UNITED STATES
SECURITIES AND EXCHANGE COMMISSION
Washington, D.C. 20549
FORM N-CSR
CERTIFIED SHAREHOLDER REPORT OF REGISTERED
MANAGEMENT INVESTMENT COMPANIES
Investment Company Act file number | 811-5857 | |||||||
| ||||||||
Columbia Funds Institutional Trust | ||||||||
(Exact name of registrant as specified in charter) | ||||||||
| ||||||||
One Financial Center, Boston, Massachusetts |
| 02111 | ||||||
(Address of principal executive offices) |
| (Zip code) | ||||||
| ||||||||
James R. Bordewick, Jr., Esq. Columbia Management Advisors, LLC One Financial Center Boston, MA 02111 | ||||||||
(Name and address of agent for service) | ||||||||
| ||||||||
Registrant’s telephone number, including area code: | 1-617-426-3750 |
| ||||||
| ||||||||
Date of fiscal year end: | July 31, 2007 |
| ||||||
| ||||||||
Date of reporting period: | January 31, 2007 |
| ||||||
Form N-CSR is to be used by management investment companies to file reports with the Commission not later than 10 days after the transmission to stockholders of any report that is required to be transmitted to stockholders under Rule 30e-1 under the Investment Company Act of 1940 (17 CFR 270.30e-1). The Commission may use the information provided on Form N-CSR in its regulatory, disclosure review, inspection, and policymaking roles.
A registrant is required to disclose the information specified by Form N-CSR, and the Commission will make this information public. A registrant is not required to respond to the collection of information contained in Form N-CSR unless the Form displays a currently valid Office of Management and Budget (“OMB”) control number. Please direct comments concerning the accuracy of the information collection burden estimate and any suggestions for reducing the burden to Secretary, Securities and Exchange Commission, 450 Fifth Street, NW, Washington, DC 20549-0609. The OMB has reviewed this collection of information under the clearance requirements of 44 U.S.C. § 3507.
Item 1. Reports to Stockholders.
![]()
CMG CORE BOND FUND
CMG SHORT TERM BOND FUND
CMG ULTRA SHORT TERM BOND FUND
CMG HIGH YIELD FUND
PORTFOLIOS OF COLUMBIA FUNDS INSTITUTIONAL TRUST
Semiannual Report
January 31, 2007
Not FDIC
Insured
May Lose Value
No Bank Guarantee
Columbia Management Advisors, LLC ("CMA") is an SEC-registered investment advisor and indirect, wholly owned subsidiary of Bank of America Corporation and is part of Columbia Management.
Columbia Management Group, LLC ("Columbia Management") is the investment management division of Bank of America Corporation. Columbia Management entities furnish investment management services and products for institutional and individual investors. The funds are distributed by Columbia Management Distributors, Inc., member of NASD, SIPC, part of Columbia Management and an affiliate of Bank of America Corporation.
| Table of Contents | |||
Fund Profile
| CMG Core Bond Fund | 1 | ||||||
| CMG Short Term Bond Fund | 5 | ||||||
| CMG Ultra Short Term Bond Fund | 9 | ||||||
| CMG High Yield Fund | 13 | ||||||
Financial Statements
| Financial Highlights | 17 | ||||||
| Schedule of Investments | 21 | ||||||
| Statements of Assets and Liabilities | 62 | ||||||
| Statements of Operations | 63 | ||||||
| Statements of Changes in Net Assets | 64 | ||||||
| Notes to Financial Statements | 66 | ||||||
| Board Consideration and Approval of Investment Advisory Agreements | 77 | ||||||
| Summary of Management Fee Evaluation by Independent Fee Consultant | 80 | ||||||
The views expressed in the fund profiles reflect the current views of the portfolio managers of the funds included in this report. These views are not guarantees of future performance and involve certain risks, uncertainties and assumptions that are difficult to predict so actual outcomes and results may differ significantly from the views expressed. These views are subject to change at any time based upon economic, market or other conditions and the portfolio managers disclaim any responsibility to update such views. These views may not be relied on as investment advice and, because investment decisions for a fund are based on numerous factors, may not be relied on as an indication of trading intent on behalf of any particular fund. References to specific company securities should not be construed as a recommendation or investment advi ce.
Performance data quoted represents past performance and current performance may be lower or higher. Past performance is no guarantee of future results. The investment return and principal value will fluctuate so that shares, when redeemed, may be worth more or less than the original cost. Please visit www.columbiamanagement.com for daily and most recent month-end performance updates.
CMG CORE BOND FUND
A Portfolio of Columbia Funds Institutional Trust
FUND PROFILE
Summary
• For the six-month period ended January 31, 2007, CMG Core Bond Fund returned 3.67%. The fund's return was in line with its benchmark, the Lehman Brothers U.S. Aggregate Bond Index,1 which returned 3.65%. It was slightly above the average return of its peer group, the Lipper Corporate Debt Funds A Rated Classification, which was 3.57% over the same period.2 Investments in non-Treasury securities boosted the fund relative to its benchmark and peer group.
• Intermediate-term interest rates declined modestly during the period. Yields on 5-year Treasury securities fell by one-tenth of a percentage point and 10-year yields declined only slightly more. Because the fund's maturity profile approximated that of its benchmark, this slight movement did not produce any gains for the fund relative to its benchmark. The fund's incremental performance advantage came from the corporate sector, where intermediate corporate bonds outperformed comparable Treasury securities. The fund benefited because it had more exposure to corporate bonds than its benchmark and also, we believe, more exposure than its peer group.
• The same situation applied to the mortgage-backed and asset-backed sectors, where the fund was also overweight relative to its benchmark. However, within the mortgage-backed sector, we gave up some opportunity by focusing on 15-year maturities. We believed that 15-year securities had the potential to outperform in an environment of rapidly-changing interest rates. However, the stability of rates during the period favored 30-year securities, which were superior performers. We increased the fund's commitment to 30-year mortgage pass-throughs as the period wore on.
• With the Federal Reserve on indefinite hold, we expect interest rates to continue to trade in a fairly narrow range. Yields are essentially flat across a wide range of maturities, and the fund's maturity structure continues to be neutral with respect to its benchmark. We plan to continue to maintain a higher commitment than the benchmark to investment-grade corporate bonds, high-quality asset-backed securities and AAA-rated mortgage-backed securities, a stance that has benefited the fund in recent months.
1 The Lehman Brothers U.S. Aggregate Bond Index is a market value-weighted index that tracks the daily price, coupon, pay-downs, and total return performance of fixed-rate, publicly placed, dollar-denominated, and non-convertible investment grade debt issues with at least $250 million par amount outstanding and with at least one year to final maturity. Indices are not investments, do not incur fees or expenses and are not professionally managed. It is not possible to invest directly in an index. Securities in the fund may not match those in an index.
2 Lipper Inc., a widely respected data provider in the industry, calculates an average total return (assuming reinvestment of distributions) for mutual funds with investment objectives similar to those of the fund. Lipper makes no adjustment for the effect of sales loads.
1
We appreciate your continued confidence in the CMG Core Bond Fund.
Portfolio Management
Leonard A. Aplet has co-managed the CMG Core Bond Fund since September 2000 and has been with the advisor or its predecessors or affiliate organizations since 1987.
Richard R. Cutts has co-managed the fund since November 2000 and has been with the advisor or its predecessors or affiliate organizations since 1994.
The fund's top ten holdings (as a percentage of net assets) as of January 31, 2007 were:
| (%) | |||||||
| Federal Home Loan Mortgage Corp., 5.500% 08/01/2021 | 4.5 | ||||||
| U.S. Treasury Bonds, 6.250% 08/15/2023 | 3.3 | ||||||
| U.S. Treasury Notes, 3.875% 02/15/2013 | 3.1 | ||||||
| Federal Home Loan Mortgage Corp., 4.500% 03/15/2018 | 2.9 | ||||||
| Federal National Mortgage Association, 5.500% 11/01/2036 | 2.8 | ||||||
| Federal Home Loan Mortgage Corp., 5.500% 08/01/2035 | 2.7 | ||||||
| Federal National Mortgage Association, 5.250% 08/01/2012 | 2.4 | ||||||
| Washington Mutual Mortgage Securities Corp., 5.500% 10/25/2035 | 2.2 | ||||||
| Government National Mortgage Association, 4.500% 04/16/2028 | 1.9 | ||||||
| Structures Asset Securities Corp., 5.500% 07/25/2033 | 1.8 | ||||||
Holdings are calculated as a percentage of net assets, and are subject to change. Because the fund is actively managed, there is no guarantee the fund will continue to maintain the holdings breakdown listed. The fund's holdings and their weights within the portfolio may change as market conditions change.
Investing in fixed-income securities may involve certain risks, including the credit quality of individual issuers, possible prepayments, market or economic developments and yields and share price fluctuations due to changes in interest rates. When interest rates go up, bond prices typically drop, and vice versa.
2
Performance data quoted represents past performance and current performance may be lower or higher. Past performance is no guarantee of future results. The investment return and principal value will fluctuate so that shares, when redeemed, may be worth more or less than the original cost. Please visit www.columbiamanagement.com for daily and most recent month-end performance updates.
Performance results reflect any voluntary waivers or reimbursement of fund expenses by the advisor or its affiliates. Absent these waivers or reimbursement arrangements, performance results would have been lower. All results shown assume reinvestment of distributions.
The table and chart do not reflect the deduction of taxes that a shareholder would pay on fund distributions or the redemption of fund shares.
Average annual total return as of January 31, 2007 (%)
| Inception | 6-month (cumulative) | 1-year | 5-year | Life | |||||||||||||||||||
| CMG Core Bond Fund | 09/01/00 | 3.67 | 4.31 | 4.39 | 5.68 | ||||||||||||||||||
| Lehman Brothers U.S. Aggregate Bond Index | 3.65 | 4.28 | 4.88 | 6.01 | |||||||||||||||||||
Average annual total return as of December 31, 2006 (%)
| Inception | 6-month (cumulative) | 1-year | 5-year | Life | |||||||||||||||||||
| CMG Core Bond Fund | 09/01/00 | 5.13 | 4.31 | 4.48 | 5.75 | ||||||||||||||||||
| Lehman Brothers U.S. Aggregate Bond Index | 5.09 | 4.33 | 5.06 | 6.10 | |||||||||||||||||||
Growth of a $3,000,000 investment, September 1, 2000 to January 31, 2007
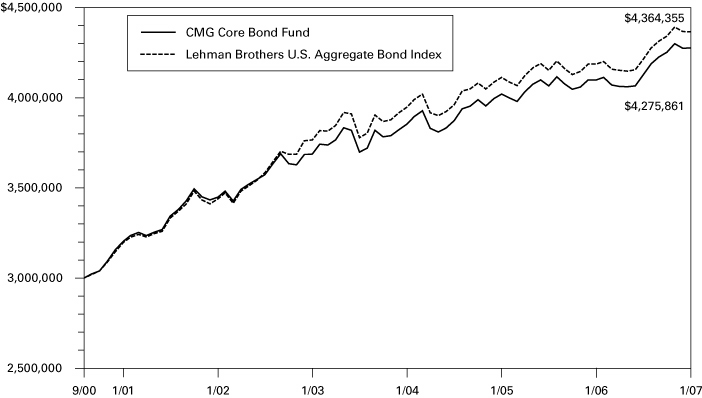
The chart above shows the growth in value of a hypothetical minimum initial $3,000,000 investment in the fund compared to the index during the stated time period.
The Lehman Brothers U.S. Aggregate Bond Index is a market value-weighted index that tracks the daily price, coupon, pay-downs, and total return performance of fixed-rate, publicly placed, dollar-denominated, and non-convertible investment grade debt issues with at least $250 million par amount outstanding and with at least one year to final maturity. Indices are not investments, do not incur fees or expenses and are not professionally managed. It is not possible to invest directly in an index. Securities in the fund may not match those in an index.
Index performance is from September 1, 2000.
3
UNDERSTANDING YOUR EXPENSES – CMG Core Bond Fund
As a fund shareholder, you incur two types of costs. There are transaction costs and also ongoing costs, which generally include investment advisory fees and other fund expenses. The information on this page is intended to help you understand your ongoing costs of investing in the fund and to compare these costs with the ongoing costs of investing in other mutual funds.
Analyzing your fund's expenses
To illustrate these ongoing costs, we have provided an example and calculated the expenses paid by investors during the reporting period. The information in the following table is based on an initial investment of $1,000, which is invested at the beginning of the reporting period and held for the entire period. Expense information is calculated two ways and each method provides you with different information. The amount listed in the "actual" column is calculated using the fund's actual operating expenses and total return for the period. The amount listed in the "hypothetical" column assumes that the return each year is 5% before expenses and is calculated based on the fund's actual operating expenses. You should not use the hypothetical account values and expenses to estimate either your actual account balance at the end of the period or the expenses you paid during this reporting period.
Estimating your actual expenses
To estimate the expenses that you paid over the period, first you will need your account balance at the end of the period:
1. Divide your ending account balance by $1,000. For example, if an account balance was $8,600 at the end of the period, the result would be 8.6.
2. In the section of the table below titled "Expenses paid during the period," locate the amount under "actual." Multiply this number by the result from step 1. Your answer is an estimate of the expenses you paid on your account during the period.
August 1, 2006 – January 31, 2007
| Account value at the beginning of the period ($) | Account value at the end of the period ($) | Expenses paid during the period ($) | Fund's annualized expense ratio (%) | ||||||||||||||||||||||||||||
| Actual | Hypothetical | Actual | Hypothetical | Actual | Hypothetical | Actual | |||||||||||||||||||||||||
| 1,000.00 | 1,000.00 | 1,036.70 | 1,023.95 | 1.28 | 1.28 | 0.25 | |||||||||||||||||||||||||
Expenses paid during the period are equal to the annualized expense ratio of 0.25%, multiplied by the average account value over the period, then multiplied by the number of days in the fund's most recent fiscal half- year and divided by 365.
Had the investment advisor and/or any of its affiliates not waived or reimbursed a portion of expenses, account value at end of the period would have been reduced.
It is important to note that the expense amounts shown in the table are meant to highlight only ongoing costs of investing in the fund and do not reflect any transaction costs, such as sales charges, redemption or exchange fees. Therefore, the hypothetical examples provided may not help you determine the relative total costs of owning shares of different funds. If these transaction costs were included, your costs would have been higher.
Compare with other funds
Since all mutual funds are required to include the same hypothetical calculations about expenses in shareholder reports, you can use this information to compare the ongoing cost of investing in the fund with other funds. To do so, compare the 5% hypothetical example with the 5% hypothetical examples that appear in the shareholder reports of other funds. As you compare hypothetical examples of other funds, it is important to note that hypothetical examples are meant to highlight the ongoing costs of investing in a fund and do not reflect any transaction costs, such as sales charges or redemption or exchange fees.
4
Performance data quoted represents past performance and current performance may be lower or higher. Past performance is no guarantee of future results. The investment return and principal value will fluctuate so that shares, when redeemed, may be worth more or less than the original cost. Please visit www.columbiamanagement.com for daily and most recent month-end performance updates.
CMG SHORT TERM BOND FUND
A Portfolio of Columbia Funds Institutional Trust
FUND PROFILE
Summary
• For the six-month period ended January 31, 2007, CMG Short Term Bond Fund returned 2.67%. The fund outperformed its benchmark the Merrill Lynch 1-3 Year U.S. Treasury Index,1 which returned 2.37% during the period. The fund also exceeded the average return of its peer group, the Lipper Short Investment Grade Debt Funds Classification, which was 2.57%.2 The fund was able to extract modest advantages from its trading strategies within the Treasury market and incremental gains from its non-Treasury holdings.
• In sharp contrast to recent reporting periods, the Federal Reserve Board (the Fed) did not intervene on short-term interest rates during the past six months. However, there were several shifts in investor sentiment. During the first four months of the period, interest rates declined substantially. In the last two months they rebounded, ending the period only slightly lower than where they started.
• The combination of slightly higher money market rates and slightly lower rates on two-year securities enabled the fund to make several tactical trades within the Treasury market. The fund also achieved extra returns through overweight positions in short-term corporate bonds and short duration mortgage-backed and asset-backed securities, as each of these categories outperformed comparable Treasury securities.
• With the Fed expected to be on hold for the near term, we look for interest rates to remain in a fairly narrow trading range. We have therefore moved the portfolio's maturity in line with its benchmark. The fund remains overweight relative to its benchmark in investment-grade corporate bonds and AAA-rated mortgage-backed securities.
1 The Merrill Lynch 1-3 Year U.S. Treasury Index tracks the performance of sovereign debt publicly issued in the US domestic market with maturities of 1-3 years and a minimum amount outstanding of $1 billion. Indices are not investments, do not incur fees or expenses and are not professionally managed. It is not possible to invest directly in an index. Securities in the fund may not match those in an index.
2 Lipper Inc., a widely respected data provider in the industry, calculates an average total return (assuming reinvestment of distributions) for mutual funds with investment objectives similar to those of the fund. Lipper makes no adjustment for the effect of sales loads.
5
We appreciate your continued confidence in the CMG Short Term Bond Fund.
Portfolio Management
Leonard A. Aplet has co-managed the CMG Short Term Bond Fund since February 1998 and has been with the advisor or its predecessors or affiliate organizations since 1987.
Richard R. Cutts has co-managed the fund since November 2000 and has been with the advisor or its predecessors or affiliate organizations since 1994.
Ronald Stahl has co-managed the fund since November 2006 and has been with the advisor or its predecessors or affiliate organizations since 1998.
The fund's top ten holdings (as a percentage of net assets) as of January 31, 2007 were:
| (%) | |||||||
| Federal National Mortgage Association, 4.750% 08/03/2007 | 3.7 | ||||||
| Countrywide Alternative Loan Trust, 5.500% 02/25/2036 | 2.5 | ||||||
| U.S. Treasury Inflation Indexed Notes, 3.875% 01/15/2009 | 2.4 | ||||||
| Federal Home Loan Mortgage Corp., 5.500% 02/15/2025 | 2.2 | ||||||
| Capital Auto Receivables Asset Trust, 3.580% 01/15/2009 | 2.1 | ||||||
| Federal National Mortgage Association, 5.500% 07/25/2025 | 2.1 | ||||||
| JPMorgan Mortgage Trust, 5.766% 04/25/2036 | 1.8 | ||||||
| Long Beach Auto Receivable Trust, 4.050% 04/15/2011 | 1.8 | ||||||
| MASTR Asset Securitization Trust, 5.750% 05/25/2036 | 1.7 | ||||||
| Federal Home Loan Mortgage Corp., 4.500% 03/01/2021 | 1.7 | ||||||
Holdings are calculated as a percentage of net assets, and are subject to change. Because the fund is actively managed, there is no guarantee the fund will continue to maintain the holdings breakdown listed. The fund's holdings and their weights within the portfolio may change as market conditions change.
Investing in fixed-income securities may involve certain risks, including the credit quality of individual issuers, possible prepayments, market or economic developments and yields and share price fluctuations due to changes in interest rates. When interest rates go up, bond prices typically drop, and vice versa.
6
Performance data quoted represents past performance and current performance may be lower or higher. Past performance is no guarantee of future results. The investment return and principal value will fluctuate so that shares, when redeemed, may be worth more or less than the original cost. Please visit www.columbiamanagement.com for daily and most recent month-end performance updates.
Performance results reflect any voluntary waivers or reimbursement of fund expenses by the advisor or its affiliates. Absent these waivers or reimbursement arrangements, performance results would have been lower. All results shown assume reinvestment of distributions
The table and chart do not reflect the deduction of taxes that a shareholder would pay on fund distributions or the redemption of fund shares.
Average annual total return as of January 31, 2007 (%)
| Inception | 6-month (cumulative) | 1-year | 5-year | Life | |||||||||||||||||||
| CMG Short Term Bond Fund | 02/02/98 | 2.67 | 4.39 | 3.28 | 4.83 | ||||||||||||||||||
| Merrill Lynch 1-3 Year U.S. Treasury Index | 2.37 | 4.01 | 2.83 | 4.39 | |||||||||||||||||||
Average annual total return as of December 31, 2006 (%)
| Inception | 6-month (cumulative) | 1-year | 5-year | Life | |||||||||||||||||||
| CMG Short Term Bond Fund | 02/02/98 | 3.24 | 4.42 | 3.33 | 4.85 | ||||||||||||||||||
| Merrill Lynch 1-3 Year U.S. Treasury Index | 2.90 | 3.96 | 2.82 | 4.41 | |||||||||||||||||||
Growth of a $3,000,000 investment, February 2, 1998 to January 31, 2007
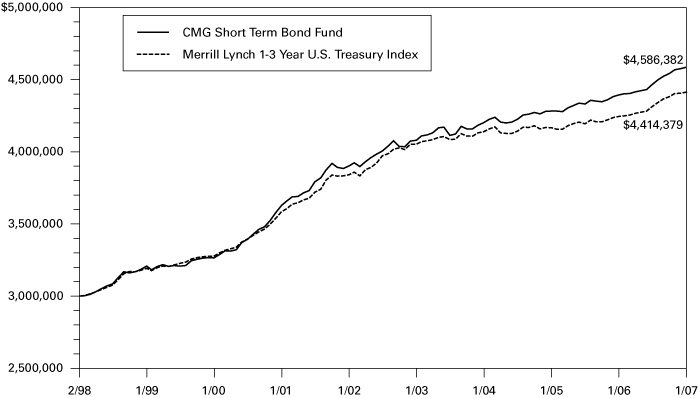
The chart above shows the growth in value of a hypothetical minimum initial $3,000,000 investment in the fund compared to the index during the stated time period.
The Merrill Lynch 1-3 Year U.S. Treasury Index tracks the performance of sovereign debt publicly issued in the US domestic market with maturities of 1-3 years and a minimum amount outstanding of $1 billion. Indices are not investments, do not incur fees or expenses and are not professionally managed. It is not possible to invest directly in an index. Securities in the fund may not match those in an index.
Index performance is from February 2, 1998.
7
UNDERSTANDING YOUR EXPENSES – CMG Short Term Bond Fund
As a fund shareholder, you incur two types of costs. There are transaction costs and also ongoing costs, which generally include investment advisory fees and other fund expenses. The information on this page is intended to help you understand your ongoing costs of investing in the fund and to compare these costs with the ongoing costs of investing in other mutual funds.
Analyzing your fund's expenses
To illustrate these ongoing costs, we have provided an example and calculated the expenses paid by investors during the reporting period. The information in the following table is based on an initial investment of $1,000, which is invested at the beginning of the reporting period and held for the entire period. Expense information is calculated two ways and each method provides you with different information. The amount listed in the "actual" column is calculated using the fund's actual operating expenses and total return for the period. The amount listed in the "hypothetical" column assumes that the return each year is 5% before expenses and is calculated based on the fund's actual operating expenses. You should not use the hypothetical account values and expenses to estimate either your actual account balance at the end of the period or the expenses you paid during this reporting period.
Estimating your actual expenses
To estimate the expenses that you paid over the period, first you will need your account balance at the end of the period:
1. Divide your ending account balance by $1,000. For example, if an account balance was $8,600 at the end of the period, the result would be 8.6.
2. In the section of the table below titled "Expenses paid during the period," locate the amount under "actual." Multiply this number by the result from step 1. Your answer is an estimate of the expenses you paid on your account during the period.
August 1, 2006 – January 31, 2007
| Account value at the beginning of the period ($) | Account value at the end of the period ($) | Expenses paid during the period ($) | Fund's annualized expense ratio (%) | ||||||||||||||||||||||||||||
| Actual | Hypothetical | Actual | Hypothetical | Actual | Hypothetical | Actual | |||||||||||||||||||||||||
| 1,000.00 | 1,000.00 | 1,026.72 | 1,023.95 | 1.28 | 1.28 | 0.25 | |||||||||||||||||||||||||
Expenses paid during the period are equal to the annualized expense ratio of 0.25%, multiplied by the average account value over the period, then multiplied by the number of days in the fund's most recent fiscal half-year and divided by 365.
Had the investment advisor and/or any of its affiliates not waived or reimbursed a portion of expenses, account values at end of the period would have been reduced.
It is important to note that the expense amounts shown in the table are meant to highlight only ongoing costs of investing in the fund and do not reflect any transaction costs, such as sales charges, redemption or exchange fees. Therefore, the hypothetical examples provided may not help you determine the relative total costs of owning shares of different funds. If these transaction costs were included, your costs would have been higher.
Compare with other funds
Since all mutual funds are required to include the same hypothetical calculations about expenses in shareholder reports, you can use this information to compare the ongoing cost of investing in the fund with other funds. To do so, compare the 5% hypothetical example with the 5% hypothetical examples that appear in the shareholder reports of other funds. As you compare hypothetical examples of other funds, it is important to note that hypothetical examples are meant to highlight the ongoing costs of investing in a fund and do not reflect any transaction costs, such as sales charges or redemption or exchange fees.
8
Performance data quoted represents past performance and current performance may be lower or higher. Past performance is no guarantee of future results. The investment return and principal value will fluctuate so that shares, when redeemed, may be worth more or less than the original cost. Please visit www.columbiamanagement.com for daily and most recent month-end performance updates.
CMG ULTRA SHORT TERM BOND FUND
A Portfolio of Columbia Funds Institutional Trust
FUND PROFILE
Summary
• For the six-month period ended January 31, 2007, CMG Ultra Short Term Bond Fund returned 2.61%. The fund outperformed its benchmark, the Citigroup One-Year U.S. Treasury Bill Index1, which returned 2.42%, and the average return of its peer group, the Lipper Ultra-Short Obligations Funds Classification, which was 2.49%.2 The fund emphasized investments at the short end of its short-term maturity spectrum, which aided performance as within that spectrum, bonds with the shortest maturities outperformed those with longer maturities.
• During the period, the difference in yield between short- and long-term maturity bonds narrowed and short-term yields actually rose above long-term yields, resulting in what bond market professionals call an "inverted" yield curve. In this environment, investors were paid less for accepting the risk of a longer maturity bond than for a shorter one, reflecting uncertainty about the near-term direction of interest rates and the economy. During the period, the Federal Reserve Board held short-term rates steady, indicating that it would continue to monitor the economy for potential inflationary pressures and indicators of the overall strength.
• The fund's emphasis on bonds with the shortest maturities aided performance, as did its exposure to corporate and asset-backed floating rate bonds, which adjust their rates according to the direction of interest rates. The fund also benefited from owning a small position in lower-quality BBB-rated securities, which performed well as investors continued to demonstrate a willingness to take on risk in order to gain access to higher yields. The fund's holdings in asset-backed securities and corporate bonds with relatively longer maturities detracted from returns.
• We do not expect any major shift in the interest rate environment until later in the year, perhaps during the third quarter. As a result, we plan to continue to emphasize bonds with shorter maturities in many of the sectors already represented in the fund's portfolio, including asset backed securities, collateralized mortgage obligations, corporate and agency issues. Should the environment change measurably and turn in favor of longer maturity issues, we would look to add exposure to securities with longer maturities within the fund's short-term range.
1 The Citigroup One-Year U.S. Treasury Bill Index consists of a single 1-year US Treasury Bill whose return is tracked until its maturity. Indices are not investments, do not incur fees or expenses and are not professionally managed. It is not possible to invest directly in an index. Securities in the fund may not match those in an index.
2 Lipper Inc., a widely respected data provider in the industry, calculates an average total return (assuming reinvestment of distributions) for mutual funds with similar investment objectives as those of the fund. Lipper makes no adjustments for the effect of sales loads.
9
We appreciate your continued confidence in the CMG Ultra Short Term Bond Fund.
Portfolio Management
Guy C. Holbrook has managed the fund since its inception and has been with the advisor or its predecessors or affiliate organizations since 1998.
The fund's top ten holdings (as a percentage of net assets) as of January 31, 2007 were:
| (%) | |||||||
| Federal Home Loan Mortgage Corp., 4.125% 04/02/2007 | 1.8 | ||||||
| Federal Home Loan Mortgage Corp., 5.500% 04/15/2027 | 1.5 | ||||||
| Federal Home Loan Bank, 5.410% 12/28/2007 | 1.3 | ||||||
| Rhineland Funding Capital, 5.310% 02/05/2007 | 1.3 | ||||||
| Providian Gateway Master Trust, 3.350% 09/15/2011 | 1.3 | ||||||
| Federal Home Loan Bank, 5.375% 02/15/2007 | 1.1 | ||||||
| American Honda Finanace Corp., 5.386% 06/23/2008 | 1.1 | ||||||
| Long Beach Auto Receivables Trust, 5.370% 10/15/2007 | 1.0 | ||||||
| Lehman Brothers Holding, Inc., 3.500% 08/07/2008 | 1.0 | ||||||
| Genworth Financial, Inc., 5.510% 06/15/2007 | 1.0 | ||||||
Holdings are calculated as a percentage of net assets, and are subject to change. Because the fund is actively managed, there is no guarantee the fund will continue to maintain the holdings breakdown listed. The fund's holdings and their weights within the portfolio may change as market conditions change.
Investing in fixed-income securities may involve certain risks, including the credit quality of individual issuers, possible prepayments, market or economic developments and yields and share price fluctuations due to changes in interest rates. When interest rates go up, bond prices typically drop, and vice versa.
10
Performance data quoted represents past performance and current performance may be lower or higher. Past performance is no guarantee of future results. The investment return and principal value will fluctuate so that shares, when redeemed, may be worth more or less than the original cost. Please visit www.columbiamanagement.com for daily and most recent month-end performance updates.
Performance results reflect any voluntary waivers or reimbursement of fund expenses by the advisor or its affiliates. Absent these waivers or reimbursement arrangements, performance results would have been lower. All results shown assume reinvestment of distributions
The table and chart do not reflect the deduction of taxes that a shareholder would pay on fund distributions or the redemption of fund shares.
Average annual total return as of January 31, 2007 (%)
| Inception | 6-month (cumulative) | 1-year | Life | ||||||||||||||||
| CMG Ultra Short Term Bond Fund | 03/08/04 | 2.61 | 4.72 | 2.81 | |||||||||||||||
| Citigroup One-Year U.S. Treasury Bill Index | 2.42 | 4.37 | 2.50 | ||||||||||||||||
Average annual total return as of December 31, 2006 (%)
| Inception | 6-month (cumulative) | 1-year | Life | ||||||||||||||||
| CMG Ultra Short Term Bond Fund | 03/08/04 | 2.79 | 4.67 | 2.75 | |||||||||||||||
| Citigroup One-Year U.S. Treasury Bill Index | 2.60 | 4.24 | 2.44 | ||||||||||||||||
Growth of a $3,000,000 investment, March 8, 2004 to January 31, 2007
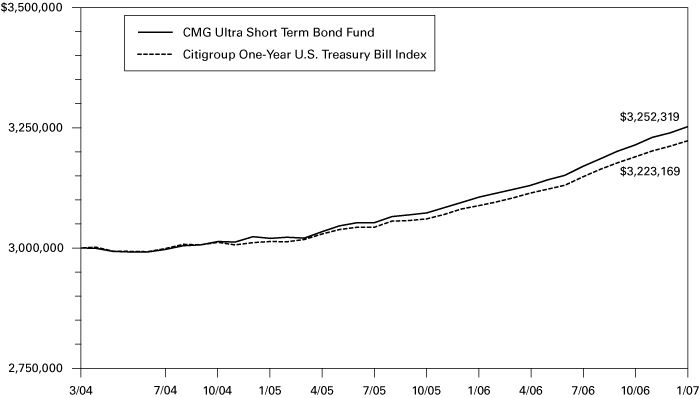
The chart above shows the growth in value of a hypothetical minimum initial $3,000,000 investment in the fund compared to the index during the stated time period.
The Citigroup One-Year U.S. Treasury Bill Index consists of a single 1-year US Treasury Bill whose return is tracked until its maturity. Indices are not investments, do not incur fees or expenses and are not professionally managed. It is not possible to invest directly in an index. Securities in the fund may not match those in an index.
Index performance is from March 8, 2004.
11
UNDERSTANDING YOUR EXPENSES – CMG Ultra Short Term Bond Fund
As a fund shareholder, you incur two types of costs. There are transaction costs and also ongoing costs, which generally include investment advisory fees and other fund expenses. The information on this page is intended to help you understand your ongoing costs of investing in the fund and to compare these costs with the ongoing costs of investing in other mutual funds.
Analyzing your fund's expenses
To illustrate these ongoing costs, we have provided an example and calculated the expenses paid by investors during the reporting period. The information in the following table is based on an initial investment of $1,000, which is invested at the beginning of the reporting period and held for the entire period. Expense information is calculated two ways and each method provides you with different information. The amount listed in the "actual" column is calculated using the fund's actual operating expenses and total return for the period. The amount listed in the "hypothetical" column assumes that the return each year is 5% before expenses and is calculated based on the fund's actual operating expenses. You should not use the hypothetical account values and expenses to estimate either your actual account balance at the end of the period or the expenses you paid during this reporting period.
Estimating your actual expenses
To estimate the expenses that you paid over the period, first you will need your account balance at the end of the period:
1. Divide your ending account balance by $1,000. For example, if an account balance was $8,600 at the end of the period, the result would be 8.6.
2. In the section of the table below titled "Expenses paid during the period," locate the amount under "actual." Multiply this number by the result from step 1. Your answer is an estimate of the expenses you paid on your account during the period.
August 1, 2006 – January 31, 2007
| Account value at the beginning of the period ($) | Account value at the end of the period ($) | Expenses paid during the period ($) | Fund's annualized expense ratio (%) | ||||||||||||||||||||||||||||
| Actual | Hypothetical | Actual | Hypothetical | Actual | Hypothetical | Actual | |||||||||||||||||||||||||
| 1,000.00 | 1,000.00 | 1,026.11 | 1,023.95 | 1.28 | 1.28 | 0.25 | |||||||||||||||||||||||||
Expenses paid during the period are equal to the annualized expense ratio of 0.25%, multiplied by the average account value over the period, then multiplied by the number of days in the fund's most recent fiscal half-year and divided by 365.
Had the investment advisor and/or any of its affiliates not waived or reimbursed a portion of expenses, account values at end of the period would have been reduced.
It is important to note that the expense amounts shown in the table are meant to highlight only ongoing costs of investing in the fund and do not reflect any transaction costs, such as sales charges, redemption or exchange fees. Therefore, the hypothetical examples provided may not help you determine the relative total costs of owning shares of different funds. If these transaction costs were included, your costs would have been higher.
Compare with other funds
Since all mutual funds are required to include the same hypothetical calculations about expenses in shareholder reports, you can use this information to compare the ongoing cost of investing in the fund with other funds. To do so, compare the 5% hypothetical example with the 5% hypothetical examples that appear in the shareholder reports of other funds. As you compare hypothetical examples of other funds, it is important to note that hypothetical examples are meant to highlight the ongoing costs of investing in a fund and do not reflect any transaction costs, such as sales charges or redemption or exchange fees.
12
Performance data quoted represents past performance and current performance may be lower or higher. Past performance is no guarantee of future results. The investment return and principal value will fluctuate so that shares, when redeemed, may be worth more or less than the original cost. Please visit www.columbiamanagement.com for most recent daily and month-end performance updates.
CMG HIGH YIELD FUND
A Portfolio of Columbia Funds Institutional Trust
FUND PROFILE
Summary
• For the six-month period ended January 31, 2007, CMG High Yield Fund returned 6.24%. The fund underperformed its benchmarks, the Merrill Lynch Intermediate BB Index and the JPMorgan Chase Developed BB High Yield Index,1 which returned 6.74% and 6.79%, respectively. The fund also underperformed the average return of its peer group, the Lipper High Current Yields Classification, which was 7.68% for the period.2 The fund's emphasis on higher quality credits placed it at a competitive disadvantage during the period.
• The fund benefited from favorable security selection in the utilities sector, particularly Mirant North America LLC. An overweighted position in the forest products & paper sector also aided performance as did an underweighted position in the information technology sector. Favorable security selection also enhanced returns within these sectors.
• The six-month period was noteworthy for the price rebounds experienced by the automotive and airline sectors in the JPMorgan Chase Developed BB High Yield Index. The automotive sector was the best performing sector in the index, during the period, far outpacing other sectors. This performance occurred, despite the fact that Ford Motor Co. was downgraded during the period, resulting in it being dropped from the Index. Because the fund is oriented toward higher quality investments, it did not participate fully in the automotive rally. An underweighted position in the diversified media also detracted from results.
• At the end of the period, the corporate default rate for high yield bonds remained low, corporate earnings remained strong and the pace of new issuance had slowed compared to one year ago. Despite these favorable factors, valuations are quite rich on a historical basis. We plan to maintain our conservative positioning relative to our peer group, noting that the yield advantage of lower quality bonds has narrowed to historically thin margins.
We appreciate your continued confidence in the CMG High Yield Fund.
1 The Merrill Lynch Intermediate BB Index is a market-weighted index, consisting of BB cash pay bonds, which are US dollar denominated bonds issued in the US domestic market with maturities between 1 and 10 years. The JPMorgan Chase Developed BB High Yield Index is designed to mirror the investable universe of the US dollar developed, BB-rated, high yield corporate debt market. Indices are not investments, do not incur fees or expenses and are not professionally managed. It is not possible to invest directly in an index. Securities in the fund may not match those in an index.
2 Lipper Inc., a widely respected data provider in the industry, calculates an average total return (assuming reinvestment of distributions) for mutual funds with investment objectives similar to those of the fund. Lipper makes no adjustment for the effect of sales loads.
13
Portfolio Management
Kevin L. Cronk has co-managed the fund since September 2005. He has been with the advisor or its predecessors or affiliate organizations since August 1999.
Thomas A. LaPointe has co-managed the fund since September 2005. He has been with the advisor or its predecessors or affiliate organizations since February 1999.
The fund's top ten issuers (as a percentage of net assets) as of January 31, 2007 were:
| (%) | |||||||
| Dow Jones CDX High Yield Index | 4.3 | ||||||
| Owens–Illinois, Inc. | 1.8 | ||||||
| Chesapeake Energy Corp. | 1.6 | ||||||
| AES Corp. | 1.5 | ||||||
| Allied Waste North America, Inc. | 1.4 | ||||||
| GMAC LLC | 1.3 | ||||||
| EchoStar DBS Corp. | 1.3 | ||||||
| ARAMARK Corp. | 1.1 | ||||||
| Colorado Interstate Gas Co. | 1.1 | ||||||
| DirecTV Holdings LLC | 1.1 | ||||||
Holdings are calculated as a percentage of net assets, and are subject to change. Because the fund is actively managed, there is no guarantee the fund will continue to maintain the holdings breakdown listed. The fund's holdings and their weights within the portfolio may change as market conditions change.
Investing in fixed-income securities may involves certain risks, including the credit quality of individual issuers, possible prepayments, market or economic developments and yields and share price fluctuations due to changes in interest rates. When interest rates go up, bond prices typically drop, and vice versa.
Investments in high yield or "junk" bonds offer the potential for higher income than investments in investment-grade bonds but they also have a higher degree of risk. Changes in economic conditions or other circumstances may adversely affect a high-yield bond issuer's ability to make timely principal and interest payments.
14
Performance data quoted represents past performance and current performance may be lower or higher. Past performance is no guarantee of future results. The investment return and principal value will fluctuate so that shares, when redeemed, may be worth more or less than the original cost. Please visit www.columbiamanagement.com for daily and most recent month-end performance updates.
Performance results reflect any voluntary waivers or reimbursement of fund expenses by the advisor or its affiliates. Absent these waivers or reimbursement arrangements, performance results would have been lower. All results shown assume reinvestment of distributions.
The table and chart do not reflect the deduction of taxes that a shareholder would pay on fund distributions or the redemption of shares.
Average annual total return as of January 31, 2007 (%)
| Inception | 6-month (cumulative) | 1-year | 5-year | 10-year | |||||||||||||||||||
| CMG High Yield Fund | 07/06/94 | 6.24 | 5.97 | 6.53 | 6.68 | ||||||||||||||||||
| JPMorgan Chase Developed BB High Yield Index | 6.79 | 7.70 | 8.94 | 8.11 | |||||||||||||||||||
| Merrill Lynch Intermediate BB Index | 6.74 | 8.08 | 6.98 | 6.54 | |||||||||||||||||||
Average annual total return as of December 31, 2006 (%)
| Inception | 6-month (cumulative) | 1-year | 5-year | 10-year | |||||||||||||||||||
| CMG High Yield Fund | 07/06/94 | 6.65 | 6.47 | 6.58 | 6.72 | ||||||||||||||||||
| JPMorgan Chase Developed BB High Yield Index | 7.60 | 8.67 | 8.98 | 8.14 | |||||||||||||||||||
| Merrill Lynch Intermediate BB Index | 7.54 | 9.48 | 6.89 | 6.59 | |||||||||||||||||||
Growth of a $3,000,000 investment, February 1, 1997 to January 31, 2007
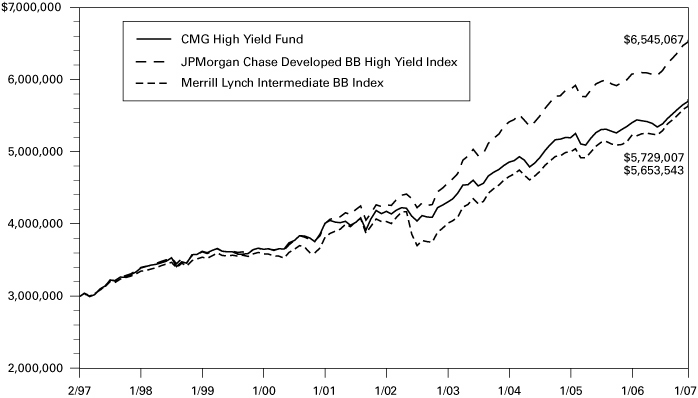
The chart above shows the growth in value of a hypothetical minimum initial $3,000,000 investment in the fund compared to the indices during the stated time period.
The JPMorgan Chase Developed BB High Yield Index, is designed to mirror the investable universe of the US dollar developed, BB-rated, high yield corporate debt market. The Merrill Lynch Intermediate BB Index is a market-weighted index, consisting of BB cash pay bonds, which are US dollar denominated bonds issued in the US domestic market with maturities between 1 and 10 years. Indices are not investments, do not incur fees or expenses and are not professionally managed. It is not possible to invest directly in an index. Securities in the fund may not match those in an index.
15
UNDERSTANDING YOUR EXPENSES – CMG High Yield Fund
As a fund shareholder, you incur two types of costs. There are transaction costs and also ongoing costs, which generally include investment advisory fees and other fund expenses. The information on this page is intended to help you understand your ongoing costs of investing in the fund and to compare these costs with the ongoing costs of investing in other mutual funds.
Analyzing your fund's expenses
To illustrate these ongoing costs, we have provided an example and calculated the expenses paid by investors during the reporting period. The information in the following table is based on an initial investment of $1,000, which is invested at the beginning of the reporting period and held for the entire period. Expense information is calculated two ways and each method provides you with different information. The amount listed in the "actual" column is calculated using the fund's actual operating expenses and total return for the period. The amount listed in the "hypothetical" column assumes that the return each year is 5% before expenses and is calculated based on the fund's actual operating expenses. You should not use the hypothetical account values and expenses to estimate either your actual account balance at the end of the period or the expenses you paid during this reporting period.
Estimating your actual expenses
To estimate the expenses that you paid over the period, first you will need your account balance at the end of the period:
1. Divide your ending account balance by $1,000. For example, if an account balance was $8,600 at the end of the period, the result would be 8.6.
2. In the section of the table below titled "Expenses paid during the period," locate the amount under "actual." Multiply this number by the result from step 1. Your answer is an estimate of the expenses you paid on your account during the period.
August 1, 2006 – January 31, 2007
| Account value at the beginning of the period ($) | Account value at the end of the period ($) | Expenses paid during the period ($) | Fund's annualized expense ratio (%) | ||||||||||||||||||||||||||||
| Actual | Hypothetical | Actual | Hypothetical | Actual | Hypothetical | Actual | |||||||||||||||||||||||||
| 1,000.00 | 1,000.00 | 1,062.41 | 1,023.19 | 2.08 | 2.04 | 0.40 | |||||||||||||||||||||||||
Expenses paid during the period are equal to the annualized expense ratio of 0.40%, multiplied by the average account value over the period, then multiplied by the number of days in the fund's most recent fiscal half-year and divided by 365.
Had the investment advisor and/or any of its affiliates not waived or reimbursed a portion of expenses, account values at end of the period would have been reduced.
It is important to note that the expense amounts shown in the table are meant to highlight only ongoing costs of investing in the fund and do not reflect any transaction costs, such as sales charges, redemption or exchange fees. Therefore, the hypothetical examples provided may not help you determine the relative total costs of owning shares of different funds. If these transaction costs were included, your costs would have been higher.
Compare with other funds
Since all mutual funds are required to include the same hypothetical calculations about expenses in shareholder reports, you can use this information to compare the ongoing cost of investing in the fund with other funds. To do so, compare the 5% hypothetical example with the 5% hypothetical examples that appear in the shareholder reports of other funds. As you compare hypothetical examples of other funds, it is important to note that hypothetical examples are meant to highlight the ongoing costs of investing in a fund and do not reflect any transaction costs, such as sales charges or redemption or exchange fees.
16
CMG CORE BOND FUND
A Portfolio of Columbia Funds Institutional Trust
FINANCIAL HIGHLIGHTS
(For a Fund Share Outstanding Throughout Each Period)
| (Unaudited) Six Months Ended January 31, | Year Ended July 31, | Period Ended July 31, | Year Ended October 31, | ||||||||||||||||||||||||||||
| 2007 | 2006 | 2005 | 2004 | 2003 (a) | 2002 | 2001 | |||||||||||||||||||||||||
| Net asset value, beginning of period | $ | 10.05 | $ | 10.42 | $ | 10.36 | $ | 10.38 | $ | 10.52 | $ | 10.83 | $ | 10.02 | |||||||||||||||||
| Income from investment operations: | |||||||||||||||||||||||||||||||
| Net investment income | 0.25 | (b) | 0.48 | (b) | 0.42 | (b) | 0.37 | (b) | 0.31 | (b) | 0.56 | (b)(c) | 0.65 | ||||||||||||||||||
| Net realized and unrealized gain (loss) on investments and futures contracts | 0.12 | (0.33 | ) | 0.09 | 0.11 | (0.12 | ) | (0.15 | ) (c) | 0.81 | |||||||||||||||||||||
| Total from investment operations | 0.37 | 0.15 | 0.51 | 0.48 | 0.19 | 0.41 | 1.46 | ||||||||||||||||||||||||
| Less distributions declared to shareholders: | |||||||||||||||||||||||||||||||
| From net investment income | (0.26 | ) | (0.51 | ) | (0.45 | ) | (0.41 | ) | (0.33 | ) | (0.58 | ) | (0.65 | ) | |||||||||||||||||
| From net realized gains | �� | - | (0.01 | ) | - | (0.09 | ) | - | (0.14 | ) | - | (d) | |||||||||||||||||||
| Total distributions | (0.26 | ) | (0.52 | ) | (0.45 | ) | (0.50 | ) | (0.33 | ) | (0.72 | ) | (0.65 | ) | |||||||||||||||||
| Net asset value, end of period | $ | 10.16 | $ | 10.05 | $ | 10.42 | $ | 10.36 | $ | 10.38 | $ | 10.52 | $ | 10.83 | |||||||||||||||||
| Total return (e)(f) | 3.67 | %(g) | 1.46 | % | 4.98 | % | 4.67 | % | 1.76 | %(g) | 3.97 | % | 15.01 | % | |||||||||||||||||
| Ratios/Supplemental data: | |||||||||||||||||||||||||||||||
| Net assets, end of period (000's) | $ | 52,657 | $ | 56,181 | $ | 79,102 | $ | 32,810 | $ | 30,512 | $ | 27,412 | $ | 28,774 | |||||||||||||||||
| Ratio of net expenses to average net assets | 0.25 | %(i) | 0.25 | %(h) | 0.25 | %(h) | 0.35 | %(h) | 0.40 | %(h)(i) | 0.40 | %(h) | 0.40 | %(h) | |||||||||||||||||
| Ratio of net investment income to average net assets | 4.88 | %(i) | 4.65 | %(h) | 4.01 | %(h) | 3.54 | %(h) | 3.95 | %(h)(i) | 5.34 | %(c)(h) | 6.14 | %(h) | |||||||||||||||||
| Reimbursement | 0.12 | %(i) | 0.10 | % | 0.06 | % | 0.25 | % | 0.29 | %(i) | 0.16 | % | 0.25 | % | |||||||||||||||||
| Portfolio turnover rate | 39 | %(g) | 109 | % | 130 | % | 231 | % | 181 | %(g) | 147 | % | 140 | % | |||||||||||||||||
(a) The Fund changed its fiscal year end from October 31 to July 31.
(b) Per share data was calculated using the average shares outstanding during the period.
(c) Effective November 1, 2001, the Fund adopted the provisions of the AICPA Audit and Accounting Guide for Investment Companies and began amortizing premium and accreting discount on all debt securities. The effect of this change for the year ended October 31, 2002, was to decrease net investment income per share by $0.02, decrease net realized and unrealized loss per share by $0.02 and decrease the ratio of net investment income to average net assets from 5.53% to 5.34%. Per share data and ratios for periods prior to October 31, 2002 have not been restated to reflect this change in presentation.
(d) Rounds to less than $0.01 per share.
(e) Total return at net asset value assuming all distributions reinvested.
(f) Had the investment advisor and/or any of its affiliates not waived or reimbursed a portion of expenses, total return would have been reduced.
(g) Not annualized
(h) The benefits derived from custody credits had an impact of less than 0.01%.
(i) Annualized.
See Accompanying Notes to Financial Statements.
17
CMG SHORT TERM BOND FUND
A Portfolio of Columbia Funds Institutional Trust
FINANCIAL HIGHLIGHTS
(For a Fund Share Outstanding Throughout Each Period)
| (Unaudited) Six Months Ended January 31, | Year Ended July 31, | Period Ended July 31, | Year Ended October 31, | ||||||||||||||||||||||||||||
| 2007 | 2006 | 2005 | 2004 | 2003 (a) | 2002 | 2001 | |||||||||||||||||||||||||
| Net asset value, beginning | |||||||||||||||||||||||||||||||
| of period | $ | 11.59 | $ | 11.79 | $ | 11.95 | $ | 12.01 | $ | 12.15 | $ | 12.41 | $ | 11.73 | |||||||||||||||||
| Income from investment operations: | |||||||||||||||||||||||||||||||
| Net investment income | 0.27 | (b) | 0.50 | (b) | 0.40 | (b) | 0.35 | (b) | 0.34 | (b) | 0.59 | (b)(c) | 0.76 | ||||||||||||||||||
| Net realized and unrealized gain (loss) on investments, foreign currency transactions and futures contracts | 0.04 | (0.14 | ) | (0.11 | ) | (0.03 | ) | (0.11 | ) | (0.22 | ) (c) | 0.68 | |||||||||||||||||||
| Total from investment operations | 0.31 | 0.36 | 0.29 | 0.32 | 0.23 | 0.37 | 1.44 | ||||||||||||||||||||||||
| Less distributions declared to shareholders: | |||||||||||||||||||||||||||||||
| From net investment income | (0.31 | ) | (0.56 | ) | (0.45 | ) | (0.38 | ) | (0.37 | ) | (0.63 | ) | (0.76 | ) | |||||||||||||||||
| Net asset value, end of period | $ | 11.59 | $ | 11.59 | $ | 11.79 | $ | 11.95 | $ | 12.01 | $ | 12.15 | $ | 12.41 | |||||||||||||||||
| Total return (d)(e) | 2.67 | %(f) | 3.15 | % | 2.47 | % | 2.72 | % | 1.91 | %(f) | 3.12 | % | 12.62 | % | |||||||||||||||||
| Ratios/Supplemental data: | |||||||||||||||||||||||||||||||
| Net assets, end of period (000's) | $ | 93,619 | $ | 83,984 | $ | 95,842 | $ | 119,125 | $ | 113,193 | $ | 140,757 | $ | 89,791 | |||||||||||||||||
| Ratio of net expenses to average net assets | 0.25 | %(g) | 0.25 | %(h) | 0.25 | %(h) | 0.25 | %(h) | 0.25 | %(g)(h) | 0.25 | %(h) | 0.25 | %(h) | |||||||||||||||||
| Ratio of interest expense to average net assets | - | - | - | - | - | (g)(i) | - | - | |||||||||||||||||||||||
| Ratio of net investment income to average net assets | 4.68 | %(g) | 4.31 | %(h) | 3.38 | %(h) | 2.91 | %(h) | 3.79 | %(g)(h) | 4.73 | %(c)(h) | 6.27 | %(h) | |||||||||||||||||
| Reimbursement | 0.08 | %(g) | 0.08 | % | 0.04 | % | 0.10 | % | 0.08 | %(g) | 0.05 | % | 0.08 | % | |||||||||||||||||
| Portfolio turnover rate | 36 | %(f) | 128 | % | 51 | % | 79 | % | 93 | %(f) | 132 | % | 82 | % | |||||||||||||||||
(a) The Fund changed its fiscal year end from October 31 to July 31.
(b) Per share data was calculated using the average shares outstanding during the period.
(c) Effective November 1, 2001, the Fund adopted the provisions of the AICPA Audit and Accounting Guide for Investment Companies and began amortizing premium and accreting discount on all debt securities. The effect of this change for the year ended October 31, 2002, was to decrease net investment income per share by $0.04, decrease net realized and unrealized loss per share by $0.04 and decrease the ratio of net investment income to average net assets from 5.08% to 4.73%. Per share data and ratios for periods prior to October 31, 2002 have not been restated to reflect this change in presentation.
(d) Total return at net asset value assuming all distributions reinvested.
(e) Had the investment advisor and/or any of its affiliates not waived or reimbursed a portion of expenses, total return would have been reduced.
(f) Not annualized.
(g) Annualized.
(h) The benefits derived from custody credits had an impact of less than 0.01%.
(i) Rounds to less than 0.01%.
See Accompanying Notes to Financial Statements.
18
CMG ULTRA SHORT TERM BOND FUND
A Portfolio of Columbia Funds Institutional Trust
FINANCIAL HIGHLIGHTS
(For a Fund Share Outstanding Throughout the Period)
| (Unaudited) Six Months Ended January 31, | Year Ended July 31, | Period Ended July 31, | |||||||||||||||||
| 2007 | 2006 | 2005 | 2004 (a) | ||||||||||||||||
| Net asset value, beginning of period | $ | 9.62 | $ | 9.67 | $ | 9.88 | $ | 10.00 | |||||||||||
| Income from investment operations: | |||||||||||||||||||
| Net investment income (b) | 0.23 | 0.38 | 0.24 | 0.07 | |||||||||||||||
| Net realized and unrealized loss on investments | 0.02 | (0.02 | ) | (0.06 | ) | (0.08 | ) | ||||||||||||
| Total from investment operations | 0.25 | 0.36 | 0.18 | (0.01 | ) | ||||||||||||||
| Less distributions declared to shareholders: | |||||||||||||||||||
| From net investment income | (0.23 | ) | (0.41 | ) | (0.36 | ) | (0.11 | ) | |||||||||||
| Return of capital | - | - | (c) | (0.03 | ) | - | |||||||||||||
| Total distributions | (0.23 | ) | (0.41 | ) | (0.39 | ) | (0.11 | ) | |||||||||||
| Net asset value, end of period | $ | 9.64 | $ | 9.62 | $ | 9.67 | $ | 9.88 | |||||||||||
| Total return (d)(e) | 2.61 | %(f) | 3.84 | % | 1.83 | % | (0.08 | )%(f) | |||||||||||
| Ratios/Supplemental data: | |||||||||||||||||||
| Net assets, end of period (000's) | $ | 113,846 | $ | 89,863 | $ | 81,575 | $ | 67,235 | |||||||||||
| Ratio of net expenses to average net assets | 0.25 | %(g) | 0.25 | %(h) | 0.25 | %(h) | 0.25 | %(g)(h) | |||||||||||
| Ratio of net investment income to average net assets | 4.82 | %(g) | 3.93 | %(h) | 2.44 | %(h) | 1.69 | %(g)(h) | |||||||||||
| Reimbursement | 0.07 | %(g) | 0.07 | % | 0.05 | % | 0.22 | %(g) | |||||||||||
| Portfolio turnover rate | 31 | %(f) | 48 | % | 75 | % | 12 | %(f) | |||||||||||
(a) The Fund commenced investment operations on March 8, 2004. Per share data, total return and portfolio turnover reflect activity from that date.
(b) Per share data was calculated using the average shares outstanding during the period.
(c) Rounds to less than $0.01 per share.
(d) Total return at net asset value assuming all distributions reinvested.
(e) Had the investment advisor and/or any of its affiliates not waived or reimbursed a portion of expenses, total return would have been reduced.
(f) Not annualized.
(g) Annualized.
(h) The benefits derived from custody credits had an impact of less than 0.01%.
See Accompanying Notes to Financial Statements.
19
CMG HIGH YIELD FUND
A Portfolio of Columbia Funds Institutional Trust
FINANCIAL HIGHLIGHTS
(For a Fund Share Outstanding Throughout Each Period)
| (Unaudited) Six Months Ended January 31, | Year Ended July 31, | Period Ended July 31, | Year Ended October 31, | ||||||||||||||||||||||||||||
| 2007 | 2006 | 2005 | 2004 | 2003 (a) | 2002 | 2001 | |||||||||||||||||||||||||
| Net asset value, beginning of period | $ | 7.66 | $ | 8.08 | $ | 8.00 | $ | 7.90 | $ | 7.55 | $ | 8.14 | $ | 8.30 | |||||||||||||||||
| Income from investment | |||||||||||||||||||||||||||||||
| operations: | |||||||||||||||||||||||||||||||
| Net investment income | 0.26 | (b) | 0.50 | (b) | 0.51 | (b) | 0.53 | (b) | 0.43 | (b) | 0.64 | (b)(c) | 0.72 | ||||||||||||||||||
| Net realized and unrealized gain (loss) on investments and foreign currency transactions | 0.21 | (0.38 | ) | 0.11 | 0.14 | 0.37 | (0.58 | ) (c) | (0.16 | ) | |||||||||||||||||||||
| Total from investment operations | 0.47 | 0.12 | 0.62 | 0.67 | 0.80 | 0.06 | 0.56 | ||||||||||||||||||||||||
| Less distributions declared to shareholders: | |||||||||||||||||||||||||||||||
| From net investment income | (0.27 | ) | (0.54 | ) | (0.54 | ) | (0.57 | ) | (0.45 | ) | (0.65 | ) | (0.72 | ) | |||||||||||||||||
| Net asset value, end of period | $ | 7.86 | $ | 7.66 | $ | 8.08 | $ | 8.00 | $ | 7.90 | $ | 7.55 | $ | 8.14 | |||||||||||||||||
| Total return (d) | 6.24 | %(e)(f) | 1.47 | %(e) | 7.98 | %(e) | 8.60 | %(e) | 10.67 | %(e)(f) | 0.60 | % | 6.92 | % | |||||||||||||||||
| Ratios/Supplemental data: | |||||||||||||||||||||||||||||||
| Net assets, end of period (000's) | $ | 88,860 | $ | 96,120 | $ | 269,243 | $ | 382,157 | $ | 429,042 | $ | 286,228 | $ | 348,979 | |||||||||||||||||
| Ratio of net expenses to average net assets | 0.40 | %(g) | 0.40 | %(h) | 0.40 | %(h) | 0.40 | %(h) | 0.42 | %(g)(h) | 0.42 | %(h) | 0.44 | %(h) | |||||||||||||||||
| Ratio of net investment income to average net assets | 6.52 | %(g) | 6.38 | %(h) | 6.26 | %(h) | 6.64 | %(h) | 7.32 | %(g)(h) | 7.98 | %(c)(h) | 8.63 | %(h) | |||||||||||||||||
| Reimbursement | 0.09 | %(g) | 0.04 | % | 0.02 | % | 0.02 | % | 0.01 | %(g) | - | - | |||||||||||||||||||
| Portfolio turnover rate | 37 | %(f) | 30 | % | 39 | % | 47 | % | 47 | %(f) | 62 | % | 59 | % | |||||||||||||||||
(a) The Fund changed its fiscal year end from October 31 to July 31.
(b) Per share data was calculated using the average shares outstanding during the period.
(c) Effective November 1, 2001, the Fund adopted the provisions of the AICPA Audit and Accounting Guide for Investment Companies and began amortizing premium and accreting discount on all debt securities. The effect of this change for the year ended October 31, 2002, was to decrease net investment income per share by $0.01, decrease net realized and unrealized loss per share by $0.01 and decrease the ratio of net investment income to average net assets from 8.11% to 7.98%. Per share data and ratios for periods prior to October 31, 2002 have not been restated to reflect this change in presentation.
(d) Total return at net asset value assuming all distributions reinvested.
(e) Had the investment advisor and/or any of its affiliates not waived or reimbursed a portion of expenses, total return would have been reduced.
(f) Not annualized.
(g) Annualized.
(h) The benefits derived from custody credits had an impact of less than 0.01%.
See Accompanying Notes to Financial Statements.
20
CMG CORE BOND FUND
A Portfolio of Columbia Funds Institutional Trust
SCHEDULE OF INVESTMENTS
January 31, 2007 (Unaudited)
| Par | Value | ||||||||||
| Corporate Fixed-Income Bonds & Notes (25.9%) | |||||||||||
| Basic Materials (0.6%) | |||||||||||
| Chemicals (0.0%) | |||||||||||
| E.I. Dupont De Nemours & Co. | |||||||||||
| 3.375% 11/15/07 | $ | 5,000 | $ | 4,908 | |||||||
| Metals & Mining (0.6%) | |||||||||||
| Alcan, Inc. | |||||||||||
| 4.500% 05/15/13 | 175,000 | 164,159 | |||||||||
| Vale Overseas Ltd. | |||||||||||
| 6.250% 01/23/17 | 150,000 | 150,282 | |||||||||
| 314,441 | |||||||||||
| 319,349 | |||||||||||
| Communications (3.3%) | |||||||||||
| Media (1.1%) | |||||||||||
| Jones Intercable, Inc. | |||||||||||
| 7.625% 04/15/08 | 200,000 | 204,850 | |||||||||
| News America, Inc. | |||||||||||
| 6.550% 03/15/33 | 175,000 | 177,180 | |||||||||
| Time Warner, Inc. | |||||||||||
| 6.625% 05/15/29 | 200,000 | 202,306 | |||||||||
| 584,336 | |||||||||||
| Telecommunication Services (2.2%) | |||||||||||
| New Cingular Wireless Services, Inc. | |||||||||||
| 8.750% 03/01/31 | 150,000 | 193,979 | |||||||||
| AT&T, Inc. | |||||||||||
| 4.125% 09/15/09 | 200,000 | 194,051 | |||||||||
| Sprint Capital Corp. | |||||||||||
| 6.875% 11/15/28 | 200,000 | 199,077 | |||||||||
| Telefonica Emisones SAU | |||||||||||
| 5.984% 06/20/11 (a) | 225,000 | 228,573 | |||||||||
| Verizon Global Funding Corp. | |||||||||||
| 7.750% 12/01/30 | 150,000 | 174,463 | |||||||||
| Vodafone Group PLC | |||||||||||
| 5.000% 12/16/13 | 188,000 | 181,383 | |||||||||
| 1,171,526 | |||||||||||
| 1,755,862 | |||||||||||
| Consumer Cyclical (1.4%) | |||||||||||
| Auto Manufacturers (0.3%) | |||||||||||
| DaimlerChrysler NA Holding Corp. | |||||||||||
| 8.500% 01/18/31 | 150,000 | 177,724 | |||||||||
| Home Builders (0.4%) | |||||||||||
| D.R. Horton, Inc. | |||||||||||
| 5.625% 09/15/14 | 225,000 | 219,487 | |||||||||
See Accompanying Notes to Financial Statements.
21
CMG CORE BOND FUND
A Portfolio of Columbia Funds Institutional Trust
SCHEDULE OF INVESTMENTS
| Par | Value | ||||||||||
| Corporate Fixed-Income Bonds & Notes (continued) | |||||||||||
| Retail (0.7%) | |||||||||||
| Costco Wholesale Corp. | |||||||||||
| 5.500% 03/15/07 | $ | 6,000 | $ | 5,998 | |||||||
| Home Depot, Inc. | |||||||||||
| 5.400% 03/01/16 | 125,000 | 120,736 | |||||||||
| Target Corp. | |||||||||||
| 5.375% 06/15/09 | 5,000 | 5,013 | |||||||||
| 5.400% 10/01/08 (a) | 9,000 | 9,019 | |||||||||
| Wal-Mart Stores, Inc. | |||||||||||
| 4.125% 07/01/10 | 225,000 | 217,284 | |||||||||
| 358,050 | |||||||||||
| 755,261 | |||||||||||
| Consumer Non-Cyclical (3.0%) | |||||||||||
| Beverages (0.3%) | |||||||||||
| Anheuser-Busch Companies, Inc. | |||||||||||
| 5.950% 01/15/33 (a) | 12,000 | 11,781 | |||||||||
| Coca-Cola Co. | |||||||||||
| 5.750% 03/15/11 | 4,000 | 4,070 | |||||||||
| Diageo Capital PLC | |||||||||||
| 3.500% 11/19/07 | 110,000 | 108,424 | |||||||||
| PepsiCo, Inc. | |||||||||||
| 5.750% 01/15/08 (a) | 6,000 | 6,024 | |||||||||
| 130,299 | |||||||||||
| Cosmetics/Personal Care (0.2%) | |||||||||||
| Gillette Co. | |||||||||||
| 2.500% 06/01/08 | 85,000 | 81,735 | |||||||||
| Procter & Gamble Co. | |||||||||||
| 4.750% 06/15/07 | 9,000 | 8,988 | |||||||||
| 90,723 | |||||||||||
| Food (0.8%) | |||||||||||
| General Mills, Inc. | |||||||||||
| 3.875% 11/30/07 | 250,000 | 246,891 | |||||||||
| Kroger Co. | |||||||||||
| 6.200% 06/15/12 (a) | 185,000 | 188,501 | |||||||||
| 435,392 | |||||||||||
| Healthcare Products (0.0%) | |||||||||||
| Johnson & Johnson | |||||||||||
| 6.625% 09/01/09 (a) | 7,000 | 7,227 | |||||||||
| Healthcare Services (1.2%) | |||||||||||
| Aetna, Inc. | |||||||||||
| 6.625% 06/15/36 | 200,000 | 213,925 | |||||||||
| UnitedHealth Group, Inc. | |||||||||||
| 3.375% 08/15/07 | 200,000 | 197,842 | |||||||||
| WellPoint, Inc. | |||||||||||
| 6.800% 08/01/12 | 225,000 | 237,227 | |||||||||
| 648,994 | |||||||||||
See Accompanying Notes to Financial Statements.
22
CMG CORE BOND FUND
A Portfolio of Columbia Funds Institutional Trust
SCHEDULE OF INVESTMENTS
| Par | Value | ||||||||||
| Corporate Fixed-Income Bonds & Notes (continued) | |||||||||||
| Household Products/Wares (0.5%) | |||||||||||
| Fortune Brands, Inc. | |||||||||||
| 5.375% 01/15/16 | $ | 250,000 | $ | 235,664 | |||||||
| Kimberly-Clark Corp. | |||||||||||
| 5.625% 02/15/12 | 7,000 | 7,078 | |||||||||
| 242,742 | |||||||||||
| 1,555,377 | |||||||||||
| Energy (2.6%) | |||||||||||
| Oil & Gas (2.0%) | |||||||||||
| Anadarko Petroleum Corp. | |||||||||||
| 6.450% 09/15/36 | 100,000 | 99,079 | |||||||||
| ChevronTexaco Capital Co. | |||||||||||
| 3.500% 09/17/07 | 211,000 | 208,760 | |||||||||
| Devon Financing Corp. | |||||||||||
| 7.875% 09/30/31 | 150,000 | 178,714 | |||||||||
| Marathon Oil Corp. | |||||||||||
| 6.800% 03/15/32 (a) | 175,000 | 192,304 | |||||||||
| Nexen, Inc. | |||||||||||
| 5.875% 03/10/35 | 150,000 | 140,427 | |||||||||
| Valero Energy Corp. | |||||||||||
| 6.875% 04/15/12 | 200,000 | 211,184 | |||||||||
| 1,030,468 | |||||||||||
| Pipelines (0.6%) | |||||||||||
| Energy Transfer Partners LP | |||||||||||
| 6.625% 10/15/36 | 150,000 | 153,838 | |||||||||
| Plains All American Pipeline LP | |||||||||||
| 6.650% 01/15/37 (b) | 150,000 | 152,288 | |||||||||
| 306,126 | |||||||||||
| 1,336,594 | |||||||||||
| Financials (11.6%) | |||||||||||
| Banks (3.7%) | |||||||||||
| Bank of New York Co., Inc. | |||||||||||
| 3.900% 09/01/07 | 12,000 | 11,907 | |||||||||
| Bank One Corp. | |||||||||||
| 6.000% 08/01/08 | 27,000 | 27,275 | |||||||||
| Barclays Bank PLC | |||||||||||
| 7.400% 12/15/09 | 3,000 | 3,163 | |||||||||
| Capital One Financial Corp. | |||||||||||
| 5.500% 06/01/15 | 210,000 | 208,006 | |||||||||
| Marshall & Ilsley Corp. | |||||||||||
| 4.375% 08/01/09 | 325,000 | 317,043 | |||||||||
| Mellon Funding Corp. | |||||||||||
| 4.875% 06/15/07 | 8,000 | 7,988 | |||||||||
| National City Bank | |||||||||||
| 4.625% 05/01/13 | 18,000 | 17,269 | |||||||||
| SunTrust Banks, Inc. | |||||||||||
| 6.375% 04/01/11 (a) | 3,000 | 3,104 | |||||||||
See Accompanying Notes to Financial Statements.
23
CMG CORE BOND FUND
A Portfolio of Columbia Funds Institutional Trust
SCHEDULE OF INVESTMENTS
| Par | Value | ||||||||||
| Corporate Fixed-Income Bonds & Notes (continued) | |||||||||||
| Banks (continued) | |||||||||||
| SunTrust Preferred Capital I | |||||||||||
| 5.853% 12/15/11 (b) | $ | 140,000 | $ | 141,258 | |||||||
| U.S. Bank NA | |||||||||||
| 6.375% 08/01/11 | 290,000 | 301,196 | |||||||||
| Wachovia Corp. | |||||||||||
| 4.875% 02/15/14 | 400,000 | 385,338 | |||||||||
| Wells Fargo & Co. | |||||||||||
| 3.500% 04/04/08 (a) | 120,000 | 117,454 | |||||||||
| 5.125% 09/01/12 | 400,000 | 397,173 | |||||||||
| 1,938,174 | |||||||||||
| Diversified Financial Services (5.7%) | |||||||||||
| American Express Co. | |||||||||||
| 3.750% 11/20/07 | 5,000 | 4,937 | |||||||||
| 4.750% 06/17/09 | 8,000 | 7,915 | |||||||||
| American Express Credit Corp. | |||||||||||
| 3.000% 05/16/08 | 300,000 | 291,199 | |||||||||
| American General Finance Corp. | |||||||||||
| 2.750% 06/15/08 | 5,000 | 4,831 | |||||||||
| Ameriprise Financial, Inc. | |||||||||||
| 7.518% 06/01/66 (c) | 150,000 | 163,775 | |||||||||
| Associates Corp. of North America | |||||||||||
| 6.950% 11/01/18 | 11,000 | 12,224 | |||||||||
| Bear Stearns Companies, Inc. | |||||||||||
| 4.500% 10/28/10 (a) | 18,000 | 17,515 | |||||||||
| CIT Group, Inc. | |||||||||||
| 3.375% 04/01/09 | 23,000 | 22,084 | |||||||||
| 6.100% 03/15/67 (c) | 75,000 | 74,804 | |||||||||
| 7.375% 04/02/07 | 7,000 | 7,021 | |||||||||
| Citigroup Global Markets Holdings, Inc. | |||||||||||
| 6.500% 02/15/08 | 6,000 | 6,066 | |||||||||
| Citigroup, Inc. | |||||||||||
| 5.000% 09/15/14 | 430,000 | 416,842 | |||||||||
| Countrywide Home Loans, Inc. | |||||||||||
| 4.125% 09/15/09 | 250,000 | 242,471 | |||||||||
| General Electric Capital Corp. | |||||||||||
| 5.000% 01/08/16 (a) | 250,000 | 242,596 | |||||||||
| 6.750% 03/15/32 | 27,000 | 30,562 | |||||||||
| Goldman Sachs Group, Inc. | |||||||||||
| 4.125% 01/15/08 | 4,000 | 3,955 | |||||||||
| 6.345% 02/15/34 | 175,000 | 174,659 | |||||||||
| HSBC Finance Corp. | |||||||||||
| 5.000% 06/30/15 | 350,000 | 338,242 | |||||||||
| International Lease Finance Corp. | |||||||||||
| 4.500% 05/01/08 | 4,000 | 3,952 | |||||||||
| JPMorgan Chase Capital XVIII | |||||||||||
| 6.950% 08/17/36 | 275,000 | 294,755 | |||||||||
| Lehman Brothers Holdings, Inc. | |||||||||||
| 4.000% 01/22/08 | 27,000 | 26,623 | |||||||||
See Accompanying Notes to Financial Statements.
24
CMG CORE BOND FUND
A Portfolio of Columbia Funds Institutional Trust
SCHEDULE OF INVESTMENTS
| Par | Value | ||||||||||
| Corporate Fixed-Income Bonds & Notes (continued) | |||||||||||
| Diversified Financial Services (continued) | |||||||||||
| Merrill Lynch & Co., Inc. | |||||||||||
| 3.700% 04/21/08 | $ | 8,000 | $ | 7,832 | |||||||
| 4.125% 01/15/09 | 200,000 | 195,691 | |||||||||
| 6.000% 02/17/09 | 12,000 | 12,159 | |||||||||
| Morgan Stanley | |||||||||||
| 4.750% 04/01/14 | 200,000 | 189,693 | |||||||||
| National Rural Utilities Cooperative Finance Corp. | |||||||||||
| 3.250% 10/01/07 | 6,000 | 5,911 | |||||||||
| SLM Corp. | |||||||||||
| 5.375% 05/15/14 | 200,000 | 197,205 | |||||||||
| 2,995,519 | |||||||||||
| Insurance (1.2%) | |||||||||||
| American International Group, Inc. | |||||||||||
| 2.875% 05/15/08 | 250,000 | 241,892 | |||||||||
| Genworth Financial, Inc. | |||||||||||
| 6.150% 11/15/66 (c) | 100,000 | 99,597 | |||||||||
| Hartford Financial Services Group, Inc. | |||||||||||
| 4.700% 09/01/07 | 100,000 | 99,546 | |||||||||
| John Hancock Financial Services, Inc. | |||||||||||
| 5.625% 12/01/08 | 15,000 | 15,052 | |||||||||
| Metlife, Inc. | |||||||||||
| 5.375% 12/15/12 | 20,000 | 19,946 | |||||||||
| 6.400% 12/15/36 | 150,000 | 150,283 | |||||||||
| 626,316 | |||||||||||
| Real Estate (0.4%) | |||||||||||
| EOP Operating LP | |||||||||||
| 7.000% 07/15/11 | 200,000 | 213,569 | |||||||||
| Real Estate Investment Trusts (REITs) (0.3%) | |||||||||||
| Health Care Property Investors, Inc. | |||||||||||
| 6.450% 06/25/12 | 150,000 | 153,972 | |||||||||
| Savings & Loans (0.3%) | |||||||||||
| Washington Mutual, Inc. | |||||||||||
| 4.200% 01/15/10 | 200,000 | 193,159 | |||||||||
| 6,120,709 | |||||||||||
| Industrials (1.0%) | |||||||||||
| Aerospace & Defense (0.5%) | |||||||||||
| Boeing Co. | |||||||||||
| 5.125% 02/15/13 | 1,000 | 990 | |||||||||
| Lockheed Martin Corp. | |||||||||||
| 6.150% 09/01/36 | 160,000 | 166,936 | |||||||||
| United Technologies Corp. | |||||||||||
| 7.125% 11/15/10 | 100,000 | 106,097 | |||||||||
| 274,023 | |||||||||||
See Accompanying Notes to Financial Statements.
25
CMG CORE BOND FUND
A Portfolio of Columbia Funds Institutional Trust
SCHEDULE OF INVESTMENTS
| Par | Value | ||||||||||
| Corporate Fixed-Income Bonds & Notes (continued) | |||||||||||
| Transportation (0.5%) | |||||||||||
| Canadian National Railway Co. | |||||||||||
| 7.195% 01/02/16 | $ | 73,589 | $ | 81,836 | |||||||
| Union Pacific Corp. | |||||||||||
| 3.875% 02/15/09 | 185,000 | 179,521 | |||||||||
| 261,357 | |||||||||||
| 535,380 | |||||||||||
| Technology (0.5%) | |||||||||||
| Computers (0.5%) | |||||||||||
| International Business Machines Corp. | |||||||||||
| 6.220% 08/01/27 | 250,000 | 260,957 | |||||||||
| Utilities (1.9%) | |||||||||||
| Electric (1.7%) | |||||||||||
| American Electric Power Co., Inc. | |||||||||||
| 5.250% 06/01/15 (a) | 225,000 | 219,013 | |||||||||
| Commonwealth Edison Co. | |||||||||||
| 3.700% 02/01/08 | 11,000 | 10,798 | |||||||||
| 5.950% 08/15/16 (a) | 200,000 | 201,964 | |||||||||
| Progress Energy, Inc. | |||||||||||
| 7.750% 03/01/31 | 200,000 | 239,483 | |||||||||
| Public Service Electric & Gas Co. | |||||||||||
| 4.000% 11/01/08 | 5,000 | 4,879 | |||||||||
| Southern California Edison Co. | |||||||||||
| 5.000% 01/15/14 | 200,000 | 193,792 | |||||||||
| Virginia Electric & Power Co. | |||||||||||
| 5.375% 02/01/07 | 6,000 | 6,000 | |||||||||
| 875,929 | |||||||||||
| Gas (0.2%) | |||||||||||
| Sempra Energy | |||||||||||
| 4.750% 05/15/09 | 100,000 | 98,619 | |||||||||
| 974,548 | |||||||||||
| Total Corporate Fixed-Income Bonds & Notes (Cost of $13,630,214) | 13,614,037 | ||||||||||
| Mortgage-Backed Securities (28.1%) | |||||||||||
| Federal Home Loan Mortgage Corp. | |||||||||||
| 3.500% 10/01/18 | 271,178 | 249,318 | |||||||||
| 4.000% 11/01/20 | 260,335 | 243,454 | |||||||||
| 5.500% 11/01/17 | 95,396 | 95,107 | |||||||||
| 5.500% 03/01/18 | 78,301 | 78,064 | |||||||||
| 5.500% 03/01/21 | 442,890 | 440,607 | |||||||||
| 5.500% 07/01/21 | 943,061 | 938,200 | |||||||||
| 5.500% 08/01/21 | 2,367,161 | 2,354,959 | |||||||||
| 5.500% 11/01/21 | 297,413 | 295,880 | |||||||||
| 5.500% 08/01/35 | 1,462,330 | 1,440,154 | |||||||||
| 6.000% 05/01/17 | 143,156 | 144,952 | |||||||||
| 6.000% 10/01/36 | 314,999 | 316,249 | |||||||||
See Accompanying Notes to Financial Statements.
26
CMG CORE BOND FUND
A Portfolio of Columbia Funds Institutional Trust
SCHEDULE OF INVESTMENTS
| Par | Value | ||||||||||
| Mortgage-Backed Securities (continued) | |||||||||||
| Federal National Mortgage Association | |||||||||||
| 5.000% 11/01/34 | $ | 441,714 | $ | 424,660 | |||||||
| 5.000% 12/01/34 | 231,361 | 222,429 | |||||||||
| 5.000% 09/01/35 | 580,841 | 557,665 | |||||||||
| 5.500% 02/01/21 | 780,094 | 776,787 | |||||||||
| 5.500% 08/01/35 | 343,035 | 337,595 | |||||||||
| 5.500% 09/01/35 | 453,869 | 446,673 | |||||||||
| 5.500% 10/01/35 | 871,422 | 857,604 | |||||||||
| 5.500% 04/01/36 | 164,966 | 162,247 | |||||||||
| 5.500% 11/01/36 | 1,488,682 | 1,464,144 | |||||||||
| 6.000% 07/01/35 | 191,794 | 192,538 | |||||||||
| 6.000% 05/01/36 | 573,336 | 575,442 | |||||||||
| 6.000% 09/01/36 | 1,127,879 | 1,132,022 | |||||||||
| 6.000% 10/01/36 | 390,993 | 392,430 | |||||||||
| 6.000% 11/01/36 | 483,477 | 485,253 | |||||||||
| 6.500% 02/01/13 | 14,450 | 14,776 | |||||||||
| 6.500% 08/01/34 | 73,695 | 75,087 | |||||||||
| 7.000% 07/01/32 | 20,829 | 21,426 | |||||||||
| Government National Mortgage Association | |||||||||||
| 7.000% 01/15/32 | 8,030 | 8,300 | |||||||||
| 7.000% 03/15/32 | 29,182 | 30,163 | |||||||||
| 7.000% 06/15/32 | 4,516 | 4,667 | |||||||||
| Total Mortgage-Backed Securities (Cost of $14,490,956) | 14,778,852 | ||||||||||
| Government & Agency Obligations (14.8%) | |||||||||||
| Foreign Government Obligations (1.8%) | |||||||||||
| Hellenic Republic of Greece | |||||||||||
| 6.950% 03/04/08 | 13,000 | 13,231 | |||||||||
| Province of Ontario | |||||||||||
| 3.500% 09/17/07 | 350,000 | 345,988 | |||||||||
| Province of Quebec | |||||||||||
| 5.000% 07/17/09 | 350,000 | 348,470 | |||||||||
| United Mexican States | |||||||||||
| 7.500% 04/08/33 | 205,000 | 237,800 | |||||||||
| 945,489 | |||||||||||
| U.S. Government Agencies (4.8%) | |||||||||||
| Federal Home Loan Bank | |||||||||||
| 4.875% 05/15/07 | 25,000 | 24,966 | |||||||||
| 5.125% 10/19/16 | 525,000 | 523,733 | |||||||||
| Federal Home Loan Mortgage Corp. | |||||||||||
| 4.875% 11/15/13 | 130,000 | 128,183 | |||||||||
| Federal National Mortgage Association | |||||||||||
| 3.375% 12/15/08 | 610,000 | 591,065 | |||||||||
| 4.625% 10/15/14 | 34,000 | 32,943 | |||||||||
| 5.250% 08/01/12 | 1,250,000 | 1,247,935 | |||||||||
| 2,548,825 | |||||||||||
See Accompanying Notes to Financial Statements.
27
CMG CORE BOND FUND
A Portfolio of Columbia Funds Institutional Trust
SCHEDULE OF INVESTMENTS
| Par | Value | ||||||||||
| Government & Agency Obligations (continued) U.S. Government Obligations (8.2%) | |||||||||||
| U.S. Treasury Bonds | |||||||||||
| 6.250% 08/15/23 (a) | $ | 1,550,000 | $ | 1,761,308 | |||||||
| 7.250% 05/15/16 (a) | 50,000 | 58,875 | |||||||||
| U.S. Treasury Inflation Indexed Bonds | |||||||||||
| 2.500% 07/15/16 (a) | 848,139 | 856,057 | |||||||||
| U.S. Treasury Notes | |||||||||||
| 3.875% 02/15/13 (a) | 1,695,000 | 1,613,164 | |||||||||
| 4,289,404 | |||||||||||
| Total Government & Agency Obligations (Cost of $8,080,881) | 7,783,718 | ||||||||||
| Collateralized Mortgage Obligations (19.0%) | |||||||||||
| Agency (10.0%) | |||||||||||
| Federal Home Loan Mortgage Corp. | |||||||||||
| 3.750% 12/15/11 | 64,604 | 62,480 | |||||||||
| 4.000% 09/15/15 | 510,000 | 494,327 | |||||||||
| 4.500% 03/15/18 | 1,580,000 | 1,534,225 | |||||||||
| 4.500% 10/15/18 | 342,654 | 337,015 | |||||||||
| 6.500% 10/15/23 | 100,000 | 102,789 | |||||||||
| Federal National Mortgage Association | |||||||||||
| 4.500% 11/25/14 | 900,000 | 883,217 | |||||||||
| 6.000% 04/25/32 | 600,000 | 607,012 | |||||||||
| Government National Mortgage Association | |||||||||||
| 4.430% 04/16/34 | 90,000 | 86,477 | |||||||||
| 4.500% 04/16/28 | 1,000,000 | 980,108 | |||||||||
| 4.807% 08/16/32 | 90,000 | 87,367 | |||||||||
| 4.954% 05/16/31 | 100,000 | 95,381 | |||||||||
| 5,270,398 | |||||||||||
| Non-Agency (9.0%) | |||||||||||
| Bear Stearns Asset Backed Securities, Inc. | |||||||||||
| 5.000% 01/25/34 | 248,249 | 244,130 | |||||||||
| Countrywide Alternative Loan Trust | |||||||||||
| 5.250% 03/25/35 | 792,956 | 779,946 | |||||||||
| 5.250% 08/25/35 | 664,877 | 662,304 | |||||||||
| 5.500% 10/25/35 | 692,337 | 687,440 | |||||||||
| Countrywide Home Loan Mortgage Pass Through Trust | |||||||||||
| 4.594% 12/19/33 (c) | 234,959 | 225,955 | |||||||||
| Structured Asset Securities Corp. | |||||||||||
| 5.500% 07/25/33 | 982,139 | 971,401 | |||||||||
| Washington Mutual Mortgage Securities Corp. | |||||||||||
| 5.500% 10/25/35 | 1,162,008 | 1,158,108 | |||||||||
| 4,729,284 | |||||||||||
| Total Collateralized Mortgage Obligations (Cost of $10,203,342) | 9,999,682 | ||||||||||
See Accompanying Notes to Financial Statements.
28
CMG CORE BOND FUND
A Portfolio of Columbia Funds Institutional Trust
SCHEDULE OF INVESTMENTS
| Par | Value | ||||||||||
| Commercial Mortgage-Backed Securities (6.4%) | |||||||||||
| Bear Stearns Commercial Mortgage Securities | |||||||||||
| 4.680% 08/13/39 | $ | 30,000 | $ | 28,803 | |||||||
| 5.458% 03/11/39 (c) | 730,000 | 730,063 | |||||||||
| CS First Boston Mortgage Securities Corp. | |||||||||||
| 4.512% 07/15/37 | 500,000 | 486,468 | |||||||||
| Greenwich Capital Commercial Funding Corp. | |||||||||||
| 5.301% 04/10/37 (c) | 100,000 | 98,516 | |||||||||
| LB-UBS Commercial Mortgage Trust | |||||||||||
| 5.103% 11/15/30 | 600,000 | 594,322 | |||||||||
| Merrill Lynch Mortgage Trust | |||||||||||
| 5.244% 11/12/37 (c) | 720,000 | 709,932 | |||||||||
| Morgan Stanley Capital I | |||||||||||
| 4.970% 12/15/41 | 71,000 | 69,097 | |||||||||
| 5.370% 12/15/43 | 630,000 | 619,539 | |||||||||
| Nationslink Funding Corp. | |||||||||||
| 6.888% 11/10/30 (d) | 54,423 | 54,592 | |||||||||
| Total Commercial Mortgage-Backed Securities (Cost of $3,439,453) | 3,391,332 | ||||||||||
| Asset-Backed Securities (2.0%) | |||||||||||
| ABFS Mortgage Loan Trust | |||||||||||
| 4.428% 12/15/33 | 80,341 | 78,528 | |||||||||
| AmeriCredit Automobile Receivables Trust | |||||||||||
| 4.870% 12/06/10 | 250,000 | 248,807 | |||||||||
| BMW Vehicle Owner Trust | |||||||||||
| 3.320% 02/25/09 | 51,000 | 50,522 | |||||||||
| Capital One Multi-Asset Execution Trust | |||||||||||
| 4.050% 03/15/13 | 250,000 | 241,443 | |||||||||
| Ford Credit Auto Owner Trust | |||||||||||
| 3.540% 11/15/08 | 116,000 | 114,762 | |||||||||
| Honda Auto Receivables Owner Trust | |||||||||||
| 3.060% 10/21/09 | 59,000 | 58,254 | |||||||||
| IMC Home Equity Loan Trust | |||||||||||
| 7.310% 11/20/28 | 58,921 | 58,727 | |||||||||
| 7.520% 08/20/28 | 34,617 | 34,513 | |||||||||
| Onyx Acceptance Grantor Trust | |||||||||||
| 3.890% 02/15/11 | 134,417 | 132,993 | |||||||||
| Wilshire Mortgage Loan Trust | |||||||||||
| 7.255% 05/25/28 | 47,630 | 47,451 | |||||||||
| Total Asset-Backed Securities (Cost of $1,072,203) | 1,066,000 | ||||||||||
See Accompanying Notes to Financial Statements.
29
CMG CORE BOND FUND
A Portfolio of Columbia Funds Institutional Trust
SCHEDULE OF INVESTMENTS
| Shares | Value | ||||||||||
| Municipal Preferred Stocks (0.3%) | |||||||||||
| Financials (0.3%) | |||||||||||
| Diversified Financial Services (0.3%) | |||||||||||
| AGFC Capital Trust I | |||||||||||
| 6.000% 01/15/67 (b) | 185,000 | $ | 183,981 | ||||||||
| Total Municipal Preferred Stocks (Cost of $184,551) | 183,981 | ||||||||||
| Securities Lending Collateral (11.0%) | |||||||||||
| State Street Navigator Securities Lending Prime Portfolio (e) | 5,798,444 | 5,798,444 | |||||||||
| Total Securities Lending Collateral (Cost of $5,798,444) | 5,798,444 | ||||||||||
| Par | |||||||||||
| Short-Term Obligation (2.4%) | |||||||||||
| Repurchase agreement with Fixed Income Clearing Corp., dated 01/31/07, due 02/01/07 at 5.16%, collateralized by a U.S. Treasury Note maturing 08/15/11, market value of $1,313,250 (repurchase proceeds $1,283,184) | 1,283,000 | 1,283,000 | |||||||||
| Total Short-Term Obligation (Cost of $1,283,000) | 1,283,000 | ||||||||||
| Total Investments (109.9%) (Cost of $58,183,044) (f) | 57,899,046 | ||||||||||
| Other Assets & Liabilities, Net (-9.9%) | (5,241,624 | ) | |||||||||
| Net Assets (100.0%) | $ | 52,657,422 | |||||||||
Notes to Schedule of Investments:
(a) All or a portion of this security is on loan at January 31, 2007. The total market value of securities on loan at January 31, 2007 is $5,707,499.
(b) Security exempt from registration pursuant to Rule 144A under the Securities Act of 1933. These securities may be resold in transactions exempt from registration, normally to qualified institutional buyers. At January 31, 2007, these securities, which are not illiquid, amounted to $477,527, which represents 0.9% of net assets.
(c) The interest rate shown on floating rate or variable rate securities reflects the rate at January 31, 2007.
See Accompanying Notes to Financial Statements.
30
CMG CORE BOND FUND
A Portfolio of Columbia Funds Institutional Trust
SCHEDULE OF INVESTMENTS
(d) Investments in affiliates during the period ended January 31, 2007:
Security name: Nationslink Funding Corp., 6.888%, 11/10/30
| Par as of 07/31/06: | $ | 90,000 | |||||
| Par purchased: | $ | - | |||||
| Par sold:* | $ | 35,577 | |||||
| Par as of 01/31/07: | $ | 54,423 | |||||
| Net realized gain/loss | $ | - | |||||
| Interest income earned | $ | 2,446 | |||||
| Value at end of period: | $ | 54,592 | |||||
| *Represents principal payments. | |||||||
| (e) Investment made with cash collateral received from securities lending activity. | |||||||
| (f) Cost for federal income tax purposes is $58,226,272. | |||||||
At January 31, 2007, the asset allocation of the Fund is as follows:
Asset Allocation | % of Net Assets | ||||||
| Mortgage-Backed Securities | 28.1 | ||||||
| Corporate Fixed-Income Bonds & Notes | 25.9 | ||||||
| Collateralized Mortgage Obligations | 19.0 | ||||||
| Government & Agency Obligations | 14.8 | ||||||
| Commercial Mortgage-Backed Securities | 6.4 | ||||||
| Asset-Backed Securities | 2.0 | ||||||
| Municipal Preferred Stocks | 0.3 | ||||||
| 96.5 | |||||||
| Securities Lending Collateral | 11.0 | ||||||
| Short-Term Obligation | 2.4 | ||||||
| Other Assets & Liabilities, Net | (9.9 | ) | |||||
| 100.0 | |||||||
See Accompanying Notes to Financial Statements.
31
CMG SHORT TERM BOND FUND
A Portfolio of Columbia Funds Institutional Trust
SCHEDULE OF INVESTMENTS
January 31, 2007 (Unaudited)
| Par | Value | ||||||||||
| Corporate Fixed-Income Bonds & Notes (33.7%) | |||||||||||
| Communications (3.4%) | |||||||||||
| Media (0.5%) | |||||||||||
| Jones Intercable, Inc. | |||||||||||
| 7.625% 04/15/08 | $ | 110,000 | $ | 112,668 | |||||||
| Time Warner, Inc. | |||||||||||
| 6.150% 05/01/07 | 375,000 | 375,484 | |||||||||
| 488,152 | |||||||||||
| Telecommunication Services (2.9%) | |||||||||||
| AT&T, Inc. | |||||||||||
| 4.125% 09/15/09 | 700,000 | 679,178 | |||||||||
| Deutsche Telekom International Finance BV | |||||||||||
| 3.875% 07/22/08 | 300,000 | 293,724 | |||||||||
| New Cingular Wireless Services, Inc. | |||||||||||
| 7.500% 05/01/07 | 300,000 | 301,296 | |||||||||
| Sprint Capital Corp. | |||||||||||
| 6.375% 05/01/09 | 470,000 | 478,512 | |||||||||
| Verizon Global Funding Corp. | |||||||||||
| 7.600% 03/15/07 | 575,000 | 576,348 | |||||||||
| Vodafone Group PLC | |||||||||||
| 7.750% 02/15/10 | 350,000 | 371,741 | |||||||||
| 2,700,799 | |||||||||||
| 3,188,951 | |||||||||||
| Consumer Cyclical (2.5%) | |||||||||||
| Auto Manufacturers (0.2%) | |||||||||||
| DaimlerChrysler NA Holding Corp. | |||||||||||
| 4.750% 01/15/08 | 200,000 | 198,298 | |||||||||
| Home Builders (0.3%) | |||||||||||
| DR Horton, Inc. | |||||||||||
| 4.875% 01/15/10 | 275,000 | 269,192 | |||||||||
| Retail (2.0%) | |||||||||||
| Home Depot, Inc. | |||||||||||
| 3.750% 09/15/09 | 500,000 | 480,835 | |||||||||
| Target Corp. | |||||||||||
| 3.375% 03/01/08 (a) | 500,000 | 489,313 | |||||||||
| Wal-Mart Stores, Inc. | |||||||||||
| 6.875% 08/10/09 | 850,000 | 882,561 | |||||||||
| 1,852,709 | |||||||||||
| 2,320,199 | |||||||||||
| Consumer Non-Cyclical (3.0%) | |||||||||||
| Beverages (0.8%) | |||||||||||
| Coca-Cola Enterprises, Inc. | |||||||||||
| 5.750% 11/01/08 | 325,000 | 327,370 | |||||||||
| Diageo Capital PLC | |||||||||||
| 3.375% 03/20/08 | 400,000 | 391,132 | |||||||||
| 718,502 | |||||||||||
See Accompanying Notes to Financial Statements.
32
CMG SHORT TERM BOND FUND
A Portfolio of Columbia Funds Institutional Trust
SCHEDULE OF INVESTMENTS
| Par | Value | ||||||||||
| Corporate Fixed-Income Bonds & Notes (continued) | |||||||||||
| Cosmetics/Personal Care (0.4%) | |||||||||||
| Procter & Gamble Co. | |||||||||||
| 4.750% 06/15/07 | $ | 410,000 | $ | 409,440 | |||||||
| Food (0.7%) | |||||||||||
| Fred Meyer, Inc. | |||||||||||
| 7.450% 03/01/08 | 275,000 | 280,087 | |||||||||
| General Mills, Inc. | |||||||||||
| 3.875% 11/30/07 | 400,000 | 395,026 | |||||||||
| 675,113 | |||||||||||
| Healthcare Services (0.7%) | |||||||||||
| UnitedHealth Group, Inc. | |||||||||||
| 3.375% 08/15/07 | 350,000 | 346,224 | |||||||||
| WellPoint, Inc. | |||||||||||
| 3.500% 09/01/07 | 300,000 | 296,409 | |||||||||
| 642,633 | |||||||||||
| Household Products/Wares (0.4%) | |||||||||||
| Fortune Brands, Inc. | |||||||||||
| 5.125% 01/15/11 | 325,000 | 318,245 | |||||||||
| 2,763,933 | |||||||||||
| Energy (1.1%) | |||||||||||
| Oil & Gas (1.1%) | |||||||||||
| ChevronTexaco Capital Co. | |||||||||||
| 3.500% 09/17/07 (a) | 725,000 | 717,304 | |||||||||
| Marathon Oil Corp. | |||||||||||
| 5.375% 06/01/07 | 350,000 | 349,871 | |||||||||
| 1,067,175 | |||||||||||
| Financials (19.4%) | |||||||||||
| Banks (5.4%) | |||||||||||
| Bank of New York Co., Inc. | |||||||||||
| 3.625% 01/15/09 | 709,000 | 686,722 | |||||||||
| Capital One Bank | |||||||||||
| 4.875% 05/15/08 | 425,000 | 422,011 | |||||||||
| Marshall & Ilsley Corp. | |||||||||||
| 4.375% 08/01/09 | 875,000 | 853,576 | |||||||||
| Mellon Funding Corp. | |||||||||||
| 3.250% 04/01/09 | 500,000 | 477,337 | |||||||||
| Regions Financial Corp. | |||||||||||
| 4.500% 08/08/08 | 450,000 | 443,907 | |||||||||
| SunTrust Banks, Inc. | |||||||||||
| 4.250% 10/15/09 | 650,000 | 631,910 | |||||||||
| U.S. Bancorp | |||||||||||
| 3.125% 03/15/08 | 850,000 | 828,146 | |||||||||
| Wells Fargo & Co. | |||||||||||
| 3.120% 08/15/08 | 700,000 | 676,447 | |||||||||
| 5,020,056 | |||||||||||
See Accompanying Notes to Financial Statements.
33
CMG SHORT TERM BOND FUND
A Portfolio of Columbia Funds Institutional Trust
SCHEDULE OF INVESTMENTS
| Par | Value | ||||||||||
| Corporate Fixed-Income Bonds & Notes (continued) | |||||||||||
| Commercial Banks (0.5%) | |||||||||||
| Fifth Third Bank | |||||||||||
| 4.200% 02/23/10 | $ | 450,000 | $ | 435,633 | |||||||
| Diversified Financial Services (9.9%) | |||||||||||
| American Express Credit Corp. | |||||||||||
| 3.000% 05/16/08 | 700,000 | 679,463 | |||||||||
| Bear Stearns Companies, Inc. | |||||||||||
| 2.875% 07/02/08 | 375,000 | 362,716 | |||||||||
| CIT Group, Inc. | |||||||||||
| 5.500% 11/30/07 | 350,000 | 350,585 | |||||||||
| Citigroup, Inc. | |||||||||||
| 4.250% 07/29/09 (a) | 850,000 | 830,428 | |||||||||
| Countrywide Home Loans, Inc. | |||||||||||
| 3.250% 05/21/08 | 425,000 | 413,716 | |||||||||
| Credit Suisse First Boston USA, Inc. | |||||||||||
| 4.625% 01/15/08 | 725,000 | 719,810 | |||||||||
| General Electric Capital Corp. | |||||||||||
| 4.250% 01/15/08 | 900,000 | 891,560 | |||||||||
| Goldman Sachs Group, Inc. | |||||||||||
| 4.125% 01/15/08 (a) | 750,000 | 741,573 | |||||||||
| HSBC Finance Corp. | |||||||||||
| 6.400% 06/17/08 | 650,000 | 658,405 | |||||||||
| JPMorgan Chase & Co. | |||||||||||
| 3.800% 10/02/09 (a) | 1,050,000 | 1,011,283 | |||||||||
| Lehman Brothers Holdings, Inc. | |||||||||||
| 7.000% 02/01/08 | 375,000 | 380,272 | |||||||||
| Merrill Lynch & Co., Inc. | |||||||||||
| 4.125% 01/15/09 | 675,000 | 660,458 | |||||||||
| Morgan Stanley | |||||||||||
| 3.875% 01/15/09 | 475,000 | 462,849 | |||||||||
| National Rural Utilities Cooperative Finance Corp. | |||||||||||
| 5.750% 08/28/09 | 425,000 | 429,522 | |||||||||
| SLM Corp. | |||||||||||
| 4.000% 01/15/09 | 750,000 | 731,594 | |||||||||
| 9,324,234 | |||||||||||
| Insurance (2.0%) | |||||||||||
| Allstate Corp. | |||||||||||
| 7.200% 12/01/09 | 650,000 | 681,162 | |||||||||
| American International Group, Inc. | |||||||||||
| 2.875% 05/15/08 | 850,000 | 822,432 | |||||||||
| Genworth Financial, Inc. | |||||||||||
| 4.750% 06/15/09 | 350,000 | 345,759 | |||||||||
| 1,849,353 | |||||||||||
| Real Estate Investment Trusts (REITs) (0.4%) | |||||||||||
| Simon Property Group LP | |||||||||||
| 4.875% 03/18/10 | 400,000 | 393,910 | |||||||||
See Accompanying Notes to Financial Statements.
34
CMG SHORT TERM BOND FUND
A Portfolio of Columbia Funds Institutional Trust
SCHEDULE OF INVESTMENTS
| Par | Value | ||||||||||
| Corporate Fixed-Income Bonds & Notes (continued) | |||||||||||
| Savings & Loans (1.2%) | |||||||||||
| Washington Mutual, Inc. | |||||||||||
| 4.000% 01/15/09 | $ | 450,000 | $ | 438,209 | |||||||
| Western Financial Bank | |||||||||||
| 9.625% 05/15/12 | 675,000 | 733,534 | |||||||||
| 1,171,743 | |||||||||||
| 18,194,929 | |||||||||||
| Industrials (2.0%) | |||||||||||
| Aerospace & Defense (0.7%) | |||||||||||
| United Technologies Corp. | |||||||||||
| 6.500% 06/01/09 | 600,000 | 615,746 | |||||||||
| Machinery (0.8%) | |||||||||||
| Caterpillar Financial Services Corp. | |||||||||||
| 3.625% 11/15/07 | 425,000 | 419,179 | |||||||||
| John Deere Capital Corp. | |||||||||||
| 4.625% 04/15/09 | 300,000 | 294,863 | |||||||||
| 714,042 | |||||||||||
| Miscellaneous Manufacturing (0.2%) | |||||||||||
| 3M Co. | |||||||||||
| 5.125% 11/06/09 (a) | 225,000 | 224,759 | |||||||||
| Transportation (0.3%) | |||||||||||
| Union Pacific Corp. | |||||||||||
| 3.875% 02/15/09 | 325,000 | 315,374 | |||||||||
| 1,869,921 | |||||||||||
| Technology (0.8%) | |||||||||||
| Computers (0.8%) | |||||||||||
| International Business Machines Corp. | |||||||||||
| 3.800% 02/01/08 | 725,000 | 713,501 | |||||||||
| Utilities (1.5%) | |||||||||||
| Electric (1.2%) | |||||||||||
| American Electric Power Co., Inc. | |||||||||||
| 5.375% 03/15/10 (a) | 500,000 | 498,711 | |||||||||
| Commonwealth Edison Co. | |||||||||||
| 3.700% 02/01/08 | 350,000 | 343,591 | |||||||||
| Virginia Electric & Power Co. | |||||||||||
| 5.375% 02/01/07 | 325,000 | 325,000 | |||||||||
| 1,167,302 | |||||||||||
| Gas (0.3%) | |||||||||||
| Sempra Energy | |||||||||||
| 4.750% 05/15/09 | 250,000 | 246,546 | |||||||||
| 1,413,848 | |||||||||||
| Total Corporate Fixed-Income Bonds & Notes (Cost of $31,629,687) | 31,532,457 | ||||||||||
See Accompanying Notes to Financial Statements.
35
CMG SHORT TERM BOND FUND
A Portfolio of Columbia Funds Institutional Trust
SCHEDULE OF INVESTMENTS
| Par | Value | ||||||||||
| Collateralized Mortgage Obligations (24.9%) | |||||||||||
| Agency (11.8%) | |||||||||||
| Federal Home Loan Mortgage Corp. | |||||||||||
| 4.000% 09/15/15 | $ | 613,856 | $ | 599,516 | |||||||
| 4.500% 02/15/15 | 1,149,287 | 1,133,369 | |||||||||
| 5.000% 05/15/26 | 253,126 | 251,304 | |||||||||
| 5.500% 02/15/25 | 2,100,000 | 2,101,302 | |||||||||
| 5.500% 12/15/26 | 937,096 | 937,211 | |||||||||
| 6.000% 06/15/25 | 1,200,000 | 1,210,868 | |||||||||
| 6.000% 05/15/27 | 1,424,502 | 1,437,562 | |||||||||
| Federal National Mortgage Association | |||||||||||
| 6.000% 06/25/27 | 1,426,271 | 1,436,574 | |||||||||
| 5.500% 07/25/25 | 1,979,114 | 1,977,413 | |||||||||
| 11,085,119 | |||||||||||
| Non-Agency (13.1%) | |||||||||||
| Bear Stearns Adjustable Rate Mortgage Trust | |||||||||||
| 3.516% 06/25/34 (b) | 1,000,000 | 973,766 | |||||||||
| Bear Stearns Asset Backed Securities, Inc. | |||||||||||
| 5.000% 01/25/34 | 806,380 | 793,003 | |||||||||
| Countrywide Alternative Loan Trust | |||||||||||
| 5.250% 08/25/35 | 997,315 | 993,456 | |||||||||
| 5.500% 02/25/36 | 2,379,047 | 2,359,749 | |||||||||
| IMPAC CMB Trust | |||||||||||
| 6.080% 12/25/33 (b) | 119,978 | 119,977 | |||||||||
| JPMorgan Mortgage Trust | |||||||||||
| 5.766% 04/25/36 (b) | 1,704,041 | 1,699,699 | |||||||||
| 6.078% 10/25/36 (b) | 979,364 | 979,064 | |||||||||
| MASTR Asset Securitization Trust | |||||||||||
| 5.750% 05/25/36 | 1,620,423 | 1,622,280 | |||||||||
| PNC Mortgage Securities Corp. | |||||||||||
| 0.010% 04/28/27 (b) | 6,299 | 5,669 | |||||||||
| Residential Accredit Loans, Inc. | |||||||||||
| 5.750% 01/25/36 | 326,599 | 326,482 | |||||||||
| SACO I, Inc. | |||||||||||
| 7.000% 08/25/36 (c) | 118,727 | 118,281 | |||||||||
| Structured Asset Securities Corp. | |||||||||||
| 5.750% 04/25/33 | 667,769 | 664,022 | |||||||||
| Washington Mutual, Inc. | |||||||||||
| 5.664% 11/25/36 (b) | 1,600,254 | 1,592,822 | |||||||||
| 12,248,270 | |||||||||||
| Total Collateralized Mortgage Obligations (Cost of $23,410,845) | 23,333,389 | ||||||||||
| Asset-Backed Securities (13.1%) | |||||||||||
| AmeriCredit Automobile Receivables Trust | |||||||||||
| 4.050% 02/06/10 | 305,679 | 303,637 | |||||||||
| Bear Stearns Asset Backed Securities, Inc. | |||||||||||
| 5.430% 06/25/35 (b) | 7,022 | 7,022 | |||||||||
| Capital Auto Receivables Asset Trust | |||||||||||
| 3.580% 01/15/09 | 2,000,000 | 1,978,804 | |||||||||
See Accompanying Notes to Financial Statements.
36
CMG SHORT TERM BOND FUND
A Portfolio of Columbia Funds Institutional Trust
SCHEDULE OF INVESTMENTS
| Par | Value | ||||||||||
| Asset-Backed Securities (continued) | |||||||||||
| Cityscape Home Equity Loan Trust | |||||||||||
| 7.410% 05/25/28 | $ | 63,597 | $ | 63,346 | |||||||
| Daimler Chrysler Auto Trust | |||||||||||
| 4.980% 02/08/11 | 1,200,000 | 1,192,671 | |||||||||
| Franklin Auto Trust | |||||||||||
| 5.040% 01/20/11 | 1,000,000 | 994,507 | |||||||||
| Harley-Davidson Motorcycle Trust | |||||||||||
| 2.760% 05/15/11 | 721,306 | 712,392 | |||||||||
| Home Equity Mortgage Trust | |||||||||||
| 5.472% 09/25/36 (b) | 1,444,767 | 1,444,173 | |||||||||
| IMC Home Equity Loan Trust | |||||||||||
| 7.500% 04/25/26 | 274,438 | 273,635 | |||||||||
| 7.520% 08/20/28 | 82,549 | 82,300 | |||||||||
| KeyCorp Student Loan Trust | |||||||||||
| 5.758% 08/27/25 (b) | 627,626 | 628,560 | |||||||||
| Long Beach Auto Receivables Trust | |||||||||||
| 4.050% 04/15/11 | 1,700,000 | 1,679,924 | |||||||||
| Navistar Financial Corp. Owner Trust | |||||||||||
| 3.250% 10/15/10 | 1,000,000 | 984,413 | |||||||||
| Pinnacle Capital Asset Trust | |||||||||||
| 5.770% 05/25/10 (c) | 870,000 | 867,635 | |||||||||
| UCFC Home Equity Loan | |||||||||||
| 6.315% 04/15/30 | 294,833 | 294,348 | |||||||||
| WFS Financial Owner Trust | |||||||||||
| 2.810% 08/22/11 | 737,436 | 725,443 | |||||||||
| Total Asset-Backed Securities (Cost of $12,208,593) | 12,232,810 | ||||||||||
| Mortgage-Backed Securities (10.9%) | |||||||||||
| Federal Home Loan Mortgage Corp. | |||||||||||
| 4.000% 05/01/11 | 1,412,897 | 1,377,921 | |||||||||
| 4.500% 11/01/07 | 398,738 | 396,174 | |||||||||
| 4.500% 03/01/21 | 1,681,978 | 1,613,395 | |||||||||
| 5.500% 01/01/21 | 423,315 | 421,242 | |||||||||
| 5.500% 07/01/21 | 116,648 | 116,047 | |||||||||
| 5.500% 08/01/21 | 1,311,340 | 1,304,580 | |||||||||
| 5.500% 09/01/21 | 988,630 | 983,534 | |||||||||
| 5.500% 01/01/22 | 1,000,000 | 994,849 | |||||||||
| 6.000% 07/01/08 | 6,542 | 6,549 | |||||||||
| 6.000% 11/01/14 | 6,381 | 6,460 | |||||||||
| 6.000% 08/01/21 | 796,658 | 805,679 | |||||||||
| 6.000% 09/01/21 | 966,392 | 977,335 | |||||||||
| Federal National Mortgage Association | |||||||||||
| 5.500% 02/01/21 | 432,009 | 430,177 | |||||||||
| 6.000% 03/01/09 | 19,315 | 19,496 | |||||||||
| 6.000% 05/01/09 | 211,228 | 213,201 | |||||||||
| Small Business Administration | |||||||||||
| 5.875% 10/25/21 (b) | 15,318 | 15,393 | |||||||||
| 5.875% 03/25/22 (b) | 89,834 | 90,285 | |||||||||
| 5.875% 06/25/22 (b) | 390,636 | 392,624 | |||||||||
| 6.000% 07/25/21 (b) | 16,619 | 16,330 | |||||||||
| Total Mortgage-Backed Securities (Cost of $10,223,417) | 10,181,271 | ||||||||||
See Accompanying Notes to Financial Statements.
37
CMG SHORT TERM BOND FUND
A Portfolio of Columbia Funds Institutional Trust
SCHEDULE OF INVESTMENTS
| Par | Value | ||||||||||
| Government & Agency Obligations (10.2%) | |||||||||||
| Foreign Government Obligations (1.6%) | |||||||||||
| Morocco Government AID Bond | |||||||||||
| 5.406% 05/01/23 (b) | $ | 330,000 | $ | 333,538 | |||||||
| Province of Quebec | |||||||||||
| 5.000% 07/17/09 (a) | 875,000 | 871,176 | |||||||||
| United Mexican States | |||||||||||
| 4.625% 10/08/08 | 325,000 | 320,450 | |||||||||
| 1,525,164 | |||||||||||
| U.S. Government Agencies (4.7%) | |||||||||||
| Federal Home Loan Bank | |||||||||||
| 5.125% 08/08/08 (a) | 85,000 | 84,959 | |||||||||
| Federal National Mortgage Association | |||||||||||
| 3.875% 02/01/08 (a) | 850,000 | 838,518 | |||||||||
| 4.750% 08/03/07 | 3,450,000 | 3,440,644 | |||||||||
| 4,364,121 | |||||||||||
| U.S. Government Obligations (3.9%) | |||||||||||
| U.S. Treasury Inflation Indexed Notes | |||||||||||
| 3.875% 01/15/09 (a) | 2,187,122 | 2,246,412 | |||||||||
| U.S. Treasury Notes | |||||||||||
| 4.375% 12/31/07 (a) | 1,470,000 | 1,461,042 | |||||||||
| 3,707,454 | |||||||||||
| Total Government & Agency Obligations (Cost of $9,722,792) | 9,596,739 | ||||||||||
| Commercial Mortgage-Backed Securities (4.9%) | |||||||||||
| Bear Stearns Commercial Mortgage Securities, Inc. | |||||||||||
| 3.869% 02/11/41 | 1,025,000 | 995,250 | |||||||||
| Chase Commercial Mortgage Securities Corp. | |||||||||||
| 7.093% 10/15/32 | 799,350 | 803,787 | |||||||||
| LB-UBS Commercial Mortgage Trust | |||||||||||
| 5.642% 12/15/25 | 460,959 | 462,666 | |||||||||
| Nationslink Funding Corp. | |||||||||||
| 6.888% 11/10/30 (d) | 302,350 | 303,287 | |||||||||
| Prudential Securities Secured Financing Corp. | |||||||||||
| 6.480% 11/01/31 | 1,442,081 | 1,458,663 | |||||||||
| Wachovia Bank Commercial Mortgage Trust | |||||||||||
| 5.191% 10/15/44 | 550,000 | 545,771 | |||||||||
| Total Commercial Mortgage-Backed Securities (Cost of $4,690,780) | 4,569,424 | ||||||||||
| Shares | |||||||||||
| Securities Lending Collateral (7.5%) | |||||||||||
| State Street Navigator Securities Lending Prime Portfolio (e) | 7,021,621 | 7,021,621 | |||||||||
| Total Securities Lending Collateral (Cost of $7,021,621) | 7,021,621 | ||||||||||
See Accompanying Notes to Financial Statements.
38
CMG SHORT TERM BOND FUND
A Portfolio of Columbia Funds Institutional Trust
SCHEDULE OF INVESTMENTS
| Par | Value | ||||||||||
| Short-Term Obligation (3.0%) | |||||||||||
| Repurchase agreement with Fixed Income Clearing Corp., dated 01/31/07, due 02/01/017 at 5.160%, collateralized by a U.S. Treasury Bond maturing 08/15/11, market value of $2,889,150 (repurchase proceeds $2,829,405) | $ | 2,829,000 | $ | 2,829,000 | |||||||
| Total Short-Term Obligation (Cost of $2,829,000) | 2,829,000 | ||||||||||
| Total Investments (108.2%) (Cost of $101,736,735) (f) | 101,296,711 | ||||||||||
| Other Assets & Liabilities, Net (-8.2%) | (7,678,079 | ) | |||||||||
| Net Assets (100.0%) | $ | 93,618,632 | |||||||||
Notes to Schedule of Investments:
(a) All or portion of security on loan at January 31, 2007. The total market value of securities on loan at January 31, 2007 is $6,875,977.
(b) The interest rate shown on floating rate or variable rate securities reflects the rate at January 31, 2007.
(c) Security exempt from registration pursuant to Rule 144A under the Securities Act of 1933. These securities may be resold in transactions exempt from registration, normally to qualified institutional buyers. At January 31, 2007, these securities, which are not illiquid, amounted to $985,916, which represents 1.1% of net assets.
(d) Investments in a security issued by an affiliate during the period ended January 31, 2007:
Security name: Nationslink Funding Corp., 6.888% 11/10/30
| Par as of 07/31/06: | $ | 500,000 | |||||
| Par purchased: | $ | - | |||||
| Par sold:* | $ | 197,650 | |||||
| Par as of 01/31/07: | $ | 302,350 | |||||
| Net realized gain/loss: | $ | - | |||||
| Interest income earned: | $ | 13,588 | |||||
| Value at end of period: | $ | 303,287 | |||||
| *Represents principal payment. | |||||||
(e) Investment made with cash collateral received from securities lending activity.
(f) Cost for federal income tax purposes is $101,963,420.
At January 31, 2007, the asset allocation of the Fund is as follows:
Asset Allocation | % of Net Assets | ||||||
| Corporate Fixed-Income Bonds & Notes | 33.7 | ||||||
| Collateralized Mortgage Obligations | 24.9 | ||||||
| Asset-Backed Securities | 13.1 | ||||||
| Mortgage-Backed Securities | 10.9 | ||||||
| Government & Agency Obligations | 10.2 | ||||||
| Commercial Mortgaged-Backed Securities | 4.9 | ||||||
| 97.7 | |||||||
| Securities Lending Collateral | 7.5 | ||||||
| Short-Term Obligation | 3.0 | ||||||
| Other Assets & Liabilities, Net | (8.2 | ) | |||||
| 100.0 | |||||||
See Accompanying Notes to Financial Statements.
39
CMG ULTRA SHORT TERM BOND FUND
A Portfolio of Columbia Funds Institutional Trust
SCHEDULE OF INVESTMENTS
January 31, 2007 (Unaudited)
| Par | Value | ||||||||||
| Corporate Fixed-Income Bonds & Notes (34.9%) | |||||||||||
| Basic Materials (2.6%) | |||||||||||
| Chemicals (2.6%) | |||||||||||
| EI Du Pont de Nemours & Co. | |||||||||||
| 3.375% 11/15/07 | $ | 1,000,000 | $ | 981,647 | |||||||
| Praxair, Inc. | |||||||||||
| 2.750% 06/15/08 | 1,000,000 | 966,057 | |||||||||
| 4.750% 07/15/07 | 1,000,000 | 997,924 | |||||||||
| 2,945,628 | |||||||||||
| Communications (3.5%) | |||||||||||
| Media (0.4%) | |||||||||||
| Comcast Cable Communications, Inc. | |||||||||||
| 8.375% 05/01/07 | 500,000 | 503,631 | |||||||||
| Telecommunications (3.1%) | |||||||||||
| AT&T, Inc. | |||||||||||
| 5.464% 05/15/08 (a) | 1,000,000 | 1,000,642 | |||||||||
| BellSouth Corp. | |||||||||||
| 5.474% 08/15/08 (a) | 600,000 | 600,434 | |||||||||
| Verizon Global Funding Corp. | |||||||||||
| 4.000% 01/15/08 (b) | 600,000 | 592,302 | |||||||||
| 6.125% 06/15/07 | 600,000 | 601,531 | |||||||||
| Vodafone Group PLC | |||||||||||
| 5.454% 12/28/07 (a) | 700,000 | 700,399 | |||||||||
| 3,495,308 | |||||||||||
| 3,998,939 | |||||||||||
| Consumer Cyclical (2.4%) | |||||||||||
| Auto Manufacturers (0.5%) | |||||||||||
| DaimlerChrysler NA Holding Corp. | |||||||||||
| 5.750% 05/18/09 (b) | 575,000 | 576,082 | |||||||||
| Retail (1.3%) | |||||||||||
| McDonald's Corp. | |||||||||||
| 5.375% 04/30/07 | 610,000 | 610,035 | |||||||||
| Target Corp. | |||||||||||
| 5.500% 04/01/07 (b) | 850,000 | 850,065 | |||||||||
| 1,460,100 | |||||||||||
| Textiles (0.6%) | |||||||||||
| Cintas Corp. | |||||||||||
| 5.125% 06/01/07 | 750,000 | 749,159 | |||||||||
| 2,785,341 | |||||||||||
See Accompanying Notes to Financial Statements.
40
CMG ULTRA SHORT TERM BOND FUND
A Portfolio of Columbia Funds Institutional Trust
SCHEDULE OF INVESTMENTS
| Par | Value | ||||||||||
| Corporate Fixed-Income Bonds & Notes (continued) | |||||||||||
| Consumer Non-Cyclical (2.9%) | |||||||||||
| Beverages (0.9%) | |||||||||||
| Diageo Finance BV | |||||||||||
| 5.484% 03/30/09 (a) | $ | 1,000,000 | $ | 1,001,238 | |||||||
| Cosmetics/Personal Care (0.6%) | |||||||||||
| Gillette Co. | |||||||||||
| 3.500% 10/15/07 | 750,000 | 738,779 | |||||||||
| Food (1.0%) | |||||||||||
| General Mills, Inc. | |||||||||||
| 5.125% 02/15/07 | 500,000 | 499,955 | |||||||||
| Kraft Foods, Inc. | |||||||||||
| 5.250% 06/01/07 | 600,000 | 599,581 | |||||||||
| 1,099,536 | |||||||||||
| Healthcare Services (0.4%) | |||||||||||
| WellPoint, Inc. | |||||||||||
| 3.750% 12/14/07 | 500,000 | 492,449 | |||||||||
| 3,332,002 | |||||||||||
| Energy (0.3%) | |||||||||||
| Oil & Gas (0.3%) | |||||||||||
| Ras Laffan Liquefied Natural Gas Co., Ltd. | |||||||||||
| 3.437% 09/15/09 (c) | 313,500 | 306,026 | |||||||||
| Financials (21.4%) | |||||||||||
| Banks (4.2%) | |||||||||||
| Bank of Montreal | |||||||||||
| 7.800% 04/01/07 | 600,000 | 601,975 | |||||||||
| Capital One Bank | |||||||||||
| 6.700% 05/15/08 | 600,000 | 608,882 | |||||||||
| M&I Marshall & Ilsley Bank | |||||||||||
| 4.125% 09/04/07 | 600,000 | 596,066 | |||||||||
| PNC Funding Corp. | |||||||||||
| 4.200% 03/10/08 | 1,000,000 | 980,365 | |||||||||
| Wachovia Bank NA | |||||||||||
| 5.800% 12/01/08 | 1,000,000 | 1,008,258 | |||||||||
| Westpac Banking Corp/NY | |||||||||||
| 5.340% 01/04/08 (a)(c) | 1,000,000 | 1,000,000 | |||||||||
| 4,795,546 | |||||||||||
| Diversified Financial Services (12.2%) | |||||||||||
| American Express Credit Corp. | |||||||||||
| 5.480% 06/16/11 (a) | 1,000,000 | 1,001,115 | |||||||||
| American Honda Finance Corp. | |||||||||||
| 5.386% 06/23/08 (a)(c) | 1,200,000 | 1,209,744 | |||||||||
See Accompanying Notes to Financial Statements.
41
CMG ULTRA SHORT TERM BOND FUND
A Portfolio of Columbia Funds Institutional Trust
SCHEDULE OF INVESTMENTS
| Par | Value | ||||||||||
| Corporate Fixed-Income Bonds & Notes (continued) | |||||||||||
| Diversified Financial Services (continued) | |||||||||||
| Bear Stearns Companies, Inc. | |||||||||||
| 5.660% 01/30/09 (a) | $ | 350,000 | $ | 351,834 | |||||||
| Caterpillar Financial Services Corp. | |||||||||||
| 3.700% 08/15/08 | 600,000 | 585,106 | |||||||||
| CIT Group, Inc. | |||||||||||
| 5.574% 02/15/07 (a) | 1,000,000 | 1,000,063 | |||||||||
| Citigroup Global Markets Holdings, Inc. | |||||||||||
| 6.500% 02/15/08 | 1,000,000 | 1,010,945 | |||||||||
| Countrywide Home Loans, Inc. | |||||||||||
| 3.250% 05/21/08 (b) | 500,000 | 486,724 | |||||||||
| Credit Suisse First Boston USA, Inc. | |||||||||||
| 4.875% 08/15/10 (b) | 200,000 | 197,236 | |||||||||
| 5.874% 02/15/07 (a) | 1,000,000 | 1,000,142 | |||||||||
| General Electric Capital Corp. | |||||||||||
| 6.500% 12/10/07 (b) | 500,000 | 504,697 | |||||||||
| Goldman Sachs Group LP | |||||||||||
| 7.200% 03/01/07 (c) | 250,000 | 250,335 | |||||||||
| Household Financial Corp. | |||||||||||
| 7.650% 05/15/07 (b) | 650,000 | 653,897 | |||||||||
| International Lease Finance Corp. | |||||||||||
| 4.350% 09/15/08 (b) | 1,000,000 | 981,954 | |||||||||
| John Deere Capital Corp. | |||||||||||
| 3.625% 05/25/07 | 500,000 | 497,267 | |||||||||
| 3.875% 03/07/07 | 540,000 | 539,248 | |||||||||
| Lehman Brothers Holdings, Inc. | |||||||||||
| 3.500% 08/07/08 | 1,160,000 | 1,127,170 | |||||||||
| Merrill Lynch & Co. | |||||||||||
| 3.000% 04/30/07 | 200,000 | 198,894 | |||||||||
| 5.410% 06/26/09 (a) | 750,000 | 750,232 | |||||||||
| SLM Corp. | |||||||||||
| 5.500% 07/27/09 (a) | 1,000,000 | 1,001,400 | |||||||||
| Textron Financial Corp. | |||||||||||
| 4.125% 03/03/08 | 600,000 | 591,800 | |||||||||
| 13,939,803 | |||||||||||
| Insurance (3.2%) | |||||||||||
| Berkshire Hathaway Finance Corp. | |||||||||||
| 5.435% 05/16/08 (a)(b) | 500,000 | 500,557 | |||||||||
| Chubb Corp. | |||||||||||
| 4.934% 11/16/07 | 1,000,000 | 995,552 | |||||||||
| Genworth Financial, Inc. | |||||||||||
| 5.510% 06/15/07 (a) | 1,100,000 | 1,100,955 | |||||||||
| Hartford Financial Services Group, Inc. | |||||||||||
| 4.700% 09/01/07 | 1,000,000 | 995,459 | |||||||||
| 3,592,523 | |||||||||||
| Real Estate Investment Trusts (REITs) (0.9%) | |||||||||||
| Simon Property Group LP | |||||||||||
| 5.375% 08/28/08 | 1,000,000 | 998,433 | |||||||||
See Accompanying Notes to Financial Statements.
42
CMG ULTRA SHORT TERM BOND FUND
A Portfolio of Columbia Funds Institutional Trust
SCHEDULE OF INVESTMENTS
| Par | Value | ||||||||||
| Corporate Fixed-Income Bonds & Notes (continued) | |||||||||||
| Savings & Loans (0.9%) | |||||||||||
| Washington Mutual Bank | |||||||||||
| 5.458% 11/06/09 (a) | $ | 1,000,000 | $ | 999,453 | |||||||
| 24,325,758 | |||||||||||
| Information Technology (0.7%) | |||||||||||
| Computers (0.7%) | |||||||||||
| International Business Machines Corp. | |||||||||||
| 3.800% 02/01/08 | 750,000 | 738,104 | |||||||||
| Utilities (1.1%) | |||||||||||
| Electric (1.1%) | |||||||||||
| Alabama Power Co. | |||||||||||
| 3.500% 11/15/07 | 567,000 | 558,746 | |||||||||
| Wisconsin Electric Power Co. | |||||||||||
| 3.500% 12/01/07 | 750,000 | 738,183 | |||||||||
| 1,296,929 | |||||||||||
| Total Corporate Fixed-Income Bonds & Notes (Cost of $39,754,784) | 39,728,727 | ||||||||||
| Asset-Backed Securities (26.9%) | |||||||||||
| AmeriCredit Automobile Receivables Trust | |||||||||||
| 3.930% 10/06/11 | 500,000 | 492,250 | |||||||||
| 4.750% 11/06/08 | 77,042 | 77,025 | |||||||||
| 5.210% 10/06/11 | 1,000,000 | 997,541 | |||||||||
| Bay View Auto Trust | |||||||||||
| 4.550% 02/25/14 | 1,000,000 | 986,522 | |||||||||
| 5.010% 06/25/14 | 300,000 | 297,365 | |||||||||
| Capital Auto Receivables Asset Trust | |||||||||||
| 3.350% 02/15/08 | 416,573 | 415,401 | |||||||||
| 5.400% 01/20/09 (c) | 1,000,000 | 999,783 | |||||||||
| Capital One Auto Finance Trust | |||||||||||
| 4.790% 05/15/09 | 324,022 | 323,656 | |||||||||
| Capital One Master Trust | |||||||||||
| 6.356% 06/15/11 | 1,000,000 | 1,010,558 | |||||||||
| Carmax Auto Owner Trust | |||||||||||
| 4.100% 05/15/08 | 124,840 | 124,749 | |||||||||
| Centex Home Equity | |||||||||||
| 5.430% 10/25/35 (a) | 66,027 | 66,030 | |||||||||
| 6.540% 01/25/32 | 226,479 | 225,550 | |||||||||
| Chase Credit Card Master Trust | |||||||||||
| 5.440% 02/15/10 (a) | 1,000,000 | 1,000,975 | |||||||||
See Accompanying Notes to Financial Statements.
43
CMG ULTRA SHORT TERM BOND FUND
A Portfolio of Columbia Funds Institutional Trust
SCHEDULE OF INVESTMENTS
| Par | Value | ||||||||||
| Asset-Backed Securities (continued) | |||||||||||
| Chase Manhattan Auto Owner Trust | |||||||||||
| 4.770% 03/15/08 | $ | 238,663 | $ | 238,543 | |||||||
| CIT Equipment Collateral | |||||||||||
| 4.420% 05/20/09 | 948,760 | 942,709 | |||||||||
| 5.070% 02/20/10 | 1,000,000 | 995,554 | |||||||||
| CNH Equipment Trust | |||||||||||
| 3.380% 02/15/11 | 538,603 | 532,119 | |||||||||
| 5.200% 06/15/10 | 1,000,000 | 998,123 | |||||||||
| 5.200% 08/16/10 | 750,000 | 748,858 | |||||||||
| 5.330% 01/15/09 | 1,000,000 | 999,258 | |||||||||
| DaimlerChrysler Auto Trust | |||||||||||
| 5.300% 10/08/08 | 345,677 | 345,591 | |||||||||
| Ford Credit Floorplan Master Owner Trust | |||||||||||
| 5.500% 06/15/11 (a) | 700,000 | 700,520 | |||||||||
| Franklin Auto Trust | |||||||||||
| 3.130% 11/15/11 | 269,953 | 265,399 | |||||||||
| 4.910% 04/20/10 | 1,000,000 | 996,191 | |||||||||
| GMAC Mortgage Corp. Loan Trust | |||||||||||
| 6.310% 05/25/36 | 776,468 | 776,421 | |||||||||
| Gracechurch Card Funding PLC | |||||||||||
| 5.430% 03/15/10 (a) | 1,000,000 | 1,001,394 | |||||||||
| GS Auto Loan Trust | |||||||||||
| 4.320% 05/15/08 | 73,165 | 73,113 | |||||||||
| 4.450% 05/17/10 | 750,000 | 744,053 | |||||||||
| Harley-Davidson Motorcycle Trust | |||||||||||
| 2.630% 11/15/10 | 110,525 | 109,183 | |||||||||
| 5.360% 10/15/10 | 653,133 | 653,020 | |||||||||
| Honda Auto Receivables Owner Trust | |||||||||||
| 4.850% 06/18/08 | 412,243 | 411,748 | |||||||||
| Household Automotive Trust | |||||||||||
| 2.220% 11/17/09 | 379,852 | 376,799 | |||||||||
| John Deere Owner Trust | |||||||||||
| 5.364% 07/13/07 | 191,250 | 191,278 | |||||||||
| Long Beach Auto Receivables Trust | |||||||||||
| 3.402% 09/15/09 | 139,591 | 139,201 | |||||||||
| 4.050% 04/15/11 | 800,000 | 790,552 | |||||||||
| 4.080% 06/15/10 | 600,129 | 596,290 | |||||||||
| 4.325% 06/15/09 | 153,713 | 153,537 | |||||||||
| 4.406% 05/15/10 | 600,000 | 595,909 | |||||||||
| 5.370% 10/15/07 | 1,154,120 | 1,154,216 | |||||||||
| Nomura Asset Acceptance Corp. | |||||||||||
| 5.460% 01/25/36 (a)(c) | 441,072 | 441,110 | |||||||||
| Ownit Mortgage Loan Asset-Backed Certificates | |||||||||||
| 5.424% 12/25/36 (a) | 563,067 | 559,932 | |||||||||
| Providian Gateway Master Trust | |||||||||||
| 3.350% 09/15/11 (c) | 1,500,000 | 1,482,167 | |||||||||
| Residential Funding Mortgage Securities II, Inc. | |||||||||||
| 5.440% 09/25/35 (a) | 445,958 | 444,736 | |||||||||
See Accompanying Notes to Financial Statements.
44
CMG ULTRA SHORT TERM BOND FUND
A Portfolio of Columbia Funds Institutional Trust
SCHEDULE OF INVESTMENTS
| Par | Value | ||||||||||
| Asset-Backed Securities (continued) | |||||||||||
| Triad Auto Receivables Owner Trust | |||||||||||
| 4.220% 06/12/12 | $ | 750,000 | $ | 735,097 | |||||||
| 4.280% 06/14/10 | 715,245 | 709,116 | |||||||||
| 4.770% 01/12/11 | 1,000,000 | 993,500 | |||||||||
| 5.360% 11/12/09 | 700,160 | 700,016 | |||||||||
| Wachovia Auto Loan Owner Trust | |||||||||||
| 5.390% 10/19/07 (c) | 442,418 | 442,460 | |||||||||
| WFS Financial Owner Trust | |||||||||||
| 3.020% 05/20/11 | 381,732 | 377,484 | |||||||||
| 3.150% 05/20/11 | 555,327 | 548,925 | |||||||||
| 3.250% 05/20/11 | 655,512 | 649,683 | |||||||||
| Total Asset-Backed Securities (cost of $30,654,641) | 30,631,210 | ||||||||||
| Collateralized Mortgage Obligations (11.1%) | |||||||||||
| Agency (7.3%) | |||||||||||
| Federal Home Loan Mortgage Corp. | |||||||||||
| 2.351% 08/15/08 (a) | 222,588 | 220,680 | |||||||||
| 3.000% 06/15/23 | 409,302 | 406,214 | |||||||||
| 3.500% 07/15/17 | 520,969 | 518,565 | |||||||||
| 4.000% 05/15/14 | 100,000 | 98,301 | |||||||||
| 4.000% 07/15/24 | 386,038 | 380,345 | |||||||||
| 4.250% 03/15/17 | 380,465 | 378,433 | |||||||||
| 4.500% 11/15/16 | 379,503 | 374,083 | |||||||||
| 5.000% 07/15/14 | 400,000 | 397,905 | |||||||||
| 5.000% 11/15/15 | 220,908 | 219,257 | |||||||||
| 5.000% 02/15/16 | 739,941 | 733,946 | |||||||||
| 5.000% 09/15/19 | 545,833 | 543,723 | |||||||||
| 5.000% 05/15/26 | 411,511 | 408,548 | |||||||||
| 5.500% 04/15/27 | 1,674,048 | 1,677,063 | |||||||||
| Federal National Mortgage Association | |||||||||||
| 4.500% 03/25/13 | 790,532 | 781,709 | |||||||||
| 5.000% 01/25/23 | 466,169 | 463,147 | |||||||||
| 6.000% 01/25/31 | 752,302 | 752,020 | |||||||||
| 8,353,939 | |||||||||||
| Non-Agency (3.8%) | |||||||||||
| Granite Master Issuer PLC | |||||||||||
| 5.330% 04/20/31 (a) | 563,121 | 563,215 | |||||||||
| JP Morgan Mortgage Trust | |||||||||||
| 5.500% 04/25/36 | 400,000 | 398,799 | |||||||||
| Opteum Mortgage Acceptance Corp. | |||||||||||
| 5.470% 12/25/35 (a) | 466,480 | 464,135 | |||||||||
| Paragon Mortgages PLC | |||||||||||
| 5.300% 06/15/41 (a)(c) | 542,332 | 542,332 | |||||||||
| Residential Mortgage Securities PLC | |||||||||||
| 5.444% 11/14/31 (a)(c) | 894,940 | 895,119 | |||||||||
| Washington Mutual, Inc. | |||||||||||
| 3.624% 04/25/35 (a) | 92,798 | 92,616 | |||||||||
See Accompanying Notes to Financial Statements.
45
CMG ULTRA SHORT TERM BOND FUND
A Portfolio of Columbia Funds Institutional Trust
SCHEDULE OF INVESTMENTS
| Par | Value | ||||||||||
| Collateralized Mortgage Obligations (continued) | |||||||||||
| 4.838% 10/25/35 (a) | $ | 691,738 | $ | 681,534 | |||||||
| 6.250% 07/25/36 | 652,931 | 651,668 | |||||||||
| 4,289,418 | |||||||||||
| Total Collateralized Mortgage Obligations (Cost of $12,699,144) | 12,643,357 | ||||||||||
| Government & Agency Obligations (8.1%) | |||||||||||
| U.S. Government Agencies (8.1%) | |||||||||||
| Federal Home Loan Bank | |||||||||||
| 2.625% 02/16/07 | 500,000 | 499,431 | |||||||||
| 4.000% 04/25/07 | 1,000,000 | 996,781 | |||||||||
| 4.000% 03/10/08 | 1,000,000 | 986,618 | |||||||||
| 4.875% 05/15/07 | 1,000,000 | 998,636 | |||||||||
| 5.375% 02/15/07 | 1,250,000 | 1,249,972 | |||||||||
| 5.410% 12/28/07 | 1,500,000 | 1,500,000 | |||||||||
| Federal Home Loan Mortgage Corp. | |||||||||||
| 4.125% 04/02/07 | 2,000,000 | 1,996,088 | |||||||||
| 5.000% 09/15/08 (b) | 1,000,000 | 997,518 | |||||||||
| 9,225,044 | |||||||||||
| Total Government & Agency Obligations (Cost of $9,268,718) | 9,225,044 | ||||||||||
| Municipal Bonds (1.2%) | |||||||||||
| CA Huntington Park Pension Obligation | |||||||||||
| Series 2005 A, | |||||||||||
| Insured: AMBAC | |||||||||||
| 5.350% 08/01/25 (d) | 500,000 | 500,000 | |||||||||
| KS Wyandotte County Kansas City Unified Government Special Obligation Revenue | |||||||||||
| Series 2005, | |||||||||||
| 4.670% 12/01/09 (d) | 100,000 | 98,681 | |||||||||
| NY Urban Development Corp. Revenue | |||||||||||
| Series 2004 B-3, | |||||||||||
| 3.580% 12/15/07 (d) | 800,000 | 788,168 | |||||||||
| Total Municipal Bonds (Cost of $1,400,000) | 1,386,849 | ||||||||||
| Shares | |||||||||||
| Securities Lending Collateral (3.1%) | |||||||||||
| State Street Navigator Securities Lending Prime Portfolio (e) | 3,488,102 | 3,488,102 | |||||||||
| Total Securities Lending Collateral (Cost of $3,488,102) | 3,488,102 | ||||||||||
See Accompanying Notes to Financial Statements.
46
CMG ULTRA SHORT TERM BOND FUND
A Portfolio of Columbia Funds Institutional Trust
SCHEDULE OF INVESTMENTS
| Par | Value | ||||||||||
| Short-Term Obligations (15.6%) | |||||||||||
| Commercial Paper (2.2%) | |||||||||||
| First Tennessee Bank N.A. | |||||||||||
| 5.320% 03/01/07 | $ | 1,000,000 | $ | 1,000,000 | |||||||
| Rhineland Funding Capital | |||||||||||
| 5.310% 02/05/07 | 1,500,000 | 1,499,115 | |||||||||
| 2,499,115 | |||||||||||
| Repurchase Agreement (13.4%) | |||||||||||
| Repurchase agreement with Fixed Income Clearing Corp., dated 01/31/07, due 02/01/07 at 5.210%, collateralized by a U.S. Government Agency Bond maturing 03/07/22, market value of $15,587,625 (repurchase proceeds $15,281,211). | 15,279,000 | 15,279,000 | |||||||||
| Total Short-Term Obligations (Cost of $17,778,115) | 17,778,115 | ||||||||||
| Total Investments (100.9%) (Cost of $115,043,504) (f) | 114,881,404 | ||||||||||
| Other Assets & Liabilities, Net (-0.9%) | (1,035,276 | ) | |||||||||
| Net Assets (100.0%) | $ | 113,846,128 | |||||||||
Notes to Schedule of Investments:
(a) The interest rate shown on floating rate or variable rate securities reflects the rate at January 31, 2007.
(b) All or a portion of this security was on loan at January 31, 2007. The total market value of these securities on loan at January 31, 2007 is $3,418,902.
(c) Security exempt from registration pursuant to Rule 144A under the Securities Act of 1933. These securities may be resold in transactions exempt from registration, normally to qualified institutional buyers. At January 31, 2007, these securities, which are not illiquid, amounted to $7,569,076, which represents 6.7% of net assets.
(d) Auction rate security. A debt security in which the interest rate is reset periodically, at intervals established at the time of issuance.
(e) Investment made with cash collateral received from securities lending activity.
(f) Cost for federal income tax purposes is $115,214,713.
At January 31, 2007, the asset allocation of the Fund is as follows:
Asset allocation (Unaudited) | % of Net Assets | ||||||
| Corporate Fixed-Income Bonds & Notes | 34.9 | ||||||
| Asset-Backed Securities | 26.9 | ||||||
| Collateralized Mortgage Obligations | 11.1 | ||||||
| Government & Agency Obligations | 8.1 | ||||||
| Municipal Bonds | 1.2 | ||||||
| 82.2 | |||||||
| Securities Lending Collateral | 3.1 | ||||||
| Short-Term Obligations | 15.6 | ||||||
| Other Assets & Liabilities, Net | (0.9 | ) | |||||
| 100.0 | |||||||
| Acronym | Name | ||||||
| AMBAC | Ambac Assurance Corp. | ||||||
See Accompanying Notes to Financial Statements.
47
CMG HIGH YIELD FUND
A Portfolio of Columbia Funds Institutional Trust
SCHEDULE OF INVESTMENTS
January 31, 2007 (Unaudited)
| Par | Value | ||||||||||
| Corporate Fixed-Income Bonds & Notes (94.8%) | |||||||||||
| Basic Materials (6.1%) | |||||||||||
| Chemicals (3.4%) | |||||||||||
| Agricultural Chemicals (0.5%) | |||||||||||
| Mosaic Co. | |||||||||||
| 7.375% 12/01/14 (a) | $ | 95,000 | $ | 96,187 | |||||||
| 7.625% 12/01/16 (a) | 340,000 | 347,650 | |||||||||
| 443,837 | |||||||||||
| Chemicals-Diversified (2.1%) | |||||||||||
| EquiStar Chemicals LP | |||||||||||
| 10.625% 05/01/11 | 500,000 | 530,000 | |||||||||
| Huntsman International LLC | |||||||||||
| 6.875% 11/15/13 (a) | 165,000 | 219,085 | |||||||||
| 7.875% 11/15/14 (a) | 235,000 | 242,050 | |||||||||
| Lyondell Chemical Co. | |||||||||||
| 8.000% 09/15/14 | 220,000 | 228,800 | |||||||||
| 8.250% 09/15/16 | 290,000 | 307,400 | |||||||||
| NOVA Chemicals Corp. | |||||||||||
| 6.500% 01/15/12 | 330,000 | 311,850 | |||||||||
| 1,839,185 | |||||||||||
| Chemicals-Specialty (0.8%) | |||||||||||
| Chemtura Corp. | |||||||||||
| 6.875% 06/01/16 | 325,000 | 315,250 | |||||||||
| Nalco Co. | |||||||||||
| 7.750% 11/15/11 | 405,000 | 413,100 | |||||||||
| 728,350 | |||||||||||
| 3,011,372 | |||||||||||
| Forest Products & Paper (1.1%) | |||||||||||
| Paper & Related Products (1.1%) | |||||||||||
| Boise Cascade LLC | |||||||||||
| 7.125% 10/15/14 | 185,000 | 180,375 | |||||||||
| Cascades, Inc. | |||||||||||
| 7.250% 02/15/13 | 250,000 | 250,625 | |||||||||
| Domtar, Inc. | |||||||||||
| 7.125% 08/15/15 | 230,000 | 227,125 | |||||||||
| Georgia-Pacific Corp. | |||||||||||
| 8.000% 01/15/24 | 330,000 | 331,650 | |||||||||
| 989,775 | |||||||||||
| Iron/Steel (1.1%) | |||||||||||
| Steel-Producers (1.1%) | |||||||||||
| Russel Metals, Inc. | |||||||||||
| 6.375% 03/01/14 | 470,000 | 451,200 | |||||||||
| United States Steel Corp. | |||||||||||
| 9.750% 05/15/10 | 545,000 | 576,338 | |||||||||
| 1,027,538 | |||||||||||
See Accompanying Notes to Financial Statements.
48
CMG HIGH YIELD FUND
A Portfolio of Columbia Funds Institutional Trust
SCHEDULE OF INVESTMENTS
| Par | Value | ||||||||||
| Corporate Fixed-Income Bonds & Notes (continued) | |||||||||||
| Metals & Mining (0.5%) | |||||||||||
| Diversified Minerals (0.5%) | |||||||||||
| FMG Finance Ltd. | |||||||||||
| 10.625% 09/01/16 (a) | $ | 380,000 | $ | 418,950 | |||||||
| 5,447,635 | |||||||||||
| Communications (14.7%) | |||||||||||
| Media (8.3%) | |||||||||||
| Broadcast Services/Programs (0.3%) | |||||||||||
| Clear Channel Communications, Inc. | |||||||||||
| 4.900% 05/15/15 | 250,000 | 210,092 | |||||||||
| Cable TV (4.1%) | |||||||||||
| Charter Communications Holdings II LLC | |||||||||||
| 10.250% 09/15/10 | 395,000 | 410,306 | |||||||||
| CSC Holdings, Inc. | |||||||||||
| 7.625% 04/01/11 | 435,000 | 448,050 | |||||||||
| DirecTV Holdings LLC | |||||||||||
| 6.375% 06/15/15 | 995,000 | 947,737 | |||||||||
| 8.375% 03/15/13 | 110,000 | 115,088 | |||||||||
| EchoStar DBS Corp. | |||||||||||
| 6.625% 10/01/14 | 1,145,000 | 1,122,100 | |||||||||
| Rogers Cable, Inc. | |||||||||||
| 7.875% 05/01/12 | 580,000 | 624,633 | |||||||||
| 3,667,914 | |||||||||||
| Multimedia (1.3%) | |||||||||||
| Lamar Media Corp. | |||||||||||
| 7.250% 01/01/13 | 925,000 | 936,562 | |||||||||
| Quebecor Media, Inc. | |||||||||||
| 7.750% 03/15/16 | 245,000 | 248,675 | |||||||||
| 1,185,237 | |||||||||||
| Publishing-Periodicals (1.6%) | |||||||||||
| Dex Media West LLC | |||||||||||
| 9.875% 08/15/13 | 210,000 | 228,375 | |||||||||
| R.H. Donnelley Corp. | |||||||||||
| 8.875% 01/15/16 | 310,000 | 324,725 | |||||||||
| 10.875% 12/15/12 | 820,000 | 891,750 | |||||||||
| 1,444,850 | |||||||||||
| Television (1.0%) | |||||||||||
| LIN Television Corp. | |||||||||||
| 6.500% 05/15/13 | 665,000 | 641,725 | |||||||||
| Sinclair Broadcast Group, Inc. | |||||||||||
| 8.000% 03/15/12 | 210,000 | 215,775 | |||||||||
| 857,500 | |||||||||||
| 7,365,593 | |||||||||||
See Accompanying Notes to Financial Statements.
49
CMG HIGH YIELD FUND
A Portfolio of Columbia Funds Institutional Trust
SCHEDULE OF INVESTMENTS
| Par | Value | ||||||||||
| Corporate Fixed-Income Bonds & Notes (continued) | |||||||||||
| Telecommunication Services (6.4%) | |||||||||||
| Cellular Telecommunications (1.3%) | |||||||||||
| Nextel Communications, Inc. | |||||||||||
| 7.375% 08/01/15 | $ | 570,000 | $ | 584,167 | |||||||
| Rogers Wireless, Inc. | |||||||||||
| 8.000% 12/15/12 | 530,000 | 557,825 | |||||||||
| 1,141,992 | |||||||||||
| Satellite Telecommunications (0.4%) | |||||||||||
| Intelsat Bermuda Ltd. | |||||||||||
| 9.250% 06/15/16 (a) | 285,000 | 312,788 | |||||||||
| Telecommunication Equipment (0.6%) | |||||||||||
| Lucent Technologies, Inc. | |||||||||||
| 6.450% 03/15/29 | 600,000 | 546,000 | |||||||||
| Telecommunication Services (0.6%) | |||||||||||
| Embarq Corp. | |||||||||||
| 7.082% 06/01/16 | 155,000 | 157,490 | |||||||||
| 7.995% 06/01/36 | 155,000 | 161,097 | |||||||||
| Time Warner Telecom Holdings, Inc. | |||||||||||
| 9.250% 02/15/14 | 235,000 | 251,744 | |||||||||
| 570,331 | |||||||||||
| Telephone-Integrated (3.5%) | |||||||||||
| Cincinnati Bell, Inc. | |||||||||||
| 7.000% 02/15/15 | 280,000 | 280,000 | |||||||||
| Citizens Communications Co. | |||||||||||
| 7.875% 01/15/27 (a) | 425,000 | 430,313 | |||||||||
| Qwest Corp. | |||||||||||
| 7.500% 10/01/14 | 580,000 | 615,525 | |||||||||
| 7.500% 06/15/23 | 465,000 | 471,975 | |||||||||
| 8.875% 03/15/12 | 755,000 | 838,050 | |||||||||
| Windstream Corp. | |||||||||||
| 8.625% 08/01/16 | 440,000 | 480,150 | |||||||||
| 3,116,013 | |||||||||||
| 5,687,124 | |||||||||||
| 13,052,717 | |||||||||||
| Consumer Cyclical (14.4%) | |||||||||||
| Apparel (0.4%) | |||||||||||
| Apparel Manufacturers (0.4%) | |||||||||||
| Phillips-Van Heusen Corp. | |||||||||||
| 7.250% 02/15/11 | 365,000 | 372,300 | |||||||||
| Auto Parts & Equipment (1.7%) | |||||||||||
| Auto/Truck Parts & Equipment-Original (1.2%) | |||||||||||
| Accuride Corp. | |||||||||||
| 8.500% 02/01/15 | 270,000 | 263,250 | |||||||||
| ArvinMeritor, Inc. | |||||||||||
| 8.125% 09/15/15 | 255,000 | 250,537 | |||||||||
See Accompanying Notes to Financial Statements.
50
CMG HIGH YIELD FUND
A Portfolio of Columbia Funds Institutional Trust
SCHEDULE OF INVESTMENTS
| Par | Value | ||||||||||
| Corporate Fixed-Income Bonds & Notes (continued) | |||||||||||
| Auto/Truck Parts & Equipment-Original (continued) | |||||||||||
| TRW Automotive, Inc. | |||||||||||
| 9.375% 02/15/13 | $ | 490,000 | $ | 524,300 | |||||||
| 1,038,087 | |||||||||||
| Auto/Truck Parts & Equipment-Replacement (0.2%) | |||||||||||
| Commercial Vehicle Group, Inc. | |||||||||||
| 8.000% 07/01/13 | 225,000 | 221,063 | |||||||||
| Rubber-Tires (0.3%) | |||||||||||
| Goodyear Tire & Rubber Co. | |||||||||||
| 8.625% 12/01/11 (a) | 125,000 | 131,563 | |||||||||
| 9.000% 07/01/15 | 100,000 | 107,750 | |||||||||
| 239,313 | |||||||||||
| 1,498,463 | |||||||||||
| Entertainment (1.9%) | |||||||||||
| Music (0.9%) | |||||||||||
| Steinway Musical Instruments, Inc. | |||||||||||
| 7.000% 03/01/14 (a) | 345,000 | 339,825 | |||||||||
| WMG Acquisition Corp. | |||||||||||
| 7.375% 04/15/14 | 460,000 | 453,100 | |||||||||
| 792,925 | |||||||||||
| Racetracks (1.0%) | |||||||||||
| Speedway Motorsports, Inc. | |||||||||||
| 6.750% 06/01/13 | 930,000 | 931,162 | |||||||||
| 1,724,087 | |||||||||||
| Home Builders (1.4%) | |||||||||||
| Building-Residential/Commercial (1.4%) | |||||||||||
| K. Hovnanian Enterprises, Inc. | |||||||||||
| 6.375% 12/15/14 | 665,000 | 631,750 | |||||||||
| KB Home | |||||||||||
| 5.875% 01/15/15 | 615,000 | 567,222 | |||||||||
| 1,198,972 | |||||||||||
| Home Furnishings (0.4%) | |||||||||||
| Home Furnishings (0.4%) | |||||||||||
| Sealy Mattress Co. | |||||||||||
| 8.250% 06/15/14 | 345,000 | 362,250 | |||||||||
| Leisure Time (1.1%) | |||||||||||
| Cruise Lines (0.9%) | |||||||||||
| Royal Caribbean Cruises Ltd. | |||||||||||
| 6.875% 12/01/13 | 800,000 | 812,354 | |||||||||
| Leisure & Recreational Products (0.2%) | |||||||||||
| K2, Inc. | |||||||||||
| 7.375% 07/01/14 | 175,000 | 176,312 | |||||||||
| 988,666 | |||||||||||
See Accompanying Notes to Financial Statements.
51
CMG HIGH YIELD FUND
A Portfolio of Columbia Funds Institutional Trust
SCHEDULE OF INVESTMENTS
| Par | Value | ||||||||||
| Corporate Fixed-Income Bonds & Notes (continued) | |||||||||||
| Lodging (4.6%) | |||||||||||
| Casino Hotels (4.6%) | |||||||||||
| Caesars Entertainment, Inc. | |||||||||||
| 7.875% 03/15/10 | $ | 255,000 | $ | 267,750 | |||||||
| CCM Merger, Inc. | |||||||||||
| 8.000% 08/01/13 (a) | 180,000 | 178,875 | |||||||||
| Chukchansi Economic Development Authority | |||||||||||
| 8.000% 11/15/13 (a) | 385,000 | 398,475 | |||||||||
| Galaxy Entertainment Finance Co., Ltd. | |||||||||||
| 9.875% 12/15/12 (a) | 485,000 | 525,012 | |||||||||
| Harrah's Operating Co., Inc. | |||||||||||
| 5.625% 06/01/15 | 440,000 | 381,913 | |||||||||
| Las Vegas Sands Corp. | |||||||||||
| 6.375% 02/15/15 | 130,000 | 126,425 | |||||||||
| MGM Mirage | |||||||||||
| 6.000% 10/01/09 | 235,000 | 234,119 | |||||||||
| 6.750% 09/01/12 | 270,000 | 267,975 | |||||||||
| 8.500% 09/15/10 | 290,000 | 311,025 | |||||||||
| Station Casinos, Inc. | |||||||||||
| 6.625% 03/15/18 | 250,000 | 218,125 | |||||||||
| 6.875% 03/01/16 | 440,000 | 402,600 | |||||||||
| Wynn Las Vegas LLC | |||||||||||
| 6.625% 12/01/14 | 815,000 | 806,850 | |||||||||
| 4,119,144 | |||||||||||
| Retail (2.5%) | |||||||||||
| Retail-Automobiles (0.9%) | |||||||||||
| AutoNation, Inc. | |||||||||||
| 7.000% 04/15/14 | 235,000 | 236,175 | |||||||||
| 7.360% 04/15/13 (b) | 140,000 | 141,050 | |||||||||
| Group 1 Automotive, Inc. | |||||||||||
| 8.250% 08/15/13 | 365,000 | 375,950 | |||||||||
| 753,175 | |||||||||||
| Retail-Convenience Store (0.7%) | |||||||||||
| Couche-Tard US LP | |||||||||||
| 7.500% 12/15/13 | 575,000 | 585,062 | |||||||||
| Retail-Propane Distributors (0.4%) | |||||||||||
| AmeriGas Partners LP | |||||||||||
| 7.125% 05/20/16 | 380,000 | 371,450 | |||||||||
| Retail-Restaurants (0.5%) | |||||||||||
| Domino's, Inc. | |||||||||||
| 8.250% 07/01/11 | 450,000 | 467,438 | |||||||||
| 2,177,125 | |||||||||||
See Accompanying Notes to Financial Statements.
52
CMG HIGH YIELD FUND
A Portfolio of Columbia Funds Institutional Trust
SCHEDULE OF INVESTMENTS
| Par | Value | ||||||||||
| Corporate Fixed-Income Bonds & Notes (continued) | |||||||||||
| Textiles (0.4%) | |||||||||||
| Textile-Products (0.4%) | |||||||||||
| INVISTA | |||||||||||
| 9.250% 05/01/12 (a) | $ | 295,000 | $ | 315,650 | |||||||
| 12,756,657 | |||||||||||
| Consumer Non-Cyclical (13.7%) | |||||||||||
| Agriculture (0.4%) | |||||||||||
| Tobacco (0.4%) | |||||||||||
| Reynolds American, Inc. | |||||||||||
| 7.625% 06/01/16 | 305,000 | 322,681 | |||||||||
| Beverages (1.6%) | |||||||||||
| Beverages-Non-Alcoholic (1.0%) | |||||||||||
| Cott Beverages, Inc. | |||||||||||
| 8.000% 12/15/11 | 880,000 | 899,800 | |||||||||
| Beverages-Wine/Spirits (0.6%) | |||||||||||
| Constellation Brands, Inc. | |||||||||||
| 8.125% 01/15/12 | 530,000 | 551,200 | |||||||||
| 1,451,000 | |||||||||||
| Biotechnology (0.4%) | |||||||||||
| Medical-Biomedical/Gene (0.4%) | |||||||||||
| Bio-Rad Laboratories, Inc. | |||||||||||
| 7.500% 08/15/13 | 295,000 | 305,325 | |||||||||
| Commercial Services (4.4%) | |||||||||||
| Commercial Services (0.6%) | |||||||||||
| Iron Mountain, Inc. | |||||||||||
| 7.750% 01/15/15 | 555,000 | 566,100 | |||||||||
| Funeral Services & Related Items (0.4%) | |||||||||||
| Service Corp. International | |||||||||||
| 6.750% 04/01/16 | 100,000 | 97,750 | |||||||||
| 7.375% 10/01/14 | 215,000 | 221,450 | |||||||||
| 319,200 | |||||||||||
| Printing-Commercial (0.8%) | |||||||||||
| Quebecor World Capital Corp. | |||||||||||
| 8.750% 03/15/16 (a) | 470,000 | 472,350 | |||||||||
| Quebecor World, Inc. | |||||||||||
| 9.750% 01/15/15 (a) | 185,000 | 193,094 | |||||||||
| 665,444 | |||||||||||
See Accompanying Notes to Financial Statements.
53
CMG HIGH YIELD FUND
A Portfolio of Columbia Funds Institutional Trust
SCHEDULE OF INVESTMENTS
| Par | Value | ||||||||||
| Corporate Fixed-Income Bonds & Notes (continued) | |||||||||||
| Private Corrections (0.9%) | |||||||||||
| Corrections Corp. of America | |||||||||||
| 6.250% 03/15/13 | $ | 665,000 | $ | 655,025 | |||||||
| 7.500% 05/01/11 | 175,000 | 179,593 | |||||||||
| 834,618 | |||||||||||
| Rental Auto/Equipment (1.7%) | |||||||||||
| Ashtead Capital, Inc. | |||||||||||
| 9.000% 08/15/16 (a) | 355,000 | 379,850 | |||||||||
| Avis Budget Car Rental LLC | |||||||||||
| 7.625% 05/15/14 (a) | 160,000 | 158,800 | |||||||||
| 7.750% 05/15/16 (a) | 235,000 | 233,238 | |||||||||
| United Rentals North America, Inc. | |||||||||||
| 7.750% 11/15/13 | 725,000 | 730,437 | |||||||||
| 1,502,325 | |||||||||||
| 3,887,687 | |||||||||||
| Food (1.1%) | |||||||||||
| Food-Dairy Products (0.6%) | |||||||||||
| Dean Foods Co. | |||||||||||
| 7.000% 06/01/16 | 535,000 | 540,350 | |||||||||
| Food-Miscellaneous/Diversified (0.5%) | |||||||||||
| Del Monte Corp. | |||||||||||
| 6.750% 02/15/15 | 460,000 | 451,375 | |||||||||
| 991,725 | |||||||||||
| Healthcare Services (3.3%) | |||||||||||
| Medical Products (0.9%) | |||||||||||
| Fisher Scientific International, Inc. | |||||||||||
| 6.750% 08/15/14 | 750,000 | 767,763 | |||||||||
| Medical-Hospitals (2.0%) | |||||||||||
| HCA, Inc. | |||||||||||
| 9.250% 11/15/16 (a) | 315,000 | 334,688 | |||||||||
| 9.625% 11/15/16, PIK (a) | 880,000 | 944,900 | |||||||||
| Triad Hospitals, Inc. | |||||||||||
| 7.000% 05/15/12 | 480,000 | 492,000 | |||||||||
| 1,771,588 | |||||||||||
| Medical-Outpatient/Home Medical (0.1%) | |||||||||||
| Select Medical Corp. | |||||||||||
| 7.625% 02/01/15 | 160,000 | 143,200 | |||||||||
| Physician Practice Management (0.3%) | |||||||||||
| US Oncology, Inc. | |||||||||||
| 9.000% 08/15/12 | 260,000 | 275,600 | |||||||||
| 2,958,151 | |||||||||||
See Accompanying Notes to Financial Statements.
54
CMG HIGH YIELD FUND
A Portfolio of Columbia Funds Institutional Trust
SCHEDULE OF INVESTMENTS
| Par | Value | ||||||||||
| Corporate Fixed-Income Bonds & Notes (continued) | |||||||||||
| Household Products/Wares (1.0%) | |||||||||||
| Consumer Products-Miscellaneous (1.0%) | |||||||||||
| American Greetings Corp. | |||||||||||
| 7.375% 06/01/16 | $ | 340,000 | $ | 349,350 | |||||||
| Scotts Co. | |||||||||||
| 6.625% 11/15/13 | 530,000 | 555,504 | |||||||||
| 904,854 | |||||||||||
| Pharmaceuticals (1.5%) | |||||||||||
| Medical-Drugs (0.6%) | |||||||||||
| Elan Finance PLC | |||||||||||
| 8.875% 12/01/13 (a) | 510,000 | 504,900 | |||||||||
| Medical-Generic Drugs (0.6%) | |||||||||||
| Mylan Laboratories, Inc. | |||||||||||
| 6.375% 08/15/15 | 530,000 | 515,425 | |||||||||
| Pharmacy Services (0.3%) | |||||||||||
| Omnicare, Inc. | |||||||||||
| 6.750% 12/15/13 | 310,000 | 305,350 | |||||||||
| 1,325,675 | |||||||||||
| 12,147,098 | |||||||||||
| Energy (13.8%) | |||||||||||
| Coal (1.9%) | |||||||||||
| Coal (1.9%) | |||||||||||
| Arch Western Finance LLC | |||||||||||
| 6.750% 07/01/13 | 690,000 | 681,375 | |||||||||
| Massey Energy Co. | |||||||||||
| 6.875% 12/15/13 | 330,000 | 305,250 | |||||||||
| Peabody Energy Corp. | |||||||||||
| 6.875% 03/15/13 | 725,000 | 728,625 | |||||||||
| 1,715,250 | |||||||||||
| Oil & Gas (5.7%) | |||||||||||
| Oil & Gas Drilling (0.6%) | |||||||||||
| Pride International, Inc. | |||||||||||
| 7.375% 07/15/14 | 535,000 | 543,025 | |||||||||
| Oil Companies-Exploration & Production (4.6%) | |||||||||||
| Chesapeake Energy Corp. | |||||||||||
| 6.375% 06/15/15 | 1,440,000 | 1,396,800 | |||||||||
| Compton Petroleum Corp. | |||||||||||
| 7.625% 12/01/13 | 320,000 | 305,600 | |||||||||
| El Paso Production Holding Co. | |||||||||||
| 7.750% 06/01/13 | 205,000 | 212,175 | |||||||||
| Newfield Exploration Co. | |||||||||||
| 6.625% 09/01/14 | 890,000 | 874,425 | |||||||||
See Accompanying Notes to Financial Statements.
55
CMG HIGH YIELD FUND
A Portfolio of Columbia Funds Institutional Trust
SCHEDULE OF INVESTMENTS
| Par | Value | ||||||||||
| Corporate Fixed-Income Bonds & Notes (continued) | |||||||||||
| Oil Companies-Exploration & Production (continued) | |||||||||||
| OPTI Canada, Inc. | |||||||||||
| 8.250% 12/15/14 (a) | $ | 245,000 | $ | 256,025 | |||||||
| Pogo Producing Co. | |||||||||||
| 6.625% 03/15/15 | 740,000 | 695,600 | |||||||||
| Quicksilver Resources, Inc. | |||||||||||
| 7.125% 04/01/16 | 320,000 | 311,200 | |||||||||
| 4,051,825 | |||||||||||
| Oil Refining & Marketing (0.5%) | |||||||||||
| Tesoro Corp. | |||||||||||
| 6.625% 11/01/15 | 430,000 | 431,612 | |||||||||
| 5,026,462 | |||||||||||
| Oil & Gas Services (1.8%) | |||||||||||
| Oil Field Machinery & Equipment (0.9%) | |||||||||||
| Grant Prideco, Inc. | |||||||||||
| 6.125% 08/15/15 | 825,000 | 789,938 | |||||||||
| Oil-Field Services (0.9%) | |||||||||||
| Universal Compression, Inc. | |||||||||||
| 7.250% 05/15/10 | 835,000 | 839,175 | |||||||||
| 1,629,113 | |||||||||||
| Pipelines (4.4%) | |||||||||||
| Pipelines (4.4%) | |||||||||||
| Atlas Pipeline Partners LP | |||||||||||
| 8.125% 12/15/15 | 285,000 | 293,550 | |||||||||
| Colorado Interstate Gas Co. | |||||||||||
| 6.800% 11/15/15 | 955,000 | 990,345 | |||||||||
| El Paso Performance-Linked Trust | |||||||||||
| 7.750% 07/15/11 (a) | 180,000 | 187,200 | |||||||||
| MarkWest Energy Partners LP | |||||||||||
| 6.875% 11/01/14 | 715,000 | 682,825 | |||||||||
| Williams Companies, Inc. | |||||||||||
| 6.375% 10/01/10 (a) | 650,000 | 653,250 | |||||||||
| 7.750% 06/15/31 | 705,000 | 740,250 | |||||||||
| 8.125% 03/15/12 | 330,000 | 355,162 | |||||||||
| 3,902,582 | |||||||||||
| 12,273,407 | |||||||||||
| Financials (8.6%) | |||||||||||
| Diversified Financial Services (7.2%) | |||||||||||
| Finance-Auto Loans (1.3%) | |||||||||||
| GMAC LLC | |||||||||||
| 8.000% 11/01/31 | 1,005,000 | 1,131,237 | |||||||||
See Accompanying Notes to Financial Statements.
56
CMG HIGH YIELD FUND
A Portfolio of Columbia Funds Institutional Trust
SCHEDULE OF INVESTMENTS
| Par | Value | ||||||||||
| Corporate Fixed-Income Bonds & Notes (continued) | |||||||||||
| Finance-Investment Banker/Broker (1.0%) | |||||||||||
| E*Trade Financial Corp. | |||||||||||
| 7.375% 09/15/13 | $ | 555,000 | $ | 575,812 | |||||||
| LaBranche & Co., Inc. | |||||||||||
| 11.000% 05/15/12 | 295,000 | 317,863 | |||||||||
| 893,675 | |||||||||||
| Special Purpose Entity (4.9%) | |||||||||||
| Dow Jones CDX High Yield Index | |||||||||||
| 8.375% 12/29/11 (a) | 3,700,000 | 3,778,625 | |||||||||
| Idearc, Inc. | |||||||||||
| 8.000% 11/15/16 (a) | 630,000 | 640,238 | |||||||||
| 4,418,863 | |||||||||||
| 6,443,775 | |||||||||||
| Real Estate Investment Trusts (REITs) (1.4%) | |||||||||||
| REITS-Hotels (0.8%) | |||||||||||
| Host Marriott LP | |||||||||||
| 6.375% 03/15/15 | 740,000 | 722,425 | |||||||||
| REITS-Regional Malls (0.6%) | |||||||||||
| Rouse Co. LP | |||||||||||
| 6.750% 05/01/13 (a) | 500,000 | 504,097 | |||||||||
| 1,226,522 | |||||||||||
| 7,670,297 | |||||||||||
| Industrials (14.8%) | |||||||||||
| Aerospace & Defense (1.9%) | |||||||||||
| Aerospace/Defense-Equipment (1.1%) | |||||||||||
| DRS Technologies, Inc. | |||||||||||
| 6.625% 02/01/16 | 420,000 | 415,800 | |||||||||
| Sequa Corp. | |||||||||||
| 9.000% 08/01/09 | 485,000 | 514,100 | |||||||||
| TransDigm, Inc. | |||||||||||
| 7.750% 07/15/14 (a)(c) | 50,000 | 51,000 | |||||||||
| 980,900 | |||||||||||
| Electronics-Military (0.8%) | |||||||||||
| L-3 Communications Corp. | |||||||||||
| 6.375% 10/15/15 | 765,000 | 741,094 | |||||||||
| 1,721,994 | |||||||||||
| Electronics (0.9%) | |||||||||||
| Electronic Components-Miscellaneous (0.9%) | |||||||||||
| Flextronics International Ltd. | |||||||||||
| 6.250% 11/15/14 | 410,000 | 389,500 | |||||||||
| NXP BV/NXP Funding LLC | |||||||||||
| 7.875% 10/15/14 (a) | 415,000 | 428,488 | |||||||||
| 817,988 | |||||||||||
See Accompanying Notes to Financial Statements.
57
CMG HIGH YIELD FUND
A Portfolio of Columbia Funds Institutional Trust
SCHEDULE OF INVESTMENTS
| Par | Value | ||||||||||
| Corporate Fixed-Income Bonds & Notes (continued) | |||||||||||
| Environmental Control (1.4%) | |||||||||||
| Non-Hazardous Waste Disposal (1.4%) | |||||||||||
| Allied Waste North America, Inc. | |||||||||||
| 7.125% 05/15/16 | $ | 1,250,000 | $ | 1,246,875 | |||||||
| Machinery-Construction & Mining (0.4%) | |||||||||||
| Machinery-Construction & Mining (0.4%) | |||||||||||
| Terex Corp. | |||||||||||
| 7.375% 01/15/14 | 320,000 | 326,400 | |||||||||
| Machinery-Diversified (1.4%) | |||||||||||
| Machinery-General Industry (1.4%) | |||||||||||
| Manitowoc Co., Inc. | |||||||||||
| 7.125% 11/01/13 | 585,000 | 586,463 | |||||||||
| Westinghouse Air Brake Technologies Corp. | |||||||||||
| 6.875% 07/31/13 | 630,000 | 623,700 | |||||||||
| 1,210,163 | |||||||||||
| Miscellaneous Manufacturing (2.3%) | |||||||||||
| Diversified Manufacturing Operators (2.3%) | |||||||||||
| ARAMARK Corp., Class B | |||||||||||
| 7.500% 01/25/14 (d) | 1,000,000 | 1,011,250 | |||||||||
| Bombardier, Inc. | |||||||||||
| 6.300% 05/01/14 (a) | 620,000 | 586,675 | |||||||||
| Trinity Industries, Inc. | |||||||||||
| 6.500% 03/15/14 | 495,000 | 486,337 | |||||||||
| 2,084,262 | |||||||||||
| Packaging & Containers (3.5%) | |||||||||||
| Containers-Metal/Glass (3.5%) | |||||||||||
| Ball Corp. | |||||||||||
| 6.875% 12/15/12 | 335,000 | 340,862 | |||||||||
| Crown Americas LLC & Crown Americas Capital Corp. | |||||||||||
| 7.750% 11/15/15 | 725,000 | 750,375 | |||||||||
| Owens-Illinois, Inc. | |||||||||||
| 7.500% 05/15/10 | 1,545,000 | 1,568,175 | |||||||||
| Silgan Holdings, Inc. | |||||||||||
| 6.750% 11/15/13 | 460,000 | 450,800 | |||||||||
| 3,110,212 | |||||||||||
| Transportation (3.0%) | |||||||||||
| Transportation-Marine (2.4%) | |||||||||||
| Overseas Shipholding Group | |||||||||||
| 8.250% 03/15/13 | 635,000 | 666,750 | |||||||||
| Stena AB | |||||||||||
| 7.500% 11/01/13 | 660,000 | 668,250 | |||||||||
| Teekay Shipping Corp. | |||||||||||
| 8.875% 07/15/11 | 715,000 | 768,625 | |||||||||
| 2,103,625 | |||||||||||
See Accompanying Notes to Financial Statements.
58
CMG HIGH YIELD FUND
A Portfolio of Columbia Funds Institutional Trust
SCHEDULE OF INVESTMENTS
| Par | Value | ||||||||||
| Corporate Fixed-Income Bonds & Notes (continued) | |||||||||||
| Transportation-Services (0.6%) | |||||||||||
| Bristow Group, Inc. | |||||||||||
| 6.125% 06/15/13 | $ | 610,000 | $ | 574,925 | |||||||
| 2,678,550 | |||||||||||
| 13,196,444 | |||||||||||
| Technology (1.8%) | |||||||||||
| Office/Business Equipment (0.3%) | |||||||||||
| Office Automation & Equipment (0.3%) | |||||||||||
| Xerox Corp. | |||||||||||
| 6.400% 03/15/16 | 215,000 | 217,583 | |||||||||
| Semiconductors (1.5%) | |||||||||||
| Electronic Components-Semiconductors (1.5%) | |||||||||||
| Advanced Micro Devices, Inc. | |||||||||||
| 7.750% 11/01/12 | 255,000 | 260,737 | |||||||||
| Freescale Semiconductor, Inc. | |||||||||||
| 9.125% 12/15/14 (a) | 405,000 | 402,469 | |||||||||
| 10.125% 12/15/16 (a) | 690,000 | 686,550 | |||||||||
| 1,349,756 | |||||||||||
| 1,567,339 | |||||||||||
| Utilities (6.9%) | |||||||||||
| Electric (6.9%) | |||||||||||
| Electric-Generation (2.6%) | |||||||||||
| AES Corp. | |||||||||||
| 7.750% 03/01/14 | 1,285,000 | 1,352,462 | |||||||||
| Edison Mission Energy | |||||||||||
| 7.500% 06/15/13 | 895,000 | 928,563 | |||||||||
| 2,281,025 | |||||||||||
| Electric-Integrated (2.1%) | |||||||||||
| CMS Energy Corp. | |||||||||||
| 6.875% 12/15/15 | 310,000 | 319,300 | |||||||||
| 8.500% 04/15/11 | 260,000 | 281,450 | |||||||||
| Nevada Power Co. | |||||||||||
| 6.500% 04/15/12 | 585,000 | 602,074 | |||||||||
| TECO Energy, Inc. | |||||||||||
| 7.000% 05/01/12 | 645,000 | 675,638 | |||||||||
| 1,878,462 | |||||||||||
| Independent Power Producer (2.2%) | |||||||||||
| Dynegy Holdings, Inc. | |||||||||||
| 7.125% 05/15/18 | 330,000 | 320,100 | |||||||||
| Mirant North America LLC | |||||||||||
| 7.375% 12/31/13 | 545,000 | 555,900 | |||||||||
| MSW Energy Holdings II LLC | |||||||||||
| 7.375% 09/01/10 | 540,000 | 560,250 | |||||||||
See Accompanying Notes to Financial Statements.
59
CMG HIGH YIELD FUND
A Portfolio of Columbia Funds Institutional Trust
SCHEDULE OF INVESTMENTS
| Par | Value | ||||||||||
| Corporate Fixed-Income Bonds & Notes (continued) | |||||||||||
| Independent Power Producer (continued) | |||||||||||
| NRG Energy, Inc. | |||||||||||
| 7.250% 02/01/14 | $ | 130,000 | $ | 130,325 | |||||||
| 7.375% 02/01/16 | 380,000 | 380,475 | |||||||||
| 7.375% 01/15/17 | 60,000 | 60,000 | |||||||||
| 2,007,050 | |||||||||||
| 6,166,537 | |||||||||||
| Total Corporate Fixed-Income Bonds & Notes (Cost of $84,651,114) | 84,278,131 | ||||||||||
| Short-Term Obligation (3.6%) | |||||||||||
| Repurchase agreement with Fixed Income Clearing Corp., dated 01/31/07, due 02/01/07 at 5.160%, collateralized by a U.S. Treasury Note maturing 08/15/11, market value of $3,259,950 (repurchase proceeds $3,193,458) | 3,193,000 | 3,193,000 | |||||||||
| Total Short-Term Obligation (Cost of $3,193,000) | 3,193,000 | ||||||||||
| Total Investments (98.4%) (Cost of $87,844,114) (e) | 87,471,131 | ||||||||||
| Other Assets & Liabilities, Net (1.6%) | 1,389,200 | ||||||||||
| Net Assets (100.0%) | $ | 88,860,331 | |||||||||
Notes to Schedule of Investments:
(a) Security exempt from registration pursuant to Rule 144A under the Securities Act of 1933. These securities may be resold in transactions exempt from registration, normally to qualified institutional buyers. At January 31, 2007, these securities, which are not illiquid, amounted to $15,352,860, which represents 17.3% of net assets.
(b) The interest rate shown on floating rate or variable rate securities reflects the rate at January 31, 2007.
(c) Security purchased on a delayed delivery basis.
(d) Loan participation agreement.
(e) Cost for federal income tax purposes is $88,308,041.
See Accompanying Notes to Financial Statements.
60
CMG HIGH YIELD FUND
A Portfolio of Columbia Funds Institutional Trust
SCHEDULE OF INVESTMENTS
At January 31, 2007, the asset allocation of the Fund is as follows:
Asset Allocation | % of Net Assets | ||||||
| Industrials | 14.8 | ||||||
| Communications | 14.7 | ||||||
| Consumer Cyclical | 14.4 | ||||||
| Energy | 13.8 | ||||||
| Consumer Non-Cyclical | 13.7 | ||||||
| Financials | 8.6 | ||||||
| Utilities | 6.9 | ||||||
| Basic Materials | 6.1 | ||||||
| Technology | 1.8 | ||||||
| 94.8 | |||||||
| Short-Term Obligation | 3.6 | ||||||
| Other Assets & Liabilities, Net | 1.6 | ||||||
| 100.0 | |||||||
At January 31, 2007, the Fund had entered into the following forward currency exchange contracts:
| Forward Currency Contracts to Buy | Value | Aggregate Face Value | Settlement Date | Unrealized Depreciation | |||||||||||||||
| EUR | $ | 202,076 | $ | 204,325 | 02/06/07 | $ | (2,249 | ) | |||||||||||
| Forward Currency Contracts to Sell | Value | Aggregate Face Value | Settlement Date | Unrealized Appreciation (Depreciation) | |||||||||||||||
| EUR | $ | 202,076 | $ | 207,215 | 02/06/07 | $ | 5,139 | ||||||||||||
| 215,214 | 213,715 | 02/16/07 | (1,499 | ) | |||||||||||||||
| $ | 3,640 | ||||||||||||||||||
| Acronym | Name | ||||||
| EUR | Euro Currency | ||||||
| PIK | Payment in-kind | ||||||
See Accompanying Notes to Financial Statements.
61
STATEMENTS OF ASSETS AND LIABILITIES
January 31, 2007 (Unaudited)
| CMG Core Bond Fund | CMG Short Term Bond Fund | CMG Ultra Short Term Bond Fund | CMG High Yield Fund | ||||||||||||||||
| ASSETS: | |||||||||||||||||||
| Unaffiliated investments, at identified cost (including repurchase agreements) | $ | 58,129,388 | $ | 101,413,977 | $ | 115,043,504 | $ | 87,844,114 | |||||||||||
| Affiliated investments, at identified cost | 53,656 | 322,758 | - | - | |||||||||||||||
| Total investments, at cost | 58,183,044 | 101,736,735 | 115,043,504 | 87,844,114 | |||||||||||||||
| Unaffiliated investments, at value (including securities on loan of 5,707,499, $6,875,977, $ $3,418,902 and $-) | 56,561,454 | 98,164,424 | 99,602,404 | 84,278,131 | |||||||||||||||
| Affiliated investments, at value | 54,592 | 303,287 | - | - | |||||||||||||||
| Repurchase agreement | 1,283,000 | 2,829,000 | 15,279,000 | 3,193,000 | |||||||||||||||
| Total investments, at value | 57,899,046 | 101,296,711 | 114,881,404 | 87,471,131 | |||||||||||||||
| Cash | 591 | 939 | 864 | 1,000,373 | |||||||||||||||
| Unrealized appreciation on foreign forward currency contracts | - | - | - | 5,139 | |||||||||||||||
| Receivable for: | |||||||||||||||||||
| Investments sold | - | - | 505,560 | 169,575 | |||||||||||||||
| Capital stock sold | 242,700 | 362,000 | 2,908,958 | 231,990 | |||||||||||||||
| Interest | 466,750 | 714,460 | 804,561 | 1,530,657 | |||||||||||||||
| Securities lending | 358 | 449 | 317 | - | |||||||||||||||
| Expense reimbursement due from Investment Advisor | 8,233 | 8,613 | 9,774 | 6,413 | |||||||||||||||
| Deferred Trustees' compensation plan | 5,010 | 6,434 | 4,127 | 9,863 | |||||||||||||||
| Other assets | - | - | 56 | - | |||||||||||||||
| Total assets | 58,622,688 | 102,389,606 | 119,115,621 | 90,425,141 | |||||||||||||||
| LIABILITIES: | |||||||||||||||||||
| Collateral on securities loaned | 5,798,444 | 7,021,621 | 3,488,102 | - | |||||||||||||||
| Unrealized depreciation on foreign forward currency contracts | - | - | - | 3,748 | |||||||||||||||
| Payable for: | |||||||||||||||||||
| Investments purchased | - | 444,600 | 1,207,661 | 1,215,892 | |||||||||||||||
| Investments purchased on a delayed delivery basis | - | - | - | 50,737 | |||||||||||||||
| Capital stock redeemed | - | 1,000,000 | 246,492 | 14,820 | |||||||||||||||
| Distributions | 125,444 | 250,469 | 277,739 | 209,015 | |||||||||||||||
| Investment advisory fee | 12,123 | 22,928 | 21,568 | 29,422 | |||||||||||||||
| Trustees' fees | - | - | - | 1,369 | |||||||||||||||
| Audit fee | 23,740 | 24,292 | 23,183 | 25,958 | |||||||||||||||
| Deferred Trustees' compensation plan | 5,010 | 6,434 | 4,127 | 9,863 | |||||||||||||||
| Other liabilities | 505 | 630 | 621 | 3,986 | |||||||||||||||
| Total liabilities | 5,965,266 | 8,770,974 | 5,269,493 | 1,564,810 | |||||||||||||||
| NET ASSETS | $ | 52,657,422 | $ | 93,618,632 | $ | 113,846,128 | $ | 88,860,331 | |||||||||||
| NET ASSETS consist of: | |||||||||||||||||||
| Paid-in capital | $ | 54,782,717 | $ | 99,289,022 | $ | 115,745,354 | $ | 138,900,437 | |||||||||||
| Overdistributed net investment income | (112,213 | ) | (449,399 | ) | (403,706 | ) | (751,642 | ) | |||||||||||
| Accumulated net realized loss | (1,729,084 | ) | (4,780,967 | ) | (1,333,420 | ) | (48,916,855 | ) | |||||||||||
| Net unrealized appreciation (depreciation) on: | |||||||||||||||||||
| Investments | (283,998 | ) | (440,024 | ) | (162,100 | ) | (372,983 | ) | |||||||||||
| Foreign currency translations | - | - | - | 1,374 | |||||||||||||||
| NET ASSETS | $ | 52,657,422 | $ | 93,618,632 | $ | 113,846,128 | $ | 88,860,331 | |||||||||||
| Shares of capital stock outstanding | 5,183,817 | 8,074,378 | 11,806,983 | 11,305,900 | |||||||||||||||
| Net asset value, offering and redemption price per share | $ | 10.16 | $ | 11.59 | $ | 9.64 | $ | 7.86 | |||||||||||
See Accompanying Notes to Financial Statements.
62
STATEMENTS OF OPERATIONS
For the Six Months Ended January 31, 2007 (Unaudited)
| CMG Core Bond Fund | CMG Short Term Bond Fund | CMG Ultra Short Term Bond Fund | CMG High Yield Fund | ||||||||||||||||
| NET INVESTMENT INCOME: | |||||||||||||||||||
| Income: | |||||||||||||||||||
| Interest | $ | 1,352,500 | $ | 2,166,373 | $ | 2,369,446 | $ | 3,174,955 | |||||||||||
| Interest from affiliates | 2,466 | 13,588 | - | - | |||||||||||||||
| Securities lending income | 2,506 | 2,477 | 1,652 | - | |||||||||||||||
| Foreign withholding tax | - | - | - | (215 | ) | ||||||||||||||
| Total investment income | 1,357,472 | 2,182,438 | 2,371,098 | 3,174,740 | |||||||||||||||
| Expenses: | |||||||||||||||||||
| Investment advisory fee | 66,162 | 110,597 | 119,665 | 183,560 | |||||||||||||||
| Trustees' fees | 6,440 | 6,716 | 6,773 | 10,356 | |||||||||||||||
| Audit fee | 20,190 | 20,542 | 19,533 | 22,408 | |||||||||||||||
| Other expenses | 5,373 | 6,186 | 6,290 | 6,403 | |||||||||||||||
| Total expenses | 98,165 | 144,041 | 152,261 | 222,727 | |||||||||||||||
| Expense reimbursement from | |||||||||||||||||||
| Investment Advisor | (32,003 | ) | (33,444 | ) | (32,596 | ) | (39,166 | ) | |||||||||||
| Net expenses | 66,162 | 110,597 | 119,665 | 183,561 | |||||||||||||||
| Net investment income | 1,291,310 | 2,071,841 | 2,251,433 | 2,991,179 | |||||||||||||||
| NET REALIZED AND UNREALIZED GAIN (LOSS) ON INVESTMENTS, FOREIGN CURRENCY TRANSACTIONS AND FUTURES CONTRACTS: | |||||||||||||||||||
| Net realized gain (loss) on: | |||||||||||||||||||
| Investments | (160,629 | ) | (120,210 | ) | (100,634 | ) | (694,427 | ) | |||||||||||
| Foreign currency transactions | - | - | - | (1,896 | ) | ||||||||||||||
| Futures contracts | - | 11,179 | - | - | |||||||||||||||
| Net realized loss | (160,629 | ) | (109,031 | ) | (100,634 | ) | (696,323 | ) | |||||||||||
| Net change in unrealized appreciation on: | |||||||||||||||||||
| Investments | 804,275 | 335,088 | 312,172 | 3,337,248 | |||||||||||||||
| Foreign currency translations | - | - | - | 1,374 | |||||||||||||||
| Net change in unrealized appreciation | 804,275 | 335,088 | 312,172 | 3,338,622 | |||||||||||||||
| Net gain | 643,646 | 226,057 | 211,538 | 2,642,299 | |||||||||||||||
| NET INCREASE IN NET ASSETS FROM OPERATIONS | $ | 1,934,956 | $ | 2,297,898 | $ | 2,462,971 | $ | 5,633,478 | |||||||||||
See Accompanying Notes to Financial Statements.
63
STATEMENTS OF CHANGES IN NET ASSETS
| CMG Core Bond Fund | CMG Short Term Bond Fund | ||||||||||||||||||
| (Unaudited) Six Months Ended January 31, 2007 | Year Ended July 31, 2006 | (Unaudited) Six Months Ended January 31, 2007 | Year Ended July 31, 2006 | ||||||||||||||||
| Operations: | |||||||||||||||||||
| Net investment income | $ | 1,291,310 | $ | 2,851,226 | $ | 2,071,841 | $ | 3,300,292 | |||||||||||
| Net realized loss on investments, | |||||||||||||||||||
| foreign currency transactions | |||||||||||||||||||
| and futures contracts | (160,629 | ) | (1,235,400 | ) | (109,031 | ) | (534,655 | ) | |||||||||||
| Net change in unrealized appreciation (depreciation) on investments and futures contracts | 804,275 | (857,311 | ) | 335,088 | (288,322 | ) | |||||||||||||
| Net increase from operations | 1,934,956 | 758,515 | 2,297,898 | 2,477,315 | |||||||||||||||
| Distributions declared to shareholders: | |||||||||||||||||||
| From net investment income | (1,326,555 | ) | (3,061,621 | ) | (2,324,241 | ) | (3,690,742 | ) | |||||||||||
| From net realized gains | - | (21,839 | ) | - | - | ||||||||||||||
| Total distributions declared to shareholders | (1,326,555 | ) | (3,083,460 | ) | (2,324,241 | ) | (3,690,742 | ) | |||||||||||
| Share transactions: | |||||||||||||||||||
| Subscriptions | 5,886,772 | 12,221,511 | 29,398,826 | 30,797,725 | |||||||||||||||
| Distributions reinvested | 535,010 | 750,818 | 1,067,561 | 1,914,965 | |||||||||||||||
| Redemptions | (10,553,865 | ) | (33,568,744 | ) | (20,805,572 | ) | (43,357,147 | ) | |||||||||||
| Net increase (decrease) in share transactions | (4,132,083 | ) | (20,596,415 | ) | 9,660,815 | (10,644,457 | ) | ||||||||||||
| Net increase (decrease) in net assets | (3,523,682 | ) | (22,921,360 | ) | 9,634,472 | (11,857,884 | ) | ||||||||||||
| NET ASSETS: | |||||||||||||||||||
| Beginning of period | 56,181,104 | 79,102,464 | 83,984,160 | 95,842,044 | |||||||||||||||
| End of period | $ | 52,657,422 | $ | 56,181,104 | $ | 93,618,632 | $ | 83,984,160 | |||||||||||
| Overdistributed net investment income | $ | (112,213 | ) | $ | (76,968 | ) | $ | (449,399 | ) | $ | (196,999 | ) | |||||||
| Changes in shares: | |||||||||||||||||||
| Subscriptions | 578,722 | 1,194,394 | 2,527,333 | 2,641,344 | |||||||||||||||
| Issued for distributions reinvested | 52,400 | 73,922 | 91,853 | 164,066 | |||||||||||||||
| Redemptions | (1,037,980 | ) | (3,269,168 | ) | (1,790,627 | ) | (3,691,976 | ) | |||||||||||
| Net increase (decrease) | (406,858 | ) | (2,000,852 | ) | 828,559 | (886,566 | ) | ||||||||||||
See Accompanying Notes to Financial Statements.
64
STATEMENTS OF CHANGES IN NET ASSETS
| CMG Ultra Short Term Bond Fund | CMG High Yield Fund | ||||||||||||||||||
| (Unaudited) Six Months Ended January 31, 2007 | Year Ended July 31, 2006 | (Unaudited) Six Months Ended January 31, 2007 | Year Ended July 31, 2006 | ||||||||||||||||
| Operations: | |||||||||||||||||||
| Net investment income | $ | 2,251,433 | $ | 3,330,426 | $ | 2,991,179 | $ | 12,038,958 | |||||||||||
| Net realized loss on investments and foreign currency transactions | (100,634 | ) | (181,990 | ) | (696,323 | ) | (1,263,762 | ) | |||||||||||
| Net change in unrealized appreciation (depreciation) on investments and foreign currency translations | 312,172 | 60,266 | 3,338,622 | (7,431,304 | ) | ||||||||||||||
| Net increase from operations | 2,462,971 | 3,208,702 | 5,633,478 | 3,343,892 | |||||||||||||||
| Distributions declared to shareholders: | |||||||||||||||||||
| From net investment income | (2,257,712 | ) | (3,636,758 | ) | (3,177,156 | ) | (12,800,444 | ) | |||||||||||
| Return of capital | - | (1,580 | ) | - | - | ||||||||||||||
| Total distributions declared to shareholders | (2,257,712 | ) | (3,638,338 | ) | (3,177,156 | ) | (12,800,444 | ) | |||||||||||
| Share transactions: | |||||||||||||||||||
| Subscriptions | 33,185,292 | 25,443,944 | 15,361,546 | 12,320,348 | |||||||||||||||
| Distributions reinvested | 794,584 | 1,242,616 | 1,751,762 | 8,511,776 | |||||||||||||||
| Redemptions | (10,202,359 | ) | (17,968,775 | ) | (26,829,472 | ) | (184,498,010 | ) | |||||||||||
| Net increase (decrease) in share transactions | 23,777,517 | 8,717,785 | (9,716,164 | ) | (163,665,886 | ) | |||||||||||||
| Net increase (decrease) in net assets | 23,982,776 | 8,288,149 | (7,259,842 | ) | (173,122,438 | ) | |||||||||||||
| NET ASSETS: | |||||||||||||||||||
| Beginning of period | 89,863,352 | 81,575,203 | 96,120,173 | 269,242,611 | |||||||||||||||
| End of period | $ | 113,846,128 | $ | 89,863,352 | $ | 88,860,331 | $ | 96,120,173 | |||||||||||
| Overdistributed net investment income | $ | (403,706 | ) | $ | (397,427 | ) | $ | (751,642 | ) | $ | (565,665 | ) | |||||||
| Changes in shares: | |||||||||||||||||||
| Subscriptions | 3,441,846 | 2,640,382 | 1,961,750 | 1,561,452 | |||||||||||||||
| Issued for distributions reinvested | 82,423 | 128,967 | 224,111 | 1,075,896 | |||||||||||||||
| Redemptions | (1,058,354 | ) | (1,863,156 | ) | (3,429,207 | ) | (23,417,941 | ) | |||||||||||
| Net increase (decrease) | 2,465,915 | 906,193 | (1,243,346 | ) | (20,780,593 | ) | |||||||||||||
See Accompanying Notes to Financial Statements.
65
NOTES TO FINANCIAL STATEMENTS
January 31, 2007 (Unaudited)
Note 1. Organization
Columbia Funds Institutional Trust (the "Trust") is a Massachusetts business trust registered under the Investment Company Act of 1940, as amended, as an open-end management investment company. Information presented in these financial statements pertains to the following diversified funds (individually referred to as a "Fund", collectively referred to as the "Funds"):
CMG Core Bond Fund
CMG Short Term Bond Fund
CMG Ultra Short Term Bond Fund
CMG High Yield Fund
Shares of the Funds are available for purchase by institutional buyers and certain advisory clients of Columbia Management Advisors, LLC ("Columbia") or one of its affiliates. Each Fund's minimum initial investment requirement for investors is $3 million. Please see the Funds' prospectuses for further details.
Investment goals. CMG Core Bond Fund seeks a high level of current income consistent with capital preservation. CMG Short Term Bond Fund seeks a high level of current income consistent with a high degree of stability of principal. CMG Ultra Short Term Bond Fund seeks a high level of current income consistent with the maintenance of liquidity and the preservation of capital. CMG High Yield Fund seeks a high level of current income. Capital appreciation is a secondary objective when consistent with a high level of current income.
Fund shares. Each Fund may issue an unlimited number of shares of beneficial interest which are offered continuously at net asset value.
Note 2. Significant accounting policies
The preparation of financial statements in conformity with accounting principles generally accepted in the United States of America ("GAAP") requires management to make estimates and assumptions that affect the reported amounts of assets and liabilities, the disclosure of contingent assets and liabilities at the date of the financial statements and the reported amounts of revenue and expenses during the reporting period. Actual results could differ from those estimates. The following is a summary of significant accounting policies consistently followed by the Funds in the preparation of their financial statements.
Security valuation. Debt securities generally are valued by pricing services approved by the Trust's Board of Trustees, based upon market transactions for normal, institutional-size trading units of similar securities. The services may use various pricing techniques which take into account appropriate factors such as yield, quality, coupon rate, maturity, type of issue, trading characteristics and other data, as well as broker quotes. Debt securities for which quotations are readily available are valued at an over-the-counter or exchange bid quotation. Certain debt securities, which tend to be more thinly traded and of lesser quality, are priced based on fundamental analysis of the financial condition of the issuer and the estimated value of any collateral. Valuations developed through pricing techniques may vary from the actual amounts realized upon sale of the securities, and the potential variation may be greater for those securities valued using fundamental analysis.
Short-term debt obligations maturing within 60 days are valued at amortized cost, which approximates market value.
66
NOTES TO FINANCIAL STATEMENTS (continued)
January 31, 2007 (Unaudited)
Futures contracts are valued at the settlement price established each day by the board of trade or exchange on which they are traded.
Forward currency exchange contracts are valued at the prevailing forward exchange rate of the underlying currencies.
Foreign securities are generally valued at the last sale price on the foreign exchange or market on which they trade. If any foreign share prices are not readily available as a result of limited share activity, the securities are valued at the last sale price of the local shares in the principal market in which such securities are normally traded.
Generally, trading in foreign securities is substantially completed each day at various times prior to the close of the New York Stock Exchange ("NYSE"). The values of such securities used in computing the net asset value of the Funds' shares are determined as of such times. Foreign currency exchange rates are generally determined at 4.00 p.m. Eastern (U.S.) time. Events affecting the values of such foreign securities and such exchange rates may occur between the times at which they are determined and the close of the customary trading session of the NYSE, which would not be reflected in the computation of the Funds' net asset value. If events materially affecting the values of such foreign securities occur and it is determined that market quotations are not reliable, then these foreign securities will be valued at their fair value using procedures approved by the Board of Trustees. If a security is valued at a "fair value", suc h value is likely to be different from the last quoted market price for the security.
Investments for which market quotations are not readily available, or that have quotations which management believes are not appropriate, are valued at fair value as determined in good faith under consistently applied procedures established by and under the general supervision of the Board of Trustees.
In September 2006, Statement of Financial Accounting Standards No. 157, Fair Value Measurements ("SFAS 157"), was issued. SFAS 157 is effective for fiscal years beginning after November 15, 2007. SFAS 157 defines fair value, establishes a framework for measuring fair value and expands disclosures about fair value measurements. Management has recently begun to evaluate the impact the application of SFAS 157 will have on the Funds' financial statement disclosures.
Security transactions. Security transactions are accounted for on the trade date. Cost is determined and gains (losses) are based upon the specific identification method for both financial statement and federal income tax purposes.
Futures contracts. Each Fund may invest in futures contracts to hedge against the effects of changes in the value of portfolio securities due to anticipated changes in interest rates and/or market conditions, for duration management, or when the transactions are economically appropriate to the reduction of risk inherent in the management of the Funds and not for trading purposes. The use of futures contracts involves certain risks, which include: (1) imperfect correlation between the price movement of the instruments and the underlying securities, (2) inability to close out positions due to differing trading hours, or the temporary absence of a liquid market, for either the instrument or the underlying securities, or (3) an inaccurate prediction by Columbia of the future direction of interest rates. Any of these risks may involve amounts exceeding the variat ion margin recorded in the Funds' Statements of Assets and Liabilities at any given time. Upon entering into a futures contract, each Fund deposits cash or securities with the broker in an amount sufficient to meet the initial margin requirement. Subsequent payments are made or received by each Fund equals to the daily change in the contract value and are recorded as variation margin receivable or payable and offset in unrealized gains or losses. The Funds recognize a realized gain or loss when the contract is closed or expires.
Forward foreign currency exchange contracts. Forward foreign currency exchange contracts are agreements to exchange one currency for another at a future date at a specified price. These contracts are used to minimize the exposure to foreign exchange rate fluctuations during the period between trade and settlement date of the contracts. Certain Funds
67
NOTES TO FINANCIAL STATEMENTS (continued)
January 31, 2007 (Unaudited)
may utilize forward foreign currency exchange contracts in connection with the settlement of purchases and sales of securities. Certain Funds may also enter into these contracts to hedge certain other foreign currency denominated assets. Contracts to buy generally are used to acquire exposure to foreign currencies, while contracts to sell are used to hedge the Funds' investments against currency fluctuations. Forward currency contracts are valued daily at the current forward exchange rate of the underlying currency, resulting in unrealized gains (losses) which become realized at the time the foreign currency contracts are closed or mature. Realized and unrealized gains (losses) arising from such transactions are included in net realized and unrealized gains (losses) on foreign currency transactions. The use of forward currency contracts does not eliminate fluctuations in the prices of the Funds' portfolio securities. While the m aximum potential loss from such contracts is the aggregate face value in U.S. dollars at the time the contract was opened, exposure is typically limited to the change in value of the contract (in U.S. dollars) over the period it remains open. The Funds could also be exposed to risk if the counterparties of the contracts are unable to fulfill the terms of the contracts.
Loan Participations and Commitments. CMG High Yield Fund may invest in Loan Participations. When a Fund purchases a Loan Participation, the Fund typically enters into a contractual relationship with the lender or third party selling such Participation ("Selling Participant"), but not the Borrower. As a result, the Fund assumes the credit risk of the Borrower, Selling Participant and any other persons interpositioned between the Fund and the Borrower ("Intermediate Participants"). The Fund may not directly benefit from the collateral supporting the Senior Loan which it has purchased from the Selling Participant.
Repurchase agreements. Each Fund may engage in repurchase agreement transactions with institutions that Columbia has determined are creditworthy. Each Fund, through its custodian, receives delivery of underlying securities collateralizing a repurchase agreement. Collateral is at least equal, at all times, to the value of the repurchase obligation including interest. A repurchase agreement transaction involves certain risks in the event of default or insolvency of the counterparty. These risks include possible delays or restrictions upon each Fund's ability to dispose of the underlying securities and a possible decline in the value of the underlying securities during the period while the Funds seek to assert their rights.
Delayed delivery securities. The Funds may trade securities on other than normal settlement terms, including securities purchased or sold on a "when-issued" basis. This may increase the risk if the other party to the transaction fails to deliver and causes the Funds to subsequently invest at less advantageous prices. The Funds identify liquid portfolio securities in its records as segregated in an amount equal to the delayed delivery commitment.
Treasury inflation indexed securities. The Funds may invest in Treasury Inflation-Indexed Securities ("TIPS"). The principal amount of TIPS is adjusted periodically for inflation based on a monthly published index. Interest payments are based on the inflation-adjusted principal at the time the interest is paid.
Stripped securities. Stripped mortgage-backed securities are derivative multi-class mortgage securities structured so that one class receives most, if not all, of the principal from the underlying mortgage assets, while the other class receives most, if not all, of the interest and the remainder of the principal. If the underlying mortgage assets experience greater than anticipated prepayments of principal, a Fund may fail to fully recoup its initial investment in an interest-only security. The market value of these securities can be extremely volatile in response to changes in interest rates. Credit risk reflects the risk that a Fund may not receive all or part of its principal because the issuer or credit enhancer has defaulted on its obligation.
Mortgage dollar roll. The Funds may enter into mortgage "dollar rolls" in which the Funds sell securities for delivery in the current month and simultaneously contracts with the same counterparty to repurchase similar (same type, coupon and maturity) but not identical securities on a specified future date not exceeding 120 days. During the roll
68
NOTES TO FINANCIAL STATEMENTS (continued)
January 31, 2007 (Unaudited)
period, the Funds lose the right to receive principal and interest paid on the securities sold. However, the Funds would benefit to the extent of any difference between the price received for the securities sold and the lower forward price for the future purchase (often referred to as the "drop") or fee income plus the interest earned on the cash proceeds of the securities sold until the settlement date of the forward purchase. Unless such benefits exceed the income, capital appreciation and gain or loss due to mortgage prepayments that would have been realized on the securities sold as part of the mortgage dollar roll, the use of this technique will diminish the investment performance of the Funds compared with what such performance would have been without the use of mortgage dollar rolls. All cash proceeds will be invested in instruments that are permissible investments for the Funds. The Funds will hold and maintain in segreg ated accounts until the settlement date, cash or liquid securities in amounts equal to the forward purchase price.
The Funds' policy is to record the components of mortgage dollar rolls using "to be announced" mortgage-backed securities ("TBA Dollar Rolls"). For financial reporting and tax purposes, the Funds treat mortgage dollar rolls as two separate transactions, one involving the purchase of a security and a separate transaction involving a sale. The Funds do not currently enter into mortgage dollar rolls that are accounted for as financing.
Mortgage dollar rolls involve certain risks. If the broker-dealer to whom the Funds sell the security becomes insolvent, the Funds' right to purchase or repurchase the mortgage-related securities may be restricted and the instrument which the Funds are required to repurchase may be worth less than an instrument which the Funds originally held. Successful use of mortgage dollar rolls may depend upon the Advisor's ability to predict correctly interest rates and mortgage prepayments. For these reasons, there is no assurance that mortgage dollar rolls can be successfully employed.
Foreign currency transactions. The values of all assets and liabilities quoted in foreign currencies are translated into U.S. dollars at that day's exchange rates. Net realized and unrealized gains (losses) on foreign currency transactions include gains (losses) arising from the fluctuation in exchange rates between trade and settlement dates on securities transactions, gains (losses) arising from the disposition of foreign currency and currency gains (losses) between the accrual and payment dates on dividends, interest income and foreign withholding taxes.
For financial statement purposes, the Funds do not distinguish that portion of gains (losses) on investments which is due to changes in foreign exchange rates from that which is due to changes in market prices of the investments. Such fluctuations are included with the net realized and unrealized gains (losses) on investments in the Statements of Operations.
Income recognition. Interest income is recorded on the accrual basis and includes accretion of discounts, amortization of premiums and paydown gains and losses, net of any non-reclaimable tax withholdings of foreign securities.
Federal income tax status. Each Fund intends to qualify each year as a "regulated investment company" under Subchapter M of the Internal Revenue Code, as amended, and will distribute substantially all of its taxable income, if any, for its tax year, and as such will not be subject to federal income taxes. In addition, each Fund intends to distribute in each calendar year substantially all of its net investment income, capital gains and certain other amounts, if any, such that each Fund should not be subject to federal excise tax. Therefore, no federal income or excise tax provision is recorded.
Distributions to shareholders. Dividends from net investment income, if any, are generally declared daily and paid monthly. Net realized capital gains, if any, are distributed at least annually.
Indemnification. In the normal course of business, each Fund enters into contracts that contain a variety of representations and warranties and which provide general indemnities. A Fund's maximum exposure under these
69
NOTES TO FINANCIAL STATEMENTS (continued)
January 31, 2007 (Unaudited)
arrangements is unknown, as this would involve future claims against the Fund. Also, under the Funds' organizational documents and by contract, the Trustees and Officers of the Trust are indemnified against certain liabilities that may arise out of their duties to the Trust. However, based on experience, the Funds expect the risk of loss due to these representations, warranties and indemnities to be minimal.
Note 3. Federal tax information
The tax character of distributions paid during the year ended July 31, 2006 was as follows:
| July 31, 2006 | |||||||||||||||
| Ordinary Income* | Long-Term Capital Gains | Tax Return of Capital | |||||||||||||
| CMG Core Bond Fund | $ | 3,064,202 | $ | 19,258 | $ | - | �� | ||||||||
| CMG Short Term Bond Fund | 3,690,742 | - | - | ||||||||||||
| CMG Ultra Short Term Bond Fund | 3,636,758 | - | 1,580 | ||||||||||||
| CMG High Yield Fund | 12,800,444 | - | - | ||||||||||||
*For tax purposes short-term capital gains distributions, if any, are considered ordinary income distributions.
Unrealized appreciation and depreciation at January 31, 2007, based on cost of investments for federal income tax purposes, excluding any unrealized appreciation and depreciation are primarily due to deferral of losses from wash sales and amortization/accretion adjustments, was:
| Unrealized Appreciation | Unrealized Depreciation | Net Unrealized Depreciation | |||||||||||||
| CMG Core Bond Fund | $ | 276,259 | $ | (603,485 | ) | $ | (327,226 | ) | |||||||
| CMG Short Term Bond Fund | 120,130 | (786,839 | ) | (666,709 | ) | ||||||||||
| CMG Ultra Short Term Bond Fund | 79,029 | (412,338 | ) | (333,309 | ) | ||||||||||
| CMG High Yield Fund | 789,089 | (1,625,999 | ) | (836,910 | ) | ||||||||||
The following capital loss carryforwards, determined as of July 31, 2006, may be available to reduce taxable income arising from future net realized gains on investments, if any, to the extent permitted by the Internal Revenue Code:
| Year of Expiration | |||||||||||||||||||||||||||||||
| 2008 | 2009 | 2010 | 2012 | 2013 | 2014 | Total | |||||||||||||||||||||||||
| CMG Core Bond Fund | $ | - | $ | - | $ | - | $ | - | $ | - | $ | 304,526 | $ | 304,526 | |||||||||||||||||
| CMG Short Term Bond Fund | 537,548 | - | 2,365,257 | 19,156 | 25,391 | 989,127 | 3,936,479 | ||||||||||||||||||||||||
| CMG Ultra Short Term Bond Fund | - | - | - | 29,640 | 47,961 | 627,248 | 704,849 | ||||||||||||||||||||||||
| CMG High Yield Fund | - | 20,046,499 | 25,194,365 | - | - | - | 45,240,864 | ||||||||||||||||||||||||
Capital loss carryforwards of $152,878, for CMG High Yield Fund, were utilized during the year ended July 31, 2006. Expired capital loss carryforwards are recorded as a reduction of paid-in capital.
70
NOTES TO FINANCIAL STATEMENTS (continued)
January 31, 2007 (Unaudited)
Utilization of these losses could be subject to limitations imposed by the Internal Revenue Code.
Under current tax rules, certain capital losses realized after October 31 may be deferred and treated as occurring on the first day of the following fiscal year. As of July 31, 2006, post-October capital losses attributed to security transactions were deferred to August 1, 2006, as follows:
| Capital Losses | |||||||
| CMG Core Bond Fund | $ | 1,166,490 | |||||
| CMG Short Term Bond Fund | 727,380 | ||||||
| CMG Ultra Short Term Bond Fund | 527,938 | ||||||
| CMG High Yield Fund | 2,979,541 | ||||||
In June 2006, the Financial Accounting Standards Board ("FASB") issued FASB Interpretation No. 48, Accounting for Uncertainty in Income Taxes, an Interpretation of FASB Statement No. 109 (the "Interpretation"). This Interpretation is effective on the last business day of the semiannual reporting period for fiscal years beginning after December 15, 2006 and is to be applied to open tax positions upon initial adoption. This Interpretation prescribes a minimum recognition threshold and measurement method for the financial statement recognition of tax positions taken or expected to be taken in a tax return and also requires certain expanded disclosures. Management has recently begun to evaluate the application of this Interpretation to the Funds and has not at this time quantified the impact, if any, resulting from the adoption of this Interpretation on each Fund's financial statements.
Note 4. Fees and compensation paid to affiliates
Investment advisory fee. Columbia, an indirect, wholly-owned subsidiary of Bank of America Corporation ("BOA"), is the investment advisor to the Funds. Each Fund's investment advisory fee is a unified fee. Columbia, out of the unified fee it receives from the Funds, pays all accounting fees, legal fees, transfer agent fees, custody fees, expenses of the Chief Compliance Officer, fees for Sarbanes-Oxley compliance, the commitment fee for the line of credit and miscellaneous expenses of the Funds. The unified fee does not include brokerage fees, taxes, Trustees' fees, Trustee legal counsel fees, audit fees, interest expense associated with any borrowings by the Funds or extraordinary expenses, if any. The unified fees are paid monthly to Columbia based on each Fund's average daily net assets at the following annual rates:
| CMG Core Bond Fund | 0.25 | % | |||||
| CMG Short Term Bond Fund | 0.25 | % | |||||
| CMG Ultra Short Term Bond Fund | 0.25 | % | |||||
| CMG High Yield Fund | 0.40 | % | |||||
Pricing & bookkeeping fees. Effective December 15, 2006, the Funds entered into a Financial Reporting Services Agreement with State Street Bank and Trust Company ("State Street") and Columbia (the "Financial Reporting Services Agreement") pursuant to which State Street provides financial reporting services to each Fund. Also effective December 15, 2006, the Funds entered into an Accounting Services Agreement with State Street and Columbia (collectively with the Financial Reporting Services Agreement, the "State Street Agreement") pursuant to which State Street provides accounting services to each Fund.
Effective December 15, 2006, the Funds entered into a Pricing and Bookkeeping Oversight and Services Agreement (the "Services Agreement") with Columbia. Under the Services Agreement Columbia provides services related to Fund expenses and compliance with the Sarbanes-Oxley Act of 2002 and provides oversight of the accounting and financial reporting services provided by State Street.
71
NOTES TO FINANCIAL STATEMENTS (continued)
January 31, 2007 (Unaudited)
The fees for each Fund are payable by Columbia.
Prior to December 15, 2006, Columbia was responsible for providing pricing and bookkeeping services to the Funds under a pricing and bookkeeping agreement. Under separate agreements, Columbia delegated certain functions to State Street. As a result, the total fees payable under the pricing and bookkeeping agreement were paid to State Street. The pricing and bookkeeping fees for each Fund were payable by Columbia.
Transfer agent fee. Columbia Management Services, Inc. (the "Transfer Agent"), an affiliate of Columbia and an indirect, wholly-owned subsidiary of BOA, provides shareholder services to the Funds and has contracted with Boston Financial Data Services ("BFDS") to serve as sub-transfer agent. The transfer agent fees for the Funds are payable by Columbia.
The Transfer Agent may also retain, as additional compensation for its services, fees for wire, telephone and redemption orders, IRA trustee agent fees and account transcript fees due the Transfer Agent from shareholders of the Funds and credits (net of bank charges) earned with respect to balances in accounts the Transfer Agent maintains in connection with its services to the Funds.
Fee waivers. Columbia has contractually agreed to reimburse the Funds through March 1, 2009 for certain expenses so that the expenses incurred by the Funds, including the investment advisory fees, will not exceed the following annual rates based on each Fund's average daily net assets:
| CMG Core Bond Fund | 0.25 | % | |||||
| CMG Short Term Bond Fund | 0.25 | % | |||||
| CMG Ultra Short Term Bond Fund | 0.25 | % | |||||
| CMG High Yield Fund | 0.40 | % | |||||
Fees paid to officers and trustees. All officers of the Funds are employees of Columbia or its affiliates and, with the exception of the Funds' Chief Compliance Officer, receive no compensation from the Funds. The Board of Trustees has appointed a Chief Compliance Officer to the Funds in accordance with federal securities regulations. The expenses of the Chief Compliance Officer are payable by Columbia.
The Funds' Trustees may participate in a deferred compensation plan which may be terminated at any time. Obligations of the plan will be paid solely out of the Funds' assets.
Other. Columbia provides certain services to the Funds related to Sarbanes-Oxley compliance. The fees for such services are payable by Columbia.
Note 5. Portfolio information
For the six months ended January 31, 2007, the cost of purchases and proceeds from sales of securities, excluding short-term obligations, were as follow:
| U.S. Government Securities | Other Investment Securities | ||||||||||||||||||
| Purchases | Sales | Purchases | Sales | ||||||||||||||||
| CMG Core Bond Fund | $ | 18,344,306 | $ | 17,682,130 | $ | 2,043,193 | $ | 7,344,170 | |||||||||||
| CMG Short Term Bond Fund | 16,211,823 | 9,737,631 | 27,858,150 | 21,282,212 | |||||||||||||||
| CMG Ultra Short Term Bond Fund | 5,838,417 | 5,383,260 | 45,603,915 | 22,047,609 | |||||||||||||||
| CMG High Yield Fund | - | - | 31,138,390 | 38,935,161 | |||||||||||||||
72
NOTES TO FINANCIAL STATEMENTS (continued)
January 31, 2007 (Unaudited)
Note 6. Line of credit
The Trust and other affiliated funds participate in a $350,000,000 committed, unsecured revolving line of credit and a $150,000,000 uncommitted, unsecured line of credit, both provided by State Street. Borrowings are used for temporary or emergency purposes to facilitate portfolio liquidity.
Interest on the committed line of credit is charged to each participating fund based on the fund's borrowings at a rate per annum equal to the Federal Funds Rate plus 0.50%. In addition, a commitment fee of 0.10% per annum is accrued and apportioned among the participating funds based on their pro-rata portion of the unutilized committed line of credit. Interest on the uncommitted line of credit is charged to each participating fund based on the fund's borrowings at a variable rate per annum equal to the Federal Funds Rate plus a spread, as determined and quoted by State Street at the time of the request for a loan. A one-time structuring fee of $30,000 is also accrued and apportioned to each fund participating in the uncommitted line of credit based on the average net assets of the participating funds. In addition, if the uncommitted line of credit is extended for an additional period, an annual administration fee of $15,000 wi ll be charged and apportioned among the participating funds. The commitment fee and structuring fee are payable by Columbia.
For the six months ended January 31, 2007, the Funds did not borrow under this arrangement.
Note 7. Shares of beneficial interest
As of January 31, 2007, the Funds had shareholders whose shares were beneficially owned by participant accounts over which Bank of America and/or its affiliates had either sole or joint investment discretion. Subscription and redemption activity of these accounts may have a significant effect on the operations of the Funds. The numbers of accounts and the percentages of shares of beneficial interest outstanding held therein are as follows:
| Number of Shareholders | % of Shares Outstanding Held | ||||||||||
| CMG Core Bond Fund | 1 | 83.4 | % | ||||||||
| CMG Short Term Bond Fund | 1 | 89.4 | % | ||||||||
| CMG Ultra Short Term Bond Fund | 1 | 98.8 | % | ||||||||
| CMG High Yield Fund | 1 | 53.6 | % | ||||||||
In addition, as of January 31, 2007, two of the Funds had shareholders that held greater than 5% of the shares outstanding and Bank of America and/or its affiliates did not have investment discretion. Subscription and redemption activity of these shareholders may have a material effect on the Funds. The numbers of accounts and the percentages of shares of beneficial interest outstanding held therein are as follows:
| Number of Shareholders | % of Shares Outstanding Held | ||||||||||
| CMG Core Bond Fund | 1 | 16.5 | % | ||||||||
| CMG High Yield Fund | 4 | 30.8 | % | ||||||||
73
NOTES TO FINANCIAL STATEMENTS (continued)
January 31, 2007 (Unaudited)
Note 8. Securities lending
CMG Core Bond Fund, CMG Short Term Bond Fund and CMG Ultra Short Term Bond Fund commenced a securities lending program in August 2006 and may lend their securities to certain approved brokers, dealers and other financial institutions. Each loan is collateralized by cash, in an amount at least equal to the market value of the securities loaned. The collateral received is invested and the income generated by the investment of the collateral, net of any fees remitted to State Street as the lending agent, is paid to the Funds. Generally, in the event of borrower default, the Funds have the right to use the collateral to offset any losses incurred. In the event the Funds are delayed or prevented from exercising their right to dispose of the collateral, there may be a potential loss to the Funds. The Funds bear the risk of loss with respect to the investment of collateral.
Note 9. Disclosure of significant risks and contingencies
Foreign securities. There are certain additional risks involved when investing in foreign securities that are not inherent with investments in domestic securities. These risks may involve foreign currency exchange rate fluctuations, adverse political and economic developments and the possible prevention of currency exchange or other foreign governmental laws or restrictions. In addition, the liquidity of foreign securities may be more limited than that of domestic securities.
Investments in emerging market countries are subject to additional risk. The risk of foreign investments is typically increased in less developed countries. These countries are also more likely to experience high levels of inflation, deflation or currency devaluation which could hurt their economies and securities markets.
High-yield securities. Investing in high-yield securities may involve greater credit risk and considerations not typically associated with investing in U.S. government bonds and other higher quality fixed income securities. These securities are non-investment grade securities, often referred to as "junk" bonds. Economic downturns may disrupt the high yield market and impair the ability of issuers to repay principal and interest. Also, an increase in interest rates would likely have an adverse impact on the value of such obligations. Moreover, high-yield securities may be less liquid to the extent that there is no established secondary market.
Sector focus. At times, the Funds may have a large portion of their assets invested in a particular group of related industries (sector). During such times, the Funds will have greater exposure to economic and market events affecting such sector than if it were more broadly diversified across sectors.
Legal proceedings. On February 9, 2005, Columbia Management Advisors, Inc. (which has since merged into Banc of America Capital Management, LLC (now named Columbia Management Advisors, LLC)) ("Columbia") and Columbia Funds Distributor, Inc. (which has been renamed Columbia Management Distributors, Inc.) (the "Distributor") (collectively, the "Columbia Group") entered into an Assurance of Discontinuance with the New York Attorney General ("NYAG") (the "NYAG Settlement") and consented to the entry of a cease-and-desist order by the Securities and Exchange Commission ("SEC") (the "SEC Order") on matters relating to mutual fund trading. The SEC Order and the NYAG Settlement are referred to collectively as the "Settlements".
Under the terms of the SEC Order, the Columbia Group agreed, among other things, to: pay $70 million in disgorgement and $70 million in civil money penalties; cease and desist from violations of the antifraud provisions and certain other provisions of the federal securities laws; maintain certain compliance and ethics oversight structures; retain an independent consultant to review the Columbia Group's applicable supervisory, compliance, control and other policies and procedures; and retain an independent distribution consultant (see below). The Columbia Funds
74
NOTES TO FINANCIAL STATEMENTS (continued)
January 31, 2007 (Unaudited)
have also voluntarily undertaken to implement certain governance measures designed to maintain the independence of their boards of trustees. The NYAG Settlement also, among other things, requires Columbia and its affiliates to reduce management fees for certain Columbia Funds (including the former Nations Funds) and other mutual funds collectively by $32 million per year for five years, for a projected total of $160 million in management fee reductions.
Pursuant to the procedures set forth in the SEC Order, the $140 million in settlement amounts described above will be distributed in accordance with a distribution plan developed by an independent distribution consultant and approved by the SEC. The independent distribution consultant has been in consultation with the staff of the SEC and has submitted a proposed plan of distribution. The SEC has released the proposed plan of distribution for public notice and comment but has not yet approved a final plan of distribution.
As a result of these matters or any adverse publicity or other developments resulting from them, there may be increased redemptions or reduced sales of fund shares, which could increase transaction costs or operating expenses, or have other adverse consequences for the funds.
A copy of the SEC Order is available on the SEC website at http://www.sec.gov. A copy of the NYAG Settlement is available as part of the Bank of America Corporation Form 8-K filing on February 10, 2005.
In connection with the events described above, various parties have filed suit against certain funds, the Trustees of the Columbia Funds, FleetBoston Financial Corporation and its affiliated entities and/or Bank of America and its affiliated entities.
On February 20, 2004, the Judicial Panel on Multidistrict Litigation transferred these cases and cases against other mutual fund companies based on similar allegations to the United States District Court in Maryland for consolidated or coordinated pretrial proceedings (the "MDL"). Subsequently, additional related cases were transferred to the MDL. On September 29, 2004, the plaintiffs in the MDL filed amended and consolidated complaints. One of these amended complaints is a putative class action that includes claims under the federal securities laws and state common law, and that names Columbia, the Distributor, the Trustees of the Columbia Funds, Bank of America Corporation and others as defendants. Another of the amended complaints is a derivative action purportedly on behalf of the Columbia Funds that asserts claims under federal securities laws and state common law.
On February 25, 2005, Columbia and other defendants filed motions to dismiss the claims in the pending cases. On March 1, 2006, for reasons stated in the court's memoranda dated November 3, 2005, the U.S. District Court for the District of Maryland granted in part and denied in part the defendants' motions to dismiss. The court dismissed all of the class action claims pending against the Columbia Funds Trusts. As to Columbia and the Distributor, the claims under the Securities Act of 1933, the claims under Sections 34(b) and 36(a) of the Investment Company Act of 1940 ("ICA") and the state law claims were dismissed. The claims under Sections 10(b) and 20(a) of the Securities Exchange Act of 1934 and claims under Section 36(b) of the ICA were not dismissed.
On March 21, 2005, a purported class action was filed in Massachusetts state court alleging that certain conduct, including market timing, entitled Class B shareholders in certain Columbia Funds to an exemption from contingent deferred sales charges upon early redemption ("the CDSC Lawsuit"). The CDSC Lawsuit was removed to federal court in Massachusetts and the federal Judicial Panel transferred the CDSC Lawsuit to the MDL.
On April 4, 2006, the plaintiffs and the Columbia defendants named in the MDL, including the Columbia Funds, entered into a term sheet containing the principal terms of a stipulation of settlement that would settle all
75
NOTES TO FINANCIAL STATEMENTS (continued)
January 31, 2007 (Unaudited)
Columbia-related claims in the MDL described above, including the CDSC Lawsuit. On April 6, 2006, the U.S. District Court for the District of Maryland stayed all actions with respect to these Columbia-related claims.
In 2004, the Columbia Funds' adviser and distributor and certain affiliated entities and individuals were named as defendants in certain purported shareholder class and derivative actions making claims, including claims under the Investment Company and the Investment Advisers Acts of 1940 and state law. Certain Columbia Funds were named as nominal defendants. The suits allege, inter alia, that the fees and expenses paid by the funds are excessive and that the advisers and their affiliates inappropriately used fund assets to distribute the funds and for other improper purposes. On March 2, 2005, the actions were consolidated in the Massachusetts federal court as In re Columbia Entities Litigation. The plaintiffs filed a consolidated amended complaint on June 9, 2005. On November 30, 2005, the judge dismissed all claims by plaintiffs and entered final judgment in favor of the defendants. The plaintiffs appealed to the United States Court of Appeals for the First Circuit on December 30, 2005. A stipulation and settlement agreement dated January 19, 2007 was filed in the First Circuit on February 14, 2007, with a joint stipulation of dismissal and motion for remand to obtain district court approval of the settlement. That joint motion was granted and the appeal was dismissed. On March 6, 2007, the case was remanded to the District Court, where the parties will seek court approval of the settlement. The terms of the proposed settlement, if approved, will require payments by the funds' adviser and/or its affiliates, including payment of plaintiffs' attorneys' fees and notice to class members. In the event that the settlement is not approved, the plaintiffs may elect to go forward with their appeal and no opinion is expressed regarding the likely outcome or financial impact of such an appeal on any fund.
76
BOARD CONSIDERATION AND APPROVAL OF
INVESTMENT ADVISORY AGREEMENTS
The Advisory Fees and Expenses Committee of the Board of Trustees meets one or more times annually to review the advisory agreements (collectively, the "Agreements") of the funds for which the Trustees serve as trustees (each a "fund") and determine whether to recommend that the full Board approve the continuation of the Agreements for an additional one-year period. After the Committee has made its recommendation, the full Board, including the Independent Trustees, determines whether to approve the continuation of the Agreements. In addition, the Board, including the Independent Trustees, considers matters bearing on the Agreements at most of its other meetings throughout the year and meets regularly with the heads of each investment area within Columbia. Through the Board's Investment Oversight Committees, Trustees also meet with selected fund portfolio managers at various times throughout the year.
The Trustees receive and review all materials that they, their legal counsel or Columbia, the funds' investment adviser, believe to be reasonably necessary for the Trustees to evaluate the Agreements and determine whether to approve the continuation of the Agreements. Those materials generally include, among other items, (i) information on the investment performance of each fund relative to the performance of peer groups of mutual funds and the fund's performance benchmarks, (ii) information on each fund's advisory fees and other expenses, including information comparing the fund's expenses to those of peer groups of mutual funds and information about any applicable expense caps and fee "breakpoints," (iii) information about the profitability of the Agreements to Columbia, including potential "fall-out" or ancillary benefits that Columbia and its affiliates may receive as a result of their relationships with the funds and (iv) i nformation obtained through Columbia's response to a questionnaire prepared at the request of the Trustees by counsel to the funds and independent legal counsel to the Independent Trustees. The Trustees also consider other information such as (v) Columbia's financial results and financial condition, (vi) each fund's investment objective and strategies and the size, education and experience of Columbia's investment staffs and their use of technology, external research and trading cost measurement tools, (vii) the allocation of the funds' brokerage, if any, and the use of "soft" commission dollars to pay for research products and services, (viii) Columbia's resources devoted to, and its record of compliance with, the funds' investment policies and restrictions, policies on personal securities transactions and other compliance policies, (ix) Columbia's response to various legal and regulatory proceedings since 2003 and (x) the economic outlook generally and for the mutual fund industry in particular. In additio n, the Advisory Fees and Expenses Committee confers with the funds' independent fee consultant and reviews materials relating to the funds' relationships with Columbia provided by the independent fee consultant. Throughout the process, the Trustees have the opportunity to ask questions of and request additional materials from Columbia and to consult with independent legal counsel to the Independent Trustees and the independent fee consultant.
The Board of Trustees most recently approved the continuation of the Agreements at its October 2006 meeting, following meetings of the Advisory Fees and Expenses Committee held in August, September and October 2006. In considering whether to approve the continuation of the Agreements, the Trustees, including the Independent Trustees, did not identify any single factor as determinative, and each weighed various factors as he or she deemed appropriate. The Trustees considered the following matters in connection with their approval of the continuation of the Agreements:
The nature, extent and quality of the services provided to the funds under the Agreements. The Trustees considered the nature, extent and quality of the services provided by Columbia and its affiliates to the funds and the resources dedicated to the funds by Columbia and its affiliates. Among other things, the Trustees considered (i) Columbia's ability (including its personnel and other resources, compensation programs for personnel involved in fund management, reputation and other attributes) to attract and retain highly qualified research, advisory and supervisory investment professionals; (ii) the portfolio management services provided by those investment professionals; and (iii) the trade execution services provided on behalf of the funds. For each fund, the Trustees also considered the benefits to shareholders of investing in a mutual fund that is part of a family of funds offering exposure to a variety of asset classes and investment disciplines and providing a variety of fund and shareholder services. After reviewing those and related factors, the Trustees concluded, within the context of their overall conclusions regarding each of the Agreements, that the nature, extent and quality of services provided supported the continuation of the Agreements.
77
BOARD CONSIDERATION AND APPROVAL OF
INVESTMENT ADVISORY AGREEMENTS (continued)
Investment performance of the funds and Columbia. The Trustees reviewed information about the performance of each fund over various time periods, including information prepared by an independent third party that compared the performance of each fund to the performance of peer groups of mutual funds and performance benchmarks. The Trustees also reviewed a description of the third party's methodology for identifying each fund's peer group for purposes of performance and expense comparisons. The Trustees also considered additional information that the Advisory Fees and Expenses Committee requested from Columbia relating to funds that presented relatively weaker performance and/or relatively higher expenses.
In the case of each fund whose performance lagged that of a relevant peer group for certain (although not necessarily all) periods, the Trustees concluded that other factors relevant to performance were sufficient, in light of other considerations, to warrant continuation of the fund's Agreements. Those factors varied from fund to fund, but included one or more of the following: (i) that the fund's performance, although lagging in certain recent periods, was stronger over the longer term; (ii) that the underperformance was attributable, to a significant extent, to investment decisions that were reasonable and consistent with the fund's investment strategy and policies and that then fund was performing as expected, given these investment decisions, market conditions and the fund's investment strategy; (iii) that the fund's performance was competitive when compared to other relevant performance benchmarks or peer groups; (iv) that Columbia had taken or was taking steps designed to help improve the fund's investment performance, including, but not limited to, replacing portfolio managers or modifying investment strategies; and (v) that the fund was proposed to be reorganized into another fund, and that such reorganization would result in a reduction in fund expenses.
The Trustees also considered Columbia's performance and reputation generally, the funds' performance as a fund family generally, and Columbia's historical responsiveness to Trustee concerns about performance and Columbia's willingness to take steps intended to improve performance.
After reviewing those and related factors, the Trustees concluded, within the context of their overall conclusions regarding each of the Agreements, that the performance of each fund and Columbia was sufficient, in light of other considerations, to warrant the continuation of the Agreement(s) pertaining to that fund.
The costs of the services provided and profits realized by Columbia and its affiliates from their relationships with the funds. The Trustees considered the fees charged to the funds for advisory services as well as the total expense levels of the funds. That information included comparisons (provided by management and by an independent third party) of each fund's advisory fees and total expense levels to those of the fund's peer groups and information about the advisory fees charged by Columbia to comparable institutional accounts. In considering, the fees charged to those accounts, the Trustees took into account, among other things, management's representations about the differences between managing mutual funds as compared to other types of accounts, including differences in the services provided, differences in the risk profile of such business for Columb ia, and the additional resources required to manage mutual funds effectively. In evaluating each fund's advisory fees, the Trustees also took into account the demands, complexity and quality of the investment management of the fund. The Trustees considered existing advisory fee breakpoints, and Columbia's use of advisory fee waivers and expense caps, which benefited a number of the funds. The Trustees also noted management's stated justification for the fees charged to the funds, which included information about the investment performance of the funds and the services provided to the funds. The Trustees also considered the compensation directly or indirectly received by Columbia and its affiliates from their relationships with the funds. The Trustees reviewed information provided by management as to the profitability to Columbia and its affiliates of their relationships with each fund, and information about the allocation of expenses used to calculate profitability. When reviewing profitability, the Trustees also considered court cases in which adviser profitability was an issue in whole or in part, the performance of the relevant funds, the expense level of each fund, and whether Columbia had implemented breakpoints and/or expense caps with respect to the fund.
78
BOARD CONSIDERATION AND APPROVAL OF
INVESTMENT ADVISORY AGREEMENTS (continued)
After reviewing those and related factors, the Trustees concluded, within the context of their overall conclusions regarding each of the Agreements, that the advisory fees charged to each fund, and the related profitability to Columbia and its affiliates of their relationships with the fund, supported the continuation of the Agreement(s) pertaining to that fund.
Economies of Scale. The Trustees considered the existence of any economies of scale in the provision by Columbia of services to each fund, to groups of related funds, and to Columbia's investment advisory clients as a whole and whether those economies were shared with the funds through breakpoints in the investment advisory fees or other means, such as expense waivers/reductions and additional investments by Columbia in investment, trading and compliance resources. The Trustees noted that many of the funds benefited from breakpoints, expense caps, or both. In considering those issues, the Trustees also took note of the costs of the services provided (both on an absolute and a relative basis) and the profitability to Columbia and its affiliates of their relationships with the funds, as discussed above.
After reviewing those and related factors, the Trustees concluded, within the context of their overall conclusions regarding each of the Agreements, that the extent to which economies of scale were shared with the funds supported the continuation of the Agreements.
Other Factors. The Trustees also considered other factors, which included but were not limited to the following:
n the extent to which each fund had operated in accordance with its investment objective and investment restrictions, the nature and scope of the compliance programs of the funds and Columbia and the compliance-related resources that Columbia and its affiliates were providing to the funds;
n the nature, quality, cost and extent of administrative and shareholder services performed by Columbia and its affiliates, both under the Agreements and under separate agreements for the provision of transfer agency and administrative services;
n so-called "fall-out benefits" to Columbia and its affiliates, such as the engagement of its affiliates to provide distribution, brokerage and transfer agency services to the funds, and the benefits of research made available to Columbia by reason of brokerage commissions generated by the funds' securities transactions, as well as possible conflicts of interest associated with those fall-out and other benefits, and the reporting, disclosure and other processes in place to disclose and monitor those possible conflicts of interest; and
n the draft report provided by the funds' independent fee consultant, which included information about and analysis of the funds' fees, expenses and performance.
Based on their evaluation of all factors that they deemed to be material, including those factors described above, and assisted by the advice of independent counsel and the independent fee consultant, the Trustees, including the Independent Trustees, approved the continuance of each of the Agreements through October 31, 2007.
79
SUMMARY OF MANAGEMENT FEE EVALUATION BY
INDEPENDENT FEE CONSULTANT
Prepared Pursuant to the February 9, 2005 Assurance of Discontinuance between the Office of Attorney General of New York State and Columbia Management Advisors, Inc. and Columbia Funds Distributor, Inc. October 11, 2006
I. Overview
Columbia Management Advisors, LLC ("CMA") and Columbia Funds Distributors, Inc.1 ("CFD") agreed on February 9, 2005 to the New York Attorney General's Assurance of Discontinuance ("AOD"). Among other things, the AOD stipulates that CMA may manage or advise a Columbia Fund ("Fund" and together with all such funds or a group of such funds as the "Funds") only if the Independent Members of the Fund's Board of Trustees (such Independent Members of the Fund's Board together with the other members of the Fund's Board, referred to as the "Trustees") appoint a Senior Officer or retain an Independent Fee Consultant ("IFC") who is to manage the process by which proposed management fees are negotiated. The AOD further stipulates that the Senior Officer or IFC is to prepare a written annual evaluation of the fee negotiation process.
On September 14, 2006, the Independent members of the Funds' Boards retained me as IFC for the Funds. In this capacity, I have prepared the second annual written evaluation of the fee negotiation process. I am successor to the first IFC, Erik Sirri, who prepared the annual evaluation in 2005 and who contributed to the second annual written evaluation until his resignation as IFC in August 2006 to become Director of the Division of Market Regulation at the U.S. Securities and Exchange Commission.2
A. Role of the Independent Fee Consultant
The AOD charges the IFC with "managing the process by which proposed management fees...to be charged the Columbia Fund are negotiated so that they are negotiated in a manner which is at arms' length and reasonable and consistent with this Assurance of Discontinuance." In this role, the IFC does not replace the Trustees in negotiating management fees with CMA, and the IFC does not substitute his or her judgment for that of the Trustees about the reasonableness of proposed fees. As the AOD states, CMA "may manage or advise a Columbia Fund only if the reasonableness of the proposed management fees is determined by the Board of Trustees...using...an annual independent written evaluation prepared by or under the direction of...the Independent Fee Consultant."
B. Elements Involved in Managing the Fee Negotiation Process
Managing the fee negotiation process has three elements. One involves reviewing the information provided by CMG to the Trustees for evaluating the proposed management fees and augmenting that information, as necessary, with additional information from CMG or other sources and with further analyses of the information and data. The second element involves reviewing the information and analysis relative to at least the following six factors set forth in the AOD:
1. The nature and quality of CMA's services, including the Fund's performance;
2. Management fees (including any components thereof) charged by other mutual fund companies for like services;
3. Possible economies of scale as the Fund grows larger;
1 CMA and CFD are subsidiaries of Columbia Management Group, Inc. ("CMG"), which also is the parent of Columbia Management Services, Inc. ("CFS"), the Funds' transfer agent. Before the date of this report, CMA merged into an affiliated entity, Banc of America Capital Management, LLC, which was renamed Columbia Management Advisors, LLC and which carries on the business of CMA. CFD also has been renamed Columbia Management Distributors, Inc.
2 I am an independent economic consultant. From August 2005 until August 2006, I provided support to Mr. Sirri as an independent consultant. From 1994 to 2004, I was Chief Economist at the Investment Company Institute. Earlier, I was Section Chief and Assistant Director at the Federal Reserve Board and Professor of Economics at Oklahoma State University. I have no material relationship with Bank of America or CMG, aside from serving as IFC, and I am aware of no material relationship with any of their affiliates. To assist me with the report, I engaged NERA Economic Consulting, an independent consulting firm that has had extensive experience in the mutual fund industry. I also have retained Willkie Farr & Gallagher LLP as counsel to advise me in connection with the report.
80
SUMMARY OF MANAGEMENT FEE EVALUATION BY
INDEPENDENT FEE CONSULTANT (continued)
4. Management fees (including any components thereof) charged to institutional and other clients of CMA for like services;
5. Costs to CMA and its affiliates of supplying services pursuant to the management fee agreements, excluding any intra-corporate profit; and
6. Profit margins of CMA and its affiliates from supplying such services.
The final element involves providing the Trustees with a written evaluation of the above factors as they relate to the fee negotiation process.
C. Organization of the Annual Evaluation
The 2006 annual evaluation focuses on the six factors and contains a section for each factor except that CMA's costs and profits from managing the Funds have been combined into a single section. In each section, the discussion of the factor considers and analyzes the available data and other information as they bear upon the fee negotiation process. If appropriate, the discussion in the section may point out certain aspects of the proposed fees that may warrant particular attention from the Trustees. The discussion also may suggest other data, information, and approaches that the Trustees might consider incorporating into the fee negotiation process in future years.
In addition to a discussion of the six factors, the report reviews the status of recommendations made in the 2005 IFC evaluation. The 2006 report also summarizes the findings with regard to the six factors and contains a summary of recommendations for possible enhancements to the process.
II. Status of 2005 Recommendations
The 2005 IFC evaluation contains recommendations aimed at enhancing the evaluation of proposed management fees by Trustees. The section summarizes those recommendations and includes my assessment of the response to the recommendations.
1. Recommendation: Trustees should consider requesting more analytical work from CMG in the preparation of future 15(c) materials.
Status: CMG has provided additional analyses to the Trustees on economies of scale, a comparative analysis of institutional and retail management fees, management fee breakpoints, risk-adjusted performance, fee waivers and expense reimbursements, and CMG's costs and profitability.
2. Recommendation: Trustees may wish to consider whether CMG should continue expanding the use of Morningstar or other third party data to supplement CMG's fee and performance analysis that is now based primarily on Lipper reports.
Status: CMG has used data from Morningstar Inc. to compare with data from Lipper Inc. ("Lipper") in performing the Trustees' screening procedures.
3. Recommendation: Trustees should consider whether...the fund-by-fund screen...should place comparable emphasis on both basis point and quintile information in their evaluation of the funds...Also, the Trustees should consider incorporating sequences of one year performance into a fund-by-fund screen.
81
SUMMARY OF MANAGEMENT FEE EVALUATION BY
INDEPENDENT FEE CONSULTANT (continued)
Status: CMG has not provided Trustees with results of the screening process using percentiles. CMG has provided Trustees with information on the changes in performance and expenses between 2005 and 2006 and data on one-year returns.
4. Recommendation: Given the volatility of fund performance, the Trustees may want to consider whether a better method exists than th[e] fee waiver process to deal with fund underperformance.
Status: It is my understanding that the Trustees have determined to address fund underperformance not only through fee waivers and expense caps but also through discussions with CMG regarding the sources of underperformance. CMG has provided Trustees with an analysis of the relationship between breakpoints, expense reimbursements, and fee waivers.
5. Recommendation: [Seventy-one] percent of funds [have] yet to reach their first management fee breakpoint... Trustees may wish to consider whether the results of my ongoing economies-of-scale work affects the underlying economic assumptions reflected in the existing breakpoint schedules.
Status: CMG has prepared a memo for the Trustees discussing its views on the nature and sharing of potential economies of scale. The memo discuses CMG's view that economies of scale arise at the complex level rather than the fund level. The memo also describes steps, including the introduction of breakpoints, taken to share economies of scale with shareholders. CMG's analysis, however, does not discuss specific sources of economies of scale and does not link breakpoints to economies of scale that might be realized as the Funds' assets increase.
6. Recommendation: Trustees should continue working with management to address issues of funds that demonstrate consistent or significant underperformance even if the fee levels for the funds are low.
Status: Trustees monitor performance on an ongoing basis.
III. Findings
A. General
1. Based upon my examination of the available information and the six factors, I conclude that the Trustees have the relevant information necessary to evaluate the reasonableness of the proposed management fees for the Funds. CMG has provided the Trustees with relevant materials on the six factors through the 15(c) contract renewal process and in materials prepared for review at Board and Committee meetings.
2. In my view, the process by which the proposed management fees of the Funds have been negotiated in 2006 thus far has been, to the extent practicable, at arms' length and reasonable and consistent with the AOD.
B. Nature and Quality of Services, Including Performance
3. The performance of the Funds has been relatively strong, especially that of fixed-income Funds. For each of the 1-, 3-, 5- and 10-year performance periods, over 60 percent of the funds have ranked in the top three performance quintiles.
4. The performance of the equity Funds overall, though less concentrated in the top two quintiles than the fixed income Funds, improved in 2006 relative to that in 2005. The fixed-income funds maintained the relatively high performance level of 2005 in 2006.
82
SUMMARY OF MANAGEMENT FEE EVALUATION BY
INDEPENDENT FEE CONSULTANT (continued)
5. The Funds' overall performance adjusted for risk was significantly stronger than performance unadjusted for risk. Domestic and international equity funds, in particular, moved to higher relative performance rankings after adjusting for risk.
6. The procedure used to construct the performance universe in which each Fund's performance is ranked relative to comparable funds may bias a Fund's ranking upward within that universe. The bias occurs because the performance ranking procedure includes all share classes of multi-class funds in the universe and because the procedure ranks either no-load or A share classes of the Funds. No-load and A share classes generally have lower total expenses than B and C shares (owing to B and C shares having higher distribution/service fees) and thus, given all else, would outperform many of B and C share classes included in the universe. A preliminary analysis that adjusts for the bias results in a downward movement in the relative performance for the Funds but does not change the general finding that the Funds' performance has been strong relative to comparable funds.
C. Management Fees Charged by Other Mutual Fund Companies
7. The Funds' management fees and total expenses are generally low relative to those of their peers. At least 56 percent of the Funds are in the first or second quintiles with the lowest fees and expenses and nearly three fourths or more in the first three quintiles. Equity Funds are more highly concentrated in the first three quintiles than fixed-income Funds.
8. The fee and expense rankings as whole are similar to those in 2005 in that the majority of funds are ranked in the top quintiles. Nonetheless, a number of individual funds experienced a change in ranking between 2005 and 2006. This fund-level instability may reflect sensitivity of rankings to the composition of the comparison groups, as the membership of the peer groups typically changed substantially between the two years.
9. The Liberty Money Market Fund VS appears to have a higher management fee structure than that of other Columbia money market funds of comparable asset size.
D. Trustees' Fee and Performance Evaluation Process
10. The Trustees' evaluation process identified 21 funds in 2006 for further review based upon their relative performance or expenses. Seventeen of these funds had been subject to review in 2004 or 2005.
E. Potential Economies of Scale
11. CMG has prepared a memo for the Trustees containing its views on the sources and sharing of potential economies of scale. CMG views economies of scale as arising at the complex level and would regard estimates of scale economies for individual funds as unreliable. CMG has not, however, identified specific sources of economies of scale nor has it provided any estimates of the magnitude of any economies of scale. In the memo, CMG also describes measures taken by the Trustees and CMG that seek to share any potential economies of scale through breakpoints in management fee schedules, expense reimbursements, fee waivers, enhanced shareholder services, fund mergers, and operational consolidation. These measures, although of significant benefit to shareholders, have not been directly linked in the memo to the existence, sources, and magnitude of economies of scale.
F. Management Fees Charged to Institutional Clients
12. CMG has provided Trustees with comparisons of mutual fund management fees and institutional fees based upon standardized fee schedules and upon actual fees. Based upon the information, institutional fees are generally lower than the Funds' management fees. This pattern is consistent with the economics of the two financial products. Data
83
SUMMARY OF MANAGEMENT FEE EVALUATION BY
INDEPENDENT FEE CONSULTANT (continued)
are not available, however, on actual institutional fees at other money managers. Thus, it is not possible to determine the extent to which differences between the Funds' management fees and institutional fees are consistent with those seen generally in the marketplace.
G. Revenues, Expenses, and Profits
13. The financial statements and the methodology underlying their construction generally form a sufficient basis for Trustees to evaluate the expenses and profitability of the Funds.
IV. Recommendations
A. Performance
1. Trustees may wish to consider incorporating risk adjusted measures in their evaluation of performance. CMG has begun to prepare reports for the Trustees with risk adjustments, which could form the basis for formally including the measures in the 15(c) materials. To this end, Trustees may wish to have CMG prepare documents explaining risk adjustments and describing their advantages and disadvantages.
2. Trustees may wish to consider having CMG evaluate the sensitivity of performance rankings to the design of the universe. The preliminary analysis contained in the evaluation suggests that the method employed by Lipper, the source of performance rankings used by the Trustees, may bias performance rankings upward.
B. Economies of Scale
3. Trustees may wish to consider having CMG extend its analysis of economies of scale by examining the sources of such economies, if any. Identification of the sources may enable the Trustees and CMG to gauge their magnitude. It also may enable the Trustees and CMG to build upon past work on standardized fee schedules so that the schedules themselves are consistent with any economies of scale and their sources. Finally, an extension of the analysis may enable the Trustees and CMG to develop a framework that coordinates the use of fee waivers and expense caps with the standard fee schedules and with any economies of scale and their sources.
C. Institutional Fees
4. Trustees may wish to consider encouraging CMG to build further upon its expanded analysis of institutional fees by refining the matching of institutional accounts with mutual funds, by dating the establishment of each institutional account, and by incorporating other accounts, such as subadvisory relationships, trusts, offshore funds, and separately managed accounts into the analysis.
D. Profitability
5. Trustees may wish to consider requesting that CMG expand the reporting of revenues and expenses to include more line-item detail for management and administration, transfer agency, fund accounting, and distribution.
6. Trustees may wish to consider requesting that CMG provide a statement of its operations in the 15(c) materials.
7. Trustees may wish to consider the treatment of the revenue sharing with the Private Bank of Bank of America in their review of CMG's profitability.
Respectfully submitted,
John D. Rea
84
SUMMARY OF MANAGEMENT FEE EVALUATION BY
INDEPENDENT FEE CONSULTANT (continued)
Appendix
Sources of Information Used in the Evaluation
The following list generally describes the sources and types of information that were used in preparing this report.
1. Performance, management fees, and expense ratios for the Funds and comparable funds from other fund complexes from Lipper and CMG. The sources of this information were CMG and Lipper;
2. CMG's expenses and profitability obtained directly from CMG;
3. Information on CMG's organizational structure;
4. Profitability of publicly traded asset managers from Lipper;
5. Interviews with CMG staff, including members of senior management, legal staff, heads of affiliates, portfolio managers, and financial personnel;
6. Documents prepared by CMG for Section 15(c) contract renewals in 2005 and 2006;
7. Academic research papers, industry publications, professional materials on mutual fund operations and profitability, and SEC releases and studies of mutual fund expenses
8. Interviews with and documents prepared by Ernst & Young LLP in its review of the Private Bank Revenue Sharing Agreement;
9. Discussions with Trustees and attendance at Board and committee meetings during which matters pertaining to the evaluation were considered.
In addition, I engaged NERA Economic Consulting ("NERA") to assist me in data management and analysis. NERA has extensive experience in the mutual fund industry that provides unique insights and special knowledge pertaining to my independent analysis of fees, performance, and profitability. I have also retained attorneys in the Washington, D.C. office of Willkie Farr & Gallagher LLP as outside counsel to advise me in connection with my evaluation.
Finally, meetings and discussions with CMG staff were informative. My participation in Board and committee meetings in which Trustees and CMG management discussed issues relating to management contracts were of great benefit to the preparation of the evaluation.
85
COLUMBIA FUNDS INSTITUTIONAL TRUST
ONE FINANCIAL CENTER, BOSTON, MASSACHUSETTS, 02111-2621
- INVESTMENT ADVISOR -
COLUMBIA MANAGEMENT ADVISORS, LLC
100 FEDERAL STREET
BOSTON, MASSACHUSETTS 02110-2624
- LEGAL COUNSEL -
ROPES & GRAY LLP
ONE INTERNATIONAL PLACE
BOSTON, MASSACHUSETTS 02110-2624
- TRANSFER AGENT -
COLUMBIA MANAGEMENT SERVICES, INC.
P.O. BOX 8081
BOSTON, MASSACHUSETTS 02266-8081
SHC-44/116584-0107 (03/07) 07/36501
A description of the funds' proxy voting policies and procedures is available (i) on the funds' website, www.columbiamanagement.com; (ii) on the Securities and Exchange Commission's website at www.sec.gov, and (iii) without charge, upon request, by calling 800-368-0346. Information regarding how the funds voted proxies relating to portfolio securities during the 12-month period ended June 30 is available from the SEC's website. Information regarding how the funds voted proxies relating to portfolio securities is also available from the funds' website.
Each fund files a complete schedule of portfolio holdings with the SEC for the first and third quarters of each fiscal year on Form N-Q. Each fund's Form N-Q is available on the SEC's website at www.sec.gov and may be reviewed and copied at the SEC's Public Reference Room in Washington, D.C. Information on the operation of the Public Reference Room may be obtained by calling 1-800-SEC-0330.
The funds are offered by prospectus through Columbia Management Distributors, Inc. Please consider the investment objectives, risks, charges and expenses of a mutual fund carefully before investing. Contact your Columbia Management representative or visit www.columbiamanagement.com for a prospectus, which contains this and other important information about the fund. Read it carefully before you invest.
Fund distributed by Columbia Management Distributors, Inc.
©2007 Columbia Management Distributors, Inc.
One Financial Center, Boston, MA 02111-2621

CMG ENHANCED S&P 500® INDEX FUND
CMG LARGE CAP GROWTH FUND
CMG LARGE CAP VALUE FUND
CMG MID CAP GROWTH FUND
CMG MID CAP VALUE FUND
CMG SMALL CAP GROWTH FUND
CMG SMALL CAP VALUE FUND
CMG SMALL/MID CAP FUND
CMG INTERNATIONAL STOCK FUND
PORTFOLIOS OF COLUMBIA FUNDS INSTITUTIONAL TRUST
Semiannual Report
January 31, 2007
Not FDIC
Insured
May Lose Value
No Bank Guarantee
Columbia Management Advisors, LLC ("CMA") is an SEC-registered investment advisor and indirect, wholly owned subsidiary of Bank of America Corporation and is part of Columbia Management.
Columbia Management Group, LLC ("Columbia Management") is the investment management division of Bank of America Corporation. Columbia Management entities furnish investment management services and products for institutional and individual investors. The funds are distributed by Columbia Management Distributors, Inc., member of NASD, SIPC, part of Columbia Management and an affiliate of Bank of America Corporation.
Table of Contents
| Fund Profile | |||||||
| CMG Enhanced S&P 500® Index Fund | 1 | ||||||
| CMG Large Cap Growth Fund | 6 | ||||||
| CMG Large Cap Value Fund | 11 | ||||||
| CMG Mid Cap Growth Fund | 16 | ||||||
| CMG Mid Cap Value Fund | 21 | ||||||
| CMG Small Cap Growth Fund | 27 | ||||||
| CMG Small Cap Value Fund | 33 | ||||||
| CMG Small/Mid Cap Fund | 39 | ||||||
| CMG International Stock Fund | 45 | ||||||
| Financial Statements | |||||||
| Financial Highlights | 51 | ||||||
| Schedules of Investments | 60 | ||||||
| Statements of Assets and Liabilities | 126 | ||||||
| Statements of Operations | 128 | ||||||
| Statements of Changes in Net Assets | 130 | ||||||
| Notes to Financial Statements | 135 | ||||||
| Board Consideration and Approval of Investment Advisory Agreements | 146 | ||||||
| Summary of Management Fee Evaluation by Independent Fee Consultant | 149 | ||||||
The views expressed in the fund profiles reflect the current views of the portfolio managers of the funds included in this report. These views are not guarantees of future performance and involve certain risks, uncertainties and assumptions that are difficult to predict so actual outcomes and results may differ significantly from the views expressed. These views are subject to change at any time based upon economic, market or other conditions and the portfolio managers disclaim any responsibility to update such views. These views may not be relied on as investment advice and, because investment decisions for a fund are based on numerous factors, may not be relied on as an indication of trading intent on behalf of any particular fund. References to specific company securities should not be construed as a recommendation or investment advice.
Performance data quoted represents past performance and current performance may be lower or higher. Past performance is no guarantee of future results. The investment return and principal value will fluctuate so that shares, when redeemed, may be worth more or less than the original cost. Please visit www.columbiamanagement.com for daily and most recent month-end performance updates.
CMG ENHANCED S&P 500® INDEX FUND
A Portfolio of Columbia Funds Institutional Trust
FUND PROFILE
Summary
• For the six-month period ended January 31, 2007, CMG Enhanced S&P 500® Index Fund returned 15.31%. The fund's return was higher than that of its benchmark, the S&P 500 Index,1 which was 13.75% for the same period. The fund also outperformed the 13.18% average return for its peer group, the Lipper Large Cap Core Funds Classification.2 Stock selection, especially in financials, energy and healthcare, was the primary reason for the fund's higher relative returns.
• Within the financials sector, strong mergers and acquisitions activity boosted capital market-related stocks, such as Goldman Sachs and Lehman Brothers (1.9% and 0.6% of net assets, respectively). The fund had more exposure than the index to both stocks, which magnified the impact of their performance on the fund. Elsewhere in the portfolio, Microsoft and Cisco Systems were also solid contributors to performance relative to the index (3.1% and 1.8% of net assets, respectively).
The fund had no exposure to the indirect parent company of the fund's advisor, Bank of America Corporation, because the fund is not permitted to own the stock. This has hampered the fund's performance during prior periods but aided performance during this reporting period. Within the energy sector, we had less exposure than the index to Valero Energy (0.4% of net assets), which was a positive for performance as its shares lagged the index in the face of declining oil prices.
Weak security selection in consumer discretionary, materials and consumer staples sectors hurt performance. Within consumer discretionary, the fund had only a small position in Comcast (less than 0.1% of net assets) and lacked exposure to at least one other top performing name that is included in the index, and this hampered returns during the period. In the consumer staples sector, the fund had more exposure than the index to Reynolds American and Archer-Daniels-Midland (1.2% and 0.4% of net assets, respectively), which also hampered performance. Reynolds American delivered only modest returns while Archer-Daniels-Midland lost nearly 27% during the period. In the energy sector, ConocoPhillips (1.1% of net assets) and Anadarko were disappointments. We sold Anadarko. Within health care, biotechnology stalwart Amgen (1.7% of net assets) failed to keep pace with the sector's overall gains and hampered the fund's return disproportio nately, because the fund had an above-index position in the stock.
1 The Standard & Poor's (S&P) 500 Index tracks the performance of 500 widely held, large-capitalization US stocks. Indices are not investments, do not incur fees or expenses and are not professionally managed. It is not possible to invest directly in an index. Securities in the fund may not match those in an index.
2 Lipper Inc., a widely respected data provider in the industry, calculates an average total return (assuming reinvestment of distributions) for mutual funds with investment objectives similar to those of the fund. Lipper makes no adjustment for the effect of sales loads.
1
• The fund is positioned to reflect our confidence in corporate business prospects and our expectation for continued, moderate economic growth. By our estimates, valuations remain attractive on a historical basis, with large caps holding a slight valuation advantage over small cap stocks and growth stocks slightly undervalued relative to value stocks.
We appreciate your continued confidence in CMG Enhanced S&P 500® Index Fund.
Portfolio Management
Vikram Kuriyan has managed the CMG Enhanced S&P 500® Index Fund since June 2005 and has been with the advisor or its predecessors or affiliate organizations since 2000.
The fund's top ten holdings (as a percentage of net assets) as of January 31, 2007 were:
| (%) | |||||||
| Exxon Mobil | 3.8 | ||||||
| Citigroup | 3.2 | ||||||
| Microsoft | 3.1 | ||||||
| Pfizer | 2.0 | ||||||
| Goldman Sachs | 1.9 | ||||||
| JPMorgan Chase | 1.8 | ||||||
| Cisco Systems | 1.8 | ||||||
| Amgen | 1.7 | ||||||
| General Electric | 1.6 | ||||||
| AT&T | 1.5 | ||||||
Holdings are calculated as a percentage of net assets and are subject to change. Because the fund is actively managed, there is no guarantee the fund will continue to maintain the holdings breakdown listed. The fund's holdings and their weights within the portfolio may change as market conditions change.
Equity investments are affected by stock market fluctuations that occur in response to economic and business developments.
Investing in the fund also includes market risk and tracking error risk. Unlike the S&P 500 Index, the fund incurs administrative expenses and transaction costs in trading stocks. The composition of the S&P 500 Index and the stocks held by the fund will diverge.
2
Performance data quoted represents past performance and current performance may be lower or higher. Past performance is no guarantee of future results. The investment return and principal value will fluctuate so that shares, when redeemed, may be worth more or less than the original cost. Please visit www.columbiamanagement.com for daily and most recent month-end performance updates.
Performance results reflect any voluntary waivers or reimbursement of fund expenses by the advisor or its affiliates. Absent these waivers or reimbursement arrangements, performance results would have been lower. All results shown assume reinvestment of distributions.
The table and chart do not reflect the deduction of taxes that a shareholder would pay on fund distributions or the redemption of fund shares.
Average annual total return as of January 31, 2007 (%)
| Inception | 6-month (cumulative) | 1-year | Life | ||||||||||||||||
| CMG Enhanced S&P 500® Index Fund | 05/05/03 | 15.31 | 16.51 | 15.59 | |||||||||||||||
| S&P 500 Index | 13.75 | 14.51 | 14.52 | ||||||||||||||||
Average annual total return as of December 31, 2006 (%)
| Inception | 6-month (cumulative) | 1-year | Life | ||||||||||||||||
| CMG Enhanced S&P 500® Index Fund | 05/05/03 | 14.57 | 17.91 | 15.52 | |||||||||||||||
| S&P 500 Index | 12.74 | 15.80 | 14.41 | ||||||||||||||||
Index performance is from May 5, 2003.
Growth of a $3,000,000 investment, May 5, 2003 to January 31, 2007
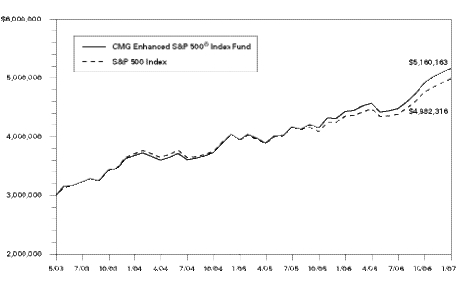
The chart above shows the growth in value of a hypothetical minimum initial $3,000,000 investment in the fund compared to the index during the stated time period.
The Standard & Poor's (S&P) 500 Index tracks the performance of 500 widely held, large-capitalization US stocks. Indices are not investments, do not incur fees or expenses and are not professionally managed. It is not possible to invest directly in an index. Securities in the fund may not match those in an index.
3
UNDERSTANDING YOUR EXPENSES – CMG Enhanced S&P 500® Index Fund
As a fund shareholder, you incur two types of costs. There are transaction costs and also ongoing costs, which generally include investment advisory fees and other fund expenses. The information on this page is intended to help you understand your ongoing costs of investing in the fund and to compare these costs with the ongoing costs of investing in other mutual funds.
Analyzing your fund's expenses
To illustrate these ongoing costs, we have provided an example and calculated the expenses paid by investors during the reporting period. The information in the following table is based on an initial investment of $1,000, which is invested at the beginning of the reporting period and held for the entire period. Expense information is calculated two ways and each method provides you with different information. The amount listed in the "actual" column is calculated using the fund's actual operating expenses and total return for the period. The amount listed in the "hypothetical" column assumes that the return each year is 5% before expenses and is calculated based on the fund's actual operating expenses. You should not use the hypothetical account values and expenses to estimate either your actual account balance at the end of the period or the expenses you paid during this reporting period.
Estimating your actual expenses
To estimate the expenses that you paid over the period, first you will need your account balance at the end of the period:
1. Divide your ending account balance by $1,000. For example, if an account balance was $8,600 at the end of the period, the result would be 8.6.
2. In the section of the table below titled "Expenses paid during the period," locate the amount under "actual." Multiply this number by the result from step 1. Your answer is an estimate of the expenses you paid on your account during the period.
August 1, 2006 – January 31, 2007
| Account value at the beginning of the period ($) | Account value at the end of the period ($) | Expenses paid during the period ($) | Fund's annualized expense ratio (%) | ||||||||||||||||||||||||
| Actual | Hypothetical | Actual | Hypothetical | Actual | Hypothetical | Actual | |||||||||||||||||||||
| 1,000.00 | 1,000.00 | 1,153.10 | 1,023.95 | 1.36 | 1.28 | 0.25 | |||||||||||||||||||||
Expenses paid during the period are equal to the fund's annualized expense ratio of 0.25%, multiplied by the average account value over the period, then multiplied by the number of days in the fund's most recent fiscal half-year and divided by 365.
Had the investment advisor and/or any of its affiliates not reimbursed a portion of expenses, account value at the end of the period would have been reduced.
It is important to note that the expense amounts shown in the table are meant to highlight only ongoing costs of investing in the fund and do not reflect any transaction costs, such as sales charges, redemption or exchange fees. Therefore, the hypothetical examples provided may not help you determine the relative total costs of owning shares of different funds. If these transaction costs were included, your costs would have been higher.
4
Compare with other funds
Since all mutual funds are required to include the same hypothetical calculations about expenses in shareholder reports, you can use this information to compare the ongoing cost of investing in the fund with other funds. To do so, compare the 5% hypothetical example with the 5% hypothetical examples that appear in the shareholder reports of other funds. As you compare hypothetical examples of other funds, it is important to note that hypothetical examples are meant to highlight the ongoing costs of investing in a fund and do not reflect any transaction costs, such as sales charges or redemption or exchange fees.
5
Performance data quoted represents past performance and current performance may be lower or higher. Past performance is no guarantee of future results. The investment return and principal value will fluctuate so that shares, when redeemed, may be worth more or less than the original cost. Please visit www.columbiamanagement.com for most recent daily and month-end performance updates.
CMG LARGE CAP GROWTH FUND
A Portfolio of Columbia Funds Institutional Trust
FUND PROFILE
Summary
• For the six-month period ended January 31, 2007, CMG Large Cap Growth Fund returned 15.46%. The fund beat its benchmark, the Russell 1000 Growth Index1, and its peer group, the Morningstar Large Growth Category, which returned 15.12% and averaged 13.50%, respectively, over the same period.2 Our focus on large-cap companies that we believe have strong competitive positions, high sustainable profits, good balance sheets and above-average earnings growth prospects resulted in strong stock selection relative to the index and peer group, which drove performance.
• Technology, the fund's largest sector weight, had the biggest impact on returns, led by Internet-related stocks, which rallied sharply. In addition, Research in Motion (0.7% of net assets), the maker of wireless Blackberry devices, rebounded after resolving patent litigation issues. Industrials further boosted performance, as aerospace stocks benefited from a pickup in orders. Returns from most other sectors were modestly ahead of those in the index. Notable individual contributors included Las Vegas Sands and Bank of New York (0.5% and 1.0% of net assets, respectively). Las Vegas Sands, a casino operator, climbed as investors grew more excited about its prospects in Macau, a developing gaming center in Asia. Bank of New York benefited from a recent restructuring that focuses the company on asset management and investment services.
Health care modestly detracted from returns relative to the index. No one stock was a major disappointment. Instead not owning several medical device companies that did well and investing in some companies at the wrong times hampered returns. Certain biotechnology stocks were also disappointments.
• We remain optimistic about the prospects for large-cap growth stocks. Valuations remain attractive relative to other areas of the market and to their historical averages. As corporate profit growth slows in the United States, large-cap growth companies with international operations have the potential to attract added investor interest. Going forward, we plan to keep the fund highly diversified across sectors, relying on stock selection to drive returns.
1 The Russell 1000 Growth Index measures the performance of those Russell 1000 Index companies with higher price-to-book ratios and higher forecasted growth values. Indices are not investments, do not incur fees or expenses and are not professionally managed. It is not possible to invest directly in an index. Securities in the fund may not match those in an index.
2 ©2007 by Morningstar, Inc. All rights reserved. The information contained herein is the proprietary information of Morningstar, Inc., may not be copied or redistributed for any purpose and may only be used for noncommercial, personal purposes. The information contained herein is not represented or warranted to be accurate, correct, complete or timely. Morningstar, Inc. shall not be responsible for investment decisions, damages or other losses resulting from the use of this information. Past performance is no guarantee of future performance. Morningstar, Inc. has not granted consent for it to be considered or deemed an "expert" under the Securities Act of 1933. Morningstar Categories compare the performance of funds with similar investment objectives and strategies.
6
Thank you for investing in CMG Large Cap Growth Fund.
Portfolio Management
Paul J. Berlinguet, lead manager for CMG Large Cap Growth Fund, has managed or co-managed the fund since October 2003 and has been with the advisor or its predecessors or affiliate organizations since 2003.
Roger R. Sullivan has co-managed the fund since June 2005 and has been with the advisor or its predecessors or affiliate organizations since January 2005.
John T. Wilson has co-managed the fund since August 2005 and has been with the advisor or its predecessors since July 2005.
Edward P. Hickey has co-managed the fund since June 2005 and has been with the advisor or its predecessors or affiliate organizations since 1998.
Mary-Ann Ward has co-managed the fund since June 2005 and has been with the advisor or its predecessors or affiliate organizations since 1997.
The fund's top ten holdings (as a percentage of net assets) as of January 31, 2007 were:
| (%) | |||||||
| Johnson & Johnson | 2.9 | ||||||
| Microsoft | 2.8 | ||||||
| Cisco Systems | 2.8 | ||||||
| 2.8 | |||||||
| General Electric | 2.5 | ||||||
| PepsiCo | 2.2 | ||||||
| Procter & Gamble | 2.0 | ||||||
| International Business Machines | 2.0 | ||||||
| Amgen | 1.8 | ||||||
| Altria Group | 1.7 | ||||||
Holdings are calculated as a percentage of net assets, and are subject to change. Because the fund is actively managed, there is no guarantee the fund will continue to maintain the holdings breakdown listed. The fund's holdings and their weights within the portfolio may change as market conditions change.
Equity investments are affected by stock market fluctuations that occur in response to economic and business developments.
Investing in growth stocks incurs the possibility of losses because their prices are sensitive to changes in current or expected earnings.
7
Performance data quoted represents past performance and current performance may be lower or higher. Past performance is no guarantee of future results. The investment return and principal value will fluctuate so that shares, when redeemed, may be worth more or less than the original cost. Please visit www.columbiamanagement.com for daily and most recent month-end performance updates.
Performance results may reflect any voluntary waivers or reimbursement of fund expenses by the advisor or its affiliates. Absent these waivers or reimbursement arrangements, performance results would have been lower. All results shown assume reinvestment of distributions.
The table and chart do not reflect the deduction of taxes that a shareholder would pay on fund distributions or the redemption of fund shares.
Average annual total return as of January 31, 2007 (%)
| Inception | 6-month | 1-year | Life (cumulative) | ||||||||||||||||
| CMG Large Cap Growth Fund | 09/10/03 | 15.46 | 9.46 | 9.92 | |||||||||||||||
| Russell 1000 Growth Index | 15.12 | 9.95 | 9.01 | ||||||||||||||||
Average annual total return as of December 31, 2006 (%)
| Inception | 6-month | 1-year | Life (cumulative) | ||||||||||||||||
| CMG Large Cap Growth Fund | 09/10/03 | 9.82 | 10.41 | 9.35 | |||||||||||||||
| Russell 1000 Growth Index | 10.10 | 9.07 | 8.41 | ||||||||||||||||
Index performance is from September 10, 2003.
Growth of a $3,000,000 investment, September 10, 2003 to January 31, 2007
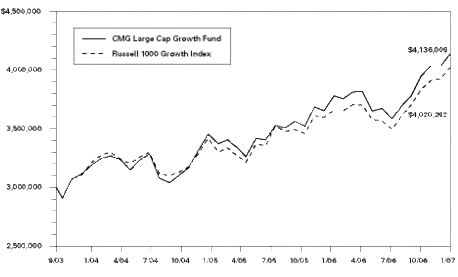
The chart above shows the growth in value of a hypothetical minimum initial $3,000,000 investment in the fund compared to the index during the stated time period.
The Russell 1000 Growth Index measures the performance of those Russell 1000 Index companies with higher price-to-book ratios and higher forecasted growth values. Indices are not investments, do not incur fees or expenses and are not professionally managed. It is not possible to invest directly in an index. Securities in the fund may not match those in an index
8
UNDERSTANDING YOUR EXPENSES – CMG Large Cap Growth Fund
As a fund shareholder, you incur two types of costs. There are transaction costs and also ongoing costs, which generally include investment advisory fees and other fund expenses. The information on this page is intended to help you understand your ongoing costs of investing in the fund and to compare these costs with the ongoing costs of investing in other mutual funds.
Analyzing your fund's expenses
To illustrate these ongoing costs, we have provided an example and calculated the expenses paid by investors during the reporting period. The information in the following table is based on an initial investment of $1,000, which is invested at the beginning of the reporting period and held for the entire period. Expense information is calculated two ways and each method provides you with different information. The amount listed in the "actual" column is calculated using the fund's actual operating expenses and total return for the period. The amount listed in the "hypothetical" column assumes that the return each year is 5% before expenses and is calculated based on the fund's actual operating expenses. You should not use the hypothetical account values and expenses to estimate either your actual account balance at the end of the period or the expenses you paid during this reporting period.
Estimating your actual expenses
To estimate the expenses that you paid over the period, first you will need your account balance at the end of the period:
1. Divide your ending account balance by $1,000. For example, if an account balance was $8,600 at the end of the period, the result would be 8.6.
2. In the section of the table below titled "Expenses paid during the period," locate the amount under "actual." Multiply this number by the result from step 1. Your answer is an estimate of the expenses you paid on your account during the period.
August 1, 2006 – January 31, 2007
| Account value at the beginning of the period ($) | Account value at the end of the period ($) | Expenses paid during the period ($) | Fund's annualized expense ratio (%) | ||||||||||||||||||||||||
| Actual | Hypothetical | Actual | Hypothetical | Actual | Hypothetical | Actual | |||||||||||||||||||||
| 1,000.00 | 1,000.00 | 1,154.61 | 1,022.68 | 2.72 | 2.55 | 0.50 | |||||||||||||||||||||
Expenses paid during the period are equal to the fund's annualized expense ratio of 0.50%, multiplied by the average account value over the period, then multiplied by the number of days in the fund's most recent fiscal half-year and divided by 365.
Had the investment advisor and/or any of its affiliates not reimbursed a portion of expenses, account value at the end of the period would have been reduced.
It is important to note that the expense amounts shown in the table are meant to highlight only ongoing costs of investing in the fund and do not reflect any transaction costs, such as sales charges, redemption or exchange fees. Therefore, the hypothetical examples provided may not help you determine the relative total costs of owning shares of different funds. If these transaction costs were included, your costs would have been higher.
9
Compare with other funds
Since all mutual funds are required to include the same hypothetical calculations about expenses in shareholder reports, you can use this information to compare the ongoing cost of investing in the fund with other funds. To do so, compare the 5% hypothetical example with the 5% hypothetical examples that appear in the shareholder reports of other funds. As you compare hypothetical examples of other funds, it is important to note that hypothetical examples are meant to highlight the ongoing costs of investing in a fund and do not reflect any transaction costs, such as sales charges or redemption or exchange fees.
10
Performance data quoted represents past performance and current performance may be lower or higher. Past performance is no guarantee of future results. The investment return and principal value will fluctuate so that shares, when redeemed, may be worth more or less than the original cost. Please visit www.columbiamanagement.com for daily and most recent month-end performance updates.
CMG LARGE CAP VALUE FUND
A Portfolio of Columbia Funds Institutional Trust
FUND PROFILE
Summary
• For the six-month period ended January 31, 2007, CMG Large Cap Value Fund returned 12.12%. The fund's benchmark, the Russell 1000 Value Index,1 returned 13.43%. The average return of its peer group, the Morningstar Large Value Category, was 12.90%.2 Solid economic growth and strong corporate profits aided the fund, its benchmark and peer group to double digit returns. For the fund, stock selection within financials, materials and telecommunications sectors aided performance while energy holdings detracted from its return.
• With slightly over one third of the fund's assets invested in financial stocks, the sector's solid performance, in general, and stock selection, in particular, aided the fund's return. Capital markets and diversified financial service firms were the best performers. A favorable appraisal by analysts of Citigroup's (3.7% of net assets) upside potential in a positive interest rate environment, combined with its strong international presence and a lower level of deal risk than its competitors, resulted in a 16.4% gain for its shares, which set new highs during the period. JPMorgan Chase and U.S. Bancorp (3.7% and 2.4% of net assets, respectively) also generated double-digit gains. Within the telecommunications sector, shares of AT&T (3.2% of net assets) rose 28.1% as the company closed its merger with BellSouth near the end of December. The completed merger, which combines AT&T with BellSouth and Cingular, offers the potential for operating synergies and profit margin. In the materials sector, the fund's investment in Weyerhauser (1.8% of net assets), a paper and forest products company, returned 24.4% as rising containerboard prices and the company's restructuring initiatives in that division, combined with other factors, translated into a higher share price.
Energy stocks were disappointing during the period. However, the fund's modest weight in the sector – 14% – limited the negative impact on the fund's return. Occidental Petroleum (1.6% of net assets) declined 13.2% and EnCana declined 16.7%. We sold EnCana but retained the position in Occidental Petroleum.
1 The Russell 1000 Value Index measures the performance of those Russell 1000 Index companies with lower price-to-book ratios and lower forecasted growth values. Indices are not investments, do not incur fees or expenses and are not professionally managed. It is not possible to invest directly in an index. Securities in the fund may not match those in an index.
2 ©2007 by Morningstar, Inc. All rights reserved. The information contained herein is the proprietary information of Morningstar, Inc., may not be copied or redistributed for any purpose and may only be used for noncommercial, personal purposes. The information contained herein is not represented or warranted to be accurate, correct, complete or timely. Morningstar, Inc. shall not be responsible for investment decisions, damages or other losses resulting from the use of this information. Past performance is no guarantee of future performance. Morningstar, Inc. has not granted consent for it to be considered or deemed an "expert" under the Securities Act of 1933. Morningstar Categories compare the performance of funds with similar investment objectives and strategies.
11
• In managing the fund, we plan to remain attentive to the economic landscape, both here and abroad, as well as business factors, such as prospects for consumer-related sectors and operating margins. We plan to continue to seek out companies that demonstrate the potential for incremental operating improvements and efficiencies that allow top-line revenue growth to improve their bottom-line results.
Thank you for investing in CMG Large Cap Value Fund.
Portfolio Management
Lori J. Ensinger has co-managed the CMG Large Cap Value Fund since August 2005 and has been with the advisor or its predecessors or affiliate organizations since 2001.
Diane L. Sobin has co-managed the fund since August 2005 and has been with the advisor or its predecessors or affiliate organizations since 2001.
David I. Hoffman has co-managed the fund since August 2005 and has been with the advisor or its predecessors or affiliate organizations since 2001.
Noah J. Petrucci has co-managed the fund since August 2005 and has been with the advisor or its predecessors or affiliate organizations since 2002.
The fund's top ten holdings (as a percentage of net assets) as of January 31, 2007 were:
| (%) | |||||||
| Citigroup | 3.7 | ||||||
| JPMorgan Chase | 3.7 | ||||||
| AT&T | 3.2 | ||||||
| Merrill Lynch | 3.1 | ||||||
| Exxon Mobil | 2.7 | ||||||
| Pfizer | 2.7 | ||||||
| General Electric | 2.6 | ||||||
| U.S. Bancorp | 2.4 | ||||||
| Wells Fargo | 2.3 | ||||||
| Weyerhaeuser | 1.8 | ||||||
Holdings are calculated as a percentage of net assets, and are subject to change. Because the fund is actively managed, there is no guarantee the fund will continue to maintain the holdings breakdown listed. The fund's holdings and their weights within the portfolio may change as market conditions change.
Equity investments are affected by stock market fluctuations that occur in response to economic and business developments.
Value stocks are stocks of companies that may have experienced adverse business or industry developments or may be subject to special risks that have caused the stocks to be out of favor and, in the advisor's opinion, undervalued. If the advisor's assessment of a company's prospects is wrong, the price of the company's stock may not approach the value the advisor has placed on it.
12
Performance data quoted represents past performance and current performance may be lower or higher. Past performance is no guarantee of future results. The investment return and principal value will fluctuate so that shares, when redeemed, may be worth more or less than the original cost. Please visit www.columbiamanagement.com for daily and most recent month-end performance updates.
Performance results may reflect any voluntary waivers or reimbursement of fund expenses by the advisor or its affiliates. Absent these waivers or reimbursement arrangements, performance results would have been lower. All results shown assume reinvestment of distributions.
The table and chart do not reflect the deduction of taxes that a shareholder would pay on fund distributions or the redemption of fund shares.
Average annual total return as of January 31, 2007 (%)
| Inception | 6-month | 1-year | Life (cumulative) | ||||||||||||||||
| CMG Large Cap Value Fund | 09/10/03 | 12.12 | 14.53 | 14.42 | |||||||||||||||
| Russell 1000 Value Index | 13.43 | 19.18 | 17.42 | ||||||||||||||||
Average annual total return as of December 31, 2006 (%)
| Inception | 6-month | 1-year | Life (cumulative) | ||||||||||||||||
| CMG Large Cap Value Fund | 09/10/03 | 11.67 | 17.55 | 14.39 | |||||||||||||||
| Russell 1000 Value Index | 14.72 | 22.25 | 17.45 | ||||||||||||||||
Index performance is from September 10, 2003.
Growth of a $3,000,000 investment, September 10, 2003 to January 31, 2007
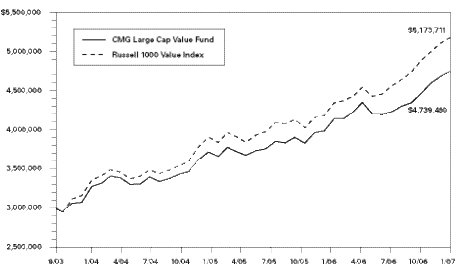
The chart above shows the growth in value of a hypothetical minimum initial $3,000,000 investment in the fund compared to the index during the stated time period.
The Russell 1000 Value Index measures the performance of those Russell 1000 Index companies with lower price-to-book ratios and lower forecasted growth values. Indices are not investments, do not incur fees or expenses and are not professionally managed. It is not possible to invest directly in an index. Securities in the fund may not match those in an index
13
UNDERSTANDING YOUR EXPENSES – CMG Large Cap Value Fund
As a fund shareholder, you incur two types of costs. There are transaction costs and also ongoing costs, which generally include investment advisory fees and other fund expenses. The information on this page is intended to help you understand your ongoing costs of investing in the fund and to compare these costs with the ongoing costs of investing in other mutual funds.
Analyzing your fund's expenses
To illustrate these ongoing costs, we have provided an example and calculated the expenses paid by investors during the reporting period. The information in the following table is based on an initial investment of $1,000, which is invested at the beginning of the reporting period and held for the entire period. Expense information is calculated two ways and each method provides you with different information. The amount listed in the "actual" column is calculated using the fund's actual operating expenses and total return for the period. The amount listed in the "hypothetical" column assumes that the return each year is 5% before expenses and is calculated based on the fund's actual operating expenses. You should not use the hypothetical account values and expenses to estimate either your actual account balance at the end of the period or the expenses you paid during this reporting period.
Estimating your actual expenses
To estimate the expenses that you paid over the period, first you will need your account balance at the end of the period:
1. Divide your ending account balance by $1,000. For example, if an account balance was $8,600 at the end of the period, the result would be 8.6.
2. In the section of the table below titled "Expenses paid during the period," locate the amount under "actual." Multiply this number by the result from step 1. Your answer is an estimate of the expenses you paid on your account during the period.
August 1, 2006 – January 31, 2007
| Account value at the beginning of the period ($) | Account value at the end of the period ($) | Expenses paid during the period ($) | Fund's annualized expense ratio (%) | ||||||||||||||||||||||||
| Actual | Hypothetical | Actual | Hypothetical | Actual | Hypothetical | Actual | |||||||||||||||||||||
| 1,000.00 | 1,000.00 | 1,121.19 | 1,022.68 | 2.67 | 2.55 | 0.50 | |||||||||||||||||||||
Expenses paid during the period are equal to the fund's annualized expense ratio of 0.50%, multiplied by the average account value over the period, then multiplied by the number of days in the fund's most recent fiscal half-year and divided by 365.
Had the investment advisor and/or any of its affiliates not reimbursed a portion of expenses, account value at the end of the period would have been reduced.
It is important to note that the expense amounts shown in the table are meant to highlight only ongoing costs of investing in the fund and do not reflect any transaction costs, such as sales charges, redemption or exchange fees. Therefore, the hypothetical examples provided may not help you determine the relative total costs of owning shares of different funds. If these transaction costs were included, your costs would have been higher.
14
Compare with other funds
Since all mutual funds are required to include the same hypothetical calculations about expenses in shareholder reports, you can use this information to compare the ongoing cost of investing in the fund with other funds. To do so, compare the 5% hypothetical example with the 5% hypothetical examples that appear in the shareholder reports of other funds. As you compare hypothetical examples of other funds, it is important to note that hypothetical examples are meant to highlight the ongoing costs of investing in a fund and do not reflect any transaction costs, such as sales charges or redemption or exchange fees.
15
Performance data quoted represents past performance and current performance may be lower or higher. Past performance is no guarantee of future results. The investment return and principal value will fluctuate so that shares, when redeemed, may be worth more or less than the original cost. Please visit www.columbiamanagement.com for daily and most recent month-end performance updates.
CMG MID CAP GROWTH FUND
A Portfolio of Columbia Funds Institutional Trust
FUND PROFILE
Summary
• For the six-month period ended January 31, 2007, CMG Mid Cap Growth Fund returned 14.84%. The fund trailed its benchmark, the Russell Midcap Growth Index,1 which returned 15.98%, but came out ahead of the 14.07% average return of its peer group, the Morningstar Mid-Cap Growth Category,2 for the same period. Stock selection, particularly in the telecommunications services and industrials sectors, contributed positively to performance. Health care and consumer discretionary investments were disappointing.
• An overweight in the telecommunications services sector, particularly, wireless telecom services, drove returns. Standouts included Millicom International Cellular SA (0.4% of net assets), a wireless service provider benefiting from better-than-expected subscriber growth and usage in Vietnam and Pakistan. In industrials, the fund had more exposure than the index to the aerospace and defense industry, which aided returns because the group did well during the period. Aerospace and defense companies benefited from growth in emerging markets and spending in developed countries to refurbish aging fleets. Stock selection among air freight, logistics and marine companies was also positive. Elsewhere, top performers included MEMC Electronic Materials (1.1% of net assets), a company that supplies poly silicon for the manufacture of semiconductor wafers and solar panels.
Health care stock selection was disappointing, largely because the fund did not own enough of the top performing names in the index. An underweighting in Forest Laboratories (0.4% of net assets) was especially costly, as solid prescription growth for key drugs that treat depression, hypertension and Alzheimer's disease propelled the stock higher. In the consumer discretionary sector, Nutri/System (0.4% of net assets), a weight loss company, sagged as increased advertising expenditures worried investors.
1 The Russell Midcap Growth Index measures the performance of those Russell Midcap companies with higher price-to-book ratios and higher forecasted growth values. Indices are not investments, do not incur fees or expenses and are not professionally managed. It is not possible to invest directly in an index. Securities in the fund may not match those in an index.
2 ©2007 by Morningstar, Inc. All rights reserved. The information contained herein is the proprietary information of Morningstar, Inc., may not be copied or redistributed for any purpose and may only be used for noncommercial, personal purposes. The information contained herein is not represented or warranted to be accurate, correct, complete or timely. Morningstar, Inc. shall not be responsible for investment decisions, damages or other losses resulting from the use of this information. Past performance is no guarantee of future performance. Morningstar, Inc. has not granted consent for it to be considered or deemed an "expert" under the Securities Act of 1933. Morningstar Categories compare the performance of funds with similar investment objectives and strategies.
16
• By the end of the period, we had positioned the portfolio for slowing economic growth by trimming its exposure to cyclical, industrial and material stocks as well as certain energy stocks. We added to stakes in the consumer staples, health care and telecommunications services sectors. Going forward, we plan to continue to screen the investment universe for growth companies we believe are attractively valued with strong business models, rising profit margins and improving returns on capital.
Thank you for investing in CMG Mid Cap Growth Fund.
Portfolio Management
Wayne M. Collette has co-managed the CMG Mid Cap Growth Fund since February 2006 and has been with the advisor or its predecessors or affiliate organizations since 2001.
George J. Myers has co-managed the fund since February 2006 and has been with the advisor or its predecessors or affiliate organizations since 2004.
The fund's top ten holdings (as a percentage of net assets) as of January 31, 2007 were:
| (%) | |||||||
| Coach | 1.9 | ||||||
| Cognizant Technology Solutions | 1.4 | ||||||
| American Tower | 1.3 | ||||||
| Nordstrom | 1.2 | ||||||
| MEMC Electronic Materials | 1.1 | ||||||
| Allergan | 1.1 | ||||||
| NII Holdings | 1.1 | ||||||
| Affiliated Managers Group | 1.1 | ||||||
| Leap Wireless International | 1.1 | ||||||
| J.C. Penney | 1.0 | ||||||
Holdings are calculated as a percentage of net assets, and are subject to change. Because the fund is actively managed, there is no guarantee the fund will continue to maintain the holdings breakdown listed. The fund's holdings and their weights within the portfolio may change as market conditions change.
Equity investments are affected by stock market fluctuations that occur in response to economic and business developments.
Investing in growth stocks incurs the possibility of losses because their prices are sensitive to changes in current or expected earnings.
Investing in mid-cap stocks may present special risks, including possible illiquidity and greater price volatility than stocks of larger, more established companies.
17
Performance data quoted represents past performance and current performance may be lower or higher. Past performance is no guarantee of future results. The investment return and principal value will fluctuate so that shares, when redeemed, may be worth more or less than the original cost. Please visit www.columbiamanagement.com for daily and most recent month-end performance updates.
Performance results reflect any voluntary waivers or reimbursement of fund expenses by the advisor or its affiliates. Absent these waivers or reimbursement arrangements, performance results would have been lower. All results shown assume reinvestment of distributions.
The table and chart do not reflect the deduction of taxes that a shareholder would pay on fund distributions or the redemption of fund shares.
Average annual total return as of January 31, 2007 (%)
| Inception | 6-month | 1-year | Life (cumulative) | ||||||||||||||||
| CMG Mid Cap Growth Fund | 05/05/03 | 14.84 | 6.52 | 16.40 | |||||||||||||||
| Russell Midcap Growth Index | 15.98 | 8.20 | 19.24 | ||||||||||||||||
Average annual total return as of December 31, 2006 (%)
| Inception | 6-month | 1-year | Life (cumulative) | ||||||||||||||||
| CMG Mid Cap Growth Fund | 05/05/03 | 6.62 | 11.85 | 15.76 | |||||||||||||||
| Russell Midcap Growth Index | 7.90 | 10.66 | 18.56 | ||||||||||||||||
Index performance is from May 5, 2003.
Growth of a $3,000,000 investment, May 5, 2003 to January 31, 2007
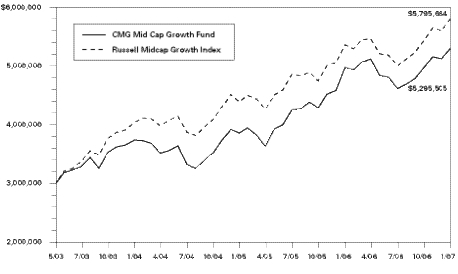
The chart above shows the growth in value of a hypothetical minimum initial $3,000,000 investment in the fund compared to the index during the stated time period.
The Russell Midcap Growth Index measures the performance of those Russell Midcap companies with higher price-to-book ratios and higher forecasted growth values. Indices are not investments, do not incur fees or expenses and are not professionally managed. It is not possible to invest directly in an index. Securities in the fund may not match those in an index
18
UNDERSTANDING YOUR EXPENSES – CMG Mid Cap Growth Fund
As a fund shareholder, you incur two types of costs. There are transaction costs and also ongoing costs, which generally include investment advisory fees and other fund expenses. The information on this page is intended to help you understand your ongoing costs of investing in the fund and to compare these costs with the ongoing costs of investing in other mutual funds.
Analyzing your fund's expenses
To illustrate these ongoing costs, we have provided an example and calculated the expenses paid by investors during the reporting period. The information in the following table is based on an initial investment of $1,000, which is invested at the beginning of the reporting period and held for the entire period. Expense information is calculated two ways and each method provides you with different information. The amount listed in the "actual" column is calculated using the fund's actual operating expenses and total return for the period. The amount listed in the "hypothetical" column assumes that the return each year is 5% before expenses and is calculated based on the fund's actual operating expenses. You should not use the hypothetical account values and expenses to estimate either your actual account balance at the end of the period or the expenses you paid during this reporting period.
Estimating your actual expenses
To estimate the expenses that you paid over the period, first you will need your account balance at the end of the period:
1. Divide your ending account balance by $1,000. For example, if an account balance was $8,600 at the end of the period, the result would be 8.6.
2. In the section of the table below titled "Expenses paid during the period," locate the amount under "actual." Multiply this number by the result from step 1. Your answer is an estimate of the expenses you paid on your account during the period.
August 1, 2006 – January 31, 2007
| Account value at the beginning of the period ($) | Account value at the end of the period ($) | Expenses paid during the period ($) | Fund's annualized expense ratio (%) | ||||||||||||||||||||||||
| Actual | Hypothetical | Actual | Hypothetical | Actual | Hypothetical | Actual | |||||||||||||||||||||
| 1,000.00 | 1,000.00 | 1,148.41 | 1,021.68 | 3.79 | 3.57 | 0.70 | |||||||||||||||||||||
Expenses paid during the period are equal to the fund's annualized expense ratio of 0.70%, multiplied by the average account value over the period, then multiplied by the number of days in the fund's most recent fiscal half-year and divided by 365.
Had the investment advisor and/or any of its affiliates not reimbursed a portion of expenses, account value at the end of the period would have been reduced.
It is important to note that the expense amounts shown in the table are meant to highlight only ongoing costs of investing in the fund and do not reflect any transaction costs, such as sales charges, redemption or exchange fees. Therefore, the hypothetical examples provided may not help you determine the relative total costs of owning shares of different funds. If these transaction costs were included, your costs would have been higher.
19
Compare with other funds
Since all mutual funds are required to include the same hypothetical calculations about expenses in shareholder reports, you can use this information to compare the ongoing cost of investing in the fund with other funds. To do so, compare the 5% hypothetical example with the 5% hypothetical examples that appear in the shareholder reports of other funds. As you compare hypothetical examples of other funds, it is important to note that hypothetical examples are meant to highlight the ongoing costs of investing in a fund and do not reflect any transaction costs, such as sales charges or redemption or exchange fees.
20
Performance data quoted represents past performance and current performance may be lower or higher. Past performance is no guarantee of future results. The investment return and principal value will fluctuate so that shares, when redeemed, may be worth more or less than the original cost. Please visit www.columbiamanagement.com for daily and most recent month-end performance updates.
CMG MID CAP VALUE FUND
A Portfolio of Columbia Funds Institutional Trust
FUND PROFILE
Summary
• For the six-month period ended January 31, 2007, CMG Mid Cap Value returned 14.66%. The fund's benchmark, the Russell Midcap Value Index,1 returned 16.45% for the period. The average return of the fund's peer group, the Morningstar Mid-Cap Value Category, was 14.79%.2 Stock selection within the technology, energy, financial and utilities sectors aided performance while industrial and health care holdings hampered the fund's return.
• Strong performance from the fund's financial and utilities holdings were the primary force behind the fund's returns. A little over one-quarter of the fund's assets are invested in the financial sector. Within that group, real estate investment trusts (REITs), where we focused on nonresidential companies in capacity-constrained markets we consider desirable, generated strong performance. Over the past two years, mergers and acquisitions and privatization activity within the group has totaled over $103 billion, which has made many REITs attractive takeover candidates. In this regard, Equity Office Properties, General Growth Properties (0.5% and 1.7% of net assets, respectively) and Boston Properties (0.7% of net assets) all benefited, generating gains of 29% plus. We reduced our position in Equity Office Properties after it announced it would be acquired by Blackstone Group and trimmed the fund's position in Bos ton Properties after the stock reached our price target. We added a position in Plum Creek Timber (0.7% of net assets), which we believe could benefit from an upturn in the housing cycle.
The fund's energy, health care and consumer staples investments were laggards during the period. In health care, Hospira (0.9% of net assets), a medical specialties company, declined 14% following an announcement that gross margins had declined and that earnings were even lower than analysts had estimated.
1 The Russell Midcap Value Index measures the performance of those Russell Midcap Index companies with lower price-to-book ratios and lower forecasted growth values. The stocks are also members of the Russell 1000 Value Index. Indices are not investments, do not incur fees or expenses and are not professionally managed. It is not possible to invest directly in an index. Securities in the fund may not match those in an index.
2 ©2007 by Morningstar, Inc. All rights reserved. The information contained herein is the proprietary information of Morningstar, Inc., may not be copied or redistributed for any purpose and may only be used for noncommercial, personal purposes. The information contained herein is not represented or warranted to be accurate, correct, complete or timely. Morningstar, Inc. shall not be responsible for investment decisions, damages or other losses resulting from the use of this information. Past performance is no guarantee of future performance. Morningstar, Inc. has not granted consent for it to be considered or deemed an "expert" under the Securities Act of 1933. Morningstar Categories compare the performance of funds with similar investment objectives and strategies.
21
As companies within the portfolio peaked at our estimate of full valuation, we reduced the fund's exposure to cyclically-driven companies and added less to cyclically reliant areas. Late in the period, we added positions within homebuilding, consumer products and energy service, where we saw the potential for opportunity.
• In managing the fund, we plan to remain attentive to the economic landscape, both here and abroad, as well as business factors, such as prospects for consumer-related sectors and operating margins. We plan to continue to seek out companies that demonstrate the potential for incremental operating improvements and efficiencies that allow top-line revenue growth to improve their bottom-line results.
We appreciate your continued confidence in CMG Mid Cap Value Fund.
Portfolio Management
Diane L. Sobin has co-managed the CMG Mid Cap Value Fund since September 2004 and has been with the advisor or its predecessors or affiliate organizations since 2001.
Lori J. Ensinger has co-managed the fund since September 2004 and has been with the advisor or its predecessors or affiliate organizations since 2001.
David I. Hoffman has co-managed the fund since September 2004 and has been with the advisor or its predecessors or affiliate organizations since 2001.
Noah J. Petrucci has co-managed the fund since September 2004 and has been with the advisor or its predecessors or affiliate organizations since 2002.
The fund's top ten holdings (as a percentage of net assets) as of January 31, 2007 were:
| (%) | |||||||
| PG&E | 2.1 | ||||||
| Entergy | 1.8 | ||||||
| General Growth Properties | 1.7 | ||||||
| Ambac Financial Group | 1.7 | ||||||
| Edison International | 1.6 | ||||||
| Kroger | 1.6 | ||||||
| Hess | 1.5 | ||||||
| PPL | 1.5 | ||||||
| CIT Group | 1.5 | ||||||
| Comerica | 1.4 | ||||||
Holdings are calculated as a percentage of net assets, and are subject to change. Because the fund is actively managed, there is no guarantee the fund will continue to maintain the holdings breakdown listed. The fund's holdings and their weights within the portfolio may change as market conditions change.
Equity investments are affected by stock market fluctuations that occur in response to economic and business developments.
22
Investing in mid-cap stocks may present special risks, including possible illiquidity and greater price volatility than stocks of larger, more established companies.
Value stocks are stocks of companies that may have experienced adverse business or industry developments or may be subject to special risks that have caused the stocks to be out of favor and, in the advisor's opinion, undervalued. If the advisor's assessment of a company's prospects is wrong, the price of the company's stock may not approach the value the advisor has placed on it.
23
Performance data quoted represents past performance and current performance may be lower or higher. Past performance is no guarantee of future results. The investment return and principal value will fluctuate so that shares, when redeemed, may be worth more or less than the original cost. Please visit www.columbiamanagement.com for daily and most recent month-end performance updates.
Performance results reflect any voluntary waivers or reimbursement of fund expenses by the advisor or its affiliates. Absent these waivers or reimbursement arrangements, performance results would have been lower. All results shown assume reinvestment of distributions.
The table and chart do not reflect the deduction of taxes that a shareholder would pay on fund distributions or the redemption of fund shares.
Average annual total return as of January 31, 2007 (%)
| Inception | 6-month (cumulative) | 1-year | Life | ||||||||||||||||
| CMG Mid Cap Value Fund | 05/05/03 | 14.66 | 15.16 | 19.20 | |||||||||||||||
| Russell Midcap Value Index | 16.45 | 18.77 | 24.56 | ||||||||||||||||
Average annual total return as of December 31, 2006 (%)
| Inception | 6-month (cumulative) | 1-year | Life | ||||||||||||||||
| CMG Mid Cap Value Fund | 05/05/03 | 10.55 | 17.29 | 18.68 | |||||||||||||||
| Russell Midcap Value Index | 12.33 | 20.22 | 24.17 | ||||||||||||||||
Index performance is from May 5, 2003.
Growth of a $3,000,000 investment, May 5, 2003 to January 31, 2007
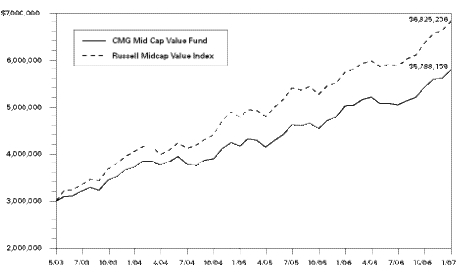
The chart above shows the growth in value of a hypothetical minimum initial $3,000,000 investment in the fund compared to the index during the stated time period.
The Russell Midcap Value Index measures the performance of those Russell Midcap Index companies with lower price-to-book ratios and lower forecasted growth values. The stocks are also members of the Russell 1000 Value Index. Indices are not investments, do not incur fees or expenses and are not professionally managed. It is not possible to invest directly in indices. Securities in the fund may not match those in an index.
24
UNDERSTANDING YOUR EXPENSES – CMG Mid Cap Value Fund
As a fund shareholder, you incur two types of costs. There are transaction costs and also ongoing costs, which generally include investment advisory fees and other fund expenses. The information on this page is intended to help you understand your ongoing costs of investing in the fund and to compare these costs with the ongoing costs of investing in other mutual funds.
Analyzing your fund's expenses
To illustrate these ongoing costs, we have provided an example and calculated the expenses paid by investors during the reporting period. The information in the following table is based on an initial investment of $1,000, which is invested at the beginning of the reporting period and held for the entire period. Expense information is calculated two ways and each method provides you with different information. The amount listed in the "actual" column is calculated using the fund's actual operating expenses and total return for the period. The amount listed in the "hypothetical" column assumes that the return each year is 5% before expenses and is calculated based on the fund's actual operating expenses. You should not use the hypothetical account values and expenses to estimate either your actual account balance at the end of the period or the expenses you paid during this reporting period.
Estimating your actual expenses
To estimate the expenses that you paid over the period, first you will need your account balance at the end of the period:
1. Divide your ending account balance by $1,000. For example, if an account balance was $8,600 at the end of the period, the result would be 8.6.
2. In the section of the table below titled "Expenses paid during the period," locate the amount under "actual." Multiply this number by the result from step 1. Your answer is an estimate of the expenses you paid on your account during the period.
August 1, 2006 – January 31, 2007
| Account value at the beginning of the period ($) | Account value at the end of the period ($) | Expenses paid during the period ($) | Fund's annualized expense ratio (%) | ||||||||||||||||||||||||
| Actual | Hypothetical | Actual | Hypothetical | Actual | Hypothetical | Actual | |||||||||||||||||||||
| 1,000.00 | 1,000.00 | 1,146.60 | 1,021.68 | 3.79 | 3.57 | 0.70 | |||||||||||||||||||||
Expenses paid during the period are equal to the fund's annualized expense ratio of 0.70%, multiplied by the average account value over the period, then multiplied by the number of days in the fund's most recent fiscal half-year and divided by 365.
Had the investment advisor and/or any of its affiliates not reimbursed a portion of expenses, account value at the end of the period would have been reduced.
It is important to note that the expense amounts shown in the table are meant to highlight only ongoing costs of investing in the fund and do not reflect any transaction costs, such as sales charges, redemption or exchange fees. Therefore, the hypothetical examples provided may not help you determine the relative total costs of owning shares of different funds. If these transaction costs were included, your costs would have been higher.
25
Compare with other funds
Since all mutual funds are required to include the same hypothetical calculations about expenses in shareholder reports, you can use this information to compare the ongoing cost of investing in the fund with other funds. To do so, compare the 5% hypothetical example with the 5% hypothetical examples that appear in the shareholder reports of other funds. As you compare hypothetical examples of other funds, it is important to note that hypothetical examples are meant to highlight the ongoing costs of investing in a fund and do not reflect any transaction costs, such as sales charges or redemption or exchange fees.
26
Performance data quoted represents past performance and current performance may be lower or higher. Past performance is no guarantee of future results. The investment return and principal value will fluctuate so that shares, when redeemed, may be worth more or less than the original cost. Please visit www.columbiamanagement.com for daily and most recent month-end performance updates.
CMG SMALL CAP GROWTH FUND
A Portfolio of Columbia Funds Institutional Trust
FUND PROFILE
Summary
• For the six-month period ended January 31, 2007, CMG Small Cap Growth Fund returned 14.51%. For the same period, the fund's benchmarks, the Russell 2000 Growth Index1 and Russell 2000 Index1, returned 14.81% and 14.95%, respectively. The average return of its peer group, the Morningstar Small Growth Category, was 13.45%.2 The fund benefited from strong stock selection, particularly in the industrials, financials and energy sectors. Consumer discretionary returns detracted from relative performance, largely because the fund did not own certain restaurant stocks that performed especially well.
• Industrials gave a boost to returns, fueled by aerospace and defense stocks that benefited from strong growth in emerging markets and the refurbishing of aging fleets in developed countries. In addition, Huron Consulting Group (1.7% of net assets), an industrial company that provides consulting services to the health care, academic and legal industries, rallied amid growing demand. In financials, our focus was on capital markets companies, which gained from the increased use of alternative investment instruments. Energy stocks further aided returns, as the oil companies the fund owned held up amid declining commodity prices. Top contributors also included Allscripts Healthcare Solutions (1.2% of net assets), a health care technology company that provides doctors with electronic recordkeeping for patient care.
Consumer discretionary returns suffered as Christopher & Banks (0.3% of net assets), a women's clothing retailer, declined sharply after a weak holiday season. Detractors elsewhere included HealthExtras (0.8% of net assets), a pharmaceutical benefit management company that faltered amid industry pricing concerns.
1 The Russell 2000 Growth Index measures the performance of those Russell 2000 Index companies with higher price-to-book ratios and higher forecasted growth values. The Russell 2000 Index tracks the performance of the 2,000 smallest of the 3,000 largest U.S. companies based on market capitalization. Indices are not investments, do not incur fees or expenses and are not professionally managed. It is not possible to invest directly in an index. Securities in the fund may not match those in an index.
2 ©2007 by Morningstar, Inc. All rights reserved. The information contained herein is the proprietary information of Morningstar, Inc., may not be copied or redistributed for any purpose and may only be used for noncommercial, personal purposes. The information contained herein is not represented or warranted to be accurate, correct, complete or timely. Morningstar, Inc. shall not be responsible for investment decisions, damages or other losses resulting from the use of this information. Past performance is no guarantee of future performance. Morningstar, Inc. has not granted consent for it to be considered or deemed an "expert" under the Securities Act of 1933. Morningstar Categories compare the performance of funds with similar investment objectives and strategies.
27
• By period end, we had positioned the fund for slowing economic growth by trimming its exposure to cyclical, industrial and material stocks as well as certain energy stocks. We added to stakes in the consumer staples, health care and telecommunications services sectors. Going forward, we plan to continue to screen the investment universe for growth companies that we believe are attractively valued with strong business models, rising profit margins and improving returns on capital.
Thank you for investing in CMG Small Cap Growth Fund.
Portfolio Management
Wayne M. Collette has co-managed the CMG Small Cap Growth Fund since February 2006 and has been with the advisor or its predecessors or affiliate organizations since 2001.
George J. Myers has co-managed the fund since February 2006 and has been with the advisor or its predecessors or affiliate organizations since 2004.
The fund's top ten holdings (as a percentage of net assets) as of January 31, 2007 were:
| (%) | |||||||
| Huron Consulting Group | 1.7 | ||||||
| ICON | 1.7 | ||||||
| Allscripts Healthcare Solutions | 1.2 | ||||||
| BE Aerospace | 1.1 | ||||||
| GameStop | 1.1 | ||||||
| SBA Communications | 1.1 | ||||||
| General Cable | 1.1 | ||||||
| Euronet Worldwide | 1.1 | ||||||
| Resources Connection | 1.1 | ||||||
| Affiliated Managers Group | 1.0 | ||||||
Holdings are calculated as a percentage of net assets, and are subject to change. Because the fund is actively managed, there is no guarantee the fund will continue to maintain the holdings breakdown listed. The fund's holdings and their weights within the portfolio may change as market conditions change.
Equity investments are affected by stock market fluctuations that occur in response to economic and business developments.
Investing in growth stocks incurs the possibility of losses because their prices are sensitive to changes in current or expected earnings.
Investments in small-cap stocks may be subject to greater volatility and price fluctuations because they may be thinly traded and less liquid than investments in larger companies.
28
Performance data quoted represents past performance and current performance may be lower or higher. Past performance is no guarantee of future results. The investment return and principal value will fluctuate so that shares, when redeemed, may be worth more or less than the original cost. Please visit www.columbiamanagement.com for daily and most recent month-end performance updates.
Performance results reflect any voluntary waivers or reimbursement of fund expenses by the advisor or its affiliates. Absent these waivers or reimbursement arrangements, performance results would have been lower. All results shown assume reinvestment of distributions.
The table and chart do not reflect the deduction of taxes that a shareholder would pay on fund distributions or the redemption of fund shares.
Average annual total return as of January 31, 2007 (%)
| Inception | 6-month (cumulative) | 1-year | 5-year | 10-year | |||||||||||||||||||
| CMG Small Cap Growth Fund | 08/30/89 | 14.51 | 7.62 | 11.19 | 10.59 | ||||||||||||||||||
| Russell 2000 Index | 14.95 | 10.44 | 11.99 | 9.40 | |||||||||||||||||||
| Russell 2000 Growth Index | 14.81 | 5.30 | 8.10 | 4.81 | |||||||||||||||||||
Average annual total return as of December 31, 2006 (%)
| Inception | 6-month (cumulative) | 1-year | 5-year | 10-year | |||||||||||||||||||
| CMG Small Cap Growth Fund | 08/30/89 | 4.66 | 15.93 | 9.86 | 10.73 | ||||||||||||||||||
| Russell 2000 Index | 9.38 | 18.37 | 11.39 | 9.44 | |||||||||||||||||||
| Russell 2000 Growth Index | 6.86 | 13.35 | 6.93 | 4.88 | |||||||||||||||||||
Growth of a $3,000,000 investment, February 1, 1997 to January 31, 2007
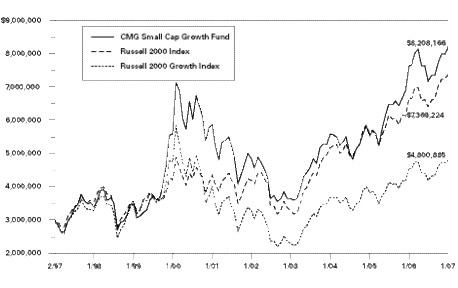
29
The chart above shows the growth in value of a hypothetical minimum initial $3,000,000 investment in the fund compared to the indices during the period.
The Russell 2000 Index tracks the performance of the 2,000 smallest of the 3,000 largest U.S. companies based on market capitalization. The Russell 2000 Growth Index measures the performance of those Russell 2000 Index companies with higher price-to-book ratios and higher forecasted growth values. Indices are not investments, do not incur fees or expenses and are not professionally managed. It is not possible to invest directly in indices. Securities in the fund may not match those in an index.
30
UNDERSTANDING YOUR EXPENSES — CMG Small Cap Growth Fund
As a fund shareholder, you incur two types of costs. There are transaction costs and also ongoing costs, which generally include investment advisory fees and other fund expenses. The information on this page is intended to help you understand your ongoing costs of investing in the fund and to compare these costs with the ongoing costs of investing in other mutual funds.
Analyzing your fund's expenses
To illustrate these ongoing costs, we have provided an example and calculated the expenses paid by investors during the reporting period. The information in the following table is based on an initial investment of $1,000, which is invested at the beginning of the reporting period and held for the entire period. Expense information is calculated two ways and each method provides you with different information. The amount listed in the "actual" column is calculated using the fund's actual operating expenses and total return for the period. The amount listed in the "hypothetical" column assumes that the return each year is 5% before expenses and is calculated based on the fund's actual operating expenses. You should not use the hypothetical account values and expenses to estimate either your actual account balance at the end of the period or the expenses you paid during this reporting period.
Estimating your actual expenses
To estimate the expenses that you paid over the period, first you will need your account balance at the end of the period:
1. Divide your ending account balance by $1,000. For example, if an account balance was $8,600 at the end of the period, the result would be 8.6.
2. In the section of the table below titled "Expenses paid during the period," locate the amount under "actual." Multiply this number by the result from step 1. Your answer is an estimate of the expenses you paid on your account during the period.
August 1, 2006 – January 31, 2007
| Account value at the beginning of the period ($) | Account value at the end of the period ($) | Expenses paid during the period ($) | Fund's annualized expense ratio (%) | ||||||||||||||||||||||||
| Actual | Hypothetical | Actual | Hypothetical | Actual | Hypothetical | Actual | |||||||||||||||||||||
| 1,000.00 | 1,000.00 | 1,145.08 | 1,021.17 | 4.33 | 4.08 | 0.80 | |||||||||||||||||||||
Expenses paid during the period are equal to the fund's annualized expense ratio of 0.80%, multiplied by the average account value over the period, then multiplied by the number of days in the fund's most recent fiscal half-year and divided by 365.
Had the investment advisor and/or any of its affiliates not reimbursed a portion of expenses, account value at the end of the period would have been reduced.
It is important to note that the expense amounts shown in the table are meant to highlight only ongoing costs of investing in the fund and do not reflect any transaction costs, such as sales charges, redemption or exchange fees. Therefore, the hypothetical examples provided may not help you determine the relative total costs of owning shares of different funds. If these transaction costs were included, your costs would have been higher.
31
Compare with other funds
Since all mutual funds are required to include the same hypothetical calculations about expenses in shareholder reports, you can use this information to compare the ongoing cost of investing in the fund with other funds. To do so, compare the 5% hypothetical example with the 5% hypothetical examples that appear in the shareholder reports of other funds. As you compare hypothetical examples of other funds, it is important to note that hypothetical examples are meant to highlight the ongoing costs of investing in a fund and do not reflect any transaction costs, such as sales charges or redemption or exchange fees.
32
Performance data quoted represents past performance and current performance may be lower or higher. Past performance is no guarantee of future results. The investment return and principal value will fluctuate so that shares, when redeemed, may be worth more or less than the original cost. Please visit www.columbiamanagement.com for daily and most recent month-end performance updates.
CMG SMALL CAP VALUE FUND
A Portfolio of Columbia Funds Institutional Trust
FUND PROFILE
Summary
• For the six-month period ended January 31, 2007, CMG Small Cap Value Fund returned 13.79%. The fund trailed both of its benchmarks, the Russell 2000 Value Index and the Russell 2000 Index1, which returned 15.08% and 14.95%, respectively. However, its return was higher than the average return of its peer group, the Morningstar Small Value Category, which was 13.37% over the same period.2 Recognizing that the fund is compared against two indices, the following discussion relates to performance measured against the Russell 2000 Value Index. Small-cap stocks rallied in the second half of 2006, led by some of the smallest and lowest-quality small-cap stocks. The fund's focus on financially strong companies caused the fund to lag the index. However, we believe that a slight bias toward smaller stocks within the fund's universe and an adherence to a strict value discipline helped the fund outperf orm its peer group average.
• Financials and industrials aided performance. Strong stock selection among commercial banks and insurers along with a lack of exposure to thrifts—primarily savings and loan organizations and savings banks—gave the biggest boost to returns in the financials sector. On the industrials side, we focused on capital goods and aerospace and defense companies, which did quite well for the period. Among the standouts were Cash America International (1.0% of net assets), a pawn shop operator that benefited from increased gold prices, and KHD Humboldt Wedag International (1.2% of net assets), a multi-national industrial services company, which experienced strong growth in Eastern Europe and Asia.
Returns from health care and energy stocks were disappointing. In health care, the fund did not own the lower-quality stocks that were the period's best performers. In addition, our emphasis on companies that manage health-care facilities and offer medical services hampered returns. Both were pressured by concerns that lower reimbursement rates would hurt pricing and revenues. Energy stocks declined, hampered by coal and energy service investments that were weak performers.
1 The Russell 2000 Value Index tracks the performance of those Russell 2000 Index companies with lower price-to-book ratios and lower forecasted growth values. The Russell 2000 Index tracks the performance of the 2,000 smallest of the 3,000 largest U.S. companies based on market capitalization. Indices are not investments, do not incur fees or expenses and are not professionally managed. It is not possible to invest directly in indices. Securities in the fund may not match those in an index.
2 ©2007 by Morningstar, Inc. All rights reserved. The information contained herein is the proprietary information of Morningstar, Inc., may not be copied or redistributed for any purpose and may only be used for noncommercial, personal purposes. The information contained herein is not represented or warranted to be accurate, correct, complete or timely. Morningstar, Inc. shall not be responsible for investment decisions, damages or other losses resulting from the use of this information. Past performance is no guarantee of future performance. Morningstar, Inc. has not granted consent for it to be considered or deemed an "expert" under the Securities Act of 1933. Morningstar Categories compare the performance of funds with similar investment objectives and strategies.
33
• Despite several years of strong gains, we expect small-cap value stocks to keep up with the broader market as long as credit remains available at reasonable rates and the economy continues to grow. We plan to continue to focus on financially strong companies with above average stakes in industrials and health care, where we continue to find ample opportunities that meet our investment criteria.
Thank you for investing in CMG Small Cap Value Fund.
Portfolio Management
Stephen Barbaro has managed or co-managed the CMG Small Cap Value Fund since the fund's inception and has been with the advisor or its predecessors or affiliate organizations since 1976.
Jeremy Javidi has co-managed the fund since August 2005 and has been with the advisor or its predecessors or affiliate organizations since January 2000.
The fund's top ten holdings (as a percentage of net assets) as of January 31, 2007 were:
| (%) | |||||||
| Precision Castparts | 1.3 | ||||||
| KHD Humboldt Wedag International | 1.2 | ||||||
| Greif | 1.1 | ||||||
| Pediatrix Medical Group | 1.0 | ||||||
| Harsco | 1.0 | ||||||
| Cash America International | 1.0 | ||||||
| MPS Group | 0.9 | ||||||
| Eagle Materials | 0.9 | ||||||
| Consolidated Graphics | 0.8 | ||||||
| Navigators Group | 0.8 | ||||||
Holdings are calculated as a percentage of net assets, and are subject to change. Because the fund is actively managed, there is no guarantee the fund will continue to maintain the holdings breakdown listed. The fund's holdings and their weights within the portfolio may change as market conditions change.
Equity investments are affected by stock market fluctuations that occur in response to economic and business developments.
Investments in small-cap stocks may be subject to greater volatility and price fluctuations because they may be thinly traded and less liquid than investments in larger companies.
Value stocks are stocks of companies that may have experienced adverse business or industry developments or may be subject to special risks that have caused the stocks to be out of favor and, in the advisor's opinion, undervalued. If the advisor's assessment of a company's prospects is wrong, the price of the company's stock may not approach the value the advisor has placed on it.
34
Performance data quoted represents past performance and current performance may be lower or higher. Past performance is no guarantee of future results. The investment return and principal value will fluctuate so that shares, when redeemed, may be worth more or less than the original cost. Please visit www.columbiamanagement.com for daily and most recent month-end performance updates.
Performance results reflect any voluntary waivers or reimbursement of fund expenses by the advisor or its affiliates. Absent these waivers or reimbursement arrangements, performance results would have been lower. All results shown assume reinvestment of distributions.
The table and chart do not reflect the deduction of taxes that a shareholder would pay on fund distributions or the redemption of fund shares.
Average annual total return as of January 31, 2007 (%)
| Inception | 6-month (cumulative) | 1-year | Life | ||||||||||||||||
| CMG Small Cap Value Fund | 05/05/03 | 13.79 | 12.25 | 22.77 | |||||||||||||||
| Russell 2000 Value Index | 15.08 | 15.76 | 23.48 | ||||||||||||||||
| Russell 2000 Index | 14.95 | 10.44 | 20.98 | ||||||||||||||||
Average annual total return as of December 31, 2006 (%)
| Inception | 6-month (cumulative) | 1-year | Life | ||||||||||||||||
| CMG Small Cap Value Fund | 05/05/03 | 9.53 | 20.01 | 22.90 | |||||||||||||||
| Russell 2000 Value Index | 11.81 | 23.48 | 23.58 | ||||||||||||||||
| Russell 2000 Index | 9.38 | 18.37 | 20.97 | ||||||||||||||||
Index performance is from May 5, 2003.
Growth of a $3,000,000 investment, May 5, 2003 to January 31, 2007
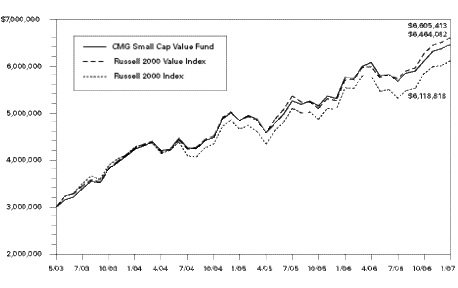
35
The chart above shows the growth in value of a hypothetical minimum initial $3,000,000 investment in the fund compared to the indices during the stated time period.
The Russell 2000 Value Index tracks the performance of those Russell 2000 Index companies with lower price-to-book ratios and lower forecasted growth values. The Russell 2000 Index tracks the performance of the 2,000 smallest of the 3,000 largest U.S. companies based on market capitalization. Indices are not investments, do not incur fees or expenses and are not professionally managed. It is not possible to invest directly in indices. Securities in the fund may not match those in an index.
36
UNDERSTANDING YOUR EXPENSES — CMG Small Cap Value Fund
As a fund shareholder, you incur two types of costs. There are transaction costs and also ongoing costs, which generally include investment advisory fees and other fund expenses. The information on this page is intended to help you understand your ongoing costs of investing in the fund and to compare these costs with the ongoing costs of investing in other mutual funds.
Analyzing your fund's expenses
To illustrate these ongoing costs, we have provided an example and calculated the expenses paid by investors during the reporting period. The information in the following table is based on an initial investment of $1,000, which is invested at the beginning of the reporting period and held for the entire period. Expense information is calculated two ways and each method provides you with different information. The amount listed in the "actual" column is calculated using the fund's actual operating expenses and total return for the period. The amount listed in the "hypothetical" column assumes that the return each year is 5% before expenses and is calculated based on the fund's actual operating expenses. You should not use the hypothetical account values and expenses to estimate either your actual account balance at the end of the period or the expenses you paid during this reporting period.
Estimating your actual expenses
To estimate the expenses that you paid over the period, first you will need your account balance at the end of the period:
1. Divide your ending account balance by $1,000. For example, if an account balance was $8,600 at the end of the period, the result would be 8.6.
2. In the section of the table below titled "Expenses paid during the period," locate the amount under "actual." Multiply this number by the result from step 1. Your answer is an estimate of the expenses you paid on your account during the period.
August 1, 2006 – January 31, 2007
| Account value at the beginning of the period ($) | Account value at the end of the period ($) | Expenses paid during the period ($) | Fund's annualized expense ratio (%) | ||||||||||||||||||||||||
| Actual | Hypothetical | Actual | Hypothetical | Actual | Hypothetical | Actual | |||||||||||||||||||||
| 1,000.00 | 1,000.00 | 1,137.92 | 1,021.17 | 4.31 | 4.08 | 0.80 | |||||||||||||||||||||
Expenses paid during the period are equal to the fund's annualized expense ratio of 0.80%, multiplied by the average account value over the period, then multiplied by the number of days in the fund's most recent fiscal half-year and divided by 365.
Had the investment advisor and/or any of its affiliates not reimbursed a portion of expenses, account value at the end of the period would have been reduced.
It is important to note that the expense amounts shown in the table are meant to highlight only ongoing costs of investing in the fund and do not reflect any transaction costs, such as sales charges, redemption or exchange fees. Therefore, the hypothetical examples provided may not help you determine the relative total costs of owning shares of different funds. If these transaction costs were included, your costs would have been higher.
37
Compare with other funds
Since all mutual funds are required to include the same hypothetical calculations about expenses in shareholder reports, you can use this information to compare the ongoing cost of investing in the fund with other funds. To do so, compare the 5% hypothetical example with the 5% hypothetical examples that appear in the shareholder reports of other funds. As you compare hypothetical examples of other funds, it is important to note that hypothetical examples are meant to highlight the ongoing costs of investing in a fund and do not reflect any transaction costs, such as sales charges or redemption or exchange fees.
38
Performance data quoted represents past performance and current performance may be lower or higher. Past performance is no guarantee of future results. The investment return and principal value will fluctuate so that shares, when redeemed, may be worth more or less than the original cost. Please visit www.columbiamanagement.com for daily and most recent month-end performance updates.
CMG SMALL/MID CAP FUND
A Portfolio of Columbia Funds Institutional Trust
FUND PROFILE
Summary
• For the six-month period ended January 31, 2007, CMG Small/Mid Cap Fund returned 14.19%. The fund's return was lower than the return of its benchmarks, the Russell 2500 Growth Index and the Russell 2500 Index,1 which returned 15.99% and 15.85%, respectively. However, the fund came out ahead of the 14.07% average return of its peer group, the Morningstar Mid-Cap Growth Category.2 Stock selection, especially in the industrials, materials and energy sectors, was strong. Disappointments came mainly from the consumer discretionary and health care sectors.
• Industrials made the biggest positive contribution to returns. Stock selection in consulting and business services was strong, and because the fund's exposure to the group was higher than the benchmarks, the positive returns were amplified. Winners included Huron Consulting (1.8% of net assets), a firm that has experienced strong demand for its services to the health care, academic and legal industries. Within materials, chemical holdings drove returns. Potash Corp. of Saskatchewan Inc. (1.1% of net assets), which supplies materials used in agricultural fertilizers, did well.
By contrast, the fund lost ground in the consumer discretionary sector, where weak stock selection and an underweight relative to the benchmarks detracted from returns. Specialty retailer Christopher & Banks (0.3% of net assets), a women's clothing retailer, declined sharply after missing the mark on its holiday product offerings. In health care, returns were lackluster, especially in the health care equipment and services area. Among the detractors was HealthExtras (0.7% of net assets), a pharmaceutical benefit management company, which was pressured by industry pricing concerns.
1 The Russell 2500 Growth Index measures the performance of those Russell 2500 Index companies with higher price-to-book ratios and higher forecasted growth values. The Russell 2500 Index tracks the performance of the 2,500 smallest companies of the Russell 3000 Index. Indices are not investments, do not incur fees or expenses and are not professionally managed. It is not possible to invest directly in indices. Securities in the fund may not match those in an index.
2 ©2007 by Morningstar, Inc. All rights reserved. The information contained herein is the proprietary information of Morningstar, Inc., may not be copied or redistributed for any purpose and may only be used for noncommercial, personal purposes. The information contained herein is not represented or warranted to be accurate, correct, complete or timely. Morningstar, Inc. shall not be responsible for investment decisions, damages or other losses resulting from the use of this information. Past performance is no guarantee of future performance. Morningstar, Inc. has not granted consent for it to be considered or deemed an "expert" under the Securities Act of 1933. Morningstar Categories compare the performance of funds with similar investment objectives and strategies.
39
• By the period's end, we had positioned the fund for slowing economic growth by trimming its exposure to cyclical, industrial and material stocks as well as certain energy stocks. We added to stakes in the consumer staples, health care and telecommunications services sectors. Going forward, we plan to continue to screen the investment universe for attractively valued growth companies with strong business models, rising profit margins and improving returns on capital.
We appreciate your continued confidence in the CMG Small/Mid Cap Fund.
Portfolio Management
Wayne M. Collette has co-managed the CMG Small/Mid Cap Fund since February 2006 and has been with the advisor or its predecessors or affiliate organizations since 2001.
George J. Myers has co-managed the fund since February 2006 and has been associated with the advisor or its predecessors or affiliate organizations since 2004.
The fund's top ten holdings (as a percentage of net assets) as of January 31, 2007 were:
| (%) | |||||||
| Huron Consulting Group | 1.8 | ||||||
| ICON | 1.5 | ||||||
| Affiliated Managers Group | 1.4 | ||||||
| NII Holdings | 1.2 | ||||||
| General Cable | 1.1 | ||||||
| Alliance Data Systems | 1.1 | ||||||
| GameStop | 1.1 | ||||||
| Potash Corp. of Saskatchewan | 1.1 | ||||||
| Euronet Worldwide | 1.1 | ||||||
| Crown Castle International | 1.1 | ||||||
Holdings are calculated as a percentage of net assets and are subject to change. Because the fund is actively managed, there is no guarantee the fund will continue to maintain the holdings breakdown listed. The fund's holdings and their weights within the portfolio may change as market conditions change.
Equity investments are affected by stock market fluctuations that occur in response to economic and business developments.
Investing in growth stocks incurs the possibility of losses because their prices are sensitive to changes in current or expected earnings.
Investments in small- and mid-cap stocks may present special risks. They tend to be more volatile and may be less liquid than the stocks of larger companies. Small-cap stocks often have narrower markets, limited financial resources and tend to be more thinly traded than stocks of larger companies.
40
Performance data quoted represents past performance and current performance may be lower or higher. Past performance is no guarantee of future results. The investment return and principal value will fluctuate so that shares, when redeemed, may be worth more or less than the original cost. Please visit www.columbiamanagement.com for daily and most recent month-end performance updates.
Performance results reflect any reimbursement of fund expenses by the advisor or its affiliates. Absent these waivers or reimbursement arrangements, performance results would have been lower. All results shown assume reinvestment of distributions.
The table and chart do not reflect the deduction of taxes that a shareholder would pay on fund distributions or the redemption of fund shares.
Average annual total return as of January 31, 2007 (%)
| Inception | 6-month (cumulative) | 1-year | 5-year | Life | |||||||||||||||||||
| CMG Small/Mid Cap Fund | 12/01/00 | 14.19 | 6.87 | 10.61 | 6.00 | ||||||||||||||||||
| Russell 2500 Growth Index | 15.99 | 7.68 | 9.25 | 5.73 | |||||||||||||||||||
| Russell 2500 Index | 15.85 | 11.42 | 13.07 | 11.95 | |||||||||||||||||||
Average annual total return as of December 31, 2006 (%)
| Inception | 6-month (cumulative) | 1-year | 5-year | Life | |||||||||||||||||||
| CMG Small/Mid Cap Fund | 12/01/00 | 4.84 | 14.49 | 9.31 | 5.55 | ||||||||||||||||||
| Russell 2500 Growth Index | 6.94 | 12.26 | 7.62 | 5.27 | |||||||||||||||||||
| Russell 2500 Index | 9.26 | 16.17 | 12.19 | 11.63 | |||||||||||||||||||
Index performance is from December 1, 2000.
Growth of a $3,000,000 investment, December 1, 2000 to January 31, 2007

41
The chart above shows the growth in value of a hypothetical minimum initial $3,000,000 investment in the fund compared to the indices during the stated time period.
The Russell 2500 Growth Index measures the performance of those Russell 2500 Index companies with higher price-to-book ratios and higher forecasted growth values. The Russell 2500 Index tracks the performance of the 2,500 smallest companies of the Russell 3000 Index. Indices are not investments, do not incur fees or expenses and are not professionally managed. It is not possible to invest directly in indices. Securities in the fund may not match those in an index.
42
UNDERSTANDING YOUR EXPENSES — CMG Small/Mid Cap Fund
As a fund shareholder, you incur two types of costs. There are transaction costs and also ongoing costs, which generally include investment advisory fees and other fund expenses. The information on this page is intended to help you understand your ongoing costs of investing in the fund and to compare these costs with the ongoing costs of investing in other mutual funds.
Analyzing your fund's expenses
To illustrate these ongoing costs, we have provided an example and calculated the expenses paid by investors during the reporting period. The information in the following table is based on an initial investment of $1,000, which is invested at the beginning of the reporting period and held for the entire period. Expense information is calculated two ways and each method provides you with different information. The amount listed in the "actual" column is calculated using the fund's actual operating expenses and total return for the period. The amount listed in the "hypothetical" column assumes that the return each year is 5% before expenses and is calculated based on the fund's actual operating expenses. You should not use the hypothetical account values and expenses to estimate either your actual account balance at the end of the period or the expenses you paid during this reporting period.
Estimating your actual expenses
To estimate the expenses that you paid over the period, first you will need your account balance at the end of the period:
1. Divide your ending account balance by $1,000. For example, if an account balance was $8,600 at the end of the period, the result would be 8.6.
2. In the section of the table below titled "Expenses paid during the period," locate the amount under "actual." Multiply this number by the result from step 1. Your answer is an estimate of the expenses you paid on your account during the period.
August 1, 2006 – January 31, 2007
| Account value at the beginning of the period ($) | Account value at the end of the period ($) | Expenses paid during the period ($) | Fund's annualized expense ratio (%) | ||||||||||||||||||||||||
| Actual | Hypothetical | Actual | Hypothetical | Actual | Hypothetical | Actual | |||||||||||||||||||||
| 1,000.00 | 1,000.00 | 1,141.91 | 1,021.42 | 4.05 | 3.82 | 0.75 | |||||||||||||||||||||
Expenses paid during the period are equal to the fund's annualized expense ratio of 0.75%, multiplied by the average account value over the period, then multiplied by the number of days in the fund's most recent fiscal half-year and divided by 365.
Had the investment advisor and/or any of its affiliates not reimbursed a portion of expenses, account value at the end of the period would have been reduced.
It is important to note that the expense amounts shown in the table are meant to highlight only ongoing costs of investing in the fund and do not reflect any transaction costs, such as sales charges, redemption or exchange fees. Therefore, the hypothetical examples provided may not help you determine the relative total costs of owning shares of different funds. If these transaction costs were included, your costs would have been higher.
43
Compare with other funds
Since all mutual funds are required to include the same hypothetical calculations about expenses in shareholder reports, you can use this information to compare the ongoing cost of investing in the fund with other funds. To do so, compare the 5% hypothetical example with the 5% hypothetical examples that appear in the shareholder reports of other funds. As you compare hypothetical examples of other funds, it is important to note that hypothetical examples are meant to highlight the ongoing costs of investing in a fund and do not reflect any transaction costs, such as sales charges or redemption or exchange fees.
44
Performance data quoted represents past performance and current performance may be lower or higher. Past performance is no guarantee of future results. The investment return and principal value will fluctuate so that shares, when redeemed, may be worth more or less than the original cost. Please visit www.columbiamanagement.com for most recent daily and month-end performance updates.
CMG INTERNATIONAL STOCK FUND
A Portfolio of Columbia Funds Institutional Trust
FUND PROFILE
Summary
• For the six-month period ended January 31, 2007, CMG International Stock Fund returned 15.03%. The fund's return was higher than the returns of its benchmarks, the MSCI EAFE Index and the MSCI All Country World ex U.S. Index1, which returned 14.33% and 14.87%, respectively. The fund's return was also higher than the 14.68% average return of its peer group, the Morningstar Foreign Large Blend Category.2 Recognizing that the fund is compared against two indices, the following discussion relates to performance measured against the MSCI EAFE Index. During the period, a long list of factors created a positive environment for the international equity markets: robust global economic growth, tame inflation, relatively low interest rates, strong corporate profits, a weak U.S. dollar and declining energy prices. All of the developed markets posted positive double-digit returns, with the exception of the United Kingdom (UK) which rose 7.0% in the face of an unexpected interest-rate hike by the Bank of England. The fund had less exposure than the index to the UK market, which aided results.
• The fund's exposure to the energy sector was higher than the index, which hampered performance because energy was the only sector to post a negative return for the period. Nevertheless, individual energy holdings were helpful. In China, Yanzhou Coal Mining and PetroChina, a major energy company, were among the best performers (0.6% and 0.9% of net assets, respectively). Other companies that were positive included JM AB, a Swedish property management and development company that benefited from strong demand for residential and commercial property, and Salzgitter, a German steel producer (0.9% and 1.1% of net assets, respectively). Companies that detracted from return included the UK's PartyGaming, an online gaming company that declined because of new US regulations prohibiting the processing of cash transactions by US financial institutions. The new rules effectively eliminated the US as a market for PartyGaming . The stock was sold. AstraZeneca (1.5% of net assets), a UK pharmaceutical company, was also disappointing, as concerns about the company's pipeline of future drugs weighed on the stock.
1 The Morgan Stanley Capital International (MSCI) Europe, Australasia, Far East (EAFE) Index is a free float- adjusted market capitalization index that is designed to measure developed market equity performance, excluding the US and Canada. The MSCI All Country (AC) World ex U.S. Index is an unmanaged index of global stock market performance that includes developed and emerging markets but excludes the US. Indices are not investments, do not incur fees or expenses and are not professionally managed. It is not possible to invest directly in an index.
2 ©2007 by Morningstar, Inc. All rights reserved. The information contained herein is the proprietary information of Morningstar, Inc., may not be copied or redistributed for any purpose and may only be used for noncommercial, personal purposes. The information contained herein is not represented or warranted to be accurate, correct, complete or timely. Morningstar, Inc. shall not be responsible for investment decisions, damages or other losses resulting from the use of this information. Past performance is no guarantee of future performance. Morningstar, Inc. has not granted consent for it to be considered or deemed an "expert" under the Securities Act of 1933. Morningstar Categories compare the performance of funds with similar investment objectives and strategies.
45
• Many markets are at all-time highs and appear poised for correction. We would view any market weakness as a buying opportunity, as we believe that the long-term environment for equities is positive, with global economic growth rates running higher than global interest rates. We expect inflation to remain under control, as companies continue to outsource production to low-cost countries. Against this backdrop, we expect central banks to maintain monetary policies that accommodate growth for the foreseeable future.
We appreciate your continued confidence in the CMG International Stock Fund.
Portfolio Management
Fred Copper has managed or co-managed the CMG International Stock Fund since October 2005 and has been with the advisor or its predecessors or affiliate organizations since 2005.
Jasmine (Weili) Huang has co-managed the fund since May 2006 and has been with the advisor or its predecessors or affiliate organizations since 2003.
Timothy R. Anderson has co-managed the fund since May 2006 and has been with the advisor or its predecessors or affiliate organizations since March 2006.
Paul J. DiGiacomo has co-managed the fund since May 2006 and has been with the advisor or its predecessors or affiliate organizations since April 2006.
Daisuke Nomoto has co-managed the fund since May 2006 and has been with the advisor or its predecessors or affiliate organizations since 2005.
The fund's top ten holdings and countries (as a percentage of net assets) as of January 31, 2007 were:
| Holdings | (%) | Countries | (%) | ||||||||||||
| iShares MSCI EAFE Index Fund | 2.7 | Japan | 22.4 | ||||||||||||
| Total | 2.0 | United Kingdom | 14.0 | ||||||||||||
| Toyota Motor | 2.0 | Germany | 9.5 | ||||||||||||
| Novartis | 1.9 | France | 7.3 | ||||||||||||
| Banco Santander Central Hispano | 1.9 | Switzerland | 7.0 | ||||||||||||
| Banco Bilbao Vizcaya Argentaria | 1.7 | Sweden | 5.0 | ||||||||||||
| Barclays | 1.7 | Spain | 4.8 | ||||||||||||
| AstraZeneca | 1.5 | Finland | 2.9 | ||||||||||||
| BNP Paribas | 1.5 | Netherlands | 2.6 | ||||||||||||
| Societe Generale | 1.4 | Canada | 2.4 | ||||||||||||
Holdings and country breakdowns are disclosed as a percentage of net assets, and are subject to change. Because the fund is actively managed, there is no guarantee the fund will continue to maintain the holdings and country breakdown listed. The fund's holdings and their weights within the portfolio may change as market conditions change.
Equity investments are affected by stock market fluctuations that occur in response to economic and business developments.
46
International investing involves special risks, including foreign taxation, currency fluctuation, risks associated with possible differences in financial standards and other monetary and political risks.
A concentration of investments in a specific sector, such as the technology sector, may cause the fund to experience increased volatility.
47
Performance data quoted represents past performance and current performance may be lower or higher. Past performance is no guarantee of future results. The investment return and principal value will fluctuate so that shares, when redeemed, may be worth more or less than the original cost. Please visit www.columbiamanagement.com for daily and most recent month-end performance updates.
Performance results reflect any voluntary waivers or reimbursement of fund expenses by the advisor or its affiliates. Absent these waivers or reimbursement arrangements, performance results would have been lower. All results shown assume reinvestment of distributions.
The table and chart do not reflect the deduction of taxes that a shareholder would pay on fund distributions or the redemption of fund shares.
Average annual total return as of January 31, 2007 (%)
| Inception | 6-month (cumulative) | 1-year | 5-year | 10-year | |||||||||||||||||||
| CMG International Stock Fund | 02/01/94 | 15.03 | 19.86 | 14.43 | 8.60 | ||||||||||||||||||
| MSCI EAFE Index | 14.33 | 19.84 | 16.40 | 8.16 | |||||||||||||||||||
| MSCI All Country World ex U.S. Index | 14.87 | 19.31 | 17.99 | 8.83 | |||||||||||||||||||
Average annual total return as of December 31, 2006 (%)
| Inception | 6-month (cumulative) | 1-year | 5-year | 10-year | |||||||||||||||||||
| CMG International Stock Fund | 02/01/94 | 14.15 | 25.31 | 13.08 | 8.40 | ||||||||||||||||||
| MSCI EAFE Index | 14.69 | 26.34 | 14.98 | 7.71 | |||||||||||||||||||
| MSCI All Country World ex U.S. Index | 15.61 | 27.16 | 16.87 | 8.59 | |||||||||||||||||||
Growth of a $3,000,000 investment, February 1, 1997 to January 31, 2007
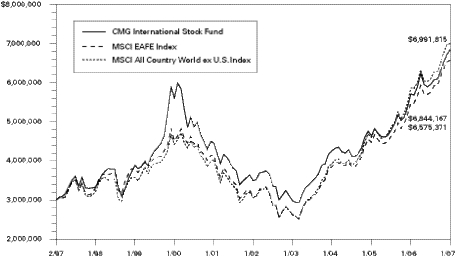
The chart above shows the growth in value of a hypothetical minimum initial $3,000,000 investment in the fund compared to the indices during the stated time period.
The Morgan Stanley Capital International (MSCI) Europe, Australasia, Far East (EAFE) Index is a free float-adjusted market capitalization index that is designed to measure developed market equity performance, excluding the US and Canada. The MSCI All Country (AC) World ex U.S. Index is an unmanaged index of global stock market performance that includes developed and emerging markets but excludes the US. Indices are not investments, do not incur fees or expenses and are not professionally managed. It is not possible to invest directly in indices. Securities in the fund may not match those in an index.
48
UNDERSTANDING YOUR EXPENSES — CMG International Stock Fund
As a fund shareholder, you incur two types of costs. There are transaction costs and also ongoing costs, which generally include investment advisory fees and other fund expenses. The information on this page is intended to help you understand your ongoing costs of investing in the fund and to compare these costs with the ongoing costs of investing in other mutual funds.
Analyzing your fund's expenses
To illustrate these ongoing costs, we have provided an example and calculated the expenses paid by investors during the reporting period. The information in the following table is based on an initial investment of $1,000, which is invested at the beginning of the reporting period and held for the entire period. Expense information is calculated two ways and each method provides you with different information. The amount listed in the "actual" column is calculated using the fund's actual operating expenses and total return for the period. The amount listed in the "hypothetical" column assumes that the return each year is 5% before expenses and is calculated based on the fund's actual operating expenses. You should not use the hypothetical account values and expenses to estimate either your actual account balance at the end of the period or the expenses you paid during this reporting period.
Estimating your actual expenses
To estimate the expenses that you paid over the period, first you will need your account balance at the end of the period:
1. Divide your ending account balance by $1,000. For example, if an account balance was $8,600 at the end of the period, the result would be 8.6.
2. In the section of the table below titled "Expenses paid during the period," locate the amount under "actual." Multiply this number by the result from step 1. Your answer is an estimate of the expenses you paid on your account during the period.
August 1, 2006 – January 31, 2007
| Account value at the beginning of the period ($) | Account value at the end of the period ($) | Expenses paid during the period ($) | Fund's annualized expense ratio (%) | ||||||||||||||||||||||||
| Actual | Hypothetical | Actual | Hypothetical | Actual | Hypothetical | Actual | |||||||||||||||||||||
| 1,000.00 | 1,000.00 | 1,150.28 | 1,021.42 | 4.06 | 3.82 | 0.75 | |||||||||||||||||||||
Expenses paid during the period are equal to the fund's annualized expense ratio of 0.75%, multiplied by the average account value over the period, then multiplied by the number of days in the fund's most recent fiscal half-year and divided by 365.
Had the investment advisor and/or any of its affiliates not reimbursed a portion of expenses, account value at the end of the period would have been reduced.
It is important to note that the expense amounts shown in the table are meant to highlight only ongoing costs of investing in the fund and do not reflect any transaction costs, such as sales charges, redemption or exchange fees. Therefore, the hypothetical examples provided may not help you determine the relative total costs of owning shares of different funds. If these transaction costs were included, your costs would have been higher.
49
Compare with other funds
Since all mutual funds are required to include the same hypothetical calculations about expenses in shareholder reports, you can use this information to compare the ongoing cost of investing in the fund with other funds. To do so, compare the 5% hypothetical example with the 5% hypothetical examples that appear in the shareholder reports of other funds. As you compare hypothetical examples of other funds, it is important to note that hypothetical examples are meant to highlight the ongoing costs of investing in a fund and do not reflect any transaction costs, such as sales charges or redemption or exchange fees.
50
CMG ENHANCED S&P 500® INDEX FUND
A Portfolio of Columbia Funds Institutional Trust
FINANCIAL HIGHLIGHTS
(For a Fund Share Outstanding Throughout Each Period)
| (Unaudited) Six Months Ended | Period Ended | ||||||||||||||||||||||
| January 31, | Year Ended July 31, | July 31, | |||||||||||||||||||||
| 2007 | 2006 | 2005 | 2004 | 2003 (a) | |||||||||||||||||||
| Net asset value, beginning of period | $ | 13.52 | $ | 13.49 | $ | 11.97 | $ | 10.73 | $ | 10.00 | |||||||||||||
| Income from investment operations: | |||||||||||||||||||||||
| Net investment income (b) | 0.13 | 0.23 | 0.24 | (c) | 0.17 | 0.04 | |||||||||||||||||
| Net realized and unrealized gain on investments | 1.93 | 0.76 | 1.58 | 1.13 | 0.69 | ||||||||||||||||||
| Total from investment operations | 2.06 | 0.99 | 1.82 | 1.30 | 0.73 | ||||||||||||||||||
| Less distributions declared to shareholders: | |||||||||||||||||||||||
| From net investment income | (0.22 | ) | (0.25 | ) | (0.20 | ) | (0.05 | ) | - | ||||||||||||||
| From net realized gains | (0.90 | ) | (0.71 | ) | (0.10 | ) | (0.01 | ) | - | ||||||||||||||
| Total distributions declared to shareholders | (1.12 | ) | (0.96 | ) | (0.30 | ) | (0.06 | ) | - | ||||||||||||||
| Net asset value, end of period | $ | 14.46 | $ | 13.52 | $ | 13.49 | $ | 11.97 | $ | 10.73 | |||||||||||||
| Total return (d)(e) | 15.31 | %(f) | 7.56 | % | 15.32 | % | 12.08 | % | 7.30 | %(f) | |||||||||||||
| Ratios/Supplemental data: | |||||||||||||||||||||||
| Net assets, end of period (000's) | $ | 125,209 | $ | 100,973 | $ | 91,633 | $ | 98,247 | $ | 9,134 | |||||||||||||
| Ratio of net operating expenses to average net assets | 0.25 | %(g) | 0.25 | % | 0.25 | % | 0.25 | % | 0.25 | %(g) | |||||||||||||
| Ratio of interest expense to average net assets | - | %(g)(h) | - | %(h) | - | - | - | ||||||||||||||||
| Ratio of net expenses to average net assets | 0.25 | %(g) | 0.25 | % | 0.25 | % | 0.25 | % | 0.25 | %(g) | |||||||||||||
| Ratio of net investment income to average net assets | 1.79 | %(g) | 1.70 | % | 1.91 | % | 1.43 | % | 1.50 | %(g) | |||||||||||||
| Reimbursement | 0.06 | %(g) | 0.06 | % | 0.04 | % | 0.05 | % | 1.37 | %(g) | |||||||||||||
| Portfolio turnover rate | 28 | %(f) | 66 | % | 49 | % | 60 | % | 2 | %(f) | |||||||||||||
(a) The Fund commenced investment operations on May 5, 2003. Per share data, total return and portfolio turnover rate reflect activity from that date.
(b) Per share data was calculated using the average shares outstanding during the period.
(c) Net investment income per share reflects a special dividend. The effect of this dividend amounted to $0.04 per share.
(d) Total return at net asset value assuming all distributions reinvested.
(e) Had the investment advisor and/or any of its affiliates not waived or reimbursed a portion of expenses, total return would have been reduced.
(f) Not annualized.
(g) Annualized.
(h) Rounds to less than 0.01%.
See Accompanying Notes to Financial Statements.
51
CMG LARGE CAP GROWTH FUND
A Portfolio of Columbia Funds Institutional Trust
FINANCIAL HIGHLIGHTS
(For a Fund Share Outstanding Throughout Each Period)
| (Unaudited) Six Months Ended | Period Ended | ||||||||||||||||||
| January 31, | Year Ended July 31, | July 31, | |||||||||||||||||
| 2007 | 2006 | 2005 | 2004 (a) | ||||||||||||||||
| Net asset value, beginning of period | $ | 11.12 | $ | 11.65 | $ | 10.25 | $ | 10.00 | |||||||||||
| Income from investment operations: | |||||||||||||||||||
| Net investment income (b) | 0.03 | 0.07 | 0.12 | (c) | 0.03 | ||||||||||||||
| Net realized and unrealized gain on investments | 1.68 | 0.14 | 1.37 | 0.23 | |||||||||||||||
| Total from investment operations | 1.71 | 0.21 | 1.49 | 0.26 | |||||||||||||||
| Less distributions declared to shareholders: | |||||||||||||||||||
| From net investment income | (0.08 | ) | (0.08 | ) | (0.09 | ) | (0.01 | ) | |||||||||||
| From net realized gains | (0.69 | ) | (0.66 | ) | - | - | |||||||||||||
| Total distributions declared to shareholders | (0.77 | ) | (0.74 | ) | (0.09 | ) | (0.01 | ) | |||||||||||
| Net asset value, end of period | $ | 12.06 | $ | 11.12 | $ | 11.65 | $ | 10.25 | |||||||||||
| Total return (d)(e) | 15.46 | %(f) | 1.63 | % | 14.55 | % | 2.57 | %(f) | |||||||||||
| Ratios/Supplemental data: | |||||||||||||||||||
| Net assets, end of period (000's) | $ | 43,573 | $ | 35,765 | $ | 40,312 | $ | 40,684 | |||||||||||
| Ratio of net operating expenses to average net assets | 0.50 | %(g) | 0.50 | % | 0.50 | % | 0.50 | %(g) | |||||||||||
| Ratio of interest expense to average net assets | - | - | %(h) | - | - | ||||||||||||||
| Ratio of net expenses to average net assets | 0.50 | %(g) | 0.50 | % | 0.50 | % | 0.50 | %(g) | |||||||||||
| Ratio of net investment income to average net assets | 0.57 | %(g) | 0.62 | % | 1.07 | % | 0.31 | %(g) | |||||||||||
| Reimbursement | 0.17 | %(g) | 0.13 | % | 0.07 | % | 0.14 | %(g) | |||||||||||
| Portfolio turnover rate | 105 | %(f) | 180 | % | 120 | % | 114 | %(f) | |||||||||||
(a) The Fund commenced investment operations on September 10, 2003. Per share data, total return and portfolio turnover rate reflect activity from that date.
(b) Per share data was calculated using the average shares outstanding during the period.
(c) Net investment income per share reflects a special dividend. The effect of this dividend amounted to $0.05 per share.
(d) Total return at net asset value assuming all distributions reinvested.
(e) Had the investment advisor and/or any of its affiliates not waived or reimbursed a portion of expenses, total return would have been reduced.
(f) Not annualized.
(g) Annualized.
(h) Rounds to less than 0.01%.
See Accompanying Notes to Financial Statements.
52
CMG LARGE CAP VALUE FUND
A Portfolio of Columbia Funds Institutional Trust
FINANCIAL HIGHLIGHTS
(For a Fund Share Outstanding Throughout Each Period)
| (Unaudited) Six Months Ended | Period Ended | ||||||||||||||||||
| January 31, | Year Ended July 31, | July 31, | |||||||||||||||||
| 2007 | 2006 | 2005 | 2004 (a) | ||||||||||||||||
| Net asset value, beginning of period | $ | 11.89 | $ | 12.54 | $ | 11.09 | $ | 10.00 | |||||||||||
| Income from investment operations: | |||||||||||||||||||
| Net investment income (b) | 0.11 | 0.22 | 0.24 | 0.18 | |||||||||||||||
| Net realized and unrealized gain on investments | 1.32 | 0.92 | 1.46 | 0.93 | |||||||||||||||
| Total from investment operations | 1.43 | 1.14 | 1.70 | 1.11 | |||||||||||||||
| Less distributions declared to shareholders: | |||||||||||||||||||
| From net investment income | (0.22 | ) | (0.28 | ) | (0.22 | ) | (0.02 | ) | |||||||||||
| From net realized gains | (0.97 | ) | (1.51 | ) | (0.03 | ) | - | ||||||||||||
| Total distributions declared to shareholders | (1.19 | ) | (1.79 | ) | (0.25 | ) | (0.02 | ) | |||||||||||
| Net asset value, end of period | $ | 12.13 | $ | 11.89 | $ | 12.54 | $ | 11.09 | |||||||||||
| Total return (c)(d) | 12.12 | %(e) | 9.85 | %(f) | 15.41 | %(g) | 11.15 | %(e) | |||||||||||
| Ratios/Supplemental data: | |||||||||||||||||||
| Net assets, end of period (000's) | $ | 39,586 | $ | 37,280 | $ | 38,731 | $ | 47,855 | |||||||||||
| Ratio of net expenses to average net assets | 0.50 | %(h) | 0.50 | % | 0.50 | % | 0.50 | %(h) | |||||||||||
| Ratio of net investment income to average net assets | 1.77 | %(h) | 1.78 | % | 1.99 | % | 1.86 | %(h) | |||||||||||
| Reimbursement | 0.17 | %(h) | 0.13 | % | 0.07 | % | 0.14 | %(h) | |||||||||||
| Portfolio turnover rate | 43 | %(e) | 97 | % | 45 | % | 46 | %(e) | |||||||||||
(a) The Fund commenced investment operations on September 10, 2003. Per share data, total return and portfolio turnover rate reflect activity from that date.
(b) Per share data was calculated using the average shares outstanding during the period.
(c) Total return at net asset value assuming all distributions reinvested.
(d) Had the investment advisor and/or any of its affiliates not waived or reimbursed a portion of expenses, total return would have been reduced.
(e) Not annualized.
(f) Total return includes a voluntary reimbursement by the investment advisor for a realized investment loss due to a trading error. This reimbursement had an impact of less than 0.01% on the Fund's total return.
(g) Total return includes a reimbursement of loss experienced by the Fund due to a compliance violation. The reimbursement had an impact of less than 0.01% on the Fund's total return.
(h) Annualized.
See Accompanying Notes to Financial Statements.
53
CMG MID CAP GROWTH FUND
A Portfolio of Columbia Funds Institutional Trust
FINANCIAL HIGHLIGHTS
(For a Fund Share Outstanding Throughout Each Period)
| (Unaudited) Six Months Ended | Period Ended | ||||||||||||||||||||||
| January 31, | Year Ended July 31, | July 31, | |||||||||||||||||||||
| 2007 | 2006 | 2005 | 2004 | 2003 (a) | |||||||||||||||||||
| Net asset value, beginning of period | $ | 14.98 | $ | 14.15 | $ | 11.04 | $ | 10.93 | $ | 10.00 | |||||||||||||
| Income from investment operations: | |||||||||||||||||||||||
| Net investment income (loss) (b) | 0.04 | 0.01 | (0.03 | ) | (0.05 | ) | (0.01 | ) | |||||||||||||||
| Net realized and unrealized gain on investments and foreign currency | 2.14 | 1.20 | 3.14 | 0.17 | 0.94 | ||||||||||||||||||
| Total from investment operations | 2.18 | 1.21 | 3.11 | 0.12 | 0.93 | ||||||||||||||||||
| Less distributions declared to shareholders: | |||||||||||||||||||||||
| From net investment income | (0.06 | ) | - | - | - | - | |||||||||||||||||
| From net realized gains | (1.74 | ) | (0.38 | ) | - | (0.01 | ) | - | |||||||||||||||
| Total distributions declared to shareholders | (1.80 | ) | (0.38 | ) | - | (0.01 | ) | - | |||||||||||||||
| Net asset value, end of period | $ | 15.36 | $ | 14.98 | $ | 14.15 | $ | 11.04 | $ | 10.93 | |||||||||||||
| Total return (c)(d) | 14.84 | %(e) | 8.56 | % | 28.17 | % | 1.06 | % | 9.30 | %(e) | |||||||||||||
| Ratios/Supplemental data: | |||||||||||||||||||||||
| Net assets, end of period (000's) | $ | 27,122 | $ | 23,636 | $ | 24,881 | $ | 19,284 | $ | 2,161 | |||||||||||||
| Ratio of net expenses to average net assets | 0.70 | %(f) | 0.70 | % | 0.70 | % | 0.70 | % | 0.70 | %(f) | |||||||||||||
| Ratio of net investment income (loss) to average net assets | 0.51 | %(f) | 0.08 | % | (0.21 | )% | (0.38 | )% | (0.44 | )%(f) | |||||||||||||
| Reimbursement | 0.26 | %(f) | 0.20 | % | 0.21 | % | 0.22 | % | 3.85 | %(f) | |||||||||||||
| Portfolio turnover rate | 72 | %(e) | 65 | % | 141 | % | 169 | % | 23 | %(e) | |||||||||||||
(a) The Fund commenced investment operations on May 5, 2003. Per share data, total return and portfolio turnover rate reflect activity from that date.
(b) Per share data was calculated using the average shares outstanding during the period.
(c) Total return at net asset value assuming all distributions reinvested.
(d) Had the investment advisor and/or any of its affiliates not waived or reimbursed a portion of expenses, total return would have been reduced.
(e) Not annualized.
(f) Annualized.
See Accompanying Notes to Financial Statements.
54
CMG MID CAP VALUE FUND
A Portfolio of Columbia Funds Institutional Trust
FINANCIAL HIGHLIGHTS
(For a Fund Share Outstanding Throughout Each Period)
| (Unaudited) Six Months Ended | Period Ended | ||||||||||||||||||||||
| January 31, | Year Ended July 31, | July 31, | |||||||||||||||||||||
| 2007 | 2006 | 2005 | 2004 | 2003 (a) | |||||||||||||||||||
| Net asset value, beginning of period | $ | 14.02 | $ | 15.17 | $ | 12.58 | $ | 10.69 | $ | 10.00 | |||||||||||||
| Income from investment operations: | |||||||||||||||||||||||
| Net investment income (b) | 0.10 | 0.15 | 0.11 | 0.07 | 0.01 | ||||||||||||||||||
| Net realized and unrealized gain on investments | 1.89 | 1.14 | 2.66 | 1.84 | 0.68 | ||||||||||||||||||
| Total from investment operations | 1.99 | 1.29 | 2.77 | 1.91 | 0.69 | ||||||||||||||||||
| Less distributions declared to shareholders: | |||||||||||||||||||||||
| From net investment income | (0.18 | ) | (0.16 | ) | (0.09 | ) | (0.02 | ) | - | ||||||||||||||
| From net realized gains | (2.31 | ) | (2.28 | ) | (0.09 | ) | - | (c) | - | ||||||||||||||
| Total distributions declared to shareholders | (2.49 | ) | (2.44 | ) | (0.18 | ) | (0.02 | ) | - | ||||||||||||||
| Net asset value, end of period | $ | 13.52 | $ | 14.02 | $ | 15.17 | $ | 12.58 | $ | 10.69 | |||||||||||||
| Total return (d)(e) | 14.66 | %(f) | 9.30 | % | 22.14 | % | 17.91 | % | 6.90 | %(f) | |||||||||||||
| Ratios/Supplemental data: | |||||||||||||||||||||||
| Net assets, end of period (000's) | $ | 16,262 | $ | 17,762 | $ | 21,277 | $ | 21,994 | $ | 2,651 | |||||||||||||
| Ratio of net expenses to average net assets | 0.70 | %(g) | 0.70 | % | 0.70 | % | 0.70 | % | 0.70 | %(g) | |||||||||||||
| Ratio of net investment income to average net assets | 1.35 | %(g) | 1.02 | % | 0.78 | % | 0.54 | % | 0.49 | %(g) | |||||||||||||
| Reimbursement | 0.36 | %(g) | 0.25 | % | 0.19 | % | 0.20 | % | 3.61 | %(g) | |||||||||||||
| Portfolio turnover rate | 33 | %(f) | 59 | % | 59 | % | 9 | % | 2 | %(f) | |||||||||||||
(a) The Fund commenced investment operations on May 5, 2003. Per share data, total return and portfolio turnover rate reflect activity from that date.
(b) Per share data was calculated using the average shares outstanding during the period.
(c) Rounds to less than $0.01 per share.
(d) Total return at net asset value assuming all distributions reinvested.
(e) Had the investment advisor and/or any of its affiliates not waived or reimbursed a portion of expenses, total return would have been reduced.
(f) Not annualized.
(g) Annualized.
See Accompanying Notes to Financial Statements.
55
CMG SMALL CAP GROWTH FUND
A Portfolio of Columbia Funds Institutional Trust
FINANCIAL HIGHLIGHTS
(For a Fund Share Outstanding Throughout Each Period)
| (Unaudited) Six Months Ended | Period Ended | ||||||||||||||||||||||||||||||
| January 31, | Year Ended July 31, | July 31, | Year Ended October 31, | ||||||||||||||||||||||||||||
| 2007 | 2006 | 2005 | 2004 | 2003 (a) | 2002 | 2001 | |||||||||||||||||||||||||
| Net asset value, beginning of period | $ | 2.03 | $ | 6.57 | $ | 5.07 | $ | 4.62 | $ | 3.67 | $ | 4.41 | $ | 18.78 | |||||||||||||||||
| Income from investment operations: | |||||||||||||||||||||||||||||||
| Net investment loss | - | (b)(c) | (0.02 | )(b) | (0.03 | )(b) | (0.03 | )(b) | (0.02 | )(b) | (0.02 | )(b) | (0.01 | ) | |||||||||||||||||
| Net realized and unrealized gain (loss) on investments | 0.28 | 0.53 | (d) | 1.53 | 0.48 | 0.97 | (0.72 | ) | (2.18 | ) | |||||||||||||||||||||
| Total from investment operations | 0.28 | 0.51 | 1.50 | 0.45 | 0.95 | (0.74 | ) | (2.19 | ) | ||||||||||||||||||||||
| Less distributions declared to shareholders: | |||||||||||||||||||||||||||||||
| From net realized gains | (0.49 | ) | (5.05 | )(e) | - | - | - | - | (c) | (12.18 | ) | ||||||||||||||||||||
| Net asset value, end of period | $ | 1.82 | $ | 2.03 | $ | 6.57 | $ | 5.07 | $ | 4.62 | $ | 3.67 | $ | 4.41 | |||||||||||||||||
| Total return (f) | 14.51 | %(g)(h) | 10.46 | %(h) | 29.59 | % | 9.74 | % | 25.89 | %(g) | (16.76 | )% | (28.84 | )% | |||||||||||||||||
| Ratios/Supplemental data: | |||||||||||||||||||||||||||||||
| Net assets, end of period (000's) | $ | 39,625 | $ | 40,183 | $ | 30,317 | $ | 292,028 | $ | 293,924 | $ | 227,874 | $ | 283,521 | |||||||||||||||||
| Ratio of net operating expenses to average net assets (i) | 0.80 | %(j) | 1.09 | % | 0.85 | % | 0.79 | % | 0.81 | %(j) | 0.79 | % | 0.82 | % | |||||||||||||||||
| Ratio of interest expense to average net assets | - | %(j)(k) | - | - | - | - | - | - | |||||||||||||||||||||||
| Ratio of net expenses to average net assets (i) | 0.80 | %(j) | 1.09 | % | 0.85 | % | 0.79 | % | 0.81 | %(j) | 0.79 | % | 0.82 | % | |||||||||||||||||
| Ratio of net investment loss to average net assets (i) | (0.23 | )%(j) | (0.88 | )% | (0.61 | )% | (0.62 | )% | (0.55 | )%(j) | (0.49 | )% | (0.22 | )% | |||||||||||||||||
| Waiver/reimbursement | 0.25 | %(j) | 0.21 | % | - | - | - | - | - | ||||||||||||||||||||||
| Portfolio turnover rate | 70 | %(g) | 112 | % | 119 | % | 123 | % | 89 | %(g) | 120 | % | 160 | % | |||||||||||||||||
(a) The Fund changed its fiscal year end from October 31 to July 31.
(b) Per share data was calculated using the average shares outstanding during the period.
(c) Rounds to less than $0.01 per share.
(d) The amount shown for a share outstanding does not correspond with the aggregate gain (loss) on investments for the period due to timing of sales and repurchases of Fund shares in relation to fluctuating market values of the investments of the Fund.
(e) Capital gain distributions were declared after significant shareholder redemptions reduced the size of the Fund.
(f) Total return at net asset value assuming all distributions reinvested.
(g) Not annualized.
(h) Had the investment advisor and/or any of its affiliates not waived or reimbursed a portion of expenses, total return would have been reduced.
(i) The benefits derived from custody credits had an impact of less than 0.01%.
(j) Annualized.
(k) Rounds to less than 0.01%.
See Accompanying Notes to Financial Statements.
56
CMG SMALL CAP VALUE FUND
A Portfolio of Columbia Funds Institutional Trust
FINANCIAL HIGHLIGHTS
(For a Fund Share Outstanding Throughout Each Period)
| (Unaudited) Six Months Ended | Period Ended | ||||||||||||||||||||||
| January 31, | Year Ended July 31, | July 31, | |||||||||||||||||||||
| 2007 | 2006 | 2005 | 2004 | 2003 (a) | |||||||||||||||||||
| Net asset value, beginning of period | $ | 15.31 | $ | 16.06 | $ | 13.91 | $ | 11.29 | $ | 10.00 | |||||||||||||
| Income from investment operations: | |||||||||||||||||||||||
| Net investment income (b) | 0.06 | 0.09 | 0.11 | 0.11 | 0.02 | ||||||||||||||||||
| Net realized and unrealized gain on investments | 1.99 | 1.06 | 3.11 | 2.79 | 1.27 | ||||||||||||||||||
| Total from investment operations | 2.05 | 1.15 | 3.22 | 2.90 | 1.29 | ||||||||||||||||||
| Less distributions declared to shareholders: | |||||||||||||||||||||||
| From net investment income | (0.12 | ) | (0.13 | ) | (0.10 | ) | (0.06 | ) | - | ||||||||||||||
| From net realized gains | (3.18 | ) | (1.77 | ) | (0.97 | ) | (0.22 | ) | - | ||||||||||||||
| Total distributions declared to shareholders | (3.30 | ) | (1.90 | ) | (1.07 | ) | (0.28 | ) | - | ||||||||||||||
| Net asset value, end of period | $ | 14.06 | $ | 15.31 | $ | 16.06 | $ | 13.91 | $ | 11.29 | |||||||||||||
| Total return (c)(d) | 13.79 | %(e) | 7.90 | %(f) | 23.57 | % | 25.79 | % | 12.90 | %(e) | |||||||||||||
| Ratios/Supplemental data: | |||||||||||||||||||||||
| Net assets, end of period (000's) | $ | 30,216 | $ | 33,439 | $ | 36,989 | $ | 40,356 | $ | 21,356 | |||||||||||||
| Ratio of net operating expenses to average net assets | 0.80 | %(g) | 0.80 | % | 0.80 | % | 0.80 | % | 0.80 | %(g) | |||||||||||||
| Ratio of interest expense to average net assets | 0.02 | %(g) | - | %(h) | - | - | - | ||||||||||||||||
| Ratio of net expenses to average net assets | 0.82 | %(g) | 0.80 | % | 0.80 | % | 0.80 | % | 0.80 | %(g) | |||||||||||||
| Ratio of net investment income to average net assets | 0.70 | %(g) | 0.60 | % | 0.77 | % | 0.82 | % | 0.66 | %(g) | |||||||||||||
| Reimbursement | 0.23 | %(g) | 0.14 | % | 0.12 | % | 0.09 | % | 0.36 | %(g) | |||||||||||||
| Portfolio turnover rate | 17 | %(e) | 37 | % | 41 | % | 53 | % | 5 | %(e) | |||||||||||||
(a) The Fund commenced investment operations on May 5, 2003. Per share data, total return and portfolio turnover rate reflect activity from that date.
(b) Per share data was calculated using the average shares outstanding during the period.
(c) Total return at net asset value assuming all distributions reinvested.
(d) Had the investment advisor and/or any of its affiliates not waived or reimbursed a portion of expenses, total return would have been reduced.
(e) Not annualized.
(f) Total return includes a voluntary reimbursement by the investment advisor for a realized investment loss due to a trading error. This reimbursement had an impact of less than 0.01% on the Fund's total return.
(g) Annualized.
(h) Rounds to less than 0.01%.
See Accompanying Notes to Financial Statements.
57
CMG SMALL/MID CAP FUND
A Portfolio of Columbia Funds Institutional Trust
FINANCIAL HIGHLIGHTS
(For a Fund Share Outstanding Throughout Each Period)
| (Unaudited) Six Months Ended | Period Ended | Year Ended | Period Ended | ||||||||||||||||||||||||||||
| January 31, | Year Ended July 31, | July 31, | October 31, | October 31, | |||||||||||||||||||||||||||
| 2007 | 2006 | 2005 | 2004 | 2003 (a) | 2002 | 2001 (b) | |||||||||||||||||||||||||
| Net asset value, beginning of period | $ | 11.24 | $ | 11.49 | $ | 8.77 | $ | 8.30 | $ | 6.96 | $ | 8.00 | $ | 10.00 | |||||||||||||||||
| Income from investment operations: | |||||||||||||||||||||||||||||||
| Net investment loss | - | (c)(d) | (0.05 | )(c) | (0.04 | )(c) | (0.05 | )(c) | (0.03 | )(c) | (0.04 | )(c) | (0.02 | ) | |||||||||||||||||
| Net realized and unrealized gain (loss) on investments | 0.73 | 1.07 | 2.76 | 0.52 | 1.37 | (1.00 | ) | (1.98 | ) | ||||||||||||||||||||||
| Total from investment operations | 0.73 | 1.02 | 2.72 | 0.47 | 1.34 | (1.04 | ) | (2.00 | ) | ||||||||||||||||||||||
| Less distributions declared to shareholders: | |||||||||||||||||||||||||||||||
| From net realized gains | (7.69 | )(e) | (1.27 | ) | - | - | - | - | - | ||||||||||||||||||||||
| Net asset value, end of period | $ | 4.28 | $ | 11.24 | $ | 11.49 | $ | 8.77 | $ | 8.30 | $ | 6.96 | $ | 8.00 | |||||||||||||||||
| Total return (f)(g) | 14.19 | % (h) | 9.17 | %(i) | 31.01 | % | 5.66 | % | 19.25 | % (h) | (13.00 | )% | (20.00 | )%(h) | |||||||||||||||||
| Ratios/Supplemental data: | |||||||||||||||||||||||||||||||
| Net assets, end of period (000's) | $ | 10,259 | $ | 8,773 | $ | 38,755 | $ | 50,662 | $ | 73,926 | $ | 54,769 | $ | 49,391 | |||||||||||||||||
| Ratio of net expenses to average net assets | 0.75 | % (j) | 0.75 | % | 0.75 | % | 0.75 | % | 0.78 | % (j)(k) | 0.80 | % (k) | 0.80 | % (j)(k) | |||||||||||||||||
| Ratio of net investment loss to average net assets | (0.07 | )%(j) | (0.45 | )% | (0.37 | )% | (0.49 | )% | (0.50 | )%(j)(k) | (0.45 | )%(k) | (0.23 | )%(j)(k) | |||||||||||||||||
| Reimbursement | 0.60 | % (j) | 0.23 | % | 0.09 | % | 0.06 | % | 0.06 | % (j) | 0.06 | % | 0.17 | % (j) | |||||||||||||||||
| Portfolio turnover rate | 53 | % (h) | 109 | % | 170 | % | 91 | % | 84 | % (h) | 125 | % | 167 | % (h) | |||||||||||||||||
(a) The Fund changed its fiscal year end from October 31 to July 31.
(b) The Fund commenced investment operations on December 1, 2000. Per share data, total return and portfolio turnover rate reflect activity from that date.
(c) Per share data was calculated using the average shares outstanding during the period.
(d) Rounds to less than $0.01 per share.
(e) Capital gain distributions were declared after significant shareholder redemptions reduced the size of the Fund.
(f) Total return at net asset value assuming all distributions reinvested.
(g) Had the investment advisor and/or any of its affiliates not waived or reimbursed a portion of expenses, total return would have been reduced.
(h) Not annualized.
(i) Total return includes a voluntary reimbursement by the investment advisor for a realized investment loss due to a trading error. This reimbursement had an impact of less than 0.01% on the Fund's total return.
(j) Annualized.
(k) The benefits derived from custody credits had an impact of less than 0.01%.
See Accompanying Notes to Financial Statements.
58
CMG INTERNATIONAL STOCK FUND
A Portfolio of Columbia Funds Institutional Trust
FINANCIAL HIGHLIGHTS
(For a Fund Share Outstanding Throughout Each Period)
| (Unaudited) Six Months Ended | Period Ended | ||||||||||||||||||||||||||||||
| January 31, | Year Ended July 31, | July 31, | Year Ended October 31, | ||||||||||||||||||||||||||||
| 2007 | 2006 | 2005 | 2004 | 2003 (a) | 2002 | 2001 | |||||||||||||||||||||||||
| Net asset value, beginning of period | $ | 14.63 | $ | 13.76 | $ | 12.17 | $ | 10.33 | $ | 9.32 | $ | 10.42 | $ | 16.20 | |||||||||||||||||
| Income from investment operations: | |||||||||||||||||||||||||||||||
| Net investment income | 0.06 | (b) | 0.26 | (b) | 0.19 | (b) | 0.14 | (b) | 0.11 | (b) | 0.02 | (b) | 0.03 | ||||||||||||||||||
| Net realized and unrealized gain (loss) on investments, foreign currency and foreign capital gains tax | 2.05 | 2.85 | 1.79 | 1.76 | 0.95 | (1.09 | ) | (3.09 | ) | ||||||||||||||||||||||
| Total from investment operations | 2.11 | 3.11 | 1.98 | 1.90 | 1.06 | (1.07 | ) | (3.06 | ) | ||||||||||||||||||||||
| Less distributions declared to shareholders: | |||||||||||||||||||||||||||||||
| From net investment income | (0.36 | ) | (0.27 | ) | (0.10 | ) | (0.06 | ) | (0.05 | ) | (0.03 | ) | - | ||||||||||||||||||
| From net realized gains | (2.92 | ) | (1.97 | ) | (0.29 | ) | - | - | - | (2.72 | ) | ||||||||||||||||||||
| Total distributions declared to shareholders | (3.28 | ) | (2.24 | ) | (0.39 | ) | (0.06 | ) | (0.05 | ) | (0.03 | ) | (2.72 | ) | |||||||||||||||||
| Net asset value, end of period | $ | 13.46 | $ | 14.63 | $ | 13.76 | $ | 12.17 | $ | 10.33 | $ | 9.32 | $ | 10.42 | |||||||||||||||||
| Total return (c) | 15.03 | %(d)(e) | 24.31 | %(d) | 16.31 | %(d) | 18.40 | %(d) | 11.39 | %(d)(e) | (10.28 | )% | (22.46 | )% | |||||||||||||||||
| Ratios/Supplemental data: | |||||||||||||||||||||||||||||||
| Net assets, end of period (000's) | $ | 110,767 | $ | 105,738 | $ | 136,144 | $ | 152,251 | $ | 58,488 | $ | 20,616 | $ | 20,553 | |||||||||||||||||
| Ratio of net operating expenses to average net assets | 0.75 | %(f) | 0.75 | % | 0.75 | % | 0.75 | % | 0.93 | %(f)(g) | 1.31 | %(g) | 1.26 | %(g) | |||||||||||||||||
| Ratio of interest expense to average net assets | 0.01 | %(f) | 0.01 | % | - | - | - | - | - | ||||||||||||||||||||||
| Ratio of net expenses to average net assets | 0.76 | %(f) | 0.76 | % | 0.75 | % | 0.75 | % | 0.93 | %(f)(g) | 1.31 | %(g) | 1.26 | %(g) | |||||||||||||||||
| Ratio of net investment income to average net assets | 0.84 | %(f) | 1.84 | % | 1.47 | % | 1.16 | % | 1.50 | %(f)(g) | 0.21 | %(g) | 0.29 | %(g) | |||||||||||||||||
| Reimbursement | 0.06 | %(f) | 0.06 | % | 0.03 | % | 0.05 | % | 0.06 | %(f) | - | - | |||||||||||||||||||
| Portfolio turnover rate | 43 | %(e) | 86 | % | 68 | % | 91 | % | 59 | %(e) | 111 | % | 117 | % | |||||||||||||||||
(a) The Fund changed its fiscal year end from October 31 to July 31.
(b) Per share data was calculated using the average shares outstanding during the period.
(c) Total return at net asset value assuming all distributions reinvested.
(d) Had the investment advisor and/or any of its affiliates not waived or reimbursed a portion of expenses, total return would have been reduced.
(e) Not annualized.
(f) Annualized.
(g) The benefits derived from custody credits had an impact of less than 0.01%.
See Accompanying Notes to Financial Statements.
59
CMG ENHANCED S&P 500® INDEX FUND
A Portfolio of Columbia Funds Institutional Trust
SCHEDULE OF INVESTMENTS
January 31, 2007 (Unaudited)
| Shares | Value | ||||||||||
| Common Stocks (98.1%) | |||||||||||
| Consumer Discretionary (10.7%) | |||||||||||
| Automobiles (0.6%) | |||||||||||
| General Motors Corp. (a) | 5,100 | $ | 167,484 | ||||||||
| Harley-Davidson, Inc. (a) | 8,200 | 559,814 | |||||||||
| 727,298 | |||||||||||
| Diversified Consumer Services (0.3%) | |||||||||||
| Apollo Group, Inc., Class A (a)(b) | 8,400 | 364,560 | |||||||||
| Hotels, Restaurants & Leisure (2.6%) | |||||||||||
| Darden Restaurants, Inc. | 34,000 | 1,330,760 | |||||||||
| McDonald's Corp. | 23,400 | 1,037,790 | |||||||||
| Starbucks Corp. (b) | 4,600 | 160,724 | |||||||||
| Wyndham Worldwide Corp. (b) | 8,900 | 277,680 | |||||||||
| Yum! Brands, Inc. | 7,600 | 456,076 | |||||||||
| 3,263,030 | |||||||||||
| Household Durables (0.3%) | |||||||||||
| Centex Corp. (a) | 8,200 | 440,258 | |||||||||
| Media (3.7%) | |||||||||||
| CBS Corp., Class B | 21,500 | 670,155 | |||||||||
| Comcast Corp., Class A (a)(b) | 600 | 26,592 | |||||||||
| DIRECTV Group, Inc. (b) | 56,500 | 1,378,035 | |||||||||
| Gannett Co., Inc. | 2,600 | 151,164 | |||||||||
| McGraw-Hill Companies, Inc. | 8,100 | 543,348 | |||||||||
| Omnicom Group, Inc. | 15,100 | 1,588,520 | |||||||||
| Viacom, Inc., Class B (b) | 6,400 | 260,288 | |||||||||
| 4,618,102 | |||||||||||
| Multiline Retail (1.9%) | |||||||||||
| Federated Department Stores, Inc. | 27,200 | 1,128,528 | |||||||||
| Kohl's Corp. (b) | 6,100 | 432,551 | |||||||||
| Nordstrom, Inc. | 8,300 | 462,393 | |||||||||
| Sears Holdings Corp. (a)(b) | 2,000 | 353,300 | |||||||||
| 2,376,772 | |||||||||||
| Specialty Retail (1.3%) | |||||||||||
| AutoNation, Inc. (a)(b) | 400 | 8,980 | |||||||||
| Home Depot, Inc. | 30,700 | 1,250,718 | |||||||||
| Limited Brands, Inc. | 300 | 8,382 | |||||||||
| Lowe's Companies, Inc. | 100 | 3,371 | |||||||||
| Office Depot, Inc. (b) | 3,200 | 119,648 | |||||||||
| OfficeMax, Inc. | 3,000 | 144,870 | |||||||||
| Sherwin-Williams Co. | 1,000 | 69,100 | |||||||||
| 1,605,069 | |||||||||||
| 13,395,089 | |||||||||||
See Accompanying Notes to Financial Statements.
60
CMG ENHANCED S&P 500® INDEX FUND
A Portfolio of Columbia Funds Institutional Trust
SCHEDULE OF INVESTMENTS
| Shares | Value | ||||||||||
| Common Stocks (continued) | |||||||||||
| Consumer Staples (9.2%) | |||||||||||
| Beverages (1.7%) | |||||||||||
| Coca-Cola Co. | 26,500 | $ | 1,268,820 | ||||||||
| PepsiCo, Inc. | 13,300 | 867,692 | |||||||||
| 2,136,512 | |||||||||||
| Food & Staples Retailing (1.7%) | |||||||||||
| Kroger Co. | 28,600 | 732,160 | |||||||||
| Wal-Mart Stores, Inc. | 28,400 | 1,354,396 | |||||||||
| 2,086,556 | |||||||||||
| Food Products (2.4%) | |||||||||||
| Archer-Daniels-Midland Co. | 15,000 | 480,000 | |||||||||
| ConAgra Foods, Inc. | 18,400 | 473,064 | |||||||||
| H.J. Heinz Co. | 14,000 | 659,680 | |||||||||
| Sara Lee Corp. | 84,900 | 1,456,035 | |||||||||
| 3,068,779 | |||||||||||
| Household Products (0.7%) | |||||||||||
| Clorox Co. (a) | 400 | 26,168 | |||||||||
| Colgate-Palmolive Co. | 4,500 | 307,350 | |||||||||
| Kimberly-Clark Corp. | 600 | 41,640 | |||||||||
| Procter & Gamble Co. | 7,000 | 454,090 | |||||||||
| 829,248 | |||||||||||
| Personal Products (0.2%) | |||||||||||
| Estee Lauder Companies, Inc., Class A | 6,800 | 323,000 | |||||||||
| Tobacco (2.5%) | |||||||||||
| Altria Group, Inc. | 18,100 | 1,581,759 | |||||||||
| Reynolds American, Inc. (a) | 23,800 | 1,535,100 | |||||||||
| 3,116,859 | |||||||||||
| 11,560,954 | |||||||||||
| Energy (9.6%) | |||||||||||
| Energy Equipment & Services (0.5%) | |||||||||||
| BJ Services Co. (a) | 7,600 | 210,216 | |||||||||
| Schlumberger Ltd. | 5,900 | 374,591 | |||||||||
| 584,807 | |||||||||||
| Oil, Gas & Consumable Fuels (9.1%) | |||||||||||
| Chevron Corp. | 23,900 | 1,741,832 | |||||||||
| ConocoPhillips | 20,500 | 1,361,405 | |||||||||
| Exxon Mobil Corp. | 64,400 | 4,772,040 | |||||||||
| Hess Corp. | 4,800 | 259,152 | |||||||||
| Marathon Oil Corp. | 20,500 | 1,851,970 | |||||||||
| Occidental Petroleum Corp. | 9,600 | 445,056 | |||||||||
| Sunoco, Inc. | 7,200 | 454,536 | |||||||||
| Valero Energy Corp. | 9,700 | 526,516 | |||||||||
| 11,412,507 | |||||||||||
| 11,997,314 | |||||||||||
See Accompanying Notes to Financial Statements.
61
CMG ENHANCED S&P 500® INDEX FUND
A Portfolio of Columbia Funds Institutional Trust
SCHEDULE OF INVESTMENTS
| Shares | Value | ||||||||||
| Common Stocks (continued) | |||||||||||
| Financials (21.7%) | |||||||||||
| Capital Markets (4.9%) | |||||||||||
| Bear Stearns Companies, Inc. | 1,100 | $ | 181,335 | ||||||||
| Charles Schwab Corp. | 19,000 | 359,480 | |||||||||
| Goldman Sachs Group, Inc. | 10,900 | 2,312,544 | |||||||||
| Lehman Brothers Holdings, Inc. | 8,900 | 731,936 | |||||||||
| Merrill Lynch & Co., Inc. | 12,100 | 1,132,076 | |||||||||
| Morgan Stanley | 16,500 | 1,366,035 | |||||||||
| Northern Trust Corp. | 500 | 30,375 | |||||||||
| 6,113,781 | |||||||||||
| Commercial Banks (4.5%) | |||||||||||
| BB&T Corp. (a) | 4,900 | 207,074 | |||||||||
| Fifth Third Bancorp (a) | 6,700 | 267,330 | |||||||||
| KeyCorp | 5,700 | 217,569 | |||||||||
| National City Corp. (a) | 18,900 | 715,365 | |||||||||
| PNC Financial Services Group, Inc. | 2,500 | 184,425 | |||||||||
| Regions Financial Corp. | 2,500 | 90,650 | |||||||||
| SunTrust Banks, Inc. | 4,500 | 373,950 | |||||||||
| U.S. Bancorp | 22,800 | 811,680 | |||||||||
| Wachovia Corp. | 27,400 | 1,548,100 | |||||||||
| Wells Fargo & Co. | 34,600 | 1,242,832 | |||||||||
| 5,658,975 | |||||||||||
| Consumer Finance (0.0%) | |||||||||||
| American Express Co. | 100 | 5,822 | |||||||||
| Diversified Financial Services (5.3%) | |||||||||||
| CIT Group, Inc. | 5,600 | 330,176 | |||||||||
| Citigroup, Inc. | 71,900 | 3,963,847 | |||||||||
| JPMorgan Chase & Co. | 45,300 | 2,307,129 | |||||||||
| 6,601,152 | |||||||||||
| Insurance (5.0%) | |||||||||||
| ACE Ltd. | 3,000 | 173,340 | |||||||||
| Allstate Corp. | 20,400 | 1,227,264 | |||||||||
| American International Group, Inc. | 21,200 | 1,451,140 | |||||||||
| Genworth Financial, Inc., Class A | 1,300 | 45,370 | |||||||||
| Hartford Financial Services Group, Inc. | 1,400 | 132,874 | |||||||||
| MetLife, Inc. | 6,800 | 422,416 | |||||||||
| Principal Financial Group, Inc. | 2,500 | 154,025 | |||||||||
| Prudential Financial, Inc. | 10,500 | 935,865 | |||||||||
| SAFECO Corp. (a) | 15,900 | 1,017,759 | |||||||||
| XL Capital Ltd., Class A | 10,100 | 696,900 | |||||||||
| 6,256,953 | |||||||||||
| Real Estate Investment Trusts (REITs) (0.9%) | |||||||||||
| Equity Office Properties Trust | 17,300 | 961,015 | |||||||||
| Kimco Realty Corp. | 200 | 9,920 | |||||||||
| ProLogis | 3,500 | 227,500 | |||||||||
| 1,198,435 | |||||||||||
See Accompanying Notes to Financial Statements.
62
CMG ENHANCED S&P 500® INDEX FUND
A Portfolio of Columbia Funds Institutional Trust
SCHEDULE OF INVESTMENTS
| Shares | Value | ||||||||||
| Common Stocks (continued) | |||||||||||
| Real Estate Management & Development (0.0%) | |||||||||||
| Realogy Corp. (b) | 200 | $ | 5,980 | ||||||||
| Thrifts & Mortgage Finance (1.1%) | |||||||||||
| Countrywide Financial Corp. | 13,900 | 604,372 | |||||||||
| Fannie Mae | 7,200 | 407,016 | |||||||||
| Freddie Mac | 5,600 | 363,608 | |||||||||
| 1,374,996 | |||||||||||
| 27,216,094 | |||||||||||
| Health Care (12.0%) | |||||||||||
| Biotechnology (2.4%) | |||||||||||
| Amgen, Inc. (b) | 30,500 | 2,146,285 | |||||||||
| Biogen Idec, Inc. (b) | 11,900 | 575,246 | |||||||||
| Gilead Sciences, Inc. (b) | 3,400 | 218,688 | |||||||||
| 2,940,219 | |||||||||||
| Health Care Equipment & Supplies (0.1%) | |||||||||||
| Biomet, Inc. (a) | 2,200 | 93,192 | |||||||||
| Zimmer Holdings, Inc. (b) | 500 | 42,110 | |||||||||
| 135,302 | |||||||||||
| Health Care Providers & Services (3.7%) | |||||||||||
| Aetna, Inc. | 17,800 | 750,448 | |||||||||
| AmerisourceBergen Corp. | 8,200 | 429,516 | |||||||||
| Cardinal Health, Inc. | 500 | 35,710 | |||||||||
| Caremark Rx, Inc. | 8,900 | 545,214 | |||||||||
| Coventry Health Care, Inc. (b) | 10,500 | 541,275 | |||||||||
| Humana, Inc. (b) | 1,700 | 94,350 | |||||||||
| McKesson Corp. | 3,800 | 211,850 | |||||||||
| Quest Diagnostics, Inc. | 10,400 | 545,792 | |||||||||
| WellPoint, Inc. (b) | 19,200 | 1,504,896 | |||||||||
| 4,659,051 | |||||||||||
| Health Care Technology (0.0%) | |||||||||||
| IMS Health, Inc. (a) | 1,700 | 49,062 | |||||||||
| Life Sciences Tools & Services (0.1%) | |||||||||||
| PerkinElmer, Inc. | 200 | 4,774 | |||||||||
| Thermo Fisher Scientific, Inc. (b) | 2,600 | 124,410 | |||||||||
| 129,184 | |||||||||||
| Pharmaceuticals (5.7%) | |||||||||||
| Abbott Laboratories | 14,100 | 747,300 | |||||||||
| Forest Laboratories, Inc. (b) | 30,800 | 1,728,188 | |||||||||
| Johnson & Johnson | 18,900 | 1,262,520 | |||||||||
| King Pharmaceuticals, Inc. (a)(b) | 1,800 | 32,148 | |||||||||
| Merck & Co., Inc. | 18,600 | 832,350 | |||||||||
| Pfizer, Inc. (a) | 95,500 | 2,505,920 | |||||||||
| 7,108,426 | |||||||||||
| 15,021,244 | |||||||||||
See Accompanying Notes to Financial Statements.
63
CMG ENHANCED S&P 500® INDEX FUND
A Portfolio of Columbia Funds Institutional Trust
SCHEDULE OF INVESTMENTS
| Shares | Value | ||||||||||
| Common Stocks (continued) | |||||||||||
| Industrials (10.5%) | |||||||||||
| Aerospace & Defense (2.1%) | |||||||||||
| Boeing Co. | 5,600 | $ | 501,536 | ||||||||
| General Dynamics Corp. | 3,100 | 242,265 | |||||||||
| Honeywell International, Inc. | 10,900 | 498,021 | |||||||||
| L-3 Communications Holdings, Inc. | 300 | 24,702 | |||||||||
| Lockheed Martin Corp. | 5,400 | 524,826 | |||||||||
| Northrop Grumman Corp. | 1,100 | 78,034 | |||||||||
| Raytheon Co. | 6,400 | 332,160 | |||||||||
| United Technologies Corp. | 5,600 | 380,912 | |||||||||
| 2,582,456 | |||||||||||
| Air Freight & Logistics (0.9%) | |||||||||||
| FedEx Corp. | 1,400 | 154,560 | |||||||||
| United Parcel Service, Inc., Class B (a) | 14,000 | 1,011,920 | |||||||||
| 1,166,480 | |||||||||||
| Building Products (0.3%) | |||||||||||
| Masco Corp. | 9,300 | 297,507 | |||||||||
| Commercial Services & Supplies (0.1%) | |||||||||||
| R.R. Donnelley & Sons Co. | 2,800 | 103,880 | |||||||||
| Electrical Equipment (1.6%) | |||||||||||
| Cooper Industries Ltd., Class A (a) | 5,800 | 530,062 | |||||||||
| Emerson Electric Co. | 20,200 | 908,394 | |||||||||
| Rockwell Automation, Inc. (a) | 9,800 | 599,858 | |||||||||
| 2,038,314 | |||||||||||
| Industrial Conglomerates (3.7%) | |||||||||||
| 3M Co. | 17,200 | 1,277,960 | |||||||||
| General Electric Co. | 57,100 | 2,058,455 | |||||||||
| Tyco International Ltd. | 41,700 | 1,329,396 | |||||||||
| 4,665,811 | |||||||||||
| Machinery (1.2%) | |||||||||||
| Danaher Corp. | 200 | 14,812 | |||||||||
| Dover Corp. | 1,500 | 74,400 | |||||||||
| Illinois Tool Works, Inc. | 11,200 | 571,088 | |||||||||
| Ingersoll-Rand Co., Ltd., Class A | 17,500 | 750,400 | |||||||||
| Parker Hannifin Corp. | 1,600 | 132,416 | |||||||||
| 1,543,116 | |||||||||||
| Road & Rail (0.5%) | |||||||||||
| CSX Corp. | 3,200 | 117,728 | |||||||||
| Ryder System, Inc. (a) | 9,300 | 507,222 | |||||||||
| 624,950 | |||||||||||
| Trading Companies & Distributors (0.1%) | |||||||||||
| W.W. Grainger, Inc. | 1,600 | 124,240 | |||||||||
| 13,146,754 | |||||||||||
See Accompanying Notes to Financial Statements.
64
CMG ENHANCED S&P 500® INDEX FUND
A Portfolio of Columbia Funds Institutional Trust
SCHEDULE OF INVESTMENTS
| Shares | Value | ||||||||||
| Common Stocks (continued) | |||||||||||
| Information Technology (14.8%) | |||||||||||
| Communications Equipment (2.8%) | |||||||||||
| Cisco Systems, Inc. (b) | 83,700 | $ | 2,225,583 | ||||||||
| Motorola, Inc. | 24,500 | 486,325 | |||||||||
| QUALCOMM, Inc. | 19,900 | 749,434 | |||||||||
| 3,461,342 | |||||||||||
| Computers & Peripherals (4.8%) | |||||||||||
| Apple Computer, Inc. (b) | 1,800 | 154,314 | |||||||||
| Dell, Inc. (b) | 77,800 | 1,885,872 | |||||||||
| Hewlett-Packard Co. | 43,100 | 1,865,368 | |||||||||
| International Business Machines Corp. | 14,100 | 1,398,015 | |||||||||
| Lexmark International, Inc., Class A (a)(b) | 11,400 | 718,542 | |||||||||
| 6,022,111 | |||||||||||
| IT Services (0.2%) | |||||||||||
| Computer Sciences Corp. (a)(b) | 2,200 | 115,412 | |||||||||
| Fiserv, Inc. (b) | 2,300 | 120,911 | |||||||||
| 236,323 | |||||||||||
| Semiconductors & Semiconductor Equipment (2.7%) | |||||||||||
| Applied Materials, Inc. | 67,200 | 1,191,456 | |||||||||
| Intel Corp. | 44,000 | 922,240 | |||||||||
| National Semiconductor Corp. (a) | 12,800 | 296,064 | |||||||||
| Novellus Systems, Inc. (a)(b) | 2,500 | 77,075 | |||||||||
| Texas Instruments, Inc. (a) | 27,100 | 845,249 | |||||||||
| 3,332,084 | |||||||||||
| Software (4.3%) | |||||||||||
| Autodesk, Inc. (a)(b) | 13,700 | 598,964 | |||||||||
| Microsoft Corp. (c) | 125,200 | 3,863,672 | |||||||||
| Oracle Corp. (b) | 55,900 | 959,244 | |||||||||
| 5,421,880 | |||||||||||
| 18,473,740 | |||||||||||
| Materials (3.0%) | |||||||||||
| Chemicals (0.5%) | |||||||||||
| Dow Chemical Co. | 6,600 | 274,164 | |||||||||
| PPG Industries, Inc. | 6,000 | 397,740 | |||||||||
| 671,904 | |||||||||||
| Containers & Packaging (0.5%) | |||||||||||
| Pactiv Corp. (b) | 17,100 | 554,724 | |||||||||
| Metals & Mining (1.6%) | |||||||||||
| Freeport-McMoRan Copper & Gold, Inc., Class B (a) | 3,300 | 189,783 | |||||||||
| Nucor Corp. | 20,500 | 1,323,070 | |||||||||
| Phelps Dodge Corp. | 2,300 | 284,280 | |||||||||
| United States Steel Corp. | 2,100 | 175,329 | |||||||||
| 1,972,462 | |||||||||||
See Accompanying Notes to Financial Statements.
65
CMG ENHANCED S&P 500® INDEX FUND
A Portfolio of Columbia Funds Institutional Trust
SCHEDULE OF INVESTMENTS
| Shares | Value | ||||||||||
| Common Stocks (continued) | |||||||||||
| Paper & Forest Products (0.4%) | |||||||||||
| International Paper Co. | 15,500 | $ | 522,350 | ||||||||
| 3,721,440 | |||||||||||
| Telecommunication Services (3.4%) | |||||||||||
| Diversified Telecommunication Services (3.1%) | |||||||||||
| AT&T, Inc. | 51,000 | 1,919,130 | |||||||||
| CenturyTel, Inc. | 5,900 | 264,556 | |||||||||
| Citizens Communications Co. (a) | 14,100 | 206,706 | |||||||||
| Verizon Communications, Inc. | 37,200 | 1,432,944 | |||||||||
| 3,823,336 | |||||||||||
| Wireless Telecommunication Services (0.3%) | |||||||||||
| Sprint Nextel Corp. | 24,100 | 429,703 | |||||||||
| 4,253,039 | |||||||||||
| Utilities (3.2%) | |||||||||||
| Electric Utilities (1.7%) | |||||||||||
| Edison International | 30,100 | 1,353,898 | |||||||||
| Exelon Corp. | 4,400 | 263,956 | |||||||||
| FirstEnergy Corp. | 8,300 | 492,439 | |||||||||
| Progress Energy, Inc. (a) | 200 | 9,508 | |||||||||
| 2,119,801 | |||||||||||
| Independent Power Producers & Energy Traders (0.5%) | |||||||||||
| Constellation Energy Group, Inc. | 2,700 | 195,885 | |||||||||
| TXU Corp. | 8,500 | 459,680 | |||||||||
| 655,565 | |||||||||||
| Multi-Utilities (1.0%) | |||||||||||
| CenterPoint Energy, Inc. (a) | 38,500 | 664,510 | |||||||||
| NiSource, Inc. (a) | 4,900 | 116,620 | |||||||||
| PG&E Corp. | 9,800 | 457,464 | |||||||||
| 1,238,594 | |||||||||||
| 4,013,960 | |||||||||||
| Total Common Stocks (Cost of $102,117,142) | 122,799,628 | ||||||||||
| Securities Lending Collateral (11.7%) | |||||||||||
| State Street Navigator Securities Lending Prime Portfolio (d) | 14,613,488 | 14,613,488 | |||||||||
| Total Securities Lending Collateral (Cost of $14,613,488) | 14,613,488 | ||||||||||
See Accompanying Notes to Financial Statements.
66
CMG ENHANCED S&P 500® INDEX FUND
A Portfolio of Columbia Funds Institutional Trust
SCHEDULE OF INVESTMENTS
| Par | Value | ||||||||||
| Short-Term Obligation (1.8%) | |||||||||||
| Repurchase agreement with Fixed Income Clearing Corp., dated 01/31/07, due 02/01/07 at 5.160%, collateralized by a U.S. Treasury Bond maturing 02/15/23, market value of $2,372,296 (repurchase proceeds $2,322,333) | $ | 2,322,000 | $ | 2,322,000 | |||||||
| Total Short-Term Obligation (Cost of $2,322,000) | 2,322,000 | ||||||||||
| Total Investments (111.6%) (Cost of $119,052,630) (e) | 139,735,116 | ||||||||||
| Other Assets & Liabilities, Net (-11.6%) | (14,526,020 | ) | |||||||||
| Net Assets (100.0%) | $ | 125,209,096 | |||||||||
Notes to Schedule of Investments:
(a) All or a portion of this security was on loan at January 31, 2007. The total market value of securities on loan at January 31, 2007 is $14,381,118.
(b) Non-income producing security.
(c) The security or a portion of the security is pledged as collateral for open futures contracts. At January 31, 2007, the total market value of securities pledged amounted to $784,940.
(d) Investment made with cash collateral received from securities lending activity.
(e) Cost for federal income tax purposes is $119,052,630.
At January 31, 2007, the Fund held the following open long futures contracts:
| Type | Number of Contracts | Value | Aggregate Face Value | Expiration Date | Unrealized Appreciation | ||||||||||||||||||
| S&P 500® Index | 7 | $ | 2,525,250 | $ | 2,489,633 | Mar-2007 | $ | 35,617 | |||||||||||||||
| At January 31, 2007, the Fund held investments in the following sectors: | |||
| Sector | % of Net Assets | ||||||
| Financials | 21.7 | ||||||
| Information Technology | 14.8 | ||||||
| Health Care | 12.0 | ||||||
| Consumer Discretionary | 10.7 | ||||||
| Industrials | 10.5 | ||||||
| Energy | 9.6 | ||||||
| Consumer Staples | 9.2 | ||||||
| Telecommunication Services | 3.4 | ||||||
| Utilities | 3.2 | ||||||
| Materials | 3.0 | ||||||
| 98.1 | |||||||
| Securities Lending Collateral | 11.7 | ||||||
| Short-Term Obligation | 1.8 | ||||||
| Other Assets & Liabilities, Net | (11.6 | ) | |||||
| 100.0 | |||||||
See Accompanying Notes to Financial Statements.
67
CMG LARGE CAP GROWTH FUND
A Portfolio of Columbia Funds Institutional Trust
SCHEDULE OF INVESTMENTS
January 31, 2007 (Unaudited)
| Shares | Value | ||||||||||
| Common Stocks (98.2%) | |||||||||||
| Consumer Discretionary (14.6%) | |||||||||||
| Diversified Consumer Services (0.7%) | |||||||||||
| Sotheby's | 8,564 | $ | 317,553 | ||||||||
| Hotels, Restaurants & Leisure (2.3%) | |||||||||||
| Las Vegas Sands Corp. (a) | 2,048 | 213,135 | |||||||||
| Royal Caribbean Cruises Ltd. | 8,690 | 390,442 | |||||||||
| Starwood Hotels & Resorts Worldwide, Inc. | 6,600 | 413,028 | |||||||||
| 1,016,605 | |||||||||||
| Media (4.4%) | |||||||||||
| Comcast Corp., Class A (a) | 15,530 | 688,290 | |||||||||
| Lamar Advertising Co., Class A (a) | 4,470 | 296,272 | |||||||||
| News Corp., Class A | 20,350 | 473,137 | |||||||||
| Viacom, Inc., Class B (a) | 11,550 | 469,738 | |||||||||
| 1,927,437 | |||||||||||
| Multiline Retail (2.2%) | |||||||||||
| Kohl's Corp. (a) | 4,120 | 292,149 | |||||||||
| Target Corp. | 10,810 | 663,302 | |||||||||
| 955,451 | |||||||||||
| Specialty Retail (4.3%) | |||||||||||
| CarMax, Inc. (a) | 3,550 | 203,876 | |||||||||
| GameStop Corp., Class A (a) | 7,610 | 406,602 | |||||||||
| Home Depot, Inc. | 11,540 | 470,140 | |||||||||
| J Crew Group, Inc. (a) | 7,069 | 256,817 | |||||||||
| Limited Brands, Inc. | 12,530 | 350,088 | |||||||||
| Urban Outfitters, Inc. (a) | 7,130 | 173,972 | |||||||||
| 1,861,495 | |||||||||||
| Textiles, Apparel & Luxury Goods (0.7%) | |||||||||||
| Polo Ralph Lauren Corp. | 3,480 | 285,534 | |||||||||
| 6,364,075 | |||||||||||
| Consumer Staples (8.8%) | |||||||||||
| Beverages (2.2%) | |||||||||||
| PepsiCo, Inc. | 14,760 | 962,942 | |||||||||
| Food & Staples Retailing (1.8%) | |||||||||||
| CVS Corp. | 6,360 | 214,014 | |||||||||
| Kroger Co. | 22,040 | 564,224 | |||||||||
| 778,238 | |||||||||||
| Household Products (2.7%) | |||||||||||
| Energizer Holdings, Inc. (a) | 3,320 | 282,964 | |||||||||
| Procter & Gamble Co. | 13,540 | 878,340 | |||||||||
| 1,161,304 | |||||||||||
| Personal Products (0.5%) | |||||||||||
| Avon Products, Inc. | 6,220 | 213,906 | |||||||||
| Tobacco (1.6%) | |||||||||||
| Altria Group, Inc. | 8,260 | 721,841 | |||||||||
| 3,838,231 | |||||||||||
See Accompanying Notes to Financial Statements.
68
CMG LARGE CAP GROWTH FUND
A Portfolio of Columbia Funds Institutional Trust
SCHEDULE OF INVESTMENTS
| Shares | Value | ||||||||||
| Common Stocks (continued) | |||||||||||
| Energy (5.1%) | |||||||||||
| Energy Equipment & Services (1.9%) | |||||||||||
| Halliburton Co. | 11,150 | $ | 329,371 | ||||||||
| Transocean, Inc. (a) | 6,310 | 488,205 | |||||||||
| 817,576 | |||||||||||
| Oil, Gas & Consumable Fuels (3.2%) | |||||||||||
| Devon Energy Corp. | 5,600 | 392,504 | |||||||||
| Hess Corp. | 6,670 | 360,113 | |||||||||
| Southwestern Energy Co. (a) | 6,280 | 241,529 | |||||||||
| XTO Energy, Inc. | 8,440 | 425,967 | |||||||||
| 1,420,113 | |||||||||||
| 2,237,689 | |||||||||||
| Financials (5.8%) | |||||||||||
| Capital Markets (3.0%) | |||||||||||
| Bank of New York Co., Inc. | 11,351 | 454,153 | |||||||||
| Goldman Sachs Group, Inc. | 1,430 | 303,389 | |||||||||
| Merrill Lynch & Co., Inc. | 4,720 | 441,603 | |||||||||
| State Street Corp. | 1,758 | 124,906 | |||||||||
| 1,324,051 | |||||||||||
| Diversified Financial Services (0.6%) | |||||||||||
| Nasdaq Stock Market, Inc. (a) | 7,070 | 240,946 | |||||||||
| Insurance (2.2%) | |||||||||||
| Ambac Financial Group, Inc. | 3,880 | 341,828 | |||||||||
| American International Group, Inc. | 9,020 | 617,419 | |||||||||
| 959,247 | |||||||||||
| 2,524,244 | |||||||||||
| Health Care (16.4%) | |||||||||||
| Biotechnology (3.6%) | |||||||||||
| Amgen, Inc. (a) | 11,030 | 776,181 | |||||||||
| Genentech, Inc. (a) | 3,540 | 309,290 | |||||||||
| Isis Pharmaceuticals, Inc. (a) | 14,570 | 151,382 | |||||||||
| Vertex Pharmaceuticals, Inc. (a) | 8,860 | 313,201 | |||||||||
| 1,550,054 | |||||||||||
| Health Care Equipment & Supplies (1.7%) | |||||||||||
| Cytyc Corp. (a) | 7,790 | 225,287 | |||||||||
| Zimmer Holdings, Inc. (a) | 6,120 | 515,426 | |||||||||
| 740,713 | |||||||||||
| Health Care Providers & Services (2.9%) | |||||||||||
| Caremark Rx, Inc. | 4,620 | 283,021 | |||||||||
| Humana, Inc. (a) | 4,040 | 224,220 | |||||||||
| McKesson Corp. | 8,330 | 464,398 | |||||||||
| UnitedHealth Group, Inc. | 5,440 | 284,294 | |||||||||
| 1,255,933 | |||||||||||
See Accompanying Notes to Financial Statements.
69
CMG LARGE CAP GROWTH FUND
A Portfolio of Columbia Funds Institutional Trust
SCHEDULE OF INVESTMENTS
| Shares | Value | ||||||||||
| Common Stocks (continued) | |||||||||||
| Life Sciences Tools & Services (1.4%) | |||||||||||
| Thermo Fisher Scientific, Inc. (a) | 12,560 | $ | 600,996 | ||||||||
| Pharmaceuticals (6.8%) | |||||||||||
| Abbott Laboratories | 8,050 | 426,650 | |||||||||
| Johnson & Johnson | 18,860 | 1,259,848 | |||||||||
| Merck & Co., Inc. | 4,870 | 217,933 | |||||||||
| Mylan Laboratories, Inc. | 21,240 | 470,254 | |||||||||
| Novartis AG, ADR | 5,080 | 293,065 | |||||||||
| Wyeth | 6,420 | 317,212 | |||||||||
| 2,984,962 | |||||||||||
| 7,132,658 | |||||||||||
| Industrials (13.1%) | |||||||||||
| Aerospace & Defense (5.0%) | |||||||||||
| Boeing Co. | 7,330 | 656,475 | |||||||||
| L-3 Communications Holdings, Inc. | 5,010 | 412,524 | |||||||||
| Lockheed Martin Corp. | 3,760 | 365,434 | |||||||||
| Precision Castparts Corp. | 4,180 | 371,560 | |||||||||
| United Technologies Corp. | 5,330 | 362,547 | |||||||||
| 2,168,540 | |||||||||||
| Airlines (0.8%) | |||||||||||
| Continental Airlines, Inc., Class B (a) | 8,500 | 352,665 | |||||||||
| Commercial Services & Supplies (2.1%) | |||||||||||
| Equifax, Inc. | 10,820 | 449,354 | |||||||||
| Waste Management, Inc. | 11,770 | 447,025 | |||||||||
| 896,379 | |||||||||||
| Electrical Equipment (1.0%) | |||||||||||
| Emerson Electric Co. | 10,190 | 458,244 | |||||||||
| Industrial Conglomerates (3.4%) | |||||||||||
| General Electric Co. | 30,800 | 1,110,340 | |||||||||
| Textron, Inc. | 4,110 | 382,929 | |||||||||
| 1,493,269 | |||||||||||
| Machinery (0.8%) | |||||||||||
| Caterpillar, Inc. | 5,490 | 351,744 | |||||||||
| 5,720,841 | |||||||||||
| Information Technology (28.9%) | |||||||||||
| Communications Equipment (5.6%) | |||||||||||
| Alcatel-Lucent, ADR | 11,910 | 154,830 | |||||||||
| Cisco Systems, Inc. (a) | 45,800 | 1,217,822 | |||||||||
| CommScope, Inc. (a) | 8,940 | 288,851 | |||||||||
| F5 Networks, Inc. (a) | 1,750 | 125,020 | |||||||||
| QUALCOMM, Inc. | 8,700 | 327,642 | |||||||||
| Research In Motion Ltd. (a) | 2,470 | 315,617 | |||||||||
| 2,429,782 | |||||||||||
See Accompanying Notes to Financial Statements.
70
CMG LARGE CAP GROWTH FUND
A Portfolio of Columbia Funds Institutional Trust
SCHEDULE OF INVESTMENTS
| Shares | Value | ||||||||||
| Common Stocks (continued) | |||||||||||
| Computers & Peripherals (6.6%) | |||||||||||
| Apple Computer, Inc. (a) | 7,060 | $ | 605,254 | ||||||||
| Dell, Inc. (a) | 17,660 | 428,078 | |||||||||
| EMC Corp. (a) | 34,440 | 481,816 | |||||||||
| Hewlett-Packard Co. | 11,580 | 501,182 | |||||||||
| International Business Machines Corp. | 8,830 | 875,495 | |||||||||
| 2,891,825 | |||||||||||
| Electronic Equipment & Instruments (1.1%) | |||||||||||
| Amphenol Corp., Class A | 3,410 | 230,925 | |||||||||
| Trimble Navigation Ltd. (a) | 4,480 | 253,479 | |||||||||
| 484,404 | |||||||||||
| Internet Software & Services (7.2%) | |||||||||||
| Akamai Technologies, Inc. (a) | 6,730 | 378,091 | |||||||||
| Baidu.com, Inc., ADR (a) | 1,400 | 174,916 | |||||||||
| eBay, Inc. (a) | 21,710 | 703,187 | |||||||||
| Google, Inc., Class A (a) | 2,398 | 1,202,118 | |||||||||
| VeriSign, Inc. (a) | 8,620 | 206,018 | |||||||||
| Yahoo!, Inc. (a) | 17,340 | 490,895 | |||||||||
| 3,155,225 | |||||||||||
| IT Services (1.0%) | |||||||||||
| Cognizant Technology Solutions Corp., Class A (a) | 4,960 | 423,038 | |||||||||
| Semiconductors & Semiconductor Equipment (3.0%) | |||||||||||
| Intel Corp. | 31,020 | 650,179 | |||||||||
| MEMC Electronic Materials, Inc. (a) | 4,940 | 258,856 | |||||||||
| Texas Instruments, Inc. | 12,350 | 385,197 | |||||||||
| 1,294,232 | |||||||||||
| Software (4.4%) | |||||||||||
| Adobe Systems, Inc. (a) | 8,440 | 328,063 | |||||||||
| Microsoft Corp. | 39,790 | 1,227,919 | |||||||||
| Oracle Corp. (a) | 12,120 | 207,979 | |||||||||
| THQ, Inc. (a) | 5,720 | 173,316 | |||||||||
| 1,937,277 | |||||||||||
| 12,615,783 | |||||||||||
| Materials (2.0%) | |||||||||||
| Chemicals (2.0%) | |||||||||||
| E.I. du Pont de Nemours & Co. | 9,470 | 469,333 | |||||||||
| Monsanto Co. | 7,328 | 403,700 | |||||||||
| 873,033 | |||||||||||
| Telecommunication Services (3.5%) | |||||||||||
| Diversified Telecommunication Services (1.5%) | |||||||||||
| Level 3 Communications, Inc. (a) | 24,095 | 149,630 | |||||||||
| Time Warner Telecom, Inc., Class A (a) | 21,348 | 496,981 | |||||||||
| 646,611 | |||||||||||
See Accompanying Notes to Financial Statements.
71
CMG LARGE CAP GROWTH FUND
A Portfolio of Columbia Funds Institutional Trust
SCHEDULE OF INVESTMENTS
| Shares | Value | ||||||||||
| Common Stocks (continued) | |||||||||||
| Wireless Telecommunication Services (2.0%) | |||||||||||
| American Tower Corp., Class A (a) | 11,540 | $ | 459,638 | ||||||||
| NII Holdings, Inc. (a) | 5,420 | 399,996 | |||||||||
| 859,634 | |||||||||||
| 1,506,245 | |||||||||||
| Total Common Stocks (Cost of $37,586,071) | 42,812,799 | ||||||||||
| Par | |||||||||||
| Short-Term Obligation (1.0%) | |||||||||||
| Repurchase agreement with Fixed Income Clearing Corp., dated 01/31/07, due 02/01/07 at 5.160%, collateralized by a U.S. Government Note maturing 08/15/11, market value of $432,600 (repurchase proceeds $423,061) | $ | 423,000 | 423,000 | ||||||||
| Total Short-Term Obligation (Cost of $423,000) | 423,000 | ||||||||||
| Total Investments (99.2%) (Cost of $38,009,071) (b) | 43,235,799 | ||||||||||
| Other Assets & Liabilities, Net (0.8%) | 336,837 | ||||||||||
| Net Assets (100.0%) | $ | 43,572,636 | |||||||||
Notes to Schedule of Investments:
(a) Non-income producing security.
(b) Cost for federal income tax purposes is $38,009,071.
At January 31, 2007, the Fund held investments in the following sectors:
| Sector | % of Net Assets | ||||||
| Information Technology | 28.9 | ||||||
| Health Care | 16.4 | ||||||
| Consumer Discretionary | 14.6 | ||||||
| Industrials | 13.1 | ||||||
| Consumer Staples | 8.8 | ||||||
| Financials | 5.8 | ||||||
| Energy | 5.1 | ||||||
| Telecommunication Services | 3.5 | ||||||
| Materials | 2.0 | ||||||
| 98.2 | |||||||
| Short-Term Obligation | 1.0 | ||||||
| Other Assets & Liabilities, Net | 0.8 | ||||||
| 100.0 | |||||||
| Acronym | Name | ||||||
| ADR | American Depositary Receipt | ||||||
See Accompanying Notes to Financial Statements.
72
CMG LARGE CAP VALUE FUND
A Portfolio of Columbia Funds Institutional Trust
SCHEDULE OF INVESTMENTS
January 31, 2007 (Unaudited)
| Shares | Value | ||||||||||
| Common Stocks (97.8%) | |||||||||||
| Consumer Discretionary (7.7%) | |||||||||||
| Hotels, Restaurants & Leisure (1.2%) | |||||||||||
| McDonald's Corp. | 10,866 | $ | 481,907 | ||||||||
| Household Durables (2.2%) | |||||||||||
| Centex Corp. | 4,400 | 236,236 | |||||||||
| Lennar Corp., Class A | 4,700 | 255,586 | |||||||||
| Newell Rubbermaid, Inc. | 12,600 | 372,204 | |||||||||
| 864,026 | |||||||||||
| Media (2.0%) | |||||||||||
| News Corp., Class A | 17,000 | 395,250 | |||||||||
| Time Warner, Inc. | 17,300 | 378,351 | |||||||||
| 773,601 | |||||||||||
| Multiline Retail (1.7%) | |||||||||||
| Federated Department Stores, Inc. | 16,332 | 677,615 | |||||||||
| Specialty Retail (0.5%) | |||||||||||
| Limited Brands, Inc. | 7,200 | 201,168 | |||||||||
| Textiles, Apparel & Luxury Goods (0.1%) | |||||||||||
| Polo Ralph Lauren Corp. | 733 | 60,142 | |||||||||
| 3,058,459 | |||||||||||
| Consumer Staples (8.2%) | |||||||||||
| Beverages (2.2%) | |||||||||||
| Anheuser-Busch Companies, Inc. | 3,700 | 188,589 | |||||||||
| Coca-Cola Enterprises, Inc. | 10,166 | 208,607 | |||||||||
| Diageo PLC, ADR | 6,199 | 488,047 | |||||||||
| 885,243 | |||||||||||
| Food Products (1.2%) | |||||||||||
| Kraft Foods, Inc., Class A | 7,300 | 254,916 | |||||||||
| Tyson Foods, Inc., Class A | 11,800 | 209,450 | |||||||||
| 464,366 | |||||||||||
| Household Products (1.0%) | |||||||||||
| Colgate-Palmolive Co. | 5,900 | 402,970 | |||||||||
| Personal Products (0.6%) | |||||||||||
| Avon Products, Inc. | 6,200 | 213,218 | |||||||||
| Tobacco (3.2%) | |||||||||||
| Altria Group, Inc. | 6,629 | 579,308 | |||||||||
| Loews Corp. - Carolina Group | 10,100 | 692,254 | |||||||||
| 1,271,562 | |||||||||||
| 3,237,359 | |||||||||||
See Accompanying Notes to Financial Statements.
73
CMG LARGE CAP VALUE FUND
A Portfolio of Columbia Funds Institutional Trust
SCHEDULE OF INVESTMENTS
| Shares | Value | ||||||||||
| Common Stocks (continued) | |||||||||||
| Energy (14.0%) | |||||||||||
| Energy Equipment & Services (3.6%) | |||||||||||
| ENSCO International, Inc. | 6,200 | $ | 315,394 | ||||||||
| Halliburton Co. | 6,454 | 190,651 | |||||||||
| National-Oilwell Varco, Inc. (a) | 4,200 | 254,688 | |||||||||
| Rowan Companies, Inc. | 9,500 | 312,455 | |||||||||
| Schlumberger Ltd. | 5,650 | 358,719 | |||||||||
| 1,431,907 | |||||||||||
| Oil, Gas & Consumable Fuels (10.4%) | |||||||||||
| ConocoPhillips | 8,832 | 586,533 | |||||||||
| Exxon Mobil Corp. | 14,535 | 1,077,043 | |||||||||
| Hess Corp. | 8,900 | 480,511 | |||||||||
| Newfield Exploration Co. (a) | 6,100 | 261,141 | |||||||||
| Occidental Petroleum Corp. | 13,500 | 625,860 | |||||||||
| Peabody Energy Corp. | 10,400 | 424,632 | |||||||||
| Total SA, ADR | 4,800 | 326,640 | |||||||||
| Williams Companies, Inc. | 12,200 | 329,278 | |||||||||
| 4,111,638 | |||||||||||
| 5,543,545 | |||||||||||
| Financials (34.7%) | |||||||||||
| Capital Markets (5.9%) | |||||||||||
| Bank of New York Co., Inc. | 4,103 | 164,161 | |||||||||
| Deutsche Bank AG, Registered Shares | 3,100 | 440,231 | |||||||||
| Merrill Lynch & Co., Inc. | 13,280 | 1,242,477 | |||||||||
| Nuveen Investments, Inc., Class A | 533 | 26,383 | |||||||||
| State Street Corp. | 6,832 | 485,414 | |||||||||
| 2,358,666 | |||||||||||
| Commercial Banks (11.1%) | |||||||||||
| Barclays PLC, ADR | 7,400 | 436,526 | |||||||||
| Marshall & Ilsley Corp. | 9,520 | 448,011 | |||||||||
| PNC Financial Services Group, Inc. | 9,200 | 678,684 | |||||||||
| SunTrust Banks, Inc. | 4,800 | 398,880 | |||||||||
| U.S. Bancorp | 26,546 | 945,038 | |||||||||
| UnionBanCal Corp. | 1,500 | 96,930 | |||||||||
| Wachovia Corp. | 8,522 | 481,493 | |||||||||
| Wells Fargo & Co. | 24,956 | 896,419 | |||||||||
| 4,381,981 | |||||||||||
| Diversified Financial Services (8.6%) | |||||||||||
| CIT Group, Inc. | 8,600 | 507,056 | |||||||||
| Citigroup, Inc. | 26,485 | 1,460,118 | |||||||||
| JPMorgan Chase & Co. | 28,600 | 1,456,598 | |||||||||
| 3,423,772 | |||||||||||
See Accompanying Notes to Financial Statements.
74
CMG LARGE CAP VALUE FUND
A Portfolio of Columbia Funds Institutional Trust
SCHEDULE OF INVESTMENTS
| Shares | Value | ||||||||||
| Common Stocks (continued) | |||||||||||
| Insurance (6.1%) | |||||||||||
| Ambac Financial Group, Inc. | 6,785 | $ | 597,759 | ||||||||
| American International Group, Inc. | 8,251 | 564,781 | |||||||||
| Genworth Financial, Inc., Class A | 10,800 | 376,920 | |||||||||
| Hartford Financial Services Group, Inc. | 4,955 | 470,279 | |||||||||
| Prudential Financial, Inc. | 4,500 | 401,085 | |||||||||
| 2,410,824 | |||||||||||
| Real Estate Investment Trusts (REITs) (2.5%) | |||||||||||
| Archstone-Smith Trust | 3,055 | 193,106 | |||||||||
| General Growth Properties, Inc. | 5,900 | 362,968 | |||||||||
| Kimco Realty Corp. | 4,636 | 229,946 | |||||||||
| ProLogis | 2,900 | 188,500 | |||||||||
| 974,520 | |||||||||||
| Thrifts & Mortgage Finance (0.5%) | |||||||||||
| Washington Mutual, Inc. | 4,400 | 196,196 | |||||||||
| 13,745,959 | |||||||||||
| Health Care (7.9%) | |||||||||||
| Health Care Providers & Services (1.5%) | |||||||||||
| Aetna, Inc. | 7,044 | 296,975 | |||||||||
| CIGNA Corp. | 2,177 | 288,235 | |||||||||
| 585,210 | |||||||||||
| Life Sciences Tools & Services (0.8%) | |||||||||||
| Thermo Fisher Scientific, Inc. (a) | 6,400 | 306,240 | |||||||||
| Pharmaceuticals (5.6%) | |||||||||||
| Johnson & Johnson | 5,700 | 380,760 | |||||||||
| Merck & Co., Inc. | 8,600 | 384,850 | |||||||||
| Novartis AG, ADR | 6,548 | 377,754 | |||||||||
| Pfizer, Inc. | 40,862 | 1,072,219 | |||||||||
| 2,215,583 | |||||||||||
| 3,107,033 | |||||||||||
| Industrials (8.4%) | |||||||||||
| Aerospace & Defense (4.6%) | |||||||||||
| Boeing Co. | 6,400 | 573,184 | |||||||||
| L-3 Communications Holdings, Inc. | 7,100 | 584,614 | |||||||||
| United Technologies Corp. | 9,696 | 659,522 | |||||||||
| 1,817,320 | |||||||||||
| Electrical Equipment (1.2%) | |||||||||||
| ABB Ltd., ADR | 26,797 | 477,254 | |||||||||
| Industrial Conglomerates (2.6%) | |||||||||||
| General Electric Co. | 28,892 | 1,041,557 | |||||||||
| 3,336,131 | |||||||||||
See Accompanying Notes to Financial Statements.
75
CMG LARGE CAP VALUE FUND
A Portfolio of Columbia Funds Institutional Trust
SCHEDULE OF INVESTMENTS
| Shares | Value | ||||||||||
| Common Stocks (continued) | |||||||||||
| Information Technology (3.8%) | |||||||||||
| Computers & Peripherals (1.5%) | |||||||||||
| Hewlett-Packard Co. | 14,100 | $ | 610,248 | ||||||||
| Electronic Equipment & Instruments (1.1%) | |||||||||||
| Agilent Technologies, Inc. (a) | 12,900 | 412,800 | |||||||||
| Semiconductors & Semiconductor Equipment (1.0%) | |||||||||||
| Fairchild Semiconductor International, Inc. (a) | 18,000 | 320,580 | |||||||||
| Intersil Corp., Class A | 2,400 | 56,544 | |||||||||
| 377,124 | |||||||||||
| Software (0.2%) | |||||||||||
| Electronic Arts, Inc. (a) | 1,800 | 90,000 | |||||||||
| 1,490,172 | |||||||||||
| Materials (3.4%) | |||||||||||
| Chemicals (0.4%) | |||||||||||
| Rohm and Haas Co. | 3,300 | 171,798 | |||||||||
| Construction Materials (0.5%) | |||||||||||
| Vulcan Materials Co. | 2,000 | 203,680 | |||||||||
| Containers & Packaging (0.7%) | |||||||||||
| Crown Holdings, Inc. (a) | 12,300 | 271,461 | |||||||||
| Paper & Forest Products (1.8%) | |||||||||||
| Weyerhaeuser Co. | 9,500 | 712,500 | |||||||||
| 1,359,439 | |||||||||||
| Telecommunication Services (4.5%) | |||||||||||
| Diversified Telecommunication Services (4.5%) | |||||||||||
| AT&T, Inc. | 33,557 | 1,262,750 | |||||||||
| Verizon Communications, Inc. | 13,070 | 503,456 | |||||||||
| 1,766,206 | |||||||||||
| Utilities (5.2%) | |||||||||||
| Electric Utilities (3.1%) | |||||||||||
| Entergy Corp. | 4,773 | 443,173 | |||||||||
| FPL Group, Inc. | 7,000 | 396,550 | |||||||||
| PPL Corp. | 11,100 | 395,160 | |||||||||
| 1,234,883 | |||||||||||
| Multi-Utilities (2.1%) | |||||||||||
| PG&E Corp. | 7,033 | 328,301 | |||||||||
| Public Service Enterprise Group, Inc. | 7,600 | 509,428 | |||||||||
| 837,729 | |||||||||||
| 2,072,612 | |||||||||||
| Total Common Stocks (Cost of $32,500,811) | 38,716,915 | ||||||||||
See Accompanying Notes to Financial Statements.
76
CMG LARGE CAP VALUE FUND
A Portfolio of Columbia Funds Institutional Trust
SCHEDULE OF INVESTMENTS
| Par | Value | ||||||||||
| Convertible Bonds (1.3%) | |||||||||||
| Consumer Discretionary (1.3%) | |||||||||||
| Media (1.3%) | |||||||||||
| Liberty Media Corp. 0.750% 03/30/23 | $ | 400,000 | $ | 510,500 | |||||||
| Total Convertible Bonds (Cost of $437,559) | 510,500 | ||||||||||
| Short-Term Obligation (0.8%) | |||||||||||
| Repurchase agreement with Fixed Income Clearing Corp., dated 01/31/07, due 02/01/07 at 5.160%, collateralized by a U.S. Treasury Bond maturing 08/15/29, market value of $345,563 (repurchase proceeds $336,048) | 336,000 | 336,000 | |||||||||
| Total Short-Term Obligation (Cost of $336,000) | 336,000 | ||||||||||
| Total Investments (99.9%) (Cost of $33,274,370) (b) | 39,563,415 | ||||||||||
| Other Assets & Liabilities, Net (0.1%) | 22,818 | ||||||||||
| Net Assets (100.0%) | $ | 39,586,233 | |||||||||
Notes to Schedule of Investments:
(a) Non-income producing security.
(b) Cost for federal income tax purposes is $33,274,370.
At January 31, 2007, the Fund held investments in the following sectors:
| Sector | % of Net Assets | ||||||
| Financials | 34.7 | ||||||
| Energy | 14.0 | ||||||
| Industrials | 8.4 | ||||||
| Consumer Staples | 8.2 | ||||||
| Health Care | 7.9 | ||||||
| Consumer Discretionary | 9.0 | ||||||
| Utilities | 5.2 | ||||||
| Telecommunication Services | 4.5 | ||||||
| Information Technology | 3.8 | ||||||
| Materials | 3.4 | ||||||
| 99.1 | |||||||
| Short-Term Obligation | 0.8 | ||||||
| Other Assets & Liabilities, Net | 0.1 | ||||||
| 100.0 | |||||||
| Acronym | Name | ||||||
| ADR | American Depositary Receipt | ||||||
See Accompanying Notes to Financial Statements.
77
CMG MID CAP GROWTH FUND
A Portfolio of Columbia Funds Institutional Trust
SCHEDULE OF INVESTMENTS
January 31, 2007 (Unaudited)
| Shares | Value | ||||||||||
| Common Stocks (97.1%) | |||||||||||
| Consumer Discretionary (20.1%) | |||||||||||
| Automobiles (0.4%) | |||||||||||
| Harley-Davidson, Inc. | 1,600 | $ | 109,232 | ||||||||
| Hotels, Restaurants & Leisure (5.9%) | |||||||||||
| Brinker International, Inc. | 3,370 | 106,324 | |||||||||
| Darden Restaurants, Inc. | 2,250 | 88,065 | |||||||||
| Harrah's Entertainment, Inc. | 2,835 | 239,501 | |||||||||
| Hilton Hotels Corp. | 7,470 | 264,363 | |||||||||
| International Game Technology, Inc. | 4,730 | 205,566 | |||||||||
| Marriott International, Inc., Class A | 4,260 | 205,076 | |||||||||
| Scientific Games Corp., Class A (a) | 3,000 | 93,120 | |||||||||
| Starwood Hotels & Resorts Worldwide, Inc. | 1,940 | 121,405 | |||||||||
| Wynn Resorts Ltd. | 870 | 97,214 | |||||||||
| Yum! Brands, Inc. | 3,130 | 187,831 | |||||||||
| 1,608,465 | |||||||||||
| Household Durables (1.4%) | |||||||||||
| Centex Corp. | 2,560 | 137,447 | |||||||||
| Harman International Industries, Inc. | 1,120 | 105,918 | |||||||||
| Newell Rubbermaid, Inc. | 4,580 | 135,293 | |||||||||
| 378,658 | |||||||||||
| Internet & Catalog Retail (0.7%) | |||||||||||
| Nutri/System, Inc. (a) | 2,590 | 114,090 | |||||||||
| Priceline.com, Inc. (a) | 1,510 | 64,356 | |||||||||
| 178,446 | |||||||||||
| Media (3.0%) | |||||||||||
| EchoStar Communications Corp., Class A (a) | 2,930 | 118,196 | |||||||||
| Getty Images, Inc. (a) | 1,810 | 89,125 | |||||||||
| Grupo Televisa SA, ADR | 7,420 | 218,593 | |||||||||
| Lamar Advertising Co., Class A (a) | 1,730 | 114,665 | |||||||||
| NET Servicos de Comunicacao SA, ADR | 7,840 | 95,178 | |||||||||
| Regal Entertainment Group, Class A | 3,740 | 84,150 | |||||||||
| XM Satellite Radio Holdings, Inc., Class A (a) | 6,140 | 87,249 | |||||||||
| 807,156 | |||||||||||
| Multiline Retail (2.2%) | |||||||||||
| J.C. Penney Co., Inc. | 3,400 | 276,216 | |||||||||
| Nordstrom, Inc. | 6,020 | 335,374 | |||||||||
| 611,590 | |||||||||||
| Specialty Retail (3.2%) | |||||||||||
| AutoZone, Inc. (a) | 660 | 82,916 | |||||||||
| GameStop Corp., Class A (a) | 4,660 | 248,984 | |||||||||
| Office Depot, Inc. (a) | 2,990 | 111,796 | |||||||||
| PETsMART, Inc. | 4,190 | 127,962 | |||||||||
| TJX Companies, Inc. | 8,300 | 245,431 | |||||||||
| Tractor Supply Co. (a) | 1,130 | 56,873 | |||||||||
| 873,962 | |||||||||||
| Textiles, Apparel & Luxury Goods (3.3%) | |||||||||||
| Carter's, Inc. (a) | 5,160 | 131,064 | |||||||||
| Coach, Inc. (a) | 11,160 | 511,798 | |||||||||
See Accompanying Notes to Financial Statements.
78
CMG MID CAP GROWTH FUND
A Portfolio of Columbia Funds Institutional Trust
SCHEDULE OF INVESTMENTS
| Shares | Value | ||||||||||
| Common Stocks (continued) | |||||||||||
| Textiles, Apparel & Luxury Goods (continued) | |||||||||||
| Phillips-Van Heusen Corp. | 3,300 | $ | 181,995 | ||||||||
| Polo Ralph Lauren Corp. | 750 | 61,537 | |||||||||
| 886,394 | |||||||||||
| 5,453,903 | |||||||||||
| Consumer Staples (5.9%) | |||||||||||
| Beverages (1.1%) | |||||||||||
| Hansen Natural Corp. (a) | 4,210 | 160,359 | |||||||||
| Pepsi Bottling Group, Inc. | 4,080 | 129,051 | |||||||||
| 289,410 | |||||||||||
| Food & Staples Retailing (0.6%) | |||||||||||
| Kroger Co. | 4,800 | 122,880 | |||||||||
| Whole Foods Market, Inc. | 770 | 33,256 | |||||||||
| 156,136 | |||||||||||
| Food Products (2.6%) | |||||||||||
| Campbell Soup Co. | 2,630 | 101,202 | |||||||||
| Dean Foods Co. (a) | 3,890 | 172,133 | |||||||||
| H.J. Heinz Co. | 3,410 | 160,679 | |||||||||
| Hershey Co. | 2,260 | 115,351 | |||||||||
| McCormick & Co., Inc. | 3,830 | 149,523 | |||||||||
| 698,888 | |||||||||||
| Personal Products (1.2%) | |||||||||||
| Alberto-Culver Co. | 1,860 | 42,538 | |||||||||
| Avon Products, Inc. | 5,410 | 186,050 | |||||||||
| Estee Lauder Companies, Inc., Class A | 2,370 | 112,575 | |||||||||
| 341,163 | |||||||||||
| Tobacco (0.4%) | |||||||||||
| UST, Inc. | 2,180 | 125,219 | |||||||||
| 1,610,816 | |||||||||||
| Energy (7.3%) | |||||||||||
| Energy Equipment & Services (3.5%) | |||||||||||
| BJ Services Co. | 6,460 | 178,683 | |||||||||
| Diamond Offshore Drilling, Inc. | 1,380 | 116,527 | |||||||||
| FMC Technologies, Inc. (a) | 2,700 | 167,211 | |||||||||
| Grant Prideco, Inc. (a) | 3,050 | 119,499 | |||||||||
| National-Oilwell Varco, Inc. (a) | 2,620 | 158,877 | |||||||||
| Patterson-UTI Energy, Inc. | 3,900 | 94,185 | |||||||||
| Smith International, Inc. | 2,570 | 101,978 | |||||||||
| 936,960 | |||||||||||
| Oil, Gas & Consumable Fuels (3.8%) | |||||||||||
| Cameco Corp. | 3,170 | 120,872 | |||||||||
| Chesapeake Energy Corp. | 8,140 | 241,025 | |||||||||
| Denbury Resources, Inc. (a) | 6,880 | 190,576 | |||||||||
| Helix Energy Solutions Group, Inc. (a) | 3,070 | 98,762 | |||||||||
See Accompanying Notes to Financial Statements.
79
CMG MID CAP GROWTH FUND
A Portfolio of Columbia Funds Institutional Trust
SCHEDULE OF INVESTMENTS
| Shares | Value | ||||||||||
| Common Stocks (continued) | |||||||||||
| Oil, Gas & Consumable Fuels (continued) | |||||||||||
| Petroplus Holdings AG (a) | 1,581 | $ | 101,065 | ||||||||
| Range Resources Corp. | 5,010 | 153,757 | |||||||||
| Southwestern Energy Co. (a) | 3,189 | 122,649 | |||||||||
| 1,028,706 | |||||||||||
| 1,965,666 | |||||||||||
| Financials (9.3%) | |||||||||||
| Capital Markets (4.0%) | |||||||||||
| Affiliated Managers Group, Inc. (a) | 2,640 | 294,096 | |||||||||
| Bear Stearns Companies, Inc. | 1,130 | 186,280 | |||||||||
| E*TRADE Financial Corp. (a) | 4,190 | 102,152 | |||||||||
| Investment Technology Group, Inc. (a) | 2,050 | 89,380 | |||||||||
| Lazard Ltd., Class A | 3,000 | 152,280 | |||||||||
| T. Rowe Price Group, Inc. | 5,440 | 261,066 | |||||||||
| 1,085,254 | |||||||||||
| Commercial Banks (1.3%) | |||||||||||
| City National Corp. | 2,100 | 151,053 | |||||||||
| East West Bancorp, Inc. | 1,840 | 70,656 | |||||||||
| Zions Bancorporation | 1,590 | 134,864 | |||||||||
| 356,573 | |||||||||||
| Diversified Financial Services (0.8%) | |||||||||||
| Chicago Mercantile Exchange Holdings, Inc., Class A | 310 | 174,623 | |||||||||
| IntercontinentalExchange, Inc. (a) | 210 | 27,415 | |||||||||
| 202,038 | |||||||||||
| Insurance (1.4%) | |||||||||||
| Ambac Financial Group, Inc. | 3,085 | 271,788 | |||||||||
| Hanover Insurance Group, Inc. | 2,070 | 99,464 | |||||||||
| 371,252 | |||||||||||
| Real Estate Investment Trusts (REITs) (0.8%) | |||||||||||
| CapitalSource, Inc. | 3,820 | 106,158 | |||||||||
| General Growth Properties, Inc. | 1,950 | 119,964 | |||||||||
| 226,122 | |||||||||||
| Real Estate Management & Development (1.0%) | |||||||||||
| CB Richard Ellis Group, Inc., Class A (a) | 4,760 | 179,024 | |||||||||
| St. Joe Co. | 1,650 | 95,535 | |||||||||
| 274,559 | |||||||||||
| 2,515,798 | |||||||||||
| Health Care (14.2%) | |||||||||||
| Biotechnology (1.4%) | |||||||||||
| Celgene Corp. (a) | 2,380 | 127,758 | |||||||||
| Cephalon, Inc. (a) | 1,430 | 103,546 | |||||||||
| MedImmune, Inc. (a) | 2,030 | 70,360 | |||||||||
| Vertex Pharmaceuticals, Inc. (a) | 2,040 | 72,114 | |||||||||
| 373,778 | |||||||||||
See Accompanying Notes to Financial Statements.
80
CMG MID CAP GROWTH FUND
A Portfolio of Columbia Funds Institutional Trust
SCHEDULE OF INVESTMENTS
| Shares | Value | ||||||||||
| Common Stocks (continued) | |||||||||||
| Health Care Equipment & Supplies (3.5%) | |||||||||||
| C.R. Bard, Inc. | 1,580 | $ | 130,382 | ||||||||
| Cytyc Corp. (a) | 4,990 | 144,311 | |||||||||
| Dade Behring Holdings, Inc. | 2,590 | 108,987 | |||||||||
| Gen-Probe, Inc. (a) | 1,920 | 99,302 | |||||||||
| Kinetic Concepts, Inc. (a) | 1,240 | 60,996 | |||||||||
| ResMed, Inc. (a) | 1,142 | 60,046 | |||||||||
| St. Jude Medical, Inc. (a) | 4,250 | 181,730 | |||||||||
| Varian Medical Systems, Inc. (a) | 3,923 | 180,968 | |||||||||
| 966,722 | |||||||||||
| Health Care Providers & Services (4.9%) | |||||||||||
| Coventry Health Care, Inc. (a) | 1,730 | 89,181 | |||||||||
| DaVita, Inc. (a) | 3,107 | 169,642 | |||||||||
| Express Scripts, Inc. (a) | 2,230 | 155,029 | |||||||||
| Henry Schein, Inc. (a) | 2,290 | 116,263 | |||||||||
| Humana, Inc. (a) | 1,930 | 107,115 | |||||||||
| Laboratory Corp. of America Holdings (a) | 1,490 | 109,426 | |||||||||
| Manor Care, Inc. | 2,240 | 119,258 | |||||||||
| McKesson Corp. | 1,950 | 108,712 | |||||||||
| Medco Health Solutions, Inc. (a) | 1,170 | 69,276 | |||||||||
| Patterson Companies, Inc. (a) | 2,960 | 111,326 | |||||||||
| Quest Diagnostics, Inc. | 3,329 | 174,706 | |||||||||
| 1,329,934 | |||||||||||
| Health Care Technology (0.4%) | |||||||||||
| IMS Health, Inc. | 3,530 | 101,876 | |||||||||
| Life Sciences Tools & Services (2.5%) | |||||||||||
| Covance, Inc. (a) | 1,300 | 80,145 | |||||||||
| Invitrogen Corp. (a) | 2,200 | 134,706 | |||||||||
| Pharmaceutical Product Development, Inc. | 1,600 | 55,200 | |||||||||
| Thermo Fisher Scientific, Inc. (a) | 4,670 | 223,459 | |||||||||
| Waters Corp. (a) | 3,150 | 178,574 | |||||||||
| 672,084 | |||||||||||
| Pharmaceuticals (1.5%) | |||||||||||
| Allergan, Inc. | 2,620 | 305,780 | |||||||||
| Forest Laboratories, Inc. (a) | 1,740 | 97,632 | |||||||||
| 403,412 | |||||||||||
| 3,847,806 | |||||||||||
| Industrials (12.4%) | |||||||||||
| Aerospace & Defense (3.1%) | |||||||||||
| Alliant Techsystems, Inc. (a) | 1,330 | 107,730 | |||||||||
| BE Aerospace, Inc. (a) | 4,230 | 125,969 | |||||||||
| Precision Castparts Corp. | 3,040 | 270,226 | |||||||||
| Rockwell Collins, Inc. | 3,470 | 236,689 | |||||||||
| Spirit Aerosystems Holdings, Inc., Class A (a) | 3,054 | 93,544 | |||||||||
| 834,158 | |||||||||||
See Accompanying Notes to Financial Statements.
81
CMG MID CAP GROWTH FUND
A Portfolio of Columbia Funds Institutional Trust
SCHEDULE OF INVESTMENTS
| Shares | Value | ||||||||||
| Common Stocks (continued) | |||||||||||
| Air Freight & Logistics (1.0%) | |||||||||||
| C.H. Robinson Worldwide, Inc. | 3,180 | $ | 168,699 | ||||||||
| Expeditors International Washington, Inc. | 2,640 | 112,701 | |||||||||
| 281,400 | |||||||||||
| Airlines (0.4%) | |||||||||||
| Gol Linhas Aereas Inteligentes SA, ADR | 3,260 | 98,159 | |||||||||
| Commercial Services & Supplies (3.1%) | |||||||||||
| Corporate Executive Board Co. | 2,135 | 193,709 | |||||||||
| Dun & Bradstreet Corp. (a) | 1,880 | 159,800 | |||||||||
| Equifax, Inc. | 1,370 | 56,896 | |||||||||
| Monster Worldwide, Inc. (a) | 2,850 | 140,818 | |||||||||
| Robert Half International, Inc. | 5,160 | 210,012 | |||||||||
| Stericycle, Inc. (a) | 1,040 | 80,080 | |||||||||
| 841,315 | |||||||||||
| Construction & Engineering (0.3%) | |||||||||||
| Jacobs Engineering Group, Inc. (a) | 830 | 75,156 | |||||||||
| Electrical Equipment (0.8%) | |||||||||||
| Rockwell Automation, Inc. | 1,680 | 102,833 | |||||||||
| Roper Industries, Inc. | 2,190 | 113,705 | |||||||||
| 216,538 | |||||||||||
| Machinery (2.1%) | |||||||||||
| Gardner Denver, Inc. (a) | 1,730 | 66,692 | |||||||||
| Joy Global, Inc. | 5,365 | 249,312 | |||||||||
| Terex Corp. (a) | 2,260 | 128,571 | |||||||||
| Timken Co. | 4,130 | 118,159 | |||||||||
| 562,734 | |||||||||||
| Marine (0.5%) | |||||||||||
| American Commercial Lines, Inc. (a) | 1,910 | 134,540 | |||||||||
| Road & Rail (0.9%) | |||||||||||
| CSX Corp. | 1,500 | 55,185 | |||||||||
| Landstar System, Inc. | 4,300 | 181,847 | |||||||||
| 237,032 | |||||||||||
| Trading Companies & Distributors (0.2%) | |||||||||||
| WESCO International, Inc. (a) | 1,130 | 68,614 | |||||||||
| 3,349,646 | |||||||||||
| Information Technology (17.7%) | |||||||||||
| Communications Equipment (1.4%) | |||||||||||
| F5 Networks, Inc. (a) | 1,490 | 106,446 | |||||||||
| Harris Corp. | 3,980 | 202,263 | |||||||||
| Tellabs, Inc. (a) | 7,640 | 76,935 | |||||||||
| 385,644 | |||||||||||
See Accompanying Notes to Financial Statements.
82
CMG MID CAP GROWTH FUND
A Portfolio of Columbia Funds Institutional Trust
SCHEDULE OF INVESTMENTS
| Shares | Value | ||||||||||
| Common Stocks (continued) | |||||||||||
| Computers & Peripherals (1.7%) | |||||||||||
| Network Appliance, Inc. (a) | 6,530 | $ | 245,528 | ||||||||
| SanDisk Corp. (a) | 3,740 | 150,348 | |||||||||
| Western Digital Corp. (a) | 3,760 | 73,696 | |||||||||
| 469,572 | |||||||||||
| Electronic Equipment & Instruments (1.0%) | |||||||||||
| Amphenol Corp., Class A | 1,920 | 130,023 | |||||||||
| Jabil Circuit, Inc. | 2,770 | 66,452 | |||||||||
| Trimble Navigation Ltd. (a) | 1,410 | 79,778 | |||||||||
| 276,253 | |||||||||||
| Internet Software & Services (1.0%) | |||||||||||
| Akamai Technologies, Inc. (a) | 2,020 | 113,484 | |||||||||
| Equinix, Inc. (a) | 1,750 | 147,122 | |||||||||
| 260,606 | |||||||||||
| IT Services (4.1%) | |||||||||||
| Alliance Data Systems Corp. (a) | 3,530 | 239,793 | |||||||||
| Cognizant Technology Solutions Corp., Class A (a) | 4,520 | 385,511 | |||||||||
| Fiserv, Inc. (a) | 3,000 | 157,710 | |||||||||
| Global Payments, Inc. | 4,324 | 163,274 | |||||||||
| Paychex, Inc. | 3,940 | 157,639 | |||||||||
| 1,103,927 | |||||||||||
| Semiconductors & Semiconductor Equipment (3.8%) | |||||||||||
| Intersil Corp., Class A | 2,170 | 51,125 | |||||||||
| KLA-Tencor Corp. | 2,630 | 129,475 | |||||||||
| Lam Research Corp. (a) | 1,630 | 74,670 | |||||||||
| Marvell Technology Group Ltd. (a) | 4,640 | 84,866 | |||||||||
| MEMC Electronic Materials, Inc. (a) | 5,890 | 308,636 | |||||||||
| National Semiconductor Corp. | 5,780 | 133,691 | |||||||||
| NVIDIA Corp. (a) | 3,350 | 102,678 | |||||||||
| Qimonda AG, ADR (a) | 10,160 | 158,293 | |||||||||
| 1,043,434 | |||||||||||
| Software (4.7%) | |||||||||||
| Activision, Inc. (a) | 9,360 | 159,401 | |||||||||
| Amdocs Ltd. (a) | 3,140 | 108,895 | |||||||||
| Autodesk, Inc. (a) | 3,857 | 168,628 | |||||||||
| BEA Systems, Inc. (a) | 6,500 | 80,145 | |||||||||
| BMC Software, Inc. (a) | 3,420 | 117,614 | |||||||||
| Citrix Systems, Inc. (a) | 4,484 | 142,008 | |||||||||
| Electronic Arts, Inc. (a) | 1,320 | 66,000 | |||||||||
| Hyperion Solutions Corp. (a) | 2,637 | 111,334 | |||||||||
| Intuit, Inc. (a) | 5,632 | 177,127 | |||||||||
| Salesforce.com, Inc. (a) | 1,240 | 54,349 | |||||||||
| THQ, Inc. (a) | 2,770 | 83,931 | |||||||||
| 1,269,432 | |||||||||||
| 4,808,868 | |||||||||||
| Materials (3.4%) | |||||||||||
| Chemicals (0.6%) | |||||||||||
| Potash Corp. of Saskatchewan, Inc. | 970 | 151,349 | |||||||||
See Accompanying Notes to Financial Statements.
83
CMG MID CAP GROWTH FUND
A Portfolio of Columbia Funds Institutional Trust
SCHEDULE OF INVESTMENTS
| Shares | Value | ||||||||||
| Common Stocks (continued) | |||||||||||
| Construction Materials (0.8%) | |||||||||||
| Florida Rock Industries, Inc. | 1,540 | $ | 76,153 | ||||||||
| Vulcan Materials Co. | 1,340 | 136,466 | |||||||||
| 212,619 | |||||||||||
| Metals & Mining (2.0%) | |||||||||||
| Allegheny Technologies, Inc. | 1,500 | 155,235 | |||||||||
| Freeport-McMoRan Copper & Gold, Inc., Class B | 1,260 | 72,463 | |||||||||
| Phelps Dodge Corp. | 1,130 | 139,668 | |||||||||
| Titanium Metals Corp. (a) | 1,730 | 53,353 | |||||||||
| Zinifex Ltd. | 9,630 | 123,846 | |||||||||
| 544,565 | |||||||||||
| 908,533 | |||||||||||
| Telecommunication Services (5.6%) | |||||||||||
| Diversified Telecommunication Services (0.5%) | |||||||||||
| Tele2 AB, Class B | 9,100 | 135,566 | |||||||||
| Wireless Telecommunication Services (5.1%) | |||||||||||
| American Tower Corp., Class A (a) | 9,156 | 364,683 | |||||||||
| Crown Castle International Corp. (a) | 7,660 | 269,326 | |||||||||
| Leap Wireless International, Inc. (a) | 4,400 | 289,036 | |||||||||
| Millicom International Cellular SA (a) | 1,720 | 114,277 | |||||||||
| NII Holdings, Inc. (a) | 4,050 | 298,890 | |||||||||
| SBA Communications Corp., Class A (a) | 1,950 | 57,934 | |||||||||
| 1,394,146 | |||||||||||
| 1,529,712 | |||||||||||
| Utilities (1.2%) | |||||||||||
| Gas Utilities (0.4%) | |||||||||||
| Questar Corp. | 1,260 | 102,312 | |||||||||
| Independent Power Producers & Energy Traders (0.8%) | |||||||||||
| AES Corp. (a) | 11,180 | 232,432 | |||||||||
| 334,744 | |||||||||||
| Total Common Stocks (Cost of $20,577,184) | 26,325,492 | ||||||||||
See Accompanying Notes to Financial Statements.
84
CMG MID CAP GROWTH FUND
A Portfolio of Columbia Funds Institutional Trust
SCHEDULE OF INVESTMENTS
| Par | Value | ||||||||||
| Short-Term Obligation (3.2%) | |||||||||||
| Repurchase agreement with Fixed Income Clearing Corp., dated 01/31/07, due 02/01/07 at 5.160%, collateralized by a U.S. Treasury Note maturing 08/15/11, market value of $896,100 (repurchase proceeds $875,125) | $ | 875,000 | $ | 875,000 | |||||||
| Total Short-Term Obligation (Cost of $875,000) | 875,000 | ||||||||||
| Total Investments (100.3%) (Cost of $21,452,184) (b) | 27,200,492 | ||||||||||
| Other Assets & Liabilities, Net (-0.3%) | (78,287 | ) | |||||||||
| Net Assets (100.0%) | $ | 27,122,205 | |||||||||
Notes to Schedule of Investments:
(a) Non-income producing security.
(b) Cost for federal income tax purposes is $21,452,184.
At January 31, 2007, the Fund held investments in the following sectors:
| Sector | % of Net Assets | ||||||
| Consumer Discretionary | 20.1 | ||||||
| Information Technology | 17.7 | ||||||
| Health Care | 14.2 | ||||||
| Industrials | 12.4 | ||||||
| Financials | 9.3 | ||||||
| Energy | 7.3 | ||||||
| Consumer Staples | 5.9 | ||||||
| Telecommunication Services | 5.6 | ||||||
| Materials | 3.4 | ||||||
| Utilities | 1.2 | ||||||
| 97.1 | |||||||
| Short-Term Obligation | 3.2 | ||||||
| Other Assets & Liabilities, Net | (0.3 | ) | |||||
| 100.0 | |||||||
| Acronym | Name | ||||||
| ADR | American Depositary Receipt | ||||||
See Accompanying Notes to Financial Statements.
85
CMG MID CAP VALUE FUND
A Portfolio of Columbia Funds Institutional Trust
SCHEDULE OF INVESTMENTS
January 31, 2007 (Unaudited)
| Shares | Value | ||||||||||
| Common Stocks (97.1%) | |||||||||||
| Consumer Discretionary (8.2%) | |||||||||||
| Auto Components (1.5%) | |||||||||||
| BorgWarner, Inc. | 1,550 | $ | 106,237 | ||||||||
| Johnson Controls, Inc. | 1,450 | 134,067 | |||||||||
| 240,304 | |||||||||||
| Automobiles (0.5%) | |||||||||||
| Ford Motor Co. | 10,800 | 87,804 | |||||||||
| Hotels, Restaurants & Leisure (0.7%) | |||||||||||
| Starwood Hotels & Resorts Worldwide, Inc. | 1,725 | 107,950 | |||||||||
| Household Durables (1.3%) | |||||||||||
| Centex Corp. | 1,800 | 96,642 | |||||||||
| Lennar Corp., Class A | 2,300 | 125,074 | |||||||||
| 221,716 | |||||||||||
| Leisure Equipment & Products (1.2%) | |||||||||||
| Brunswick Corp. | 2,400 | 81,864 | |||||||||
| Hasbro, Inc. | 4,100 | 116,440 | |||||||||
| 198,304 | |||||||||||
| Media (1.3%) | |||||||||||
| Dow Jones & Co., Inc. | 2,625 | 98,989 | |||||||||
| Regal Entertainment Group, Class A | 4,800 | 108,000 | |||||||||
| 206,989 | |||||||||||
| Multiline Retail (1.1%) | |||||||||||
| Federated Department Stores, Inc. | 4,216 | 174,922 | |||||||||
| Textiles, Apparel & Luxury Goods (0.6%) | |||||||||||
| Polo Ralph Lauren Corp. | 1,200 | 98,460 | |||||||||
| 1,336,449 | |||||||||||
| Consumer Staples (8.7%) | |||||||||||
| Beverages (1.7%) | |||||||||||
| Coca-Cola Enterprises, Inc. | 499 | 10,239 | |||||||||
| Fomento Economico Mexicano SA de CV, ADR | 925 | 111,065 | |||||||||
| Pepsi Bottling Group, Inc. | 5,100 | 161,313 | |||||||||
| 282,617 | |||||||||||
| Food & Staples Retailing (1.5%) | |||||||||||
| Kroger Co. | 9,850 | 252,160 | |||||||||
| Food Products (2.9%) | |||||||||||
| Dean Foods Co. (a) | 4,200 | 185,850 | |||||||||
| Hershey Co. | 1,600 | 81,664 | |||||||||
| Smithfield Foods, Inc. (a) | 3,300 | 86,658 | |||||||||
| Tyson Foods, Inc., Class A | 6,350 | 112,713 | |||||||||
| 466,885 | |||||||||||
| Household Products (1.2%) | |||||||||||
| Clorox Co. | 2,950 | 192,989 | |||||||||
See Accompanying Notes to Financial Statements.
86
CMG MID CAP VALUE FUND
A Portfolio of Columbia Funds Institutional Trust
SCHEDULE OF INVESTMENTS
| Shares | Value | ||||||||||
| Common Stocks (continued) | |||||||||||
| Personal Products (1.4%) | |||||||||||
| Avon Products, Inc. | 2,600 | $ | 89,414 | ||||||||
| Estee Lauder Companies, Inc., Class A | 2,800 | 133,000 | |||||||||
| 222,414 | |||||||||||
| 1,417,065 | |||||||||||
| Energy (7.8%) | |||||||||||
| Energy Equipment & Services (2.5%) | |||||||||||
| National-Oilwell Varco, Inc. (a) | 1,125 | 68,220 | |||||||||
| Rowan Companies, Inc. | 3,825 | 125,804 | |||||||||
| Technip SA, ADR | 1,225 | 79,074 | |||||||||
| Tidewater, Inc. | 2,500 | 128,925 | |||||||||
| 402,023 | |||||||||||
| Oil, Gas & Consumable Fuels (5.3%) | |||||||||||
| Hess Corp. | 4,575 | 247,004 | |||||||||
| Newfield Exploration Co. (a) | 4,700 | 201,207 | |||||||||
| Peabody Energy Corp. | 3,700 | 151,071 | |||||||||
| Tesoro Corp. | 1,400 | 115,346 | |||||||||
| Williams Companies, Inc. | 5,500 | 148,445 | |||||||||
| 863,073 | |||||||||||
| 1,265,096 | |||||||||||
| Financials (26.2%) | |||||||||||
| Capital Markets (0.1%) | |||||||||||
| Nuveen Investments, Inc., Class A | 299 | 14,801 | |||||||||
| Commercial Banks (10.2%) | |||||||||||
| Bank of Hawaii Corp. | 3,000 | 157,050 | |||||||||
| City National Corp. | 2,800 | 201,404 | |||||||||
| Comerica, Inc. | 3,975 | 235,717 | |||||||||
| Cullen/Frost Bankers, Inc. | 3,525 | 188,693 | |||||||||
| KeyCorp | 5,200 | 198,484 | |||||||||
| Marshall & Ilsley Corp. | 4,325 | 203,535 | |||||||||
| SVB Financial Group (a) | 2,650 | 123,623 | |||||||||
| TCF Financial Corp. | 4,500 | 114,210 | |||||||||
| Zions Bancorporation | 2,775 | 235,375 | |||||||||
| 1,658,091 | |||||||||||
| Diversified Financial Services (1.5%) | |||||||||||
| CIT Group, Inc. | 4,175 | 246,158 | |||||||||
| Insurance (6.0%) | |||||||||||
| ACE Ltd. | 1,700 | 98,226 | |||||||||
| Ambac Financial Group, Inc. | 3,000 | 264,300 | |||||||||
| Axis Capital Holdings Ltd. | 2,100 | 69,195 | |||||||||
| Genworth Financial, Inc., Class A | 5,200 | 181,480 | |||||||||
| Loews Corp. | 3,475 | 151,023 | |||||||||
| Old Republic International Corp. | 5,200 | 115,960 | |||||||||
| Platinum Underwriters Holdings Ltd. | 3,300 | 98,505 | |||||||||
| 978,689 | |||||||||||
See Accompanying Notes to Financial Statements.
87
CMG MID CAP VALUE FUND
A Portfolio of Columbia Funds Institutional Trust
SCHEDULE OF INVESTMENTS
| Shares | Value | ||||||||||
| Common Stocks (continued) | |||||||||||
| Real Estate Investment Trusts (REITs) (7.3%) | |||||||||||
| Alexandria Real Estate Equities, Inc. | 800 | $ | 86,688 | ||||||||
| Archstone-Smith Trust | 1,275 | 80,593 | |||||||||
| Boston Properties, Inc. | 950 | 119,785 | |||||||||
| Equity Office Properties Trust | 1,500 | 83,325 | |||||||||
| Equity Residential Property Trust | 2,200 | 123,816 | |||||||||
| General Growth Properties, Inc. | 4,575 | 281,454 | |||||||||
| iStar Financial, Inc. | 2,120 | 106,318 | |||||||||
| Plum Creek Timber Co., Inc. | 3,000 | 120,750 | |||||||||
| ProLogis | 3,000 | 195,000 | |||||||||
| 1,197,729 | |||||||||||
| Thrifts & Mortgage Finance (1.1%) | |||||||||||
| PMI Group, Inc. | 3,625 | 173,348 | |||||||||
| 4,268,816 | |||||||||||
| Health Care (6.9%) | |||||||||||
| Health Care Equipment & Supplies (1.6%) | |||||||||||
| Beckman Coulter, Inc. | 1,900 | 122,588 | |||||||||
| Hospira, Inc. (a) | 3,875 | 142,523 | |||||||||
| 265,111 | |||||||||||
| Health Care Providers & Services (2.4%) | |||||||||||
| CIGNA Corp. | 1,250 | 165,500 | |||||||||
| Community Health Systems, Inc. (a) | 3,475 | 124,231 | |||||||||
| Universal Health Services, Inc., Class B | 1,700 | 98,481 | |||||||||
| 388,212 | |||||||||||
| Life Sciences Tools & Services (2.3%) | |||||||||||
| Millipore Corp. (a) | 1,250 | 85,600 | |||||||||
| Thermo Fisher Scientific, Inc. (a) | 2,425 | 116,036 | |||||||||
| Varian, Inc. (a) | 3,100 | 165,881 | |||||||||
| 367,517 | |||||||||||
| Pharmaceuticals (0.6%) | |||||||||||
| Mylan Laboratories, Inc. | 4,400 | 97,416 | |||||||||
| 1,118,256 | |||||||||||
| Industrials (10.5%) | |||||||||||
| Aerospace & Defense (1.3%) | |||||||||||
| L-3 Communications Holdings, Inc. | 1,800 | 148,212 | |||||||||
| Spirit Aerosystems Holdings, Inc., Class A (a) | 1,869 | 57,247 | |||||||||
| 205,459 | |||||||||||
| Commercial Services & Supplies (1.1%) | |||||||||||
| Equifax, Inc. | 3,000 | 124,590 | |||||||||
| SAIC, Inc. (a) | 2,727 | 50,586 | |||||||||
| 175,176 | |||||||||||
| Construction & Engineering (0.7%) | |||||||||||
| Jacobs Engineering Group, Inc. (a) | 1,075 | 97,341 | |||||||||
| KBR, Inc. (a) | 725 | 16,987 | |||||||||
| 114,328 | |||||||||||
See Accompanying Notes to Financial Statements.
88
CMG MID CAP VALUE FUND
A Portfolio of Columbia Funds Institutional Trust
SCHEDULE OF INVESTMENTS
| Shares | Value | ||||||||||
| Common Stocks (continued) | |||||||||||
| Electrical Equipment (0.8%) | |||||||||||
| Cooper Industries Ltd., Class A | 1,450 | $ | 132,516 | ||||||||
| 132,516 | |||||||||||
| Industrial Conglomerates (1.2%) | |||||||||||
| McDermott International, Inc. (a) | 1,850 | 95,534 | |||||||||
| Textron, Inc. | 1,150 | 107,145 | |||||||||
| 202,679 | |||||||||||
| Machinery (3.7%) | |||||||||||
| Barnes Group, Inc. | 6,518 | 139,616 | |||||||||
| Dover Corp. | 2,150 | 106,640 | |||||||||
| Harsco Corp. | 1,125 | 96,615 | |||||||||
| Kennametal, Inc. | 1,575 | 97,335 | |||||||||
| Parker Hannifin Corp. | 2,000 | 165,520 | |||||||||
| 605,726 | |||||||||||
| Marine (0.9%) | |||||||||||
| Alexander & Baldwin, Inc. | 2,825 | 139,668 | |||||||||
| Road & Rail (0.8%) | |||||||||||
| Canadian Pacific Railway Ltd. | 2,300 | 125,902 | |||||||||
| 1,701,454 | |||||||||||
| Information Technology (8.1%) | |||||||||||
| Communications Equipment (0.5%) | |||||||||||
| CommScope, Inc. (a) | 2,400 | 77,544 | |||||||||
| Computers & Peripherals (0.7%) | |||||||||||
| Diebold, Inc. | 1,700 | 78,795 | |||||||||
| NCR Corp. (a) | 900 | 42,651 | |||||||||
| 121,446 | |||||||||||
| Electronic Equipment & Instruments (3.2%) | |||||||||||
| Agilent Technologies, Inc. (a) | 5,100 | 163,200 | |||||||||
| Arrow Electronics, Inc. (a) | 4,525 | 159,506 | |||||||||
| Mettler-Toledo International, Inc. (a) | 1,300 | 107,640 | |||||||||
| Tektronix, Inc. | 3,036 | 85,828 | |||||||||
| 516,174 | |||||||||||
| Semiconductors & Semiconductor Equipment (1.9%) | |||||||||||
| Fairchild Semiconductor International, Inc. (a) | 4,675 | 83,262 | |||||||||
| Intersil Corp., Class A | 2,300 | 54,188 | |||||||||
| KLA-Tencor Corp. | 1,850 | 91,076 | |||||||||
| NVIDIA Corp. (a) | 1,600 | 49,040 | |||||||||
| Verigy Ltd. (a) | 2,083 | 38,181 | |||||||||
| 315,747 | |||||||||||
| Software (1.8%) | |||||||||||
| Activision, Inc. (a) | 4,633 | 78,900 | |||||||||
| Cadence Design Systems, Inc. (a) | 3,575 | 67,567 | |||||||||
| Electronic Arts, Inc. (a) | 1,625 | 81,250 | |||||||||
| Synopsys, Inc. (a) | 2,150 | 57,190 | |||||||||
| 284,907 | |||||||||||
| 1,315,818 | |||||||||||
See Accompanying Notes to Financial Statements.
89
CMG MID CAP VALUE FUND
A Portfolio of Columbia Funds Institutional Trust
SCHEDULE OF INVESTMENTS
| Shares | Value | ||||||||||
| Common Stocks (continued) | |||||||||||
| Materials (6.8%) | |||||||||||
| Chemicals (2.7%) | |||||||||||
| Air Products & Chemicals, Inc. | 2,950 | $ | 220,247 | ||||||||
| PPG Industries, Inc. | 1,500 | 99,435 | |||||||||
| Rohm and Haas Co. | 2,300 | 119,738 | |||||||||
| 439,420 | |||||||||||
| Construction Materials (1.2%) | |||||||||||
| Martin Marietta Materials, Inc. | 825 | 95,222 | |||||||||
| Vulcan Materials Co. | 900 | 91,656 | |||||||||
| 186,878 | |||||||||||
| Containers & Packaging (1.5%) | |||||||||||
| Crown Holdings, Inc. (a) | 5,500 | 121,385 | |||||||||
| Packaging Corp. of America | 5,600 | 127,904 | |||||||||
| 249,289 | |||||||||||
| Metals & Mining (0.4%) | |||||||||||
| Allegheny Technologies, Inc. | 600 | 62,094 | |||||||||
| Paper & Forest Products (1.0%) | |||||||||||
| Weyerhaeuser Co. | 2,200 | 165,000 | |||||||||
| 1,102,681 | |||||||||||
| Utilities (13.9%) | |||||||||||
| Electric Utilities (7.9%) | |||||||||||
| American Electric Power Co., Inc. | 5,100 | 222,003 | |||||||||
| Edison International | 5,775 | 259,759 | |||||||||
| Entergy Corp. | 3,100 | 287,835 | |||||||||
| FPL Group, Inc. | 3,175 | 179,864 | |||||||||
| Hawaiian Electric Industries, Inc. | 3,175 | 85,058 | |||||||||
| PPL Corp. | 6,925 | 246,530 | |||||||||
| 1,281,049 | |||||||||||
| Gas Utilities (0.7%) | |||||||||||
| AGL Resources, Inc. | 2,875 | 112,988 | |||||||||
| Independent Power Producers & Energy Traders (0.5%) | |||||||||||
| AES Corp. (a) | 4,050 | 84,200 | |||||||||
| Multi-Utilities (4.8%) | |||||||||||
| PG&E Corp. | 7,325 | 341,931 | |||||||||
| Public Service Enterprise Group, Inc. | 1,800 | 120,654 | |||||||||
| Sempra Energy | 2,375 | 136,277 | |||||||||
| Wisconsin Energy Corp. | 4,000 | 186,240 | |||||||||
| 785,102 | |||||||||||
| 2,263,339 | |||||||||||
| Total Common Stocks (Cost of $12,644,244) | 15,788,974 | ||||||||||
See Accompanying Notes to Financial Statements.
90
CMG MID CAP VALUE FUND
A Portfolio of Columbia Funds Institutional Trust
SCHEDULE OF INVESTMENTS
| Par | Value | ||||||||||
| Convertible Bonds (0.2%) | |||||||||||
| Consumer Cyclical (0.2%) | |||||||||||
| Auto Manufacturers (0.2%) | |||||||||||
| Ford Motor Co. 4.250% 12/15/36 | $ | 38,000 | $ | 43,130 | |||||||
| Total Convertible Bonds (Cost of $40,015) | 43,130 | ||||||||||
| Short-Term Obligation (2.9%) | |||||||||||
| Repurchase agreement with Fixed Income Clearing Corp., dated 01/31/07, due 02/01/07 at 5.160%, collateralized by a U.S. Treasury Bond maturing 08/15/29, market value of $480,274 (repurchase proceeds $469,067) | 469,000 | 469,000 | |||||||||
| Total Short-Term Obligation (Cost of $469,000) | 469,000 | ||||||||||
| Total Investments (100.2%) (Cost of $13,153,259) (b) | 16,301,104 | ||||||||||
| Other Assets & Liabilities, Net (-0.2%) | (38,636 | ) | |||||||||
| Net Assets (100.0%) | $ | 16,262,468 | |||||||||
Notes to Schedule of Investments:
(a) Non-income producing security.
(b) Cost for federal income tax purposes is $13,153,259.
At January 31, 2007, the Fund held investments in the following sectors:
| Sector | % of Net Assets | ||||||
| Financials | 26.2 | ||||||
| Utilities | 13.9 | ||||||
| Industrials | 10.5 | ||||||
| Consumer Staples | 8.7 | ||||||
| Consumer Discretionary | 8.2 | ||||||
| Information Technology | 8.1 | ||||||
| Energy | 7.8 | ||||||
| Health Care | 6.9 | ||||||
| Materials | 6.8 | ||||||
| Consumer Cyclical | 0.2 | ||||||
| 97.3 | |||||||
| Short-Term Obligation | 2.9 | ||||||
| Other Assets & Liabilities, Net | (0.2 | ) | |||||
| 100.0 | |||||||
| Acronym | Name | ||||||
| ADR | American Depositary Receipt | ||||||
See Accompanying Notes to Financial Statements.
91
CMG SMALL CAP GROWTH FUND
A Portfolio of Columbia Funds Institutional Trust
SCHEDULE OF INVESTMENTS
January 31, 2007 (Unaudited)
| Shares | Value | ||||||||||
| Common Stocks (95.0%) | |||||||||||
| Consumer Discretionary (13.0%) | |||||||||||
| Auto Components (0.8%) | |||||||||||
| Spartan Motors, Inc. | 17,795 | $ | 297,888 | ||||||||
| Automobiles (0.5%) | |||||||||||
| Piaggio & Cie, SpA (a) | 46,160 | 201,200 | |||||||||
| Diversified Consumer Services (0.7%) | |||||||||||
| Laureate Education, Inc. (a) | 4,380 | 264,289 | |||||||||
| Hotels, Restaurants & Leisure (2.8%) | |||||||||||
| Chipotle Mexican Grill, Inc., Class A (a) | 3,260 | 193,709 | |||||||||
| Pinnacle Entertainment, Inc. (a) | 6,735 | 232,560 | |||||||||
| RARE Hospitality International, Inc. (a) | 6,010 | 189,555 | |||||||||
| Ruby Tuesday, Inc. | 4,600 | 131,606 | |||||||||
| Scientific Games Corp., Class A (a) | 6,000 | 186,240 | |||||||||
| Shuffle Master, Inc. (a) | 7,150 | 190,262 | |||||||||
| 1,123,932 | |||||||||||
| Household Durables (0.5%) | |||||||||||
| Ryland Group, Inc. | 3,800 | 213,484 | |||||||||
| Internet & Catalog Retail (1.2%) | |||||||||||
| Gmarket, Inc. (a) | 4,751 | 101,671 | |||||||||
| Nutri/System, Inc. (a) | 3,790 | 166,950 | |||||||||
| Priceline.com, Inc. (a) | 4,460 | 190,085 | |||||||||
| 458,706 | |||||||||||
| Leisure Equipment & Products (0.6%) | |||||||||||
| Marvel Entertainment, Inc. (a) | 5,530 | 154,398 | |||||||||
| Pool Corp. | 2,690 | 98,454 | |||||||||
| 252,852 | |||||||||||
| Specialty Retail (3.8%) | |||||||||||
| Children's Place Retail Stores, Inc. (a) | 2,280 | 123,599 | |||||||||
| Christopher & Banks Corp. | 6,150 | 109,347 | |||||||||
| GameStop Corp., Class A (a) | 8,313 | 444,164 | |||||||||
| Hibbett Sporting Goods, Inc. (a) | 6,930 | 222,522 | |||||||||
| Monro Muffler, Inc. | 4,910 | 185,303 | |||||||||
| Tractor Supply Co. (a) | 5,830 | 293,424 | |||||||||
| Tween Brands, Inc. (a) | 3,620 | 123,768 | |||||||||
| 1,502,127 | |||||||||||
| Textiles, Apparel & Luxury Goods (2.1%) | |||||||||||
| Carter's, Inc. (a) | 13,060 | 331,724 | |||||||||
| Phillips-Van Heusen Corp. | 3,210 | 177,032 | |||||||||
| Quiksilver, Inc. (a) | 22,050 | 313,330 | |||||||||
| 822,086 | |||||||||||
| 5,136,564 | |||||||||||
See Accompanying Notes to Financial Statements.
92
CMG SMALL CAP GROWTH FUND
A Portfolio of Columbia Funds Institutional Trust
SCHEDULE OF INVESTMENTS
| Shares | Value | ||||||||||
| Common Stocks (continued) | |||||||||||
| Consumer Staples (1.3%) | |||||||||||
| Food & Staples Retailing (0.3%) | |||||||||||
| Pantry, Inc. (a) | 2,250 | $ | 109,823 | ||||||||
| Household Products (0.5%) | |||||||||||
| Central Garden & Pet Co. (a) | 4,380 | 196,180 | |||||||||
| Personal Products (0.5%) | |||||||||||
| USANA Health Sciences, Inc. (a) | 4,130 | 219,220 | |||||||||
| 525,223 | |||||||||||
| Energy (5.8%) | |||||||||||
| Energy Equipment & Services (2.7%) | |||||||||||
| Atwood Oceanics, Inc. (a) | 7,620 | 368,579 | |||||||||
| Core Laboratories NV (a) | 3,040 | 250,496 | |||||||||
| Oil States International, Inc. (a) | 8,250 | 237,765 | |||||||||
| Tetra Technologies, Inc. (a) | 10,180 | 235,769 | |||||||||
| 1,092,609 | |||||||||||
| Oil, Gas & Consumable Fuels (3.1%) | |||||||||||
| Berry Petroleum Co., Class A | 8,810 | 273,462 | |||||||||
| Carrizo Oil & Gas, Inc. (a) | 7,570 | 217,259 | |||||||||
| Foundation Coal Holdings, Inc. | 5,520 | 183,706 | |||||||||
| GMX Resources, Inc. (a) | 3,140 | 117,059 | |||||||||
| Ship Finance Intl Ltd. | 8,540 | 202,654 | |||||||||
| W&T Offshore, Inc. | 7,440 | 228,557 | |||||||||
| 1,222,697 | |||||||||||
| 2,315,306 | |||||||||||
| Financials (9.2%) | |||||||||||
| Capital Markets (2.4%) | |||||||||||
| Affiliated Managers Group, Inc. (a) | 3,670 | 408,838 | |||||||||
| Greenhill & Co., Inc. | 3,100 | 232,283 | |||||||||
| Investment Technology Group, Inc. (a) | 2,960 | 129,056 | |||||||||
| Waddell & Reed Financial, Inc., Class A | 7,120 | 182,771 | |||||||||
| 952,948 | |||||||||||
| Commercial Banks (2.2%) | |||||||||||
| Signature Bank (a) | 9,240 | 305,936 | |||||||||
| Sterling Financial Corp. | 6,440 | 213,615 | |||||||||
| UCBH Holdings, Inc. | 8,950 | 167,812 | |||||||||
| WSB Financial Group, Inc. (a) | 8,868 | 172,483 | |||||||||
| 859,846 | |||||||||||
| Consumer Finance (0.5%) | |||||||||||
| First Cash Financial Services, Inc. (a) | 9,030 | 212,024 | |||||||||
| Diversified Financial Services (0.4%) | |||||||||||
| Genesis Lease Ltd. (a) | 2,415 | 62,597 | |||||||||
| International Securities Exchange Holdings, Inc. | 2,500 | 103,575 | |||||||||
| 166,172 | |||||||||||
See Accompanying Notes to Financial Statements.
93
CMG SMALL CAP GROWTH FUND
A Portfolio of Columbia Funds Institutional Trust
SCHEDULE OF INVESTMENTS
| Shares | Value | ||||||||||
| Common Stocks (continued) | |||||||||||
| Insurance (1.4%) | |||||||||||
| Hanover Insurance Group, Inc. | 4,150 | $ | 199,408 | ||||||||
| ProAssurance Corp. (a) | 7,350 | 373,306 | |||||||||
| 572,714 | |||||||||||
| Real Estate Investment Trusts (REITs) (2.3%) | |||||||||||
| Alexandria Real Estate Equities, Inc. | 2,510 | 271,984 | |||||||||
| FelCor Lodging Trust, Inc. | 5,350 | 118,075 | |||||||||
| Home Properties, Inc. | 3,870 | 248,802 | |||||||||
| Washington Real Estate Investment Trust | 6,070 | 259,492 | |||||||||
| 898,353 | |||||||||||
| 3,662,057 | |||||||||||
| Health Care (19.6%) | |||||||||||
| Biotechnology (3.6%) | |||||||||||
| Alkermes, Inc. (a) | 5,790 | 86,387 | |||||||||
| Allos Therapeutics, Inc. (a) | 25,550 | 160,198 | |||||||||
| Applera Corp. - Celera Group (a) | 7,930 | 125,770 | |||||||||
| ArQule, Inc. (a) | 10,978 | 71,906 | |||||||||
| Array Biopharma, Inc. (a) | 11,840 | 162,918 | |||||||||
| BioMarin Pharmaceuticals, Inc. (a) | 7,080 | 134,095 | |||||||||
| Cubist Pharmaceuticals, Inc. (a) | 8,760 | 161,184 | |||||||||
| Digene Corp. (a) | 3,780 | 194,481 | |||||||||
| Keryx Biopharmaceuticals, Inc. (a) | 6,580 | 75,078 | |||||||||
| Onyx Pharmaceuticals, Inc. (a) | 7,970 | 94,445 | |||||||||
| OSI Pharmaceuticals, Inc. (a) | 4,570 | 155,471 | |||||||||
| 1,421,933 | |||||||||||
| Health Care Equipment & Supplies (7.1%) | |||||||||||
| ArthroCare Corp. (a) | 3,310 | 122,139 | |||||||||
| Aspect Medical Systems, Inc. (a) | 5,310 | 88,411 | |||||||||
| Bespak PLC | 11,140 | 159,531 | |||||||||
| DexCom, Inc. (a) | 16,410 | 146,049 | |||||||||
| Haemonetics Corp. (a) | 5,964 | 287,703 | |||||||||
| Hologic, Inc. (a) | 6,043 | 335,689 | |||||||||
| I-Flow Corp. (a) | 6,250 | 97,875 | |||||||||
| Kyphon, Inc. (a) | 8,572 | 401,084 | |||||||||
| Mentor Corp. | 4,610 | 235,064 | |||||||||
| NuVasive, Inc. (a) | 14,080 | 340,877 | |||||||||
| PolyMedica Corp. | 1,740 | 69,670 | |||||||||
| ResMed, Inc. (a) | 4,122 | 216,735 | |||||||||
| Thoratec Corp. (a) | 12,340 | 222,243 | |||||||||
| West Pharmaceutical Services, Inc. | 1,730 | 83,957 | |||||||||
| 2,807,027 | |||||||||||
| Health Care Providers & Services (3.5%) | |||||||||||
| Animal Health International | 3,471 | 43,214 | |||||||||
| HealthExtras, Inc. (a) | 13,115 | 335,219 | |||||||||
| Pediatrix Medical Group, Inc. (a) | 6,210 | 326,273 | |||||||||
| Psychiatric Solutions, Inc. (a) | 7,780 | 302,953 | |||||||||
| United Surgical Partners International, Inc. (a) | 9,795 | 298,454 | |||||||||
| Visicu, Inc. (a) | 8,220 | 84,913 | |||||||||
| 1,391,026 | |||||||||||
See Accompanying Notes to Financial Statements.
94
CMG SMALL CAP GROWTH FUND
A Portfolio of Columbia Funds Institutional Trust
SCHEDULE OF INVESTMENTS
| Shares | Value | ||||||||||
| Common Stocks (continued) | |||||||||||
| Health Care Technology (1.2%) | |||||||||||
| Allscripts Healthcare Solutions, Inc. (a) | 14,944 | $ | 457,286 | ||||||||
| Life Sciences Tools & Services (1.9%) | |||||||||||
| ICON PLC, ADR (a) | 17,550 | 654,615 | |||||||||
| Illumina, Inc. (a) | 2,680 | 109,478 | |||||||||
| 764,093 | |||||||||||
| Pharmaceuticals (2.3%) | |||||||||||
| BioMimetic Therapeutics, Inc. (a) | 10,083 | 155,278 | |||||||||
| Medicis Pharmaceutical Corp., Class A | 9,060 | 343,646 | |||||||||
| Penwest Pharmaceuticals Co. (a) | 16,160 | 230,119 | |||||||||
| Pozen, Inc. (a) | 5,740 | 97,063 | |||||||||
| Viropharma, Inc. (a) | 4,660 | 79,360 | |||||||||
| 905,466 | |||||||||||
| 7,746,831 | |||||||||||
| Industrials (16.1%) | |||||||||||
| Aerospace & Defense (2.6%) | |||||||||||
| Armor Holdings, Inc. (a) | 3,962 | 239,701 | |||||||||
| BE Aerospace, Inc. (a) | 15,197 | 452,567 | |||||||||
| Ceradyne, Inc. (a) | 3,282 | 177,490 | |||||||||
| Hexcel Corp. (a) | 8,840 | 170,082 | |||||||||
| 1,039,840 | |||||||||||
| Air Freight & Logistics (0.6%) | |||||||||||
| Forward Air Corp. | 7,117 | 223,331 | |||||||||
| Airlines (0.6%) | |||||||||||
| Alaska Air Group, Inc. (a) | 5,790 | 248,101 | |||||||||
| Building Products (0.7%) | |||||||||||
| ElkCorp. | 6,530 | 283,141 | |||||||||
| Commercial Services & Supplies (6.3%) | |||||||||||
| ACCO Brands Corp. (a) | 8,130 | 196,177 | |||||||||
| Advisory Board Co. (a) | 5,420 | 305,200 | |||||||||
| Corporate Executive Board Co. | 3,113 | 282,442 | |||||||||
| Huron Consulting Group, Inc. (a) | 12,635 | 655,125 | |||||||||
| Kenexa Corp. (a) | 10,948 | 399,602 | |||||||||
| Resources Connection, Inc. (a) | 13,520 | 424,528 | |||||||||
| Waste Connections, Inc. (a) | 5,540 | 241,378 | |||||||||
| 2,504,452 | |||||||||||
| Construction & Engineering (0.5%) | |||||||||||
| Granite Construction, Inc. | 1,480 | 79,269 | |||||||||
| Perini Corp. (a) | 3,768 | 113,869 | |||||||||
| 193,138 | |||||||||||
See Accompanying Notes to Financial Statements.
95
CMG SMALL CAP GROWTH FUND
A Portfolio of Columbia Funds Institutional Trust
SCHEDULE OF INVESTMENTS
| Shares | Value | ||||||||||
| Common Stocks (continued) | |||||||||||
| Electrical Equipment (2.0%) | |||||||||||
| Acuity Brands, Inc. | 3,840 | $ | 222,758 | ||||||||
| Franklin Electric Co., Inc. | 2,170 | 109,325 | |||||||||
| General Cable Corp. (a) | 10,220 | 440,789 | |||||||||
| 772,872 | |||||||||||
| Machinery (1.8%) | |||||||||||
| Bucyrus International, Inc., Class A | 4,100 | 190,281 | |||||||||
| ESCO Technologies, Inc. (a) | 6,043 | 288,674 | |||||||||
| Force Protection, Inc. (a) | 4,880 | 87,791 | |||||||||
| RBC Bearings, Inc. (a) | 4,911 | 150,670 | |||||||||
| 717,416 | |||||||||||
| Marine (0.5%) | |||||||||||
| American Commercial Lines, Inc. (a) | 2,820 | 198,641 | |||||||||
| Road & Rail (0.5%) | |||||||||||
| Genesee & Wyoming, Inc., Class A (a) | 6,620 | 186,618 | |||||||||
| 6,367,550 | |||||||||||
| Information Technology (24.0%) | |||||||||||
| Communications Equipment (1.4%) | |||||||||||
| CommScope, Inc. (a) | 5,290 | 170,920 | |||||||||
| F5 Networks, Inc. (a) | 3,480 | 248,611 | |||||||||
| Radyne Corp. (a) | 10,890 | 113,910 | |||||||||
| 533,441 | |||||||||||
| Computers & Peripherals (1.6%) | |||||||||||
| Brocade Communications Systems, Inc. (a) | 29,570 | 253,710 | |||||||||
| Emulex Corp. (a) | 5,740 | 101,885 | |||||||||
| Iomega Corp. (a) | 24,120 | 94,068 | |||||||||
| Synaptics, Inc. (a) | 7,210 | 195,103 | |||||||||
| 644,766 | |||||||||||
| Electronic Equipment & Instruments (1.7%) | |||||||||||
| FLIR Systems, Inc. (a) | 9,410 | 290,863 | |||||||||
| IPG Photonics Corp. (a) | 1,247 | 32,933 | |||||||||
| Novatel, Inc. (a) | 5,700 | 235,125 | |||||||||
| Sunpower Corp., Class A (a) | 2,680 | 118,724 | |||||||||
| 677,645 | |||||||||||
| Internet Software & Services (2.9%) | |||||||||||
| aQuantive, Inc. (a) | 7,570 | 202,876 | |||||||||
| Equinix, Inc. (a) | 4,380 | 368,226 | |||||||||
| Knot, Inc. (a) | 6,970 | 210,285 | |||||||||
| RADVision Ltd. (a) | 10,540 | 205,846 | |||||||||
| WebEx Communications, Inc. (a) | 4,820 | 178,726 | |||||||||
| 1,165,959 | |||||||||||
| IT Services (4.1%) | |||||||||||
| Acxiom Corp. | 8,860 | 201,122 | |||||||||
| Euronet Worldwide, Inc. (a) | 14,774 | 426,378 | |||||||||
| Global Cash Access, Inc. (a) | 11,534 | 184,775 | |||||||||
See Accompanying Notes to Financial Statements.
96
CMG SMALL CAP GROWTH FUND
A Portfolio of Columbia Funds Institutional Trust
SCHEDULE OF INVESTMENTS
| Shares | Value | ||||||||||
| Common Stocks (continued) | |||||||||||
| IT Services (continued) | |||||||||||
| Global Payments, Inc. | 4,828 | $ | 182,305 | ||||||||
| Heartland Payment Systems, Inc. | 10,900 | 290,594 | |||||||||
| Isilon Systems, Inc. (a) | 2,092 | 48,304 | |||||||||
| TALX Corp. | 8,890 | 283,235 | |||||||||
| 1,616,713 | |||||||||||
| Semiconductors & Semiconductor Equipment (5.0%) | |||||||||||
| Atheros Communications, Inc. (a) | 13,403 | 318,455 | |||||||||
| ATMI, Inc. (a) | 6,340 | 212,010 | |||||||||
| Hittite Microwave Corp. (a) | 6,080 | 211,463 | |||||||||
| Netlogic Microsystems, Inc. (a) | 8,180 | 195,338 | |||||||||
| SiRF Technology Holdings, Inc. (a) | 6,353 | 186,524 | |||||||||
| Supertex, Inc. (a) | 2,730 | 101,938 | |||||||||
| Tessera Technologies, Inc. (a) | 8,379 | 320,413 | |||||||||
| Varian Semiconductor Equipment Associates, Inc. (a) | 3,240 | 133,326 | |||||||||
| Verigy Ltd. (a) | 16,210 | 297,129 | |||||||||
| 1,976,596 | |||||||||||
| Software (7.3%) | |||||||||||
| Activision, Inc. (a) | 7,490 | 127,555 | |||||||||
| ANSYS, Inc. (a) | 4,010 | 200,059 | |||||||||
| Aspen Technology, Inc. (a) | 19,810 | 203,053 | |||||||||
| Hyperion Solutions Corp. (a) | 6,333 | 267,379 | |||||||||
| Informatica Corp. (a) | 10,590 | 133,010 | |||||||||
| KongZhong Corp., ADR (a) | 24,150 | 189,336 | |||||||||
| Micros Systems, Inc. (a) | 3,889 | 218,951 | |||||||||
| Nuance Communications, Inc. (a) | 26,256 | 302,469 | |||||||||
| Quest Software, Inc. (a) | 11,670 | 174,233 | |||||||||
| The9 Ltd., ADR (a) | 7,080 | 260,898 | |||||||||
| THQ, Inc. (a) | 6,910 | 209,373 | |||||||||
| Transaction Systems Architects, Inc. (a) | 5,485 | 198,283 | |||||||||
| Ultimate Software Group, Inc. (a) | 11,200 | 273,056 | |||||||||
| Verint Systems, Inc. (a) | 4,400 | 145,420 | |||||||||
| 2,903,075 | |||||||||||
| 9,518,195 | |||||||||||
| Materials (2.4%) | |||||||||||
| Metals & Mining (2.4%) | |||||||||||
| Century Aluminum Co. (a) | 4,053 | 184,736 | |||||||||
| Claymont Steel Holdings, Inc. (a) | 16,243 | 302,932 | |||||||||
| Universal Stainless & Alloy (a) | 5,870 | 259,747 | |||||||||
| Zinifex Ltd. | 16,700 | 214,770 | |||||||||
| 962,185 | |||||||||||
| Telecommunication Services (3.3%) | |||||||||||
| Diversified Telecommunication Services (0.3%) | |||||||||||
| Cogent Communications Group, Inc. (a) | 5,740 | 120,540 | |||||||||
See Accompanying Notes to Financial Statements.
97
CMG SMALL CAP GROWTH FUND
A Portfolio of Columbia Funds Institutional Trust
SCHEDULE OF INVESTMENTS
| Shares | Value | ||||||||||
| Common Stocks (continued) | |||||||||||
| Wireless Telecommunication Services (3.0%) | |||||||||||
| Dobson Communications Corp., Class A (a) | 28,010 | $ | 271,417 | ||||||||
| InPhonic, Inc. (a) | 10,150 | 140,882 | |||||||||
| Linktone Ltd., ADR (a) | 36,920 | 166,878 | |||||||||
| Millicom International Cellular SA (a) | 2,240 | 148,826 | |||||||||
| SBA Communications Corp., Class A (a) | 14,840 | 440,896 | |||||||||
| 1,168,899 | |||||||||||
| 1,289,439 | |||||||||||
| Total Common Stocks (Cost of $31,146,386) | 37,523,350 | ||||||||||
| Investment Companies (1.1%) | |||||||||||
| Biotech HOLDRs Trust | 811 | 154,779 | |||||||||
| iShares Nasdaq Biotechnology Index Fund (a) | 1,870 | 149,301 | |||||||||
| streetTRACKS SPDR Biotech ETF (a) | 3,082 | 147,813 | |||||||||
| Total Investment Companies (Cost of $420,394) | 451,893 | ||||||||||
| Par | |||||||||||
| Short-Term Obligation (3.9%) | |||||||||||
| Repurchase agreement with Fixed Income Clearing Corp., dated 01/31/07, due 02/01/07 at 5.160%, collateralized by a U.S. Treasury Note maturing 08/15/11, market value of $1,570,750 (repurchase proceeds $1,538,220) | $ | 1,538,000 | 1,538,000 | ||||||||
| Total Short-Term Obligation (Cost of $1,538,000) | 1,538,000 | ||||||||||
| Total Investments (99.7%) (Cost of $33,104,780) (b) | 39,513,243 | ||||||||||
| Other Assets & Liabilities, Net (0.3%) | 111,785 | ||||||||||
| Net Assets (100.0%) | $ | 39,625,028 | |||||||||
Notes to Schedule of Investments:
(a) Non-income producing security.
(b) Cost for federal income tax purposes is $33,104,780.
See Accompanying Notes to Financial Statements.
98
CMG SMALL CAP GROWTH FUND
A Portfolio of Columbia Funds Institutional Trust
SCHEDULE OF INVESTMENTS
At January 31, 2007, the Fund held investments in the following sectors:
| Sector | % of Net Assets | ||||||
| Information Technology | 24.0 | ||||||
| Health Care | 19.6 | ||||||
| Industrials | 16.1 | ||||||
| Consumer Discretionary | 13.0 | ||||||
| Financials | 9.2 | ||||||
| Energy | 5.8 | ||||||
| Telecommunication Services | 3.3 | ||||||
| Materials | 2.4 | ||||||
| Consumer Staples | 1.3 | ||||||
| 94.7 | |||||||
| Investment Companies | 1.1 | ||||||
| Short-Term Obligation | 3.9 | ||||||
| Other Assets & Liabilities, Net | 0.3 | ||||||
| 100.0 | |||||||
| Acronym | Name | ||||||
| ADR | American Depositary Receipt | ||||||
See Accompanying Notes to Financial Statements.
99
CMG SMALL CAP VALUE FUND
A Portfolio of Columbia Funds Institutional Trust
SCHEDULE OF INVESTMENTS
January 31, 2007 (Unaudited)
| Shares | Value | ||||||||||
| Common Stocks (99.4%) | |||||||||||
| Consumer Discretionary (10.8%) | |||||||||||
| Auto Components (1.2%) | |||||||||||
| American Axle & Manufacturing Holdings, Inc. | 4,060 | $ | 84,367 | ||||||||
| BorgWarner, Inc. | 2,680 | 183,687 | |||||||||
| Modine Manufacturing Co. | 4,110 | 107,518 | |||||||||
| 375,572 | |||||||||||
| Distributors (0.4%) | |||||||||||
| Building Materials Holding Corp. | 4,710 | 112,239 | |||||||||
| Diversified Consumer Services (0.3%) | |||||||||||
| Regis Corp. | 1,820 | 76,058 | |||||||||
| Hotels, Restaurants & Leisure (2.0%) | |||||||||||
| Bob Evans Farms, Inc. | 3,630 | 123,311 | |||||||||
| Landry's Restaurants, Inc. | 4,940 | 147,953 | |||||||||
| Multimedia Games, Inc. (a) | 5,646 | 58,549 | |||||||||
| Scientific Games Corp., Class A (a) | 4,970 | 154,269 | |||||||||
| Vail Resorts, Inc. (a) | 2,680 | 123,950 | |||||||||
| 608,032 | |||||||||||
| Household Durables (1.9%) | |||||||||||
| American Greetings Corp., Class A | 9,720 | 233,474 | |||||||||
| CSS Industries, Inc. | 2,330 | 84,043 | |||||||||
| Furniture Brands International, Inc. | 6,480 | 108,022 | |||||||||
| Kimball International, Inc., Class B | 5,960 | 146,854 | |||||||||
| 572,393 | |||||||||||
| Media (0.3%) | |||||||||||
| 4Kids Entertainment, Inc. (a) | 5,260 | 102,938 | |||||||||
| Specialty Retail (3.0%) | |||||||||||
| America's Car-Mart, Inc. (a) | 10,100 | 105,141 | |||||||||
| Borders Group, Inc. | 3,580 | 75,108 | |||||||||
| GameStop Corp., Class A (a) | 2,890 | 154,413 | |||||||||
| Monro Muffler, Inc. | 4,590 | 173,227 | |||||||||
| Payless Shoesource, Inc. (a) | 3,520 | 119,504 | |||||||||
| Rent-A-Center, Inc. (a) | 5,590 | 164,681 | |||||||||
| Zale Corp. (a) | 3,710 | 102,099 | |||||||||
| 894,173 | |||||||||||
| Textiles, Apparel & Luxury Goods (1.7%) | |||||||||||
| Delta Apparel, Inc. | 3,270 | 53,334 | |||||||||
| Hampshire Group Ltd. (a) | 6,092 | 88,029 | |||||||||
| Hartmarx Corp. (a) | 11,379 | 79,425 | |||||||||
| Stride Rite Corp. | 5,450 | 94,067 | |||||||||
| Wolverine World Wide, Inc. | 6,450 | 198,467 | |||||||||
| 513,322 | |||||||||||
| 3,254,727 | |||||||||||
See Accompanying Notes to Financial Statements.
100
CMG SMALL CAP VALUE FUND
A Portfolio of Columbia Funds Institutional Trust
SCHEDULE OF INVESTMENTS
| Shares | Value | ||||||||||
| Common Stocks (continued) | |||||||||||
| Consumer Staples (3.6%) | |||||||||||
| Food & Staples Retailing (1.1%) | |||||||||||
| BJ's Wholesale Club, Inc. (a) | 3,340 | $ | 102,004 | ||||||||
| Weis Markets, Inc. | 5,330 | 230,682 | |||||||||
| 332,686 | |||||||||||
| Food Products (2.5%) | |||||||||||
| Flowers Foods, Inc. | 3,959 | 111,327 | |||||||||
| Fresh Del Monte Produce, Inc. | 4,490 | 69,146 | |||||||||
| J&J Snack Foods Corp. | 2,960 | 122,189 | |||||||||
| Lancaster Colony Corp. | 3,210 | 140,406 | |||||||||
| Lance, Inc. | 4,360 | 92,737 | |||||||||
| Maui Land & Pineapple Co., Inc. (a) | 2,630 | 84,712 | |||||||||
| Ralcorp Holdings, Inc. (a) | 2,580 | 142,777 | |||||||||
| 763,294 | |||||||||||
| 1,095,980 | |||||||||||
| Energy (5.6%) | |||||||||||
| Energy Equipment & Services (2.4%) | |||||||||||
| Complete Production Services, Inc. (a) | 2,473 | 49,139 | |||||||||
| Grey Wolf, Inc. (a) | 16,680 | 113,924 | |||||||||
| Lone Star Technologies, Inc. (a) | 2,590 | 125,227 | |||||||||
| Lufkin Industries, Inc. | 3,777 | 226,053 | |||||||||
| Oil States International, Inc. (a) | 2,040 | 58,793 | |||||||||
| Superior Well Services, Inc. (a) | 1,290 | 29,335 | |||||||||
| TriCo Marine Services, Inc. (a) | 4,193 | 136,398 | |||||||||
| 738,869 | |||||||||||
| Oil, Gas & Consumable Fuels (3.2%) | |||||||||||
| Alpha Natural Resources, Inc. (a) | 4,890 | 65,917 | |||||||||
| Aurora Oil & Gas Corp. (a) | 12,560 | 34,540 | |||||||||
| Bois d'Arc Energy, Inc. (a) | 3,898 | 59,873 | |||||||||
| Comstock Resources, Inc. (a) | 1,710 | 54,634 | |||||||||
| Harvest Natural Resources, Inc. (a) | 9,950 | 100,097 | |||||||||
| Nordic American Tanker Shipping | 3,333 | 118,088 | |||||||||
| Peabody Energy Corp. | 2,460 | 100,442 | |||||||||
| Range Resources Corp. | 6,340 | 194,575 | |||||||||
| Stone Energy Corp. (a) | 2,280 | 77,497 | |||||||||
| Swift Energy Co. (a) | 1,550 | 68,727 | |||||||||
| Western Refining, Inc. | 3,013 | 82,406 | |||||||||
| 956,796 | |||||||||||
| 1,695,665 | |||||||||||
| Financials (27.9%) | |||||||||||
| Capital Markets (0.9%) | |||||||||||
| Piper Jaffray Companies, Inc. (a) | 2,520 | 173,729 | |||||||||
| Thomas Weisel Partners Group, Inc. (a) | 4,436 | 88,498 | |||||||||
| 262,227 | |||||||||||
See Accompanying Notes to Financial Statements.
101
CMG SMALL CAP VALUE FUND
A Portfolio of Columbia Funds Institutional Trust
SCHEDULE OF INVESTMENTS
| Shares | Value | ||||||||||
| Common Stocks (continued) | |||||||||||
| Commercial Banks (11.0%) | |||||||||||
| BancFirst Corp. | 2,010 | $ | 97,827 | ||||||||
| BancTrust Financial Group, Inc. | 4,892 | 105,080 | |||||||||
| Bank of Granite Corp. | 6,992 | 132,079 | |||||||||
| Bryn Mawr Bank Corp. | 4,603 | 110,932 | |||||||||
| Capitol Bancorp Ltd. | 4,290 | 184,041 | |||||||||
| Central Pacific Financial Corp. | 2,800 | 109,424 | |||||||||
| Chemical Financial Corp. | 5,015 | 149,447 | |||||||||
| Chittenden Corp. | 4,960 | 151,082 | |||||||||
| Citizens Banking Corp. | 5,480 | 134,315 | |||||||||
| City Holding Co. | 2,270 | 91,027 | |||||||||
| Columbia Banking System, Inc. | 3,530 | 120,408 | |||||||||
| Community Trust Bancorp, Inc. | 3,452 | 134,973 | |||||||||
| First Citizens BancShares, Inc., Class A | 474 | 97,165 | |||||||||
| First Financial Bankshares, Inc. | 2,590 | 106,760 | |||||||||
| First Financial Corp. | 3,720 | 122,723 | |||||||||
| First National Bank of Alaska | 19 | 40,090 | |||||||||
| Mass Financial Corp., Class A (a) | 13,010 | 34,867 | |||||||||
| Merchants Bancshares, Inc. | 4,070 | 93,122 | |||||||||
| Northrim BanCorp, Inc. | 3,924 | 110,853 | |||||||||
| Park National Corp. | 178 | 17,538 | |||||||||
| S&T Bancorp, Inc. | 3,734 | 129,420 | |||||||||
| Sandy Spring Bancorp, Inc. | 2,350 | 84,624 | |||||||||
| South Financial Group, Inc. | 2,035 | 52,584 | |||||||||
| Sterling Bancorp NY | 5,130 | 95,418 | |||||||||
| Susquehanna Bancshares, Inc. | 5,560 | 140,334 | |||||||||
| Taylor Capital Group, Inc. | 3,800 | 144,286 | |||||||||
| TriCo Bancshares | 3,757 | 101,289 | |||||||||
| Trustmark Corp. | 2,850 | 83,961 | |||||||||
| UMB Financial Corp. | 5,070 | 185,410 | |||||||||
| Whitney Holding Corp. | 5,340 | 168,958 | |||||||||
| 3,330,037 | |||||||||||
| Consumer Finance (1.6%) | |||||||||||
| Advance America Cash Advance Centers, Inc. | 13,600 | 189,856 | |||||||||
| Cash America International, Inc. | 7,020 | 299,824 | |||||||||
| 489,680 | |||||||||||
| Diversified Financial Services (0.5%) | |||||||||||
| Financial Federal Corp. | 1,015 | 29,029 | |||||||||
| Medallion Financial Corp. | 10,350 | 116,852 | |||||||||
| 145,881 | |||||||||||
| Insurance (7.0%) | |||||||||||
| American Physicians Capital, Inc. (a) | 4,165 | 161,185 | |||||||||
| Baldwin & Lyons, Inc., Class B | 3,871 | 101,110 | |||||||||
| CNA Surety Corp. (a) | 7,270 | 154,487 | |||||||||
| Commerce Group, Inc. | 5,220 | 157,540 | |||||||||
| Delphi Financial Group, Inc., Class A | 5,310 | 209,426 | |||||||||
| Harleysville Group, Inc. | 2,935 | 99,790 | |||||||||
| Horace Mann Educators Corp. | 8,030 | 159,235 | |||||||||
| KMG America Corp. (a) | 11,431 | 105,737 | |||||||||
See Accompanying Notes to Financial Statements.
102
CMG SMALL CAP VALUE FUND
A Portfolio of Columbia Funds Institutional Trust
SCHEDULE OF INVESTMENTS
| Shares | Value | ||||||||||
| Common Stocks (continued) | |||||||||||
| Insurance (continued) | |||||||||||
| National Western Life Insurance Co., Class A | 394 | $ | 90,419 | ||||||||
| Navigators Group, Inc. (a) | 5,054 | 241,531 | |||||||||
| Phoenix Companies, Inc. | 10,820 | 162,625 | |||||||||
| ProCentury Corp. | 9,181 | 180,407 | |||||||||
| RLI Corp. | 2,602 | 143,995 | |||||||||
| United America Indemnity Ltd., Class A (a) | 6,320 | 152,438 | |||||||||
| 2,119,925 | |||||||||||
| Real Estate Investment Trusts (REITs) (6.1%) | |||||||||||
| Cousins Properties, Inc. | 571 | 22,349 | |||||||||
| Crescent Real Estate Equities Co. | 8,600 | 172,516 | |||||||||
| Equity One, Inc. | 6,460 | 179,201 | |||||||||
| Franklin Street Properties Corp. | 8,126 | 166,989 | |||||||||
| Getty Realty Corp. | 4,320 | 134,568 | |||||||||
| Healthcare Realty Trust, Inc. | 4,440 | 188,167 | |||||||||
| Highland Hospitality Corp. | 8,490 | 134,821 | |||||||||
| Lexington Corporate Properties Trust | 6,970 | 148,322 | |||||||||
| National Health Investors, Inc. | 662 | 21,250 | |||||||||
| Potlatch Corp. | 3,400 | 160,514 | |||||||||
| Strategic Hotels & Resorts, Inc. | 7,140 | 153,653 | |||||||||
| Sun Communities, Inc. | 3,900 | 123,279 | |||||||||
| Universal Health Realty Income Trust | 3,060 | 123,746 | |||||||||
| Urstadt Biddle Properties, Inc., Class A | 6,380 | 123,963 | |||||||||
| 1,853,338 | |||||||||||
| Thrifts & Mortgage Finance (0.8%) | |||||||||||
| Corus Bankshares, Inc. | 7,212 | 153,615 | |||||||||
| TrustCo Bank Corp. NY | 7,740 | 81,425 | |||||||||
| Washington Federal, Inc. | 109 | 2,528 | |||||||||
| 237,568 | |||||||||||
| 8,438,656 | |||||||||||
| Health Care (9.8%) | |||||||||||
| Health Care Equipment & Supplies (2.5%) | |||||||||||
| Analogic Corp. | 1,540 | 90,429 | |||||||||
| DJO, Inc. (a) | 2,130 | 88,182 | |||||||||
| Greatbatch, Inc. (a) | 2,980 | �� | 87,582 | ||||||||
| Haemonetics Corp. (a) | 3,220 | 155,333 | |||||||||
| STERIS Corp. | 7,530 | 194,575 | |||||||||
| Viasys Healthcare, Inc. (a) | 2,580 | 75,929 | |||||||||
| Vital Signs, Inc. | 1,300 | 67,600 | |||||||||
| 759,630 | |||||||||||
| Health Care Providers & Services (5.2%) | |||||||||||
| Cross Country Healthcare, Inc. (a) | 7,000 | 157,920 | |||||||||
| Genesis HealthCare Corp. (a) | 3,570 | 218,555 | |||||||||
| Gentiva Health Services, Inc. (a) | 7,330 | 145,134 | |||||||||
| Hooper Holmes, Inc. (a) | 11,900 | 40,103 | |||||||||
| Kindred Healthcare, Inc. (a) | 6,350 | 182,245 | |||||||||
| Owens & Minor, Inc. | 3,520 | 117,744 | |||||||||
| Pediatrix Medical Group, Inc. (a) | 5,860 | 307,885 | |||||||||
See Accompanying Notes to Financial Statements.
103
CMG SMALL CAP VALUE FUND
A Portfolio of Columbia Funds Institutional Trust
SCHEDULE OF INVESTMENTS
| Shares | Value | ||||||||||
| Common Stocks (continued) | |||||||||||
| Health Care Providers & Services (continued) | |||||||||||
| RehabCare Group, Inc. (a) | 3,070 | $ | 46,603 | ||||||||
| Res-Care, Inc. (a) | 6,430 | 111,689 | |||||||||
| Symbion, Inc. (a) | 4,940 | 92,378 | |||||||||
| U.S. Physical Therapy, Inc. (a) | 4,210 | 59,361 | |||||||||
| United Surgical Partners International, Inc. (a) | 3,220 | 98,113 | |||||||||
| 1,577,730 | |||||||||||
| Life Sciences Tools & Services (1.4%) | |||||||||||
| Bio-Rad Laboratories, Inc., Class A (a) | 1,880 | 161,755 | |||||||||
| PAREXEL International Corp. (a) | 5,330 | 174,558 | |||||||||
| Varian, Inc. (a) | 1,600 | 85,616 | |||||||||
| 421,929 | |||||||||||
| Pharmaceuticals (0.7%) | |||||||||||
| Alpharma, Inc., Class A | 4,990 | 137,474 | |||||||||
| Sciele Pharma, Inc. (a) | 2,317 | 55,029 | |||||||||
| 192,503 | |||||||||||
| 2,951,792 | |||||||||||
| Industrials (17.8%) | |||||||||||
| Aerospace & Defense (2.8%) | |||||||||||
| AAR Corp. (a) | 6,685 | 199,146 | |||||||||
| Esterline Technologies Corp. (a) | 4,570 | 182,663 | |||||||||
| Moog, Inc., Class A (a) | 2,340 | 91,236 | |||||||||
| Precision Castparts Corp. | 4,320 | 384,005 | |||||||||
| 857,050 | |||||||||||
| Airlines (0.8%) | |||||||||||
| JetBlue Airways Corp. (a) | 8,555 | 117,032 | |||||||||
| Skywest, Inc. | 4,960 | 134,615 | |||||||||
| 251,647 | |||||||||||
| Building Products (1.3%) | |||||||||||
| Goodman Global, Inc. (a) | 4,334 | 77,015 | |||||||||
| Lennox International, Inc. | 3,080 | 93,447 | |||||||||
| NCI Building Systems, Inc. (a) | 4,120 | 234,511 | |||||||||
| 404,973 | |||||||||||
| Commercial Services & Supplies (4.2%) | |||||||||||
| ABM Industries, Inc. | 3,610 | 93,283 | |||||||||
| Casella Waste Systems, Inc., Class A (a) | 7,060 | 88,250 | |||||||||
| CBIZ, Inc. (a) | 6,292 | 42,156 | |||||||||
| Consolidated Graphics, Inc. (a) | 4,090 | 253,580 | |||||||||
| Healthcare Services Group, Inc. | 5,849 | 169,153 | |||||||||
| IKON Office Solutions, Inc. | 5,480 | 81,652 | |||||||||
| Korn/Ferry International (a) | 4,770 | 113,908 | |||||||||
| Navigant Consulting, Inc. (a) | 4,740 | 98,497 | |||||||||
| TeleTech Holdings, Inc. (a) | 7,555 | 203,607 | |||||||||
| United Stationers, Inc. (a) | 2,250 | 114,660 | |||||||||
| 1,258,746 | |||||||||||
See Accompanying Notes to Financial Statements.
104
CMG SMALL CAP VALUE FUND
A Portfolio of Columbia Funds Institutional Trust
SCHEDULE OF INVESTMENTS
| Shares | Value | ||||||||||
| Common Stocks (continued) | |||||||||||
| Construction & Engineering (2.0%) | |||||||||||
| EMCOR Group, Inc. (a) | 3,080 | $ | 176,853 | ||||||||
| KHD Humboldt Wedag International Ltd. (a) | 8,932 | 351,653 | |||||||||
| Washington Group International, Inc. (a) | 1,530 | 87,409 | |||||||||
| 615,915 | |||||||||||
| Electrical Equipment (1.9%) | |||||||||||
| Belden CDT, Inc. | 3,030 | 131,048 | |||||||||
| Genlyte Group, Inc. (a) | 2,820 | 213,671 | |||||||||
| Woodward Governor Co. | 5,260 | 220,078 | |||||||||
| 564,797 | |||||||||||
| Machinery (2.2%) | |||||||||||
| Briggs & Stratton Corp. | 3,880 | 115,003 | |||||||||
| EnPro Industries, Inc. (a) | 5,060 | 167,233 | |||||||||
| Harsco Corp. | 3,570 | 306,592 | |||||||||
| Kadant, Inc. (a) | 2,243 | 61,346 | |||||||||
| 650,174 | |||||||||||
| Road & Rail (1.3%) | |||||||||||
| Dollar Thrifty Automotive Group, Inc. (a) | 1,590 | 74,937 | |||||||||
| Ryder System, Inc. | 2,180 | 118,897 | |||||||||
| Werner Enterprises, Inc. | 10,000 | 190,100 | |||||||||
| 383,934 | |||||||||||
| Trading Companies & Distributors (1.0%) | |||||||||||
| Kaman Corp. | 4,520 | 103,011 | |||||||||
| Watsco, Inc. | 3,790 | 193,366 | |||||||||
| 296,377 | |||||||||||
| Transportation Infrastructure (0.3%) | |||||||||||
| Interpool, Inc. | 4,190 | 103,535 | |||||||||
| 5,387,148 | |||||||||||
| Information Technology (13.2%) | |||||||||||
| Communications Equipment (1.9%) | |||||||||||
| Anaren, Inc. (a) | 8,230 | 135,795 | |||||||||
| Andrew Corp. (a) | 6,250 | 66,375 | |||||||||
| Black Box Corp. | 1,981 | 81,379 | |||||||||
| Dycom Industries, Inc. (a) | 6,000 | 135,780 | |||||||||
| Polycom, Inc. (a) | 3,050 | 102,541 | |||||||||
| Tollgrade Communications, Inc. (a) | 5,060 | 50,904 | |||||||||
| 572,774 | |||||||||||
| Computers & Peripherals (1.1%) | |||||||||||
| Electronics for Imaging, Inc. (a) | 5,750 | 132,537 | |||||||||
| Emulex Corp. (a) | 5,450 | 96,738 | |||||||||
| Imation Corp. | 1,930 | 83,974 | |||||||||
| Mobility Electronics, Inc. (a) | 8,175 | 30,820 | |||||||||
| 344,069 | |||||||||||
| Electronic Equipment & Instruments (3.2%) | |||||||||||
| Agilysys, Inc. | 3,870 | 73,336 | |||||||||
| Anixter International, Inc. (a) | 2,930 | 161,941 | |||||||||
| Benchmark Electronics, Inc. (a) | 5,960 | 134,994 | |||||||||
See Accompanying Notes to Financial Statements.
105
CMG SMALL CAP VALUE FUND
A Portfolio of Columbia Funds Institutional Trust
SCHEDULE OF INVESTMENTS
| Shares | Value | ||||||||||
| Common Stocks (continued) | |||||||||||
| Electronic Equipment & Instruments (continued) | |||||||||||
| Brightpoint, Inc. (a) | 12,406 | $ | 136,590 | ||||||||
| Coherent, Inc. (a) | 2,512 | 77,244 | |||||||||
| MTS Systems Corp. | 3,470 | 148,412 | |||||||||
| NAM TAI Electronics, Inc. | 6,940 | 93,829 | |||||||||
| Vishay Intertechnology, Inc. (a) | 10,620 | 139,547 | |||||||||
| 965,893 | |||||||||||
| Internet Software & Services (0.1%) | |||||||||||
| Keynote Systems, Inc. (a) | 2,271 | 26,843 | |||||||||
| IT Services (1.5%) | |||||||||||
| Acxiom Corp. | 3,372 | 76,544 | |||||||||
| CSG Systems International, Inc. (a) | 1,788 | 44,843 | |||||||||
| MAXIMUS, Inc. | 2,090 | 63,014 | |||||||||
| MPS Group, Inc. (a) | 17,460 | 261,551 | |||||||||
| 445,952 | |||||||||||
| Semiconductors & Semiconductor Equipment (3.1%) | |||||||||||
| Actel Corp. (a) | 5,508 | 98,373 | |||||||||
| Advanced Energy Industries, Inc. (a) | 3,650 | 63,255 | |||||||||
| Asyst Technologies, Inc. (a) | 7,753 | 50,317 | |||||||||
| ATMI, Inc. (a) | 1,630 | 54,507 | |||||||||
| Brooks Automation, Inc. (a) | 3,154 | 43,904 | |||||||||
| Cabot Microelectronics Corp. (a) | 1,430 | 43,172 | |||||||||
| Exar Corp. (a) | 6,060 | 79,386 | |||||||||
| Fairchild Semiconductor International, Inc. (a) | 4,630 | 82,460 | |||||||||
| MEMC Electronic Materials, Inc. (a) | 2,330 | 122,092 | |||||||||
| Sigmatel, Inc. (a) | 13,950 | 54,126 | |||||||||
| Standard Microsystems Corp. (a) | 4,010 | 111,879 | |||||||||
| Varian Semiconductor Equipment Associates, Inc. (a) | 1,590 | 65,428 | |||||||||
| Veeco Instruments, Inc. (a) | 3,060 | 58,721 | |||||||||
| 927,620 | |||||||||||
| Software (2.3%) | |||||||||||
| Captaris, Inc. (a) | 12,310 | 108,451 | |||||||||
| Lawson Software, Inc. (a) | 4,990 | 37,475 | |||||||||
| MapInfo Corp. (a) | 5,750 | 78,488 | |||||||||
| MSC.Software Corp. (a) | 7,940 | 124,658 | |||||||||
| Sybase, Inc. (a) | 5,060 | 131,004 | |||||||||
| Synchronoss Technologies, Inc. (a) | 4,286 | 66,004 | |||||||||
| Transaction Systems Architects, Inc. (a) | 4,160 | 150,384 | |||||||||
| 696,464 | |||||||||||
| 3,979,615 | |||||||||||
| Materials (6.8%) | |||||||||||
| Chemicals (1.6%) | |||||||||||
| H.B. Fuller Co. | 8,340 | 215,756 | |||||||||
| Minerals Technologies, Inc. | 2,280 | 132,400 | |||||||||
| Sensient Technologies Corp. | 5,720 | 141,169 | |||||||||
| 489,325 | |||||||||||
See Accompanying Notes to Financial Statements.
106
CMG SMALL CAP VALUE FUND
A Portfolio of Columbia Funds Institutional Trust
SCHEDULE OF INVESTMENTS
| Shares | Value | ||||||||||
| Common Stocks (continued) | |||||||||||
| Construction Materials (0.9%) | |||||||||||
| Eagle Materials, Inc. | 5,200 | $ | 256,828 | ||||||||
| Containers & Packaging (1.6%) | |||||||||||
| AptarGroup, Inc. | 2,680 | 163,507 | |||||||||
| Greif, Inc., Class A | 2,920 | 333,785 | |||||||||
| 497,292 | |||||||||||
| Metals & Mining (1.8%) | |||||||||||
| Carpenter Technology Corp. | 1,430 | 167,453 | |||||||||
| Metal Management, Inc. | 2,380 | 97,675 | |||||||||
| RTI International Metals, Inc. (a) | 1,930 | 157,778 | |||||||||
| Worthington Industries, Inc. | 5,840 | 112,011 | |||||||||
| 534,917 | |||||||||||
| Paper & Forest Products (0.9%) | |||||||||||
| Glatfelter Co. | 8,280 | 134,053 | |||||||||
| Mercer International, Inc. (a) | 10,810 | 130,909 | |||||||||
| 264,962 | |||||||||||
| 2,043,324 | |||||||||||
| Telecommunication Services (0.3%) | |||||||||||
| Diversified Telecommunication Services (0.3%) | |||||||||||
| North Pittsburgh Systems, Inc. | 3,770 | 88,859 | |||||||||
| Utilities (3.6%) | |||||||||||
| Electric Utilities (2.1%) | |||||||||||
| ALLETE, Inc. | 2,180 | 104,836 | |||||||||
| El Paso Electric Co. (a) | 5,960 | 144,828 | |||||||||
| Maine & Maritimes Corp. (a)(b) | 1,190 | 18,742 | |||||||||
| MGE Energy, Inc. | 3,090 | 105,616 | |||||||||
| Otter Tail Corp. | 3,960 | 128,027 | |||||||||
| Puget Energy, Inc. | 5,730 | 140,729 | |||||||||
| 642,778 | |||||||||||
| Gas Utilities (0.8%) | |||||||||||
| Northwest Natural Gas Co. | 2,980 | 121,256 | |||||||||
| WGL Holdings, Inc. | 4,250 | 134,428 | |||||||||
| 255,684 | |||||||||||
| Multi-Utilities (0.7%) | |||||||||||
| CH Energy Group, Inc. | 4,070 | 207,733 | |||||||||
| 1,106,195 | |||||||||||
| Total Common Stocks (Cost of $20,036,820) | 30,041,961 | ||||||||||
See Accompanying Notes to Financial Statements.
107
CMG SMALL CAP VALUE FUND
A Portfolio of Columbia Funds Institutional Trust
SCHEDULE OF INVESTMENTS
| Par | Value | ||||||||||
| Short-Term Obligation (0.5%) | |||||||||||
| Repurchase agreement with Fixed Income Clearing Corp., dated 01/31/07, due 02/01/07 at 5.160%, collateralized by a U.S. Treasury Bond maturing 08/15/29, market value of $152,282 (repurchase proceeds $144,021) | $ | 144,000 | $ | 144,000 | |||||||
| Total Short-Term Obligation (Cost of $144,000) | 144,000 | ||||||||||
| Total Investments (99.9%) (Cost of $20,180,820) (c) | 30,185,961 | ||||||||||
| Other Assets & Liabilities, Net (0.1%) | 30,136 | ||||||||||
| Net Assets (100.0%) | $ | 30,216,097 | |||||||||
Notes to Schedule of Investments:
(a) Non-income producing security.
(b) Represents fair value as determined in good faith under procedures approved by the Board of Trustees.
(c) Cost for federal income tax purposes is $20,180,820.
At January 31, 2007, the Fund held investments in the following sectors:
| Sector | % of Net Assets | ||||||
| Financials | 27.9 | ||||||
| Industrials | 17.8 | ||||||
| Information Technology | 13.2 | ||||||
| Consumer Discretionary | 10.8 | ||||||
| Health Care | 9.8 | ||||||
| Materials | 6.8 | ||||||
| Energy | 5.6 | ||||||
| Utilities | 3.6 | ||||||
| Consumer Staples | 3.6 | ||||||
| Telecommunication Services | 0.3 | ||||||
| 99.4 | |||||||
| Short-Term Obligation | 0.5 | ||||||
| Other Assets & Liabilities, Net | 0.1 | ||||||
| 100.0 | |||||||
See Accompanying Notes to Financial Statements.
108
CMG SMALL/MID CAP FUND
A Portfolio of Columbia Funds Institutional Trust
SCHEDULE OF INVESTMENTS
January 31, 2007 (Unaudited)
| Shares | Value | ||||||||||
| Common Stocks (98.3%) | |||||||||||
| Consumer Discretionary (13.5%) | |||||||||||
| Automobiles (0.5%) | |||||||||||
| Piaggio & Cie SpA (a) | 12,030 | $ | 52,436 | ||||||||
| Diversified Consumer Services (0.7%) | |||||||||||
| ITT Educational Services, Inc. (a) | 400 | 31,040 | |||||||||
| Strayer Education, Inc. | 330 | 37,544 | |||||||||
| 68,584 | |||||||||||
| Hotels, Restaurants & Leisure (2.8%) | |||||||||||
| Brinker International, Inc. | 930 | 29,341 | |||||||||
| Chipotle Mexican Grill, Inc., Class A (a) | 850 | 50,507 | |||||||||
| Hilton Hotels Corp. | 2,790 | 98,738 | |||||||||
| Pinnacle Entertainment, Inc. (a) | 1,652 | 57,044 | |||||||||
| Scientific Games Corp., Class A (a) | 1,550 | 48,112 | |||||||||
| 283,742 | |||||||||||
| Household Durables (0.3%) | |||||||||||
| NVR, Inc. (a) | 45 | 31,163 | |||||||||
| Internet & Catalog Retail (1.1%) | |||||||||||
| Gmarket, Inc. (a) | 1,230 | 26,322 | |||||||||
| Nutri/System, Inc. (a) | 980 | 43,169 | |||||||||
| Priceline.com, Inc. (a) | 1,150 | 49,013 | |||||||||
| 118,504 | |||||||||||
| Leisure Equipment & Products (0.5%) | |||||||||||
| Pool Corp. | 1,340 | 49,044 | |||||||||
| Media (1.6%) | |||||||||||
| Getty Images, Inc. (a) | 690 | 33,976 | |||||||||
| Grupo Televisa SA, ADR | 3,130 | 92,210 | |||||||||
| NET Servicos de Comunicacao SA, ADR (a) | 2,980 | 36,177 | |||||||||
| 162,363 | |||||||||||
| Specialty Retail (3.0%) | |||||||||||
| Christopher & Banks Corp. | 1,600 | 28,448 | |||||||||
| GameStop Corp., Class A (a) | 2,090 | 111,669 | |||||||||
| Hibbett Sporting Goods, Inc. (a) | 1,800 | 57,798 | |||||||||
| Monro Muffler, Inc. | 700 | 26,418 | |||||||||
| Tractor Supply Co. (a) | 1,080 | 54,356 | |||||||||
| Tween Brands, Inc. (a) | 970 | 33,164 | |||||||||
| 311,853 | |||||||||||
| Textiles, Apparel & Luxury Goods (3.0%) | |||||||||||
| Carter's, Inc. (a) | 2,970 | 75,438 | |||||||||
| Coach, Inc. (a) | 2,370 | 108,688 | |||||||||
| Phillips-Van Heusen Corp. | 830 | 45,775 | |||||||||
| Quiksilver, Inc. (a) | 5,700 | 80,997 | |||||||||
| 310,898 | |||||||||||
| 1,388,587 | |||||||||||
See Accompanying Notes to Financial Statements.
109
CMG SMALL/MID CAP FUND
A Portfolio of Columbia Funds Institutional Trust
SCHEDULE OF INVESTMENTS
| Shares | Value | ||||||||||
| Common Stocks (continued) | |||||||||||
| Consumer Staples (3.1%) | |||||||||||
| Beverages (0.6%) | |||||||||||
| Hansen Natural Corp. (a) | 1,590 | $ | 60,563 | ||||||||
| Food Products (1.5%) | |||||||||||
| Campbell Soup Co. | 1,260 | 48,485 | |||||||||
| Dean Foods Co. (a) | 690 | 30,533 | |||||||||
| Hershey Co. | 610 | 31,134 | |||||||||
| McCormick & Co., Inc. | 1,050 | 40,992 | |||||||||
| 151,144 | |||||||||||
| Household Products (0.3%) | |||||||||||
| Central Garden & Pet Co. (a) | 690 | 30,905 | |||||||||
| Personal Products (0.4%) | |||||||||||
| USANA Health Sciences, Inc. (a) | 780 | 41,402 | |||||||||
| Tobacco (0.3%) | |||||||||||
| UST, Inc. | 640 | 36,762 | |||||||||
| 320,776 | |||||||||||
| Energy (7.0%) | |||||||||||
| Energy Equipment & Services (2.7%) | |||||||||||
| Atwood Oceanics, Inc. (a) | 1,440 | 69,653 | |||||||||
| BJ Services Co. | 1,800 | 49,788 | |||||||||
| FMC Technologies, Inc. (a) | 1,010 | 62,550 | |||||||||
| Grant Prideco, Inc. (a) | 1,340 | 52,501 | |||||||||
| Oil States International, Inc. (a) | 1,360 | 39,195 | |||||||||
| 273,687 | |||||||||||
| Oil, Gas & Consumable Fuels (4.3%) | |||||||||||
| Cameco Corp. | 1,260 | 48,044 | |||||||||
| Denbury Resources, Inc. (a) | 3,130 | 86,701 | |||||||||
| Helix Energy Solutions Group, Inc. (a) | 2,010 | 64,662 | |||||||||
| Petroplus Holdings AG (a) | 587 | 37,524 | |||||||||
| Range Resources Corp. | 1,910 | 58,618 | |||||||||
| Ship Finance Intl Ltd. | 2,220 | 52,680 | |||||||||
| Southwestern Energy Co. (a) | 2,510 | 96,534 | |||||||||
| 444,763 | |||||||||||
| 718,450 | |||||||||||
| Financials (9.2%) | |||||||||||
| Capital Markets (3.2%) | |||||||||||
| Affiliated Managers Group, Inc. (a) | 1,270 | 141,478 | |||||||||
| Greenhill & Co., Inc. | 533 | 39,938 | |||||||||
| Investment Technology Group, Inc. (a) | 760 | 33,136 | |||||||||
| Lazard Ltd., Class A | 1,510 | 76,648 | |||||||||
| Waddell & Reed Financial, Inc., Class A | 1,620 | 41,585 | |||||||||
| 332,785 | |||||||||||
See Accompanying Notes to Financial Statements.
110
CMG SMALL/MID CAP FUND
A Portfolio of Columbia Funds Institutional Trust
SCHEDULE OF INVESTMENTS
| Shares | Value | ||||||||||
| Common Stocks (continued) | |||||||||||
| Commercial Banks (2.2%) | |||||||||||
| City National Corp. | 350 | $ | 25,176 | ||||||||
| Signature Bank (a) | 2,190 | 72,511 | |||||||||
| WSB Financial Group, Inc. (a) | 2,378 | 46,252 | |||||||||
| Zions Bancorporation | 910 | 77,186 | |||||||||
| 221,125 | |||||||||||
| Consumer Finance (0.5%) | |||||||||||
| First Cash Financial Services, Inc. (a) | 2,330 | 54,708 | |||||||||
| Insurance (1.7%) | |||||||||||
| Ambac Financial Group, Inc. | 870 | 76,647 | |||||||||
| ProAssurance Corp. (a) | 1,890 | 95,993 | |||||||||
| 172,640 | |||||||||||
| Real Estate Investment Trusts (REITs) (1.6%) | |||||||||||
| Alexandria Real Estate Equities, Inc. | 420 | 45,511 | |||||||||
| CapitalSource, Inc. | 920 | 25,567 | |||||||||
| General Growth Properties, Inc. | 800 | 49,216 | |||||||||
| Washington Real Estate Investment Trust | 1,020 | 43,605 | |||||||||
| 163,899 | |||||||||||
| 945,157 | |||||||||||
| Health Care (20.1%) | |||||||||||
| Biotechnology (3.5%) | |||||||||||
| Alkermes, Inc. (a) | 1,140 | 17,009 | |||||||||
| Allos Therapeutics, Inc. (a) | 6,610 | 41,445 | |||||||||
| Applera Corp. - Celera Group (a) | 2,100 | 33,306 | |||||||||
| ArQule, Inc. (a) | 2,841 | 18,608 | |||||||||
| Array Biopharma, Inc. (a) | 3,060 | 42,106 | |||||||||
| BioMarin Pharmaceuticals, Inc. (a) | 870 | 16,478 | |||||||||
| Cephalon, Inc. (a) | 540 | 39,101 | |||||||||
| Cubist Pharmaceuticals, Inc. (a) | 2,310 | 42,504 | |||||||||
| Digene Corp. (a) | 780 | 40,131 | |||||||||
| Onyx Pharmaceuticals, Inc. (a) | 2,130 | 25,240 | |||||||||
| OSI Pharmaceuticals, Inc. (a) | 1,180 | 40,144 | |||||||||
| 356,072 | |||||||||||
| Health Care Equipment & Supplies (5.9%) | |||||||||||
| Beckman Coulter, Inc. | 510 | 32,905 | |||||||||
| Bespak PLC | 2,880 | 41,243 | |||||||||
| Cytyc Corp. (a) | 1,840 | 53,213 | |||||||||
| Gen-Probe, Inc. (a) | 790 | 40,859 | |||||||||
| Haemonetics Corp. (a) | 1,488 | 71,781 | |||||||||
| IDEXX Laboratories, Inc. (a) | 250 | 21,453 | |||||||||
| Intuitive Surgical, Inc. (a) | 290 | 28,539 | |||||||||
| Kinetic Concepts, Inc. (a) | 440 | 21,644 | |||||||||
| Mentor Corp. | 770 | 39,262 | |||||||||
| NuVasive, Inc. (a) | 3,690 | 89,335 | |||||||||
| ResMed, Inc. (a) | 1,068 | 56,155 | |||||||||
See Accompanying Notes to Financial Statements.
111
CMG SMALL/MID CAP FUND
A Portfolio of Columbia Funds Institutional Trust
SCHEDULE OF INVESTMENTS
| Shares | Value | ||||||||||
| Common Stocks (continued) | |||||||||||
| Health Care Equipment & Supplies (continued) | |||||||||||
| Thoratec Corp. (a) | 3,190 | $ | 57,452 | ||||||||
| Varian Medical Systems, Inc. (a) | 1,126 | 51,942 | |||||||||
| 605,783 | |||||||||||
| Health Care Providers & Services (3.7%) | |||||||||||
| Animal Health International, Inc. | 898 | 11,180 | |||||||||
| DaVita, Inc. (a) | 1,247 | 68,086 | |||||||||
| HealthExtras, Inc. (a) | 2,655 | 67,862 | |||||||||
| Henry Schein, Inc. (a) | 690 | 35,031 | |||||||||
| Lincare Holdings, Inc. (a) | 1,040 | 40,924 | |||||||||
| Patterson Companies, Inc. (a) | 1,110 | 41,747 | |||||||||
| Psychiatric Solutions, Inc. (a) | 1,680 | 65,419 | |||||||||
| Quest Diagnostics, Inc. | 970 | 50,906 | |||||||||
| 381,155 | |||||||||||
| Health Care Technology (1.1%) | |||||||||||
| Allscripts Healthcare Solutions, Inc. (a) | 3,495 | 106,947 | |||||||||
| Life Sciences Tools & Services (3.5%) | |||||||||||
| ICON PLC, ADR (a) | 4,036 | 150,543 | |||||||||
| Illumina, Inc. (a) | 630 | 25,735 | |||||||||
| Invitrogen Corp. (a) | 690 | 42,249 | |||||||||
| Pharmaceutical Product Development, Inc. | 720 | 24,840 | |||||||||
| Thermo Fisher Scientific, Inc. (a) | 1,600 | 76,560 | |||||||||
| Waters Corp. (a) | 730 | 41,384 | |||||||||
| 361,311 | |||||||||||
| Pharmaceuticals (2.4%) | |||||||||||
| Allergan, Inc. | 680 | 79,363 | |||||||||
| Medicis Pharmaceutical Corp., Class A | 1,610 | 61,067 | |||||||||
| Penwest Pharmaceuticals Co. (a) | 4,240 | 60,378 | |||||||||
| Pozen, Inc. (a) | 1,490 | 25,196 | |||||||||
| Viropharma, Inc. (a) | 1,200 | 20,436 | |||||||||
| 246,440 | |||||||||||
| 2,057,708 | |||||||||||
| Industrials (13.8%) | |||||||||||
| Aerospace & Defense (2.6%) | |||||||||||
| Armor Holdings, Inc. (a) | 670 | 40,535 | |||||||||
| BE Aerospace, Inc. (a) | 2,220 | 66,111 | |||||||||
| Ceradyne, Inc. (a) | 850 | 45,968 | |||||||||
| Hexcel Corp. (a) | 2,270 | 43,675 | |||||||||
| Rockwell Collins, Inc. | 990 | 67,528 | |||||||||
| 263,817 | |||||||||||
| Air Freight & Logistics (0.4%) | |||||||||||
| UTI Worldwide, Inc. | 1,290 | 39,216 | |||||||||
| Airlines (0.6%) | |||||||||||
| Alaska Air Group, Inc. (a) | 1,450 | 62,133 | |||||||||
See Accompanying Notes to Financial Statements.
112
CMG SMALL/MID CAP FUND
A Portfolio of Columbia Funds Institutional Trust
SCHEDULE OF INVESTMENTS
| Shares | Value | ||||||||||
| Common Stocks (continued) | |||||||||||
| Commercial Services & Supplies (6.2%) | |||||||||||
| ACCO Brands Corp. (a) | 2,530 | $ | 61,049 | ||||||||
| Corporate Executive Board Co. | 810 | 73,491 | |||||||||
| Huron Consulting Group, Inc. (a) | 3,515 | 182,253 | |||||||||
| Kenexa Corp. (a) | 2,812 | 102,638 | |||||||||
| Monster Worldwide, Inc. (a) | 1,070 | 52,869 | |||||||||
| Resources Connection, Inc. (a) | 3,300 | 103,620 | |||||||||
| Robert Half International, Inc. | 1,390 | 56,573 | |||||||||
| 632,493 | |||||||||||
| Electrical Equipment (1.4%) | |||||||||||
| General Cable Corp. (a) | 2,650 | 114,295 | |||||||||
| Roper Industries, Inc. | 510 | 26,479 | |||||||||
| 140,774 | |||||||||||
| Machinery (1.2%) | |||||||||||
| ESCO Technologies, Inc. (a) | 1,190 | 56,846 | |||||||||
| Force Protection, Inc. (a) | 1,270 | 22,847 | |||||||||
| Terex Corp. (a) | 860 | 48,926 | |||||||||
| 128,619 | |||||||||||
| Marine (0.5%) | |||||||||||
| American Commercial Lines, Inc. (a) | 710 | 50,012 | |||||||||
| Road & Rail (0.9%) | |||||||||||
| Genesee & Wyoming, Inc., Class A (a) | 890 | 25,089 | |||||||||
| Landstar System, Inc. | 1,660 | 70,201 | |||||||||
| 95,290 | |||||||||||
| 1,412,354 | |||||||||||
| Information Technology (20.9%) | |||||||||||
| Communications Equipment (1.1%) | |||||||||||
| F5 Networks, Inc. (a) | 940 | 67,153 | |||||||||
| Harris Corp. | 980 | 49,804 | |||||||||
| 116,957 | |||||||||||
| Computers & Peripherals (1.4%) | |||||||||||
| Brocade Communications Systems, Inc. (a) | 7,690 | 65,980 | |||||||||
| Emulex Corp. (a) | 1,490 | 26,448 | |||||||||
| Synaptics, Inc. (a) | 1,870 | 50,602 | |||||||||
| 143,030 | |||||||||||
| Electronic Equipment & Instruments (1.6%) | |||||||||||
| Amphenol Corp., Class A | 370 | 25,056 | |||||||||
| Mettler-Toledo International, Inc. (a) | 570 | 47,196 | |||||||||
| Novatel, Inc. (a) | 1,480 | 61,050 | |||||||||
| Sunpower Corp., Class A (a) | 700 | 31,010 | |||||||||
| 164,312 | |||||||||||
| Internet Software & Services (2.5%) | |||||||||||
| Akamai Technologies, Inc. (a) | 510 | 28,652 | |||||||||
| aQuantive, Inc. (a) | 1,960 | 52,528 | |||||||||
| Digital River, Inc. (a) | 940 | 48,109 | |||||||||
See Accompanying Notes to Financial Statements.
113
CMG SMALL/MID CAP FUND
A Portfolio of Columbia Funds Institutional Trust
SCHEDULE OF INVESTMENTS
| Shares | Value | ||||||||||
| Common Stocks (continued) | |||||||||||
| Internet Software & Services (continued) | |||||||||||
| Equinix, Inc. (a) | 830 | $ | 69,778 | ||||||||
| Knot, Inc. (a) | 1,810 | 54,608 | |||||||||
| 253,675 | |||||||||||
| IT Services (4.1%) | |||||||||||
| Alliance Data Systems Corp. (a) | 1,660 | 112,764 | |||||||||
| Cognizant Technology Solutions Corp., Class A (a) | 1,040 | 88,702 | |||||||||
| Euronet Worldwide, Inc. (a) | 3,815 | 110,101 | |||||||||
| Global Cash Access, Inc. (a) | 2,871 | 45,993 | |||||||||
| Global Payments, Inc. | 1,658 | 62,606 | |||||||||
| 420,166 | |||||||||||
| Semiconductors & Semiconductor Equipment (4.6%) | |||||||||||
| Atheros Communications, Inc. (a) | 1,867 | 44,360 | |||||||||
| ATMI, Inc. (a) | 1,640 | 54,842 | |||||||||
| Hittite Microwave Corp. (a) | 1,275 | 44,344 | |||||||||
| Marvell Technology Group Ltd. (a) | 1,772 | 32,410 | |||||||||
| MEMC Electronic Materials, Inc. (a) | 1,010 | 52,924 | |||||||||
| Netlogic Microsystems, Inc. (a) | 1,835 | 43,820 | |||||||||
| Qimonda AG, ADR (a) | 2,570 | 40,041 | |||||||||
| SiRF Technology Holdings, Inc. (a) | 1,750 | 51,380 | |||||||||
| Supertex, Inc. (a) | 710 | 26,511 | |||||||||
| Verigy Ltd. (a) | 4,210 | 77,169 | |||||||||
| 467,801 | |||||||||||
| Software (5.6%) | |||||||||||
| Activision, Inc. (a) | 3,550 | 60,456 | |||||||||
| Amdocs Ltd. (a) | 2,020 | 70,054 | |||||||||
| ANSYS, Inc. (a) | 1,060 | 52,883 | |||||||||
| BMC Software, Inc. (a) | 1,380 | 47,458 | |||||||||
| Informatica Corp. (a) | 2,750 | 34,540 | |||||||||
| KongZhong Corp., ADR (a) | 6,140 | 48,138 | |||||||||
| Nuance Communications, Inc. (a) | 3,231 | 37,221 | |||||||||
| Quest Software, Inc. (a) | 2,850 | 42,551 | |||||||||
| The9 Ltd., ADR (a) | 1,830 | 67,435 | |||||||||
| THQ, Inc. (a) | 1,050 | 31,815 | |||||||||
| Transaction Systems Architects, Inc. (a) | 1,220 | 44,103 | |||||||||
| Verint Systems, Inc. (a) | 1,140 | 37,677 | |||||||||
| 574,331 | |||||||||||
| 2,140,272 | |||||||||||
| Materials (5.3%) | |||||||||||
| Chemicals (1.1%) | |||||||||||
| Potash Corp. of Saskatchewan, Inc. | 710 | 110,781 | |||||||||
| Construction Materials (1.4%) | |||||||||||
| Florida Rock Industries, Inc. | 870 | 43,022 | |||||||||
| Martin Marietta Materials, Inc. | 510 | 58,864 | |||||||||
| Vulcan Materials Co. | 400 | 40,736 | |||||||||
| 142,622 | |||||||||||
See Accompanying Notes to Financial Statements.
114
CMG SMALL/MID CAP FUND
A Portfolio of Columbia Funds Institutional Trust
SCHEDULE OF INVESTMENTS
| Shares | Value | ||||||||||
| Common Stocks (continued) | |||||||||||
| Metals & Mining (2.8%) | |||||||||||
| Allegheny Technologies, Inc. | 640 | $ | 66,233 | ||||||||
| Claymont Steel Holdings, Inc. (a) | 3,531 | 65,853 | |||||||||
| Freeport-McMoRan Copper & Gold, Inc., Class B | 880 | 50,609 | |||||||||
| Phelps Dodge Corp. | 340 | 42,024 | |||||||||
| Zinifex Ltd. | 5,090 | 65,460 | |||||||||
| 290,179 | |||||||||||
| 543,582 | |||||||||||
| Telecommunication Services (5.4%) | |||||||||||
| Diversified Telecommunication Services (0.8%) | |||||||||||
| Cogent Communications Group, Inc. (a) | 1,490 | 31,290 | |||||||||
| Tele2 AB, Class B | 3,460 | 51,545 | |||||||||
| 82,835 | |||||||||||
| Wireless Telecommunication Services (4.6%) | |||||||||||
| American Tower Corp., Class A (a) | 1,739 | 69,264 | |||||||||
| Crown Castle International Corp. (a) | 3,100 | 108,996 | |||||||||
| InPhonic, Inc. (a) | 2,630 | 36,505 | |||||||||
| Linktone Ltd., ADR (a) | 4,400 | 19,888 | |||||||||
| Millicom International Cellular SA (a) | 730 | 48,501 | |||||||||
| NII Holdings, Inc. (a) | 1,730 | 127,674 | |||||||||
| SBA Communications Corp., Class A (a) | 2,090 | 62,094 | |||||||||
| 472,922 | |||||||||||
| 555,757 | |||||||||||
| Total Common Stocks (cost of $7,920,232) | 10,082,643 | ||||||||||
| Investment Company (0.4%) | |||||||||||
| SPDR S&P Biotech ETF (a) | 831 | 39,855 | |||||||||
| Total Investment Company (Cost of $37,319) | 39,855 | ||||||||||
| Total Investments (98.7%) (Cost of $7,957,551) (b) | 10,122,498 | ||||||||||
| Other Assets & Liabilities, Net (1.3%) | 136,947 | ||||||||||
| Net Assets (100.0%) | $ | 10,259,445 | |||||||||
Notes to Schedule of Investments:
(a) Non-income producing security.
(b) Cost for federal income tax purposes is $7,957,551.
See Accompanying Notes to Financial Statements.
115
CMG SMALL/MID CAP FUND
A Portfolio of Columbia Funds Institutional Trust
SCHEDULE OF INVESTMENTS
At January 31, 2007, the Fund held investments in the following sectors:
| Sector | % of Net Assets | ||||||
| Information Technology | 20.9 | ||||||
| Health Care | 20.1 | ||||||
| Industrials | 13.8 | ||||||
| Consumer Discretionary | 13.5 | ||||||
| Financials | 9.2 | ||||||
| Energy | 7.0 | ||||||
| Telecommunication Services | 5.4 | ||||||
| Materials | 5.3 | ||||||
| Consumer Staples | 3.1 | ||||||
| 98.3 | |||||||
| Investment Company | 0.4 | ||||||
| Other Assets & Liabilities, Net | 1.3 | ||||||
| 100.0 | |||||||
| Acronym | Name | ||||||
| ADR | American Depositary Receipt | ||||||
See Accompanying Notes to Financial Statements.
116
CMG INTERNATIONAL STOCK FUND
A Portfolio of Columbia Funds Institutional Trust
SCHEDULE OF INVESTMENTS
January 31, 2007 (Unaudited)
| Shares | Value | ||||||||||
| Common Stocks (96.9%) | |||||||||||
| Consumer Discretionary (10.8%) | |||||||||||
| Auto Components (2.1%) | |||||||||||
| Continental AG | 6,516 | $ | 788,745 | ||||||||
| Denso Corp. | 23,600 | 948,315 | |||||||||
| Leoni AG | 14,740 | 613,985 | |||||||||
| 2,351,045 | |||||||||||
| Automobiles (2.7%) | |||||||||||
| Suzuki Motor Corp. | 28,700 | 827,110 | |||||||||
| Toyota Motor Corp. | 33,300 | 2,194,394 | |||||||||
| 3,021,504 | |||||||||||
| Hotels, Restaurants & Leisure (0.5%) | |||||||||||
| Genting Bhd | 52,300 | 570,850 | |||||||||
| Household Durables (2.4%) | |||||||||||
| JM AB | 37,200 | 1,004,103 | |||||||||
| Makita Corp. | 16,500 | 581,469 | |||||||||
| Matsushita Electric Industrial Co., Ltd. | 50,000 | 996,949 | |||||||||
| 2,582,521 | |||||||||||
| Leisure Equipment & Products (1.1%) | |||||||||||
| FUJIFILM Holdings Corp. | 11,100 | 458,936 | |||||||||
| Nikon Corp. | 17,000 | 383,322 | |||||||||
| Sega Sammy Holdings, Inc. | 15,000 | 387,068 | |||||||||
| 1,229,326 | |||||||||||
| Media (1.6%) | |||||||||||
| Modern Times Group AB, Class B (a) | 4,800 | 304,809 | |||||||||
| Vivendi SA | 34,775 | 1,436,664 | |||||||||
| 1,741,473 | |||||||||||
| Specialty Retail (0.4%) | |||||||||||
| HMV Group PLC | 163,344 | 431,687 | |||||||||
| 11,928,406 | |||||||||||
| Consumer Staples (5.1%) | |||||||||||
| Beverages (1.9%) | |||||||||||
| Diageo PLC | 16,595 | 323,451 | |||||||||
| Fomento Economico Mexicano SAB de CV, ADR | 5,813 | 697,967 | |||||||||
| Heineken NV | 21,854 | 1,109,671 | |||||||||
| 2,131,089 | |||||||||||
| Food & Staples Retailing (1.4%) | |||||||||||
| Kesko Oyj, Class B | 13,344 | 711,393 | |||||||||
| Massmart Holdings Ltd. | 77,577 | 820,948 | |||||||||
| 1,532,341 | |||||||||||
| Food Products (0.9%) | |||||||||||
| China Milk Products Group Ltd. (a) | 500,000 | 434,017 | |||||||||
| Toyo Suisan Kaisha Ltd. | 32,000 | 496,593 | |||||||||
| 930,610 | |||||||||||
| Tobacco (0.9%) | |||||||||||
| Imperial Tobacco Group PLC | 25,471 | 1,040,701 | |||||||||
| 5,634,741 | |||||||||||
See Accompanying Notes to Financial Statements.
117
CMG INTERNATIONAL STOCK FUND
A Portfolio of Columbia Funds Institutional Trust
SCHEDULE OF INVESTMENTS
| Shares | Value | ||||||||||
| Common Stocks (continued) | |||||||||||
| Energy (9.2%) | |||||||||||
| Energy Equipment & Services (1.1%) | |||||||||||
| Subsea 7, Inc. (a) | 17,100 | $ | 304,640 | ||||||||
| TGS Nopec Geophysical Co. ASA (a) | 47,300 | 967,364 | |||||||||
| 1,272,004 | |||||||||||
| Oil, Gas & Consumable Fuels (8.1%) | |||||||||||
| BP PLC, ADR | 23,492 | 1,491,977 | |||||||||
| EnCana Corp. | 14,800 | 709,942 | |||||||||
| PetroChina Co., Ltd., Class H | 800,000 | 986,937 | |||||||||
| Petroleo Brasileiro SA, ADR | 3,913 | 384,570 | |||||||||
| Royal Dutch Shell PLC, Class A | 10,265 | 347,544 | |||||||||
| Royal Dutch Shell PLC, Class B | 37,915 | 1,276,030 | |||||||||
| Statoil ASA | 30,150 | 809,301 | |||||||||
| Total SA | 32,629 | 2,203,365 | |||||||||
| Yanzhou Coal Mining Co., Ltd., Class H | 756,000 | 706,632 | |||||||||
| 8,916,298 | |||||||||||
| 10,188,302 | |||||||||||
| Financials (30.2%) | |||||||||||
| Capital Markets (3.6%) | |||||||||||
| Credit Suisse Group, Registered Shares | 17,326 | 1,229,167 | |||||||||
| Daiwa Securities Group, Inc. | 53,000 | 654,055 | |||||||||
| Deutsche Bank AG, Registered Shares | 10,869 | 1,536,557 | |||||||||
| UBS AG, Registered Shares | 8,270 | 519,823 | |||||||||
| 3,939,602 | |||||||||||
| Commercial Banks (18.7%) | |||||||||||
| Australia & New Zealand Banking Group Ltd. | 26,966 | 612,423 | |||||||||
| Banco Bilbao Vizcaya Argentaria SA | 76,799 | 1,915,770 | |||||||||
| Banco Santander Central Hispano SA | 108,670 | 2,069,498 | |||||||||
| Bank of Ireland | 48,941 | 1,093,862 | |||||||||
| Barclays PLC | 130,057 | 1,901,680 | |||||||||
| BNP Paribas | 14,746 | 1,656,683 | |||||||||
| Bumiputra-Commerce Holdings Berhad | 175,300 | 462,324 | |||||||||
| Depfa Bank PLC | 43,701 | 772,950 | |||||||||
| HBOS PLC | 54,600 | 1,197,223 | |||||||||
| HSBC Holdings PLC | 79,972 | 1,453,503 | |||||||||
| Industrial Bank of Korea | 29,950 | 553,037 | |||||||||
| Mega Financial Holding Co., Ltd. | 632,000 | 423,927 | |||||||||
| Mitsubishi UFJ Financial Group, Inc. | 49 | 595,015 | |||||||||
| Mizuho Financial Group, Inc. | 54 | 390,059 | |||||||||
| Societe Generale | 8,752 | 1,545,831 | |||||||||
| Sumitomo Mitsui Financial Group, Inc. | 87 | 892,445 | |||||||||
| Sumitomo Trust & Banking Co., Ltd. | 30,000 | 321,625 | |||||||||
| Swedbank AB, Class A | 19,200 | 728,451 | |||||||||
| United Overseas Bank Ltd. | 104,000 | 1,289,033 | |||||||||
| Westpac Banking Corp. | 45,877 | 896,982 | |||||||||
| 20,772,321 | |||||||||||
See Accompanying Notes to Financial Statements.
118
CMG INTERNATIONAL STOCK FUND
A Portfolio of Columbia Funds Institutional Trust
SCHEDULE OF INVESTMENTS
| Shares | Value | ||||||||||
| Common Stocks (continued) | |||||||||||
| Consumer Finance (0.8%) | |||||||||||
| ORIX Corp. | 3,080 | $ | 886,013 | ||||||||
| Diversified Financial Services (2.2%) | |||||||||||
| Fortis | 24,547 | 1,035,471 | |||||||||
| ING Groep NV | 33,142 | 1,449,878 | |||||||||
| 2,485,349 | |||||||||||
| Insurance (3.8%) | |||||||||||
| Aviva PLC | 54,757 | 886,770 | |||||||||
| Axis Capital Holdings Ltd. | 19,965 | 657,847 | |||||||||
| Baloise Holding AG, Registered Shares | 8,826 | 897,059 | |||||||||
| Milano Assicurazioni SpA | 81,058 | 647,817 | |||||||||
| Sampo Oyj, Class A | 39,015 | 1,070,474 | |||||||||
| 4,159,967 | |||||||||||
| Real Estate Management & Development (1.1%) | |||||||||||
| Sun Hung Kai Properties Ltd. | 34,000 | 414,681 | |||||||||
| Swire Pacific Ltd., Class A | 66,000 | 760,834 | |||||||||
| 1,175,515 | |||||||||||
| 33,418,767 | |||||||||||
| Health Care (8.4%) | |||||||||||
| Pharmaceuticals (8.4%) | |||||||||||
| AstraZeneca PLC | 30,660 | 1,710,749 | |||||||||
| Biovail Corp. | 51,553 | 1,050,650 | |||||||||
| Eisai Co., Ltd. | 13,800 | 710,622 | |||||||||
| GlaxoSmithKline PLC | 33,992 | 916,757 | |||||||||
| Hisamitsu Pharmaceutical Co., Inc. | 23,400 | 681,287 | |||||||||
| Novartis AG, Registered Shares | 36,709 | 2,119,618 | |||||||||
| Novo-Nordisk A/S, Class B | 3,900 | 335,696 | |||||||||
| Ono Pharmaceutical Co., Ltd. | 7,300 | 357,846 | |||||||||
| Roche Holding AG, Genusschein Shares | 2,368 | 446,430 | |||||||||
| Takeda Pharmaceutical Co., Ltd. | 15,400 | 1,005,393 | |||||||||
| 9,335,048 | |||||||||||
| Industrials (12.8%) | |||||||||||
| Aerospace & Defense (2.1%) | |||||||||||
| European Aeronautic Defence and Space Co. NV | 8,794 | 291,884 | |||||||||
| MTU Aero Engines Holding AG | 16,646 | 888,217 | |||||||||
| Rolls-Royce Group PLC | 122,539 | 1,126,870 | |||||||||
| 2,306,971 | |||||||||||
| Airlines (0.6%) | |||||||||||
| British Airways PLC (a) | 63,480 | 672,873 | |||||||||
| Building Products (2.2%) | |||||||||||
| Assa Abloy AB, Class B | 40,200 | 882,730 | |||||||||
| Geberit AG, Registered Shares | 706 | 1,193,346 | |||||||||
| KCC Corp. | 1,414 | 365,586 | |||||||||
| 2,441,662 | |||||||||||
See Accompanying Notes to Financial Statements.
119
CMG INTERNATIONAL STOCK FUND
A Portfolio of Columbia Funds Institutional Trust
SCHEDULE OF INVESTMENTS
| Shares | Value | ||||||||||
| Common Stocks (continued) | |||||||||||
| Electrical Equipment (1.9%) | |||||||||||
| Mitsubishi Electric Corp. | 89,000 | $ | 807,241 | ||||||||
| Schneider Electric SA | 10,671 | 1,294,107 | |||||||||
| 2,101,348 | |||||||||||
| Machinery (4.4%) | |||||||||||
| Georg Fischer AG, Registered Shares (a) | 1,240 | 833,586 | |||||||||
| Heidelberger Druckmaschinen AG | 23,249 | 983,963 | |||||||||
| Komatsu Ltd. | 30,500 | 652,044 | |||||||||
| SKF AB, Class B | 44,600 | 885,899 | |||||||||
| Sulzer AG, Registered Shares | 365 | 519,076 | |||||||||
| Volvo AB, Class B | 13,400 | 987,896 | |||||||||
| 4,862,464 | |||||||||||
| Road & Rail (1.1%) | |||||||||||
| Central Japan Railway Co. | 116 | 1,241,058 | |||||||||
| Trading Companies & Distributors (0.5%) | |||||||||||
| Hitachi High-Technologies Corp. | 19,300 | 583,239 | |||||||||
| 14,209,615 | |||||||||||
| Information Technology (5.9%) | |||||||||||
| Communications Equipment (1.3%) | |||||||||||
| Nokia Oyj | 65,768 | 1,447,475 | |||||||||
| Computers & Peripherals (0.7%) | |||||||||||
| Wincor Nixdorf AG | 5,206 | 827,121 | |||||||||
| Electronic Equipment & Instruments (0.6%) | |||||||||||
| Kyocera Corp. | 7,900 | 727,733 | |||||||||
| IT Services (1.3%) | |||||||||||
| CGI Group, Inc., Class A (a) | 111,100 | 863,839 | |||||||||
| Nomura Research Institute Ltd. | 3,400 | 530,157 | |||||||||
| 1,393,996 | |||||||||||
| Office Electronics (2.0%) | |||||||||||
| Brother Industries Ltd. | 81,000 | 1,128,526 | |||||||||
| Canon, Inc. | 20,300 | 1,070,707 | |||||||||
| 2,199,233 | |||||||||||
| 6,595,558 | |||||||||||
| Materials (6.8%) | |||||||||||
| Chemicals (2.9%) | |||||||||||
| BASF AG | 15,297 | 1,478,702 | |||||||||
| Linde AG | 7,549 | 811,556 | |||||||||
| Shin-Etsu Chemical Co., Ltd. | 13,300 | 869,512 | |||||||||
| 3,159,770 | |||||||||||
See Accompanying Notes to Financial Statements.
120
CMG INTERNATIONAL STOCK FUND
A Portfolio of Columbia Funds Institutional Trust
SCHEDULE OF INVESTMENTS
| Shares | Value | ||||||||||
| Common Stocks (continued) | |||||||||||
| Metals & Mining (3.9%) | |||||||||||
| JFE Holdings, Inc. | 15,400 | $ | 859,588 | ||||||||
| Kobe Steel Ltd. | 219,000 | 792,627 | |||||||||
| Rio Tinto PLC | 13,661 | 736,755 | |||||||||
| Salzgitter AG | 9,678 | 1,237,482 | |||||||||
| SSAB Svenskt Stal AB, Series A | 28,800 | 703,785 | |||||||||
| 4,330,237 | |||||||||||
| 7,490,007 | |||||||||||
| Telecommunication Services (4.2%) | |||||||||||
| Diversified Telecommunication Services (3.0%) | |||||||||||
| Belgacom SA | 23,849 | 1,082,086 | |||||||||
| Chunghwa Telecom Co., Ltd., ADR | 34,197 | 708,220 | |||||||||
| Nippon Telegraph & Telephone Corp. | 123 | 615,153 | |||||||||
| Telefonica O2 Czech Republic AS | 39,844 | 972,547 | |||||||||
| 3,378,006 | |||||||||||
| Wireless Telecommunication Services (1.2%) | |||||||||||
| China Mobile Ltd. | 45,500 | 418,823 | |||||||||
| Philippine Long Distance Telephone Co., ADR | 7,750 | 407,805 | |||||||||
| Taiwan Mobile Co., Ltd | 512,000 | 496,500 | |||||||||
| 1,323,128 | |||||||||||
| 4,701,134 | |||||||||||
| Utilities (3.5%) | |||||||||||
| Electric Utilities (2.5%) | |||||||||||
| E.ON AG | 10,312 | 1,403,050 | |||||||||
| Endesa SA | 26,670 | 1,340,781 | |||||||||
| 2,743,831 | |||||||||||
| Gas Utilities (1.0%) | |||||||||||
| Tokyo Gas Co., Ltd. | 217,000 | 1,127,198 | |||||||||
| 3,871,029 | |||||||||||
| Total Common Stocks (Cost of $81,642,392) | 107,372,607 | ||||||||||
| Investment Company (2.7%) | |||||||||||
| iShares MSCI EAFE Index Fund | 39,717 | 2,948,590 | |||||||||
| Total Investment Company (Cost of $2,744,025) | 2,948,590 | ||||||||||
See Accompanying Notes to Financial Statements.
121
CMG INTERNATIONAL STOCK FUND
A Portfolio of Columbia Funds Institutional Trust
SCHEDULE OF INVESTMENTS
| Par | Value | ||||||||||
| Short-Term Obligation (0.6%) | |||||||||||
| Repurchase agreement with Fixed Income Clearing Corp., dated 01/31/07, due 02/01/07 at 5.160%, collateralized by a U.S. Treasury Note maturing 08/15/11, market value of $695,250 (repurchase proceeds $680,097) | $ | 680,000 | $ | 680,000 | |||||||
| Total Short-Term Obligation (Cost of $680,000) | 680,000 | ||||||||||
| Total Investments (100.2%) (Cost of $85,066,417) (b) | 111,001,197 | ||||||||||
| Other Assets & Liabilities, Net (-0.2%) | (234,258 | ) | |||||||||
| Net Assets (100.0%) | $ | 110,766,939 | |||||||||
Notes to Schedule of Investments:
(a) Non-income producing security.
(b) Cost for federal income tax purposes is $85,066,417.
The Fund invested in the following countries at January 31, 2007:
| Summary of Securities by Country | Value | % of Total Investments | |||||||||
| Japan | $ | 24,773,299 | 22.3 | ||||||||
| United Kingdom | 15,514,570 | 14.0 | |||||||||
| Germany | 10,569,378 | 9.5 | |||||||||
| France | 8,136,650 | 7.3 | |||||||||
| Switzerland | 7,758,105 | 7.0 | |||||||||
| Sweden | 5,497,673 | 5.0 | |||||||||
| Spain | 5,326,049 | 4.8 | |||||||||
| United States* | 4,694,242 | 4.2 | |||||||||
| Finland | 3,229,342 | 2.9 | |||||||||
| Netherlands | 2,851,433 | 2.6 | |||||||||
| Canada | 2,624,431 | 2.4 | |||||||||
| Belgium | 2,117,557 | 1.9 | |||||||||
| Norway | 2,081,305 | 1.9 | |||||||||
| Ireland | 1,866,812 | 1.7 | |||||||||
| Singapore | 1,723,050 | 1.5 | |||||||||
| China | 1,693,569 | 1.5 | |||||||||
| Taiwan | 1,628,647 | 1.5 | |||||||||
| Hong Kong | 1,594,338 | 1.4 | |||||||||
| Australia | 1,509,405 | 1.4 | |||||||||
| Malaysia | 1,033,174 | 0.9 | |||||||||
| Czech Republic | 972,547 | 0.9 | |||||||||
| South Korea | 918,623 | 0.8 | |||||||||
| South Africa | 820,948 | 0.7 | |||||||||
| Mexico | 697,967 | 0.6 | |||||||||
| Italy | 647,817 | 0.6 | |||||||||
| Brazil | 384,570 | 0.4 | |||||||||
| Denmark | 335,696 | 0.3 | |||||||||
| $ | 111,001,197 | 100.0 | |||||||||
*Includes short-term obligation and investment company.
Certain securities are listed by country of underlying exposure but may trade predominantly on other exchanges.
See Accompanying Notes to Financial Statements.
122
CMG INTERNATIONAL STOCK FUND
A Portfolio of Columbia Funds Institutional Trust
SCHEDULE OF INVESTMENTS
At January 31, 2007, the Fund had entered into the following forward currency exchange contracts:
| Forward Currency Contracts to Buy | Value | Aggregate Face Value | Settlement Date | Unrealized Appreciation (Depreciation) | |||||||||||||||
| AUD | $ | 4,511,341 | $ | 4,558,403 | 03/28/07 | $ | (47,062 | ) | |||||||||||
| CNY | 220,140 | 220,245 | 03/28/07 | (105 | ) | ||||||||||||||
| CZK | 34,037 | 35,197 | 03/28/07 | (1,160 | ) | ||||||||||||||
| DKK | 560,469 | 569,582 | 03/28/07 | (9,113 | ) | ||||||||||||||
| EUR | 1,233,459 | 1,247,486 | 03/28/07 | (14,027 | ) | ||||||||||||||
| EUR | 321,431 | 319,539 | 03/28/07 | 1,892 | |||||||||||||||
| EUR | 548,785 | 545,454 | 03/28/07 | 3,331 | |||||||||||||||
| GBP | 9,099,293 | 9,105,678 | 03/28/07 | (6,385 | ) | ||||||||||||||
| GBP | 108,044 | 106,334 | 03/28/07 | 1,710 | |||||||||||||||
| GBP | 828,994 | 830,624 | 03/28/07 | (1,630 | ) | ||||||||||||||
| KRW | 72,632 | 73,973 | 03/28/07 | (1,341 | ) | ||||||||||||||
| MXN | 34,524 | 35,041 | 03/28/07 | (517 | ) | ||||||||||||||
| MYR | 70,468 | 70,165 | 03/28/07 | 303 | |||||||||||||||
| NOK | 69,055 | 69,736 | 03/28/07 | (681 | ) | ||||||||||||||
| PHP | 26,498 | 26,364 | 03/28/07 | 134 | |||||||||||||||
| SEK | 149,981 | 153,532 | 03/28/07 | (3,551 | ) | ||||||||||||||
| SGD | 43,751 | 43,634 | 03/28/07 | 117 | |||||||||||||||
| THB | 401,696 | 383,470 | 03/28/07 | 18,226 | |||||||||||||||
| TWD | 171,347 | 174,604 | 03/28/07 | (3,257 | ) | ||||||||||||||
| ZAR | 37,990 | 39,108 | 03/28/07 | (1,118 | ) | ||||||||||||||
| $ | (64,234 | ) | |||||||||||||||||
| Forward Currency Contracts to Sell | Value | Aggregate Face Value | Settlement Date | Unrealized Appreciation (Depreciation) | |||||||||||||||
| AUD | $ | 345,833 | $ | 348,433 | 03/28/07 | $ | 2,600 | ||||||||||||
| CAD | 1,565,299 | 1,592,621 | 03/28/07 | 27,322 | |||||||||||||||
| CAD | 805,205 | 820,973 | 03/28/07 | 15,768 | |||||||||||||||
| CHF | 106,661 | 106,560 | 03/28/07 | (101 | ) | ||||||||||||||
| CHF | 273,924 | 272,366 | 03/28/07 | (1,558 | ) | ||||||||||||||
| CNY | 2,869,352 | 2,869,792 | 03/28/07 | 440 | |||||||||||||||
| CZK | 443,734 | 455,001 | 03/28/07 | 11,267 | |||||||||||||||
| CZK | 210,925 | 212,635 | 03/28/07 | 1,710 | |||||||||||||||
| CZK | 271,316 | 271,677 | 03/28/07 | 361 | |||||||||||||||
| DKK | 42,924 | 43,432 | 03/28/07 | 508 | |||||||||||||||
| EUR | 94,077 | 95,138 | 03/28/07 | 1,061 | |||||||||||||||
| EUR | 277,006 | 275,379 | 03/28/07 | (1,627 | ) | ||||||||||||||
| GBP | 697,377 | 695,811 | 03/28/07 | (1,566 | ) | ||||||||||||||
| KRW | 946,963 | 969,331 | 03/28/07 | 22,368 | |||||||||||||||
| MXN | 449,803 | 457,090 | 03/28/07 | 7,287 | |||||||||||||||
| MYR | 920,388 | 909,940 | 03/28/07 | (10,448 | ) | ||||||||||||||
See Accompanying Notes to Financial Statements.
123
CMG INTERNATIONAL STOCK FUND
A Portfolio of Columbia Funds Institutional Trust
SCHEDULE OF INVESTMENTS
| Forward Currency Contracts to Sell | Value | Aggregate Face Value | Settlement Date | Unrealized Appreciation (Depreciation) | |||||||||||||||
| NOK | $ | 899,485 | $ | 909,316 | 03/28/07 | $ | 9,831 | ||||||||||||
| PHP | 345,504 | 341,940 | 03/28/07 | (3,564 | ) | ||||||||||||||
| SEK | 1,954,671 | 1,975,231 | 03/28/07 | 20,560 | |||||||||||||||
| SEK | 557,055 | 551,948 | 03/28/07 | (5,107 | ) | ||||||||||||||
| SGD | 570,074 | 569,471 | 03/28/07 | (603 | ) | ||||||||||||||
| THB | 401,696 | 398,268 | 03/28/07 | (3,428 | ) | ||||||||||||||
| TWD | 2,233,967 | 2,259,766 | 03/28/07 | 25,799 | |||||||||||||||
| ZAR | 495,938 | 508,109 | 03/28/07 | 12,171 | |||||||||||||||
| $ | 131,051 | ||||||||||||||||||
| Acronym | Name | ||||||
| ADR | American Depositary Receipt | ||||||
| AUD | Australian Dollar | ||||||
| CAD | Canadian Dollar | ||||||
| CHF | Swiss Franc | ||||||
| CNY | Yuan Renminbi | ||||||
| CZK | Czech Koruna | ||||||
| DKK | Danish Krone | ||||||
| EUR | Euro Currency | ||||||
| GBP | Pound Sterling | ||||||
| KRW | South Korean Won | ||||||
| MXN | Mexican Peso | ||||||
| MYR | Malaysian Ringgit | ||||||
| NOK | Norwegian Krone | ||||||
| PHP | Philippine Peso | ||||||
| SEK | Swedish Krona | ||||||
| SGD | Singapore Dollar | ||||||
| THB | Thailand Baht | ||||||
| TWD | Taiwan Dollar | ||||||
| ZAR | South African Rand | ||||||
See Accompanying Notes to Financial Statements.
124
This page is intentionally left blank.
STATEMENTS OF ASSETS AND LIABILITIES
January 31, 2007 (Unaudited)
| CMG Enhanced S&P 500® Index Fund | CMG Large Cap Growth Fund | CMG Large Cap Value Fund | CMG Mid Cap Growth Fund | CMG Mid Cap Value Fund | |||||||||||||||||||
| ASSETS: | |||||||||||||||||||||||
| Investments, at identified cost | $ | 119,052,630 | $ | 38,009,071 | $ | 33,274,370 | $ | 21,452,184 | $ | 13,153,259 | |||||||||||||
| Investments, at value (including securities on loan of $14,381,118, $-, $-, $- ,$- ,$- ,$- ,$- and $-) | $ | 139,735,116 | $ | 43,235,799 | $ | 39,563,415 | $ | 27,200,492 | $ | 16,301,104 | |||||||||||||
| Cash | 5,011 | 20 | 893 | 483 | 661 | ||||||||||||||||||
| Foreign currency (cost of $46,402) | - | - | - | - | - | ||||||||||||||||||
| Unrealized appreciation on foreign forward currency contracts | - | - | - | - | - | ||||||||||||||||||
| Receivable for: | |||||||||||||||||||||||
| Investments sold | - | 1,378,859 | 527,325 | 184,424 | 158,870 | ||||||||||||||||||
| Interest | 333 | 61 | 1,056 | 125 | 273 | ||||||||||||||||||
| Dividends | 94,889 | 10,651 | 32,224 | 3,127 | 6,140 | ||||||||||||||||||
| Futures variation margin | 15,750 | - | - | - | - | ||||||||||||||||||
| Securities lending | 810 | - | - | - | - | ||||||||||||||||||
| Foreign tax reclaims | - | - | - | - | - | ||||||||||||||||||
| Expense reimbursement due from Investment Advisor | 9,590 | 9,926 | 10,025 | 11,105 | 10,191 | ||||||||||||||||||
| Deferred Trustees' compensation plan | 5,461 | 4,538 | 4,600 | 4,859 | 4,237 | ||||||||||||||||||
| Other assets | - | - | 2 | - | - | ||||||||||||||||||
| Total Assets | 139,866,960 | 44,639,854 | 40,139,540 | 27,404,615 | 16,481,476 | ||||||||||||||||||
| LIABILITIES: | |||||||||||||||||||||||
| Payable to custodian bank | - | - | - | - | - | ||||||||||||||||||
| Collateral on securities loaned | 14,613,488 | - | - | - | - | ||||||||||||||||||
| Unrealized depreciation on foreign forward currency contracts | - | - | - | - | - | ||||||||||||||||||
| Payable for: | |||||||||||||||||||||||
| Investments purchased | - | 1,004,261 | 442,045 | 246,328 | 189,575 | ||||||||||||||||||
| Fund shares repurchased | - | 25,000 | 74,500 | - | - | ||||||||||||||||||
| Investment advisory fee | 25,361 | 17,695 | 16,388 | 15,622 | 9,528 | ||||||||||||||||||
| Trustees' fees | 485 | 517 | 509 | 420 | 517 | ||||||||||||||||||
| Transfer agent fees | - | - | - | - | - | ||||||||||||||||||
| Merger costs | - | - | - | - | - | ||||||||||||||||||
| Custody fee | - | - | - | - | - | ||||||||||||||||||
| Audit fee | 12,459 | 14,889 | 14,889 | 14,889 | 14,889 | ||||||||||||||||||
| Chief compliance officer expenses | - | - | - | - | - | ||||||||||||||||||
| Deferred Trustees' compensation plan | 5,461 | 4,538 | 4,600 | 4,859 | 4,237 | ||||||||||||||||||
| Other liabilities | 610 | 318 | 376 | 292 | 262 | ||||||||||||||||||
| Total Liabilities | 14,657,864 | 1,067,218 | 553,307 | 282,410 | 219,008 | ||||||||||||||||||
| NET ASSETS | $ | 125,209,096 | $ | 43,572,636 | $ | 39,586,233 | $ | 27,122,205 | $ | 16,262,468 | |||||||||||||
| NET ASSETS consist of: | |||||||||||||||||||||||
| Paid-in-capital | $ | 101,803,787 | $ | 37,137,856 | $ | 31,781,850 | $ | 20,626,584 | $ | 12,030,315 | |||||||||||||
| Undistributed (overdistributed) net investment income | 119,467 | (2,646 | ) | 40,476 | (9,223 | ) | 4,836 | ||||||||||||||||
| Accumulated net investment loss | - | - | - | - | - | ||||||||||||||||||
| Accumulated net realized gain | 2,567,739 | 1,210,698 | 1,474,862 | 756,536 | 1,079,472 | ||||||||||||||||||
| Net unrealized appreciation on: | |||||||||||||||||||||||
| Investments | 20,682,486 | 5,226,728 | 6,289,045 | 5,748,308 | 3,147,845 | ||||||||||||||||||
| Foreign currency translations | - | - | - | - | - | ||||||||||||||||||
| Futures contracts | 35,617 | - | - | - | - | ||||||||||||||||||
| NET ASSETS | $ | 125,209,096 | $ | 43,572,636 | $ | 39,586,233 | $ | 27,122,205 | $ | 16,262,468 | |||||||||||||
| Shares of capital stock outstanding | 8,657,850 | 3,613,472 | 3,262,779 | 1,765,617 | 1,202,501 | ||||||||||||||||||
| Net asset value, offering and redemption price per share | $ | 14.46 | $ | 12.06 | $ | 12.13 | $ | 15.36 | $ | 13.52 | |||||||||||||
See Accompanying Notes to Financial Statements.
126
| CMG Small Cap Growth Fund | CMG Small Cap Value Fund | CMG Small/Mid Cap Fund | CMG International Stock Fund | ||||||||||||||||
| ASSETS: | |||||||||||||||||||
| Investments, at identified cost | $ | 33,104,780 | $ | 20,180,820 | $ | 7,957,551 | $ | 85,066,417 | |||||||||||
| Investments, at value (including securities on loan of $14,381,118, $-, $-, $- ,$- ,$- ,$- ,$- and $-) | $ | 39,513,243 | $ | 30,185,961 | $ | 10,122,498 | $ | 111,001,197 | |||||||||||
| Cash | 918 | 36 | - | 435 | |||||||||||||||
| Foreign currency (cost of $46,402) | - | - | - | 46,420 | |||||||||||||||
| Unrealized appreciation on foreign forward currency contracts | - | - | - | 184,766 | |||||||||||||||
| Receivable for: | |||||||||||||||||||
| Investments sold | 639,123 | 285,364 | 501,807 | 1,191,298 | |||||||||||||||
| Interest | 220 | 21 | - | 97 | |||||||||||||||
| Dividends | 6,424 | 21,542 | 1,151 | 48,018 | |||||||||||||||
| Futures variation margin | - | - | - | - | |||||||||||||||
| Securities lending | - | - | - | - | |||||||||||||||
| Foreign tax reclaims | - | - | - | 26,594 | |||||||||||||||
| Expense reimbursement due from Investment Advisor | 8,401 | 11,537 | 7,716 | 1,056 | |||||||||||||||
| Deferred Trustees' compensation plan | 12,097 | 5,417 | 4,766 | 6,873 | |||||||||||||||
| Other assets | - | 1 | - | - | |||||||||||||||
| Total Assets | 40,180,426 | 30,509,879 | 10,637,938 | 112,506,754 | |||||||||||||||
| LIABILITIES: | |||||||||||||||||||
| Payable to custodian bank | - | - | 5,432 | - | |||||||||||||||
| Collateral on securities loaned | - | - | - | - | |||||||||||||||
| Unrealized depreciation on foreign forward currency contracts | - | - | - | 117,949 | |||||||||||||||
| Payable for: | |||||||||||||||||||
| Investments purchased | 471,552 | 253,486 | 343,103 | 1,527,476 | |||||||||||||||
| Fund shares repurchased | - | - | - | - | |||||||||||||||
| Investment advisory fee | 24,634 | 19,224 | 6,345 | 68,602 | |||||||||||||||
| Trustees' fees | - | 465 | - | - | |||||||||||||||
| Transfer agent fees | 18 | - | - | - | |||||||||||||||
| Merger costs | 19,195 | - | - | - | |||||||||||||||
| Custody fee | 5,540 | - | - | - | |||||||||||||||
| Audit fee | 20,316 | 14,889 | 18,520 | 16,976 | |||||||||||||||
| Chief compliance officer expenses | 1,334 | - | - | - | |||||||||||||||
| Deferred Trustees' compensation plan | 12,097 | 5,417 | 4,766 | 6,873 | |||||||||||||||
| Other liabilities | 712 | 301 | 327 | 1,939 | |||||||||||||||
| Total Liabilities | 555,398 | 293,782 | 378,493 | 1,739,815 | |||||||||||||||
| NET ASSETS | $ | 39,625,028 | $ | 30,216,097 | $ | 10,259,445 | $ | 110,766,939 | |||||||||||
| NET ASSETS consist of: | |||||||||||||||||||
| Paid-in-capital | $ | 31,880,857 | $ | 19,213,287 | $ | 7,938,735 | $ | 81,145,122 | |||||||||||
| Undistributed (overdistributed) net investment income | - | 7,779 | - | (600,733 | ) | ||||||||||||||
| Accumulated net investment loss | (60,273 | ) | - | (7,871 | ) | - | |||||||||||||
| Accumulated net realized gain | 1,395,960 | 989,890 | 163,626 | 4,219,977 | |||||||||||||||
| Net unrealized appreciation on: | |||||||||||||||||||
| Investments | 6,408,463 | 10,005,141 | 2,164,947 | 25,934,780 | |||||||||||||||
| Foreign currency translations | 21 | - | 8 | 67,793 | |||||||||||||||
| Futures contracts | - | - | - | - | |||||||||||||||
| NET ASSETS | $ | 39,625,028 | $ | 30,216,097 | $ | 10,259,445 | $ | 110,766,939 | |||||||||||
| Shares of capital stock outstanding | 21,776,579 | 2,149,534 | 2,398,082 | 8,229,735 | |||||||||||||||
| Net asset value, offering and redemption price per share | $ | 1.82 | $ | 14.06 | $ | 4.28 | $ | 13.46 | |||||||||||
See Accompanying Notes to Financial Statements.
127
STATEMENTS OF OPERATIONS
For the Six Months Ended January 31, 2007 (Unaudited)
| CMG Enhanced S&P 500® Index Fund | CMG Large Cap Growth Fund | CMG Large Cap Value Fund | CMG Mid Cap Growth Fund | CMG Mid Cap Value Fund | |||||||||||||||||||
| NET INVESTMENT INCOME: | |||||||||||||||||||||||
| Income: | |||||||||||||||||||||||
| Dividends | $ | 1,094,020 | $ | 175,326 | $ | 401,126 | $ | 133,073 | $ | 168,453 | |||||||||||||
| Interest | 85,639 | 29,097 | 23,096 | 26,168 | 12,705 | ||||||||||||||||||
| Securities lending | 3,792 | - | - | - | - | ||||||||||||||||||
| Foreign withholding tax | - | (141 | ) | (1,156 | ) | (82 | ) | (246 | ) | ||||||||||||||
| Total income | 1,183,451 | 204,282 | 423,066 | 159,159 | 180,912 | ||||||||||||||||||
| Expenses: | |||||||||||||||||||||||
| Investment advisory fee | 144,826 | 95,671 | 93,098 | 92,262 | 61,736 | ||||||||||||||||||
| Transfer agent fee | - | - | - | - | - | ||||||||||||||||||
| Trustees' fees | 8,727 | 7,320 | 7,304 | 9,415 | 6,832 | ||||||||||||||||||
| Custody fee | - | - | - | - | - | ||||||||||||||||||
| Audit fee | 17,914 | 20,344 | 20,344 | 20,344 | 20,344 | ||||||||||||||||||
| Registration fee | - | - | - | - | - | ||||||||||||||||||
| Chief compliance officer expenses | - | - | - | - | - | ||||||||||||||||||
| Other expenses | 5,520 | 4,681 | 4,756 | 4,667 | 4,603 | ||||||||||||||||||
| Total operating expenses | 176,987 | 128,016 | 125,502 | 126,688 | 93,515 | ||||||||||||||||||
| Interest expense | 389 | - | - | - | - | ||||||||||||||||||
| Total expenses | 177,376 | 128,016 | 125,502 | 126,688 | 93,515 | ||||||||||||||||||
| Expense reimbursement from Investment Advisor | (32,161 | ) | (32,345 | ) | (32,404 | ) | (34,426 | ) | (31,779 | ) | |||||||||||||
| Custody earnings credit | - | - | - | - | - | ||||||||||||||||||
| Net expenses | 145,215 | 95,671 | 93,098 | 92,262 | 61,736 | ||||||||||||||||||
| Net investment income (loss) | 1,038,236 | 108,611 | 329,968 | 66,897 | 119,176 | ||||||||||||||||||
| NET REALIZED AND UNREALIZED GAIN (LOSS) ON INVESTMENTS, FOREIGN CURRENCY AND FUTURES CONTRACTS, NET OF FOREIGN CAPITAL GAINS TAX: | |||||||||||||||||||||||
| Net realized gain (loss) on: | |||||||||||||||||||||||
| Investments | 3,258,718 | 2,066,159 | 2,033,936 | 1,522,645 | 1,678,474 | ||||||||||||||||||
| Foreign currency transactions | - | - | - | (678 | ) | (9 | ) | ||||||||||||||||
| Foreign capital gains tax | - | - | - | - | - | ||||||||||||||||||
| Futures contracts | 289,064 | - | - | - | - | ||||||||||||||||||
| Net realized gain | 3,547,782 | 2,066,159 | 2,033,936 | 1,521,967 | 1,678,465 | ||||||||||||||||||
| Net change in unrealized appreciation (depreciation) on: | |||||||||||||||||||||||
| Investments | 11,643,184 | 3,199,634 | 1,828,733 | 2,076,094 | 599,245 | ||||||||||||||||||
| Foreign currency translations | - | - | - | - | - | ||||||||||||||||||
| Futures contracts | (3,130 | ) | - | - | - | - | |||||||||||||||||
| Net change in unrealized appreciation | 11,640,054 | 3,199,634 | 1,828,733 | 2,076,094 | 599,245 | ||||||||||||||||||
| Net gain | 15,187,836 | 5,265,793 | 3,862,669 | 3,598,061 | 2,277,710 | ||||||||||||||||||
| NET INCREASE IN NET ASSETS FROM OPERATIONS | $ | 16,226,072 | $ | 5,374,404 | $ | 4,192,637 | $ | 3,664,958 | $ | 2,396,886 | |||||||||||||
See Accompanying Notes to Financial Statements.
128
| CMG Small Cap Growth Fund | CMG Small Cap Value Fund | CMG Small/Mid Cap Fund | CMG International Stock Fund | ||||||||||||||||
| NET INVESTMENT INCOME: | |||||||||||||||||||
| Income: | |||||||||||||||||||
| Dividends | $ | 62,719 | $ | 238,767 | $ | 20,406 | $ | 945,727 | |||||||||||
| Interest | 50,926 | 3,340 | 12,181 | 2,145 | |||||||||||||||
| Securities lending | - | - | - | - | |||||||||||||||
| Foreign withholding tax | - | - | (43 | ) | (63,110 | ) | |||||||||||||
| Total income | 113,645 | 242,107 | 32,544 | 884,762 | |||||||||||||||
| Expenses: | |||||||||||||||||||
| Investment advisory fee | 148,728 | 127,796 | 35,678 | 414,935 | |||||||||||||||
| Transfer agent fee | 29 | - | - | - | |||||||||||||||
| Trustees' fees | 5,213 | 11,019 | 5,718 | 7,722 | |||||||||||||||
| Custody fee | 10,239 | - | - | - | |||||||||||||||
| Audit fee | 19,281 | 20,344 | 18,324 | 20,391 | |||||||||||||||
| Registration fee | 9,224 | - | - | - | |||||||||||||||
| Chief compliance officer expenses | 2,229 | - | - | - | |||||||||||||||
| Other expenses | 14,042 | 4,679 | 4,382 | 7,233 | |||||||||||||||
| Total operating expenses | 208,985 | 163,838 | 64,102 | 450,281 | |||||||||||||||
| Interest expense | 160 | 2,396 | - | 7,356 | |||||||||||||||
| Total expenses | 209,145 | 166,234 | 64,102 | 457,637 | |||||||||||||||
| Expense reimbursement from Investment Advisor | (50,056 | ) | (36,042 | ) | (28,425 | ) | (35,347 | ) | |||||||||||
| Custody earnings credit | (285 | ) | - | - | - | ||||||||||||||
| Net expenses | 158,804 | 130,192 | 35,677 | 422,290 | |||||||||||||||
| Net investment income (loss) | (45,159 | ) | 111,915 | (3,133 | ) | 462,472 | |||||||||||||
| NET REALIZED AND UNREALIZED GAIN (LOSS) ON INVESTMENTS, FOREIGN CURRENCY AND FUTURES CONTRACTS, NET OF FOREIGN CAPITAL GAINS TAX: | |||||||||||||||||||
| Net realized gain (loss) on: | |||||||||||||||||||
| Investments | 2,644,058 | 3,334,690 | 499,617 | 6,753,496 | |||||||||||||||
| Foreign currency transactions | (1,656 | ) | - | (92 | ) | 304,449 | |||||||||||||
| Foreign capital gains tax | - | - | - | (1,063 | ) | ||||||||||||||
| Futures contracts | - | - | - | - | |||||||||||||||
| Net realized gain | 2,642,402 | 3,334,690 | 499,525 | 7,056,882 | |||||||||||||||
| Net change in unrealized appreciation (depreciation) on: | |||||||||||||||||||
| Investments | 2,757,084 | 769,947 | 817,383 | 7,856,942 | |||||||||||||||
| Foreign currency translations | 21 | - | 8 | 64,452 | |||||||||||||||
| Futures contracts | - | - | - | - | |||||||||||||||
| Net change in unrealized appreciation | 2,757,105 | 769,947 | 817,391 | 7,921,394 | |||||||||||||||
| Net gain | 5,399,507 | 4,104,637 | 1,316,916 | 14,978,276 | |||||||||||||||
| NET INCREASE IN NET ASSETS FROM OPERATIONS | $ | 5,354,348 | $ | 4,216,552 | $ | 1,313,783 | $ | 15,440,748 | |||||||||||
See Accompanying Notes to Financial Statements.
129
STATEMENTS OF CHANGES IN NET ASSETS
| CMG Enhanced S&P 500® Index Fund | |||||||||||
| (Unaudited) Six Months Ended January 31, 2007 | Year Ended July 31, 2006 | ||||||||||
| Operations: | |||||||||||
| Net investment income | $ | 1,038,236 | $ | 1,532,249 | |||||||
| Net realized gain on investments and futures contracts | 3,547,782 | 8,091,680 | |||||||||
| Net change in unrealized appreciation (depreciation) on investments and futures contracts | 11,640,054 | (3,021,580 | ) | ||||||||
| Net increase from operations | 16,226,072 | 6,602,349 | |||||||||
| Distributions declared to shareholders: | |||||||||||
| From net investment income | (1,720,935 | ) | (1,547,386 | ) | |||||||
| From net realized gains | (7,095,404 | ) | (4,395,562 | ) | |||||||
| Total distributions declared to shareholders | (8,816,339 | ) | (5,942,948 | ) | |||||||
| Share transactions: | |||||||||||
| Subscriptions | 19,667,610 | 25,772,014 | |||||||||
| Distributions reinvested | 3,163,765 | 1,192,965 | |||||||||
| Redemptions | (6,005,179 | ) | (18,284,280 | ) | |||||||
| Net increase (decrease) in share transactions | 16,826,196 | 8,680,699 | |||||||||
| Net increase in net assets | 24,235,929 | 9,340,100 | |||||||||
| NET ASSETS: | |||||||||||
| Beginning of period | 100,973,167 | 91,633,067 | |||||||||
| End of period | $ | 125,209,096 | $ | 100,973,167 | |||||||
| Undistributed net investment income, at end of period | $ | 119,467 | $ | 802,166 | |||||||
| Change in shares: | |||||||||||
| Subscriptions | 1,390,735 | 1,932,072 | |||||||||
| Issued for distributions reinvested | 221,397 | 90,582 | |||||||||
| Redemptions | (420,399 | ) | (1,347,447 | ) | |||||||
| Net increase | 1,191,733 | 675,207 | |||||||||
See Accompanying Notes to Financial Statements.
130
STATEMENTS OF CHANGES IN NET ASSETS
| CMG Large Cap Growth Fund | CMG Large Cap Value Fund | ||||||||||||||||||
| (Unaudited) Six Months Ended January 31, 2007 | Year Ended July 31, 2006 | (Unaudited) Six Months Ended January 31, 2007 | Year Ended July 31, 2006 | ||||||||||||||||
| Operations: | |||||||||||||||||||
| Net investment income | $ | 108,611 | $ | 236,616 | $ | 329,968 | $ | 664,005 | |||||||||||
| Net realized gain on investments and foreign currency transactions | 2,066,159 | 2,208,271 | 2,033,936 | 3,683,361 | |||||||||||||||
| Net change in unrealized appreciation (depreciation) on investments | 3,199,634 | (1,726,056 | ) | 1,828,733 | (884,539 | ) | |||||||||||||
| Net increase from operations | 5,374,404 | 718,831 | 4,192,637 | 3,462,827 | |||||||||||||||
| Distributions declared to shareholders: | |||||||||||||||||||
| From net investment income | (240,113 | ) | (244,682 | ) | (638,584 | ) | (786,000 | ) | |||||||||||
| From net realized gains | (2,140,830 | ) | (2,107,614 | ) | (2,775,915 | ) | (4,217,978 | ) | |||||||||||
| Total distributions declared to shareholders | (2,380,943 | ) | (2,352,296 | ) | (3,414,499 | ) | (5,003,978 | ) | |||||||||||
| Share transactions: | |||||||||||||||||||
| Subscriptions | 6,184,024 | 607,996 | 3,785,066 | 2,117,201 | |||||||||||||||
| Distributions reinvested | 1,159,364 | 1,081,858 | 1,648,088 | 2,230,353 | |||||||||||||||
| Redemptions | (2,529,395 | ) | (4,602,728 | ) | (3,905,245 | ) | (4,257,442 | ) | |||||||||||
| Net increase (decrease) in share transactions | 4,813,993 | (2,912,874 | ) | 1,527,909 | 90,112 | ||||||||||||||
| Net increase (decrease) in net assets | 7,807,454 | (4,546,339 | ) | 2,306,047 | (1,451,039 | ) | |||||||||||||
| NET ASSETS: | |||||||||||||||||||
| Beginning of period | 35,765,182 | 40,311,521 | 37,280,186 | 38,731,225 | |||||||||||||||
| End of period | $ | 43,572,636 | $ | 35,765,182 | $ | 39,586,233 | $ | 37,280,186 | |||||||||||
| Undistributed (overdistributed) net investment income, at end of period | $ | (2,646 | ) | $ | 128,856 | $ | 40,476 | $ | 349,092 | ||||||||||
| Change in shares: | |||||||||||||||||||
| Subscriptions | 519,256 | 51,129 | 313,158 | 186,275 | |||||||||||||||
| Issued for distributions reinvested | 97,754 | 94,075 | 137,340 | 197,376 | |||||||||||||||
| Redemptions | (219,629 | ) | (388,044 | ) | (323,908 | ) | (336,132 | ) | |||||||||||
| Net increase (decrease) | 397,381 | (242,840 | ) | 126,590 | 47,519 | ||||||||||||||
See Accompanying Notes to Financial Statements.
131
STATEMENTS OF CHANGES IN NET ASSETS
| CMG Mid Cap Growth Fund | CMG Mid Cap Value Fund | ||||||||||||||||||
| (Unaudited) Six Months Ended January 31, 2007 | Year Ended July 31, 2006 | (Unaudited) Six Months Ended January 31, 2007 | Year Ended July 31, 2006 | ||||||||||||||||
| Operations: | |||||||||||||||||||
| Net investment income | $ | 66,897 | $ | 20,930 | $ | 119,176 | $ | 194,099 | |||||||||||
| Net realized gain on investments and foreign currency transactions | 1,521,967 | 2,629,036 | 1,678,465 | 2,848,500 | |||||||||||||||
| Net change in unrealized appreciation (depreciation) on investments and foreign currency translations | 2,076,094 | (433,276 | ) | 599,245 | (1,416,716 | ) | |||||||||||||
| Net increase from operations | 3,664,958 | 2,216,690 | 2,396,886 | 1,625,883 | |||||||||||||||
| Distributions declared to shareholders: | |||||||||||||||||||
| From net investment income | (93,030 | ) | - | (196,538 | ) | (193,534 | ) | ||||||||||||
| From net realized gains | (2,823,902 | ) | (596,195 | ) | (2,606,305 | ) | (2,793,995 | ) | |||||||||||
| Total distributions declared to shareholders | (2,916,932 | ) | (596,195 | ) | (2,802,843 | ) | (2,987,529 | ) | |||||||||||
| Share transactions: | |||||||||||||||||||
| Subscriptions | 5,537,405 | 2,478,025 | 2,052,212 | 989,569 | |||||||||||||||
| Distributions reinvested | 1,214,957 | 256,151 | 1,292,451 | 1,221,997 | |||||||||||||||
| Redemptions | (4,013,873 | ) | (5,599,689 | ) | (4,437,852 | ) | (4,365,601 | ) | |||||||||||
| Net increase (decrease) in share transactions | 2,738,489 | (2,865,513 | ) | (1,093,189 | ) | (2,154,035 | ) | ||||||||||||
| Net increase (decrease) in net assets | 3,486,515 | (1,245,018 | ) | (1,499,146 | ) | (3,515,681 | ) | ||||||||||||
| NET ASSETS: | |||||||||||||||||||
| Beginning of period | 23,635,690 | 24,880,708 | 17,761,614 | 21,277,295 | |||||||||||||||
| End of period | $ | 27,122,205 | $ | 23,635,690 | $ | 16,262,468 | $ | 17,761,614 | |||||||||||
| Undistributed (overdistributed) net investment income, at end of period | $ | (9,223 | ) | $ | 16,910 | $ | 4,836 | $ | 82,198 | ||||||||||
| Change in shares: | |||||||||||||||||||
| Subscriptions | 364,811 | 161,008 | 145,402 | 69,276 | |||||||||||||||
| Issued for distributions reinvested | 80,889 | 17,122 | 98,285 | 91,536 | |||||||||||||||
| Redemptions | (258,027 | ) | (358,183 | ) | (308,197 | ) | (295,964 | ) | |||||||||||
| Net increase (decrease) | 187,673 | (180,053 | ) | (64,510 | ) | (135,152 | ) | ||||||||||||
See Accompanying Notes to Financial Statements.
132
STATEMENTS OF CHANGES IN NET ASSETS
| CMG Small Cap Growth Fund | CMG Small Cap Value Fund | ||||||||||||||||||
| (Unaudited) Six Months Ended January 31, 2007 | Year Ended July 31, 2006 | (Unaudited) Six Months Ended January 31, 2007 | Year Ended July 31, 2006 | ||||||||||||||||
| Operations: | |||||||||||||||||||
| Net investment income (loss) | $ | (45,159 | ) | $ | (241,357 | ) | $ | 111,915 | $ | 214,137 | |||||||||
| Net realized gain on investments and foreign currency transactions | 2,642,402 | 9,398,939 | 3,334,690 | 4,366,840 | |||||||||||||||
| Net change in unrealized appreciation (depreciation) on investments | 2,757,105 | (11,061,310 | ) | 769,947 | (1,837,919 | ) | |||||||||||||
| Net increase (decrease) from operations | 5,354,348 | (1,903,728 | ) | 4,216,552 | 2,743,058 | ||||||||||||||
| Distributions declared to shareholders: | |||||||||||||||||||
| From net investment income | - | - | (208,296 | ) | (279,581 | ) | |||||||||||||
| From net realized gains | (8,560,579 | ) | (8,639,807 | ) | (5,551,832 | ) | (3,938,120 | ) | |||||||||||
| Total distributions declared to shareholders | (8,560,579 | ) | (8,639,807 | ) | (5,760,128 | ) | (4,217,701 | ) | |||||||||||
| Share transactions: | |||||||||||||||||||
| Subscriptions | 4,086,221 | 5,297,768 | 2,183,851 | 2,488,587 | |||||||||||||||
| Proceeds received in connection with merger | - | 40,504,741 | - | - | |||||||||||||||
| Distributions reinvested | 6,665,647 | 5,234,864 | 4,751,572 | 2,926,706 | |||||||||||||||
| Redemptions | (8,103,801 | ) | (30,627,476 | ) | (8,614,924 | ) | (7,490,753 | ) | |||||||||||
| Net increase (decrease) in share transactions | 2,648,067 | 20,409,897 | (1,679,501 | ) | (2,075,460 | ) | |||||||||||||
| Net increase (decrease) in net assets | (558,164 | ) | 9,866,362 | (3,223,077 | ) | (3,550,103 | ) | ||||||||||||
| NET ASSETS: | |||||||||||||||||||
| Beginning of period | 40,183,192 | 30,316,830 | 33,439,174 | 36,989,277 | |||||||||||||||
| End of period | $ | 39,625,028 | $ | 40,183,192 | $ | 30,216,097 | $ | 33,439,174 | |||||||||||
| Undistributed net investment income, at end of period | $ | - | $ | - | $ | 7,779 | $ | 104,160 | |||||||||||
| Accumulated net investment loss, at end of period | $ | (60,273 | ) | $ | (15,114 | ) | $ | - | $ | - | |||||||||
| Change in shares: | |||||||||||||||||||
| Subscriptions | 2,042,505 | 2,641,989 | 147,436 | 160,463 | |||||||||||||||
| Issued in connection with merger | - | 18,087,654 | - | - | |||||||||||||||
| Issued for distributions reinvested | 3,765,902 | 2,670,849 | 344,567 | 203,243 | |||||||||||||||
| Redemptions | (3,834,000 | ) | (8,212,815 | ) | (526,785 | ) | (481,975 | ) | |||||||||||
| Net increase (decrease) | 1,974,407 | 15,187,677 | (34,782 | ) | (118,269 | ) | |||||||||||||
See Accompanying Notes to Financial Statements.
133
STATEMENTS OF CHANGES IN NET ASSETS
| CMG Small/Mid Cap Fund | CMG International Stock Fund | ||||||||||||||||||
| (Unaudited) Six Months Ended January 31, 2007 | Year Ended July 31, 2006 | (Unaudited) Six Months Ended January 31, 2007 | Year Ended July 31, 2006 | ||||||||||||||||
| Operations: | |||||||||||||||||||
| Net investment income (loss) | $ | (3,133 | ) | $ | (94,429 | ) | $ | 462,472 | $ | 2,145,229 | |||||||||
| Net realized gain on investments and foreign currency transactions, net of foreign capital gains tax | 499,525 | 7,685,179 | 7,056,882 | 23,690,227 | |||||||||||||||
| Net change in unrealized appreciation (depreciation) on investments and foreign currency translations | 817,391 | (4,880,243 | ) | 7,921,394 | 1,019,388 | ||||||||||||||
| Net increase from operations | 1,313,783 | 2,710,507 | 15,440,748 | 26,854,844 | |||||||||||||||
| Distributions declared to shareholders: | |||||||||||||||||||
| From net investment income | - | - | (2,513,869 | ) | (2,041,358 | ) | |||||||||||||
| From net realized gains | (6,782,938 | ) | (1,443,974 | ) | (20,428,853 | ) | (14,728,492 | ) | |||||||||||
| Total distributions declared to shareholders | (6,782,938 | ) | (1,443,974 | ) | (22,942,722 | ) | (16,769,850 | ) | |||||||||||
| Share transactions: | |||||||||||||||||||
| Subscriptions | 10,000,000 | - | 12,578,886 | 7,527,480 | |||||||||||||||
| Distributions reinvested | 6,782,938 | 1,443,974 | 14,502,772 | 10,430,452 | |||||||||||||||
| Redemptions | (9,827,294 | ) | (32,692,430 | ) | (14,550,384 | ) | (58,449,515 | ) | |||||||||||
| Net increase (decrease) in share transactions | 6,955,644 | (31,248,456 | ) | 12,531,274 | (40,491,583 | ) | |||||||||||||
| Net increase (decrease) in net assets | 1,486,489 | (29,981,923 | ) | 5,029,300 | (30,406,589 | ) | |||||||||||||
| NET ASSETS: | |||||||||||||||||||
| Beginning of period | 8,772,956 | 38,754,879 | 105,737,639 | 136,144,228 | |||||||||||||||
| End of period | $ | 10,259,445 | $ | 8,772,956 | $ | 110,766,939 | $ | 105,737,639 | |||||||||||
| Undistributed (overdistributed) net investment income, at end of period | $ | - | $ | - | $ | (600,733 | ) | $ | 1,450,664 | ||||||||||
| Accumulated net investment loss, at end of period | $ | (7,871 | ) | $ | (4,738 | ) | $ | - | $ | - | |||||||||
| Change in shares: | |||||||||||||||||||
| Subscriptions | 2,398,082 | - | 879,689 | 534,955 | |||||||||||||||
| Issued for distributions reinvested | 1,559,556 | 132,353 | 1,105,394 | 788,394 | |||||||||||||||
| Redemptions | (2,339,832 | ) | (2,724,333 | ) | (984,794 | ) | (3,989,516 | ) | |||||||||||
| Net increase (decrease) | 1,617,806 | (2,591,980 | ) | 1,000,289 | (2,666,167 | ) | |||||||||||||
See Accompanying Notes to Financial Statements.
134
NOTES TO FINANCIAL STATEMENTS
January 31, 2007 (Unaudited)
Note 1. Organization:
Columbia Funds Institutional Trust (the "Trust") is a Massachusetts business trust registered under the Investment Company Act of 1940, as amended, as an open-end management investment company. Information presented in these financial statements pertains to the following diversified funds (individually referred to as a "Fund", collectively referred to as the "Funds"):
CMG Enhanced S&P 500® Index Fund
CMG Large Cap Growth Fund
CMG Large Cap Value Fund
CMG Mid Cap Growth Fund
CMG Mid Cap Value Fund
CMG Small Cap Growth Fund
CMG Small Cap Value Fund
CMG Small/Mid Cap Fund
CMG International Stock Fund
Shares of the Funds are available for purchase by institutional buyers and certain advisory clients of Columbia Management Advisors, LLC ("Columbia") or one of its affiliates. Each Fund's minimum initial investment requirement for investors purchasing shares directly is $3 million. Please see the Funds' prospectuses for further details.
Investment goals. CMG Enhanced S&P 500® Index Fund seeks to outperform the total return, over the long run, of the Standard & Poor's 500 Composite Stock Index (the "S&P 500®"). CMG Large Cap Growth Fund and CMG Large Cap Value Fund seek long-term growth by investing primarily in large capitalization equities. CMG Mid Cap Growth Fund and CMG Mid Cap Value Fund seek long-term growth by investing primarily in middle capitalization equities. CMG Small Cap Growth Fund seeks to provide investors with long-term capital appreciation. CMG Small Cap Value Fund seeks long-term growth by investing primarily in small capitalization equities. CMG Small/Mid Cap Fund seeks long-term capital appreciation by investing in small and middle capitalization equities. CMG International Stock Fund seeks long-term capital appreciation.
Fund shares. Each Fund may issue an unlimited number of shares of beneficial interest which are offered continuously at net asset value.
Note 2. Significant accounting policies:
The preparation of financial statements in conformity with accounting principles generally accepted in the United States of America ("GAAP") requires management to make estimates and assumptions that affect the reported amounts of assets and liabilities, the disclosure of contingent assets and liabilities at the date of the financial statements and the reported amounts of revenue and expenses during the reporting period. Actual results could differ from those estimates. The following is a summary of significant accounting policies consistently followed by the Funds in the preparation of their financial statements.
Security valuation. Equity securities, exchange traded funds and securities of certain investment companies are valued at the last sale price on the principal exchange on which they trade, except for securities traded on the NASDAQ, which are valued at the NASDAQ official close price. Unlisted securities or listed securities for which there were no sales during the day are valued at the closing bid price on such exchanges or over-the-counter markets.
135
NOTES TO FINANCIAL STATEMENTS (continued)
January 31, 2007 (Unaudited)
Short-term debt obligations maturing within 60 days are valued at amortized cost, which approximates market value.
Futures contracts are valued at the settlement price established each day by the board of trade or exchange on which they are traded.
Forward currency exchange contracts are valued at the prevailing forward exchange rate of the underlying currencies.
Foreign securities are generally valued at the last sale price on the foreign exchange or market on which they trade. If any foreign share prices are not readily available as a result of limited share activity, the securities are valued at the last sale price of the local shares in the principal market in which such securities are normally traded.
Generally, trading in foreign securities is substantially completed each day at various times prior to the close of the New York Stock Exchange ("NYSE"). The values of such securities used in computing the net asset value of the Funds' shares are determined as of such times. Foreign currency exchange rates are generally determined at 4:00 p.m. Eastern (U.S.) time. Events affecting the values of such foreign securities and such exchange rates may occur between the times at which they are determined and the close of the customary trading session of the NYSE, which would not be reflected in the computation of the Funds' net asset value. If events materially affecting the values of such foreign securities occur and it is determined that market quotations are not reliable, then these foreign securities will be valued at their fair value using procedures approved by the Board of Trustees. The CMG International Stock Fund may use a sys tematic fair valuation model provided by an independent third party to value securities principally traded in foreign markets in order to adjust for possible stale pricing that may occur between the close of the foreign exchanges and the time for valuation. If a security is valued at a "fair value", such value is likely to be different from the last quoted market price for the security.
Investments for which market quotations are not readily available, or that have quotations which management believes are not appropriate, are valued at fair value as determined in good faith under consistently applied procedures established by and under the general supervision of the Board of Trustees.
In September 2006, Statement of Financial Accounting Standards No. 157, Fair Value Measurements ("SFAS 157"), was issued. SFAS 157 is effective for fiscal years beginning after November 15, 2007. SFAS 157 defines fair value, establishes a framework for measuring fair value and expands disclosures about fair value measurements. Management has recently begun to evaluate the impact the application of SFAS 157 will have on the Funds' financial statement disclosures.
Security transactions. Security transactions are accounted for on the trade date. Cost is determined and gains (losses) are based upon the specific identification method for both financial statement and federal income tax purposes.
Futures contracts. Certain Funds may invest in futures contracts to hedge against the effects of changes in the value of portfolio securities due to anticipated changes in interest rates and/or market conditions, for duration management, or when the transactions are economically appropriate to the reduction of risk inherent in the management of the Fund and not for trading purposes. The use of futures contracts involves certain risks, which include: (1) imperfect correlation between the price movement of the instruments and the underlying securities, (2) inability to close out positions due to differing trading hours, or the temporary absence of a liquid market, for either the instrument or the underlying securities, or (3) an inaccurate prediction by Columbia of the future direction of interest rates. Any of these risks may involve amounts exceeding the var iation margin recorded in the Fund's Statement of Assets and Liabilities at any given time. Upon entering into a futures contract, a Fund deposits cash or securities with the broker in an amount sufficient to meet the initial margin requirement. Subsequent payments are made or received by the Fund equal to the daily change in the contract value and are recorded as variation margin receivable or payable and offset in unrealized gains or losses. The Fund recognizes a realized gain or loss when the contract is closed or expires.
136
NOTES TO FINANCIAL STATEMENTS (continued)
January 31, 2007 (Unaudited)
Forward foreign currency exchange contracts. Forward foreign currency exchange contracts are agreements to exchange one currency for another at a future date at a specified price. These contracts are used to minimize the exposure to foreign exchange rate fluctuations during the period between trade and settlement dates of the contracts. Certain Funds may utilize forward foreign currency exchange contracts in connection with the settlement of purchases and sales of securities. Certain Funds may also enter into these contracts to hedge certain other foreign currency denominated assets. Contracts to buy generally are used to acquire exposure to foreign currencies, while contracts to sell are used to hedge the Funds' investments against currency fluctuations. Forward currency contracts are valued daily at the current forward exchange rate of the underlying curre ncy, resulting in unrealized gains (losses) which become realized at the time the foreign currency contracts are closed or mature. Realized and unrealized gains (losses) arising from such transactions are included in net realized and unrealized gains (losses) on foreign currency transactions. The use of forward currency contracts does not eliminate fluctuations in the prices of the Funds' portfolio securities. While the maximum potential loss from such contracts is the aggregate face value in U.S. dollars at the time the contract was opened, exposure is typically limited to the change in value of the contract (in U.S. dollars) over the period it remains open. The Funds could also be exposed to risk if the counterparties of the contracts are unable to fulfill the terms of the contracts.
Repurchase agreements. Each Fund may engage in repurchase agreement transactions with institutions that Columbia has determined are creditworthy. Each Fund, through its custodian, receives delivery of underlying securities collateralizing a repurchase agreement. Collateral is at least equal, at all times, to the value of the repurchase obligation including interest. A repurchase agreement transaction involves certain risks in the event of default or insolvency of the counterparty. These risks include possible delays or restrictions upon each Fund's ability to dispose of the underlying securities and a possible decline in the value of the underlying securities during the period while the Funds seek to assert their rights.
Foreign currency transactions. The values of all assets and liabilities quoted in foreign currencies are translated into U.S. dollars at that day's exchange rates. Net realized and unrealized gains (losses) on foreign currency transactions include gains (losses) arising from the fluctuation in exchange rates between trade and settlement dates on securities transactions, gains (losses) arising from the disposition of foreign currency and currency gains (losses) between the accrual and payment dates on dividends, interest income and foreign withholding taxes.
For financial statement purposes, the Funds do not distinguish that portion of gains (losses) on investments which is due to changes in foreign exchange rates from that which is due to changes in market prices of the investments. Such fluctuations are included with the net realized and unrealized gains (losses) on investments in the Statements of Operations.
Income recognition. Interest income is recorded on the accrual basis. Corporate actions and dividend income are recorded on the ex-date, except for certain foreign securities which are recorded as soon after ex-date as the Funds become aware of such, net of non-reclaimable tax withholdings. Distributions received from REITs in excess of their income are recorded as a reduction of the cost of the related investments and/or realized gains, as applicable. If the Funds no longer own the applicable securities, any distributions received in excess of income are recorded as realized gains.
Federal income tax status. Each Fund intends to qualify each year as a "regulated investment company" under Subchapter M of the Internal Revenue Code, as amended, and will distribute substantially all of its taxable income, if any, for its tax year, and as such will not be subject to federal income taxes. In addition, each Fund intends to distribute in each calendar year substantially all of its net investment income, capital gains and certain other amounts, if any, such that each Fund should not be subject to federal excise tax. Therefore, no federal income or excise tax provision is recorded.
137
NOTES TO FINANCIAL STATEMENTS (continued)
January 31, 2007 (Unaudited)
Distributions to shareholders. Distributions to shareholders are recorded on ex-date. Dividends from net investment income, if any, are declared and distributed at least annually. Net realized capital gains, if any, are distributed at least annually.
Indemnification. In the normal course of business, each Fund enters into contracts that contain a variety of representations and warranties and which provide general indemnities. A Fund's maximum exposure under these arrangements is unknown, as this would involve future claims against the Fund. Also, under the Fund's organizational documents and by contract the Trustees and Officers of the Trust are indemnified against certain liabilities that may arise out of their duties to the Trust. However, based on experience, the Funds expect the risk of loss due to these representations, warranties and indemnities to be minimal.
Note 3. Federal tax information:
The tax character of distributions paid during the year ended July 31, 2006 was as follows:
| July 31, 2006 | |||||||||||
| Ordinary Income* | Long-Term Capital Gains | ||||||||||
| CMG Enhanced S&P 500® Index Fund | $ | 3,814,830 | $ | 2,128,118 | |||||||
| CMG Large Cap Growth Fund | 563,021 | 1,789,275 | |||||||||
| CMG Large Cap Value Fund | 1,661,382 | 3,342,596 | |||||||||
| CMG Mid Cap Growth Fund | 209,153 | 387,042 | |||||||||
| CMG Mid Cap Value Fund | 1,001,723 | 1,985,806 | |||||||||
| CMG Small Cap Growth Fund | 281,083 | 8,358,724 | |||||||||
| CMG Small Cap Value Fund | 1,247,123 | 2,970,578 | |||||||||
| CMG Small/Mid Cap Fund | 241,708 | 1,202,266 | |||||||||
| CMG International Stock Fund | 2,772,501 | 13,997,349 | |||||||||
* For tax purposes short-term capital gains distributions, if any, are considered ordinary income distributions.
Unrealized appreciation and depreciation at January 31, 2007, based on cost of investments for federal income tax purposes, excluding any unrealized appreciation and depreciation from changes in the value of other assets and liabilities resulting from changes in exchange rates, was:
| Unrealized Appreciation | Unrealized Depreciation | Net Unrealized Appreciation | |||||||||||||
| CMG Enhanced S&P 500® Index Fund | $ | 22,143,619 | $ | (1,461,133 | ) | $ | 20,682,486 | ||||||||
| CMG Large Cap Growth Fund | 5,517,162 | (290,434 | ) | 5,226,728 | |||||||||||
| CMG Large Cap Value Fund | 6,489,483 | (200,438 | ) | 6,289,045 | |||||||||||
| CMG Mid Cap Growth Fund | 6,097,649 | (349,341 | ) | 5,748,308 | |||||||||||
| CMG Mid Cap Value Fund | 3,199,215 | (51,370 | ) | 3,147,845 | |||||||||||
| CMG Small Cap Growth Fund | 7,030,277 | (621,814 | ) | 6,408,463 | |||||||||||
| CMG Small Cap Value Fund | 10,405,678 | (400,537 | ) | 10,005,141 | |||||||||||
| CMG Small/Mid Cap Fund | 2,304,198 | (139,251 | ) | 2,164,947 | |||||||||||
| CMG International Stock Fund | 26,575,597 | (640,817 | ) | 25,934,780 | |||||||||||
138
NOTES TO FINANCIAL STATEMENTS (continued)
January 31, 2007 (Unaudited)
The following capital loss carryforwards, determined as of July 31, 2006, may be available to reduce taxable income arising from future net realized gains on investments, if any, to the extent permitted by the Internal Revenue Code:
| Year of Expiration | |||||||||||||||
| 2010 | 2011 | Total | |||||||||||||
| CMG International Stock Fund | $ | 1,072,288 | $ | 420,427 | $ | 1,492,715 | |||||||||
In June 2006, the Financial Accounting Standards Board ("FASB") issued FASB Interpretation No. 48, Accounting for Uncertainty in Income Taxes, an Interpretation of FASB Statement No. 109 (the "Interpretation"). This Interpretation is effective on the last business day of the semiannual reporting period for fiscal years beginning after December 15, 2006 and is to be applied to open tax positions upon initial adoption. This Interpretation prescribes a minimum recognition threshold and measurement method for the financial statement recognition of tax positions taken or expected to be taken in a tax return and also requires certain expanded disclosures. Management has recently begun to evaluate the application of this Interpretation to the Funds and has not at this time quantified the impact, if any, resulting from the adoption of this Interpretation on the Funds' financial statements.
Note 4. Fees and compensation paid to affiliates:
Investment advisory fee. Columbia, an indirect, wholly-owned subsidiary of Bank of America Corporation ("BOA"), is the investment advisor to the Funds. With the exception of CMG Small Cap Growth Fund, each Fund's investment advisory fee is a unified fee. Columbia, out of the unified fee it receives from the Funds, pays all accounting fees, legal fees, transfer agent fees, custody fees, expenses of the Chief Compliance Officer, fees for Sarbanes-Oxley compliance, the commitment fee for the line of credit and miscellaneous expenses of the Funds. The unified fee does not include brokerage fees, taxes, Trustees' fees, Trustee legal counsel fees, audit fees, interest expense associated with any borrowings by the Funds or extraordinary expenses, if any. The unified fees are paid monthly to Columbia based on each Fund's average daily net assets at the following ann ual rates:
| CMG Enhanced S&P 500® Index Fund | 0.25 | % | |||||
| CMG Large Cap Growth Fund | 0.50 | % | |||||
| CMG Large Cap Value Fund | 0.50 | % | |||||
| CMG Mid Cap Growth Fund | 0.70 | % | |||||
| CMG Mid Cap Value Fund | 0.70 | % | |||||
| CMG Small Cap Value Fund | 0.80 | % | |||||
| CMG Small/Mid Cap Fund | 0.75 | % | |||||
| CMG International Stock Fund | 0.75 | % | |||||
Columbia receives a monthly investment advisory fee from CMG Small Cap Growth Fund at the annual rate of 0.75% of the Fund's average daily net assets.
Pricing & bookkeeping fees. Effective December 15, 2006, the Funds entered into a Financial Reporting Services Agreement with State Street Bank & Trust Company ("State Street") and Columbia (the "Financial Reporting Services Agreement") pursuant to which State Street provides financial reporting services to each Fund. Also effective December 15, 2006, the Funds entered into an Accounting Services Agreement with State Street and Columbia (collectively with the Financial Reporting Services Agreement, the "State Street Agreements") pursuant to which State Street provides accounting services to each Fund.
Effective December 15, 2006, the Funds entered into the Pricing and Bookkeeping Oversight and Services Agreement (the "Services Agreement") with Columbia. Under the Services Agreement Columbia provides services related to Fund expenses and compliance with the Sarbanes-Oxley Act of 2002 and provides oversight of the accounting and financial reporting services provided by State Street.
139
NOTES TO FINANCIAL STATEMENTS (continued)
January 31, 2007 (Unaudited)
The fees for each Fund, with the exception of CMG Small Cap Growth Fund, are payable by Columbia. CMG Small Cap Growth Fund is not charged a fee for financial reporting services, accounting services and pricing and bookkeeping services.
Prior to December 15, 2006, Columbia was responsible for providing pricing and bookkeeping services to the Funds under a pricing and bookkeeping agreement. Under separate agreements, Columbia delegated certain functions to State Street. As a result, the total fees payable under the pricing and bookkeeping agreement were paid to State Street. The pricing and bookkeeping fees for each Fund, with the exception of CMG Small Cap Growth Fund, were payable by Columbia. CMG Small Cap Growth Fund was not charged a fee for pricing and bookkeeping services.
Transfer agent fee. Columbia Management Services, Inc. (the "Transfer Agent"), an affiliate of Columbia and an indirect, wholly-owned subsidiary of BOA, provides shareholder services to the Funds and has contracted with Boston Financial Data Services ("BFDS") to serve as sub-transfer agent. The transfer agent fees for each Fund, with the exception of CMG Small Cap Growth Fund, are payable by Columbia.
The Transfer Agent is entitled to receive a fee from CMG Small Cap Growth Fund, paid monthly, at the annual rate of $17.00 per open account plus sub-transfer agent fees (exclusive of BFDS fees) calculated based on assets held in omnibus accounts subject to certain limitations and intended to recover the cost of payments to other parties (including affiliates of BOA) for services to those accounts.
The Transfer Agent may also retain, as additional compensation for its services, fees for wire, telephone and redemption orders, IRA trustee agent fees and account transcript fees due the Transfer Agent from shareholders of the Funds and credits (net of bank charges) earned with respect to balances in accounts the Transfer Agent maintains in connection with its services to the Funds.
For the six months ended January 31, 2007, the annualized effective transfer agent fee rate for CMG Small Cap Growth Fund, inclusive of out-of-pocket expenses was less than 0.01% of the Fund's average daily net assets.
Fee waivers. Columbia has contractually agreed to reimburse each Fund, with the exception of CMG Small Cap Growth Fund, through March 1, 2009 for certain expenses so that the expenses incurred by the Funds, including the investment advisory fees, will not exceed the following annual rates (exclusive of brokerage commissions, interest, taxes and extraordinary expenses, if any) based on each Fund's average daily net assets:
| CMG Enhanced S&P 500® Index Fund | 0.25 | % | |||||
| CMG Large Cap Growth Fund | 0.50 | % | |||||
| CMG Large Cap Value Fund | 0.50 | % | |||||
| CMG Mid Cap Growth Fund | 0.70 | % | |||||
| CMG Mid Cap Value Fund | 0.70 | % | |||||
| CMG Small Cap Value Fund | 0.80 | % | |||||
| CMG Small/Mid Cap Fund | 0.75 | % | |||||
| CMG International Stock Fund | 0.75 | % | |||||
Columbia and its affiliates have contractually agreed to waive fees and reimburse the CMG Small Cap Growth Fund until November 30, 2009, for certain expenses so that total expenses (exclusive of brokerage commissions, interest, taxes and extraordinary expenses, if any) will not exceed 0.80% annually of the Fund's average daily net assets. There is no guarantee that this arrangement will continue after November 30, 2009.
Custody credits. CMG Small Cap Growth Fund has an agreement with its custodian bank under which custody fees may be reduced by balance credits. These credits are recorded as a reduction of total expenses on the Statement of Operations. The Fund could have invested a portion of the assets utilized in connection with the expense offset arrangement in an income-producing asset if it had not entered into such an agreement.
Fees paid to officers and trustees. All officers of the Funds are employees of Columbia or its affiliates and, with the exception of the Funds' Chief Compliance Officer, receive no compensation from the Funds. The Board of Trustees has appointed a Chief Compliance Officer to the Funds in accordance with federal securities regulations. The expenses of the Chief Compliance Officer for each Fund with the exception of CMG Small Cap Growth Fund are payable by
140
NOTES TO FINANCIAL STATEMENTS (continued)
January 31, 2007 (Unaudited)
Columbia. CMG Small Cap Growth Fund, along with other affiliated funds, pays its pro-rata share of the expenses associated with the Chief Compliance Officer. CMG Small Cap Growth Fund's expenses for the Chief Compliance Officer will not exceed $15,000 per year.
The Funds' Trustees may participate in a deferred compensation plan which may be terminated at any time. Obligations of the plan will be paid solely out of the Funds' assets.
Other. Columbia provides certain services to the Funds related to Sarbanes-Oxley compliance. The fees for such services for each Fund with the exception of CMG Small Cap Growth Fund are payable by Columbia. For the six months ended January 31, 2007, CMG Small Cap Growth Fund paid $1,465 to Columbia for such services. This amount is included in "Other expenses" on the Statement of Operations.
Note 5. Portfolio information:
For the six months ended January 31, 2007, the cost of purchases and proceeds from sales of securities, excluding short-term obligations, were as follows:
| Purchases | Sales | ||||||||||
| CMG Enhanced S&P 500® Index Fund | $ | 39,912,696 | $ | 31,176,454 | |||||||
| CMG Large Cap Growth Fund | 41,657,245 | 39,208,682 | |||||||||
| CMG Large Cap Value Fund | 15,491,698 | 16,493,825 | |||||||||
| CMG Mid Cap Growth Fund | 19,411,547 | 18,181,557 | |||||||||
| CMG Mid Cap Value Fund | 5,557,900 | 9,447,170 | |||||||||
| CMG Small Cap Growth Fund | 26,661,810 | 32,719,831 | |||||||||
| CMG Small Cap Value Fund | 5,434,276 | 12,940,881 | |||||||||
| CMG Small/Mid Cap Fund | 5,218,023 | 4,918,897 | |||||||||
| CMG International Stock Fund | 46,851,733 | 55,930,884 | |||||||||
Note 6. Line of credit:
The Trust and other affiliated funds participate in a $350,000,000 committed, unsecured revolving line of credit and a $150,000,000 uncommitted, unsecured line of credit, both provided by State Street. Borrowings are used for temporary or emergency purposes to facilitate portfolio liquidity.
Interest on the committed line of credit is charged to each participating fund based on the fund's borrowings at a rate per annum equal to the Federal Funds Rate plus 0.50%. In addition, a commitment fee of 0.10% per annum is accrued and apportioned among the participating funds based on their pro-rata portion of the unutilized committed line of credit. Interest on the uncommitted line of credit is charged to each participating fund based on the fund's borrowings at a variable rate per annum equal to the Federal Funds Rate plus a spread, as determined and quoted by State Street at the time of the request for a loan. A one-time structuring fee of $30,000 is also accrued and apportioned to each fund participating in the uncommitted line of credit based on the average net assets of the participating funds. In addition, if the uncommitted line of credit is extended for an additional period, an annual administration fee of $15,000 wi ll be charged and apportioned among the participating funds. The commitment fee and structuring fee are included in the unified fee, with the exception of CMG Small Cap Growth Fund.
141
NOTES TO FINANCIAL STATEMENTS (continued)
January 31, 2007 (Unaudited)
For the six months ended January 31, 2007, the average daily loan balance outstanding on days where borrowings existed and the weighted average interest rates for the Funds that participated in these arrangements are as follows:
| Average Borrowings | Weighted Average Interest Rates | ||||||||||
| CMG Enhanced S&P 500® Index Fund | $ | 4,000,000 | 3.50 | % | |||||||
| CMG Small Cap Growth Fund | 1,000,000 | 5.75 | % | ||||||||
| CMG Small Cap Value Fund | 5,000,000 | 5.75 | % | ||||||||
| CMG International Stock Fund | 4,600,000 | 5.19 | % | ||||||||
Note 7. Securities lending:
CMG Enhanced S&P 500® Index Fund, CMG Large Cap Growth Fund and CMG Large Cap Value Fund commenced a securities lending program in August 2006 and may lend their securities to certain approved brokers, dealers and other financial institutions. Each loan is collateralized by cash, in an amount at least equal to the market value of the securities loaned plus accrued income from the investment of the collateral. The collateral received is invested and the income generated by the investment of the collateral, net of any fees remitted to State Street as the lending agent, is paid to the Funds. Generally, in the event of borrower default, the Funds have the right to use the collateral to offset any losses incurred. In the event the Funds are delayed or prevented from exercising their rights to dispose of the collateral, there may be a potential loss to the Funds. The Funds bear the risk of loss with respect to the i nvestment of collateral.
Note 8. Shares of beneficial interest:
As of January 31, 2007, the Funds had shareholders whose shares were beneficially owned by participant accounts over which Bank of America and/or its affiliates had either sole or joint investment discretion. Subscription and redemption activity of these accounts may have a significant effect on the operations of the Funds. The percentage of shares of beneficial interest outstanding held therein are as follows:
| % of Shares Outstanding Held | |||||||
| CMG Enhanced S&P 500® Index Fund | 100.0 | % | |||||
| CMG Large Cap Growth Fund | 100.0 | % | |||||
| CMG Large Cap Value Fund | 100.0 | % | |||||
| CMG Mid Cap Growth Fund | 100.0 | % | |||||
| CMG Mid Cap Value Fund | 100.0 | % | |||||
| CMG Small Cap Growth Fund | 100.0 | % | |||||
| CMG Small Cap Value Fund | 97.4 | % | |||||
| CMG International Stock Fund | 100.0 | % | |||||
In addition, as of January 31, 2007, CMG Small/Mid Cap Fund had one shareholder that held 100.0% of the shares outstanding. Subscription and redemption activity of this shareholder may have a material effect on the Fund.
142
NOTES TO FINANCIAL STATEMENTS (continued)
January 31, 2007 (Unaudited)
Note 9. Disclosure of significant risks and contingencies:
Foreign securities. There are certain additional risks involved when investing in foreign securities that are not inherent with investments in domestic securities. These risks may involve foreign currency exchange rate fluctuations, adverse political and economic developments and the possible prevention of currency exchange or other foreign governmental laws or restrictions. In addition, the liquidity of foreign securities may be more limited than that of domestic securities.
Investments in emerging market countries are subject to additional risk. The risk of foreign investments is typically increased in less developed countries. These countries are also more likely to experience high levels of inflation, deflation or currency devaluation which could hurt their economies and securities markets.
Sector Focus. At times, the Funds may have a large portion of their assets invested in a particular group of related industries (sector). During such times, the Funds will have greater exposure to economic and market events affecting such sector than if it were more broadly diversified across sectors.
Legal proceedings. On February 9, 2005, Columbia Management Advisors, Inc. (which has since merged into Banc of America Capital Management, LLC (now named Columbia Management Advisors, LLC)) ("Columbia") and Columbia Funds Distributor, Inc. (which has been renamed Columbia Management Distributors, Inc.) (the "Distributor") (collectively, the "Columbia Group") entered into an Assurance of Discontinuance with the New York Attorney General ("NYAG") (the "NYAG Settlement") and consented to the entry of a cease-and-desist order by the Securities and Exchange Commission ("SEC") (the "SEC Order") on matters relating to mutual fund trading. The SEC Order and the NYAG Settlement are referred to collectively as the "Settlements".
Under the terms of the SEC Order, the Columbia Group agreed, among other things, to: pay $70 million in disgorgement and $70 million in civil money penalties; cease and desist from violations of the antifraud provisions and certain other provisions of the federal securities laws; maintain certain compliance and ethics oversight structures; retain an independent consultant to review the Columbia Group's applicable supervisory, compliance, control and other policies and procedures; and retain an independent distribution consultant (see below). The Columbia Funds have also voluntarily undertaken to implement certain governance measures designed to maintain the independence of their boards of trustees. The NYAG Settlement also, among other things, requires Columbia and its affiliates to reduce management fees for certain Columbia Funds (including the former Nations Funds) and other mutual funds collectively by $32 million per year f or five years, for a projected total of $160 million in management fee reductions.
Pursuant to the procedures set forth in the SEC Order, the $140 million in settlement amounts described above will be distributed in accordance with a distribution plan developed by an independent distribution consultant and approved by the SEC. The independent distribution consultant has been in consultation with the staff of the SEC and has submitted a proposed plan of distribution. The SEC has released the proposed plan of distribution for public notice and comment but has not yet approved a final plan of distribution.
As a result of these matters or any adverse publicity or other developments resulting from them, there may be increased redemptions or reduced sales of fund shares, which could increase transaction costs or operating expenses, or have other adverse consequences for the funds.
A copy of the SEC Order is available on the SEC website at http://www.sec.gov. A copy of the NYAG Settlement is available as part of the Bank of America Corporation Form 8-K filing on February 10, 2005.
In connection with the events described above, various parties have filed suit against certain funds, the Trustees of the Columbia Funds, FleetBoston Financial Corporation and its affiliated entities and/or Bank of America and its affiliated entities.
143
NOTES TO FINANCIAL STATEMENTS (continued)
January 31, 2007 (Unaudited)
On February 20, 2004, the Judicial Panel on Multidistrict Litigation transferred these cases and cases against other mutual fund companies based on similar allegations to the United States District Court in Maryland for consolidated or coordinated pretrial proceedings (the "MDL"). Subsequently, additional related cases were transferred to the MDL. On September 29, 2004, the plaintiffs in the MDL filed amended and consolidated complaints. One of these amended complaints is a putative class action that includes claims under the federal securities laws and state common law, and that names Columbia, the Distributor, the Trustees of the Columbia Funds, Bank of America Corporation and others as defendants. Another of the amended complaints is a derivative action purportedly on behalf of the Columbia Funds that asserts claims under federal securities laws and state common law.
On February 25, 2005, Columbia and other defendants filed motions to dismiss the claims in the pending cases. On March 1, 2006, for reasons stated in the court's memoranda dated November 3, 2005, the U.S. District Court for the District of Maryland granted in part and denied in part the defendants' motions to dismiss. The court dismissed all of the class action claims pending against the Columbia Funds Trusts. As to Columbia and the Distributor, the claims under the Securities Act of 1933, the claims under Sections 34(b) and 36(a) of the Investment Company Act of 1940 ("ICA") and the state law claims were dismissed. The claims under Sections 10(b) and 20(a) of the Securities Exchange Act of 1934 and claims under Section 36(b) of the ICA were not dismissed.
On March 21, 2005, a purported class action was filed in Massachusetts state court alleging that certain conduct, including market timing, entitled Class B shareholders in certain Columbia Funds to an exemption from contingent deferred sales charges upon early redemption ("the CDSC Lawsuit"). The CDSC Lawsuit was removed to federal court in Massachusetts and the federal Judicial Panel transferred the CDSC Lawsuit to the MDL.
On April 4, 2006, the plaintiffs and the Columbia defendants named in the MDL, including the Columbia Funds, entered into a term sheet containing the principal terms of a stipulation of settlement that would settle all Columbia-related claims in the MDL described above, including the CDSC Lawsuit. On April 6, 2006, the U.S. District Court for the District of Maryland stayed all actions with respect to these Columbia-related claims.
In 2004, the Columbia Funds' adviser and distributor and certain affiliated entities and individuals were named as defendants in certain purported shareholder class and derivative actions making claims, including claims under the Investment Company and the Investment Advisers Acts of 1940 and state law. Certain Columbia Funds were named as nominal defendants. The suits allege, inter alia, that the fees and expenses paid by the funds are excessive and that the advisers and their affiliates inappropriately used fund assets to distribute the funds and for other improper purposes. On March 2, 2005, the actions were consolidated in the Massachusetts federal court as In re Columbia Entities Litigation. The plaintiffs filed a consolidated amended complaint on June 9, 2005. On November 30, 2005, the judge dismissed all claims by plaintiffs and entered final judgment in favor of the defendants. The plaintiffs appealed to the United States Court of Appeals for the First Circuit on December 30, 2005. A stipulation and settlement agreement dated January 19, 2007 was filed in the First Circuit on February 14, 2007, with a joint stipulation of dismissal and motion for remand to obtain district court approval of the settlement. That joint motion was granted and the appeal was dismissed. On March 6, 2007, the case was remanded to the District Court, where the parties will seek court approval of the settlement. The terms of the proposed settlement, if approved, will require payments by the funds' adviser and/or its affiliates, including payment of plaintiffs' attorneys' fees and notice to class members. In the event that the settlement is not approved, the plaintiffs may elect to go forward with their appeal and no opinion is expressed regarding the likely outcome or financial impact of such an appeal on any fund.
144
NOTES TO FINANCIAL STATEMENTS (continued)
January 31, 2007 (Unaudited)
Note 10. Business combinations and mergers:
Effective March 27, 2006, CMG Small Cap Growth Fund, a series of Columbia Funds Institutional Trust, merged into CMG Small Cap Fund. CMG Small Cap Fund was then renamed CMG Small Cap Growth Fund. CMG Small Cap Fund received a tax-free transfer of assets from CMG Small Cap Growth Fund as follows:
| Shares Issued | Net Assets Received | Unrealized Appreciation1 | |||||||||
| 18,087,654 | $ | 40,504,741 | $ | 8,060,601 | |||||||
| Net Assets of CMG Small Cap Fund Prior to Combination | Net Assets of CMG Small Cap Growth Fund Immediately Prior to Combination | Net Assets of CMG Small Cap Fund Immediately After Combination | |||||||||
| $ | 6,118,119 | $ | 40,504,741 | $ | 46,622,860 | ||||||
1Unrealized appreciation is included in the Net Assets Received.
145
BOARD CONSIDERATION AND APPROVAL OF
INVESTMENT ADVISORY AGREEMENTS
The Advisory Fees and Expenses Committee of the Board of Trustees meets one or more times annually to review the advisory agreements (collectively, the "Agreements") of the funds for which the Trustees serve as trustees (each a "fund") and determine whether to recommend that the full Board approve the continuation of the Agreements for an additional one-year period. After the Committee has made its recommendation, the full Board, including the Independent Trustees, determines whether to approve the continuation of the Agreements. In addition, the Board, including the Independent Trustees, considers matters bearing on the Agreements at most of its other meetings throughout the year and meets regularly with the heads of each investment area within Columbia. Through the Board's Investment Oversight Committees, Trustees also meet with selected fund portfolio managers at various times throughout the year.
The Trustees receive and review all materials that they, their legal counsel or Columbia, the funds' investment adviser, believe to be reasonably necessary for the Trustees to evaluate the Agreements and determine whether to approve the continuation of the Agreements. Those materials generally include, among other items, (i) information on the investment performance of each fund relative to the performance of peer groups of mutual funds and the fund's performance benchmarks, (ii) information on each fund's advisory fees and other expenses, including information comparing the fund's expenses to those of peer groups of mutual funds and information about any applicable expense caps and fee "breakpoints," (iii) information about the profitability of the Agreements to Columbia, including potential "fall-out" or ancillary benefits that Columbia and its affiliates may receive as a result of their relationships with the funds and (iv) i nformation obtained through Columbia's response to a questionnaire prepared at the request of the Trustees by counsel to the funds and independent legal counsel to the Independent Trustees. The Trustees also consider other information such as (v) Columbia's financial results and financial condition, (vi) each fund's investment objective and strategies and the size, education and experience of Columbia's investment staffs and their use of technology, external research and trading cost measurement tools, (vii) the allocation of the funds' brokerage, if any, and the use of "soft" commission dollars to pay for research products and services, (viii) Columbia's resources devoted to, and its record of compliance with, the funds' investment policies and restrictions, policies on personal securities transactions and other compliance policies, (ix) Columbia's response to various legal and regulatory proceedings since 2003 and (x) the economic outlook generally and for the mutual fund industry in particular. In additio n, the Advisory Fees and Expenses Committee confers with the funds' independent fee consultant and reviews materials relating to the funds' relationships with Columbia provided by the independent fee consultant. Throughout the process, the Trustees have the opportunity to ask questions of and request additional materials from Columbia and to consult with independent legal counsel to the Independent Trustees and the independent fee consultant.
The Board of Trustees most recently approved the continuation of the Agreements at its October 2006 meeting, following meetings of the Advisory Fees and Expenses Committee held in August, September and October 2006. In considering whether to approve the continuation of the Agreements, the Trustees, including the Independent Trustees, did not identify any single factor as determinative, and each weighed various factors as he or she deemed appropriate. The Trustees considered the following matters in connection with their approval of the continuation of the Agreements:
The nature, extent and quality of the services provided to the funds under the Agreements. The Trustees considered the nature, extent and quality of the services provided by Columbia and its affiliates to the funds and the resources dedicated to the funds by Columbia and its affiliates. Among other things, the Trustees considered (i) Columbia's ability (including its personnel and other resources, compensation programs for personnel involved in fund management, reputation and other attributes) to attract and retain highly qualified research, advisory and supervisory investment professionals; (ii) the portfolio management services provided by those investment professionals; and (iii) the trade execution services provided on behalf of the funds. For each fund, the Trustees also considered the benefits to shareholders of investing in a mutual fund that is part of a family of funds offering exposure to a variety of asset classes and investment disciplines and providing a variety of fund and shareholder services. After reviewing those and related factors, the Trustees concluded, within the context of their overall conclusions regarding each of the Agreements, that the nature, extent and quality of services provided supported the continuation of the Agreements.
146
BOARD CONSIDERATION AND APPROVAL OF
INVESTMENT ADVISORY AGREEMENTS (continued)
Investment performance of the funds and Columbia. The Trustees reviewed information about the performance of each fund over various time periods, including information prepared by an independent third party that compared the performance of each fund to the performance of peer groups of mutual funds and performance benchmarks. The Trustees also reviewed a description of the third party's methodology for identifying each fund's peer group for purposes of performance and expense comparisons. The Trustees also considered additional information that the Advisory Fees and Expenses Committee requested from Columbia relating to funds that presented relatively weaker performance and/or relatively higher expenses.
In the case of each fund whose performance lagged that of a relevant peer group for certain (although not necessarily all) periods, the Trustees concluded that other factors relevant to performance were sufficient, in light of other considerations, to warrant continuation of the fund's Agreements. Those factors varied from fund to fund, but included one or more of the following: (i) that the fund's performance, although lagging in certain recent periods, was stronger over the longer term; (ii) that the underperformance was attributable, to a significant extent, to investment decisions that were reasonable and consistent with the fund's investment strategy and policies and that then fund was performing as expected, given these investment decisions, market conditions and the fund's investment strategy; (iii) that the fund's performance was competitive when compared to other relevant performance benchmarks or peer groups; (iv) that Columbia had taken or was taking steps designed to help improve the fund's investment performance, including, but not limited to, replacing portfolio managers or modifying investment strategies; and (v) that the fund was proposed to be reorganized into another fund, and that such reorganization would result in a reduction in fund expenses.
The Trustees also considered Columbia's performance and reputation generally, the funds' performance as a fund family generally, and Columbia's historical responsiveness to Trustee concerns about performance and Columbia's willingness to take steps intended to improve performance.
After reviewing those and related factors, the Trustees concluded, within the context of their overall conclusions regarding each of the Agreements, that the performance of each fund and Columbia was sufficient, in light of other considerations, to warrant the continuation of the Agreement(s) pertaining to that fund.
The costs of the services provided and profits realized by Columbia and its affiliates from their relationships with the funds. The Trustees considered the fees charged to the funds for advisory services as well as the total expense levels of the funds. That information included comparisons (provided by management and by an independent third party) of each fund's advisory fees and total expense levels to those of the fund's peer groups and information about the advisory fees charged by Columbia to comparable institutional accounts. In considering, the fees charged to those accounts, the Trustees took into account, among other things, management's representations about the differences between managing mutual funds as compared to other types of accounts, including differences in the services provided, differences in the risk profile of such business for Columb ia, and the additional resources required to manage mutual funds effectively. In evaluating each fund's advisory fees, the Trustees also took into account the demands, complexity and quality of the investment management of the fund. The Trustees considered existing advisory fee breakpoints, and Columbia's use of advisory fee waivers and expense caps, which benefited a number of the funds. The Trustees also noted management's stated justification for the fees charged to the funds, which included information about the investment performance of the funds and the services provided to the funds. The Trustees also considered the compensation directly or indirectly received by Columbia and its affiliates from their relationships with the funds. The Trustees reviewed information provided by management as to the profitability to Columbia and its affiliates of their relationships with each fund, and information about the allocation of expenses used to calculate profitability. When reviewing profitability, the Trustees also considered court cases in which adviser profitability was an issue in whole or in part, the performance of the relevant funds, the expense level of each fund, and whether Columbia had implemented breakpoints and/or expense caps with respect to the fund.
147
BOARD CONSIDERATION AND APPROVAL OF
INVESTMENT ADVISORY AGREEMENTS (continued)
After reviewing those and related factors, the Trustees concluded, within the context of their overall conclusions regarding each of the Agreements, that the advisory fees charged to each fund, and the related profitability to Columbia and its affiliates of their relationships with the fund, supported the continuation of the Agreement(s) pertaining to that fund.
Economies of Scale. The Trustees considered the existence of any economies of scale in the provision by Columbia of services to each fund, to groups of related funds, and to Columbia's investment advisory clients as a whole and whether those economies were shared with the funds through breakpoints in the investment advisory fees or other means, such as expense waivers/reductions and additional investments by Columbia in investment, trading and compliance resources. The Trustees noted that many of the funds benefited from breakpoints, expense caps, or both. In considering those issues, the Trustees also took note of the costs of the services provided (both on an absolute and a relative basis) and the profitability to Columbia and its affiliates of their relationships with the funds, as discussed above.
After reviewing those and related factors, the Trustees concluded, within the context of their overall conclusions regarding each of the Agreements, that the extent to which economies of scale were shared with the funds supported the continuation of the Agreements.
Other Factors. The Trustees also considered other factors, which included but were not limited to the following:
n the extent to which each fund had operated in accordance with its investment objective and investment restrictions, the nature and scope of the compliance programs of the funds and Columbia and the compliance-related resources that Columbia and its affiliates were providing to the funds;
n the nature, quality, cost and extent of administrative and shareholder services performed by Columbia and its affiliates, both under the Agreements and under separate agreements for the provision of transfer agency and administrative services;
n so-called "fall-out benefits" to Columbia and its affiliates, such as the engagement of its affiliates to provide distribution, brokerage and transfer agency services to the funds, and the benefits of research made available to Columbia by reason of brokerage commissions generated by the funds' securities transactions, as well as possible conflicts of interest associated with those fall-out and other benefits, and the reporting, disclosure and other processes in place to disclose and monitor those possible conflicts of interest; and
n the draft report provided by the funds' independent fee consultant, which included information about and analysis of the funds' fees, expenses and performance.
Based on their evaluation of all factors that they deemed to be material, including those factors described above, and assisted by the advice of independent counsel and the independent fee consultant, the Trustees, including the Independent Trustees, approved the continuance of each of the Agreements through October 31, 2007.
148
SUMMARY OF MANAGEMENT FEE EVALUATION BY
INDEPENDENT FEE CONSULTANT
Prepared Pursuant to the February 9, 2005 Assurance of Discontinuance between the Office of Attorney General of New York State and Columbia Management Advisors, Inc. and Columbia Funds Distributor, Inc. October 11, 2006
I. Overview
Columbia Management Advisors, LLC ("CMA") and Columbia Funds Distributors, Inc.1 ("CFD") agreed on February 9, 2005 to the New York Attorney General's Assurance of Discontinuance ("AOD"). Among other things, the AOD stipulates that CMA may manage or advise a Columbia Fund ("Fund" and together with all such funds or a group of such funds as the "Funds") only if the Independent Members of the Fund's Board of Trustees (such Independent Members of the Fund's Board together with the other members of the Fund's Board, referred to as the "Trustees") appoint a Senior Officer or retain an Independent Fee Consultant ("IFC") who is to manage the process by which proposed management fees are negotiated. The AOD further stipulates that the Senior Officer or IFC is to prepare a written annual evaluation of the fee negotiation process.
On September 14, 2006, the Independent members of the Funds' Boards retained me as IFC for the Funds. In this capacity, I have prepared the second annual written evaluation of the fee negotiation process. I am successor to the first IFC, Erik Sirri, who prepared the annual evaluation in 2005 and who contributed to the second annual written evaluation until his resignation as IFC in August 2006 to become Director of the Division of Market Regulation at the U.S. Securities and Exchange Commission.2
A. Role of the Independent Fee Consultant
The AOD charges the IFC with "managing the process by which proposed management fees...to be charged the Columbia Fund are negotiated so that they are negotiated in a manner which is at arms' length and reasonable and consistent with this Assurance of Discontinuance." In this role, the IFC does not replace the Trustees in negotiating management fees with CMA, and the IFC does not substitute his or her judgment for that of the Trustees about the reasonableness of proposed fees. As the AOD states, CMA "may manage or advise a Columbia Fund only if the reasonableness of the proposed management fees is determined by the Board of Trustees...using...an annual independent written evaluation prepared by or under the direction of...the Independent Fee Consultant."
B. Elements Involved in Managing the Fee Negotiation Process
Managing the fee negotiation process has three elements. One involves reviewing the information provided by CMG to the Trustees for evaluating the proposed management fees and augmenting that information, as necessary, with additional information from CMG or other sources and with further analyses of the information and data. The second element involves reviewing the information and analysis relative to at least the following six factors set forth in the AOD:
1. The nature and quality of CMA's services, including the Fund's performance;
2. Management fees (including any components thereof) charged by other mutual fund companies for like services;
3. Possible economies of scale as the Fund grows larger;
1 CMA and CFD are subsidiaries of Columbia Management Group, Inc. ("CMG"), which also is the parent of Columbia Management Services, Inc. ("CFS"), the Funds' transfer agent. Before the date of this report, CMA merged into an affiliated entity, Banc of America Capital Management, LLC, which was renamed Columbia Management Advisors, LLC and which carries on the business of CMA. CFD also has been renamed Columbia Management Distributors, Inc.
2 I am an independent economic consultant. From August 2005 until August 2006, I provided support to Mr. Sirri as an independent consultant. From 1994 to 2004, I was Chief Economist at the Investment Company Institute. Earlier, I was Section Chief and Assistant Director at the Federal Reserve Board and Professor of Economics at Oklahoma State University. I have no material relationship with Bank of America or CMG, aside from serving as IFC, and I am aware of no material relationship with any of their affiliates. To assist me with the report, I engaged NERA Economic Consulting, an independent consulting firm that has had extensive experience in the mutual fund industry. I also have retained Willkie Farr & Gallagher LLP as counsel to advise me in connection with the report.
149
SUMMARY OF MANAGEMENT FEE EVALUATION BY
INDEPENDENT FEE CONSULTANT (continued)
4. Management fees (including any components thereof) charged to institutional and other clients of CMA for like services;
5. Costs to CMA and its affiliates of supplying services pursuant to the management fee agreements, excluding any intra-corporate profit; and
6. Profit margins of CMA and its affiliates from supplying such services.
The final element involves providing the Trustees with a written evaluation of the above factors as they relate to the fee negotiation process.
C. Organization of the Annual Evaluation
The 2006 annual evaluation focuses on the six factors and contains a section for each factor except that CMA's costs and profits from managing the Funds have been combined into a single section. In each section, the discussion of the factor considers and analyzes the available data and other information as they bear upon the fee negotiation process. If appropriate, the discussion in the section may point out certain aspects of the proposed fees that may warrant particular attention from the Trustees. The discussion also may suggest other data, information, and approaches that the Trustees might consider incorporating into the fee negotiation process in future years.
In addition to a discussion of the six factors, the report reviews the status of recommendations made in the 2005 IFC evaluation. The 2006 report also summarizes the findings with regard to the six factors and contains a summary of recommendations for possible enhancements to the process.
II. Status of 2005 Recommendations
The 2005 IFC evaluation contains recommendations aimed at enhancing the evaluation of proposed management fees by Trustees. The section summarizes those recommendations and includes my assessment of the response to the recommendations.
1. Recommendation: Trustees should consider requesting more analytical work from CMG in the preparation of future 15(c) materials.
Status: CMG has provided additional analyses to the Trustees on economies of scale, a comparative analysis of institutional and retail management fees, management fee breakpoints, risk-adjusted performance, fee waivers and expense reimbursements, and CMG's costs and profitability.
2. Recommendation: Trustees may wish to consider whether CMG should continue expanding the use of Morningstar or other third party data to supplement CMG's fee and performance analysis that is now based primarily on Lipper reports.
Status: CMG has used data from Morningstar Inc. to compare with data from Lipper Inc. ("Lipper") in performing the Trustees' screening procedures.
3. Recommendation: Trustees should consider whether...the fund-by-fund screen...should place comparable emphasis on both basis point and quintile information in their evaluation of the funds...Also, the Trustees should consider incorporating sequences of one year performance into a fund-by-fund screen.
Status: CMG has not provided Trustees with results of the screening process using percentiles. CMG has provided Trustees with information on the changes in performance and expenses between 2005 and 2006 and data on one-year returns.
150
SUMMARY OF MANAGEMENT FEE EVALUATION BY
INDEPENDENT FEE CONSULTANT (continued)
4. Recommendation: Given the volatility of fund performance, the Trustees may want to consider whether a better method exists than th[e] fee waiver process to deal with fund underperformance.
Status: It is my understanding that the Trustees have determined to address fund underperformance not only through fee waivers and expense caps but also through discussions with CMG regarding the sources of underperformance. CMG has provided Trustees with an analysis of the relationship between breakpoints, expense reimbursements, and fee waivers.
5. Recommendation: [Seventy-one] percent of funds [have] yet to reach their first management fee breakpoint... Trustees may wish to consider whether the results of my ongoing economies-of-scale work affects the underlying economic assumptions reflected in the existing breakpoint schedules.
Status: CMG has prepared a memo for the Trustees discussing its views on the nature and sharing of potential economies of scale. The memo discuses CMG's view that economies of scale arise at the complex level rather than the fund level. The memo also describes steps, including the introduction of breakpoints, taken to share economies of scale with shareholders. CMG's analysis, however, does not discuss specific sources of economies of scale and does not link breakpoints to economies of scale that might be realized as the Funds' assets increase.
6. Recommendation: Trustees should continue working with management to address issues of funds that demonstrate consistent or significant underperformance even if the fee levels for the funds are low.
Status: Trustees monitor performance on an ongoing basis.
III. Findings
A. General
1. Based upon my examination of the available information and the six factors, I conclude that the Trustees have the relevant information necessary to evaluate the reasonableness of the proposed management fees for the Funds. CMG has provided the Trustees with relevant materials on the six factors through the 15(c) contract renewal process and in materials prepared for review at Board and Committee meetings.
2. In my view, the process by which the proposed management fees of the Funds have been negotiated in 2006 thus far has been, to the extent practicable, at arms' length and reasonable and consistent with the AOD.
B. Nature and Quality of Services, Including Performance
3. The performance of the Funds has been relatively strong, especially that of fixed-income Funds. For each of the 1-, 3-, 5- and 10-year performance periods, over 60 percent of the funds have ranked in the top three performance quintiles.
4. The performance of the equity Funds overall, though less concentrated in the top two quintiles than the fixed income Funds, improved in 2006 relative to that in 2005. The fixed-income funds maintained the relatively high performance level of 2005 in 2006.
5. The Funds' overall performance adjusted for risk was significantly stronger than performance unadjusted for risk. Domestic and international equity funds, in particular, moved to higher relative performance rankings after adjusting for risk.
6. The procedure used to construct the performance universe in which each Fund's performance is ranked relative to comparable funds may bias a Fund's ranking upward within that universe. The bias occurs because the
151
SUMMARY OF MANAGEMENT FEE EVALUATION BY
INDEPENDENT FEE CONSULTANT (continued)
performance ranking procedure includes all share classes of multi-class funds in the universe and because the procedure ranks either no-load or A share classes of the Funds. No-load and A share classes generally have lower total expenses than B and C shares (owing to B and C shares having higher distribution/service fees) and thus, given all else, would outperform many of B and C share classes included in the universe. A preliminary analysis that adjusts for the bias results in a downward movement in the relative performance for the Funds but does not change the general finding that the Funds' performance has been strong relative to comparable funds.
C. Management Fees Charged by Other Mutual Fund Companies
7. The Funds' management fees and total expenses are generally low relative to those of their peers. At least 56 percent of the Funds are in the first or second quintiles with the lowest fees and expenses and nearly three fourths or more in the first three quintiles. Equity Funds are more highly concentrated in the first three quintiles than fixed-income Funds.
8. The fee and expense rankings as whole are similar to those in 2005 in that the majority of funds are ranked in the top quintiles. Nonetheless, a number of individual funds experienced a change in ranking between 2005 and 2006. This fund-level instability may reflect sensitivity of rankings to the composition of the comparison groups, as the membership of the peer groups typically changed substantially between the two years.
9. The Liberty Money Market Fund VS appears to have a higher management fee structure than that of other Columbia money market funds of comparable asset size.
D. Trustees' Fee and Performance Evaluation Process
10. The Trustees' evaluation process identified 21 funds in 2006 for further review based upon their relative performance or expenses. Seventeen of these funds had been subject to review in 2004 or 2005.
E. Potential Economies of Scale
11. CMG has prepared a memo for the Trustees containing its views on the sources and sharing of potential economies of scale. CMG views economies of scale as arising at the complex level and would regard estimates of scale economies for individual funds as unreliable. CMG has not, however, identified specific sources of economies of scale nor has it provided any estimates of the magnitude of any economies of scale. In the memo, CMG also describes measures taken by the Trustees and CMG that seek to share any potential economies of scale through breakpoints in management fee schedules, expense reimbursements, fee waivers, enhanced shareholder services, fund mergers, and operational consolidation. These measures, although of significant benefit to shareholders, have not been directly linked in the memo to the existence, sources, and magnitude of economies of scale.
F. Management Fees Charged to Institutional Clients
12. CMG has provided Trustees with comparisons of mutual fund management fees and institutional fees based upon standardized fee schedules and upon actual fees. Based upon the information, institutional fees are generally lower than the Funds' management fees. This pattern is consistent with the economics of the two financial products. Data are not available, however, on actual institutional fees at other money managers. Thus, it is not possible to determine the extent to which differences between the Funds' management fees and institutional fees are consistent with those seen generally in the marketplace.
G. Revenues, Expenses, and Profits
13. The financial statements and the methodology underlying their construction generally form a sufficient basis for Trustees to evaluate the expenses and profitability of the Funds.
152
SUMMARY OF MANAGEMENT FEE EVALUATION BY
INDEPENDENT FEE CONSULTANT (continued)
IV. Recommendations
A. Performance
1. Trustees may wish to consider incorporating risk adjusted measures in their evaluation of performance. CMG has begun to prepare reports for the Trustees with risk adjustments, which could form the basis for formally including the measures in the 15(c) materials. To this end, Trustees may wish to have CMG prepare documents explaining risk adjustments and describing their advantages and disadvantages.
2. Trustees may wish to consider having CMG evaluate the sensitivity of performance rankings to the design of the universe. The preliminary analysis contained in the evaluation suggests that the method employed by Lipper, the source of performance rankings used by the Trustees, may bias performance rankings upward.
B. Economies of Scale
3. Trustees may wish to consider having CMG extend its analysis of economies of scale by examining the sources of such economies, if any. Identification of the sources may enable the Trustees and CMG to gauge their magnitude. It also may enable the Trustees and CMG to build upon past work on standardized fee schedules so that the schedules themselves are consistent with any economies of scale and their sources. Finally, an extension of the analysis may enable the Trustees and CMG to develop a framework that coordinates the use of fee waivers and expense caps with the standard fee schedules and with any economies of scale and their sources.
C. Institutional Fees
4. Trustees may wish to consider encouraging CMG to build further upon its expanded analysis of institutional fees by refining the matching of institutional accounts with mutual funds, by dating the establishment of each institutional account, and by incorporating other accounts, such as subadvisory relationships, trusts, offshore funds, and separately managed accounts into the analysis.
D. Profitability
5. Trustees may wish to consider requesting that CMG expand the reporting of revenues and expenses to include more line-item detail for management and administration, transfer agency, fund accounting, and distribution.
6. Trustees may wish to consider requesting that CMG provide a statement of its operations in the 15(c) materials.
7. Trustees may wish to consider the treatment of the revenue sharing with the Private Bank of Bank of America in their review of CMG's profitability.
Respectfully submitted,
John D. Rea
153
Appendix
Sources of Information Used in the Evaluation
The following list generally describes the sources and types of information that were used in preparing this report.
1. Performance, management fees, and expense ratios for the Funds and comparable funds from other fund complexes from Lipper and CMG. The sources of this information were CMG and Lipper;
2. CMG's expenses and profitability obtained directly from CMG;
3. Information on CMG's organizational structure;
4. Profitability of publicly traded asset managers from Lipper;
5. Interviews with CMG staff, including members of senior management, legal staff, heads of affiliates, portfolio managers, and financial personnel;
6. Documents prepared by CMG for Section 15(c) contract renewals in 2005 and 2006;
7. Academic research papers, industry publications, professional materials on mutual fund operations and profitability, and SEC releases and studies of mutual fund expenses
8. Interviews with and documents prepared by Ernst & Young LLP in its review of the Private Bank Revenue Sharing Agreement;
9. Discussions with Trustees and attendance at Board and committee meetings during which matters pertaining to the evaluation were considered.
In addition, I engaged NERA Economic Consulting ("NERA") to assist me in data management and analysis. NERA has extensive experience in the mutual fund industry that provides unique insights and special knowledge pertaining to my independent analysis of fees, performance, and profitability. I have also retained attorneys in the Washington, D.C. office of Willkie Farr & Gallagher LLP as outside counsel to advise me in connection with my evaluation.
Finally, meetings and discussions with CMG staff were informative. My participation in Board and committee meetings in which Trustees and CMG management discussed issues relating to management contracts were of great benefit to the preparation of the evaluation.
154
This page is intentionally left blank.
COLUMBIA FUNDS INSTITUTIONAL TRUST
ONE FINANCIAL CENTER BOSTON, MA 02111-2621
- INVESTMENT ADVISOR -
COLUMBIA MANAGEMENT ADVISORS, LLC
100 FEDERAL STREET
BOSTON, MASSACHUSETTS 02110-2624
- LEGAL COUNSEL -
ROPES & GRAY LLP
ONE INTERNATIONAL PLACE
BOSTON, MA 02110-2624
- TRANSFER AGENT -
COLUMBIA MANAGEMENT SERVICES, INC.
P.O. BOX 8081
BOSTON, MASSACHUSETTS 02266-8081
SHC-44/116493-0107 (03/07) 07/36502
A description of the funds' proxy voting policies and procedures is available (i) at www.columbiamanagement.com; (ii) on the Securities and Exchange Commission's website at www.sec.gov, and (iii) without charge, upon request, by calling 800-368-0346. Information regarding how the funds voted proxies relating to portfolio securities during the 12-month period ended June 30 is available from the SEC's website. Information regarding how the funds voted proxies relating to portfolio securities is also available from the funds' website.
Each fund files a complete schedule of portfolio holdings with the SEC for the first and third quarters of each fiscal year on Form N-Q. Each fund's Form N-Q is available on the SEC's website at www.sec.gov and may be reviewed and copied at the SEC's Public Reference Room in Washington, D.C. Information on the operation of the Public Reference Room may be obtained by calling 800-SEC-0330.
The funds are offered by prospectus through Columbia Management Distributors, Inc. Please consider the investment objectives, risks, charges and expenses of a mutual fund carefully before investing. Contact your Columbia Management representative or visit www.columbiamanagement.com for a prospectus, which contains this and other important information about the fund. Read it carefully before you invest.
Fund distributed by Columbia Management Distributors, Inc.
©2007 Columbia Management Distributors, Inc.
One Financial Center, Boston, MA 02111-2621
![]()
CMG STRATEGIC EQUITY FUND
A PORTFOLIO OF COLUMBIA FUNDS INSTITUTIONAL TRUST
Semiannual Report
January 31, 2007
Not FDIC
Insured
May Lose Value
No Bank Guarantee
Columbia Management Advisors, LLC ("CMA") is an SEC-registered investment advisor and indirect, wholly owned subsidiary of Bank of America Corporation and is part of Columbia Management.
Columbia Management Group, LLC ("Columbia Management") is the investment management division of Bank of America Corporation. Columbia Management entities furnish investment management services and products for institutional and individual investors. The fund is distributed by Columbia Management Distributors, Inc., member of NASD, SIPC, part of Columbia Management and an affiliate of Bank of America Corporation.
The views expressed in the fund profile reflect the current views of the portfolio managers of the fund included in this report. These views are not guarantees of future performance and involve certain risks, uncertainties and assumptions that are difficult to predict so actual outcomes and results may differ significantly from the views expressed. These views are subject to change at any time based upon economic, market or other conditions and the portfolio managers disclaim any responsibility to update such views. These views may not be relied on as investment advice and, because investment decisions for the Fund are based on numerous factors, may not be relied on as an indication of trading intent on behalf of the Fund. References to specific company securities should not be construed as a recommendation or investment advice.
Performance data quoted represents past performance and current performance may be lower or higher. Past performance is no guarantee of future results. The investment return and principal value will fluctuate so that shares, when redeemed, may be worth more or less than the original cost. Please visit www.columbiamanagement.com for daily and most recent month-end performance updates.
CMG STRATEGIC EQUITY FUND
A Portfolio of Columbia Funds Institutional Trust
FUND PROFILE
Summary
• For the six-month period ended January 31, 2007, CMG Strategic Equity Fund returned 12.41%. During the period the fund's benchmark, the S&P 500 Index1, returned 13.75%. The average return of its peer group, the Morningstar Large Blend Category, was 13.19%.2 The fund derived solid results from its consumer holdings. However, its relative performance was hurt at the margin by substandard results from the information technology, health care and energy sectors.
• The fund's positions in consumer stocks helped keep the fund's returns competitive with its benchmark and peer group. Within the consumer discretionary category, the fund enjoyed above-average returns from Bebe Stores, Inc., Yum! Brands, Inc. and Mexican housing company Desarrolladora Homex SA de CV (0.4%, 0.5% and 0.2% of net assets, respectively). Within consumer staples, the fund benefited from its holdings in Avon Products, Inc. (0.6% of net assets), Wal-Mart Stores and ConAgra Foods, Inc. Both Wal-Mart Stores and ConAgra Foods, Inc. were sold during the period.
• Most of the fund's modest performance shortfall versus its benchmark and peer group can be accounted for by stock selection within the information technology and health care sectors. The fund experienced disappointing results from companies such as Samsung Electronics Co. Ltd., Red Hat, Inc., Silicon Laboratories, Inc., and CSR PLC, none of which is included in the benchmark index. Within health care, Hospira, Inc., Omnicare and Astrazeneca experienced double-digit losses during a period when health care as a whole rose almost 10 percent. The fund took action to stem its losses—of the seven companies listed above, only Samsung Electronics Co. Ltd. and Hospira, Inc. remain in the portfolio (0.3% and 0.4% of net assets, respectively).
• The energy sector also hampered the fund's return. Although energy stocks have been market leaders over the past two years, they lagged during this particular six-month period, which virtually coincided with the decline of oil prices from the highs of summer 2006.
• Looking ahead, we plan to focus our attention on companies that can deliver stable growth without undue dependence on a maturing economic cycle. We will also continue to search for compelling growth opportunities overseas.
1 The Standard & Poor's (S&P) 500 Index tracks the performance of 500 widely held, large-capitalization US stocks. Indices are not investments, do not incur fees or expenses and are not professionally managed. It is not possible to invest directly in an index. Securities in the fund may not match those in an index.
2 ©2007 by Morningstar, Inc. All rights reserved. The information contained herein is the proprietary information of Morningstar, Inc., may not be copied or redistributed for any purpose and may only be used for noncommercial, personal purposes. The information contained herein is not represented or warranted to be accurate, correct, complete or timely. Morningstar, Inc. shall not be responsible for investment decisions, damages or other losses resulting from the use of this information. Past performance is no guarantee of future performance. Morningstar, Inc. has not granted consent for it to be considered or deemed an "expert" under the Securities Act of 1933. Morningstar Categories compare the performance of funds with similar investment objectives and strategies.
1
We appreciate your continued confidence in CMG Strategic Equity Fund.
Portfolio Management
Emil A. Gjester has managed or co-managed the fund since January 2004 and has been with the advisor or its predecessors or affiliate organizations since 1996.
Jonas Patrikson has co-managed the fund since February 2006 and has been with the advisor or its predecessors or affiliate organizations since 2004.
Michael T. Welter has co-managed the fund since July 2006 and has been with the advisor since July 2006.
Dara White has co-managed the fund since February 2006 and has been with the advisor since January 2006.
The fund's top ten holdings (as a percentage of net assets) as of January 31, 2007 were:
| (%) | |||||||
| Exxon Mobil Corp. | 2.7 | ||||||
| Citigroup, Inc. | 2.6 | ||||||
| General Electric Co. | 2.6 | ||||||
| JPMorgan Chase & Co. | 2.0 | ||||||
| Microsoft Corp. | 1.9 | ||||||
| Johnson & Johnson | 1.9 | ||||||
| Cisco Systems, Inc. | 1.6 | ||||||
| Wachovia Corp. | 1.6 | ||||||
| Procter and Gamble Co. | 1.4 | ||||||
| Google, Inc. | 1.4 | ||||||
Holdings are calculated as a percentage of net assets and are subject to change. Because the fund is actively managed, there is no guarantee the fund will continue to maintain the holdings breakdown listed. The fund's holdings and their weights within the portfolio may change as market conditions change.
Equity investments are affected by stock market fluctuations that occur in response to economic and business developments.
International investing may involve certain risks, including foreign taxation, currency fluctuations, risks associated with possible differences in financial standards and other monetary and political risks.
2
Performance data quoted represents past performance and current performance may be lower or higher. Past performance is no guarantee of future results. The investment return and principal value will fluctuate so that shares, when redeemed, may be worth more or less than the original cost. Please visit www.columbiamanagement.com for daily and most recent month-end performance updates.
Performance results reflect any voluntary waivers or reimbursement of fund expenses by the advisor or its affiliates. Absent these waivers or reimbursement arrangements, performance results would have been lower. All results shown assume reinvestment of distributions.
The table and chart do not reflect the deduction of taxes that a shareholder would pay on fund distributions or the redemption of fund shares.
Average annual total return as of January 31, 2007 (%)
| Inception | 6-month (cumulative) | 1-year | 5-year | Life | |||||||||||||||
| CMG Strategic Equity Fund 10/09/01 | 12.41 | 11.74 | 12.07 | 13.94 | |||||||||||||||
| S&P 500 Index | 13.75 | 14.51 | 6.82 | 7.85 | |||||||||||||||
Average annual total return as of December 31, 2006 (%)
| Inception | 6-month (cumulative) | 1-year | 5-year | Life | |||||||||||||||
| CMG Strategic Equity Fund 10/09/01 | 10.98 | 14.14 | 11.54 | 13.80 | |||||||||||||||
| S&P 500 Index | 12.74 | 15.80 | 6.19 | 7.67 | |||||||||||||||
Index performance is from October 9, 2001.
Growth of a $5,000,000 investment, October 9, 2001 to January 31, 2007
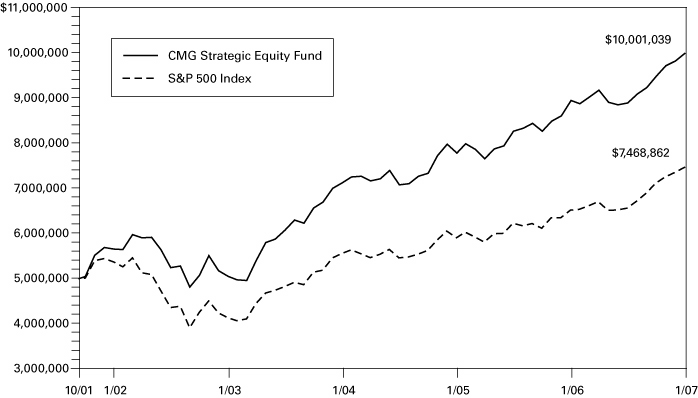
The chart above shows the growth in value of a hypothetical minimum initial $5,000,000 investment in the fund compared to the index during the period.
The Standard & Poor's (S&P) 500 Index tracks the performance of 500 widely held, large-capitalization US stocks. Indices are not investments, do not incur fees or expenses and are not professionally managed. It is not possible to invest directly in an index. Securities in the fund may not match those in an index.
3
UNDERSTANDING YOUR EXPENSES – CMG Strategic Equity Fund
As a fund shareholder, you incur two types of costs. There are transaction costs and also ongoing costs, which generally include investment advisory fees and other fund expenses. The information on this page is intended to help you understand your ongoing costs of investing in the fund and to compare these costs with the ongoing costs of investing in other mutual funds.
Analyzing your fund's expenses
To illustrate these ongoing costs, we have provided an example and calculated the expenses paid by investors during the reporting period. The information in the following table is based on an initial investment of $1,000, which is invested at the beginning of the reporting period and held for the entire period. Expense information is calculated two ways and each method provides you with different information. The amount listed in the "actual" column is calculated using the fund's actual operating expenses and total return for the period. The amount listed in the "hypothetical" column assumes that the return each year is 5% before expenses and is calculated based on the fund's actual operating expenses. You should not use the hypothetical account values and expenses to estimate either your actual account balance at the end of the period or the expenses you paid during this reporting period.
Estimating your actual expenses
To estimate the expenses that you paid over the period, first you will need your account balance at the end of the period:
1. Divide your ending account balance by $1,000. For example, if an account balance was $8,600 at the end of the period, the result would be 8.6.
2. In the section of the table below titled "Expenses paid during the period," locate the amount under "actual." Multiply this number by the result from step 1. Your answer is an estimate of the expenses you paid on your account during the period.
August 1, 2006 — January 31, 2007
| Account value at the beginning of the period ($) | Account value at the end of the period ($) | Expenses paid during the period ($) | Fund's annualized expense ratio (%) | ||||||||||||||||||||||||
| Actual | Hypothetical | Actual | Hypothetical | Actual | Hypothetical | Actual | |||||||||||||||||||||
| 1,000.00 | 1,000.00 | 1,124.11 | 1,023.19 | 2.14 | 2.04 | 0.40 | |||||||||||||||||||||
Expenses paid during the period are equal to the annualized expense ratio of 0.40%, multiplied by the average account value over the period, then multiplied by the number of days in the fund's most recent fiscal half-year and divided by 365.
Had the investment advisor and/or any of its affiliates not waived or reimbursed a portion of expenses, account value at end of the period would have been reduced.
It is important to note that the expense amounts shown in the table are meant to highlight only ongoing costs of investing in the fund and do not reflect any transaction costs, such as sales charges, redemption or exchange fees. Therefore, the hypothetical examples provided may not help you determine the relative total costs of owning shares of different funds. If these transaction costs were included, your costs would have been higher.
Compare with other funds
Since all mutual funds are required to include the same hypothetical calculations about expenses in shareholder reports, you can use this information to compare the ongoing cost of investing in the fund with other funds. To do so, compare the 5% hypothetical example with the 5% hypothetical examples that appear in the shareholder reports of other funds. As you compare hypothetical examples of other funds, it is important to note that hypothetical examples are meant to highlight the continuing costs of investing in a fund and do not reflect any transaction costs, such as sales charges or redemption or exchange fees.
4
CMG STRATEGIC EQUITY FUND
A Portfolio of Columbia Funds Institutional Trust
FINANCIAL HIGHLIGHTS
(For a Fund Share Outstanding Throughout Each Period)
| (Unaudited) Six Months Ended January 31, | Year Ended July 31, | Period Ended July 31, | Year Ended October 31, | Period Ended October 31, | |||||||||||||||||||||||||||
| 2007 | 2006 | 2005 | 2004 | 2003 (a) | 2002 | 2001 (b) | |||||||||||||||||||||||||
| Net asset value, beginning of period | $ | 3.13 | $ | 15.22 | $ | 13.80 | $ | 12.06 | $ | 10.14 | $ | 10.10 | $ | 10.00 | |||||||||||||||||
| Income from investment operations: | |||||||||||||||||||||||||||||||
| Net investment income | 0.02 | (c) | 0.14 | (c) | 0.19 | (c)(d) | 0.12 | (c) | 0.10 | (c) | 0.11 | (c) | - | (e) | |||||||||||||||||
| Net realized and unrealized gain (loss) on investments and foreign currency | 0.36 | 0.82 | 2.09 | 1.87 | 1.88 | (0.05 | ) | 0.10 | |||||||||||||||||||||||
| Total from investment operations | 0.38 | 0.96 | 2.28 | 1.99 | 1.98 | 0.06 | 0.10 | ||||||||||||||||||||||||
| Less distributions declared to shareholders: | |||||||||||||||||||||||||||||||
| From net investment income | (0.03 | ) | (0.57 | ) | (0.14 | ) | (0.09 | ) | (0.06 | ) | (0.02 | ) | - | ||||||||||||||||||
| From net realized gains | (0.59 | ) | (12.48 | )(f) | (0.72 | ) | (0.16 | ) | - | - | - | ||||||||||||||||||||
| Total distributions declared to shareholders | (0.62 | ) | (13.05 | ) | (0.86 | ) | (0.25 | ) | (0.06 | ) | (0.02 | ) | - | ||||||||||||||||||
| Capital contributions | - | (e) | - | - | - | - | - | - | |||||||||||||||||||||||
| Net asset value, end of period | $ | 2.89 | $ | 3.13 | $ | 15.22 | $ | 13.80 | $ | 12.06 | $ | 10.14 | $ | 10.10 | |||||||||||||||||
| Total return (g)(h) | 12.41 | %(j) | 7.58 | %(i) | 16.77 | % | 16.58 | % | 19.66 | %(j) | 0.53 | % | 1.00 | %(j) | |||||||||||||||||
| Ratios/Supplemental data: | |||||||||||||||||||||||||||||||
| Net assets, end of period (000's) | $ | 80,225 | $ | 120,541 | $ | 755,860 | $ | 618,714 | $ | 370,620 | $ | 188,179 | $ | 36,942 | |||||||||||||||||
| Ratio of net expenses to average net assets (k) | 0.40 | %(l) | 0.40 | % | 0.40 | % | 0.40 | % | 0.40 | %(l) | 0.40 | % | 0.40 | %(l) | |||||||||||||||||
| Ratio of interest expense to average net assets | - | (1) (m) | - | - | - | - | - | - | |||||||||||||||||||||||
| Ratio of net investment income to average net assets (k) | 1.28 | %(l) | 1.09 | % | 1.31 | % | 0.88 | % | 1.22 | %(l) | 1.01 | % | 0.04 | %(l) | |||||||||||||||||
| Waiver/reimbursement | �� | 0.21 | %(l) | 0.07 | % | 0.03 | % | 0.05 | % | 0.05 | %(l) | 0.07 | % | 0.80 | %(l) | ||||||||||||||||
| Portfolio turnover rate | 64 | %(j) | 47 | % | 64 | % | 81 | % | 78 | %(j) | 172 | % | 14 | %(j) | |||||||||||||||||
(a) The Fund changed its fiscal year end from October 31 to July 31.
(b) The Fund commenced investment operations on October 9, 2001. Per share data, total return and portfolio turnover rate reflect activity from that date.
(c) Per share data was calculated using average shares outstanding during the period.
(d) Net investment income per share reflects a special dividend. The effect of this dividend amounted to $0.02 per share.
(e) Rounds to less than $0.01 per share.
(f) Capital gain distributions were declared after significant shareholder redemptions reduced the size of the Fund.
(g) Total return at net asset value assuming all distributions reinvested.
(h) Had the investment advisor and/or any of its affiliates not waived or reimbursed a portion of expenses, total return would have been reduced.
(i) Total return includes a voluntary reimbursement by the investment advisor for a realized investment loss due to a trading error. This reimbursement had an impact of less than 0.01% on the Fund's total return.
(j) Not annualized.
(k) The benefits derived from custody credits had an impact of less than 0.01%.
(l) Annualized.
(m) Rounds to less than 0.01%.
See Accompanying Notes to Financial Statements.
5
CMG STRATEGIC EQUITY FUND
A Portfolio of Columbia Funds Institutional Trust
SCHEDULE OF INVESTMENTS
January 31, 2007 (Unaudited)
| Shares | Value | ||||||||||
| Common Stocks (98.9%) | |||||||||||
| Consumer Discretionary (10.8%) | |||||||||||
| Hotels, Restaurants & Leisure (0.9%) | |||||||||||
| Starbucks Corp. (a) | 11,070 | $ | 386,786 | ||||||||
| Yum! Brands, Inc. | 6,220 | 373,262 | |||||||||
| 760,048 | |||||||||||
| Household Durables (0.7%) | |||||||||||
| Centex Corp. | 2,980 | 159,996 | |||||||||
| Cyrela Brazil Realty SA | 25,800 | 238,681 | |||||||||
| Desarrolladora Homex SA de CV, ADR (a) | 2,650 | 157,569 | |||||||||
| 556,246 | |||||||||||
| Internet & Catalog Retail (0.4%) | |||||||||||
| Expedia, Inc. (a) | 14,170 | 303,947 | |||||||||
| Media (3.3%) | |||||||||||
| Comcast Corp., Class A (a) | 18,010 | 782,714 | |||||||||
| Liberty Global, Inc., Class A (a) | 6,840 | 205,610 | |||||||||
| NET Servicos de Comunicacao SA, ADR (a) | 32,000 | 388,480 | |||||||||
| News Corp., Class A | 17,828 | 414,501 | |||||||||
| Reed Elsevier PLC, ADR | 3,340 | 153,106 | |||||||||
| Time Warner, Inc. | 34,294 | 750,010 | |||||||||
| 2,694,421 | |||||||||||
| Multiline Retail (2.3%) | |||||||||||
| Federated Department Stores, Inc. | 19,036 | 789,804 | |||||||||
| Kohl's Corp. (a) | 6,290 | 446,024 | |||||||||
| Target Corp. | 9,460 | 580,465 | |||||||||
| 1,816,293 | |||||||||||
| Specialty Retail (1.9%) | |||||||||||
| Bebe Stores, Inc. | 15,050 | 278,726 | |||||||||
| Bed Bath & Beyond, Inc. (a) | 10,710 | 451,855 | |||||||||
| Best Buy Co., Inc. | 8,040 | 405,216 | |||||||||
| Lowe's Companies, Inc. | 10,790 | 363,731 | |||||||||
| 1,499,528 | |||||||||||
| Textiles, Apparel & Luxury Goods (1.3%) | |||||||||||
| LVMH Moet Hennessy Louis Vuitton SA | 3,420 | 360,668 | |||||||||
| NIKE, Inc., Class B | 6,950 | 686,729 | |||||||||
| 1,047,397 | |||||||||||
| 8,677,880 | |||||||||||
See Accompanying Notes to Financial Statements.
6
CMG STRATEGIC EQUITY FUND
A Portfolio of Columbia Funds Institutional Trust
SCHEDULE OF INVESTMENTS
| Shares | Value | ||||||||||
| Common Stocks (continued) | |||||||||||
| Consumer Staples (8.9%) | |||||||||||
| Beverages (2.5%) | |||||||||||
| C&C Group PLC | 8,100 | $ | 119,295 | ||||||||
| Coca-Cola Co. | 18,880 | 903,974 | |||||||||
| Fomento Economico Mexicano SA de CV, ADR | 3,370 | 404,636 | |||||||||
| PepsiCo, Inc. | 9,190 | 599,556 | |||||||||
| 2,027,461 | |||||||||||
| Food & Staples Retailing (0.6%) | |||||||||||
| Kroger Co. | 13,140 | 336,384 | |||||||||
| Walgreen Co. | 3,480 | 157,644 | |||||||||
| 494,028 | |||||||||||
| Food Products (3.2%) | |||||||||||
| Archer-Daniels-Midland Co. | 6,230 | 199,360 | |||||||||
| General Mills, Inc. | 5,510 | 315,392 | |||||||||
| Hershey Co. | 16,480 | 841,139 | |||||||||
| Nestle SA, Registered Shares | 1,900 | 697,100 | |||||||||
| Wm. Wrigley Jr. Co. | 10,205 | 525,762 | |||||||||
| 2,578,753 | |||||||||||
| Household Products (2.0%) | |||||||||||
| Colgate-Palmolive Co. | 6,550 | 447,365 | |||||||||
| Procter & Gamble Co. | 17,120 | 1,110,574 | |||||||||
| 1,557,939 | |||||||||||
| Personal Products (0.6%) | |||||||||||
| Avon Products, Inc. | 13,140 | 451,885 | |||||||||
| 7,110,066 | |||||||||||
| Energy (9.7%) | |||||||||||
| Energy Equipment & Services (3.0%) | |||||||||||
| Cameron International Corp. (a) | 3,910 | 205,275 | |||||||||
| Core Laboratories NV (a) | 1,910 | 157,384 | |||||||||
| Dresser-Rand Group, Inc. (a) | 8,270 | 214,689 | |||||||||
| Halliburton Co. | 9,890 | 292,151 | |||||||||
| Nabors Industries Ltd. (a) | 3,750 | 113,550 | |||||||||
| National-Oilwell Varco, Inc. (a) | 2,570 | 155,845 | |||||||||
| Noble Corp. | 4,590 | 344,020 | |||||||||
| Schlumberger Ltd. | 6,060 | 384,749 | |||||||||
| TGS Nopec Geophysical Co., ASA (a) | 12,830 | 262,395 | |||||||||
| Transocean, Inc. (a) | 4,150 | 321,086 | |||||||||
| 2,451,144 | |||||||||||
See Accompanying Notes to Financial Statements.
7
CMG STRATEGIC EQUITY FUND
A Portfolio of Columbia Funds Institutional Trust
SCHEDULE OF INVESTMENTS
| Shares | Value | ||||||||||
| Common Stocks (continued) | |||||||||||
| Oil, Gas & Consumable Fuels (6.7%) | |||||||||||
| Cameco Corp. | 4,000 | $ | 152,520 | ||||||||
| Chesapeake Energy Corp. | 10,830 | 320,676 | |||||||||
| Chevron Corp. | 4,890 | 356,383 | |||||||||
| ConocoPhillips | 8,840 | 587,065 | |||||||||
| Exxon Mobil Corp. | 29,320 | 2,172,612 | |||||||||
| Hess Corp. | 7,140 | 385,489 | |||||||||
| Newfield Exploration Co. (a) | 3,420 | 146,410 | |||||||||
| Peabody Energy Corp. | 4,290 | 175,161 | |||||||||
| Petroplus Holdings AG (a) | 3,039 | 194,267 | |||||||||
| Southwestern Energy Co. (a) | 6,380 | 245,375 | |||||||||
| USEC, Inc. (a) | 11,980 | 162,449 | |||||||||
| Valero Energy Corp. | 8,630 | 468,436 | |||||||||
| 5,366,843 | |||||||||||
| 7,817,987 | |||||||||||
| Financials (21.5%) | |||||||||||
| Capital Markets (3.6%) | |||||||||||
| Bank of New York Co., Inc. | 14,940 | 597,749 | |||||||||
| Lazard Ltd., Class A | 7,400 | 375,624 | |||||||||
| Legg Mason, Inc. | 3,960 | 415,206 | |||||||||
| Merrill Lynch & Co., Inc. | 9,580 | 896,305 | |||||||||
| Nomura Holdings, Inc., ADR | 14,320 | 291,985 | |||||||||
| Waddell & Reed Financial, Inc., Class A | 11,280 | 289,558 | |||||||||
| 2,866,427 | |||||||||||
| Commercial Banks (4.4%) | |||||||||||
| Allied Irish Banks PLC, ADR | 5,130 | 297,899 | |||||||||
| Banco Bradesco SA, ADR | 5,670 | 230,429 | |||||||||
| HSBC Holdings PLC, ADR | 2,600 | 238,758 | |||||||||
| ICICI Bank Ltd., ADR | 3,600 | 158,940 | |||||||||
| Raiffeisen International Bank Holding AG | 570 | 87,317 | |||||||||
| SunTrust Banks, Inc. | 5,450 | 452,895 | |||||||||
| U.S. Bancorp | 23,200 | 825,920 | |||||||||
| Wachovia Corp. | 22,210 | 1,254,865 | |||||||||
| 3,547,023 | |||||||||||
| Diversified Financial Services (5.3%) | |||||||||||
| CIT Group, Inc. | 10,320 | 608,467 | |||||||||
| Citigroup, Inc. | 38,503 | 2,122,670 | |||||||||
| JPMorgan Chase & Co. | 30,876 | 1,572,515 | |||||||||
| 4,303,652 | |||||||||||
| Insurance (5.9%) | |||||||||||
| ACE Ltd. | 9,120 | 526,954 | |||||||||
| American International Group, Inc. | 8,934 | 611,532 | |||||||||
| Aon Corp. | 11,130 | 399,122 | |||||||||
See Accompanying Notes to Financial Statements.
8
CMG STRATEGIC EQUITY FUND
A Portfolio of Columbia Funds Institutional Trust
SCHEDULE OF INVESTMENTS
| Shares | Value | ||||||||||
| Common Stocks (continued) | |||||||||||
| Insurance (continued) | |||||||||||
| Axis Capital Holdings Ltd. | 14,970 | $ | 493,261 | ||||||||
| Berkshire Hathaway, Inc., Class B (a) | 180 | 660,123 | |||||||||
| Hartford Financial Services Group, Inc. | 6,500 | 616,915 | |||||||||
| National Financial Partners Corp. | 5,080 | 249,428 | |||||||||
| Platinum Underwriters Holdings Ltd. | 12,910 | 385,364 | |||||||||
| Prudential Financial, Inc. | 9,030 | 804,844 | |||||||||
| 4,747,543 | |||||||||||
| Real Estate Investment Trusts (REITs) (0.8%) | |||||||||||
| CapitalSource, Inc. | 15,730 | 437,137 | |||||||||
| Digital Realty Trust, Inc. | 5,520 | 198,389 | |||||||||
| 635,526 | |||||||||||
| Thrifts & Mortgage Finance (1.5%) | |||||||||||
| Freddie Mac | 5,230 | 339,584 | |||||||||
| Washington Mutual, Inc. | 19,070 | 850,331 | |||||||||
| 1,189,915 | |||||||||||
| 17,290,086 | |||||||||||
| Health Care (14.5%) | |||||||||||
| Biotechnology (2.6%) | |||||||||||
| Amgen, Inc. (a) | 7,230 | 508,775 | |||||||||
| Applera Corp. - Celera Group (a) | 8,730 | 138,458 | |||||||||
| Genentech, Inc. (a) | 4,110 | 359,091 | |||||||||
| Genzyme Corp. (a) | 3,900 | 256,347 | |||||||||
| Gilead Sciences, Inc. (a) | 5,210 | 335,107 | |||||||||
| Grifols SA (a) | 16,630 | 254,678 | |||||||||
| Keryx Biopharmaceuticals, Inc. (a) | 5,360 | 61,158 | |||||||||
| Onyx Pharmaceuticals, Inc. (a) | 6,510 | 77,143 | |||||||||
| Vertex Pharmaceuticals, Inc. (a) | 2,730 | 96,505 | |||||||||
| 2,087,262 | |||||||||||
| Health Care Equipment & Supplies (3.8%) | |||||||||||
| Align Technology, Inc. (a) | 13,450 | 222,597 | |||||||||
| Baxter International, Inc. | 10,050 | 499,083 | |||||||||
| BioLase Technology, Inc. (a) | 10,540 | 90,644 | |||||||||
| Conceptus, Inc. (a) | 7,540 | 174,853 | |||||||||
| Hospira, Inc. (a) | 8,320 | 306,010 | |||||||||
| Medtronic, Inc. | 4,870 | 260,301 | |||||||||
| Mindray Medical International Ltd., ADR (a) | 6,185 | 150,296 | |||||||||
| Sirona Dental Systems, Inc. (a) | 2,960 | 126,747 | |||||||||
| St. Jude Medical, Inc. (a) | 3,020 | 129,135 | |||||||||
| Thoratec Corp. (a) | 9,680 | 174,337 | |||||||||
| Varian Medical Systems, Inc. (a) | 8,100 | 373,653 | |||||||||
See Accompanying Notes to Financial Statements.
9
CMG STRATEGIC EQUITY FUND
A Portfolio of Columbia Funds Institutional Trust
SCHEDULE OF INVESTMENTS
| Shares | Value | ||||||||||
| Common Stocks (continued) | |||||||||||
| Health Care Equipment & Supplies (continued) | |||||||||||
| Volcano Corp. (a) | 7,180 | $ | 138,861 | ||||||||
| Zimmer Holdings, Inc. (a) | 5,040 | 424,469 | |||||||||
| 3,070,986 | |||||||||||
| Health Care Providers & Services (1.4%) | |||||||||||
| Animal Health International, Inc. (a) | 7,003 | 87,187 | |||||||||
| McKesson Corp. | 5,880 | 327,810 | |||||||||
| Medco Health Solutions, Inc. (a) | 4,700 | 278,287 | |||||||||
| Sierra Health Services, Inc. (a) | 7,800 | 313,560 | |||||||||
| VCA Antech, Inc. (a) | 3,710 | 124,730 | |||||||||
| 1,131,574 | |||||||||||
| Health Care Technology (0.2%) | |||||||||||
| IMS Health, Inc. | 5,930 | 171,140 | |||||||||
| Life Sciences Tools & Services (1.5%) | |||||||||||
| Applera Corp. - Applied Biosystems Group | 5,660 | 196,742 | |||||||||
| Qiagen N.V. (a) | 15,060 | 260,086 | |||||||||
| Thermo Fisher Scientific, Inc. (a) | 11,340 | 542,619 | |||||||||
| Waters Corp. (a) | 2,910 | 164,968 | |||||||||
| 1,164,415 | |||||||||||
| Pharmaceuticals (5.0%) | |||||||||||
| Abbott Laboratories | 11,820 | 626,460 | |||||||||
| Johnson & Johnson | 22,580 | 1,508,344 | |||||||||
| Novartis AG, ADR | 13,900 | 801,891 | |||||||||
| Novo-Nordisk A/S, Class B | 2,860 | 246,177 | |||||||||
| Pfizer, Inc. | 30,130 | 790,611 | |||||||||
| 3,973,483 | |||||||||||
| 11,598,860 | |||||||||||
| Industrials (9.7%) | |||||||||||
| Aerospace & Defense (1.3%) | |||||||||||
| Goodrich Corp. | 9,570 | 469,121 | |||||||||
| United Technologies Corp. | 7,990 | 543,480 | |||||||||
| 1,012,601 | |||||||||||
| Air Freight & Logistics (0.8%) | |||||||||||
| United Parcel Service, Inc., Class B | 8,730 | 631,004 | |||||||||
See Accompanying Notes to Financial Statements.
10
CMG STRATEGIC EQUITY FUND
A Portfolio of Columbia Funds Institutional Trust
SCHEDULE OF INVESTMENTS
| Shares | Value | ||||||||||
| Common Stocks (continued) | |||||||||||
| Airlines (0.9%) | |||||||||||
| Gol Linhas Aereas Inteligentes SA, ADR | 13,500 | $ | 406,485 | ||||||||
| UAL Corp. (a) | 7,720 | 333,504 | |||||||||
| 739,989 | |||||||||||
| Building Products (0.4%) | |||||||||||
| Assa Abloy AB, Class B | 15,940 | 350,018 | |||||||||
| Commercial Services & Supplies (0.6%) | |||||||||||
| Monster Worldwide, Inc. (a) | 9,580 | 473,348 | |||||||||
| Industrial Conglomerates (4.2%) | |||||||||||
| 3M Co. | 12,470 | 926,521 | |||||||||
| General Electric Co. | 57,640 | 2,077,922 | |||||||||
| Siemens AG, ADR | 3,000 | 332,190 | |||||||||
| 3,336,633 | |||||||||||
| Machinery (1.5%) | |||||||||||
| Caterpillar, Inc. | 1,880 | 120,452 | |||||||||
| Flowserve Corp. (a) | 2,260 | 119,938 | |||||||||
| Gardner Denver, Inc. (a) | 4,390 | 169,234 | |||||||||
| Illinois Tool Works, Inc. | 7,430 | 378,856 | |||||||||
| Joy Global, Inc. | 7,740 | 359,678 | |||||||||
| Mueller Water Products, Inc., Class B | 5,800 | 78,764 | |||||||||
| 1,226,922 | |||||||||||
| 7,770,515 | |||||||||||
| Information Technology (14.9%) | |||||||||||
| Communications Equipment (3.8%) | |||||||||||
| Cisco Systems, Inc. (a) | 47,590 | 1,265,418 | |||||||||
| Corning, Inc. (a) | 18,210 | 379,496 | |||||||||
| Nokia Oyj, ADR | 39,010 | 862,121 | |||||||||
| QUALCOMM, Inc. | 13,410 | 505,021 | |||||||||
| 3,012,056 | |||||||||||
| Computers & Peripherals (3.3%) | |||||||||||
| Apple, Inc. (a) | 3,830 | 328,346 | |||||||||
| Dell, Inc. (a) | 23,340 | 565,995 | |||||||||
| Hewlett-Packard Co. | 20,190 | 873,823 | |||||||||
| International Business Machines Corp. | 8,760 | 868,554 | |||||||||
| 2,636,718 | |||||||||||
See Accompanying Notes to Financial Statements.
11
CMG STRATEGIC EQUITY FUND
A Portfolio of Columbia Funds Institutional Trust
SCHEDULE OF INVESTMENTS
| Shares | Value | ||||||||||
| Common Stocks (continued) | |||||||||||
| Electronic Equipment & Instruments (0.4%) | |||||||||||
| AU Optronics Corp., ADR | 11,910 | $ | 159,951 | ||||||||
| LG.Philips LCD Co., Ltd., ADR (a) | 10,760 | 150,748 | |||||||||
| 310,699 | |||||||||||
| Internet Software & Services (1.5%) | |||||||||||
| Equinix, Inc. (a) | 1,070 | 89,955 | |||||||||
| Google, Inc., Class A (a) | 2,200 | 1,102,860 | |||||||||
| 1,192,815 | |||||||||||
| IT Services (1.5%) | |||||||||||
| Computer Sciences Corp. (a) | 7,300 | 382,958 | |||||||||
| First Data Corp. | 17,020 | 423,117 | |||||||||
| Global Payments, Inc. | 5,670 | 214,099 | |||||||||
| Western Union Co. | 8,410 | 187,880 | |||||||||
| 1,208,054 | |||||||||||
| Semiconductors & Semiconductor Equipment (1.9%) | |||||||||||
| ASML Holding N.V., N.Y. Registered Shares (a) | 4,550 | 116,116 | |||||||||
| Intel Corp. | 31,090 | 651,646 | |||||||||
| Intersil Corp., Class A | 8,150 | 192,014 | |||||||||
| Lam Research Corp. (a) | 3,280 | 150,257 | |||||||||
| Mattson Technology, Inc. (a) | 12,770 | 111,227 | |||||||||
| Samsung Electronics Co. Ltd., GDR (b) | 760 | 230,090 | |||||||||
| Volterra Semiconductor Corp. (a) | 8,140 | 107,285 | |||||||||
| 1,558,635 | |||||||||||
| Software (2.5%) | |||||||||||
| Microsoft Corp. | 49,940 | 1,541,149 | |||||||||
| Oracle Corp. (a) | 28,040 | 481,166 | |||||||||
| 2,022,315 | |||||||||||
| 11,941,292 | |||||||||||
| Materials (2.9%) | |||||||||||
| Chemicals (0.7%) | |||||||||||
| Lyondell Chemical Co. | 16,170 | 511,295 | |||||||||
| Metals & Mining (2.2%) | |||||||||||
| Arcelor Mittal, Class A | 7,830 | 372,473 | |||||||||
| Companhia Vale do Rio Doce, ADR | 12,760 | 432,947 | |||||||||
| Freeport-McMoRan Copper & Gold, Inc., Class B | 9,700 | 557,847 | |||||||||
| Newmont Mining Corp. | 9,550 | 430,705 | |||||||||
| 1,793,972 | |||||||||||
| 2,305,267 | |||||||||||
See Accompanying Notes to Financial Statements.
12
CMG STRATEGIC EQUITY FUND
A Portfolio of Columbia Funds Institutional Trust
SCHEDULE OF INVESTMENTS
| Shares | Value | ||||||||||
| Common Stocks (continued) | |||||||||||
| Telecommunication Services (3.0%) | |||||||||||
| Diversified Telecommunication Services (2.2%) | |||||||||||
| AT&T, Inc. | 25,194 | $ | 948,050 | ||||||||
| Chunghwa Telecom Co., Ltd., ADR | 9,614 | 199,106 | |||||||||
| Tele2 AB, Class B | 21,880 | 325,955 | |||||||||
| Telekomunikasi Indonesia, ADR | 7,850 | 329,386 | |||||||||
| 1,802,497 | |||||||||||
| Wireless Telecommunication Services (0.8%) | |||||||||||
| American Tower Corp., Class A (a) | 7,790 | 310,276 | |||||||||
| Philippine Long Distance Telephone Co., ADR | 3,060 | 161,017 | |||||||||
| Syniverse Holdings, Inc. (a) | 11,680 | 171,462 | |||||||||
| 642,755 | |||||||||||
| 2,445,252 | |||||||||||
| Utilities (3.0%) | |||||||||||
| Electric Utilities (1.9%) | |||||||||||
| Edison International | 6,300 | 283,374 | |||||||||
| Entergy Corp. | 4,010 | 372,328 | |||||||||
| FPL Group, Inc. | 9,420 | 533,643 | |||||||||
| PPL Corp. | 8,110 | 288,716 | |||||||||
| 1,478,061 | |||||||||||
| Multi-Utilities (1.1%) | |||||||||||
| PG&E Corp. | 9,260 | 432,257 | |||||||||
| Public Service Enterprise Group, Inc. | 7,130 | 477,924 | |||||||||
| 910,181 | |||||||||||
| 2,388,242 | |||||||||||
| Total Common Stocks (Cost of $64,165,586) | 79,345,447 | ||||||||||
See Accompanying Notes to Financial Statements.
13
CMG STRATEGIC EQUITY FUND
A Portfolio of Columbia Funds Institutional Trust
SCHEDULE OF INVESTMENTS
| Par | Value | ||||||||||
| Short-Term Obligation (0.8%) | |||||||||||
| Repurchase agreement with Fixed Income Clearing Corp., dated 01/31/07, due 02/01/07 at 5.160%, collateralized by a U.S. Treasury Bond maturing 08/15/11, market value of $638,600 (repurchase proceeds $625,090). | $ | 625,000 | $ | 625,000 | |||||||
| Total Short-Term Obligation (Cost of $625,000) | 625,000 | ||||||||||
| Total Investments (99.7%) (Cost of $64,790,586) (c) | 79,970,447 | ||||||||||
| Other Assets & Liabilities, Net (0.3%) | 254,810 | ||||||||||
| Net Assets (100.0%) | $ | 80,225,257 | |||||||||
| Notes to Investment Portfolio: | |||||||||||
(a) Non-income producing security.
(b) Security exempt from registration pursuant to Rule 144A under the Securities Act of 1933. This security may be resold in transactions exempt from registration, normally to qualified institutional buyers. At January 31, 2007, the value of this security, which is not illiquid, represents 0.3% of net assets.
(c) Cost for federal income tax purposes is $64,790,586.
At January 31, 2007, the Fund held investments in the following sectors:
| Sector | % of Net Assets | ||||||
| Financials | 21.5 | % | |||||
| Information Technology | 14.9 | ||||||
| Health Care | 14.5 | ||||||
| Consumer Discretionary | 10.8 | ||||||
| Energy | 9.7 | ||||||
| Industrials | 9.7 | ||||||
| Consumer Staples | 8.9 | ||||||
| Telecommunication Services | 3.0 | ||||||
| Utilities | 3.0 | ||||||
| Materials | 2.9 | ||||||
| 98.9 | |||||||
| Short-Term Obligation | 0.8 | ||||||
| Other Assets & Liabilities, Net | 0.3 | ||||||
| 100.0 | % | ||||||
| Acronym | Name | ||||||
| ADR | American Depositary Receipt | ||||||
| GDR | Global Depositary Receipt | ||||||
See Accompanying Notes to Financial Statements.
14
CMG STRATEGIC EQUITY FUND
A Portfolio of Columbia Funds Institutional Trust
STATEMENT OF ASSETS AND LIABILITIES
January 31, 2007 (Unaudited)
| ASSETS: | |||||||
| Investments, at identified cost | $ | 64,790,586 | |||||
| Investments, at value | $ | 79,970,447 | |||||
| Cash | 880 | ||||||
| Receivable for: | |||||||
| Investments sold | 1,590,788 | ||||||
| Fund shares sold | 1,629 | ||||||
| Interest | 89 | ||||||
| Dividends | 55,903 | ||||||
| Foreign tax reclaims | 5,942 | ||||||
| Expense reimbursement due from Investment Advisor | 17,555 | ||||||
| Deferred Trustees' compensation plan | 13,817 | ||||||
| Total Assets | 81,657,050 | ||||||
| LIABILITIES: | |||||||
| Payable for: | |||||||
| Investments purchased | 1,259,730 | ||||||
| Fund shares repurchased | 75,232 | ||||||
| Investment advisory fee | 27,488 | ||||||
| Transfer agent fee | 46 | ||||||
| Trustees' fees | 6,929 | ||||||
| Audit fee | 19,443 | ||||||
| Custody fee | 825 | ||||||
| Legal fee | 12,495 | ||||||
| Chief compliance officer expenses | 1,515 | ||||||
| Deferred Trustees' compensation plan | 13,817 | ||||||
| Other liabilities | 14,273 | ||||||
| Total Liabilities | 1,431,793 | ||||||
| NET ASSETS | $ | 80,225,257 | |||||
| NET ASSETS consist of: | |||||||
| Paid-in capital | $ | 56,653,884 | |||||
| Undistributed net investment income | 16,880 | ||||||
| Accumulated net realized gain | 8,374,398 | ||||||
| Net unrealized appreciation on: | |||||||
| Investments | 15,179,861 | ||||||
| Foreign currency translations | 234 | ||||||
| NET ASSETS | $ | 80,225,257 | |||||
| Shares of capital stock outstanding | 27,786,372 | ||||||
| Net asset value, offering and redemption price per share | $ | 2.89 | |||||
See Accompanying Notes to Financial Statements.
15
CMG STRATEGIC EQUITY FUND
A Portfolio of Columbia Funds Institutional Trust
STATEMENT OF OPERATIONS
| For the Six Months Ended January 31, 2007 (Unaudited) | |||||||
| NET INVESTMENT INCOME: | |||||||
| Income: | |||||||
| Dividends | $ | 744,524 | |||||
| Interest | 109,929 | ||||||
| Foreign withholding tax | (10,426 | ) | |||||
| Total Investment Income | 844,027 | ||||||
| Expenses: | |||||||
| Investment advisory fee | 201,173 | ||||||
| Transfer agent fee | 121 | ||||||
| Trustees' fees | 14,932 | ||||||
| Custody fee | 12,320 | ||||||
| Audit fee | 19,686 | ||||||
| Chief compliance officer expenses | 2,518 | ||||||
| Other expenses | 57,525 | ||||||
| Total Operating Expenses | 308,275 | ||||||
| Interest expense | 1,453 | ||||||
| Total Expenses | 309,728 | ||||||
| Fees and expenses waived or reimbursed by Investment Advisor | (106,880 | ) | |||||
| Custody earnings credit | (222 | ) | |||||
| Net Expenses | 202,626 | ||||||
| Net Investment Income | 641,401 | ||||||
| NET REALIZED AND UNREALIZED GAIN (LOSS) ON INVESTMENTS AND FOREIGN CURRENCY: | |||||||
| Net realized gain (loss) on: | |||||||
| Investments | 18,721,873 | ||||||
| Foreign currency transactions | (17,618 | ) | |||||
| Net realized gain | 18,704,255 | ||||||
| Net change in unrealized depreciation on: | |||||||
| Investments | (7,626,080 | ) | |||||
| Foreign currency translations | (172 | ) | |||||
| Net change in unrealized depreciation | (7,626,252 | ) | |||||
| Net Gain | 11,078,003 | ||||||
| NET INCREASE IN NET ASSSETS FROM OPERATIONS | $ | 11,719,404 | |||||
See Accompanying Notes to Financial Statements.
16
CMG STRATEGIC EQUITY FUND
A Portfolio of Columbia Funds Institutional Trust
STATEMENT OF CHANGES IN NET ASSETS
| (Unaudited) Six Months Ended January 31, | Year Ended July 31, | ||||||||||
| Increase (Decrease) in Net Assets: | 2007 | 2006 | |||||||||
| Operations: | |||||||||||
| Net investment income | $ | 641,401 | $ | 3,502,391 | |||||||
| Net realized gain on investments and foreign currency transactions | 18,704,255 | 139,034,783 | |||||||||
| Net change in unrealized depreciation on investments and foreign currency translations | (7,626,252 | ) | (122,205,133 | ) | |||||||
| Net increase from operations | 11,719,404 | 20,332,041 | |||||||||
| Distributions declared to shareholders: | |||||||||||
| From net investment income | (611,244 | ) | (8,532,614 | ) | |||||||
| From net realized gains | (14,482,350 | ) | (165,009,285 | ) | |||||||
| Total distributions declared to shareholders | (15,093,594 | ) | (173,541,899 | ) | |||||||
| Share Transactions: | |||||||||||
| Subscriptions | 1,631,070 | 51,206,578 | |||||||||
| Distributions reinvested | 14,633,613 | 158,121,863 | |||||||||
| Redemptions | (53,208,497 | ) | (691,437,711 | ) | |||||||
| Net decrease from share transactions | (36,943,814 | ) | (482,109,270 | ) | |||||||
| Capital contributions | 2,641 | - | |||||||||
| Net decrease in net assets | (40,315,363 | ) | (635,319,128 | ) | |||||||
| NET ASSETS: | |||||||||||
| Beginning of period | 120,540,620 | 755,859,748 | |||||||||
| End of period | $ | 80,225,257 | $ | 120,540,620 | |||||||
| Undistributed (overdistributed) net investment income | $ | 16,880 | $ | (13,277 | ) | ||||||
| Changes in Shares: | |||||||||||
| Subscriptions | 509,279 | 5,650,804 | |||||||||
| Issued for distributions reinvested | 5,134,601 | 36,117,727 | |||||||||
| Redemptions | (16,339,098 | ) | (52,950,990 | ) | |||||||
| Net decrease | (10,695,218 | ) | (11,182,459 | ) | |||||||
See Accompanying Notes to Financial Statements.
17
CMG STRATEGIC EQUITY FUND
A Portfolio of Columbia Funds Institutional Trust
NOTES TO FINANCIAL STATEMENTS
January 31, 2007 (Unaudited)
Note 1. Organization
CMG Strategic Equity Fund (the "Fund"), a series of Columbia Funds Institutional Trust (the "Trust"), is a diversified portfolio. The Trust is a Massachusetts business trust registered under the Investment Company Act of 1940, as amended, as an open-end management investment company.
Shares in the Fund are available for purchase by institutional buyers and certain individual and institutional advisory clients of Columbia Management Advisors, LLC ("Columbia") or one of its affiliates. The Fund's minimum initial investment requirement for investors is $5 million. Please see the Fund's prospectus for further details.
Investment goal. The Fund seeks long-term growth of capital and total returns greater than those of the market over time.
Fund shares. The Fund may issue an unlimited number of shares of beneficial interest which are offered continuously at net asset value.
Note 2. Significant accounting policies
The preparation of financial statements in conformity with accounting principles generally accepted in the United States of America ("GAAP") requires management to make estimates and assumptions that affect the reported amounts of assets and liabilities, the disclosure of contingent assets and liabilities at the date of the financial statements and the reported amounts of revenue and expenses during the reporting period. Actual results could differ from those estimates. The following is a summary of significant accounting policies consistently followed by the Fund in the preparation of its financial statements.
Security valuation. Equity securities, exchange traded funds and securities of certain investment companies are valued at the last sale price on the principal exchange on which they trade, except for securities traded on the NASDAQ, which are valued at the NASDAQ official close price. Unlisted securities or listed securities for which there were no sales during the day are valued at the closing bid price on such exchanges or over-the-counter markets.
Short-term debt obligations maturing within 60 days are valued at amortized cost, which approximates market value.
Foreign securities are generally valued at the last sale price on the foreign exchange or market on which they trade. If any foreign share prices are not readily available as a result of limited share activity, the securities are valued at the last sale price of the local shares in the principal market in which such securities are normally traded.
Generally, trading in foreign securities is substantially completed each day at various times prior to the close of the New York Stock Exchange ("NYSE"). The values of such securities used in computing the net asset value of the Fund's shares are determined as of such times. Foreign currency exchange rates are generally determined at 4:00 p.m. Eastern (U.S.) time. Events affecting the values of such foreign securities and such exchange rates may occur between the times at which they are determined and the close of the customary trading session of the NYSE, which would not be reflected in the computation of the Fund's net asset value. If events materially affecting the values of such foreign securities occur and it is determined that market quotations are not reliable, then these foreign securities will be valued at their fair value using procedures approved by the Board of Trustees.
18
CMG STRATEGIC EQUITY FUND
A Portfolio of Columbia Funds Institutional Trust
NOTES TO FINANCIAL STATEMENTS
January 31, 2007 (Unaudited)
Investments for which market quotations are not readily available, or that have quotations which management believes are not appropriate, are valued at fair value as determined in good faith under consistently applied procedures established by and under the general supervision of the Board of Trustees. If a security is valued at a "fair value", such value is likely to be different from the last quoted market price for the security.
In September 2006, Statement of Financial Accounting Standards No. 157, Fair Value Measurements ("SFAS 157"), was issued. SFAS 157 is effective for fiscal years beginning after November 15, 2007. SFAS 157 defines fair value, establishes a framework for measuring fair value and expands disclosures about fair value measurements. Management has recently begun to evaluate the impact the application of SFAS 157 will have on the Fund's financial statement disclosures.
Security transactions. Security transactions are accounted for on the trade date. Cost is determined and gains (losses) are based upon the specific identification method for both financial statement and federal income tax purposes.
Repurchase agreements. The Fund may engage in repurchase agreement transactions with institutions that Columbia has determined are creditworthy. The Fund, through its custodian, receives delivery of underlying securities collateralizing a repurchase agreement. Collateral is at least equal, at all times, to the value of the repurchase obligation including interest. A repurchase agreement transaction involves certain risks in the event of default or insolvency of the counterparty. These risks include possible delays or restrictions upon the Fund's ability to dispose of the underlying securities and a possible decline in the value of the underlying securities during the period while the Fund seeks to assert its rights.
Income recognition. Interest income is recorded on the accrual basis. Corporate actions and dividend income are recorded on the ex-date, except for certain foreign securities which are recorded as soon after ex-date as the Fund becomes aware of such, net of non-reclaimable tax withholdings. Distributions received from real estate investment trusts (REITs) in excess of their income are recorded as a reduction of the cost of the related investments and/or realized gains as applicable. If the Fund no longer owns the applicable securities, any distributions received in excess of income are recorded as realized gains.
Foreign currency transactions. The values of all assets and liabilities quoted in foreign currencies are translated into U.S. dollars at that day's exchange rates. Net realized and unrealized gains (losses) on foreign currency transactions include gains (losses) arising from the fluctuation in exchange rates between trade and settlement dates on securities transactions, gains (losses) arising from the disposition of foreign currency and currency gains (losses) between the accrual and payment dates on dividends, interest income and foreign withholding taxes.
For financial statement purposes, the Fund does not distinguish that portion of gains (losses) on investments which is due to changes in foreign exchange rates from that which is due to changes in market prices of the investments. Such fluctuations are included with the net realized and unrealized gains (losses) on investments in the statement of operations.
Federal income tax status. The Fund intends to qualify each year as a "regulated investment company" under Subchapter M of the Internal Revenue Code, as amended, and will distribute substantially all of its taxable income, if any, for its tax year, and as such will not be subject to federal income taxes. In addition, the Fund intends to distribute in each calendar year substantially all of its net investment income, capital gains and certain other amounts, if any, such that the Fund should not be subject to federal excise tax. Therefore, no federal income or excise tax provision is recorded.
Distributions to shareholders. Distributions to shareholders are recorded on ex-date. Net realized capital gains, if any, are distributed at least annually.
19
CMG STRATEGIC EQUITY FUND
A Portfolio of Columbia Funds Institutional Trust
NOTES TO FINANCIAL STATEMENTS
January 31, 2007 (Unaudited)
Indemnification. In the normal course of business, the Fund enters into contracts that contain a variety of representations and warranties and which provide general indemnities. The Fund's maximum exposure under these arrangements is unknown, as this would involve future claims against the Fund. Also, under the Fund's organizational documents and by contract, the Trustees and Officers of the Trust are indemnified against certain liabilities that may arise out of their duties to the Trust. However, based on experience, the Fund expects the risk of loss due to these representations, warranties and indemnities to be minimal.
Note 3. Federal tax information
The tax character of distributions paid during the year ended July 31, 2006 was as follows:
| July 31, 2006 | |||||||
| Distributions paid from: | |||||||
| Ordinary Income* | $ | 32,828,472 | |||||
| Long-Term Capital Gains | 140,713,427 | ||||||
*For tax purposes short-term capital gains distributions, if any, are considered ordinary income distributions.
Unrealized appreciation and depreciation at January 31, 2007, based on cost of investments for federal income tax purposes was:
| Unrealized appreciation | $ | 15,714,399 | |||||
| Unrealized depreciation | (534,538 | ) | |||||
| Net unrealized appreciation | $ | 15,179,861 | |||||
In June 2006, the Financial Accounting Standards Board ("FASB") issued FASB Interpretation No. 48, Accounting for Uncertainty in Income Taxes, an Interpretation of FASB Statement No. 109 (the "Interpretation"). This Interpretation is effective on the last business day of the semiannual reporting period for fiscal years beginning after December 15, 2006 and is to be applied to open tax positions upon initial adoption. This Interpretation prescribes a minimum recognition threshold and measurement method for the financial statement recognition of tax positions taken or expected to be taken in a tax return and also requires certain expanded disclosures. Management has recently begun to evaluate the application of this Interpretation to the Fund and has not at this time quantified the impact, if any, resulting from the adoption of this Interpretation on the Fund's financial statements.
Note 4. Fees and compensation paid to affiliates
Investment advisory fee. Columbia, an indirect, wholly-owned subsidiary of Bank of America Corporation ("BOA"), is the investment advisor to the Fund and provides administrative and other services to the Fund. Columbia receives a monthly investment advisory fee at the annual rate of 0.40% of the Fund's average daily net assets.
In addition to the annual Fund operating expenses, each shareholder may enter into a written administrative services agreement with Columbia or its affiliate. Pursuant to this Agreement, Columbia or its affiliate will provide the shareholder specialized reports regarding the Fund, performance of the shareholder's investments and market conditions and economic indicators. For such services, each shareholder (and not the Fund) will pay an annual fee calculated as a
20
CMG STRATEGIC EQUITY FUND
A Portfolio of Columbia Funds Institutional Trust
NOTES TO FINANCIAL STATEMENTS
January 31, 2007 (Unaudited)
percentage of the shareholder's net assets in the Fund. The annual fee is 0.20% on the first $25 million of the shareholder's net assets in the Fund, and 0.00% on the shareholder's net assets in the Fund in excess of $25 million.
Pricing & bookkeeping fees. Effective December 15, 2006, the Fund entered into a Financial Reporting Services Agreement with State Street Bank & Trust Company ("State Street") and Columbia (the "Financial Reporting Services Agreement") pursuant to which State Street provides financial reporting services to the Fund. Also effective December 15, 2006, the Fund entered into an Accounting Services Agreement with State Street and Columbia (collectively with the Financial Reporting Services Agreement, the "State Street Agreements") pursuant to which State Street provides accounting services to the Fund.
Effective December 15, 2006, the Fund entered into a Pricing and Bookkeeping Oversight and Services Agreement (the "Services Agreement") with Columbia. Under the Services Agreement Columbia provides services related to Fund expenses and compliance with the Sarbanes-Oxley Act of 2002 and provides oversight of the accounting and financial reporting services provided by State Street.
The Fund is not charged a fee for financial reporting services, accounting services and pricing and bookkeeping services.
Prior to December 15, 2006, Columbia was responsible for providing pricing and bookkeeping services to the Fund under a pricing and bookkeeping agreement. Under separate agreements, Columbia delegated certain functions to State Street. As a result, the total fees payable under the pricing and bookkeeping agreement were paid to State Street. The Fund was not charged a fee for pricing and bookkeeping services.
Transfer agent fee. Columbia Management Services, Inc. (the "Transfer Agent"), an affiliate of Columbia and an indirect, wholly-owned subsidiary of BOA, provides shareholder services to the Fund and has contracted with Boston Financial Data Services ("BFDS") to serve as sub-transfer agent.
The Transfer Agent is entitled to receive a fee for its services, paid monthly, at the annual rate of $17.00 per open account plus sub-transfer agent fees (exclusive of BFDS fees) calculated based on assets held in omnibus accounts subject to certain limitations and intended to recover the cost of payments to other parties (including affiliates of BOA) for services to those accounts.
The Transfer Agent may also retain, as additional compensation for its services, fees for wire, telephone and redemption orders, IRA trustee agent fees and account transcript fees due the Transfer Agent from shareholders of the Fund and credits (net of bank charges) earned with respect to balances in accounts the Transfer Agent maintains in connection with its services to the Fund. The Transfer Agent also receives reimbursements for certain out-of-pocket expenses.
For the six months ended January 31, 2007, the Fund's annualized effective transfer agent fee rate, inclusive of out-of-pocket expenses was less than 0.01% of the Fund's average daily net assets.
Expense limits and fee reimbursements. Columbia has contractually agreed to reimburse the Fund through November 30, 2007 for certain expenses so that the expenses incurred by the Fund, exclusive of interest, taxes and extraordinary expenses, will not exceed 0.40% of the Fund's average daily net assets.
Custody credits. The Fund has an agreement with its custodian bank under which custody fees may be reduced by balance credits. These credits are recorded as a reduction of total expenses on the Statement of Operations. The Fund could have invested a portion of the assets utilized in connection with the expense offset arrangement in an income-producing asset if it had not entered into such an agreement.
21
CMG STRATEGIC EQUITY FUND
A Portfolio of Columbia Funds Institutional Trust
NOTES TO FINANCIAL STATEMENTS
January 31, 2007 (Unaudited)
Fees paid to officers and trustees. All officers of the Fund are employees of Columbia or its affiliates and with the exception of the Fund's Chief Compliance Officer, receive no compensation from the Fund. The Board of Trustees has appointed a Chief Compliance Officer to the Fund in accordance with federal securities regulations. The Fund, along with other affiliated funds, pays its pro-rata share of the expenses associated with the Chief Compliance Officer. The Fund's expenses for the Chief Compliance Officer will not exceed $15,000 per year.
The Fund's Trustees may participate in a deferred compensation plan which may be terminated at any time. Obligations of the plan will be paid solely out of the Fund's assets.
Other. Columbia provides certain services to the Fund related to Sarbanes-Oxley compliance. For the six months ended January 31, 2007, the Fund paid $1,465 to Columbia for such services. This amount is included in "Other expenses" on the Statement of Operations.
Note 5. Portfolio information
For the six months ended January 31, 2007, the cost of purchases and proceeds from sales of securities, excluding short-term obligations, were $61,401,782 and $104,103,615, respectively.
Note 6. Line of credit
The Fund and other affiliated funds participate in a $350,000,000 committed unsecured revolving line of credit and a $150,000,000 uncommitted, unsecured line of credit, both provided by State Street Bank. Borrowings are used for temporary or emergency purposes to facilitate portfolio liquidity.
Interest on the committed line of credit is charged to each participating fund based on the fund's borrowings at a rate per annum equal to the Federal Funds Rate plus 0.50%. In addition, a commitment fee of 0.10% per annum is accrued and apportioned among the participating funds based on their pro-rata portion of the unutilized committed line of credit. Interest on the uncommitted line of credit is charged to each participating fund based on the fund's borrowings at a variable rate per annum equal to the Federal Funds Rate plus a spread, as determined and quoted by State Street at the time of the request for a loan. A one-time structuring fee of $30,000 is also accrued and apportioned to each fund participating in the uncommitted line of credit based on the average net assets of the participating funds. In addition, if the uncommitted line of credit is extended for an additional period, an annual administration fee of $15,000 wi ll be charged and apportioned among the participating funds. The commitment fee and structuring fee are included in "Other expenses" in the Statement of Operations.
For the six months ended January 31, 2007, the average daily loan balance outstanding on days where borrowings existed was $4,500,000 at a weighted average interest rate of 5.81%.
Note 7. Shares of beneficial interest
As of January 31, 2007, one account held 87.9% of the Fund's shares outstanding. The account was beneficially owned by participant accounts over which Bank of America and/or its affiliates had either sole or joint investment discretion. Subscription and redemption activity of this account may have a significant effect on the operations of the Fund.
22
CMG STRATEGIC EQUITY FUND
A Portfolio of Columbia Funds Institutional Trust
NOTES TO FINANCIAL STATEMENTS
January 31, 2007 (Unaudited)
As of January 31, 2007, the Fund also had one account holding 5.5% of the shares outstanding. Subscription and redemption activity of this account may have a significant effect on the operations of the Fund.
Note 8. Other
For the six months ended January 31, 2007, Columbia voluntarily reimbursed the Fund $2,641 in custody expenses.
Note 9. Disclosure of significant risks and contingencies
Sector focus. At times, the Fund may have a large portion of its assets invested in a particular group of related industries (sector). During such times, the Fund will have greater exposure to economic and market events affecting such sector than if it were more broadly diversified across sectors.
Foreign securities. There are certain additional risks involved when investing in foreign securities that are not inherent with investments in domestic securities. These risks may involve foreign currency exchange rate fluctuations, adverse political and economic developments and the possible prevention of currency exchange or other foreign governmental laws or restrictions. In addition, the liquidity of foreign securities may be more limited than that of domestic securities.
Legal Proceedings Disclosure. On February 9, 2005, Columbia Management Advisors, Inc. (which has since merged into Banc of America Capital Management, LLC (now named Columbia Management Advisors, LLC)) ("Columbia") and Columbia Funds Distributor, Inc. (which has been renamed Columbia Management Distributors, Inc.) (the "Distributor") (collectively, the "Columbia Group") entered into an Assurance of Discontinuance with the New York Attorney General ("NYAG") (the "NYAG Settlement") and consented to the entry of a cease-and-desist order by the Securities and Exchange Commission ("SEC") (the "SEC Order") on matters relating to mutual fund trading. The SEC Order and the NYAG Settlement are referred to collectively as the "Settlements".
Under the terms of the SEC Order, the Columbia Group agreed, among other things, to: pay $70 million in disgorgement and $70 million in civil money penalties; cease and desist from violations of the antifraud provisions and certain other provisions of the federal securities laws; maintain certain compliance and ethics oversight structures; retain an independent consultant to review the Columbia Group's applicable supervisory, compliance, control and other policies and procedures; and retain an independent distribution consultant (see below). The Columbia Funds have also voluntarily undertaken to implement certain governance measures designed to maintain the independence of their boards of trustees. The NYAG Settlement also, among other things, requires Columbia and its affiliates to reduce management fees for certain Columbia Funds (including the former Nations Funds) and other mutual funds collectively by $32 million per year f or five years, for a projected total of $160 million in management fee reductions.
Pursuant to the procedures set forth in the SEC Order, the $140 million in settlement amounts described above will be distributed in accordance with a distribution plan developed by an independent distribution consultant and approved by the SEC. The independent distribution consultant has been in consultation with the staff of the SEC and has submitted a proposed plan of distribution. The SEC has released the proposed plan of distribution for public notice and comment but has not yet approved a final plan of distribution.
As a result of these matters or any adverse publicity or other developments resulting from them, there may be increased redemptions or reduced sales of fund shares, which could increase transaction costs or operating expenses, or have other adverse consequences for the funds.
A copy of the SEC Order is available on the SEC website at http://www.sec.gov. A copy of the NYAG Settlement is available as part of the Bank of America Corporation Form 8-K filing on February 10, 2005.
23
CMG STRATEGIC EQUITY FUND
A Portfolio of Columbia Funds Institutional Trust
NOTES TO FINANCIAL STATEMENTS
January 31, 2007 (Unaudited)
In connection with the events described above, various parties have filed suit against certain funds, the Trustees of the Columbia Funds, FleetBoston Financial Corporation and its affiliated entities and/or Bank of America and its affiliated entities.
On February 20, 2004, the Judicial Panel on Multidistrict Litigation transferred these cases and cases against other mutual fund companies based on similar allegations to the United States District Court in Maryland for consolidated or coordinated pretrial proceedings (the "MDL"). Subsequently, additional related cases were transferred to the MDL. On September 29, 2004, the plaintiffs in the MDL filed amended and consolidated complaints. One of these amended complaints is a putative class action that includes claims under the federal securities laws and state common law, and that names Columbia, the Distributor, the Trustees of the Columbia Funds, Bank of America Corporation and others as defendants. Another of the amended complaints is a derivative action purportedly on behalf of the Columbia Funds that asserts claims under federal securities laws and state common law.
On February 25, 2005, Columbia and other defendants filed motions to dismiss the claims in the pending cases. On March 1, 2006, for reasons stated in the court's memoranda dated November 3, 2005, the U.S. District Court for the District of Maryland granted in part and denied in part the defendants' motions to dismiss. The court dismissed all of the class action claims pending against the Columbia Funds Trusts. As to Columbia and the Distributor, the claims under the Securities Act of 1933, the claims under Sections 34(b) and 36(a) of the Investment Company Act of 1940 ("ICA") and the state law claims were dismissed. The claims under Sections 10(b) and 20(a) of the Securities Exchange Act of 1934 and claims under Section 36(b) of the ICA were not dismissed.
On March 21, 2005, a purported class action was filed in Massachusetts state court alleging that certain conduct, including market timing, entitled Class B shareholders in certain Columbia Funds to an exemption from contingent deferred sales charges upon early redemption ("the CDSC Lawsuit"). The CDSC Lawsuit was removed to federal court in Massachusetts and the federal Judicial Panel transferred the CDSC Lawsuit to the MDL.
On April 4, 2006, the plaintiffs and the Columbia defendants named in the MDL, including the Columbia Funds, entered into a term sheet containing the principal terms of a stipulation of settlement that would settle all Columbia-related claims in the MDL described above, including the CDSC Lawsuit. On April 6, 2006, the U.S. District Court for the District of Maryland stayed all actions with respect to these Columbia-related claims.
In 2004, the Columbia Funds' adviser and distributor and certain affiliated entities and individuals were named as defendants in certain purported shareholder class and derivative actions making claims, including claims under the Investment Company and the Investment Advisers Acts of 1940 and state law. Certain Columbia Funds were named as nominal defendants. The suits allege, inter alia, that the fees and expenses paid by the funds are excessive and that the advisers and their affiliates inappropriately used fund assets to distribute the funds and for other improper purposes. On March 2, 2005, the actions were consolidated in the Massachusetts federal court as In re Columbia Entities Litigation. The plaintiffs filed a consolidated amended complaint on June 9, 2005. On November 30, 2005, the judge dismissed all claims by plaintiffs and entered final judgment in favor of the defendants. The plaintiffs appealed to the United States Court of Appeals for the First Circuit on December 30, 2005. A stipulation and settlement agreement dated January 19, 2007 was filed in the First Circuit on February 14, 2007, with a joint stipulation of dismissal and motion for remand to obtain district court approval of the settlement. That joint motion was granted and the appeal was dismissed. On March 6, 2007, the case was remanded to the District Court, where the parties will seek court approval of the settlement. The terms of the proposed settlement, if approved, will require payments by the funds' adviser and/or its affiliates, including payment of plaintiffs' attorneys' fees and notice to class members. In the event that the settlement is not approved, the plaintiffs may elect to go forward with their appeal and no opinion is expressed regarding the likely outcome or financial impact of such an appeal on any fund.
24
Board Consideration and Approval of
Investment Advisory Agreements
The Advisory Fees and Expenses Committee of the Board of Trustees meets one or more times annually to review the advisory agreements (collectively, the "Agreements") of the funds for which the Trustees serve as trustees (each a "fund") and determine whether to recommend that the full Board approve the continuation of the Agreements for an additional one-year period. After the Committee has made its recommendation, the full Board, including the Independent Trustees, determines whether to approve the continuation of the Agreements. In addition, the Board, including the Independent Trustees, considers matters bearing on the Agreements at most of its other meetings throughout the year and meets regularly with the heads of each investment area within Columbia. Through the Board's Investment Oversight Committees, Trustees also meet with selected fund portfolio managers at various times throughout the year.
The Trustees receive and review all materials that they, their legal counsel or Columbia, the funds' investment adviser, believe to be reasonably necessary for the Trustees to evaluate the Agreements and determine whether to approve the continuation of the Agreements. Those materials generally include, among other items, (i) information on the investment performance of each fund relative to the performance of peer groups of mutual funds and the fund's performance benchmarks, (ii) information on each fund's advisory fees and other expenses, including information comparing the fund's expenses to those of peer groups of mutual funds and information about any applicable expense caps and fee "breakpoints," (iii) information about the profitability of the Agreements to Columbia, including potential "fall-out" or ancillary benefits that Columbia and its affiliates may receive as a result of their relationships with the funds and (iv) i nformation obtained through Columbia's response to a questionnaire prepared at the request of the Trustees by counsel to the funds and independent legal counsel to the Independent Trustees. The Trustees also consider other information such as (v) Columbia's financial results and financial condition, (vi) each fund's investment objective and strategies and the size, education and experience of Columbia's investment staffs and their use of technology, external research and trading cost measurement tools, (vii) the allocation of the funds' brokerage, if any, and the use of "soft" commission dollars to pay for research products and services, (viii) Columbia's resources devoted to, and its record of compliance with, the funds' investment policies and restrictions, policies on personal securities transactions and other compliance policies, (ix) Columbia's response to various legal and regulatory proceedings since 2003 and (x) the economic outlook generally and for the mutual fund industry in particular. In additio n, the Advisory Fees and Expenses Committee confers with the funds' independent fee consultant and reviews materials relating to the funds' relationships with Columbia provided by the independent fee consultant. Throughout the process, the Trustees have the opportunity to ask questions of and request additional materials from Columbia and to consult with independent legal counsel to the Independent Trustees and the independent fee consultant.
The Board of Trustees most recently approved the continuation of the Agreements at its October 2006 meeting, following meetings of the Advisory Fees and Expenses Committee held in August, September and October 2006. In considering whether to approve the continuation of the Agreements, the Trustees, including the Independent Trustees, did not identify any single factor as determinative, and each weighed various factors as he or she deemed appropriate. The Trustees considered the following matters in connection with their approval of the continuation of the Agreements:
The nature, extent and quality of the services provided to the funds under the Agreements. The Trustees considered the nature, extent and quality of the services provided by Columbia and its affiliates to the funds and the resources dedicated to the funds by Columbia and its affiliates. Among other things, the Trustees considered (i) Columbia's ability (including its personnel and other resources, compensation programs for personnel involved in fund management, reputation and other attributes) to attract and retain highly qualified research, advisory and supervisory investment professionals; (ii) the portfolio management services provided by those investment professionals; and (iii) the trade execution services provided on behalf of the funds. For each fund, the Trustees also considered the benefits to shareholders of investing in a mutual fund that is part of a family of funds offering exposure to a variety of asset classes and investment disciplines and providing a variety of fund and shareholder services. After reviewing those and related factors, the Trustees concluded, within the context of their overall conclusions regarding each of the Agreements, that the nature, extent and quality of services provided supported the continuation of the Agreements.
25
Investment performance of the funds and Columbia. The Trustees reviewed information about the performance of each fund over various time periods, including information prepared by an independent third party that compared the performance of each fund to the performance of peer groups of mutual funds and performance benchmarks. The Trustees also reviewed a description of the third party's methodology for identifying each fund's peer group for purposes of performance and expense comparisons. The Trustees also considered additional information that the Advisory Fees and Expenses Committee requested from Columbia relating to funds that presented relatively weaker performance and/or relatively higher expenses.
In the case of each fund whose performance lagged that of a relevant peer group for certain (although not necessarily all) periods, the Trustees concluded that other factors relevant to performance were sufficient, in light of other considerations, to warrant continuation of the fund's Agreements. Those factors varied from fund to fund, but included one or more of the following: (i) that the fund's performance, although lagging in certain recent periods, was stronger over the longer term; (ii) that the underperformance was attributable, to a significant extent, to investment decisions that were reasonable and consistent with the fund's investment strategy and policies and that then fund was performing as expected, given these investment decisions, market conditions and the fund's investment strategy; (iii) that the fund's performance was competitive when compared to other relevant performance benchmarks or peer groups; (iv) that Columbia had taken or was taking steps designed to help improve the fund's investment performance, including, but not limited to, replacing portfolio managers or modifying investment strategies; and (v) that the fund was proposed to be reorganized into another fund, and that such reorganization would result in a reduction in fund expenses.
The Trustees also considered Columbia's performance and reputation generally, the funds' performance as a fund family generally, and Columbia's historical responsiveness to Trustee concerns about performance and Columbia's willingness to take steps intended to improve performance.
After reviewing those and related factors, the Trustees concluded, within the context of their overall conclusions regarding each of the Agreements, that the performance of each fund and Columbia was sufficient, in light of other considerations, to warrant the continuation of the Agreement(s) pertaining to that fund.
The costs of the services provided and profits realized by Columbia and its affiliates from their relationships with the funds. The Trustees considered the fees charged to the funds for advisory services as well as the total expense levels of the funds. That information included comparisons (provided by management and by an independent third party) of each fund's advisory fees and total expense levels to those of the fund's peer groups and information about the advisory fees charged by Columbia to comparable institutional accounts. In considering, the fees charged to those accounts, the Trustees took into account, among other things, management's representations about the differences between managing mutual funds as compared to other types of accounts, including differences in the services provided, differences in the risk profile of such business for Columb ia, and the additional resources required to manage mutual funds effectively. In evaluating each fund's advisory fees, the Trustees also took into account the demands, complexity and quality of the investment management of the fund. The Trustees considered existing advisory fee breakpoints, and Columbia's use of advisory fee waivers and expense caps, which benefited a number of the funds. The Trustees also noted management's stated justification for the fees charged to the funds, which included information about the investment performance of the funds and the services provided to the funds. The Trustees also considered the compensation directly or indirectly received by Columbia and its affiliates from their relationships with the funds. The Trustees reviewed information provided by management as to the profitability to Columbia and its affiliates of their relationships with each fund, and information about the allocation of expenses used to calculate profitability. When reviewing profitability, the Trustees also considered court cases in which adviser profitability was an issue in whole or in part, the performance of the relevant funds, the expense level of each fund, and whether Columbia had implemented breakpoints and/or expense caps with respect to the fund.
26
After reviewing those and related factors, the Trustees concluded, within the context of their overall conclusions regarding each of the Agreements, that the advisory fees charged to each fund, and the related profitability to Columbia and its affiliates of their relationships with the fund, supported the continuation of the Agreement(s) pertaining to that fund.
Economies of Scale. The Trustees considered the existence of any economies of scale in the provision by Columbia of services to each fund, to groups of related funds, and to Columbia's investment advisory clients as a whole and whether those economies were shared with the funds through breakpoints in the investment advisory fees or other means, such as expense waivers/reductions and additional investments by Columbia in investment, trading and compliance resources. The Trustees noted that many of the funds benefited from breakpoints, expense caps, or both. In considering those issues, the Trustees also took note of the costs of the services provided (both on an absolute and a relative basis) and the profitability to Columbia and its affiliates of their relationships with the funds, as discussed above.
After reviewing those and related factors, the Trustees concluded, within the context of their overall conclusions regarding each of the Agreements, that the extent to which economies of scale were shared with the funds supported the continuation of the Agreements.
Other Factors. The Trustees also considered other factors, which included but were not limited to the following:
n the extent to which each fund had operated in accordance with its investment objective and investment restrictions, the nature and scope of the compliance programs of the funds and Columbia and the compliance-related resources that Columbia and its affiliates were providing to the funds;
n the nature, quality, cost and extent of administrative and shareholder services performed by Columbia and its affiliates, both under the Agreements and under separate agreements for the provision of transfer agency and administrative services;
n so-called "fall-out benefits" to Columbia and its affiliates, such as the engagement of its affiliates to provide distribution, brokerage and transfer agency services to the funds, and the benefits of research made available to Columbia by reason of brokerage commissions generated by the funds' securities transactions, as well as possible conflicts of interest associated with those fall-out and other benefits, and the reporting, disclosure and other processes in place to disclose and monitor those possible conflicts of interest; and
n the draft report provided by the funds' independent fee consultant, which included information about and analysis of the funds' fees, expenses and performance.
Based on their evaluation of all factors that they deemed to be material, including those factors described above, and assisted by the advice of independent counsel and the independent fee consultant, the Trustees, including the Independent Trustees, approved the continuance of each of the Agreements through October 31, 2007.
27
Summary of Management Fee Evaluation by
Independent Fee Consultant
Prepared Pursuant to the February 9, 2005 Assurance of Discontinuance between the Office of Attorney General of New York State and Columbia Management Advisors, Inc. and Columbia Funds Distributor, Inc. October 11, 2006
I. Overview
Columbia Management Advisors, LLC ("CMA") and Columbia Funds Distributors, Inc.1 ("CFD") agreed on February 9, 2005 to the New York Attorney General's Assurance of Discontinuance ("AOD"). Among other things, the AOD stipulates that CMA may manage or advise a Columbia Fund ("Fund" and together with all such funds or a group of such funds as the "Funds") only if the Independent Members of the Fund's Board of Trustees (such Independent Members of the Fund's Board together with the other members of the Fund's Board, referred to as the "Trustees") appoint a Senior Officer or retain an Independent Fee Consultant ("IFC") who is to manage the process by which proposed management fees are negotiated. The AOD further stipulates that the Senior Officer or IFC is to prepare a written annual evaluation of the fee negotiation process.
On September 14, 2006, the Independent members of the Funds' Boards retained me as IFC for the Funds. In this capacity, I have prepared the second annual written evaluation of the fee negotiation process. I am successor to the first IFC, Erik Sirri, who prepared the annual evaluation in 2005 and who contributed to the second annual written evaluation until his resignation as IFC in August 2006 to become Director of the Division of Market Regulation at the U.S. Securities and Exchange Commission.2
A. Role of the Independent Fee Consultant
The AOD charges the IFC with "managing the process by which proposed management fees...to be charged the Columbia Fund are negotiated so that they are negotiated in a manner which is at arms' length and reasonable and consistent with this Assurance of Discontinuance." In this role, the IFC does not replace the Trustees in negotiating management fees with CMA, and the IFC does not substitute his or her judgment for that of the Trustees about the reasonableness of proposed fees. As the AOD states, CMA "may manage or advise a Columbia Fund only if the reasonableness of the proposed management fees is determined by the Board of Trustees...using...an annual independent written evaluation prepared by or under the direction of...the Independent Fee Consultant."
B. Elements Involved in Managing the Fee Negotiation Process
Managing the fee negotiation process has three elements. One involves reviewing the information provided by CMG to the Trustees for evaluating the proposed management fees and augmenting that information, as necessary, with additional information from CMG or other sources and with further analyses of the information and data. The second element involves reviewing the information and analysis relative to at least the following six factors set forth in the AOD:
1. The nature and quality of CMA's services, including the Fund's performance;
2. Management fees (including any components thereof) charged by other mutual fund companies for like services;
3. Possible economies of scale as the Fund grows larger;
1 CMA and CFD are subsidiaries of Columbia Management Group, Inc. ("CMG"), which also is the parent of Columbia Management Services, Inc. ("CFS"), the Funds' transfer agent. Before the date of this report, CMA merged into an affiliated entity, Banc of America Capital Management, LLC, which was renamed Columbia Management Advisors, LLC and which carries on the business of CMA. CFD also has been renamed Columbia Management Distributors, Inc.
2 I am an independent economic consultant. From August 2005 until August 2006, I provided support to Mr. Sirri as an independent consultant. From 1994 to 2004, I was Chief Economist at the Investment Company Institute. Earlier, I was Section Chief and Assistant Director at the Federal Reserve Board and Professor of Economics at Oklahoma State University. I have no material relationship with Bank of America or CMG, aside from serving as IFC, and I am aware of no material relationship with any of their affiliates. To assist me with the report, I engaged NERA Economic Consulting, an independent consulting firm that has had extensive experience in the mutual fund industry. I also have retained Willkie Farr & Gallagher LLP as counsel to advise me in connection with the report.
28
4. Management fees (including any components thereof) charged to institutional and other clients of CMA for like services;
5. Costs to CMA and its affiliates of supplying services pursuant to the management fee agreements, excluding any intra-corporate profit; and
6. Profit margins of CMA and its affiliates from supplying such services.
The final element involves providing the Trustees with a written evaluation of the above factors as they relate to the fee negotiation process.
C. Organization of the Annual Evaluation
The 2006 annual evaluation focuses on the six factors and contains a section for each factor except that CMA's costs and profits from managing the Funds have been combined into a single section. In each section, the discussion of the factor considers and analyzes the available data and other information as they bear upon the fee negotiation process. If appropriate, the discussion in the section may point out certain aspects of the proposed fees that may warrant particular attention from the Trustees. The discussion also may suggest other data, information, and approaches that the Trustees might consider incorporating into the fee negotiation process in future years.
In addition to a discussion of the six factors, the report reviews the status of recommendations made in the 2005 IFC evaluation. The 2006 report also summarizes the findings with regard to the six factors and contains a summary of recommendations for possible enhancements to the process.
II. Status of 2005 Recommendations
The 2005 IFC evaluation contains recommendations aimed at enhancing the evaluation of proposed management fees by Trustees. The section summarizes those recommendations and includes my assessment of the response to the recommendations.
1. Recommendation: Trustees should consider requesting more analytical work from CMG in the preparation of future 15(c) materials.
Status: CMG has provided additional analyses to the Trustees on economies of scale, a comparative analysis of institutional and retail management fees, management fee breakpoints, risk-adjusted performance, fee waivers and expense reimbursements, and CMG's costs and profitability.
2. Recommendation: Trustees may wish to consider whether CMG should continue expanding the use of Morningstar or other third party data to supplement CMG's fee and performance analysis that is now based primarily on Lipper reports.
Status: CMG has used data from Morningstar Inc. to compare with data from Lipper Inc. ("Lipper") in performing the Trustees' screening procedures.
3. Recommendation: Trustees should consider whether...the fund-by-fund screen...should place comparable emphasis on both basis point and quintile information in their evaluation of the funds...Also, the Trustees should consider incorporating sequences of one year performance into a fund-by-fund screen.
29
Status: CMG has not provided Trustees with results of the screening process using percentiles. CMG has provided Trustees with information on the changes in performance and expenses between 2005 and 2006 and data on one-year returns.
4. Recommendation: Given the volatility of fund performance, the Trustees may want to consider whether a better method exists than th[e] fee waiver process to deal with fund underperformance.
Status: It is my understanding that the Trustees have determined to address fund underperformance not only through fee waivers and expense caps but also through discussions with CMG regarding the sources of underperformance. CMG has provided Trustees with an analysis of the relationship between breakpoints, expense reimbursements, and fee waivers.
5. Recommendation: [Seventy-one] percent of funds [have] yet to reach their first management fee breakpoint... Trustees may wish to consider whether the results of my ongoing economies-of-scale work affects the underlying economic assumptions reflected in the existing breakpoint schedules.
Status: CMG has prepared a memo for the Trustees discussing its views on the nature and sharing of potential economies of scale. The memo discuses CMG's view that economies of scale arise at the complex level rather than the fund level. The memo also describes steps, including the introduction of breakpoints, taken to share economies of scale with shareholders. CMG's analysis, however, does not discuss specific sources of economies of scale and does not link breakpoints to economies of scale that might be realized as the Funds' assets increase.
6. Recommendation: Trustees should continue working with management to address issues of funds that demonstrate consistent or significant underperformance even if the fee levels for the funds are low.
Status: Trustees monitor performance on an ongoing basis.
III. Findings
A. General
1. Based upon my examination of the available information and the six factors, I conclude that the Trustees have the relevant information necessary to evaluate the reasonableness of the proposed management fees for the Funds. CMG has provided the Trustees with relevant materials on the six factors through the 15(c) contract renewal process and in materials prepared for review at Board and Committee meetings.
2. In my view, the process by which the proposed management fees of the Funds have been negotiated in 2006 thus far has been, to the extent practicable, at arms' length and reasonable and consistent with the AOD.
B. Nature and Quality of Services, Including Performance
3. The performance of the Funds has been relatively strong, especially that of fixed-income Funds. For each of the 1-, 3-, 5- and 10-year performance periods, over 60 percent of the funds have ranked in the top three performance quintiles.
4. The performance of the equity Funds overall, though less concentrated in the top two quintiles than the fixed income Funds, improved in 2006 relative to that in 2005. The fixed-income funds maintained the relatively high performance level of 2005 in 2006.
30
5. The Funds' overall performance adjusted for risk was significantly stronger than performance unadjusted for risk. Domestic and international equity funds, in particular, moved to higher relative performance rankings after adjusting for risk.
6. The procedure used to construct the performance universe in which each Fund's performance is ranked relative to comparable funds may bias a Fund's ranking upward within that universe. The bias occurs because the performance ranking procedure includes all share classes of multi-class funds in the universe and because the procedure ranks either no-load or A share classes of the Funds. No-load and A share classes generally have lower total expenses than B and C shares (owing to B and C shares having higher distribution/service fees) and thus, given all else, would outperform many of B and C share classes included in the universe. A preliminary analysis that adjusts for the bias results in a downward movement in the relative performance for the Funds but does not change the general finding that the Funds' performance has been strong relative to comparable funds.
C. Management Fees Charged by Other Mutual Fund Companies
7. The Funds' management fees and total expenses are generally low relative to those of their peers. At least 56 percent of the Funds are in the first or second quintiles with the lowest fees and expenses and nearly three fourths or more in the first three quintiles. Equity Funds are more highly concentrated in the first three quintiles than fixed-income Funds.
8. The fee and expense rankings as whole are similar to those in 2005 in that the majority of funds are ranked in the top quintiles. Nonetheless, a number of individual funds experienced a change in ranking between 2005 and 2006. This fund-level instability may reflect sensitivity of rankings to the composition of the comparison groups, as the membership of the peer groups typically changed substantially between the two years.
9. The Liberty Money Market Fund VS appears to have a higher management fee structure than that of other Columbia money market funds of comparable asset size.
D. Trustees' Fee and Performance Evaluation Process
10. The Trustees' evaluation process identified 21 funds in 2006 for further review based upon their relative performance or expenses. Seventeen of these funds had been subject to review in 2004 or 2005.
E. Potential Economies of Scale
11. CMG has prepared a memo for the Trustees containing its views on the sources and sharing of potential economies of scale. CMG views economies of scale as arising at the complex level and would regard estimates of scale economies for individual funds as unreliable. CMG has not, however, identified specific sources of economies of scale nor has it provided any estimates of the magnitude of any economies of scale. In the memo, CMG also describes measures taken by the Trustees and CMG that seek to share any potential economies of scale through breakpoints in management fee schedules, expense reimbursements, fee waivers, enhanced shareholder services, fund mergers, and operational consolidation. These measures, although of significant benefit to shareholders, have not been directly linked in the memo to the existence, sources, and magnitude of economies of scale.
F. Management Fees Charged to Institutional Clients
12. CMG has provided Trustees with comparisons of mutual fund management fees and institutional fees based upon standardized fee schedules and upon actual fees. Based upon the information, institutional fees are generally lower than the Funds' management fees. This pattern is consistent with the economics of the two financial products. Data
31
are not available, however, on actual institutional fees at other money managers. Thus, it is not possible to determine the extent to which differences between the Funds' management fees and institutional fees are consistent with those seen generally in the marketplace.
G. Revenues, Expenses, and Profits
13. The financial statements and the methodology underlying their construction generally form a sufficient basis for Trustees to evaluate the expenses and profitability of the Funds.
IV. Recommendations
A. Performance
1. Trustees may wish to consider incorporating risk adjusted measures in their evaluation of performance. CMG has begun to prepare reports for the Trustees with risk adjustments, which could form the basis for formally including the measures in the 15(c) materials. To this end, Trustees may wish to have CMG prepare documents explaining risk adjustments and describing their advantages and disadvantages.
2. Trustees may wish to consider having CMG evaluate the sensitivity of performance rankings to the design of the universe. The preliminary analysis contained in the evaluation suggests that the method employed by Lipper, the source of performance rankings used by the Trustees, may bias performance rankings upward.
B. Economies of Scale
3. Trustees may wish to consider having CMG extend its analysis of economies of scale by examining the sources of such economies, if any. Identification of the sources may enable the Trustees and CMG to gauge their magnitude. It also may enable the Trustees and CMG to build upon past work on standardized fee schedules so that the schedules themselves are consistent with any economies of scale and their sources. Finally, an extension of the analysis may enable the Trustees and CMG to develop a framework that coordinates the use of fee waivers and expense caps with the standard fee schedules and with any economies of scale and their sources.
C. Institutional Fees
4. Trustees may wish to consider encouraging CMG to build further upon its expanded analysis of institutional fees by refining the matching of institutional accounts with mutual funds, by dating the establishment of each institutional account, and by incorporating other accounts, such as subadvisory relationships, trusts, offshore funds, and separately managed accounts into the analysis.
D. Profitability
5. Trustees may wish to consider requesting that CMG expand the reporting of revenues and expenses to include more line-item detail for management and administration, transfer agency, fund accounting, and distribution.
6. Trustees may wish to consider requesting that CMG provide a statement of its operations in the 15(c) materials.
7. Trustees may wish to consider the treatment of the revenue sharing with the Private Bank of Bank of America in their review of CMG's profitability.
Respectfully submitted,
John D. Rea
32
Appendix
Sources of Information Used in the Evaluation
The following list generally describes the sources and types of information that were used in preparing this report.
1. Performance, management fees, and expense ratios for the Funds and comparable funds from other fund complexes from Lipper and CMG. The sources of this information were CMG and Lipper;
2. CMG's expenses and profitability obtained directly from CMG;
3. Information on CMG's organizational structure;
4. Profitability of publicly traded asset managers from Lipper;
5. Interviews with CMG staff, including members of senior management, legal staff, heads of affiliates, portfolio managers, and financial personnel;
6. Documents prepared by CMG for Section 15(c) contract renewals in 2005 and 2006;
7. Academic research papers, industry publications, professional materials on mutual fund operations and profitability, and SEC releases and studies of mutual fund expenses
8. Interviews with and documents prepared by Ernst & Young LLP in its review of the Private Bank Revenue Sharing Agreement;
9. Discussions with Trustees and attendance at Board and committee meetings during which matters pertaining to the evaluation were considered.
In addition, I engaged NERA Economic Consulting ("NERA") to assist me in data management and analysis. NERA has extensive experience in the mutual fund industry that provides unique insights and special knowledge pertaining to my independent analysis of fees, performance, and profitability. I have also retained attorneys in the Washington, D.C. office of Willkie Farr & Gallagher LLP as outside counsel to advise me in connection with my evaluation.
Finally, meetings and discussions with CMG staff were informative. My participation in Board and committee meetings in which Trustees and CMG management discussed issues relating to management contracts were of great benefit to the preparation of the evaluation.
33
COLUMBIA FUNDS INSTITUTIONAL TRUST
ONE FINANCIAL CENTER, BOSTON, MASSACHUSETTS 02111-2621
- INVESTMENT ADVISOR -
COLUMBIA MANAGEMENT ADVISORS, LLC
100 FEDERAL STREET
BOSTON, MASSACHUSETTS 02110-2624
- LEGAL COUNSEL -
ROPES & GRAY LLP
ONE INTERNATIONAL PLACE
BOSTON, MASSACHUSETTS 02110-2624
- TRANSFER AGENT -
COLUMBIA MANAGEMENT SERVICES, INC.
P.O. BOX 8081
BOSTON, MASSACHUSETTS 02266-8081
SHC-44/116690-0107 (03/07) 07/36503
A description of the fund's proxy voting policies and procedures is available (i) on the fund's website, www.columbiamanagement.com; (ii) on the Securities and Exchange Commission's website at www.sec.gov, and (iii) without charge, upon request, by calling 800-368-0346. Information regarding how the fund voted proxies relating to portfolio securities during the 12-month period ended June 30 is available from the SEC's website. Information regarding how the fund voted proxies relating to portfolio securities is also available from the fund's website.
The fund files a complete schedule of portfolio holdings with the SEC for the first and third quarters of each fiscal year on Form N-Q. The fund's Form N-Q is available on the SEC's website at www.sec.gov and may be reviewed and copied at the SEC's Public Reference Room in Washington, D.C. Information on the operation of the Public Reference Room may be obtained by calling 1-800-SEC-0330.
The fund is offered by prospectus through Columbia Management Distributors, Inc. Please consider the investment objectives, risks, charges and expenses of a mutual fund carefully before investing. Contact your Columbia Management representative or visit www.columbiamanagement.com for a prospectus, which contains this and other important information about the fund. Read it carefully before you invest.
Fund distributed by Columbia Management Distributors, Inc.
© 2007 Columbia Management Distributors, Inc.
One Financial Center, Boston, MA 02111-2621
Item 2. Code of Ethics.
Not applicable at this time.
Item 3. Audit Committee Financial Expert.
Not applicable at this time.
Item 4. Principal Accountant Fees and Services.
Not applicable at this time.
Item 5. Audit Committee of Listed Registrants.
Not applicable.
Item 6. Schedule of Investments
The registrant’s “Schedule I — Investments in securities of unaffiliated issuers” (as set forth in 17 CFR 210.12-12) is included in Item 1 of this Form N-CSR.
Item 7. Disclosure of Proxy Voting Policies and Procedures for Closed-End Management Investment Companies.
Not applicable.
Item 8. Portfolio Managers of Closed-End Management Investment Companies.
Not applicable.
Item 9. Purchases of Equity Securities by Closed-End Management Investment Company and Affiliated Purchasers.
Not applicable.
Item 10. Submission of Matters to a Vote of Security Holders.
There have not been any material changes to the procedures by which shareholders may recommend nominees to the registrant’s board of directors, since those procedures were last disclosed in response to requirements of Item 7(d)(2)(ii)(G) of Schedule 14A or this Item.
Item 11. Controls and Procedures.
(a) The registrant’s principal executive officer and principal financial officers, based on their evaluation of the registrant’s disclosure controls and procedures as of a date within 90 days of the filing of this report, have concluded that such controls and procedures are adequately designed to ensure that information required to be disclosed by the registrant in Form N-CSR is accumulated and communicated to the registrant’s management, including the principal executive officer and principal financial officer, or persons performing similar functions, as appropriate to allow timely decisions regarding required disclosure.
(b) There was no change in the registrant’s internal control over financial reporting that occurred during the registrant’s second fiscal quarter of the period covered by this report that has materially affected, or is reasonably likely to materially affect, the registrant’s internal control over financial reporting.
Item 12. Exhibits.
(a)(1) Code of ethics required to be disclosed under Item 2 of Form N-CSR: Not applicable at this time.
(a)(2) Certifications pursuant to Rule 30a-2(a) under the Investment Company Act of 1940 (17 CFR 270.30a-2(a)) attached hereto as Exhibit 99.CERT.
(a)(3) Not applicable.
(b) Certification pursuant to Rule 30a-2(b) under the Investment Company Act of 1940 (17 CFR 270.30a-2(b)) attached hereto as Exhibit 99.906CERT.
SIGNATURES
Pursuant to the requirements of the Securities Exchange Act of 1934 and the Investment Company Act of 1940, the registrant has duly caused this report to be signed on its behalf by the undersigned, thereunto duly authorized.
(registrant) | Columbia Funds Institutional Trust |
| |||||
| |||||||
| |||||||
By (Signature and Title) |
| /s/ Christopher L. Wilson |
| ||||
|
| Christopher L. Wilson, President |
| ||||
| |||||||
| |||||||
Date |
| March 29, 2007 |
|
| |||
Pursuant to the requirements of the Securities Exchange Act of 1934 and the Investment Company Act of 1940, this report has been signed below by the following persons on behalf of the registrant and in the capacities and on the dates indicated.
By (Signature and Title) |
| /s/ Christopher L. Wilson |
|
| ||
| Christopher L. Wilson, President |
|
| |||
|
|
|
| |||
|
|
|
| |||
Date |
| March 29, 2007 |
|
| ||
|
|
|
| |||
|
|
|
| |||
By (Signature and Title) |
| /s/ J. Kevin Connaughton |
|
| ||
| J. Kevin Connaughton, Treasurer |
|
| |||
|
|
|
| |||
|
|
|
| |||
Date |
| March 29, 2007 |
|
| ||