UNITED STATES
SECURITIES AND EXCHANGE COMMISSION
Washington, D.C. 20549
FORM N-CSR
CERTIFIED SHAREHOLDER REPORT OF REGISTERED
MANAGEMENT INVESTMENT COMPANIES
Investment Company Act file number | 811-5857 | |||||||
| ||||||||
Columbia Funds Institutional Trust | ||||||||
(Exact name of registrant as specified in charter) | ||||||||
| ||||||||
One Financial Center, Boston, Massachusetts |
| 02111 | ||||||
(Address of principal executive offices) |
| (Zip code) | ||||||
| ||||||||
James R. Bordewick, Jr., Esq. | ||||||||
(Name and address of agent for service) | ||||||||
| ||||||||
Registrant’s telephone number, including area code: | 1-617-426-3750 |
| ||||||
| ||||||||
Date of fiscal year end: | July 31 |
| ||||||
| ||||||||
Date of reporting period: | January 31, 2009 |
| ||||||
Form N-CSR is to be used by management investment companies to file reports with the Commission not later than 10 days after the transmission to stockholders of any report that is required to be transmitted to stockholders under Rule 30e-1 under the Investment Company Act of 1940 (17 CFR 270.30e-1). The Commission may use the information provided on Form N-CSR in its regulatory, disclosure review, inspection, and policymaking roles.
A registrant is required to disclose the information specified by Form N-CSR, and the Commission will make this information public. A registrant is not required to respond to the collection of information contained in Form N-CSR unless the Form displays a currently valid Office of Management and Budget (“OMB”) control number. Please direct comments concerning the accuracy of the information collection burden estimate and any suggestions for reducing the burden to Secretary, Securities and Exchange Commission, 450 Fifth Street, NW, Washington, DC 20549-0609. The OMB has reviewed this collection of information under the clearance requirements of 44 U.S.C. § 3507.
Item 1. Reports to Stockholders.
![]()
CMG CORE BOND FUND
CMG SHORT TERM BOND FUND
CMG ULTRA SHORT TERM BOND FUND
CMG HIGH YIELD FUND
PORTFOLIOS OF COLUMBIA FUNDS INSTITUTIONAL TRUST
Semiannual Report
January 31, 2009
NOT FDIC INSURED
May Lose Value
No Bank Guarantee
NOT BANK ISSUED
Columbia Management Group, LLC ("Columbia Management") is the investment management division of Bank of America Corporation. Columbia Management entities furnish investment management services and products for institutional and individual investors. The funds are distributed by Columbia Management Distributors, Inc., member of FINRA, SIPC, part of Columbia Management and an affiliate of Bank of America Corporation.
Columbia Management Advisors, LLC ("CMA") is an SEC-registered investment advisor and an indirect, wholly owned subsidiary of Bank of America Corporation and is part of Columbia Management.
Table of Contents
| Fund Profile | |||||||
| CMG Core Bond Fund | 1 | ||||||
| CMG Short Term Bond Fund | 5 | ||||||
| CMG Ultra Short Term Bond Fund | 9 | ||||||
| CMG High Yield Fund | 13 | ||||||
| Financial Statements | |||||||
| Financial Highlights | 17 | ||||||
| Schedules of Investments | 21 | ||||||
| Statements of Assets and Liabilities | 46 | ||||||
| Statements of Operations | 47 | ||||||
| Statements of Changes in Net Assets | 48 | ||||||
| Notes to Financial Statements | 51 | ||||||
| Board Consideration and Approval of Investment Advisory Agreements | 64 | ||||||
| Summary of Management Fee Evaluation by Independent Fee Consultant | 68 | ||||||
The views expressed in this report reflect the current views of the respective parties. These views are not guarantees of future performance and involve certain risks, uncertainties and assumptions that are difficult to predict so actual outcomes and results may differ significantly from the views expressed. These views are subject to change at any time based upon economic, market or other conditions and the respective parties disclaim any responsibility to update such views. These views may not be relied on as investment advice and, because investment decisions for a CMG Fund are based on numerous factors, may not be relied on as an indication of trading intent on behalf of any particular CMG Fund. References to specific securities should not be construed as a recommendation or investment advice.
Performance data quoted represents past performance and current performance may be lower or higher. Past performance is no guarantee of future results. The investment return and principal value will fluctuate so that shares, when redeemed, may be worth more or less than the original cost. Please visit www.columbiamanagement.com for daily and most recent month-end performance updates.
CMG CORE BOND FUND
A Portfolio of Columbia Funds Institutional Trust
FUND PROFILE
Summary
• For the six-month period that ended January 31, 2009, CMG Core Bond Fund returned 1.01%. The fund's return was less than the 3.23% return of the Barclays Capital U.S. Aggregate Bond Index.1 However, the fund surpassed the average return of its peer group, the Lipper Corporate Debt Funds A Rated Classification2, which was negative 4.43% over the same period. The strong showing of the index reflects its relatively high concentration in Treasury securities, which outperformed all other fixed-income asset classes during the period. In general, funds that were positioned conservatively tended to outperform during this time of market upheaval.
• The economy was buffeted by a financial crisis in which widespread credit problems in the banking sector brought lending to a standstill. The fixed-income markets were characterized by an unprecedented shortage of liquidity and a flight to quality that pushed Treasury rates down to historical lows across the entire maturity spectrum. Against this backdrop, the fund's ownership of asset classes such as corporate bonds, mortgages, asset-backed securities and commercial mortgage-backed securities (CMBS) accounted for its underperformance relative to the index.
• A decision to restructure the fund's non-Treasury positions aided the fund's return. Within our mortgage holdings, we shifted our emphasis to agency-backed issues, which gained explicit backing from the federal government during the period. Within asset-backed holdings, we focused on securities backed by credit cards and by auto companies, leaving the beleaguered major auto makers out of the mix. Finally, the fund targeted seasoned CMBS that were issued when underwriting standards were tougher. In aggregate, these maneuvers added significant value for the period.
• Looking forward, we believe that the Federal Reserve Board has done all it can do with regard to monetary policy, with short-term interest rates now hovering close to zero. We do, however, expect the Treasury to continue to intervene in other ways to stimulate the economy. To the extent that these initiatives produce more debt, we anticipate a modest inflationary effect and have invested in TIPS – Treasury Inflation Protected Securities — in
1 The Barclays Capital U.S. Aggregate Bond Index (formerly the Lehman Brothers U.S. Aggregate Bond Index) is a market value-weighted index that tracks the daily price, coupon, pay-downs and total return performance of fixed-rate, publicly placed, dollar-denominated and non-convertible investment grade debt issues with at least $250 million par amount outstanding and with at least one year to final maturity. Indices are not investments, do not incur fees or expenses and are not professionally managed. It is not possible to invest directly in an index. Securities in the fund may not match those in an index.
2 Lipper Inc., a widely respected data provider in the industry, calculates an average total return (assuming reinvestment of distributions) for mutual funds with investment objectives similar to those of the fund. Lipper makes no adjustment for the effect of sales loads.
1
anticipation. More generally, we plan to monitor the government's efforts to jump-start the economy and the impact of those efforts on the credit markets.
Portfolio Management
Alexander D. Powers has co-managed the fund since December 2007 and has been associated with the advisor or its predecessors or affiliate organizations since 1996.
Jonathan P. Carlson has co-managed the fund since December 2007 and has been associated with the advisor or its predecessors or affiliate organizations since 2007.
Michael Zazzarino has co-managed the fund since December 2007 and has been associated with the advisor or its predecessors or affiliate organizations since 2005.
Carl W. Pappo has co-managed the fund since March 2008 and has been associated with the advisor or its predecessors or affiliate organizations since 1993.
The fund's top ten holdings (as a percentage of net assets) as of January 31, 2009 were:
| (%) | |||||||
| Federal National Mortgage Association, 4.000% 02/01/2039* | 6.8 | ||||||
| Federal National Mortgage Association, 5.500% 06/01/2038* | 6.5 | ||||||
| Federal National Mortgage Association, 5.000% 06/01/2038* | 6.2 | ||||||
| Federal National Mortgage Association, 4.500% 02/01/2039* | 5.8 | ||||||
| Federal National Mortgage Association, 5.000% 09/01/2037* | 5.0 | ||||||
| Federal National Mortgage Association, 5.000% 04/01/2038* | 3.5 | ||||||
| U.S. Treasury Notes, 3.750% 11/15/2018 | 2.9 | ||||||
| Federal National Mortgage Association, 5.000% 03/01/2038* | 1.7 | ||||||
| U.S. Treasury Notes, 0.875% 12/31/2010 | 1.5 | ||||||
| Federal National Mortgage Association, 5.000% 05/01/2038* | 1.4 | ||||||
* Mortgage-backed securities
Holdings are calculated as a percentage of net assets and are subject to change. Because the fund is actively managed, there is no guarantee the fund will continue to maintain the holdings breakdown listed. The fund's holdings and their weights within the portfolio may change as market conditions change.
Investing in fixed-income securities may involve certain risks, including the credit quality of individual issuers, possible prepayments, market or economic developments and yield and share price fluctuations due to changes in interest rates. When interest rates go up, bond prices generally drop, and vice versa.
2
Performance data quoted represents past performance and current performance may be lower or higher. Past performance is no guarantee of future results. The investment return and principal value will fluctuate so that shares, when redeemed, may be worth more or less than the original cost. Please visit www.columbiamanagement.com for daily and most recent month-end performance updates.
Average annual total return as of January 31, 2009 (%)
| Inception | 6-month (cumulative) | 1-year | 5-year | Life | |||||||||||||||
| CMG Core Bond Fund 09/01/00 | 1.01 | -0.62 | 3.35 | 5.06 | |||||||||||||||
| Barclays Capital U.S. Aggregate Bond Index | 3.23 | 2.59 | 4.30 | 5.93 | |||||||||||||||
Average annual total return as of December 31, 2008 (%)
| Inception | 6-month (cumulative) | 1-year | 5-year | Life | |||||||||||||||
| CMG Core Bond Fund 09/01/00 | 0.28 | 0.45 | 3.49 | 5.09 | |||||||||||||||
| Barclays Capital U.S. Aggregate Bond Index | 4.07 | 5.24 | 4.65 | 6.10 | |||||||||||||||
Index performance is from September 1, 2000.
Performance results reflect any fee waivers or reimbursements of fund expenses by the investment advisor and/or any of its affiliates. Absent these fee waivers or expense reimbursement arrangements, performance results would have been lower. All results shown assume reinvestment of distributions and do not reflect the deduction of taxes that a shareholder may pay on fund distributions or on the redemption of fund shares.
The fund's annual operating expense ratios, with and without contractual waivers, as stated in the fund's prospectus that is current as of the date of this report, are 0.25% and 0.33%, respectively, of average annual net assets. Differences in expense ratios disclosed elsewhere in this report may result from including fee waivers and expense reimbursements as well as different time periods used in calculating the ratios. The contractual waiver expires 11/30/2009.
Performance of a $3,000,000 investment, September 1, 2000 to January 31, 2009
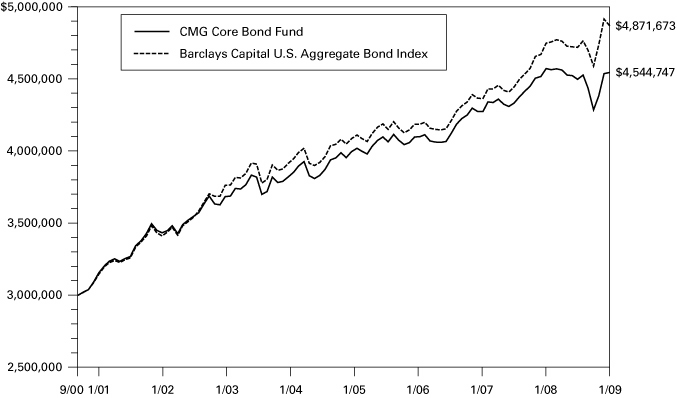
The chart above compares the results of a hypothetical minimum initial $3,000,000 investment in the fund to the index during the stated time period and does not reflect the deduction of taxes that a shareholder may pay on fund distributions or on the redemption of fund shares.
The Barclays Capital U.S. Aggregate Bond Index is a market value-weighted index that tracks the daily price, coupon, pay-downs, and total return performance of fixed-rate, publicly placed, dollar-denominated, and non-convertible investment grade debt issues with at least $250 million par amount outstanding and with at least one year to final maturity. Indices are not investments, do not incur fees or expenses and are not professionally managed. It is not possible to invest directly in an index. Securities in the fund may not match those in an index.
3
UNDERSTANDING YOUR EXPENSES – CMG Core Bond Fund
As a fund shareholder, you incur ongoing costs, which generally include investment advisory fees and other fund expenses. The information on this page is intended to help you understand the ongoing costs of investing in the fund and to compare these costs with the ongoing costs of investing in other mutual funds.
Analyzing your fund's expenses
To illustrate these ongoing costs, we have provided an example and calculated the expenses paid by investors during the period. The information in the following table is based on an initial investment of $1,000, which is invested at the beginning of the period and held for the entire period. Expense information is calculated two ways and each method provides you with different information. The amount listed in the "Actual" column is calculated using the fund's actual operating expenses and total return for the period. The amount listed in the "Hypothetical" column assumes that the return each year is 5% before expenses and is calculated based on the fund's actual operating expenses. You should not use the hypothetical account values and expenses to estimate either your actual account balance at the end of the period or the expenses you paid during this period.
Estimating your actual expenses
To estimate the expenses that you paid over the period, first you will need your account balance at the end of the period:
1. Divide your ending account balance by $1,000. For example, if an account balance was $8,600 at the end of the period, the result would be 8.6.
2. In the section of the table below titled "Expenses paid during the period," locate the amount labeled "Actual." Multiply this number by the result from step 1. Your answer is an estimate of the expenses you paid on your account during the period.
August 1, 2008 – January 31, 2009
| Account value at the beginning of the period ($) | Account value at the end of the period ($) | Expenses paid during the period ($) | Fund's annualized expense ratio (%) | ||||||||||||||||||||||||
| Actual | Hypothetical | Actual | Hypothetical | Actual | Hypothetical | Actual | |||||||||||||||||||||
| 1,000.00 | 1,000.00 | 1,010.08 | 1,023.95 | 1.27 | 1.28 | 0.25 | |||||||||||||||||||||
Expenses paid during the period are equal to the annualized expense ratio of 0.25%, multiplied by the average account value over the period, then multiplied by the number of days in the fund's most recent fiscal half-year and divided by 365.
Had the investment advisor and/or any of its affiliates not waived fees or reimbursed a portion of expenses, account value at end of the period would have been reduced.
It is important to note that the expense amounts shown in the table are meant to highlight only ongoing costs of investing in the fund. Therefore, the hypothetical examples provided may not help you determine the relative total costs of owning shares of different funds.
Compare with other funds
Since all mutual funds are required to include the same hypothetical calculations about expenses in shareholder reports, you can use this information to compare the ongoing costs of investing in the fund with other funds. To do so, compare the 5% hypothetical example with the 5% hypothetical examples that appear in the shareholder reports of other funds. As you compare hypothetical examples of other funds, it is important to note that hypothetical examples are meant to highlight the ongoing costs of investing in a fund.
4
Performance data quoted represents past performance, and current performance may be lower or higher. Past performance is no guarantee of future results. The investment return and principal value will fluctuate so that shares, when redeemed, may be worth more or less than the original cost. Please visit www.columbiamanagement.com for daily and most recent month-end performance updates.
CMG SHORT TERM BOND FUND
A Portfolio of Columbia Funds Institutional Trust
FUND PROFILE
Summary
• For the six-month period that ended January 31, 2009, CMG Short Term Bond Fund returned 0.02%. The fund underperformed the Merrill Lynch 1-3 Year U.S. Treasury Index,1 which returned 3.64% during the period. The fund outperformed the average return of its peer group, the Lipper Short Investment Grade Debt Funds Classification2, which was negative 3.99%. The period was characterized by a flight to quality in which Treasury securities outperformed all other fixed-income asset classes, and conservatively positioned funds tended to outperform those with greater exposure to riskier market sectors.
• Although a flight-to-quality mindset was already in evidence when the period began, it intensified as the period wore on. A weakening economy, rising unemployment, tight credit, and the fears generated by high-profile failures, such as the Lehman bankruptcy, created a demand for Treasury securities that pushed yields to historical lows across the entire maturity spectrum, and the Treasury sector outperformed virtually every other fixed income sector. In this environment, the fund's positions in commercial mortgage backed securities (CMBS) hurt relative performance as did exposure to corporate bonds. The fund's investments in the insurance, REIT and brokerage sectors were especially disappointing. The fund responded to the unfolding financial crisis by trimming its corporate bond holdings, a move that aided six-month performance. In particular, investments in the health care, energy and telecommunications sector s outperformed the larger corporate market.
• We expect the Federal Reserve Board and the U.S. Treasury to continue to take steps aimed at easing the ongoing liquidity crunch, and the new administration is expected to maintain a policy goal of keeping mortgage rates low. Nonetheless, with interest rates at historical lows, we do not anticipate lengthening the duration of the portfolio versus our index. (Duration is a measure of interest rate sensitivity, similar to maturity). We continue to favor high quality corporate bonds and we remain overweight with respect to the banking, utilities and energy sectors. We also carry overweight positions in those securitized sectors that we believe have become over-discounted relative to the quality of the underlying collateral. In general, we believe that the magnitude of the yield advantage offered by non-Treasury investments could benefit the fund's long-term performance once the current economic crisis is resolved and the market returns to a more normal, less risk-averse mentality.
1 The Merrill Lynch 1-3 Year U.S. Treasury Index tracks the performance of sovereign debt publicly issued in the US domestic market with maturities of 1-3 years and a minimum amount outstanding of $1 billion. Indices are not investments, do not incur fees or expenses and are not professionally managed. It is not possible to invest directly in an index. Securities in the fund may not match those in an index.
As of 01/01/2009, Merrill Lynch & Co., Inc. is a wholly-owned subsidiary of Bank of America Corporation and an affiliate of Columbia Management.
2 Lipper Inc., a widely respected data provider in the industry, calculates an average total return (assuming reinvestment of distributions) for mutual funds with investment objectives similar to those of the fund. Lipper makes no adjustment for the effect of sales loads.
5
Portfolio Management
Leonard A. Aplet has co-managed the fund since February 1998 and has been associated with the advisor or its predecessors or affiliate organizations since 1987.
Ronald Stahl has co-managed the fund since November 2006 and has been associated with the advisor or its predecessors or affiliate organizations since 1998.
The fund's top ten holdings (as a percentage of net assets) as of January 31, 2009 were:
| (%) | |||||||
| Federal Home Loan Mortgage Corp., 5.500% 11/15/2028 | 2.6 | ||||||
| Federal National Mortgage Association, 2.750% 04/11/2011 | 2.5 | ||||||
| Federal National Mortgage Association, 5.000% 01/01/2024* | 2.3 | ||||||
| U.S. Treasury Notes, 2.750% 10/31/2013 | 2.0 | ||||||
| Federal National Mortgage Association, 5.000% 02/18/2024* | 1.9 | ||||||
| AmeriCredit Automobile Receivables Trust, 5.420% 05/07/2012 | 1.8 | ||||||
| Federal Home Loan Bank, 5.250% 06/11/2010 | 1.5 | ||||||
| Nissan Auto Receivables Owner Trust, 5.220% 11/15/2011 | 1.5 | ||||||
| USAA Auto Owner Trust, 4.890% 08/15/2012 | 1.5 | ||||||
| Federal Home Loan Mortgage Corp., 5.500% 05/15/2034 | 1.4 | ||||||
* Mortgage-backed securities
Holdings are calculated as a percentage of net assets and are subject to change. Because the fund is actively managed, there is no guarantee the fund will continue to maintain the holdings breakdown listed. The fund's holdings and their weights within the portfolio may change as market conditions change.
Investing in fixed-income securities may involve certain risks, including the credit quality of individual issuers, possible prepayments, market or economic developments and yield and share price fluctuations due to changes in interest rates. When interest rates go up, bond prices generally drop, and vice versa.
6
Performance data quoted represents past performance and current performance may be lower or higher. Past performance is no guarantee of future results. The investment return and principal value will fluctuate so that shares, when redeemed, may be worth more or less than the original cost. Please visit www.columbiamanagement.com for daily and most recent month-end performance updates.
Average annual total return as of January 31, 2009 (%)
| Inception 02/02/98 | 6-month (cumulative) | 1-year | 5-year | 10-year | |||||||||||||||||||
| CMG Short Term Bond Fund | 0.02 | 0.25 | 3.20 | 4.37 | |||||||||||||||||||
| Merrill Lynch 1-3 Year U.S. Treasury Index | 3.64 | 4.43 | 3.95 | 4.64 | |||||||||||||||||||
Average annual total return as of December 31, 2008 (%)
| Inception 02/02/98 | 6-month (cumulative) | 1-year | 5-year | 10-year | |||||||||||||||||||
| CMG Short Term Bond Fund | -1.30 | 0.38 | 3.01 | 4.31 | |||||||||||||||||||
| Merrill Lynch 1-3 Year U.S. Treasury Index | 4.42 | 6.61 | 4.06 | 4.71 | |||||||||||||||||||
Performance results reflect any fee waivers or reimbursements of fund expenses by the investment advisor and/or any of its affiliates. Absent these fee waivers or expense reimbursement arrangements, performance results would have been lower. All results shown assume reinvestment of distributions and do not reflect the deduction of taxes that a shareholder may pay on fund distributions or on the redemption of fund shares.
The fund's annual operating expense ratios, with and without contractual waivers, as stated in the fund's prospectus that is current as of the date of this report, are 0.25% and 0.30%, respectively, of average annual net assets. Differences in expense ratios disclosed elsewhere in this report may result from including fee waivers and expense reimbursements as well as different time periods used in calculating the ratios. The contractual waiver expires 11/30/2009.
Performance of a $3,000,000 investment, February 1, 1999 to January 31, 2009
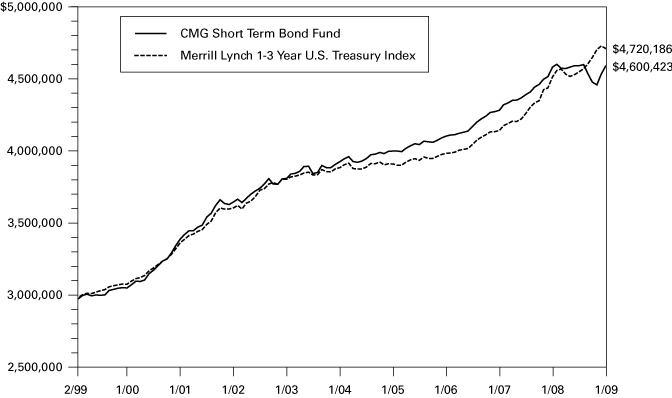
The chart above compares the results of a hypothetical minimum initial $3,000,000 investment in the fund to the index during the stated time period and does not reflect the deduction of taxes that a shareholder may pay on fund distributions or on the redemption of fund shares.
The Merrill Lynch 1-3 Year U.S. Treasury Index tracks the performance of sovereign debt publicly issued in the US domestic market with maturities of 1-3 years and a minimum amount outstanding of $1 billion. Indices are not investments, do not incur fees or expenses and are not professionally managed. It is not possible to invest directly in an index. Securities in the fund may not match those in an index.
7
UNDERSTANDING YOUR EXPENSES – CMG Short Term Bond Fund
As a fund shareholder, you incur ongoing costs, which generally include investment advisory fees and other fund expenses. The information on this page is intended to help you understand the ongoing costs of investing in the fund and to compare these costs with the ongoing costs of investing in other mutual funds.
Analyzing your fund's expenses
To illustrate these ongoing costs, we have provided an example and calculated the expenses paid by investors during the period. The information in the following table is based on an initial investment of $1,000, which is invested at the beginning of the period and held for the entire period. Expense information is calculated two ways and each method provides you with different information. The amount listed in the "Actual" column is calculated using the fund's actual operating expenses and total return for the period. The amount listed in the "Hypothetical" column assumes that the return each year is 5% before expenses and is calculated based on the fund's actual operating expenses. You should not use the hypothetical account values and expenses to estimate either your actual account balance at the end of the period or the expenses you paid during this period.
Estimating your actual expenses
To estimate the expenses that you paid over the period, first you will need your account balance at the end of the period:
1. Divide your ending account balance by $1,000. For example, if an account balance was $8,600 at the end of the period, the result would be 8.6.
2. In the section of the table below titled "Expenses paid during the period," locate the amount labeled "Actual." Multiply this number by the result from step 1. Your answer is an estimate of the expenses you paid on your account during the period.
August 1, 2008 – January 31, 2009
| Account value at the beginning of the period ($) | Account value at the end of the period ($) | Expenses paid during the period ($) | Fund's annualized expense ratio (%) | ||||||||||||||||||||||||
| Actual | Hypothetical | Actual | Hypothetical | Actual | Hypothetical | Actual | |||||||||||||||||||||
| 1,000.00 | 1,000.00 | 1,000.20 | 1,023.95 | 1.26 | 1.28 | 0.25 | |||||||||||||||||||||
Expenses paid during the period are equal to the annualized expense ratio of 0.25%, multiplied by the average account value over the period, then multiplied by the number of days in the fund's most recent fiscal half-year and divided by 365.
Had the investment advisor and/or any of its affiliates not waived fees or reimbursed a portion of expenses, account value at end of the period would have been reduced.
It is important to note that the expense amounts shown in the table are meant to highlight only ongoing costs of investing in the fund. Therefore, the hypothetical examples provided may not help you determine the relative total costs of owning shares of different funds.
Compare with other funds
Since all mutual funds are required to include the same hypothetical calculations about expenses in shareholder reports, you can use this information to compare the ongoing costs of investing in the fund with other funds. To do so, compare the 5% hypothetical example with the 5% hypothetical examples that appear in the shareholder reports of other funds. As you compare hypothetical examples of other funds, it is important to note that hypothetical examples are meant to highlight the ongoing costs of investing in a fund.
8
Performance data quoted represents past performance, and current performance may be lower or higher. Past performance is no guarantee of future results. The investment return and principal value will fluctuate so that shares, when redeemed, may be worth more or less than the original cost. Please visit www.columbiamanagement.com for daily and most recent month-end performance updates.
CMG ULTRA SHORT TERM BOND FUND
A Portfolio of Columbia Funds Institutional Trust
FUND PROFILE
Summary
• For the six-month period that ended January 31, 2009, CMG Ultra Short Term Bond Fund returned negative 0.12%. The fund underperformed its benchmark, the Citigroup One-Year U.S. Treasury Bill Index1, which returned 2.22%. However, it outperformed the average return of its peer group, the Lipper Ultra-Short Obligations Funds Classification2, which was negative 3.24%. The fund's conservative orientation aided its performance relative to its peer group at a time when Treasury securities were by far the best performing fixed-income asset class.
• The market environment in the past six months was challenging for fixed-income investors. Poor financial health among major brokerage firms resulted in illiquidity and bouts of irrationality in trading and pricing. The collapse of Lehman Brothers in September created a new set of fears for investors already cautious because of rising unemployment, lower factory orders and other signs that the economy was in recession. As liquidity dried up, the fund responded by boosting its levels of cash and high quality commercial paper. At one point 15% of net assets were held in overnight paper – more than three times the normal level for these holdings.
• More generally, the fund adopted a conservative stance and reduced its commitments to corporate bonds and asset-backed securities. This shift in portfolio composition was gradual, as in some cases market illiquidity required us to hold securities until maturity as opposed to selling them in the open market. The impact of this shift in composition on portfolio performance was positive, as the non-Treasury sectors that were reduced underperformed during the period.
• Looking forward, we do not expect the market's dynamics to change quickly even though the Federal Reserve Board has made unprecedented efforts to inject liquidity and confidence into the marketplace. As a result, we plan to maintain the portfolio's conservative stance and high quality composition. We expect to retain our current focus on industrials and utilities as well as FDIC-insured bonds as opposed to non-guaranteed issuers from the financial sector.
1 The Citigroup One-Year U.S. Treasury Bill Index consists of a single 1-year U.S. Treasury Bill whose return is tracked until its maturity. Indices are not investments, do not incur fees or expenses and are not professionally managed. It is not possible to invest directly in an index. Securities in the fund may not match those in an index.
2 Lipper Inc., a widely respected data provider in the industry, calculates an average total return (assuming reinvestment of distributions) for mutual funds with similar investment objectives as those of the fund. Lipper makes no adjustments for the effect of sales loads.
9
Portfolio Management
Guy C. Holbrook has managed the fund since March 2004 and has been associated with the advisor or its predecessors or affiliate organizations since 1998.
The fund's top ten holdings (as a percentage of net assets) as of January 31, 2009 were:
| (%) | |||||||
| Federal National Mortgage Association, 4.250% 05/15/2009 | 3.0 | ||||||
| Federal Home Loan Bank, 2.204% 02/19/2010 | 3.0 | ||||||
| Bank One Issuance Trust, 3.940% 04/16/2012 | 2.0 | ||||||
| National City Bank/Cleveland OH, 4.250% 01/29/2010 | 1.8 | ||||||
| E.I. Du Pont de Nemours & Co., 6.875% 10/15/2009 | 1.6 | ||||||
| Federal Home Loan Mortgage Corp., 5.000% 06/11/2009 | 1.5 | ||||||
| Berkshire Hathaway Finance Corp., 1.654% 01/11/2011 | 1.5 | ||||||
| Carmax Auto Owner Trust, 5.150% 02/15/2011 | 1.2 | ||||||
| Pepsi Bottling Holdings, Inc., 5.625% 02/17/2009 | 1.2 | ||||||
| Leek Finance PLC, 1.635% 12/21/2038 | 1.1 | ||||||
Holdings are calculated as a percentage of net assets, and are subject to change. Because the fund is actively managed, there is no guarantee the fund will continue to maintain the holdings breakdown listed. The fund's holdings and their weights within the portfolio may change as market conditions change.
Investing in fixed-income securities may involve certain risks, including the credit quality of individual issuers, possible prepayments, market or economic developments and yield and share price fluctuations due to changes in interest rates. When interest rates go up, bond prices generally drop, and vice versa.
10
Performance data quoted represents past performance and current performance may be lower or higher. Past performance is no guarantee of future results. The investment return and principal value will fluctuate so that shares, when redeemed, may be worth more or less than the original cost. Please visit www.columbiamanagement.com for daily and most recent month-end performance updates.
Average annual total return as of January 31, 2009 (%)
| Inception | 6-month (cumulative) | 1-year | Life | ||||||||||||||||
| CMG Ultra Short Term Bond Fund | 03/08/04 | -0.12 | 0.34 | 2.33 | |||||||||||||||
| Citigroup One-Year U.S. Treasury Bill Index | 2.22 | 3.41 | 3.53 | ||||||||||||||||
Average annual total return as of December 31, 2008 (%)
| Inception | 6-month (cumulative) | 1-year | Life | ||||||||||||||||
| CMG Ultra Short Term Bond Fund | 03/08/04 | -0.95 | 0.32 | 2.22 | |||||||||||||||
| Citigroup One-Year U.S. Treasury Bill Index | 2.59 | 4.81 | 3.60 | ||||||||||||||||
Index performance is from March 8, 2004.
Performance results reflect any fee waivers or reimbursements of fund expenses by the investment advisor and/or any of its affiliates. Absent these fee waivers or expense reimbursement arrangements, performance results would have been lower. All results shown assume reinvestment of distributions and do not reflect the deduction of taxes that a shareholder may pay on fund distributions or on the redemption of fund shares.
The fund's annual operating expense ratios, with and without contractual waivers, as stated in the fund's prospectus that is current as of the date of this report, are 0.25% and 0.32%, respectively, of average annual net assets. Differences in expense ratios disclosed elsewhere in this report may result from including fee waivers and expense reimbursements as well as different time periods used in calculating the ratios. The contractual waiver expires 11/30/2009.
Performance of a $3,000,000 investment, March 8, 2004 to January 31, 2009
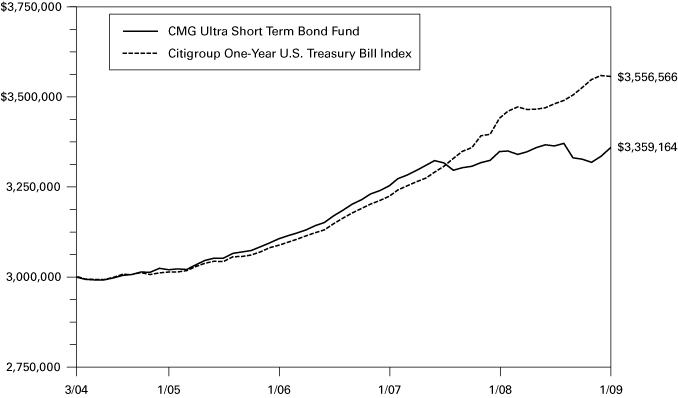
The chart above compares the results of a hypothetical minimum initial $3,000,000 investment in the fund to the index during the stated time period and does not reflect the deduction of taxes that a shareholder may pay on fund distributions or on the redemption of fund shares.
The Citigroup One-Year U.S. Treasury Bill Index consists of a single 1-year U.S. Treasury Bill whose return is tracked until its maturity. Indices are not investments, do not incur fees or expenses and are not professionally managed. It is not possible to invest directly in an index. Securities in the fund may not match those in an index.
11
UNDERSTANDING YOUR EXPENSES – CMG Ultra Short Term Bond Fund
As a fund shareholder, you incur ongoing costs, which generally include investment advisory fees and other fund expenses. The information on this page is intended to help you understand the ongoing costs of investing in the fund and to compare these costs with the ongoing costs of investing in other mutual funds.
Analyzing your fund's expenses
To illustrate these ongoing costs, we have provided an example and calculated the expenses paid by investors during the period. The information in the following table is based on an initial investment of $1,000, which is invested at the beginning of the period and held for the entire period. Expense information is calculated two ways and each method provides you with different information. The amount listed in the "Actual" column is calculated using the fund's actual operating expenses and total return for the period. The amount listed in the "Hypothetical" column assumes that the return each year is 5% before expenses and is calculated based on the fund's actual operating expenses. You should not use the hypothetical account values and expenses to estimate either your actual account balance at the end of the period or the expenses you paid during this period.
Estimating your actual expenses
To estimate the expenses that you paid over the period, first you will need your account balance at the end of the period:
1. Divide your ending account balance by $1,000. For example, if an account balance was $8,600 at the end of the period, the result would be 8.6.
2. In the section of the table below titled "Expenses paid during the period," locate the amount labeled "Actual." Multiply this number by the result from step 1. Your answer is an estimate of the expenses you paid on your account during the period.
August 1, 2008 – January 31, 2009
| Account value at the beginning of the period ($) | Account value at the end of the period ($) | Expenses paid during the period ($) | Fund's annualized expense ratio (%) | ||||||||||||||||||||||||
| Actual | Hypothetical | Actual | Hypothetical | Actual | Hypothetical | Actual | |||||||||||||||||||||
| 1,000.00 | 1,000.00 | 998.79 | 1,023.95 | 1.26 | 1.28 | 0.25 | |||||||||||||||||||||
Expenses paid during the period are equal to the annualized expense ratio of 0.25%, multiplied by the average account value over the period, then multiplied by the number of days in the fund's most recent fiscal half-year and divided by 365.
Had the investment advisor and/or any of its affiliates not waived fees or reimbursed a portion of expenses, account value at end of the period would have been reduced.
It is important to note that the expense amounts shown in the table are meant to highlight only ongoing costs of investing in the fund. Therefore, the hypothetical examples provided may not help you determine the relative total costs of owning shares of different funds.
Compare with other funds
Since all mutual funds are required to include the same hypothetical calculations about expenses in shareholder reports, you can use this information to compare the ongoing costs of investing in the fund with other funds. To do so, compare the 5% hypothetical example with the 5% hypothetical examples that appear in the shareholder reports of other funds. As you compare hypothetical examples of other funds, it is important to note that hypothetical examples are meant to highlight the ongoing costs of investing in a fund.
12
Performance data quoted represents past performance, and current performance may be lower or higher. Past performance is no guarantee of future results. The investment return and principal value will fluctuate so that shares, when redeemed, may be worth more or less than the original cost. Please visit www.columbiamanagement.com for daily and most recent month-end performance updates.
CMG HIGH YIELD FUND
A Portfolio of Columbia Funds Institutional Trust
FUND PROFILE
Summary
• For the six-month period that ended January 31, 2009, CMG High Yield Fund returned negative 13.36%. It underperformed the JPMorgan Developed BB High Yield Index,1 which returned negative 10.78%. However, it held up significantly better in a difficult environment than the average fund in its peer group, the Lipper High Current Yields Classification2, which returned negative 20.06%. As a general rule, performance during the past six months was a function of credit quality. The fund's overall credit quality was, on average, lower than the BB level of the JPMorgan index, but we believe that the fund was more conservatively oriented than its peer group, which accounted for its ability to stem losses better than its average competitor.
• The high-yield market faced a very difficult environment over the past six months. Investors shied away from corporate bonds and the high-yield sector, in particular, as the overall illiquidity of the fixed-income markets deepened the risk-averse mindset in the midst of an ongoing credit crisis. Against this backdrop, the fund made a concentrated effort to shed investments in companies with weak operating prospects and replace them with holdings that had the potential to improve the portfolio's credit profile. The fund's holdings in the utility and energy sectors were helpful to relative performance, with Echostar and Amerigas Partners (2.3% and 0.7% of net assets, respectively) posting especially strong showings. Poor performers included asset manager Nuveen Investments (now less than 0.01% of net assets), whose performance suffered in line with other financial companies, and Huntsman International (0.4% of ne t assets), whose bonds lost value when a competitor's planned takeover of the company fell through.
• Now that the economy has entered into recession, we would not be surprised to see an increase in the corporate default rate. This would represent a significant challenge to the high-yield marketplace. With that in mind, we plan to continue to emphasize conservative, higher quality issues, a stance that we believe should continue to be in the best interests of our shareholders. Our view is that companies that generate solid free cash flow are positioned to endure near-term economic weakness better than those with weaker financial resources. In addition, we believe they offer upside potential when conditions improve.
1 The JP Morgan Developed BB High Yield Index is designed to mirror the investable universe of the U.S. dollar developed, BB-rated, high yield corporate debt market. Indices are not investments, do not incur fees or expenses and are not professionally managed. It is not possible to invest directly in an index. Securities in the fund may not match those in an index.
2 Lipper Inc., a widely respected data provider in the industry, calculates an average total return (assuming reinvestment of distributions) for mutual funds with investment objectives similar to those of the fund. Lipper makes no adjustment for the effect of sales loads.
13
Portfolio Management
Kevin L. Cronk has managed the fund since September 2005 and has been associated with the advisor or its predecessors or affiliate organizations since August 1999.
The fund's top ten issuers (as a percentage of net assets) as of January 31, 2009 were:
| (%) | |||||||
| HCA, Inc. | 2.9 | ||||||
| EchoStar DBS Corp. | 2.3 | ||||||
| Freeport-McMoRan Copper & Gold, Inc. | 1.9 | ||||||
| Windstream Corp. | 1.9 | ||||||
| Chesapeake Energy Corp. | 1.8 | ||||||
| TXU Energy Co. LLC | 1.8 | ||||||
| El Paso Corp. | 1.6 | ||||||
| Qwest Corp. | 1.6 | ||||||
| DirecTV Holdings LLC | 1.5 | ||||||
| L-3 Communications Corp. | 1.5 | ||||||
Issuers are calculated as a percentage of net assets, and are subject to change. Because the fund is actively managed, there is no guarantee the fund will continue to maintain the issuers breakdown listed. The fund's issuers and their weights within the portfolio may change as market conditions change.
Investing in fixed-income securities may involve certain risks, including the credit quality of individual issuers, possible prepayments, market or economic developments, yields and share price fluctuations due to changes in interest rates. When interest rates go up, bond prices generally drop, and vice versa.
Investments in high yield or "junk" bonds offer the potential for higher income than investments in investment-grade bonds, but they also have a higher degree of risk. Changes in economic conditions or other circumstances may adversely affect a high-yield bond issuer's ability to make timely principal and interest payments.
14
Performance data quoted represents past performance and current performance may be lower or higher. Past performance is no guarantee of future results. The investment return and principal value will fluctuate so that shares, when redeemed, may be worth more or less than the original cost. Please visit www.columbiamanagement.com for daily and most recent month-end performance updates.
Average annual total return as of January 31, 2009 (%)
| Inception | 6-month (cumulative) | 1-year | 5-year | 10-year | |||||||||||||||
| CMG High Yield Fund 07/06/94 | -13.36 | -13.15 | 0.70 | 3.34 | |||||||||||||||
| JPMorgan Developed BB High Yield Index | -10.78 | -11.06 | 2.12 | 5.22 | |||||||||||||||
Average annual total return as of December 31, 2008 (%)
| Inception | 6-month (cumulative) | 1-year | 5-year | 10-year | |||||||||||||||
| CMG High Yield Fund 07/06/94 | -19.06 | -19.89 | -0.42 | 2.78 | |||||||||||||||
| JPMorgan Developed BB High Yield Index | -16.81 | -16.81 | 0.97 | 4.62 | |||||||||||||||
Performance results reflect any fee waivers or reimbursements of fund expenses by the investment advisor and/or any of its affiliates. Absent these fee waivers or expense reimbursement arrangements, performance results would have been lower. All results shown assume reinvestment of distributions and do not reflect the deduction of taxes that a shareholder may pay on fund distributions or on the redemption of fund shares.
The fund's annual operating expense ratios, with and without contractual waivers, as stated in the fund's prospectus that is current as of the date of this report, are 0.40% and 0.54%, respectively, of average annual net assets. Differences in expense ratios disclosed elsewhere in this report may result from including fee waivers and expense reimbursements as well as different time periods used in calculating the ratios. The contractual waiver expires 11/30/2009.
Performance of a $3,000,000 investment, February 1, 1999 to January 31, 2009
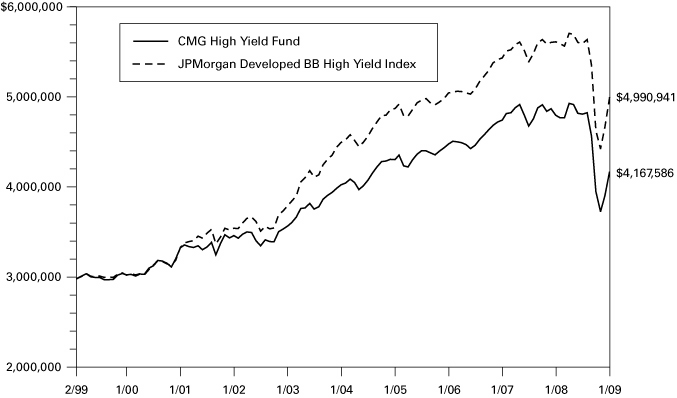
The chart above compares the results of a hypothetical minimum initial $3,000,000 investment in the fund to the index during the stated time period and does not reflect the deduction of taxes that a shareholder may pay on fund distributions or on the redemption of fund shares.
The JPMorgan Developed BB High Yield Index is designed to mirror the investable universe of the U.S. dollar developed, BB-rated, high yield corporate debt market. Indices are not investments, do not incur fees or expenses and are not professionally managed. It is not possible to invest directly in an index. Securities in the fund may not match those in an index.
15
UNDERSTANDING YOUR EXPENSES – CMG High Yield Fund
As a fund shareholder, you incur ongoing costs, which generally include investment advisory fees and other fund expenses. The information on this page is intended to help you understand the ongoing costs of investing in the fund and to compare these costs with the ongoing costs of investing in other mutual funds.
Analyzing your fund's expenses
To illustrate these ongoing costs, we have provided an example and calculated the expenses paid by investors during the period. The information in the following table is based on an initial investment of $1,000, which is invested at the beginning of the period and held for the entire period. Expense information is calculated two ways and each method provides you with different information. The amount listed in the "Actual" column is calculated using the fund's actual operating expenses and total return for the period. The amount listed in the "Hypothetical" column assumes that the return each year is 5% before expenses and is calculated based on the fund's actual operating expenses. You should not use the hypothetical account values and expenses to estimate either your actual account balance at the end of the period or the expenses you paid during this period.
Estimating your actual expenses
To estimate the expenses that you paid over the period, first you will need your account balance at the end of the period:
1. Divide your ending account balance by $1,000. For example, if an account balance was $8,600 at the end of the period, the result would be 8.6.
2. In the section of the table below titled "Expenses paid during the period," locate the amount labeled "Actual." Multiply this number by the result from step 1. Your answer is an estimate of the expenses you paid on your account during the period.
August 1, 2008 – January 31, 2009
| Account value at the beginning of the period ($) | Account value at the end of the period ($) | Expenses paid during the period ($) | Fund's annualized expense ratio (%) | ||||||||||||||||||||||||
| Actual | Hypothetical | Actual | Hypothetical | Actual | Hypothetical | Actual | |||||||||||||||||||||
| 1,000.00 | 1,000.00 | 866.41 | 1,023.19 | 1.88 | 2.04 | 0.40 | |||||||||||||||||||||
Expenses paid during the period are equal to the annualized expense ratio of 0.40%, multiplied by the average account value over the period, then multiplied by the number of days in the fund's most recent fiscal half-year and divided by 365.
Had the investment advisor and/or any of its affiliates not waived fees or reimbursed a portion of expenses, account value at end of the period would have been reduced.
It is important to note that the expense amounts shown in the table are meant to highlight only ongoing costs of investing in the fund. Therefore, the hypothetical examples provided may not help you determine the relative total costs of owning shares of different funds.
Compare with other funds
Since all mutual funds are required to include the same hypothetical calculations about expenses in shareholder reports, you can use this information to compare the ongoing costs of investing in the fund with other funds. To do so, compare the 5% hypothetical example with the 5% hypothetical examples that appear in the shareholder reports of other funds. As you compare hypothetical examples of other funds, it is important to note that hypothetical examples are meant to highlight the ongoing costs of investing in a fund.
16
CMG CORE BOND FUND
A Portfolio of Columbia Funds Institutional Trust
FINANCIAL HIGHLIGHTS
(For a Share Outstanding Throughout Each Period)
| (Unaudited) Six Months Ended January 31, | Year Ended July 31, | ||||||||||||||||||||||||||
| 2009 | 2008 | 2007 | 2006 | 2005 | 2004 | ||||||||||||||||||||||
| Net asset value, beginning of period | $ | 9.88 | $ | 10.03 | $ | 10.05 | $ | 10.42 | $ | 10.36 | $ | 10.38 | |||||||||||||||
| Income from investment operations: | |||||||||||||||||||||||||||
| Net investment income (a) | 0.24 | 0.51 | 0.52 | 0.48 | 0.42 | 0.37 | |||||||||||||||||||||
| Net realized and unrealized gain (loss) on investments and futures contacts | (0.15 | ) | (0.12 | ) | (0.02 | ) | (0.33 | ) | 0.09 | 0.11 | |||||||||||||||||
| Total from investment operations | 0.09 | 0.39 | 0.50 | 0.15 | 0.51 | 0.48 | |||||||||||||||||||||
| Less distributions to shareholders: | |||||||||||||||||||||||||||
| From net investment income | (0.24 | ) | (0.54 | ) | (0.52 | ) | (0.51 | ) | (0.45 | ) | (0.41 | ) | |||||||||||||||
| From net realized gains | - | - | - | (0.01 | ) | - | (0.09 | ) | |||||||||||||||||||
| Total distributions to shareholders | (0.24 | ) | (0.54 | ) | (0.52 | ) | (0.52 | ) | (0.45 | ) | (0.50 | ) | |||||||||||||||
| Net asset value, end of period | $ | 9.73 | $ | 9.88 | $ | 10.03 | $ | 10.05 | $ | 10.42 | $ | 10.36 | |||||||||||||||
| Total return (b)(c) | 1.01 | %(d) | 3.84 | % | 5.06 | % | 1.46 | % | 4.98 | % | 4.67 | % | |||||||||||||||
| Ratios to Average Net Assets/Supplemental Data: | |||||||||||||||||||||||||||
| Net expenses before interest expense | 0.25 | %(e) | 0.25 | % | 0.25 | % | 0.25 | %(f) | 0.25 | %(f) | 0.35 | %(f) | |||||||||||||||
| Interest expense | - | - | %(g) | - | - | - | - | ||||||||||||||||||||
| Net expense | 0.25 | %(e) | 0.25 | % | 0.25 | % | 0.25 | % | 0.25 | % | 0.35 | % | |||||||||||||||
| Waiver/Reimbursement | 0.09 | %(e) | 0.08 | % | 0.13 | % | 0.10 | % | 0.06 | % | 0.25 | % | |||||||||||||||
| Net investment income | 4.96 | %(e) | 5.07 | % | 5.07 | % | 4.65 | %(f) | 4.01 | %(f) | 3.54 | %(f) | |||||||||||||||
| Portfolio turnover rate | 124 | %(d) | 272 | % | 95 | % | 109 | % | 130 | % | 231 | % | |||||||||||||||
| Net assets, end of period (000's) | $ | 79,661 | $ | 88,124 | $ | 67,673 | $ | 56,181 | $ | 79,102 | $ | 32,810 | |||||||||||||||
(a) Per share data was calculated using the average shares outstanding during the period.
(b) Total return at net asset value assuming all distributions reinvested.
(c) Had the investment advisor and/or any of its affiliates not waived fees or reimbursed a portion of expenses, total return would have been reduced.
(d) Not annualized.
(e) Annualized.
(f) The benefits derived from custody credits had an impact of less than 0.01%.
(g) Rounds to less than 0.01%.
See Accompanying Notes to Financial Statements.
17
CMG SHORT TERM BOND FUND
A Portfolio of Columbia Funds Institutional Trust
FINANCIAL HIGHLIGHTS
(For a Share Outstanding Throughout Each Period)
| (Unaudited) Six Months Ended January 31, | Year Ended July 31, | ||||||||||||||||||||||||||
| 2009 | 2008 | 2007 | 2006 | 2005 | 2004 | ||||||||||||||||||||||
| Net asset value, beginning of period | $ | 11.50 | $ | 11.58 | $ | 11.59 | $ | 11.79 | $ | 11.95 | $ | 12.01 | |||||||||||||||
| Income from investment operations: | |||||||||||||||||||||||||||
| Net investment income (a) | 0.28 | 0.57 | 0.57 | 0.50 | 0.40 | 0.35 | |||||||||||||||||||||
| Net realized and unrealized gain (loss) on investments, foreign currency and futures contracts | (0.28 | ) | (0.05 | ) | 0.03 | (0.14 | ) | (0.11 | ) | (0.03 | ) | ||||||||||||||||
| Total from investment operations | - | 0.52 | 0.60 | 0.36 | 0.29 | 0.32 | |||||||||||||||||||||
| Less distributions to shareholders: | |||||||||||||||||||||||||||
| From net investment income | (0.30 | ) | (0.60 | ) | (0.61 | ) | (0.56 | ) | (0.45 | ) | (0.38 | ) | |||||||||||||||
| Net asset value, end of period | $ | 11.20 | $ | 11.50 | $ | 11.58 | $ | 11.59 | $ | 11.79 | $ | 11.95 | |||||||||||||||
| Total return (b)(c) | 0.02 | %(d) | 4.60 | % | 5.25 | % | 3.15 | % | 2.47 | % | 2.72 | % | |||||||||||||||
| Ratios to Average Net Assets/Supplemental Data: | |||||||||||||||||||||||||||
| Net expense | 0.25 | %(e) | 0.25 | % | 0.25 | % | 0.25 | %(f) | 0.25 | %(f) | 0.25 | %(f) | |||||||||||||||
| Waiver/Reimbursement | 0.04 | %(e) | 0.05 | % | 0.07 | % | 0.08 | % | 0.04 | % | 0.10 | % | |||||||||||||||
| Net investment income | 4.89 | %(e) | 4.87 | % | 4.87 | % | 4.31 | %(f) | 3.38 | %(f) | 2.91 | %(f) | |||||||||||||||
| Portfolio turnover rate | 34 | %(d) | 46 | % | 67 | % | 128 | % | 51 | % | 79 | % | |||||||||||||||
| Net assets, end of period (000's) | $ | 212,379 | $ | 205,543 | $ | 138,432 | $ | 83,984 | $ | 95,842 | $ | 119,125 | |||||||||||||||
(a) Per share data was calculated using the average shares outstanding during the period.
(b) Total return at net asset value assuming all distributions reinvested.
(c) Had the investment advisor and/or any of its affiliates not waived fees or reimbursed a portion of expenses, total return would have been reduced.
(d) Not annualized.
(e) Annualized.
(f) The benefits derived from custody credits had an impact of less than 0.01%.
See Accompanying Notes to Financial Statements.
18
CMG ULTRA SHORT TERM BOND FUND
A Portfolio of Columbia Funds Institutional Trust
FINANCIAL HIGHLIGHTS
(For a Share Outstanding Throughout Each Period)
| (Unaudited) Six Months Ended January 31, | Year Ended July 31, | Period Ended July 31, | |||||||||||||||||||||||||
| 2009 | 2008 | 2007 | 2006 | 2005 | 2004 (a) | ||||||||||||||||||||||
| Net asset value, beginning of period | $ | 9.29 | $ | 9.59 | $ | 9.62 | $ | 9.67 | $ | 9.88 | $ | 10.00 | |||||||||||||||
| Income from investment operations: | |||||||||||||||||||||||||||
| Net investment income (b) | 0.17 | 0.43 | 0.47 | 0.38 | 0.24 | 0.07 | |||||||||||||||||||||
| Net realized and unrealized loss on investments | (0.18 | ) | (0.30 | ) | (0.03 | ) | (0.02 | ) | (0.06 | ) | (0.08 | ) | |||||||||||||||
| Total from investment operations | (0.01 | ) | 0.13 | 0.44 | 0.36 | 0.18 | (0.01 | ) | |||||||||||||||||||
| Less distributions to shareholders: | |||||||||||||||||||||||||||
| From net investment income | (0.19 | ) | (0.43 | ) | (0.47 | ) | (0.41 | ) | (0.36 | ) | (0.11 | ) | |||||||||||||||
| Return of capital | - | - | - | - | (c) | (0.03 | ) | - | |||||||||||||||||||
| Total distributions to shareholders | (0.19 | ) | (0.43 | ) | (0.47 | ) | (0.41 | ) | (0.39 | ) | (0.11 | ) | |||||||||||||||
| Net asset value, end of period | $ | 9.09 | $ | 9.29 | $ | 9.59 | $ | 9.62 | $ | 9.67 | $ | 9.88 | |||||||||||||||
| Total return (d)(e) | (0.12 | )%(f) | 1.42 | % | 4.62 | %(g) | 3.84 | % | 1.83 | % | (0.08 | )%(f) | |||||||||||||||
| Ratios to Average Net Assets/ Supplemental Data: | |||||||||||||||||||||||||||
| Net expenses | 0.25 | %(h) | 0.25 | % | 0.25 | % | 0.25 | %(i) | 0.25 | %(i) | 0.25 | %(h)(i) | |||||||||||||||
| Waiver/Reimbursement | 0.06 | %(h) | 0.07 | % | 0.06 | % | 0.07 | % | 0.05 | % | 0.22 | %(h) | |||||||||||||||
| Net investment income | 3.63 | %(h) | 4.58 | % | 4.88 | % | 3.93 | %(i) | 2.44 | %(i) | 1.69 | %(h)(i) | |||||||||||||||
| Portfolio turnover rate | 50 | %(f) | 69 | % | 108 | % | 48 | % | 75 | % | 12 | %(f) | |||||||||||||||
| Net assets, end of period (000's) | $ | 99,469 | $ | 96,595 | $ | 152,793 | $ | 89,863 | $ | 81,575 | $ | 67,235 | |||||||||||||||
(a) The Fund commenced investment operations on March 8, 2004. Per share data, total return and portfolio turnover reflect activity from that date.
(b) Per share data was calculated using the average shares outstanding during the period.
(c) Rounds to less than $0.01 per share.
(d) Total return at net asset value assuming all distributions reinvested.
(e) Had the investment advisor and/or any of its affiliates not waived fees or reimbursed a portion of expenses, total return would have been reduced.
(f) Not annualized.
(g) Total return includes a voluntary reimbursement by the investment advisor for a realized investment loss due to a trading error. This reimbursement had an impact of less than 0.01% on the Fund's total return.
(h) Annualized.
(i) The benefits derived from custody credits had an impact of less than 0.01%.
See Accompanying Notes to Financial Statements.
19
CMG HIGH YIELD FUND
A Portfolio of Columbia Funds Institutional Trust
FINANCIAL HIGHLIGHTS
(For a Share Outstanding Throughout Each Period)
| (Unaudited) Six Months Ended January 31, | Year Ended July 31, | ||||||||||||||||||||||||||
| 2009 | 2008 | 2007 | 2006 | 2005 | 2004 | ||||||||||||||||||||||
| Net asset value, beginning of period | $ | 7.16 | $ | 7.48 | $ | 7.66 | $ | 8.08 | $ | 8.00 | $ | 7.90 | |||||||||||||||
| Income from investment operations: | |||||||||||||||||||||||||||
| Net investment income (a) | 0.25 | 0.52 | 0.53 | 0.50 | 0.51 | 0.53 | |||||||||||||||||||||
| Net realized and unrealized gain (loss) on investments, foreign currency and credit default swap contracts | (1.21 | ) | (0.31 | ) | (0.16 | ) | (0.38 | ) | 0.11 | 0.14 | |||||||||||||||||
| Total from investment operations | (0.96 | ) | 0.21 | 0.37 | 0.12 | 0.62 | 0.67 | ||||||||||||||||||||
| Less distributions to shareholders: | |||||||||||||||||||||||||||
| From net investment income | (0.27 | ) | (0.53 | ) | (0.55 | ) | (0.54 | ) | (0.54 | ) | (0.57 | ) | |||||||||||||||
| Net asset value, end of period | $ | 5.93 | $ | 7.16 | $ | 7.48 | $ | 7.66 | $ | 8.08 | $ | 8.00 | |||||||||||||||
| Total return (b)(c) | (13.36 | )%(d) | 2.81 | % | 4.76 | % | 1.47 | % | 7.98 | % | 8.60 | % | |||||||||||||||
| Ratios to Average Net Assets/ Supplemental Data: | |||||||||||||||||||||||||||
| Net expenses before interest expense | 0.40 | %(e) | 0.40 | % | 0.40 | % | 0.40 | %(f) | 0.40 | %(f) | 0.40 | %(f) | |||||||||||||||
| Interest expense | - | - | %(g) | - | - | - | - | ||||||||||||||||||||
| Net expenses | 0.40 | %(e) | 0.40 | % | 0.40 | % | 0.40 | %(f) | 0.40 | %(f) | 0.40 | %(f) | |||||||||||||||
| Waiver/Reimbursement | 0.18 | %(e) | 0.14 | % | 0.09 | % | 0.04 | % | 0.02 | % | 0.02 | % | |||||||||||||||
| Net investment income | 8.02 | %(e) | 7.01 | % | 6.70 | % | 6.38 | %(f) | 6.26 | %(f) | 6.64 | %(f) | |||||||||||||||
| Portfolio turnover rate | 24 | %(d) | 37 | % | 57 | % | 30 | % | 39 | % | 47 | % | |||||||||||||||
| Net assets, end of period (000's) | $ | 38,810 | $ | 45,697 | $ | 62,173 | $ | 96,120 | $ | 269,243 | $ | 382,157 | |||||||||||||||
(a) Per share data was calculated using the average shares outstanding during the period.
(b) Total return at net asset value assuming all distributions reinvested.
(c) Had the investment advisor and/or any of its affiliates not waived fees or reimbursed a portion of expenses, total return would have been reduced.
(d) Not annualized.
(e) Annualized.
(f) The benefits derived from custody credits had an impact of less than 0.01%.
(g) Rounds to less than 0.01%.
See Accompanying Notes to Financial Statements.
20
CMG CORE BOND FUND
A Portfolio of Columbia Funds Institutional Trust
SCHEDULE OF INVESTMENTS
January 31, 2009 (Unaudited)
| Par | Value | ||||||||||
| Mortgage-Backed Securities (40.4%) | |||||||||||
| Federal Home Loan Mortgage Corp. 4.000% 11/01/20 | $ | 192,650 | $ | 193,510 | |||||||
| 5.000% 11/01/21 | 1,230 | 1,261 | |||||||||
| 5.000% 12/01/36 | 1,163,301 | 1,182,495 | |||||||||
| Federal National Mortgage Association 4.901% 04/01/38 (a) | 541,747 | 554,439 | |||||||||
| 5.000% 09/01/37 | 3,931,987 | 4,001,779 | |||||||||
| 5.000% 03/01/38 | 1,324,751 | 1,348,191 | |||||||||
| 5.000% 04/01/38 | 2,747,249 | 2,795,858 | |||||||||
| 5.000% 05/01/38 | 1,118,093 | 1,137,876 | |||||||||
| 5.000% 06/01/38 | 4,845,174 | 4,930,904 | |||||||||
| 5.000% 01/01/39 | 600,000 | 610,616 | |||||||||
| 5.500% 04/01/36 | 135,495 | 138,816 | |||||||||
| 5.500% 06/01/38 | 5,075,924 | 5,200,051 | |||||||||
| 7.000% 07/01/32 | 8,094 | 8,600 | |||||||||
| TBA: 4.000% 02/01/39 (b) | 5,445,000 | 5,411,819 | |||||||||
| 4.500% 02/01/39 (b) | 4,600,000 | 4,630,185 | |||||||||
| Government National Mortgage Association 7.000% 01/15/32 | 5,900 | 6,277 | |||||||||
| 7.000% 03/15/32 | 16,122 | 17,152 | |||||||||
| 7.000% 06/15/32 | 3,226 | 3,432 | |||||||||
| Total Mortgage-Backed Securities (Cost of $31,431,454) | 32,173,261 | ||||||||||
| Corporate Fixed-Income Bonds & Notes (23.9%) | |||||||||||
| Basic Materials (0.7%) | |||||||||||
| Chemicals (0.4%) | |||||||||||
| Dow Chemical Co. 5.700% 05/15/18 | 375,000 | 298,385 | |||||||||
| Iron/Steel (0.3%) | |||||||||||
| Nucor Corp. 5.000% 06/01/13 | 160,000 | 162,411 | |||||||||
| 5.850% 06/01/18 | 105,000 | 102,127 | |||||||||
| 264,538 | |||||||||||
| 562,923 | |||||||||||
| Communications (3.5%) | |||||||||||
| Media (1.2%) | |||||||||||
| Comcast Corp. 5.700% 05/15/18 | 40,000 | 38,891 | |||||||||
| 7.050% 03/15/33 | 350,000 | 362,042 | |||||||||
| Time Warner Cable, Inc. 6.200% 07/01/13 | 265,000 | 260,863 | |||||||||
| Par | Value | ||||||||||
| Media (continued) | |||||||||||
| Time Warner, Inc. 6.875% 05/01/12 | $ | 220,000 | $ | 220,998 | |||||||
| Viacom, Inc. 6.125% 10/05/17 | 100,000 | 82,964 | |||||||||
| 965,758 | |||||||||||
| Telecommunication Services (2.3%) | |||||||||||
| AT&T, Inc. 5.100% 09/15/14 | 325,000 | 324,793 | |||||||||
| British Telecommunications PLC 5.150% 01/15/13 | 280,000 | 258,202 | |||||||||
| Deutsche Telekom International Finance BV 8.500% 06/15/10 | 205,000 | 217,051 | |||||||||
| New Cingular Wireless Services, Inc. 8.750% 03/01/31 | 250,000 | 294,743 | |||||||||
| Telefonica Emisones SAU 5.984% 06/20/11 | 225,000 | 232,160 | |||||||||
| Verizon Wireless Capital LLC 5.550% 02/01/14 (c) | 440,000 | 437,118 | |||||||||
| 8.500% 11/15/18 (c) | 95,000 | 108,994 | |||||||||
| 1,873,061 | |||||||||||
| 2,838,819 | |||||||||||
| Consumer Cyclical (1.6%) | |||||||||||
| Entertainment (0.3%) | |||||||||||
| Walt Disney Co. 4.500% 12/15/13 | 195,000 | 200,917 | |||||||||
| Restaurants (0.3%) | |||||||||||
| McDonald's Corp. 5.000% 02/01/19 | 30,000 | 30,854 | |||||||||
| 5.700% 02/01/39 | 190,000 | 196,107 | |||||||||
| 226,961 | |||||||||||
| Retail (1.0%) | |||||||||||
| Best Buy Co., Inc. 6.750% 07/15/13 | 240,000 | 218,019 | |||||||||
| CVS Caremark Corp. 5.750% 06/01/17 | 250,000 | 250,141 | |||||||||
| CVS Pass-Through Trust 6.036% 12/10/28 (c) | 399,680 | 305,004 | |||||||||
| 773,164 | |||||||||||
| 1,201,042 | |||||||||||
See Accompanying Notes to Financial Statements.
21
CMG CORE BOND FUND
A Portfolio of Columbia Funds Institutional Trust
SCHEDULE OF INVESTMENTS
January 31, 2009 (Unaudited)
| Par | Value | ||||||||||
| Corporate Fixed-Income Bonds & Notes (continued) | |||||||||||
| Consumer Non-Cyclical (2.2%) | |||||||||||
| Beverages (0.4%) | |||||||||||
| Anheuser-Busch Companies, Inc. 5.950% 01/15/33 | $ | 12,000 | $ | 9,447 | |||||||
| Bottling Group LLC 5.125% 01/15/19 | 100,000 | 101,047 | |||||||||
| Coca-Cola Co. 5.750% 03/15/11 | 4,000 | 4,236 | |||||||||
| Diageo Capital PLC 4.375% 05/03/10 | 75,000 | 75,489 | |||||||||
| PepsiCo, Inc. 7.900% 11/01/18 | 130,000 | 161,221 | |||||||||
| 351,440 | |||||||||||
| Food (1.2%) | |||||||||||
| Campbell Soup Co. 4.500% 02/15/19 | 140,000 | 136,244 | |||||||||
| ConAgra Foods, Inc. 6.750% 09/15/11 | 150,000 | 157,042 | |||||||||
| 7.875% 09/15/10 | 185,000 | 196,564 | |||||||||
| Kraft Foods, Inc. 6.500% 08/11/17 | 240,000 | 246,461 | |||||||||
| Kroger Co. 6.200% 06/15/12 | 185,000 | 192,832 | |||||||||
| 929,143 | |||||||||||
| Healthcare Products (0.0%) | |||||||||||
| Johnson & Johnson 6.625% 09/01/09 | 7,000 | 7,189 | |||||||||
| Household Products/Wares (0.3%) | |||||||||||
| Fortune Brands, Inc. 5.375% 01/15/16 | 225,000 | 195,523 | |||||||||
| Kimberly-Clark Corp. 5.625% 02/15/12 | 7,000 | 7,224 | |||||||||
| 202,747 | |||||||||||
| Pharmaceuticals (0.3%) | |||||||||||
| Wyeth 5.500% 02/01/14 | 250,000 | 260,720 | |||||||||
| 1,751,239 | |||||||||||
| Energy (2.1%) | |||||||||||
| Oil & Gas (0.8%) | |||||||||||
| Devon Energy Corp. 6.300% 01/15/19 | 70,000 | 70,046 | |||||||||
| Par | Value | ||||||||||
| Oil & Gas (continued) | |||||||||||
| Nexen, Inc. 5.875% 03/10/35 | $ | 250,000 | $ | 175,121 | |||||||
| Talisman Energy, Inc. 6.250% 02/01/38 | 290,000 | 195,921 | |||||||||
| Valero Energy Corp. 6.875% 04/15/12 | 200,000 | 201,747 | |||||||||
| 642,835 | |||||||||||
| Oil & Gas Services (0.7%) | |||||||||||
| Halliburton Co. 5.900% 09/15/18 | 245,000 | 262,813 | |||||||||
| Weatherford International Ltd. 5.150% 03/15/13 | 255,000 | 234,860 | |||||||||
| 7.000% 03/15/38 | 65,000 | 46,906 | |||||||||
| 544,579 | |||||||||||
| Pipelines (0.6%) | |||||||||||
| Energy Transfer Partners LP 6.000% 07/01/13 | 215,000 | 202,451 | |||||||||
| 6.625% 10/15/36 | 200,000 | 151,796 | |||||||||
| TransCanada Pipelines Ltd. 6.350% 05/15/67 (a) | 190,000 | 108,125 | |||||||||
| 462,372 | |||||||||||
| 1,649,786 | |||||||||||
| Financials (9.6%) | |||||||||||
| Banks (7.4%) | |||||||||||
| American Express Centurion Bank 5.200% 11/26/10 | 250,000 | 241,724 | |||||||||
| American Express Credit Corp. 5.875% 05/02/13 | 95,000 | 91,938 | |||||||||
| ANZ National International Ltd. 6.200% 07/19/13 (c) | 470,000 | 455,583 | |||||||||
| Bank of New York Mellon Corp. 5.125% 08/27/13 | 115,000 | 117,172 | |||||||||
| Barclays Bank PLC 7.400% 12/15/09 | 3,000 | 3,014 | |||||||||
| Capital One Financial Corp. 5.500% 06/01/15 | 400,000 | 346,402 | |||||||||
| Citigroup, Inc. 5.000% 09/15/14 | 475,000 | 384,252 | |||||||||
| Credit Suisse First Boston USA, Inc. 4.875% 08/15/10 | 500,000 | 504,195 | |||||||||
| Deutsche Bank AG London 4.875% 05/20/13 | 450,000 | 439,904 | |||||||||
| Goldman Sachs Capital II 5.793% 12/29/49 (a) | 170,000 | 61,049 | |||||||||
See Accompanying Notes to Financial Statements.
22
CMG CORE BOND FUND
A Portfolio of Columbia Funds Institutional Trust
SCHEDULE OF INVESTMENTS
January 31, 2009 (Unaudited)
| Par | Value | ||||||||||
| Corporate Fixed-Income Bonds & Notes (continued) | |||||||||||
| Banks (continued) | |||||||||||
| Goldman Sachs Group, Inc. 6.250% 09/01/17 | $ | 115,000 | $ | 106,406 | |||||||
| JPMorgan Chase & Co. 6.000% 01/15/18 | 245,000 | 245,999 | |||||||||
| JPMorgan Chase Capital XX 6.550% 09/29/36 | 20,000 | 15,147 | |||||||||
| KeyCorp 6.500% 05/14/13 | 445,000 | 428,054 | |||||||||
| Merrill Lynch & Co., Inc. 6.050% 08/15/12 (f) | 475,000 | 461,831 | |||||||||
| 7.750% 05/14/38 (f) | 170,000 | 161,115 | |||||||||
| Morgan Stanley 5.750% 10/18/16 | 235,000 | 203,067 | |||||||||
| National Australia Bank Ltd. 5.350% 06/12/13 (c) | 250,000 | 236,939 | |||||||||
| National City Corp. 3.125% 04/30/09 | 145,000 | 143,054 | |||||||||
| 4.900% 01/15/15 | 10,000 | 9,187 | |||||||||
| 5.750% 02/01/09 | 115,000 | 115,000 | |||||||||
| 6.875% 05/15/19 | 160,000 | 139,118 | |||||||||
| Northern Trust Co. 5.500% 08/15/13 | 110,000 | 113,426 | |||||||||
| 6.500% 08/15/18 | 130,000 | 135,717 | |||||||||
| SunTrust Banks, Inc. 6.375% 04/01/11 | 3,000 | 3,018 | |||||||||
| SunTrust Preferred Capital I 5.853% 12/15/11 (a) | 240,000 | 124,800 | |||||||||
| USB Capital IX 6.189% 04/15/49 (a) | 375,000 | 157,500 | |||||||||
| Wachovia Capital Trust III 5.800% 03/15/42 (a) | 440,000 | 224,400 | |||||||||
| Wachovia Corp. 5.500% 05/01/13 | 230,000 | 237,053 | |||||||||
| 5,906,064 | |||||||||||
| Diversified Financial Services (0.3%) | |||||||||||
| Associates Corp. of North America 6.950% 11/01/18 | 11,000 | 9,890 | |||||||||
| International Lease Finance Corp. 4.875% 09/01/10 | 170,000 | 141,176 | |||||||||
| Lehman Brothers Holdings, Inc. 5.625% 01/24/13 (d)(e) | 110,000 | 15,400 | |||||||||
| 5.750% 07/18/11 (d)(e) | 325,000 | 45,500 | |||||||||
| 6.875% 05/02/18 (d)(e) | 30,000 | 4,200 | |||||||||
| 216,166 | |||||||||||
| Par | Value | ||||||||||
| Insurance (1.4%) | |||||||||||
| MetLife, Inc. 5.375% 12/15/12 | $ | 20,000 | $ | 19,651 | |||||||
| Metropolitan Life Global Funding I 5.125% 04/10/13 (c) | 360,000 | 344,553 | |||||||||
| New York Life Global Funding 4.650% 05/09/13 (c) | 345,000 | 340,332 | |||||||||
| Principal Life Income Funding Trusts 5.300% 04/24/13 | 190,000 | 182,032 | |||||||||
| UnitedHealth Group, Inc. 5.250% 03/15/11 | 250,000 | 250,716 | |||||||||
| 1,137,284 | |||||||||||
| Real Estate Investment Trusts (REITs) (0.5%) | |||||||||||
| Health Care Property Investors, Inc. 6.450% 06/25/12 | 150,000 | 117,406 | |||||||||
| Simon Property Group LP 5.750% 12/01/15 | 400,000 | 305,089 | |||||||||
| 422,495 | |||||||||||
| 7,682,009 | |||||||||||
| Industrials (1.0%) | |||||||||||
| Aerospace & Defense (0.0%) | |||||||||||
| Boeing Co. 5.125% 02/15/13 | 1,000 | 1,030 | |||||||||
| Machinery (0.2%) | |||||||||||
| Caterpillar Financial Services Corp. 5.450% 04/15/18 | 140,000 | 130,526 | |||||||||
| 6.200% 09/30/13 | 15,000 | 15,734 | |||||||||
| 146,260 | |||||||||||
| Machinery-Construction & Mining (0.2%) | |||||||||||
| Caterpillar, Inc. 8.250% 12/15/38 | 125,000 | 143,912 | |||||||||
| Transportation (0.6%) | |||||||||||
| Burlington Northern Santa Fe Corp. 6.200% 08/15/36 | 200,000 | 176,611 | |||||||||
| Union Pacific Corp. 3.875% 02/15/09 | 310,000 | 310,195 | |||||||||
| 486,806 | |||||||||||
| 778,008 | |||||||||||
See Accompanying Notes to Financial Statements.
23
CMG CORE BOND FUND
A Portfolio of Columbia Funds Institutional Trust
SCHEDULE OF INVESTMENTS
January 31, 2009 (Unaudited)
| Par | Value | ||||||||||
| Corporate Fixed-Income Bonds & Notes (continued) | |||||||||||
| Technology (0.6%) | |||||||||||
| Software (0.6%) | |||||||||||
| Oracle Corp. 4.950% 04/15/13 | $ | 460,000 | $ | 485,620 | |||||||
| Utilities (2.6%) | |||||||||||
| Electric (2.0%) | |||||||||||
| Commonwealth Edison Co. 5.950% 08/15/16 | 200,000 | 196,505 | |||||||||
| 6.150% 09/15/17 | 215,000 | 212,947 | |||||||||
| Indiana Michigan Power Co. 5.650% 12/01/15 | 205,000 | 180,070 | |||||||||
| Oncor Electric Delivery Co. 5.950% 09/01/13 (c) | 140,000 | 136,921 | |||||||||
| Pacific Gas & Electric Co. 5.800% 03/01/37 | 340,000 | 336,357 | |||||||||
| Progress Energy, Inc. 7.750% 03/01/31 | 200,000 | 204,726 | |||||||||
| Southern California Edison Co. 5.000% 01/15/14 | 350,000 | 367,773 | |||||||||
| 1,635,299 | |||||||||||
| Gas (0.6%) | |||||||||||
| Atmos Energy Corp. 6.350% 06/15/17 | 175,000 | 158,167 | |||||||||
| Sempra Energy 4.750% 05/15/09 | 300,000 | 298,286 | |||||||||
| 456,453 | |||||||||||
| 2,091,752 | |||||||||||
| Total Corporate Fixed-Income Bonds & Notes (Cost of $20,539,657) | 19,041,198 | ||||||||||
| Government & Agency Obligations (10.3%) | |||||||||||
| Foreign Government Obligations (1.7%) | |||||||||||
| European Investment Bank 4.250% 07/15/13 | 180,000 | 191,057 | |||||||||
| 5.125% 05/30/17 | 295,000 | 323,885 | |||||||||
| Kreditanstalt fuer Wiederaufbau 4.500% 07/16/18 | 425,000 | 444,850 | |||||||||
| Province of Quebec 4.625% 05/14/18 | 435,000 | 434,354 | |||||||||
| 1,394,146 | |||||||||||
| U.S. Government Agency (0.8%) | |||||||||||
| Resolution Funding Corp., Strips (h) 01/15/21 (g) | 1,030,000 | 598,106 | |||||||||
| Par | Value | ||||||||||
| U.S. Government Obligations (7.8%) | |||||||||||
| U.S. Treasury Bonds 6.125% 11/15/27 (g) | $ | 350,000 | $ | 454,289 | |||||||
| U.S. Treasury Inflation Indexed Notes 1.625% 01/15/18 (g) | 1,151,594 | 1,124,603 | |||||||||
| U.S. Treasury Notes 0.875% 12/31/10 (g) | 1,235,000 | 1,234,324 | |||||||||
| 1.125% 01/15/12 (g) | 40,000 | 39,747 | |||||||||
| 1.500% 12/31/13 (g) | 905,000 | 891,779 | |||||||||
| 3.750% 11/15/18 (g) | 2,160,000 | 2,326,061 | |||||||||
| U.S. Treasury Strips (h) 05/15/38 (g) | 515,000 | 182,758 | |||||||||
| 6,253,561 | |||||||||||
| Total Government & Agency Obligations (Cost of $8,142,387) | 8,245,813 | ||||||||||
| Asset-Backed Securities (8.2%) | |||||||||||
| ABFS Mortgage Loan Trust 4.428% 12/15/33 | 13,148 | 12,215 | |||||||||
| AmeriCredit Automobile Receivables Trust 4.870% 12/06/10 | 30,466 | 30,081 | |||||||||
| Capital One Multi-Asset Execution Trust 4.050% 03/15/13 | 250,000 | 245,233 | |||||||||
| 4.850% 11/15/13 | 285,000 | 278,792 | |||||||||
| 4.850% 02/18/14 | 525,000 | 511,240 | |||||||||
| Capital One Prime Auto Receivables Trust 4.890% 01/15/12 | 350,000 | 347,484 | |||||||||
| Carmax Auto Owner Trust 5.270% 11/15/12 | 500,000 | 447,472 | |||||||||
| Chase Issuance Trust 4.260% 05/15/13 | 540,000 | 542,045 | |||||||||
| Citibank Credit Card Issuance Trust 5.500% 06/22/12 | 455,000 | 461,338 | |||||||||
| Discover Card Master Trust 5.100% 10/15/13 | 595,000 | 576,600 | |||||||||
| Ford Credit Auto Owner Trust 4.950% 03/15/13 | 495,000 | 417,852 | |||||||||
| 5.160% 04/15/13 | 560,000 | 472,790 | |||||||||
| Franklin Auto Trust 5.360% 05/20/16 | 300,000 | 280,725 | |||||||||
| GE Capital Credit Card Master Note Trust 4.130% 06/15/13 | 350,000 | 341,546 | |||||||||
See Accompanying Notes to Financial Statements.
24
CMG CORE BOND FUND
A Portfolio of Columbia Funds Institutional Trust
SCHEDULE OF INVESTMENTS
January 31, 2009 (Unaudited)
| Par | Value | ||||||||||
| Asset-Backed Securities (continued) | |||||||||||
| Honda Auto Receivables Owner Trust 4.470% 01/18/12 | $ | 410,000 | $ | 408,983 | |||||||
| USAA Auto Owner Trust 4.280% 10/15/12 | 670,000 | 664,518 | |||||||||
| 4.900% 02/15/12 | 468,798 | 470,474 | |||||||||
| Total Asset-Backed Securities (Cost of $6,816,496) | 6,509,388 | ||||||||||
| Commercial Mortgage-Backed Securities (7.8%) | |||||||||||
| Bear Stearns Commercial Mortgage Securities 4.680% 08/13/39 (a) | 30,000 | 26,984 | |||||||||
| 4.740% 03/13/40 | 895,000 | 820,931 | |||||||||
| 4.750% 02/13/46 (a) | 585,000 | 500,230 | |||||||||
| 4.933% 02/13/42 (a) | 480,000 | 399,348 | |||||||||
| 5.742% 09/11/42 (a) | 80,000 | 58,222 | |||||||||
| Chase Commercial Mortgage Securities Corp. 6.484% 02/12/16 (a)(c) | 400,000 | 395,930 | |||||||||
| Commercial Mortgage Pass Through Certificates 5.306% 12/10/46 | 460,000 | 321,060 | |||||||||
| JPMorgan Chase Commercial Mortgage Securities Corp. 5.440% 06/12/47 | 495,000 | 303,385 | |||||||||
| 5.447% 06/12/47 | 539,000 | 316,524 | |||||||||
| 5.814% 06/12/43 (a) | 445,000 | 307,894 | |||||||||
| LB-UBS Commercial Mortgage Trust 4.853% 09/15/31 | 450,000 | 420,925 | |||||||||
| 5.611% 04/15/41 | 188,588 | 170,075 | |||||||||
| 6.462% 03/15/31 | 405,000 | 399,116 | |||||||||
| Morgan Stanley Capital I 4.989% 08/13/42 | 220,000 | 182,431 | |||||||||
| 5.168% 01/14/42 | 230,000 | 196,003 | |||||||||
| 5.208% 11/14/42 (a) | 205,000 | 168,796 | |||||||||
| 5.328% 11/12/41 | 350,000 | 250,858 | |||||||||
| Morgan Stanley Dean Witter Capital I 4.920% 03/12/35 | 390,000 | 357,715 | |||||||||
| 5.980% 01/15/39 | 295,000 | 286,372 | |||||||||
| Wachovia Bank Commercial Mortgage Trust 5.726% 06/15/45 | 307,188 | 301,177 | |||||||||
| Total Commercial Mortgage-Backed Securities (Cost of $7,177,400) | 6,183,976 | ||||||||||
| Par | Value | ||||||||||
| Collateralized Mortgage Obligations (5.0%) | |||||||||||
| Agency (2.4%) | |||||||||||
| Federal Home Loan Mortgage Corp. 3.750% 12/15/11 | $ | 40,262 | $ | 40,510 | |||||||
| 4.000% 09/15/15 | 436,410 | 441,383 | |||||||||
| 4.500% 10/15/18 | 179,018 | 182,299 | |||||||||
| 6.500% 10/15/23 | 80,063 | 84,687 | |||||||||
| Government National Mortgage Association 4.430% 04/16/34 | 90,000 | 91,658 | |||||||||
| 4.500% 04/16/28 | 952,136 | 965,239 | |||||||||
| 4.807% 08/16/32 | 90,000 | 92,371 | |||||||||
| 1,898,147 | |||||||||||
| Non-Agency (2.6%) | |||||||||||
| Chase Mortgage Finance Corp. 5.999% 03/25/37 (a) | 1,269,138 | 974,206 | |||||||||
| Countrywide Home Loan Mortgage Pass Through Trust 4.595% 12/19/33 (a) | 196,118 | 160,765 | |||||||||
| Structured Asset Securities Corp. 5.500% 07/25/33 | 304,692 | 283,808 | |||||||||
| Washington Mutual Alternative Mortgage Pass-Through Certificates 5.500% 10/25/35 | 790,612 | 646,077 | |||||||||
| 2,064,856 | |||||||||||
| Total Collateralized Mortgage Obligations (Cost of $4,454,506) | 3,963,003 | ||||||||||
| Shares | |||||||||||
| Securities Lending Collateral (8.2%) | |||||||||||
| State Street Navigator Securities Lending Prime Portfolio (i) (7 day yield of 1.900%) | 6,561,635 | 6,561,635 | |||||||||
| Total Securities Lending Collateral (Cost of $6,561,635) | 6,561,635 | ||||||||||
See Accompanying Notes to Financial Statements.
25
CMG CORE BOND FUND
A Portfolio of Columbia Funds Institutional Trust
SCHEDULE OF INVESTMENTS
January 31, 2009 (Unaudited)
| Par | Value | ||||||||||
| Short-Term Obligation (15.4%) | |||||||||||
| Repurchase agreement with Fixed Income Clearing Corp., dated 01/30/09, due on 02/02/09, at 0.210%, collateralized by a U.S. Government Agency Obligation maturing 03/15/10, market value of $12,536,438 (repurchase proceeds $12,289,215) | $ | 12,289,000 | $ | 12,289,000 | |||||||
| Total Short-Term Obligation (Cost of $12,289,000) | 12,289,000 | ||||||||||
| Total Investments (119.2%) (Cost of $97,412,535) (j) | 94,967,274 | ||||||||||
| Obligation to Return Collateral for Securities Loaned (-8.2%) | (6,561,635 | ) | |||||||||
| Other Assets & Liabilities, Net (-11.0%) | (8,744,141 | ) | |||||||||
| Net Assets (100.0%) | $ | 79,661,498 | |||||||||
Notes to Schedule of Investments:
(a) The interest rate shown on floating rate or variable rate securities reflects the rate at January 31, 2009.
(b) Security purchased on a delayed delivery basis.
(c) Security exempt from registration pursuant to Rule 144A under the Securities Act of 1933. These securities may be resold in transactions exempt from registration, normally to qualified institutional buyers. At January 31, 2009, these securities, which are not illiquid, amounted to $2,761,374, which represents 3.5% of net assets.
(d) The issuer has filed for bankruptcy protection under Chapter 11 and is in default of certain debt covenants. Income is not being accrued. At January 31, 2009, these securities amounted to $65,100, which represents 0.1% of net assets.
(e) Represents fair value as determined in good faith under procedures approved by the Board of Trustees. At January 31, 2009, the value of these securities amounted to $65,100, which represents 0.1% of net assets.
(f) Investments in affiliates during the six month period ended January 31, 2009:
| Securities name: | Merrill Lynch & Co., Inc: 6.050% 08/15/12 7.750% 05/14/38 | ||||||
| Par as of 07/31/08: | $ | 645,000 | |||||
| Purchases: | $ | - | |||||
| Sales: | $ | - | |||||
| Par as of 01/31/09: | $ | 645,000 | |||||
| Net realized gain (loss) | $ | - | |||||
| Interest income earned: | $ | 20,956 | |||||
| Value at end of period: | $ | 622,946 | |||||
Merrill Lynch & Co., Inc. became an affiliate on January 1, 2009.
(g) All or a portion of this security was on loan at January 31, 2009. The total market value of securities on loan at January 31, 2009 is $6,405,987.
(h) Zero coupon bond.
(i) Investment made with cash collateral received from securities lending activity.
(j) Cost for federal income tax purposes is $97,462,446.
At January 31, 2009, the asset allocation of the Fund is as follows:
| % of | |||||||
| Asset Allocation | Net Assets | ||||||
| Mortgage-Backed Securities | 40.4 | ||||||
| Corporate Fixed-Income Bonds & Notes | 23.9 | ||||||
| Government & Agency Obligations | 10.3 | ||||||
| Asset-Backed Securities | 8.2 | ||||||
| Commercial Mortgage-Backed Securities | 7.8 | ||||||
| Collateralized Mortgage Obligations | 5.0 | ||||||
| 95.6 | |||||||
| Securities Lending Collateral | 8.2 | ||||||
| Short-Term Obligation | 15.4 | ||||||
| Obligation to Return Collateral for Securities Loaned | (8.2 | ) | |||||
| Other Assets & Liabilities, Net | (11.0 | ) | |||||
| 100.0 | |||||||
| Acronym | Name | ||||||
| TBA | To Be Announced | ||||||
See Accompanying Notes to Financial Statements.
26
CMG SHORT TERM BOND FUND
A Portfolio of Columbia Funds Institutional Trust
SCHEDULE OF INVESTMENTS
January 31, 2009 (Unaudited)
| Par | Value | ||||||||||
| Corporate Fixed-Income Bonds & Notes (26.0%) | |||||||||||
| Basic Materials (0.8%) | |||||||||||
| Chemicals (0.4%) | |||||||||||
| EI Du Pont de Nemours & Co. 5.000% 07/15/13 | $ | 880,000 | $ | 913,329 | |||||||
| Iron/Steel (0.4%) | |||||||||||
| Nucor Corp. 5.000% 06/01/13 | 800,000 | 812,057 | |||||||||
| 1,725,386 | |||||||||||
| Communications (3.7%) | |||||||||||
| Media (0.8%) | |||||||||||
| Comcast Corp. 5.500% 03/15/11 | 200,000 | 200,295 | |||||||||
| 5.850% 01/15/10 | 600,000 | 607,945 | |||||||||
| Time Warner Cable, Inc. 6.200% 07/01/13 | 850,000 | 836,731 | |||||||||
| 1,644,971 | |||||||||||
| Telecommunication Services (2.9%) | |||||||||||
| AT&T, Inc. 6.250% 03/15/11 | 1,250,000 | 1,307,590 | |||||||||
| British Telecommunications PLC 5.150% 01/15/13 | 700,000 | 645,504 | |||||||||
| Deutsche Telekom International Finance BV 8.500% 06/15/10 | 800,000 | 847,029 | |||||||||
| Telefonica Emisones SAU 5.984% 06/20/11 | 850,000 | 877,048 | |||||||||
| Verizon Global Funding Corp. 7.250% 12/01/10 | 700,000 | 745,278 | |||||||||
| Verizon Wireless Capital LLC 5.550% 02/01/14 (a) | 1,250,000 | 1,241,812 | |||||||||
| Vodafone Group PLC 7.750% 02/15/10 | 600,000 | 620,305 | |||||||||
| 6,284,566 | |||||||||||
| 7,929,537 | |||||||||||
| Consumer Cyclical (0.8%) | |||||||||||
| Retail (0.8%) | |||||||||||
| CVS Caremark Corp. 5.750% 08/15/11 | 677,000 | 703,026 | |||||||||
| Target Corp. 6.350% 01/15/11 | 1,000,000 | 1,050,546 | |||||||||
| 1,753,572 | |||||||||||
| Par | Value | ||||||||||
| Consumer Non-Cyclical (3.0%) | |||||||||||
| Beverages (0.9%) | |||||||||||
| Bottling Group LLC 6.950% 03/15/14 | $ | 1,000,000 | $ | 1,144,593 | |||||||
| Diageo Capital PLC 4.375% 05/03/10 | 750,000 | 754,894 | |||||||||
| 1,899,487 | |||||||||||
| Food (0.7%) | |||||||||||
| ConAgra Foods, Inc. 7.875% 09/15/10 | 700,000 | 743,757 | |||||||||
| Kraft Foods, Inc. 5.625% 08/11/10 | 625,000 | 643,215 | |||||||||
| 1,386,972 | |||||||||||
| Healthcare Services (0.4%) | |||||||||||
| UnitedHealth Group, Inc. 4.125% 08/15/09 | 800,000 | 800,412 | |||||||||
| Pharmaceuticals (1.0%) | |||||||||||
| Abbott Laboratories 5.600% 05/15/11 | 1,100,000 | 1,177,978 | |||||||||
| Wyeth 6.950% 03/15/11 | 940,000 | 1,003,646 | |||||||||
| 2,181,624 | |||||||||||
| 6,268,495 | |||||||||||
| Energy (2.0%) | |||||||||||
| Oil & Gas (1.5%) | |||||||||||
| Canadian Natural Resources Ltd. 5.450% 10/01/12 | 600,000 | 562,628 | |||||||||
| Conoco Funding Co. 6.350% 10/15/11 | 1,000,000 | 1,066,204 | |||||||||
| Occidental Petroleum Corp. 6.750% 01/15/12 | 1,000,000 | 1,053,680 | |||||||||
| Valero Energy Corp. 6.875% 04/15/12 | 575,000 | 580,022 | |||||||||
| 3,262,534 | |||||||||||
| Oil & Gas Services (0.3%) | |||||||||||
| Weatherford International Ltd. 5.150% 03/15/13 | 650,000 | 598,664 | |||||||||
See Accompanying Notes to Financial Statements.
27
CMG SHORT TERM BOND FUND
A Portfolio of Columbia Funds Institutional Trust
SCHEDULE OF INVESTMENTS
January 31, 2009 (Unaudited)
| Par | Value | ||||||||||
| Corporate Fixed-Income Bonds & Notes (continued) | |||||||||||
| Pipelines (0.2%) | |||||||||||
| TransCanada Pipelines Ltd. 6.125% 02/19/10 | $ | 350,000 | $ | 355,666 | |||||||
| 4,216,864 | |||||||||||
| Financials (10.5%) | |||||||||||
| Banks (7.3%) | |||||||||||
| American Express Credit Corp. 5.875% 05/02/13 | 1,600,000 | 1,548,430 | |||||||||
| Bank of New York Mellon Corp. 5.125% 08/27/13 | 1,200,000 | 1,222,662 | |||||||||
| Barclays Bank PLC 7.400% 12/15/09 | 1,300,000 | 1,305,860 | |||||||||
| Capital One Bank 5.750% 09/15/10 | 1,115,000 | 1,108,855 | |||||||||
| Citigroup, Inc. 4.250% 07/29/09 | 825,000 | 816,753 | |||||||||
| Countrywide Home Loans, Inc. 4.125% 09/15/09 (b) | 600,000 | 596,215 | |||||||||
| Credit Suisse First Boston USA, Inc. 4.875% 08/15/10 | 1,000,000 | 1,008,389 | |||||||||
| Deutsche Bank AG London 4.875% 05/20/13 | 1,000,000 | 977,564 | |||||||||
| Fifth Third Bank 4.200% 02/23/10 | 1,000,000 | 991,703 | |||||||||
| Goldman Sachs Group, Inc. 4.500% 06/15/10 | 500,000 | 495,697 | |||||||||
| JPMorgan Chase & Co. 3.800% 10/02/09 | 1,500,000 | 1,498,457 | |||||||||
| PNC Funding Corp. 4.500% 03/10/10 | 800,000 | 790,508 | |||||||||
| SunTrust Banks, Inc. 4.250% 10/15/09 | 925,000 | 917,729 | |||||||||
| U.S. Bank National Association 6.375% 08/01/11 | 1,250,000 | 1,302,272 | |||||||||
| Wells Fargo & Co. 5.250% 10/23/12 | 1,050,000 | 1,057,403 | |||||||||
| 15,638,497 | |||||||||||
| Diversified Financial Services (0.9%) | |||||||||||
| General Electric Capital Corp. 4.875% 10/21/10 | 980,000 | 990,680 | |||||||||
| Lehman Brothers Holdings, Inc. 3.950% 11/10/09 (c)(d) | 1,100,000 | 154,000 | |||||||||
| Par | Value | ||||||||||
| Diversified Financial Services (continued) | |||||||||||
| National Rural Utilities Cooperative Finance Corp. 5.750% 08/28/09 | $ | 750,000 | $ | 765,116 | |||||||
| 1,909,796 | |||||||||||
| Insurance (1.4%) | |||||||||||
| Allstate Corp. 7.200% 12/01/09 | 1,000,000 | 1,027,685 | |||||||||
| American International Group, Inc. 5.375% 10/18/11 | 850,000 | 736,193 | |||||||||
| Berkshire Hathaway Finance Corp. 5.000% 08/15/13 | 500,000 | 515,792 | |||||||||
| Principal Life Income Funding Trusts 5.300% 04/24/13 | 700,000 | 670,643 | |||||||||
| 2,950,313 | |||||||||||
| Real Estate Investment Trusts (REITs) (0.3%) | |||||||||||
| Simon Property Group LP 4.875% 03/18/10 | 600,000 | 574,425 | |||||||||
| Savings & Loans (0.6%) | |||||||||||
| Western Financial Bank 9.625% 05/15/12 | 1,325,000 | 1,296,238 | |||||||||
| 22,369,269 | |||||||||||
| Industrials (1.9%) | |||||||||||
| Aerospace & Defense (0.5%) | |||||||||||
| United Technologies Corp. 6.500% 06/01/09 | 970,000 | 981,585 | |||||||||
| Machinery (0.8%) | |||||||||||
| Caterpillar Financial Services Corp. 4.300% 06/01/10 | 825,000 | 836,792 | |||||||||
| John Deere Capital Corp. 4.500% 04/03/13 | 800,000 | 791,872 | |||||||||
| 1,628,664 | |||||||||||
| Miscellaneous Manufacturing (0.1%) | |||||||||||
| 3M Co. 5.125% 11/06/09 | 225,000 | 232,268 | |||||||||
See Accompanying Notes to Financial Statements.
28
CMG SHORT TERM BOND FUND
A Portfolio of Columbia Funds Institutional Trust
SCHEDULE OF INVESTMENTS
January 31, 2009 (Unaudited)
| Par | Value | ||||||||||
| Corporate Fixed-Income Bonds & Notes (continued) | |||||||||||
| Transportation (0.5%) | |||||||||||
| Burlington Northern Santa Fe Corp. 6.750% 07/15/11 | $ | 700,000 | $ | 730,329 | |||||||
| Union Pacific Corp. 3.875% 02/15/09 | 415,000 | 415,261 | |||||||||
| 1,145,590 | |||||||||||
| 3,988,107 | |||||||||||
| Technology (1.2%) | |||||||||||
| Computers (0.4%) | |||||||||||
| International Business Machines Corp. 4.950% 03/22/11 | 800,000 | 841,971 | |||||||||
| Networking & Telecom Equipment (0.5%) | |||||||||||
| Cisco Systems, Inc. 5.250% 02/22/11 | 1,000,000 | 1,045,877 | |||||||||
| Software (0.3%) | |||||||||||
| Oracle Corp. 5.000% 01/15/11 | 700,000 | 730,517 | |||||||||
| 2,618,365 | |||||||||||
| Utilities (2.1%) | |||||||||||
| Electric (1.9%) | |||||||||||
| Consolidated Edison Co. of New York 4.700% 06/15/09 | 1,000,000 | 1,006,040 | |||||||||
| Dominion Resources, Inc. 5.125% 12/15/09 | 450,000 | 452,886 | |||||||||
| Exelon Generation Co. LLC 6.950% 06/15/11 | 800,000 | 797,264 | |||||||||
| Ohio Power Co. 5.750% 09/01/13 | 900,000 | 880,118 | |||||||||
| Pacific Gas & Electric Co. 4.200% 03/01/11 | 850,000 | 854,946 | |||||||||
| 3,991,254 | |||||||||||
| Gas (0.2%) | |||||||||||
| Sempra Energy 4.750% 05/15/09 | 484,000 | 481,235 | |||||||||
| 4,472,489 | |||||||||||
| Total Corporate Fixed-Income Bonds & Notes (Cost of $56,285,847) | 55,342,084 | ||||||||||
| Par | Value | ||||||||||
| Asset-Backed Securities (20.0%) | |||||||||||
| AmeriCredit Automobile Receivables Trust 4.630% 06/06/12 | $ | 1,284,947 | $ | 1,176,102 | |||||||
| 4.870% 12/06/10 | 219,352 | 216,580 | |||||||||
| 5.190% 11/06/11 | 954,141 | 936,437 | |||||||||
| 5.210% 10/06/11 | 296,393 | 289,717 | |||||||||
| 5.420% 08/08/11 | 2,546,765 | 2,365,355 | |||||||||
| 5.420% 05/07/12 | 4,000,000 | 3,772,192 | |||||||||
| Americredit Prime Automobile Receivable 5.270% 11/08/11 | 946,057 | 942,248 | |||||||||
| Capital Auto Receivables Asset Trust 3.740% 03/15/11 | 438,614 | 426,590 | |||||||||
| Capital One Auto Finance Trust 5.030% 04/15/12 | 2,384,303 | 2,332,133 | |||||||||
| 5.070% 07/15/11 | 379,886 | 369,839 | |||||||||
| Capital One Prime Auto Receivables Trust 5.010% 11/15/11 | 2,200,000 | 2,182,697 | |||||||||
| Cityscape Home Equity Loan Trust 7.380% 07/25/28 | 429,406 | 404,381 | |||||||||
| 7.410% 05/25/28 | 27,240 | 27,136 | |||||||||
| CPS Auto Trust 5.040% 09/15/11 (a) | 400,000 | 368,415 | |||||||||
| Daimler Chrysler Auto Trust 4.980% 02/08/11 | 689,385 | 680,400 | |||||||||
| Fifth Third Auto Trust 4.070% 01/17/12 | 1,400,000 | 1,358,958 | |||||||||
| Ford Credit Auto Owner Trust 5.050% 03/15/10 | 140,354 | 140,139 | |||||||||
| Franklin Auto Trust 5.040% 01/20/11 | 262,801 | 263,007 | |||||||||
| GE Equipment Midticket LLC 4.530% 06/14/11 | 2,000,000 | 1,987,136 | |||||||||
| GS Auto Loan Trust 5.480% 12/15/14 | 2,000,000 | 1,940,645 | |||||||||
| Hyundai Auto Receivables Trust 5.110% 04/15/11 | 377,933 | 378,981 | |||||||||
| IMC Home Equity Loan Trust 7.500% 04/25/26 | 137,080 | 136,696 | |||||||||
| 7.520% 08/20/28 | 435,372 | 368,181 | |||||||||
| Nissan Auto Lease Trust 5.200% 05/17/10 | 1,000,000 | 994,981 | |||||||||
| Nissan Auto Receivables Owner Trust 5.220% 11/15/11 | 3,150,000 | 3,169,484 | |||||||||
See Accompanying Notes to Financial Statements.
29
CMG SHORT TERM BOND FUND
A Portfolio of Columbia Funds Institutional Trust
SCHEDULE OF INVESTMENTS
January 31, 2009 (Unaudited)
| Par | Value | ||||||||||
| Asset-Backed Securities (continued) | |||||||||||
| Santander Drive Auto Receivables Trust 5.050% 09/15/11 | $ | 244,241 | $ | 239,286 | |||||||
| SLM Student Loan Trust 2.056% 03/15/17 (e) | 618,398 | 546,712 | |||||||||
| 2.076% 12/15/20 (e) | 1,532,000 | 1,254,182 | |||||||||
| Triad Auto Receivables Owner Trust 4.220% 06/12/12 | 1,701,771 | 1,541,401 | |||||||||
| 4.880% 04/12/13 | 3,200,000 | 2,774,833 | |||||||||
| UCFC Home Equity Loan 6.315% 04/15/30 | 250,584 | 235,210 | |||||||||
| UPFC Auto Receivables Trust 5.010% 08/15/12 | 1,323,645 | 1,194,556 | |||||||||
| USAA Auto Owner Trust 4.170% 02/15/11 | 873,359 | 872,778 | |||||||||
| 4.890% 08/15/12 | 3,146,742 | 3,157,228 | |||||||||
| 4.980% 10/15/12 | 1,125,000 | 1,129,876 | |||||||||
| 5.070% 06/15/13 | 750,000 | 749,469 | |||||||||
| Wachovia Auto Loan Owner Trust 5.080% 04/20/12 (a) | 1,700,000 | 1,625,709 | |||||||||
| Total Asset-Backed Securities (Cost of $43,676,410) | 42,549,670 | ||||||||||
| Collateralized Mortgage Obligations (16.0%) | |||||||||||
| Agency (9.2%) | |||||||||||
| Federal Home Loan Mortgage Corp. 4.000% 09/15/15 | 280,727 | 283,516 | |||||||||
| 4.500% 02/15/15 | 471,560 | 477,871 | |||||||||
| 4.500% 03/15/21 | 400,000 | 408,647 | |||||||||
| 5.000% 09/15/24 | 407,605 | 410,645 | |||||||||
| 5.000% 03/15/26 | 985,166 | 1,005,175 | |||||||||
| 5.000% 05/15/26 | 102,702 | 103,822 | |||||||||
| 5.500% 02/15/25 | 1,232,438 | 1,257,955 | |||||||||
| 5.500% 12/15/26 | 440,548 | 448,913 | |||||||||
| 5.500% 06/15/28 | 1,700,000 | 1,753,509 | |||||||||
| 5.500% 11/15/28 | 5,425,391 | 5,529,630 | |||||||||
| 5.500% 10/15/29 | 516,349 | 533,117 | |||||||||
| 5.500% 05/15/34 | 2,983,906 | 3,039,647 | |||||||||
| 6.000% 06/15/25 | 740,103 | 757,467 | |||||||||
| 6.000% 05/15/27 | 876,164 | 898,881 | |||||||||
| Federal National Mortgage Association 4.500% 01/25/29 | 762,003 | 766,008 | |||||||||
| 5.500% 07/25/25 | 996,892 | 1,015,550 | |||||||||
| 6.000% 06/25/27 | 880,139 | 899,594 | |||||||||
| 19,589,947 | |||||||||||
| Par | Value | ||||||||||
| Non-Agency (6.8%) | |||||||||||
| Chase Mortgage Finance Corp. 5.681% 03/25/37 (e) | $ | 730,997 | $ | 631,394 | |||||||
| 5.999% 03/25/37 (e) | 1,493,103 | 1,146,125 | |||||||||
| Countrywide Alternative Loan Trust 5.250% 08/25/35 | 988,390 | 680,409 | |||||||||
| 5.500% 02/25/36 | 1,795,761 | 1,216,412 | |||||||||
| Countrywide Home Loan Mortgage Pass Through Trust 5.471% 01/25/36 (e) | 942,028 | 695,771 | |||||||||
| 6.000% 12/25/36 | 394,159 | 372,610 | |||||||||
| JPMorgan Mortgage Trust 5.687% 04/25/37 (e) | 642,449 | 489,724 | |||||||||
| 5.754% 04/25/36 (e) | 1,233,154 | 866,584 | |||||||||
| 6.040% 10/25/36 (e) | 2,387,014 | 1,713,657 | |||||||||
| MASTR Asset Securitization Trust 5.750% 05/25/36 | 1,042,024 | 994,327 | |||||||||
| PNC Mortgage Securities Corp. 0.110% 04/28/27 (e) | 4,224 | 3,759 | |||||||||
| Residential Accredit Loans, Inc. 5.750% 01/25/36 | 204,033 | 143,361 | |||||||||
| SACO I, Inc. 7.000% 08/25/36 (a) | 64,991 | 58,492 | |||||||||
| Structured Adjustable Rate Mortgage Loan Trust 5.814% 07/25/36 (e) | 1,889,244 | 994,290 | |||||||||
| Structured Asset Securities Corp. 5.750% 04/25/33 | 511,735 | 459,169 | |||||||||
| Washington Mutual Mortgage Pass-Through Certificates 5.627% 11/25/36 (e) | 1,626,980 | 1,309,120 | |||||||||
| 5.849% 07/25/37 (e) | 2,255,420 | 1,240,257 | |||||||||
| Wells Fargo Mortgage Backed Securities Trust 5.240% 04/25/36 (e) | 430,167 | 331,916 | |||||||||
| 6.000% 07/25/37 | 1,195,911 | 962,281 | |||||||||
| 14,309,658 | |||||||||||
| Total Collateralized Mortgage Obligations (Cost of $38,985,749) | 33,899,605 | ||||||||||
| Government & Agency Obligations (12.4%) | |||||||||||
| Foreign Government Obligations (1.2%) | |||||||||||
| Morocco Government AID Bond 1.678% 05/01/23 (e) | 290,000 | 278,159 | |||||||||
| Province of Ontario 3.125% 09/08/10 | 1,300,000 | 1,312,522 | |||||||||
| Province of Quebec 5.000% 07/17/09 | 875,000 | 885,144 | |||||||||
| 2,475,825 | |||||||||||
See Accompanying Notes to Financial Statements.
30
CMG SHORT TERM BOND FUND
A Portfolio of Columbia Funds Institutional Trust
SCHEDULE OF INVESTMENTS
January 31, 2009 (Unaudited)
| Par | Value | ||||||||||
| Government & Agency Obligations (continued) | |||||||||||
| U.S. Government Agencies (7.3%) | |||||||||||
| Federal Farm Credit Bank 2.700% 09/23/09 | $ | 1,350,000 | $ | 1,366,636 | |||||||
| Federal Home Loan Bank 3.375% 02/27/13 (f) | 2,100,000 | 2,181,463 | |||||||||
| 5.250% 06/11/10 (f) | 3,015,000 | 3,175,302 | |||||||||
| Federal Home Loan Mortgage Corp. 3.125% 10/25/10 (g) | 135,000 | 138,985 | |||||||||
| Federal National Mortgage Association 2.750% 04/11/11 (f) | 5,250,000 | 5,330,761 | |||||||||
| 4.625% 06/01/10 | 1,700,000 | 1,772,605 | |||||||||
| 5.000% 04/20/09 | 1,400,000 | 1,413,210 | |||||||||
| 5.375% 08/15/09 (g) | 100,000 | 102,525 | |||||||||
| 15,481,487 | |||||||||||
| U.S. Government Obligations (3.9%) | |||||||||||
| Regions Bank 3.250% 12/09/11 (j) | 2,000,000 | 2,055,742 | |||||||||
| U.S. Treasury Inflation Indexed Bond 3.500% 01/15/11 (f) | 1,954,064 | 1,998,640 | |||||||||
| U.S. Treasury Notes 2.750% 10/31/13 (f) | 4,000,000 | 4,179,064 | |||||||||
| 8,233,446 | |||||||||||
| Total Government & Agency Obligations (Cost of $25,543,479) | 26,190,758 | ||||||||||
| Mortgage-Backed Securities (10.7%) | |||||||||||
| Federal Home Loan Mortgage Corp. 4.500% 03/01/21 | 1,337,381 | 1,356,902 | |||||||||
| 5.000% 06/01/22 | 817,345 | 837,015 | |||||||||
| 5.500% 01/01/21 | 298,716 | 308,582 | |||||||||
| 5.500% 07/01/21 | 79,596 | 82,162 | |||||||||
| 5.500% 08/01/21 | 854,735 | 882,297 | |||||||||
| 5.500% 09/01/21 | 659,129 | 680,383 | |||||||||
| 5.500% 01/01/22 | 651,918 | 672,904 | |||||||||
| 5.500% 03/01/22 | 683,197 | 705,190 | |||||||||
| 5.500% 05/01/22 | 2,750,001 | 2,838,680 | |||||||||
| 6.000% 11/01/14 | 3,612 | 3,771 | |||||||||
| 6.000% 08/01/21 | 355,368 | 370,205 | |||||||||
| 6.000% 02/01/22 | 355,103 | 369,909 | |||||||||
| 6.000% 08/01/22 | 443,081 | 461,555 | |||||||||
| 6.000% 10/01/22 | 699,162 | 728,314 | |||||||||
| 6.000% 01/15/24 | 279,133 | 284,542 | |||||||||
| Par | Value | ||||||||||
| Mortgage-Backed Securities (continued) | |||||||||||
| Federal National Mortgage Association 5.000% 12/25/17 | $ | 2,351,420 | $ | 2,406,195 | |||||||
| 5.000% 01/01/24 | 4,857,000 | 4,976,732 | |||||||||
| 5.500% 11/01/21 | 284,940 | 294,040 | |||||||||
| 6.000% 03/01/09 | 6,184 | 6,153 | |||||||||
| 6.000% 05/01/09 | 87,913 | 88,872 | |||||||||
| 6.000% 05/25/30 | 73,991 | 74,814 | |||||||||
| TBA 5.000% 02/01/24 (h) | 4,000,000 | 4,092,500 | |||||||||
| Small Business Administration 0.875% 03/25/22 (e) | 68,132 | 67,110 | |||||||||
| 0.875% 06/25/22 (e) | 156,122 | 153,768 | |||||||||
| Total Mortgage-Backed Securities (Cost of $22,513,098) | 22,742,595 | ||||||||||
| Commercial Mortgage-Backed Securities (6.3%) | |||||||||||
| Bear Stearns Commercial Mortgage Securities, Inc. 3.869% 02/11/41 | 2,300,640 | 2,293,925 | |||||||||
| CS First Boston Mortgage Securities Corp. 4.512% 07/15/37 | 800,000 | 756,720 | |||||||||
| 5.017% 08/15/38 | 350,000 | 331,211 | |||||||||
| First Union National Bank Commercial Mortgage 7.841% 05/17/32 | 1,922,892 | 1,942,315 | |||||||||
| JPMorgan Chase Commercial Mortgage Securities Corp. 4.914% 07/12/37 | 1,225,025 | 1,202,993 | |||||||||
| 5.538% 02/12/49 | 1,538,926 | 1,489,603 | |||||||||
| JPMorgan Commercial Mortgage Finance Corp. 6.812% 01/15/30 | 700,000 | 699,698 | |||||||||
| LB-UBS Commercial Mortgage Trust 4.243% 10/15/29 | 1,000,000 | 956,322 | |||||||||
| 5.642% 12/15/25 | 163,690 | 161,652 | |||||||||
| Merrill Lynch Mortgage Trust 4.446% 09/12/42 | 356,308 | 355,145 | |||||||||
| Merrill Lynch/Countrywide Commercial Mortgage Trust 5.549% 06/12/50 | 1,571,535 | 1,516,865 | |||||||||
| Prudential Securities Secured Financing Corp. 7.602% 06/16/31 (e) | 1,700,000 | 1,704,079 | |||||||||
| Total Commercial Mortgage-Backed Securities (Cost of $13,631,075) | 13,410,528 | ||||||||||
See Accompanying Notes to Financial Statements.
31
CMG SHORT TERM BOND FUND
A Portfolio of Columbia Funds Institutional Trust
SCHEDULE OF INVESTMENTS
January 31, 2009 (Unaudited)
| Shares | Value | ||||||||||
| Securities Lending Collateral (7.0%) | |||||||||||
| State Street Navigator Securities Lending Prime Portfolio (i) (7 day yield of 1.900%) | 14,890,015 | $ | 14,890,015 | ||||||||
| Total Securities Lending Collateral (Cost of $14,890,015) | 14,890,015 | ||||||||||
| Par | |||||||||||
| Short-Term Obligation (9.7%) | |||||||||||
| Repurchase agreement with Fixed Income Clearing Corp., dated 01/30/09, due 02/02/09 at 0.210%, collateralized by a U.S. Government Agency Obligation maturing 07/28/11, market value $21,049,448 (repurchase p roceeds $20,633,361) | $ | 20,633,000 | $ | 20,633,000 | |||||||
| Total Short-Term Obligation (Cost of $20,633,000) | 20,633,000 | ||||||||||
| Total Investments (108.1%) (Cost of $236,158,673) (k) | 229,658,255 | ||||||||||
| Obligation to Return Collateral for Securities Loaned (-7.0%) | (14,890,015 | ) | |||||||||
| Other Assets & Liabilities, Net (-1.1%) | (2,389,288 | ) | |||||||||
| Net Assets (100.0%) | $ | 212,378,952 | |||||||||
Notes to Schedule of Investments:
(a) Security exempt from registration pursuant to Rule 144A under the Securities Act of 1933. These securities may be resold in transactions exempt from registration, normally to qualified institutional buyers. At January 31, 2009, these securities, which are not illiquid, amounted to $3,294,428, which represents 1.6% of net assets.
(b) Investments in affiliates during the six month period ended January 31, 2009:
| Security name: | Countrywide Home Loans, Inc. 4.125% 09/15/09 | ||||||
| Par as of 07/31/08: | $ | 600,000 | |||||
| Par purchased: | $ | - | |||||
| Par sold: | $ | - | |||||
| Par as of 01/31/09: | $ | 600,000 | |||||
| Net realized gain (loss): | $ | - | |||||
| Interest income earned: | $ | 12,375 | |||||
| Value at end of period: | $ | 596,215 | |||||
(c) The issuer filed for bankruptcy protection under Chapter 11 and is in default of certain debt covenants. Income is not being accrued. At January 31, 2009, the market value of this security amounted to $154,000 which represents 0.1% of net assets.
(d) Represents fair value as determined in good faith under procedures approved by the Board of Trustees. At January 31, 2009, the value of this security was $154,000, which represents 0.1% of net assets.
(e) The interest rate shown on floating rate or variable rate securities reflects the rate at January 31, 2009.
(f) All or a portion of this security was on loan at January 31, 2009. The total market value of securities on loan at January 31, 2009 is $14,595,772.
(g) All or a portion of this security is pledged for collateral for open futures contracts. At January 31, 2009, the market value of this security pledged amounted to $190,034.
(h) Security purchased on a delayed delivery basis.
(i) Investment made with cash collateral received from securities lending activity.
(j) Security guaranteed by the Federal Deposit Insurance Corporation under the Temporary Liquidity Guarantee Program.
(k) Cost for federal income tax purposes is $236,637,153.
See Accompanying Notes to Financial Statements.
32
CMG SHORT TERM BOND FUND
A Portfolio of Columbia Funds Institutional Trust
SCHEDULE OF INVESTMENTS
January 31, 2009 (Unaudited)
At January 31, 2009, the Fund held the following open long futures contracts:
| Type | Number of Contracts | Value | Aggregate Face Value | Expiration Date | Unrealized Appreciation | ||||||||||||||||||
| 5 Year U.S. Treasury Notes | 88 | $ | 10,399,125 | $ | 10,356,579 | Mar-2009 | $ | 42,546 | |||||||||||||||
At January 31, 2009, the asset allocation of the Fund is as follows:
| Asset Allocation | % of Net Assets | ||||||
| Corporate Fixed-Income Bonds & Notes | 26.0 | ||||||
| Asset-Backed Securities | 20.0 | ||||||
| Collateralized Mortgage Obligations | 16.0 | ||||||
| Government & Agency Obligations | 12.4 | ||||||
| Mortgage-Backed Securities | 10.7 | ||||||
| Commercial Mortgage-Backed Securities | 6.3 | ||||||
| 91.4 | |||||||
| Securities Lending Collateral | 7.0 | ||||||
| Short-Term Obligation | 9.7 | ||||||
| Obligation to Return Collateral for Securities Loaned | (7.0 | ) | |||||
| Other Assets & Liabilities, Net | (1.1 | ) | |||||
| 100.0 | |||||||
| Acronym | Name | ||||||
| TBA | To Be Announced | ||||||
See Accompanying Notes to Financial Statements.
33
CMG ULTRA SHORT TERM BOND FUND
A Portfolio of Columbia Funds Institutional Trust
SCHEDULE OF INVESTMENTS
January 31, 2009 (Unaudited)
| Par | Value | ||||||||||
| Corporate Fixed-Income Bonds & Notes (34.8%) | |||||||||||
| Basic Materials (2.6%) | |||||||||||
| Chemicals (2.6%) | |||||||||||
| E.I. Du Pont de Nemours & Co. 6.875% 10/15/09 | $ | 1,500,000 | $ | 1,559,013 | |||||||
| Lubrizol Corp. 4.625% 10/01/09 | 1,000,000 | 999,326 | |||||||||
| 2,558,339 | |||||||||||
| Communications (2.9%) | |||||||||||
| Media (1.6%) | |||||||||||
| Comcast Cable Communications LLC 6.875% 06/15/09 | 1,000,000 | 1,009,870 | |||||||||
| Walt Disney Co. 2.289% 09/10/09 (a) | 580,000 | 576,626 | |||||||||
| 1,586,496 | |||||||||||
| Telecommunications (1.3%) | |||||||||||
| Cisco Systems, Inc. 2.233% 02/20/09 (a) | 500,000 | 499,843 | |||||||||
| Deutsche Telekom International Finance BV 1.678% 03/23/09 (a) | 800,000 | 795,836 | |||||||||
| 1,295,679 | |||||||||||
| 2,882,175 | |||||||||||
| Consumer Cyclical (0.5%) | |||||||||||
| Retail (0.5%) | |||||||||||
| Wal-Mart Stores, Inc. 6.875% 08/10/09 | 500,000 | 513,369 | |||||||||
| Consumer Non-Cyclical (5.7%) | |||||||||||
| Beverages (1.7%) | |||||||||||
| Coca-Cola Enterprises, Inc. 3.293% 08/03/09 (a) | 675,000 | 663,296 | |||||||||
| Diageo Finance BV 1.588% 03/30/09 (a) | 1,000,000 | 996,153 | |||||||||
| 1,659,449 | |||||||||||
| Food (3.0%) | |||||||||||
| Kraft Foods, Inc. 4.125% 11/12/09 | 1,000,000 | 1,002,101 | |||||||||
| Pepsi Bottling Holdings, Inc. 5.625% 02/17/09 (b) | 1,150,000 | 1,151,859 | |||||||||
| Safeway, Inc. 1.816% 03/27/09 (a) | 800,000 | 798,875 | |||||||||
| 2,952,835 | |||||||||||
| Par | Value | ||||||||||
| Healthcare Services (1.0%) | |||||||||||
| UnitedHealth Group Inc. 2.297% 03/02/09 (a) | $ | 1,000,000 | $ | 999,313 | |||||||
| 5,611,597 | |||||||||||
| Energy (0.4%) | |||||||||||
| Oil & Gas (0.4%) | |||||||||||
| Conoco Funding Co. 6.350% 10/15/11 | 400,000 | 426,482 | |||||||||
| Financials (17.2%) | |||||||||||
| Banks (9.6%) | |||||||||||
| American Express Centurion Bank 5.200% 11/26/10 | 750,000 | 725,173 | |||||||||
| Capital One Bank USA 5.000% 06/15/09 | 800,000 | 791,797 | |||||||||
| Citigroup, Inc. 4.125% 02/22/10 | 850,000 | 816,577 | |||||||||
| Credit Suisse USA, Inc. 6.125% 11/15/11 | 785,000 | 799,335 | |||||||||
| Comerica Bank 2.303% 08/24/11 (a) | 1,000,000 | 718,131 | |||||||||
| Deutsche Bank AG London 4.875% 05/20/13 | 625,000 | 610,978 | |||||||||
| Goldman Sachs Group, Inc. 2.886% 02/06/12 (a) | 1,000,000 | 853,799 | |||||||||
| 6.650% 05/15/09 (c) | 500,000 | 495,000 | |||||||||
| HSBC Finance Corp. 2.598% 08/09/11 (a) | 850,000 | 728,948 | |||||||||
| JPMorgan Chase & Co. 4.600% 01/17/11 | 750,000 | 754,476 | |||||||||
| Merrill Lynch & Co., Inc. 4.250% 02/08/10 (e) | 800,000 | 782,993 | |||||||||
| Morgan Stanley 1.393% 01/18/11 (a) | 1,000,000 | 870,690 | |||||||||
| National Westminster Bank PLC 7.375% 10/01/09 | 641,000 | 630,282 | |||||||||
| 9,578,179 | |||||||||||
| Commercial Banks (3.1%) | |||||||||||
| KeyBank NA 7.000% 02/01/11 | 500,000 | 494,536 | |||||||||
| National City Bank/ Cleveland OH 4.250% 01/29/10 | 1,800,000 | 1,786,345 | |||||||||
| Westpac Banking Corp. 1.409% 01/25/10 (a)(b) | 772,000 | 770,880 | |||||||||
| 3,051,761 | |||||||||||
See Accompanying Notes to Financial Statements.
34
CMG ULTRA SHORT TERM BOND FUND
A Portfolio of Columbia Funds Institutional Trust
SCHEDULE OF INVESTMENTS
January 31, 2009 (Unaudited)
| Par | Value | ||||||||||
| Corporate Fixed-Income Bonds & Notes (continued) | |||||||||||
| Diversified Financial Services (2.0%) | |||||||||||
| General Electric Capital Corp. 1.209% 01/26/11 (a) | $ | 1,000,000 | $ | 949,774 | |||||||
| John Deere Capital Corp. 2.739% 08/19/10 (a) | 1,000,000 | 961,119 | |||||||||
| Lehman Brothers Holdings, Inc. 2.871% 03/23/09 (c)(d) | 750,000 | 105,000 | |||||||||
| 2,015,893 | |||||||||||
| Insurance (1.5%) | |||||||||||
| Berkshire Hathaway Finance Corp. 1.654% 01/11/11 (a) | 1,500,000 | 1,477,863 | |||||||||
| Savings & Loans (1.0%) | |||||||||||
| Wachovia Mortgage FSB 2.342% 03/02/09 (a) | 1,000,000 | 997,018 | |||||||||
| 17,120,714 | |||||||||||
| Industrials (1.0%) | |||||||||||
| Transportation (1.0%) | |||||||||||
| Union Pacific Corp. 3.875% 02/15/09 | 1,000,000 | 1,000,630 | |||||||||
| Information Technology (1.5%) | |||||||||||
| Computers (1.5%) | |||||||||||
| Hewlett-Packard Co. 2.006% 06/15/09 (a) | 1,000,000 | 999,184 | |||||||||
| International Business Machines Corp. 4.375% 06/01/09 | 500,000 | 501,848 | |||||||||
| 1,501,032 | |||||||||||
| Utilities (3.0%) | |||||||||||
| Electric (2.0%) | |||||||||||
| Consolidated Edison Co. of New York, Inc. 4.700% 06/15/09 | 500,000 | 503,020 | |||||||||
| 7.150% 12/01/09 | 500,000 | 515,700 | |||||||||
| Duke Energy Carolinas LLC 4.500% 04/01/10 | 1,000,000 | 1,007,769 | |||||||||
| 2,026,489 | |||||||||||
| Par | Value | ||||||||||
| Gas (1.0%) | |||||||||||
| Sempra Energy 4.750% 05/15/09 | $ | 1,000,000 | $ | 994,288 | |||||||
| 3,020,777 | |||||||||||
| Total Corporate Fixed-Income Bonds & Notes (Cost of $36,086,925) | 34,635,115 | ||||||||||
| Asset-Backed Securities (17.3%) | |||||||||||
| Advanta Business Card Master Trust 5.300% 05/21/12 | 1,000,000 | 974,624 | |||||||||
| AmeriCredit Automobile Receivables Trust 3.930% 10/06/11 | 254,126 | 234,831 | |||||||||
| 5.190% 11/06/11 | 894,507 | 877,909 | |||||||||
| 5.210% 10/06/11 | 357,100 | 349,057 | |||||||||
| 5.420% 08/08/11 | 1,121,217 | 1,041,351 | |||||||||
| Bank One Issuance Trust 3.940% 04/16/12 | 2,000,000 | 2,010,548 | |||||||||
| Bay View Auto Trust 4.550% 02/25/14 | 531,533 | 531,232 | |||||||||
| 5.010% 06/25/14 | 229,997 | 229,989 | |||||||||
| Capital One Prime Auto Receivables Trust 4.990% 09/15/10 | 96,978 | 96,981 | |||||||||
| Carmax Auto Owner Trust 5.150% 02/15/11 | 1,225,923 | 1,210,853 | |||||||||
| Centex Home Equity 6.540% 01/25/32 (a) | 174,126 | 9,889 | |||||||||
| CIT Equipment Collateral 5.070% 02/20/10 | 299,808 | 299,392 | |||||||||
| 5.160% 02/20/13 | 600,000 | 598,659 | |||||||||
| Citibank Credit Card Issuance Trust 5.300% 05/20/11 | 1,000,000 | 1,003,893 | |||||||||
| CNH Equipment Trust 5.200% 06/15/10 | 70,282 | 70,253 | |||||||||
| 5.200% 08/16/10 | 212,680 | 212,479 | |||||||||
| Drive Auto Receivables Trust 5.300% 07/15/11 (b) | 129,941 | 129,512 | |||||||||
| 5.490% 04/15/11 (b) | 34,994 | 34,892 | |||||||||
| Ford Credit Floorplan Master Owner Trust 0.513% 06/15/11 (a) | 700,000 | 677,702 | |||||||||
| GMAC Mortgage Corp. Loan Trust 6.310% 05/25/36 | 177,466 | 158,867 | |||||||||
See Accompanying Notes to Financial Statements.
35
CMG ULTRA SHORT TERM BOND FUND
A Portfolio of Columbia Funds Institutional Trust
SCHEDULE OF INVESTMENTS
January 31, 2009 (Unaudited)
| Par | Value | ||||||||||
| Asset-Backed Securities (continued) | |||||||||||
| GS Auto Loan Trust 4.450% 05/17/10 | $ | 24,070 | $ | 24,075 | |||||||
| Household Automotive Trust 5.280% 09/17/11 | 728,013 | 715,938 | |||||||||
| 5.300% 11/17/11 | 809,649 | 790,082 | |||||||||
| 5.430% 06/17/11 | 372,278 | 366,222 | |||||||||
| Long Beach Auto Receivables Trust 4.972% 10/15/11 | 624,671 | 610,422 | |||||||||
| 5.170% 08/15/11 | 679,352 | 665,830 | |||||||||
| Nomura Asset Acceptance Corp. 0.529% 01/25/36 (a)(b) | 59,948 | 49,376 | |||||||||
| Residential Funding Mortgage Securities II, Inc. 0.509% 09/25/35 (a) | 13,073 | 12,922 | |||||||||
| Santander Drive Auto Receivables Trust 5.050% 09/15/11 | 488,481 | 478,572 | |||||||||
| Triad Auto Receivables Owner Trust 4.220% 06/12/12 | 481,452 | 436,081 | |||||||||
| 4.280% 06/14/10 | 16,443 | 16,416 | |||||||||
| 4.770% 01/12/11 | 119,412 | 118,448 | |||||||||
| 5.260% 11/14/11 | 736,247 | 713,465 | |||||||||
| 5.410% 08/12/11 | 543,527 | 529,530 | |||||||||
| World Omni Auto Receivables Trust 4.130% 03/15/11 | 925,000 | 915,314 | |||||||||
| Total Asset-Backed Securities (cost of $17,662,589) | 17,195,606 | ||||||||||
| Government & Agency Obligations (9.8%) | |||||||||||
| Foreign Government Obligations (0.5%) | |||||||||||
| Svensk Exportkredit AB 4.000% 06/15/10 | 500,000 | 511,990 | |||||||||
| U.S. Government Agencies (9.3%) | |||||||||||
| Federal Farm Credit Bank 2.750% 05/04/10 | 1,000,000 | 1,018,826 | |||||||||
| Federal Home Loan Bank 2.204% 02/19/10 (a)(f) | 3,000,000 | 3,004,077 | |||||||||
| 2.435% 03/09/09 | 50,000 | 50,095 | |||||||||
| 5.000% 02/26/09 | 127,500 | 127,884 | |||||||||
| Federal Home Loan Mortgage Corp. 4.250% 07/15/09 | 500,000 | 508,359 | |||||||||
| 5.000% 06/11/09 (f) | 1,500,000 | 1,523,961 | |||||||||
| Par | Value | ||||||||||
| Federal National Mortgage Association 4.250% 05/15/09 | $ | 3,000,000 | $ | 3,031,140 | |||||||
| 9,264,342 | |||||||||||
| Total Government & Agency Obligations (Cost of $9,757,155) | 9,776,332 | ||||||||||
| Collateralized Mortgage Obligations (4.7%) | |||||||||||
| Agency (1.8%) | |||||||||||
| Federal Home Loan Mortgage Corp. 4.000% 05/15/14 | 16,722 | 16,746 | |||||||||
| 4.000% 07/15/24 | 76,523 | 76,567 | |||||||||
| 4.500% 11/15/16 | 168,975 | 171,257 | |||||||||
| 5.000% 07/15/14 | 59,259 | 59,275 | |||||||||
| 5.000% 11/15/15 | 92,431 | 93,760 | |||||||||
| 5.000% 02/15/16 | 326,283 | 331,846 | |||||||||
| 5.000% 05/15/26 | 166,964 | 168,785 | |||||||||
| 5.500% 02/15/24 | 136,991 | 138,219 | |||||||||
| Federal National Mortgage Association 4.500% 03/25/13 | 9,938 | 9,925 | |||||||||
| 5.500% 11/25/26 | 648,553 | 660,032 | |||||||||
| 6.000% 01/25/31 | 4,888 | 4,881 | |||||||||
| 1,731,293 | |||||||||||
| Non-Agency (2.9%) | |||||||||||
| Axon Financial Funding Ltd. 5.960% 04/04/17 (a)(b)(c)(g)(h) | 1,750,000 | 17,500 | |||||||||
| Bear Stearns Alt-A Trust 0.609% 12/25/46 (a) | 721,086 | 145,706 | |||||||||
| Granite Master Issuer PLC 0.519% 12/17/54 (a)(c) | 750,000 | 112,500 | |||||||||
| Indymac Index Mortgage Loan Trust 0.629% 04/25/37 (a) | 290,824 | 42,884 | |||||||||
| JPMorgan Mortgage Trust 5.500% 04/25/36 | 259,610 | 237,291 | |||||||||
| Kildare Securities Ltd. 2.249% 12/10/43 (a)(b) | 805,976 | 767,243 | |||||||||
| Leek Finance PLC 1.635% 12/21/38 (a)(b) | 1,464,720 | 1,071,582 | |||||||||
| Opteum Mortgage Acceptance Corp. 5.470% 12/25/35 (a) | 4,433 | 4,393 | |||||||||
See Accompanying Notes to Financial Statements.
36
CMG ULTRA SHORT TERM BOND FUND
A Portfolio of Columbia Funds Institutional Trust
SCHEDULE OF INVESTMENTS
January 31, 2009 (Unaudited)
| Par | Value | ||||||||||
| Collateralized Mortgage Obligations (continued) | |||||||||||
| Washington Mutual, Inc. 4.834% 10/25/35 (a) | $ | 500,759 | $ | 409,406 | |||||||
| 6.250% 07/25/36 | 119,207 | 96,651 | |||||||||
| 2,905,156 | |||||||||||
| Total Collateralized Mortgage Obligations (Cost of $8,226,210) | 4,636,449 | ||||||||||
| Mortgage-Backed Securities (1.4%) | |||||||||||
| Federal Home Loan Mortgage Corp. 5.063% 02/01/36 (a) | 949,123 | 945,549 | |||||||||
| Federal National Mortgage Association 4.843% 03/01/34 (a) | 410,900 | 413,912 | |||||||||
| Total Mortgage-Backed Securities (Cost of $1,356,220) | 1,359,461 | ||||||||||
| Municipal Bond (0.5%) | |||||||||||
| LA Public Facilities Authority Cleco Power LLC Series 2008, 7.000% 12/01/38 (a) | 500,000 | 504,560 | |||||||||
| Total Municipal Bond (Cost of $500,000) | 504,560 | ||||||||||
| Shares | |||||||||||
| Securities Lending Collateral (4.3%) | |||||||||||
| State Street Navigator Securities Lending Prime Portfolio (i) (7 day yield of 1.900%) | 4,354,425 | 4,354,425 | |||||||||
| Total Securities Lending Collateral (Cost of $4,354,425) | 4,354,425 | ||||||||||
| Par | |||||||||||
| Short-Term Obligations (29.9%) | |||||||||||
| Commercial Paper (22.6%) | |||||||||||
| ABN Amro Bank NV Chicago 3.080% 03/09/09 | $ | 1,000,000 | 1,000,000 | ||||||||
| Banco Bilbao Vizcaya 2.230% 02/12/09 | 2,000,000 | 2,000,000 | |||||||||
| Barclays Bank PLC 3.080% 04/21/09 (j) | 1,000,000 | 1,003,923 | |||||||||
| Barton Capital Corp. 1.520% 02/24/09 | 1,500,000 | 1,498,543 | |||||||||
| Par | Value | ||||||||||
| Commercial Paper (continued) | |||||||||||
| Chariot Funding LLC 0.400% 02/20/09 | $ | 1,500,000 | $ | 1,499,683 | |||||||
| Danske Corp. 1.450% 03/17/09 | 1,500,000 | 1,497,342 | |||||||||
| Fairway Finance Corp. 0.530% 04/17/09 | 1,000,000 | 997,767 | |||||||||
| Gemini Securitization Corp., LLC 2.850% 02/09/09 | 500,000 | 499,683 | |||||||||
| Gotham Funding Corp. 1.550% 03/12/09 | 1,500,000 | 1,497,481 | |||||||||
| Harris Trust & Savings 1.710% 10/30/09 | 1,000,000 | 998,579 | |||||||||
| Nordea North America, Inc. 2.100% 03/05/09 | 2,000,000 | 1,996,267 | |||||||||
| Oakland Alameda County College 0.850% 02/02/09 | 1,000,000 | 1,000,000 | |||||||||
| Sheffield Receivable 0.300% 02/17/09 | 1,000,000 | 999,867 | |||||||||
| Thames Asset Global Securitization, Inc. 0.900% 03/12/09 | 1,000,000 | 999,025 | |||||||||
| UBS AG Stamford Branch 1.600% 03/17/09 | 1,500,000 | 1,500,000 | |||||||||
| 1.570% 03/18/09 | 1,000,000 | 1,000,000 | |||||||||
| UBS Finance (Delaware) 1.390% 04/06/09 | 1,000,000 | 998,229 | |||||||||
| Victory Receivables 0.500% 02/11/09 | 1,500,000 | 1,499,792 | |||||||||
| 22,486,181 | |||||||||||
| U.S. Government Agencies (5.0%) | |||||||||||
| Federal Home Loan Bank (k) 07/20/09 | 2,000,000 | 1,995,426 | |||||||||
| Federal Home Loan Mortgage Corp. (k) 02/23/09 | 3,000,000 | 2,995,233 | |||||||||
| 4,990,659 | |||||||||||
| Repurchase Agreement (1.0%) | |||||||||||
| Repurchase agreement with Fixed Income Clearing Corp., dated 01/30/09, due 02/02/09 at 0.210%, collateralized by a U.S. Government Agency Obligation maturing 06/28/10, market value $996,093 (repurchase proceeds $976,017) | 976,000 | 976,000 | |||||||||
See Accompanying Notes to Financial Statements.
37
CMG ULTRA SHORT TERM BOND FUND
A Portfolio of Columbia Funds Institutional Trust
SCHEDULE OF INVESTMENTS
January 31, 2009 (Unaudited)
| Par | Value | ||||||||||
| Short-Term Obligations (continued) | |||||||||||
| Variable Rate Demand Notes (1.3%) | |||||||||||
| CA Los Angeles Community College District Series 2008 F-2, 3.049% 08/01/09 | $ | 1,275,000 | $ | 1,282,879 | |||||||
| Total Short-Term Obligations (Cost of $29,725,064) | 29,735,719 | ||||||||||
| Total Investments (102.7%) (Cost of $107,668,588) (l) | 102,197,667 | ||||||||||
| Obligation to Return Collateral for Securities Loaned (-4.3%) | (4,354,425 | ) | |||||||||
| Other Assets & Liabilities, Net (1.6%) | 1,626,161 | ||||||||||
| Net Assets (100.0%) | $ | 99,469,403 | |||||||||
Notes to Schedule of Investments:
(a) The interest rate shown on floating rate or variable rate securities reflects the rate at January 31, 2009.
(b) Security exempt from registration pursuant to Rule 144A under the Securities Act of 1933. These securities may be resold in transactions exempt from registration, normally to qualified institutional buyers. At January 31, 2009, these securities, which are not illiquid except for the following, amounted to $3,992,844, which represents 4.0% of net assets.
| Security | Acquisition Date | Par | Cost | Value | |||||||||||||||
| Axon Financial Funding Ltd., 5.960% 04/04/17 | 04/04/07 | $ | 1,750,000 | $ | 1,750,000 | $ | 17,500 | ||||||||||||
(c) Represents fair value as determined in good faith under procedures approved by the Board of Trustees. The value of these securities amounted to $730,000, which represents 0.7% of net assets.
(d) The issuer has filed for bankruptcy protection under Chapter 11, and is in default of certain debt covenants. Income is not being accrued. At January 31, 2009, the value of this security amounted to $105,000, which represents 0.1% of net assets.
(e) Investments in affiliates during the six month period ended January 31, 2009:
| Security name: | Merrill Lynch & Co., Inc., 4.250% 02/08/10 | ||||||
| Par as of 07/31/08: | $ | 800,000 | |||||
| Par purchased: | $ | - | |||||
| Par sold: | $ | - | |||||
| Par as of 01/31/09: | $ | 800,000 | |||||
| Net realized gain : | $ | - | |||||
| Interest income earned: | $ | 2,724 | |||||
| Value at end of period: | $ | 782,993 | |||||
Merrill Lynch & Co., Inc. became an affiliate on January 1, 2009.
(f) All or a portion of this security was on loan at January 31, 2009. The total market value of securities on loan at January 31, 2009 is $4,265,322.
(g) The issuer is in default of certain debt covenants. Income is not being accrued. At January 31, 2009, the value of these securities amounted to $17,500, which represents less than 0.1% of net assets.
(h) Security issued by a structured investment vehicle.
(i) Investment made with cash collateral received from securities lending activity.
(j) The rate shown represents the discount rate at the date of purchase.
(k) Zero coupon bond.
(l) Cost for federal income tax purposes is $107,855,719.
At January 31, 2009, the asset allocation of the Fund is as follows:
| Asset Allocation | % of Net Assets | ||||||
| Corporate Fixed-Income Bonds & Notes | 34.8 | ||||||
| Asset-Backed Securities | 17.3 | ||||||
| Government & Agency Obligations | 9.8 | ||||||
| Collateralized Mortgage Obligations | 4.7 | ||||||
| Mortgage-Backed Securities | 1.4 | ||||||
| Municipal Bond | 0.5 | ||||||
| 68.5 | |||||||
| Securities Lending Collateral | 4.3 | ||||||
| Obligation to Return Collateral for Securities Loaned | (4.3 | ) | |||||
| Short-Term Obligations | 29.9 | ||||||
| Other Assets & Liabilities, Net | 1.6 | ||||||
| 100.0 | |||||||
See Accompanying Notes to Financial Statements.
38
CMG HIGH YIELD FUND
A Portfolio of Columbia Funds Institutional Trust
SCHEDULE OF INVESTMENTS
January 31, 2009 (Unaudited)
| Par (a) | Value | ||||||||||
| Corporate Fixed-Income Bonds & Notes (86.5%) | |||||||||||
| Basic Materials (8.4%) | |||||||||||
| Chemicals (1.7%) | |||||||||||
| Agricultural Chemicals (1.1%) | |||||||||||
| Mosaic Co. 7.625% 12/01/16 (b) | $ | 305,000 | $ | 286,700 | |||||||
| Terra Capital, Inc. 7.000% 02/01/17 | 175,000 | 159,250 | |||||||||
| 445,950 | |||||||||||
| Chemicals-Diversified (0.6%) | |||||||||||
| Huntsman International LLC 6.875% 11/15/13 (b) | EUR | 165,000 | 82,394 | ||||||||
| 7.875% 11/15/14 | 260,000 | 135,200 | |||||||||
| 217,594 | |||||||||||
| 663,544 | |||||||||||
| Forest Products & Paper (1.8%) | |||||||||||
| Paper & Related Products (1.8%) | |||||||||||
| Cascades, Inc. 7.250% 02/15/13 | 250,000 | 141,250 | |||||||||
| Domtar Corp. 7.125% 08/15/15 | 405,000 | 295,650 | |||||||||
| Georgia-Pacific Corp. 8.000% 01/15/24 | 300,000 | 219,000 | |||||||||
| NewPage Corp. 10.000% 05/01/12 | 70,000 | 26,950 | |||||||||
| 682,850 | |||||||||||
| Iron/Steel (2.4%) | |||||||||||
| Steel-Producers (2.4%) | |||||||||||
| Russel Metals, Inc. 6.375% 03/01/14 | 300,000 | 234,000 | |||||||||
| Steel Dynamics, Inc. 7.750% 04/15/16 (b) | 500,000 | 400,000 | |||||||||
| United States Steel Corp. 7.000% 02/01/18 | 445,000 | 318,990 | |||||||||
| 952,990 | |||||||||||
| Metals & Mining (2.5%) | |||||||||||
| Diversified Minerals (0.6%) | |||||||||||
| FMG Finance Ltd. 10.625% 09/01/16 (b) | 365,000 | 237,250 | |||||||||
| Par (a) | Value | ||||||||||
| Metal-Diversified (1.9%) | |||||||||||
| Freeport-McMoRan Copper & Gold, Inc. 8.375% 04/01/17 (c) | $ | 880,000 | $ | 730,400 | |||||||
| 967,650 | |||||||||||
| 3,267,034 | |||||||||||
| Communications (16.1%) | |||||||||||
| Media (6.4%) | |||||||||||
| Broadcast Services/Programs (0.4%) | |||||||||||
| Liberty Media LLC 8.250% 02/01/30 | 365,000 | 178,317 | |||||||||
| Cable TV (4.8%) | |||||||||||
| Cablevision Systems Corp. 8.000% 04/15/12 | 115,000 | 110,975 | |||||||||
| CSC Holdings, Inc. 7.625% 04/01/11 | 270,000 | 268,650 | |||||||||
| DirecTV Holdings LLC 6.375% 06/15/15 | 635,000 | 596,900 | |||||||||
| EchoStar DBS Corp. 6.625% 10/01/14 (c) | 975,000 | 887,250 | |||||||||
| 1,863,775 | |||||||||||
| Multimedia (1.2%) | |||||||||||
| Lamar Media Corp. 7.250% 01/01/13 | 165,000 | 135,713 | |||||||||
| Quebecor Media, Inc. 7.750% 03/15/16 | 415,000 | 325,775 | |||||||||
| 461,488 | |||||||||||
| 2,503,580 | |||||||||||
| Telecommunication Services (9.7%) | |||||||||||
| Cellular Telecommunications (2.2%) | |||||||||||
| Digicel Ltd. 9.250% 09/01/12 (b) | 220,000 | 193,600 | |||||||||
| MetroPCS Wireless, Inc. 9.250% 11/01/14 | 265,000 | 245,456 | |||||||||
| Nextel Communications, Inc. 7.375% 08/01/15 | 380,000 | 178,600 | |||||||||
| Wind Acquisition Financial SA 10.750% 12/01/15 (b) | 250,000 | 222,500 | |||||||||
| 840,156 | |||||||||||
| Satellite Telecommunications (1.5%) | |||||||||||
| Inmarsat Finance PLC 7.625% 06/30/12 | 65,000 | 60,775 | |||||||||
| 10.375% 11/15/12 | 240,000 | 237,600 | |||||||||
See Accompanying Notes to Financial Statements.
39
CMG HIGH YIELD FUND
A Portfolio of Columbia Funds Institutional Trust
SCHEDULE OF INVESTMENTS
January 31, 2009 (Unaudited)
| Par (a) | Value | ||||||||||
| Corporate Fixed-Income Bonds & Notes (continued) | |||||||||||
| Satellite Telecommunications (continued) | |||||||||||
| Intelsat Corp. 9.250% 06/15/16 (b) | $ | 305,000 | $ | 279,075 | |||||||
| 577,450 | |||||||||||
| Telecommunication Equipment (0.5%) | |||||||||||
| Lucent Technologies, Inc. 6.450% 03/15/29 | 515,000 | 172,525 | |||||||||
| Telecommunication Services (0.5%) | |||||||||||
| Time Warner Telecom Holdings, Inc. 9.250% 02/15/14 | 220,000 | 201,300 | |||||||||
| Telephone-Integrated (5.0%) | |||||||||||
| Citizens Communications Co. 7.875% 01/15/27 | 585,000 | 433,632 | |||||||||
| Qwest Communications International, Inc. 7.500% 02/15/14 | 230,000 | 196,650 | |||||||||
| Qwest Corp. 7.500% 10/01/14 | 580,000 | 527,800 | |||||||||
| 7.500% 06/15/23 | 100,000 | 74,000 | |||||||||
| Windstream Corp. 7.000% 03/15/19 | 250,000 | 221,250 | |||||||||
| 8.625% 08/01/16 | 510,000 | 502,350 | |||||||||
| 1,955,682 | |||||||||||
| 3,747,113 | |||||||||||
| 6,250,693 | |||||||||||
| Consumer Cyclical (6.3%) | |||||||||||
| Apparel (0.5%) | |||||||||||
| Apparel Manufacturers (0.5%) | |||||||||||
| Levi Strauss & Co. 9.750% 01/15/15 | 235,000 | 193,581 | |||||||||
| Auto Parts & Equipment (1.1%) | |||||||||||
| Auto/Truck Parts & Equipment-Original (0.2%) | |||||||||||
| TRW Automotive, Inc. 7.000% 03/15/14 (b) | 175,000 | 83,125 | |||||||||
| Auto/Truck Parts & Equipment-Replacement (0.1%) | |||||||||||
| Commercial Vehicle Group, Inc. 8.000% 07/01/13 | 100,000 | 45,000 | |||||||||
| Par (a) | Value | ||||||||||
| Rubber-Tires (0.8%) | |||||||||||
| Goodyear Tire & Rubber Co. 8.625% 12/01/11 | $ | 81,000 | $ | 77,355 | |||||||
| 9.000% 07/01/15 | 255,000 | 235,238 | |||||||||
| 312,593 | |||||||||||
| 440,718 | |||||||||||
| Entertainment (0.3%) | |||||||||||
| Music (0.3%) | |||||||||||
| WMG Acquisition Corp. 7.375% 04/15/14 | 210,000 | 133,350 | |||||||||
| Home Builders (0.8%) | |||||||||||
| Building-Residential/Commercial (0.8%) | |||||||||||
| KB Home 5.875% 01/15/15 | 450,000 | 308,250 | |||||||||
| Lodging (1.6%) | |||||||||||
| Casino Hotels (0.7%) | |||||||||||
| MGM Mirage 7.500% 06/01/16 | 490,000 | 264,600 | |||||||||
| Gambling (Non-Hotel) (0.9%) | |||||||||||
| Mashantucket Western Pequot Tribe 8.500% 11/15/15 (b) | 370,000 | 127,650 | |||||||||
| Seminole Indian Tribe of Florida 7.804% 10/01/20 (b) | 260,000 | 208,192 | |||||||||
| 335,842 | |||||||||||
| 600,442 | |||||||||||
| Retail (2.0%) | |||||||||||
| Retail-Apparel/Shoe (0.7%) | |||||||||||
| Phillips-Van Heusen Corp. 7.250% 02/15/11 | 170,000 | 159,375 | |||||||||
| 8.125% 05/01/13 | 95,000 | 85,975 | |||||||||
| 245,350 | |||||||||||
| Retail-Hypermarkets (0.3%) | |||||||||||
| New Albertson's, Inc. 8.000% 05/01/31 | 165,000 | 127,050 | |||||||||
See Accompanying Notes to Financial Statements.
40
CMG HIGH YIELD FUND
A Portfolio of Columbia Funds Institutional Trust
SCHEDULE OF INVESTMENTS
January 31, 2009 (Unaudited)
| Par (a) | Value | ||||||||||
| Corporate Fixed-Income Bonds & Notes (continued) | |||||||||||
| Retail-Propane Distributors (1.0%) | |||||||||||
| AmeriGas Partners LP 7.125% 05/20/16 | $ | 305,000 | $ | 280,600 | |||||||
| 7.250% 05/20/15 | 90,000 | 83,250 | |||||||||
| Inergy LP/Inergy Finance Corp. 8.750% 03/01/15 (b) | 25,000 | 23,625 | |||||||||
| 387,475 | |||||||||||
| 759,875 | |||||||||||
| 2,436,216 | |||||||||||
| Consumer Non-Cyclical (12.7%) | |||||||||||
| Agriculture (0.7%) | |||||||||||
| Tobacco (0.7%) | |||||||||||
| Reynolds American, Inc. 7.625% 06/01/16 | 305,000 | 266,120 | |||||||||
| Beverages (1.2%) | |||||||||||
| Beverages-Wine/Spirits (1.2%) | |||||||||||
| Constellation Brands, Inc. 8.125% 01/15/12 | 465,000 | 461,512 | |||||||||
| Biotechnology (0.7%) | |||||||||||
| Medical-Biomedical/Gene (0.7%) | |||||||||||
| Bio-Rad Laboratories, Inc. 7.500% 08/15/13 | 305,000 | 277,550 | |||||||||
| Commercial Services (3.0%) | |||||||||||
| Commercial Services (0.6%) | |||||||||||
| Iron Mountain, Inc. 8.000% 06/15/20 | 270,000 | 249,750 | |||||||||
| Funeral Services & Related Items (0.9%) | |||||||||||
| Service Corp. International 6.750% 04/01/16 | 100,000 | 89,750 | |||||||||
| 7.375% 10/01/14 | 265,000 | 253,075 | |||||||||
| 342,825 | |||||||||||
| Private Corrections (1.5%) | |||||||||||
| Corrections Corp. of America 6.250% 03/15/13 | 415,000 | 403,587 | |||||||||
| GEO Group, Inc. 8.250% 07/15/13 | 200,000 | 176,000 | |||||||||
| 579,587 | |||||||||||
| 1,172,162 | |||||||||||
| Par (a) | Value | ||||||||||
| Food (1.1%) | |||||||||||
| Food-Dairy Products (0.4%) | |||||||||||
| Dean Foods Co. 7.000% 06/01/16 | $ | 175,000 | $ | 161,875 | |||||||
| Food-Meat Products (0.2%) | |||||||||||
| Smithfield Foods, Inc. 7.750% 07/01/17 | 105,000 | 71,138 | |||||||||
| Food-Miscellaneous/Diversified (0.5%) | |||||||||||
| Del Monte Corp. 6.750% 02/15/15 | 225,000 | 211,500 | |||||||||
| 444,513 | |||||||||||
| Healthcare Products (0.6%) | |||||||||||
| Medical Products (0.6%) | |||||||||||
| Biomet, Inc. PIK, 10.375% 10/15/17 | 255,000 | 226,950 | |||||||||
| Healthcare Services (3.3%) | |||||||||||
| Medical-Hospitals (3.3%) | |||||||||||
| Community Health Systems, Inc. 8.875% 07/15/15 | 190,000 | 182,875 | |||||||||
| HCA, Inc. 9.250% 11/15/16 | 270,000 | 257,850 | |||||||||
| PIK, 9.625% 11/15/16 (c) | 1,015,000 | 852,600 | |||||||||
| 1,293,325 | |||||||||||
| Household Products/Wares (0.3%) | |||||||||||
| Consumer Products-Miscellaneous (0.3%) | |||||||||||
| American Greetings Corp. 7.375% 06/01/16 | 190,000 | 110,200 | |||||||||
| Pharmaceuticals (1.8%) | |||||||||||
| Medical-Drugs (0.8%) | |||||||||||
| Elan Finance PLC 6.149% 11/15/11 (d) | 110,000 | 81,400 | |||||||||
| 8.875% 12/01/13 | 225,000 | 162,000 | |||||||||
| Warner Chilcott Corp. 8.750% 02/01/15 | 70,000 | 65,450 | |||||||||
| 308,850 | |||||||||||
See Accompanying Notes to Financial Statements.
41
CMG HIGH YIELD FUND
A Portfolio of Columbia Funds Institutional Trust
SCHEDULE OF INVESTMENTS
January 31, 2009 (Unaudited)
| Par (a) | Value | ||||||||||
| Corporate Fixed-Income Bonds & Notes (continued) | |||||||||||
| Pharmacy Services (1.0%) | |||||||||||
| Omnicare, Inc. 6.750% 12/15/13 | $ | 410,000 | $ | 378,225 | |||||||
| 687,075 | |||||||||||
| 4,939,407 | |||||||||||
| Energy (15.6%) | |||||||||||
| Coal (2.0%) | |||||||||||
| Arch Western Finance LLC 6.750% 07/01/13 | 500,000 | 473,750 | |||||||||
| Massey Energy Co. 6.875% 12/15/13 | 350,000 | 306,250 | |||||||||
| 780,000 | |||||||||||
| Oil & Gas (8.9%) | |||||||||||
| Oil & Gas Drilling (0.4%) | |||||||||||
| Pride International, Inc. | |||||||||||
| 7.375% 07/15/14 | 180,000 | 172,800 | |||||||||
| Oil Companies-Exploration & Production (7.6%) | |||||||||||
| Chesapeake Energy Corp. 6.375% 06/15/15 | 790,000 | 667,550 | |||||||||
| 9.500% 02/15/15 | 50,000 | 49,000 | |||||||||
| Cimarex Energy Co. 7.125% 05/01/17 | 210,000 | 181,650 | |||||||||
| KCS Energy, Inc. 7.125% 04/01/12 | 200,000 | 174,000 | |||||||||
| Newfield Exploration Co. 6.625% 09/01/14 | 345,000 | 308,775 | |||||||||
| 6.625% 04/15/16 | 185,000 | 163,725 | |||||||||
| OPTI Canada, Inc. 8.250% 12/15/14 | 485,000 | 223,100 | |||||||||
| PetroHawk Energy Corp. 7.875% 06/01/15 (b) | 175,000 | 146,562 | |||||||||
| Pioneer Natural Resources Co. 5.875% 07/15/16 | 185,000 | 143,581 | |||||||||
| Quicksilver Resources, Inc. 7.125% 04/01/16 | 420,000 | 289,800 | |||||||||
| Range Resources Corp. 7.500% 05/15/16 | 335,000 | 314,900 | |||||||||
| Southwestern Energy Co. 7.500% 02/01/18 (b) | 305,000 | 288,225 | |||||||||
| 2,950,868 | |||||||||||
| Par (a) | Value | ||||||||||
| Oil Refining & Marketing (0.9%) | |||||||||||
| Frontier Oil Corp. 8.500% 09/15/16 | $ | 130,000 | $ | 123,500 | |||||||
| Tesoro Corp. 6.625% 11/01/15 | 295,000 | 231,944 | |||||||||
| 355,444 | |||||||||||
| 3,479,112 | |||||||||||
| Pipelines (4.7%) | |||||||||||
| Atlas Pipeline Partners LP 8.125% 12/15/15 | 255,000 | 173,400 | |||||||||
| Colorado Interstate Gas Co. 6.800% 11/15/15 | 116,000 | 108,170 | |||||||||
| El Paso Corp. 6.875% 06/15/14 | 430,000 | 396,675 | |||||||||
| 7.250% 06/01/18 | 140,000 | 128,100 | |||||||||
| El Paso Performance-Linked Trust 7.750% 07/15/11 (b) | 110,000 | 105,325 | |||||||||
| Kinder Morgan Finance Co. ULC 5.700% 01/05/16 | 485,000 | 418,313 | |||||||||
| MarkWest Energy Partners LP 6.875% 11/01/14 | 320,000 | 233,600 | |||||||||
| 8.500% 07/15/16 | 70,000 | 51,275 | |||||||||
| Williams Companies, Inc. 7.625% 07/15/19 | 50,000 | 47,625 | |||||||||
| 8.125% 03/15/12 | 150,000 | 148,500 | |||||||||
| 1,810,983 | |||||||||||
| 6,070,095 | |||||||||||
| Financials (1.4%) | |||||||||||
| Diversified Financial Services (0.3%) | |||||||||||
| Special Purpose Entity (0.3%) | |||||||||||
| Goldman Sachs Capital II 5.793% 12/29/49 (d) | 300,000 | 107,733 | |||||||||
| Insurance (0.6%) | |||||||||||
| Property/Casualty Insurance (0.6%) | |||||||||||
| Crum & Forster Holdings Corp. 7.750% 05/01/17 | 290,000 | 218,950 | |||||||||
| Real Estate Investment Trusts (REITs) (0.5%) | |||||||||||
| REITS-Hotels (0.5%) | |||||||||||
| Host Marriott LP 6.375% 03/15/15 | 260,000 | 208,000 | |||||||||
| 534,683 | |||||||||||
See Accompanying Notes to Financial Statements.
42
CMG HIGH YIELD FUND
A Portfolio of Columbia Funds Institutional Trust
SCHEDULE OF INVESTMENTS
January 31, 2009 (Unaudited)
| Par (a) | Value | ||||||||||
| Corporate Fixed-Income Bonds & Notes (continued) | |||||||||||
| Industrials (15.6%) | |||||||||||
| Aerospace & Defense (2.4%) | |||||||||||
| Aerospace/Defense-Equipment (0.9%) | |||||||||||
| BE Aerospace, Inc. 8.500% 07/01/18 | $ | 315,000 | $ | 296,100 | |||||||
| Moog, Inc. 7.250% 06/15/18 (b) | 55,000 | 49,225 | |||||||||
| 345,325 | |||||||||||
| Electronics-Military (1.5%) | |||||||||||
| L-3 Communications Corp. 5.875% 01/15/15 | 160,000 | 146,400 | |||||||||
| 6.375% 10/15/15 | 480,000 | 450,000 | |||||||||
| 596,400 | |||||||||||
| 941,725 | |||||||||||
| Electrical Components & Equipment (1.0%) | |||||||||||
| Wire & Cable Products (1.0%) | |||||||||||
| Belden, Inc. 7.000% 03/15/17 | 175,000 | 133,000 | |||||||||
| General Cable Corp. 3.810% 04/01/15 (d) | 145,000 | 97,150 | |||||||||
| 7.125% 04/01/17 | 215,000 | 172,000 | |||||||||
| 402,150 | |||||||||||
| Electronics (0.6%) | |||||||||||
| Electronic Components-Miscellaneous (0.6%) | |||||||||||
| Flextronics International Ltd. 6.250% 11/15/14 | 300,000 | 231,750 | |||||||||
| Environmental Control (1.5%) | |||||||||||
| Non-Hazardous Waste Disposal (1.5%) | |||||||||||
| Allied Waste North America, Inc. 7.125% 05/15/16 | 580,000 | 565,500 | |||||||||
| Machinery-Construction & Mining (1.0%) | |||||||||||
| Machinery-Construction & Mining (1.0%) | |||||||||||
| Terex Corp. 8.000% 11/15/17 | 455,000 | 377,650 | |||||||||
| Machinery-Diversified (1.1%) | |||||||||||
| Machinery-General Industry (1.1%) | |||||||||||
| Manitowoc Co., Inc. 7.125% 11/01/13 | 250,000 | 200,000 | |||||||||
| Par (a) | Value | ||||||||||
| Machinery-General Industry (continued) | |||||||||||
| Westinghouse Air Brake Technologies Corp. 6.875% 07/31/13 | $ | 250,000 | $ | 226,250 | |||||||
| 426,250 | |||||||||||
| Miscellaneous Manufacturing (2.2%) | |||||||||||
| Diversified Manufacturing Operators (1.8%) | |||||||||||
| Bombardier, Inc. 6.300% 05/01/14 (b) | 475,000 | 384,750 | |||||||||
| Koppers Holdings, Inc. (e) 11/15/14 (9.875% 11/15/09) | 145,000 | 119,806 | |||||||||
| Trinity Industries, Inc. 6.500% 03/15/14 | 220,000 | 184,800 | |||||||||
| 689,356 | |||||||||||
| Miscellaneous Manufacturing (0.4%) | |||||||||||
| American Railcar Industries, Inc. 7.500% 03/01/14 | 215,000 | 149,425 | |||||||||
| 838,781 | |||||||||||
| Packaging & Containers (2.6%) | |||||||||||
| Containers-Metal/Glass (2.6%) | |||||||||||
| Crown Americas LLC & Crown Americas Capital Corp. 7.750% 11/15/15 | 370,000 | 373,700 | |||||||||
| Owens-Illinois, Inc. 7.500% 05/15/10 | 405,000 | 409,050 | |||||||||
| Silgan Holdings, Inc. 6.750% 11/15/13 | 270,000 | 244,350 | |||||||||
| 1,027,100 | |||||||||||
| Transportation (3.2%) | |||||||||||
| Transportation-Marine (1.9%) | |||||||||||
| Navios Maritime Holdings, Inc. 9.500% 12/15/14 | 200,000 | 117,000 | |||||||||
| Stena AB 7.500% 11/01/13 | 460,000 | 325,450 | |||||||||
| Teekay Corp. 8.875% 07/15/11 | 310,000 | 278,225 | |||||||||
| 720,675 | |||||||||||
| Transportation-Railroad (0.6%) | |||||||||||
| Kansas City Southern de Mexico SA de CV 7.375% 06/01/14 | 280,000 | 240,800 | |||||||||
See Accompanying Notes to Financial Statements.
43
CMG HIGH YIELD FUND
A Portfolio of Columbia Funds Institutional Trust
SCHEDULE OF INVESTMENTS
January 31, 2009 (Unaudited)
| Par (a) | Value | ||||||||||
| Corporate Fixed-Income Bonds & Notes (continued) | |||||||||||
| Transportation-Services (0.7%) | |||||||||||
| Bristow Group, Inc. 7.500% 09/15/17 | $ | 400,000 | $ | 292,000 | |||||||
| 1,253,475 | |||||||||||
| 6,064,381 | |||||||||||
| Utilities (10.4%) | |||||||||||
| Electric (10.4%) | |||||||||||
| Electric-Generation (4.0%) | |||||||||||
| AES Corp. 7.750% 03/01/14 | 305,000 | 290,512 | |||||||||
| 8.000% 10/15/17 | 265,000 | 249,100 | |||||||||
| Edison Mission Energy 7.000% 05/15/17 | 575,000 | 534,750 | |||||||||
| Intergen NV 9.000% 06/30/17 (b) | 525,000 | 488,250 | |||||||||
| 1,562,612 | |||||||||||
| Electric-Integrated (2.9%) | |||||||||||
| CMS Energy Corp. 6.875% 12/15/15 | 185,000 | 169,185 | |||||||||
| Ipalco Enterprises, Inc. 7.250% 04/01/16 (b) | 285,000 | 263,625 | |||||||||
| TXU Energy Co. LLC 3.906% 10/10/14 (d)(f) | 561,071 | 390,225 | |||||||||
| 3.961% 10/10/14 (d)(f) | 5,000 | 3,478 | |||||||||
| 5.888% 10/10/14 (d)(f) | 421,429 | 293,104 | |||||||||
| 1,119,617 | |||||||||||
| Independent Power Producer (3.5%) | |||||||||||
| Dynegy Holdings, Inc. 7.125% 05/15/18 | 445,000 | 318,175 | |||||||||
| Mirant North America LLC 7.375% 12/31/13 | 490,000 | 472,850 | |||||||||
| NRG Energy, Inc. 7.375% 02/01/16 | 230,000 | 219,075 | |||||||||
| NSG Holdings LLC/NSG Holdings, Inc. 7.750% 12/15/25 (b) | 415,000 | 336,150 | |||||||||
| 1,346,250 | |||||||||||
| 4,028,479 | |||||||||||
| Total Corporate Fixed-Income Bonds & Notes (Cost of $40,424,085) | 33,590,988 | ||||||||||
| Par (a) | Value | ||||||||||
| Municipal Bond (0.4%) | |||||||||||
| Virginia (0.4%) | |||||||||||
| VA Tobacco Settlement Financing Corp. Series 2007 A1, 6.706% 06/01/46 | $ | 275,000 | $ | 150,906 | |||||||
| Total Municipal Bond (Cost of $274,976) | 150,906 | ||||||||||
| Convertible Bond (0.1%) | |||||||||||
| Industrials (0.1%) | |||||||||||
| General Cable Corp. 0.875% 11/15/13 | 85,000 | 54,400 | |||||||||
| Total Convertible Bond (Cost of $45,308) | 54,400 | ||||||||||
| Short-Term Obligation (10.6%) | |||||||||||
| Repurchase agreement with Fixed Income Clearing Corp., dated 01/30/09, due 02/02/09 at 0.210%, collateralized by a U.S. Government Agency Obligation maturing 06/28/10, market value $4,179,483 (repurchase proceeds $4,094,072) | 4,094,000 | 4,094,000 | |||||||||
| Total Short-Term Obligation (Cost of $4,094,000) | 4,094,000 | ||||||||||
| Total Investments (97.6%) (Cost of $44,838,369) (g) | 37,890,294 | ||||||||||
| Other Assets & Liabilities, Net (2.4%) | 920,057 | ||||||||||
| Net Assets (100.0%) | $ | 38,810,351 | |||||||||
See Accompanying Notes to Financial Statements.
44
CMG HIGH YIELD FUND
A Portfolio of Columbia Funds Institutional Trust
SCHEDULE OF INVESTMENTS
January 31, 2009 (Unaudited)
Notes to Schedule of Investments:
(a) Principal amount is stated in U.S. dollars unless otherwise noted.
(b) Security exempt from registration pursuant to Rule 144A under the Securities Act of 1933. These securities may be resold in transactions exempt from registration, normally to qualified institutional buyers. At January 31, 2009, these securities, which are not illiquid except for the following, amounted to $4,206,223, which represents 10.8% of net assets.
| Security | Acquisition Date | Par | Cost | Value | |||||||||||||||
| Seminole Indian Tribe of Florida 7.804% 10/01/20 | 09/26/07 | $ | 260,000 | $ | 263,643 | $ | 208,192 | ||||||||||||
(c) A portion of these securities are pledged as collateral for a credit default swap contract. At January 31, 2009, the market value of the pledged securities amounted to $2,323,000.
(d) The interest rate shown on floating rate or variable rate securities reflects the rate at January 31, 2009.
(e) Step bond. This security is currently not paying coupon. Shown parenthetically is the next coupon rate to be paid and the date the security will begin accruing at this rate.
(f) Loan participation agreement.
(g) Cost for federal income tax purposes is $45,013,699.
Forward foreign currency exchange contract outstanding on January 31, 2009 is:
| Forward Foreign Currency Exchange Contract to Sell | Value | Aggregate Face Value | Settlement Date | Unrealized Appreciation | |||||||||||||||
| EUR | $ | 79,365 | $ | 81,670 | 02/19/09 | $ | 2,305 | ||||||||||||
The following table shows the undiscounted maximum potential payment by the Fund as the seller of credit protection in a credit default swap contract:
| Type of Reference Assets On Which the Fund Sold Credit Protection | Total Maximum Potential Payment For Selling Credit Protection (Undiscounted) | Amount Recoverable(1) | Reference Asset Rating Range(2) | ||||||||||||
| High Yield Indexes | $ | 1,980,000 | $ | – | BB to B | ||||||||||
(1) The Fund has no recourse provisions under the credit derivatives and holds no collateral which can offset or reduce potential payments under a triggering event.
(2) The reference asset rating range represents the Standard & Poor's equivalent of the ratings of all the securities included in the index. The lower the reference asset rating, the greater the likelihood of default of the securities in the index.
At January 31, 2009, the asset allocation of the Fund was as follows:
| Asset Allocation | % of Net Assets | ||||||
| Communications | 16.1 | ||||||
| Industrials | 15.7 | ||||||
| Energy | 15.6 | ||||||
| Consumer Non-Cyclical | 12.7 | ||||||
| Utilities | 10.4 | ||||||
| Basic Materials | 8.4 | ||||||
| Consumer Cyclical | 6.3 | ||||||
| Financials | 1.4 | ||||||
| Municipal Bond | 0.4 | ||||||
| 87.0 | |||||||
| Short-Term Obligation | 10.6 | ||||||
| Other Assets & Liabilities, Net | 2.4 | ||||||
| 100.0 | |||||||
| Acronym | Name | ||||||
| EUR | Eur | o | |||||
| PIK | Payment-In-Kind | ||||||
At January 31, 2009, the Fund had entered into the following
credit default swap contract:
| Swap Counterparty | Referenced Obligation | Receive Buy/Sell Protection | Fixed Rate | Expiration Date | Notional Amount | Upfront Premiums Received | Value of Contract | ||||||||||||||||||||||||
| JPMorgan | CDX.NA.HY.11 | Sell | 5.000 | % | 12/20/13 | $ | 1,980,000 | $ | 486,750 | $ | (500,698 | ) | |||||||||||||||||||
See Accompanying Notes to Financial Statements.
45
STATEMENTS OF ASSETS AND LIABILITIES
January 31, 2009 (Unaudited)
| CMG Core Bond Fund | CMG Short Term Bond Fund | CMG Ultra Short Term Bond Fund | CMG High Yield Fund | ||||||||||||||||
| ASSETS: | |||||||||||||||||||
| Unaffiliated investments, at identified cost | $ | 84,475,316 | $ | 214,931,481 | $ | 105,898,344 | $ | 40,744,369 | |||||||||||
| Repurchase agreements, at cost | 12,289,000 | 20,633,000 | 976,000 | 4,094,000 | |||||||||||||||
| Affiliated investments, at identified cost | 648,219 | 594,192 | 794,244 | - | |||||||||||||||
| Total investments, at cost | 97,412,535 | 236,158,673 | 107,668,588 | 44,838,369 | |||||||||||||||
| Unaffiliated investments, at value (including securities on loan of 6,405,987, $14,595,772, $ $4,265,322 and $-, respectively) | $ | 82,055,328 | $ | 208,429,040 | $ | 100,438,674 | $ | 33,796,294 | |||||||||||
| Repurchase agreement, at value | 12,289,000 | 20,633,000 | 976,000 | 4,094,000 | |||||||||||||||
| Affiliated investments, at value | 622,946 | 596,215 | 782,993 | - | |||||||||||||||
| Total investments, at value | 94,967,274 | 229,658,255 | 102,197,667 | 37,890,294 | |||||||||||||||
| Cash | 160 | 22 | 10,002 | 1,972 | |||||||||||||||
| Unrealized appreciation on forward foreign currency exchange contract | - | - | - | 2,305 | |||||||||||||||
| Receivable for: | |||||||||||||||||||
| Investments sold | 2,417,378 | - | - | 2,751,822 | |||||||||||||||
| Fund shares sold | 50,000 | 2,329,999 | 1,383,929 | - | |||||||||||||||
| Interest | 515,770 | 1,460,524 | 541,547 | 747,121 | |||||||||||||||
| Securities lending | 6,811 | 14,142 | 1,885 | - | |||||||||||||||
| Expense reimbursement due from investment advisor | 4,710 | 5,180 | 5,160 | 5,978 | |||||||||||||||
| Trustees' deferred compensation plan | 8,336 | 10,073 | 8,440 | 12,157 | |||||||||||||||
| Total Assets | 97,970,439 | 233,478,195 | 104,148,630 | 41,411,649 | |||||||||||||||
| LIABILITIES: | |||||||||||||||||||
| Collateral on securities loaned | 6,561,635 | 14,890,015 | 4,354,425 | - | |||||||||||||||
| Open credit default swap contract (Upfront premiums received $486,750) | - | - | - | 500,698 | |||||||||||||||
| Payable for: | |||||||||||||||||||
| Investments purchased | 1,272,942 | 1,242,562 | - | 1,928,476 | |||||||||||||||
| Investments purchased on a delayed delivery basis | 10,217,258 | 4,109,444 | - | - | |||||||||||||||
| Fund shares repurchased | 27,000 | 20,000 | - | - | |||||||||||||||
| Futures variation margin | - | 7,563 | - | - | |||||||||||||||
| Distributions | 176,261 | 747,981 | 264,841 | 118,971 | |||||||||||||||
| Investment advisory fee | 17,141 | 42,817 | 19,605 | 12,456 | |||||||||||||||
| Trustees' fees | 2,678 | 1,209 | 2,281 | 2,906 | |||||||||||||||
| Audit fee | 24,134 | 23,255 | 23,257 | 25,569 | |||||||||||||||
| Legal fee | 1,556 | 4,324 | 6,378 | 65 | |||||||||||||||
| Trustees' deferred compensation plan | 8,336 | 10,073 | 8,440 | 12,157 | |||||||||||||||
| Total liabilities | 18,308,941 | 21,099,243 | 4,679,227 | 2,601,298 | |||||||||||||||
| NET ASSETS | $ | 79,661,498 | $ | 212,378,952 | $ | 99,469,403 | $ | 38,810,351 | |||||||||||
| NET ASSETS CONSIST OF: | |||||||||||||||||||
| Paid-in capital | $ | 85,885,659 | $ | 224,651,519 | $ | 108,984,023 | $ | 66,279,812 | |||||||||||
| Overdistributed net investment income | (40,800 | ) | (662,238 | ) | (294,703 | ) | (269,513 | ) | |||||||||||
| Accumulated net realized loss | (3,738,100 | ) | (5,152,457 | ) | (3,748,996 | ) | (20,239,005 | ) | |||||||||||
| Net unrealized appreciation (depreciation) on: | |||||||||||||||||||
| Investments | (2,445,261 | ) | (6,500,418 | ) | (5,470,921 | ) | (6,948,075 | ) | |||||||||||
| Foreign currency translations | - | - | - | 2,187 | |||||||||||||||
| Credit default swap contracts | - | - | - | (15,055 | ) | ||||||||||||||
| Futures contracts | - | 42,546 | - | - | |||||||||||||||
| NET ASSETS | $ | 79,661,498 | $ | 212,378,952 | $ | 99,469,403 | $ | 38,810,351 | |||||||||||
| Shares of capital stock outstanding | 8,190,272 | 18,969,072 | 10,946,839 | 6,544,080 | |||||||||||||||
| Net asset value, offering and redemption price per share | $ | 9.73 | $ | 11.20 | $ | 9.09 | $ | 5.93 | |||||||||||
See Accompanying Notes to Financial Statements.
46
STATEMENTS OF OPERATIONS
For the Six Months Ended January 31, 2009 (Unaudited)
| CMG Core Bond Fund | CMG Short Term Bond Fund | CMG Ultra Short Term Bond Fund | CMG High Yield Fund | ||||||||||||||||
| INVESTMENT INCOME: | |||||||||||||||||||
| Interest | $ | 2,020,041 | $ | 5,089,484 | $ | 2,033,039 | $ | 1,640,460 | |||||||||||
| Interest from affiliates | 20,956 | 12,375 | 2,724 | - | |||||||||||||||
| Securities lending | 43,036 | 58,089 | 23,729 | - | |||||||||||||||
| Total investment income | 2,084,033 | 5,159,948 | 2,059,492 | 1,640,460 | |||||||||||||||
| Expenses: | |||||||||||||||||||
| Investment advisory fee | 100,018 | 250,858 | 132,739 | 77,892 | |||||||||||||||
| Trustees' fees | 9,266 | 9,202 | 8,396 | 7,350 | |||||||||||||||
| Audit fee | 19,731 | 20,471 | 18,995 | 22,617 | |||||||||||||||
| Other expenses | 5,132 | 7,956 | 7,020 | 5,459 | |||||||||||||||
| Total expenses | 134,147 | 288,487 | 167,150 | 113,318 | |||||||||||||||
| Fees waived or expenses reimbursed by investment advisor | (33,953 | ) | (37,569 | ) | (34,492 | ) | (35,223 | ) | |||||||||||
| Net expenses | 100,194 | 250,918 | 132,658 | 78,095 | |||||||||||||||
| Net investment income | 1,983,839 | 4,909,030 | 1,926,834 | 1,562,365 | |||||||||||||||
| NET REALIZED AND UNREALIZED GAIN (LOSS) ON INVESTMENTS, FOREIGN CURRENCY, FUTURES CONTRACTS AND CREDIT DEFAULT SWAP CONTRACTS: | |||||||||||||||||||
| Net realized gain (loss) on: | |||||||||||||||||||
| Investments | (507,885 | ) | (161,449 | ) | (97,397 | ) | (3,661,638 | ) | |||||||||||
| Foreign currency transactions and forward foreign currency exchange contracts | - | - | - | 30,384 | |||||||||||||||
| Futures contracts | - | 80,324 | - | - | |||||||||||||||
| Credit default swap contracts | - | - | - | 1,107 | |||||||||||||||
| Net realized loss | (507,885 | ) | (81,125 | ) | (97,397 | ) | (3,630,147 | ) | |||||||||||
| Net change in unrealized appreciation (depreciation) on: | |||||||||||||||||||
| Investments | (1,097,293 | ) | (5,109,484 | ) | (2,309,368 | ) | (3,928,495 | ) | |||||||||||
| Foreign currency translations and forward foreign currency exchange contracts | - | - | - | 1,430 | |||||||||||||||
| Futures contracts | - | 42,546 | - | - | |||||||||||||||
| Credit default swap contracts | - | - | - | (15,055 | ) | ||||||||||||||
| Net change in unrealized appreciation (depreciation) | (1,097,293 | ) | (5,066,938 | ) | (2,309,368 | ) | (3,942,120 | ) | |||||||||||
| Net loss | (1,605,178 | ) | (5,148,063 | ) | (2,406,765 | ) | (7,572,267 | ) | |||||||||||
| NET INCREASE (DECREASE) RESULTING FROM OPERATIONS | $ | 378,661 | $ | (239,033 | ) | $ | (479,931 | ) | $ | (6,009,902 | ) | ||||||||
See Accompanying Notes to Financial Statements.
47
STATEMENTS OF CHANGES IN NET ASSETS
| CMG Core Bond Fund | CMG Short Term Bond Fund | ||||||||||||||||||
| (Unaudited) Six Months Ended January 31, 2009 | Year Ended July 31, 2008 | (Unaudited) Six Months Ended January 31, 2009 | Year Ended July 31, 2008 | ||||||||||||||||
| Increase (decrease) in net assets | |||||||||||||||||||
| Operations: | |||||||||||||||||||
| Net investment income | $ | 1,983,839 | $ | 4,470,337 | $ | 4,909,030 | $ | 8,177,268 | |||||||||||
| Net realized gain (loss) on investments and futures contracts | (507,885 | ) | (998,360 | ) | (81,125 | ) | 38,391 | ||||||||||||
| Net change in unrealized appreciation (depreciation) on investments and futures contracts | (1,097,293 | ) | (458,717 | ) | (5,066,938 | ) | (1,030,404 | ) | |||||||||||
| Net increase (decrease) resulting from operations | 378,661 | 3,013,260 | (239,033 | ) | 7,185,255 | ||||||||||||||
| Distributions to shareholders: | |||||||||||||||||||
| From net investment income | (2,008,701 | ) | (4,651,794 | ) | (5,293,875 | ) | (8,705,705 | ) | |||||||||||
| Net capital stock transactions | (6,832,748 | ) | 22,089,503 | 12,368,405 | 68,632,114 | ||||||||||||||
| Total increase (decrease) in net assets | (8,462,788 | ) | 20,450,969 | 6,835,497 | 67,111,664 | ||||||||||||||
| NET ASSETS: | |||||||||||||||||||
| Beginning of period | 88,124,286 | 67,673,317 | 205,543,455 | 138,431,791 | |||||||||||||||
| End of period | $ | 79,661,498 | $ | 88,124,286 | $ | 212,378,952 | $ | 205,543,455 | |||||||||||
| Overdistibuted net investment income at end of period | $ | (40,800 | ) | $ | (15,938 | ) | $ | (662,238 | ) | $ | (277,393 | ) | |||||||
See Accompanying Notes to Financial Statements.
48
STATEMENTS OF CHANGES IN NET ASSETS
| CMG Ultra Short Term Bond Fund | CMG High Yield Fund | ||||||||||||||||||
| (Unaudited) Six Months Ended January 31, 2009 | Year Ended July 31, 2008 | (Unaudited) Six Months Ended January 31, 2009 | Year Ended July 31, 2008 | ||||||||||||||||
| Increase (decrease) in net assets | |||||||||||||||||||
| Operations: | |||||||||||||||||||
| Net investment income | $ | 1,926,834 | $ | 5,578,370 | $ | 1,562,365 | $ | 3,737,639 | |||||||||||
| Net realized gain (loss) on investments, foreign currency transactions, forward foreign currency exchange contracts and credit default swap contracts | (97,397 | ) | (1,876,094 | ) | (3,630,147 | ) | (2,410,581 | ) | |||||||||||
| Net change in unrealized appreciation (depreciation) on investments, foreign currency translations, forward foreign currency exchange contracts and credit default swap contracts | (2,309,368 | ) | (2,191,777 | ) | (3,942,120 | ) | 263,527 | ||||||||||||
| Net increase (decrease) resulting from operations | (479,931 | ) | 1,510,499 | (6,009,902 | ) | 1,590,585 | |||||||||||||
| Distributions to shareholders: | |||||||||||||||||||
| From net investment income | (2,150,863 | ) | (5,705,300 | ) | (1,693,575 | ) | (3,778,512 | ) | |||||||||||
| Net capital stock transactions | 5,505,179 | (52,002,839 | ) | 816,512 | (14,287,932 | ) | |||||||||||||
| Total increase (decrease) in net assets | 2,874,385 | (56,197,640 | ) | (6,886,965 | ) | (16,475,859 | ) | ||||||||||||
| NET ASSETS: | |||||||||||||||||||
| Beginning of period | 96,595,018 | 152,792,658 | 45,697,316 | 62,173,175 | |||||||||||||||
| End of period | $ | 99,469,403 | $ | 96,595,018 | $ | 38,810,351 | $ | 45,697,316 | |||||||||||
| Overdistibuted net investment income at end of period | $ | (294,703 | ) | $ | (70,674 | ) | $ | (269,513 | ) | $ | (138,303 | ) | |||||||
See Accompanying Notes to Financial Statements.
49
STATEMENTS OF CHANGES IN NET ASSETS - CAPITAL STOCK ACTIVITY
| CMG Core Bond Fund | |||||||||||||||||||
| (Unaudited) Six Months Ended January 31, 2009 | Year Ended July 31, 2008 | ||||||||||||||||||
| Shares | Dollars ($) | Shares | Dollars ($) | ||||||||||||||||
| Subscriptions | 1,056,814 | 10,253,619 | 4,024,573 | 40,729,229 | |||||||||||||||
| Distributions reinvested | 78,449 | 754,864 | 156,722 | 1,588,459 | |||||||||||||||
| Redemptions | (1,867,985 | ) | (17,841,231 | ) | (2,008,322 | ) | (20,228,185 | ) | |||||||||||
| Net increase (decrease) | (732,722 | ) | (6,832,748 | ) | 2,172,973 | 22,089,503 | |||||||||||||
| CMG Short Term Bond Fund | |||||||||||||||||||
| (Unaudited) Six Months Ended January 31, 2009 | Year Ended July 31, 2008 | ||||||||||||||||||
| Shares | Dollars ($) | Shares | Dollars ($) | ||||||||||||||||
| Subscriptions | 6,259,149 | 70,438,649 | 10,954,738 | 127,068,209 | |||||||||||||||
| Distributions reinvested | 49,273 | 550,959 | 115,417 | 1,341,771 | |||||||||||||||
| Redemptions | (5,219,925 | ) | (58,621,203 | ) | (5,139,763 | ) | (59,777,866 | ) | |||||||||||
| Net increase | 1,088,497 | 12,368,405 | 5,930,392 | 68,632,114 | |||||||||||||||
| CMG Ultra Short Term Bond Fund | |||||||||||||||||||
| (Unaudited) Six Months Ended January 31, 2009 | Year Ended July 31, 2008 | ||||||||||||||||||
| Shares | Dollars ($) | Shares | Dollars ($) | ||||||||||||||||
| Subscriptions | 5,658,223 | 52,117,825 | 4,274,964 | 40,228,402 | |||||||||||||||
| Distributions reinvested | 9,181 | 83,698 | 88,630 | 835,828 | |||||||||||||||
| Redemptions | (5,116,327 | ) | (46,696,344 | ) | (9,893,831 | ) | (93,067,069 | ) | |||||||||||
| Net increase (decrease) | 551,077 | 5,505,179 | (5,530,237 | ) | (52,002,839 | ) | |||||||||||||
| CMG High Yield Fund | |||||||||||||||||||
| (Unaudited) Six Months Ended January 31, 2009 | Year Ended July 31, 2008 | ||||||||||||||||||
| Shares | Dollars ($) | Shares | Dollars ($) | ||||||||||||||||
| Subscriptions | 909,756 | 5,553,846 | 1,692,130 | 12,887,905 | |||||||||||||||
| Distributions reinvested | 139,696 | 839,512 | 261,129 | 1,950,122 | |||||||||||||||
| Redemptions | (887,425 | ) | (5,576,846 | ) | (3,886,936 | ) | (29,125,959 | ) | |||||||||||
| Net increase (decrease) | 162,027 | 816,512 | (1,933,677 | ) | (14,287,932 | ) | |||||||||||||
See Accompanying Notes to Financial Statements.
50
NOTES TO FINANCIAL STATEMENTS
January 31, 2009 (Unaudited)
Note 1. Organization
Columbia Funds Institutional Trust (the "Trust") is a Massachusetts business trust registered under the Investment Company Act of 1940, as amended, as an open-end management investment company. Information presented in these financial statements pertains only to the following diversified funds (individually referred to as a "Fund", collectively referred to as the "Funds"):
CMG Core Bond Fund
CMG Short Term Bond Fund
CMG Ultra Short Term Bond Fund
CMG High Yield Fund
Shares of the Funds are available for purchase by institutional investors investing directly in the Funds, by institutional investors investing in the Funds as an advisory client of Columbia Management Advisors, LLC ("Columbia"), the Funds' investment adviser, and by institutional investors investing in the Funds as an advisory client of Bank of America, N.A. Please see the Funds' prospectuses for further details, including applicable investment minimums.
Investment objectives. CMG Core Bond Fund seeks to provide investors a high level of current income consistent with capital preservation. CMG Short Term Bond Fund seeks to provide investors a high level of current income consistent with a high degree of stability of principal. CMG Ultra Short Term Bond Fund seeks a high level of current income consistent with the maintenance of liquidity and the preservation of capital. CMG High Yield Fund seeks a high level of current income. Capital appreciation is a secondary objective of the CMG High Yield Fund when consistent with a high level of current income.
Fund shares. The Trust may issue an unlimited number of shares of beneficial interest which are offered continuously at net asset value.
Note 2. Significant accounting policies
The preparation of financial statements in accordance with accounting principles generally accepted in the United States of America ("GAAP") requires management to make certain estimates and assumptions that affect the reported amounts of assets and liabilities, the disclosure of contingent assets and liabilities at the date of the financial statements and the reported amounts of revenue and expenses during the reporting period. Actual results could differ from those estimates. The following is a summary of significant accounting policies consistently followed by the Funds in the preparation of their financial statements.
Security valuation. Debt securities generally are valued by pricing services approved by the Trust's Board of Trustees, based upon market transactions for normal, institutional-size trading units of similar securities. The services may use various pricing techniques which take into account appropriate factors such as yield, quality, coupon rate, maturity, type of issue, trading characteristics and other data, as well as broker quotes. Debt securities for which quotations are readily available are valued at an over-the-counter or exchange bid quotation. Certain debt securities, which tend to be more thinly traded and of lesser quality, are priced based on fundamental analysis of the financial condition of the issuer and the estimated value of any collateral. Valuations developed through pricing techniques may vary from the actual amounts realized upon sale of the securities, and the potential variation may be greater for those securities valued using fundamental analysis.
51
NOTES TO FINANCIAL STATEMENTS (continued)
January 31, 2009 (Unaudited)
Short-term investments maturing in 60 days or less are valued at amortized cost, which approximates market value.
Futures contracts are valued at the settlement price established each day by the board of trade or exchange on which they are traded.
Credit default swap contracts are marked to market daily based upon quotations from market makers. Quotations obtained from independent pricing services use information provided by market makers.
Forward foreign currency exchange contracts are valued at the prevailing forward exchange rate of the underlying currencies.
Foreign securities are generally valued at the last sale price on the foreign exchange or market on which they trade. If any foreign share prices are not readily available as a result of limited share activity, the securities are valued at the last sale price of the local shares in the principal market in which such securities are normally traded.
Generally, trading in foreign securities is substantially completed each day at various times prior to the close of the New York Stock Exchange ("NYSE"). The values of such securities used in computing the net asset value of the Funds' shares are determined as of such times. Foreign currency exchange rates are generally determined at 4:00 p.m. Eastern (U.S.) time. Occasionally, events affecting the values of such foreign securities and such exchange rates may occur between the times at which they are determined and the close of the customary trading session of the NYSE, which would not be reflected in the computation of the Funds' net asset values. If events materially affecting the values of such foreign securities occur and it is determined that market quotations are not reliable, then these foreign securities will be valued at their fair value using procedures approved by the Board of Trustees. The Funds may use a systematic fair valuation model provided by an independent third party to value securities principally traded in foreign markets in order to adjust for possible stale pricing that may occur between the close of the foreign exchanges and the time for valuation.
Investments for which market quotations are not readily available, or that have quotations which management believes are not reliable, are valued at fair value as determined in good faith under consistently applied procedures established by and under the general supervision of the Board of Trustees. If a security is valued at fair value, such value is likely to be different from the last quoted market price for the security. The determination of fair value often requires significant judgment. To determine fair value, management may use assumptions including but not limited to future cash flows and estimated risk premiums. Multiple inputs from various sources may be used to determine value.
On August 1, 2008, the Funds adopted Statement of Financial Accounting Standards No. 157, Fair Value Measurements ("SFAS 157"). SFAS 157 establishes a hierarchy that prioritizes the inputs to valuation techniques used to measure fair value giving the highest priority to unadjusted quoted prices in active markets for identical securities (level 1 measurements) and the lowest priority to unobservable inputs (level 3 measurements) when market prices are not readily available or reliable. The three levels of the fair value hierarchy under SFAS 157 are described below:
• Level 1—quoted prices in active markets for identical securities
• Level 2—prices determined using other significant observable inputs (including quoted prices for similar securities, interest rates, prepayment speeds, credit risk and others)
• Level 3—prices determined using significant unobservable inputs. In situations where quoted prices or observable inputs are unavailable or less reliable, unobservable inputs may be used. Unobservable inputs may include management's own assumptions about the factors market participants would use in pricing an investment.
The inputs or methodology used for valuing securities are not necessarily an indication of the risk associated with investing in those securities.
52
NOTES TO FINANCIAL STATEMENTS (continued)
January 31, 2009 (Unaudited)
| The following tables summarize the inputs used, as of January 31, 2009, in valuing each Funds' assets: | |||||||||||
| CMG Core Bond Fund | |||||||||||
| Valuation Inputs | Investments in Securities | Other Financial Instruments | |||||||||
| Level 1—Quoted Prices | $ | 22,857,201 | $ | - | |||||||
| Level 2—Other Significant Observable Inputs | 72,110,073 | - | |||||||||
| Level 3—Significant Unobservable Inputs | - | - | |||||||||
| Total | $ | 94,967,274 | $ | - | |||||||
| CMG Short Term Bond Fund | |||||||||||
| Valuation Inputs | Investments in Securities | Other Financial Instruments* | |||||||||
| Level 1—Quoted Prices | $ | 21,067,719 | $ | 42,546 | |||||||
| Level 2—Other Significant Observable Inputs | 208,528,285 | - | |||||||||
| Level 3—Significant Unobservable Inputs | 62,251 | - | |||||||||
| Total | $ | 229,658,255 | $ | 42,546 | |||||||
*Other financial instruments consist of futures contracts which are not included in the Schedule of Investments.
The following table reconciles asset balances for the six month period ending January 31, 2009, in which significant unobservable inputs (Level 3) were used in determining value:
| Investments in Securities | Other Financial Instruments | ||||||||||
| Balance as of July 31, 2008 | $ | 76,207 | $ | - | |||||||
| Accretion of Discounts/Amortization of Premiums | 23 | - | |||||||||
| Realized gain (loss) | 126 | - | |||||||||
| Change in unrealized depreciation | (6,737 | ) | - | ||||||||
| Net purchases/sales | (7,368 | ) | - | ||||||||
| Transfers into and/or out of Level 3 | - | - | |||||||||
| Balance as of January 31, 2009 | $ | 62,251 | $ | - | |||||||
The change in unrealized losses attributable to securities owned at January 31, 2009 which were valued using significant unobservable inputs (Level 3) amounted to $6,737. This amount is included in net change in unrealized depreciation on the Statement of Changes in Net Assets.
53
NOTES TO FINANCIAL STATEMENTS (continued)
January 31, 2009 (Unaudited)
| CMG Ultra Short Term Bond Fund | |||||||||||
| Valuation Inputs | Investments in Securities | Other Financial Instruments | |||||||||
| Level 1—Quoted Prices | $ | 4,354,425 | $ | - | |||||||
| Level 2—Other Significant Observable Inputs | 97,218,242 | - | |||||||||
| Level 3—Significant Unobservable Inputs | 625,000 | - | |||||||||
| Total | $ | 102,197,667 | $ | - | |||||||
The following table reconciles asset balances for the six month period ending January 31, 2009 in which significant unobservable inputs (Level 3) were used in determining value:
| Investments in Securities | Other Financial Instruments | ||||||||||
| Balance as of July 31, 2008 | $ | 1,774,238 | $ | - | |||||||
| Accretion of Discounts/Amortization of Premiums | - | - | |||||||||
| Realized gain | 804 | - | |||||||||
| Change in unrealized depreciation | (550,150 | ) | - | ||||||||
| Net sales | (195,929 | ) | - | ||||||||
| Transfers out of Level 3 | (403,963 | ) | - | ||||||||
| Balance as of January 31, 2009 | $ | 625,000 | $ | - | |||||||
The change in unrealized losses attributable to securities owned at January 31, 2009 which were valued using significant unobservable inputs (Level 3) amounted to $549,069. This amount is included in net change in unrealized depreciation on the Statement of Changes in Net Assets.
| CMG High Yield Fund | |||||||||||
| Valuation Inputs | Investments in Securities | Other Financial Instruments* | |||||||||
| Level 1—Quoted Prices | $ | - | $ | - | |||||||
| Level 2—Other Significant Observable Inputs | 37,890,294 | (498,393 | ) | ||||||||
| Level 3—Significant Unobservable Inputs | - | - | |||||||||
| Total | $ | 37,890,294 | $ | (498,393 | ) | ||||||
*Other financial instruments consist of a forward foreign currency exchange contract and a credit default swap contract which are not included in the Schedule of Investments.
The tables reconciling asset balances for which significant unobservable inputs (Level 3) were used in determining value reflect fiscal year to date activity for any securities for which Level 3 inputs were used at either the beginning or the end of the current fiscal period.
Security transactions. Security transactions are accounted for on the trade date. Cost is determined and gains (losses) are based upon the specific identification method for both financial statement and federal income tax purposes.
54
NOTES TO FINANCIAL STATEMENTS (continued)
January 31, 2009 (Unaudited)
In March 2008, Statement of Financial Accounting Standards No. 161, Disclosures about Derivative Instruments and Hedging Activities–an amendment of FASB Statement No. 133 ("SFAS 161"), was issued. SFAS 161 is effective for fiscal years and interim periods beginning after November 15, 2008. SFAS 161 requires additional discussion about the reporting entity's derivative instruments and hedging activities, by providing for qualitative disclosures about the objectives and strategies for using derivatives, quantitative data about the fair value of and gains and losses on derivative contracts, and details of credit-risk-related contingent features in their derivative contracts. Management is evaluating the impact the application of SFAS 161 will have on the Funds' financial stateme nt disclosures.
In September 2008, FASB Staff Position 133-1 and FIN 45-4, Disclosures about Credit Derivatives and Certain Guarantees: An Amendment of FASB Statement No. 133 and FASB Interpretation No. 45 and Clarification of the Effective Date of FASB Statement No. 161 ("Amendment"), was issued and is effective for annual and interim reporting periods ending after November 15, 2008. The Amendment requires enhanced disclosures regarding a fund's credit derivatives and hybrid financial instruments containing embedded credit derivatives.
Futures contracts. The Funds may invest in futures for both hedging and non-hedging purposes, including, for example, to seek to enhance returns or as a substitute for a position in an underlying asset.
The use of futures contracts involves certain risks, which include: (1) imperfect correlation between the price movement of the instruments and the underlying securities, (2) inability to close out positions due to differing trading hours, or the temporary absence of a liquid market, for either the instruments or the underlying securities, or (3) an inaccurate prediction by Columbia of the future direction of interest rates. Any of these risks may involve amounts exceeding the variation margin recorded in the Funds' Statements of Assets and Liabilities at any given time.
Upon entering into a futures contract, a Fund pledges cash or securities with the broker in an amount sufficient to meet the initial margin requirement. Subsequent payments are made or received by a Fund equal to the daily change in the contract value and are recorded as variation margin receivable or payable and offset in unrealized gains or losses. A Fund recognizes a realized gain or loss when the contract is closed or expires.
Forward foreign currency exchange contracts. Forward foreign currency exchange contracts are agreements to exchange one currency for another at a future date at a specified price. These contracts are used to minimize the exposure to foreign exchange rate fluctuations during the period between trade and settlement date of the contract. Certain Funds may utilize forward foreign currency exchange contracts in connection with the settlement of purchases and sales of securities. Certain Funds may also enter into these contracts to hedge certain other foreign currency denominated assets. Contracts to buy generally are used to acquire exposure to foreign currencies, while contracts to sell are generally used to hedge the Funds' investments against currency fluctuations. Forward foreign currency exchange contracts are valued daily at the current exchange rate of the underlying currency, resulting in unrealized gains (losses) which become realized at the time the forward foreign currency exchange contracts are closed or mature. Realized and unrealized gains (losses) arising from such transactions are included in net realized and unrealized gains (losses) on foreign currency transactions. The use of forward foreign currency exchange contracts does not eliminate fluctuations in the prices of the Funds' portfolio securities. While the maximum potential loss from such contracts is the aggregate face value in U.S. dollars at the time the contract was opened, exposure is typically limited to the change in value of the contract (in U.S. dollars) over the period it remains open. The Funds could also be exposed to risk that counterparties of the contracts may be unable to fulfill the terms of the contracts.
Repurchase agreements. Each Fund may engage in repurchase agreement transactions with institutions that Columbia has determined are creditworthy. Each Fund, through its custodian, receives delivery of the underlying securities collateralizing a repurchase agreement. Columbia is responsible for determining that the collateral is at least equal, at all times, to the value of the repurchase obligation including interest. A repurchase agreement transaction involves certain risks in the event of default or insolvency of the counterparty. These risks include possible delays or restrictions
55
NOTES TO FINANCIAL STATEMENTS (continued)
January 31, 2009 (Unaudited)
on each Fund's ability to dispose of the underlying securities and a possible decline in the value of the underlying securities during the period while the Funds seek to assert their rights.
Loan participations and commitments. CMG High Yield Fund may invest in loan participations. When CMG High Yield Fund purchases a loan participation, CMG High Yield Fund typically enters into a contractual relationship with the lender or third party selling such participation ("Selling Participant"), but not the borrower. However, CMG High Yield Fund assumes the credit risk of the borrower, Selling Participant and any other persons interpositioned between CMG High Yield Fund and the borrower. CMG High Yield Fund may not directly benefit from the collateral supporting the senior loan which it has purchased from the Selling Participant.
Credit default swaps. The Funds may engage in credit default swap transactions for hedging purposes or to seek to increase total return. Credit default swaps are agreements in which one party pays fixed periodic payments to a counterparty in consideration for a guarantee from the counterparty to make a specific payment should a negative credit event take place. The Funds may receive an upfront payment as the protection seller or make an upfront payment as the protection buyer.
If the Fund is a seller of protection and a credit event occurs, as defined under the terms of that particular swap agreement, the Fund will either (i) pay to the buyer of protection an amount equal to the notional amount of the swap and take delivery of the referenced obligation or underlying securities comprising the referenced index or (ii) pay a net settlement amount in the form of cash or securities equal to the notional amount of the swap less the recovery value of the referenced obligation or underlying securities comprising the referenced index. Recovery values are assumed by market makers considering either industry standard recovery rates or entity specific factors and considerations until a credit event occurs. If a credit event has occurred, the recovery value is determined by a facilitated auction whereby a minimum number of allowable broker bids, together with a specified valuation method, are used to calculate the settlement value.
Credit default swaps are marked to market daily based on quotations from market makers and any change is recorded as unrealized appreciation/depreciation on the Funds' Statement of Assets and Liabilities. Periodic payments received or made are recorded as realized gain or loss and premiums received or made are amortized on the Statements of Operations. Gains or losses are realized as a result of a credit event or termination of the contract. Collateral, in the form of restricted cash or securities, may be required to be held in segregated accounts with the Funds' custodian in compliance with the terms of the swap contract.
By entering into these agreements, the Funds could be exposed to risks in excess of the amounts recorded on the Statements of Assets and Liabilities. Risks include the possibility that there will be no liquid market for these agreements, or that the counterparty to an agreement will default on its obligation to perform.
Delayed delivery securities. Each Fund may trade securities on other than normal settlement terms, including securities purchased or sold on a "when-issued" basis. This may increase the risk if the other party to the transaction fails to deliver and causes the Funds to subsequently invest at less advantageous prices. Each Fund holds until the settlement date, in a segregated account, cash or liquid securities in an amount equal to the delayed delivery commitment.
Treasury inflation protected securities. The Funds may invest in treasury inflation protected securities ("TIPS"). The principal amount of TIPS is adjusted periodically for inflation based on a monthly published index. Interest payments are based on the inflation-adjusted principal at the time the interest is paid. These adjustments are recorded as interest income on the Statements of Operations.
Stripped securities. Stripped mortgage-backed securities are derivative multi-class mortgage securities structured so that one class receives most, if not all, of the principal from the underlying mortgage assets, while the other class receives most, if not all, of the interest and the remainder of the principal. If the underlying mortgage assets experience
56
NOTES TO FINANCIAL STATEMENTS (continued)
January 31, 2009 (Unaudited)
greater than anticipated prepayments of principal, a Fund may fail to fully recoup its initial investment in an interest-only security. The market value of these securities can be extremely volatile in response to changes in interest rates. Credit risk reflects the risk that a Fund may not receive all or part of its principal because the issuer or credit enhancer has defaulted on its obligation.
Foreign currency translations and transactions. The values of all assets and liabilities quoted in foreign currencies are translated into U.S. dollars at that day's exchange rates. Net realized and unrealized gains (losses) on foreign currency transactions include gains (losses) arising from the fluctuation in exchange rates between trade and settlement dates on securities transactions, gains (losses) arising from the disposition of foreign currency and currency gains (losses) between the accrual and payment dates on dividends, interest income and foreign withholding taxes.
For financial statement purposes, the Funds do not distinguish that portion of gains (losses) on investments which is due to changes in foreign exchange rates from that which is due to changes in market prices of the investments. Such fluctuations are included with the net realized and unrealized gains (losses) on investments on the Statements of Operations.
Income recognition. Interest income is recorded on an accrual basis and includes accretion of discounts, amortization of premiums and paydown gains and losses. Fee income attributable to mortgage dollar roll transactions is recorded on the accrual basis over the term of the transaction. The value of additional securities received as an income payment is recorded as income and as the cost basis of such securities. Corporate actions and dividend income are recorded on the ex-date except for certain foreign securities which are recorded as soon after the ex-date as the Funds become aware of such, net of any non-reclaimable tax withholdings.
Expenses. General expenses of the Trust are allocated to the Funds and other series of the Trust based upon relative net assets or other expense allocation methodologies determined by the nature of the expense. Expenses directly attributable to a Fund are charged to such Fund.
Federal income tax status. Each Fund intends to qualify each year as a "regulated investment company" under Subchapter M of the Internal Revenue Code, as amended, and will distribute substantially all of its taxable income for its tax year, and as such will not be subject to federal income taxes. In addition, each Fund intends to distribute in each calendar year substantially all of its net investment income, capital gains and certain other amounts, if any, such that each Fund should not be subject to federal excise tax. Therefore, no federal income or excise tax provision is recorded.
Distributions to shareholders. Distributions from net investment income are declared daily and distributed monthly. Net realized capital gains, if any, are distributed at least annually. Income distributions and capital gain distributions are determined in accordance with federal income tax regulations which may differ from GAAP.
Indemnification. In the normal course of business, each Fund enters into contracts that contain a variety of representations and warranties and which provide general indemnities. A Fund's maximum exposure under these arrangements is unknown because this would involve future claims against a Fund. Also, under the Trust's organizational documents and by contract, the Trustees and officers of the Trust are indemnified against certain liabilities that may arise out of actions relating to their duties to the Trust. However, based on experience, the Funds expect the risk of loss due to these representations, warranties and indemnities to be minimal.
57
NOTES TO FINANCIAL STATEMENTS (continued)
January 31, 2009 (Unaudited)
Note 3. Federal tax information
The tax character of distributions paid during the year ended July 31, 2008 was as follows:
| Ordinary Income* | Long-Term Capital Gains | ||||||||||
| CMG Core Bond Fund | $ | 4,651,794 | $ | - | |||||||
| CMG Short Term Bond Fund | 8,705,705 | - | |||||||||
| CMG Ultra Short Term Bond Fund | 5,705,300 | - | |||||||||
| CMG High Yield Fund | 3,778,512 | - | |||||||||
*For tax purposes short-term capital gain distributions, if any, are considered ordinary income distributions.
Unrealized appreciation and depreciation at January 31, 2009, based on cost of investments for federal income tax purposes, were:
| Unrealized Appreciation | Unrealized Depreciation | Net Unrealized Depreciation | |||||||||||||
| CMG Core Bond Fund | $ | 1,463,221 | $ | (3,958,393 | ) | $ | (2,495,172 | ) | |||||||
| CMG Short Term Bond Fund | 1,687,409 | (8,666,307 | ) | (6,978,898 | ) | ||||||||||
| CMG Ultra Short Term Bond Fund | 240,957 | (5,899,009 | ) | (5,658,052 | ) | ||||||||||
| CMG High Yield Fund | 153,691 | (7,277,096 | ) | (7,123,405 | ) | ||||||||||
The following capital loss carryforwards, determined as of July 31, 2008, may be available to reduce taxable income arising from future net realized gains on investments, if any, to the extent permitted by the Internal Revenue Code:
| Year of Expiration | |||||||||||||||||||||||||||||||||||
| 2009 | 2010 | 2012 | 2013 | 2014 | 2015 | 2016 | Total | ||||||||||||||||||||||||||||
| CMG Core Bond Fund | $ | - | $ | - | $ | - | $ | - | $ | 304,526 | $ | 1,461,747 | $ | 399,785 | $ | 2,166,058 | |||||||||||||||||||
| CMG Short Term Bond Fund | - | 2,365,257 | 19,156 | 25,391 | 989,127 | 899,128 | 650,370 | 4,948,429 | |||||||||||||||||||||||||||
| CMG Ultra Short Term Bond Fund | - | - | 29,640 | 47,961 | 627,248 | 685,751 | 213,699 | 1,604,299 | |||||||||||||||||||||||||||
| CMG High Yield Fund | 6,776,032 | 2,987,019 | - | - | - | 3,691,106 | 835,787 | 14,289,944 | |||||||||||||||||||||||||||
Under current tax rules, certain capital losses realized after October 31 may be deferred and treated as occurring on the first day of the following fiscal year. As of July 31, 2008, post-October capital losses attributed to security transactions were deferred to August 1, 2008, as follows:
| Capital Losses | |||||||
| CMG Core Bond Fund | $ | 958,625 | |||||
| CMG Short Term Bond Fund | 57,876 | ||||||
| CMG Ultra Short Term Bond Fund | 2,047,300 | ||||||
| CMG High Yield Fund | 2,310,873 | ||||||
Under Financial Accounting Standards Board ("FASB") Interpretation No. 48, Accounting for Uncertainty in Income Taxes, an Interpretation of FASB Statement No. 109 ("FIN 48"), management determines whether a tax position of the Funds is more likely than not to be sustained upon examination by the applicable taxing authority, including resolution of any related appeals or litigation processes, based on the technical merits of the position. The tax benefit to be recognized is
58
NOTES TO FINANCIAL STATEMENTS (continued)
January 31, 2009 (Unaudited)
measured as the largest amount of benefit that is greater than fifty percent likely of being realized upon ultimate settlement. Management has evaluated the known implications of FIN 48 on its computation of net assets for each Fund. As a result of this evaluation, management has concluded that FIN 48 did not have any effect on the Funds' financial statements. However, management's conclusions regarding FIN 48 may be subject to review and adjustment at a later date based on factors including, but not limited to, further implementation guidance from the FASB, new tax laws, regulations, and administrative interpretations (including relevant court decisions). The Funds' federal tax returns for the prior three fiscal years remain subject to examination by the Internal Revenue Service. The Funds are not aware of any tax positions for which it is reasonably possible that the total amounts of unrecognized tax benefits will significantl y change in the next twelve months.
Note 4. Fees and compensation paid to affiliates
Investment advisory fee. Columbia, an indirect, wholly owned subsidiary of Bank of America Corporation ("BOA"), provides investment advisory, administrative and other services to the Funds. In rendering investment advisory services to the Funds, Columbia may use the portfolio management and research resources of Columbia Management Pte. Ltd., an affiliate of Columbia. Each Fund's investment advisory fee is a unified fee. Columbia, out of the unified fee it receives from the Funds, pays all accounting fees, legal fees, transfer agent fees, custody fees, expenses of the Chief Compliance Officer, the commitment fee for the line of credit (see Note 6) and miscellaneous expenses of the Funds. The unified fee does not include brokerage fees, taxes, fees and expenses of the independent Trustees (including legal counsel fees), audit fees, interest expense associated with any borrowings by the Funds or extraordinary expenses, if any. The unified fees are paid monthly to Columbia based on each Fund's average daily net assets at the following annual rates:
| CMG Core Bond Fund | 0.25 | % | |||||
| CMG Short Term Bond Fund | 0.25 | % | |||||
| CMG Ultra Short Term Bond Fund | 0.25 | % | |||||
| CMG High Yield Fund | 0.40 | % | |||||
Pricing and bookkeeping fees. The Funds have entered into a Financial Reporting Services Agreement (the "Financial Reporting Services Agreement") with State Street Bank & Trust Company ("State Street") and Columbia pursuant to which State Street provides financial reporting services to the Funds. The Funds have also entered into an Accounting Services Agreement (collectively with the Financial Reporting Services Agreement, the "State Street Agreements") with State Street and Columbia pursuant to which State Street provides accounting services to the Funds.
The Funds have entered into a Pricing and Bookkeeping Oversight and Services Agreement (the "Services Agreement") with Columbia. Under the Services Agreement, Columbia provides services related to Fund expenses and the requirements of the Sarbanes-Oxley Act of 2002, and provides oversight of the accounting and financial reporting services provided by State Street. The pricing and bookkeeping fees for each Fund are payable by Columbia.
Transfer agent fee. Columbia Management Services, Inc. (the "Transfer Agent"), an affiliate of Columbia and an indirect, wholly owned subsidiary of BOA, provides shareholder services to the Funds and has contracted with Boston Financial Data Services ("BFDS") to serve as sub-transfer agent. The transfer agent fees for the Funds are payable by Columbia. The Transfer Agent pays the fees of BFDS for services as sub-transfer agent and is not entitled to reimbursement for such fees from the Funds or Columbia.
The Transfer Agent may also retain, as additional compensation for its services, fees for wire, telephone and redemption orders, Individual Retirement Account ("IRA") trustee agent fees and account transcript fees due the Transfer Agent from shareholders of the Funds and credits (net of bank charges) earned with respect to balances in accounts the Transfer Agent maintains in connection with its services to the Funds.
59
NOTES TO FINANCIAL STATEMENTS (continued)
January 31, 2009 (Unaudited)
Fee waivers and expense reimbursements. Columbia has contractually agreed to waive its management fee and, to the extent necessary, bear other expenses of each Fund through November 30, 2009, so that the ordinary operating expenses incurred by the Funds will not exceed the following annual rates (exclusive of any distribution and service fees, brokerage commissions, interest, taxes and extraordinary expenses, but inclusive of custodial charges relating to overdrafts, if any), after giving effect to any balance credits from the Funds' custodian, based on each Fund's average daily net assets:
| CMG Core Bond Fund | 0.25 | % | |||||
| CMG Short Term Bond Fund | 0.25 | % | |||||
| CMG Ultra Short Term Bond Fund | 0.25 | % | |||||
| CMG High Yield Fund | 0.40 | % | |||||
There is no guarantee that these arrangements will continue after November 30, 2009.
Fees paid to officers and trustees. All officers of the Funds are employees of Columbia or its affiliates and, with the exception of the Funds' Chief Compliance Officer, receive no compensation from the Funds. The Board of Trustees has appointed a Chief Compliance Officer to the Funds in accordance with federal securities regulations. The Funds, along with other affiliated funds, are charged their pro-rata share of the expenses associated with the Chief Compliance Officer. The expenses of the Chief Compliance Officer charged to each Fund are payable by Columbia.
The Trust's eligible Trustees may participate in a deferred compensation plan which may be terminated at any time. Obligations of the plan will be paid solely out of the Funds' assets.
Note 5. Portfolio information
For the six month period ended January 31, 2009, the cost of purchases and proceeds from sales of securities, excluding short-term obligations, for the Funds were as follows:
| U.S. Government Securities | Other Investment Securities | ||||||||||||||||||
| Purchases | Sales | Purchases | Sales | ||||||||||||||||
| CMG Core Bond Fund | $ | 81,830,737 | $ | 92,035,918 | $ | 14,797,755 | $ | 13,833,626 | |||||||||||
| CMG Short Term Bond Fund | 40,009,005 | 29,208,082 | 27,925,387 | 35,458,703 | |||||||||||||||
| CMG Ultra Short Term Bond Fund | 6,942,774 | 6,280,055 | 29,997,635 | 38,625,863 | |||||||||||||||
| CMG High Yield Fund | - | - | 9,853,443 | 8,472,437 | |||||||||||||||
Note 6. Line of credit
The Funds and other affiliated funds participate in a $280,000,000 committed, unsecured revolving line of credit provided by State Street. The maximum amount that may be borrowed by any fund is limited to the lesser of $200,000,000 and the Fund's borrowing limit set forth in the Fund's registration statement. Borrowings are available for short-term liquidity or temporary or emergency purposes.
Interest is charged to each participating fund based on the fund's borrowings at a rate per annum equal to the greater of the Federal Funds Rate plus 0.50% or the overnight LIBOR Rate plus 0.50%. In addition, an annual operations agency fee of $20,000, an amendment fee of 0.02% and a commitment fee of 0.12% per annum are accrued and apportioned among the participating funds pro rata based on their relative net assets. Prior to October 16, 2008, the Funds and other affiliated funds participated in a $350,000,000 committed, unsecured revolving line of credit and a $150,000,000 uncommitted,
60
NOTES TO FINANCIAL STATEMENTS (continued)
January 31, 2009 (Unaudited)
unsecured line of credit, both provided by State Street. Interest on the committed line of credit was charged to each participating fund based on the fund's borrowings at a rate per annum equal to the Federal Funds Rate plus 0.50%. In addition, a commitment fee of 0.10% per annum was accrued and apportioned among the participating funds pro rata based on their relative net assets. Interest on the uncommitted line of credit was charged to each participating fund based on the fund's borrowings at a rate per annum equal to the Federal Funds Rate plus 0.375%. State Street charged an annual operations agency fee of $40,000 for the committed line of credit and was able to charge an annual administration fee of $15,000 for the uncommitted line of credit. The commitment fee, the operations agency fee and the administration fee were accrued and apportioned among the participating funds pro rata based on their relative net assets.
For the six month period ended January 31, 2009, the Funds did not borrow under these arrangements.
Note 7. Securities lending
Each Fund may lend its securities to certain approved brokers, dealers and other financial institutions. Each loan is collateralized by cash, in an amount at least equal to the market value of the securities loaned plus accrued income from the investment of collateral. The market value of the loaned securities is determined at the close of business of the Funds and any additional required collateral is delivered to the Funds on the next business day. The collateral received is invested and the income generated by the investment of the collateral, net of any fees remitted to State Street as the lending agent and borrower rebates, is paid to the Funds. Generally, in the event of borrower default, the Funds have the right to use the collateral to offset any losses incurred. In the event the Funds are delayed or prevented from exercising their right to dispose of the collateral, there may be a potential loss to the Funds. The Funds bear the risk of loss with respect to the investment of collateral.
Note 8. Shares of beneficial interest
As of January 31, 2009, the Funds had shareholders whose shares were beneficially owned by participant accounts over which BOA and/or any of its affiliates had either sole or joint investment discretion. The percentages of shares of beneficial interest outstanding held therein are as follows:
| % of Shares Outstanding Held | |||||||
| CMG Core Bond Fund | 89.5 | ||||||
| CMG Short Term Bond Fund | 95.8 | ||||||
| CMG Ultra Short Term Bond Fund | 98.6 | ||||||
| CMG High Yield Fund | 78.9 | ||||||
As of January 31, 2009, CMG Core Bond Fund had one account holder that held 10.4% of the shares outstanding over which BOA and/or any of its affiliates did not have investment discretion.
As of January 31, 2009, CMG High Yield Fund had one account holder that held 12.4% of the shares outstanding over which BOA and/or any of its affiliates did not have investment discretion.
Subscription and redemption activity of these accounts may have a significant effect on the operations of the Funds.
61
NOTES TO FINANCIAL STATEMENTS (continued)
January 31, 2009 (Unaudited)
Note 9. Significant risks and contingencies
Sector focus risk. Certain Funds may focus their investments in certain sectors, subjecting them to greater risk than a fund that is less focused.
High yield securities risk. Investing in high-yield securities may involve greater credit risk and considerations not typically associated with investing in U.S. Government bonds and other higher quality fixed income securities. These securities are non-investment grade securities, often referred to as "junk" bonds. Economic downturns may disrupt the high yield market and impair the ability of issuers to repay principal and interest. Also, an increase in interest rates would likely have an adverse impact on the value of such obligations. Moreover, high-yield securities may be less liquid to the extent that there is no established secondary market.
Foreign securities risk. There are certain additional risks involved when investing in foreign securities. These risks may involve foreign currency exchange rate fluctuations, adverse political and economic developments and the possible prevention of currency exchange or other foreign governmental laws or restrictions. In addition, the liquidity of foreign securities may be more limited than that of domestic securities.
Investments in emerging market countries are subject to additional risk. The risk of foreign investments is typically increased in less developed countries. These countries are also more likely to experience high levels of inflation, deflation or currency devaluation which could hurt their economies and securities markets.
Asset-backed securities risk. The value of asset-backed securities may be affected by, among other factors, changes in interest rates, the market's assessment of the quality of underlying assets, the creditworthiness of the servicer for the underlying assets, factors concerning the interests in and structure of the issuer or the originator of the underlying assets, or the creditworthiness or rating of the entities that provide any supporting letters of credit, surety bonds, derivative instruments, or other credit enhancement. The value of asset-backed securities also will be affected by the exhaustion, termination or expiration of any credit enhancement. Most asset-backed securities are subject to prepayment risk, which is the possibility that the underlying debt may be refinanced or prepaid prior to maturity during periods of declining or low interest rates , causing the Fund to have to reinvest the money received in securities that have lower yields. In addition, the impact of prepayments on the value of asset-backed securities may be difficult to predict and may result in greater volatility.
Mortgage-backed securities risk. The value of mortgage-backed securities may be affected by, among other things, changes in interest rates, factors concerning the interests in and structure of the issuer or the originator of the mortgages, the creditworthiness of the entities that provide any supporting letters of credit, surety bonds or other credit enhancements or the quality of underlying assets or the market's assessment thereof. Mortgage-backed securities are subject to prepayment risk, which is the possibility that the underlying mortgage may be refinanced or prepaid prior to maturity during periods of declining or low interest rates, causing the Funds to have to reinvest the money received in securities that have lower yields. In addition, the impact of prepayments on the value of mortgage-backed securities may be difficult to predict and may result i n greater volatility.
Legal proceedings. CMG Funds are not named as parties to any regulatory proceedings or litigation. Columbia Management Advisors, LLC and Columbia Management Distributors, Inc. (collectively, the "Columbia Group") are subject to a settlement agreement with the New York Attorney General ("NYAG") (the "NYAG Settlement") and a settlement order with the SEC (the "SEC Order") on matters relating to mutual fund trading, each dated February 9, 2005. Under the terms of the SEC Order, the Columbia Group (or predecessor entities) agreed, among other things,
62
NOTES TO FINANCIAL STATEMENTS (continued)
January 31, 2009 (Unaudited)
to: pay disgorgement and civil money penalties collectively totaling $140 million; cease and desist from violations of the antifraud provisions and certain other provisions of the federal securities laws; maintain certain compliance and ethics oversight structures; and retain an independent consultant to review the Columbia Group's applicable supervisory, compliance, control and other policies and procedures. The NYAG Settlement, among other things, requires Columbia Management Advisors, LLC and its affiliates to reduce management fees for certain funds in the Columbia family of mutual funds in a projected total of $160 million over five years through November 30, 2009 and to make certain disclosures to investors relating to expenses. In connection with the Columbia Group providing services to the Columbia Funds, the Columbia Funds have voluntarily undertaken to implement certain governance measures designed to maintain the inde pendence of their boards of trustees and certain special consulting and compliance measures.
Pursuant to the SEC Order and related procedures, the $140 million in settlement amounts described above has been substantially distributed in accordance with a distribution plan that was developed by an independent distribution consultant and approved by the SEC on April 6, 2007.
In connection with the events described above, various parties have filed suit against certain funds, the Trustees of the Columbia Funds, FleetBoston Financial Corporation and its affiliated entities and/or Bank of America and its affiliated entities.
On February 20, 2004, the Judicial Panel on Multidistrict Litigation transferred these cases and cases against other mutual fund companies based on similar allegations to the United States District Court in Maryland for consolidated or coordinated pretrial proceedings (the "MDL"). Subsequently, additional related cases were transferred to the MDL. On September 29, 2004, the plaintiffs in the MDL filed amended and consolidated complaints. One of these amended complaints is a putative class action that includes claims under the federal securities laws and state common law, and that names Columbia Management Advisors, Inc. (which has since merged into Banc of America Capital Management, LLC (now named Columbia Management Advisors, LLC)) ("Columbia"), Columbia Funds Distributor, Inc. (now named Columbia Management Distributors, Inc.) (the "Distributor"), the Trustees of the Columbia Funds, Bank of America Corporation and others as d efendants. Another of the amended complaints is a derivative action purportedly on behalf of the Columbia Funds that asserts claims under federal securities laws and state common law.
On February 25, 2005, Columbia and other defendants filed motions to dismiss the claims in the pending cases. On March 1, 2006, for reasons stated in the court's memoranda dated November 3, 2005, the United States District Court for the District of Maryland granted in part and denied in part the defendants' motions to dismiss. The court dismissed all of the class action claims pending against the Columbia Funds Trusts. As to Columbia and the Distributor, the claims under the Securities Act of 1933, the claims under Sections 34(b) and 36(a) of the Investment Company Act of 1940 ("ICA") and the state law claims were dismissed. The claims under Sections 10(b) and 20(a) of the Securities Exchange Act of 1934 and claims under Section 36(b) of the ICA were not dismissed.
On March 21, 2005, a purported class action was filed in Massachusetts state court alleging that certain conduct, including market timing, entitled Class B shareholders in certain Columbia Funds to an exemption from contingent deferred sales charges upon early redemption (the "CDSC Lawsuit"). The CDSC Lawsuit was removed to federal court in Massachusetts and transferred to the MDL.
On September 14, 2007, the plaintiffs and the Columbia defendants named in the MDL, including the Columbia Funds, entered into a stipulation of settlement with respect to all Columbia-related claims in the MDL described above, including the CDSC Lawsuit. The settlement is subject to court approval.
63
BOARD CONSIDERATION AND APPROVAL OF
ADVISORY AGREEMENTS
The Advisory Fees and Expenses Committee of the Board of Trustees meets several times annually to review the advisory agreements (collectively, the "Agreements") of the funds for which the Trustees serve as trustees (each a "fund") and to determine whether to recommend that the full Board approve the continuation of the Agreements for an additional one-year period. After the Committee has made its recommendation, the full Board, including the Independent Trustees, determines whether to approve the continuation of the Agreements. In addition, the full Board, including the Independent Trustees, considers matters bearing on the Agreements at most of its other meetings throughout the year and meets regularly with senior management of the funds and Columbia, the funds' investment adviser, including the senior manager of each investment area within Columbia. Through the Board's Investment Oversight Committees, Trustees also meet with selected fund portfolio managers, research analysts and traders at various times throughout the year.
The Trustees receive and review all materials that they, their legal counsel or Columbia believe to be reasonably necessary for the Trustees to evaluate the Agreements and to determine whether to approve the continuation of the Agreements. Those materials generally include, among other items, (i) information on the investment performance of each fund relative to the performance of peer groups of mutual funds and the fund's performance benchmarks, and additional information assessing performance on a risk-adjusted basis, (ii) information on each fund's advisory fees and other expenses, including information comparing the fund's expenses to those of peer groups of mutual funds and information about any applicable expense caps and fee "breakpoints," (iii) information about the profitability of the Agreements to Columbia, including potential "fall-out" or ancillary benefits that Columbia and its affiliates may receive as a result of their relationships with the funds and (iv) information obtained through Columbia's response to a questionnaire prepared at the request of the Trustees by counsel to the funds and independent legal counsel to the Independent Trustees. The Trustees also consider other information such as (v) Columbia's financial results and financial condition, (vi) each fund's investment objective and strategies and the size, education and experience of Columbia's investment staffs and their use of technology, external research and trading cost measurement tools, (vii) the allocation of the funds' brokerage and the use of "soft" commission dollars to pay for research products and services, (viii) Columbia's resources devoted to, and its record of compliance with, the funds' investment policies and restrictions, policies on personal securities transactions and other compliance policies and legal and regulatory requirements, (ix) Columbia's response to various legal and regulatory proceedings since 2003 and to the recent peri od of volatility in the securities markets and (x) the economic outlook generally and for the mutual fund industry in particular. In addition, the Advisory Fees and Expenses Committee confers with the funds' independent fee consultant and reviews materials relating to the funds' relationships with Columbia provided by the independent fee consultant. Throughout the process, the Trustees have the opportunity to ask questions of and to request additional materials from Columbia and to consult with the independent fee consultant and independent legal counsel to the Independent Trustees.
The Board of Trustees most recently approved the continuation of the Agreements at its October, 2008 meeting, following meetings of the Advisory Fees and Expenses Committee held in February, April, August, September and October, 2008. In considering whether to approve the continuation of the Agreements, the Trustees, including the Independent Trustees, did not identify any single factor as determinative, and each weighed various factors as he or she deemed appropriate. The Trustees considered the following matters in connection with their approval of the continuation of the Agreements:
The nature, extent and quality of the services provided to the funds under the Agreements. The Trustees considered the nature, extent and quality of the services provided by Columbia and its affiliates to the funds and the resources dedicated to the funds by Columbia and its affiliates. Among other things, the Trustees considered (i) Columbia's ability (including its personnel and other resources, compensation programs for personnel involved in fund management, reputation and other attributes) to attract, motivate and retain highly qualified research, advisory and supervisory investment professionals; (ii) the portfolio management services provided by those investment professionals; and (iii) the trade execution services provided on behalf of the funds. For each fund, the Trustees also considered the benefits to shareholders of investing in a mutual fund tha t is part of a family of funds offering exposure to a variety of asset classes and investment disciplines and providing a variety of fund and shareholder services. After reviewing those and related factors, the Trustees concluded, within the context of their overall
64
conclusions regarding each of the Agreements, that the nature, extent and quality of services provided supported the continuation of the Agreements.
Investment performance of the funds and Columbia. The Trustees reviewed information about the performance of each fund over various time periods, including information prepared by an independent third-party data provider that compared the performance of each fund to the performance of peer groups of mutual funds and performance benchmarks. The Trustees also reviewed a description of the third party's methodology for identifying each fund's peer group for purposes of performance and expense comparisons. The Trustees also considered additional information that the Advisory Fees and Expenses Committee requested from Columbia relating to funds that presented relatively weaker performance and/or relatively higher expenses. In the case of each fund whose performance lagged that of a relevant peer group for certain (although not necessarily all) periods, the Truste es concluded that other factors relevant to performance were sufficient, in light of other considerations, to warrant continuation of the fund's Agreements. Those factors varied from fund to fund, but included one or more of the following: (i) that the fund's performance, although lagging in certain recent periods, was stronger over the longer term; (ii) that the underperformance was attributable, to a significant extent, to investment decisions that were reasonable and consistent with the fund's investment strategy and policies and that the fund was performing within a reasonable range of expectations, given those investment decisions, market conditions and the fund's investment strategy; (iii) that the fund's performance was competitive when compared to other relevant performance benchmarks or peer groups; (iv) that Columbia had taken or was taking steps designed to help improve the fund's investment performance, including, but not limited to, replacing portfolio managers or modifying investment strategies ; and (v) that Columbia proposed to waive advisory fees or cap the expenses of the fund.
The Trustees noted the performance of each fund through April 30, 2008 relative to that of a peer group selected by an independent third-party data provider for purposes of performance comparisons. Specifically, CMG Core Bond Fund's performance was in the second quintile (where the best performance would be in the first quintile) for the one-, three- and ten-year periods, and in the first quintile for the three-year period; CMG Short Term Bond Fund's performance was in the first quintile for the one-, three-, five- and ten-year periods; Columbia Ultra Short Term Bond Fund's performance was in the third quintile for the one- and five-year periods, and in the second quintile for the three-year period; and CMG High Yield Fund's performance was in the first quintile for the one- and ten-year periods, in the fourth quintile for the three-year period, and in the fifth quintile for the five-year period.
The Trustees also considered Columbia's performance and reputation generally, the funds' performance as a fund family generally, and Columbia's historical responsiveness to Trustee concerns about performance and Columbia's willingness to take steps intended to improve performance. After reviewing those and related factors, the Trustees concluded, within the context of their overall conclusions regarding each of the Agreements, that the performance of each fund and Columbia was sufficient, in light of other considerations, to warrant the continuation of the Agreement(s) pertaining to that fund.
The costs of the services provided and profits realized by Columbia and its affiliates from their relationships with the funds. The Trustees considered the fees charged to the funds for advisory services as well as the total expense levels of the funds. That information included comparisons (provided by management and by an independent third-party data provider) of each fund's advisory fees and total expense levels to those of the fund's peer groups and information about the advisory fees charged by Columbia to comparable institutional accounts. In considering the fees charged to those accounts, the Trustees took into account, among other things, management's representations about the differences between managing mutual funds as compared to other types of accounts, including differences in the services provided, differences in the risk profile of such busine ss for Columbia, and the additional resources required to manage mutual funds effectively. In evaluating each fund's advisory fees, the Trustees also took into account the demands, complexity and quality of the investment management of the fund. The Trustees considered existing advisory fee breakpoints, and Columbia's use of advisory fee waivers and expense caps, which benefited a
65
number of the funds. The Trustees also noted management's stated justification for the fees charged to the funds, which included information about the investment performance of the funds and the services provided to the funds.
The Trustees considered each fund's total expenses and actual management fees relative to those of a peer group selected by an independent third-party data provider for the purposes of expense comparisons. Specifically, CMG Core Bond Fund's total expenses and actual management fees were in the first quintile (where the lowest fees and expenses would be in the first quintile); CMG Short Term Bond Fund's total expenses and actual management fees were in the first quintile; CMG Ultra Short Term Bond's total expenses and actual management fees were in the first quintile; and CMG High Yield Fund's total expenses and actual management fees were in the first quintile.
The Trustees also considered the compensation directly or indirectly received by Columbia and its affiliates from their relationships with the funds. The Trustees reviewed information provided by management as to the profitability to Columbia and its affiliates of their relationships with each fund, and information about the allocation of expenses used to calculate profitability. When reviewing profitability, the Trustees also considered court cases in which adviser profitability was an issue in whole or in part, the performance of the relevant funds, the expense level of each fund, and whether Columbia had implemented breakpoints and/or expense caps with respect to the fund.
After reviewing those and related factors, the Trustees concluded, within the context of their overall conclusions regarding each of the Agreements, that the advisory fees charged to each fund, and the related profitability to Columbia and its affiliates of their relationships with the fund, supported the continuation of the Agreement(s) pertaining to that fund.
Economies of Scale. The Trustees considered the existence of any economies of scale in the provision by Columbia of services to each fund, to groups of related funds, and to Columbia's investment advisory clients as a whole and whether those economies were shared with the funds through breakpoints in the investment advisory fees or other means, such as fee waivers/expense reductions and additional investments by Columbia in investment, trading and compliance resources. The Trustees noted that many of the funds benefited from breakpoints, fee waivers/expense caps, or both. In considering those issues, the Trustees also took note of the costs of the services provided (both on an absolute and a relative basis) and the profitability to Columbia and its affiliates of their relationships with the funds, as discussed above.
After reviewing those and related factors, the Trustees concluded, within the context of their overall conclusions regarding each of the Agreements, that the extent to which economies of scale were shared with the funds supported the continuation of the Agreements.
Other Factors. The Trustees also considered other factors, which included but were not limited to the following:
n the extent to which each fund had operated in accordance with its investment objective and investment restrictions, the nature and scope of the compliance programs of the funds and Columbia and the compliance-related resources that Columbia and its affiliates were providing to the funds;
n the nature, quality, cost and extent of administrative and shareholder services overseen and performed by Columbia and its affiliates, both under the Agreements and under separate agreements for the provision of transfer agency and administrative services;
n so-called "fall-out benefits" to Columbia and its affiliates, such as the engagement of its affiliates to provide distribution, brokerage and transfer agency services to the funds, and the benefits of research made available to Columbia by reason of brokerage commissions generated by the funds' securities transactions, as well as possible
66
conflicts of interest associated with those fall-out and other benefits, and the reporting, disclosure and other processes in place to disclose and monitor those possible conflicts of interest; and
n the report provided by the funds' independent fee consultant, which included information about and analysis of the funds' fees, expenses and performance.
Based on their evaluation of all factors that they deemed to be material, including those factors described above, and assisted by the advice of independent counsel and the independent fee consultant, the Trustees, including the Independent Trustees, approved the continuance of each of the Agreements through October 31, 2009.
67
SUMMARY OF MANAGEMENT FEE EVALUATION BY
INDEPENDENT FEE CONSULTANT
[EXCERPTS FROM:] REPORT OF INDEPENDENT FEE CONSULTANT TO THE FUNDS SUPERVISED BY THE COLUMBIA ATLANTIC BOARD
Prepared Pursuant to the February 9, 2005 Assurance of Discontinuance among the Office of Attorney General of New York State, Columbia Management Advisors, LLC, and Columbia Management Distributors, Inc. November 3, 2008
I. Overview
On February 9, 2005, Columbia Management Advisors, LLC ("CMA") and Columbia Management Distributors, Inc.1 ("CMD") agreed to the New York Attorney General's Assurance of Discontinuance ("AOD"). Among other things, the AOD stipulates that CMA may manage or advise a Columbia Fund ("Columbia Fund" and, together with some or all of such funds, the "Columbia Funds") only if the Independent Members of the Columbia Fund's Board of Trustees appoint a Senior Officer or retain an Independent Fee Consultant ("IFC") who is to manage the process by which proposed management fees are negotiated. The AOD further stipulates that the Senior Officer or IFC is to prepare a written annual evaluation of the fee negotiation process.
With effect from January 1, 2007, the Independent Members of the Board of Trustees for certain Columbia Funds known collectively as the "Atlantic Funds" (together with the other members of that Board, the "Trustees") retained me as IFC for the Atlantic Funds.2 In this capacity, I have prepared the fourth annual written evaluation of the fee negotiation process. As was the case with last year's report (the "2007 Report") my immediate predecessor as IFC, John Rea, provided invaluable assistance in the preparation of this year's report.
A. Role of the Independent Fee Consultant
The AOD charges the IFC with "managing the process by which proposed management fees...to be charged the Columbia Fund are negotiated so that they are negotiated in a manner which is at arms' length and reasonable and consistent with this Assurance of Discontinuance." The AOD also provides that CMA "may manage or advise a Columbia Fund only if the reasonableness of the proposed management fees is determined by the Board of Trustees...using...an annual independent written evaluation prepared by or under the direction of...the Independent Fee Consultant." Therefore, the AOD makes clear that the IFC does not supplant the Trustees in negotiating management fees with CMA, nor does the IFC substitute his or her judgment for that of the Trustees with respect to the reasonableness of proposed fees or any other matter that is committed to the business judgment of the Trustees.
B. Elements Involved in Managing the Fee Negotiation Process
In preparing the report required by the AOD, the IFC must consider at least the following six factors set forth in the AOD:
1. The nature and quality of CMA's services, including the Fund's performance;
2. Management fees (including any components thereof) charged by other mutual fund companies for like services;
3. Possible economies of scale as the Fund grows larger;
1 CMA and CMD are subsidiaries of Columbia Management Group, LLC ("CMG"), and are the successors to the entities named in the AOD.
2 I have no material relationship with Bank of America, CMG or any of its affiliates, aside from serving as IFC, and I am aware of no material relationship with any of their affiliates. I retained John Rea, an independent economic consultant, to assist me with this report.
Unless otherwise stated or required by the context, this report covers only the Atlantic Funds, which are also referred as the "Funds."
68
4. Management fees (including any components thereof) charged to institutional and other clients of CMA for like services;
5. Costs to CMA and its affiliates of supplying services pursuant to the management fee agreements, excluding any intra-corporate profit; and
6. Profit margins of CMA and its affiliates from supplying such services.
C. Organization of the Annual Evaluation
This report, like last year's, focuses on the six factors and contains a section for each factor except that CMA's costs and profits from managing the Funds have been combined into a single section. In addition to a discussion of these factors, the report offers recommendations to improve the fee review process in future years. A review of the status of recommendations made in the 2007 Report is being provided separately with the materials for the October meeting.
II. Summary of Findings
A. General
1. Based upon my examination of the information supplied by CMG in the light of the six factors set forth in the AOD, I conclude that the Trustees have the relevant information necessary to evaluate the reasonableness of the proposed management fees for each Atlantic Fund.
2. In my view, the process by which the proposed management fees of the Funds have been negotiated in 2008 thus far has been, to the extent practicable, at arms' length and reasonable and consistent with the AOD.
B. Nature and Quality of Services, Including Performance
3. The performance of the Funds has been relatively strong in recent years. Based upon 1-, 3-, 5-, and 10-year returns through April 30, 2008, at least half of all the Funds were in the first and second performance quintiles in each of the four performance periods and, at most, only 11% were in the fifth quintile in any one performance period. Both equity and fixed-income funds posted strong performance relative to comparable funds.
4. Performance rankings were similar in 2007 and 2008, although last year's were slightly stronger. Despite the stability in the distribution of rankings in the two years, at least half the Funds changed quintile rankings between the two years in at least one of the 1-, 3-, and 5-year performance periods.
5. The performance of the actively managed equity Funds against their benchmarks was very strong. At least 57% and as many as 73% posted net returns exceeding their benchmarks over the 1-, 3-, and 5-year periods. In contrast, gross and net returns of fixed-income Funds typically fell short of their benchmarks.
6. Atlantic equity Funds' overall performance adjusted for risk also was strong. Based upon 3-year returns, nearly 80% of the equity Funds had a combination of risk-adjusted and unadjusted returns that placed them in the top half of their performance universes. Only about one-fifth of the fixed income Funds posted high returns and low risk relative to comparable funds. About two-thirds of the fixed-income Funds took on more risk than the typical fund in their performance universes.
7. The industry-standard procedure used by Lipper that includes all share classes in the performance universe tends to bias a Fund's ranking upward within that universe. The bias occurs because either no-12b-1 fee or low-12b-1 fee share classes of the Atlantic Funds are compared with funds in performance universes that include all share classes of multi-class funds with 12b-1 fees of up to 100 basis points. Correcting this bias by limiting the performance universe to classes of comparable funds with low or no 12b-1 fees (a "filtered universe") lowers the relative performance for the Funds, but their performance, on the whole, remains strong. The filtering process, however, did identify two Funds for further review that had not been designated review funds using unfiltered universes.
69
8. A small number of Funds have consistently underperformed over the past four years. The exact number depends on the criteria used to evaluate longer-term performance. For example, the one-year returns of one Fund have been in the fourth or fifth performance quintiles in each of the past four years; there are six Funds whose three-year returns have been in the fourth or fifth quintile over the past four years.
9. The services performed by CMG professionals beyond portfolio management, such as compliance, legal, information technology, risk management, finance and fund administration, are critical to the success of the Funds and appear to be of high quality.
C. Management Fees Charged by Other Mutual Fund Companies
10. The Funds' management fees and total expenses are generally low relative to those of their peers. Only 21% of the Funds ranked in the two most expensive quintiles for actual management fees, and only 23% in those quintiles for total expenses.
11. The highest concentration of low-expense Funds is found among the equity and tax-exempt fixed income Funds. The 12 former Excelsior Funds have relatively high fees and expenses, with half of those Funds ranking in either the fourth or fifth quintiles. The higher actual management fee rankings of certain Excelsior Funds are due in part to fee schedules that are higher than standard Columbia Fund fee schedules at current asset levels. After discussion with the Trustees, CMA is proposing to lower the management fees on three of these Funds.
12. The distribution of expense rankings is similar in 2007 and 2008, while management fee rankings improved markedly in 2008. Part of the improvement reflects expense limitations introduced last year for the state intermediate municipal bond Funds.
13. The management fees of the Atlantic Funds are generally in line with those of Columbia Funds supervised by the Nations Board of Trustees (the "Nations Funds"). In investment categories in which the Atlantic Funds have higher average fees, the difference principally arises out of differences in asset size.
D. Trustees' Fee and Performance Evaluation Process
14. The Trustees' evaluation process identified 17 Funds in 2008 for further review based upon their relative performance or expenses or both. When compared in filtered universes, two more Funds met the criteria for further review. CMG provided further information about those Funds to assist the Trustees in their evaluation.
E. Potential Economies of Scale
15. CMG presented to the Trustees its analysis of the sources and sharing of potential economies of scale. CMG views economies of scale as arising at the complex level and would regard estimates of scale economies for individual funds as unreliable. In its analysis, CMG did not identify specific sources of economies of scale or provide any estimates of any economies of scale that might arise from future asset growth. CMG's analysis included measures taken by the Trustees and CMG that seek to share any potential economies of scale through breakpoints in management fee schedules, expense reimbursements, fee waivers, enhanced shareholder services, fund mergers, and operational consolidation.
16. An examination of the contractual fee schedules for five Atlantic Funds shows that they are generally in line with those of their competitors, in terms of number and extent of fee breakpoints. A similar examination last year of five different Funds led to the same conclusion.
F. Management Fees Charged to Institutional Clients
17. CMG has provided Trustees with comparisons of mutual fund management fees and institutional fees based upon standardized fee schedules and upon actual fees. The results show that, consistent with industry practice, institutional fees are generally lower than the Funds' management fees. However, because the services provided and risks borne by the manager are more extensive for mutual funds compared to institutional accounts, the differences are of limited value in assisting the Trustees in their review of the reasonableness of the Funds' management fees.
70
G. Revenues, Expenses, and Profits
18. The activity-based cost allocation methodology ("ABC") employed by CMG to allocate costs, both direct and indirect, for purposes of calculating Fund profitability is thoughtful and detailed. This year, CMG proposed a change to the method by which indirect expenses are allocated. Under this "hybrid" method, indirect costs relating to fund management are allocated among the Funds 50% by assets and 50% per Fund. Allocating indirect expenses equally to each Fund has an intuitive logic, as each Fund regardless of size has certain expenses, such as preparing and printing prospectuses and financial statements.
19. The materials provided on CMG's revenues and expenses with respect to the Funds and the methodology underlying their construction form a sufficient basis for Trustees to evaluate the expenses and profitability of the Funds.
20. In 2007, CMG's complex-wide pre-tax margins on the Atlantic Funds were slightly below industry medians, based on limited data available for publicly held mutual fund managers. However, as is to be expected in a complex now comprising 75 Funds (including former Excelsior Funds), some Atlantic Funds have relatively high pre-tax profit margins, when calculated solely with respect to management revenues and expenses, while other Atlantic Funds operate at a loss. There is a positive relationship between fund size and profitability, with smaller funds generally operating at a loss.
21. CMG pays a fixed percentage of its management fee revenues to an affiliate, U.S. Trust, Bank of America Private Wealth Management, to compensate it for services it performs with respect to Atlantic Fund assets held for the benefit of its customers. Based on our analysis of the services provided by this affiliate, we have concluded that all payments other than those for sub-transfer agent or sub-accounting services should be treated as a distribution expense.
III. Recommendations
1) Criteria for review. The Trustees may wish to consider modifying the criteria for classifying a fund as a "Review Fund" to include criteria that focus exclusively on performance without regard to expense or fee levels. For example, a fund whose one-year or three-year performance was median or below for four consecutive years could be treated as a Review Fund. When we applied such criteria to the Funds, several additional Funds would have been added to the list of Review Funds.
2) Profitability data. CMG should present to the Trustees each year the profitability of each Fund, each investment style and each complex (of which Atlantic is one) calculated as follows:
a. Management-only profitability should be calculated without reference to any Private Bank expense.
b. Profitability excluding distribution (which essentially covers the management and transfer agency functions) should be adjusted by removing from the expense calculation any portion of the Private Bank payment not attributable to the performance by the Private Bank of sub-transfer agency or sub-accounting functions.
c. Total profitability, including distribution: No adjustment for Private Bank expenses should be made, because all such expenses represent legitimate fund expenses to be taken into account in calculating CMG's profit margin including distribution.
d. Distribution only: This should include all Private Bank expenses other than those attributable to sub-transfer agency services.
Therefore, the following data need not be provided:
1. Adjusting total profitability data for Private Bank expenses
2. Adjusting profitability excluding distribution by backing out all Private Bank expenses.
3) Potential economies of scale. CMG and the IFC should continue to work on methods for more precisely quantifying to the extent possible the sources and magnitude of any economies of scale as CMG's mutual fund assets under management increase, to the extent that the data allows for meaningful year-over-year comparisons. The framework suggested in Section IV.D.4 may prove to be a useful model for such an analysis.
71
4) Competitive breakpoint analysis. As part of the annual fee evaluation process, the breakpoints of a select group of Atlantic Funds (which would differ each year) should continue to be compared to those of industry rivals to ensure that the Funds' breakpoint schedules remain within industry norms. As breakpoint schedules change relatively little each year, performing such a comparison for each Atlantic Fund each year would not be an efficient use of Trustee and CMG resources.
5) Cost allocation methodology. CMG's point that the current ABC system of allocating indirect expenses creates anomalous results in several cases, including sub-advised Funds, is well-taken. We would like to work with CMG over the forthcoming year on alternatives to the current system of allocating indirect expenses that (1) resolve the anomalies, (2) limit the amount of incremental effort on CMG's part and (3) remain faithful to the general principle that expenses should be allocated by time and effort to the extent reasonably possible.
6) Management fee disparities. CMG and the Atlantic Trustees, as part of any future study of management fees, should analyze the differences in management fee schedules, principally arising out of the reorganization of the former Excelsior Funds as Atlantic Funds. As part of that analysis, CMG should provide an explanation for any significant fee differences among comparable funds across fund families managed by CMA, such as differences in the management styles of different Funds included the same Lipper category. Finally, whenever CMG proposes a management fee change or an expense cap for any mutual fund managed by CMA that is comparable to any Atlantic Fund, CMG should provide the Trustees with sufficient information about the proposal to allow the Trustees to assess the applicability of the proposed change to the relevant Atlantic Fund or Funds.
7) Tax-exempt Fund expense data. The expense rankings of certain tax-exempt Funds were adversely affected by including certain investment-related interest expenses that Lipper excluded in calculating the expense ratios of competitors. We recommend that CMG follow the Lipper practice and exclude such interest expenses from data submitted to Lipper to avoid unfairly disadvantaging the tax-exempt Funds.
8) Reduction of volume of paper documents submitted. The effort to rationalize and simplify the data presented to the Trustees and the process by which that data was prepared and organized was regarded as a success by all parties. We should continue to look for opportunities to reduce and simplify the presentation of 15(c) data, especially in the area of Fund profitability. The Fund "Dashboard" volume presents a large volume of Fund data on a single page. If it is continued, the Trustees may wish to consider receiving the underlying Lipper data on CD, rather than the current paper volumes.
* * *
Respectfully submitted,
Steven E. Asher
72
This page is intentionally left blank.
COLUMBIA FUNDS INSTITUTIONAL TRUST
ONE FINANCIAL CENTER, BOSTON, MASSACHUSETTS, 02111-2621
- INVESTMENT ADVISOR -
COLUMBIA MANAGEMENT ADVISORS, LLC
100 FEDERAL STREET
BOSTON, MASSACHUSETTS 02110-2624
- LEGAL COUNSEL -
ROPES & GRAY LLP
ONE INTERNATIONAL PLACE
BOSTON, MASSACHUSETTS 02110-2624
- TRANSFER AGENT -
COLUMBIA MANAGEMENT SERVICES, INC.
P.O. BOX 8081
BOSTON, MASSACHUSETTS 02266-8081
SHC-44/5757-0109 (03/09) 09-73945
A description of the policies and procedures that each fund uses to determine how to vote proxies and a copy of each fund's voting records are available (i) at www.columbiamanagement.com; (ii) on the Securities and Exchange Commission's website at www.sec.gov, and (iii) without charge, upon request, by calling 1-800-368-0346. Information regarding how each fund voted proxies relating to portfolio securities during the 12-month period ended June 30 is available from the SEC's website. Information regarding how each fund voted proxies relating to portfolio securities is also available from the website, www.columbiamanagement.com.
Each fund files a complete schedule of portfolio holdings with the SEC for the first and third quarters of each fiscal year on Form N-Q. Each fund's Form N-Q is available on the SEC's website at www.sec.gov and may be reviewed and copied at the SEC's Public Reference Room in Washington, D.C. Information on the operation of the Public Reference Room may be obtained by calling 1-800-SEC-0330.
Please read and consider the investment objectives, risks, charges and expenses for any fund carefully before investing. For a prospectus which contains this and other important information about the fund, contact your Columbia Management representative or financial advisor or go to www.columbiamanagement.com.
©2009 Columbia Management Distributors, Inc.
One Financial Center, Boston, MA 02111-2621
![]()
CMG ENHANCED S&P 500® INDEX FUND
CMG LARGE CAP GROWTH FUND
CMG LARGE CAP VALUE FUND
CMG MID CAP GROWTH FUND
CMG MID CAP VALUE FUND
CMG SMALL CAP GROWTH FUND
CMG SMALL CAP VALUE FUND
CMG SMALL/MID CAP FUND
CMG INTERNATIONAL STOCK FUND
PORTFOLIOS OF COLUMBIA FUNDS INSTITUTIONAL TRUST
Semiannual Report
January 31, 2009
| NOT FDIC INSURED NOT BANK ISSUED | May Lose Value No Bank Guarantee | ||||||
Columbia Management Group, LLC ("Columbia Management") is the investment management division of Bank of America Corporation. Columbia Management entities furnish investment management services and products for institutional and individual investors. The funds are distributed by Columbia Management Distributors, Inc., member of FINRA, SIPC, part of Columbia Management and an affiliate of Bank of America Corporation.
Columbia Management Advisors, LLC ("CMA") is an SEC-registered investment advisor and an indirect, wholly-owned subsidiary of Bank of America Corporation and is part of Columbia Management.
Table of Contents
| Fund Profile | |||||||
| CMG Enhanced S&P 500® Index Fund | 1 | ||||||
| CMG Large Cap Growth Fund | 5 | ||||||
| CMG Large Cap Value Fund | 9 | ||||||
| CMG Mid Cap Growth Fund | 13 | ||||||
| CMG Mid Cap Value Fund | 17 | ||||||
| CMG Small Cap Growth Fund | 21 | ||||||
| CMG Small Cap Value Fund | 25 | ||||||
| CMG Small/Mid Cap Fund | 29 | ||||||
| CMG International Stock Fund | 33 | ||||||
| Financial Statements | |||||||
| Financial Highlights | 37 | ||||||
| Schedules of Investments | 46 | ||||||
| Statements of Assets and Liabilities | 88 | ||||||
| Statements of Operations | 90 | ||||||
| Statements of Changes in Net Assets | 92 | ||||||
| Notes to Financial Statements | 100 | ||||||
| Board Consideration and Approval of Advisory Agreements | 113 | ||||||
| Summary of Management Fee Evaluation by Independent Fee Consultant | 117 | ||||||
The views expressed in this report reflect the current views of the respective parties. These views are not guarantees of future performance and involve certain risks, uncertainties and assumptions that are difficult to predict so actual outcomes and results may differ significantly from the views expressed. These views are subject to change at any time based upon economic, market or other conditions and the respective parties disclaim any responsibility to update such views. These views may not be relied on as investment advice and, because investment decisions for a CMG Fund are based on numerous factors, may not be relied on as an indication of trading intent on behalf of any particular CMG Fund. References to specific securities should not be construed as a recommendation or investment advice.
Performance data quoted represents past performance and current performance may be lower or higher. Past performance is no guarantee of future results. The investment return and principal value will fluctuate so that shares, when redeemed, may be worth more or less than the original cost. Please visit www.columbiamanagement.com for daily and most recent month-end performance updates.
CMG ENHANCED S&P 500® INDEX FUND
A Portfolio of Columbia Funds Institutional Trust
FUND PROFILE
Summary
• For the six-month period that ended January 31, 2009, CMG Enhanced S&P 500® Index Fund returned negative 32.65%. In an environment of sharply declining stock prices and weak economic conditions, the fund held up somewhat better than the S&P 500 Index,1 which returned negative 33.95%, and the average fund in its peer group, the Lipper Large-Cap Core Funds Classification,2 which returned negative 33.92% over the same period. Stock selection in the financials, energy and consumer discretionary sectors aided performance relative to the index, as did industry allocation decisions within those sectors. Stock selection within the materials, utilities and industrial sectors hampered returns relative to the index.
• Within the financials sector, the fund had less exposure than the index to diversified financials and regional banks, and no exposure to some of the worst performing names within those groups, which helped the fund sidestep some steep declines. In the energy sector, performance was negative in absolute terms. However, a decision to overweight integrated oil and gas companies, such as Chevron (2.3% of net assets), and underweight oil and gas equipment and service companies, helped the fund stem some losses as the former held up better than the latter in an environment of falling oil prices. In the consumer discretionary sector, which was a poor performer overall, a decision to overweight Apollo Group (0.7% of net assets), an educational services company, was rewarded. A slumping economy increased demand for supplemental educational services and the stock returned more than 30% for the period.
Within the materials sector, a brutal reversal in commodity prices hurt Freeport-McMoRan Copper & Gold (no longer held), and the fund's overweight relative to the index detracted from returns. An overweight in Ryder System (0.8% of net assets), a trucking company, in the industrials sector amplified the impact of the stock's significant decline in the portfolio. The utilities sector held up better than most other sectors as investors were attracted to its relative stability and dividend payments. However, the fund had less exposure than the index to the sector, which detracted from performance.
• With consumer spending in decline and job losses on the rise, the outlook for the US economy is cloudy, at best, through the middle of 2009. However, history shows that during previous economic cycles the stock market has risen well before an economic recovery takes
1 The Standard & Poor's (S&P) 500 Index tracks the performance of 500 widely held, large-capitalization US stocks. Indices are not investments, do not incur fees or expenses and are not professionally managed. It is not possible to invest directly in an index. Securities in the fund may not match those in an index.
"Standard & Poor's" and "S&P" are trademarks of The McGraw-Hill Companies, Inc., and have been licensed for use by the Advisor. The Fund is not sponsored, endorsed, sold or promoted by Standard & Poor's and Standard & Poor's makes no representation regarding the advisability of investing in the Fund.
2 Lipper Inc., a widely respected data provider in the industry, calculates an average total return (assuming reinvestment of distributions) for mutual funds with investment objectives similar to those of the fund. Lipper makes no adjustment for the effect of sales loads.
1
hold. Investors have tended to move into riskier assets while the economy was still in recession because they anticipated a recovery and a more favorable environment for riskier asset classes. And when the stock market turns around, it has historically produced quick and substantial gains. Consider, for example, that even though the economy was still in the throes of major recessions in 1982 and 1991, the Standard & Poor's 500 Index gained more than 21% and 30%, respectively, for those same years. There's no guarantee that history will repeat itself. However, if you have a long-term plan for investing—and the patience to stay with it during volatile times—history is on your side.
Portfolio Management
Brian M. Condon has managed the fund since 2009 and has been associated with the advisor or its predecessors or affiliate organizations since 2009.
The fund's top ten holdings (as a percentage of net assets) as of January 31, 2009 were:
| (%) | |||||||
| Exxon Mobil | 5.2 | ||||||
| Procter & Gamble | 2.5 | ||||||
| Microsoft | 2.3 | ||||||
| Johnson & Johnson | 2.3 | ||||||
| Chevron | 2.3 | ||||||
| AT&T | 2.0 | ||||||
| International Business Machines | 1.9 | ||||||
| Boston Scientific | 1.8 | ||||||
| Pfizer | 1.6 | ||||||
| Amgen | 1.5 | ||||||
Holdings are calculated as a percentage of net assets and are subject to change. Because the fund is actively managed, there is no guarantee the fund will continue to maintain the holdings breakdown listed. The fund's holdings and their weights within the portfolio may change as market conditions change.
Equity investments are affected by stock market fluctuations that occur in response to economic and business developments.
Investing in the fund also includes market risk and tracking error risk. Unlike the S&P 500 Index, the fund incurs administrative expenses and transaction costs in trading stocks. The composition of the S&P 500 Index and the stocks held by the fund will diverge.
2
Performance data quoted represents past performance and current performance may be lower or higher. Past performance is no guarantee of future results. The investment return and principal value will fluctuate so that shares, when redeemed, may be worth more or less than the original cost. Please visit www.columbiamanagement.com for daily and most recent month-end performance updates.
Average annual total return as of January 31, 2009 (%)
| Inception | 6-month (cumulative) | 1-year | 5-year | Life | |||||||||||||||||||
| CMG Enhanced S&P 500® Index Fund | 05/05/03 | -32.65 | -38.13 | -3.59 | 0.38 | ||||||||||||||||||
| S&P 500 Index | -33.95 | -38.63 | -4.24 | -0.07 | |||||||||||||||||||
Average annual total return as of December 31, 2008 (%)
| Inception | 6-month (cumulative) | 1-year | 5-year | Life | |||||||||||||||||||
| CMG Enhanced S&P 500® Index Fund | 05/05/03 | -27.72 | -36.77 | -1.75 | 1.81 | ||||||||||||||||||
| S&P 500 Index | -28.48 | -37.00 | -2.19 | 1.49 | |||||||||||||||||||
Index performance is from May 5, 2003.
Performance results reflect any fee waivers or reimbursements of fund expenses by the investment advisor and/or any of its affiliates. Absent these fee waivers or expense reimbursement arrangements, performance results would have been lower. All results shown assume reinvestment of distributions and do not reflect the deduction of taxes that a shareholder may pay on fund distributions or on the redemption of fund shares.
The fund's annual operating expense ratios, with and without contractual waivers, as stated in the fund's prospectus that is current as of the date of this report, are 0.25% and 0.30%, respectively, of average annual net assets. Differences in expense ratios disclosed elsewhere in this report may result from including fee waivers and expense reimbursements as well as different time periods used in calculating the ratios. The contractual waiver expires 11/30/09.
Performance of a $3,000,000 investment, May 5, 2003 to January 31, 2009
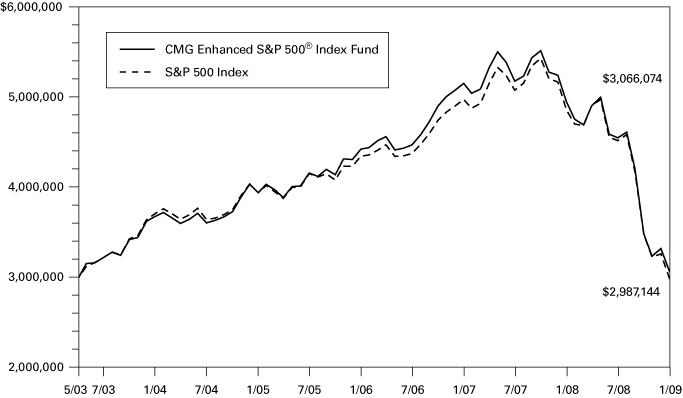
The chart above compares the results of a hypothetical minimum initial $3,000,000 investment in the fund to the index during the stated time period and does not reflect the deduction of taxes that a shareholder may pay on fund distributions or on the redemption of fund shares.
The Standard & Poor's (S&P) 500 Index tracks the performance of 500 widely held, large-capitalization US stocks. Indices are not investments, do not incur fees or expenses and are not professionally managed. It is not possible to invest directly in an index. Securities in the fund may not match those in an index.
3
UNDERSTANDING YOUR EXPENSES – CMG Enhanced S&P 500® Index Fund
As a fund shareholder, you incur ongoing costs, which generally include investment advisory fees and other fund expenses. The information on this page is intended to help you understand the ongoing costs of investing in the fund and to compare these costs with the ongoing costs of investing in other mutual funds.
Analyzing your fund's expenses
To illustrate these ongoing costs, we have provided an example and calculated the expenses paid by investors during the period. The information in the following table is based on an initial investment of $1,000, which is invested at the beginning of the period and held for the entire period. Expense information is calculated two ways and each method provides you with different information. The amount listed in the "Actual" column is calculated using the fund's actual operating expenses and total return for the period. The amount listed in the "Hypothetical" column assumes that the return each year is 5% before expenses and is calculated based on the fund's actual operating expenses. You should not use the hypothetical account values and expenses to estimate either your actual account balance at the end of the period or the expenses you paid during this period.
Estimating your actual expenses
To estimate the expenses that you paid over the period, first you will need your account balance at the end of the period:
1. Divide your ending account balance by $1,000. For example, if an account balance was $8,600 at the end of the period, the result would be 8.6.
2. In the section of the table below titled "Expenses paid during the period," locate the amount labeled "Actual." Multiply this number by the result from step 1. Your answer is an estimate of the expenses you paid on your account during the period.
August 1, 2008 – January 31, 2009
| Account value at the beginning of the period ($) | Account value at the end of the period ($) | Expenses paid during the period ($) | Fund's annualized expense ratio (%) | ||||||||||||||||||||||||
| Actual | Hypothetical | Actual | Hypothetical | Actual | Hypothetical | Actual | |||||||||||||||||||||
| 1,000.00 | 1,000.00 | 673.49 | 1,023.95 | 1.05 | 1.28 | 0.25 | |||||||||||||||||||||
Expenses paid during the period are equal to the fund's annualized expense ratio of 0.25%, multiplied by the average account value over the period, then multiplied by the number of days in the fund's most recent fiscal half-year and divided by 365.
Had the investment advisor and/or any of its affiliates not waived fees or reimbursed a portion of expenses, account value at the end of the period would have been reduced.
It is important to note that the expense amounts shown in the table are meant to highlight only ongoing costs of investing in the fund. Therefore, the hypothetical examples provided may not help you determine the relative total costs of owning shares of different funds.
Compare with other funds
Since all mutual funds are required to include the same hypothetical calculations about expenses in shareholder reports, you can use this information to compare the ongoing costs of investing in the fund with other funds. To do so, compare the 5% hypothetical example with the 5% hypothetical examples that appear in the shareholder reports of other funds. As you compare hypothetical examples of other funds, it is important to note that hypothetical examples are meant to highlight the ongoing costs of investing in a fund.
4
Performance data quoted represents past performance and current performance may be lower or higher. Past performance is no guarantee of future results. The investment return and principal value will fluctuate so that shares, when redeemed, may be worth more or less than the original cost. Please visit www.columbiamanagement.com for daily and most recent month-end performance updates.
CMG LARGE CAP GROWTH FUND
A Portfolio of Columbia Funds Institutional Trust
FUND PROFILE
Summary
• For the six-month period that ended January 31, 2009, CMG Large Cap Growth Fund returned negative 35.79%. By comparison, the Russell 1000 Growth Index1 and the Lipper Large-Cap Growth Funds Classification2 average returned negative 34.31% and negative 35.61%, respectively. Stocks fell sharply across all sectors, hurt by a slowing global economy, deteriorating housing market and tight credit. Although there was no place to find shelter in a declining market, we kept our focus on large-cap companies with above-average earnings growth, attractive stock valuations, strong competitive positions and solid balance sheets, favoring companies less sensitive to the economic slowdown.
• Investments in the energy, financials and industrials sectors hurt performance. Slowing global demand resulted in a dramatic decline in oil and gas prices, which, in turn, pressured energy stock prices. Among the biggest detractors were Schlumberger, an oil field service company, and Transocean, an offshore driller (1.6% and 0.5% of net assets, respectively). Stock selection and a modest overweight in financials, where stocks fell significantly, also hurt returns. Among our worst performers were asset managers, whose assets under management contracted as the stock market declined. In industrials, companies such as SPX (0.5% of net assets), a diversified manufacturer with overseas sales, suffered as corporate spending slowed globally and the US dollar strengthened. Technology stocks, about 30% of assets, did further damage to returns, as slower corporate and consumer spending caused a sharp drop in stock prices. Detractors included QUALCOMM (1.9% of net assets), which makes semiconductor chips for cell phones and smart phones.
• The fund's consumer discretionary holdings held up better than the sector average, in part because of a focus on less economically sensitive companies. Among the strongest performers were for-profit education enterprises, such as Apollo Group (0.6% of net assets), which benefited from rising enrollment trends. Utilities stock selection also helped stem losses. Gainers elsewhere included Goodrich (0.5% of net assets), an aviation parts supplier that rebounded late in the year.
• We expect recent monetary and fiscal stimulus measures to help stimulate the economy at some point. When that happens will depend, we believe, on when the banks step up lending. Going forward, we plan to add selectively to more economically sensitive names, which should be among the first beneficiaries in a market recovery. We believe current valuations offer attractive opportunities to add to stock positions that we favor.
1 The Russell 1000 Growth Index measures the performance of those Russell 1000 Index companies with higher price-to-book ratios and higher forecasted growth values. Indices are not investments, do not incur fees or expenses and are not professionally managed. It is not possible to invest directly in an index. Securities in the fund may not match those in an index.
2 Lipper Inc., a widely respected data provider in the industry, calculates an average total return (assuming reinvestment of distributions) for mutual funds with investment objectives similar to those of the fund. Lipper makes no adjustment for the effect of sales loads.
5
Portfolio Management
John T. Wilson, lead manager for CMG Large Cap Growth Fund, has managed or co-managed the fund since 2005 and has been associated with the advisor or its predecessors or affiliate organizations since 2005.
Roger R. Sullivan has co-managed the fund since 2005 and has been associated with the advisor or its predecessors or affiliate organizations since 2005.
The fund's top ten holdings (as a percentage of net assets) as of January 31, 2009 were:
| (%) | |||||||
| 3.4 | |||||||
| Microsoft | 2.8 | ||||||
| Coca-Cola | 2.4 | ||||||
| Hewlett-Packard | 2.4 | ||||||
| Apple | 2.4 | ||||||
| International Business Machines | 2.3 | ||||||
| Abbott Laboratories | 2.1 | ||||||
| Philip Morris International | 2.1 | ||||||
| Cisco Systems | 2.0 | ||||||
| Wal-Mart Stores | 2.0 | ||||||
Holdings are calculated as a percentage of net assets and are subject to change. Because the fund is actively managed, there is no guarantee the fund will continue to maintain the holdings breakdown listed. The fund's holdings and their weights within the portfolio may change as market conditions change.
Equity investments are affected by stock market fluctuations that occur in response to economic and business developments.
Investing in growth stocks incurs the possibility of losses because their prices are sensitive to changes in current or expected earnings.
6
Performance data quoted represents past performance and current performance may be lower or higher. Past performance is no guarantee of future results. The investment return and principal value will fluctuate so that shares, when redeemed, may be worth more or less than the original cost. Please visit www.columbiamanagement.com for daily and most recent month-end performance updates.
Average annual total return as of January 31, 2009 (%)
| Inception | 6-month (cumulative) | 1-year | 5-year | Life | |||||||||||||||||||
| CMG Large Cap Growth Fund | 09/10/03 | -35.79 | -36.98 | -3.93 | -2.23 | ||||||||||||||||||
| Russell 1000 Growth Index | -34.31 | -36.44 | -4.76 | -2.84 | |||||||||||||||||||
Average annual total return as of December 31, 2008 (%)
| Inception | 6-month (cumulative) | 1-year | 5-year | Life | |||||||||||||||||||
| CMG Large Cap Growth Fund | 09/10/03 | -34.04 | -39.93 | -2.60 | -1.32 | ||||||||||||||||||
| Russell 1000 Growth Index | -32.31 | -38.44 | -3.42 | -1.98 | |||||||||||||||||||
Index performance is from September 10, 2003.
Performance results reflect any fee waivers or reimbursements of fund expenses by the investment advisor and/or any of its affiliates. Absent these fee waivers or expense reimbursement arrangements, performance results would have been lower. All results shown assume reinvestment of distributions and do not reflect the deduction of taxes that a shareholder may pay on fund distributions or on the redemption of fund shares.
The fund's annual operating expense ratios, with and without contractual waivers, as stated in the fund's prospectus that is current as of the date of this report, are 0.50% and 0.65%, respectively, of average annual net assets. Differences in expense ratios disclosed elsewhere in this report may result from including fee waivers and expense reimbursements as well as different time periods used in calculating the ratios. The contractual waiver expires 11/30/09.
Performance of a $3,000,000 investment, September 10, 2003 to January 31, 2009
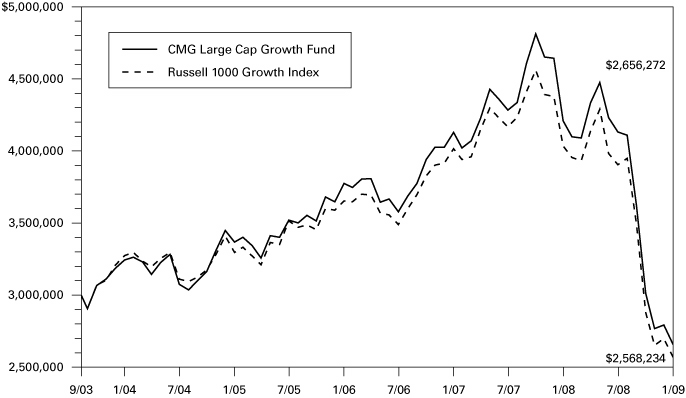
The chart above compares the results of a hypothetical minimum initial $3,000,000 investment in the fund to the index during the stated time period and does not reflect the deduction of taxes that a shareholder may pay on fund distributions or on the redemption of fund shares.
The Russell 1000 Growth Index measures the performance of those Russell 1000 Index companies with higher price-to-book ratios and higher forecasted growth values. Indices are not investments, do not incur fees or expenses and are not professionally managed. It is not possible to invest directly in an index. Securities in the fund may not match those in an index.
7
UNDERSTANDING YOUR EXPENSES – CMG Large Cap Growth Fund
As a fund shareholder, you incur ongoing costs, which generally include investment advisory fees and other fund expenses. The information on this page is intended to help you understand the ongoing costs of investing in the fund and to compare these costs with the ongoing costs of investing in other mutual funds.
Analyzing your fund's expenses
To illustrate these ongoing costs, we have provided an example and calculated the expenses paid by investors during the period. The information in the following table is based on an initial investment of $1,000, which is invested at the beginning of the period and held for the entire period. Expense information is calculated two ways and each method provides you with different information. The amount listed in the "Actual" column is calculated using the fund's actual operating expenses and total return for the period. The amount listed in the "Hypothetical" column assumes that the return each year is 5% before expenses and is calculated based on the fund's actual operating expenses. You should not use the hypothetical account values and expenses to estimate either your actual account balance at the end of the period or the expenses you paid during this period.
Estimating your actual expenses
To estimate the expenses that you paid over the period, first you will need your account balance at the end of the period:
1. Divide your ending account balance by $1,000. For example, if an account balance was $8,600 at the end of the period, the result would be 8.6.
2. In the section of the table below titled "Expenses paid during the period," locate the amount labeled "Actual." Multiply this number by the result from step 1. Your answer is an estimate of the expenses you paid on your account during the period.
August 1, 2008 – January 31, 2009
| Account value at the beginning of the period ($) | Account value at the end of the period ($) | Expenses paid during the period ($) | Fund's annualized expense ratio (%) | ||||||||||||||||||||||||
| Actual | Hypothetical | Actual | Hypothetical | Actual | Hypothetical | Actual | |||||||||||||||||||||
| 1,000.00 | 1,000.00 | 642.08 | 1,022.68 | 2.07 | 2.55 | 0.50 | |||||||||||||||||||||
Expenses paid during the period are equal to the fund's annualized expense ratio of 0.50%, multiplied by the average account value over the period, then multiplied by the number of days in the fund's most recent fiscal half-year and divided by 365.
Had the investment advisor and/or any of its affiliates not waived fees or reimbursed a portion of expenses, account value at the end of the period would have been reduced.
It is important to note that the expense amounts shown in the table are meant to highlight only ongoing costs of investing in the fund. Therefore, the hypothetical examples provided may not help you determine the relative total costs of owning shares of different funds.
Compare with other funds
Since all mutual funds are required to include the same hypothetical calculations about expenses in shareholder reports, you can use this information to compare the ongoing costs of investing in the fund with other funds. To do so, compare the 5% hypothetical example with the 5% hypothetical examples that appear in the shareholder reports of other funds. As you compare hypothetical examples of other funds, it is important to note that hypothetical examples are meant to highlight the ongoing costs of investing in a fund.
8
Performance data quoted represents past performance and current performance may be lower or higher. Past performance is no guarantee of future results. The investment return and principal value will fluctuate so that shares, when redeemed, may be worth more or less than the original cost. Please visit www.columbiamanagement.com for daily and most recent month-end performance updates.
CMG LARGE CAP VALUE FUND
A Portfolio of Columbia Funds Institutional Trust
FUND PROFILE
Summary
• For the six-month period that ended January 31, 2009, CMG Large Cap Value Fund returned negative 33.04%. The fund's benchmark, the Russell 1000 Value Index,1 returned negative 35.10%. The average return of its peer group, the Lipper Multi-Cap Value Funds Classification,2 was negative 35.21%. In a challenging environment for companies across all market sectors, stock selection helped the fund stem some losses relative to its benchmark.
• The fund's stock selection within financials helped it hold up better than the index during the period. The fund had more exposure to JPMorgan Chase (3.8% of net assets), which did not lose as much ground as many other stocks in the sector, and had less exposure than the index to Citigroup, which, prior to being sold by the fund, was among the worst performers during the period. Within the consumer discretionary sector, we had more exposure to stocks that declined less than the average for the sector. For example, retailer Kohl's (1.4% of net assets) declined less than the average retailer as the company has done a better job of managing through the downturn and has generated good operating results. McDonald's (1.9% of net assets) lost some ground, but its loss was modest compared to the broader market, its industry and its sector. We did well to underweight the industrials sector as the global economy weakened , and we stemmed losses by focusing on companies with more favorable near term outlooks, including United Technologies (1.4% of net assets). Positive performance from California utility holding PG&E (1.5% of net assets) aided the fund's return.
• Consumer staples holdings were hard hit during the period. Detractors in the food and personal product sectors included Smithfield, Tyson Foods and Avon Products (1.1% of net assets). We sold the first two during the period. Within the energy sector, the fund was hurt by Newfield Exploration, El Paso (0.3% and 0.4% of net assets, respectively) and Valero Energy, all of which suffered on investor concerns about access to capital and declining energy prices. In addition, our conviction in Valero's prospects waned. As a result, we exited the position.
• Heading into 2009, value investors face the challenge of discerning between stocks where negative sentiment has overshadowed business fundamentals and those where the danger of further declines remains. Against this backdrop, we have positioned the fund to ride out the continuing storm of economic uncertainty by maintaining more exposure than the index to both consumer staples and health care, two sectors that historically have held up better than others during periods of weak consumer spending. Overall, we plan to continue to focus on companies that we believe have good valuations, the potential for margin expansion and are good stewards of capital.
1 The Russell 1000 Value Index measures the performance of those companies in the Russell 1000 Index with lower price-to-book ration and lower forecasted growth values. Indices are not investments, do not incur fees or expenses and are not professionally managed. It is not possible to invest directly in an index. Securities in the fund may not match those in an index.
2 Lipper Inc., a widely respected data provider in the industry, calculates an average total return (assuming reinvestment of distributions) for mutual funds with investment objectives similar to those of the fund. Lipper makes no adjustment for the effect of sales loads.
9
Portfolio Management
Lori J. Ensinger has co-managed the fund since 2005. She has been associated with the advisor or its predecessors or affiliate organizations since 2001.
Diane L. Sobin has co-managed the fund since 2005 and has been associated with the advisor or its predecessors or affiliate organizations since 2001.
David I. Hoffman has co-managed the fund since 2005 and has been associated with the advisor or its predecessors or affiliate organizations since 2001.
Noah J. Petrucci has co-managed the fund since 2005 and has been associated with the advisor or its predecessors or affiliate organizations since 2002.
The fund's top ten holdings (as a percentage of net assets) as of January 31, 2009 were:
| (%) | |||||||
| Exxon Mobil | 5.2 | ||||||
| AT&T | 3.8 | ||||||
| JPMorgan Chase | 3.8 | ||||||
| Amgen | 3.1 | ||||||
| Johnson & Johnson | 2.4 | ||||||
| Procter & Gamble | 2.1 | ||||||
| U.S. Bancorp | 2.0 | ||||||
| Chevron | 2.0 | ||||||
| Wells Fargo | 1.9 | ||||||
| ConocoPhillips | 1.9 | ||||||
Holdings are calculated as a percentage of net assets and are subject to change. Because the fund is actively managed, there is no guarantee the fund will continue to maintain the holdings breakdown listed. The fund's holdings and their weights within the portfolio may change as market conditions change.
Equity investments are affected by stock market fluctuations that occur in response to economic and business developments.
Value stocks are stocks of companies that may have experienced adverse business or industry developments or may be subject to special risks that have caused the stocks to be out of favor and, in the advisor's opinion, undervalued. The price of the company's stock may not approach the value the advisor has placed on it.
10
Performance data quoted represents past performance and current performance may be lower or higher. Past performance is no guarantee of future results. The investment return and principal value will fluctuate so that shares, when redeemed, may be worth more or less than the original cost. Please visit www.columbiamanagement.com for daily and most recent month-end performance updates.
Average annual total return as of January 31, 2009 (%)
| Inception | 6-month (cumulative) | 1-year | 5-year | Life | |||||||||||||||||||
| CMG Large Cap Value Fund | 09/10/03 | -33.04 | -39.57 | -3.65 | -1.59 | ||||||||||||||||||
| Russell 1000 Value Index | -35.10 | -41.78 | -3.52 | -0.95 | |||||||||||||||||||
Average annual total return as of December 31, 2008 (%)
| Inception | 6-month (cumulative) | 1-year | 5-year | Life | |||||||||||||||||||
| CMG Large Cap Value Fund | 09/10/03 | -27.00 | -37.23 | -1.53 | 0.18 | ||||||||||||||||||
| Russell 1000 Value Index | -26.93 | -36.85 | -0.79 | 1.34 | |||||||||||||||||||
Index performance is from September 10, 2003.
Performance results reflect any fee waivers or reimbursements of fund expenses by the investment advisor and/or any of its affiliates. Absent these fee waivers or expense reimbursement arrangements, performance results would have been lower. All results shown assume reinvestment of distributions and do not reflect the deduction of taxes that a shareholder may pay on fund distributions or on the redemption of fund shares.
The fund's annual operating expense ratios, with and without contractual waivers, as stated in the fund's prospectus that is current as of the date of this report, are 0.50% and 0.70%, respectively, of average annual net assets. Differences in expense ratios disclosed elsewhere in this report may result from including fee waivers and expense reimbursements as well as different time periods used in calculating the ratios. The contractual waiver expires 11/30/09.
Performance of a $3,000,000 investment, September 10, 2003 to January 31, 2009
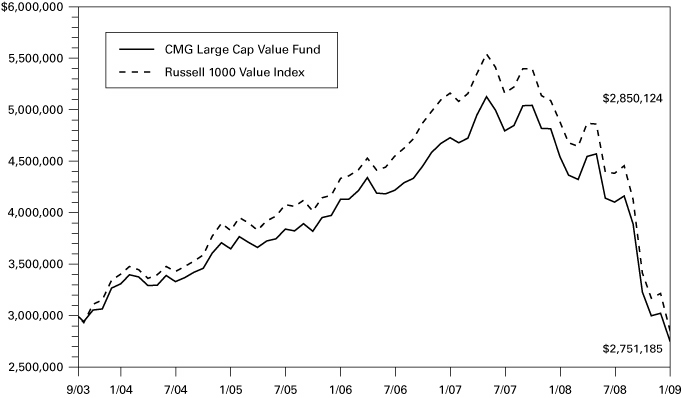
The chart above compares the results of a hypothetical minimum initial $3,000,000 investment in the fund to the index during the stated time period and does not reflect the deduction of taxes that a shareholder may pay on fund distributions or on the redemption of fund shares.
The Russell 1000 Value Index measures the performance of those companies in the Russell 1000 Index with lower price-to-book ratios and lower forecasted growth values. Indices are not investments, do not incur fees or expenses and are not professionally managed. It is not possible to invest directly in an index. Securities in the fund may not match those in an index.
11
UNDERSTANDING YOUR EXPENSES – CMG Large Cap Value Fund
As a fund shareholder, you incur ongoing costs, which generally include investment advisory fees and other fund expenses. The information on this page is intended to help you understand the ongoing costs of investing in the fund and to compare these costs with the ongoing costs of investing in other mutual funds.
Analyzing your fund's expenses
To illustrate these ongoing costs, we have provided an example and calculated the expenses paid by investors during the period. The information in the following table is based on an initial investment of $1,000, which is invested at the beginning of the period and held for the entire period. Expense information is calculated two ways and each method provides you with different information. The amount listed in the "Actual" column is calculated using the fund's actual operating expenses and total return for the period. The amount listed in the "Hypothetical" column assumes that the return each year is 5% before expenses and is calculated based on the fund's actual operating expenses. You should not use the hypothetical account values and expenses to estimate either your actual account balance at the end of the period or the expenses you paid during this period.
Estimating your actual expenses
To estimate the expenses that you paid over the period, first you will need your account balance at the end of the period:
1. Divide your ending account balance by $1,000. For example, if an account balance was $8,600 at the end of the period, the result would be 8.6.
2. In the section of the table below titled "Expenses paid during the period," locate the amount labeled "Actual." Multiply this number by the result from step 1. Your answer is an estimate of the expenses you paid on your account during the period.
August 1, 2008 – January 31, 2009
| Account value at the beginning of the period ($) | Account value at the end of the period ($) | Expenses paid during the period ($) | Fund's annualized expense ratio (%) | ||||||||||||||||||||||||
| Actual | Hypothetical | Actual | Hypothetical | Actual | Hypothetical | Actual | |||||||||||||||||||||
| 1,000.00 | 1,000.00 | 669.61 | 1,022.68 | 2.10 | 2.55 | 0.50 | |||||||||||||||||||||
Expenses paid during the period are equal to the fund's annualized expense ratio of 0.50%, multiplied by the average account value over the period, then multiplied by the number of days in the fund's most recent fiscal half-year and divided by 365.
Had the investment advisor and/or any of its affiliates not waived fees or reimbursed a portion of expenses, account value at the end of the period would have been reduced.
It is important to note that the expense amounts shown in the table are meant to highlight only ongoing costs of investing in the fund. Therefore, the hypothetical examples provided may not help you determine the relative total costs of owning shares of different funds.
Compare with other funds
Since all mutual funds are required to include the same hypothetical calculations about expenses in shareholder reports, you can use this information to compare the ongoing costs of investing in the fund with other funds. To do so, compare the 5% hypothetical example with the 5% hypothetical examples that appear in the shareholder reports of other funds. As you compare hypothetical examples of other funds, it is important to note that hypothetical examples are meant to highlight the ongoing costs of investing in a fund.
12
Performance data quoted represents past performance, and current performance may be lower or higher. Past performance is no guarantee of future results. The investment return and principal value will fluctuate so that shares, when redeemed, may be worth more or less than the original cost. Please visit www.columbiamanagement.com for daily and most recent month-end performance updates.
CMG MID CAP GROWTH FUND
A Portfolio of Columbia Funds Institutional Trust
FUND PROFILE
Summary
• For the six-month period that ended January 31, 2009, CMG Mid Cap Growth Fund returned negative 41.03%. The fund's performance was slightly lower than the Russell Midcap Growth Index1 and Lipper Mid-Cap Growth Funds Classification average,2 which returned negative 40.69% and negative 40.07%, respectively. Stocks across all sectors were hit hard, as the global economy slowed, some major financial firms crumbled and credit markets tightened. In this environment, there was no place to hide as investors fled the stock market. However, we maintained our long-term focus on mid-sized companies with improving profit margins and returns on invested capital, as well as strong management teams and balance sheets.
• Industrials, health care and materials stock selection hurt returns versus the index. Industrials, which were about 18% of assets, fell significantly as the global economic slowdown reduced capital spending. Detractors included McDermott International, an energy infrastructure company. It suffered from cost overruns and slower demand resulting from the sharp drop in oil and gas prices. We cut our losses and sold the position. In health care, contract research organizations (CROs), such as Charles River Laboratories International (0.7% of net assets), which conducts clinical research for pharmaceutical and biotechnology companies, declined as investors worried that economic weakness would dim business prospects. Within materials, agricultural stocks such as Potash Corp. of Saskatchewan (1.3% of net assets), a Canadian fertilizer company, fell as slowing global demand depressed commodity prices.
• Although consumer discretionary and energy stocks generated losses for the period, the fund's returns from these sectors were not as low as those in the index. In consumer discretionary, we focused on companies that were not as sensitive to the current economic slowdown, including low-cost retailers and for-profit education companies. Apollo Group (1.1% of net assets), a for-profit education firm, rallied as unemployed workers returned to the classroom. Within energy, companies with strong production growth, such as natural gas producer Southwestern Energy (1.2% of net assets), held up better than the sector average of the index. Stock selection in the utilities and technology sectors also was modestly helpful in stemming losses.
• We expect recent monetary and fiscal stimulus measures to aid the economy once the credit markets thaw and banks start lending more. Since stock prices have historically moved ahead of a recovery, we have begun selectively adding to more economically sensitive names. We remain hopeful that mid-cap stocks will offer greater stability than smaller-cap stocks if volatility continues and more return potential than large caps when the market rebounds.
1 The Russell Midcap Growth Index measures the performance of those Russell Midcap Index companies with higher price-to-book ratios and higher forecasted growth values. Indices are not investments, do not incur fees or expenses and are not professionally managed. It is not possible to invest directly in an index. Securities in the fund may not match those in an index.
2 Lipper Inc., a widely respected data provider in the industry, calculates an average total return (assuming reinvestment of distributions) for mutual funds with investment objectives similar to those of the fund. Lipper makes no adjustment for the effect of sales loads.
13
Portfolio Management
Wayne M. Collette has co-managed the fund since 2006 and has been associated with the advisor or its predecessors or affiliate organizations since 2001.
George J. Myers has co-managed the fund since 2006 and has been associated with the advisor or its predecessors or affiliate organizations since 2004.
Lawrence W. Lin has co-managed the fund since 2007 and has been associated with the advisor or its predecessors or affiliate organizations since 2006.
Brian D. Neigut has co-managed the fund since 2007 and has been associated with the advisor or its predecessors or affiliate organizations since 2007.
The fund's top ten holdings (as a percentage of net assets) as of January 31, 2009 were:
| (%) | |||||||
| Stericycle | 2.0 | ||||||
| American Tower | 1.8 | ||||||
| ITT Educational Services | 1.7 | ||||||
| Express Scripts | 1.6 | ||||||
| Precision Castparts | 1.3 | ||||||
| Landstar System | 1.3 | ||||||
| Potash Corp. of Saskatchewan | 1.3 | ||||||
| Questar | 1.2 | ||||||
| Analog Devices | 1.2 | ||||||
| Yum! Brands | 1.2 | ||||||
Holdings are calculated as a percentage of net assets and are subject to change. Because the fund is actively managed, there is no guarantee the fund will continue to maintain the holdings breakdown listed. The fund's holdings and their weights within the portfolio may change as market conditions change.
Equity investments are affected by stock market fluctuations that occur in response to economic and business developments.
Investing in growth stocks incurs the possibility of losses because their prices are sensitive to changes in current or expected earnings.
Investing in mid-cap stocks may present special risks, including possible illiquidity and greater price volatility than stocks of larger, more established companies.
14
Performance data quoted represents past performance and current performance may be lower or higher. Past performance is no guarantee of future results. The investment return and principal value will fluctuate so that shares, when redeemed, may be worth more or less than the original cost. Please visit www.columbiamanagement.com for daily and most recent month-end performance updates.
Average annual total return as of January 31, 2009 (%)
| Inception | 6-month (cumulative) | 1-year | 5-year | Life | |||||||||||||||||||
| CMG Mid Cap Growth Fund | 05/05/03 | -41.03 | -39.95 | -2.27 | 1.82 | ||||||||||||||||||
| Russell Midcap Growth Index | -40.69 | -42.24 | -3.86 | 1.74 | |||||||||||||||||||
Average annual total return as of December 31, 2008 (%)
| Inception | 6-month (cumulative) | 1-year | 5-year | Life | |||||||||||||||||||
| CMG Mid Cap Growth Fund | 05/05/03 | -42.15 | -43.90 | -1.10 | 2.52 | ||||||||||||||||||
| Russell Midcap Growth Index | -40.26 | -44.32 | -2.33 | 2.60 | |||||||||||||||||||
Index performance is from May 5, 2003.
Performance results reflect any fee waivers or reimbursements of fund expenses by the investment advisor and/or any of its affiliates. Absent these fee waivers or expense reimbursement arrangements, performance results would have been lower. All results shown assume reinvestment of distributions and do not reflect the deduction of taxes that a shareholder may pay on fund distributions or on the redemption of fund shares.
The fund's annual operating expense ratios, with and without contractual waivers, as stated in the fund's prospectus that is current as of the date of this report, are 0.70% and 1.00%, respectively, of average annual net assets. Differences in expense ratios disclosed elsewhere in this report may result from including fee waivers and expense reimbursements as well as different time periods used in calculating the ratios. The contractual waiver expires 11/30/09.
Performance of a $3,000,000 investment, May 5, 2003 to January 31, 2009
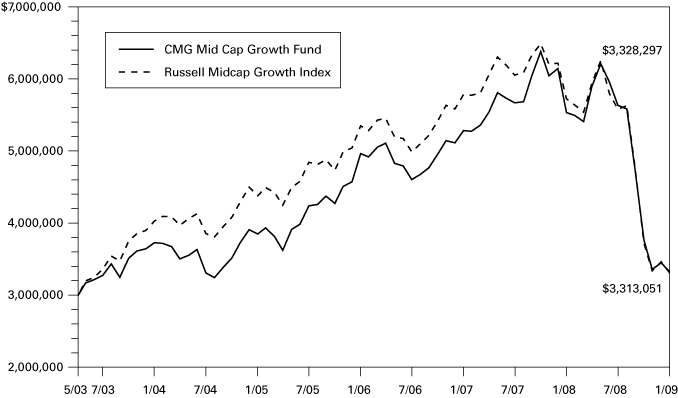
The chart above compares the results of a hypothetical minimum initial $3,000,000 investment in the fund to the index during the stated time period and does not reflect the deduction of taxes that a shareholder may pay on fund distributions or on the redemption of fund shares.
The Russell Midcap Growth Index measures the performance of those Russell Midcap Index companies with higher price-to-book ratios and higher forecasted growth values. Indices are not investments, do not incur fees or expenses and are not professionally managed. It is not possible to invest directly in an index. Securities in the fund may not match those in an index.
15
UNDERSTANDING YOUR EXPENSES – CMG Mid Cap Growth Fund
As a fund shareholder, you incur ongoing costs, which generally include investment advisory fees and other fund expenses. The information on this page is intended to help you understand the ongoing costs of investing in the fund and to compare these costs with the ongoing costs of investing in other mutual funds.
Analyzing your fund's expenses
To illustrate these ongoing costs, we have provided an example and calculated the expenses paid by investors during the period. The information in the following table is based on an initial investment of $1,000, which is invested at the beginning of the period and held for the entire period. Expense information is calculated two ways and each method provides you with different information. The amount listed in the "Actual" column is calculated using the fund's actual operating expenses and total return for the period. The amount listed in the "Hypothetical" column assumes that the return each year is 5% before expenses and is calculated based on the fund's actual operating expenses. You should not use the hypothetical account values and expenses to estimate either your actual account balance at the end of the period or the expenses you paid during this period.
Estimating your actual expenses
To estimate the expenses that you paid over the period, first you will need your account balance at the end of the period:
1. Divide your ending account balance by $1,000. For example, if an account balance was $8,600 at the end of the period, the result would be 8.6.
2. In the section of the table below titled "Expenses paid during the period," locate the amount labeled "Actual." Multiply this number by the result from step 1. Your answer is an estimate of the expenses you paid on your account during the period.
August 1, 2008 – January 31, 2009
| Account value at the beginning of the period ($) | Account value at the end of the period ($) | Expenses paid during the period ($) | Fund's annualized expense ratio (%) | ||||||||||||||||||||||||
| Actual | Hypothetical | Actual | Hypothetical | Actual | Hypothetical | Actual | |||||||||||||||||||||
| 1,000.00 | 1,000.00 | 589.71 | 1,021.68 | 2.80 | 3.57 | 0.70 | |||||||||||||||||||||
Expenses paid during the period are equal to the fund's annualized expense ratio of 0.70%, multiplied by the average account value over the period, then multiplied by the number of days in the fund's most recent fiscal half-year and divided by 365.
Had the investment advisor and/or any of its affiliates not waived fees or reimbursed a portion of expenses, account value at the end of the period would have been reduced.
It is important to note that the expense amounts shown in the table are meant to highlight only ongoing costs of investing in the fund. Therefore, the hypothetical examples provided may not help you determine the relative total costs of owning shares of different funds.
Compare with other funds
Since all mutual funds are required to include the same hypothetical calculations about expenses in shareholder reports, you can use this information to compare the ongoing costs of investing in the fund with other funds. To do so, compare the 5% hypothetical example with the 5% hypothetical examples that appear in the shareholder reports of other funds. As you compare hypothetical examples of other funds, it is important to note that hypothetical examples are meant to highlight the ongoing costs of investing in a fund.
16
Performance data quoted represents past performance and current performance may be lower or higher. Past performance is no guarantee of future results. The investment return and principal value will fluctuate so that shares, when redeemed, may be worth more or less than the original cost. Please visit www.columbiamanagement.com for daily and most recent month-end performance updates.
CMG MID CAP VALUE FUND
A Portfolio of Columbia Funds Institutional Trust
FUND PROFILE
Summary
• For the six-month period that ended January 31, 2009, CMG Mid Cap Value Fund returned negative 38.70%. The fund's benchmark, the Russell Midcap Value Index,1 returned negative 38.92% for the period. The average return of the fund's peer group, the Lipper Mid-Cap Core Funds Classification, was negative 37.07%.2 The fund's cash position helped it outperform the benchmark, as did stock selection in the financial and materials sectors. However, sharply declining stock prices in all sectors resulted in disappointing performance for the fund, the index and its peer group.
• Although financials lost significant ground for the period, the fund's holdings in the sector held up better than those of the index. In particular, the fund benefited from management's decision to increase exposure to commercial banks while decreasing exposure to diversified financials, which underperformed the rest of the sector. Both TCF Financial and Greenhill & Co. (1.8% and 0.7% of net assets, respectively) generated positive returns. In the utilities sector, PG&E and Wisconsin Energy (2.6% and 1.8% of net assets, respectively) also logged modest gains during the period. The fund had more exposure than the index to PG&E, which amplified the impact of its gain on relative returns.
• Stock selection in the conglomerates and aerospace industries hampered the fund's relative returns. Aircraft leasing company AerCap Holdings and diversified manufacturer Textron (0.3% and 0.5% of net assets, respectively) were particular disappointments. In the health care sector, we exited a position in CIGNA on concerns that capital positions in the firm's subsidiaries and exposures in its insurance portfolio have clouded its near term outlook. In the materials sector, Weyerhaeuser (1.5% of net assets) underperformed as it cut its dividend and lowered its earnings outlook. However, we retained our overweight position in the stock because we see upside potential if the firm can deliver on several key initiatives. In technology services, the portfolio's underweight relative to the index hampered returns, as the industry outperformed the broader market. Stock selection within software also hampered the fund's re lative return within the technology sector.
• Heading into 2009, value investors face the challenge of discerning between stocks where negative sentiment has overshadowed business fundamentals and those where the danger of further declines remains. Against this backdrop, we have taken steps that we believe will position the fund to ride out the continuing storm of economic uncertainty. We reduced exposure to financials and utilities, where the fund already had less exposure than the index, and we initiated new positions in health care and energy, as our research indicates these areas may present opportunities to add good companies with promising outlooks. We sold
1 The Russell Midcap Value Index measures the performance of those Russell Midcap Index companies with lower price-to-book ratios and lower forecasted growth values. Indices are not investments, do not incur fees or expenses and are not professionally managed. It is not possible to invest directly in an index. Securities in the fund may not match those in an index.
2 Lipper Inc., a widely respected data provider in the industry, calculates an average total return (assuming reinvestment of distributions) for mutual funds with investment objectives similar to those of the fund. Lipper makes no adjustment for the effect of sales loads.
17
positions where we no longer had strong conviction, which raised the fund's cash level to approximately 5%. Also in energy, we increased overall exposure by adding to existing positions across a variety of industries. We plan to continue to focus on companies that we believe have good valuations, the potential for margin expansion and are good stewards of capital.
Portfolio Management
Diane L. Sobin has co-managed the fund since 2004 and has been associated with the advisor or its predecessors or affiliate organizations since 2001.
David I. Hoffman has co-managed the fund since 2004 and has been associated with the advisor or its predecessors or affiliate organizations since 2001.
Lori J. Ensinger has co-managed the fund since 2004 and has been associated with the advisor or its predecessors or affiliate organizations since 2001.
Noah J. Petrucci has co-managed the fund since 2004 and has been associated with the advisor or its predecessors or affiliate organizations since 2002.
The fund's top ten holdings (as a percentage of net assets) as of January 31, 2009 were:
| (%) | |||||||
| PG&E | 2.6 | ||||||
| Marsh & McLennan Companies | 2.0 | ||||||
| ACE Ltd. | 1.9 | ||||||
| Wisconsin Energy | 1.8 | ||||||
| Reinsurance Group of America | 1.8 | ||||||
| Sempra Energy | 1.8 | ||||||
| Ameriprise Financial | 1.8 | ||||||
| TCF Financial | 1.8 | ||||||
| Cullen/Frost Bankers | 1.7 | ||||||
| Williams Companies | 1.7 | ||||||
Holdings are calculated as a percentage of net assets and are subject to change. Because the fund is actively managed, there is no guarantee the fund will continue to maintain the holdings breakdown listed. The fund's holdings and their weights within the portfolio may change as market conditions change.
Equity investments are affected by stock market fluctuations that occur in response to economic and business developments.
Investing in mid-cap stocks may present special risks, including possible illiquidity and greater price volatility than stocks of larger, more established companies.
Value stocks are stocks of companies that may have experienced adverse business or industry developments or may be subject to special risks that have caused the stocks to be out of favor and, in the advisor's opinion, undervalued. The price of the company's stock may not approach the value the advisor has placed on it.
18
Performance data quoted represents past performance and current performance may be lower or higher. Past performance is no guarantee of future results. The investment return and principal value will fluctuate so that shares, when redeemed, may be worth more or less than the original cost. Please visit www.columbiamanagement.com for daily and most recent month-end performance updates.
Average annual total return as of January 31, 2009 (%)
| Inception | 6-month (cumulative) | 1-year | 5-year | Life | |||||||||||||||||||
| CMG Mid Cap Value Fund | 05/05/03 | -38.70 | -42.80 | -2.98 | 1.15 | ||||||||||||||||||
| Russell Midcap Value Index | -38.92 | -42.17 | -2.35 | 3.24 | |||||||||||||||||||
Average annual total return as of December 31, 2008 (%)
| Inception | 6-month (cumulative) | 1-year | 5-year | Life | |||||||||||||||||||
| CMG Mid Cap Value Fund | 05/05/03 | -34.34 | -42.13 | -0.85 | 2.82 | ||||||||||||||||||
| Russell Midcap Value Index | -32.67 | -38.44 | 0.33 | 5.30 | |||||||||||||||||||
Index performance is from May 5, 2003.
Performance results reflect any fee waivers or reimbursements of fund expenses by the investment advisor and/or any of its affiliates. Absent these fee waivers or expense reimbursement arrangements, performance results would have been lower. All results shown assume reinvestment of distributions and do not reflect the deduction of taxes that a shareholder may pay on fund distributions or on the redemption of fund shares.
The fund's annual operating expense ratios, with and without contractual waivers, as stated in the fund's prospectus that is current as of the date of this report, are 0.70% and 1.14%, respectively, of average annual net assets. Differences in expense ratios disclosed elsewhere in this report may result from including fee waivers and expense reimbursements as well as different time periods used in calculating the ratios. The contractual waiver expires 11/30/09.
Performance of a $3,000,000 investment, May 5, 2003 to January 31, 2009
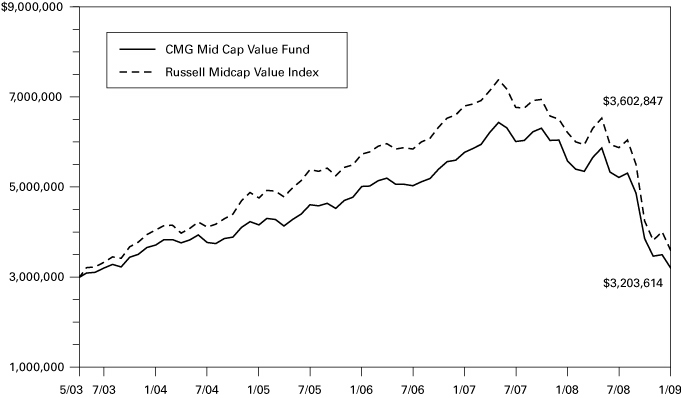
The chart above compares the results of a hypothetical minimum initial $3,000,000 investment in the fund to the index during the stated time period and does not reflect the deduction of taxes that a shareholder may pay on fund distributions or on the redemption of fund shares.
The Russell Midcap Value Index measures the performance of those Russell Midcap Index companies with lower price-to-book ratios and lower forecasted growth values. Indices are not investments, do not incur fees or expenses and are not professionally managed. It is not possible to invest directly in an index. Securities in the fund may not match those in an index.
19
UNDERSTANDING YOUR EXPENSES – CMG Mid Cap Value Fund
As a fund shareholder, you incur ongoing costs, which generally include investment advisory fees and other fund expenses. The information on this page is intended to help you understand the ongoing costs of investing in the fund and to compare these costs with the ongoing costs of investing in other mutual funds.
Analyzing your fund's expenses
To illustrate these ongoing costs, we have provided an example and calculated the expenses paid by investors during the period. The information in the following table is based on an initial investment of $1,000, which is invested at the beginning of the period and held for the entire period. Expense information is calculated two ways and each method provides you with different information. The amount listed in the "Actual" column is calculated using the fund's actual operating expenses and total return for the period. The amount listed in the "Hypothetical" column assumes that the return each year is 5% before expenses and is calculated based on the fund's actual operating expenses. You should not use the hypothetical account values and expenses to estimate either your actual account balance at the end of the period or the expenses you paid during this period.
Estimating your actual expenses
To estimate the expenses that you paid over the period, first you will need your account balance at the end of the period:
1. Divide your ending account balance by $1,000. For example, if an account balance was $8,600 at the end of the period, the result would be 8.6.
2. In the section of the table below titled "Expenses paid during the period," locate the amount labeled "Actual." Multiply this number by the result from step 1. Your answer is an estimate of the expenses you paid on your account during the period.
August 1, 2008 – January 31, 2009
| Account value at the beginning of the period ($) | Account value at the end of the period ($) | Expenses paid during the period ($) | Fund's annualized expense ratio (%) | ||||||||||||||||||||||||
| Actual | Hypothetical | Actual | Hypothetical | Actual | Hypothetical | Actual | |||||||||||||||||||||
| 1,000.00 | 1,000.00 | 613.90 | 1,021.68 | 2.85 | 3.57 | 0.70 | |||||||||||||||||||||
Expenses paid during the period are equal to the fund's annualized expense ratio of 0.70%, multiplied by the average account value over the period, then multiplied by the number of days in the fund's most recent fiscal half-year and divided by 365.
Had the investment advisor and/or any of its affiliates not waived fees or reimbursed a portion of expenses, account value at the end of the period would have been reduced.
It is important to note that the expense amounts shown in the table are meant to highlight only ongoing costs of investing in the fund. Therefore, the hypothetical examples provided may not help you determine the relative total costs of owning shares of different funds.
Compare with other funds
Since all mutual funds are required to include the same hypothetical calculations about expenses in shareholder reports, you can use this information to compare the ongoing costs of investing in the fund with other funds. To do so, compare the 5% hypothetical example with the 5% hypothetical examples that appear in the shareholder reports of other funds. As you compare hypothetical examples of other funds, it is important to note that hypothetical examples are meant to highlight the ongoing costs of investing in a fund.
20
Performance data quoted represents past performance and current performance may be lower or higher. Past performance is no guarantee of future results. The investment return and principal value will fluctuate so that shares, when redeemed, may be worth more or less than the original cost. Please visit www.columbiamanagement.com for daily and most recent month-end performance updates.
CMG SMALL CAP GROWTH FUND
A Portfolio of Columbia Funds Institutional Trust
FUND PROFILE
Summary
• For the six-month period that ended January 31, 2009, CMG Small Cap Growth Fund returned negative 40.94%. For the same period, the Russell 2000 Growth Index and Russell 2000 Index1 returned negative 39.06% and negative 37.38%, respectively. The average return of the Lipper Small-Cap Growth Funds Classification2 was negative 38.60%. The stock market posted sharp losses across all sectors, as the economy slowed, unemployment rose and credit remained tight. The fund remained focused on companies with improving returns on invested capital, improving profit margins and strong balance sheets, but could not escape the downturn.
• Stock selection in the materials, financials and health care sectors hampered relative returns. Within materials, agricultural companies, including Intrepid Potash (1.6% of net assets), declined sharply as the global economy weakened and demand slowed. Financials were hit hard by the stock market decline and problems related to the subprime mortgage crisis. Shares of Waddell & Reed Financial (0.8% of net assets), an asset management company in the Midwest, lost ground as assets under management fell in a declining market, hurting revenues. In health care, which represents over 27% of the Russell 2000 Growth Index, contract research organizations such as ICON (2.4% of net assets) in Ireland hindered performance, amid concerns that pharmaceutical and biotechnology firms would cut back on spending for clinical research. Technology stocks, 19.5% of net assets, also fell sharply, as corporations cut back on spen ding. Among the weakest performers was Vocus (0.8% of net assets), which provides online public relations software.
• The fund stemmed some losses in the energy and consumer discretionary sectors. The standout in energy was CNX Gas, a natural gas company with assets in the Appalachian and Illinois basins. It rose 78%, fueled by strong production growth, rising earnings and the company's solid balance sheet. We locked in profits and sold the position. In the consumer discretionary sector, for-profit education companies aided returns, as unemployed workers returned to the classroom. Elsewhere, HEICO (0.6% of net assets), which supplies aerospace and automotive products, benefited from record sales and operating income.
• Looking ahead, we believe that recent monetary and fiscal stimulus efforts have the potential to help stimulate economic growth. We further believe full recovery, however, is unlikely until the credit markets loosen up and banks begin lending more. With the expectation of
1 The Russell 2000 Growth Index measures the performance of those Russell 2000 Index companies with higher price-to-book ratios and higher forecasted growth values. The Russell 2000 Index measures the performance of the 2,000 smallest of the 3,000 largest US companies based on market capitalization. Indices are not investments, do not incur fees or expenses and are not professionally managed. It is not possible to invest directly in an index. Securities in the fund may not match those in an index.
2 Lipper Inc., a widely respected data provider in the industry, calculates an average total return (assuming reinvestment of distributions) for mutual funds with investment objectives similar to those of the fund. Lipper makes no adjustment for the effect of sales loads.
21
improvement, we plan to add gradually to more economically sensitive companies, focusing on small-cap companies that have the ability to self-finance.
Portfolio Management
Wayne M. Collette has co-managed the fund since February 2006 and has been associated with the advisor or its predecessors or affiliate organizations since 2001.
George J. Myers has co-managed the fund since February 2006 and has been associated with the advisor or its predecessors or affiliate organizations since 2004.
Lawrence W. Lin has co-managed the fund since October 2007 and has been associated with the advisor or its predecessors or affiliate organizations since 2006.
Brian D. Neigut has co-managed the fund since October 2007 and has been associated with the advisor or its predecessors or affiliate organizations since 2007.
The fund's top ten holdings (as a percentage of net assets) as of January 31, 2009 were:
| (%) | |||||||
| ICON | 2.4 | ||||||
| NuVasive | 1.9 | ||||||
| Alexion Pharmaceuticals | 1.9 | ||||||
| Solera Holdings | 1.7 | ||||||
| Concho Resources | 1.6 | ||||||
| Intrepid Potash | 1.6 | ||||||
| Psychiatric Solutions | 1.5 | ||||||
| Corinthian Colleges | 1.5 | ||||||
| Core Laboratories | 1.5 | ||||||
| OSI Pharmaceuticals | 1.4 | ||||||
Holdings are calculated as a percentage of net assets and are subject to change. Because the fund is actively managed, there is no guarantee the fund will continue to maintain the holdings breakdown listed. The fund's holdings and their weights within the portfolio may change as market conditions change.
Equity investments are affected by stock market fluctuations that occur in response to economic and business developments.
Investing in growth stocks incurs the possibility of losses because their prices are sensitive to changes in current or expected earnings.
Investments in small-cap stocks may be subject to greater volatility and price fluctuations because they may be thinly traded and less liquid than investments in larger companies.
22
Performance data quoted represents past performance and current performance may be lower or higher. Past performance is no guarantee of future results. The investment return and principal value will fluctuate so that shares, when redeemed, may be worth more or less than the original cost. Please visit www.columbiamanagement.com for daily and most recent month-end performance updates.
Average annual total return as of January 31, 2009 (%)
| Inception | 6-month (cumulative) | 1-year | 5-year | 10-year | |||||||||||||||||||
| CMG Small Cap Growth Fund | 08/30/89 | -40.94 | -39.16 | -1.17 | 4.36 | ||||||||||||||||||
| Russell 2000 Growth Index | -39.06 | -37.48 | -4.86 | -1.97 | |||||||||||||||||||
| Russell 2000 Index | -37.38 | -36.84 | -4.06 | 1.68 | |||||||||||||||||||
Average annual total return as of December 31, 2008 (%)
| Inception | 6-month (cumulative) | 1-year | 5-year | 10-year | |||||||||||||||||||
| CMG Small Cap Growth Fund | 08/30/89 | -38.73 | -43.32 | 1.00 | 4.76 | ||||||||||||||||||
| Russell 2000 Growth Index | -32.51 | -38.54 | -2.35 | -0.76 | |||||||||||||||||||
| Russell 2000 Index | -26.94 | -33.79 | -0.93 | 3.02 | |||||||||||||||||||
Performance results reflect any fee waivers or reimbursements of fund expenses by the investment advisor and/or any of its affiliates. Absent these fee waivers or expense reimbursement arrangements, performance results would have been lower. All results shown assume reinvestment of distributions and do not reflect the deduction of taxes that a shareholder may pay on fund distributions or on the redemption of fund shares.
The fund's annual operating expense ratios, with and without contractual waivers, as stated in the fund's prospectus that is current as of the date of this report, are 0.80% and 1.06%, respectively, of average annual net assets. Differences in expense ratios disclosed elsewhere in this report may result from including fee waivers and expense reimbursements as well as different time periods used in calculating the ratios. The contractual waiver expires 11/30/09.
Performance of a $3,000,000 investment, February 1, 1999 to January 31, 2009

The chart above compares the results of a hypothetical minimum initial $3,000,000 investment in the fund to the indices during the stated time period and does not reflect the deduction of taxes that a shareholder may pay on fund distributions or on the redemption of fund shares.
The Russell 2000 Growth Index measures the performance of those Russell 2000 Index companies with higher price-to-book ratios and higher forecasted growth values. The Russell 2000 Index measures the performance of the 2,000 smallest of the 3,000 largest US companies based on market capitalization. Indices are not investments, do not incur fees or expenses and are not professionally managed. It is not possible to invest directly in an index. Securities in the fund may not match those in an index.
23
UNDERSTANDING YOUR EXPENSES — CMG Small Cap Growth Fund
As a fund shareholder, you incur ongoing costs, which generally include investment advisory fees and other fund expenses. The information on this page is intended to help you understand the ongoing costs of investing in the fund and to compare these costs with the ongoing costs of investing in other mutual funds.
Analyzing your fund's expenses
To illustrate these ongoing costs, we have provided an example and calculated the expenses paid by investors during the period. The information in the following table is based on an initial investment of $1,000, which is invested at the beginning of the period and held for the entire period. Expense information is calculated two ways and each method provides you with different information. The amount listed in the "Actual" column is calculated using the fund's actual operating expenses and total return for the period. The amount listed in the "Hypothetical" column assumes that the return each year is 5% before expenses and is calculated based on the fund's actual operating expenses. You should not use the hypothetical account values and expenses to estimate either your actual account balance at the end of the period or the expenses you paid during this period.
Estimating your actual expenses
To estimate the expenses that you paid over the period, first you will need your account balance at the end of the period:
1. Divide your ending account balance by $1,000. For example, if an account balance was $8,600 at the end of the period, the result would be 8.6.
2. In the section of the table below titled "Expenses paid during the period," locate the amount in the column labeled "Actual." Multiply this number by the result from step 1. Your answer is an estimate of the expenses you paid on your account during the period.
August 1, 2008 – January 31, 2009
| Account value at the beginning of the period ($) | Account value at the end of the period ($) | Expenses paid during the period ($) | Fund's annualized expense ratio (%) | ||||||||||||||||||||||||
| Actual | Hypothetical | Actual | Hypothetical | Actual | Hypothetical | Actual | |||||||||||||||||||||
| 1,000.00 | 1,000.00 | 590.61 | 1,021.17 | 3.21 | 4.08 | 0.80 | |||||||||||||||||||||
Expenses paid during the period are equal to the fund's annualized expense ratio of 0.80%, multiplied by the average account value over the period, then multiplied by the number of days in the fund's most recent fiscal half-year and divided by 365.
Had the investment advisor and/or any of its affiliates not waived fees or reimbursed a portion of expenses, account value at the end of the period would have been reduced.
It is important to note that the expense amounts shown in the table are meant to highlight only ongoing costs of investing in the fund. Therefore, the hypothetical examples provided may not help you determine the relative total costs of owning shares of different funds.
Compare with other funds
Since all mutual funds are required to include the same hypothetical calculations about expenses in shareholder reports, you can use this information to compare the ongoing costs of investing in the fund with other funds. To do so, compare the 5% hypothetical example with the 5% hypothetical examples that appear in the shareholder reports of other funds. As you compare hypothetical examples of other funds, it is important to note that hypothetical examples are meant to highlight the ongoing costs of investing in a fund.
24
Performance data quoted represents past performance and current performance may be lower or higher. Past performance is no guarantee of future results. The investment return and principal value will fluctuate so that shares, when redeemed, may be worth more or less than the original cost. Please visit www.columbiamanagement.com for daily and most recent month-end performance updates.
CMG SMALL CAP VALUE FUND
A Portfolio of Columbia Funds Institutional Trust
FUND PROFILE
Summary
• For the six-month period that ended January 31, 2009, CMG Small Cap Value Fund returned negative 33.44%. In an environment of sharply declining stock prices, contracting economic growth and shrinking profits, the fund held up somewhat better than its benchmarks and peer group. The Russell 2000 Value Index returned negative 35.72% and the Russell 2000 Index returned negative 37.38%.1 The average return of the Lipper Small-Cap Value Funds Classification2 was negative 36.73% over the same period. The fund's long-standing focus on small-cap companies with strong balance sheets and positive cash flows helped as access to credit tightened and stock prices plunged in the final months of the period. We believe that the fund was more defensively positioned than its peer group early on in the period, with more exposure to health care and consumer staples stocks.
• A decision to underweight consumer discretionary stocks relative to the index helped stem losses because that sector was one of the period's weakest performers. In addition, the fund had little or no exposure to some of the weakest industries within the sector, namely media, autos and auto parts. In addition, stock selection aided performance, led by Monro Muffler Brake (0.6% of net assets), an auto repair chain, which benefited from strong execution, increased market share and an aging vehicle fleet. Stock selection in the tiny telecommunication services sector and in technology as well as a modest overweight in consumer staples further aided relative performance.
• The fund lost ground versus the index on its investments in industrials and energy. In industrials, stock selection was weak in some of the better performing industries, namely construction and engineering and airlines. Among detractors was KHD Humboldt Wedag International (0.3% of net assets), a company that builds cement and processing plants overseas. It tumbled amid concerns that the global slowdown would hurt demand from emerging markets. An overweight in energy hurt results because energy stocks plummeted as oil prices fell. In the financials sector, the fund's exposure was in line with the sector's weight in the Russell 2000 Value Index, but its contribution to return was higher.
• During the fourth quarter of 2008, we moved the portfolio to a more neutral position, reducing defensive holdings and adding opportunistically to high quality stocks that we believe would benefit from improved economic growth. In that regard, the fund headed into 2009 with modest overweights in technology, materials and industrials. Although the exact timing of an economic recovery remains uncertain, we believe that this overall positioning, with an emphasis on companies with solid balance sheets, strong cash flows and attractive valuations,
1 The Russell 2000 Value Index measures the performance of those Russell 2000 Index companies with lower price-to-book ratios and lower forecasted growth values. The Russell 2000 Index measures the performance of the 2,000 smallest of the 3,000 largest US companies based on market capitalization. Indices are not investments, do not incur fees or expenses and are not professionally managed. It is not possible to invest directly in an index. Securities in the fund may not match those in an index.
2 Lipper Inc., a widely respected data provider in the industry, calculates an average total return (assuming reinvestment of distributions) for mutual funds with investment objectives similar to those of the fund. Lipper makes no adjustment for the effect of sales loads.
25
should help the fund weather further volatility but also help it capture opportunity if the economy turns around.
Portfolio Management
Stephen D. Barbaro, lead manager, has managed or co-managed the fund since May 2003 and has been associated with the advisor or its predecessors or affiliate organizations since 1976.
Jeremy Javidi has co-managed the fund since August 2005 and has been associated with the advisor or its predecessors or affiliate organizations since 2000.
The fund's top ten holdings (as a percentage of net assets) as of January 31, 2009 were:
| (%) | |||||||
| CH Energy Group | 0.9 | ||||||
| United America Indemnity | 0.9 | ||||||
| Weis Markets | 0.8 | ||||||
| Chemical Financial Group | 0.8 | ||||||
| Werner Enterprises | 0.8 | ||||||
| Potlatch | 0.7 | ||||||
| First Financial | 0.7 | ||||||
| CNA Surety | 0.7 | ||||||
| Navigators Group | 0.7 | ||||||
| First Citizens BancShares | 0.7 | ||||||
Holdings are calculated as a percentage of net assets and are subject to change. Because the fund is actively managed, there is no guarantee the fund will continue to maintain the holdings breakdown listed. The fund's holdings and their weights within the portfolio may change as market conditions change.
Equity investments are affected by stock market fluctuations that occur in response to economic and business developments.
Investments in small-cap stocks may be subject to greater volatility and price fluctuations because they may be thinly traded and less liquid than investments in larger companies.
Value stocks are stocks of companies that may have experienced adverse business or industry developments or may be subject to special risks that have caused the stocks to be out of favor and, in the advisors opinion, undervalued. The price of the company's stock may not approach the value the advisor has placed on it.
26
Performance data quoted represents past performance and current performance may be lower or higher. Past performance is no guarantee of future results. The investment return and principal value will fluctuate so that shares, when redeemed, may be worth more or less than the original cost. Please visit www.columbiamanagement.com for daily and most recent month-end performance updates.
Average annual total return as of January 31, 2009 (%)
| Inception | 6-month (cumulative) | 1-year | 5-year | Life | |||||||||||||||||||
| CMG Small Cap Value Fund | 05/05/03 | -33.44 | -34.51 | -1.46 | 4.84 | ||||||||||||||||||
| Russell 2000 Value Index | -35.72 | -36.47 | -3.43 | 3.11 | |||||||||||||||||||
| Russell 2000 Index | -37.38 | -36.84 | -4.06 | 2.65 | |||||||||||||||||||
Average annual total return as of December 31, 2008 (%)
| Inception | 6-month (cumulative) | 1-year | 5-year | Life | |||||||||||||||||||
| CMG Small Cap Value Fund | 05/05/03 | -21.33 | -28.21 | 1.84 | 7.33 | ||||||||||||||||||
| Russell 2000 Value Index | -21.17 | -28.92 | 0.27 | 6.01 | |||||||||||||||||||
| Russell 2000 Index | -26.94 | -33.79 | -0.93 | 4.85 | |||||||||||||||||||
Index performance is from May 5, 2003.
Performance results reflect any fee waivers or reimbursements of fund expenses by the investment advisor and/or any of its affiliates. Absent these fee waivers or expense reimbursement arrangements, performance results would have been lower. All results shown assume reinvestment of distributions and do not reflect the deduction of taxes that a shareholder may pay on fund distributions or on the redemption of fund shares.
The fund's annual operating expense ratios, with and without contractual waivers, as stated in the fund's prospectus that is current as of the date of this report, are 0.80% and 1.09%, respectively, of average annual net assets. Differences in expense ratios disclosed elsewhere in this report may result from including fee waivers and expense reimbursements as well as different time periods used in calculating the ratios. The contractual waiver expires 11/30/09.
Performance of a $3,000,000 investment, May 5, 2003 to January 31, 2009

The chart above compares the results of a hypothetical minimum initial $3,000,000 investment in the fund to the indices during the stated time period and does not reflect the deduction of taxes that a shareholder may pay on fund distributions or on the redemption of fund shares.
The Russell 2000 Value Index measures the performance of those Russell 2000 Index companies with lower price-to-book ratios and lower forecasted growth values. The Russell 2000 Index measures the performance of the 2,000 smallest of the 3,000 largest US companies based on market capitalization. Indices are not investments, do not incur fees or expenses and are not professionally managed. It is not possible to invest directly in an index. Securities in the fund may not match those in an index.
27
UNDERSTANDING YOUR EXPENSES — CMG Small Cap Value Fund
As a fund shareholder, you incur ongoing costs, which generally include investment advisory fees and other fund expenses. The information on this page is intended to help you understand the ongoing costs of investing in the fund and to compare these costs with the ongoing costs of investing in other mutual funds.
Analyzing your fund's expenses
To illustrate these ongoing costs, we have provided an example and calculated the expenses paid by investors during the period. The information in the following table is based on an initial investment of $1,000, which is invested at the beginning of the period and held for the entire period. Expense information is calculated two ways and each method provides you with different information. The amount listed in the "Actual" column is calculated using the fund's actual operating expenses and total return for the period. The amount listed in the "Hypothetical" column assumes that the return each year is 5% before expenses and is calculated based on the fund's actual operating expenses. You should not use the hypothetical account values and expenses to estimate either your actual account balance at the end of the period or the expenses you paid during this period.
Estimating your actual expenses
To estimate the expenses that you paid over the period, first you will need your account balance at the end of the period:
1. Divide your ending account balance by $1,000. For example, if an account balance was $8,600 at the end of the period, the result would be 8.6.
2. In the section of the table below titled "Expenses paid during the period," locate the amount in the column labeled "Actual." Multiply this number by the result from step 1. Your answer is an estimate of the expenses you paid on your account during the period.
August 1, 2008 – January 31, 2009
| Account value at the beginning of the period ($) | Account value at the end of the period ($) | Expenses paid during the period ($) | Fund's annualized expense ratio (%) | ||||||||||||||||||||||||
| Actual | Hypothetical | Actual | Hypothetical | Actual | Hypothetical | Actual | |||||||||||||||||||||
| 1,000.00 | 1,000.00 | 665.62 | 1,021.17 | 3.36 | 4.08 | 0.80 | |||||||||||||||||||||
Expenses paid during the period are equal to the fund's annualized expense ratio of 0.80%, multiplied by the average account value over the period, then multiplied by the number of days in the fund's most recent fiscal half-year and divided by 365.
Had the investment advisor and/or any of its affiliates not waived fees or reimbursed a portion of expenses, account value at the end of the period would have been reduced.
It is important to note that the expense amounts shown in the table are meant to highlight only ongoing costs of investing in the fund. Therefore, the hypothetical examples provided may not help you determine the relative total costs of owning shares of different funds.
Compare with other funds
Since all mutual funds are required to include the same hypothetical calculations about expenses in shareholder reports, you can use this information to compare the ongoing costs of investing in the fund with other funds. To do so, compare the 5% hypothetical example with the 5% hypothetical examples that appear in the shareholder reports of other funds. As you compare hypothetical examples of other funds, it is important to note that hypothetical examples are meant to highlight the ongoing costs of investing in a fund.
28
Performance data quoted represents past performance and current performance may be lower or higher. Past performance is no guarantee of future results. The investment return and principal value will fluctuate so that shares, when redeemed, may be worth more or less than the original cost. Please visit www.columbiamanagement.com for daily and most recent month-end performance updates.
CMG SMALL/MID CAP FUND
A Portfolio of Columbia Funds Institutional Trust
FUND PROFILE
Summary
• For the six-month period that ended January 31, 2009, CMG Small/Mid Cap Fund returned negative 42.25%. The fund's benchmarks, the Russell 2500 Growth Index and the Russell 2500 Index1, returned negative 40.12% and negative 37.83%, respectively. The average return of the Lipper Mid-Cap Growth Funds Classification2 was negative 40.07%. In a very difficult market environment, stock selection detracted from returns relative to the fund's benchmarks. However, we maintained our focus on companies with improving returns on invested capital, improving profit margins and strong balance sheets, on the belief that these companies are positioned to rebound when the market environment improves. Our bias was towards less economically sensitive companies.
• The fund's biggest disappointments were in the materials, industrials, energy and health care sectors. Materials stocks declined overall as slowing global demand depressed commodity prices. Within the sector, agricultural companies such as Potash Corp. of Saskatchewan (1.2% of net assets), a Canadian fertilizer company, were weak performers for the fund. Industrials stocks were hit hard as corporations scaled back on capital spending. McDermott International, an energy infrastructure company that we sold before period end, fell sharply as declining energy prices reduced demand for its services. In health care, contract research organizations, which conduct clinical research for pharmaceutical and biotechnology companies, were weak performers. Companies such as ICON, which is based in Ireland, and Charles River Laboratories International (1.2% and 0.7% of net assets, respectively), plunged in anticipation of slo wer demand for their services.
• The fund held up better than the index in the energy and consumer discretionary sectors, where certain stocks bucked the market's downward trend. Of note were for-profit education companies such as ITT Educational Services (1.9% of net assets), which benefited as unemployed workers returned to the classroom and boosted enrollment. The fund also enjoyed strong gains from Aeropostale, a clothing retailer that reported solid sales growth, and Darden Restaurants, which operates the Olive Garden chain (0.6% and 0.8% of net assets, respectively).
• Going forward, we expect to gradually increase the fund's stake in more economically sensitive companies. However, as long as credit remains tight, our focus will be on companies that are less reliant on the capital markets. As banks increase their lending activities, we believe that the economy has the potential to expand. We believe that smaller-cap stocks are
1 The Russell 2500 Growth Index measures the performance of those Russell 2500 companies with higher price-to-book ratios and higher forecasted growth values. The Russell 2500 Index measures the performance of the 2,500 smallest companies of the Russell 3000 Index. Indices are not investments, do not incur fees or expenses and are not professionally managed. It is not possible to invest directly in an index. Securities in the fund may not match those in an index.
2 Lipper Inc., a widely respected data provider in the industry, calculates an average total return (assuming reinvestment of distributions) for mutual funds with investment objectives similar to those of the fund. Lipper makes no adjustment for the effect of sales loads.
29
well positioned to face an improved environment because historically they have often led the market as investors anticipate economic recovery.
Portfolio Management
Wayne M. Collette has co-managed the fund since February 2006 and has been associated with the advisor or its predecessors or affiliate organizations since 2001.
George J. Myers has co-managed the fund since February 2006 and has been associated with the advisor or its predecessors or affiliate organizations since 2004.
Lawrence W. Lin has co-managed the fund since October 2007 and has been associated with the advisor or its predecessors or affiliate organizations since 2006.
Brian D. Neigut has co-managed the fund since October 2007 and has been associated with the advisor or its predecessors or affiliate organizations since 2007.
The fund's top ten holdings (as a percentage of net assets) as of January 31, 2009 were:
| (%) | |||||||
| Stericycle | 2.0 | ||||||
| Marvel Entertainment | 1.9 | ||||||
| ITT Educational Services | 1.9 | ||||||
| Solera Holdings | 1.4 | ||||||
| Chattem | 1.3 | ||||||
| NuVasive | 1.3 | ||||||
| Landstar Systems | 1.2 | ||||||
| Psychiatric Solutions | 1.2 | ||||||
| OSI Pharmaceuticals | 1.2 | ||||||
| Potash Corp. of Saskatchewan | 1.2 | ||||||
Holdings are calculated as a percentage of net assets and are subject to change. Because the fund is actively managed, there is no guarantee the fund will continue to maintain the holdings breakdown listed. The fund's holdings and their weights within the portfolio may change as market conditions change.
Equity investments are affected by stock market fluctuations that occur in response to economic and business developments.
Investing in growth stocks incurs the possibility of losses because their prices are sensitive to changes in current or expected earnings.
Investments in small- and mid-cap stocks may present special risks. They tend to be more volatile and may be less liquid than the stocks of larger companies. Small-cap stocks often have narrower markets, limited financial resources and tend to be more thinly traded than stocks of larger companies.
30
Performance data quoted represents past performance and current performance may be lower or higher. Past performance is no guarantee of future results. The investment return and principal value will fluctuate so that shares, when redeemed, may be worth more or less than the original cost. Please visit www.columbiamanagement.com for daily and most recent month-end performance updates.
Average annual total return as of January 31, 2009 (%)
| Inception | 6-month (cumulative) | 1-year | 5-year | Life | |||||||||||||||||||
| CMG Small/Mid Cap Fund | 12/01/00 | -42.25 | -38.56 | -1.43 | -1.28 | ||||||||||||||||||
| Russell 2500 Growth Index | -40.12 | -40.14 | -4.23 | -2.34 | |||||||||||||||||||
| Russell 2500 Index | -37.83 | -38.74 | -3.52 | 1.61 | |||||||||||||||||||
Average annual total return as of December 31, 2008 (%)
| Inception | 6-month (cumulative) | 1-year | 5-year | Life | |||||||||||||||||||
| CMG Small/Mid Cap Fund | 12/01/00 | -41.22 | -43.56 | -0.11 | -0.78 | ||||||||||||||||||
| Russell 2500 Growth Index | -36.51 | -41.50 | -2.24 | -1.61 | |||||||||||||||||||
| Russell 2500 Index | -31.21 | -36.79 | -0.98 | 2.82 | |||||||||||||||||||
Index performance is from December 1, 2000.
Performance results reflect any fee waivers or reimbursements of fund expenses by the investment advisor and/or any of its affiliates. Absent these fee waivers or expense reimbursement arrangements, performance results would have been lower. All results shown assume reinvestment of distributions and do not reflect the deduction of taxes that a shareholder may pay on fund distributions or on the redemption of fund shares.
The fund's annual operating expense ratios, with and without contractual waivers, as stated in the fund's prospectus that is current as of the date of this report, are 0.75% and 1.27%, respectively, of average annual net assets. Differences in expense ratios disclosed elsewhere in this report may result from including fee waivers and expense reimbursements as well as different time periods used in calculating the ratios. The contractual waiver expires 11/30/09.
Performance of a $3,000,000 investment, December 1, 2000 to January 31, 2009
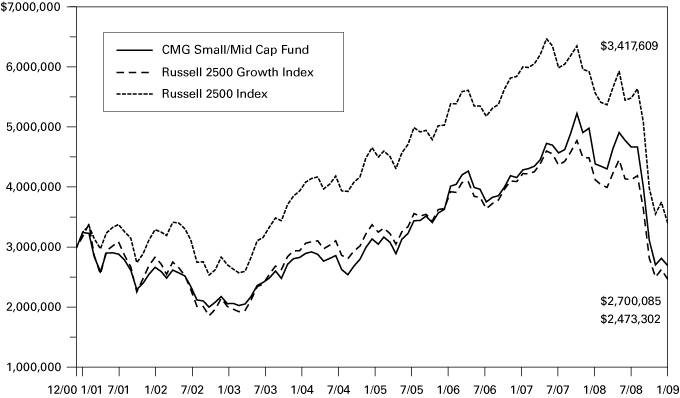
The chart above compares the results of a hypothetical minimum initial $3,000,000 investment in the fund to the indices during the stated time period and does not reflect the deduction of taxes that a shareholder may pay on fund distributions or on the redemption of fund shares.
The Russell 2500 Growth Index measures the performance of those Russell 2500 Index companies with higher price-to-book ratios and higher forecasted growth values. The Russell 2500 Index measures the performance of the 2,500 smallest companies of the Russell 3000 Index. Indices are not investments, do not incur fees or expenses and are not professionally managed. It is not possible to invest directly in an index. Securities in the fund may not match those in an index.
31
UNDERSTANDING YOUR EXPENSES — CMG Small/Mid Cap Fund
As a fund shareholder, you incur ongoing costs, which generally include investment advisory fees and other fund expenses. The information on this page is intended to help you understand the ongoing costs of investing in the fund and to compare these costs with the ongoing costs of investing in other mutual funds.
Analyzing your fund's expenses
To illustrate these ongoing costs, we have provided an example and calculated the expenses paid by investors during the period. The information in the following table is based on an initial investment of $1,000, which is invested at the beginning of the period and held for the entire period. Expense information is calculated two ways and each method provides you with different information. The amount listed in the "Actual" column is calculated using the fund's actual operating expenses and total return for the period. The amount listed in the "Hypothetical" column assumes that the return each year is 5% before expenses and is calculated based on the fund's actual operating expenses. You should not use the hypothetical account values and expenses to estimate either your actual account balance at the end of the period or the expenses you paid during this period.
Estimating your actual expenses
To estimate the expenses that you paid over the period, first you will need your account balance at the end of the period:
1. Divide your ending account balance by $1,000. For example, if an account balance was $8,600 at the end of the period, the result would be 8.6.
2. In the section of the table below titled "Expenses paid during the period," locate the amount in the column labeled "Actual." Multiply this number by the result from step 1. Your answer is an estimate of the expenses you paid on your account during the period.
August 1, 2008 – January 31, 2009
| Account value at the beginning of the period ($) | Account value at the end of the period ($) | Expenses paid during the period ($) | Fund's annualized expense ratio (%) | ||||||||||||||||||||||||
| Actual | Hypothetical | Actual | Hypothetical | Actual | Hypothetical | Actual | |||||||||||||||||||||
| 1,000.00 | 1,000.00 | 577.51 | 1,021.42 | 2.98 | 3.82 | 0.75 | |||||||||||||||||||||
Expenses paid during the period are equal to the fund's annualized expense ratio of 0.75%, multiplied by the average account value over the period, then multiplied by the number of days in the fund's most recent fiscal half-year and divided by 365.
Had the investment advisor and/or any of its affiliates not waived fees or reimbursed a portion of expenses, account value at the end of the period would have been reduced.
It is important to note that the expense amounts shown in the table are meant to highlight only ongoing costs of investing in the fund. Therefore, the hypothetical examples provided may not help you determine the relative total costs of owning shares of different funds.
Compare with other funds
Since all mutual funds are required to include the same hypothetical calculations about expenses in shareholder reports, you can use this information to compare the ongoing costs of investing in the fund with other funds. To do so, compare the 5% hypothetical example with the 5% hypothetical examples that appear in the shareholder reports of other funds. As you compare hypothetical examples of other funds, it is important to note that hypothetical examples are meant to highlight the ongoing costs of investing in a fund.
32
Performance data quoted represents past performance and current performance may be lower or higher. Past performance is no guarantee of future results. The investment return and principal value will fluctuate so that shares, when redeemed, may be worth more or less than the original cost. Please visit www.columbiamanagement.com for daily and most recent month-end performance updates.
CMG INTERNATIONAL STOCK FUND
A Portfolio of Columbia Funds Institutional Trust
FUND PROFILE
Summary
• For the six-month period that ended January 31, 2009, CMG International Stock Fund returned negative 45.12%. The fund's benchmarks, the MSCI EAFE Index and the MSCI All Country World ex U.S. Index,1 returned negative 40.75% and negative 42.56%, respectively. The average return of the fund's peer group, the Lipper International Multi-Cap Core Funds Classification,2 was negative 40.61%. An overweight in China, a market that declined significantly in the face of the global economic slowdown, detracted from performance relative to the fund's benchmarks. An underweight in the United Kingdom (UK) also held back returns. The UK market is dominated by mega cap stocks which are more defensive and held up slightly better during the market downturn. Holdings in commodities-based industrial stocks were also disappointing, as demand for commodities fell off sharply.
• During the period, we positioned the portfolio more defensively. An overweight relative to the MSCI EAFE Index in insurance was helpful, as insurance companies have been less affected by the troubles in the financial sector. An overweight relative to the MSCI EAFE Index in health care also aided performance, with Biovail (0.5% of net assets), a Canadian pharmaceutical company, generating a relatively strong return. The fund benefited from a decision to avoid Portugal and to underweight Greece for most of the period. Fast Retailing Company (0.5% of net assets) in Japan is among the individual companies that made relatively strong contributions to performance. Fast Retailing's low priced but fashionable clothing was popular as consumers became more cost conscious.
• Governments around the world are seeking solutions to the global economic problems. Many have reduced interest rates, developed stimulus packages designed to boost economic growth and taken steps to solve the credit problems plaguing some of the biggest financial institutions. These policies will take time to work, and the economic news may be negative for a while. On a more positive note, financial markets are forward-looking, and they usually turn up before the economy recovers. With this in mind, we are focused on companies that we believe will preserve their margins and profitability in a slow-growth environment and that have strong balance sheets with little or no debt.
1 The Morgan Stanley Capital International (MSCI) Europe, Australasia, Far East (EAFE) Index is a free float-adjusted market capitalization index that is designed to measure developed market equity performance, excluding the US and Canada. The MSCI All Country (AC) World ex U.S. Index tracks global stock market performance that includes developed and emerging markets but excludes the US. Indices are not investments, do not incur fees or expenses and are not professionally managed. It is not possible to invest directly in an index. Securities in the fund may not match those in an index.
2 Lipper Inc., a widely respected data provider in the industry, calculates an average total return (assuming reinvestment of distributions) for mutual funds with investment objectives similar to those of the fund. Lipper makes no adjustment for the effect of sales loads.
33
Portfolio Management
Fred Copper, lead manager, has managed or co-managed the fund since 2005 and has been associated with the advisor or its predecessors or affiliate organization since September 2005.
Jasmine (Weili) Huang has co-managed the fund since 2006 and has been associated with the advisor or its predecessors or affiliate organization since September 2003.
Timothy R. Anderson has co-managed the fund since 2006 and has been associated with the advisor or predecessors or affiliate organizations since March 2006.
Paul J. DiGiacomo has co-managed the fund since 2006 and has been associated with the advisor or predecessors or affiliate organizations since April 2006.
Daisuke Nomoto has co-managed the fund since 2006 and has been associated with the advisor or its predecessors or affiliate organization since April 2005.
The fund's top ten holdings and countries (as a percentage of net assets) as of January 31, 2009 were:
| (%) | (%) | ||||||||||||||
| iShares MSCI EAFE Index Fund | 2.4 | Japan | 22.2 | ||||||||||||
| Total SA | 2.1 | United Kingdom | 17.4 | ||||||||||||
| Roche Holdings AG, Genusschein Shares | 2.0 | France | 9.0 | ||||||||||||
| E.ON AG | 1.9 | Switzerland | 8.5 | ||||||||||||
| BP PLC | 1.8 | United States | 7.3 | ||||||||||||
| Sanofi-Aventis SA | 1.6 | Germany | 6.8 | ||||||||||||
| Banco Santander SA | 1.6 | Spain | 5.0 | ||||||||||||
| Nippon Telegraph & Telephone | 1.5 | China | 3.3 | ||||||||||||
| Sumitomo Mitsui Financial Group | 1.4 | Canada | 2.3 | ||||||||||||
| BHP Billiton PLC | 1.4 | Netherlands | 2.3 | ||||||||||||
Holdings and country breakdowns are calculated as a percentage of net assets and are subject to change. Because the fund is actively managed, there is no guarantee the fund will continue to maintain the holdings and country breakdowns listed. The fund's holdings and their weights within the portfolio may change as market conditions change.
Equity investments are affected by stock market fluctuations that occur in response to economic and business developments.
International investing may involve certain risks, including foreign taxation, currency fluctuation, risks associated with possible differences in financial standards and other monetary and political risks.
A concentration of investments in a specific sector, such as the financials sector, may cause the fund to experience increased volatility.
34
Performance data quoted represents past performance and current performance may be lower or higher. Past performance is no guarantee of future results. The investment return and principal value will fluctuate so that shares, when redeemed, may be worth more or less than the original cost. Please visit www.columbiamanagement.com for daily and most recent month-end performance updates.
Average annual total return as of January 31, 2009 (%)
| Inception | 6-month (cumulative) | 1-year | 5-year | 10-year | |||||||||||||||||||
| CMG International Stock Fund | 02/01/94 | -45.12 | -46.91 | -3.79 | -1.00 | ||||||||||||||||||
| MSCI EAFE Index | -40.75 | -43.74 | -0.70 | -0.21 | |||||||||||||||||||
| MSCI All Country World ex U.S. Index | -42.56 | -44.72 | 0.79 | 1.34 | |||||||||||||||||||
Average annual total return as of December 31, 2008 (%)
| Inception | 6-month (cumulative) | 1-year | 5-year | 10-year | |||||||||||||||||||
| CMG International Stock Fund | 02/01/94 | -39.95 | -45.04 | -0.96 | 0.69 | ||||||||||||||||||
| MSCI EAFE Index | -36.41 | -43.38 | 1.66 | 0.80 | |||||||||||||||||||
| MSCI All Country World ex U.S. Index | -39.26 | -45.24 | 3.00 | 2.27 | |||||||||||||||||||
Performance results reflect any fee waivers or reimbursements of fund expenses by the investment advisor and/or any of its affiliates. Absent these fee waivers or expense reimbursement arrangements, performance results would have been lower. All results shown assume reinvestment of distributions and do not reflect the deduction of taxes that a shareholder may pay on fund distributions or on the redemption of fund shares.
The fund's annual operating expense ratios, with and without contractual waivers, as stated in the fund's prospectus that is current as of the date of this report, are 0.75% and 0.83%, respectively, of average annual net assets. Differences in expense ratios disclosed elsewhere in this report may result from including fee waivers and expense reimbursements as well as different time periods used in calculating the ratios. The contractual waiver expires 11/30/09.
Performance of a $3,000,000 investment, February 1, 1999 to January 31, 2009
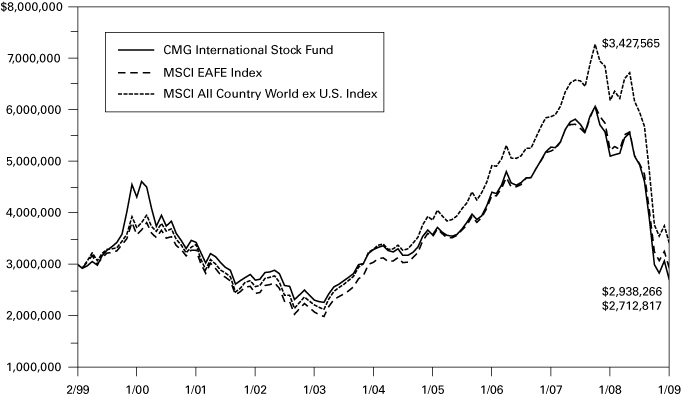
The chart above compares the results of a hypothetical minimum initial $3,000,000 investment in the fund to the indices during the stated time period and does nor reflect the deduction of taxes that a shareholder may pay on fund distributions or on the redemption of fund shares.
The Morgan Stanley Capital International (MSCI) Europe, Australasia, Far East (EAFE) Index is a free float-adjusted market capitalization index that is designed to measure developed market equity performance, excluding the US and Canada. The MSCI All Country (AC) World ex U.S. Index tracks global stock market performance that includes developed and emerging markets but excludes the US. Indices are not investments, do not incur fees or expenses and are not professionally managed. It is not possible to invest directly in an index. Securities in the fund may not match those in an index.
35
UNDERSTANDING YOUR EXPENSES — CMG International Stock Fund
As a fund shareholder, you incur ongoing costs, which generally include investment advisory fees and other fund expenses. The information on this page is intended to help you understand the ongoing costs of investing in the fund and to compare these costs with the ongoing costs of investing in other mutual funds.
Analyzing your fund's expenses
To illustrate these ongoing costs, we have provided an example and calculated the expenses paid by investors during the period. The information in the following table is based on an initial investment of $1,000, which is invested at the beginning of the period and held for the entire period. Expense information is calculated two ways and each method provides you with different information. The amount listed in the "Actual" column is calculated using the fund's actual operating expenses and total return for the period. The amount listed in the "Hypothetical" column assumes that the return each year is 5% before expenses and is calculated based on the fund's actual operating expenses. You should not use the hypothetical account values and expenses to estimate either your actual account balance at the end of the period or the expenses you paid during this period.
Estimating your actual expenses
To estimate the expenses that you paid over the period, first you will need your account balance at the end of the period:
1. Divide your ending account balance by $1,000. For example, if an account balance was $8,600 at the end of the period, the result would be 8.6.
2. In the section of the table below titled "Expenses paid during the period," locate the amount in the column labeled "Actual." Multiply this number by the result from step 1. Your answer is an estimate of the expenses you paid on your account during the period.
August 1, 2008 – January 31, 2009
| Account value at the beginning of the period ($) | Account value at the end of the period ($) | Expenses paid during the period ($) | Fund's annualized expense ratio (%) | ||||||||||||||||||||||||
| Actual | Hypothetical | Actual | Hypothetical | Actual | Hypothetical | Actual | |||||||||||||||||||||
| 1,000.00 | 1,000.00 | 548.82 | 1,021.42 | 2.93 | 3.82 | 0.75 | |||||||||||||||||||||
Expenses paid during the period are equal to the fund's annualized expense ratio of 0.75%, multiplied by the average account value over the period, then multiplied by the number of days in the fund's most recent fiscal half-year and divided by 365.
Had the investment advisor and/or any of its affiliates not waived fees or reimbursed a portion of expenses, account value at the end of the period would have been reduced.
It is important to note that the expense amounts shown in the table are meant to highlight only ongoing costs of investing in the fund. Therefore, the hypothetical examples provided may not help you determine the relative total costs of owning shares of different funds.
Compare with other funds
Since all mutual funds are required to include the same hypothetical calculations about expenses in shareholder reports, you can use this information to compare the ongoing costs of investing in the fund with other funds. To do so, compare the 5% hypothetical example with the 5% hypothetical examples that appear in the shareholder reports of other funds. As you compare hypothetical examples of other funds, it is important to note that hypothetical examples are meant to highlight the ongoing costs of investing in a fund.
36
CMG ENHANCED S&P 500® INDEX FUND
A Portfolio of Columbia Funds Institutional Trust
FINANCIAL HIGHLIGHTS
(For a Share Outstanding Throughout Each Period)
| (Unaudited) Six Months Ended January 31, | Year Ended July 31, | ||||||||||||||||||||||||||
| 2009 | 2008 | 2007 | 2006 | 2005 | 2004 | ||||||||||||||||||||||
| Net asset value, beginning of period | $ | 12.19 | $ | 14.53 | $ | 13.52 | $ | 13.49 | $ | 11.97 | $ | 10.73 | |||||||||||||||
| Income from investment operations: | |||||||||||||||||||||||||||
| Net investment income (a) | 0.15 | 0.25 | 0.25 | 0.23 | 0.24 | (b) | 0.17 | ||||||||||||||||||||
| Net realized and unrealized gain (loss) on investments and futures contracts | (4.11 | ) | (1.94 | ) | 1.88 | 0.76 | 1.58 | 1.13 | |||||||||||||||||||
| Total from investment operations | (3.96 | ) | (1.69 | ) | 2.13 | 0.99 | 1.82 | 1.30 | |||||||||||||||||||
| Less distributions to shareholders: | |||||||||||||||||||||||||||
| From net investment income | (0.27 | ) | (0.22 | ) | (0.22 | ) | (0.25 | ) | (0.20 | ) | (0.05 | ) | |||||||||||||||
| From net realized gains | - | (0.43 | ) | (0.90 | ) | (0.71 | ) | (0.10 | ) | (0.01 | ) | ||||||||||||||||
| Total distributions to shareholders | (0.27 | ) | (0.65 | ) | (1.12 | ) | (0.96 | ) | (0.30 | ) | (0.06 | ) | |||||||||||||||
| Net asset value, end of period | $ | 7.96 | $ | 12.19 | $ | 14.53 | $ | 13.52 | $ | 13.49 | $ | 11.97 | |||||||||||||||
| Total return (c)(d) | (32.65 | )%(e) | (12.20 | )% | 15.87 | % | 7.56 | % | 15.32 | % | 12.08 | % | |||||||||||||||
| Ratios to average net assets/Supplemental data: | |||||||||||||||||||||||||||
| Net expenses before interest expense | 0.25 | %(f) | 0.25 | % | 0.25 | % | 0.25 | % | 0.25 | % | 0.25 | % | |||||||||||||||
| Interest expense | - | - | %(g) | - | %(g) | - | %(g) | - | - | ||||||||||||||||||
| Net expenses | 0.25 | %(f) | 0.25 | % | 0.25 | % | 0.25 | % | 0.25 | % | 0.25 | % | |||||||||||||||
| Waiver/Reimbursement | 0.04 | %(f) | 0.05 | % | 0.05 | % | 0.06 | % | 0.04 | % | 0.05 | % | |||||||||||||||
| Net investment income | 2.42 | %(f) | 1.81 | % | 1.73 | % | 1.70 | % | 1.91 | % | 1.43 | % | |||||||||||||||
| Portfolio turnover rate | 26 | %(e) | 49 | % | 45 | % | 66 | % | 49 | % | 60 | % | |||||||||||||||
| Net assets, end of period (000's) | $ | 106,735 | $ | 165,206 | $ | 222,698 | $ | 100,973 | $ | 91,633 | $ | 98,247 | |||||||||||||||
(a) Per share data was calculated using the average shares outstanding during the period.
(b) Net investment income per share reflects a special dividend. The effect of this dividend amounted to $0.04 per share.
(c) Total return at net asset value assuming all distributions reinvested.
(d) Had the investment advisor and/or any of its affiliates not waived fees or reimbursed a portion of expenses, total return would have been reduced.
(e) Not annualized.
(f) Annualized.
(g) Rounds to less than 0.01%.
See Accompanying Notes to Financial Statements.
37
CMG LARGE CAP GROWTH FUND
A Portfolio of Columbia Funds Institutional Trust
FINANCIAL HIGHLIGHTS
(For a Share Outstanding Throughout Each Period)
| (Unaudited) Six Months Ended January 31, | Year Ended July 31, | Period Ended July 31, | |||||||||||||||||||||||||
| 2009 | 2008 | 2007 | 2006 | 2005 | 2004 (a) | ||||||||||||||||||||||
| Net asset value, beginning of period | $ | 11.16 | $ | 12.51 | $ | 11.12 | $ | 11.65 | $ | 10.25 | $ | 10.00 | |||||||||||||||
| Income from investment operations: | |||||||||||||||||||||||||||
| Net investment income (b) | 0.05 | 0.07 | 0.08 | 0.07 | 0.12 | (c) | 0.03 | ||||||||||||||||||||
| Net realized and unrealized gain (loss) on investments | (4.04 | ) | (0.42 | ) | 2.08 | 0.14 | 1.37 | 0.23 | |||||||||||||||||||
| Total from investment operations | (3.99 | ) | (0.35 | ) | 2.16 | 0.21 | 1.49 | 0.26 | |||||||||||||||||||
| Less distributions to shareholders: | |||||||||||||||||||||||||||
| From net investment income | (0.08 | ) | (0.07 | ) | (0.08 | ) | (0.08 | ) | (0.09 | ) | (0.01 | ) | |||||||||||||||
| From net realized gains | - | (0.93 | ) | (0.69 | ) | (0.66 | ) | - | - | ||||||||||||||||||
| Total distributions to shareholders | (0.08 | ) | (1.00 | ) | (0.77 | ) | (0.74 | ) | (0.09 | ) | (0.01 | ) | |||||||||||||||
| Net asset value, end of period | $ | 7.09 | $ | 11.16 | $ | 12.51 | $ | 11.12 | $ | 11.65 | $ | 10.25 | |||||||||||||||
| Total return (d)(e) | (35.79 | )%(f) | (3.57 | )% | 19.77 | % | 1.63 | % | 14.55 | % | 2.57 | %(f) | |||||||||||||||
| Ratios to average net assets/Supplemental data: | |||||||||||||||||||||||||||
| Net expenses before interest expense | 0.50 | %(g) | 0.50 | % | 0.50 | % | 0.50 | % | 0.50 | % | 0.50 | %(g) | |||||||||||||||
| Interest expense | - | - | %(h) | - | - | %(h) | - | - | |||||||||||||||||||
| Net expenses | 0.50 | %(g) | 0.50 | % | 0.50 | % | 0.50 | % | 0.50 | % | 0.50 | %(g) | |||||||||||||||
| Waiver/Reimbursement | 0.14 | %(g) | 0.15 | % | 0.16 | % | 0.13 | % | 0.07 | % | 0.14 | %(g) | |||||||||||||||
| Net investment income | 0.97 | %(g) | 0.62 | % | 0.63 | % | 0.62 | % | 1.07 | % | 0.31 | %(g) | |||||||||||||||
| Portfolio turnover rate | 79 | %(f) | 161 | % | 179 | % | 180 | % | 120 | % | 114 | %(f) | |||||||||||||||
| Net assets, end of period (000's) | $ | 37,611 | $ | 51,230 | $ | 58,978 | $ | 35,765 | $ | 40,312 | $ | 40,684 | |||||||||||||||
(a) The Fund commenced investment operations on September 10, 2003. Per share data, total return and portfolio turnover rate reflect activity from that date.
(b) Per share data was calculated using the average shares outstanding during the period.
(c) Net investment income per share reflects a special dividend. The effect of this dividend amounted to $0.05 per share.
(d) Total return at net asset value assuming all distributions reinvested.
(e) Had the investment advisor and/or any of its affiliates not waived fees or reimbursed a portion of expenses, total return would have been reduced.
(f) Not annualized.
(g) Annualized.
(h) Rounds to less than 0.01%.
See Accompanying Notes to Financial Statements.
38
CMG LARGE CAP VALUE FUND
A Portfolio of Columbia Funds Institutional Trust
FINANCIAL HIGHLIGHTS
(For a Share Outstanding Throughout Each Period)
| (Unaudited) Six Months Ended January 31, | Year Ended July 31, | Period Ended July 31, | |||||||||||||||||||||||||
| 2009 | 2008 | 2007 | 2006 | 2005 | 2004 (a) | ||||||||||||||||||||||
| Net asset value, beginning of period | $ | 9.36 | $ | 12.30 | $ | 11.89 | $ | 12.54 | $ | 11.09 | $ | 10.00 | |||||||||||||||
| Income from investment operations: | |||||||||||||||||||||||||||
| Net investment income (b) | 0.10 | 0.23 | 0.22 | 0.22 | 0.24 | 0.18 | |||||||||||||||||||||
| Net realized and unrealized gain (loss) on investments and written options | (3.18 | ) | (1.83 | ) | 1.38 | 0.92 | 1.46 | 0.93 | |||||||||||||||||||
| Total from investment operations | (3.08 | ) | (1.60 | ) | 1.60 | 1.14 | 1.70 | 1.11 | |||||||||||||||||||
| Less distributions to shareholders: | |||||||||||||||||||||||||||
| From net investment income | (0.13 | ) | (0.22 | ) | (0.22 | ) | (0.28 | ) | (0.22 | ) | (0.02 | ) | |||||||||||||||
| From net realized gains | - | (1.12 | ) | (0.97 | ) | (1.51 | ) | (0.03 | ) | - | |||||||||||||||||
| Total distributions to shareholders | (0.13 | ) | (1.34 | ) | (1.19 | ) | (1.79 | ) | (0.25 | ) | (0.02 | ) | |||||||||||||||
| Net asset value, end of period | $ | 6.15 | $ | 9.36 | $ | 12.30 | $ | 11.89 | $ | 12.54 | $ | 11.09 | |||||||||||||||
| Total return (c)(d) | (33.04 | )%(e) | (14.50 | )% | 13.69 | % | 9.85 | %(f) | 15.41 | %(g) | 11.15 | %(e) | |||||||||||||||
| Ratios to average net assets/Supplemental data: | |||||||||||||||||||||||||||
| Net expenses | 0.50 | %(h) | 0.50 | % | 0.50 | % | 0.50 | % | 0.50 | % | 0.50 | %(h) | |||||||||||||||
| Waiver/Reimbursement | 0.18 | %(h) | 0.20 | % | 0.18 | % | 0.13 | % | 0.07 | % | 0.14 | %(h) | |||||||||||||||
| Net investment income | 2.55 | %(h) | 2.09 | % | 1.78 | % | 1.78 | % | 1.99 | % | 1.86 | %(h) | |||||||||||||||
| Portfolio turnover rate | 36 | %(e) | 57 | % | 92 | % | 97 | % | 45 | % | 46 | %(e) | |||||||||||||||
| Net assets, end of period (000's) | $ | 25,311 | $ | 37,741 | $ | 44,830 | $ | 37,280 | $ | 38,731 | $ | 47,855 | |||||||||||||||
(a) The Fund commenced investment operations on September 10, 2003. Per share data, total return and portfolio turnover rate reflect activity from that date.
(b) Per share data was calculated using the average shares outstanding during the period.
(c) Total return at net asset value assuming all distributions reinvested.
(d) Had the investment advisor and/or any of its affiliates not waived fees or reimbursed a portion of expenses, total return would have been reduced.
(e) Not annualized.
(f) Total return includes a voluntary reimbursement by the investment advisor for a realized investment loss due to a trading error. This reimbursement had an impact of less than 0.01% on the Fund's total return.
(g) Total return includes a reimbursement of loss experienced by the Fund due to a compliance violation. The reimbursement had an impact of less then 0.01% on the Fund's total return.
(h) Annualized.
See Accompanying Notes to Financial Statements.
39
CMG MID CAP GROWTH FUND
A Portfolio of Columbia Funds Instituional Trust
FINANCIAL HIGHLIGHTS
(For a Share Outstanding Throughout Each Period)
| (Unaudited) Six Months Ended January 31, | Year Ended July 31, | ||||||||||||||||||||||||||
| 2009 | 2008 | 2007 | 2006 | 2005 | 2004 | ||||||||||||||||||||||
| Net asset value, beginning of period | $ | 13.88 | $ | 16.48 | $ | 14.98 | $ | 14.15 | $ | 11.04 | $ | 10.93 | |||||||||||||||
| Income from investment operations: | |||||||||||||||||||||||||||
| Net investment income (loss) (a) | 0.01 | (0.01 | ) | 0.09 | 0.01 | (0.03 | ) | (0.05 | ) | ||||||||||||||||||
| Net realized and unrealized gain (loss) on investments, written options and foreign currency | (5.69 | ) | 0.06 | 3.21 | 1.20 | 3.14 | 0.17 | ||||||||||||||||||||
| Total from investment operations | (5.68 | ) | 0.05 | 3.30 | 1.21 | 3.11 | 0.12 | ||||||||||||||||||||
| Less distributions to shareholders: | |||||||||||||||||||||||||||
| From net investment income | - | (0.06 | ) | (0.05 | ) | - | - | - | |||||||||||||||||||
| From net realized gains | (0.48 | ) | (2.59 | ) | (1.75 | ) | (0.38 | ) | - | (0.01 | ) | ||||||||||||||||
| Total distributions to shareholders | (0.48 | ) | (2.65 | ) | (1.80 | ) | (0.38 | ) | - | (0.01 | ) | ||||||||||||||||
| Net asset value, end of period | $ | 7.72 | $ | 13.88 | $ | 16.48 | $ | 14.98 | $ | 14.15 | $ | 11.04 | |||||||||||||||
| Total return (b)(c) | (41.03 | )%(d) | (0.67 | )% | 23.22 | % | 8.56 | % | 28.17 | % | 1.06 | % | |||||||||||||||
| Ratios to average net assets/Supplemental data: | |||||||||||||||||||||||||||
| Net expenses | 0.70 | %(e) | 0.70 | % | 0.70 | % | 0.70 | % | 0.70 | % | 0.70 | % | |||||||||||||||
| Waiver/Reimbursement | 0.31 | %(e) | 0.30 | % | 0.25 | % | 0.20 | % | 0.21 | % | 0.22 | % | |||||||||||||||
| Net investment income (loss) | 0.28 | %(e) | (0.08 | )% | 0.54 | % | 0.08 | % | (0.21 | )% | (0.38 | )% | |||||||||||||||
| Portfolio turnover rate | 65 | %(d) | 168 | % | 152 | % | 65 | % | 141 | % | 169 | % | |||||||||||||||
| Net assets, end of period (000's) | $ | 14,744 | $ | 25,012 | $ | 28,674 | $ | 23,636 | $ | 24,881 | $ | 19,284 | |||||||||||||||
(a) Per share data was calculated using the average shares outstanding during the period.
(b) Total return at net asset value assuming all distributions reinvested.
(c) Had the investment advisor and/or any of its affiliates not waived fees or reimbursed a portion of expenses, total return would have been reduced.
(d) Not annualized.
(e) Annualized.
See Accompanying Notes to Financial Statements.
40
CMG MID CAP VALUE FUND
A Portfolio of Columbia Funds Institutional Trust
FINANCIAL HIGHLIGHTS
(For a Share Outstanding Throughout Each Period)
| (Unaudited) Six Months Ended January 31, | Year Ended July 31, | ||||||||||||||||||||||||||
| 2009 | 2008 | 2007 | 2006 | 2005 | 2004 | ||||||||||||||||||||||
| Net asset value, beginning of period | $ | 10.90 | $ | 14.09 | $ | 14.02 | $ | 15.17 | $ | 12.58 | $ | 10.69 | |||||||||||||||
| Income from investment operations: | |||||||||||||||||||||||||||
| Net investment income (a) | 0.09 | 0.11 | 0.22 | 0.15 | 0.11 | 0.07 | |||||||||||||||||||||
| Net realized and unrealized gain (loss) on investments, written options and foreign currency | (4.30 | ) | (1.80 | ) | 2.34 | 1.14 | 2.66 | 1.84 | |||||||||||||||||||
| Total from investment operations | (4.21 | ) | (1.69 | ) | 2.56 | 1.29 | 2.77 | 1.91 | |||||||||||||||||||
| Less distributions to shareholders: | |||||||||||||||||||||||||||
| From net investment income | (0.09 | ) | (0.22 | ) | (0.18 | ) | (0.16 | ) | (0.09 | ) | (0.02 | ) | |||||||||||||||
| From net realized gains | (0.02 | ) | (1.28 | ) | (2.31 | ) | (2.28 | ) | (0.09 | ) | - | (b) | |||||||||||||||
| Total distributions to shareholders | (0.11 | ) | (1.50 | ) | (2.49 | ) | (2.44 | ) | (0.18 | ) | (0.02 | ) | |||||||||||||||
| Net asset value, end of period | $ | 6.58 | $ | 10.90 | $ | 14.09 | $ | 14.02 | $ | 15.17 | $ | 12.58 | |||||||||||||||
| Total return (c)(d) | (38.70 | )%(e) | (13.36 | )% | 19.50 | % | 9.30 | % | 22.14 | % | 17.91 | % | |||||||||||||||
| Ratios to average net assets/Supplemental data: | |||||||||||||||||||||||||||
| Net expenses | 0.70 | %(f) | 0.70 | % | 0.70 | % | 0.70 | % | 0.70 | % | 0.70 | % | |||||||||||||||
| Waiver/Reimbursement | 0.39 | %(f) | 0.44 | % | 0.36 | % | 0.25 | % | 0.19 | % | 0.20 | % | |||||||||||||||
| Net investment income | 1.99 | %(f) | 0.85 | % | 1.49 | % | 1.02 | % | 0.78 | % | 0.54 | % | |||||||||||||||
| Portfolio turnover rate | 20 | %(e) | 51 | % | 63 | % | 59 | % | 59 | % | 9 | % | |||||||||||||||
| Net assets, end of period (000's) | $ | 12,926 | $ | 17,079 | $ | 19,296 | $ | 17,762 | $ | 21,277 | $ | 21,994 | |||||||||||||||
(a) Per share data was calculated using the average shares outstanding during the period.
(b) Rounds to less than $0.01 per share.
(c) Total return at net asset value assuming all distributions reinvested.
(d) Had the investment advisor and/or any of its affiliates not waived fees or reimbursed a portion of expenses, total return would have been reduced.
(e) Not annualized.
(f) Annualized.
See Accompanying Notes to Financial Statements.
41
CMG SMALL CAP GROWTH FUND
A Portfolio of Columbia Funds Institutional Trust
FINANCIAL HIGHLIGHTS
(For a Share Outstanding Throughout Each Period)
| (Unaudited) Six Months Ended January 31, | Year Ended July 31, | ||||||||||||||||||||||||||
| 2009 | 2008 | 2007 | 2006 | 2005 | 2004 | ||||||||||||||||||||||
| Net asset value, beginning of period | $ | 1.71 | $ | 1.95 | $ | 2.03 | $ | 6.57 | $ | 5.07 | $ | 4.62 | |||||||||||||||
| Income from investment operations: | |||||||||||||||||||||||||||
| Net investment loss (a) | - | (b) | - | (b) | (0.01 | ) | (0.02 | ) | (0.03 | ) | (0.03 | ) | |||||||||||||||
| Net realized and unrealized gain (loss) on investments, written options and foreign currency | (0.70 | ) | 0.05 | 0.42 | 0.53 | (c) | 1.53 | 0.48 | |||||||||||||||||||
| Total from investment operations | (0.70 | ) | 0.05 | 0.41 | 0.51 | 1.50 | 0.45 | ||||||||||||||||||||
| Less distributions to shareholders: | |||||||||||||||||||||||||||
| From net realized gains | - | (0.28 | ) | (0.49 | ) | (5.05 | )(d) | - | - | ||||||||||||||||||
| From return of capital | - | (0.01 | ) | - | - | - | - | ||||||||||||||||||||
| Total distributions to shareholders | - | (0.29 | ) | (0.49 | ) | (5.05 | ) | - | - | ||||||||||||||||||
| Net asset value, end of period | $ | 1.01 | $ | 1.71 | $ | 1.95 | $ | 2.03 | $ | 6.57 | $ | 5.07 | |||||||||||||||
| Total return (e) | (40.94 | )%(f)(g) | 1.49 | %(g) | 22.69 | %(g) | 10.46 | %(g) | 29.59 | % | 9.74 | % | |||||||||||||||
| Ratios to average net assets/ Supplemental data: | |||||||||||||||||||||||||||
| Net expenses before interest expense (h) | 0.80 | %(i) | 0.80 | % | 0.80 | % | 1.09 | % | 0.85 | % | 0.79 | % | |||||||||||||||
| Interest expense | - | - | %(j) | - | %(j) | - | - | - | |||||||||||||||||||
| Net expenses (h) | 0.80 | %(i) | 0.80 | % | 0.80 | % | 1.09 | % | 0.85 | % | 0.79 | % | |||||||||||||||
| Waiver/Reimbursement | 0.36 | %(i) | 0.26 | % | 0.27 | % | 0.21 | % | - | - | |||||||||||||||||
| Net investment loss (h) | (0.28 | )%(i) | (0.21 | )% | (0.25 | )% | (0.88 | )% | (0.61 | )% | (0.62 | )% | |||||||||||||||
| Portfolio turnover rate | 79 | %(f) | 191 | % | 158 | % | 112 | % | 119 | % | 123 | % | |||||||||||||||
| Net assets, end of period (000's) | $ | 27,728 | $ | 40,818 | $ | 39,899 | $ | 40,183 | $ | 30,317 | $ | 292,028 | |||||||||||||||
(a) Per share data was calculated using the average shares outstanding during the period.
(b) Rounds to less than $0.01 per share.
(c) The amount shown for a share outstanding does not correspond with the aggregate gain (loss) on investments for the period due to timing of sales and repurchases of Fund shares in relation to fluctuating market values of the investments of the Fund.
(d) Capital gain distributions were declared after significant shareholder redemptions reduced the size of the Fund.
(e) Total return at net asset value assuming all distributions reinvested.
(f) Not annualized.
(g) Had the investment advisor and/or any of its affiliates not waived fees or reimbursed a portion of expenses, total return would have been reduced.
(h) The benefits derived from custody credits had an impact of less than 0.01%.
(i) Annualized.
(j) Rounds to less than 0.01%.
See Accompanying Notes to Financial Statements.
42
CMG SMALL CAP VALUE FUND
A Portfolio of Columbia Funds Institutional Trust
FINANCIAL HIGHLIGHTS
(For a Share Outstanding Throughout Each Period)
| (Unaudited) Six Months Ended January 31, | Year Ended July 31, | ||||||||||||||||||||||||||
| 2009 | 2008 | 2007 | 2006 | 2005 | 2004 | ||||||||||||||||||||||
| Net asset value, beginning of period | $ | 11.06 | $ | 13.94 | $ | 15.31 | $ | 16.06 | $ | 13.91 | $ | 11.29 | |||||||||||||||
| Income from investment operations: | |||||||||||||||||||||||||||
| Net investment income (a) | 0.07 | 0.08 | 0.11 | 0.09 | 0.11 | 0.11 | |||||||||||||||||||||
| Net realized and unrealized gain (loss) on investments and foreign currency | (3.68 | ) | (1.08 | ) | 1.82 | 1.06 | 3.11 | 2.79 | |||||||||||||||||||
| Total from investment operations | (3.61 | ) | (1.00 | ) | 1.93 | 1.15 | 3.22 | 2.90 | |||||||||||||||||||
| Less distributions to shareholders: | |||||||||||||||||||||||||||
| From net investment income | (0.04 | ) | (0.13 | ) | (0.12 | ) | (0.13 | ) | (0.10 | ) | (0.06 | ) | |||||||||||||||
| From net realized gains | (0.92 | ) | (1.75 | ) | (3.18 | ) | (1.77 | ) | (0.97 | ) | (0.22 | ) | |||||||||||||||
| Total distributions to shareholders | (0.96 | ) | (1.88 | ) | (3.30 | ) | (1.90 | ) | (1.07 | ) | (0.28 | ) | |||||||||||||||
| Net asset value, end of period | $ | 6.49 | $ | 11.06 | $ | 13.94 | $ | 15.31 | $ | 16.06 | $ | 13.91 | |||||||||||||||
| Total return (b)(c) | (33.44 | )%(d) | (7.73 | )% | 12.82 | % | 7.90 | %(e) | 23.57 | % | 25.79 | % | |||||||||||||||
| Ratios to average net assets/ Supplemental data: | |||||||||||||||||||||||||||
| Net expenses before interest expense | 0.80 | %(f) | 0.80 | % | 0.80 | % | 0.80 | % | 0.80 | % | 0.80 | % | |||||||||||||||
| Interest expense | - | %(f)(g) | 0.01 | % | 0.01 | % | - | %(g) | - | - | |||||||||||||||||
| Net expenses | 0.80 | %(f) | 0.81 | % | 0.81 | % | 0.80 | % | 0.80 | % | 0.80 | % | |||||||||||||||
| Waiver/Reimbursement | 0.26 | %(f) | 0.29 | % | 0.22 | % | 0.14 | % | 0.12 | % | 0.09 | % | |||||||||||||||
| Net investment income | 1.47 | %(f) | 0.67 | % | 0.75 | % | 0.60 | % | 0.77 | % | 0.82 | % | |||||||||||||||
| Portfolio turnover rate | 34 | %(d) | 49 | % | 50 | % | 37 | % | 41 | % | 53 | % | |||||||||||||||
| Net assets, end of period (000's) | $ | 24,324 | $ | 26,748 | $ | 31,952 | �� | $ | 33,439 | $ | 36,989 | $ | 40,356 | ||||||||||||||
(a) Per share data was calculated using the average shares outstanding during the period.
(b) Total return at net asset value assuming all distributions reinvested.
(c) Had the investment advisor and/or any of its affiliates not waived fees or reimbursed a portion of expenses, total return would have been reduced.
(d) Not annualized.
(e) Total return includes a voluntary reimbursement by the investment advisor for a realized investment loss due to a trading error. This reimbursement had an impact of less than 0.01% on the Fund's total return.
(f) Annualized.
(g) Rounds to less than 0.01%.
See Accompanying Notes to Financial Statements.
43
CMG SMALL/MID CAP FUND
A Portfolio of Columbia Funds Institutional Trust
FINANCIAL HIGHLIGHTS
(For a Share Outstanding Throughout Each Period)
| (Unaudited) Six Months Ended January 31, | Year Ended July 31, | ||||||||||||||||||||||||||
| 2009 | 2008 | 2007 | 2006 | 2005 | 2004 | ||||||||||||||||||||||
| Net asset value, beginning of period | $ | 4.00 | $ | 4.56 | $ | 11.24 | $ | 11.49 | $ | 8.77 | $ | 8.30 | |||||||||||||||
| Income from investment operations: | |||||||||||||||||||||||||||
| Net investment loss (a) | - | (b) | (0.01 | ) | - | (b) | (0.05 | ) | (0.04 | ) | (0.05 | ) | |||||||||||||||
| Net realized and unrealized gain (loss) on investments, written options and foreign currency | (1.69 | ) | 0.14 | 1.01 | 1.07 | 2.76 | 0.52 | ||||||||||||||||||||
| Total from investment operations | (1.69 | ) | 0.13 | 1.01 | 1.02 | 2.72 | 0.47 | ||||||||||||||||||||
| Less distributions to shareholders: | |||||||||||||||||||||||||||
| From net realized gains | - | (0.66 | ) | (7.69 | )(c) | (1.27 | ) | - | - | ||||||||||||||||||
| Return of capital | - | (0.03 | ) | - | - | - | - | ||||||||||||||||||||
| Total distributions to shareholders | - | (0.69 | ) | (7.69 | ) | (1.27 | ) | - | - | ||||||||||||||||||
| Net asset value, end of period | $ | 2.31 | $ | 4.00 | $ | 4.56 | $ | 11.24 | $ | 11.49 | $ | 8.77 | |||||||||||||||
| Total return (d)(e) | (42.25 | )%(f) | 2.12 | % | 21.66 | % | 9.17 | %(g) | 31.01 | % | 5.66 | % | |||||||||||||||
| Ratios to average net assets/Supplemental data: | |||||||||||||||||||||||||||
| Net expenses | 0.75 | %(h) | 0.75 | % | 0.75 | % | 0.75 | % | 0.75 | % | 0.75 | % | |||||||||||||||
| Waiver/Reimbursement | 0.76 | %(h) | 0.52 | % | 0.57 | % | 0.23 | % | 0.09 | % | 0.06 | % | |||||||||||||||
| Net investment loss | (0.24 | )%(h) | (0.22 | )% | (0.01 | )% | (0.45 | )% | (0.37 | )% | (0.49 | )% | |||||||||||||||
| Portfolio turnover rate | 73 | %(f) | 179 | % | 158 | % | 109 | % | 170 | % | 91 | % | |||||||||||||||
| Net assets, end of period (000's) | $ | 6,612 | $ | 11,474 | $ | 12,516 | $ | 8,773 | $ | 38,755 | $ | 50,662 | |||||||||||||||
(a) Per share data was calculated using the average shares outstanding during the period.
(b) Rounds to less than $0.01 per share.
(c) Capital gain distributions were declared after significant shareholder redemptions reduced the size of the Fund in the prior year.
(d) Total return at net asset value assuming all distributions reinvested.
(e) Had the investment advisor and/or any of its affiliates not waived fees or reimbursed a portion of expenses, total return would have been reduced.
(f) Not annualized.
(g) Total return includes a voluntary reimbursement by the investment advisor for a realized investment loss due to a trading error. This reimbursement had an impact of less than 0.01% on the Fund's total return.
(h) Annualized.
See Accompanying Notes to Financial Statements.
44
CMG INTERNATIONAL STOCK FUND
A Portfolio of Columbia Funds Institutional Trust
FINANCIAL HIGHLIGHTS
(For a Share Outstanding Throughout Each Period)
| (Unaudited) Six Months Ended January 31, | Year Ended July 31, | ||||||||||||||||||||||||||
| 2009 | 2008 | 2007 | 2006 | 2005 | 2004 | ||||||||||||||||||||||
| Net asset value, beginning of period | $ | 10.65 | $ | 14.60 | $ | 14.63 | $ | 13.76 | $ | 12.17 | $ | 10.33 | |||||||||||||||
| Income from investment operations: | |||||||||||||||||||||||||||
| Net investment income (a) | 0.07 | 0.31 | (b) | 0.27 | 0.26 | 0.19 | 0.14 | ||||||||||||||||||||
| Net realized and unrealized gain (loss) on investments, written options, foreign currency and foreign capital gains tax | (4.85 | ) | (2.14 | ) | 2.98 | 2.85 | 1.79 | 1.76 | |||||||||||||||||||
| Total from investment operations | (4.78 | ) | (1.83 | ) | 3.25 | 3.11 | 1.98 | 1.90 | |||||||||||||||||||
| Less distributions to shareholders: | |||||||||||||||||||||||||||
| From net investment income | (0.07 | ) | (0.47 | ) | (0.36 | ) | (0.27 | ) | (0.10 | ) | (0.06 | ) | |||||||||||||||
| From net realized gains | (0.16 | ) | (1.65 | ) | (2.92 | ) | (1.97 | ) | (0.29 | ) | - | ||||||||||||||||
| Total distributions to shareholders | (0.23 | ) | (2.12 | ) | (3.28 | ) | (2.24 | ) | (0.39 | ) | (0.06 | ) | |||||||||||||||
| Net asset value, end of period | $ | 5.64 | $ | 10.65 | $ | 14.60 | $ | 14.63 | $ | 13.76 | $ | 12.17 | |||||||||||||||
| Total return (c)(d) | (45.12 | )%(e) | (13.82 | )%(f) | 24.77 | %(f) | 24.31 | % | 16.31 | % | 18.40 | % | |||||||||||||||
| Ratios to average net assets/ Supplemental data: | |||||||||||||||||||||||||||
| Net expenses before interest expense | 0.75 | %(g) | 0.75 | % | 0.75 | % | 0.75 | % | 0.75 | % | 0.75 | % | |||||||||||||||
| Interest expense | - | %(g)(h) | - | %(h) | 0.01 | % | 0.01 | % | - | - | |||||||||||||||||
| Net expenses | 0.75 | %(g) | 0.75 | % | 0.76 | % | 0.76 | % | 0.75 | % | 0.75 | % | |||||||||||||||
| Waiver/Reimbursement | 0.12 | %(g) | 0.08 | % | 0.07 | % | 0.06 | % | 0.03 | % | 0.05 | % | |||||||||||||||
| Net investment income | 1.93 | %(g) | 2.51 | % | 1.87 | % | 1.84 | % | 1.47 | % | 1.16 | % | |||||||||||||||
| Portfolio turnover rate | 64 | %(e) | 62 | % | 80 | % | 86 | % | 68 | % | 91 | % | |||||||||||||||
| Net assets, end of period (000's) | $ | 52,201 | $ | 91,740 | $ | 120,314 | $ | 105,738 | $ | 136,144 | $ | 152,251 | |||||||||||||||
(a) Per share data was calculated using the average shares outstanding during the period.
(b) Net investment income per share reflects a special dividend. The effect of this dividend amounted to $0.03 per share.
(c) Total return at net asset value assuming all distributions reinvested.
(d) Had the investment advisor and/or any of its affiliates not waived fees or reimbursed a portion of expenses, total return would have been reduced.
(e) Not annualized.
(f) Total return includes a voluntary reimburstment by the investment advisor for a realized loss due to a trading error. This reimbursement had an impact of less than 0.01% on the Fund's total return.
(g) Annualized.
(h) Rounds to less than 0.01%.
See Accompanying Notes to Financial Statements.
45
CMG ENHANCED S&P 500® INDEX FUND
A Portfolio of Columbia Funds Institutional Trust
SCHEDULE OF INVESTMENTS
January 31, 2009 (Unaudited)
| Shares | Value | ||||||||||
| Common Stocks (96.4%) | |||||||||||
| Consumer Discretionary (8.2%) | |||||||||||
| Diversified Consumer Services (1.2%) | |||||||||||
| Apollo Group, Inc., Class A (a) | 8,600 | $ | 700,556 | ||||||||
| H&R Block, Inc. | 30,000 | 621,900 | |||||||||
| 1,322,456 | |||||||||||
| Hotels, Restaurants & Leisure (1.3%) | |||||||||||
| Darden Restaurants, Inc. | 5,300 | 138,966 | |||||||||
| McDonald's Corp. | 16,600 | 963,132 | |||||||||
| Starbucks Corp. (a) | 21,200 | 200,128 | |||||||||
| Yum! Brands, Inc. | 1,900 | 54,378 | |||||||||
| 1,356,604 | |||||||||||
| Media (2.2%) | |||||||||||
| Comcast Corp., Class A | 12,300 | 180,195 | |||||||||
| DIRECTV Group, Inc. (a) | 36,200 | 792,780 | |||||||||
| Time Warner, Inc. | 98,200 | 916,206 | |||||||||
| Walt Disney Co. | 21,200 | 438,416 | |||||||||
| 2,327,597 | |||||||||||
| Multiline Retail (0.3%) | |||||||||||
| Big Lots, Inc. (a) | 18,500 | 248,825 | |||||||||
| Nordstrom, Inc. | 2,400 | 30,456 | |||||||||
| Target Corp. | 400 | 12,480 | |||||||||
| 291,761 | |||||||||||
| Specialty Retail (2.1%) | |||||||||||
| Autozone, Inc. (a) | 2,100 | 279,069 | |||||||||
| Best Buy Co., Inc. | 17,400 | 487,548 | |||||||||
| Gap, Inc. | 59,700 | 673,416 | |||||||||
| Home Depot, Inc. | 25,000 | 538,250 | |||||||||
| Limited Brands, Inc. | 1,100 | 8,712 | |||||||||
| Lowe's Companies, Inc. | 10,400 | 190,008 | |||||||||
| Sherwin-Williams Co. | 200 | 9,550 | |||||||||
| TJX Companies, Inc. | 5,100 | 99,042 | |||||||||
| 2,285,595 | |||||||||||
| Textiles, Apparel & Luxury Goods (1.1%) | |||||||||||
| Coach, Inc. (a) | 53,200 | 776,720 | |||||||||
| NIKE, Inc., Class B | 1,800 | 81,450 | |||||||||
| Polo Ralph Lauren Corp. | 6,400 | 262,592 | |||||||||
| 1,120,762 | |||||||||||
| 8,704,775 | |||||||||||
| Shares | Value | ||||||||||
| Consumer Staples (12.3%) | |||||||||||
| Beverages (1.9%) | |||||||||||
| Coca-Cola Co. | 17,300 | $ | 739,056 | ||||||||
| PepsiCo, Inc. | 24,100 | 1,210,543 | |||||||||
| 1,949,599 | |||||||||||
| Food & Staples Retailing (2.4%) | |||||||||||
| CVS Caremark Corp. | 17,000 | 456,960 | |||||||||
| Kroger Co. | 14,400 | 324,000 | |||||||||
| SUPERVALU, Inc. | 27,100 | 475,334 | |||||||||
| Sysco Corp. | 5,600 | 124,824 | |||||||||
| Wal-Mart Stores, Inc. | 25,000 | 1,178,000 | |||||||||
| Walgreen Co. | 600 | 16,446 | |||||||||
| 2,575,564 | |||||||||||
| Food Products (0.9%) | |||||||||||
| Archer-Daniels-Midland Co. | 13,700 | 375,106 | |||||||||
| General Mills, Inc. | 4,000 | 236,600 | |||||||||
| Kraft Foods, Inc., Class A | 11,700 | 328,185 | |||||||||
| 939,891 | |||||||||||
| Household Products (3.9%) | |||||||||||
| Clorox Co. | 3,200 | 160,480 | |||||||||
| Colgate-Palmolive Co. | 4,600 | 299,184 | |||||||||
| Kimberly-Clark Corp. | 20,000 | 1,029,400 | |||||||||
| Procter & Gamble Co. | 48,900 | 2,665,050 | |||||||||
| 4,154,114 | |||||||||||
| Personal Products (0.3%) | |||||||||||
| Avon Products, Inc. | 3,200 | 65,440 | |||||||||
| Estee Lauder Companies, Inc., Class A | 10,700 | 280,875 | |||||||||
| 346,315 | |||||||||||
| Tobacco (2.9%) | |||||||||||
| Altria Group, Inc. | 80,300 | 1,328,162 | |||||||||
| Philip Morris International, Inc. | 34,800 | 1,292,820 | |||||||||
| Reynolds American, Inc. | 13,100 | 500,158 | |||||||||
| 3,121,140 | |||||||||||
| 13,086,623 | |||||||||||
| Energy (13.4%) | |||||||||||
| Energy Equipment & Services (0.5%) | |||||||||||
| BJ Services Co. | 1,856 | 20,416 | |||||||||
| ENSCO International, Inc. | 9,300 | 254,448 | |||||||||
| Noble Corp. | 3,500 | 95,025 | |||||||||
See Accompanying Notes to Financial Statements.
46
CMG ENHANCED S&P 500® INDEX FUND
A Portfolio of Columbia Funds Institutional Trust
SCHEDULE OF INVESTMENTS
January 31, 2009 (Unaudited)
| Shares | Value | ||||||||||
| Common Stocks (continued) | |||||||||||
| Energy Equipment & Services (continued) | |||||||||||
| Schlumberger Ltd. | 5,600 | $ | 228,536 | ||||||||
| 598,425 | |||||||||||
| Oil, Gas & Consumable Fuels (12.9%) | |||||||||||
| Anadarko Petroleum Corp. | 9,000 | 330,660 | |||||||||
| Apache Corp. | 7,800 | 585,000 | |||||||||
| Chevron Corp. | 34,300 | 2,418,836 | |||||||||
| ConocoPhillips | 30,000 | 1,425,900 | |||||||||
| Devon Energy Corp. | 4,400 | 271,040 | |||||||||
| EOG Resources, Inc. | 5,600 | 379,512 | |||||||||
| Exxon Mobil Corp. | 72,300 | 5,529,504 | |||||||||
| Hess Corp. | 7,300 | 405,953 | |||||||||
| Marathon Oil Corp. | 15,300 | 416,619 | |||||||||
| Massey Energy Co. | 15,400 | 233,772 | |||||||||
| Murphy Oil Corp. | 2,700 | 119,286 | |||||||||
| Occidental Petroleum Corp. | 19,100 | 1,041,905 | |||||||||
| Valero Energy Corp. | 24,900 | 600,588 | |||||||||
| 13,758,575 | |||||||||||
| 14,357,000 | |||||||||||
| Financials (10.7%) | |||||||||||
| Capital Markets (2.4%) | |||||||||||
| Bank of New York Mellon Corp. | 15,300 | 393,822 | |||||||||
| Charles Schwab Corp. | 31,200 | 424,008 | |||||||||
| Franklin Resources, Inc. | 3,700 | 179,154 | |||||||||
| Goldman Sachs Group, Inc. | 11,200 | 904,176 | |||||||||
| Morgan Stanley | 8,700 | 176,001 | |||||||||
| Northern Trust Corp. | 5,600 | 322,112 | |||||||||
| State Street Corp. | 8,200 | 190,814 | |||||||||
| 2,590,087 | |||||||||||
| Commercial Banks (1.6%) | |||||||||||
| BB&T Corp. | 11,000 | 217,690 | |||||||||
| PNC Financial Services Group, Inc. | 1,300 | 42,276 | |||||||||
| U.S. Bancorp | 28,700 | 425,908 | |||||||||
| Wells Fargo & Co. | 52,700 | 996,030 | |||||||||
| 1,681,904 | |||||||||||
| Consumer Finance (0.3%) | |||||||||||
| American Express Co. | 14,600 | 244,258 | |||||||||
| Capital One Financial Corp. | 6,100 | 96,624 | |||||||||
| 340,882 | |||||||||||
| Diversified Financial Services (1.3%) | |||||||||||
| Citigroup, Inc. | 1,500 | 5,325 | |||||||||
| Shares | Value | ||||||||||
| Diversified Financial Services (continued) | |||||||||||
| JPMorgan Chase & Co. | 52,300 | $ | 1,334,173 | ||||||||
| Moody's Corp. | 1,800 | 38,556 | |||||||||
| 1,378,054 | |||||||||||
| Insurance (2.7%) | |||||||||||
| AFLAC, Inc. | 8,000 | 185,680 | |||||||||
| Allstate Corp. | 10,700 | 231,869 | |||||||||
| Chubb Corp. | 13,500 | 574,830 | |||||||||
| Loews Corp. | 10,300 | 251,320 | |||||||||
| MetLife, Inc. | 20,600 | 591,838 | |||||||||
| Prudential Financial, Inc. | 12,500 | 321,875 | |||||||||
| Travelers Companies, Inc. | 19,000 | 734,160 | |||||||||
| 2,891,572 | |||||||||||
| Real Estate Investment Trusts (REITs) (2.2%) | |||||||||||
| AvalonBay Communities, Inc. | 500 | 26,724 | |||||||||
| Boston Properties, Inc. | 1,100 | 47,630 | |||||||||
| Equity Residential Property Trust | 23,000 | 550,390 | |||||||||
| HCP, Inc. | 4,900 | 114,366 | |||||||||
| Host Hotels & Resorts, Inc. | 35,000 | 188,300 | |||||||||
| Kimco Realty Corp. | 11,200 | 161,056 | |||||||||
| Plum Creek Timber Co., Inc. | 800 | 24,616 | |||||||||
| Public Storage | 12,600 | 779,562 | |||||||||
| Simon Property Group, Inc. | 7,900 | 339,542 | |||||||||
| Vornado Realty Trust | 3,100 | 157,511 | |||||||||
| 2,389,697 | |||||||||||
| Thrifts & Mortgage Finance (0.2%) | |||||||||||
| Hudson City Bancorp, Inc. | 16,300 | 189,080 | |||||||||
| 11,461,276 | |||||||||||
| Health Care (15.4%) | |||||||||||
| Biotechnology (3.2%) | |||||||||||
| Amgen, Inc. (a) | 28,800 | 1,579,680 | |||||||||
| Biogen Idec, Inc. (a) | 23,400 | 1,138,410 | |||||||||
| Genzyme Corp. (a) | 400 | 27,568 | |||||||||
| Gilead Sciences, Inc. (a) | 13,300 | 675,241 | |||||||||
| 3,420,899 | |||||||||||
| Health Care Equipment & Supplies (4.1%) | |||||||||||
| Baxter International, Inc. | 6,900 | 404,685 | |||||||||
| Becton Dickinson & Co. | 2,700 | 196,209 | |||||||||
| Boston Scientific Corp. (a) | 219,700 | 1,948,739 | |||||||||
| Covidien Ltd. | 6,600 | 253,044 | |||||||||
| Medtronic, Inc. | 42,600 | 1,426,674 | |||||||||
See Accompanying Notes to Financial Statements.
47
CMG ENHANCED S&P 500® INDEX FUND
A Portfolio of Columbia Funds Institutional Trust
SCHEDULE OF INVESTMENTS
January 31, 2009 (Unaudited)
| Shares | Value | ||||||||||
| Common Stocks (continued) | |||||||||||
| Health Care Equipment & Supplies (continued) | |||||||||||
| St. Jude Medical, Inc. (a) | 800 | $ | 29,096 | ||||||||
| Zimmer Holdings, Inc. (a) | 2,600 | 94,640 | |||||||||
| 4,353,087 | |||||||||||
| Health Care Providers & Services (0.4%) | |||||||||||
| Aetna, Inc. | 8,400 | 260,400 | |||||||||
| UnitedHealth Group, Inc. | 2,600 | 73,658 | |||||||||
| WellPoint, Inc. (a) | 2,100 | 87,045 | |||||||||
| 421,103 | |||||||||||
| Life Sciences Tools & Services (0.1%) | |||||||||||
| Thermo Fisher Scientific, Inc. (a) | 3,300 | 118,569 | |||||||||
| Pharmaceuticals (7.6%) | |||||||||||
| Abbott Laboratories | 7,800 | 432,432 | |||||||||
| Bristol-Myers Squibb Co. | 9,200 | 196,972 | |||||||||
| Eli Lilly & Co. | 25,700 | 946,274 | |||||||||
| Forest Laboratories, Inc. (a) | 21,900 | 548,376 | |||||||||
| Johnson & Johnson | 42,700 | 2,463,363 | |||||||||
| King Pharmaceuticals, Inc. (a) | 1,000 | 8,740 | |||||||||
| Merck & Co., Inc. | 17,600 | 502,480 | |||||||||
| Mylan, Inc. (a) | 70,300 | 796,499 | |||||||||
| Pfizer, Inc. | 118,100 | 1,721,898 | |||||||||
| Schering-Plough Corp. | 9,100 | 159,796 | |||||||||
| Wyeth | 7,100 | 305,087 | |||||||||
| 8,081,917 | |||||||||||
| 16,395,575 | |||||||||||
| Industrials (10.2%) | |||||||||||
| Aerospace & Defense (2.5%) | |||||||||||
| Boeing Co. | 17,700 | 748,887 | |||||||||
| Goodrich Corp. | 400 | 15,464 | |||||||||
| Honeywell International, Inc. | 12,400 | 406,844 | |||||||||
| Lockheed Martin Corp. | 1,300 | 106,652 | |||||||||
| Northrop Grumman Corp. | 15,500 | 745,860 | |||||||||
| United Technologies Corp. | 12,600 | 604,674 | |||||||||
| 2,628,381 | |||||||||||
| Air Freight & Logistics (1.4%) | |||||||||||
| C.H. Robinson Worldwide, Inc. | 100 | 4,598 | |||||||||
| FedEx Corp. | 12,800 | 652,032 | |||||||||
| United Parcel Service, Inc., Class B | 20,600 | 875,294 | |||||||||
| 1,531,924 | |||||||||||
| Shares | Value | ||||||||||
| Commercial Services & Supplies (0.1%) | |||||||||||
| R.R. Donnelley & Sons Co. | 11,500 | $ | 112,240 | ||||||||
| Construction & Engineering (0.3%) | |||||||||||
| Fluor Corp. | 7,800 | 303,420 | |||||||||
| Jacobs Engineering Group, Inc. (a) | 400 | 15,468 | |||||||||
| 318,888 | |||||||||||
| Electrical Equipment (0.6%) | |||||||||||
| Emerson Electric Co. | 13,300 | 434,910 | |||||||||
| Rockwell Automation, Inc. | 8,200 | 213,528 | |||||||||
| 648,438 | |||||||||||
| Industrial Conglomerates (1.6%) | |||||||||||
| 3M Co. | 11,400 | 613,206 | |||||||||
| General Electric Co. | 74,400 | 902,472 | |||||||||
| Tyco International Ltd. | 9,300 | 195,486 | |||||||||
| 1,711,164 | |||||||||||
| Machinery (0.9%) | |||||||||||
| Caterpillar, Inc. | 10,300 | 317,755 | |||||||||
| Cummins, Inc. | 20,100 | 481,998 | |||||||||
| Manitowoc Co., Inc. | 11,000 | 60,500 | |||||||||
| Parker Hannifin Corp. | 1,500 | 57,315 | |||||||||
| 917,568 | |||||||||||
| Professional Services (0.1%) | |||||||||||
| Robert Half International, Inc. | 3,600 | 61,020 | |||||||||
| Road & Rail (2.5%) | |||||||||||
| Burlington Northern Santa Fe Corp. | 3,500 | 231,875 | |||||||||
| CSX Corp. | 21,300 | 616,848 | |||||||||
| Norfolk Southern Corp. | 8,000 | 306,880 | |||||||||
| Ryder System, Inc. | 25,500 | 861,390 | |||||||||
| Union Pacific Corp. | 15,900 | 696,261 | |||||||||
| 2,713,254 | |||||||||||
| Trading Companies & Distributors (0.2%) | |||||||||||
| W.W. Grainger, Inc. | 3,100 | 226,145 | |||||||||
| 10,869,022 | |||||||||||
See Accompanying Notes to Financial Statements.
48
CMG ENHANCED S&P 500® INDEX FUND
A Portfolio of Columbia Funds Institutional Trust
SCHEDULE OF INVESTMENTS
January 31, 2009 (Unaudited)
| Shares | Value | ||||||||||
| Common Stocks (continued) | |||||||||||
| Information Technology (15.6%) | |||||||||||
| Communications Equipment (1.8%) | |||||||||||
| Cisco Systems, Inc. (a) | 94,500 | $ | 1,414,665 | ||||||||
| QUALCOMM, Inc. | 14,500 | 500,975 | |||||||||
| 1,915,640 | |||||||||||
| Computers & Peripherals (4.2%) | |||||||||||
| Apple, Inc. (a) | 3,100 | 279,403 | |||||||||
| Dell, Inc. (a) | 30,500 | 289,750 | |||||||||
| Hewlett-Packard Co. | 44,000 | 1,529,000 | |||||||||
| International Business Machines Corp. | 22,700 | 2,080,455 | |||||||||
| Lexmark International, Inc., Class A (a) | 11,000 | 260,480 | |||||||||
| 4,439,088 | |||||||||||
| Internet Software & Services (1.2%) | |||||||||||
| eBay, Inc. (a) | 65,800 | 790,916 | |||||||||
| Google, Inc., Class A (a) | 900 | 304,677 | |||||||||
| Yahoo!, Inc. (a) | 13,100 | 153,663 | |||||||||
| 1,249,256 | |||||||||||
| IT Services (1.1%) | |||||||||||
| Computer Sciences Corp. (a) | 10,900 | 401,556 | |||||||||
| MasterCard, Inc., Class A | 900 | 122,202 | |||||||||
| Total System Services, Inc. | 28,000 | 354,480 | |||||||||
| Western Union Co. | 21,600 | 295,056 | |||||||||
| 1,173,294 | |||||||||||
| Semiconductors & Semiconductor Equipment (1.9%) | |||||||||||
| Intel Corp. | 86,500 | 1,115,850 | |||||||||
| LSI Corp. (a) | 42,800 | 136,104 | |||||||||
| National Semiconductor Corp. | 800 | 8,112 | |||||||||
| Texas Instruments, Inc. | 54,900 | 820,755 | |||||||||
| 2,080,821 | |||||||||||
| Software (5.4%) | |||||||||||
| Adobe Systems, Inc. (a) | 19,000 | 366,890 | |||||||||
| Autodesk, Inc. (a) | 19,100 | 316,296 | |||||||||
| CA, Inc. | 3,700 | 66,563 | |||||||||
| Compuware Corp. (a) | 16,700 | 108,550 | |||||||||
| Microsoft Corp. (b) | 144,500 | 2,470,950 | |||||||||
| Oracle Corp. (a) | 73,600 | 1,238,688 | |||||||||
| Symantec Corp. (a) | 77,300 | 1,185,009 | |||||||||
| 5,752,946 | |||||||||||
| 16,611,045 | |||||||||||
| Shares | Value | ||||||||||
| Materials (2.8%) | |||||||||||
| Chemicals (2.1%) | |||||||||||
| CF Industries Holdings, Inc. | 14,100 | $ | 662,700 | ||||||||
| Dow Chemical Co. | 34,000 | 394,060 | |||||||||
| E.I. Du Pont de Nemours & Co. | 17,700 | 406,392 | |||||||||
| Eastman Chemical Co. | 2,900 | 75,255 | |||||||||
| Monsanto Co. | 9,100 | 692,146 | |||||||||
| 2,230,553 | |||||||||||
| Construction Materials (0.1%) | |||||||||||
| Vulcan Materials Co. | 1,100 | 54,406 | |||||||||
| Containers & Packaging (0.5%) | |||||||||||
| Ball Corp. | 1,400 | 53,676 | |||||||||
| Sealed Air Corp. | 41,900 | 567,745 | |||||||||
| 621,421 | |||||||||||
| Paper & Forest Products (0.1%) | |||||||||||
| International Paper Co. | 6,600 | 60,192 | |||||||||
| 2,966,572 | |||||||||||
| Telecommunication Services (3.5%) | |||||||||||
| Diversified Telecommunication Services (3.4%) | |||||||||||
| AT&T, Inc. | 88,300 | 2,173,946 | |||||||||
| CenturyTel, Inc. | 300 | 8,142 | |||||||||
| Qwest Communications International, Inc. | 9,700 | 31,234 | |||||||||
| Verizon Communications, Inc. | 48,100 | 1,436,747 | |||||||||
| 3,650,069 | |||||||||||
| Wireless Telecommunication Services (0.1%) | |||||||||||
| American Tower Corp., Class A (a) | 1,500 | 45,510 | |||||||||
| Sprint Nextel Corp. (a) | 31,200 | 75,816 | |||||||||
| 121,326 | |||||||||||
| 3,771,395 | |||||||||||
| Utilities (4.3%) | |||||||||||
| Electric Utilities (3.1%) | |||||||||||
| American Electric Power Co., Inc. | 7,500 | 235,125 | |||||||||
| Duke Energy Corp. | 4,600 | 69,690 | |||||||||
| Edison International | 22,100 | 719,797 | |||||||||
| Entergy Corp. | 5,100 | 389,436 | |||||||||
| Exelon Corp. | 6,600 | 357,852 | |||||||||
| FirstEnergy Corp. | 16,400 | 819,836 | |||||||||
| FPL Group, Inc. | 4,800 | 247,440 | |||||||||
See Accompanying Notes to Financial Statements.
49
CMG ENHANCED S&P 500® INDEX FUND
A Portfolio of Columbia Funds Institutional Trust
SCHEDULE OF INVESTMENTS
January 31, 2009 (Unaudited)
| Shares | Value | ||||||||||
| Common Stocks (continued) | |||||||||||
| Electric Utilities (continued) | |||||||||||
| Pepco Holdings, Inc. | 28,300 | $ | 504,023 | ||||||||
| Progress Energy, Inc. | 200 | 7,744 | |||||||||
| 3,350,943 | |||||||||||
| Gas Utilities (0.5%) | |||||||||||
| Questar Corp. | 16,200 | 550,476 | |||||||||
| Multi-Utilities (0.7%) | |||||||||||
| CenterPoint Energy, Inc. | 11,600 | 155,208 | |||||||||
| NiSource, Inc. | 8,700 | 84,216 | |||||||||
| PG&E Corp. | 1,200 | 46,404 | |||||||||
| Public Service Enterprise Group, Inc. | 12,100 | 381,997 | |||||||||
| Sempra Energy | 1,300 | 56,992 | |||||||||
| 724,817 | |||||||||||
| 4,626,236 | |||||||||||
| Total Common Stocks (Cost of $135,645,240) | 102,849,519 | ||||||||||
| Par | |||||||||||
| Short-Term Obligation (3.6%) | |||||||||||
| Repurchase agreement with Fixed Income Clearing Corp., dated 01/30/09, due 02/02/09, at 0.210%, collateralized by a U.S. Government Agency Obligation maturing 11/17/15, market value $3,966,063 (repurchase proceeds $3,883,068) | $ | 3,883,000 | 3,883,000 | ||||||||
| Total Short-Term Obligation (Cost of $3,883,000) | 3,883,000 | ||||||||||
| Total Investments (100.0%) (Cost of $139,528,240) (b) | 106,732,519 | ||||||||||
| Other Assets & Liabilities, Net (0.0%) | 2,234 | ||||||||||
| Net Assets (100.0%) | $ | 106,734,753 | |||||||||
Notes to Schedule of Investments:
(a) Non-income producing security.
(b) The security or a portion of the security is pledged as collateral for open futures contracts. At January 31, 2009, the total market value of securities pledged amounted to $752,400.
(c) Cost for federal income tax purposes is $139,528,240.
At January 31, 2009, the Fund held the following open long futures contracts:
| Type | Number of Contracts | Value | Aggregate Face Value | Expiration Date | Unrealized Depreciation | ||||||||||||||||||
| S&P 500 Index | 19 | $ | 3,906,875 | $ | 4,159,728 | Mar-09 | $ | (252,853 | ) | ||||||||||||||
At January 31, 2009, the Fund held investments in the following sectors:
| Sector | % of Net Assets | ||||||
| Information Technology | 15.6 | ||||||
| Health Care | 15.4 | ||||||
| Energy | 13.4 | ||||||
| Consumer Staples | 12.3 | ||||||
| Financials | 10.7 | ||||||
| Industrials | 10.2 | ||||||
| Consumer Discretionary | 8.2 | ||||||
| Utilities | 4.3 | ||||||
| Telecommunication Services | 3.5 | ||||||
| Materials | 2.8 | ||||||
| 96.4 | |||||||
| Short-Term Obligation | 3.6 | ||||||
| Other Assets & Liabilities, Net | 0.0 | * | |||||
| 100.0 | |||||||
*Rounds to less than 0.1%.
See Accompanying Notes to Financial Statements.
50
CMG LARGE CAP GROWTH FUND
A Portfolio of Columbia Funds Institutional Trust
SCHEDULE OF INVESTMENTS
January 31, 2009 (Unaudited)
| Shares | Value | ||||||||||
| Common Stocks (98.7%) | |||||||||||
| Consumer Discretionary (9.5%) | |||||||||||
| Diversified Consumer Services (0.5%) | |||||||||||
| Apollo Group, Inc., Class A (a) | 2,570 | $ | 209,352 | ||||||||
| Hotels, Restaurants & Leisure (1.9%) | |||||||||||
| McDonald's Corp. | 7,440 | 431,669 | |||||||||
| Starwood Hotels & Resorts Worldwide, Inc. | 12,690 | 191,873 | |||||||||
| Wynn Resorts Ltd. (a) | 3,030 | 91,142 | |||||||||
| 714,684 | |||||||||||
| Internet & Catalog Retail (0.5%) | |||||||||||
| Amazon.com, Inc. (a) | 3,050 | 179,401 | |||||||||
| Leisure Equipment & Products (0.4%) | |||||||||||
| Hasbro, Inc. | 5,690 | 137,300 | |||||||||
| Media (1.8%) | |||||||||||
| Comcast Corp., Class A | 22,010 | 322,447 | |||||||||
| DIRECTV Group, Inc. (a) | 16,350 | 358,065 | |||||||||
| 680,512 | |||||||||||
| Multiline Retail (1.6%) | |||||||||||
| Kohl's Corp. (a) | 7,780 | 285,604 | |||||||||
| Target Corp. | 9,730 | 303,576 | |||||||||
| 589,180 | |||||||||||
| Specialty Retail (2.1%) | |||||||||||
| Best Buy Co., Inc. | 3,790 | 106,196 | |||||||||
| Lowe's Companies, Inc. | 16,390 | 299,445 | |||||||||
| Staples, Inc. | 13,180 | 210,089 | |||||||||
| Urban Outfitters, Inc. (a) | 11,910 | 185,558 | |||||||||
| 801,288 | |||||||||||
| Textiles, Apparel & Luxury Goods (0.7%) | |||||||||||
| Polo Ralph Lauren Corp. | 6,180 | 253,565 | |||||||||
| 3,565,282 | |||||||||||
| Consumer Staples (11.7%) | |||||||||||
| Beverages (3.9%) | |||||||||||
| Coca-Cola Co. | 21,130 | 902,674 | |||||||||
| Molson Coors Brewing Co., Class B | 4,350 | 175,174 | |||||||||
| PepsiCo, Inc. | 7,590 | 381,246 | |||||||||
| 1,459,094 | |||||||||||
| Shares | Value | ||||||||||
| Food & Staples Retailing (2.7%) | |||||||||||
| Kroger Co. | 12,020 | $ | 270,450 | ||||||||
| Wal-Mart Stores, Inc. | 16,020 | 754,862 | |||||||||
| 1,025,312 | |||||||||||
| Food Products (1.3%) | |||||||||||
| Kraft Foods, Inc., Class A | 17,920 | 502,656 | |||||||||
| Household Products (0.7%) | |||||||||||
| Kimberly-Clark Corp. | 2,308 | 118,793 | |||||||||
| Procter & Gamble Co. | 2,610 | 142,245 | |||||||||
| 261,038 | |||||||||||
| Personal Products (1.0%) | |||||||||||
| Avon Products, Inc. | 18,110 | 370,350 | |||||||||
| Tobacco (2.1%) | |||||||||||
| Philip Morris International, Inc. | 21,170 | 786,465 | |||||||||
| 4,404,915 | |||||||||||
| Energy (8.6%) | |||||||||||
| Energy Equipment & Services (2.9%) | |||||||||||
| Halliburton Co. | 11,760 | 202,860 | |||||||||
| Nabors Industries Ltd. (a) | 12,420 | 135,999 | |||||||||
| Schlumberger Ltd. | 14,470 | 590,521 | |||||||||
| Transocean Ltd. (a) | 3,255 | 177,788 | |||||||||
| 1,107,168 | |||||||||||
| Oil, Gas & Consumable Fuels (5.7%) | |||||||||||
| Devon Energy Corp. | 4,760 | 293,216 | |||||||||
| Exxon Mobil Corp. | 3,760 | 287,565 | |||||||||
| Hess Corp. | 6,980 | 388,158 | |||||||||
| Occidental Petroleum Corp. | 9,510 | 518,770 | |||||||||
| Peabody Energy Corp. | 10,880 | 272,000 | |||||||||
| Southwestern Energy Co. (a) | 5,980 | 189,267 | |||||||||
| Ultra Petroleum Corp. (a) | 4,870 | 174,492 | |||||||||
| 2,123,468 | |||||||||||
| 3,230,636 | |||||||||||
| Financials (3.3%) | |||||||||||
| Capital Markets (1.9%) | |||||||||||
| Goldman Sachs Group, Inc. | 5,170 | 417,374 | |||||||||
| State Street Corp. | 4,320 | 100,526 | |||||||||
| Waddell & Reed Financial, Inc., Class A | 12,940 | 182,713 | |||||||||
| 700,613 | |||||||||||
See Accompanying Notes to Financial Statements.
51
CMG LARGE CAP GROWTH FUND
A Portfolio of Columbia Funds Institutional Trust
SCHEDULE OF INVESTMENTS
January 31, 2009 (Unaudited)
| Shares | Value | ||||||||||
| Common Stocks (continued) | |||||||||||
| Diversified Financial Services (0.1%) | |||||||||||
| IntercontinentalExchange, Inc. (a) | 964 | $ | 54,881 | ||||||||
| Insurance (1.3%) | |||||||||||
| Axis Capital Holdings Ltd. | 9,953 | 241,460 | |||||||||
| MetLife, Inc. | 8,440 | 242,481 | |||||||||
| 483,941 | |||||||||||
| 1,239,435 | |||||||||||
| Health Care (17.8%) | |||||||||||
| Biotechnology (3.7%) | |||||||||||
| BioMarin Pharmaceutical, Inc. (a) | 9,490 | 182,778 | |||||||||
| Celgene Corp. (a) | 4,780 | 253,101 | |||||||||
| Genentech, Inc. (a) | 4,020 | 326,585 | |||||||||
| Genzyme Corp. (a) | 3,060 | 210,895 | |||||||||
| Gilead Sciences, Inc. (a) | 5,830 | 295,989 | |||||||||
| Vertex Pharmaceuticals, Inc. (a) | 3,640 | 120,302 | |||||||||
| 1,389,650 | |||||||||||
| Health Care Equipment & Supplies (2.9%) | |||||||||||
| Baxter International, Inc. | 8,610 | 504,976 | |||||||||
| Covidien Ltd. | 6,550 | 251,127 | |||||||||
| Medtronic, Inc. | 10,110 | 338,584 | |||||||||
| 1,094,687 | |||||||||||
| Health Care Providers & Services (3.3%) | |||||||||||
| Humana, Inc. (a) | 7,860 | 298,130 | |||||||||
| McKesson Corp. | 6,930 | 306,306 | |||||||||
| Medco Health Solutions, Inc. (a) | 14,050 | 631,266 | |||||||||
| 1,235,702 | |||||||||||
| Life Sciences Tools & Services (2.1%) | |||||||||||
| Covance, Inc. (a) | 6,610 | 255,146 | |||||||||
| Thermo Fisher Scientific, Inc. (a) | 14,741 | 529,644 | |||||||||
| 784,790 | |||||||||||
| Pharmaceuticals (5.8%) | |||||||||||
| Abbott Laboratories | 14,290 | 792,238 | |||||||||
| Bristol-Myers Squibb Co. | 22,620 | 484,294 | |||||||||
| Johnson & Johnson | 4,620 | 266,528 | |||||||||
| Schering-Plough Corp. | 26,280 | 461,477 | |||||||||
| Teva Pharmaceutical Industries Ltd., ADR | 4,510 | 186,939 | |||||||||
| 2,191,476 | |||||||||||
| 6,696,305 | |||||||||||
| Shares | Value | ||||||||||
| Industrials (12.4%) | |||||||||||
| Aerospace & Defense (3.8%) | |||||||||||
| Goodrich Corp. | 5,300 | $ | 204,898 | ||||||||
| Lockheed Martin Corp. | 5,320 | 436,453 | |||||||||
| Precision Castparts Corp. | 4,840 | 314,358 | |||||||||
| United Technologies Corp. | 9,810 | 470,782 | |||||||||
| 1,426,491 | |||||||||||
| Commercial Services & Supplies (0.8%) | |||||||||||
| Waste Management, Inc. | 9,330 | 291,003 | |||||||||
| Machinery (4.0%) | |||||||||||
| Cummins, Inc. | 6,130 | 146,997 | |||||||||
| Flowserve Corp. | 5,040 | 268,682 | |||||||||
| Illinois Tool Works, Inc. | 12,110 | 395,513 | |||||||||
| Joy Global, Inc. | 8,420 | 175,389 | |||||||||
| Parker Hannifin Corp. | 8,370 | 319,818 | |||||||||
| SPX Corp. | 4,700 | 197,917 | |||||||||
| 1,504,316 | |||||||||||
| Professional Services (0.6%) | |||||||||||
| Dun & Bradstreet Corp. | 3,120 | 237,120 | |||||||||
| Road & Rail (2.3%) | |||||||||||
| Landstar System, Inc. | 5,650 | 202,665 | |||||||||
| Norfolk Southern Corp. | 8,230 | 315,703 | |||||||||
| Union Pacific Corp. | 7,870 | 344,627 | |||||||||
| 862,995 | |||||||||||
| Trading Companies & Distributors (0.9%) | |||||||||||
| W.W. Grainger, Inc. | 4,920 | 358,914 | |||||||||
| 4,680,839 | |||||||||||
| Information Technology (29.7%) | |||||||||||
| Communications Equipment (3.9%) | |||||||||||
| Cisco Systems, Inc. (a) | 50,680 | 758,680 | |||||||||
| QUALCOMM, Inc. | 20,870 | 721,058 | |||||||||
| 1,479,738 | |||||||||||
| Computers & Peripherals (8.6%) | |||||||||||
| Apple, Inc. (a) | 9,820 | 885,077 | |||||||||
| EMC Corp. (a) | 49,760 | 549,350 | |||||||||
| Hewlett-Packard Co. | 25,850 | 898,288 | |||||||||
| International Business Machines Corp. | 9,620 | 881,673 | |||||||||
| 3,214,388 | |||||||||||
See Accompanying Notes to Financial Statements.
52
CMG LARGE CAP GROWTH FUND
A Portfolio of Columbia Funds Institutional Trust
SCHEDULE OF INVESTMENTS
January 31, 2009 (Unaudited)
| Shares | Value | ||||||||||
| Common Stocks (continued) | |||||||||||
| Electronic Equipment, Instruments & Components (0.5%) | |||||||||||
| FLIR Systems, Inc. (a) | 7,960 | $ | 198,761 | ||||||||
| Internet Software & Services (4.1%) | |||||||||||
| Equinix, Inc. (a) | 4,710 | 251,278 | |||||||||
| Google, Inc., Class A (a) | 3,828 | 1,295,893 | |||||||||
| 1,547,171 | |||||||||||
| IT Services (1.2%) | |||||||||||
| Visa, Inc., Class A | 9,470 | 467,345 | |||||||||
| Semiconductors & Semiconductor Equipment (5.1%) | |||||||||||
| Broadcom Corp., Class A (a) | 8,740 | 138,529 | |||||||||
| Intel Corp. | 46,300 | 597,270 | |||||||||
| Lam Research Corp. (a) | 18,000 | 363,780 | |||||||||
| Linear Technology Corp. | 16,770 | 392,753 | |||||||||
| Marvell Technology Group Ltd. (a) | 31,720 | 231,239 | |||||||||
| Microchip Technology, Inc. | 9,560 | 181,353 | |||||||||
| 1,904,924 | |||||||||||
| Software (6.3%) | |||||||||||
| Activision Blizzard, Inc. (a) | 26,565 | 232,710 | |||||||||
| Adobe Systems, Inc. (a) | 13,900 | 268,409 | |||||||||
| Microsoft Corp. | 61,030 | 1,043,613 | |||||||||
| Oracle Corp. (a) | 34,200 | 575,586 | |||||||||
| Symantec Corp. (a) | 15,540 | 238,228 | |||||||||
| 2,358,546 | |||||||||||
| 11,170,873 | |||||||||||
| Materials (4.0%) | |||||||||||
| Chemicals (3.2%) | |||||||||||
| Monsanto Co. | 6,258 | 475,984 | |||||||||
| Potash Corp. of Saskatchewan | 2,740 | 205,116 | |||||||||
| Praxair, Inc. | 8,170 | 508,664 | |||||||||
| 1,189,764 | |||||||||||
| Metals & Mining (0.8%) | |||||||||||
| Nucor Corp. | 4,520 | 184,371 | |||||||||
| Steel Dynamics, Inc. | 10,980 | 116,607 | |||||||||
| 300,978 | |||||||||||
| 1,490,742 | |||||||||||
| Shares | Value | ||||||||||
| Telecommunication Services (0.8%) | |||||||||||
| Wireless Telecommunication Services (0.8%) | |||||||||||
| NII Holdings, Inc. (a) | 14,880 | $ | 288,672 | ||||||||
| Utilities (0.9%) | |||||||||||
| Electric Utilities (0.9%) | |||||||||||
| Entergy Corp. | 4,720 | 360,419 | |||||||||
| Total Common Stocks (Cost of $44,126,666) | 37,128,118 | ||||||||||
| Par | |||||||||||
| Short-Term Obligation (1.5%) | |||||||||||
| Repurchase agreement with Fixed Income Clearing Corp., dated 01/30/09, due 02/02/09 at 0.200%, collateralized by a U.S. Treasury Obligation maturing 11/15/12, market value $579,390 (repurchase proceeds $568,009) | $ | 568,000 | 568,000 | ||||||||
| Total Short-Term Obligation (Cost of $568,000) | 568,000 | ||||||||||
| Total Investments (100.2%) (Cost of $44,694,666) (b) | 37,696,118 | ||||||||||
| Other Assets & Liabilities, Net (-0.2)% | (85,590 | ) | |||||||||
| Net Assets (100.0%) | $ | 37,610,528 | |||||||||
Notes to Schedule of Investments:
(a) Non-income producing security.
(b) Cost for federal income tax purposes is $44,694,666.
See Accompanying Notes to Financial Statements.
53
CMG LARGE CAP GROWTH FUND
A Portfolio of Columbia Funds Institutional Trust
SCHEDULE OF INVESTMENTS
January 31, 2009 (Unaudited)
At January 31, 2009, the Fund held investments in the following sectors:
| Sector | % of Net Assets | ||||||
| Information Technology | 29.7 | ||||||
| Health Care | 17.8 | ||||||
| Industrials | 12.4 | ||||||
| Consumer Staples | 11.7 | ||||||
| Consumer Discretionary | 9.5 | ||||||
| Energy | 8.6 | ||||||
| Materials | 4.0 | ||||||
| Financials | 3.3 | ||||||
| Utilities | 0.9 | ||||||
| Telecommunication Services | 0.8 | ||||||
| 98.7 | |||||||
| Short-Term Obligation | 1.5 | ||||||
| Other Assets & Liabilities, Net | (0.2 | ) | |||||
| 100.0 | |||||||
| Acronym | Name | ||||||
| ADR | American Depositary Receipt | ||||||
See Accompanying Notes to Financial Statements.
54
CMG LARGE CAP VALUE FUND
A Portfolio of Columbia Funds Institutional Trust
SCHEDULE OF INVESTMENTS
January 31, 2009 (Unaudited)
| Shares | Value | ||||||||||
| Common Stocks (94.5%) | |||||||||||
| Consumer Discretionary (6.6%) | |||||||||||
| Hotels, Restaurants & Leisure (2.4%) | |||||||||||
| Carnival Corp. | 7,500 | $ | 136,425 | ||||||||
| McDonald's Corp. | 8,166 | 473,791 | |||||||||
| 610,216 | |||||||||||
| Multiline Retail (1.4%) | |||||||||||
| Kohl's Corp. (a) | 9,825 | 360,676 | |||||||||
| Specialty Retail (1.6%) | |||||||||||
| Lowe's Companies, Inc. | 22,400 | 409,248 | |||||||||
| Textiles, Apparel & Luxury Goods (1.2%) | |||||||||||
| V.F. Corp. | 5,200 | 291,304 | |||||||||
| 1,671,444 | |||||||||||
| Consumer Staples (9.9%) | |||||||||||
| Beverages (1.4%) | |||||||||||
| Diageo PLC, ADR | 6,499 | 353,156 | |||||||||
| Food & Staples Retailing (2.3%) | |||||||||||
| Sysco Corp. | 10,500 | 234,045 | |||||||||
| Wal-Mart Stores, Inc. | 7,300 | 343,976 | |||||||||
| 578,021 | |||||||||||
| Food Products (1.9%) | |||||||||||
| ConAgra Foods, Inc. | 11,400 | 194,940 | |||||||||
| General Mills, Inc. | 2,800 | 165,620 | |||||||||
| J M Smucker Co. | 2,800 | 126,420 | |||||||||
| 486,980 | |||||||||||
| Household Products (2.1%) | |||||||||||
| Procter & Gamble Co. | 9,700 | 528,650 | |||||||||
| Personal Products (1.1%) | |||||||||||
| Avon Products, Inc. | 13,765 | 281,494 | |||||||||
| Tobacco (1.1%) | |||||||||||
| Philip Morris International, Inc. | 7,329 | 272,272 | |||||||||
| 2,500,573 | |||||||||||
| Energy (18.9%) | |||||||||||
| Energy Equipment & Services (2.4%) | |||||||||||
| Halliburton Co. | 16,354 | 282,106 | |||||||||
| Smith International, Inc. | 3,000 | 68,100 | |||||||||
| Shares | Value | ||||||||||
| Energy Equipment & Services (continued) | |||||||||||
| Transocean Ltd. (a) | 4,900 | $ | 267,638 | ||||||||
| 617,844 | |||||||||||
| Oil, Gas & Consumable Fuels (16.5%) | |||||||||||
| Chevron Corp. | 7,100 | 500,692 | |||||||||
| ConocoPhillips | 10,007 | 475,632 | |||||||||
| El Paso Corp. | 13,300 | 108,794 | |||||||||
| EOG Resources, Inc. | 3,875 | 262,609 | |||||||||
| Exxon Mobil Corp. | 17,235 | 1,318,133 | |||||||||
| Hess Corp. | 7,575 | 421,246 | |||||||||
| Marathon Oil Corp. | 8,300 | 226,009 | |||||||||
| Newfield Exploration Co. (a) | 3,300 | 63,327 | |||||||||
| Occidental Petroleum Corp. | 8,000 | 436,400 | |||||||||
| Petroleo Brasileiro SA, ADR | 6,800 | 178,160 | |||||||||
| Williams Companies, Inc. | 12,700 | 179,705 | |||||||||
| 4,170,707 | |||||||||||
| 4,788,551 | |||||||||||
| Financials (18.8%) | |||||||||||
| Capital Markets (2.4%) | |||||||||||
| Goldman Sachs Group, Inc. | 5,100 | 411,723 | |||||||||
| State Street Corp. | 9,000 | 209,430 | |||||||||
| 621,153 | |||||||||||
| Commercial Banks (4.9%) | |||||||||||
| PNC Financial Services Group, Inc. | 7,700 | 250,404 | |||||||||
| U.S. Bancorp | 34,446 | 511,179 | |||||||||
| Wells Fargo & Co. | 26,056 | 492,458 | |||||||||
| 1,254,041 | |||||||||||
| Diversified Financial Services (3.8%) | |||||||||||
| JPMorgan Chase & Co. | 37,400 | 954,074 | |||||||||
| Insurance (5.6%) | |||||||||||
| ACE Ltd. | 8,487 | 370,543 | |||||||||
| Aon Corp. | 12,100 | 448,305 | |||||||||
| Axis Capital Holdings Ltd. | 2,400 | 58,224 | |||||||||
| Hartford Financial Services Group, Inc. | 6,763 | 89,001 | |||||||||
| Marsh & McLennan Companies, Inc. | 14,400 | 278,352 | |||||||||
| Prudential Financial, Inc. | 6,600 | 169,950 | |||||||||
| 1,414,375 | |||||||||||
See Accompanying Notes to Financial Statements.
55
CMG LARGE CAP VALUE FUND
A Portfolio of Columbia Funds Institutional Trust
SCHEDULE OF INVESTMENTS
January 31, 2009 (Unaudited)
| Shares | Value | ||||||||||
| Common Stocks (continued) | |||||||||||
| Real Estate Investment Trusts (REITs) (2.1%) | |||||||||||
| Plum Creek Timber Co., Inc. | 8,900 | $ | 273,853 | ||||||||
| Rayonier, Inc. | 8,400 | 247,296 | |||||||||
| 521,149 | |||||||||||
| 4,764,792 | |||||||||||
| Health Care (11.8%) | |||||||||||
| Biotechnology (3.2%) | |||||||||||
| Amgen, Inc. (a) | 14,500 | 795,325 | |||||||||
| Health Care Providers & Services (2.7%) | |||||||||||
| McKesson Corp. | 6,400 | 282,880 | |||||||||
| Medco Health Solutions, Inc. (a) | 9,100 | 408,863 | |||||||||
| 691,743 | |||||||||||
| Life Sciences Tools & Services (1.1%) | |||||||||||
| Thermo Fisher Scientific, Inc. (a) | 8,000 | 287,440 | |||||||||
| Pharmaceuticals (4.8%) | |||||||||||
| Abbott Laboratories | 5,900 | 327,096 | |||||||||
| Johnson & Johnson | 10,400 | 599,976 | |||||||||
| Schering-Plough Corp. | 16,300 | 286,228 | |||||||||
| 1,213,300 | |||||||||||
| 2,987,808 | |||||||||||
| Industrials (6.7%) | |||||||||||
| Aerospace & Defense (4.7%) | |||||||||||
| Goodrich Corp. | 5,900 | 228,094 | |||||||||
| L-3 Communications Holdings, Inc. | 4,850 | 383,247 | |||||||||
| Northrop Grumman Corp. | 4,500 | 216,540 | |||||||||
| United Technologies Corp. | 7,596 | 364,532 | |||||||||
| 1,192,413 | |||||||||||
| Construction & Engineering (1.2%) | |||||||||||
| KBR, Inc. | 21,900 | 310,104 | |||||||||
| Machinery (0.8%) | |||||||||||
| Eaton Corp. | 4,600 | 202,492 | |||||||||
| 1,705,009 | |||||||||||
| Information Technology (5.2%) | |||||||||||
| Computers & Peripherals (3.0%) | |||||||||||
| EMC Corp. (a) | 30,800 | 340,032 | |||||||||
| Hewlett-Packard Co. | 7,700 | 267,575 | |||||||||
| Shares | Value | ||||||||||
| Computers & Peripherals (continued) | |||||||||||
| International Business Machines Corp. | 1,700 | $ | 155,805 | ||||||||
| 763,412 | |||||||||||
| Semiconductors & Semiconductor Equipment (1.0%) | |||||||||||
| Intel Corp. | 9,900 | 127,710 | |||||||||
| Intersil Corp., Class A | 9,700 | 90,307 | |||||||||
| Marvell Technology Group Ltd. (a) | 5,500 | 40,095 | |||||||||
| 258,112 | |||||||||||
| Software (1.2%) | |||||||||||
| BMC Software, Inc. (a) | 11,800 | 298,894 | |||||||||
| 1,320,418 | |||||||||||
| Materials (5.0%) | |||||||||||
| Chemicals (2.6%) | |||||||||||
| E.I. Du Pont de Nemours & Co. | 8,800 | 202,048 | |||||||||
| Monsanto Co. | 3,275 | 249,096 | |||||||||
| Potash Corp. of Saskatchewan | 2,675 | 200,251 | |||||||||
| 651,395 | |||||||||||
| Metals & Mining (2.1%) | |||||||||||
| Allegheny Technologies, Inc. | 1,300 | 28,717 | |||||||||
| Freeport-McMoRan Copper & Gold, Inc. (a) | 8,100 | 203,634 | |||||||||
| Nucor Corp. | 7,225 | 294,708 | |||||||||
| 527,059 | |||||||||||
| Paper & Forest Products (0.3%) | |||||||||||
| Weyerhaeuser Co. | 3,000 | 82,020 | |||||||||
| 1,260,474 | |||||||||||
| Telecommunication Services (5.3%) | |||||||||||
| Diversified Telecommunication Services (5.3%) | |||||||||||
| AT&T, Inc. | 38,757 | 954,197 | |||||||||
| Verizon Communications, Inc. | 13,270 | 396,375 | |||||||||
| 1,350,572 | |||||||||||
| Utilities (6.3%) | |||||||||||
| Electric Utilities (3.5%) | |||||||||||
| Exelon Corp. | 5,600 | 303,632 | |||||||||
| FPL Group, Inc. | 8,300 | 427,865 | |||||||||
| Northeast Utilities Co. | 997 | 23,729 | |||||||||
| Southern Co. | 3,700 | 123,765 | |||||||||
| 878,991 | |||||||||||
See Accompanying Notes to Financial Statements.
56
CMG LARGE CAP VALUE FUND
A Portfolio of Columbia Funds Institutional Trust
SCHEDULE OF INVESTMENTS
January 31, 2009 (Unaudited)
| Shares | Value | ||||||||||
| Common Stocks (continued) | |||||||||||
| Multi-Utilities (2.8%) | |||||||||||
| PG&E Corp. | 9,933 | $ | 384,109 | ||||||||
| Public Service Enterprise Group, Inc. | 4,086 | 128,995 | |||||||||
| Wisconsin Energy Corp. | 4,300 | 191,694 | |||||||||
| 704,798 | |||||||||||
| 1,583,789 | |||||||||||
| Total Common Stocks (Cost of $30,241,218) | 23,933,430 | ||||||||||
| Convertible Preferred Stocks (1.1%) | |||||||||||
| Health Care (0.5%) | |||||||||||
| Pharmaceuticals (0.5%) | |||||||||||
| Schering-Plough Corp., 6.000% | 800 | 139,208 | |||||||||
| Materials (0.6%) | |||||||||||
| Metals & Mining (0.6%) | |||||||||||
| Freeport-McMoRan Copper & Gold, Inc., 6.750% | 3,100 | 144,460 | |||||||||
| Total Convertible Preferred Stocks (Cost of $341,316) | 283,668 | ||||||||||
| Par | |||||||||||
| Short-Term Obligation (6.2%) | |||||||||||
| Repurchase agreement with Fixed Income Clearing Corp., dated 01/30/09, due 02/02/09 at 0.200%, collateralized by a U.S. Treasury Obligation maturing 11/15/15, market value of $1,596,108 (repurchase proceeds $1,560,026) | $ | 1,560,000 | $ | 1,560,000 | |||||||
| Total Short-Term Obligation (Cost of $1,560,000) | 1,560,000 | ||||||||||
| Total Investments (101.8%) (Cost of $32,142,534) (b) | 25,777,098 | ||||||||||
| Other Assets & Liabilities, Net (-1.8%) | (466,104 | ) | |||||||||
| Net Assets (100.0%) | $ | 25,310,994 | |||||||||
Notes to Schedule of Investments:
(a) Non-income producing security.
(b) Cost for federal income tax purposes is $32,142,534.
At January 31, 2009, the Fund held investments in the following sectors:
| Sector | % of Net Assets | ||||||
| Energy | 18.9 | ||||||
| Financials | 18.8 | ||||||
| Health Care | 12.3 | ||||||
| Consumer Staples | 9.9 | ||||||
| Industrials | 6.7 | ||||||
| Consumer Discretionary | 6.6 | ||||||
| Utilities | 6.3 | ||||||
| Materials | 5.6 | ||||||
| Telecommunication Services | 5.3 | ||||||
| Information Technology | 5.2 | ||||||
| 95.6 | |||||||
| Short-Term Obligation | 6.2 | ||||||
| Other Assets & Liabilities, Net | (1.8 | ) | |||||
| 100.0 | |||||||
| Acronym | Name | ||||||
| ADR | American Depositary Receipt | ||||||
See Accompanying Notes to Financial Statements.
57
CMG MID CAP GROWTH FUND
A Portfolio of Columbia Funds Institutional Trust
SCHEDULE OF INVESTMENTS
January 31, 2009 (Unaudited)
| Shares | Value | ||||||||||
| Common Stocks (96.9%) | |||||||||||
| Consumer Discretionary (18.4%) | |||||||||||
| Distributors (0.5%) | |||||||||||
| LKQ Corp. (a) | 6,730 | $ | 77,731 | ||||||||
| Diversified Consumer Services (3.8%) | |||||||||||
| Apollo Group, Inc., Class A (a) | 2,070 | 168,622 | |||||||||
| DeVry, Inc. | 1,512 | 81,013 | |||||||||
| ITT Educational Services, Inc. (a) | 2,069 | 253,473 | |||||||||
| New Oriental Education & Technology Group, ADR (a) | 1,150 | 55,016 | |||||||||
| 558,124 | |||||||||||
| Hotels, Restaurants & Leisure (3.7%) | |||||||||||
| Darden Restaurants, Inc. | 6,010 | 157,582 | |||||||||
| Starbucks Corp. (a) | 8,650 | 81,656 | |||||||||
| Starwood Hotels & Resorts Worldwide, Inc. | 2,650 | 40,068 | |||||||||
| WMS Industries, Inc. (a) | 3,990 | 88,658 | |||||||||
| Yum! Brands, Inc. | 6,180 | 176,872 | |||||||||
| 544,836 | |||||||||||
| Household Durables (0.4%) | |||||||||||
| NVR, Inc. (a) | 130 | 55,392 | |||||||||
| Leisure Equipment & Products (0.5%) | |||||||||||
| Mattel, Inc. | 4,740 | 67,261 | |||||||||
| Media (2.0%) | |||||||||||
| DreamWorks Animation SKG, Inc., Class A (a) | 4,650 | 102,067 | |||||||||
| Liberty Media Corp. - Entertainment, Class A (a) | 6,320 | 115,972 | |||||||||
| McGraw-Hill Companies, Inc. | 3,240 | 71,248 | |||||||||
| 289,287 | |||||||||||
| Multiline Retail (1.5%) | |||||||||||
| Dollar Tree, Inc. (a) | 2,860 | 122,151 | |||||||||
| Kohl's Corp. (a) | 2,840 | 104,256 | |||||||||
| 226,407 | |||||||||||
| Specialty Retail (5.0%) | |||||||||||
| Advance Auto Parts, Inc. | 3,570 | 116,846 | |||||||||
| Bed Bath & Beyond, Inc. (a) | 2,950 | 68,529 | |||||||||
| Gap, Inc. | 6,790 | 76,591 | |||||||||
| Guess ?, Inc. | 4,560 | 73,370 | |||||||||
| Shares | Value | ||||||||||
| Specialty Retail (continued) | |||||||||||
| Limited Brands, Inc. | 6,590 | $ | 52,193 | ||||||||
| Ross Stores, Inc. | 3,400 | 100,028 | |||||||||
| Sherwin-Williams Co. | 2,300 | 109,825 | |||||||||
| Tiffany & Co. | 2,200 | 45,650 | |||||||||
| TJX Companies, Inc. | 5,120 | 99,430 | |||||||||
| 742,462 | |||||||||||
| Textiles, Apparel & Luxury Goods (1.0%) | |||||||||||
| Deckers Outdoor Corp. (a) | 1,550 | 80,972 | |||||||||
| Polo Ralph Lauren Corp. | 1,760 | 72,213 | |||||||||
| 153,185 | |||||||||||
| 2,714,685 | |||||||||||
| Consumer Staples (3.3%) | |||||||||||
| Food & Staples Retailing (0.4%) | |||||||||||
| Kroger Co. | 2,440 | 54,900 | |||||||||
| Food Products (0.7%) | |||||||||||
| Campbell Soup Co. | 3,240 | 98,399 | |||||||||
| Household Products (1.5%) | |||||||||||
| Church & Dwight Co., Inc. | 1,820 | 96,879 | |||||||||
| Clorox Co. | 2,560 | 128,384 | |||||||||
| 225,263 | |||||||||||
| Personal Products (0.7%) | |||||||||||
| Avon Products, Inc. | 5,370 | 109,816 | |||||||||
| 488,378 | |||||||||||
| Energy (8.6%) | |||||||||||
| Energy Equipment & Services (2.8%) | |||||||||||
| Core Laboratories N.V. | 1,050 | 70,550 | |||||||||
| Diamond Offshore Drilling, Inc. | 2,420 | 151,879 | |||||||||
| FMC Technologies, Inc. (a) | 2,300 | 68,057 | |||||||||
| Noble Corp. | 4,760 | 129,234 | |||||||||
| 419,720 | |||||||||||
| Oil, Gas & Consumable Fuels (5.8%) | |||||||||||
| Concho Resources, Inc. (a) | 3,248 | 81,914 | |||||||||
| CONSOL Energy, Inc. | 2,470 | 67,332 | |||||||||
| Continental Resources, Inc. (a) | 4,319 | 89,274 | |||||||||
| Denbury Resources, Inc. (a) | 9,509 | 116,390 | |||||||||
| Frontier Oil Corp. | 4,380 | 62,546 | |||||||||
| PetroHawk Energy Corp. (a) | 5,970 | 117,669 | |||||||||
| Range Resources Corp. | 2,190 | 78,489 | |||||||||
See Accompanying Notes to Financial Statements.
58
CMG MID CAP GROWTH FUND
A Portfolio of Columbia Funds Institutional Trust
SCHEDULE OF INVESTMENTS
January 31, 2009 (Unaudited)
| Shares | Value | ||||||||||
| Common Stocks (continued) | |||||||||||
| Oil, Gas & Consumable Fuels (continued) | |||||||||||
| Southwestern Energy Co. (a) | 5,458 | $ | 172,746 | ||||||||
| Ultra Petroleum Corp. (a) | 1,720 | 61,628 | |||||||||
| 847,988 | |||||||||||
| 1,267,708 | |||||||||||
| Financials (5.3%) | |||||||||||
| Capital Markets (3.1%) | |||||||||||
| Charles Schwab Corp. | 3,230 | 43,896 | |||||||||
| Invesco Ltd. | 6,820 | 80,408 | |||||||||
| Northern Trust Corp. | 2,090 | 120,217 | |||||||||
| T. Rowe Price Group, Inc. | 3,190 | 87,980 | |||||||||
| Waddell & Reed Financial, Inc., Class A | 9,180 | 129,621 | |||||||||
| 462,122 | |||||||||||
| Commercial Banks (0.4%) | |||||||||||
| TCF Financial Corp. | 5,029 | 62,309 | |||||||||
| Consumer Finance (0.6%) | |||||||||||
| SLM Corp. (a) | 7,320 | 83,814 | |||||||||
| Diversified Financial Services (0.7%) | |||||||||||
| CME Group, Inc. | 300 | 52,173 | |||||||||
| IntercontinentalExchange, Inc. (a) | 860 | 48,960 | |||||||||
| 101,133 | |||||||||||
| Real Estate Investment Trusts (REITs) (0.5%) | |||||||||||
| Plum Creek Timber Co., Inc. | 2,240 | 68,925 | |||||||||
| 778,303 | |||||||||||
| Health Care (14.6%) | |||||||||||
| Biotechnology (1.5%) | |||||||||||
| Alexion Pharmaceuticals, Inc. (a) | 1,960 | 72,265 | |||||||||
| Celgene Corp. (a) | 1,320 | 69,894 | |||||||||
| Genzyme Corp. (a) | 1,160 | 79,947 | |||||||||
| 222,106 | |||||||||||
| Health Care Equipment & Supplies (2.4%) | |||||||||||
| C.R. Bard, Inc. | 800 | 68,456 | |||||||||
| Intuitive Surgical, Inc. (a) | 1,267 | 130,793 | |||||||||
| Mindray Medical International Ltd., ADR | 3,890 | 80,367 | |||||||||
| St. Jude Medical, Inc. (a) | 2,200 | 80,014 | |||||||||
| 359,630 | |||||||||||
| Shares | Value | ||||||||||
| Health Care Providers & Services (5.5%) | |||||||||||
| DaVita, Inc. (a) | 2,500 | $ | 117,500 | ||||||||
| Express Scripts, Inc. (a) | 4,380 | 235,469 | |||||||||
| Laboratory Corp. of America Holdings (a) | 2,780 | 164,576 | |||||||||
| McKesson Corp. | 1,860 | 82,212 | |||||||||
| Medco Health Solutions, Inc. (a) | 2,840 | 127,601 | |||||||||
| Quest Diagnostics, Inc. | 1,800 | 88,830 | |||||||||
| 816,188 | |||||||||||
| Life Sciences Tools & Services (3.2%) | |||||||||||
| Charles River Laboratories International, Inc. (a) | 4,270 | 104,231 | |||||||||
| Covance, Inc. (a) | 2,640 | 101,904 | |||||||||
| Illumina, Inc. (a) | 2,956 | 80,876 | |||||||||
| Pharmaceutical Product Development, Inc. | 2,880 | 68,803 | |||||||||
| Thermo Fisher Scientific, Inc. (a) | 3,090 | 111,024 | |||||||||
| 466,838 | |||||||||||
| Pharmaceuticals (2.0%) | |||||||||||
| Allergan, Inc. | 4,350 | 165,822 | |||||||||
| Perrigo Co. | 4,120 | 120,922 | |||||||||
| 286,744 | |||||||||||
| 2,151,506 | |||||||||||
| Industrials (17.8%) | |||||||||||
| Aerospace & Defense (2.4%) | |||||||||||
| Goodrich Corp. | 3,850 | 148,841 | |||||||||
| Precision Castparts Corp. | 3,060 | 198,747 | |||||||||
| 347,588 | |||||||||||
| Air Freight & Logistics (0.7%) | |||||||||||
| C.H. Robinson Worldwide, Inc. | 2,180 | 100,237 | |||||||||
| Commercial Services & Supplies (2.9%) | |||||||||||
| Pitney Bowes, Inc. | 2,318 | 51,599 | |||||||||
| Stericycle, Inc. (a) | 6,020 | 294,498 | |||||||||
| Waste Connections, Inc. (a) | 2,962 | 85,957 | |||||||||
| 432,054 | |||||||||||
| Construction & Engineering (1.8%) | |||||||||||
| Foster Wheeler Ltd. (a) | 6,120 | 122,216 | |||||||||
| Jacobs Engineering Group, Inc. (a) | 1,730 | 66,899 | |||||||||
| Quanta Services, Inc. (a) | 3,960 | 84,665 | |||||||||
| 273,780 | |||||||||||
See Accompanying Notes to Financial Statements.
59
CMG MID CAP GROWTH FUND
A Portfolio of Columbia Funds Institutional Trust
SCHEDULE OF INVESTMENTS
January 31, 2009 (Unaudited)
| Shares | Value | ||||||||||
| Common Stocks (continued) | |||||||||||
| Electrical Equipment (1.5%) | |||||||||||
| AMETEK, Inc. | 3,210 | $ | 102,592 | ||||||||
| Roper Industries, Inc. | 2,860 | 117,660 | |||||||||
| 220,252 | |||||||||||
| Machinery (3.6%) | |||||||||||
| Cummins, Inc. | 2,340 | 56,113 | |||||||||
| Flowserve Corp. | 1,490 | 79,432 | |||||||||
| ITT Corp. | 2,460 | 111,389 | |||||||||
| Joy Global, Inc. | 2,605 | 54,262 | |||||||||
| Pall Corp. | 3,980 | 103,759 | |||||||||
| Parker Hannifin Corp. | 2,100 | 80,241 | |||||||||
| Wabtec Corp. | 1,580 | 47,289 | |||||||||
| 532,485 | |||||||||||
| Professional Services (1.8%) | |||||||||||
| Dun & Bradstreet Corp. | 840 | 63,840 | |||||||||
| FTI Consulting, Inc. (a) | 1,950 | 79,969 | |||||||||
| Huron Consulting Group, Inc. (a) | 1,140 | 56,977 | |||||||||
| Robert Half International, Inc. | 3,830 | 64,919 | |||||||||
| 265,705 | |||||||||||
| Road & Rail (2.3%) | |||||||||||
| CSX Corp. | 3,020 | 87,459 | |||||||||
| Landstar System, Inc. | 5,320 | 190,828 | |||||||||
| Old Dominion Freight Line, Inc. (a) | 2,570 | 64,456 | |||||||||
| 342,743 | |||||||||||
| Trading Companies & Distributors (0.8%) | |||||||||||
| Fastenal Co. | 3,360 | 114,845 | |||||||||
| 2,629,689 | |||||||||||
| Information Technology (20.2%) | |||||||||||
| Communications Equipment (2.4%) | |||||||||||
| F5 Networks, Inc. (a) | 2,770 | 61,411 | |||||||||
| Harris Corp. | 3,390 | 146,753 | |||||||||
| Juniper Networks, Inc. (a) | 5,110 | 72,358 | |||||||||
| Research In Motion Ltd. (a) | 1,290 | 71,466 | |||||||||
| 351,988 | |||||||||||
| Computers & Peripherals (0.5%) | |||||||||||
| NetApp, Inc. (a) | 4,940 | 73,260 | |||||||||
| Shares | Value | ||||||||||
| Electronic Equipment, Instruments & Components (1.3%) | |||||||||||
| Agilent Technologies, Inc. (a) | 4,840 | $ | 87,507 | ||||||||
| Itron, Inc. (a) | 1,180 | 77,054 | |||||||||
| Trimble Navigation Ltd. (a) | 1,446 | 21,430 | |||||||||
| 185,991 | |||||||||||
| Internet Software & Services (1.6%) | |||||||||||
| Equinix, Inc. (a) | 2,598 | 138,603 | |||||||||
| VeriSign, Inc. (a) | 4,670 | 90,178 | |||||||||
| 228,781 | |||||||||||
| IT Services (4.4%) | |||||||||||
| Alliance Data Systems Corp. (a) | 2,670 | 111,045 | |||||||||
| Cognizant Technology Solutions Corp., Class A (a) | 5,490 | 102,828 | |||||||||
| Fiserv, Inc. (a) | 2,660 | 84,455 | |||||||||
| Global Payments, Inc. | 2,960 | 102,741 | |||||||||
| Hewitt Associates, Inc., Class A (a) | 3,810 | 108,128 | |||||||||
| MasterCard, Inc., Class A | 450 | 61,101 | |||||||||
| Paychex, Inc. | 3,500 | 85,015 | |||||||||
| 655,313 | |||||||||||
| Semiconductors & Semiconductor Equipment (5.7%) | |||||||||||
| Altera Corp. | 9,130 | 140,420 | |||||||||
| Analog Devices, Inc. | 8,931 | 178,441 | |||||||||
| ASML Holding N.V., N.Y. Registered Shares | 3,630 | 60,040 | |||||||||
| Broadcom Corp., Class A (a) | 6,860 | 108,731 | |||||||||
| International Rectifier Corp. (a) | 4,470 | 60,881 | |||||||||
| Intersil Corp., Class A | 6,180 | 57,536 | |||||||||
| Marvell Technology Group Ltd. (a) | 8,290 | 60,434 | |||||||||
| MEMC Electronic Materials, Inc. (a) | 3,720 | 50,592 | |||||||||
| Silicon Laboratories, Inc. (a) | 3,060 | 70,472 | |||||||||
| Varian Semiconductor Equipment Associates, Inc. (a) | 2,920 | 55,597 | |||||||||
| 843,144 | |||||||||||
| Software (4.3%) | |||||||||||
| Activision Blizzard, Inc. (a) | 12,790 | 112,040 | |||||||||
| Autodesk, Inc. (a) | 2,617 | 43,338 | |||||||||
| Citrix Systems, Inc. (a) | 2,588 | 54,452 | |||||||||
| Software (continued) | |||||||||||
| FactSet Research Systems, Inc. | 2,820 | 112,236 | |||||||||
| Intuit, Inc. (a) | 2,670 | 60,475 | |||||||||
| McAfee, Inc. (a) | 3,780 | 115,252 | |||||||||
See Accompanying Notes to Financial Statements.
60
CMG MID CAP GROWTH FUND
A Portfolio of Columbia Funds Institutional Trust
SCHEDULE OF INVESTMENTS
January 31, 2009 (Unaudited)
| Shares | Value | ||||||||||
| Common Stocks (continued) | |||||||||||
| Software (continued) | |||||||||||
| Salesforce.com, Inc. (a) | 2,280 | $ | 60,671 | ||||||||
| Symantec Corp. (a) | 5,330 | 81,709 | |||||||||
| 640,173 | |||||||||||
| 2,978,650 | |||||||||||
| Materials (4.1%) | |||||||||||
| Chemicals (3.7%) | |||||||||||
| CF Industries Holdings, Inc. | 1,380 | 64,860 | |||||||||
| Ecolab, Inc. | 4,290 | 145,689 | |||||||||
| Intrepid Potash, Inc. (a) | 3,755 | 76,527 | |||||||||
| Monsanto Co. | 890 | 67,693 | |||||||||
| Potash Corp. of Saskatchewan, Inc. | 2,500 | 187,150 | |||||||||
| 541,919 | |||||||||||
| Metals & Mining (0.4%) | |||||||||||
| Freeport-McMoRan Copper & Gold, Inc. | 2,257 | 56,741 | |||||||||
| 598,660 | |||||||||||
| Telecommunication Services (1.8%) | |||||||||||
| Wireless Telecommunication Services (1.8%) | |||||||||||
| American Tower Corp., Class A (a) | 8,876 | 269,298 | |||||||||
| Utilities (2.8%) | |||||||||||
| Electric Utilities (1.6%) | |||||||||||
| ITC Holdings Corp. | 1,989 | 83,498 | |||||||||
| PPL Corp. | 4,800 | 147,168 | |||||||||
| 230,666 | |||||||||||
| Gas Utilities (1.2%) | |||||||||||
| Questar Corp. | 5,360 | 182,133 | |||||||||
| 412,799 | |||||||||||
| Total Common Stocks (Cost of $17,085,257) | 14,289,676 | ||||||||||
| Par | Value | ||||||||||
| Short-Term Obligation (4.4%) | |||||||||||
| Repurchase agreement with Fixed Income Clearing Corp., dated 01/30/09, due 02/02/09 at 0.200%, collateralized by a U.S. Treasury Obligation maturing 11/15/12, market value $656,642 (repurchase proceeds $639,011) | $ | 639,000 | $ | 639,000 | |||||||
| Total Short-Term Obligation (Cost of $639,000) | 639,000 | ||||||||||
| Total Investments (101.3%) (Cost of $17,724,257) (b) | 14,928,676 | ||||||||||
| Other Assets & Liabilities, Net (-1.3%) | (184,850 | ) | |||||||||
| Net Assets (100.0%) | $ | 14,743,826 | |||||||||
Notes to Schedule of Investments:
(a) Non-income producing security.
(b) Cost for federal income tax purposes is $17,724,257.
For the six month period ended January 31, 2009, transactions in written option contracts were as follows:
| Number of contracts | Premium received | ||||||||||
| Options outstanding at July 31, 2008 | - | $ | - | ||||||||
| Options written | 42 | 8,168 | |||||||||
| Options terminated in closing purchase transactions | (42 | ) | (8,168 | ) | |||||||
| Options exercised | - | - | |||||||||
| Options expired | - | - | |||||||||
| Options outstanding at January 31, 2009 | - | $ | - | ||||||||
See Accompanying Notes to Financial Statements.
61
CMG MID CAP GROWTH FUND
A Portfolio of Columbia Funds Institutional Trust
SCHEDULE OF INVESTMENTS
January 31, 2009 (Unaudited)
At January 31, 2009, the Fund held investments in the following sectors:
| Sector | % of Net Assets | ||||||
| Information Technology | 20.2 | ||||||
| Consumer Discretionary | 18.4 | ||||||
| Industrials | 17.8 | ||||||
| Health Care | 14.6 | ||||||
| Energy | 8.6 | ||||||
| Financials | 5.3 | ||||||
| Materials | 4.1 | ||||||
| Consumer Staples | 3.3 | ||||||
| Utilities | 2.8 | ||||||
| Telecommunication Services | 1.8 | ||||||
| 96.9 | |||||||
| Short-Term Obligation | 4.4 | ||||||
| Other Assets & Liabilities, Net | (1.3 | ) | |||||
| 100.0 | |||||||
| Acronym | Name | ||||||
| ADR | American Depositary Receipt | ||||||
See Accompanying Notes to Financial Statements.
62
CMG MID CAP VALUE FUND
A Portfolio of Columbia Funds Institutional Trust
SCHEDULE OF INVESTMENTS
January 31, 2009 (Unaudited)
| Shares | Value | ||||||||||
| Common Stocks (95.0%) | |||||||||||
| Consumer Discretionary (9.4%) | |||||||||||
| Auto Components (1.6%) | |||||||||||
| BorgWarner, Inc. | 6,200 | $ | 104,656 | ||||||||
| Johnson Controls, Inc. | 8,350 | 104,459 | |||||||||
| 209,115 | |||||||||||
| Hotels, Restaurants & Leisure (1.3%) | |||||||||||
| Royal Caribbean Cruises Ltd. | 10,000 | 64,900 | |||||||||
| Starwood Hotels & Resorts Worldwide, Inc. | 6,725 | 101,682 | |||||||||
| 166,582 | |||||||||||
| Household Durables (0.8%) | |||||||||||
| Stanley Works | 3,100 | 96,906 | |||||||||
| Leisure Equipment & Products (1.2%) | |||||||||||
| Hasbro, Inc. | 6,400 | 154,432 | |||||||||
| Media (0.7%) | |||||||||||
| Regal Entertainment Group, Class A | 8,701 | 87,358 | |||||||||
| Multiline Retail (0.1%) | |||||||||||
| Saks, Inc. (a) | 6,702 | 16,889 | |||||||||
| Specialty Retail (2.6%) | |||||||||||
| Bed Bath & Beyond, Inc. (a) | 1,600 | 37,168 | |||||||||
| GameStop Corp., Class A (a) | 1,500 | 37,170 | |||||||||
| Gap, Inc. | 8,200 | 92,496 | |||||||||
| Ross Stores, Inc. | 5,600 | 164,752 | |||||||||
| 331,586 | |||||||||||
| Textiles, Apparel & Luxury Goods (1.1%) | |||||||||||
| Polo Ralph Lauren Corp. | 3,600 | 147,708 | |||||||||
| 1,210,576 | |||||||||||
| Consumer Staples (10.8%) | |||||||||||
| Beverages (2.3%) | |||||||||||
| Fomento Economico Mexicano SAB de CV, ADR | 6,075 | 171,011 | |||||||||
| Pepsi Bottling Group, Inc. | 6,900 | 133,101 | |||||||||
| 304,112 | |||||||||||
| Shares | Value | ||||||||||
| Food & Staples Retailing (1.4%) | |||||||||||
| BJ's Wholesale Club, Inc. (a) | 3,000 | $ | 86,040 | ||||||||
| Kroger Co. | 3,950 | 88,875 | |||||||||
| 174,915 | |||||||||||
| Food Products (4.6%) | |||||||||||
| ConAgra Foods, Inc. | 8,600 | 147,060 | |||||||||
| Dean Foods Co. (a) | 10,000 | 193,400 | |||||||||
| Hershey Co. | 3,000 | 111,840 | |||||||||
| JM Smucker Co. | 2,400 | 108,360 | |||||||||
| Smithfield Foods, Inc. (a) | 2,700 | 32,049 | |||||||||
| 592,709 | |||||||||||
| Household Products (0.9%) | |||||||||||
| Clorox Co. | 2,250 | 112,837 | |||||||||
| Personal Products (1.6%) | |||||||||||
| Avon Products, Inc. | 5,700 | 116,565 | |||||||||
| Estee Lauder Companies, Inc., Class A | 3,475 | 91,219 | |||||||||
| 207,784 | |||||||||||
| 1,392,357 | |||||||||||
| Energy (7.9%) | |||||||||||
| Energy Equipment & Services (2.0%) | |||||||||||
| Complete Production Services, Inc. (a) | 7,000 | 44,870 | |||||||||
| National-Oilwell Varco, Inc. (a) | 3,550 | 93,862 | |||||||||
| Noble Corp. | 2,700 | 73,305 | |||||||||
| Rowan Companies, Inc. | 3,825 | 48,424 | |||||||||
| 260,461 | |||||||||||
| Oil, Gas & Consumable Fuels (5.9%) | |||||||||||
| Cabot Oil & Gas Corp. | 4,300 | 118,207 | |||||||||
| El Paso Corp. | 14,500 | 118,610 | |||||||||
| Forest Oil Corp. (a) | 2,800 | 42,000 | |||||||||
| Hess Corp. | 1,675 | 93,147 | |||||||||
| Newfield Exploration Co. (a) | 4,900 | 94,031 | |||||||||
| Peabody Energy Corp. | 3,200 | 80,000 | |||||||||
| Williams Companies, Inc. | 15,100 | 213,665 | |||||||||
| 759,660 | |||||||||||
| 1,020,121 | |||||||||||
See Accompanying Notes to Financial Statements.
63
CMG MID CAP VALUE FUND
A Portfolio of Columbia Funds Institutional Trust
SCHEDULE OF INVESTMENTS
January 31, 2009 (Unaudited)
| Shares | Value | ||||||||||
| Common Stocks (continued) | |||||||||||
| Financials (25.1%) | |||||||||||
| Capital Markets (2.5%) | |||||||||||
| Ameriprise Financial, Inc. | 11,700 | $ | 235,755 | ||||||||
| Greenhill & Co., Inc. | 1,299 | 84,461 | |||||||||
| 320,216 | |||||||||||
| Commercial Banks (8.8%) | |||||||||||
| Bank of Hawaii Corp. | 5,100 | 182,937 | |||||||||
| City National Corp. | 3,900 | 134,979 | |||||||||
| Comerica, Inc. | 10,575 | 176,179 | |||||||||
| Cullen/Frost Bankers, Inc. | 4,925 | 215,567 | |||||||||
| KeyCorp | 9,700 | 70,616 | |||||||||
| Marshall & Ilsley Corp. | 3,725 | 21,270 | |||||||||
| SVB Financial Group (a) | 3,950 | 82,042 | |||||||||
| TCF Financial Corp. | 18,300 | 226,737 | |||||||||
| Zions Bancorporation | 1,675 | 24,991 | |||||||||
| 1,135,318 | |||||||||||
| Insurance (8.2%) | |||||||||||
| ACE Ltd. | 5,544 | 242,051 | |||||||||
| Aon Corp. | 3,400 | 125,970 | |||||||||
| Assurant, Inc. | 2,200 | 58,080 | |||||||||
| Marsh & McLennan Companies, Inc. | 13,500 | 260,955 | |||||||||
| Platinum Underwriters Holdings Ltd. | 5,400 | 150,174 | |||||||||
| Reinsurance Group of America, Inc. | 6,400 | 228,032 | |||||||||
| 1,065,262 | |||||||||||
| Real Estate Investment Trusts (REITs) (5.6%) | |||||||||||
| Alexandria Real Estate Equities, Inc. | 3,100 | 183,954 | |||||||||
| Boston Properties, Inc. | 1,650 | 71,445 | |||||||||
| Equity Residential Property Trust | 3,400 | 81,362 | |||||||||
| Plum Creek Timber Co., Inc. | 4,800 | 147,696 | |||||||||
| ProLogis | 3,500 | 35,035 | |||||||||
| Rayonier, Inc. | 7,000 | 206,080 | |||||||||
| 725,572 | |||||||||||
| 3,246,368 | |||||||||||
| Health Care (7.1%) | |||||||||||
| Health Care Equipment & Supplies (4.2%) | |||||||||||
| Beckman Coulter, Inc. | 3,200 | 159,104 | |||||||||
| Cooper Companies, Inc. | 3,200 | 60,704 | |||||||||
| Hospira, Inc. (a) | 5,375 | 133,838 | |||||||||
| Shares | Value | ||||||||||
| Health Care Equipment & Supplies (continued) | |||||||||||
| Teleflex, Inc. | 3,400 | $ | 180,812 | ||||||||
| 534,458 | |||||||||||
| Health Care Providers & Services (2.3%) | |||||||||||
| AmerisourceBergen Corp. | 3,500 | 127,120 | |||||||||
| Community Health Systems, Inc. (a) | 4,975 | 92,734 | |||||||||
| Universal Health Services, Inc., Class B | 2,100 | 79,485 | |||||||||
| 299,339 | |||||||||||
| Life Sciences Tools & Services (0.6%) | |||||||||||
| Varian, Inc. (a) | 2,900 | 80,736 | |||||||||
| 914,533 | |||||||||||
| Industrials (7.8%) | |||||||||||
| Aerospace & Defense (2.1%) | |||||||||||
| AerCap Holdings NV (a) | 8,000 | 39,040 | |||||||||
| L-3 Communications Holdings, Inc. | 1,700 | 134,334 | |||||||||
| Spirit Aerosystems Holdings, Inc., Class A (a) | 7,107 | 96,655 | |||||||||
| 270,029 | |||||||||||
| Construction & Engineering (0.7%) | |||||||||||
| Jacobs Engineering Group, Inc. (a) | 2,350 | 90,874 | |||||||||
| Electrical Equipment (1.0%) | |||||||||||
| Cooper Industries Ltd., Class A | 4,900 | 131,859 | |||||||||
| Industrial Conglomerates (0.5%) | |||||||||||
| Textron, Inc. | 6,700 | 60,501 | |||||||||
| Machinery (2.2%) | |||||||||||
| Barnes Group, Inc. | 4,118 | 46,534 | |||||||||
| Harsco Corp. | 1,950 | 46,254 | |||||||||
| Kennametal, Inc. | 4,650 | 74,586 | |||||||||
| Parker Hannifin Corp. | 3,225 | 123,227 | |||||||||
| 290,601 | |||||||||||
| Marine (0.7%) | |||||||||||
| Alexander & Baldwin, Inc. | 4,025 | 88,711 | |||||||||
See Accompanying Notes to Financial Statements.
64
CMG MID CAP VALUE FUND
A Portfolio of Columbia Funds Institutional Trust
SCHEDULE OF INVESTMENTS
January 31, 2009 (Unaudited)
| Shares | Value | ||||||||||
| Common Stocks (continued) | |||||||||||
| Road & Rail (0.6%) | |||||||||||
| Canadian Pacific Railway Ltd. | 2,400 | $ | 72,624 | ||||||||
| 1,005,199 | |||||||||||
| Information Technology (6.5%) | |||||||||||
| Computers & Peripherals (2.0%) | |||||||||||
| Diebold, Inc. | 4,100 | 101,598 | |||||||||
| NCR Corp. (a) | 12,600 | 158,130 | |||||||||
| 259,728 | |||||||||||
| Electronic Equipment, Instruments & Components (2.0%) | |||||||||||
| Agilent Technologies, Inc. (a) | 2,900 | 52,432 | |||||||||
| Arrow Electronics, Inc. (a) | 6,325 | 120,618 | |||||||||
| Mettler-Toledo International, Inc. (a) | 1,200 | 79,896 | |||||||||
| 252,946 | |||||||||||
| Internet Software & Services (0.5%) | |||||||||||
| VeriSign, Inc. (a) | 3,700 | 71,447 | |||||||||
| Semiconductors & Semiconductor Equipment (0.5%) | |||||||||||
| Intersil Corp., Class A | 2,700 | 25,137 | |||||||||
| Marvell Technology Group Ltd. (a) | 2,900 | 21,141 | |||||||||
| Verigy Ltd. (a) | 1,983 | 16,479 | |||||||||
| 62,757 | |||||||||||
| Software (1.5%) | |||||||||||
| Activision Blizzard, Inc. (a) | 2,966 | 25,982 | |||||||||
| Citrix Systems, Inc. (a) | 3,300 | 69,432 | |||||||||
| Synopsys, Inc. (a) | 5,250 | 97,125 | |||||||||
| 192,539 | |||||||||||
| 839,417 | |||||||||||
| Materials (7.0%) | |||||||||||
| Chemicals (2.7%) | |||||||||||
| Air Products & Chemicals, Inc. | 2,750 | 138,325 | |||||||||
| Albemarle Corp. | 3,525 | 78,431 | |||||||||
| PPG Industries, Inc. | 3,600 | 135,288 | |||||||||
| 352,044 | |||||||||||
| Containers & Packaging (2.4%) | |||||||||||
| Crown Holdings, Inc. (a) | 8,400 | 157,500 | |||||||||
| Packaging Corp. of America | 11,000 | 156,200 | |||||||||
| 313,700 | |||||||||||
| Shares | Value | ||||||||||
| Metals & Mining (0.4%) | |||||||||||
| Allegheny Technologies, Inc. | 2,500 | $ | 55,225 | ||||||||
| Paper & Forest Products (1.5%) | |||||||||||
| Weyerhaeuser Co. | 6,909 | 188,892 | |||||||||
| 909,861 | |||||||||||
| Utilities (13.4%) | |||||||||||
| Electric Utilities (4.9%) | |||||||||||
| American Electric Power Co., Inc. | 3,000 | 94,050 | |||||||||
| Edison International | 6,175 | 201,120 | |||||||||
| Entergy Corp. | 1,600 | 122,176 | |||||||||
| FPL Group, Inc. | 3,475 | 179,136 | |||||||||
| Northeast Utilities | 1,454 | 34,605 | |||||||||
| 631,087 | |||||||||||
| Gas Utilities (1.3%) | |||||||||||
| AGL Resources, Inc. | 5,575 | 171,877 | |||||||||
| Multi-Utilities (7.2%) | |||||||||||
| PG&E Corp. | 8,725 | 337,396 | |||||||||
| Public Service Enterprise Group, Inc. | 4,200 | 132,594 | |||||||||
| Sempra Energy | 5,275 | 231,256 | |||||||||
| Wisconsin Energy Corp. | 5,300 | 236,274 | |||||||||
| 937,520 | |||||||||||
| 1,740,484 | |||||||||||
| Total Common Stocks (Cost of $17,124,209) | 12,278,916 | ||||||||||
| Convertible Preferred Stock (0.5%) | |||||||||||
| Materials (0.5%) | |||||||||||
| Metals & Mining (0.5%) | |||||||||||
| Freeport-McMoRan Copper & Gold, Inc., 6.750% | 1,500 | 69,900 | |||||||||
| Total Convertible Preferred Stock (Cost of $62,015) | 69,900 | ||||||||||
See Accompanying Notes to Financial Statements.
65
CMG MID CAP VALUE FUND
A Portfolio of Columbia Funds Institutional Trust
SCHEDULE OF INVESTMENTS
January 31, 2009 (Unaudited)
| Par | Value | ||||||||||
| Convertible Bond (0.2%) | |||||||||||
| Financials (0.2%) | |||||||||||
| Real Estate Investment Trusts (REITs) (0.2%) | |||||||||||
| Vornado Realty Trust 3.625% 11/15/26 | $ | 40,000 | $ | 32,500 | |||||||
| Total Convertible Bond (Cost of $31,720) | 32,500 | ||||||||||
| Short-Term Obligation (7.1%) | |||||||||||
| Repurchase agreement with Fixed Income Clearing Corp., dated 01/30/09 due 02/02/09 at 0.200%, collateralized by U.S. Treasury Obligation maturing 02/15/36, market value $933,478 (repurchase proceeds $912,015) | 912,000 | 912,000 | |||||||||
| Total Short-Term Obligation (Cost of $912,000) | 912,000 | ||||||||||
| Total Investments (102.8%) (Cost of $18,129,944) (b) | 13,293,316 | ||||||||||
| Other Assets & Liabilities, Net (-2.8%) | (366,971 | ) | |||||||||
| Net Assets (100.0%) | $ | 12,926,345 | |||||||||
Notes to Schedule of Investments:
(a) Non-income producing security.
(b) Cost for federal income tax purposes is $18,129,944.
At January 31, 2009, the Fund held investments in the following sectors:
| Sector | % of Net Assets | ||||||
| Financials | 25.3 | ||||||
| Utilities | 13.4 | ||||||
| Consumer Staples | 10.8 | ||||||
| Consumer Discretionary | 9.4 | ||||||
| Energy | 7.9 | ||||||
| Industrials | 7.8 | ||||||
| Materials | 7.5 | ||||||
| Health Care | 7.1 | ||||||
| Information Technology | 6.5 | ||||||
| 95.7 | |||||||
| Short-Term Obligation | 7.1 | ||||||
| Other Assets & Liabilities, Net | (2.8 | ) | |||||
| 100.0 | |||||||
| Acronym | Name | ||||||
| ADR | American Depositary Receipt | ||||||
See Accompanying Notes to Financial Statements.
66
CMG SMALL CAP GROWTH FUND
A Portfolio of Columbia Funds Institutional Trust
SCHEDULE OF INVESTMENTS
January 31, 2009 (Unaudited)
| Shares | Value | ||||||||||
| Common Stocks (93.4%) | |||||||||||
| Consumer Discretionary (12.2%) | |||||||||||
| Distributors (0.8%) | |||||||||||
| LKQ Corp. (a) | 18,290 | $ | 211,250 | ||||||||
| Diversified Consumer Services (4.2%) | |||||||||||
| American Public Education, Inc. (a) | 5,270 | 206,373 | |||||||||
| Capella Education Co. (a) | 3,445 | 190,612 | |||||||||
| Coinstar, Inc. (a) | 10,660 | 244,967 | |||||||||
| Corinthian Colleges, Inc. (a) | 22,890 | 427,585 | |||||||||
| Steiner Leisure Ltd. (a) | 4,310 | 107,448 | |||||||||
| 1,176,985 | |||||||||||
| Hotels, Restaurants & Leisure (3.3%) | |||||||||||
| Bally Technologies, Inc. (a) | 7,300 | 147,387 | |||||||||
| BJ's Restaurants, Inc. (a) | 11,410 | 126,651 | |||||||||
| P.F. Chang's China Bistro, Inc. (a) | 6,850 | 121,450 | |||||||||
| Panera Bread Co., Class A (a) | 3,310 | 155,504 | |||||||||
| Texas Roadhouse, Inc., Class A (a) | 24,500 | 186,935 | |||||||||
| WMS Industries, Inc. (a) | 8,140 | 180,871 | |||||||||
| 918,798 | |||||||||||
| Media (1.0%) | |||||||||||
| Marvel Entertainment, Inc. (a) | 10,030 | 275,925 | |||||||||
| Specialty Retail (2.2%) | |||||||||||
| Aeropostale, Inc. (a) | 8,331 | 175,868 | |||||||||
| Children's Place Retail Stores, Inc. (a) | 6,910 | 129,977 | |||||||||
| Guess ?, Inc. | 7,480 | 120,353 | |||||||||
| Gymboree Corp. (a) | 7,140 | 174,930 | |||||||||
| 601,128 | |||||||||||
| Textiles, Apparel & Luxury Goods (0.7%) | |||||||||||
| Deckers Outdoor Corp. (a) | 3,980 | 207,915 | |||||||||
| 3,392,001 | |||||||||||
| Consumer Staples (3.4%) | |||||||||||
| Food & Staples Retailing (0.4%) | |||||||||||
| BJ's Wholesale Club, Inc. (a) | 3,432 | 98,430 | |||||||||
| Food Products (1.7%) | |||||||||||
| Diamond Foods, Inc. | 7,080 | 181,814 | |||||||||
| Flowers Foods, Inc. | 8,860 | 190,401 | |||||||||
| Green Mountain Coffee Roasters, Inc. (a) | 2,930 | 112,102 | |||||||||
| 484,317 | |||||||||||
| Shares | Value | ||||||||||
| Personal Products (1.3%) | |||||||||||
| Chattem, Inc. (a) | 5,290 | $ | 357,604 | ||||||||
| 940,351 | |||||||||||
| Energy (6.9%) | |||||||||||
| Energy Equipment & Services (2.8%) | |||||||||||
| Atwood Oceanics, Inc. (a) | 14,500 | 241,425 | |||||||||
| CARBO Ceramics, Inc. | 3,280 | 117,916 | |||||||||
| Core Laboratories N.V. | 6,150 | 413,218 | |||||||||
| 772,559 | |||||||||||
| Oil, Gas & Consumable Fuels (4.1%) | |||||||||||
| Arena Resources, Inc. (a) | 12,779 | 311,296 | |||||||||
| Carrizo Oil & Gas, Inc. (a) | 4,860 | 67,360 | |||||||||
| Comstock Resources, Inc. (a) | 1,378 | 52,543 | |||||||||
| Concho Resources, Inc. (a) | 18,416 | 464,452 | |||||||||
| Holly Corp. | 5,870 | 137,182 | |||||||||
| Penn Virginia Corp. | 5,620 | 115,772 | |||||||||
| 1,148,605 | |||||||||||
| 1,921,164 | |||||||||||
| Financials (5.4%) | |||||||||||
| Capital Markets (2.7%) | |||||||||||
| Cohen & Steers, Inc. | 11,500 | 124,200 | |||||||||
| Greenhill & Co., Inc. | 3,080 | 200,262 | |||||||||
| KBW, Inc. (a) | 3,343 | 62,781 | |||||||||
| optionsXpress Holdings, Inc. | 13,430 | 146,253 | |||||||||
| Waddell & Reed Financial, Inc., Class A | 16,020 | 226,202 | |||||||||
| 759,698 | |||||||||||
| Commercial Banks (0.9%) | |||||||||||
| Glacier Bancorp, Inc. | 7,779 | 119,408 | |||||||||
| TCF Financial Corp. | 9,193 | 113,901 | |||||||||
| 233,309 | |||||||||||
| Real Estate Investment Trusts (REITs) (1.8%) | |||||||||||
| Home Properties, Inc. | 6,890 | 247,282 | |||||||||
| Redwood Trust, Inc. | 9,721 | 123,360 | |||||||||
| Washington Real Estate Investment Trust | 5,730 | 136,431 | |||||||||
| 507,073 | |||||||||||
| 1,500,080 | |||||||||||
See Accompanying Notes to Financial Statements.
67
CMG SMALL CAP GROWTH FUND
A Portfolio of Columbia Funds Institutional Trust
SCHEDULE OF INVESTMENTS
January 31, 2009 (Unaudited)
| Shares | Value | ||||||||||
| Common Stocks (continued) | |||||||||||
| Health Care (26.8%) | |||||||||||
| Biotechnology (8.0%) | |||||||||||
| Acorda Therapeutics, Inc. (a) | 7,720 | $ | 189,372 | ||||||||
| Alexion Pharmaceuticals, Inc. (a) | 14,300 | 527,241 | |||||||||
| Allos Therapeutics, Inc. (a) | 22,880 | 179,150 | |||||||||
| BioMarin Pharmaceuticals, Inc. (a) | 8,700 | 167,562 | |||||||||
| Celera Corp. (a) | 12,800 | 108,032 | |||||||||
| Myriad Genetics, Inc. (a) | 1,920 | 143,174 | |||||||||
| Onyx Pharmaceuticals, Inc. (a) | 10,300 | 313,429 | |||||||||
| OSI Pharmaceuticals, Inc. (a) | 11,010 | 391,956 | |||||||||
| United Therapeutics Corp. (a) | 3,010 | 204,530 | |||||||||
| 2,224,446 | |||||||||||
| Health Care Equipment & Supplies (5.8%) | |||||||||||
| Haemonetics Corp. (a) | 2,330 | 137,819 | |||||||||
| Immucor, Inc. (a) | 10,090 | 279,594 | |||||||||
| Masimo Corp. (a) | 11,758 | 326,520 | |||||||||
| NuVasive, Inc. (a) | 14,820 | 553,379 | |||||||||
| Thoratec Corp. (a) | 11,160 | 323,305 | |||||||||
| 1,620,617 | |||||||||||
| Health Care Providers & Services (7.3%) | |||||||||||
| CardioNet, Inc. (a) | 13,479 | 305,704 | |||||||||
| Catalyst Health Solutions, Inc. (a) | 9,277 | 204,279 | |||||||||
| Genoptix, Inc. (a) | 8,110 | 274,929 | |||||||||
| HMS Holdings Corp. (a) | 4,740 | 146,703 | |||||||||
| IPC The Hospitalist Co., Inc. (a) | 11,633 | 222,656 | |||||||||
| LHC Group, Inc. (a) | 7,330 | 195,051 | |||||||||
| Owens & Minor, Inc. | 5,760 | 229,075 | |||||||||
| Psychiatric Solutions, Inc. (a) | 16,567 | 430,742 | |||||||||
| 2,009,139 | |||||||||||
| Health Care Technology (1.0%) | |||||||||||
| Omnicell, Inc. (a) | 21,860 | 170,727 | |||||||||
| Phase Forward, Inc. (a) | 8,118 | 109,593 | |||||||||
| 280,320 | |||||||||||
| Life Sciences Tools & Services (3.1%) | |||||||||||
| ICON PLC, ADR (a) | 33,710 | 677,571 | |||||||||
| Illumina, Inc. (a) | 6,580 | 180,029 | |||||||||
| 857,600 | |||||||||||
| Shares | Value | ||||||||||
| Pharmaceuticals (1.6%) | |||||||||||
| Cypress Bioscience, Inc. (a) | 14,680 | $ | 124,780 | ||||||||
| Perrigo Co. | 10,850 | 318,447 | |||||||||
| 443,227 | |||||||||||
| 7,435,349 | |||||||||||
| Industrials (14.0%) | |||||||||||
| Aerospace & Defense (1.9%) | |||||||||||
| HEICO Corp. | 4,470 | 176,699 | |||||||||
| Orbital Sciences Corp. (a) | 9,260 | 155,290 | |||||||||
| Teledyne Technologies, Inc. (a) | 6,500 | 181,155 | |||||||||
| 513,144 | |||||||||||
| Air Freight & Logistics (0.7%) | |||||||||||
| HUB Group, Inc., Class A (a) | 8,615 | 195,561 | |||||||||
| Commercial Services & Supplies (2.8%) | |||||||||||
| Clean Harbors, Inc. (a) | 4,800 | 256,848 | |||||||||
| Geo Group, Inc. (a) | 10,520 | 155,696 | |||||||||
| Waste Connections, Inc. (a) | 11,790 | 342,146 | |||||||||
| 754,690 | |||||||||||
| Construction & Engineering (1.2%) | |||||||||||
| EMCOR Group, Inc. (a) | 9,790 | 201,576 | |||||||||
| Orion Marine Group, Inc. (a) | 4,349 | 43,055 | |||||||||
| Pike Electric Corp. (a) | 8,253 | 92,846 | |||||||||
| 337,477 | �� | ||||||||||
| Electrical Equipment (1.8%) | |||||||||||
| Acuity Brands, Inc. | 6,430 | 172,774 | |||||||||
| Energy Conversion Devices, Inc. (a) | 4,050 | 101,939 | |||||||||
| Woodward Governor Co. | 10,990 | 226,064 | |||||||||
| 500,777 | |||||||||||
| Machinery (1.9%) | |||||||||||
| Kaydon Corp. | 3,900 | 106,080 | |||||||||
| Key Technology, Inc. (a) | 5,244 | 69,535 | |||||||||
| RBC Bearings, Inc. (a) | 9,941 | 181,721 | |||||||||
| Wabtec Corp. | 5,750 | 172,098 | |||||||||
| 529,434 | |||||||||||
See Accompanying Notes to Financial Statements.
68
CMG SMALL CAP GROWTH FUND
A Portfolio of Columbia Funds Institutional Trust
SCHEDULE OF INVESTMENTS
January 31, 2009 (Unaudited)
| Shares | Value | ||||||||||
| Common Stocks (continued) | |||||||||||
| Professional Services (1.9%) | |||||||||||
| Huron Consulting Group, Inc. (a) | 4,200 | $ | 209,916 | ||||||||
| Watson Wyatt Worldwide, Inc., Class A | 6,932 | 322,338 | |||||||||
| 532,254 | |||||||||||
| Road & Rail (1.8%) | |||||||||||
| Genesee & Wyoming, Inc., Class A (a) | 6,950 | 188,832 | |||||||||
| Landstar System, Inc. | 3,840 | 137,741 | |||||||||
| Old Dominion Freight Line, Inc. (a) | 7,040 | 176,563 | |||||||||
| 503,136 | |||||||||||
| 3,866,473 | |||||||||||
| Information Technology (19.5%) | |||||||||||
| Communications Equipment (2.3%) | |||||||||||
| F5 Networks, Inc. (a) | 9,050 | 200,638 | |||||||||
| Neutral Tandem, Inc. (a) | 20,168 | 319,461 | |||||||||
| NICE Systems Ltd., ADR (a) | 5,900 | 113,221 | |||||||||
| 633,320 | |||||||||||
| Computers & Peripherals (1.1%) | |||||||||||
| Synaptics, Inc. (a) | 12,900 | 304,053 | |||||||||
| Internet Software & Services (2.3%) | |||||||||||
| Equinix, Inc. (a) | 3,805 | 202,997 | |||||||||
| VistaPrint Ltd. (a) | 8,810 | 201,749 | |||||||||
| Vocus, Inc. (a) | 14,465 | 220,736 | |||||||||
| 625,482 | |||||||||||
| IT Services (1.6%) | |||||||||||
| Cybersource Corp. (a) | 9,716 | 115,912 | |||||||||
| Gartner, Inc. (a) | 8,360 | 118,377 | |||||||||
| Integral Systems, Inc. (a) | 10,180 | 111,267 | |||||||||
| Wright Express Corp. (a) | 8,510 | 99,227 | |||||||||
| 444,783 | |||||||||||
| Semiconductors & Semiconductor Equipment (3.2%) | |||||||||||
| FEI Co. (a) | 11,870 | 216,034 | |||||||||
| Hittite Microwave Corp. (a) | 5,290 | 135,530 | |||||||||
| Microsemi Corp. (a) | 17,060 | 143,304 | |||||||||
| MKS Instruments, Inc. (a) | 9,950 | 139,797 | |||||||||
| Monolithic Power Systems, Inc. (a) | 10,990 | 133,529 | |||||||||
| Silicon Laboratories, Inc. (a) | 5,770 | 132,883 | |||||||||
| 901,077 | |||||||||||
| Shares | Value | ||||||||||
| Software (9.0%) | |||||||||||
| Blackboard, Inc. (a) | 12,996 | $ | 330,228 | ||||||||
| Concur Technologies, Inc. (a) | 5,231 | 129,154 | |||||||||
| FactSet Research Systems, Inc. | 4,710 | 187,458 | |||||||||
| Informatica Corp. (a) | 22,670 | 289,269 | |||||||||
| Jack Henry & Associates, Inc. | 6,880 | 122,464 | |||||||||
| Lawson Software, Inc. (a) | 29,550 | 124,701 | |||||||||
| Micros Systems, Inc. (a) | 8,920 | 128,448 | |||||||||
| Netscout Systems, Inc. (a) | 15,330 | 217,993 | |||||||||
| Solera Holdings, Inc. (a) | 19,620 | 472,646 | |||||||||
| SPSS, Inc. (a) | 5,440 | 139,699 | |||||||||
| Sybase, Inc. (a) | 12,910 | 352,572 | |||||||||
| 2,494,632 | |||||||||||
| 5,403,347 | |||||||||||
| Materials (3.3%) | |||||||||||
| Chemicals (2.3%) | |||||||||||
| CF Industries Holdings, Inc. | 3,830 | 180,010 | |||||||||
| Intrepid Potash, Inc. (a) | 22,100 | 450,398 | |||||||||
| 630,408 | |||||||||||
| Containers & Packaging (1.0%) | |||||||||||
| Silgan Holdings, Inc. | 6,370 | 292,001 | |||||||||
| 922,409 | |||||||||||
| Telecommunication Services (1.3%) | |||||||||||
| Wireless Telecommunication Services (1.3%) | |||||||||||
| SBA Communications Corp., Class A (a) | 17,810 | 354,419 | |||||||||
| Utilities (0.6%) | |||||||||||
| Electric Utilities (0.6%) | |||||||||||
| ITC Holdings Corp. | 4,170 | 175,057 | |||||||||
| Total Common Stocks (Cost of $28,508,131) | 25,910,650 | ||||||||||
See Accompanying Notes to Financial Statements.
69
CMG SMALL CAP GROWTH FUND
A Portfolio of Columbia Funds Institutional Trust
SCHEDULE OF INVESTMENTS
January 31, 2009 (Unaudited)
| Par | Value | ||||||||||
| Short-Term Obligation (5.6%) | |||||||||||
| Repurchase agreement with Fixed Income Clearing Corp., dated 01/30/09, due 02/02/09 at 0.200%, collateralized by a U.S. Treasury Obligation maturing 05/15/13, market value $1,579,241 (repurchase proceeds $1,544,026) | $ | 1,544,000 | $ | 1,544,000 | |||||||
| Total Short-Term Obligation (Cost of $1,544,000) | 1,544,000 | ||||||||||
| Total Investments (99.0%) (Cost of $30,052,131) (b) | 27,454,650 | ||||||||||
| Other Assets & Liabilities, Net (1.0%) | 273,284 | ||||||||||
| Net Assets (100.0%) | $ | 27,727,934 | |||||||||
Notes to Schedule of Investments:
(a) Non-income producing security.
(b) Cost for federal income tax purposes is $30,052,131.
| Acronym | Name | ||||||
| ADR | American Depositary Receipt | ||||||
For the six month period ended January 31, 2009, transactions in written option contracts were as follows:
| Number of contracts | Premium received | ||||||||||
| Options outstanding at July 31, 2008 | 65 | $ | 8,362 | ||||||||
| Options written | - | - | |||||||||
| Options terminated in closing purchase transactions | (19 | ) | (2,603 | ) | |||||||
| Options exercised | - | - | |||||||||
| Options expired | (46 | ) | (5,759 | ) | |||||||
| Options outstanding at January 31, 2009 | - | $ | - | ||||||||
At January 31, 2009, the Fund held investments in the following sectors:
| Sector | % of Net Assets | ||||||
| Health Care | 26.8 | ||||||
| Information Technology | 19.5 | ||||||
| Industrials | 14.0 | ||||||
| Consumer Discretionary | 12.2 | ||||||
| Energy | 6.9 | ||||||
| Financials | 5.4 | ||||||
| Consumer Staples | 3.4 | ||||||
| Materials | 3.3 | ||||||
| Telecommunication Services | 1.3 | ||||||
| Utilities | 0.6 | ||||||
| 93.4 | |||||||
| Short-Term Obligation | 5.6 | ||||||
| Other Assets & Liabilities, Net | 1.0 | ||||||
| 100.0 | |||||||
See Accompanying Notes to Financial Statements.
70
CMG SMALL CAP VALUE FUND
A Portfolio of Columbia Funds Institutional Trust
SCHEDULE OF INVESTMENTS
January 31, 2009 (Unaudited)
| Shares | Value | ||||||||||
| Common Stocks (89.7%) | |||||||||||
| Consumer Discretionary (7.1%) | |||||||||||
| Auto Components (0.3%) | |||||||||||
| BorgWarner, Inc. | 4,230 | $ | 71,402 | ||||||||
| Diversified Consumer Services (0.4%) | |||||||||||
| Regis Corp. | 4,577 | 51,491 | |||||||||
| Sotheby's | 4,975 | 43,233 | |||||||||
| 94,724 | |||||||||||
| Hotels, Restaurants & Leisure (1.6%) | |||||||||||
| Benihana, Inc., Class A (a) | 17,301 | 42,215 | |||||||||
| Bob Evans Farms, Inc. | 4,725 | 82,971 | |||||||||
| CEC Entertainment, Inc. (a) | 3,830 | 89,392 | |||||||||
| Jack in the Box, Inc. (a) | 4,060 | 91,715 | |||||||||
| Landry's Restaurants, Inc. | 6,310 | 40,763 | |||||||||
| Red Robin Gourmet Burgers, Inc. (a) | 4,555 | 55,480 | |||||||||
| 402,536 | |||||||||||
| Household Durables (1.1%) | |||||||||||
| American Greetings Corp., Class A | 12,860 | 55,812 | |||||||||
| Cavco Industries, Inc. (a) | 2,715 | 66,463 | |||||||||
| CSS Industries, Inc. | 3,925 | 59,542 | |||||||||
| Ethan Allen Interiors, Inc. | 3,815 | 43,453 | |||||||||
| Furniture Brands International, Inc. | 12,770 | 26,179 | |||||||||
| Universal Electronics, Inc. (a) | 1,911 | 21,556 | |||||||||
| 273,005 | |||||||||||
| Internet & Catalog Retail (0.2%) | |||||||||||
| NutriSystem, Inc. | 3,790 | 48,853 | |||||||||
| Leisure Equipment & Products (0.2%) | |||||||||||
| Brunswick Corp. | 14,933 | 41,514 | |||||||||
| Specialty Retail (2.5%) | |||||||||||
| America's Car-Mart, Inc. (a) | 9,923 | 90,200 | |||||||||
| AnnTaylor Stores Corp. (a) | 10,525 | 51,783 | |||||||||
| Foot Locker, Inc. | 6,146 | 45,235 | |||||||||
| Monro Muffler Brake, Inc. | 5,965 | 144,770 | |||||||||
| OfficeMax, Inc. | 12,800 | 70,528 | |||||||||
| Rent-A-Center, Inc. (a) | 10,159 | 150,861 | |||||||||
| Shoe Carnival, Inc. (a) | 6,355 | 49,887 | |||||||||
| 603,264 | |||||||||||
| Shares | Value | ||||||||||
| Textiles, Apparel & Luxury Goods (0.8%) | |||||||||||
| Hampshire Group Ltd. (a) | 3,855 | $ | 12,143 | ||||||||
| Movado Group, Inc. | 8,070 | 61,978 | |||||||||
| Phillips-Van Heusen Corp. | 2,905 | 55,253 | |||||||||
| Wolverine World Wide, Inc. | 3,945 | 71,562 | |||||||||
| 200,936 | |||||||||||
| 1,736,234 | |||||||||||
| Consumer Staples (5.5%) | |||||||||||
| Food & Staples Retailing (2.6%) | |||||||||||
| BJ's Wholesale Club, Inc. (a) | 4,005 | 114,863 | |||||||||
| Casey's General Stores, Inc. | 4,130 | 87,763 | |||||||||
| Ruddick Corp. | 4,275 | 102,814 | |||||||||
| Spartan Stores, Inc. | 3,485 | 64,751 | |||||||||
| Weis Markets, Inc. | 6,830 | 212,481 | |||||||||
| Whole Foods Market, Inc. | 5,475 | 56,119 | |||||||||
| 638,791 | |||||||||||
| Food Products (2.4%) | |||||||||||
| Flowers Foods, Inc. | 3,043 | 65,394 | |||||||||
| Fresh Del Monte Produce, Inc. (a) | 6,470 | 155,927 | |||||||||
| J & J Snack Foods Corp. | 2,598 | 90,696 | |||||||||
| Lancaster Colony Corp. | 2,015 | 73,366 | |||||||||
| Lance, Inc. | 4,013 | 75,565 | |||||||||
| Ralcorp Holdings, Inc. (a) | 1,935 | 114,591 | |||||||||
| 575,539 | |||||||||||
| Personal Products (0.5%) | |||||||||||
| NBTY, Inc. (a) | 6,525 | 123,127 | |||||||||
| 1,337,457 | |||||||||||
| Energy (3.0%) | |||||||||||
| Energy Equipment & Services (1.2%) | |||||||||||
| Lufkin Industries, Inc. | 3,220 | 112,539 | |||||||||
| Patterson-UTI Energy, Inc. | 3,155 | 30,162 | |||||||||
| TGC Industries, Inc. (a) | 9,544 | 21,760 | |||||||||
| Tidewater, Inc. | 3,000 | 124,830 | |||||||||
| 289,291 | |||||||||||
| Oil, Gas & Consumable Fuels (1.8%) | |||||||||||
| Comstock Resources, Inc. (a) | 1,690 | 64,440 | |||||||||
| Holly Corp. | 7,105 | 166,044 | |||||||||
| Nordic American Tanker Shipping | 2,638 | 75,605 | |||||||||
| Stone Energy Corp. (a) | 7,600 | 65,208 | |||||||||
| Swift Energy Co. (a) | 5,140 | 78,745 | |||||||||
| 450,042 | |||||||||||
| 739,333 | |||||||||||
See Accompanying Notes to Financial Statements.
71
CMG SMALL CAP VALUE FUND
A Portfolio of Columbia Funds Institutional Trust
SCHEDULE OF INVESTMENTS
January 31, 2009 (Unaudited)
| Shares | Value | ||||||||||
| Common Stocks (continued) | |||||||||||
| Financials (30.3%) | |||||||||||
| Capital Markets (1.0%) | |||||||||||
| Federated Investors, Inc., Class B | 4,350 | $ | 84,912 | ||||||||
| Janus Capital Group, Inc. | 9,450 | 49,612 | |||||||||
| Piper Jaffray Companies, Inc. (a) | 3,716 | 106,686 | |||||||||
| Virtus Investment Partners, Inc. (a) | 1,276 | 7,733 | |||||||||
| 248,943 | |||||||||||
| Commercial Banks (7.7%) | |||||||||||
| BancFirst Corp. | 3,285 | 117,012 | |||||||||
| BancTrust Financial Group, Inc. | 10,832 | 96,080 | |||||||||
| Bank of Granite Corp. | 11,922 | 37,435 | |||||||||
| Bryn Mawr Bank Corp. | 6,561 | 121,904 | |||||||||
| Capital Corp. of the West | 9,117 | 7,020 | |||||||||
| Capitol Bancorp Ltd. | 8,116 | 48,777 | |||||||||
| Chemical Financial Corp. | 8,935 | 203,718 | |||||||||
| Columbia Banking System, Inc. | 6,760 | 60,164 | |||||||||
| Community Trust Bancorp, Inc. | 4,170 | 116,635 | |||||||||
| First Citizens BancShares, Inc., Class A | 1,264 | 176,783 | |||||||||
| First Financial Corp. | 5,464 | 181,132 | |||||||||
| First National Bank of Alaska | 43 | 61,490 | |||||||||
| Mass Financial Corp., Class A (a) | 13,010 | 51,129 | |||||||||
| Merchants Bancshares, Inc. | 6,283 | 122,833 | |||||||||
| Northfield Bancorp, Inc. | 8,199 | 81,498 | |||||||||
| Northrim BanCorp, Inc. | 7,169 | 72,120 | |||||||||
| South Financial Group, Inc. | 19,290 | 36,265 | |||||||||
| Sterling Bancorp NY | 9,805 | 108,051 | |||||||||
| Taylor Capital Group, Inc. | 7,445 | 47,574 | |||||||||
| West Coast Bancorp | 9,355 | 27,784 | |||||||||
| Whitney Holding Corp. | 8,270 | 107,427 | |||||||||
| 1,882,831 | |||||||||||
| Consumer Finance (0.5%) | |||||||||||
| Cash America International, Inc. | 7,225 | 132,073 | |||||||||
| Diversified Financial Services (0.7%) | |||||||||||
| Medallion Financial Corp. | 15,763 | 106,558 | |||||||||
| Pico Holdings, Inc. (a) | 2,740 | 69,651 | |||||||||
| 176,209 | |||||||||||
| Insurance (7.7%) | |||||||||||
| Baldwin & Lyons, Inc., Class B | 5,871 | 98,574 | |||||||||
| CNA Surety Corp. (a) | 10,773 | 178,293 | |||||||||
| eHealth, Inc. (a) | 5,628 | 77,779 | |||||||||
| EMC Insurance Group, Inc. | 6,525 | 126,715 | |||||||||
| FBL Financial Group, Inc. Class A | 4,930 | 50,828 | |||||||||
| Shares | Value | ||||||||||
| Insurance (continued) | |||||||||||
| Genworth Financial, Inc., Class A | 11,212 | $ | 26,012 | ||||||||
| Harleysville Group, Inc. | 3,390 | 96,412 | |||||||||
| Horace Mann Educators Corp. | 13,005 | 121,597 | |||||||||
| National Western Life Insurance Co., Class A | 684 | 84,905 | |||||||||
| Navigators Group, Inc. (a) | 3,449 | 177,072 | |||||||||
| Phoenix Companies, Inc. | 26,426 | 46,245 | |||||||||
| RAM Holdings Ltd. (a) | 28,518 | 13,974 | |||||||||
| RLI Corp. | 2,252 | 127,215 | |||||||||
| Safety Insurance Group, Inc. | 4,690 | 164,244 | |||||||||
| Selective Insurance Group, Inc. | 6,570 | 100,849 | |||||||||
| Stewart Information Services Corp. | 6,880 | 102,099 | |||||||||
| United America Indemnity Ltd., Class A (a) | 20,794 | 220,001 | |||||||||
| United Fire & Casualty Co. | 2,555 | 51,228 | |||||||||
| 1,864,042 | |||||||||||
| Real Estate Investment Trusts (REITs) (6.5%) | |||||||||||
| DCT Industrial Trust, Inc. | 23,278 | 84,965 | |||||||||
| DiamondRock Hospitality Co. | 21,015 | 86,161 | |||||||||
| Duke Realty Corp. | 7,360 | 67,786 | |||||||||
| DuPont Fabros Technology, Inc. | 10,211 | 38,087 | |||||||||
| Franklin Street Properties Corp. | 13,706 | 156,522 | |||||||||
| Getty Realty Corp. | 4,450 | 92,293 | |||||||||
| LaSalle Hotel Properties | 8,964 | 74,670 | |||||||||
| Mack-Cali Realty Corp. | 2,225 | 45,212 | |||||||||
| National Health Investors, Inc. | 5,687 | 148,146 | |||||||||
| National Retail Properties, Inc. | 9,660 | 139,394 | |||||||||
| Potlatch Corp. | 7,325 | 184,517 | |||||||||
| Sun Communities, Inc. | 9,565 | 114,780 | |||||||||
| Sunstone Hotel Investors, Inc. | 13,638 | 58,780 | |||||||||
| Universal Health Realty Income Trust | 4,760 | 145,656 | |||||||||
| Urstadt Biddle Properties, Inc., Class A | 8,810 | 130,300 | |||||||||
| 1,567,269 | |||||||||||
| Real Estate Management & Development (0.4%) | |||||||||||
| Avatar Holdings, Inc. (a) | 2,315 | 60,074 | |||||||||
| Maui Land & Pineapple Co., Inc. (a) | 4,831 | 44,590 | |||||||||
| 104,664 | |||||||||||
| Thrifts & Mortgage Finance (5.8%) | |||||||||||
| Bank Mutual Corp. | 15,940 | 140,750 | |||||||||
| BankFinancial Corp. | 11,485 | 110,601 | |||||||||
See Accompanying Notes to Financial Statements.
72
CMG SMALL CAP VALUE FUND
A Portfolio of Columbia Funds Institutional Trust
SCHEDULE OF INVESTMENTS
January 31, 2009 (Unaudited)
| Shares | Value | ||||||||||
| Common Stocks (continued) | |||||||||||
| Thrifts & Mortgage Finance (continued) | |||||||||||
| Beneficial Mutual Bancorp, Inc. (a) | 13,417 | $ | 128,535 | ||||||||
| Brookline Bancorp, Inc. | 17,910 | 173,190 | |||||||||
| Clifton Savings Bancorp, Inc. | 10,860 | 113,378 | |||||||||
| Corus Bankshares, Inc. | 24,867 | 27,602 | |||||||||
| ESSA Bancorp, Inc. | 7,217 | 96,275 | |||||||||
| Home Federal Bancorp, Inc. | 13,850 | 124,512 | |||||||||
| TrustCo Bank Corp. NY | 12,780 | 85,626 | |||||||||
| United Financial Bancorp, Inc. | 8,913 | 122,197 | |||||||||
| Washington Federal, Inc. | 10,145 | 124,581 | |||||||||
| Westfield Financial, Inc. | 16,134 | 155,370 | |||||||||
| 1,402,617 | |||||||||||
| 7,378,648 | |||||||||||
| Health Care (6.3%) | |||||||||||
| Health Care Equipment & Supplies (1.0%) | |||||||||||
| Analogic Corp. | 2,380 | 59,500 | |||||||||
| STERIS Corp. | 5,460 | 145,236 | |||||||||
| Zoll Medical Corp. (a) | 2,700 | 43,227 | |||||||||
| 247,963 | |||||||||||
| Health Care Providers & Services (4.6%) | |||||||||||
| AmSurg Corp. (a) | 4,390 | 86,000 | |||||||||
| Cross Country Healthcare, Inc. (a) | 13,470 | 100,890 | |||||||||
| Gentiva Health Services, Inc. (a) | 3,303 | 83,500 | |||||||||
| Healthspring, Inc. (a) | 3,389 | 59,036 | |||||||||
| Kindred Healthcare, Inc. (a) | 8,375 | 113,649 | |||||||||
| Magellan Health Services, Inc. (a) | 1,635 | 59,220 | |||||||||
| Mednax, Inc. (a) | 3,020 | 101,381 | |||||||||
| NovaMed, Inc. (a) | 19,969 | 59,108 | |||||||||
| Owens & Minor, Inc. | 3,106 | 123,526 | |||||||||
| RehabCare Group, Inc. (a) | 10,086 | 140,700 | |||||||||
| Res-Care, Inc. (a) | 11,220 | 152,031 | |||||||||
| U.S. Physical Therapy, Inc. (a) | 3,938 | 48,044 | |||||||||
| 1,127,085 | |||||||||||
| Health Care Technology (0.1%) | |||||||||||
| Omnicell, Inc. (a) | 3,372 | 26,335 | |||||||||
| Life Sciences Tools & Services (0.6%) | |||||||||||
| PAREXEL International Corp. (a) | 7,620 | 75,362 | |||||||||
| Varian, Inc. (a) | 2,140 | 59,577 | |||||||||
| 134,939 | |||||||||||
| 1,536,322 | |||||||||||
| Shares | Value | ||||||||||
| Industrials (13.0%) | |||||||||||
| Aerospace & Defense (0.9%) | |||||||||||
| AAR Corp. (a) | 4,663 | $ | 84,587 | ||||||||
| Esterline Technologies Corp. (a) | 1,990 | 71,819 | |||||||||
| Moog, Inc., Class A (a) | 1,835 | 54,976 | |||||||||
| 211,382 | |||||||||||
| Airlines (0.7%) | |||||||||||
| Republic Airways Holdings, Inc. (a) | 5,547 | 45,430 | |||||||||
| Skywest, Inc. | 8,390 | 131,303 | |||||||||
| 176,733 | |||||||||||
| Building Products (1.4%) | |||||||||||
| Ameron International Corp. | 1,482 | 73,878 | |||||||||
| Builders FirstSource, Inc. (a) | 15,738 | 19,358 | |||||||||
| Lennox International, Inc. | 4,105 | 115,391 | |||||||||
| NCI Building Systems, Inc. (a) | 5,540 | 64,208 | |||||||||
| Universal Forest Products, Inc. | 2,700 | 56,700 | |||||||||
| 329,535 | |||||||||||
| Commercial Services & Supplies (1.1%) | |||||||||||
| ABM Industries, Inc. | 5,870 | 87,170 | |||||||||
| Casella Waste Systems, Inc., Class A (a) | 9,230 | 25,475 | |||||||||
| Consolidated Graphics, Inc. (a) | 4,390 | 70,723 | |||||||||
| United Stationers, Inc. (a) | 2,945 | 82,489 | |||||||||
| 265,857 | |||||||||||
| Construction & Engineering (1.6%) | |||||||||||
| Dycom Industries, Inc. (a) | 8,580 | 58,430 | |||||||||
| EMCOR Group, Inc. (a) | 7,770 | 159,984 | |||||||||
| KBR, Inc. | 7,070 | 100,111 | |||||||||
| KHD Humboldt Wedag International Ltd. (a) | 7,022 | 69,729 | |||||||||
| 388,254 | |||||||||||
| Electrical Equipment (0.9%) | |||||||||||
| Belden CDT, Inc. | 4,680 | 61,121 | |||||||||
| GrafTech International Ltd. (a) | 14,990 | 120,070 | |||||||||
| Woodward Governor Co. | 2,465 | 50,705 | |||||||||
| 231,896 | |||||||||||
| Machinery (2.0%) | |||||||||||
| Astec Industries, Inc. (a) | 3,134 | 77,002 | |||||||||
| EnPro Industries, Inc. (a) | 5,915 | 108,245 | |||||||||
See Accompanying Notes to Financial Statements.
73
CMG SMALL CAP VALUE FUND
A Portfolio of Columbia Funds Institutional Trust
SCHEDULE OF INVESTMENTS
January 31, 2009 (Unaudited)
| Shares | Value | ||||||||||
| Common Stocks (continued) | |||||||||||
| Machinery (continued) | |||||||||||
| FreightCar America, Inc. | 3,909 | $ | 74,857 | ||||||||
| Harsco Corp. | 2,505 | 59,419 | |||||||||
| Kadant, Inc. (a) | 3,898 | 39,136 | |||||||||
| LB Foster Co., Class A (a) | 2,538 | 66,978 | |||||||||
| Robbins & Myers, Inc. | 3,890 | 67,258 | |||||||||
| 492,895 | |||||||||||
| Professional Services (1.5%) | |||||||||||
| CBIZ, Inc. (a) | 8,527 | 69,325 | |||||||||
| CDI Corp. | 7,182 | 76,991 | |||||||||
| Korn/Ferry International (a) | 7,460 | 70,124 | |||||||||
| MPS Group, Inc. (a) | 22,885 | 138,454 | |||||||||
| 354,894 | |||||||||||
| Road & Rail (1.8%) | |||||||||||
| Genesee & Wyoming, Inc., Class A (a) | 3,775 | 102,567 | |||||||||
| Heartland Express, Inc. | 7,240 | 97,450 | |||||||||
| Ryder System, Inc. | 1,315 | 44,421 | |||||||||
| Werner Enterprises, Inc. | 13,190 | 197,850 | |||||||||
| 442,288 | |||||||||||
| Trading Companies & Distributors (1.1%) | |||||||||||
| Kaman Corp. | 5,476 | 104,537 | |||||||||
| Watsco, Inc. | 4,975 | 164,424 | |||||||||
| 268,961 | |||||||||||
| 3,162,695 | |||||||||||
| Information Technology (11.8%) | |||||||||||
| Communications Equipment (2.3%) | |||||||||||
| ADC Telecommunications, Inc. (a) | 11,980 | 60,738 | |||||||||
| Anaren, Inc. (a) | 7,838 | 92,645 | |||||||||
| Bel Fuse, Inc., Class B | 2,495 | 38,024 | |||||||||
| Black Box Corp. | 4,211 | 91,926 | |||||||||
| Ciena Corp. (a) | 9,220 | 57,533 | |||||||||
| Comtech Telecommunications Corp. (a) | 1,275 | 49,470 | |||||||||
| Emulex Corp. (a) | 9,910 | 56,586 | |||||||||
| Tellabs, Inc. (a) | 24,490 | 101,144 | |||||||||
| 548,066 | |||||||||||
| Computers & Peripherals (0.6%) | |||||||||||
| Electronics for Imaging, Inc. (a) | 7,615 | 67,697 | |||||||||
| QLogic Corp. (a) | 6,605 | 74,769 | |||||||||
| 142,466 | |||||||||||
| Shares | Value | ||||||||||
| Electronic Equipment, Instruments & Components (2.6%) | |||||||||||
| Anixter International, Inc. (a) | 3,855 | $ | 104,008 | ||||||||
| Benchmark Electronics, Inc. (a) | 12,445 | 146,104 | |||||||||
| Brightpoint, Inc. (a) | 16,161 | 75,634 | |||||||||
| CPI International, Inc. (a) | 7,790 | 59,749 | |||||||||
| MTS Systems Corp. | 3,985 | 104,367 | |||||||||
| NAM TAI Electronics, Inc. | 17,410 | 98,715 | |||||||||
| Plexus Corp. (a) | 3,655 | 52,851 | |||||||||
| 641,428 | |||||||||||
| IT Services (1.6%) | |||||||||||
| CACI International, Inc., Class A (a) | 2,955 | 133,418 | |||||||||
| CSG Systems International, Inc. (a) | 5,408 | 78,416 | |||||||||
| MAXIMUS, Inc. | 3,260 | 121,142 | |||||||||
| TeleTech Holdings, Inc. (a) | 5,822 | 47,100 | |||||||||
| 380,076 | |||||||||||
| Semiconductors & Semiconductor Equipment (2.5%) | |||||||||||
| Actel Corp. (a) | 7,298 | 65,828 | |||||||||
| Advanced Energy Industries, Inc. (a) | 4,695 | 42,161 | |||||||||
| ATMI, Inc. (a) | 4,655 | 62,889 | |||||||||
| Fairchild Semiconductor International, Inc. (a) | 14,435 | 65,679 | |||||||||
| Kulicke & Soffa Industries, Inc. (a) | 16,711 | 25,568 | |||||||||
| Mattson Technology, Inc. (a) | 16,925 | 16,587 | |||||||||
| MKS Instruments, Inc. (a) | 6,421 | 90,215 | |||||||||
| OmniVision Technologies, Inc. (a) | 7,796 | 52,155 | |||||||||
| Skyworks Solutions, Inc. (a) | 10,735 | 46,375 | |||||||||
| Standard Microsystems Corp. (a) | 4,470 | 61,910 | |||||||||
| Varian Semiconductor Equipment Associates, Inc. (a) | 1,890 | 35,986 | |||||||||
| Zoran Corp. (a) | 9,112 | 54,125 | |||||||||
| 619,478 | |||||||||||
| Software (2.2%) | |||||||||||
| Jack Henry & Associates, Inc. | 3,745 | 66,661 | |||||||||
| Lawson Software, Inc. (a) | 6,442 | 27,185 | |||||||||
| Mentor Graphics Corp. (a) | 12,311 | 57,369 | |||||||||
| MSC.Software Corp. (a) | 12,610 | 73,390 | |||||||||
| Parametric Technology Corp. (a) | 5,950 | 53,550 | |||||||||
| Progress Software Corp. (a) | 3,280 | 55,957 | |||||||||
| SPSS, Inc. (a) | 2,530 | 64,970 | |||||||||
| Sybase, Inc. (a) | 5,015 | 136,960 | |||||||||
| 536,042 | |||||||||||
| 2,867,556 | |||||||||||
See Accompanying Notes to Financial Statements.
74
CMG SMALL CAP VALUE FUND
A Portfolio of Columbia Funds Institutional Trust
SCHEDULE OF INVESTMENTS
January 31, 2009 (Unaudited)
| Shares | Value | ||||||||||
| Common Stocks (continued) | |||||||||||
| Materials (5.5%) | |||||||||||
| Chemicals (1.5%) | |||||||||||
| Cytec Industries, Inc. | 3,400 | $ | 69,496 | ||||||||
| H.B. Fuller Co. | 10,975 | 153,321 | |||||||||
| OM Group, Inc. (a) | 6,830 | 132,365 | |||||||||
| 355,182 | |||||||||||
| Construction Materials (0.4%) | |||||||||||
| Eagle Materials, Inc. | 5,534 | 100,055 | |||||||||
| Containers & Packaging (1.3%) | |||||||||||
| Greif, Inc., Class A | 2,283 | 69,084 | |||||||||
| Greif, Inc., Class B | 5,493 | 166,822 | |||||||||
| Packaging Corp. of America | 6,334 | 89,943 | |||||||||
| 325,849 | |||||||||||
| Metals & Mining (1.8%) | |||||||||||
| Carpenter Technology Corp. | 3,130 | 51,645 | |||||||||
| Harry Winston Diamond Corp. | 13,703 | 53,716 | |||||||||
| Haynes International, Inc. (a) | 3,466 | 63,324 | |||||||||
| RTI International Metals, Inc. (a) | 7,395 | 98,427 | |||||||||
| Schnitzer Steel Industries, Inc., Class A | 1,620 | 63,617 | |||||||||
| Worthington Industries, Inc. | 9,310 | 93,659 | |||||||||
| 424,388 | |||||||||||
| Paper & Forest Products (0.5%) | |||||||||||
| Clearwater Paper Corp. (a) | 9,198 | 104,029 | |||||||||
| Mercer International, Inc. (a) | 14,065 | 18,003 | |||||||||
| 122,032 | |||||||||||
| 1,327,506 | |||||||||||
| Telecommunication Services (0.8%) | |||||||||||
| Diversified Telecommunication Services (0.3%) | |||||||||||
| Warwick Valley Telephone Co. | 7,200 | 63,720 | |||||||||
| Wireless Telecommunication Services (0.5%) | |||||||||||
| Syniverse Holdings, Inc. (a) | 9,836 | 133,376 | |||||||||
| 197,096 | |||||||||||
| Utilities (6.4%) | |||||||||||
| Electric Utilities (3.4%) | |||||||||||
| ALLETE, Inc. | 4,940 | 153,634 | |||||||||
| El Paso Electric Co. (a) | 8,160 | 134,966 | |||||||||
| Great Plains Energy, Inc. | 5,580 | 106,411 | |||||||||
| Hawaiian Electric Industries, Inc. | 3,680 | 79,782 | |||||||||
| Shares | Value | ||||||||||
| Electric Utilities (continued) | |||||||||||
| Maine & Maritimes Corp. | 1,550 | $ | 61,458 | ||||||||
| MGE Energy, Inc. | 4,660 | 149,353 | |||||||||
| UIL Holdings Corp. | 4,955 | 130,961 | |||||||||
| 816,565 | |||||||||||
| Independent Power Producers & Energy Traders (0.7%) | |||||||||||
| Black Hills Corp. | 6,525 | 172,912 | |||||||||
| Multi-Utilities (2.3%) | |||||||||||
| Avista Corp. | 8,800 | 167,552 | |||||||||
| CH Energy Group, Inc. | 4,460 | 225,587 | |||||||||
| NorthWestern Corp. | 6,690 | 161,965 | |||||||||
| 555,104 | |||||||||||
| 1,544,581 | |||||||||||
| Total Common Stocks (Cost of $26,871,404) | 21,827,428 | ||||||||||
| Par | |||||||||||
| Short-Term Obligation (27.1%) | |||||||||||
| Repurchase agreement with Fixed Income Clearing Corp., dated 01/30/09, due 02/02/09 at 0.200%, collateralized by a U.S. Treasury Obligation maturing 02/15/36, market value $6,725,680 (repurchase proceeds $6,592,110) | $ | 6,592,000 | 6,592,000 | ||||||||
| Total Short-Term Obligation (Cost of $6,592,000) | 6,592,000 | ||||||||||
| Total Investments (116.8%) (Cost of $33,463,404) (b) | 28,419,428 | ||||||||||
| Other Assets & Liabilities, Net (-16.8%) | (4,095,237 | ) | |||||||||
| Net Assets (100.0%) | $ | 24,324,191 | |||||||||
Notes to Schedule of Investments:
(a) Non-income producing security.
(b) Cost for federal income tax purposes is $33,463,404.
See Accompanying Notes to Financial Statements.
75
CMG SMALL CAP VALUE FUND
A Portfolio of Columbia Funds Institutional Trust
SCHEDULE OF INVESTMENTS
January 31, 2009 (Unaudited)
At January 31, 2009, the Fund held investments in the following sectors:
| Sector | % of Net Assets | ||||||
| Financials | 30.3 | ||||||
| Industrials | 13.0 | ||||||
| Information Technology | 11.8 | ||||||
| Consumer Discretionary | 7.1 | ||||||
| Utilities | 6.4 | ||||||
| Health Care | 6.3 | ||||||
| Consumer Staples | 5.5 | ||||||
| Materials | 5.5 | ||||||
| Energy | 3.0 | ||||||
| Telecommunication Services | 0.8 | ||||||
| 89.7 | |||||||
| Short-Term Obligation | 27.1 | ||||||
| Other Assets & Liabilities, Net | (16.8 | ) | |||||
| 100.0 | |||||||
See Accompanying Notes to Financial Statements.
76
CMG SMALL/MID CAP FUND
A Portfolio of Columbia Funds Institutional Trust
SCHEDULE OF INVESTMENTS
January 31, 2009 (Unaudited)
| Shares | Value | ||||||||||
| Common Stocks (98.6%) | |||||||||||
| Consumer Discretionary (15.4%) | |||||||||||
| Distributors (0.8%) | |||||||||||
| LKQ Corp. (a) | 4,280 | $ | 49,434 | ||||||||
| Diversified Consumer Services (4.6%) | |||||||||||
| Coinstar, Inc. (a) | 2,520 | 57,910 | |||||||||
| Corinthian Colleges, Inc. (a) | 1,930 | 36,053 | |||||||||
| DeVry, Inc. | 1,035 | 55,455 | |||||||||
| ITT Educational Services, Inc. (a) | 1,030 | 126,185 | |||||||||
| New Oriental Education & Technology Group, ADR (a) | 660 | 31,574 | |||||||||
| 307,177 | |||||||||||
| Hotels, Restaurants & Leisure (2.4%) | |||||||||||
| Darden Restaurants, Inc. | 2,030 | 53,226 | |||||||||
| P.F. Chang's China Bistro, Inc. (a) | 1,600 | 28,368 | |||||||||
| Panera Bread Co., Class A (a) | 570 | 26,779 | |||||||||
| WMS Industries, Inc. (a) | 2,200 | 48,884 | |||||||||
| 157,257 | |||||||||||
| Media (2.6%) | |||||||||||
| DreamWorks Animation SKG, Inc., Class A (a) | 2,080 | 45,656 | |||||||||
| Marvel Entertainment, Inc. (a) | 4,630 | 127,371 | |||||||||
| 173,027 | |||||||||||
| Multiline Retail (0.9%) | |||||||||||
| Dollar Tree, Inc. (a) | 1,340 | 57,232 | |||||||||
| Specialty Retail (3.5%) | |||||||||||
| Advance Auto Parts, Inc. | 1,660 | 54,332 | |||||||||
| Aeropostale, Inc. (a) | 1,950 | 41,164 | |||||||||
| Children's Place Retail Stores, Inc. (a) | 1,640 | 30,848 | |||||||||
| Guess ?, Inc. | 2,600 | 41,834 | |||||||||
| Ross Stores, Inc. | 1,430 | 42,071 | |||||||||
| Tiffany & Co. | 1,030 | 21,373 | |||||||||
| 231,622 | |||||||||||
| Textiles, Apparel & Luxury Goods (0.6%) | |||||||||||
| Deckers Outdoor Corp. (a) | 800 | 41,792 | |||||||||
| 1,017,541 | |||||||||||
| Consumer Staples (4.2%) | |||||||||||
| Food & Staples Retailing (0.4%) | |||||||||||
| BJ's Wholesale Club, Inc. (a) | 806 | 23,116 | |||||||||
| Shares | Value | ||||||||||
| Food Products (0.9%) | |||||||||||
| Flowers Foods, Inc. | 1,630 | $ | 35,029 | ||||||||
| Green Mountain Coffee Roasters, Inc. (a) | 700 | 26,782 | |||||||||
| 61,811 | |||||||||||
| Household Products (0.7%) | |||||||||||
| Church & Dwight Co., Inc. | 840 | 44,713 | |||||||||
| Personal Products (2.2%) | |||||||||||
| Alberto-Culver Co. | 2,430 | 59,438 | |||||||||
| Chattem, Inc. (a) | 1,290 | 87,204 | |||||||||
| 146,642 | |||||||||||
| 276,282 | |||||||||||
| Energy (7.1%) | |||||||||||
| Energy Equipment & Services (2.0%) | |||||||||||
| Atwood Oceanics, Inc. (a) | 2,680 | 44,622 | |||||||||
| Core Laboratories N.V. | 850 | 57,112 | |||||||||
| National-Oilwell Varco, Inc. (a) | 1,130 | 29,877 | |||||||||
| 131,611 | |||||||||||
| Oil, Gas & Consumable Fuels (5.1%) | |||||||||||
| Concho Resources, Inc. (a) | 2,135 | 53,845 | |||||||||
| Continental Resources, Inc. (a) | 1,990 | 41,133 | |||||||||
| Denbury Resources, Inc. (a) | 5,410 | 66,218 | |||||||||
| Holly Corp. | 1,430 | 33,419 | |||||||||
| PetroHawk Energy Corp. (a) | 3,960 | 78,052 | |||||||||
| Southwestern Energy Co. (a) | 1,190 | 37,664 | |||||||||
| Ultra Petroleum Corp. (a) | 810 | 29,022 | |||||||||
| 339,353 | |||||||||||
| 470,964 | |||||||||||
| Financials (6.4%) | |||||||||||
| Capital Markets (2.8%) | |||||||||||
| Cohen & Steers, Inc. | 2,780 | 30,024 | |||||||||
| Greenhill & Co., Inc. | 750 | 48,765 | |||||||||
| optionsXpress Holdings, Inc. | 3,310 | 36,046 | |||||||||
| Waddell & Reed Financial, Inc., Class A | 4,810 | 67,917 | |||||||||
| 182,752 | |||||||||||
| Commercial Banks (0.9%) | |||||||||||
| Glacier Bancorp, Inc. | 1,876 | 28,796 | |||||||||
| TCF Financial Corp. | 2,325 | 28,807 | |||||||||
| 57,603 | |||||||||||
See Accompanying Notes to Financial Statements.
77
CMG SMALL/MID CAP FUND
A Portfolio of Columbia Funds Institutional Trust
SCHEDULE OF INVESTMENTS
January 31, 2009 (Unaudited)
| Shares | Value | ||||||||||
| Common Stocks (continued) | |||||||||||
| Real Estate Investment Trusts (REITs) (2.7%) | |||||||||||
| Home Properties, Inc. | 1,670 | $ | 59,936 | ||||||||
| Nationwide Health Properties, Inc. | 1,720 | 43,912 | |||||||||
| Plum Creek Timber Co., Inc. | 1,040 | 32,001 | |||||||||
| Redwood Trust, Inc. | 2,292 | 29,085 | |||||||||
| Washington Real Estate Investment Trust | 660 | 15,715 | |||||||||
| 180,649 | |||||||||||
| 421,004 | |||||||||||
| Health Care (21.7%) | |||||||||||
| Biotechnology (4.4%) | |||||||||||
| Alexion Pharmaceuticals, Inc. (a) | 2,140 | 78,902 | |||||||||
| BioMarin Pharmaceuticals, Inc. (a) | 2,000 | 38,520 | |||||||||
| Onyx Pharmaceuticals, Inc. (a) | 2,020 | 61,468 | |||||||||
| OSI Pharmaceuticals, Inc. (a) | 2,240 | 79,744 | |||||||||
| United Therapeutics Corp. (a) | 480 | 32,616 | |||||||||
| 291,250 | |||||||||||
| Health Care Equipment & Supplies (4.6%) | |||||||||||
| Immucor, Inc. (a) | 1,530 | 42,396 | |||||||||
| Masimo Corp. (a) | 2,308 | 64,093 | |||||||||
| Mindray Medical International Ltd., ADR | 1,780 | 36,775 | |||||||||
| NuVasive, Inc. (a) | 2,331 | 87,040 | |||||||||
| Thoratec Corp. (a) | 2,570 | 74,453 | |||||||||
| 304,757 | |||||||||||
| Health Care Providers & Services (6.2%) | |||||||||||
| CardioNet, Inc. (a) | 2,046 | 46,403 | |||||||||
| Catalyst Health Solutions, Inc. (a) | 1,012 | 22,284 | |||||||||
| Genoptix, Inc. (a) | 1,380 | 46,782 | |||||||||
| HMS Holdings Corp. (a) | 1,020 | 31,569 | |||||||||
| IPC The Hospitalist Co., Inc. (a) | 2,707 | 51,812 | |||||||||
| Laboratory Corp. of America Holdings (a) | 750 | 44,400 | |||||||||
| LHC Group, Inc. (a) | 1,500 | 39,915 | |||||||||
| Psychiatric Solutions, Inc. (a) | 3,150 | 81,900 | |||||||||
| Quest Diagnostics, Inc. | 850 | 41,948 | |||||||||
| 407,013 | |||||||||||
| Health Care Technology (0.4%) | |||||||||||
| Phase Forward, Inc. (a) | 1,817 | 24,530 | |||||||||
| Shares | Value | ||||||||||
| Life Sciences Tools & Services (4.6%) | |||||||||||
| Charles River Laboratories International, Inc. (a) | 1,930 | $ | 47,112 | ||||||||
| Covance, Inc. (a) | 1,320 | 50,952 | |||||||||
| ICON PLC, ADR (a) | 3,952 | 79,435 | |||||||||
| Illumina, Inc. (a) | 1,920 | 52,531 | |||||||||
| Pharmaceutical Product Development, Inc. | 1,680 | 40,135 | |||||||||
| Thermo Fisher Scientific, Inc. (a) | 1,040 | 37,367 | |||||||||
| 307,532 | |||||||||||
| Pharmaceuticals (1.5%) | |||||||||||
| Cypress Bioscience, Inc. (a) | 3,460 | 29,410 | |||||||||
| Perrigo Co. | 2,330 | 68,385 | |||||||||
| 97,795 | |||||||||||
| 1,432,877 | |||||||||||
| Industrials (18.9%) | |||||||||||
| Aerospace & Defense (2.3%) | |||||||||||
| Goodrich Corp. | 1,110 | 42,913 | |||||||||
| HEICO Corp. | 1,100 | 43,483 | |||||||||
| Precision Castparts Corp. | 600 | 38,970 | |||||||||
| Teledyne Technologies, Inc. (a) | 900 | 25,083 | |||||||||
| 150,449 | |||||||||||
| Air Freight & Logistics (0.6%) | |||||||||||
| HUB Group, Inc., Class A (a) | 1,826 | 41,450 | |||||||||
| Commercial Services & Supplies (3.7%) | |||||||||||
| Clean Harbors, Inc. (a) | 660 | 35,317 | |||||||||
| Geo Group, Inc. (a) | 2,390 | 35,372 | |||||||||
| Stericycle, Inc. (a) | 2,720 | 133,062 | |||||||||
| Waste Connections, Inc. (a) | 1,375 | 39,902 | |||||||||
| 243,653 | |||||||||||
| Construction & Engineering (1.5%) | |||||||||||
| Foster Wheeler Ltd. (a) | 1,860 | 37,144 | |||||||||
| Orion Marine Group, Inc. (a) | 1,285 | 12,722 | |||||||||
| Quanta Services, Inc. (a) | 2,300 | 49,174 | |||||||||
| 99,040 | |||||||||||
| Electrical Equipment (2.6%) | |||||||||||
| AMETEK, Inc. | 1,870 | 59,765 | |||||||||
| Energy Conversion Devices, Inc. (a) | 750 | 18,877 | |||||||||
| Roper Industries, Inc. | 1,200 | 49,368 | |||||||||
See Accompanying Notes to Financial Statements.
78
CMG SMALL/MID CAP FUND
A Portfolio of Columbia Funds Institutional Trust
SCHEDULE OF INVESTMENTS
January 31, 2009 (Unaudited)
| Shares | Value | ||||||||||
| Common Stocks (continued) | |||||||||||
| Electrical Equipment (continued) | |||||||||||
| Woodward Governor Co. | 2,180 | $ | 44,843 | ||||||||
| 172,853 | |||||||||||
| Machinery (3.1%) | |||||||||||
| Flowserve Corp. | 690 | 36,784 | |||||||||
| Kaydon Corp. | 1,140 | 31,008 | |||||||||
| Key Technology, Inc. (a) | 2,200 | 29,172 | |||||||||
| Manitowoc Co., Inc. | 1,350 | 7,425 | |||||||||
| Pall Corp. | 2,050 | 53,443 | |||||||||
| RBC Bearings, Inc. (a) | 1,400 | 25,592 | |||||||||
| Wabtec Corp. | 860 | 25,740 | |||||||||
| 209,164 | |||||||||||
| Professional Services (2.5%) | |||||||||||
| Dun & Bradstreet Corp. | 550 | 41,800 | |||||||||
| FTI Consulting, Inc. (a) | 1,070 | 43,881 | |||||||||
| Huron Consulting Group, Inc. (a) | 850 | 42,483 | |||||||||
| Watson Wyatt Worldwide, Inc., Class A | 750 | 34,875 | |||||||||
| 163,039 | |||||||||||
| Road & Rail (2.6%) | |||||||||||
| Genesee & Wyoming, Inc., Class A (a) | 1,690 | 45,917 | |||||||||
| Landstar System, Inc. | 2,290 | 82,142 | |||||||||
| Old Dominion Freight Line, Inc. (a) | 1,730 | 43,389 | |||||||||
| 171,448 | |||||||||||
| 1,251,096 | |||||||||||
| Information Technology (18.8%) | |||||||||||
| Communications Equipment (2.3%) | |||||||||||
| F5 Networks, Inc. (a) | 2,210 | 48,996 | |||||||||
| Harris Corp. | 1,190 | 51,515 | |||||||||
| Neutral Tandem, Inc. (a) | 3,273 | 51,844 | |||||||||
| 152,355 | |||||||||||
| Computers & Peripherals (1.1%) | |||||||||||
| Synaptics, Inc. (a) | 3,050 | 71,889 | |||||||||
| Electronic Equipment, Instruments & Components (1.3%) | |||||||||||
| Itron, Inc. (a) | 550 | 35,915 | |||||||||
| Mettler-Toledo International, Inc. (a) | 550 | 36,619 | |||||||||
| Trimble Navigation Ltd. (a) | 792 | 11,737 | |||||||||
| 84,271 | |||||||||||
| Shares | Value | ||||||||||
| Internet Software & Services (1.7%) | |||||||||||
| Equinix, Inc. (a) | 1,207 | $ | 64,394 | ||||||||
| Vocus, Inc. (a) | 3,347 | 51,075 | |||||||||
| 115,469 | |||||||||||
| IT Services (3.3%) | |||||||||||
| Alliance Data Systems Corp. (a) | 1,120 | 46,581 | |||||||||
| Gartner, Inc. (a) | 2,080 | 29,453 | |||||||||
| Global Payments, Inc. | 1,360 | 47,205 | |||||||||
| Hewitt Associates, Inc., Class A (a) | 2,450 | 69,531 | |||||||||
| Integral Systems, Inc. (a) | 2,400 | 26,232 | |||||||||
| 219,002 | |||||||||||
| Semiconductors & Semiconductor Equipment (2.9%) | |||||||||||
| Hittite Microwave Corp. (a) | 1,330 | 34,075 | |||||||||
| International Rectifier Corp. (a) | 2,520 | 34,322 | |||||||||
| Microsemi Corp. (a) | 4,030 | 33,852 | |||||||||
| Monolithic Power Systems, Inc. (a) | 2,600 | 31,590 | |||||||||
| Silicon Laboratories, Inc. (a) | 1,360 | 31,321 | |||||||||
| Varian Semiconductor Equipment Associates, Inc. (a) | 1,300 | 24,752 | |||||||||
| 189,912 | |||||||||||
| Software (6.2%) | |||||||||||
| Activision Blizzard, Inc. (a) | 5,910 | 51,772 | |||||||||
| Blackboard, Inc. (a) | 2,334 | 59,307 | |||||||||
| Concur Technologies, Inc. (a) | 1,070 | 26,418 | |||||||||
| FactSet Research Systems, Inc. | 1,340 | 53,332 | |||||||||
| McAfee, Inc. (a) | 1,780 | 54,272 | |||||||||
| Nuance Communications, Inc. (a) | 3,970 | 39,144 | |||||||||
| Solera Holdings, Inc. (a) | 3,900 | 93,951 | |||||||||
| Sybase, Inc. (a) | 1,290 | 35,230 | |||||||||
| 413,426 | |||||||||||
| 1,246,324 | |||||||||||
| Materials (3.6%) | |||||||||||
| Chemicals (2.5%) | |||||||||||
| CF Industries Holdings, Inc. | 700 | 32,900 | |||||||||
| Intrepid Potash, Inc. (a) | 2,412 | 49,156 | |||||||||
| Potash Corp. of Saskatchewan | 1,065 | 79,726 | |||||||||
| 161,782 | |||||||||||
| Containers & Packaging (0.7%) | |||||||||||
| Silgan Holdings, Inc. | 1,070 | 49,049 | |||||||||
See Accompanying Notes to Financial Statements.
79
CMG SMALL/MID CAP FUND
A Portfolio of Columbia Funds Institutional Trust
SCHEDULE OF INVESTMENTS
January 31, 2009 (Unaudited)
| Shares | Value | ||||||||||
| Common Stocks (continued) | |||||||||||
| Metals & Mining (0.4%) | |||||||||||
| Freeport-McMoRan Copper & Gold, Inc. | 1,007 | $ | 25,316 | ||||||||
| 236,147 | |||||||||||
| Telecommunication Services (1.9%) | |||||||||||
| Wireless Telecommunication Services (1.9%) | |||||||||||
| American Tower Corp., Class A (a) | 1,949 | 59,133 | |||||||||
| SBA Communications Corp., Class A (a) | 3,320 | 66,068 | |||||||||
| 125,201 | |||||||||||
| Utilities (0.6%) | |||||||||||
| Electric Utilities (0.6%) | |||||||||||
| ITC Holdings Corp. | 1,021 | 42,861 | |||||||||
| Total Common Stocks (Cost of $7,591,265) | 6,520,297 | ||||||||||
| Par | |||||||||||
| Short-Term Obligation (3.9%) | |||||||||||
| Repurchase agreement with Fixed Income Clearing Corp., dated 01/30/09, due 02/02/09 at 0.200%, collateralized by a U.S. Treasury Obligation maturing 11/15/16, market value $263,800 (repurchase proceeds $257,004) | $ | 257,000 | 257,000 | ||||||||
| Total Short-Term Obligation (Cost of $257,000) | 257,000 | ||||||||||
| Total Investments (102.5%) (Cost of $7,848,265) (b) | 6,777,297 | ||||||||||
| Other Assets & Liabilities, Net (-2.5%) | (165,255 | ) | |||||||||
| Net Assets (100.0%) | $ | 6,612,042 | |||||||||
Notes to Schedule of Investments:
(a) Non-income producing security.
(b) Cost for federal income tax purposes is $7,848,265.
At January 31, 2009, the Fund held investments in the following sectors:
| Sector | % of Net Assets | ||||||
| Health Care | 21.7 | ||||||
| Industrials | 18.9 | ||||||
| Information Technology | 18.8 | ||||||
| Consumer Discretionary | 15.4 | ||||||
| Energy | 7.1 | ||||||
| Financials | 6.4 | ||||||
| Consumer Staples | 4.2 | ||||||
| Materials | 3.6 | ||||||
| Telecommunication Services | 1.9 | ||||||
| Utilities | 0.6 | ||||||
| 98.6 | |||||||
| Short-Term Obligation | 3.9 | ||||||
| Other Assets & Liabilities, Net | (2.5 | ) | |||||
| 100.0 | |||||||
| Acronym | Name | ||||||
| ADR | American Depositary Receipt | ||||||
See Accompanying Notes to Financial Statements.
80
CMG INTERNATIONAL STOCK FUND
A Portfolio of Columbia Funds Institutional Trust
SCHEDULE OF INVESTMENTS
January 31, 2009 (Unaudited)
| Shares | Value | ||||||||||
| Common Stocks (96.0%) | |||||||||||
| Consumer Discretionary (9.4%) | |||||||||||
| Auto Components (0.8%) | |||||||||||
| Denso Corp. | 22,200 | $ | 401,244 | ||||||||
| Automobiles (1.3%) | |||||||||||
| Dongfeng Motor Group Co., Ltd., Class H | 562,000 | 196,403 | |||||||||
| Honda Motor Co., Ltd. | 11,100 | 248,157 | |||||||||
| Toyota Motor Corp. | 8,100 | 258,339 | |||||||||
| 702,899 | |||||||||||
| Diversified Consumer Services (1.1%) | |||||||||||
| Benesse Corp. | 13,000 | 552,999 | |||||||||
| Hotels, Restaurants & Leisure (1.7%) | |||||||||||
| OPAP SA | 16,389 | 475,928 | |||||||||
| Paddy Power PLC | 28,386 | 395,805 | |||||||||
| 871,733 | |||||||||||
| Household Durables (0.4%) | |||||||||||
| JM AB | 44,875 | 229,288 | |||||||||
| Media (1.4%) | |||||||||||
| Vivendi | 29,379 | 758,503 | |||||||||
| Specialty Retail (1.8%) | |||||||||||
| Fast Retailing Co., Ltd. | 2,100 | 265,158 | |||||||||
| Game Group PLC | 236,988 | 491,984 | |||||||||
| Point, Inc. | 4,120 | 183,644 | |||||||||
| 940,786 | |||||||||||
| Textiles, Apparel & Luxury Goods (0.9%) | |||||||||||
| Polo Ralph Lauren Corp. (a) | 11,567 | 474,594 | |||||||||
| 4,932,046 | |||||||||||
| Consumer Staples (10.2%) | |||||||||||
| Beverages (0.8%) | |||||||||||
| Fomento Economico Mexicano SAB de CV, ADR | 13,782 | 387,963 | |||||||||
| Food & Staples Retailing (3.8%) | |||||||||||
| George Weston Ltd. | 7,005 | 373,200 | |||||||||
| Koninklijke Ahold NV | 56,369 | 677,863 | |||||||||
| Seven & I Holdings Co., Ltd. | 25,000 | 666,284 | |||||||||
| Shares | Value | ||||||||||
| Food & Staples Retailing (continued) | |||||||||||
| Wal-Mart Stores, Inc. | 6,112 | $ | 287,998 | ||||||||
| 2,005,345 | |||||||||||
| Food Products (3.7%) | |||||||||||
| China Milk Products Group Ltd. | 787,000 | 195,606 | |||||||||
| Kerry Group PLC, Class A | 21,553 | 404,123 | |||||||||
| Nestle SA, Registered Shares | 21,405 | 740,060 | |||||||||
| Toyo Suisan Kaisha Ltd. | 23,000 | 607,740 | |||||||||
| 1,947,529 | |||||||||||
| Household Products (1.0%) | |||||||||||
| Unicharm Corp. | 7,500 | 514,587 | |||||||||
| Tobacco (0.9%) | |||||||||||
| Japan Tobacco, Inc. | 159 | 454,325 | |||||||||
| 5,309,749 | |||||||||||
| Energy (8.9%) | |||||||||||
| Energy Equipment & Services (0.7%) | |||||||||||
| Noble Corp. (a) | 13,213 | 358,733 | |||||||||
| Oil, Gas & Consumable Fuels (8.2%) | |||||||||||
| BG Group PLC | 38,277 | 528,365 | |||||||||
| BP PLC, ADR | 22,690 | 963,644 | |||||||||
| Centennial Coal Co., Ltd. | 110,580 | 193,662 | |||||||||
| CNOOC Ltd. | 358,200 | 308,486 | |||||||||
| Royal Dutch Shell PLC, Class B | 23,554 | 564,310 | |||||||||
| StatoilHydro ASA | 18,550 | 319,903 | |||||||||
| Total SA | 21,999 | 1,100,428 | |||||||||
| Yanzhou Coal Mining Co., Ltd., Class H | 488,000 | 316,090 | |||||||||
| 4,294,888 | |||||||||||
| 4,653,621 | |||||||||||
| Financials (20.3%) | |||||||||||
| Capital Markets (1.0%) | |||||||||||
| Credit Suisse Group AG, Registered Shares | 10,045 | 257,338 | |||||||||
| Intermediate Capital Group PLC | 21,456 | 119,053 | |||||||||
| Macquarie Group Ltd. | 9,919 | 159,498 | |||||||||
| 535,889 | |||||||||||
| Commercial Banks (10.8%) | |||||||||||
| Australia & New Zealand Banking Group Ltd. | 25,581 | 212,162 | |||||||||
See Accompanying Notes to Financial Statements.
81
CMG INTERNATIONAL STOCK FUND
A Portfolio of Columbia Funds Institutional Trust
SCHEDULE OF INVESTMENTS
January 31, 2009 (Unaudited)
| Shares | Value | ||||||||||
| Common Stocks (continued) | |||||||||||
| Commercial Banks (continued) | |||||||||||
| Banco Bilbao Vizcaya Argentaria SA | 74,812 | $ | 700,256 | ||||||||
| Banco Santander SA | 101,516 | 819,159 | |||||||||
| Bank of China Ltd., Class H | 929,000 | 243,465 | |||||||||
| Barclays PLC | 181,216 | 269,388 | |||||||||
| BNP Paribas | 10,637 | 407,538 | |||||||||
| DBS Group Holdings Ltd. | 79,000 | 456,085 | |||||||||
| HSBC Holdings PLC | 73,563 | 574,050 | |||||||||
| Industrial & Commercial Bank of China, Class H | 416,000 | 176,893 | |||||||||
| Standard Chartered PLC | 36,510 | 462,215 | |||||||||
| Sumitomo Mitsui Financial Group, Inc. | 19,600 | 776,436 | |||||||||
| Sumitomo Trust & Banking Co., Ltd. | 41,000 | 201,532 | |||||||||
| Uniao de Bancos Brasileiros SA, GDR (a) | 3,106 | 174,806 | |||||||||
| United Overseas Bank Ltd. | 24,000 | 185,867 | |||||||||
| 5,659,852 | |||||||||||
| Consumer Finance (0.3%) | |||||||||||
| ORIX Corp. | 2,990 | 129,994 | |||||||||
| Diversified Financial Services (1.0%) | |||||||||||
| ING Groep NV | 68,321 | 545,653 | |||||||||
| Insurance (5.0%) | |||||||||||
| Aviva PLC | 63,293 | 285,246 | |||||||||
| Axis Capital Holdings Ltd. | 12,935 | 313,803 | |||||||||
| Baloise Holding AG, Registered Shares | 9,511 | 590,796 | |||||||||
| Brit Insurance Holdings PLC | 180,727 | 531,271 | |||||||||
| Lancashire Holdings Ltd. (b) | 37,239 | 245,498 | |||||||||
| Zurich Financial Services AG, Registered Shares | 3,508 | 633,454 | |||||||||
| 2,600,068 | |||||||||||
| Real Estate Management & Development (2.2%) | |||||||||||
| Hongkong Land Holdings Ltd. | 199,000 | 422,475 | |||||||||
| Leopalace21 Corp. | 35,400 | 297,237 | |||||||||
| Swire Pacific Ltd., Class A | 64,500 | 416,882 | |||||||||
| 1,136,594 | |||||||||||
| 10,608,050 | |||||||||||
| Shares | Value | ||||||||||
| Health Care (10.2%) | |||||||||||
| Biotechnology (0.5%) | |||||||||||
| Amgen, Inc. (b) | 4,946 | $ | 271,288 | ||||||||
| Health Care Equipment & Supplies (0.5%) | |||||||||||
| Terumo Corp. | 7,200 | 243,533 | |||||||||
| Pharmaceuticals (9.2%) | |||||||||||
| Astellas Pharma, Inc. | 15,000 | 565,640 | |||||||||
| AstraZeneca PLC, ADR | 19,307 | 743,899 | |||||||||
| Biovail Corp. (a) | 24,653 | 269,457 | |||||||||
| Daiichi Sankyo Co., Ltd. | 19,600 | 440,545 | |||||||||
| Novartis AG, Registered Shares | 5,260 | 217,645 | |||||||||
| Roche Holding AG, Genusschein Shares | 7,543 | 1,060,592 | |||||||||
| Sanofi-Aventis SA | 15,204 | 856,298 | |||||||||
| Santen Pharmaceutical Co. Ltd. | 8,700 | 278,454 | |||||||||
| Takeda Pharmaceutical Co., Ltd. | 7,900 | 369,098 | |||||||||
| 4,801,628 | |||||||||||
| 5,316,449 | |||||||||||
| Industrials (11.1%) | |||||||||||
| Aerospace & Defense (2.3%) | |||||||||||
| BAE Systems PLC | 132,284 | 772,352 | |||||||||
| MTU Aero Engines Holding AG | 15,636 | 437,551 | |||||||||
| 1,209,903 | |||||||||||
| Airlines (0.5%) | |||||||||||
| Deutsche Lufthansa AG, Registered Shares | 21,169 | 256,624 | |||||||||
| Construction & Engineering (1.3%) | |||||||||||
| Outotec Oyj | 22,253 | 316,483 | |||||||||
| Toyo Engineering Corp. | 119,000 | 384,325 | |||||||||
| 700,808 | |||||||||||
| Electrical Equipment (3.7%) | |||||||||||
| ABB Ltd., Registered Shares (b) | 51,355 | 667,575 | |||||||||
| Gamesa Corp., Tecnologica SA | 20,224 | 340,050 | |||||||||
| Harbin Power Equipment Co., Ltd., Class H | 328,000 | 227,852 | |||||||||
| Mitsubishi Electric Corp. | 50,000 | 227,824 | |||||||||
| Schneider Electric SA | 7,040 | 447,767 | |||||||||
| 1,911,068 | |||||||||||
See Accompanying Notes to Financial Statements.
82
CMG INTERNATIONAL STOCK FUND
A Portfolio of Columbia Funds Institutional Trust
SCHEDULE OF INVESTMENTS
January 31, 2009 (Unaudited)
| Shares | Value | ||||||||||
| Common Stocks (continued) | |||||||||||
| Industrial Conglomerates (1.5%) | |||||||||||
| Keppel Corp. Ltd. | 124,000 | $ | 325,830 | ||||||||
| Siemens AG, Registered Shares | 8,088 | 453,429 | |||||||||
| 779,259 | |||||||||||
| Machinery (1.4%) | |||||||||||
| Demag Cranes AG | 16,827 | 383,199 | |||||||||
| Nabtesco Corp. | 53,000 | 321,812 | |||||||||
| 705,011 | |||||||||||
| Professional Services (0.4%) | |||||||||||
| Teleperformance | 8,035 | 220,357 | |||||||||
| 5,783,030 | |||||||||||
| Information Technology (4.8%) | |||||||||||
| Electronic Equipment, Instruments & Components (0.8%) | |||||||||||
| FUJIFILM Holdings Corp. | 18,400 | 401,592 | |||||||||
| Internet Software & Services (0.6%) | |||||||||||
| NetEase.com, Inc., ADR (b) | 17,753 | 337,485 | |||||||||
| Office Electronics (1.1%) | |||||||||||
| Canon, Inc. | 21,300 | 572,476 | |||||||||
| Semiconductors & Semiconductor Equipment (1.3%) | |||||||||||
| Marvell Technology Group Ltd. (a)(b) | 43,117 | 314,323 | |||||||||
| United Microelectronics Corp., ADR | 190,166 | 344,200 | |||||||||
| 658,523 | |||||||||||
| Software (1.0%) | |||||||||||
| Nintendo Co., Ltd. | 1,800 | 553,737 | |||||||||
| 2,523,813 | |||||||||||
| Materials (7.5%) | |||||||||||
| Chemicals (2.5%) | |||||||||||
| BASF SE | 23,189 | 671,287 | |||||||||
| Clariant AG, Registered Shares | 49,348 | 246,024 | |||||||||
| Nifco, Inc. | 23,100 | 204,401 | |||||||||
| Potash Corp. of Saskatchewan | 2,500 | 188,073 | |||||||||
| 1,309,785 | |||||||||||
| Shares | Value | ||||||||||
| Construction Materials (0.9%) | |||||||||||
| Ciments Francais SA | 5,970 | $ | 457,534 | ||||||||
| Metals & Mining (4.1%) | |||||||||||
| Anglo American PLC | 20,327 | 368,278 | |||||||||
| BHP Billiton PLC | 45,114 | 768,757 | |||||||||
| Norsk Hydro ASA | 44,400 | 158,034 | |||||||||
| Salzgitter AG | 5,255 | 381,564 | |||||||||
| Yamato Kogyo Co., Ltd. | 18,800 | 453,339 | |||||||||
| 2,129,972 | |||||||||||
| 3,897,291 | |||||||||||
| Telecommunication Services (6.7%) | |||||||||||
| Diversified Telecommunication Services (5.6%) | |||||||||||
| BCE, Inc. | 19,300 | 395,207 | |||||||||
| Bezeq Israeli Telecommunication Corp., Ltd. | 367,635 | 545,126 | |||||||||
| France Telecom SA | 21,825 | 492,734 | |||||||||
| Nippon Telegraph & Telephone Corp. | 15,800 | 761,793 | |||||||||
| Telefonica O2 Czech Republic AS | 27,880 | 523,327 | |||||||||
| Telekomunikacja Polska SA | 32,405 | 182,950 | |||||||||
| 2,901,137 | |||||||||||
| Wireless Telecommunication Services (1.1%) | |||||||||||
| NTT DoCoMo, Inc. | 161 | 280,371 | |||||||||
| Vodafone Group PLC | 171,845 | 320,263 | |||||||||
| 600,634 | |||||||||||
| 3,501,771 | |||||||||||
| Utilities (6.9%) | |||||||||||
| Electric Utilities (4.2%) | |||||||||||
| E.ON AG | 30,998 | 997,307 | |||||||||
| Enel SpA | 123,663 | 693,169 | |||||||||
| Iberdrola SA | 65,209 | 506,055 | |||||||||
| 2,196,531 | |||||||||||
| Gas Utilities (0.6%) | |||||||||||
| Gas Natural SDG SA | 12,084 | 290,900 | |||||||||
| Multi-Utilities (2.1%) | |||||||||||
| Centrica PLC | 164,391 | 613,596 | |||||||||
| United Utilities Group PLC | 64,477 | 504,701 | |||||||||
| 1,118,297 | |||||||||||
| 3,605,728 | |||||||||||
| Total Common Stocks (Cost of $68,379,598) | 50,131,548 | ||||||||||
See Accompanying Notes to Financial Statements.
83
CMG INTERNATIONAL STOCK FUND
A Portfolio of Columbia Funds Institutional Trust
SCHEDULE OF INVESTMENTS
January 31, 2009 (Unaudited)
| Shares | Value | ||||||||||
| Investment Companies (2.7%) | |||||||||||
| iShares MSCI Brazil Index Fund | 4,304 | $ | 152,147 | ||||||||
| iShares MSCI EAFE Index Fund | 32,416 | 1,254,499 | |||||||||
| Total Investment Companies (Cost of $1,704,864) | 1,406,646 | ||||||||||
| Preferred Stock (0.5%) | |||||||||||
| Utilities (0.5%) | |||||||||||
| Electric Utilities (0.5%) | |||||||||||
| Cia Energetica de Minas Gerais | 17,000 | 230,452 | |||||||||
| Total Preferrred Stock (Cost of $406,279) | 230,452 | ||||||||||
| Units | |||||||||||
| Rights (0.0%) | |||||||||||
| Financials (0.0%) | |||||||||||
| Diversified Financial Services (0.0%) | |||||||||||
| Fortis Expires 07/04/14 (b)(c)(d) | 23,749 | - | |||||||||
| Total Rights (Cost of $—) | - | ||||||||||
| Par | |||||||||||
| Short-Term Obligation (0.8%) | |||||||||||
| Repurchase agreement with Fixed Income Clearing Corp., dated 01/30/09, due 02/02/09 at 0.200%, collateralized by U.S. Treasury Obligation maturing 08/15/17, market value $426,868 (repurchase proceeds $418,007) | $ | 418,000 | 418,000 | ||||||||
| Total Short-Term Obligation (Cost of $418,000) | 418,000 | ||||||||||
| Total Investments (100.0%) (Cost of $70,908,741) (e) | 52,186,646 | ||||||||||
| Other Assets & Liabilities, Net (0.0%) | 14,004 | ||||||||||
| Net Assets (100.0%) | $ | 52,200,650 | |||||||||
Notes to Schedule of Investments:
(a) All or a portion of this security is pledged as collateral for open written options contracts.
(b) Non-income producing security.
(c) Represents fair value as determined in good faith under procedures approved by the Board of Trustees.
(d) Security has no value.
(e) Cost for federal income tax purposes is $70,908,741.
At January 31, 2009, the Fund held the following written call options:
| Name of Issuer | Strike Price | Number of Contracts | Expiration Date | Premium | Value | ||||||||||||||||||
| Biovail Corp. | $ | 12.5 | 246 | 02/21/09 | $ | 984 | $ | 1,968 | |||||||||||||||
| Marvell Technlogy Group Ltd. | 7.5 | 344 | 02/21/09 | 3,096 | 12,040 | ||||||||||||||||||
| Noble Corp. | 27.5 | 132 | 02/21/09 | 10,495 | 21,780 | ||||||||||||||||||
| Polo Ralph Lauren Corp. | 45.0 | 57 | 02/21/09 | 3,694 | 6,555 | ||||||||||||||||||
| Uniao de Bancos Brasileros SA, GDR | 70.0 | 31 | 02/21/09 | 3,306 | 1,550 | ||||||||||||||||||
| Total written call options (proceeds $21,575) | $ | 43,893 | |||||||||||||||||||||
For the six month period ended January 31, 2009, transactions in written option contracts were as follows:
| Number of contracts | Premium received | ||||||||||
| Options outstanding at July 31, 2008 | 70 | $ | 4,578 | ||||||||
| Options written | 1,410 | 50,650 | |||||||||
| Options terminated in closing purchase transactions | (61 | ) | (3,615 | ) | |||||||
| Options exercised | - | - | |||||||||
| Options expired | (609 | ) | (30,038 | ) | |||||||
| Options outstanding at January 31, 2009 | 810 | $ | 21,575 | ||||||||
See Accompanying Notes to Financial Statements.
84
CMG INTERNATIONAL STOCK FUND
A Portfolio of Columbia Funds Institutional Trust
SCHEDULE OF INVESTMENTS
January 31, 2009 (Unaudited)
Forward foreign currency exchange contracts outstanding on January 31, 2009 are:
| Forward Foreign Currency Contracts to Buy | Value | Aggregate Face Value | Settlement Date | Unrealized Appreciation (Depreciation) | |||||||||||||||
| AUD | $ | 2,904,738 | $ | 2,928,686 | 02/10/09 | $ | (23,948 | ) | |||||||||||
| AUD | 106,689 | 109,360 | 02/10/09 | (2,671) | |||||||||||||||
| CAD | 207,118 | 202,181 | 02/10/09 | 4,937 | |||||||||||||||
| CHF | 225,903 | 218,917 | 02/10/09 | 6,986 | |||||||||||||||
| CHF | 82,774 | 88,382 | 02/10/09 | (5,608) | |||||||||||||||
| CHF | 262,978 | 273,099 | 02/10/09 | (10,121) | |||||||||||||||
| CHF | 203,485 | 204,937 | 02/10/09 | (1,452) | |||||||||||||||
| CZK | 51,241 | 59,125 | 02/10/09 | (7,884) | |||||||||||||||
| DKK | 476,807 | 465,432 | 02/10/09 | 11,375 | |||||||||||||||
| EUR | 4,292,719 | 4,197,352 | 02/10/09 | 95,367 | |||||||||||||||
| EUR | 270,135 | 267,316 | 02/10/09 | 2,819 | |||||||||||||||
| EUR | 330,308 | 367,005 | 02/10/09 | (36,697) | |||||||||||||||
| EUR | 110,103 | 117,274 | 02/10/09 | (7,171) | |||||||||||||||
| GBP | 904,201 | 924,431 | 02/10/09 | (20,230) | |||||||||||||||
| GBP | 524,552 | 534,840 | 02/10/09 | (10,288) | |||||||||||||||
| GBP | 469,489 | 485,893 | 02/10/09 | (16,404) | |||||||||||||||
| GBP | 104,331 | 102,405 | 02/10/09 | 1,926 | |||||||||||||||
| ILS | 540,666 | 563,564 | 02/11/09 | (22,898) | |||||||||||||||
| JPY | 431,868 | 406,659 | 02/10/09 | 25,209 | |||||||||||||||
| JPY | 289,890 | 273,206 | 02/10/09 | 16,684 | |||||||||||||||
| JPY | 1,043,643 | 1,014,035 | 02/10/09 | 29,608 | |||||||||||||||
| JPY | 489,670 | 492,833 | 02/10/09 | (3,163) | |||||||||||||||
| JPY | 103,302 | 102,912 | 02/10/09 | 390 | |||||||||||||||
| NOK | 136,545 | 133,559 | 02/10/09 | 2,986 | |||||||||||||||
| PLN | 199,402 | 218,403 | 02/10/09 | (19,001) | |||||||||||||||
| SEK | 450,701 | 466,881 | 02/10/09 | (16,180) | |||||||||||||||
| SEK | 420,941 | 439,412 | 02/10/09 | (18,471) | |||||||||||||||
| SGD | 54,313 | 54,475 | 02/10/09 | (162) | |||||||||||||||
| SGD | 84,782 | 88,154 | 02/10/09 | (3,372) | |||||||||||||||
| SGD | 215,930 | 218,651 | 02/10/09 | (2,721) | |||||||||||||||
| TWD | 200,992 | 201,541 | 02/10/09 | (549) | |||||||||||||||
| $ | (30,704 | ) | |||||||||||||||||
| Forward Foreign Currency Contracts to Sell | Value | Aggregate Face Value | Settlement Date | Unrealized Appreciation (Depreciation) | |||||||||||||||
| AUD | $ | 475,021 | $ | 473,641 | 02/10/09 | $ | (1,380 | ) | |||||||||||
| AUD | 104,149 | 116,506 | 02/10/09 | 12,357 | |||||||||||||||
| AUD | 210,203 | 217,202 | 02/10/09 | 6,999 | |||||||||||||||
| AUD | 97,798 | 101,732 | 02/10/09 | 3,934 | |||||||||||||||
| CAD | 702,082 | 698,110 | 02/10/09 | (3,972) | |||||||||||||||
| CAD | 218,534 | 213,410 | 02/10/09 | (5,124) | |||||||||||||||
| CAD | 57,080 | 55,578 | 02/10/09 | (1,502) | |||||||||||||||
| CAD | 242,181 | 245,611 | 02/10/09 | 3,430 | |||||||||||||||
| CAD | 110,898 | 108,883 | 02/10/09 | (2,015) | |||||||||||||||
| CHF | 770,829 | 751,096 | 02/10/09 | (19,733) | |||||||||||||||
| CHF | 115,538 | 112,229 | 02/10/09 | (3,309) | |||||||||||||||
| CZK | 653,788 | 700,393 | 02/10/09 | 46,605 | |||||||||||||||
| DKK | 54,257 | 59,021 | 02/10/09 | 4,764 | |||||||||||||||
| EUR | 272,696 | 266,016 | 02/10/09 | (6,680) | |||||||||||||||
| EUR | 815,527 | 821,221 | 02/10/09 | 5,694 | |||||||||||||||
| EUR | 1,326,352 | 1,346,572 | 02/10/09 | 20,220 | |||||||||||||||
| EUR | 106,262 | 109,045 | 02/10/09 | 2,783 | |||||||||||||||
| EUR | 348,231 | 354,011 | 02/10/09 | 5,780 | |||||||||||||||
| EUR | 199,721 | 204,735 | 02/10/09 | 5,014 | |||||||||||||||
| GBP | 155,047 | 164,380 | 02/10/09 | 9,333 | |||||||||||||||
| GBP | 369,506 | 356,210 | 02/10/09 | (13,296) | |||||||||||||||
| ILS | 1,172,959 | 1,215,941 | 02/11/09 | 42,982 | |||||||||||||||
| JPY | 200,492 | 188,371 | 02/10/09 | (12,121) | |||||||||||||||
| JPY | 177,781 | 175,850 | 02/10/09 | (1,931) | |||||||||||||||
| JPY | 432,758 | 435,927 | 02/10/09 | 3,169 | |||||||||||||||
| JPY | 97,680 | 98,058 | 02/10/09 | 378 | |||||||||||||||
| MXN | 215,129 | 233,840 | 02/10/09 | 18,711 | |||||||||||||||
| NOK | 419,019 | 408,442 | 02/10/09 | (10,577) | |||||||||||||||
| PLN | 354,046 | 406,724 | 02/10/09 | 52,678 | |||||||||||||||
| SEK | 55,456 | 57,765 | 02/10/09 | 2,309 | |||||||||||||||
| SEK | 148,560 | 151,730 | 02/10/09 | 3,170 | |||||||||||||||
| SGD | 753,767 | 753,642 | 02/10/09 | (125) | |||||||||||||||
| TWD | 515,296 | 522,719 | 02/10/09 | 7,423 | |||||||||||||||
| $ | 175,968 | ||||||||||||||||||
See Accompanying Notes to Financial Statements.
85
CMG INTERNATIONAL STOCK FUND
A Portfolio of Columbia Funds Institutional Trust
SCHEDULE OF INVESTMENTS
January 31, 2009 (Unaudited)
At January 31, 2009, the Fund is invested in the following countries:
| Country | Value | % of Total Investments | |||||||||
| Japan | $ | 11,616,618 | 22.3 | ||||||||
| United Kingdom | 9,126,869 | 17.5 | |||||||||
| France | 4,741,158 | 9.1 | |||||||||
| Switzerland | 4,413,484 | 8.5 | |||||||||
| United States* | 3,845,384 | 7.4 | |||||||||
| Germany | 3,580,960 | 6.9 | |||||||||
| Spain | 2,656,419 | 5.1 | |||||||||
| China | 1,693,794 | 3.2 | |||||||||
| Canada | 1,225,938 | 2.3 | |||||||||
| Netherlands | 1,223,516 | 2.3 | |||||||||
| Hong Kong | 1,147,843 | 2.2 | |||||||||
| Singapore | 967,782 | 1.9 | |||||||||
| Ireland | 799,928 | 1.5 | |||||||||
| Italy | 693,169 | 1.3 | |||||||||
| Australia | 565,322 | 1.1 | |||||||||
| Israel | 545,126 | 1.0 | |||||||||
| Czech Republic | 523,327 | 1.0 | |||||||||
| Norway | 477,937 | 0.9 | |||||||||
| Greece | 475,928 | 0.9 | |||||||||
| Brazil | 405,259 | 0.8 | |||||||||
| Mexico | 387,963 | 0.7 | |||||||||
| Taiwan | 344,201 | 0.7 | |||||||||
| Finland | 316,483 | 0.6 | |||||||||
| Sweden | 229,288 | 0.4 | |||||||||
| Poland | 182,950 | 0.4 | |||||||||
| $ | 52,186,646 | 100.0 | |||||||||
*Includes short-term obligation and investment companies.
Certain securities are listed by country of underlying exposure but may trade predominantly on other exchanges.
| Acronym | Name | ||||||
| ADR | American Depositary Receipt | ||||||
| AUD | Australian Dollar | ||||||
| CAD | Canadian Dollar | ||||||
| CHF | Swiss Franc | ||||||
| CZK | Czech Koruna | ||||||
| DKK | Danish Krone | ||||||
| EUR | Euro | ||||||
| GBP | Pound Sterling | ||||||
| GDR | Global Depositary Receipt | ||||||
| ILS | Israeli Shekel | ||||||
| JPY | Japanese Yen | ||||||
| MXN | Mexican Peso | ||||||
| NOK | Norwegian Krone | ||||||
| PLN | Polish Zloty | ||||||
| SEK | Swedish Krona | ||||||
| SGD | Singapore Dollar | ||||||
| TWD | New Taiwan Dollar | ||||||
See Accompanying Notes to Financial Statements.
86
This page is intentionally left blank.
STATEMENTS OF ASSETS AND LIABILITIES
January 31, 2009 (Unaudited)
| CMG Enhanced S&P 500® Index Fund | CMG Large Cap Growth Fund | CMG Large Cap Value Fund | CMG Mid Cap Growth Fund | CMG Mid Cap Value Fund | |||||||||||||||||||
| ASSETS: | |||||||||||||||||||||||
| Repurchase agreements, at identified cost | $ | 3,883,000 | $ | 568,000 | $ | 1,560,000 | $ | 639,000 | $ | 912,000 | |||||||||||||
| Investments, at identified cost | 135,645,240 | 44,126,666 | 30,582,534 | 17,085,257 | 17,217,944 | ||||||||||||||||||
| Total investments, at identified cost | 139,528,240 | 44,694,666 | 32,142,534 | 17,724,257 | 18,129,944 | ||||||||||||||||||
| Repurchase agreements, at value | 3,883,000 | 568,000 | 1,560,000 | 639,000 | 912,000 | ||||||||||||||||||
| Investments, at value | 102,849,519 | 37,128,118 | 24,217,098 | 14,289,676 | 12,381,316 | ||||||||||||||||||
| Total investments, at value | $ | 106,732,519 | $ | 37,696,118 | $ | 25,777,098 | $ | 14,928,676 | $ | 13,293,316 | |||||||||||||
| Cash | 1,749 | 502 | 7 | 393 | 6,249 | ||||||||||||||||||
| Foreign currency (cost of $-, $-, $-, $-, $-, $-, $-, $- and $43,781, respectively) | - | - | - | - | - | ||||||||||||||||||
| Unrealized appreciation on forward foreign currency exchange contracts | - | - | - | - | - | ||||||||||||||||||
| Receivable for: | |||||||||||||||||||||||
| Investments sold | - | 515,016 | 63,201 | 441,593 | 145,788 | ||||||||||||||||||
| Dividends | 151,341 | 19,945 | 66,077 | 8,936 | 20,298 | ||||||||||||||||||
| Interest | 45 | 6 | 17 | 7 | 316 | ||||||||||||||||||
| Foreign tax reclaims | - | - | - | - | - | ||||||||||||||||||
| Expense reimbursement due from investment advisor | - | - | - | - | - | ||||||||||||||||||
| Trustees' deferred compensation plan | 10,059 | 7,702 | 7,654 | 7,964 | 7,068 | ||||||||||||||||||
| Other assets | - | - | - | - | - | ||||||||||||||||||
| Total Assets | 106,895,713 | 38,239,289 | 25,914,054 | 15,387,569 | 13,473,035 | ||||||||||||||||||
| LIABILITIES: | |||||||||||||||||||||||
| Unrealized depreciation on forward foreign currency exchange contracts | - | - | - | - | - | ||||||||||||||||||
| Expense reimbursement due to investment advisor | 4,586 | 2,625 | 2,442 | 2,153 | 2,245 | ||||||||||||||||||
| Written options, at value (premium of $-, $-, $-, $-, $-, $-, $-, $- and $21,575, respectively) | - | - | - | - | - | ||||||||||||||||||
| Payable for: | |||||||||||||||||||||||
| Investments purchased | 839 | 574,689 | 554,449 | 597,457 | 491,044 | ||||||||||||||||||
| Fund shares repurchased | - | - | - | - | - | ||||||||||||||||||
| Futures variation margin | 96,425 | - | - | - | - | ||||||||||||||||||
| Investment advisory fee | 24,579 | 16,644 | 11,343 | 9,019 | 8,036 | ||||||||||||||||||
| Transfer agent fee | - | - | - | - | - | ||||||||||||||||||
| Trustees' fees | 584 | 67 | 59 | 102 | 79 | ||||||||||||||||||
| Audit fee | 21,637 | 24,370 | 24,391 | 24,261 | 24,371 | ||||||||||||||||||
| Custody fee | - | - | - | - | - | ||||||||||||||||||
| Reports to shareholders | - | - | - | - | - | ||||||||||||||||||
| Chief compliance officer expenses | - | - | - | - | - | ||||||||||||||||||
| Interest payable | - | - | - | - | - | ||||||||||||||||||
| Trustees' deferred compensation plan | 10,059 | 7,702 | 7,654 | 7,964 | 7,068 | ||||||||||||||||||
| Other liabilities | 2,251 | 2,664 | 2,722 | 2,787 | 13,847 | ||||||||||||||||||
| Total Liabilities | 160,960 | 628,761 | 603,060 | 643,743 | 546,690 | ||||||||||||||||||
| NET ASSETS | $ | 106,734,753 | $ | 37,610,528 | $ | 25,310,994 | $ | 14,743,826 | $ | 12,926,345 | |||||||||||||
| NET ASSETS CONSIST OF: | |||||||||||||||||||||||
| Paid-in capital | $ | 179,085,350 | $ | 54,066,052 | $ | 41,203,795 | $ | 21,729,199 | $ | 19,508,328 | |||||||||||||
| Undistributed (Overdistributed) net investment income | 24,006 | (30,388 | ) | 333,618 | 13,423 | (2,626 | ) | ||||||||||||||||
| Accumulated net investment loss | - | - | - | - | - | ||||||||||||||||||
| Accumulated net realized loss | (39,326,029 | ) | (9,426,588 | ) | (9,860,983 | ) | (4,203,215 | ) | (1,742,729 | ) | |||||||||||||
| Net unrealized appreciation (depreciation) on: | |||||||||||||||||||||||
| Investments | (32,795,721 | ) | (6,998,548 | ) | (6,365,436 | ) | (2,795,581 | ) | (4,836,628 | ) | |||||||||||||
| Foreign currency translations | - | - | - | - | - | ||||||||||||||||||
| Futures contracts | (252,853 | ) | - | - | - | - | |||||||||||||||||
| Written options | - | - | - | - | - | ||||||||||||||||||
| NET ASSETS | $ | 106,734,753 | $ | 37,610,528 | $ | 25,310,994 | $ | 14,743,826 | $ | 12,926,345 | |||||||||||||
| Shares of capital stock outstanding | 13,410,038 | 5,301,585 | 4,113,132 | 1,909,429 | 1,963,232 | ||||||||||||||||||
| Net asset value, offering and redemption price per share | $ | 7.96 | $ | 7.09 | $ | 6.15 | $ | 7.72 | $ | 6.58 | |||||||||||||
See Accompanying Notes to Financial Statements.
88
| CMG Small Cap Growth Fund | CMG Small Cap Value Fund | CMG Small/Mid Cap Fund | CMG International Stock Fund | ||||||||||||||||
| ASSETS: | |||||||||||||||||||
| Repurchase agreements, at identified cost | $ | 1,544,000 | $ | 6,592,000 | $ | 257,000 | $ | 418,000 | |||||||||||
| Investments, at identified cost | 28,508,131 | 26,871,404 | 7,591,265 | 70,490,741 | |||||||||||||||
| Total investments, at identified cost | 30,052,131 | 33,463,404 | 7,848,265 | 70,908,741 | |||||||||||||||
| Repurchase agreements, at value | 1,544,000 | 6,592,000 | 257,000 | 418,000 | |||||||||||||||
| Investments, at value | 25,910,650 | 21,827,428 | 6,520,297 | 51,768,646 | |||||||||||||||
| Total investments, at value | $ | 27,454,650 | $ | 28,419,428 | $ | 6,777,297 | $ | 52,186,646 | |||||||||||
| Cash | 44 | 79 | 251 | 118 | |||||||||||||||
| Foreign currency (cost of $-, $-, $-, $-, $-, $-, $-, $- and $43,781, respectively) | - | - | - | 43,150 | |||||||||||||||
| Unrealized appreciation on forward foreign currency exchange contracts | - | - | - | 456,020 | |||||||||||||||
| Receivable for: | |||||||||||||||||||
| Investments sold | 1,242,541 | 93,585 | 88,068 | 200,348 | |||||||||||||||
| Dividends | 7,127 | 11,245 | 2,217 | 41,323 | |||||||||||||||
| Interest | 17 | 73 | 3 | 5 | |||||||||||||||
| Foreign tax reclaims | - | - | - | 75,781 | |||||||||||||||
| Expense reimbursement due from investment advisor | 9,703 | - | 5,352 | 6,727 | |||||||||||||||
| Trustees' deferred compensation plan | 12,920 | 8,571 | 7,327 | 10,406 | |||||||||||||||
| Other assets | 1,242 | - | - | - | |||||||||||||||
| Total Assets | 28,728,244 | 28,532,981 | 6,880,515 | 53,020,524 | |||||||||||||||
| LIABILITIES: | |||||||||||||||||||
| Unrealized depreciation on forward foreign currency exchange contracts | - | - | - | 310,756 | |||||||||||||||
| Expense reimbursement due to investment advisor | - | 2,346 | - | - | |||||||||||||||
| Written options, at value (premium of $-, $-, $-, $-, $-, $-, $-, $- and $21,575, respectively) | - | - | - | 43,893 | |||||||||||||||
| Payable for: | |||||||||||||||||||
| Investments purchased | 915,251 | 4,156,967 | 235,188 | 396,397 | |||||||||||||||
| Fund shares repurchased | - | - | - | 990 | |||||||||||||||
| Futures variation margin | - | - | - | - | |||||||||||||||
| Investment advisory fee | 18,445 | 13,643 | 4,330 | 35,660 | |||||||||||||||
| Transfer agent fee | 11 | - | - | - | |||||||||||||||
| Trustees' fees | 74 | 94 | 1,204 | 2,509 | |||||||||||||||
| Audit fee | 21,562 | 24,408 | 19,234 | 16,758 | |||||||||||||||
| Custody fee | 6,469 | - | - | - | |||||||||||||||
| Reports to shareholders | 16,743 | - | - | - | |||||||||||||||
| Chief compliance officer expenses | 126 | - | - | - | |||||||||||||||
| Interest payable | - | - | - | 103 | |||||||||||||||
| Trustees' deferred compensation plan | 12,920 | 8,571 | 7,327 | 10,406 | |||||||||||||||
| Other liabilities | 8,709 | 2,761 | 1,190 | 2,402 | |||||||||||||||
| Total Liabilities | 1,000,310 | 4,208,790 | 268,473 | 819,874 | |||||||||||||||
| NET ASSETS | $ | 27,727,934 | $ | 24,324,191 | $ | 6,612,042 | $ | 52,200,650 | |||||||||||
| NET ASSETS CONSIST OF: | |||||||||||||||||||
| Paid-in capital | $ | 39,390,860 | $ | 30,454,008 | $ | 10,011,940 | $ | 90,213,868 | |||||||||||
| Undistributed (Overdistributed) net investment income | - | 112,083 | - | 182,575 | |||||||||||||||
| Accumulated net investment loss | (67,466 | ) | - | (22,422 | ) | - | |||||||||||||
| Accumulated net realized loss | (8,997,979 | ) | (1,197,924 | ) | (2,306,508 | ) | (19,586,402 | ) | |||||||||||
| Net unrealized appreciation (depreciation) on: | |||||||||||||||||||
| Investments | (2,597,481 | ) | (5,043,976 | ) | (1,070,968 | ) | (18,722,095 | ) | |||||||||||
| Foreign currency translations | - | - | - | 135,022 | |||||||||||||||
| Futures contracts | - | - | - | - | |||||||||||||||
| Written options | - | - | - | (22,318 | ) | ||||||||||||||
| NET ASSETS | $ | 27,727,934 | $ | 24,324,191 | $ | 6,612,042 | $ | 52,200,650 | |||||||||||
| Shares of capital stock outstanding | 27,356,212 | 3,749,168 | 2,866,553 | 9,258,087 | |||||||||||||||
| Net asset value, offering and redemption price per share | $ | 1.01 | $ | 6.49 | $ | 2.31 | $ | 5.64 | |||||||||||
See Accompanying Notes to Financial Statements.
89
STATEMENTS OF OPERATIONS
For the Six Months Ended January 31, 2009 (Unaudited)
| CMG Enhanced S&P 500® Index Fund | CMG Large Cap Growth Fund | CMG Large Cap Value Fund | CMG Mid Cap Growth Fund | CMG Mid Cap Value Fund | |||||||||||||||||||
| INVESTMENT INCOME: | |||||||||||||||||||||||
| Dividends | $ | 1,742,992 | $ | 300,433 | $ | 466,305 | $ | 88,465 | $ | 190,894 | |||||||||||||
| Interest | 8,668 | 3,298 | 3,644 | 1,970 | 2,099 | ||||||||||||||||||
| Securities lending | 15,524 | 3,811 | 3,317 | - | - | ||||||||||||||||||
| Foreign taxes withheld | - | (426 | ) | (40 | ) | (669 | ) | (136 | ) | ||||||||||||||
| Total investment income | 1,767,184 | 307,116 | 473,226 | 89,766 | 192,857 | ||||||||||||||||||
| Expenses: | |||||||||||||||||||||||
| Investment advisory fee | 165,555 | 104,375 | 77,732 | 64,024 | 50,160 | ||||||||||||||||||
| Transfer agent fee | - | - | - | - | - | ||||||||||||||||||
| Trustees' fees | 10,684 | 7,527 | 7,281 | 7,067 | 6,893 | ||||||||||||||||||
| Custody fee | - | - | - | - | - | ||||||||||||||||||
| Audit fee | 18,443 | 21,202 | 21,195 | 21,239 | 21,202 | ||||||||||||||||||
| Chief compliance officer expenses | - | - | - | - | - | ||||||||||||||||||
| Other expenses | - | - | - | - | - | ||||||||||||||||||
| Expenses before interest expense | 194,682 | 133,104 | 106,208 | 92,330 | 78,255 | ||||||||||||||||||
| Interest expense | - | - | - | - | - | ||||||||||||||||||
| Total expenses | 194,682 | 133,104 | 106,208 | 92,330 | 78,255 | ||||||||||||||||||
| Fees waived or expenses reimbursed by investment advisor | (29,127 | ) | (28,729 | ) | (28,476 | ) | (28,306 | ) | (28,095 | ) | |||||||||||||
| Custody earnings credit | - | - | - | - | - | ||||||||||||||||||
| Net expenses | 165,555 | 104,375 | 77,732 | 64,024 | 50,160 | ||||||||||||||||||
| Net investment income (loss) | 1,601,629 | 202,741 | 395,494 | 25,742 | 142,697 | ||||||||||||||||||
| NET REALIZED AND UNREALIZED GAIN (LOSS) ON INVESTMENTS, WRITTEN OPTIONS, FOREIGN CURRENCY AND FUTURES CONTRACTS: | |||||||||||||||||||||||
| Net realized gain (loss) on: | |||||||||||||||||||||||
| Investments | (25,028,588 | ) | (7,858,398 | ) | (6,575,829 | ) | (4,073,484 | ) | (1,506,404 | ) | |||||||||||||
| Written options | - | - | - | 61,549 | - | ||||||||||||||||||
| Foreign currency transactions and forward foreign currency exchange contracts | - | - | - | (157 | ) | (79 | ) | ||||||||||||||||
| Futures contracts | (562,666 | ) | - | - | - | - | |||||||||||||||||
| Net realized loss | (25,591,254 | ) | (7,858,398 | ) | (6,575,829 | ) | (4,012,092 | ) | (1,506,483 | ) | |||||||||||||
| Net change in unrealized appreciation (depreciation) on: | |||||||||||||||||||||||
| Investments | (28,336,630 | ) | (10,530,795 | ) | (6,162,631 | ) | (6,227,907 | ) | (5,485,448 | ) | |||||||||||||
| Written options | - | - | - | - | - | ||||||||||||||||||
| Foreign currency translations and forward foreign currency exchange contracts | - | - | - | (2 | ) | - | |||||||||||||||||
| Futures contracts | (261,173 | ) | - | - | - | - | |||||||||||||||||
| Net change in unrealized appreciation (depreciation) | (28,597,803 | ) | (10,530,795 | ) | (6,162,631 | ) | (6,227,909 | ) | (5,485,448 | ) | |||||||||||||
| Net loss | (54,189,057 | ) | (18,389,193 | ) | (12,738,460 | ) | (10,240,001 | ) | (6,991,931 | ) | |||||||||||||
| NET DECREASE RESULTING FROM OPERATIONS | $ | (52,587,428 | ) | $ | (18,186,452 | ) | $ | (12,342,966 | ) | $ | (10,214,259 | ) | $ | (6,849,234 | ) | ||||||||
See Accompanying Notes to Financial Statements.
90
| CMG Small Cap Growth Fund | CMG Small Cap Value Fund | CMG Small/Mid Cap Fund | CMG International Stock Fund | ||||||||||||||||
| INVESTMENT INCOME: | |||||||||||||||||||
| Dividends | $ | 78,244 | $ | 248,611 | $ | 20,754 | $ | 986,041 | |||||||||||
| Interest | 5,032 | 421 | 688 | 2,593 | |||||||||||||||
| Securities lending | - | - | - | - | |||||||||||||||
| Foreign taxes withheld | (442 | ) | (97 | ) | (145 | ) | (79,052 | ) | |||||||||||
| Total investment income | 82,834 | 248,935 | 21,297 | 909,582 | |||||||||||||||
| Expenses: | |||||||||||||||||||
| Investment advisory fee | 120,010 | 87,750 | 31,430 | 255,490 | |||||||||||||||
| Transfer agent fee | 22 | - | - | - | |||||||||||||||
| Trustees' fees | 7,338 | 7,076 | 7,176 | 9,568 | |||||||||||||||
| Custody fee | 10,163 | - | - | - | |||||||||||||||
| Audit fee | 21,864 | 21,190 | 19,622 | 23,646 | |||||||||||||||
| Chief compliance officer expenses | 368 | - | - | - | |||||||||||||||
| Other expenses | 24,996 | - | 4,784 | 5,728 | |||||||||||||||
| Expenses before interest expense | 184,761 | 116,016 | 63,012 | 294,432 | |||||||||||||||
| Interest expense | - | 420 | - | 120 | |||||||||||||||
| Total expenses | 184,761 | 116,436 | 63,012 | 294,552 | |||||||||||||||
| Fees waived or expenses reimbursed by investment advisor | (56,755 | ) | (28,266 | ) | (31,582 | ) | (38,942 | ) | |||||||||||
| Custody earnings credit | (43 | ) | - | - | - | ||||||||||||||
| Net expenses | 127,963 | 88,170 | 31,430 | 255,610 | |||||||||||||||
| Net investment income (loss) | (45,129 | ) | 160,765 | (10,133 | ) | 653,972 | |||||||||||||
| NET REALIZED AND UNREALIZED GAIN (LOSS) ON INVESTMENTS, WRITTEN OPTIONS, FOREIGN CURRENCY AND FUTURES CONTRACTS: | |||||||||||||||||||
| Net realized gain (loss) on: | |||||||||||||||||||
| Investments | (7,464,442 | ) | (963,712 | ) | (2,002,751 | ) | (17,156,468 | ) | |||||||||||
| Written options | 8,153 | - | - | 33,330 | |||||||||||||||
| Foreign currency transactions and forward foreign currency exchange contracts | - | 117 | (49 | ) | (2,094,176 | ) | |||||||||||||
| Futures contracts | - | - | - | - | |||||||||||||||
| Net realized loss | (7,456,289 | ) | (963,595 | ) | (2,002,800 | ) | (19,217,314 | ) | |||||||||||
| Net change in unrealized appreciation (depreciation) on: | |||||||||||||||||||
| Investments | (8,997,585 | ) | (7,616,196 | ) | (2,849,237 | ) | (23,287,691 | ) | |||||||||||
| Written options | (5,112 | ) | - | - | (24,066 | ) | |||||||||||||
| Foreign currency translations and forward foreign currency exchange contracts | - | - | - | (47,083 | ) | ||||||||||||||
| Futures contracts | - | - | - | - | |||||||||||||||
| Net change in unrealized appreciation (depreciation) | (9,002,697 | ) | (7,616,196 | ) | (2,849,237 | ) | (23,358,840 | ) | |||||||||||
| Net loss | (16,458,986 | ) | (8,579,791 | ) | (4,852,037 | ) | (42,576,154 | ) | |||||||||||
| NET DECREASE RESULTING FROM OPERATIONS | $ | (16,504,115 | ) | $ | (8,419,026 | ) | $ | (4,862,170 | ) | $ | (41,922,182 | ) | |||||||
See Accompanying Notes to Financial Statements.
91
STATEMENTS OF CHANGES IN NET ASSETS
| CMG Enhanced S&P 500® Index Fund | CMG Large Cap Growth Fund | ||||||||||||||||||
| (Unaudited) Six Months Ended January 31, 2009 ($) | Year Ended July 31, 2008 ($) | (Unaudited) Six Months Ended January 31, 2009 ($) | Year Ended July 31, 2008 ($) | ||||||||||||||||
| Increase (Decrease) in Net Assets | |||||||||||||||||||
| Operations | |||||||||||||||||||
| Net investment income | 1,601,629 | 3,922,814 | 202,741 | 346,619 | |||||||||||||||
| Net realized loss on investments and futures contracts | (25,591,254 | ) | (13,493,203 | ) | (7,858,398 | ) | (1,282,517 | ) | |||||||||||
| Net change in unrealized appreciation (depreciation) on investments and futures contracts | (28,597,803 | ) | (17,348,463 | ) | (10,530,795 | ) | (280,959 | ) | |||||||||||
| Net decrease resulting from operations | (52,587,428 | ) | (26,918,852 | ) | (18,186,452 | ) | (1,216,857 | ) | |||||||||||
| Distributions to shareholders | |||||||||||||||||||
| From net investment income | (3,600,240 | ) | (3,477,461 | ) | (407,615 | ) | (307,640 | ) | |||||||||||
| From net realized gains | - | (7,014,878 | ) | - | (3,957,565 | ) | |||||||||||||
| Total distributions to shareholders | (3,600,240 | ) | (10,492,339 | ) | (407,615 | ) | (4,265,205 | ) | |||||||||||
| Net Capital Stock Transactions | (2,283,952 | ) | (20,080,515 | ) | 4,974,122 | (2,265,918 | ) | ||||||||||||
| Total decrease in net assets | (58,471,620 | ) | (57,491,706 | ) | (13,619,945 | ) | (7,747,980 | ) | |||||||||||
| NET ASSETS | |||||||||||||||||||
| Beginning of period | 165,206,373 | 222,698,079 | 51,230,473 | 58,978,453 | |||||||||||||||
| End of period | 106,734,753 | 165,206,373 | 37,610,528 | 51,230,473 | |||||||||||||||
| Undistributed (overdistributed) net investment income at end of period | 24,006 | 2,022,617 | (30,388 | ) | 174,486 | ||||||||||||||
See Accompanying Notes to Financial Statements.
92
STATEMENTS OF CHANGES IN NET ASSETS
| CMG Large Cap Value Fund | CMG Mid Cap Growth Fund | ||||||||||||||||||
| (Unaudited) Six Months Ended January 31, 2009 ($) | Year Ended July 31, 2008 ($) | (Unaudited) Six Months Ended January 31, 2009 ($) | Year Ended July 31, 2008 ($) | ||||||||||||||||
| Increase (Decrease) in Net Assets | |||||||||||||||||||
| Operations | |||||||||||||||||||
| Net investment income (loss) | 395,494 | 879,222 | 25,742 | (21,708 | ) | ||||||||||||||
| Net realized gain (loss) on investments, foreign currency transactions, futures contracts and written options | (6,575,829 | ) | (3,240,671 | ) | (4,012,092 | ) | 1,604,893 | ||||||||||||
| Net change in unrealized appreciation (depreciation) on investments, foreign currency translations, futures contracts and written options | (6,162,631 | ) | (3,947,592 | ) | (6,227,909 | ) | (1,521,371 | ) | |||||||||||
| Net increase (decrease) resulting from operations | (12,342,966 | ) | (6,309,041 | ) | (10,214,259 | ) | 61,814 | ||||||||||||
| Distributions to shareholders | |||||||||||||||||||
| From net investment income | (514,886 | ) | (813,201 | ) | - | (89,956 | ) | ||||||||||||
| From net realized gains | - | (4,036,007 | ) | (871,125 | ) | (4,351,636 | ) | ||||||||||||
| Total distributions to shareholders | (514,886 | ) | (4,849,208 | ) | (871,125 | ) | (4,441,592 | ) | |||||||||||
| Net Capital Stock Transactions | 428,218 | 4,068,549 | 817,600 | 717,790 | |||||||||||||||
| Total decrease in net assets | (12,429,634 | ) | (7,089,700 | ) | (10,267,784 | ) | (3,661,988 | ) | |||||||||||
| NET ASSETS | |||||||||||||||||||
| Beginning of period | 37,740,628 | 44,830,328 | 25,011,610 | 28,673,598 | |||||||||||||||
| End of period | 25,310,994 | 37,740,628 | 14,743,826 | 25,011,610 | |||||||||||||||
| Undistributed (overdistributed) net investment income at end of period | 333,618 | 453,010 | 13,423 | (12,319 | ) | ||||||||||||||
See Accompanying Notes to Financial Statements.
93
STATEMENTS OF CHANGES IN NET ASSETS
| CMG Mid Cap Value Fund | CMG Small Cap Growth Fund | ||||||||||||||||||
| (Unaudited) Six Months Ended January 31, 2009 ($) | Year Ended July 31, 2008 ($) | (Unaudited) Six Months Ended January 31, 2009 ($) | Year Ended July 31, 2008 ($) | ||||||||||||||||
| Increase (Decrease) in Net Assets | |||||||||||||||||||
| Operations | |||||||||||||||||||
| Net investment income (loss) | 142,697 | 155,993 | (45,129 | ) | (92,392 | ) | |||||||||||||
| Net realized gain (loss) on investments, foreign currency transactions and written options | (1,506,483 | ) | (41,648 | ) | (7,456,289 | ) | 146,451 | ||||||||||||
| Net change in unrealized appreciation (depreciation) on investments, foreign currency translations and written options | (5,485,448 | ) | (2,548,016 | ) | (9,002,697 | ) | 324,482 | ||||||||||||
| Net increase (decrease) resulting from operations | (6,849,234 | ) | (2,433,671 | ) | (16,504,115 | ) | 378,541 | ||||||||||||
| Distributions to shareholders | |||||||||||||||||||
| From net investment income | (161,928 | ) | (287,840 | ) | - | - | |||||||||||||
| From net realized gains | (28,534 | ) | (1,695,514 | ) | - | (6,279,372 | ) | ||||||||||||
| From return of capital | - | - | - | (159,987 | ) | ||||||||||||||
| Total distributions to shareholders | (190,462 | ) | (1,983,354 | ) | - | (6,439,359 | ) | ||||||||||||
| Net Capital Stock Transactions | 2,886,627 | 2,199,989 | 3,413,796 | 6,979,821 | |||||||||||||||
| Total increase (decrease) in net assets | (4,153,069 | ) | (2,217,036 | ) | (13,090,319 | ) | 919,003 | ||||||||||||
| NET ASSETS | |||||||||||||||||||
| Beginning of period | 17,079,414 | 19,296,450 | 40,818,253 | 39,899,250 | |||||||||||||||
| End of period | 12,926,345 | 17,079,414 | 27,727,934 | 40,818,253 | |||||||||||||||
| Undistributed (overdistributed) net investment income at end of period | (2,626 | ) | 16,605 | - | - | ||||||||||||||
| Accumulated net investment loss at end of period | - | - | (67,466 | ) | (22,337 | ) | |||||||||||||
See Accompanying Notes to Financial Statements.
94
STATEMENTS OF CHANGES IN NET ASSETS
| CMG Small Cap Value Fund | |||||||||||
| (Unaudited) Six Months Ended January 31, 2009 ($) | Year Ended July 31, 2008 ($) | ||||||||||
| Increase (Decrease) in Net Assets | |||||||||||
| Operations | |||||||||||
| Net investment income (loss) | 160,765 | 188,948 | |||||||||
| Net realized gain (loss) on investments and foreign currency transactions | (963,595 | ) | 2,295,661 | ||||||||
| Net change in unrealized appreciation (depreciation) on investments and foreign currency translations | (7,616,196 | ) | (4,519,602 | ) | |||||||
| Net increase (decrease) resulting from operations | (8,419,026 | ) | (2,034,993 | ) | |||||||
| Distributions to shareholders | |||||||||||
| From net investment income | (99,891 | ) | (274,060 | ) | |||||||
| From net realized gains | (2,249,999 | ) | (3,718,779 | ) | |||||||
| From return of capital | - | - | |||||||||
| Total distributions to shareholders | (2,349,890 | ) | (3,992,839 | ) | |||||||
| Net Capital Stock Transactions | 8,345,094 | 824,032 | |||||||||
| Total increase (decrease) in net assets | (2,423,822 | ) | (5,203,800 | ) | |||||||
| NET ASSETS | |||||||||||
| Beginning of period | 26,748,013 | 31,951,813 | |||||||||
| End of period | 24,324,191 | 26,748,013 | |||||||||
| Undistributed net investment income at end of period | 112,083 | 51,209 | |||||||||
See Accompanying Notes to Financial Statements.
95
STATEMENTS OF CHANGES IN NET ASSETS
| CMG Small/Mid Cap Fund | CMG International Stock Fund | ||||||||||||||||||
| (Unaudited) Six Months Ended January 31, 2009 ($) | Year Ended July 31, 2008 ($) | (Unaudited) Six Months Ended January 31, 2009 ($) | Year Ended July 31, 2008 ($) | ||||||||||||||||
| Increase (Decrease) in Net Assets | |||||||||||||||||||
| Operations | |||||||||||||||||||
| Net investment income (loss) | (10,133 | ) | (26,463 | ) | 653,972 | 2,726,069 | |||||||||||||
| Net realized gain (loss) on investments, foreign currency transactions, forward foreign currency exchange contracts and written options | (2,002,800 | ) | 135,455 | (19,217,314 | ) | 2,962,887 | |||||||||||||
| Net change in unrealized appreciation (depreciation) on investments, foreign currency translations, forward foreign currency exchange contracts and written options | (2,849,237 | ) | 86,830 | (23,358,840 | ) | (21,345,073 | ) | ||||||||||||
| Net increase (decrease) resulting from operations | (4,862,170 | ) | 195,822 | (41,922,182 | ) | (15,656,117 | ) | ||||||||||||
| Distributions to shareholders | |||||||||||||||||||
| From net investment income | - | - | (743,118 | ) | (3,839,262 | ) | |||||||||||||
| From net realized gains | - | (1,812,017 | ) | (1,521,943 | ) | (13,751,675 | ) | ||||||||||||
| From return of capital | - | (71,809 | ) | - | - | ||||||||||||||
| Total distributions to shareholders | - | (1,883,826 | ) | (2,265,061 | ) | (17,590,937 | ) | ||||||||||||
| Net Capital Stock Transactions | - | 646,043 | 4,647,438 | 4,673,104 | |||||||||||||||
| Total decrease in net assets | (4,862,170 | ) | (1,041,961 | ) | (39,539,805 | ) | (28,573,950 | ) | |||||||||||
| NET ASSETS | |||||||||||||||||||
| Beginning of period | 11,474,212 | 12,516,173 | 91,740,455 | 120,314,405 | |||||||||||||||
| End of period | 6,612,042 | 11,474,212 | 52,200,650 | 91,740,455 | |||||||||||||||
| Undistributed net investment income at end of period | - | - | 182,575 | 271,721 | |||||||||||||||
| Accumulated net investment loss at end of period | (22,422 | ) | (12,289 | ) | - | - | |||||||||||||
See Accompanying Notes to Financial Statements.
96
STATEMENTS OF CHANGES IN NET ASSETS - CAPITAL STOCK ACTIVITY
| CMG Enhanced S&P 500® Index Fund | |||||||||||||||||||
| (Unaudited) Six Months Ended January 31, 2009 | Year Ended July 31, 2008 | ||||||||||||||||||
| Shares | Dollars ($) | Shares | Dollars ($) | ||||||||||||||||
| Subscriptions | 1,131,286 | 10,123,912 | 2,362,098 | 33,444,264 | |||||||||||||||
| Distributions reinvested | 151,892 | 1,307,792 | 280,036 | 3,895,305 | |||||||||||||||
| Redemptions | (1,428,579 | ) | (13,715,656 | ) | (4,417,810 | ) | (57,420,084 | ) | |||||||||||
| Net decrease | (145,401 | ) | (2,283,952 | ) | (1,775,676 | ) | (20,080,515 | ) | |||||||||||
| CMG Large Cap Growth Fund | |||||||||||||||||||
| (Unaudited) Six Months Ended January 31, 2009 | Year Ended July 31, 2008 | ||||||||||||||||||
| Shares | Dollars ($) | Shares | Dollars ($) | ||||||||||||||||
| Subscriptions | 1,037,064 | 7,665,976 | 262,993 | 3,175,927 | |||||||||||||||
| Distributions reinvested | 6,478 | 48,328 | 188,415 | 2,330,690 | |||||||||||||||
| Redemptions | (333,041 | ) | (2,740,182 | ) | (574,762 | ) | (7,772,535 | ) | |||||||||||
| Net increase (decrease) | 710,501 | 4,974,122 | (123,354 | ) | (2,265,918 | ) | |||||||||||||
| CMG Large Cap Value Fund | |||||||||||||||||||
| (Unaudited) Six Months Ended January 31, 2009 | Year Ended July 31, 2008 | ||||||||||||||||||
| Shares | Dollars ($) | Shares | Dollars ($) | ||||||||||||||||
| Subscriptions | 309,264 | 2,078,693 | 245,081 | 2,649,929 | |||||||||||||||
| Distributions reinvested | 14,002 | 94,652 | 215,161 | 2,336,648 | |||||||||||||||
| Redemptions | (241,027 | ) | (1,745,127 | ) | (73,903 | ) | (918,028 | ) | |||||||||||
| Net increase | 82,239 | 428,218 | 386,339 | 4,068,549 | |||||||||||||||
| CMG Mid Cap Growth Fund | |||||||||||||||||||
| (Unaudited) Six Months Ended January 31, 2009 | Year Ended July 31, 2008 | ||||||||||||||||||
| Shares | Dollars ($) | Shares | Dollars ($) | ||||||||||||||||
| Subscriptions | 103,445 | 870,662 | 171,048 | 2,487,868 | |||||||||||||||
| Distributions reinvested | 61,787 | 493,679 | 158,421 | 2,336,715 | |||||||||||||||
| Redemptions | (57,900 | ) | (546,741 | ) | (267,602 | ) | (4,106,793 | ) | |||||||||||
| Net increase | 107,332 | 817,600 | 61,867 | 717,790 | |||||||||||||||
See Accompanying Notes to Financial Statements.
97
STATEMENTS OF CHANGES IN NET ASSETS - CAPITAL STOCK ACTIVITY
| CMG Mid Cap Value Fund | |||||||||||||||||||
| (Unaudited) Six Months Ended January 31, 2009 | Year Ended July 31, 2008 | ||||||||||||||||||
| Shares | Dollars ($) | Shares | Dollars ($) | ||||||||||||||||
| Subscriptions | 460,986 | 3,434,125 | 325,999 | 3,915,371 | |||||||||||||||
| Distributions reinvested | 8,725 | 61,599 | 78,571 | 980,570 | |||||||||||||||
| Redemptions | (74,034 | ) | (609,097 | ) | (206,528 | ) | (2,695,952 | ) | |||||||||||
| Net increase | 395,677 | 2,886,627 | 198,042 | 2,199,989 | |||||||||||||||
| CMG Small Cap Growth Fund | |||||||||||||||||||
| (Unaudited) Six Months Ended January 31, 2009 | Year Ended July 31, 2008 | ||||||||||||||||||
| Shares | Dollars ($) | Shares | Dollars ($) | ||||||||||||||||
| Subscriptions | 4,080,457 | 4,330,761 | 5,512,467 | 10,835,393 | |||||||||||||||
| Distributions reinvested | - | - | 2,957,880 | 5,412,921 | |||||||||||||||
| Redemptions | (660,439 | ) | (916,965 | ) | (4,948,412 | ) | (9,268,493 | ) | |||||||||||
| Net increase | 3,420,018 | 3,413,796 | 3,521,935 | 6,979,821 | |||||||||||||||
| CMG Small Cap Value Fund | |||||||||||||||||||
| (Unaudited) Six Months Ended January 31, 2009 | Year Ended July 31, 2008 | ||||||||||||||||||
| Shares | Dollars ($) | Shares | Dollars ($) | ||||||||||||||||
| Subscriptions | 1,257,191 | 8,749,279 | 390,255 | 4,608,081 | |||||||||||||||
| Distributions reinvested | 279,262 | 1,996,728 | 284,822 | 3,292,542 | |||||||||||||||
| Redemptions | (206,483 | ) | (2,400,913 | ) | (548,483 | ) | (7,076,591 | ) | |||||||||||
| Net increase | 1,329,970 | 8,345,094 | 126,594 | 824,032 | |||||||||||||||
| CMG Small/Mid Cap Fund | |||||||||||||||||||
| (Unaudited) Six Months Ended January 31, 2009 | Year Ended July 31, 2008 | ||||||||||||||||||
| Shares | Dollars ($) | Shares | Dollars ($) | ||||||||||||||||
| Subscriptions | - | - | - | - | |||||||||||||||
| Distributions reinvested | - | - | 393,790 | 1,646,043 | |||||||||||||||
| Redemptions | - | - | (271,739 | ) | (1,000,000 | ) | |||||||||||||
| Net increase | - | - | 122,051 | 646,043 | |||||||||||||||
See Accompanying Notes to Financial Statements.
98
STATEMENTS OF CHANGES IN NET ASSETS - CAPITAL STOCK ACTIVITY
| CMG International Stock Fund | |||||||||||||||||||
| (Unaudited) Six Months Ended January 31, 2009 | Year Ended July 31, 2008 | ||||||||||||||||||
| Shares | Dollars ($) | Shares | Dollars ($) | ||||||||||||||||
| Subscriptions | 1,586,498 | 10,724,347 | 988,440 | 12,545,498 | |||||||||||||||
| Distributions reinvested | 246,765 | 1,594,099 | 1,007,862 | 11,751,665 | |||||||||||||||
| Redemptions | (1,193,205 | ) | (7,671,008 | ) | (1,617,185 | ) | (19,624,059 | ) | |||||||||||
| Net increase | 640,058 | 4,647,438 | 379,117 | 4,673,104 | |||||||||||||||
See Accompanying Notes to Financial Statements.
99
NOTES TO FINANCIAL STATEMENTS
January 31, 2009 (Unaudited)
Note 1. Organization:
Columbia Funds Institutional Trust (the "Trust") is a Massachusetts business trust registered under the Investment Company Act of 1940, as amended, as an open-end management investment company. Information presented in these financial statements pertains to the following diversified funds (individually referred to as a "Fund", collectively referred to as the "Funds"):
CMG Enhanced S&P 500® Index Fund
CMG Large Cap Growth Fund
CMG Large Cap Value Fund
CMG Mid Cap Growth Fund
CMG Mid Cap Value Fund
CMG Small Cap Growth Fund
CMG Small Cap Value Fund
CMG Small/Mid Cap Fund
CMG International Stock Fund
Shares of the Funds are available for purchase by institutional investors investing directly in the Funds, by institutional investors investing in the Funds as an advisory client of Columbia Management Advisors, LLC ("Columbia"), the Funds' investment advisor, and by institutional investors investing in the Funds as an advisory client of Bank of America, N.A. Please see the Funds' prospectuses for further details, including applicable investment minimums.
Investment objectives. CMG Enhanced S&P 500® Index Fund seeks to outperform the total return, over the long term, of the Standard & Poor's 500 Composite Stock Price Index that measures the investment returns of stocks of large U.S. companies, while maintaining overall portfolio characteristics similar to those of the benchmark. CMG Large Cap Growth Fund and CMG Large Cap Value Fund seek long-term growth by investing primarily in large capitalization equities. CMG Mid Cap Growth Fund and CMG Mid Cap Value Fund seek long-term growth by investing in middle capitalization equities. CMG Small Cap Growth Fund seeks long-term capital appreciation. CMG Small Cap Value Fund seeks long-term growth by investing in small capitalization equities. CMG Small/Mid Cap Fund seeks long-term capital appreciation by investing in small capitalization and middle capitalization equities. CMG International Stock Fund seeks long-term capital appreciation.
Fund shares. The Trust may issue an unlimited number of shares of beneficial interest which are offered continuously at net asset value.
Note 2. Significant accounting policies:
The preparation of financial statements in accordance with accounting principles generally accepted in the United States of America ("GAAP") requires management to make certain estimates and assumptions that affect the reported amounts of assets and liabilities, the disclosure of contingent assets and liabilities at the date of the financial statements and the reported amounts of revenue and expenses during the reporting period. Actual results could differ from those estimates. The following is a summary of significant accounting policies consistently followed by the Funds in the preparation of their financial statements.
Security valuation. Equity securities, exchange-traded funds and securities of certain investment companies are valued at the last sale price on the principal exchange on which they trade, except for securities traded on the NASDAQ, which are valued at the NASDAQ official close price. Unlisted securities or listed securities for which there were no sales during the day are valued at the closing bid price on such exchanges or over-the-counter markets.
100
NOTES TO FINANCIAL STATEMENTS (continued)
January 31, 2009 (Unaudited)
Short-term investments maturing in 60 days or less are valued at amortized cost, which approximates market value.
Investments in other open-end investment companies are valued at net asset value.
Futures contracts are valued at the settlement price established each day by the board of trade or exchange on which they are traded.
Purchased options are valued at the last reported sale price, or in the absence of a sale, at the last quoted bid price. Written options are valued at the last reported sale price, or in the absence of a sale, at the last quoted ask price.
Forward foreign currency exchange contracts are valued at the prevailing forward exchange rate of the underlying currencies.
Foreign securities are generally valued at the last sale price on the foreign exchange or market on which they trade. If any foreign share prices are not readily available as a result of limited share activity, the securities are valued at the last sale price of the local shares in the principal market in which such securities are normally traded.
Generally, trading in foreign securities is substantially completed each day at various times prior to the close of the New York Stock Exchange ("NYSE"). The values of such securities used in computing the net asset value of the Funds' shares are determined as of such times. Foreign currency exchange rates are generally determined at 4:00 p.m. Eastern (U.S.) time. Occasionally, events affecting the values of such foreign securities and such exchange rates may occur between the times at which they are determined and the close of the customary trading session of the NYSE, which would not be reflected in the computation of the Funds' net asset values. If events materially affecting the values of such foreign securities occur and it is determined that market quotations are not reliable, then these foreign securities will be valued at their fair value using procedures approved by the Board of Trustees.
CMG International Stock Fund may use a systematic fair valuation model provided by an independent third party to value securities principally traded in foreign markets in order to adjust for possible stale pricing that may occur between the close of the foreign exchanges and the time for valuation.
Investments for which market quotations are not readily available, or that have quotations which management believes are not reliable, are valued at fair value as determined in good faith under consistently applied procedures established by and under the general supervision of the Board of Trustees. If a security is valued at fair value, such value is likely to be different from the last quoted market price for the security.
On August 1, 2008, the Funds adopted Statement of Financial Accounting Standards No. 157, Fair Value Measurements ("SFAS 157"). SFAS 157 establishes a hierarchy that prioritizes the inputs to valuation techniques used to measure fair value giving the highest priority to unadjusted quoted prices in active markets for identical securities (level 1 measurements) and the lowest priority to unobservable inputs (level 3 measurements) when market prices are not readily available or reliable. The three levels of the fair value hierarchy under SFAS 157 are described below:
• Level 1–quoted prices in active markets for identical securities
• Level 2–prices determined using other significant observable inputs (including quoted prices for similar securities, interest rates, prepayment speeds, credit risk and others)
• Level 3–prices determined using significant unobservable inputs. In situations where quoted prices or observable inputs are unavailable or less reliable, unobservable inputs may be used. Unobservable inputs may include management's own assumptions about the factors market participants would use in pricing an investment.
101
NOTES TO FINANCIAL STATEMENTS (continued)
January 31, 2009 (Unaudited)
The inputs or methodology used for valuing securities are not necessarily an indication of the risk associated with investing in those securities.
The following tables summarize the inputs used, as of January 31, 2009, in valuing each Fund's assets:
CMG Enhanced S&P 500® Index Fund
| Valuation Inputs | Investments in Securities | Other Financial Instruments* | |||||||||
| Level 1—Quoted Prices | $ | 102,849,519 | $ | (252,853 | ) | ||||||
| Level 2—Other Significant Observable Inputs | 3,883,000 | - | |||||||||
| Level 3—Significant Unobservable Inputs | - | - | |||||||||
| Total | $ | 106,732,519 | $ | (252,853 | ) | ||||||
* Other financial instruments consist of futures contracts which are not included in the investment portfolio.
CMG Large Cap Growth Fund
| Valuation Inputs | Investments in Securities | Other Financial Instruments | |||||||||
| Level 1—Quoted Prices | $ | 37,128,118 | $ | - | |||||||
| Level 2—Other Significant Observable Inputs | 568,000 | - | |||||||||
| Level 3—Significant Unobservable Inputs | - | - | |||||||||
| Total | $ | 37,696,118 | $ | - | |||||||
CMG Large Cap Value Fund
| Valuation Inputs | Investments in Securities | Other Financial Instruments | |||||||||
| Level 1—Quoted Prices | $ | 24,217,098 | $ | - | |||||||
| Level 2—Other Significant Observable Inputs | 1,560,000 | - | |||||||||
| Level 3—Significant Unobservable Inputs | - | - | |||||||||
| Total | $ | 25,777,098 | $ | - | |||||||
CMG Mid Cap Growth Fund
| Valuation Inputs | Investments in Securities | Other Financial Instruments | |||||||||
| Level 1—Quoted Prices | $ | 14,289,676 | $ | - | |||||||
| Level 2—Other Significant Observable Inputs | 639,000 | - | |||||||||
| Level 3—Significant Unobservable Inputs | - | - | |||||||||
| Total | $ | 14,928,676 | $ | - | |||||||
102
NOTES TO FINANCIAL STATEMENTS (continued)
January 31, 2009 (Unaudited)
CMG Mid Cap Value Fund
| Valuation Inputs | Investments in Securities | Other Financial Instruments | |||||||||
| Level 1—Quoted Prices | $ | 12,348,816 | $ | - | |||||||
| Level 2—Other Significant Observable Inputs | 944,500 | - | |||||||||
| Level 3—Significant Unobservable Inputs | - | - | |||||||||
| Total | $ | 13,293,316 | $ | - | |||||||
The Fund's assets assigned to the Level 2 input category include certain foreign securities for which a third party statistical pricing service may be employed for purposes of fair market valuation.
CMG Small Cap Growth Fund
| Valuation Inputs | Investments in Securities | Other Financial Instruments | |||||||||
| Level 1—Quoted Prices | $ | 25,910,650 | $ | - | |||||||
| Level 2—Other Significant Observable Inputs | 1,544,000 | - | |||||||||
| Level 3—Significant Unobservable Inputs | - | - | |||||||||
| Total | $ | 27,454,650 | $ | - | |||||||
CMG Small Cap Value Fund
| Valuation Inputs | Investments in Securities | Other Financial Instruments | |||||||||
| Level 1—Quoted Prices | $ | 21,827,428 | $ | - | |||||||
| Level 2—Other Significant Observable Inputs | 6,592,000 | - | |||||||||
| Level 3—Significant Unobservable Inputs | - | - | |||||||||
| Total | $ | 28,419,428 | $ | - | |||||||
CMG Small/Mid Cap Fund
| Valuation Inputs | Investments in Securities | Other Financial Instruments | |||||||||
| Level 1—Quoted Prices | $ | 6,520,297 | $ | - | |||||||
| Level 2—Other Significant Observable Inputs | 257,000 | - | |||||||||
| Level 3—Significant Unobservable Inputs | - | - | |||||||||
| Total | $ | 6,777,297 | $ | - | |||||||
103
NOTES TO FINANCIAL STATEMENTS (continued)
January 31, 2009 (Unaudited)
CMG International Stock Fund
| Valuation Inputs | Investments in Securities | Other Financial Instruments* | |||||||||
| Level 1—Quoted Prices | $ | 8,258,247 | $ | 43,893 | |||||||
| Level 2—Other Significant Observable Inputs | 43,928,399 | 145,264 | |||||||||
| Level 3—Significant Unobservable Inputs | - | - | |||||||||
| Total | $ | 52,186,646 | $ | 189,157 | |||||||
* Other financial instruments consist of forward foreign currency exchange contracts and written options which are not included in the Schedule of Investments.
The Fund's assets assigned to the Level 2 input category include certain foreign securities for which a third party statistical pricing service may be employed for purposes of fair market valuation.
Security transactions. Security transactions are accounted for on the trade date. Cost is determined and gains (losses) are based upon the specific identification method for both financial statement and federal income tax purposes.
In March 2008, Statement of Financial Accounting Standards No. 161, Disclosures about Derivative Instruments and Hedging Activities-an amendment of FASB Statement No. 133 ("SFAS 161"), was issued. SFAS 161 is effective for fiscal years and interim periods beginning after November 15, 2008. SFAS 161 requires additional discussion about the reporting entity's derivative instruments and hedging activities, by providing for qualitative disclosures about the objectives and strategies for using derivatives, quantitative data about the fair value of and gains and losses on derivative contracts, and details of credit-risk-related contingent features in their derivative contracts. Management is evaluating the impact the application of SFAS 161 will have on the Funds' financial statement di sclosures.
Futures contracts. The Funds may invest in futures for both hedging and non-hedging purposes, including, for example, to seek enhanced returns or as a substitute for a position in an underlying asset.
The use of futures contracts involves certain risks, which include: (1) imperfect correlation between the price movement of the instruments and the underlying securities, (2) inability to close out positions due to differing trading hours, or the temporary absence of a liquid market, for either the instruments or the underlying securities, or (3) an inaccurate prediction of the future direction of interest rates by Columbia. Any of these risks may involve amounts exceeding the variation margin recorded in the Funds' Statements of Assets and Liabilities at any given time.
Upon entering into a futures contract, a Fund pledges cash or securities with the broker in an amount sufficient to meet the initial margin requirement. Subsequent payments are made or received by a Fund equal to the daily change in the contract value and are recorded as variation margin receivable or payable and offset in unrealized gains or losses. A Fund recognizes a realized gain or loss when the contract is closed or expires.
Options. Each Fund may write call and put options on securities it owns or in which it may invest. Writing put options tends to increase a Fund's exposure to the underlying instrument. Writing call options tends to decrease a Fund's exposure to the underlying instrument. When a Fund writes a call or put option, an amount equal to the premium received is recorded as a liability and subsequently marked-to-market to reflect the current value of the option written. Premiums received from writing options which expire are treated as realized gains. Premiums received from writing options which are exercised or closed are added to the proceeds or offset against the amounts paid on the underlying security transaction to determine the realized gain or loss. Each Fund, as a writer of an option, has no control over whether the underlying security may be sold (call) or p urchased (put) and as a result bears the market risk
104
NOTES TO FINANCIAL STATEMENTS (continued)
January 31, 2009 (Unaudited)
of an unfavorable change in the price of the security underlying the written option. There is the risk that the Funds may not be able to enter into a closing transaction because of an illiquid market. The Funds' custodian will set aside cash or liquid portfolio securities equal to the amount of the written options contract commitment in a separate account.
Each Fund may also purchase put and call options. Purchasing call options tends to increase a Fund's exposure to the underlying instrument. Purchasing put options tends to decrease a Fund's exposure to the underlying instrument. The Funds may pay a premium, which is included in the Funds' Statements of Assets and Liabilities as an investment and subsequently marked-to-market to reflect the current value of the option. The risk associated with purchasing put and call options is limited to the premium paid. Premiums paid for purchasing options which expire are treated as realized losses. Premiums paid for purchasing options which are exercised are added to the amounts paid (call) or offset against the proceeds (put) on the underlying security to determine the realized gain or loss. If a Fund enters into a closing transaction, the Fund will realize a gain or loss, depending on whether the proceeds from the closing transaction are g reater or less than the cost of the option.
Forward foreign currency exchange contracts. Forward foreign currency exchange contracts are agreements to exchange one currency for another at a future date at a specified price. These contracts are used to minimize the exposure to foreign exchange rate fluctuations during the period between trade and settlement date of the contract. Certain Funds may utilize forward foreign currency exchange contracts in connection with the settlement of purchases and sales of securities. Certain Funds may also enter into these contracts to hedge certain other foreign currency denominated assets. Contracts to buy generally are used to acquire exposure to foreign currencies, while contracts to sell are generally used to hedge the Funds' investments against currency fluctuations. Forward foreign currency exchange contracts are valued daily at the current exchange rate of the underlying currency, resulting in unrealized gains (losses) which become realized at the time the forward foreign currency exchange contracts are closed or mature. Realized and unrealized gains (losses) arising from such transactions are included in net realized and unrealized gains (losses) on foreign currency transactions. The use of forward foreign currency exchange contracts does not eliminate fluctuations in the prices of the Funds' portfolio securities. While the maximum potential loss from such contracts is the aggregate face value in U.S. dollars at the time the contract was opened, exposure is typically limited to the change in value of the contract (in U.S. dollars) over the period it remains open. The Funds could also be exposed to risk that counterparties of the contracts may be unable to fulfill the terms of the contracts.
Repurchase agreements. Each Fund may engage in repurchase agreement transactions with institutions that Columbia has determined are creditworthy. Each Fund, through its custodian, receives delivery of the underlying securities collateralizing a repurchase agreement. Columbia is responsible for determining that the collateral is at least equal, at all times, to the value of the repurchase obligation including interest. A repurchase agreement transaction involves certain risks in the event of default or insolvency of the counterparty. These risks include possible delays in or restrictions on each Fund's ability to dispose of the underlying securities and a possible decline in the value of the underlying securities during the period while the Funds seek to assert their rights.
Foreign currency transactions and translations. The values of all assets and liabilities quoted in foreign currencies are translated into U.S. dollars at that day's exchange rates. Net realized and unrealized gains (losses) on foreign currency transactions and translations include gains (losses) arising from the fluctuation in exchange rates between trade and settlement dates on securities transactions, gains (losses) arising from the disposition of foreign currency and currency gains (losses) between the accrual and payment dates on dividends, interest income and foreign withholding taxes.
For financial statement purposes, the Funds do not distinguish that portion of gains (losses) on investments which is due to changes in foreign exchange rates from that which is due to changes in market prices of the investments. Such fluctuations are included with the net realized and unrealized gains (losses) on investments on the Statements of Operations.
105
NOTES TO FINANCIAL STATEMENTS (continued)
January 31, 2009 (Unaudited)
Income recognition. Interest income is recorded on the accrual basis. Corporate actions and dividend income are recorded on the ex-date except for certain foreign securities which are recorded as soon after the ex-date as the Funds become aware of such, net of any non-reclaimable tax withholdings. Distributions received from real estate investment trusts (REITs) in excess of their income are recorded as a reduction of the cost of the related investments. If the Funds no longer own the applicable securities, any distributions received in excess of income are recorded as realized gains.
Expenses. General expenses of the Trust are allocated to the Funds and other series of the Trust based upon relative net assets or other expense allocation methodologies determined by the nature of the expense. Expenses directly attributable to a Fund are charged to such Fund.
Federal income tax status. Each Fund intends to qualify each year as a "regulated investment company" under Subchapter M of the Internal Revenue Code, as amended, and will distribute substantially all of its taxable income for its tax year, and as such will not be subject to federal income taxes. In addition, each Fund intends to distribute in each calendar year substantially all of its net investment income, capital gains and certain other amounts, if any, such that each Fund should not be subject to federal excise tax. Therefore, no federal income or excise tax provision is recorded.
Distributions to shareholders. Distributions from net investment income, if any, are declared and distributed annually. Net realized capital gains, if any, are distributed at least annually. Income distributions and capital gain distributions are determined in accordance with federal income tax regulations which may differ from GAAP.
Indemnification. In the normal course of business, each Fund enters into contracts that contain a variety of representations and warranties and which provide general indemnities. A Fund's maximum exposure under these arrangements is unknown because this would involve future claims against a Fund. Also, under the Trust's organizational documents and by contract, the Trustees and officers of the Trust are indemnified against certain liabilities that may arise out of actions relating to their duties to the Trust. However, based on experience, the Funds expect the risk of loss due to these representations, warranties and indemnities to be minimal.
Note 3. Federal tax information:
The tax character of distributions paid during the year ended July 31, 2008 was as follows:
| Ordinary Income* | Long-Term Capital Gains | Return of Capital | |||||||||||||
| CMG Enhanced S&P 500® Index Fund | $ | 6,368,282 | $ | 4,124,057 | $ | - | |||||||||
| CMG Large Cap Growth Fund | 2,631,485 | 1,633,720 | - | ||||||||||||
| CMG Large Cap Value Fund | 1,706,031 | 3,143,177 | - | ||||||||||||
| CMG Mid Cap Growth Fund | 1,279,107 | 3,162,485 | - | ||||||||||||
| CMG Mid Cap Value Fund | 553,426 | 1,429,928 | - | ||||||||||||
| CMG Small Cap Growth Fund | 2,282,199 | 3,997,173 | 159,987 | ||||||||||||
| CMG Small Cap Value Fund | 711,327 | 3,281,512 | - | ||||||||||||
| CMG Small/Mid Cap Fund | 479,786 | 1,332,231 | 71,809 | ||||||||||||
| CMG International Stock Fund | 8,374,380 | 9,216,557 | - | ||||||||||||
* For tax purposes short-term capital gain distributions, if any, are considered ordinary income distributions.
106
NOTES TO FINANCIAL STATEMENTS (continued)
January 31, 2009 (Unaudited)
Unrealized appreciation and depreciation at January 31, 2009, based on cost of investments for federal income tax purposes, were:
| Unrealized Appreciation | Unrealized Depreciation | Net Unrealized Depreciation | |||||||||||||
| CMG Enhanced S&P 500® Index Fund | $ | 6,903,436 | $ | (39,699,157 | ) | $ | (32,795,721 | ) | |||||||
| CMG Large Cap Growth Fund | 1,084,399 | (8,082,947 | ) | (6,998,548 | ) | ||||||||||
| CMG Large Cap Value Fund | 1,233,812 | (7,599,248 | ) | (6,365,436 | ) | ||||||||||
| CMG Mid Cap Growth Fund | 1,006,380 | (3,801,961 | ) | (2,795,581 | ) | ||||||||||
| CMG Mid Cap Value Fund | 503,459 | (5,340,087 | ) | (4,836,628 | ) | ||||||||||
| CMG Small Cap Growth Fund | 2,262,771 | (4,860,252 | ) | (2,597,481 | ) | ||||||||||
| CMG Small Cap Value Fund | 1,741,995 | (6,785,971 | ) | (5,043,976 | ) | ||||||||||
| CMG Small/Mid Cap Fund | 528,930 | (1,599,898 | ) | (1,070,968 | ) | ||||||||||
| CMG International Stock Fund | 1,869,290 | (20,591,385 | ) | (18,722,095 | ) | ||||||||||
The following capital loss carryforwards, determined as of July 31, 2008, may be available to reduce taxable income arising from future net realized gains on investments, if any, to the extent permitted by the Internal Revenue Code:
| Year of Expiration | |||||||||||
| 2016 | Total | ||||||||||
| CMG Large Cap Value Fund | $ | 284,104 | $ | 284,104 | |||||||
Under Financial Accounting Standards Board ("FASB") Interpretation No. 48, Accounting for Uncertainty in Income Taxes–an Interpretation of FASB Statement No. 109 ("FIN 48"), management determines whether a tax position of the Funds is more likely than not to be sustained upon examination by the applicable taxing authority, including resolution of any related appeals or litigation processes, based on the technical merits of the position. The tax benefit to be recognized is measured as the largest amount of benefit that is greater than fifty percent likely of being realized upon ultimate settlement. Management has evaluated the known implications of FIN 48 on its computation of net assets for each Fund. As a result of this evaluation, management has concluded that FIN 48 did no t have any effect on the Funds' financial statements. However, management's conclusions regarding FIN 48 may be subject to review and adjustment at a later date based on factors including, but not limited to, further implementation guidance from the FASB, new tax laws, regulations, and administrative interpretations (including relevant court decisions). The Funds' federal tax returns for the prior three fiscal years remain subject to examination by the Internal Revenue Service. The Funds are not aware of any tax positions for which it is reasonably possible that the total amounts of unrecognized tax benefits will significantly change in the next twelve months.
Note 4. Fees and compensation paid to affiliates:
Investment advisory fee. Columbia, an indirect, wholly owned subsidiary of Bank of America Corporation ("BOA"), provides investment advisory, administrative and other services to the Funds. In rendering investment advisory services to the Funds, Columbia may use the portfolio management and research resources of Columbia Management Pte. Ltd., an affiliate of Columbia. With the exception of CMG Small Cap Growth Fund, each Fund's investment advisory fee is a unified fee. Columbia, out of the unified fee it receives from the Funds, pays accounting fees, legal fees, transfer agent fees, custody fees, expenses of the Chief Compliance Officer, the commitment fee for the line of credit (see Note 7) and miscellaneous expenses of the Funds. The unified fee does not include brokerage fees, taxes, fees and expenses of the independent Trustees (including legal counsel f ees), audit fees, interest expense associated with any
107
NOTES TO FINANCIAL STATEMENTS (continued)
January 31, 2009 (Unaudited)
borrowings by the Funds or extraordinary expenses, if any. The unified fees are paid monthly to Columbia based on each Fund's average daily net assets at the following annual rates:
| CMG Enhanced S&P 500® Index Fund | 0.25 | % | |||||
| CMG Large Cap Growth Fund | 0.50 | % | |||||
| CMG Large Cap Value Fund | 0.50 | % | |||||
| CMG Mid Cap Growth Fund | 0.70 | % | |||||
| CMG Mid Cap Value Fund | 0.70 | % | |||||
| CMG Small Cap Value Fund | 0.80 | % | |||||
| CMG Small/Mid Cap Fund | 0.75 | % | |||||
| CMG International Stock Fund | 0.75 | % | |||||
Columbia receives a monthly investment advisory fee from CMG Small Cap Growth Fund at the annual rate of 0.75% of the Fund's average daily net assets.
Pricing and bookkeeping fees. The Funds have entered into a Financial Reporting Services Agreement (the "Financial Reporting Services Agreement") with State Street Bank & Trust Company ("State Street") and Columbia pursuant to which State Street provides financial reporting services to the Funds. The Funds have also entered into an Accounting Services Agreement (collectively with the Financial Reporting Services Agreement, the "State Street Agreements") with State Street and Columbia pursuant to which State Street provides accounting services to the Funds.
The Funds have entered into a Pricing and Bookkeeping Oversight and Services Agreement (the "Services Agreement") with Columbia. Under the Services Agreement, Columbia provides services related to Fund expenses and the requirements of the Sarbanes-Oxley Act of 2002, and provides oversight of the accounting and financial reporting services provided by State Street.
The pricing and bookkeeping fees for each Fund are payable by Columbia.
Transfer agent fee. Columbia Management Services, Inc. (the "Transfer Agent"), an affiliate of Columbia and an indirect, wholly owned subsidiary of BOA, provides shareholder services to the Funds and has contracted with Boston Financial Data Services ("BFDS") to serve as sub-transfer agent.
The Transfer Agent is entitled to receive a fee, paid monthly, at the annual rate of $17.34 per open account plus reimbursement of certain sub-transfer agent fees (exclusive of BFDS fees), calculated based on assets held in omnibus accounts subject to certain limitations and intended to recover the cost of payments to other parties (including affiliates of BOA) for services to those accounts. The Transfer Agent pays the fees of BFDS for services as sub-transfer agent and is not entitled to reimbursement for such fees from the Funds or Columbia.
The Transfer Agent may also retain, as additional compensation for its services, fees for wire, telephone and redemption orders, Individual Retirement Account ("IRA") trustee agent fees and account transcript fees due the Transfer Agent from shareholders of the Funds and credits (net of bank charges) earned with respect to balances in accounts the Transfer Agent maintains in connection with its services to the Funds.
The transfer agent fees for each Fund, with the exception of CMG Small Cap Growth Fund, are payable by Columbia under the investment advisory contracts.
Fee waivers and expense reimbursements. Columbia has contractually agreed to waive its management fee and, to the extent necessary, bear other expenses of each Fund through November 30, 2009, so that ordinary operating expenses incurred by the Funds will not exceed the following annual rates (exclusive of any distribution and service fees,
108
NOTES TO FINANCIAL STATEMENTS (continued)
January 31, 2009 (Unaudited)
brokerage commissions, interest, taxes and extraordinary expenses, but inclusive of custodial charges relating to overdrafts, if any), after giving effect to any balance credits from the Funds' custodian, based on each Fund's average daily net assets:
| CMG Enhanced S&P 500® Index Fund | 0.25 | % | |||||
| CMG Large Cap Growth Fund | 0.50 | % | |||||
| CMG Large Cap Value Fund | 0.50 | % | |||||
| CMG Mid Cap Growth Fund | 0.70 | % | |||||
| CMG Mid Cap Value Fund | 0.70 | % | |||||
| CMG Small Cap Growth Fund | 0.80 | % | |||||
| CMG Small Cap Value Fund | 0.80 | % | |||||
| CMG Small/Mid Cap Fund | 0.75 | % | |||||
| CMG International Stock Fund | 0.75 | % | |||||
There is no guarantee that these arrangements will continue after November 30, 2009.
Fees paid to officers and trustees. All officers of the Funds are employees of Columbia or its affiliates and, with the exception of the Funds' Chief Compliance Officer, receive no compensation from the Funds. The Board of Trustees has appointed a Chief Compliance Officer to the Funds in accordance with federal securities regulations. The expenses of the Chief Compliance Officer for each Fund, with the exception of CMG Small Cap Growth Fund, are payable by Columbia. CMG Small Cap Growth Fund, along with other affiliated funds, pays its pro-rata share of the expenses associated with the Chief Compliance Officer.
The Trust's eligible Trustees may participate in a deferred compensation plan which may be terminated at any time. Obligations of the plan will be paid solely out of the Funds' assets.
Note 5. Custody credits:
With the exception of CMG Small Cap Growth Fund, any custody credits are applied to offset fund expenses prior to determining the expenses Columbia is required to bear. CMG Small Cap Growth Fund has an agreement with its custodian bank under which custody fees may be reduced by balance credits. These credits are recorded as a reduction of total expenses on the Statements of Operations. The Fund could have invested a portion of the assets utilized in connection with the expense offset arrangement in an income-producing asset if it had not entered into such an agreement.
Note 6. Portfolio information:
For the six month period ended January 31, 2009, the cost of purchases and proceeds from sales of securities, excluding short-term obligations, were as follows:
| Purchases | Sales | ||||||||||
| CMG Enhanced S&P 500® Index Fund | $ | 34,044,475 | $ | 39,571,459 | |||||||
| CMG Large Cap Growth Fund | 38,444,927 | 33,209,191 | |||||||||
| CMG Large Cap Value Fund | 11,782,090 | 11,117,760 | |||||||||
| CMG Mid Cap Growth Fund | 12,195,485 | 12,084,137 | |||||||||
| CMG Mid Cap Value Fund | 5,849,374 | 2,783,667 | |||||||||
| CMG Small Cap Growth Fund | 27,495,999 | 25,332,105 | |||||||||
| CMG Small Cap Value Fund | 11,600,233 | 7,803,555 | |||||||||
| CMG Small/Mid Cap Fund | 6,254,043 | 6,233,613 | |||||||||
| CMG International Stock Fund | 46,240,648 | 44,395,184 | |||||||||
109
NOTES TO FINANCIAL STATEMENTS (continued)
January 31, 2009 (Unaudited)
Note 7. Line of credit:
The Funds and other affiliated funds participate in a $280,000,000 committed, unsecured revolving line of credit provided by State Street. The maximum amount that may be borrowed by any fund is limited to the lesser of $200,000,000 and the Fund's borrowing limit set forth in the Fund's registration statement. Borrowings are available for short-term liquidity or temporary or emergency purposes.
Interest is charged to each participating fund based on the fund's borrowings at a rate per annum equal to the greater of the Federal Funds Rate plus 0.50% or the overnight LIBOR Rate plus 0.50%. In addition, an annual operations agency fee of $20,000, an amendment fee of 0.02% and a commitment fee of 0.12% per annum are accrued and apportioned among the participating funds pro rata based on their relative net assets.
Prior to October 16, 2008, the Funds and other affiliated funds participated in a $350,000,000 committed, unsecured revolving line of credit and a $150,000,000 uncommitted, unsecured line of credit, both provided by State Street. Interest on the committed line of credit was charged to each participating fund based on the fund's borrowings at a rate per annum equal to the Federal Funds Rate plus 0.50%. In addition, a commitment fee of 0.10% per annum was accrued and apportioned among the participating funds pro rata based on their relative net assets. Interest on the uncommitted line of credit was charged to each participating fund based on the fund's borrowings at a rate per annum equal to the Federal Funds Rate plus 0.375%. State Street charged an annual operations agency fee of $40,000 for the committed line of credit and was able to charge an annual administration fee of $15,000 for the uncommitted line of credit. The commitm ent fee, the operations agency fee and the administration fee were accrued and apportioned among the participating funds pro rata based on their relative net assets.
For the six month period ended January 31, 2009, the average daily loan balance outstanding on days where borrowing existed, and the weighted average interest rate of each Fund that borrowed were as follows:
| Average Borrowing Existed | Weighted Average Interest Rate | ||||||||||
| CMG Small Cap Value Fund | $ | 1,000,000 | 2.479 | % | |||||||
| CMG International Stock Fund | 1,750,000 | 0.615 | |||||||||
Note 8. Securities lending:
CMG Enhanced S&P 500® Index Fund, CMG Large Cap Growth Fund, CMG Large Cap Value Fund and CMG Mid Cap Value Fund may lend their securities to certain approved brokers, dealers and other financial institutions. Each loan is collateralized by cash, in an amount at least equal to the market value of the securities loaned plus accrued income from the investment of collateral. The market value of the loaned securities is determined at the close of business of the Funds and any additional required collateral is delivered to the Funds on the next business day. The collateral received is invested and the income generated by the investment of the collateral, net of any fees remitted to State Street as the lending agent and borrower rebates, is paid to the Funds. Generally, in the event of borrower default, the Funds have the right to use the collateral to offset any losses incurred. In the event the Funds are delayed o r prevented from exercising their right to dispose of the collateral, there may be a potential loss to the Funds. The Funds bear the risk of loss with respect to the investment of collateral.
No securities were out on loan for the Funds at January 31, 2009.
110
NOTES TO FINANCIAL STATEMENTS (continued)
January 31, 2009 (Unaudited)
Note 9. Shares of beneficial interest:
As of January 31, 2009, the Funds had shareholders whose shares were beneficially owned by participant accounts over which BOA and/or any of its affiliates had either sole or joint investment discretion. The percentages of shares of beneficial interest outstanding held therein are as follows:
| % of Shares Outstanding Held | |||||||
| CMG Enhanced S&P 500® Index Fund | 100.0 | ||||||
| CMG Large Cap Growth Fund | 100.0 | ||||||
| CMG Large Cap Value Fund | 100.0 | ||||||
| CMG Mid Cap Growth Fund | 100.0 | ||||||
| CMG Mid Cap Value Fund | 100.0 | ||||||
| CMG Small Cap Growth Fund | 93.0 | ||||||
| CMG Small Cap Value Fund | 98.9 | ||||||
| CMG Small/Mid Cap Fund | 97.4 | ||||||
| CMG International Stock Fund | 100.0 | ||||||
As of January 31, 2009, CMG Small Cap Growth Fund had one shareholder that held 7.0% of the shares outstanding, over which BOA and/or any of its affiliates did not have investment discretion.
Subscription and redemption activity of these accounts may have a significant effect on the operations of the Funds.
Note 10. Significant risks and contingencies:
Sector focus risk. Certain Funds may focus their investments in certain sectors, subjecting them to greater risk than a fund that is less focused.
Foreign securities risk. There are certain additional risks involved when investing in foreign securities. These risks may involve foreign currency exchange rate fluctuations, adverse political and economic developments and the possible prevention of currency exchange or other foreign governmental laws or restrictions. In addition, the liquidity of foreign securities may be more limited than that of domestic securities.
Legal proceedings. CMG Funds are not named as parties to any regulatory proceedings or litigation. Columbia Management Advisors, LLC and Columbia Management Distributors, Inc. (collectively, the "Columbia Group") are subject to a settlement agreement with the New York Attorney General ("NYAG") (the "NYAG Settlement") and a settlement order with the SEC (the "SEC Order") on matters relating to mutual fund trading, each dated February 9, 2005. Under the terms of the SEC Order, the Columbia Group (or predecessor entities) agreed, among other things, to: pay disgorgement and civil money penalties collectively totaling $140 million; cease and desist from violations of the antifraud provisions and certain other provisions of the federal securities laws; maintain certain compliance and ethics oversight structures; and retain an independent consultant to review the Columbia Group's applicable supervisory, compliance, control and other policies and procedures. The NYAG Settlement, among other things, requires Columbia Management Advisors, LLC and its affiliates to reduce management fees for certain funds in the Columbia family of mutual funds in a projected total of $160 million over five years through November 30, 2009 and to make certain disclosures to investors relating to expenses. In connection with the Columbia Group providing services to the Columbia Funds, the Columbia Funds have voluntarily undertaken to implement certain governance measures designed to maintain the independence of their boards of trustees and certain special consulting and compliance measures.
111
NOTES TO FINANCIAL STATEMENTS (continued)
January 31, 2009 (Unaudited)
Pursuant to the SEC Order and related procedures, the $140 million in settlement amounts described above has been substantially distributed in accordance with a distribution plan that was developed by an independent distribution consultant and approved by the SEC on April 6, 2007.
In connection with the events described above, various parties have filed suit against certain funds, the Trustees of the Columbia Funds, FleetBoston Financial Corporation and its affiliated entities and/or Bank of America and its affiliated entities.
On February 20, 2004, the Judicial Panel on Multidistrict Litigation transferred these cases and cases against other mutual fund companies based on similar allegations to the United States District Court in Maryland for consolidated or coordinated pretrial proceedings (the "MDL"). Subsequently, additional related cases were transferred to the MDL. On September 29, 2004, the plaintiffs in the MDL filed amended and consolidated complaints. One of these amended complaints is a putative class action that includes claims under the federal securities laws and state common law, and that names Columbia Management Advisors, Inc. (which has since merged into Banc of America Capital Management, LLC (now named Columbia Management Advisors, LLC)) ("Columbia"), Columbia Funds Distributor, Inc. (now named Columbia Management Distributors, Inc.) (the "Distributor"), the Trustees of the Columbia Funds, Bank of America Corporation and others as d efendants. Another of the amended complaints is a derivative action purportedly on behalf of the Columbia Funds that asserts claims under federal securities laws and state common law.
On February 25, 2005, Columbia and other defendants filed motions to dismiss the claims in the pending cases. On March 1, 2006, for reasons stated in the court's memoranda dated November 3, 2005, the United States District Court for the District of Maryland granted in part and denied in part the defendants' motions to dismiss. The court dismissed all of the class action claims pending against the Columbia Funds Trusts. As to Columbia and the Distributor, the claims under the Securities Act of 1933, the claims under Sections 34(b) and 36(a) of the Investment Company Act of 1940 ("ICA") and the state law claims were dismissed. The claims under Sections 10(b) and 20(a) of the Securities Exchange Act of 1934 and claims under Section 36(b) of the ICA were not dismissed.
On March 21, 2005, a purported class action was filed in Massachusetts state court alleging that certain conduct, including market timing, entitled Class B shareholders in certain Columbia Funds to an exemption from contingent deferred sales charges upon early redemption (the "CDSC Lawsuit"). The CDSC Lawsuit was removed to federal court in Massachusetts and transferred to the MDL.
On September 14, 2007, the plaintiffs and the Columbia defendants named in the MDL, including the Columbia Funds, entered into a stipulation of settlement with respect to all Columbia-related claims in the MDL described above, including the CDSC Lawsuit. The settlement is subject to court approval.
112
BOARD CONSIDERATION AND APPROVAL OF
ADVISORY AGREEMENTS
The Advisory Fees and Expenses Committee of the Board of Trustees meets several times annually to review the advisory agreements (collectively, the "Agreements") of the funds for which the Trustees serve as trustees (each a "fund") and to determine whether to recommend that the full Board approve the continuation of the Agreements for an additional one-year period. After the Committee has made its recommendation, the full Board, including the Independent Trustees, determines whether to approve the continuation of the Agreements. In addition, the full Board, including the Independent Trustees, considers matters bearing on the Agreements at most of its other meetings throughout the year and meets regularly with senior management of the funds and Columbia, the funds' investment adviser, including the senior manager of each investment area within Columbia. Through the Board's Investment Oversight Committees, Trustees also meet with selected fund portfolio managers, research analysts and traders at various times throughout the year.
The Trustees receive and review all materials that they, their legal counsel or Columbia believe to be reasonably necessary for the Trustees to evaluate the Agreements and to determine whether to approve the continuation of the Agreements. Those materials generally include, among other items, (i) information on the investment performance of each fund relative to the performance of peer groups of mutual funds and the fund's performance benchmarks, and additional information assessing performance on a risk-adjusted basis, (ii) information on each fund's advisory fees and other expenses, including information comparing the fund's expenses to those of peer groups of mutual funds and information about any applicable expense caps and fee "breakpoints," (iii) information about the profitability of the Agreements to Columbia, including potential "fall-out" or ancillary benefits that Columbia and its affiliates may receive as a result of their relationships with the funds and (iv) information obtained through Columbia's response to a questionnaire prepared at the request of the Trustees by counsel to the funds and independent legal counsel to the Independent Trustees. The Trustees also consider other information such as (v) Columbia's financial results and financial condition, (vi) each fund's investment objective and strategies and the size, education and experience of Columbia's investment staffs and their use of technology, external research and trading cost measurement tools, (vii) the allocation of the funds' brokerage and the use of "soft" commission dollars to pay for research products and services, (viii) Columbia's resources devoted to, and its record of compliance with, the funds' investment policies and restrictions, policies on personal securities transactions and other compliance policies and legal and regulatory requirements, (ix) Columbia's response to various legal and regulatory proceedings since 2003 and to the recent peri od of volatility in the securities markets and (x) the economic outlook generally and for the mutual fund industry in particular. In addition, the Advisory Fees and Expenses Committee confers with the funds' independent fee consultant and reviews materials relating to the funds' relationships with Columbia provided by the independent fee consultant. Throughout the process, the Trustees have the opportunity to ask questions of and to request additional materials from Columbia and to consult with the independent fee consultant and independent legal counsel to the Independent Trustees.
The Board of Trustees most recently approved the continuation of the Agreements at its October, 2008 meeting, following meetings of the Advisory Fees and Expenses Committee held in February, April, August, September and October, 2008. In considering whether to approve the continuation of the Agreements, the Trustees, including the Independent Trustees, did not identify any single factor as determinative, and each weighed various factors as he or she deemed appropriate. The Trustees considered the following matters in connection with their approval of the continuation of the Agreements:
The nature, extent and quality of the services provided to the funds under the Agreements. The Trustees considered the nature, extent and quality of the services provided by Columbia and its affiliates to the funds and the resources dedicated to the funds by Columbia and its affiliates. Among other things, the Trustees considered (i) Columbia's ability (including its personnel and other resources, compensation programs for personnel involved in fund management, reputation and other attributes) to attract, motivate and retain highly qualified research, advisory and supervisory investment professionals; (ii) the portfolio management services provided by those investment professionals; and (iii) the trade execution services provided on behalf of the funds. For each fund, the Trustees also
113
considered the benefits to shareholders of investing in a mutual fund that is part of a family of funds offering exposure to a variety of asset classes and investment disciplines and providing a variety of fund and shareholder services. After reviewing those and related factors, the Trustees concluded, within the context of their overall conclusions regarding each of the Agreements, that the nature, extent and quality of services provided supported the continuation of the Agreements.
Investment performance of the funds and Columbia. The Trustees reviewed information about the performance of each fund over various time periods, including information prepared by an independent third-party data provider that compared the performance of each fund to the performance of peer groups of mutual funds and performance benchmarks. The Trustees also reviewed a description of the third party's methodology for identifying each fund's peer group for purposes of performance and expense comparisons. The Trustees also considered additional information that the Advisory Fees and Expenses Committee requested from Columbia relating to funds that presented relatively weaker performance and/or relatively higher expenses. In the case of each fund whose performance lagged that of a relevant peer group for certain (although not necessarily all) periods, the Truste es concluded that other factors relevant to performance were sufficient, in light of other considerations, to warrant continuation of the fund's Agreements. Those factors varied from fund to fund, but included one or more of the following: (i) that the fund's performance, although lagging in certain recent periods, was stronger over the longer term; (ii) that the underperformance was attributable, to a significant extent, to investment decisions that were reasonable and consistent with the fund's investment strategy and policies and that the fund was performing within a reasonable range of expectations, given those investment decisions, market conditions and the fund's investment strategy; (iii) that the fund's performance was competitive when compared to other relevant performance benchmarks or peer groups; (iv) that Columbia had taken or was taking steps designed to help improve the fund's investment performance, including, but not limited to, replacing portfolio managers or modifying investment strategies ; and (v) that Columbia proposed to waive advisory fees or cap the expenses of the fund.
The Trustees noted the performance of each fund through April 30, 2008, relative to that of a peer group selected by an independent third-party data provider for the purposes of performance comparisons. Specifically, CMG Enhanced S&P 500 Index Fund's performance was in the fourth quintile (where the best performance would be in the first quintile) for the one-year period, in the third quintile for the three-year period, and in the second quintile for the five-year period; CMG Large Cap Growth Fund's performance was in the second quintile for the one-, three- and five-year periods; CMG Large Cap Value Fund's performance was in the second quintile for the one-year period and in the third quintile for the three- and five-year periods; CMG Mid Cap Growth Fund's performance was in the second quintile for the one- and five-year periods, and in the first quintile for the three-year period; CMG Mid Cap Value Fund's performance was i n the fourth quintile for the one-year period, and in the second quintile for the three- and five-year periods; CMG Small Cap Growth Fund's performance was in the first quintile for the one-, three-, five- and ten-year periods; CMG Small Cap Value Fund's performance was in the second quintile for the one-, three- and five-year periods; CMG Small/Mid Cap Fund's performance was in the second quintile for the one-, five- and ten-year periods, and in the first quintile for the three-year period; and CMG International Stock Fund's performance was in the fourth quintile for the one-, three- and five-year periods and in the third quintile for the ten-year period.
The Trustees also considered Columbia's performance and reputation generally, the funds' performance as a fund family generally, and Columbia's historical responsiveness to Trustee concerns about performance and Columbia's willingness to take steps intended to improve performance. After reviewing those and related factors, the Trustees concluded, within the context of their overall conclusions regarding each of the Agreements, that the performance of each fund and Columbia was sufficient, in light of other considerations, to warrant the continuation of the Agreement(s) pertaining to that fund.
The costs of the services provided and profits realized by Columbia and its affiliates from their relationships with the funds. The Trustees considered the fees charged to the funds for advisory services as well as the total expense levels of the funds. That information included comparisons (provided by management and by an independent third-party data provider) of each fund's advisory fees and total expense levels to those of the fund's peer groups and information about the advisory fees charged by Columbia to comparable institutional accounts. In considering the fees charged to those accounts, the Trustees took into account, among other things, management's representations
114
about the differences between managing mutual funds as compared to other types of accounts, including differences in the services provided, differences in the risk profile of such business for Columbia, and the additional resources required to manage mutual funds effectively. In evaluating each fund's advisory fees, the Trustees also took into account the demands, complexity and quality of the investment management of the fund. The Trustees considered existing advisory fee breakpoints, and Columbia's use of advisory fee waivers and expense caps, which benefited a number of the funds. The Trustees also noted management's stated justification for the fees charged to the funds, which included information about the investment performance of the funds and the services provided to the funds.
The trustees considered each fund's total expenses and actual management fees relative to those of a peer group selected by an independent third-party data provider for the purposes of expense comparisons. Specifically, CMG Enhanced S&P 500 Index Fund's total expenses and actual management fees were in the first quintile (where the lowest fees and expenses would be in the first quintile); CMG Large Cap Growth Fund's total expenses and actual management fees were in the first quintile; CMG Large Cap Value Fund's total expenses and actual management fees were in the first quintile; CMG Mid Cap Growth Fund's total expenses and actual management fees were in the first quintile, CMG Mid Cap Value Fund's total expenses and actual management fees were in the first quintile; CMG Small Cap Growth Fund's total expenses and actual management fees were in the first quintile; CMG Small Cap Value Fund's total expenses and actual managemen t fees were in the first quintile; CMG Small/Mid Cap Fund's total expenses and actual management fees were in the first quintile; and CMG International Stock Fund's total expenses and actual management fees were in the first quintile.
The Trustees also considered the compensation directly or indirectly received by Columbia and its affiliates from their relationships with the funds. The Trustees reviewed information provided by management as to the profitability to Columbia and its affiliates of their relationships with each fund, and information about the allocation of expenses used to calculate profitability. When reviewing profitability, the Trustees also considered court cases in which adviser profitability was an issue in whole or in part, the performance of the relevant funds, the expense level of each fund, and whether Columbia had implemented breakpoints and/or expense caps with respect to the fund.
After reviewing those and related factors, the Trustees concluded, within the context of their overall conclusions regarding each of the Agreements, that the advisory fees charged to each fund, and the related profitability to Columbia and its affiliates of their relationships with the fund, supported the continuation of the Agreement(s) pertaining to that fund.
Economies of Scale. The Trustees considered the existence of any economies of scale in the provision by Columbia of services to each fund, to groups of related funds, and to Columbia's investment advisory clients as a whole and whether those economies were shared with the funds through breakpoints in the investment advisory fees or other means, such as fee waivers/expense reductions and additional investments by Columbia in investment, trading and compliance resources. The Trustees noted that many of the funds benefited from breakpoints, fee waivers/expense caps, or both. In considering those issues, the Trustees also took note of the costs of the services provided (both on an absolute and a relative basis) and the profitability to Columbia and its affiliates of their relationships with the funds, as discussed above.
After reviewing those and related factors, the Trustees concluded, within the context of their overall conclusions regarding each of the Agreements, that the extent to which economies of scale were shared with the funds supported the continuation of the Agreements.
Other Factors. The Trustees also considered other factors, which included but were not limited to the following:
n the extent to which each fund had operated in accordance with its investment objective and investment restrictions, the nature and scope of the compliance programs of the funds and Columbia and the compliance-related resources that Columbia and its affiliates were providing to the funds;
115
n the nature, quality, cost and extent of administrative and shareholder services overseen and performed by Columbia and its affiliates, both under the Agreements and under separate agreements for the provision of transfer agency and administrative services;
n so-called "fall-out benefits" to Columbia and its affiliates, such as the engagement of its affiliates to provide distribution, brokerage and transfer agency services to the funds, and the benefits of research made available to Columbia by reason of brokerage commissions generated by the funds' securities transactions, as well as possible conflicts of interest associated with those fall-out and other benefits, and the reporting, disclosure and other processes in place to disclose and monitor those possible conflicts of interest; and
n the report provided by the funds' independent fee consultant, which included information about and analysis of the funds' fees, expenses and performance.
Based on their evaluation of all factors that they deemed to be material, including those factors described above, and assisted by the advice of independent counsel and the independent fee consultant, the Trustees, including the Independent Trustees, approved the continuance of each of the Agreements through October 31, 2009.
116
SUMMARY OF MANAGEMENT FEE EVALUATION BY
INDEPENDENT FEE CONSULTANT
EXCERPTS FROM REPORT OF INDEPENDENT FEE CONSULTANT TO THE FUNDS SUPERVISED BY THE COLUMBIA ATLANTIC BOARD
Prepared Pursuant to the February 9, 2005 Assurance of Discontinuance among the Office of Attorney General of New York State, Columbia Management Advisors, LLC, and Columbia Management Distributors, Inc. November 3, 2008
I. Overview
On February 9, 2005, Columbia Management Advisors, LLC ("CMA") and Columbia Management Distributors, Inc.1 ("CMD") agreed to the New York Attorney General's Assurance of Discontinuance ("AOD"). Among other things, the AOD stipulates that CMA may manage or advise a Columbia Fund ("Columbia Fund" and, together with some or all of such funds, the "Columbia Funds") only if the Independent Members of the Columbia Fund's Board of Trustees appoint a Senior Officer or retain an Independent Fee Consultant ("IFC") who is to manage the process by which proposed management fees are negotiated. The AOD further stipulates that the Senior Officer or IFC is to prepare a written annual evaluation of the fee negotiation process.
With effect from January 1, 2007, the Independent Members of the Board of Trustees for certain Columbia Funds known collectively as the "Atlantic Funds" (together with the other members of that Board, the "Trustees") retained me as IFC for the Atlantic Funds.2 In this capacity, I have prepared the fourth annual written evaluation of the fee negotiation process. As was the case with last year's report (the "2007 Report") my immediate predecessor as IFC, John Rea, provided invaluable assistance in the preparation of this year's report.
A. Role of the Independent Fee Consultant
The AOD charges the IFC with "managing the process by which proposed management fees...to be charged the Columbia Fund are negotiated so that they are negotiated in a manner which is at arms' length and reasonable and consistent with this Assurance of Discontinuance." The AOD also provides that CMA "may manage or advise a Columbia Fund only if the reasonableness of the proposed management fees is determined by the Board of Trustees...using...an annual independent written evaluation prepared by or under the direction of...the Independent Fee Consultant." Therefore, the AOD makes clear that the IFC does not supplant the Trustees in negotiating management fees with CMA, nor does the IFC substitute his or her judgment for that of the Trustees with respect to the reasonableness of proposed fees or any other matter that is committed to the business judgment of the Trustees.
B. Elements Involved in Managing the Fee Negotiation Process
In preparing the report required by the AOD, the IFC must consider at least the following six factors set forth in the AOD:
1. The nature and quality of CMA's services, including the Fund's performance;
2. Management fees (including any components thereof) charged by other mutual fund companies for like services;
1 CMA and CMD are subsidiaries of Columbia Management Group, LLC ("CMG"), and are the successors to the entities named in the AOD.
2 I have no material relationship with Bank of America, CMG or any of its affiliates, aside from serving as IFC, and I am aware of no material relationship with any of their affiliates. I retained John Rea, an independent economic consultant, to assist me with this report.
Unless otherwise stated or required by the context, this report covers only the Atlantic Funds, which are also referred as the "Funds."
117
3. Possible economies of scale as the Fund grows larger;
4. Management fees (including any components thereof) charged to institutional and other clients of CMA for like services;
5. Costs to CMA and its affiliates of supplying services pursuant to the management fee agreements, excluding any intra-corporate profit; and
6. Profit margins of CMA and its affiliates from supplying such services.
C. Organization of the Annual Evaluation
This report, like last year's, focuses on the six factors and contains a section for each factor except that CMA's costs and profits from managing the Funds have been combined into a single section. In addition to a discussion of these factors, the report offers recommendations to improve the fee review process in future years. A review of the status of recommendations made in the 2007 Report is being provided separately with the materials for the October meeting.
II. Summary of Findings
A. General
1. Based upon my examination of the information supplied by CMG in the light of the six factors set forth in the AOD, I conclude that the Trustees have the relevant information necessary to evaluate the reasonableness of the proposed management fees for each Atlantic Fund.
2. In my view, the process by which the proposed management fees of the Funds have been negotiated in 2008 thus far has been, to the extent practicable, at arms' length and reasonable and consistent with the AOD.
B. Nature and Quality of Services, Including Performance
3. The performance of the Funds has been relatively strong in recent years. Based upon 1-, 3-, 5-, and 10-year returns through April 30, 2008, at least half of all the Funds were in the first and second performance quintiles in each of the four performance periods and, at most, only 11% were in the fifth quintile in any one performance period. Both equity and fixed-income funds posted strong performance relative to comparable funds.
4. Performance rankings were similar in 2007 and 2008, although last year's were slightly stronger. Despite the stability in the distribution of rankings in the two years, at least half the Funds changed quintile rankings between the two years in at least one of the 1-, 3-, and 5-year performance periods.
5. The performance of the actively managed equity Funds against their benchmarks was very strong. At least 57% and as many as 73% posted net returns exceeding their benchmarks over the 1-, 3-, and 5-year periods. In contrast, gross and net returns of fixed-income Funds typically fell short of their benchmarks.
6. Atlantic equity Funds' overall performance adjusted for risk also was strong. Based upon 3-year returns, nearly 80% of the equity Funds had a combination of risk-adjusted and unadjusted returns that placed them in the top half of their performance universes. Only about one-fifth of the fixed income Funds posted high returns and low risk relative to comparable funds. About two-thirds of the fixed-income Funds took on more risk than the typical fund in their performance universes.
7. The industry-standard procedure used by Lipper that includes all share classes in the performance universe tends to bias a Fund's ranking upward within that universe. The bias occurs because either no-12b-1 fee or low-12b-1 fee share classes of the Atlantic Funds are compared with funds in performance universes that include all share classes of multi-class funds with 12b-1 fees of up to 100 basis points. Correcting this bias by limiting the performance universe to classes of comparable funds with low or no 12b-1 fees (a "filtered universe") lowers the relative performance for the Funds, but their performance, on the whole, remains strong. The filtering process, however, did identify two Funds for further review that had not been designated review funds using unfiltered universes.
118
8. A small number of Funds have consistently underperformed over the past four years. The exact number depends on the criteria used to evaluate longer-term performance. For example, the one-year returns of one Fund have been in the fourth or fifth performance quintiles in each of the past four years; there are six Funds whose three-year returns have been in the fourth or fifth quintile over the past four years.
9. The services performed by CMG professionals beyond portfolio management, such as compliance, legal, information technology, risk management, finance and fund administration, are critical to the success of the Funds and appear to be of high quality.
C. Management Fees Charged by Other Mutual Fund Companies
10. The Funds' management fees and total expenses are generally low relative to those of their peers. Only 21% of the Funds ranked in the two most expensive quintiles for actual management fees, and only 23% in those quintiles for total expenses.
11. The highest concentration of low-expense Funds is found among the equity and tax-exempt fixed income Funds. The 12 former Excelsior Funds have relatively high fees and expenses, with half of those Funds ranking in either the fourth or fifth quintiles. The higher actual management fee rankings of certain Excelsior Funds are due in part to fee schedules that are higher than standard Columbia Fund fee schedules at current asset levels. After discussion with the Trustees, CMA is proposing to lower the management fees on three of these Funds.
12. The distribution of expense rankings is similar in 2007 and 2008, while management fee rankings improved markedly in 2008. Part of the improvement reflects expense limitations introduced last year for the state intermediate municipal bond Funds.
13. The management fees of the Atlantic Funds are generally in line with those of Columbia Funds supervised by the Nations Board of Trustees (the "Nations Funds"). In investment categories in which the Atlantic Funds have higher average fees, the difference principally arises out of differences in asset size.
D. Trustees' Fee and Performance Evaluation Process
14. The Trustees' evaluation process identified 17 Funds in 2008 for further review based upon their relative performance or expenses or both. When compared in filtered universes, two more Funds met the criteria for further review. CMG provided further information about those Funds to assist the Trustees in their evaluation.
E. Potential Economies of Scale
15. CMG presented to the Trustees its analysis of the sources and sharing of potential economies of scale. CMG views economies of scale as arising at the complex level and would regard estimates of scale economies for individual funds as unreliable. In its analysis, CMG did not identify specific sources of economies of scale or provide any estimates of any economies of scale that might arise from future asset growth. CMG's analysis included measures taken by the Trustees and CMG that seek to share any potential economies of scale through breakpoints in management fee schedules, expense reimbursements, fee waivers, enhanced shareholder services, fund mergers, and operational consolidation.
16. An examination of the contractual fee schedules for five Atlantic Funds shows that they are generally in line with those of their competitors, in terms of number and extent of fee breakpoints. A similar examination last year of five different Funds led to the same conclusion.
F. Management Fees Charged to Institutional Clients
17. CMG has provided Trustees with comparisons of mutual fund management fees and institutional fees based upon standardized fee schedules and upon actual fees. The results show that, consistent with industry practice, institutional fees are generally lower than the Funds' management fees. However, because the services provided and risks borne by the manager are more extensive for mutual funds compared to institutional accounts, the differences are of limited value in assisting the Trustees in their review of the reasonableness of the Funds' management fees.
119
G. Revenues, Expenses, and Profits
18. The activity-based cost allocation methodology ("ABC") employed by CMG to allocate costs, both direct and indirect, for purposes of calculating Fund profitability is thoughtful and detailed. This year, CMG proposed a change to the method by which indirect expenses are allocated. Under this "hybrid" method, indirect costs relating to fund management are allocated among the Funds 50% by assets and 50% per Fund. Allocating indirect expenses equally to each Fund has an intuitive logic, as each Fund regardless of size has certain expenses, such as preparing and printing prospectuses and financial statements.
19. The materials provided on CMG's revenues and expenses with respect to the Funds and the methodology underlying their construction form a sufficient basis for Trustees to evaluate the expenses and profitability of the Funds.
20. In 2007, CMG's complex-wide pre-tax margins on the Atlantic Funds were slightly below industry medians, based on limited data available for publicly held mutual fund managers. However, as is to be expected in a complex now comprising 75 Funds (including former Excelsior Funds), some Atlantic Funds have relatively high pre-tax profit margins, when calculated solely with respect to management revenues and expenses, while other Atlantic Funds operate at a loss. There is a positive relationship between fund size and profitability, with smaller funds generally operating at a loss.
21. CMG pays a fixed percentage of its management fee revenues to an affiliate, U.S. Trust, Bank of America Private Wealth Management, to compensate it for services it performs with respect to Atlantic Fund assets held for the benefit of its customers. Based on our analysis of the services provided by this affiliate, we have concluded that all payments other than those for sub-transfer agent or sub-accounting services should be treated as a distribution expense.
III. Recommendations
1) Criteria for review. The Trustees may wish to consider modifying the criteria for classifying a fund as a "Review Fund" to include criteria that focus exclusively on performance without regard to expense or fee levels. For example, a fund whose one-year or three-year performance was median or below for four consecutive years could be treated as a Review Fund. When we applied such criteria to the Funds, several additional Funds would have been added to the list of Review Funds.
2) Profitability data. CMG should present to the Trustees each year the profitability of each Fund, each investment style and each complex (of which Atlantic is one) calculated as follows:
a. Management-only profitability should be calculated without reference to any Private Bank expense.
b. Profitability excluding distribution (which essentially covers the management and transfer agency functions) should be adjusted by removing from the expense calculation any portion of the Private Bank payment not attributable to the performance by the Private Bank of sub-transfer agency or sub-accounting functions.
c. Total profitability, including distribution: No adjustment for Private Bank expenses should be made, because all such expenses represent legitimate fund expenses to be taken into account in calculating CMG's profit margin including distribution.
d. Distribution only: This should include all Private Bank expenses other than those attributable to sub-transfer agency services.
Therefore, the following data need not be provided:
1. Adjusting total profitability data for Private Bank expenses
2. Adjusting profitability excluding distribution by backing out all Private Bank expenses.
3) Potential economies of scale. CMG and the IFC should continue to work on methods for more precisely quantifying to the extent possible the sources and magnitude of any economies of scale as CMG's mutual fund assets under management increase, to the extent that the data allows for meaningful year-over-year comparisons. The framework suggested in Section IV.D.4 may prove to be a useful model for such an analysis.
120
4) Competitive breakpoint analysis. As part of the annual fee evaluation process, the breakpoints of a select group of Atlantic Funds (which would differ each year) should continue to be compared to those of industry rivals to ensure that the Funds' breakpoint schedules remain within industry norms. As breakpoint schedules change relatively little each year, performing such a comparison for each Atlantic Fund each year would not be an efficient use of Trustee and CMG resources.
5) Cost allocation methodology. CMG's point that the current ABC system of allocating indirect expenses creates anomalous results in several cases, including sub-advised Funds, is well-taken. We would like to work with CMG over the forthcoming year on alternatives to the current system of allocating indirect expenses that (1) resolve the anomalies, (2) limit the amount of incremental effort on CMG's part and (3) remain faithful to the general principle that expenses should be allocated by time and effort to the extent reasonably possible.
6) Management fee disparities. CMG and the Atlantic Trustees, as part of any future study of management fees, should analyze the differences in management fee schedules, principally arising out of the reorganization of the former Excelsior Funds as Atlantic Funds. As part of that analysis, CMG should provide an explanation for any significant fee differences among comparable funds across fund families managed by CMA, such as differences in the management styles of different Funds included the same Lipper category. Finally, whenever CMG proposes a management fee change or an expense cap for any mutual fund managed by CMA that is comparable to any Atlantic Fund, CMG should provide the Trustees with sufficient information about the proposal to allow the Trustees to assess the applicability of the proposed change to the relevant Atlantic Fund or Funds.
7) Tax-exempt Fund expense data. The expense rankings of certain tax-exempt Funds were adversely affected by including certain investment-related interest expenses that Lipper excluded in calculating the expense ratios of competitors. We recommend that CMG follow the Lipper practice and exclude such interest expenses from data submitted to Lipper to avoid unfairly disadvantaging the tax-exempt Funds.
8) Reduction of volume of paper documents submitted. The effort to rationalize and simplify the data presented to the Trustees and the process by which that data was prepared and organized was regarded as a success by all parties. We should continue to look for opportunities to reduce and simplify the presentation of 15(c) data, especially in the area of Fund profitability. The Fund "Dashboard" volume presents a large volume of Fund data on a single page. If it is continued, the Trustees may wish to consider receiving the underlying Lipper data on CD, rather than the current paper volumes.
* * *
Respectfully submitted,
Steven E. Asher
121
COLUMBIA FUNDS INSTITUTIONAL TRUST
ONE FINANCIAL CENTER BOSTON, MA 02111-2621
- INVESTMENT ADVISOR -
COLUMBIA MANAGEMENT ADVISORS, LLC
100 FEDERAL STREET
BOSTON, MASSACHUSETTS 02110-2624
- LEGAL COUNSEL -
ROPES & GRAY LLP
ONE INTERNATIONAL PLACE
BOSTON, MA 02110-2624
- TRANSFER AGENT -
COLUMBIA MANAGEMENT SERVICES, INC.
P.O. BOX 8081
BOSTON, MASSACHUSETTS 02266-8081
SHC-44/5677-0109 (03/09) 09-73943
A description of the policies and procedures that each fund uses to determine how to vote proxies and a copy of each fund's voting records are available (i) at www.columbiamanagement.com; (ii) on the Securities and Exchange Commission's website at www.sec.gov, and (iii) without charge, upon request, by calling 1-800-368-0346. Information regarding how the funds voted proxies relating to portfolio securities during the 12-month period ended June 30 is available from the SEC's website. Information regarding how the funds voted proxies relating to portfolio securities is also available from the website, www.columbiamanagement.com.
Each fund files a complete schedule of portfolio holdings with the SEC for the first and third quarters of each fiscal year on Form N-Q. Each fund's Form N-Q is available on the SEC's website at www.sec.gov and may be reviewed and copied at the SEC's Public Reference Room in Washington, DC. Information on the operation of the Public Reference Room may be obtained by calling 1-800-SEC-0330.
Please read and consider the investment objectives, risks, charges and expenses for any fund carefully before investing. For a prospectus which contains this and other important information about a fund, contact your Columbia Management representative or financial advisor or go to www.columbiamanagement.com.
©2009 Columbia Management Distributors, Inc.
One Financial Center, Boston, MA 02111-2621
![]()
CMG STRATEGIC EQUITY FUND
A PORTFOLIO OF COLUMBIA FUNDS INSTITUTIONAL TRUST
Semiannual Report
January 31, 2009
NOT FDIC INSURED
May Lose Value
No Bank Guarantee
NOT BANK ISSUED
Columbia Management Group, LLC ("Columbia Management") is the investment management division of Bank of America Corporation. Columbia Management entities furnish investment management services and products for institutional and individual investors. The fund is distributed by Columbia Management Distributors, Inc., member of FINRA, SIPC, part of Columbia Management and an affiliate of Bank of America Corporation.
Columbia Management Advisors, LLC ("CMA") is an SEC-registered investment advisor and an indirect, wholly owned subsidiary of Bank of America Corporation and is part of Columbia Management.
The views expressed in this report reflect the current views of the respective parties. These views are not guarantees of future performance and involve certain risks, uncertainties and assumptions that are difficult to predict so actual outcomes and results may differ significantly from the views expressed. These views are subject to change at any time based upon economic, market or other conditions and the respective parties disclaim any responsibility to update such views. These views may not be relied on as investment advice and, because investment decisions for the Fund are based on numerous factors, may not be relied on as an indication of trading intent on behalf of the Fund. References to specific securities should not be construed as a recommendation or investment advice.
Performance data quoted represents past performance and current performance may be lower or higher. Past performance is no guarantee of future results. The investment return and principal value will fluctuate so that shares, when redeemed, may be worth more or less than the original cost. Please visit www.columbiamanagement.com for daily and most recent month-end performance updates.
CMG STRATEGIC EQUITY FUND
A Portfolio of Columbia Funds Institutional Trust
FUND PROFILE
Summary
• For the six-month period that ended January 31, 2009, CMG Strategic Equity Fund returned negative 37.09%. The fund's benchmark, the Russell 1000 Index, returned negative 34.71%.1 The average return of its peer group, the Lipper Multi-Cap Core Funds Classification, was negative 35.28%.2 In a period that was challenging for stocks, in general, both stock selection and, to a lesser extent, sector weights were a factor in the fund's underperformance relative to the benchmark. Stock selection in the energy, materials, industrials, consumer discretionary and health care sectors accounted for much of the fund's underperformance relative to the benchmark. The fall-off in commodity prices that resulted from the weak global economy weighed on the energy and materials sectors. While investments in the financials and information technology sectors declined, they went down less than the benchmark.
• Although the stock market struggled during the six-month period, the fund held several strong performers. Among energy sector investments, Denbury Resources (0.5% of net assets), an independent oil and gas company, was a strong performer. The portfolio's position in consumer staples stocks was aided by Hansen Natural (0.6% of net assets), a developer and marketer of soft drinks, and by Longs Drug Stores, which was acquired by a competitor during the period. In information technology, Affiliated Computer Services and Brocade Communications Systems (0.6% and 0.3% of net assets, respectively) registered positive returns.
• We believe that problems within the credit markets, coupled with a stressed housing market, will continue to pressure the U.S and global economy. However, we believe recent interest rate cuts and other government action, both at home and abroad, should aid its recovery and eventually enable the economy to stabilize. In this environment, valuations have become attractive across many sectors and we are finding opportunities to own companies that we believe have the potential to benefit as the economy recovers. We continue to believe in the long-term growth potential for emerging markets. However, in the near term, we are finding many compelling investments in the United States.
1 The Russell 1000 Index measures the performance of 1,000 of the largest US companies, based on market capitalization. Indices are not investments, do not incur fees or expenses and are not professionally managed. It is not possible to invest directly in an index. Securities in the fund may not match those in an index.
2 Lipper Inc., a widely respected data provider in the industry, calculates an average total return (assuming reinvestment of distributions) for mutual funds with similar investment objectives as those of the fund. Lipper makes no adjustments for the effect of sales loads.
1
Portfolio Management
Emil A. Gjester has managed or co-managed the fund since January 2004 and has been associated with the advisor or its predecessors or affiliate organizations since 1996.
Jonas Patrikson has co-managed the fund since February 2006 and has been associated with the advisor or its predecessors or affiliate organizations since 2004.
Michael T. Welter has co-managed the fund since July 2006 and has been associated with the advisor or its predecessors or affiliate organizations since 2006.
Mary-Ann Ward has co-managed the fund since April 2008 and has been associated with the advisor or its predecessors or affiliate organizations since 1997.
The fund's top ten holdings (as a percentage of net assets) as of January 31, 2009 were:
| (%) | |||||||
| Exxon Mobil | 2.9 | ||||||
| JPMorgan Chase | 2.0 | ||||||
| International Business Machines | 1.8 | ||||||
| Hewlett-Packard | 1.7 | ||||||
| AT&T | 1.6 | ||||||
| Microsoft | 1.5 | ||||||
| Apple | 1.5 | ||||||
| Abbott Laboratories | 1.4 | ||||||
| Wells Fargo | 1.3 | ||||||
| PepsiCo | 1.3 | ||||||
Holdings are calculated as a percentage of net assets and are subject to change. Because the fund is actively managed, there is no guarantee the fund will continue to maintain the holdings breakdown listed. The fund's holdings and their weights within the portfolio may change as market conditions change.
Equity investments are affected by stock market fluctuations that occur in response to economic and business developments.
International investing may involve certain risks, including foreign taxation, currency fluctuations, risks associated with possible differences in financial standards and other monetary and political risks.
2
Performance data quoted represents past performance and current performance may be lower or higher. Past performance is no guarantee of future results. The investment return and principal value will fluctuate so that shares, when redeemed, may be worth more or less than the original cost. Please visit www.columbiamanagement.com for daily and most recent month-end performance updates.
Average annual total return as of January 31, 2009 (%)
| Inception | 6-month (cumulative) | 1-year | 5-year | Life | |||||||||||||||||||
| CMG Strategic Equity Fund | 10/09/01 | -37.09 | -39.58 | -2.47 | 3.19 | ||||||||||||||||||
| Russell 1000 Index | -34.71 | -39.04 | -4.05 | -1.10 | |||||||||||||||||||
Average annual total return as of December 31, 2008 (%)
| Inception | 6-month (cumulative) | 1-year | 5-year | Life | |||||||||||||||||||
| CMG Strategic Equity Fund | 10/09/01 | -34.58 | -41.09 | -0.86 | 4.15 | ||||||||||||||||||
| Russell 1000 Index | -29.73 | -37.60 | -2.04 | 0.06 | |||||||||||||||||||
Index performance is from October 9, 2001.
Performance results reflect any fee waivers or reimbursements of fund expenses by the investment advisor and/or any of its affiliates. Absent these fee waivers or expense reimbursement arrangements, performance results would have been lower. All results shown assume reinvestment of distributions and do not reflect the deduction of taxes that a shareholder may pay on fund distributions or on the redemption of fund shares.
The fund's annual operating expense ratios, with and without contractual waivers, as stated in the fund's prospectus that is current as of the date of this report, are 0.40% and 0.73%, respectively, of average annual net assets. Differences in expense ratios disclosed elsewhere in this report may result from including fee waivers and expense reimbursements as well as different time periods used in calculating the ratios. The contractual waiver expires 11/30/09.
Performance of a $5,000,000 investment, October 9, 2001 to January 31, 2009
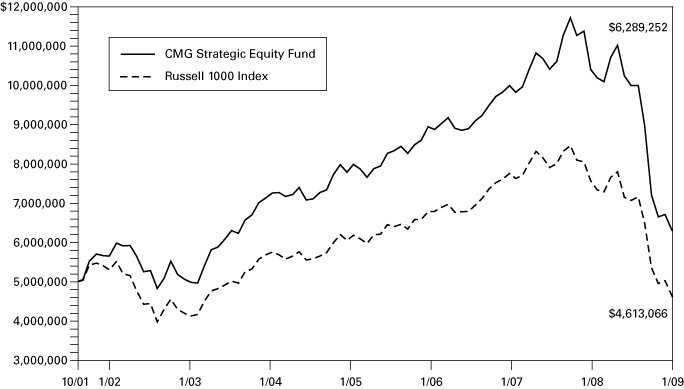
The chart above compares the results of a hypothetical minimum initial $5,000,000 investment in the fund to the index during the stated time period and does not reflect the deduction of taxes that a shareholder may pay on fund distributions or on the redemption of fund shares.
The Russell 1000 Index measures the performance of 1,000 of the largest US companies, based on market capitalization. Indices are not investments, do not incur fees or expenses and are not professionally managed. It is not possible to invest directly in an index. Securities in the fund may not match those in an index.
3
UNDERSTANDING YOUR EXPENSES – CMG Strategic Equity Fund
As a fund shareholder, you incur ongoing costs, which generally include investment advisory fees and other fund expenses. The information on this page is intended to help you understand the ongoing costs of investing in the fund and to compare these costs with the ongoing costs of investing in other mutual funds.
Analyzing your fund's expenses
To illustrate these ongoing costs, we have provided an example and calculated the expenses paid by investors during the period. The information in the following table is based on an initial investment of $1,000, which is invested at the beginning of the period and held for the entire period. Expense information is calculated two ways and each method provides you with different information. The amount listed in the "Actual" column is calculated using the fund's actual operating expenses and total return for the period. The amount listed in the "Hypothetical" column assumes that the return each year is 5% before expenses and is calculated based on the fund's actual operating expenses. You should not use the hypothetical account values and expenses to estimate either your actual account balance at the end of the period or the expenses you paid during this period.
Estimating your actual expenses
To estimate the expenses that you paid over the period, first you will need your account balance at the end of the period:
1. Divide your ending account balance by $1,000. For example, if an account balance was $8,600 at the end of the period, the result would be 8.6.
2. In the section of the table below titled "Expenses paid during the period," locate the amount in the column labeled "Actual." Multiply this number by the result from step 1. Your answer is an estimate of the expenses you paid on your account during the period.
August 1, 2008 — January 31, 2009
| Account value at the beginning of the period ($) | Account value at the end of the period ($) | Expenses paid during the period ($) | Fund's annualized expense ratio (%) | ||||||||||||||||||||||||
| Actual | Hypothetical | Actual | Hypothetical | Actual | Hypothetical | Actual | |||||||||||||||||||||
| 1,000.00 | 1,000.00 | 629.08 | 1,023.19 | 1.64 | 2.04 | 0.40 | |||||||||||||||||||||
Expenses paid during the period are equal to the annualized expense ratio of 0.40%, multiplied by the average account value over the period, then multiplied by the number of days in the fund's most recent fiscal half-year and divided by 365.
Had the investment advisor and/or any of its affiliates not waived fees or reimbursed a portion of expenses, account value at end of the period would have been reduced.
It is important to note that the expense amounts shown in the table are meant to highlight only ongoing costs of investing in the fund. Therefore, the hypothetical examples provided may not help you determine the relative total costs of owning shares of different funds.
Compare with other funds
Since all mutual funds are required to include the same hypothetical calculations about expenses in shareholder reports, you can use this information to compare the ongoing costs of investing in the fund with other funds. To do so, compare the 5% hypothetical example with the 5% hypothetical examples that appear in the shareholder reports of other funds. As you compare hypothetical examples of other funds, it is important to note that hypothetical examples are meant to highlight the ongoing costs of investing in a fund.
4
CMG STRATEGIC EQUITY FUND
A Portfolio of Columbia Funds Institutional Trust
FINANCIAL HIGHLIGHTS
(For a Share Outstanding Throughout Each Period)
| (Unaudited) Six Months Ended January 31, | Year Ended July 31, | ||||||||||||||||||||||||||
| 2009 | 2008 | 2007 | 2006 | 2005 | 2004 | ||||||||||||||||||||||
| Net asset value, beginning of period | $ | 1.94 | $ | 3.01 | $ | 3.13 | $ | 15.22 | $ | 13.80 | $ | 12.06 | |||||||||||||||
| Income from investment operations: | |||||||||||||||||||||||||||
| Net investment income (a) | 0.01 | 0.03 | 0.04 | 0.14 | 0.19 | (b) | 0.12 | ||||||||||||||||||||
| Net realized and unrealized gain (loss) on investments and foreign currency | (0.73 | ) | (0.04 | ) | 0.46 | 0.82 | 2.09 | 1.87 | |||||||||||||||||||
| Total from investment operations | (0.72 | ) | (0.01 | ) | 0.50 | 0.96 | 2.28 | 1.99 | |||||||||||||||||||
| Less distributions to shareholders: | |||||||||||||||||||||||||||
| From net investment income | (0.02 | ) | (0.05 | ) | (0.03 | ) | (0.57 | ) | (0.14 | ) | (0.09 | ) | |||||||||||||||
| From net realized gains | - | (1.01 | )(c) | (0.59 | ) | (12.48 | )(c) | (0.72 | ) | (0.16 | ) | ||||||||||||||||
| Total distributions to shareholders | (0.02 | ) | (1.06 | ) | (0.62 | ) | (13.05 | ) | (0.86 | ) | (0.25 | ) | |||||||||||||||
| Net asset value, end of period | $ | 1.20 | $ | 1.94 | $ | 3.01 | $ | 3.13 | $ | 15.22 | $ | 13.80 | |||||||||||||||
| Total return (d)(e) | (37.09 | )%(g) | (4.03 | )% | 17.08 | %(h) | 7.58 | %(f) | 16.77 | % | 16.58 | % | |||||||||||||||
| Ratios to average net assets/ Supplemental data: | |||||||||||||||||||||||||||
| Net expenses before interest expense | 0.40 | %(j) | 0.40 | %(i) | 0.40 | %(i) | 0.40 | %(i) | 0.40 | %(i) | 0.40 | %(i) | |||||||||||||||
| Interest expense | - | - | %(k) | - | %(k) | - | - | - | |||||||||||||||||||
| Net expenses | 0.40 | %(j) | 0.40 | %(i) | 0.40 | %(i) | 0.40 | %(i) | 0.40 | %(i) | 0.40 | %(i) | |||||||||||||||
| Waiver/Reimbursement | 0.41 | %(j) | 0.33 | % | 0.22 | % | 0.07 | % | 0.03 | % | 0.05 | % | |||||||||||||||
| Net investment income | 1.35 | %(j) | 1.20 | %(i) | 1.31 | %(i) | 1.09 | %(i) | 1.31 | %(i) | 0.88 | %(i) | |||||||||||||||
| Portfolio turnover rate | 77 | %(g) | 100 | % | 127 | % | 47 | % | 64 | % | 81 | % | |||||||||||||||
| Net assets, end of period (000's) | $ | 26,261 | $ | 49,466 | $ | 46,106 | $ | 120,541 | $ | 755,860 | $ | 618,714 | |||||||||||||||
(a) Per share data was calculated using the average shares outstanding during the period.
(b) Net investment income per share reflects a special dividend. The effect of this dividend amounted to $0.02 per share.
(c) Capital gain distributions were declared after significant shareholder redemptions reduced the size of the Fund.
(d) Total return at net asset value assuming all distributions reinvested.
(e) Had the investment advisor and/or any of its affiliates not waived fees or reimbursed a portion of expenses, total return would have been reduced.
(f) Includes a voluntary reimbursement by the investment advisor for a realized investment loss due to a trading error. This reimbursement increased total return and net asset value per share by less than 0.01% and less than $0.01, respectively.
(g) Not annualized.
(h) Includes a reimbursement by the investment advisor due to a compliance violation. This reimbursement increased total return and net asset value per share by less than 0.01% and $0.01, respectively.
(i) The benefits derived from custody credits had an impact of less than 0.01%.
(j) Annualized.
(k) Rounds to less than 0.01%.
See Accompanying Notes to Financial Statements.
5
CMG STRATEGIC EQUITY FUND
A Portfolio of Columbia Funds Institutional Trust
SCHEDULE OF INVESTMENTS
January 31, 2009 (Unaudited)
| Shares | Value | ||||||||||
| Common Stocks (98.7%) | |||||||||||
| Consumer Discretionary (9.5%) | |||||||||||
| Auto Components (0.2%) | |||||||||||
| Nokian Renkaat Oyj | 6,440 | $ | 62,990 | ||||||||
| Distributors (0.3%) | |||||||||||
| Genuine Parts Co. | 2,420 | 77,488 | |||||||||
| Hotels, Restaurants & Leisure (1.2%) | |||||||||||
| Burger King Holdings, Inc. | 4,700 | 104,575 | |||||||||
| Carnival Corp. | 4,510 | 82,037 | |||||||||
| WMS Industries, Inc. (a) | 4,375 | 97,212 | |||||||||
| Wynn Resorts Ltd. (a) | 1,110 | 33,389 | |||||||||
| 317,213 | |||||||||||
| Media (2.0%) | |||||||||||
| Comcast Corp., Class A | 18,800 | 275,420 | |||||||||
| DIRECTV Group, Inc. (a) | 6,720 | 147,168 | |||||||||
| News Corp., Class A | 13,830 | 88,374 | |||||||||
| 510,962 | |||||||||||
| Multiline Retail (1.3%) | |||||||||||
| Kohl's Corp. (a) | 3,170 | 116,371 | |||||||||
| Target Corp. | 6,930 | 216,216 | |||||||||
| 332,587 | |||||||||||
| Specialty Retail (2.8%) | |||||||||||
| Advance Auto Parts, Inc. | 4,580 | 149,903 | |||||||||
| Best Buy Co., Inc. | 4,740 | 132,815 | |||||||||
| Gap, Inc. | 5,720 | 64,522 | |||||||||
| Home Depot, Inc. | 7,940 | 170,948 | |||||||||
| Ross Stores, Inc. | 2,650 | 77,963 | |||||||||
| TJX Companies, Inc. | 4,640 | 90,109 | |||||||||
| Urban Outfitters, Inc. (a) | 3,460 | 53,907 | |||||||||
| 740,167 | |||||||||||
| Textiles, Apparel & Luxury Goods (1.7%) | |||||||||||
| Hanesbrands, Inc. (a) | 6,490 | 58,345 | |||||||||
| NIKE, Inc., Class B | 5,470 | 247,517 | |||||||||
| Polo Ralph Lauren Corp. | 3,590 | 147,298 | |||||||||
| 453,160 | |||||||||||
| 2,494,567 | |||||||||||
| Shares | Value | ||||||||||
| Consumer Staples (9.3%) | |||||||||||
| Beverages (3.0%) | |||||||||||
| Coca-Cola Co. | 1,860 | $ | 79,459 | ||||||||
| Fomento Economico Mexicano SAB de CV, ADR | 3,010 | 84,731 | |||||||||
| Hansen Natural Corp. (a) | 4,320 | 144,720 | |||||||||
| Molson Coors Brewing Co., Class B | 3,310 | 133,294 | |||||||||
| PepsiCo, Inc. | 6,760 | 339,555 | |||||||||
| 781,759 | |||||||||||
| Food & Staples Retailing (1.2%) | |||||||||||
| Kroger Co. | 10,460 | 235,350 | |||||||||
| United Natural Foods, Inc. (a) | 5,730 | 89,044 | |||||||||
| 324,394 | |||||||||||
| Food Products (1.5%) | |||||||||||
| Corn Products International, Inc. | 4,630 | 107,185 | |||||||||
| Kraft Foods, Inc., Class A | 6,690 | 187,654 | |||||||||
| Sanderson Farms, Inc. | 2,690 | 97,324 | |||||||||
| 392,163 | |||||||||||
| Household Products (1.1%) | |||||||||||
| Procter & Gamble Co. | 5,430 | 295,935 | |||||||||
| Personal Products (1.1%) | |||||||||||
| Avon Products, Inc. | 9,210 | 188,344 | |||||||||
| Herbalife Ltd. | 4,450 | 91,270 | |||||||||
| 279,614 | |||||||||||
| Tobacco (1.4%) | |||||||||||
| Altria Group, Inc. | 6,500 | 107,510 | |||||||||
| Philip Morris International, Inc. | 3,340 | 124,081 | |||||||||
| Universal Corp. | 4,730 | 144,644 | |||||||||
| 376,235 | |||||||||||
| 2,450,100 | |||||||||||
| Energy (14.5%) | |||||||||||
| Energy Equipment & Services (3.9%) | |||||||||||
| Cameron International Corp. (a) | 7,320 | 169,531 | |||||||||
| Core Laboratories N.V. | 2,060 | 138,411 | |||||||||
| Diamond Offshore Drilling, Inc. | 1,270 | 79,705 | |||||||||
| National-Oilwell Varco, Inc. (a) | 5,460 | 144,363 | |||||||||
| Noble Corp. | 3,810 | 103,442 | |||||||||
| Schlumberger Ltd. | 3,250 | 132,633 | |||||||||
| Transocean Ltd. (a) | 1,578 | 86,190 | |||||||||
See Accompanying Notes to Financial Statements.
6
CMG STRATEGIC EQUITY FUND
A Portfolio of Columbia Funds Institutional Trust
SCHEDULE OF INVESTMENTS
January 31, 2009 (Unaudited)
| Shares | Value | ||||||||||
| Common Stocks (continued) | |||||||||||
| Energy Equipment & Services (continued) | |||||||||||
| Weatherford International Ltd. (a) | 7,260 | $ | 80,078 | ||||||||
| Wellstream Holdings PLC | 11,550 | 79,630 | |||||||||
| 1,013,983 | |||||||||||
| Oil, Gas & Consumable Fuels (10.6%) | |||||||||||
| Apache Corp. | 2,570 | 192,750 | |||||||||
| ConocoPhillips | 5,630 | 267,594 | |||||||||
| Denbury Resources, Inc. (a) | 10,820 | 132,437 | |||||||||
| Devon Energy Corp. | 3,120 | 192,192 | |||||||||
| Exxon Mobil Corp. | 9,990 | 764,035 | |||||||||
| Hess Corp. | 3,000 | 166,830 | |||||||||
| Marathon Oil Corp. | 3,740 | 101,840 | |||||||||
| Noble Energy, Inc. | 2,410 | 117,921 | |||||||||
| Occidental Petroleum Corp. | 3,700 | 201,835 | |||||||||
| Petroleo Brasileiro SA, ADR | 5,440 | 142,528 | |||||||||
| Southwestern Energy Co. (a) | 4,650 | 147,173 | |||||||||
| StatoilHydro ASA, ADR | 8,370 | 144,215 | |||||||||
| XTO Energy, Inc. | 5,647 | 209,447 | |||||||||
| 2,780,797 | |||||||||||
| 3,794,780 | |||||||||||
| Financials (13.6%) | |||||||||||
| Capital Markets (3.9%) | |||||||||||
| Ameriprise Financial, Inc. | 7,670 | 154,551 | |||||||||
| Charles Schwab Corp. | 9,200 | 125,028 | |||||||||
| Credit Suisse Group AG, ADR | 4,190 | 106,803 | |||||||||
| Goldman Sachs Group, Inc. | 2,640 | 213,127 | |||||||||
| Greenhill & Co., Inc. | 1,410 | 91,678 | |||||||||
| Invesco Ltd. | 14,860 | 175,199 | |||||||||
| Raymond James Financial, Inc. | 4,760 | 88,108 | |||||||||
| Waddell & Reed Financial, Inc., Class A | 3,680 | 51,962 | |||||||||
| 1,006,456 | |||||||||||
| Commercial Banks (3.2%) | |||||||||||
| BB&T Corp. | 2,240 | 44,330 | |||||||||
| First Horizon National Corp. | 14,612 | 139,106 | |||||||||
| Glacier Bancorp, Inc. | 6,210 | 95,323 | |||||||||
| Prosperity Bancshares, Inc. | 2,140 | 57,887 | |||||||||
| TCF Financial Corp. | 12,440 | 154,132 | |||||||||
| Wells Fargo & Co. | 18,600 | 351,540 | |||||||||
| 842,318 | |||||||||||
| Consumer Finance (0.7%) | |||||||||||
| American Express Co. | 10,990 | 183,863 | |||||||||
| Shares | Value | ||||||||||
| Diversified Financial Services (2.2%) | |||||||||||
| JPMorgan Chase & Co. | 20,896 | $ | 533,057 | ||||||||
| Portfolio Recovery Associates, Inc. (a) | 1,700 | 40,103 | |||||||||
| 573,160 | |||||||||||
| Insurance (2.7%) | |||||||||||
| ACE Ltd. | 2,290 | 99,981 | |||||||||
| Aon Corp. | 4,220 | 156,351 | |||||||||
| Arch Capital Group Ltd. (a) | 1,960 | 117,894 | |||||||||
| Axis Capital Holdings Ltd. | 5,210 | 126,395 | |||||||||
| MetLife, Inc. | 7,340 | 210,878 | |||||||||
| 711,499 | |||||||||||
| Real Estate Investment Trusts (REITs) (0.9%) | |||||||||||
| Digital Realty Trust, Inc. | 5,010 | 159,819 | |||||||||
| Redwood Trust, Inc. | 6,524 | 82,789 | |||||||||
| 242,608 | |||||||||||
| 3,559,904 | |||||||||||
| Health Care (14.0%) | |||||||||||
| Biotechnology (3.9%) | |||||||||||
| Acorda Therapeutics, Inc. (a) | 2,179 | 53,451 | |||||||||
| Amgen, Inc. (a) | 5,090 | 279,187 | |||||||||
| Celgene Corp. (a) | 2,385 | 126,286 | |||||||||
| Cephalon, Inc. (a) | 1,030 | 79,495 | |||||||||
| Genentech, Inc. (a) | 1,790 | 145,420 | |||||||||
| Gilead Sciences, Inc. (a) | 4,030 | 204,603 | |||||||||
| Onyx Pharmaceuticals, Inc. (a) | 2,380 | 72,423 | |||||||||
| OSI Pharmaceuticals, Inc. (a) | 1,980 | 70,488 | |||||||||
| 1,031,353 | |||||||||||
| Health Care Equipment & Supplies (1.3%) | |||||||||||
| Baxter International, Inc. | 3,820 | 224,043 | |||||||||
| Mindray Medical International Ltd., ADR | 2,745 | 56,712 | |||||||||
| Smith & Nephew PLC, ADR | 1,820 | 66,175 | |||||||||
| 346,930 | |||||||||||
| Health Care Providers & Services (2.1%) | |||||||||||
| Aetna, Inc. | 3,230 | 100,130 | |||||||||
| AMERIGROUP Corp. (a) | 1,930 | 53,982 | |||||||||
| Express Scripts, Inc. (a) | 3,630 | 195,149 | |||||||||
| Medco Health Solutions, Inc. (a) | 4,350 | 195,445 | |||||||||
| 544,706 | |||||||||||
See Accompanying Notes to Financial Statements.
7
CMG STRATEGIC EQUITY FUND
A Portfolio of Columbia Funds Institutional Trust
SCHEDULE OF INVESTMENTS
January 31, 2009 (Unaudited)
| Shares | Value | ||||||||||
| Common Stocks (continued) | |||||||||||
| Life Sciences Tools & Services (0.7%) | |||||||||||
| QIAGEN N V (a) | 3,060 | $ | 52,479 | ||||||||
| Thermo Fisher Scientific, Inc. (a) | 3,350 | 120,365 | |||||||||
| 172,844 | |||||||||||
| Pharmaceuticals (6.0%) | |||||||||||
| Abbott Laboratories | 6,450 | 357,588 | |||||||||
| Allergan, Inc. | 3,770 | 143,712 | |||||||||
| AstraZeneca PLC, ADR | 3,160 | 121,755 | |||||||||
| Bristol-Myers Squibb Co. | 12,190 | 260,988 | |||||||||
| Endo Pharmaceuticals Holdings, Inc. (a) | 3,830 | 86,060 | |||||||||
| Johnson & Johnson | 3,780 | 218,068 | |||||||||
| Perrigo Co. | 3,220 | 94,507 | |||||||||
| Teva Pharmaceutical Industries Ltd., ADR | 1,920 | 79,584 | |||||||||
| Wyeth | 5,010 | 215,280 | |||||||||
| 1,577,542 | |||||||||||
| 3,673,375 | |||||||||||
| Industrials (10.7%) | |||||||||||
| Aerospace & Defense (2.0%) | |||||||||||
| Boeing Co. | 2,360 | 99,852 | |||||||||
| Honeywell International, Inc. | 3,290 | 107,945 | |||||||||
| Raytheon Co. | 2,360 | 119,463 | |||||||||
| United Technologies Corp. | 4,240 | 203,477 | |||||||||
| 530,737 | |||||||||||
| Air Freight & Logistics (0.5%) | |||||||||||
| United Parcel Service, Inc., Class B | 2,740 | 116,423 | |||||||||
| Commercial Services & Supplies (0.5%) | |||||||||||
| Republic Services, Inc. | 5,190 | 134,213 | |||||||||
| Construction & Engineering (1.4%) | |||||||||||
| Aecom Technology Corp. (a) | 2,380 | 60,238 | |||||||||
| EMCOR Group, Inc. (a) | 5,800 | 119,422 | |||||||||
| Granite Construction, Inc. | 1,230 | 43,320 | |||||||||
| Quanta Services, Inc. (a) | 6,510 | 139,184 | |||||||||
| 362,164 | |||||||||||
| Electrical Equipment (0.2%) | |||||||||||
| First Solar, Inc. (a) | 350 | 49,980 | |||||||||
| Shares | Value | ||||||||||
| Industrial Conglomerates (1.7%) | |||||||||||
| 3M Co. | 3,460 | $ | 186,114 | ||||||||
| General Electric Co. | 5,240 | 63,561 | |||||||||
| Siemens AG, ADR | 2,870 | 160,892 | |||||||||
| Textron, Inc. | 4,360 | 39,371 | |||||||||
| 449,938 | |||||||||||
| Machinery (1.2%) | |||||||||||
| Danaher Corp. | 1,870 | 104,589 | |||||||||
| Joy Global, Inc. | 4,900 | 102,067 | |||||||||
| Parker Hannifin Corp. | 2,920 | 111,573 | |||||||||
| 318,229 | |||||||||||
| Marine (0.3%) | |||||||||||
| Diana Shipping, Inc. | 5,720 | 76,019 | |||||||||
| Professional Services (0.9%) | |||||||||||
| Dun & Bradstreet Corp. | 2,500 | 190,000 | |||||||||
| FTI Consulting, Inc. (a) | 1,180 | 48,392 | |||||||||
| 238,392 | |||||||||||
| Road & Rail (1.4%) | |||||||||||
| Landstar System, Inc. | 3,410 | 122,317 | |||||||||
| Norfolk Southern Corp. | 2,590 | 99,352 | |||||||||
| Union Pacific Corp. | 3,540 | 155,017 | |||||||||
| 376,686 | |||||||||||
| Trading Companies & Distributors (0.6%) | |||||||||||
| W.W. Grainger, Inc. | 2,290 | 167,055 | |||||||||
| 2,819,836 | |||||||||||
| Information Technology (16.2%) | |||||||||||
| Communications Equipment (2.6%) | |||||||||||
| Brocade Communications Systems, Inc. (a) | 19,950 | 76,009 | |||||||||
| Cisco Systems, Inc. (a) | 21,300 | 318,861 | |||||||||
| QUALCOMM, Inc. | 8,080 | 279,164 | |||||||||
| 674,034 | |||||||||||
| Computers & Peripherals (5.0%) | |||||||||||
| Apple, Inc. (a) | 4,390 | 395,671 | |||||||||
| Hewlett-Packard Co. | 12,970 | 450,708 | |||||||||
| International Business Machines Corp. | 5,130 | 470,164 | |||||||||
| 1,316,543 | |||||||||||
See Accompanying Notes to Financial Statements.
8
CMG STRATEGIC EQUITY FUND
A Portfolio of Columbia Funds Institutional Trust
SCHEDULE OF INVESTMENTS
January 31, 2009 (Unaudited)
| Shares | Value | ||||||||||
| Common Stocks (continued) | |||||||||||
| Electronic Equipment, Instruments & Components (0.6%) | |||||||||||
| LG Display Co., Ltd., ADR (a) | 2,760 | $ | 26,275 | ||||||||
| Mettler-Toledo International, Inc. (a) | 2,130 | 141,816 | |||||||||
| 168,091 | |||||||||||
| Internet Software & Services (1.6%) | |||||||||||
| Equinix, Inc. (a) | 1,390 | 74,157 | |||||||||
| Google, Inc., Class A (a) | 1,000 | 338,530 | |||||||||
| 412,687 | |||||||||||
| IT Services (2.1%) | |||||||||||
| Affiliated Computer Services, Inc., Class A (a) | 3,310 | 151,796 | |||||||||
| Fiserv, Inc. (a) | 2,860 | 90,805 | |||||||||
| Hewitt Associates, Inc., Class A (a) | 4,060 | 115,223 | |||||||||
| MasterCard, Inc., Class A | 610 | 82,826 | |||||||||
| Redecard SA | 9,390 | 106,245 | |||||||||
| 546,895 | |||||||||||
| Semiconductors & Semiconductor Equipment (1.9%) | |||||||||||
| Analog Devices, Inc. | 3,530 | 70,529 | |||||||||
| Intel Corp. | 15,518 | 200,182 | |||||||||
| Marvell Technology Group Ltd. (a) | 14,410 | 105,049 | |||||||||
| Texas Instruments, Inc. | 4,250 | 63,538 | |||||||||
| Xilinx, Inc. | 4,190 | 70,601 | |||||||||
| 509,899 | |||||||||||
| Software (2.4%) | |||||||||||
| Microsoft Corp. | 23,250 | 397,575 | |||||||||
| Nintendo Co., Ltd. | 300 | 92,290 | |||||||||
| Oracle Corp. (a) | 7,980 | 134,303 | |||||||||
| 624,168 | |||||||||||
| 4,252,317 | |||||||||||
| Materials (5.1%) | |||||||||||
| Chemicals (1.9%) | |||||||||||
| Albemarle Corp. | 3,240 | 72,090 | |||||||||
| CF Industries Holdings, Inc. | 1,290 | 60,630 | |||||||||
| Monsanto Co. | 3,220 | 244,913 | |||||||||
| Potash Corp. of Saskatchewan | 1,470 | 110,044 | |||||||||
| 487,677 | |||||||||||
| Shares | Value | ||||||||||
| Containers & Packaging (0.2%) | |||||||||||
| Owens-Illinois, Inc. (a) | 2,620 | $ | 49,780 | ||||||||
| Metals & Mining (3.0%) | |||||||||||
| Alcoa, Inc. | 9,160 | 71,356 | |||||||||
| ArcelorMittal | 3,640 | 82,155 | |||||||||
| Cia Vale do Rio Doce, ADR | 8,770 | 123,745 | |||||||||
| Cliffs Natural Resources, Inc. | 3,050 | 70,669 | |||||||||
| Freeport-McMoRan Copper & Gold, Inc. | 6,000 | 150,840 | |||||||||
| Kaiser Aluminum Corp. | 3,320 | 82,469 | |||||||||
| Nucor Corp. | 3,860 | 157,449 | |||||||||
| Sims Metal Management Ltd., ADR | 5,500 | 58,630 | |||||||||
| 797,313 | |||||||||||
| 1,334,770 | |||||||||||
| Telecommunication Services (2.5%) | |||||||||||
| Diversified Telecommunication Services (2.1%) | |||||||||||
| AT&T, Inc. | 17,494 | 430,702 | |||||||||
| P.T. Telekomunikasi Indonesia, ADR | 5,230 | 114,589 | |||||||||
| 545,291 | |||||||||||
| Wireless Telecommunication Services (0.4%) | |||||||||||
| American Tower Corp., Class A (a) | 4,070 | 123,484 | |||||||||
| 668,775 | |||||||||||
| Utilities (3.3%) | |||||||||||
| Electric Utilities (3.3%) | |||||||||||
| Entergy Corp. | 2,990 | 228,316 | |||||||||
| Exelon Corp. | 5,510 | 298,752 | |||||||||
| FirstEnergy Corp. | 4,860 | 242,952 | |||||||||
| FPL Group, Inc. | 1,760 | 90,728 | |||||||||
| 860,748 | |||||||||||
| 860,748 | |||||||||||
| Total Common Stocks (cost of $29,457,616) | 25,909,172 | ||||||||||
See Accompanying Notes to Financial Statements.
9
CMG STRATEGIC EQUITY FUND
A Portfolio of Columbia Funds Institutional Trust
SCHEDULE OF INVESTMENTS
January 31, 2009 (Unaudited)
| Par | Value | ||||||||||
| Short-Term Obligation (2.3%) | |||||||||||
| Repurchase agreement with Fixed Income Clearing Corp., dated 01/30/09, due 02/02/09 at 0.200%, collateralized by a U.S. Treasury Obligation maturing 11/15/16, market value $619,930 (repurchase proceeds $604,010) | $ | 604,000 | $ | 604,000 | |||||||
| Total Short-Term Obligation (cost of $604,000) | 604,000 | ||||||||||
| Total Investments (101.0%) (cost of $30,061,616) (b) | 26,513,172 | ||||||||||
| Other Assets & Liabilities, Net (1.0%) | (251,864 | ) | |||||||||
| Net Assets (100.0%) | $ | 26,261,308 | |||||||||
Notes to Schedule of Investments:
(a) Non-income producing security.
(b) Cost for federal income tax purposes is $30,061,616.
At January 31, 2009, the Fund held investments in the following sectors:
| Sector | % of Net Assets | ||||||
| Information Technology | 16.2 | ||||||
| Energy | 14.5 | ||||||
| Health Care | 14.0 | ||||||
| Financials | 13.6 | ||||||
| Industrials | 10.7 | ||||||
| Consumer Discretionary | 9.5 | ||||||
| Consumer Staples | 9.3 | ||||||
| Materials | 5.1 | ||||||
| Utilities | 3.3 | ||||||
| Telecommunication Services | 2.5 | ||||||
| 98.7 | |||||||
| Short-Term Obligation | 2.3 | ||||||
| Other Assets & Liabilities, Net | (1.0 | ) | |||||
| 100.0 | |||||||
| Acronym | Name | ||||||
| ADR | American Depositary Receipt | ||||||
See Accompanying Notes to Financial Statements.
10
CMG STRATEGIC EQUITY FUND
A Portfolio of Columbia Funds Institutional Trust
STATEMENT OF ASSETS AND LIABILITIES
January 31, 2009 (Unaudited)
| ASSETS: | |||||||
| Investments, at identified cost | $ | 30,061,616 | |||||
| Investments, at value | $ | 26,513,172 | |||||
| Cash | 6,214 | ||||||
| Receivable for: | |||||||
| Investments sold | 623,283 | ||||||
| Fund shares sold | 12,000 | ||||||
| Dividends | 53,299 | ||||||
| Interest | 7 | ||||||
| Foreign tax reclaims | 1,407 | ||||||
| Expense reimbursement due from investment advisor | 15,885 | ||||||
| Trustees' deferred compensation plan | 14,978 | ||||||
| Other assets | 1,578 | ||||||
| Total Assets | 27,241,823 | ||||||
| LIABILITIES: | |||||||
| Payable for: | |||||||
| Investments purchased | 612,943 | ||||||
| Investment advisory fee | 11,734 | ||||||
| Transfer agent fee | 26 | ||||||
| Trustees' fees | 789 | ||||||
| Audit fee | 16,136 | ||||||
| Custody fee | 5,486 | ||||||
| Reports to shareholders | 16,755 | ||||||
| Chief compliance officer expenses | 128 | ||||||
| Trustees' deferred compensation plan | 14,978 | ||||||
| Other liabilities | 301,540 | ||||||
| Total Liabilities | 980,515 | ||||||
| NET ASSETS | $ | 26,261,308 | |||||
| NET ASSETS CONSIST OF: | |||||||
| Paid-in capital | $ | 41,278,869 | |||||
| Overdistributed net investment income | (71,366 | ) | |||||
| Accumulated net realized loss | (11,397,516 | ) | |||||
| Net unrealized appreciation (depreciation) on: | |||||||
| Investments | (3,548,444 | ) | |||||
| Foreign currency translations | (235 | ) | |||||
| NET ASSETS | $ | 26,261,308 | |||||
| Shares of capital stock outstanding | 21,959,189 | ||||||
| Net asset value, offering and redemption price per share | $ | 1.20 | |||||
See Accompanying Notes to Financial Statements.
11
CMG STRATEGIC EQUITY FUND
A Portfolio of Columbia Funds Institutional Trust
STATEMENT OF OPERATIONS
For the Six Months Ended January 31, 2009 (Unaudited)
| INVESTMENT INCOME: | |||||||
| Dividends | $ | 339,139 | |||||
| Interest | 2,821 | ||||||
| Foreign taxes withheld | (2,433 | ) | |||||
| Total Investment Income | 339,527 | ||||||
| Expenses: | |||||||
| Investment advisory fee | 77,814 | ||||||
| Transfer agent fee | 61 | ||||||
| Trustees' fees | 7,360 | ||||||
| Custody fee | 13,616 | ||||||
| Registration fees | 12,023 | ||||||
| Audit fee | 21,094 | ||||||
| Reports to shareholders | 15,456 | ||||||
| Chief compliance officer expenses | 368 | ||||||
| Other expenses | 9,102 | ||||||
| Total Expenses | 156,894 | ||||||
| Fees waived or expenses reimbursed by investment advisor | (79,079 | ) | |||||
| Net Expenses | 77,815 | ||||||
| Net Investment Income | 261,712 | ||||||
| NET REALIZED AND UNREALIZED GAIN (LOSS) ON INVESTMENTS AND FOREIGN CURRENCY: | |||||||
| Net realized loss on: | |||||||
| Investments | (8,639,715 | ) | |||||
| Foreign currency transactions | (2,076 | ) | |||||
| Net realized loss | (8,641,791 | ) | |||||
| Net change in unrealized appreciation (depreciation) on: | |||||||
| Investments | (10,209,848 | ) | |||||
| Foreign currency translations | (382 | ) | |||||
| Net change in unrealized appreciation (depreciation) | (10,210,230 | ) | |||||
| Net Loss | (18,852,021 | ) | |||||
| NET DECREASE RESULTING FROM OPERATIONS | $ | (18,590,309 | ) | ||||
See Accompanying Notes to Financial Statements.
12
CMG STRATEGIC EQUITY FUND
A Portfolio of Columbia Funds Institutional Trust
STATEMENT OF CHANGES IN NET ASSETS
| Increase (Decrease) in Net Assets | (Unaudited) Six Months Ended January 31, 2009 | Year Ended July 31, 2008 | |||||||||
| Operations: | |||||||||||
| Net investment income | $ | 261,712 | $ | 576,183 | |||||||
| Net realized loss on investments and foreign currency transactions | (8,641,791 | ) | (1,677,819 | ) | |||||||
| Net change in unrealized appreciation (depreciation) on investments and foreign currency translations | (10,210,230 | ) | (1,114,348 | ) | |||||||
| Net decrease resulting from operations | (18,590,309 | ) | (2,215,984 | ) | |||||||
| Distributions to shareholders: | |||||||||||
| From net investment income | (573,955 | ) | (680,722 | ) | |||||||
| From realized gain | - | (14,916,823 | ) | ||||||||
| Total distributions to shareholders | (573,955 | ) | (15,597,545 | ) | |||||||
| Net Capital Stock Transactions | (4,040,606 | ) | 21,173,915 | ||||||||
| Total increase (decrease) in net assets | (23,204,870 | ) | 3,360,386 | ||||||||
| NET ASSETS: | |||||||||||
| Beginning of period | 49,466,178 | 46,105,792 | |||||||||
| End of period | $ | 26,261,308 | $ | 49,466,178 | |||||||
| Undistributed (overdistributed) net investment income at end of period | $ | (71,366 | ) | $ | 240,877 | ||||||
Capital Stock Activity
| (Unaudited) Six Months Ended January 31, 2009 | Year Ended July 31, 2008 | ||||||||||||||||||
| Shares | Dollars ($) | Shares | Dollars ($) | ||||||||||||||||
| Subscriptions | 1,428,534 | 2,097,000 | 4,862,073 | 10,415,789 | |||||||||||||||
| Distributions reinvested | 425,953 | 545,220 | 6,894,326 | 14,891,743 | |||||||||||||||
| Redemptions | (5,435,474 | ) | (6,682,826 | ) | (1,511,583 | ) | (4,133,617 | ) | |||||||||||
| Net increase (decrease) | (3,580,987 | ) | (4,040,606 | ) | 10,244,816 | 21,173,915 | |||||||||||||
See Accompanying Notes to Financial Statements.
13
CMG STRATEGIC EQUITY FUND
A Portfolio of Columbia Funds Institutional Trust
NOTES TO FINANCIAL STATEMENTS
January 31, 2009 (Unaudited)
Note 1. Organization
CMG Strategic Equity Fund (the "Fund"), a series of Columbia Funds Institutional Trust (the "Trust"), is a diversified portfolio. The Trust is a Massachusetts business trust registered under the Investment Company Act of 1940, as amended, as an open-end management investment company.
Shares of the Fund are available for purchase by institutional investors investing directly in the Fund, by institutional investors investing in the Fund as an advisory client of Columbia Management Advisors, LLC ("Columbia"), the Fund's investment advisor, and by institutional investors investing in the Fund as an advisory client of Bank of America, N.A. Please see the Fund's prospectus for further details, including applicable investment minimums.
Investment objective. The Fund seeks to provide investors with long-term growth of capital and total returns greater than those of the market over time.
Fund shares. The Fund may issue an unlimited number of shares of beneficial interest which are offered continuously at net asset value.
Note 2. Significant accounting policies
The preparation of financial statements in accordance with accounting principles generally accepted in the United States of America ("GAAP") requires management to make certain estimates and assumptions that affect the reported amounts of assets and liabilities, the disclosure of contingent assets and liabilities at the date of the financial statements and the reported amounts of revenue and expenses during the reporting period. Actual results could differ from those estimates. The following is a summary of significant accounting policies consistently followed by the Fund in the preparation of its financial statements.
Security valuation. Equity securities are valued at the last sale price on the principal exchange on which they trade, except for securities traded on the NASDAQ, which are valued at the NASDAQ official close price. Unlisted securities or listed securities for which there were no sales during the day are valued at the closing bid price on such exchanges or over-the-counter markets.
Short-term investments maturing in 60 days or less are valued at amortized cost, which approximates market value.
Foreign securities are generally valued at the last sale price on the foreign exchange or market on which they trade. If any foreign share prices are not readily available as a result of limited share activity, the securities are valued at the last sale price of the local shares in the principal market in which such securities are normally traded.
Generally, trading in foreign securities is substantially completed each day at various times prior to the close of the New York Stock Exchange ("NYSE"). The values of such securities used in computing the net asset value of the Fund's shares are determined as of such times. Foreign currency exchange rates are generally determined at 4:00 p.m. Eastern (U.S.) time. Occasionally, events affecting the values of such foreign securities and such exchange rates may occur between the times at which they are determined and the close of the customary trading session of the NYSE, which would not be reflected in the computation of the Fund's net asset value. If events materially affecting the values of such foreign securities occur and it is determined that market quotations are not reliable, then these foreign securities will be valued at their fair value using procedures approved by the Board of Trustees.
14
CMG STRATEGIC EQUITY FUND
A Portfolio of Columbia Funds Institutional Trust
NOTES TO FINANCIAL STATEMENTS
January 31, 2009 (Unaudited)
Investments for which market quotations are not readily available, or that have quotations which management believes are not reliable, are valued at fair value as determined in good faith under consistently applied procedures established by and under the general supervision of the Board of Trustees. If a security is valued at fair value, such value is likely to be different from the last quoted market price for the security.
On August 1, 2008, the Fund adopted Statement of Financial Accounting Standards No. 157, Fair Value Measurements ("SFAS 157"). SFAS 157 establishes a hierarchy that prioritizes the inputs to valuation techniques used to measure fair value giving the highest priority to unadjusted quoted prices in active markets for identical securities (level 1 measurements) and the lowest priority to unobservable inputs (level 3 measurements) when market prices are not readily available or reliable. The three levels of the fair value hierarchy under SFAS 157 are described below:
• Level 1—quoted prices in active markets for identical securities
• Level 2—prices determined using other significant observable inputs (including quoted prices for similar securities, interest rates, prepayment speeds, credit risk and others)
• Level 3—prices determined using significant unobservable inputs. In situations where quoted prices or observable inputs are unavailable or less reliable, unobservable inputs may be used. Unobservable inputs may include management's own assumptions about the factors market participants would use in pricing an investment.
The inputs or methodology used for valuing securities are not necessarily an indication of the risk associated with investing in those securities.
| The following table summarizes the inputs used, as of January 31, 2009, in valuing the Fund's assets: | |||||||||||
| Valuation Inputs | Investments in Securities | Other Financial Instruments | |||||||||
| Level 1—Quoted Prices | $ | 25,674,262 | $ | - | |||||||
| Level 2—Other Significant Observable Inputs | 838,910 | - | |||||||||
| Level 3—Significant Unobservable Inputs | - | - | |||||||||
| Total | $ | 26,513,172 | $ | - | |||||||
The Fund's assets assigned to the Level 2 input category include certain foreign securities for which a third party statistical pricing service may be employed for purposes of fair market valuation.
Security transactions. Security transactions are accounted for on the trade date. Cost is determined and gains (losses) are based upon the specific identification method for both financial statement and federal income tax purposes.
In March 2008, Statement of Financial Accounting Standards No. 161, Disclosures about Derivative Instruments and Hedging Activities-an amendment of FASB Statement No. 133 ("SFAS 161"), was issued. SFAS 161 is effective for fiscal years and interim periods beginning after November 15, 2008. SFAS 161 requires additional discussion about the reporting entity's derivative instruments and hedging activities, by providing for qualitative disclosures about the objectives and strategies for using derivatives, quantitative data about the fair value of and gains and losses on derivative contracts, and details of credit-risk-related contingent features in their derivative contracts. Management is evaluating the impact the application of SFAS 161 will have on the Fund's financial statement di sclosures.
15
CMG STRATEGIC EQUITY FUND
A Portfolio of Columbia Funds Institutional Trust
NOTES TO FINANCIAL STATEMENTS
January 31, 2009 (Unaudited)
Repurchase agreements. The Fund may engage in repurchase agreement transactions with institutions that Columbia has determined are creditworthy. The Fund, through its custodian, receives delivery of the underlying securities collateralizing a repurchase agreement. Columbia is responsible for determining that the collateral is at least equal, at all times, to the value of the repurchase obligation including interest. A repurchase agreement transaction involves certain risks in the event of default or insolvency of the counterparty. These risks include possible delays in or restrictions on the Fund's ability to dispose of the underlying securities and a possible decline in the value of the underlying securities during the period while the Fund seeks to assert its rights.
Foreign currency transactions. The values of all assets and liabilities quoted in foreign currencies are translated into U.S. dollars at that day's exchange rates. Net realized and unrealized gains (losses) on foreign currency transactions include gains (losses) arising from the fluctuation in exchange rates between trade and settlement dates on securities transactions, gains (losses) arising from the disposition of foreign currency and currency gains (losses) between the accrual and payment dates on dividends, interest income and foreign withholding taxes.
For financial statement purposes, the Fund does not distinguish that portion of gains (losses) on investments which is due to changes in foreign exchange rates from that which is due to changes in market prices of the investments. Such fluctuations are included with the net realized and unrealized gains (losses) on investments on the Statement of Operations.
Income recognition. Interest income is recorded on the accrual basis. Corporate actions and dividend income are recorded on the ex-date except for certain foreign securities which are recorded as soon after the ex-date as the Fund becomes aware of such, net of any non-reclaimable tax withholdings. Distributions received from real estate investment trusts (REITs) in excess of their income are recorded as a reduction of the cost of the related investments. If the Fund no longer owns the applicable securities, any distributions received in excess of income are recorded as realized gains.
Expenses. General expenses of the Trust are allocated to the Fund and the other series of the Trust based upon relative net assets or other expense allocation methodologies determined by the nature of the expense. Expenses directly attributable to the Fund are charged to the Fund.
Federal income tax status. The Fund intends to qualify each year as a "regulated investment company" under Subchapter M of the Internal Revenue Code, as amended, and will distribute substantially all of its taxable income, if any, for its tax year, and as such will not be subject to federal income taxes. In addition, the Fund intends to distribute in each calendar year substantially all of its net investment income, capital gains and certain other amounts, if any, such that the Fund should not be subject to federal excise tax. Therefore, no provision is made for federal income or excise taxes.
Distributions to shareholders. Distributions from net investment income, if any, are declared and distributed annually. Net realized capital gains, if any, are distributed at least annually. Income distributions and capital gain distributions are determined in accordance with federal income tax regulations which may differ from GAAP.
Indemnification. In the normal course of business, the Fund enters into contracts that contain a variety of representations and warranties and which provide general indemnities. The Fund's maximum exposure under these arrangements is unknown because this would involve future claims against the Fund. Also, under the Trust's organizational documents and by contract, the Trustees and officers of the Trust are indemnified against certain liabilities that may arise out of actions relating to their duties to the Trust. However, based on experience, the Fund expects the risk of loss due to these representations, warranties and indemnities to be minimal.
16
CMG STRATEGIC EQUITY FUND
A Portfolio of Columbia Funds Institutional Trust
NOTES TO FINANCIAL STATEMENTS
January 31, 2009 (Unaudited)
Note 3. Federal tax information
The tax character of distributions paid during the year ended July 31, 2008 was as follows:
| Distributions paid from: | |||||||
| Ordinary Income* | $ | 3,560,000 | |||||
| Long-Term Capital Gains | 12,037,545 | ||||||
*For tax purposes short-term capital gain distributions, if any, are considered ordinary income distributions.
Unrealized appreciation and depreciation at January 31, 2009, based on cost of investments for federal income tax purposes were:
| Unrealized appreciation | $ | 2,138,556 | |||||
| Unrealized depreciation | (5,687,000 | ) | |||||
| Net unrealized depreciation | $ | (3,548,444 | ) | ||||
Under Financial Accounting Standards Board ("FASB") Interpretation No. 48, Accounting for Uncertainty in Income Taxes-an Interpretation of FASB Statement No. 109 ("FIN 48"), management determines whether a tax position of the Fund is more likely than not to be sustained upon examination by the applicable taxing authority, including resolution of any related appeals or litigation processes, based on the technical merits of the position. The tax benefit to be recognized is measured as the largest amount of benefit that is greater than fifty percent likely of being realized upon ultimate settlement. Management has evaluated the known implications of FIN 48 on its computation of net assets for the Fund. As a result of this evaluation, management has concluded that FIN 48 did not have any effect on the Fund's financial statements. However, management's conclusions regarding FIN 48 may be subject to review and adjustment at a later date based on factors including, but not limited to, further implementation guidance from the FASB, new tax laws, regulations, and administrative interpretations (including relevant court decisions). The Fund's federal tax returns for the prior three fiscal years remain subject to examination by the Internal Revenue Service. The Fund is not aware of any tax positions for which it is reasonably possible that the total amounts of unrecognized tax benefits will significantly change in the next twelve months.
Note 4. Fees and compensation paid to affiliates
Investment advisory fee. Columbia, an indirect, wholly owned subsidiary of Bank of America Corporation ("BOA"), provides investment advisory, administrative and other services to the Fund. In rendering investment advisory services to the Fund, Columbia may use the portfolio management and research resources of Columbia Management Pte. Ltd., an affiliate of Columbia. Columbia receives a monthly investment advisory fee at the annual rate of 0.40% of the Fund's average daily net assets.
In addition to the annual Fund operating expenses, each shareholder enters into a written administrative services agreement with Columbia or its affiliate. Pursuant to this Agreement, Columbia or its affiliate will provide the shareholder specialized reports regarding the Fund, performance of the shareholder's investments and market conditions and economic indicators. For such services, each shareholder (and not the Fund) will pay an annual fee calculated as a percentage of the shareholder's net assets in the Fund. The annual fee is 0.20% on the first $25 million of the shareholder's net assets in the Fund, and no fee payable on net assets in excess of $25 million.
17
CMG STRATEGIC EQUITY FUND
A Portfolio of Columbia Funds Institutional Trust
NOTES TO FINANCIAL STATEMENTS
January 31, 2009 (Unaudited)
Pricing and bookkeeping fees. The Fund has entered into a Financial Reporting Services Agreement (the "Financial Reporting Services Agreement") with State Street Bank & Trust Company ("State Street") and Columbia pursuant to which State Street provides financial reporting services to the Fund. The Fund has also entered into an Accounting Services Agreement (collectively with the Financial Reporting Services Agreement, the "State Street Agreements") with State Street and Columbia pursuant to which State Street provides accounting services to the Fund.
The Fund has entered into a Pricing and Bookkeeping Oversight and Services Agreement (the "Services Agreement") with Columbia. Under the Services Agreement, Columbia provides services related to Fund expenses and the requirements of the Sarbanes-Oxley Act of 2002, and provides oversight of the accounting and financial reporting services provided by State Street. The pricing and bookkeeping fees for the Fund are payable by Columbia.
Transfer agent fee. Columbia Management Services, Inc. (the "Transfer Agent"), an affiliate of Columbia and an indirect, wholly owned subsidiary of BOA, provides shareholder services to the Fund and has contracted with Boston Financial Data Services ("BFDS") to serve as sub-transfer agent. The Transfer Agent is entitled to receive a fee for its services, paid monthly, at the annual rate of $17.34 per open account plus reimbursement of certain sub-transfer agent fees paid by the Transfer Agent (exclusive of BFDS fees), calculated based on assets held in omnibus accounts and intended to recover the cost of payments to other parties (including affiliates of BOA) for services to those accounts. The Transfer Agent pays the fees of BFDS for services as sub-transfer agent and is not entitled to reimbursement for such fees from the Fund.
The Transfer Agent may also retain, as additional compensation for its services, fees for wire, telephone and redemption orders, Individual Retirement Account ("IRA") trustee agent fees and account transcript fees due to the Transfer Agent from shareholders of the Fund and credits (net of bank charges) earned with respect to balances in accounts the Transfer Agent maintains in connection with its services to the Fund. The Transfer Agent also receives reimbursement for certain out-of-pocket expenses.
Fee waivers and expense reimbursements. Columbia has contractually agreed to waive fees and/or reimburse the Fund through November 30, 2009, for certain expenses so that the ordinary operating expenses incurred by the Fund (exclusive of any distribution and service fees, brokerage commissions, interest, taxes and extraordinary expenses, but inclusive of custodial charges relating to overdrafts, if any), after giving effect to any balance credits from the Fund's custodian, will not exceed 0.40% of the Fund's average daily net assets. There is no guarantee that this arrangement will continue after November 30, 2009.
Fees paid to officers and trustees. All officers of the Fund are employees of Columbia or its affiliates and, with the exception of the Fund's Chief Compliance Officer, receive no compensation from the Fund. The Board of Trustees has appointed a Chief Compliance Officer to the Fund in accordance with federal securities regulations. The Fund, along with other affiliated funds, pays its pro-rata share of the expenses associated with the Chief Compliance Officer. The Fund's expenses for the Chief Compliance Officer will not exceed $15,000 per year.
The Fund's eligible Trustees may participate in a deferred compensation plan which may be terminated at any time. Obligations of the plan will be paid solely out of the Fund's assets.
Note 5. Custody credits
The Fund has an agreement with its custodian bank under which custody fees may be reduced by balance credits. These credits are recorded as part of expense reductions on the Statement of Operations. The Fund could have invested a portion of the assets utilized in connection with the expense offset arrangement in an income-producing asset if it had not entered into such an agreement. The Fund had no custody credits for the six month period ended January 31, 2009.
18
CMG STRATEGIC EQUITY FUND
A Portfolio of Columbia Funds Institutional Trust
NOTES TO FINANCIAL STATEMENTS
January 31, 2009 (Unaudited)
Note 6. Portfolio information
For the six month period ended January 31, 2009, the cost of purchases and proceeds from sales of securities, excluding short-term obligations, for the Fund were $29,897,422 and $33,967,736, respectively.
Note 7. Line of credit
The Fund and other affiliated funds participate in a $280,000,000 committed, unsecured revolving line of credit provided by State Street. The maximum amount that may be borrowed by any fund is limited to the lesser of $200,000,000 and the Fund's borrowing limit set forth in the Fund's registration statement. Borrowings are available for short-term liquidity or temporary or emergency purposes.
Interest is charged to each participating fund based on the fund's borrowings at a rate per annum equal to the greater of the Federal Funds Rate plus 0.50% or the overnight LIBOR Rate plus 0.50%. In addition, an annual operations agency fee of $20,000, an amendment fee of 0.02% and a commitment fee of 0.12% per annum are accrued and apportioned among the participating funds pro rata based on their relative net assets. Prior to October 16, 2008, the Fund and other affiliated funds participated in a $350,000,000 committed, unsecured revolving line of credit and a $150,000,000 uncommitted, unsecured line of credit, both provided by State Street. Interest on the committed line of credit was charged to each participating fund based on the fund's borrowings at a rate per annum equal to the Federal Funds Rate plus 0.50%. In addition, a commitment fee of 0.10% per annum was accrued and apportioned among the participating funds pro rata based on their relative net assets. Interest on the uncommitted line of credit was charged to each participating fund based on the fund's borrowings at a rate per annum equal to the Federal Funds Rate plus 0.375%. State Street charged an annual operations agency fee of $40,000 for the committed line of credit and was able to charge an annual administration fee of $15,000 for the uncommitted line of credit. The commitment fee, the operations agency fee and the administration fee were accrued and apportioned among the participating funds pro rata based on their relative net assets. For the six month period ended January 31, 2009, the Fund did not borrow under these arrangements.
Note 8. Shares of beneficial interest
As of January 31, 2009, 97.9% of the Fund's shares outstanding were beneficially owned by one participant account over which BOA and/or any of its affiliates had either sole or joint investment discretion. Subscription and redemption activity of this account may have a significant effect on the operations of the Fund.
Note 9. Significant risks and contingencies
Sector focus risk. The Fund may focus its investments in certain sectors, subjecting it to greater risk than a fund that is less focused.
Foreign securities risk. There are certain additional risks involved when investing in foreign securities. These risks may involve foreign currency exchange rate fluctuations, adverse political and economic developments and the possible prevention of currency exchange or other foreign governmental laws or restrictions. In addition, the liquidity of foreign securities may be more limited than that of domestic securities.
Legal proceedings. CMG Funds are not named as parties to any regulatory proceedings or litigation. Columbia Management Advisors, LLC and Columbia Management Distributors, Inc. (collectively, the "Columbia Group") are
19
CMG STRATEGIC EQUITY FUND
A Portfolio of Columbia Funds Institutional Trust
NOTES TO FINANCIAL STATEMENTS
January 31, 2009 (Unaudited)
subject to a settlement agreement with the New York Attorney General ("NYAG") (the "NYAG Settlement") and a settlement order with the SEC (the "SEC Order") on matters relating to mutual fund trading, each dated February 9, 2005. Under the terms of the SEC Order, the Columbia Group (or predecessor entities) agreed, among other things, to: pay disgorgement and civil money penalties collectively totaling $140 million; cease and desist from violations of the antifraud provisions and certain other provisions of the federal securities laws; maintain certain compliance and ethics oversight structures; and retain an independent consultant to review the Columbia Group's applicable supervisory, compliance, control and other policies and procedures. The NYAG Settlement, among other things, requires Columbia Management Advisors, LLC and its affiliates to reduce management fees for certain funds in the Columbia family of mutual funds in a pr ojected total of $160 million over five years through November 30, 2009 and to make certain disclosures to investors relating to expenses. In connection with the Columbia Group providing services to the Columbia Funds, the Columbia Funds have voluntarily undertaken to implement certain governance measures designed to maintain the independence of their boards of trustees and certain special consulting and compliance measures.
Pursuant to the SEC Order and related procedures, the $140 million in settlement amounts described above has been substantially distributed in accordance with a distribution plan that was developed by an independent distribution consultant and approved by the SEC on April 6, 2007.
In connection with the events described above, various parties have filed suit against certain funds, the Trustees of the Columbia Funds, FleetBoston Financial Corporation and its affiliated entities and/or Bank of America and its affiliated entities.
On February 20, 2004, the Judicial Panel on Multidistrict Litigation transferred these cases and cases against other mutual fund companies based on similar allegations to the United States District Court in Maryland for consolidated or coordinated pretrial proceedings (the "MDL"). Subsequently, additional related cases were transferred to the MDL. On September 29, 2004, the plaintiffs in the MDL filed amended and consolidated complaints. One of these amended complaints is a putative class action that includes claims under the federal securities laws and state common law, and that names Columbia Management Advisors, Inc. (which has since merged into Banc of America Capital Management, LLC (now named Columbia Management Advisors, LLC)) ("Columbia"), Columbia Funds Distributor, Inc. (now named Columbia Management Distributors, Inc.) (the "Distributor"), the Trustees of the Columbia Funds, Bank of America Corporation and others as d efendants. Another of the amended complaints is a derivative action purportedly on behalf of the Columbia Funds that asserts claims under federal securities laws and state common law.
On February 25, 2005, Columbia and other defendants filed motions to dismiss the claims in the pending cases. On March 1, 2006, for reasons stated in the court's memoranda dated November 3, 2005, the United States District Court for the District of Maryland granted in part and denied in part the defendants' motions to dismiss. The court dismissed all of the class action claims pending against the Columbia Funds Trusts. As to Columbia and the Distributor, the claims under the Securities Act of 1933, the claims under Sections 34(b) and 36(a) of the Investment Company Act of 1940 ("ICA") and the state law claims were dismissed. The claims under Sections 10(b) and 20(a) of the Securities Exchange Act of 1934 and claims under Section 36(b) of the ICA were not dismissed.
On March 21, 2005, a purported class action was filed in Massachusetts state court alleging that certain conduct, including market timing, entitled Class B shareholders in certain Columbia Funds to an exemption from contingent deferred sales charges upon early redemption (the "CDSC Lawsuit"). The CDSC Lawsuit was removed to federal court in Massachusetts and transferred to the MDL.
On September 14, 2007, the plaintiffs and the Columbia defendants named in the MDL, including the Columbia Funds, entered into a stipulation of settlement with respect to all Columbia-related claims in the MDL described above, including the CDSC Lawsuit. The settlement is subject to court approval.
20
BOARD CONSIDERATION AND APPROVAL OF
ADVISORY AGREEMENTS
The Advisory Fees and Expenses Committee of the Board of Trustees meets several times annually to review the advisory agreements (collectively, the "Agreements") of the funds for which the Trustees serve as trustees (each a "fund") and to determine whether to recommend that the full Board approve the continuation of the Agreements for an additional one-year period. After the Committee has made its recommendation, the full Board, including the Independent Trustees, determines whether to approve the continuation of the Agreements. In addition, the full Board, including the Independent Trustees, considers matters bearing on the Agreements at most of its other meetings throughout the year and meets regularly with senior management of the funds and Columbia, the funds' investment adviser, including the senior manager of each investment area within Columbia. Through the Board's Investment Oversight Committees, Trustees also meet with selected fund portfolio managers, research analysts and traders at various times throughout the year.
The Trustees receive and review all materials that they, their legal counsel or Columbia believe to be reasonably necessary for the Trustees to evaluate the Agreements and to determine whether to approve the continuation of the Agreements. Those materials generally include, among other items, (i) information on the investment performance of each fund relative to the performance of peer groups of mutual funds and the fund's performance benchmarks, and additional information assessing performance on a risk-adjusted basis, (ii) information on each fund's advisory fees and other expenses, including information comparing the fund's expenses to those of peer groups of mutual funds and information about any applicable expense caps and fee "breakpoints," (iii) information about the profitability of the Agreements to Columbia, including potential "fall-out" or ancillary benefits that Columbia and its affiliates may receive as a result of their relationships with the funds and (iv) information obtained through Columbia's response to a questionnaire prepared at the request of the Trustees by counsel to the funds and independent legal counsel to the Independent Trustees. The Trustees also consider other information such as (v) Columbia's financial results and financial condition, (vi) each fund's investment objective and strategies and the size, education and experience of Columbia's investment staffs and their use of technology, external research and trading cost measurement tools, (vii) the allocation of the funds' brokerage and the use of "soft" commission dollars to pay for research products and services, (viii) Columbia's resources devoted to, and its record of compliance with, the funds' investment policies and restrictions, policies on personal securities transactions and other compliance policies and legal and regulatory requirements, (ix) Columbia's response to various legal and regulatory proceedings since 2003 and to the recent peri od of volatility in the securities markets, and (x) the economic outlook generally and for the mutual fund industry in particular. In addition, the Advisory Fees and Expenses Committee confers with the funds' independent fee consultant and reviews materials relating to the funds' relationships with Columbia provided by the independent fee consultant. Throughout the process, the Trustees have the opportunity to ask questions of and to request additional materials from Columbia and to consult with the independent fee consultant and independent legal counsel to the Independent Trustees.
The Board of Trustees most recently approved the continuation of the Agreements at its October, 2008 meeting, following meetings of the Advisory Fees and Expenses Committee held in February, April, August, September and October, 2008. In considering whether to approve the continuation of the Agreements, the Trustees, including the Independent Trustees, did not identify any single factor as determinative, and each weighed various factors as he or she deemed appropriate. The Trustees considered the following matters in connection with their approval of the continuation of the Agreements:
The nature, extent and quality of the services provided to the funds under the Agreements. The Trustees considered the nature, extent and quality of the services provided by Columbia and its affiliates to the funds and the resources dedicated to the funds by Columbia and its affiliates. Among other things, the Trustees considered (i) Columbia's ability (including its personnel and other resources, compensation programs for personnel involved in fund management, reputation and other attributes) to attract, motivate and retain highly qualified research, advisory and supervisory investment professionals; (ii) the portfolio management services provided by those investment professionals; and (iii) the trade execution services provided on behalf of the funds. For each fund, the Trustees also
21
considered the benefits to shareholders of investing in a mutual fund that is part of a family of funds offering exposure to a variety of asset classes and investment disciplines and providing a variety of fund and shareholder services. After reviewing those and related factors, the Trustees concluded, within the context of their overall conclusions regarding each of the Agreements, that the nature, extent and quality of services provided supported the continuation of the Agreements.
Investment performance of the funds and Columbia. The Trustees reviewed information about the performance of each fund over various time periods, including information prepared by an independent third-party data provider that compared the performance of each fund to the performance of peer groups of mutual funds and performance benchmarks. The Trustees also reviewed a description of the third party's methodology for identifying each fund's peer group for purposes of performance and expense comparisons. The Trustees also considered additional information that the Advisory Fees and Expenses Committee requested from Columbia relating to funds that presented relatively weaker performance and/or relatively higher expenses. In the case of each fund whose performance lagged that of a relevant peer group for certain (although not necessarily all) periods, the Truste es concluded that other factors relevant to performance were sufficient, in light of other considerations, to warrant continuation of the fund's Agreements. Those factors varied from fund to fund, but included one or more of the following: (i) that the fund's performance, although lagging in certain recent periods, was stronger over the longer term; (ii) that the underperformance was attributable, to a significant extent, to investment decisions that were reasonable and consistent with the fund's investment strategy and policies and that the fund was performing within a reasonable range of expectations, given those investment decisions, market conditions and the fund's investment strategy; (iii) that the fund's performance was competitive when compared to other relevant performance benchmarks or peer groups; (iv) that Columbia had taken or was taking steps designed to help improve the fund's investment performance, including, but not limited to, replacing portfolio managers or modifying investment strategies ; and (v) that Columbia proposed to waive advisory fees or cap the expenses of the fund.
The Trustees noted that, through April 30, 2008, CMG Strategic Equity Fund's performance was in the first quintile (where the best performance would be in the first quintile) for the one-, three-, five- and ten-year periods, of the peer group selected by an independent third-party data provider for purposes of performance comparisons.
The Trustees also considered Columbia's performance and reputation generally, the funds' performance as a fund family generally, and Columbia's historical responsiveness to Trustee concerns about performance and Columbia's willingness to take steps intended to improve performance. After reviewing those and related factors, the Trustees concluded, within the context of their overall conclusions regarding each of the Agreements, that the performance of each fund and Columbia was sufficient, in light of other considerations, to warrant the continuation of the Agreement(s) pertaining to that fund.
The costs of the services provided and profits realized by Columbia and its affiliates from their relationships with the funds. The Trustees considered the fees charged to the funds for advisory services as well as the total expense levels of the funds. That information included comparisons (provided by management and by an independent third-party data provider) of each fund's advisory fees and total expense levels to those of the fund's peer groups and information about the advisory fees charged by Columbia to comparable institutional accounts. In considering the fees charged to those accounts, the Trustees took into account, among other things, management's representations about the differences between managing mutual funds as compared to other types of accounts, including differences in the services provided, differences in the risk profile of such busine ss for Columbia, and the additional resources required to manage mutual funds effectively. In evaluating each fund's advisory fees, the Trustees also took into account the demands, complexity and quality of the investment management of the fund. The Trustees considered existing advisory fee breakpoints, and Columbia's use of advisory fee waivers and expense caps, which benefited a number of the funds. The Trustees also noted management's stated justification for the fees charged to the funds, which included information about the investment performance of the funds and the services provided to the funds.
The Trustees considered that CMG Strategic Equity Fund's total expenses and actual management fees were in the first quintile (where the lowest fees and expenses would be in the first quintile) of the peer group selected by an independent third-party data provider for purposes of expense comparisons.
22
The Trustees also considered the compensation directly or indirectly received by Columbia and its affiliates from their relationships with the funds. The Trustees reviewed information provided by management as to the profitability to Columbia and its affiliates of their relationships with each fund, and information about the allocation of expenses used to calculate profitability. When reviewing profitability, the Trustees also considered court cases in which adviser profitability was an issue in whole or in part, the performance of the relevant funds, the expense level of each fund, and whether Columbia had implemented breakpoints and/or expense caps with respect to the fund.
After reviewing those and related factors, the Trustees concluded, within the context of their overall conclusions regarding each of the Agreements, that the advisory fees charged to each fund, and the related profitability to Columbia and its affiliates of their relationships with the fund, supported the continuation of the Agreement(s) pertaining to that fund.
Economies of Scale. The Trustees considered the existence of any economies of scale in the provision by Columbia of services to each fund, to groups of related funds, and to Columbia's investment advisory clients as a whole and whether those economies were shared with the funds through breakpoints in the investment advisory fees or other means, such as fee waivers/expense reductions and additional investments by Columbia in investment, trading and compliance resources. The Trustees noted that many of the funds benefited from breakpoints, fee waivers/expense caps, or both. In considering those issues, the Trustees also took note of the costs of the services provided (both on an absolute and a relative basis) and the profitability to Columbia and its affiliates of their relationships with the funds, as discussed above.
After reviewing those and related factors, the Trustees concluded, within the context of their overall conclusions regarding each of the Agreements, that the extent to which economies of scale were shared with the funds supported the continuation of the Agreements.
Other Factors. The Trustees also considered other factors, which included but were not limited to the following:
n the extent to which each fund had operated in accordance with its investment objective and investment restrictions, the nature and scope of the compliance programs of the funds and Columbia and the compliance-related resources that Columbia and its affiliates were providing to the funds;
n the nature, quality, cost and extent of administrative and shareholder services overseen and performed by Columbia and its affiliates, both under the Agreements and under separate agreements for the provision of transfer agency and administrative services;
n so-called "fall-out benefits" to Columbia and its affiliates, such as the engagement of its affiliates to provide distribution, brokerage and transfer agency services to the funds, and the benefits of research made available to Columbia by reason of brokerage commissions generated by the funds' securities transactions, as well as possible conflicts of interest associated with those fall-out and other benefits, and the reporting, disclosure and other processes in place to disclose and monitor those possible conflicts of interest; and
n the report provided by the funds' independent fee consultant, which included information about and analysis of the funds' fees, expenses and performance.
Based on their evaluation of all factors that they deemed to be material, including those factors described above, and assisted by the advice of independent counsel and the independent fee consultant, the Trustees, including the Independent Trustees, approved the continuance of each of the Agreements through October 31, 2009.
23
SUMMARY OF MANAGEMENT FEE EVALUATION BY
INDEPENDENT FEE CONSULTANT
EXCERPTS FROM REPORT OF INDEPENDENT FEE CONSULTANT TO THE FUNDS SUPERVISED BY THE COLUMBIA ATLANTIC BOARD
Prepared Pursuant to the February 9, 2005 Assurance of Discontinuance among the Office of Attorney General of New York State, Columbia Management Advisors, LLC, and Columbia Management Distributors, Inc. November 3, 2008
I. Overview
On February 9, 2005, Columbia Management Advisors, LLC ("CMA") and Columbia Management Distributors, Inc.1 ("CMD") agreed to the New York Attorney General's Assurance of Discontinuance ("AOD"). Among other things, the AOD stipulates that CMA may manage or advise a Columbia Fund ("Columbia Fund" and, together with some or all of such funds, the "Columbia Funds") only if the Independent Members of the Columbia Fund's Board of Trustees appoint a Senior Officer or retain an Independent Fee Consultant ("IFC") who is to manage the process by which proposed management fees are negotiated. The AOD further stipulates that the Senior Officer or IFC is to prepare a written annual evaluation of the fee negotiation process.
With effect from January 1, 2007, the Independent Members of the Board of Trustees for certain Columbia Funds known collectively as the "Atlantic Funds" (together with the other members of that Board, the "Trustees") retained me as IFC for the Atlantic Funds.2 In this capacity, I have prepared the fourth annual written evaluation of the fee negotiation process. As was the case with last year's report (the "2007 Report") my immediate predecessor as IFC, John Rea, provided invaluable assistance in the preparation of this year's report.
A. Role of the Independent Fee Consultant
The AOD charges the IFC with "managing the process by which proposed management fees...to be charged the Columbia Fund are negotiated so that they are negotiated in a manner which is at arms' length and reasonable and consistent with this Assurance of Discontinuance." The AOD also provides that CMA "may manage or advise a Columbia Fund only if the reasonableness of the proposed management fees is determined by the Board of Trustees...using...an annual independent written evaluation prepared by or under the direction of...the Independent Fee Consultant." Therefore, the AOD makes clear that the IFC does not supplant the Trustees in negotiating management fees with CMA, nor does the IFC substitute his or her judgment for that of the Trustees with respect to the reasonableness of proposed fees or any other matter that is committed to the business judgment of the Trustees.
B. Elements Involved in Managing the Fee Negotiation Process
In preparing the report required by the AOD, the IFC must consider at least the following six factors set forth in the AOD:
1. The nature and quality of CMA's services, including the Fund's performance;
2. Management fees (including any components thereof) charged by other mutual fund companies for like services;
3. Possible economies of scale as the Fund grows larger;
1 CMA and CMD are subsidiaries of Columbia Management Group, LLC ("CMG"), and are the successors to the entities named in the AOD.
2 I have no material relationship with Bank of America, CMG or any of its affiliates, aside from serving as IFC, and I am aware of no material relationship with any of their affiliates. I retained John Rea, an independent economic consultant, to assist me with this report.
Unless otherwise stated or required by the context, this report covers only the Atlantic Funds, which are also referred as the "Funds."
24
4. Management fees (including any components thereof) charged to institutional and other clients of CMA for like services;
5. Costs to CMA and its affiliates of supplying services pursuant to the management fee agreements, excluding any intra-corporate profit; and
6. Profit margins of CMA and its affiliates from supplying such services.
C. Organization of the Annual Evaluation
This report, like last year's, focuses on the six factors and contains a section for each factor except that CMA's costs and profits from managing the Funds have been combined into a single section. In addition to a discussion of these factors, the report offers recommendations to improve the fee review process in future years. A review of the status of recommendations made in the 2007 Report is being provided separately with the materials for the October meeting.
II. Summary of Findings
A. General
1. Based upon my examination of the information supplied by CMG in the light of the six factors set forth in the AOD, I conclude that the Trustees have the relevant information necessary to evaluate the reasonableness of the proposed management fees for each Atlantic Fund.
2. In my view, the process by which the proposed management fees of the Funds have been negotiated in 2008 thus far has been, to the extent practicable, at arms' length and reasonable and consistent with the AOD.
B. Nature and Quality of Services, Including Performance
3. The performance of the Funds has been relatively strong in recent years. Based upon 1-, 3-, 5-, and 10-year returns through April 30, 2008, at least half of all the Funds were in the first and second performance quintiles in each of the four performance periods and, at most, only 11% were in the fifth quintile in any one performance period. Both equity and fixed-income funds posted strong performance relative to comparable funds.
4. Performance rankings were similar in 2007 and 2008, although last year's were slightly stronger. Despite the stability in the distribution of rankings in the two years, at least half the Funds changed quintile rankings between the two years in at least one of the 1-, 3-, and 5-year performance periods.
5. The performance of the actively managed equity Funds against their benchmarks was very strong. At least 57% and as many as 73% posted net returns exceeding their benchmarks over the 1-, 3-, and 5-year periods. In contrast, gross and net returns of fixed-income Funds typically fell short of their benchmarks.
6. Atlantic equity Funds' overall performance adjusted for risk also was strong. Based upon 3-year returns, nearly 80% of the equity Funds had a combination of risk-adjusted and unadjusted returns that placed them in the top half of their performance universes. Only about one-fifth of the fixed income Funds posted high returns and low risk relative to comparable funds. About two-thirds of the fixed-income Funds took on more risk than the typical fund in their performance universes.
7. The industry-standard procedure used by Lipper that includes all share classes in the performance universe tends to bias a Fund's ranking upward within that universe. The bias occurs because either no-12b-1 fee or low-12b-1 fee share classes of the Atlantic Funds are compared with funds in performance universes that include all share classes of multi-class funds with 12b-1 fees of up to 100 basis points. Correcting this bias by limiting the performance universe to classes of comparable funds with low or no 12b-1 fees (a "filtered universe") lowers the relative performance for the Funds, but their performance, on the whole, remains strong. The filtering process, however, did identify two Funds for further review that had not been designated review funds using unfiltered universes.
8. A small number of Funds have consistently underperformed over the past four years. The exact number depends on the criteria used to evaluate longer-term performance. For example, the one-year returns of one Fund have
25
been in the fourth or fifth performance quintiles in each of the past four years; there are six Funds whose three-year returns have been in the fourth or fifth quintile over the past four years.
9. The services performed by CMG professionals beyond portfolio management, such as compliance, legal, information technology, risk management, finance and fund administration, are critical to the success of the Funds and appear to be of high quality.
C. Management Fees Charged by Other Mutual Fund Companies
10. The Funds' management fees and total expenses are generally low relative to those of their peers. Only 21% of the Funds ranked in the two most expensive quintiles for actual management fees, and only 23% in those quintiles for total expenses.
11. The highest concentration of low-expense Funds is found among the equity and tax-exempt fixed income Funds. The 12 former Excelsior Funds have relatively high fees and expenses, with half of those Funds ranking in either the fourth or fifth quintiles. The higher actual management fee rankings of certain Excelsior Funds are due in part to fee schedules that are higher than standard Columbia Fund fee schedules at current asset levels. After discussion with the Trustees, CMA is proposing to lower the management fees on three of these Funds.
12. The distribution of expense rankings is similar in 2007 and 2008, while management fee rankings improved markedly in 2008. Part of the improvement reflects expense limitations introduced last year for the state intermediate municipal bond Funds.
13. The management fees of the Atlantic Funds are generally in line with those of Columbia Funds supervised by the Nations Board of Trustees (the "Nations Funds"). In investment categories in which the Atlantic Funds have higher average fees, the difference principally arises out of differences in asset size.
D. Trustees' Fee and Performance Evaluation Process
14. The Trustees' evaluation process identified 17 Funds in 2008 for further review based upon their relative performance or expenses or both. When compared in filtered universes, two more Funds met the criteria for further review. CMG provided further information about those Funds to assist the Trustees in their evaluation.
E. Potential Economies of Scale
15. CMG presented to the Trustees its analysis of the sources and sharing of potential economies of scale. CMG views economies of scale as arising at the complex level and would regard estimates of scale economies for individual funds as unreliable. In its analysis, CMG did not identify specific sources of economies of scale or provide any estimates of any economies of scale that might arise from future asset growth. CMG's analysis included measures taken by the Trustees and CMG that seek to share any potential economies of scale through breakpoints in management fee schedules, expense reimbursements, fee waivers, enhanced shareholder services, fund mergers, and operational consolidation.
16. An examination of the contractual fee schedules for five Atlantic Funds shows that they are generally in line with those of their competitors, in terms of number and extent of fee breakpoints. A similar examination last year of five different Funds led to the same conclusion.
F. Management Fees Charged to Institutional Clients
17. CMG has provided Trustees with comparisons of mutual fund management fees and institutional fees based upon standardized fee schedules and upon actual fees. The results show that, consistent with industry practice, institutional fees are generally lower than the Funds' management fees. However, because the services provided and risks borne by the manager are more extensive for mutual funds compared to institutional accounts, the differences are of limited value in assisting the Trustees in their review of the reasonableness of the Funds' management fees.
26
G. Revenues, Expenses, and Profits
18. The activity-based cost allocation methodology ("ABC") employed by CMG to allocate costs, both direct and indirect, for purposes of calculating Fund profitability is thoughtful and detailed. This year, CMG proposed a change to the method by which indirect expenses are allocated. Under this "hybrid" method, indirect costs relating to fund management are allocated among the Funds 50% by assets and 50% per Fund. Allocating indirect expenses equally to each Fund has an intuitive logic, as each Fund regardless of size has certain expenses, such as preparing and printing prospectuses and financial statements.
19. The materials provided on CMG's revenues and expenses with respect to the Funds and the methodology underlying their construction form a sufficient basis for Trustees to evaluate the expenses and profitability of the Funds.
20. In 2007, CMG's complex-wide pre-tax margins on the Atlantic Funds were slightly below industry medians, based on limited data available for publicly held mutual fund managers. However, as is to be expected in a complex now comprising 75 Funds (including former Excelsior Funds), some Atlantic Funds have relatively high pre-tax profit margins, when calculated solely with respect to management revenues and expenses, while other Atlantic Funds operate at a loss. There is a positive relationship between fund size and profitability, with smaller funds generally operating at a loss.
21. CMG pays a fixed percentage of its management fee revenues to an affiliate, U.S. Trust, Bank of America Private Wealth Management, to compensate it for services it performs with respect to Atlantic Fund assets held for the benefit of its customers. Based on our analysis of the services provided by this affiliate, we have concluded that all payments other than those for sub-transfer agent or sub-accounting services should be treated as a distribution expense.
III. Recommendations
1) Criteria for review. The Trustees may wish to consider modifying the criteria for classifying a fund as a "Review Fund" to include criteria that focus exclusively on performance without regard to expense or fee levels. For example, a fund whose one-year or three-year performance was median or below for four consecutive years could be treated as a Review Fund. When we applied such criteria to the Funds, several additional Funds would have been added to the list of Review Funds.
2) Profitability data. CMG should present to the Trustees each year the profitability of each Fund, each investment style and each complex (of which Atlantic is one) calculated as follows:
a. Management-only profitability should be calculated without reference to any Private Bank expense.
b. Profitability excluding distribution (which essentially covers the management and transfer agency functions) should be adjusted by removing from the expense calculation any portion of the Private Bank payment not attributable to the performance by the Private Bank of sub-transfer agency or sub-accounting functions.
c. Total profitability, including distribution: No adjustment for Private Bank expenses should be made, because all such expenses represent legitimate fund expenses to be taken into account in calculating CMG's profit margin including distribution.
d. Distribution only: This should include all Private Bank expenses other than those attributable to sub-transfer agency services.
Therefore, the following data need not be provided:
1. Adjusting total profitability data for Private Bank expenses
2. Adjusting profitability excluding distribution by backing out all Private Bank expenses.
3) Potential economies of scale. CMG and the IFC should continue to work on methods for more precisely quantifying to the extent possible the sources and magnitude of any economies of scale as CMG's mutual fund assets under management increase, to the extent that the data allows for meaningful year-over-year comparisons. The framework suggested in Section IV.D.4 may prove to be a useful model for such an analysis.
27
4) Competitive breakpoint analysis. As part of the annual fee evaluation process, the breakpoints of a select group of Atlantic Funds (which would differ each year) should continue to be compared to those of industry rivals to ensure that the Funds' breakpoint schedules remain within industry norms. As breakpoint schedules change relatively little each year, performing such a comparison for each Atlantic Fund each year would not be an efficient use of Trustee and CMG resources.
5) Cost allocation methodology. CMG's point that the current ABC system of allocating indirect expenses creates anomalous results in several cases, including sub-advised Funds, is well-taken. We would like to work with CMG over the forthcoming year on alternatives to the current system of allocating indirect expenses that (1) resolve the anomalies, (2) limit the amount of incremental effort on CMG's part and (3) remain faithful to the general principle that expenses should be allocated by time and effort to the extent reasonably possible.
6) Management fee disparities. CMG and the Atlantic Trustees, as part of any future study of management fees, should analyze the differences in management fee schedules, principally arising out of the reorganization of the former Excelsior Funds as Atlantic Funds. As part of that analysis, CMG should provide an explanation for any significant fee differences among comparable funds across fund families managed by CMA, such as differences in the management styles of different Funds included the same Lipper category. Finally, whenever CMG proposes a management fee change or an expense cap for any mutual fund managed by CMA that is comparable to any Atlantic Fund, CMG should provide the Trustees with sufficient information about the proposal to allow the Trustees to assess the applicability of the proposed change to the relevant Atlantic Fund or Funds.
7) Tax-exempt Fund expense data. The expense rankings of certain tax-exempt Funds were adversely affected by including certain investment-related interest expenses that Lipper excluded in calculating the expense ratios of competitors. We recommend that CMG follow the Lipper practice and exclude such interest expenses from data submitted to Lipper to avoid unfairly disadvantaging the tax-exempt Funds.
8) Reduction of volume of paper documents submitted. The effort to rationalize and simplify the data presented to the Trustees and the process by which that data was prepared and organized was regarded as a success by all parties. We should continue to look for opportunities to reduce and simplify the presentation of 15(c) data, especially in the area of Fund profitability. The Fund "Dashboard" volume presents a large volume of Fund data on a single page. If it is continued, the Trustees may wish to consider receiving the underlying Lipper data on CD, rather than the current paper volumes.
* * *
Respectfully submitted,
Steven E. Asher
28
This page is intentionally left blank.
COLUMBIA FUNDS INSTITUTIONAL TRUST
ONE FINANCIAL CENTER, BOSTON, MASSACHUSETTS 02111-2621
- INVESTMENT ADVISOR -
COLUMBIA MANAGEMENT ADVISORS, LLC
100 FEDERAL STREET
BOSTON, MASSACHUSETTS 02110-2624
- LEGAL COUNSEL -
ROPES & GRAY LLP
ONE INTERNATIONAL PLACE
BOSTON, MASSACHUSETTS 02110-2624
- TRANSFER AGENT -
COLUMBIA MANAGEMENT SERVICES, INC.
P.O. BOX 8081
BOSTON, MASSACHUSETTS 02266-8081
SHC-44/5862-0109 (03/09) 09-74108
A description of the policies and procedures that the fund uses to determine how to vote proxies to its portfolio securities and a copy of the fund's voting records is available (i) on the fund's website, www.columbiamanagement.com; (ii) on the Securities and Exchange Commission's website at www.sec.gov, and (iii) without charge, upon request, by calling 1-800-368-0346. Information regarding how the fund voted proxies relating to portfolio securities during the 12-month period ended June 30 is available from the SEC's website. Information regarding how the fund voted proxies relating to portfolio securities is also available from the website, www.columbiamanagement.com.
The fund files a complete schedule of portfolio holdings with the SEC for the first and third quarters of each fiscal year on Form N-Q. The fund's Form N-Q is available on the SEC's website at www.sec.gov and may be reviewed and copied at the SEC's Public Reference Room in Washington, D.C. Information on the operation of the Public Reference Room may be obtained by calling 1-800-SEC-0330.
Please read and consider the investment objectives, risks, charges and expenses for any fund carefully before investing. For a prospectus which contains this and other important information about the fund, contact your Columbia Management representative or financial advisor or go to www.columbiamanagement.com.
© 2009 Columbia Management Distributors, Inc.
One Financial Center, Boston, MA 02111-2621
Item 2. Code of Ethics.
Not applicable for semi-annual reports.
Item 3. Audit Committee Financial Expert.
Not applicable for semi-annual reports.
Item 4. Principal Accountant Fees and Services.
Not applicable for semi-annual reports.
Item 5. Audit Committee of Listed Registrants.
Not applicable.
Item 6. Investments
(a) | The registrant’s “Schedule I – Investments in securities of unaffiliated issuers” (as set forth in 17 CFR 210.12-12) is included in Item 1 of this Form N-CSR. |
|
|
(b) | Not applicable. |
Item 7. Disclosure of Proxy Voting Policies and Procedures for Closed-End Management Investment Companies.
Not applicable.
Item 8. Portfolio Managers of Closed-End Management Investment Companies.
Not applicable.
Item 9. Purchases of Equity Securities by Closed-End Management Investment Company and Affiliated Purchasers.
Not applicable.
Item 10. Submission of Matters to a Vote of Security Holders.
There have not been any material changes to the procedures by which shareholders may recommend nominees to the registrant’s board of directors, since those procedures were last disclosed in response to requirements of Item 407(c)(2)(iv) of Regulation S-K (as required by Item 22(b)(15) of Schedule 14A) or this Item.
Item 11. Controls and Procedures.
(a) The registrant’s principal executive officer and principal financial officers, based on their evaluation of the registrant’s disclosure controls and procedures as of a date within 90 days of the filing of this report, have concluded that such controls and procedures are adequately designed to ensure that information required to be disclosed by the registrant in Form N-CSR is accumulated and communicated to the registrant’s management, including the principal executive officer and principal financial officer, or persons performing similar functions, as appropriate to allow timely decisions regarding required disclosure.
(b) There was no change in the registrant’s internal control over financial reporting that occurred during the registrant’s second fiscal quarter of the period covered by this report that has materially affected, or is reasonably likely to materially affect, the registrant’s internal control over financial reporting.
Item 12. Exhibits.
(a)(1) Code of ethics required to be disclosed under Item 2 of Form N-CSR: Not applicable at this time.
(a)(2) Certifications pursuant to Rule 30a-2(a) under the Investment Company Act of 1940 (17 CFR 270.30a-2(a)) attached hereto as Exhibit 99.CERT.
(a)(3) Not applicable.
(b) Certification pursuant to Rule 30a-2(b) under the Investment Company Act of 1940 (17 CFR 270.30a-2(b)) attached hereto as Exhibit 99.906CERT.
SIGNATURES
Pursuant to the requirements of the Securities Exchange Act of 1934 and the Investment Company Act of 1940, the registrant has duly caused this report to be signed on its behalf by the undersigned, thereunto duly authorized.
(registrant) | Columbia Funds Institutional Trust | ||
|
| ||
|
| ||
By (Signature and Title) | /s/ J. Kevin Connaughton | ||
| J. Kevin Connaughton, President | ||
|
| ||
|
| ||
Date |
| March 23, 2009 | |
Pursuant to the requirements of the Securities Exchange Act of 1934 and the Investment Company Act of 1940, this report has been signed below by the following persons on behalf of the registrant and in the capacities and on the dates indicated.
By (Signature and Title) | /s/ J. Kevin Connaughton | |
| J. Kevin Connaughton, President | |
|
| |
|
| |
Date |
| March 23, 2009 |
|
| |
|
| |
By (Signature and Title) | /s/ Michael G. Clarke | |
| Michael G. Clarke, Chief Financial Officer | |
|
| |
|
| |
Date |
| March 23, 2009 |