UNITED STATES
SECURITIES AND EXCHANGE COMMISSION
Washington, D.C. 20549
FORM N-CSR
CERTIFIED SHAREHOLDER REPORT OF REGISTERED
MANAGEMENT INVESTMENT COMPANIES
Investment Company Act file number | 811-5857 | |||||||
| ||||||||
Columbia Funds Institutional Trust | ||||||||
(Exact name of registrant as specified in charter) | ||||||||
| ||||||||
One Financial Center, Boston, Massachusetts |
| 02111 | ||||||
(Address of principal executive offices) |
| (Zip code) | ||||||
| ||||||||
James R. Bordewick, Jr., Esq. Columbia Management Advisors, LLC One Financial Center Boston, MA 02111 | ||||||||
(Name and address of agent for service) | ||||||||
| ||||||||
Registrant’s telephone number, including area code: | 1-617-426-3750 |
| ||||||
| ||||||||
Date of fiscal year end: | July 31, 2006 |
| ||||||
| ||||||||
Date of reporting period: | July 31, 2006 |
| ||||||
Form N-CSR is to be used by management investment companies to file reports with the Commission not later than 10 days after the transmission to stockholders of any report that is required to be transmitted to stockholders under Rule 30e-1 under the Investment Company Act of 1940 (17 CFR 270.30e-1). The Commission may use the information provided on Form N-CSR in its regulatory, disclosure review, inspection, and policymaking roles.
A registrant is required to disclose the information specified by Form N-CSR, and the Commission will make this information public. A registrant is not required to respond to the collection of information contained in Form N-CSR unless the Form displays a currently valid Office of Management and Budget (“OMB”) control number. Please direct comments concerning the accuracy of the information collection burden estimate and any suggestions for reducing the burden to Secretary, Securities and Exchange Commission, 450 Fifth Street, NW, Washington, DC 20549-0609. The OMB has reviewed this collection of information under the clearance requirements of 44 U.S.C. § 3507.
Item 1. Reports to Stockholders.
![]()
CMG CORE BOND FUND
CMG SHORT TERM BOND FUND
CMG ULTRA SHORT TERM BOND FUND
CMG HIGH YIELD FUND
PORTFOLIOS OF COLUMBIA FUNDS INSTITUTIONAL TRUST
Annual Report
July 31, 2006
Advised by Columbia Management Advisors, LLC.
Not FDIC
Insured
May Lose Value
No Bank Guarantee
Columbia Management Group, LLC (Columbia Management) is the primary investment manager of Bank of America Corporation. Columbia Management entities furnish investment management services and advise institutional and mutual fund portfolios. CMG Funds are distributed by Columbia Management Distributors, Inc., member of NASD, SIPC, part of Columbia Management and an affiliate of Bank of America Corporation.
| Table of Contents | |||
Management Discussion of Fund Performance
| CMG Core Bond Fund | 1 | ||||||
| CMG Short Term Bond Fund | 5 | ||||||
| CMG Ultra Short Term Bond Fund | 9 | ||||||
| CMG High Yield Fund | 13 | ||||||
Financial Statements
| Financial Highlights | 17 | ||||||
| Schedule of Investments | 21 | ||||||
| Statements of Assets and Liabilities | 60 | ||||||
| Statements of Operations | 61 | ||||||
| Statements of Changes in Net Assets | 62 | ||||||
| Notes to Financial Statements | 64 | ||||||
| Report of Independent Registered Public Accounting Firm | 74 | ||||||
Fund Governance
| Trustees | 75 | ||||||
| Officers | 77 | ||||||
The views expressed in the Management Discussion of Fund Performance reflect the current views of the Portfolio Managers. These views are not guarantees of future performance and involve certain risks, uncertainties and assumptions that are difficult to predict so actual outcomes and results may differ significantly from the views expressed. These views are subject to change at any time based upon economic, market or other conditions and the Portfolio Managers disclaim any responsibility to update such views. These views may not be relied on as investment advice and, because investment decisions for a CMG Fund are based on numerous factors, may not be relied on as an indication of trading intent on behalf of any particular CMG Fund. References to specific company securities should not be constructed as a recommendation or investment adv ice.
Performance data quoted represents past performance and current performance may be lower or higher. Past performance is no guarantee of future results. The investment return and principal value will fluctuate so that shares, when redeemed, may be worth more or less than the original cost. Please visit www.columbiamanagement.com for daily and most recent month-end performance updates.
CMG CORE BOND FUND
A Portfolio of Columbia Funds Institutional Trust
MANAGEMENT DISCUSSION OF FUND PERFORMANCE
For the 12-month period ended July 31, 2006, the CMG Core Bond Fund returned 1.46%. The fund's return matched the Lehman Brothers U.S. Aggregate Bond Index,1 which also returned 1.46%. It surpassed the average return of its peer group, the Lipper Corporate Debt Funds A-Rated Category, which was 0.78% over the same period.2 The fund's relative performance was aided by an advantageous maturity profile as well as its positions in mortgage-backed and asset-backed securities.
It was a challenging year for the bond market, as yields rose across all maturities. Yields on six-month T-bills rose 147 basis points, reflecting the Federal Reserve Board's (the Fed's) continuing campaign to manage the delicate balance between economic growth and inflation via small but steady increases in the bellwether federal funds rate. Over the same period, 30-year Treasury yields advanced only 59 basis points. As a result, the yield advantage that ordinarily accrues to longer maturities has all but disappeared, with Treasury securities yielding approximately 5% all along the maturity spectrum.
Within this environment, the fund benefited by maintaining an average maturity that was shorter than its benchmark, especially early in the period. By using a "barbell" approach of short and long maturities, we minimized the fund's exposure to intermediate bonds, which proved especially vulnerable as rates moved higher.
An overweight in mortgage-backed and asset-backed securities also boosted relative performance, as both sectors outperformed comparable Treasury securities. In particular, we increased the fund's ownership of commercial mortgage-backed securities from 1.4% to 5.4% of the portfolio. These securities are backed by loans on commercial properties and were the single best performing asset class over the past twelve months.
The fund continued to own Treasury Inflation Protected Securities (TIPS), which posted positive returns as core inflation moved higher on rising energy prices. The Fed has indicated that it is monitoring inflation closely as it weighs the relative merits of further rate increases.
Certain sector decisions detracted from the fund's positive performance. The fund was overweight in 15-year conventional mortgage pass-throughs, which underperformed 30-year pass-throughs even though the sector produced a positive return. In addition, we maintained a modest overweight in corporate bonds, which underperformed comparable Treasury securities.
We anticipate a slowing but still healthy economy in the months ahead. Quarterly growth has already been brought down by the combination of higher interest rates, higher energy prices and a cooling of the housing market, and we expect GDP to grow between 2.5% and 3% during the next year. We expect interest rates to remain at or around 5%, unless the Fed decides to take further action. This is a transitional phase for the economy and monetary policy, but in the year ahead we would not be surprised to see the Fed orchestrate a return to a more conventional Treasury market, one in which long-term yields exceed short-term yields.
1
The fund's top ten holdings (as a percentage of net assets) as of July 31, 2006 were:
| (%) | |||||||
| U.S. Treasury Bonds, 6.250% 08/15/2023 | 5.4 | ||||||
| Federal Home Loan Mortgage Corp., 5.500% 08/01/2036 | 4.3 | ||||||
| Federal National Mortgage Association, 5.500% 11/01/2035 | 3.1 | ||||||
| Federal Home Loan Mortgage Corp., 5.500% 08/01/2035 | 2.7 | ||||||
| U.S. Treasury Bonds, 7.250% 05/15/2016 | 2.7 | ||||||
| Federal Home Loan Mortgage Corp., 4.500% 03/15/2018 | 2.7 | ||||||
| U.S. Treasury Notes, 3.875% 02/15/2013 | 2.5 | ||||||
| Federal National Mortgage Association, 5.250% 08/01/2012 | 2.2 | ||||||
| Washington Mutual Mortgage Securities Corp., 5.500% 10/25/2035 | 2.1 | ||||||
| Federal Home Loan Bank, 4.375% 09/11/2009 | 2.1 | ||||||
We appreciate your continued confidence in the CMG Core Bond Fund.
Leonard A. Aplet has co-managed the CMG Core Bond Fund since September 2000 and has been with the advisor or its predecessors or affiliate organizations since 1987.
Richard R. Cutts has co-managed the fund since November 2000 and has been with the advisor or its predecessors or affiliate organizations since 1994.
Investing in fixed-income securities may involve certain risks, including the credit quality of individual issuers, possible prepayments, market or economic developments, and yield and share price fluctuations due to changes in interest rates. When interest rates go up, bond prices typically drop, and vice versa.
Holdings are calculated as a percentage of net assets, and are subject to change. Because the fund is actively managed, there is no guarantee the fund will continue to maintain the holdings breakdown listed. The fund's holdings and their weights within the portfolio may change as market conditions change.
1 The Lehman Brothers U.S. Aggregate Bond Index is a market value-weighted index that tracks the daily price, coupon, pay-downs, and total return performance of fixed-rate, publicly placed, dollar-denominated, and non-convertible investment grade debt issues with at least $250 million par amount outstanding and with at least one year to final maturity. Unlike the fund, indices are not investments, do not incur fees or expenses and are not professionally managed. It is not possible to invest directly in an index. Securities in the fund may not match those in an index.
2 Lipper Inc., a widely respected data provider in the industry, calculates an average total return (assuming reinvestment of distributions) for mutual funds with investment objectives similar to those of the fund. Lipper makes no adjustment for the effect of sales loads.
2
Average annual total return as of July 31, 2006 (%)
| Inception | 1-year | 5-year | Life | ||||||||||||||||
| CMG Core Bond Fund | 09/01/00 | 1.46 | 4.29 | 5.53 | |||||||||||||||
| Lehman Brothers U.S. Aggregate Bond Index | 1.46 | 4.79 | 5.90 | ||||||||||||||||
Average annual total return as of June 30, 2006 (%)
| Inception | 1-year | 5-year | Life | ||||||||||||||||
| CMG Core Bond Fund | 09/01/00 | -0.76 | 4.46 | 5.35 | |||||||||||||||
| Lehman Brothers U.S. Aggregate Bond Index | -0.81 | 4.97 | 5.74 | ||||||||||||||||
Performance data quoted represents past performance and current performance may be lower or higher. Past performance is no guarantee of future results. The investment return and principal value will fluctuate so that shares, when redeemed, may be worth more or less than the original cost. Please visit www.columbiamanagement.com for daily and most recent month-end performance updates.
Performance results reflect any voluntary waivers or reimbursement of fund expenses by the advisor or its affiliates. Absent these waivers or reimbursement arrangements, performance results would have been lower. All results shown assume reinvestment of distributions.
The table does not reflect the deduction of taxes that a shareholder would pay on fund distributions or the redemption of fund shares.
Growth of a $3,000,000 investment, September 1, 2000 to July 31, 2006

The chart above shows the growth in value of a hypothetical minimum initial $3,000,000 investment in the fund compared to the index during the stated time period, and does not reflect the deduction of taxes that a shareholder would pay on fund distributions or the redemption of fund shares.
The Lehman Brothers U.S. Aggregate Bond Index is a market value-weighted index that tracks the daily price, coupon, pay-downs, and total return performance of fixed-rate, publicly placed, dollar-denominated, and non-convertible investment grade debt issues with at least $250 million par amount outstanding and with at least one year to final maturity. Unlike the fund, indices are not investments, do not incur fees or expenses and are not professionally managed. It is not possible to invest directly in an index. Securities in the fund may not match those in an index.
Index performance is from September 1, 2000.
3
UNDERSTANDING YOUR EXPENSES – CMG Core Bond Fund
As a fund shareholder, you incur two types of costs. There are transaction costs and also ongoing costs, which generally include investment advisory fees and other fund expenses. The information on this page is intended to help you understand your ongoing costs of investing in the fund and to compare these costs with the ongoing costs of investing in other mutual funds.
Analyzing your fund's expenses
To illustrate these ongoing costs, we have provided an example and calculated the expenses paid by investors during the reporting period. The information in the following table is based on an initial investment of $1,000, which is invested at the beginning of the reporting period and held for the entire period. Expense information is calculated two ways and each method provides you with different information. The amount listed in the "actual" column is calculated using the fund's actual operating expenses and total return for the period. The amount listed in the "hypothetical" column assumes that the return each year is 5% before expenses and is calculated based on the fund's actual operating expenses. You should not use the hypothetical account values and expenses to estimate either your actual account balance at the end of the period or the expenses you paid during this reporting period.
Estimating your actual expenses
To estimate the expenses that you paid over the period, first you will need your account balance at the end of the period:
1. Divide your ending account balance by $1,000. For example, if an account balance was $8,600 at the end of the period, the result would be 8.6.
2. In the section of the table below titled "Expenses paid during the period," locate the amount under "actual." Multiply this number by the result from step 1. Your answer is an estimate of the expenses you paid on your account during the period.
February 1, 2006 – July 31, 2006
| Account value at the beginning of the period ($) | Account value at the end of the period ($) | Expenses paid during the period ($) | Fund's annualized expense ratio (%) | ||||||||||||||||||||||||
| Actual | Hypothetical | Actual | Hypothetical | Actual | Hypothetical | Actual | |||||||||||||||||||||
| 1,000.00 | 1,000.00 | 1,006.15 | 1,023.55 | 1.24 | 1.25 | 0.25 | |||||||||||||||||||||
Expenses paid during the period are equal to the annualized expense ratio of 0.25%, multiplied by the average account value over the period, then multiplied by the number of days in the fund's most recent fiscal half- year and divided by 365.
Had the Investment Advisor not reimbursed a portion of expenses, total return would have been reduced.
It is important to note that the expense amounts shown in the table are meant to highlight only ongoing costs of investing in the fund and do not reflect any transaction costs, such as sales charges, redemption or exchange fees. Therefore, the hypothetical examples provided may not help you determine the relative total costs of owning shares of different funds. If these transaction costs were included, your costs would have been higher.
Compare with other funds
Since all mutual funds are required to include the same hypothetical calculations about expenses in shareholder reports, you can use this information to compare the ongoing cost of investing in the fund with other funds. To do so, compare the 5% hypothetical example with the 5% hypothetical examples that appear in the shareholder reports of other funds. As you compare hypothetical examples of other funds, it is important to note that hypothetical examples are meant to highlight the continuing costs of investing in a fund and do not reflect any transaction costs, such as sales charges or redemption or exchange fees.
4
Performance data quoted represents past performance, and current performance may be lower or higher. Past performance is no guarantee of future results. The investment return and principal value will fluctuate so that shares, when redeemed, may be worth more or less than the original cost. Please visit www.columbiamanagement.com for daily and most recent month-end performance updates.
CMG SHORT TERM BOND FUND
A Portfolio of Columbia Funds Institutional Trust
MANAGEMENT DISCUSSION OF FUND PERFORMANCE
CMG Short Term Bond Fund returned 3.15% for the 12-month period ended July 31, 2006. The fund outperformed the Merrill Lynch 1-3 Year U.S. Treasury Index,1 which returned 2.86% during the period. The fund also surpassed the average return of its peer group, the Lipper Short Investment Grade Debt Funds Category, which was 2.74%.2 The fund's performance was aided by its sector allocations, its relatively short maturity profile and its use of floating-rate securities.
Yields on short-term fixed-income investments rose throughout the year, the result of a continued campaign by the Federal Reserve Board (the Fed) to steer the economy toward moderate growth and to control inflation. Over the past twelve months alone the Fed pushed the bellwether federal funds rate from 3.25% to 5.25% in a series of eight carefully orchestrated rate hikes. The yield on six-month T-bills went up 147 basis points during this period, whereas the yield on 10-year Treasury notes rose only 70 basis points. At the end of the period, Treasury securities at virtually all points on the yield curve yielded in and around 5.0%—a somewhat unusual situation by historical standards.
A combination of factors contributed to the fund's above-index performance. Our decision to keep the average duration (which is a measure of interest rate sensitivity), of the fund shorter than the index was rewarded as short-term interest rates continued to rise. We maintained a barbell structure, emphasizing longer maturities that were less affected by higher rates in combination with ultra-short securities, which could be reinvested at higher rates as those securities matured. We also did well to maintain significant exposure to floating-rate notes, whose coupons reset monthly based on the movement of short-term rates. The coupon income on these securities increased substantially as short rates rose during the year. An overweight in mortgage-backed and asset-backed securities was also helpful to overall performance, as both sectors outperformed Treasury securities of comparable maturities.
As the period progressed, we gradually shifted the fund's maturity profile to more closely approximate the index. In the process we shifted the fund away from its barbell structure and reduced exposure to floating-rate notes. In retrospect, the fund's performance would have been even better had we delayed these moves. Our purpose was to position the fund for a shift to a more traditional yield curve, in which securities with longer maturities yield more than short-term securities, which we expect going forward.
After 17 consecutive short-term rate hikes, the Fed paused at its most recent meeting, which took place just after the end of this reporting period. Rising energy prices, a cooling housing market and higher short-term interest rates have helped slow economic growth. However, core inflation is still slightly above the Fed's comfort range, so further hikes are not out of the
5
question. Against this backdrop, we continue to expect the yield curve to return to a more traditional upward slope and we expect mortgage and asset-backed securities to continue to outperform Treasuries in this environment.
The fund's top ten holdings (as a percentage of net assets) as of July 31, 2006 were:
| (%) | |||||||
| Federal National Mortgage Association, 4.750% 08/03/2007 | 4.1 | ||||||
| Countrywide Alternative Loan Trust, 5.500% 02/25/2036 | 3.0 | ||||||
| U.S. Treasury Inflation Index Notes, 3.875% 01/15/2009 | 2.7 | ||||||
| Capital Auto Receivables Asset Trust, 3.580% 01/15/2009 | 2.3 | ||||||
| Mastr Asset Backed Securities Trust, 5.435% 03/25/2036 | 2.1 | ||||||
| Long Beach Auto Receivables Trust, 4.050% 04/15/2011 | 2.0 | ||||||
| Federal Home Loan Mortgage Corp., 4.500% 03/01/2021 | 2.0 | ||||||
| Prudential Securities Secured Financing Corp., 6.480% 11/01/2031 | 1.9 | ||||||
| Federal National Mortgage Association, 6.000% 06/25/2027 | 1.8 | ||||||
| Federal Home Loan Mortgage Corp., 5.500% 07/01/2019 | 1.7 | ||||||
We appreciate your continued confidence in the CMG Short Term Bond Fund.
Leonard A. Aplet has co-managed the CMG Short Term Bond Fund since February 1998 and has been with the advisor or its predecessors or affiliate organizations since 1987.
Richard R. Cutts has co-managed the fund since November 2000 and has been with the advisor or its predecessors or affiliate organizations since 1994.
Investing in fixed-income securities may involve certain risks, including the credit quality of individual issuers, possible prepayments, market or economic developments and yield and share price fluctuations due to changes in interest rates. When interest rates go up, bond prices typically drop, and vice versa.
Holdings are calculated as a percentage of net assets, and are subject to change. Because the fund is actively managed, there is no guarantee the fund will continue to maintain the holdings breakdown listed. The fund's holdings and their weights within the portfolio may change as market conditions change.
1 The Merrill Lynch 1-3 Year U.S. Treasury Index tracks the performance of sovereign debt publicly issued in the U.S. domestic market with maturities of 1-3 years and a minimum amount outstanding of $1 billion. Unlike the fund, indices are not investments, do not incur fees or expenses and are not professionally managed. It is not possible to invest directly in an index. Securities in the fund may not match those in an index.
2 Lipper Inc., a widely respected data provider in the industry, calculates an average total return (assuming reinvestment of distributions) for mutual funds with investment objectives similar to those of the fund. Lipper makes no adjustment for the effect of sales loads.
6
Average annual total return as of July 31, 2006 (%)
| Inception | 1-year | 5-year | Life | ||||||||||||||||
| CMG Short Term Bond Fund | 02/02/98 | 3.15 | 3.33 | 4.80 | |||||||||||||||
| Merrill Lynch 1-3 Year U.S. Treasury Index | 2.86 | 3.00 | 4.37 | ||||||||||||||||
Average annual total return as of June 30, 2006 (%)
| Inception | 1-year | 5-year | Life | ||||||||||||||||
| CMG Short Term Bond Fund | 02/02/98 | 2.16 | 3.49 | 4.75 | |||||||||||||||
| Merrill Lynch 1-3 Year U.S. Treasury Index | 1.83 | 3.08 | 4.32 | ||||||||||||||||
Performance data quoted represents past performance and current performance may be lower or higher. Past performance is no guarantee of future results. The investment return and principal value will fluctuate so that shares, when redeemed, may be worth more or less than the original cost. Please visit www.columbiamanagement.com for daily and most recent month-end performance updates.
Performance results reflect any voluntary waivers or reimbursement of fund expenses by the advisor or its affiliates. Absent these waivers or reimbursement arrangements, performance results would have been lower. All results shown assume reinvestment of distributions.
The table does not reflect the deduction of taxes that a shareholder would pay on fund distributions or the redemption of fund shares.
Growth of a $3,000,000 investment, February 2, 1998 to July 31, 2006
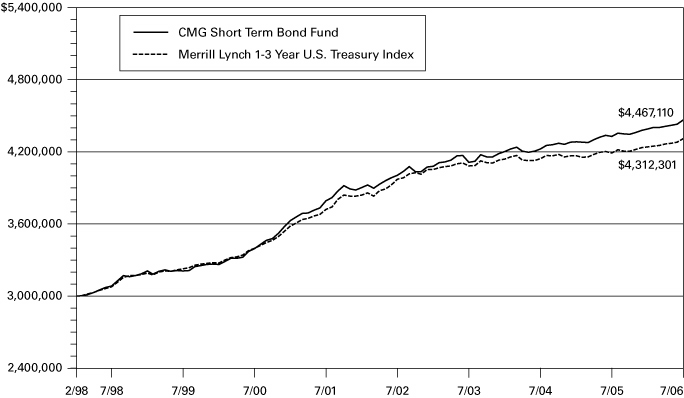
The chart above shows the growth in value of a hypothetical minimum initial $3,000,000 investment in the fund compared to the index during the stated time period, and does not reflect the deduction of taxes that a shareholder would pay on fund distributions or the redemption of fund shares.
The Merrill Lynch 1-3 Year U.S. Treasury Index tracks the performance of sovereign debt publicly issued in the U.S. domestic market with maturities of 1-3 years and a minimum amount outstanding of $1 billion. Unlike the fund, indices are not investments, do not incur fees or expenses and are not professionally managed. It is not possible to invest directly in an index. Securities in the fund may not match those in an index.
Index performance is from February 2, 1998.
7
UNDERSTANDING YOUR EXPENSES – CMG Short Term Bond Fund
As a fund shareholder, you incur two types of costs. There are transaction costs and also ongoing costs, which generally include investment advisory fees and other fund expenses. The information on this page is intended to help you understand your ongoing costs of investing in the fund and to compare these costs with the ongoing costs of investing in other mutual funds.
Analyzing your fund's expenses
To illustrate these ongoing costs, we have provided an example and calculated the expenses paid by investors during the reporting period. The information in the following table is based on an initial investment of $1,000, which is invested at the beginning of the reporting period and held for the entire period. Expense information is calculated two ways and each method provides you with different information. The amount listed in the "actual" column is calculated using the fund's actual operating expenses and total return for the period. The amount listed in the "hypothetical" column assumes that the return each year is 5% before expenses and is calculated based on the fund's actual operating expenses. You should not use the hypothetical account values and expenses to estimate either your actual account balance at the end of the period or the expenses you paid during this reporting period.
Estimating your actual expenses
To estimate the expenses that you paid over the period, first you will need your account balance at the end of the period:
1. Divide your ending account balance by $1,000. For example, if an account balance was $8,600 at the end of the period, the result would be 8.6.
2. In the section of the table below titled "Expenses paid during the period," locate the amount under "actual." Multiply this number by the result from step 1. Your answer is an estimate of the expenses you paid on your account during the period.
February 1, 2006 – July 31, 2006
| Account value at the beginning of the period ($) | Account value at the end of the period ($) | Expenses paid during the period ($) | Fund's annualized expense ratio (%) | ||||||||||||||||||||||||
| Actual | Hypothetical | Actual | Hypothetical | Actual | Hypothetical | Actual | |||||||||||||||||||||
| 1,000.00 | 1,000.00 | 1,016.71 | 1,023.55 | 1.25 | 1.25 | 0.25 | |||||||||||||||||||||
Expenses paid during the period are equal to the annualized expense ratio of 0.25%, multiplied by the average account value over the period, then multiplied by the number of days in the fund's most recent fiscal half-year and divided by 365.
Had the Investment Advisor not reimbursed a portion of expenses, total return would have been reduced.
It is important to note that the expense amounts shown in the table are meant to highlight only ongoing costs of investing in the fund and do not reflect any transaction costs, such as sales charges, redemption or exchange fees. Therefore, the hypothetical examples provided may not help you determine the relative total costs of owning shares of different funds. If these transaction costs were included, your costs would have been higher.
Compare with other funds
Since all mutual funds are required to include the same hypothetical calculations about expenses in shareholder reports, you can use this information to compare the ongoing cost of investing in the fund with other funds. To do so, compare the 5% hypothetical example with the 5% hypothetical examples that appear in the shareholder reports of other funds. As you compare hypothetical examples of other funds, it is important to note that hypothetical examples are meant to highlight the continuing costs of investing in a fund and do not reflect any transaction costs, such as sales charges or redemption or exchange fees.
8
Performance data quoted represents past performance, and current performance may be lower or higher. Past performance is no guarantee of future results. The investment return and principal value will fluctuate so that shares, when redeemed, may be worth more or less than the original cost. Please visit www.columbiamanagement.com for daily and most recent month-end performance updates.
CMG ULTRA SHORT TERM BOND FUND
A Portfolio of Columbia Funds Institutional Trust
MANAGEMENT DISCUSSION OF FUND PERFORMANCE
CMG Ultra Short Term Bond Fund returned 3.84% for the 12-month period ended July 31, 2006. The fund outperformed the Citigroup One-Year U.S. Treasury Bill Index1, which returned 3.44%, as well as outperforming the 3.63% average return of the Lipper Ultra-Short Obligation Funds Category.2 We believe the fund's return benefited from a shorter average maturity relative to its benchmark. This positioning buoyed the fund as interest rates headed higher during the period and uncertainty rose regarding how long the Federal Reserve Board (the Fed) would continue its cycle of short-term interest rate increases.
During the past 12 months, the spread between short- and long-term yields narrowed, flattening to the point where the yield curve inverted slightly in the middle of the period. As a result, buyers were paid less for accepting the risk of a longer maturity bond than for a shorter maturity issue. This unusual situation reflected investor uncertainty regarding inflation, the overall health of the economy and the anticipation of an end to the Fed's short-term interest rate increases.
In this environment, the fund benefited from strong performance from A-rated securities, as well as higher quality AA-rated bonds, which helped increase the fund's yield above that typically paid by Treasury and agency bonds. Holdings in asset-backed securities aided returns, as the fund maintained an overweight position in the sector. Floating-rate bonds also contributed to the fund's above-average return, as their yield adjustment cushioned the fund from the effects of rising interest rates.
Mortgage-backed securities underperformed versus other sectors during the period, as interest rates headed higher and maturities lengthened. As a result, mortgage issues detracted slightly from the fund's return during periods of volatility. While the fund's positioning remained fairly stable over the period, we added slightly to asset-backed securities and selected corporate debt issues that we believed combined value and reduced price volatility. To do so, we scaled back the fund's positions in Treasuries and agency bonds.
After more than two years of a Fed tightening cycle, we believe interest rates could begin to stabilize. Our view appears to be in line with the consensus, which does not anticipate that rates will head materially higher. As a result, we plan to move the average maturity of the
9
fund's holdings closer to that of its benchmark—to approximately one year. On the belief that higher quality bonds have less potential to experience credit problems, we intend to maintain the fund's focus on quality as the economy slows. However, we may look to add to the fund's holdings in BBB- and A-rated sectors, should pricing in those areas prove attractive.
The fund's top ten holdings (as a percentage of net assets) as of July 31, 2006 were:
| (%) | |||||||
| Federal Home Loan Mortgage Corp., 4.125% 04/02/2007 | 2.2 | ||||||
| Federal Home Loan Mortgage Corp., 2.875% 12/15/2006 | 2.2 | ||||||
| Federal Home Loan Mortgage Corp., 5.500% 04/15/2027 | 2.0 | ||||||
| Federal Home Loan Mortgage Corp., 5.000% 12/01/2019 | 1.7 | ||||||
| SLM Corp., 5.529% 9/15/2006 | 1.7 | ||||||
| Goldman Sachs Group, Inc., 5.647% 01/09/2007 | 1.7 | ||||||
| Morgan Stanley, 5.358% 11/24/2006 | 1.7 | ||||||
| Federal Home Loan Mortgage Corp., 2.750% 10/15/2006 | 1.7 | ||||||
| Providian Gateway Master Trust, 3.350% 09/15/2011 | 1.6 | ||||||
| Federal National Mortgage Association, 6.000% 09/01/2019 | 1.4 | ||||||
We appreciate your continued confidence in the CMG Ultra Short Term Bond Fund.
Guy C. Holbrook has managed the fund since its inception and has been with the advisor or its predecessors or affiliate organizations since 1998.
Investing in fixed-income securities may involve certain risks, including the credit quality of individual issuers, possible prepayments, market or economic developments and yield and share price fluctuations due to changes in interest rates. When interest rates go up, bond prices typically drop, and vice versa.
Holdings are calculated as a percentage of net assets, and are subject to change. Because the fund is actively managed, there is no guarantee the fund will continue to maintain the holdings breakdown listed. The fund's holdings and their weights within the portfolio may change as market conditions change.
1 The Citigroup One-Year U.S. Treasury Bill Index consists of a single 1-year U.S. Treasury Bill whose return is tracked until its maturity. Unlike the fund, indices are not investments, do not incur fees or expenses and are not professionally managed. It is not possible to invest directly in an index. Securities in the fund may not match those in an index.
2 Lipper Inc., a widely respected data provider in the industry, calculates an average total return (assuming reinvestment of distributions) for mutual funds with similar investment objectives as those of the fund. Lipper makes no adjustments for the effect of sales loads.
10
Average annual total return as of July 31, 2006 (%)
| Inception | 1-year | Life | |||||||||||||
| CMG Ultra Short Term Bond Fund | 03/08/04 | 3.84 | 2.31 | ||||||||||||
| Citigroup One-Year U.S. Treasury Bill Index | 3.44 | 2.01 | |||||||||||||
Average annual total return as of June 30, 2006 (%)
| Inception | 1-year | Life | |||||||||||||
| CMG Ultra Short Term Bond Fund | 03/08/04 | 3.24 | 2.14 | ||||||||||||
| Citigroup One-Year U.S. Treasury Bill Index | 2.86 | 1.84 | |||||||||||||
Performance data quoted represents past performance and current performance may be lower or higher. Past performance is no guarantee of future results. The investment return and principal value will fluctuate so that shares, when redeemed, may be worth more or less than the original cost. Please visit www.columbiamanagement.com for daily and most recent month-end performance updates.
Performance results reflect any voluntary waivers or reimbursement of fund expenses by the advisor or its affiliates. Absent these waivers or reimbursement arrangements, performance results would have been lower. All results shown assume reinvestment of distributions.
The table does not reflect the deduction of taxes that a shareholder would pay on fund distributions or the redemption of fund shares.
Growth of a $3,000,000 investment, March 8, 2004 to July 31, 2006
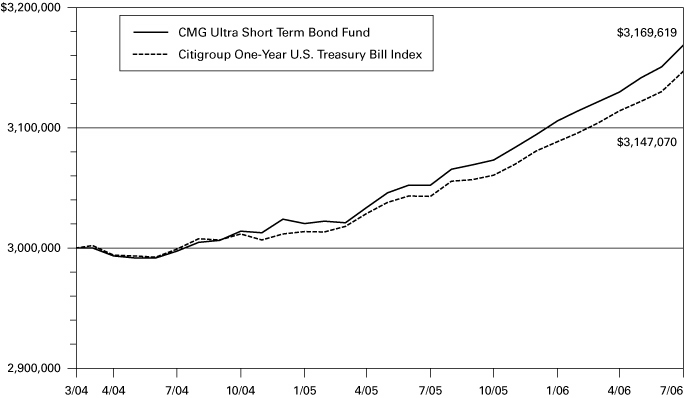
The chart above shows the growth in value of a hypothetical minimum initial $3,000,000 investment in the fund compared to the index during the stated time period, and does not reflect the deduction of taxes that a shareholder would pay on fund distributions or the redemption of fund shares.
The Citigroup One-Year U.S. Treasury Bill Index consists of a single 1-year U.S. Treasury Bill whose return is tracked until its maturity. Unlike the fund, indices are not investments, do not incur fees or expenses and are not professionally managed. It is not possible to invest directly in an index. Securities in the fund may not match those in an index.
Index performance is from March 8, 2004.
11
UNDERSTANDING YOUR EXPENSES – CMG Ultra Short Term Bond Fund
As a fund shareholder, you incur two types of costs. There are transaction costs and also ongoing costs, which generally include investment advisory fees and other fund expenses. The information on this page is intended to help you understand your ongoing costs of investing in the fund and to compare these costs with the ongoing costs of investing in other mutual funds.
Analyzing your fund's expenses
To illustrate these ongoing costs, we have provided an example and calculated the expenses paid by investors during the reporting period. The information in the following table is based on an initial investment of $1,000, which is invested at the beginning of the reporting period and held for the entire period. Expense information is calculated two ways and each method provides you with different information. The amount listed in the "actual" column is calculated using the fund's actual operating expenses and total return for the period. The amount listed in the "hypothetical" column assumes that the return each year is 5% before expenses and is calculated based on the fund's actual operating expenses. You should not use the hypothetical account values and expenses to estimate either your actual account balance at the end of the period or the expenses you paid during this reporting period.
Estimating your actual expenses
To estimate the expenses that you paid over the period, first you will need your account balance at the end of the period:
1. Divide your ending account balance by $1,000. For example, if an account balance was $8,600 at the end of the period, the result would be 8.6.
2. In the section of the table below titled "Expenses paid during the period," locate the amount under "actual." Multiply this number by the result from step 1. Your answer is an estimate of the expenses you paid on your account during the period.
February 1, 2006 – July 31, 2006
| Account value at the beginning of the period ($) | Account value at the end of the period ($) | Expenses paid during the period ($) | Fund's annualized expense ratio (%) | ||||||||||||||||||||||||
| Actual | Hypothetical | Actual | Hypothetical | Actual | Hypothetical | Actual | |||||||||||||||||||||
| 1,000.00 | 1,000.00 | 1,020.53 | 1,023.55 | 1.25 | 1.25 | 0.25 | |||||||||||||||||||||
Expenses paid during the period are equal to the annualized expense ratio of 0.25%, multiplied by the average account value over the period, then multiplied by the number of days in the fund's most recent fiscal half-year and divided by 365.
Had the Investment Advisor not reimbursed a portion of expenses, total return would have been reduced.
It is important to note that the expense amounts shown in the table are meant to highlight only ongoing costs of investing in the fund and do not reflect any transaction costs, such as sales charges, redemption or exchange fees. Therefore, the hypothetical examples provided may not help you determine the relative total costs of owning shares of different funds. If these transaction costs were included, your costs would have been higher.
Compare with other funds
Since all mutual funds are required to include the same hypothetical calculations about expenses in shareholder reports, you can use this information to compare the ongoing cost of investing in the fund with other funds. To do so, compare the 5% hypothetical example with the 5% hypothetical examples that appear in the shareholder reports of other funds. As you compare hypothetical examples of other funds, it is important to note that hypothetical examples are meant to highlight the continuing costs of investing in a fund and do not reflect any transaction costs, such as sales charges or redemption or exchange fees.
12
Performance data quoted represents past performance, and current performance may be lower or higher. Past performance is no guarantee of future results. The investment return and principal value will fluctuate so that shares, when redeemed, may be worth more or less than the original cost. Please visit www.columbiamanagement.com for daily and most recent month-end performance updates.
CMG HIGH YIELD FUND
A Portfolio of Columbia Funds Institutional Trust
MANAGEMENT DISCUSSION OF FUND PERFORMANCE
For the 12-month period ended July 31, 2006, the CMG High Yield Fund returned 1.47%. It underperformed the Merrill Lynch U.S. High Yield, Cash Pay Index, the Merrill Lynch Intermediate BB Index and the JPMorgan Chase Developed BB High Yield Index,1 which returned 4.14%, 3.15% and 2.51%, respectively. It also underperformed the average return of the Lipper High Current Yields Category, which was 3.80% for the period.2 The fund's emphasis on higher-quality credits hampered performance, especially during the latter half of the period.
The past twelve months comprised two fundamentally different investment environments for the fund. During the second half of 2005, the portfolio's policy of maintaining an above-average credit quality had a positive effect on performance. In the wake of hurricane Katrina, oil prices spiked to then-record highs and ongoing troubles at the major automotive companies combined to put pressure on lower quality issues. A steady stream of negative news from the automotive industry, coupled with bankruptcies at Delphi and Collins & Aikman contributed to an increase in risk aversion. This came on the heels of historic credit downgrades at Ford and GM, which took place earlier in the year.
However, this environment changed early in 2006. The Federal Reserve Board pushed short-term rates higher on four separate occasions between January and July. Yet corporate earnings remained strong and lower quality securities rallied. In this environment, the fund's emphasis on high quality went unrewarded. Also, an underweight in automotive bonds hampered performance as the bonds were aided by positive industry news. The fund's underweight reflects our belief that the auto industry faces additional future hurdles. Further, we believe that many of these securities are inconsistent with the fund's quality orientation.
Several other sector allocations also detracted from results for the period. The fund was slightly overweight in housing and health care, two sectors that came under pressure in recent months. Investors moved away from the bonds of homebuilders as the long-anticipated housing slowdown finally appeared in earnest. Meanwhile, the bonds of hospital management company HCA performed poorly following the announcement that the company would be taken private in an LBO—adding debt to its capital structure and therefore reducing the value of existing debt. We were able to reduce the fund's exposure relatively early in the process, thereby limiting the fund's loss relative to what had been a top ten holding of the fund. Our allocations to the utility and wireless telecommunications sectors aided performance during the period. Utilities moved higher on improved valuations while both sectors benefited from heightened merger and acquisit ion activity.
During the period we expanded the fund's diversification by increasing the number of bonds in the portfolio and reducing the average size of a position. In particular, we decreased the percentage of the portfolio accounted for by the top ten holdings. Throughout this diversification process, we maintained the fund's emphasis on higher-quality credits. Although the fund's high-quality orientation detracted from performance during this reporting period, we believe that our focus is prudent given an economic backdrop of elevated oil prices, a cooling housing market, slower corporate profit growth, and excessive leverage in the financial system. In this environment, we believe that the lower quality segment of the high yield market is more vulnerable than it has been in some time, and we are optimistic that the portfolio is well-positioned going forward.
13
The fund's top ten issuers (as a percentage of net assets) as of July 31, 2006 were:
| (%) | |||||||
| K. Hovnanian Enterprises, Inc. | 2.2 | ||||||
| Qwest Corp. | 1.9 | ||||||
| Williams Companies, Inc. | 1.6 | ||||||
| Extendicare Health Services, Inc. | 1.6 | ||||||
| Echostar DBS Corp. | 1.4 | ||||||
| Aes Corp. | 1.4 | ||||||
| Westinghouse Air Brake Technologies Corp. | 1.3 | ||||||
| Fisher Scientific International, Inc. | 1.3 | ||||||
| DirecTV Holdings LLC | 1.2 | ||||||
| Wynn Las Vegas LLC | 1.2 | ||||||
We appreciate your continued confidence in the CMG High Yield Fund.
Stephen Peacher, lead manager for CMG High Yield Fund, has co-managed the fund since September 2005. He has been with the advisor or its predecessors since April 2005.
Kevin L. Cronk has co-managed the fund since September 2005. He has been with the advisor or its predecessors or affiliate organizations since August 1999.
Thomas A. LaPointe has co-managed the fund since September 2005. He has been with the advisor or its predecessors or affiliate organizations since August 1999.
Investing in fixed-income securities involve certain risks, including the credit quality of individual issuers, possible prepayments, market or economic developments and yield and share price fluctuations due to changes in interest rates. When interest rates go up, bond prices typically drop, and vice versa.
Investments in high yield or "junk" bonds offer the potential for higher income than investments in investment-grade bonds but they also have a higher degree of risk. Changes in economic conditions or other circumstances may adversely affect a high-yield bond issuer's ability to make timely principal and interest payments.
Issuers are calculated as a percentage of net assets, and are subject to change. Because the fund is actively managed, there is no guarantee the fund will continue to maintain the issuers breakdown listed. The fund's issuers and their weights within the portfolio may change as market conditions change.
1 The Merrill Lynch U.S. High Yield, Cash Pay Index is an index that tracks the performance of non-investment-grade corporate bonds. The Merrill Lynch Intermediate BB Index is a market-weighted index, consisting of BB cash pay bonds, which are U.S. dollar denominated bonds issued in the U.S. domestic market with maturities between 1 and 10 years. The JPMorgan Chase Developed BB High Yield Index is an index that is designed to mirror the investable universe of the U.S. dollar developed, BB-rated, high yield corporate debt market. Unlike the fund, indices are not investments, do not incur fees or expenses and are not professionally managed. It is not possible to invest directly in an index. Securities in the fund may not match those in an index.
2 Lipper Inc., a widely respected data provider in the industry, calculates an average total return (assuming reinvestment of distributions) for mutual funds with investment objectives similar to those of the fund. Lipper makes no adjustment for the effect of sales loads.
14
Average annual total return as of July 31, 2006 (%)
| Inception | 1-year | 5-year | 10-year | ||||||||||||||||
| CMG High Yield Fund | 07/06/94 | 1.47 | 6.03 | 6.94 | |||||||||||||||
| JPMorgan Chase Developed BB High Yield Index | 2.51 | 7.85 | 8.28 | ||||||||||||||||
| Merrill Lynch Intermediate BB Index | 3.15 | 5.60 | 6.59 | ||||||||||||||||
| Merrill Lynch U.S. High Yield, Cash Pay Index | 4.14 | 8.26 | 6.86 | ||||||||||||||||
Average annual total return as of June 30, 2006 (%)
| Inception | 1-year | 5-year | 10-year | ||||||||||||||||
| CMG High Yield Fund | 07/06/94 | 1.45 | 6.05 | 6.94 | |||||||||||||||
| JPMorgan Chase Developed BB High Yield Index | 1.98 | 7.96 | 8.22 | ||||||||||||||||
| Merrill Lynch Intermediate BB Index | 3.05 | 5.72 | 6.53 | ||||||||||||||||
| Merrill Lynch U.S. High Yield, Cash Pay Index | 4.65 | 8.37 | 6.82 | ||||||||||||||||
Performance data quoted represents past performance and current performance may be lower or higher. Past performance is no guarantee of future results. The investment return and principal value will fluctuate so that shares, when redeemed, may be worth more or less than the original cost. Please visit www.columbiamanagement.com for daily and most recent month-end performance updates.
Performance results reflect any voluntary waivers or reimbursement of fund expenses by the advisor or its affiliates. Absent these waivers or reimbursement arrangements, performance results would have been lower. All results shown assume reinvestment of distributions.
The table does not reflect the deduction of taxes that a shareholder would pay on fund distributions or the redemption of fund shares.
Growth of a $3,000,000 investment, August 1, 1996 to July 31, 2006
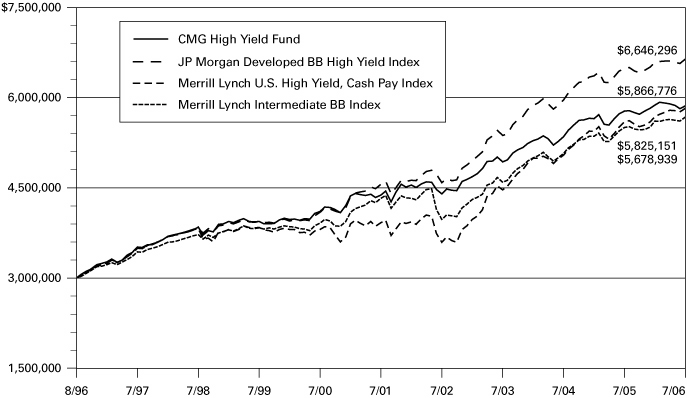
The chart above shows the growth in value of a hypothetical minimum initial $3,000,000 investment in the fund compared to the indices during the stated time period.
In September 2005, the Fund's benchmark was changed to the JPMorgan Chase Developed BB High Yield Index, an index that is designed to mirror the investable universe of the U.S. dollar developed, BB-rated, high yield corporate debt market.
The Merrill Lynch Intermediate BB Index is a market-weighted index, consisting of BB cash pay bonds, which are US dollar denominated bonds issued in the US domestic market with maturities between 1 and 10 years. The Merrill Lynch U.S. High Yield, Cash Pay Index is an index that tracks the performance of non-investment-grade corporate bonds. Unlike the fund, indices are not investments, do not incur fees or expenses and are not professionally managed. It is not possible to invest directly in an index. Securities in the fund may not match those in an index.
Index performance is from August 1, 1996.
15
UNDERSTANDING YOUR EXPENSES – CMG High Yield Fund
As a fund shareholder, you incur two types of costs. There are transaction costs and also ongoing costs, which generally include investment advisory fees and other fund expenses. The information on this page is intended to help you understand your ongoing costs of investing in the fund and to compare these costs with the ongoing costs of investing in other mutual funds.
Analyzing your fund's expenses
To illustrate these ongoing costs, we have provided an example and calculated the expenses paid by investors during the reporting period. The information in the following table is based on an initial investment of $1,000, which is invested at the beginning of the reporting period and held for the entire period. Expense information is calculated two ways and each method provides you with different information. The amount listed in the "actual" column is calculated using the fund's actual operating expenses and total return for the period. The amount listed in the "hypothetical" column assumes that the return each year is 5% before expenses and is calculated based on the fund's actual operating expenses. You should not use the hypothetical account values and expenses to estimate either your actual account balance at the end of the period or the expenses you paid during this reporting period.
Estimating your actual expenses
To estimate the expenses that you paid over the period, first you will need your account balance at the end of the period:
1. Divide your ending account balance by $1,000. For example, if an account balance was $8,600 at the end of the period, the result would be 8.6.
2. In the section of the table below titled "Expenses paid during the period," locate the amount under "actual." Multiply this number by the result from step 1. Your answer is an estimate of the expenses you paid on your account during the period.
February 1, 2006 – July 31, 2006
| Account value at the beginning of the period ($) | Account value at the end of the period ($) | Expenses paid during the period ($) | Fund's annualized expense ratio (%) | ||||||||||||||||||||||||
| Actual | Hypothetical | Actual | Hypothetical | Actual | Hypothetical | Actual | |||||||||||||||||||||
| 1,000.00 | 1,000.00 | 997.42 | 1,022.81 | 1.98 | 2.01 | 0.40 | |||||||||||||||||||||
Expenses paid during the period are equal to the annualized expense ratio of 0.40%, multiplied by the average account value over the period, then multiplied by the number of days in the fund's most recent fiscal half-year and divided by 365.
Had the Investment Advisor not reimbursed a portion of expenses, total return would have been reduced.
It is important to note that the expense amounts shown in the table are meant to highlight only ongoing costs of investing in the fund and do not reflect any transaction costs, such as sales charges, redemption or exchange fees. Therefore, the hypothetical examples provided may not help you determine the relative total costs of owning shares of different funds. If these transaction costs were included, your costs would have been higher.
Compare with other funds
Since all mutual funds are required to include the same hypothetical calculations about expenses in shareholder reports, you can use this information to compare the ongoing cost of investing in the fund with other funds. To do so, compare the 5% hypothetical example with the 5% hypothetical examples that appear in the shareholder reports of other funds. As you compare hypothetical examples of other funds, it is important to note that hypothetical examples are meant to highlight the continuing costs of investing in a fund and do not reflect any transaction costs, such as sales charges or redemption or exchange fees.
16
CMG CORE BOND FUND
A Portfolio of Columbia Funds Institutional Trust
FINANCIAL HIGHLIGHTS
(For a Fund Share Outstanding Throughout Each Period)
| Year Ended July 31, | Period Ended July 31, | Year Ended October 31, | |||||||||||||||||||||||||
| 2006 | 2005 | 2004 | 2003 (a) | 2002 | 2001 | ||||||||||||||||||||||
| Net asset value, beginning of period | $ | 10.42 | $ | 10.36 | $ | 10.38 | $ | 10.52 | $ | 10.83 | $ | 10.02 | |||||||||||||||
| Income from investment operations: | |||||||||||||||||||||||||||
| Net investment income | 0.48 | (b) | 0.42 | (b) | 0.37 | (b) | 0.31 | (b) | 0.56 | (b)(c) | 0.65 | ||||||||||||||||
| Net realized and unrealized gain (loss) on investments and futures contracts | (0.33 | ) | 0.09 | 0.11 | (0.12 | ) | (0.15 | ) (c) | 0.81 | ||||||||||||||||||
| Total from investment operations | 0.15 | 0.51 | 0.48 | 0.19 | 0.41 | 1.46 | |||||||||||||||||||||
| Less distributions declared to shareholders: | |||||||||||||||||||||||||||
| From net investment income | (0.51 | ) | (0.45 | ) | (0.41 | ) | (0.33 | ) | (0.58 | ) | (0.65 | ) | |||||||||||||||
| From net realized gains | (0.01 | ) | - | (0.09 | ) | - | (0.14 | ) | - | (d) | |||||||||||||||||
| Total distributions | (0.52 | ) | (0.45 | ) | (0.50 | ) | (0.33 | ) | (0.72 | ) | (0.65 | ) | |||||||||||||||
| Net asset value, end of period | $ | 10.05 | $ | 10.42 | $ | 10.36 | $ | 10.38 | $ | 10.52 | $ | 10.83 | |||||||||||||||
| Total return (e)(f) | 1.46 | % | 4.98 | % | 4.67 | % | 1.76 | %(g) | 3.97 | % | 15.01 | % | |||||||||||||||
| Ratios/Supplemental data: | |||||||||||||||||||||||||||
| Net assets, end of period (000's) | $ | 56,181 | $ | 79,102 | $ | 32,810 | $ | 30,512 | $ | 27,412 | $ | 28,774 | |||||||||||||||
| Ratio of net expenses to average net assets (h) | 0.25 | % | 0.25 | % | 0.35 | % | 0.40 | %(i) | 0.40 | % | 0.40 | % | |||||||||||||||
| Ratio of investment income to average net assets (h) | 4.65 | % | 4.01 | % | 3.54 | % | 3.95 | %(i) | 5.34 | %(c) | 6.14 | % | |||||||||||||||
| Waiver/reimbursement | 0.10 | % | 0.06 | % | 0.25 | % | 0.29 | %(i) | 0.16 | % | 0.25 | % | |||||||||||||||
| Portfolio turnover rate | 109 | % | 130 | % | 231 | % | 181 | %(g) | 147 | % | 140 | % | |||||||||||||||
(a) The Fund changed its fiscal year end from October 31 to July 31.
(b) Per share data was calculated using average shares outstanding during the period.
(c) Effective November 1, 2001, the Fund adopted the provisions of the AICPA Audit and Accounting Guide for Investment Companies and began amortizing premium and accreting discount on all debt securities. The effect of this change for the year ended October 31, 2002, was to decrease net investment income per share by $0.02, decrease net realized and unrealized loss per share by $0.02 and decrease the ratio of net investment income to average net assets from 5.53% to 5.34%. Per share data and ratios for periods prior to October 31, 2002 have not been restated to reflect this change in presentation.
(d) Rounds to less than $0.01 per share.
(e) Total return at net asset value assuming all distributions reinvested.
(f) Had the Investment Advisor not reimbursed a portion of expenses, total return would have been reduced.
(g) Not annualized.
(h) The benefits derived from custody credits had an impact of less than 0.01%.
(i) Annualized.
See Accompanying Notes to Financial Statements.
17
CMG SHORT TERM BOND FUND
A Portfolio of Columbia Funds Institutional Trust
FINANCIAL HIGHLIGHTS
(For a Fund Share Outstanding Throughout Each Period)
| Year Ended July 31, | Period Ended July 31, | Year Ended October 31, | |||||||||||||||||||||||||
| 2006 | 2005 | 2004 | 2003 (a) | 2002 | 2001 | ||||||||||||||||||||||
| Net asset value, beginning of period | $ | 11.79 | $ | 11.95 | $ | 12.01 | $ | 12.15 | $ | 12.41 | $ | 11.73 | |||||||||||||||
| Income from investment operations: | |||||||||||||||||||||||||||
| Net investment income | 0.50 | (b) | 0.40 | (b) | 0.35 | (b) | 0.34 | (b) | 0.59 | (b)(c) | 0.76 | ||||||||||||||||
| Net realized and unrealized gain (loss) on investments, foreign currency transactions and futures contracts | (0.14 | ) | (0.11 | ) | (0.03 | ) | (0.11 | ) | (0.22 | ) (c) | 0.68 | ||||||||||||||||
| Total from investment operations | 0.36 | 0.29 | 0.32 | 0.23 | 0.37 | 1.44 | |||||||||||||||||||||
| Less distributions declared to shareholders: | |||||||||||||||||||||||||||
| From net investment income | (0.56 | ) | (0.45 | ) | (0.38 | ) | (0.37 | ) | (0.63 | ) | (0.76 | ) | |||||||||||||||
| Net asset value, end of period | $ | 11.59 | $ | 11.79 | $ | 11.95 | $ | 12.01 | $ | 12.15 | $ | 12.41 | |||||||||||||||
| Total return (d)(e) | 3.15 | % | 2.47 | % | 2.72 | % | 1.91 | %(f) | 3.12 | % | 12.62 | % | |||||||||||||||
| Ratios/Supplemental data: | |||||||||||||||||||||||||||
| Net assets, end of period (000's) | $ | 83,984 | $ | 95,842 | $ | 119,125 | $ | 113,193 | $ | 140,757 | $ | 89,791 | |||||||||||||||
| Ratio of net expenses to average net assets (g) | 0.25 | % | 0.25 | % | 0.25 | % | 0.25 | %(h) | 0.25 | % | 0.25 | % | |||||||||||||||
| Ratio of interest expense to average net assets | - | - | - | - | (h)(i) | - | - | ||||||||||||||||||||
| Ratio of net investment income to average net assets (g) | 4.31 | % | 3.38 | % | 2.91 | % | 3.79 | %(h) | 4.73 | %(c) | 6.27 | % | |||||||||||||||
| Waiver/reimbursement | 0.08 | % | 0.04 | % | 0.10 | % | 0.08 | %(h) | 0.05 | % | 0.08 | % | |||||||||||||||
| Portfolio turnover rate | 128 | % | 51 | % | 79 | % | 93 | %(f) | 132 | % | 82 | % | |||||||||||||||
(a) The Fund changed its fiscal year end from October 31 to July 31.
(b) Per share data was calculated using average shares outstanding during the period.
(c) Effective November 1, 2001, the Fund adopted the provisions of the AICPA Audit and Accounting Guide for Investment Companies and began amortizing premium and accreting discount on all debt securities. The effect of this change for the year ended October 31, 2002, was to decrease net investment income per share by $0.04, decrease net realized and unrealized loss per share by $0.04 and decrease the ratio of net investment income to average net assets from 5.08% to 4.73%. Per share data and ratios for periods prior to October 31, 2002 have not been restated to reflect this change in presentation.
(d) Total return at net asset value assuming all distributions reinvested.
(e) Had the Investment Advisor not reimbursed a portion of expenses, total return would have been reduced.
(f) Not annualized.
(g) The benefits derived from custody credits had an impact of less than 0.01%.
(h) Annualized.
(i) Rounds to less than 0.01%.
See Accompanying Notes to Financial Statements.
18
CMG ULTRA SHORT TERM BOND FUND
A Portfolio of Columbia Funds Institutional Trust
FINANCIAL HIGHLIGHTS
(For a Fund Share Outstanding Throughout the Period)
| Year Ended July 31, | Period Ended July 31, | ||||||||||||||
| 2006 | 2005 | 2004 (a) | |||||||||||||
| Net asset value, beginning of period | $ | 9.67 | $ | 9.88 | $ | 10.00 | |||||||||
| Income from investment operations: | |||||||||||||||
| Net investment income (b) | 0.38 | 0.24 | 0.07 | ||||||||||||
| Net realized and unrealized loss on investments | (0.02 | ) | (0.06 | ) | (0.08 | ) | |||||||||
| Total from investment operations | 0.36 | 0.18 | (0.01 | ) | |||||||||||
| Less distributions declared to shareholders: | |||||||||||||||
| From net investment income | (0.41 | ) | (0.36 | ) | (0.11 | ) | |||||||||
| Return of capital | - | (c) | (0.03 | ) | - | ||||||||||
| Total distributions | (0.41 | ) | (0.39 | ) | (0.11 | ) | |||||||||
| Net asset value, end of period | $ | 9.62 | $ | 9.67 | $ | 9.88 | |||||||||
| Total return (d)(e) | 3.84 | % | 1.83 | % | (0.08 | )%(f) | |||||||||
| Ratios/Supplemental data: | |||||||||||||||
| Net assets, end of period (000's) | $ | 89,863 | $ | 81,575 | $ | 67,235 | |||||||||
| Ratio of net expenses to average net assets (g) | 0.25 | % | 0.25 | % | 0.25 | %(h) | |||||||||
| Ratio of net investment income to average net assets (g) | 3.93 | % | 2.44 | % | 1.69 | %(h) | |||||||||
| Waiver/reimbursement | 0.07 | % | 0.05 | % | 0.22 | %(h) | |||||||||
| Portfolio turnover rate | 48 | % | 75 | % | 12 | %(f) | |||||||||
(a) The Fund commenced investment operations on March 8, 2004. Per share data, total return and portfolio turnover reflect activity from that date.
(b) Per share data was calculated using average shares outstanding during the period.
(c) Rounds to less than $0.01 per share.
(d) Total return at net asset value assuming all distributions reinvested.
(e) Had the Investment Advisor not reimbursed a portion of expenses, total return would have been reduced.
(f) Not annualized.
(g) The benefits derived from custody credits had an impact of less than 0.01%.
(h) Annualized.
See Accompanying Notes to Financial Statements.
19
CMG HIGH YIELD FUND
A Portfolio of Columbia Funds Institutional Trust
FINANCIAL HIGHLIGHTS
(For a Fund Share Outstanding Throughout Each Period)
| Year Ended July 31, | Period Ended July 31, | Year Ended October 31, | |||||||||||||||||||||||||
| 2006 | 2005 | 2004 | 2003 (a) | 2002 | 2001 | ||||||||||||||||||||||
| Net asset value, beginning of period | $ | 8.08 | $ | 8.00 | $ | 7.90 | $ | 7.55 | $ | 8.14 | $ | 8.30 | |||||||||||||||
| Income from investment operations: | |||||||||||||||||||||||||||
| Net investment income | 0.50 | (b) | 0.51 | (b) | 0.53 | (b) | 0.43 | (b) | 0.64 | (b)(c) | 0.72 | ||||||||||||||||
| Net realized and unrealized gain (loss) on investments | (0.38 | ) | 0.11 | 0.14 | 0.37 | (0.58 | ) (c) | (0.16 | ) | ||||||||||||||||||
| Total from investment operations | 0.12 | 0.62 | 0.67 | 0.80 | 0.06 | 0.56 | |||||||||||||||||||||
| Less distributions declared to shareholders: | |||||||||||||||||||||||||||
| From net investment income | (0.54 | ) | (0.54 | ) | (0.57 | ) | (0.45 | ) | (0.65 | ) | (0.72 | ) | |||||||||||||||
| Net asset value, end of period | $ | 7.66 | $ | 8.08 | $ | 8.00 | $ | 7.90 | $ | 7.55 | $ | 8.14 | |||||||||||||||
| Total return (d) | 1.47 | %(e) | 7.98 | %(e) | 8.60 | %(e) | 10.67 | %(e)(f) | 0.60 | % | 6.92 | % | |||||||||||||||
| Ratios/Supplemental data: | |||||||||||||||||||||||||||
| Net assets, end of period (000's) | $ | 96,120 | $ | 269,243 | $ | 382,157 | $ | 429,042 | $ | 286,228 | $ | 348,979 | |||||||||||||||
| Ratio of net expenses to average net assets (g) | 0.40 | % | 0.40 | % | 0.40 | % | 0.42 | %(h) | 0.42 | % | 0.44 | % | |||||||||||||||
| Ratio of investment income to average net assets (g) | 6.38 | % | 6.26 | % | 6.64 | % | 7.32 | %(h) | 7.98 | %(c) | 8.63 | % | |||||||||||||||
| Waiver/reimbursement | 0.04 | % | 0.02 | % | 0.02 | % | 0.01 | %(h) | - | - | |||||||||||||||||
| Portfolio turnover rate | 30 | % | 39 | % | 47 | % | 47 | %(f) | 62 | % | 59 | % | |||||||||||||||
(a) The Fund changed its fiscal year end from October 31 to July 31.
(b) Per share data was calculated using average shares outstanding during the period.
(c) Effective November 1, 2001, the Fund adopted the provisions of the AICPA Audit and Accounting Guide for Investment Companies and began amortizing premium and accreting discount on all debt securities. The effect of this change for the year ended October 31, 2002, was to decrease net investment income per share by $0.01, decrease net realized and unrealized loss per share by $0.01 and decrease the ratio of net investment income to average net assets from 8.11% to 7.98%. Per share data and ratios for periods prior to October 31, 2002 have not been restated to reflect this change in presentation.
(d) Total return at net asset value assuming all distributions reinvested.
(e) Had the Investment Advisor not reimbursed a portion of expenses, total return would have been reduced.
(f) Not annualized.
(g) The benefits derived from custody credits had an impact of less than 0.01%.
(h) Annualized.
See Accompanying Notes to Financial Statements.
20
CMG CORE BOND FUND
A Portfolio of Columbia Funds Institutional Trust
SCHEDULE OF INVESTMENTS
July 31, 2006
| Par | Value | ||||||||||
| Corporate Fixed-Income Bonds & Notes (26.0%) | |||||||||||
| Basic Materials (0.3%) | |||||||||||
| Chemicals (0.0%) | |||||||||||
| E.I. Dupont De Nemours & Co. | |||||||||||
| 3.375% 11/15/07 | $ | 5,000 | $ | 4,860 | |||||||
| Praxair, Inc. | |||||||||||
| 6.900% 11/01/06 | 10,000 | 10,033 | |||||||||
| 14,893 | |||||||||||
| Metals & Mining (0.3%) | |||||||||||
| Alcan, Inc. | |||||||||||
| 4.500% 05/15/13 | 175,000 | 161,582 | |||||||||
| 176,475 | |||||||||||
| Communications (3.1%) | |||||||||||
| Media (0.7%) | |||||||||||
| Jones Intercable, Inc. | |||||||||||
| 7.625% 04/15/08 | 200,000 | 206,172 | |||||||||
| Time Warner, Inc. | |||||||||||
| 6.625% 05/15/29 | 200,000 | 193,034 | |||||||||
| 399,206 | |||||||||||
| Telecommunication Services (2.4%) | |||||||||||
| AT&T, Inc. | |||||||||||
| 4.125% 09/15/09 | 200,000 | 191,638 | |||||||||
| BellSouth Corp. | |||||||||||
| 5.000% 10/15/06 | 10,000 | 9,990 | |||||||||
| British Telecommunications PLC | |||||||||||
| 8.375% 12/15/10 | 4,000 | 4,428 | |||||||||
| Sprint Capital Corp. | |||||||||||
| 6.875% 11/15/28 | 200,000 | 202,370 | |||||||||
| Telecom Italia Capital SA | |||||||||||
| 6.200% 07/18/11 | 225,000 | 226,639 | |||||||||
| Telefonica Emisones SAU | |||||||||||
| 5.984% 06/20/11 | 225,000 | 225,991 | |||||||||
| Verizon Global Funding Corp. | |||||||||||
| 7.250% 12/01/10 | 225,000 | 237,770 | |||||||||
| Verizon New England, Inc. | |||||||||||
| 6.500% 09/15/11 | 34,000 | 34,428 | |||||||||
| Vodafone Group PLC | |||||||||||
| 5.000% 12/16/13 | 13,000 | 12,147 | |||||||||
| 7.750% 02/15/10 | 200,000 | 212,509 | |||||||||
| 1,357,910 | |||||||||||
| 1,757,116 | |||||||||||
| Consumer Cyclical (2.4%) | |||||||||||
| Auto Manufacturers (0.3%) | |||||||||||
| DaimlerChrysler NA Holding Corp. | |||||||||||
| 8.500% 01/18/31 | 150,000 | 173,233 | |||||||||
See Accompanying Notes to Financial Statements.
21
CMG CORE BOND FUND
A Portfolio of Columbia Funds Institutional Trust
SCHEDULE OF INVESTMENTS
| Par | Value | ||||||||||
| Corporate Fixed-Income Bonds & Notes (continued) | |||||||||||
| Home Builders (0.4%) | |||||||||||
| D.R. Horton, Inc. | |||||||||||
| 5.625% 09/15/14 | $ | 225,000 | $ | 206,852 | |||||||
| Lodging (0.3%) | |||||||||||
| Harrah's Operating Co., Inc. | |||||||||||
| 5.625% 06/01/15 | 175,000 | 163,259 | |||||||||
| Retail (1.4%) | |||||||||||
| Costco Wholesale Corp. | |||||||||||
| 5.500% 03/15/07 | 6,000 | 5,988 | |||||||||
| Home Depot, Inc. | |||||||||||
| 4.625% 08/15/10 | 300,000 | 291,246 | |||||||||
| Lowe's Companies, Inc. | |||||||||||
| 6.500% 03/15/29 | 175,000 | 183,208 | |||||||||
| Target Corp. | |||||||||||
| 5.375% 06/15/09 | 5,000 | 5,004 | |||||||||
| 5.400% 10/01/08 | 9,000 | 9,006 | |||||||||
| 5.875% 03/01/12 | 6,000 | 6,102 | |||||||||
| Wal-Mart Stores, Inc. | |||||||||||
| 4.000% 01/15/10 | 300,000 | 287,200 | |||||||||
| 4.550% 05/01/13 | 9,000 | 8,506 | |||||||||
| 5.450% 08/01/06 | 4,000 | 4,000 | |||||||||
| 800,260 | |||||||||||
| 1,343,604 | |||||||||||
| Consumer Non-Cyclical (3.0%) | |||||||||||
| Beverages (0.3%) | |||||||||||
| Anheuser-Busch Companies, Inc. | |||||||||||
| 5.750% 04/01/10 | 50,000 | 50,675 | |||||||||
| 5.950% 01/15/33 | 12,000 | 11,858 | |||||||||
| Coca-Cola Co. | |||||||||||
| 5.750% 03/15/11 | 4,000 | 4,050 | |||||||||
| Diageo Capital PLC | |||||||||||
| 3.500% 11/19/07 | 110,000 | 107,164 | |||||||||
| Diageo Finance BV | |||||||||||
| 3.000% 12/15/06 | 19,000 | 18,826 | |||||||||
| PepsiCo, Inc. | |||||||||||
| 5.750% 01/15/08 | 6,000 | 6,025 | |||||||||
| 198,598 | |||||||||||
| Cosmetics/Personal Care (0.2%) | |||||||||||
| Gillette Co. | |||||||||||
| 2.500% 06/01/08 | 85,000 | 80,761 | |||||||||
| Procter & Gamble Co. | |||||||||||
| 4.750% 06/15/07 | 9,000 | 8,947 | |||||||||
| 89,708 | |||||||||||
See Accompanying Notes to Financial Statements.
22
CMG CORE BOND FUND
A Portfolio of Columbia Funds Institutional Trust
SCHEDULE OF INVESTMENTS
| Par | Value | ||||||||||
| Corporate Fixed-Income Bonds & Notes (continued) | |||||||||||
| Food (1.1%) | |||||||||||
| General Mills, Inc. | |||||||||||
| 3.875% 11/30/07 | $ | 250,000 | $ | 244,054 | |||||||
| Kroger Co. | |||||||||||
| 6.200% 06/15/12 | 185,000 | 186,598 | |||||||||
| Safeway, Inc. | |||||||||||
| 4.950% 08/16/10 | 170,000 | 164,795 | |||||||||
| 595,447 | |||||||||||
| Healthcare Products (0.5%) | |||||||||||
| Baxter FinCo BV | |||||||||||
| 4.750% 10/15/10 | 275,000 | 265,252 | |||||||||
| Johnson & Johnson | |||||||||||
| 6.625% 09/01/09 | 7,000 | 7,268 | |||||||||
| 272,520 | |||||||||||
| Healthcare Services (0.5%) | |||||||||||
| UnitedHealth Group, Inc. | |||||||||||
| 3.375% 08/15/07 | 200,000 | 195,489 | |||||||||
| WellPoint, Inc. | |||||||||||
| 6.800% 08/01/12 | 100,000 | 105,204 | |||||||||
| 300,693 | |||||||||||
| Household Products/Wares (0.4%) | |||||||||||
| Fortune Brands, Inc. | |||||||||||
| 2.875% 12/01/06 | 6,000 | 5,943 | |||||||||
| 5.375% 01/15/16 | 250,000 | 233,036 | |||||||||
| Kimberly-Clark Corp. | |||||||||||
| 5.625% 02/15/12 | 7,000 | 7,069 | |||||||||
| 246,048 | |||||||||||
| 1,703,014 | |||||||||||
| Energy (1.8%) | |||||||||||
| Oil & Gas (1.3%) | |||||||||||
| BP Capital Markets PLC | |||||||||||
| 2.750% 12/29/06 | 12,000 | 11,869 | |||||||||
| ChevronTexaco Capital Co. | |||||||||||
| 3.500% 09/17/07 | 211,000 | 206,471 | |||||||||
| Conoco Funding Co. | |||||||||||
| 5.450% 10/15/06 | 119,000 | 118,984 | |||||||||
| Marathon Oil Corp. | |||||||||||
| 6.800% 03/15/32 | 175,000 | 184,655 | |||||||||
| Valero Energy Corp. | |||||||||||
| 6.875% 04/15/12 | 200,000 | 209,657 | |||||||||
| 731,636 | |||||||||||
| Pipelines (0.5%) | |||||||||||
| TransCanada Corp. | |||||||||||
| 5.850% 03/15/36 | 300,000 | 285,816 | |||||||||
| 1,017,452 | |||||||||||
See Accompanying Notes to Financial Statements.
23
CMG CORE BOND FUND
A Portfolio of Columbia Funds Institutional Trust
SCHEDULE OF INVESTMENTS
| Par | Value | ||||||||||
| Corporate Fixed-Income Bonds & Notes (continued) | |||||||||||
| Financials (11.5%) | |||||||||||
| Banks (2.3%) | |||||||||||
| Bank of New York Co., Inc. | |||||||||||
| 3.900% 09/01/07 | $ | 12,000 | $ | 11,791 | |||||||
| Bank One Corp. | |||||||||||
| 6.000% 08/01/08 | 27,000 | 27,257 | |||||||||
| Barclays Bank PLC | |||||||||||
| 7.400% 12/15/09 | 3,000 | 3,174 | |||||||||
| Deutsche Bank Financial, Inc. | |||||||||||
| 6.700% 12/13/06 | 7,000 | 7,027 | |||||||||
| Huntington National Bank | |||||||||||
| 2.750% 10/16/06 | 7,000 | 6,960 | |||||||||
| Mellon Funding Corp. | |||||||||||
| 4.875% 06/15/07 | 8,000 | 7,955 | |||||||||
| National City Bank | |||||||||||
| 4.625% 05/01/13 | 18,000 | 17,082 | |||||||||
| PNC Funding Corp. | |||||||||||
| 5.750% 08/01/06 | 19,000 | 19,000 | |||||||||
| SunTrust Banks, Inc. | |||||||||||
| 6.375% 04/01/11 | 3,000 | 3,096 | |||||||||
| 7.750% 05/01/10 | 10,000 | 10,756 | |||||||||
| U.S. Bank NA | |||||||||||
| 2.850% 11/15/06 | 12,000 | 11,909 | |||||||||
| 6.375% 08/01/11 | 290,000 | 301,199 | |||||||||
| Wachovia Corp. | |||||||||||
| 4.875% 02/15/14 | 400,000 | 378,856 | |||||||||
| Wells Fargo & Co. | |||||||||||
| 3.500% 04/04/08 | 120,000 | 116,225 | |||||||||
| 5.125% 09/01/12 | 400,000 | 388,709 | |||||||||
| 1,310,996 | |||||||||||
| Diversified Financial Services (6.8%) | |||||||||||
| American Express Co. | |||||||||||
| 3.750% 11/20/07 | 5,000 | 4,893 | |||||||||
| 4.750% 06/17/09 | 8,000 | 7,862 | |||||||||
| 5.500% 09/12/06 | 14,000 | 14,002 | |||||||||
| American Express Credit Corp. | |||||||||||
| 3.000% 05/16/08 | 300,000 | 287,681 | |||||||||
| American General Finance Corp. | |||||||||||
| 2.750% 06/15/08 | 5,000 | 4,761 | |||||||||
| 5.375% 09/01/09 | 50,000 | 49,815 | |||||||||
| Associates Corp. of North America | |||||||||||
| 6.950% 11/01/18 | 11,000 | 12,003 | |||||||||
| Bear Stearns Companies, Inc. | |||||||||||
| 4.500% 10/28/10 | 18,000 | 17,301 | |||||||||
| 5.700% 01/15/07 | 9,000 | 9,003 | |||||||||
| Capital One Financial Corp. | |||||||||||
| 5.500% 06/01/15 | 210,000 | 200,947 | |||||||||
| Caterpillar Financial Services Corp. | |||||||||||
| 2.350% 09/15/06 | 9,000 | 8,967 | |||||||||
See Accompanying Notes to Financial Statements.
24
CMG CORE BOND FUND
A Portfolio of Columbia Funds Institutional Trust
SCHEDULE OF INVESTMENTS
| Par | Value | ||||||||||
| Corporate Fixed-Income Bonds & Notes (continued) | |||||||||||
| Diversified Financial Services (continued) | |||||||||||
| CIT Group, Inc. | |||||||||||
| 3.375% 04/01/09 | $ | 23,000 | $ | 21,806 | |||||||
| 7.375% 04/02/07 | 7,000 | 7,085 | |||||||||
| Citigroup Global Markets Holdings, Inc. | |||||||||||
| 6.500% 02/15/08 | 6,000 | 6,093 | |||||||||
| Citigroup, Inc. | |||||||||||
| 5.000% 09/15/14 | 430,000 | 407,748 | |||||||||
| Countrywide Home Loans, Inc. | |||||||||||
| 4.125% 09/15/09 | 250,000 | 239,541 | |||||||||
| 5.500% 08/01/06 | 24,000 | 24,000 | |||||||||
| General Electric Capital Corp. | |||||||||||
| 5.000% 01/08/16 | 500,000 | 474,759 | |||||||||
| 6.750% 03/15/32 | 27,000 | 29,369 | |||||||||
| Goldman Sachs Group, Inc. | |||||||||||
| 4.125% 01/15/08 | 4,000 | 3,928 | |||||||||
| 6.345% 02/15/34 | 325,000 | 310,753 | |||||||||
| HSBC Finance Corp. | |||||||||||
| 5.000% 06/30/15 | 350,000 | 328,290 | |||||||||
| International Lease Finance Corp. | |||||||||||
| 4.500% 05/01/08 | 4,000 | 3,930 | |||||||||
| JPMorgan Chase Capital XV | |||||||||||
| 5.875% 03/15/35 | 325,000 | 295,999 | |||||||||
| Lehman Brothers Holdings, Inc. | |||||||||||
| 4.000% 01/22/08 | 27,000 | 26,436 | |||||||||
| 5.750% 07/18/11 | 225,000 | 225,863 | |||||||||
| Merrill Lynch & Co., Inc. | |||||||||||
| 3.700% 04/21/08 | 8,000 | 7,769 | |||||||||
| 4.125% 01/15/09 | 200,000 | 193,795 | |||||||||
| 6.000% 02/17/09 | 12,000 | 12,135 | |||||||||
| Morgan Stanley | |||||||||||
| 4.750% 04/01/14 | 200,000 | 185,743 | |||||||||
| National Rural Utilities Cooperative Finance Corp. | |||||||||||
| 3.250% 10/01/07 | 6,000 | 5,852 | |||||||||
| SLM Corp. | |||||||||||
| 5.375% 05/15/14 | 400,000 | 387,593 | |||||||||
| 3,815,722 | |||||||||||
| Insurance (1.4%) | |||||||||||
| Allstate Financial Global Funding II | |||||||||||
| 2.625% 10/22/06 (a) | 150,000 | 149,024 | |||||||||
| American International Group, Inc. | |||||||||||
| 2.875% 05/15/08 | 325,000 | 311,346 | |||||||||
| Genworth Financial, Inc. | |||||||||||
| 4.750% 06/15/09 | 200,000 | 196,422 | |||||||||
| Hartford Financial Services Group, Inc. | |||||||||||
| 4.700% 09/01/07 | 100,000 | 98,991 | |||||||||
| John Hancock Financial Services, Inc. | |||||||||||
| 5.625% 12/01/08 | 15,000 | 15,076 | |||||||||
See Accompanying Notes to Financial Statements.
25
CMG CORE BOND FUND
A Portfolio of Columbia Funds Institutional Trust
SCHEDULE OF INVESTMENTS
| Par | Value | ||||||||||
| Corporate Fixed-Income Bonds & Notes (continued) | |||||||||||
| Insurance (continued) | |||||||||||
| Metlife, Inc. | |||||||||||
| 5.375% 12/15/12 | $ | 20,000 | $ | 19,622 | |||||||
| 790,481 | |||||||||||
| Real Estate Investment Trusts (REITs) (0.3%) | |||||||||||
| Health Care Property Investors, Inc. | |||||||||||
| 6.450% 06/25/12 | 150,000 | 153,320 | |||||||||
| Savings & Loans (0.7%) | |||||||||||
| Washington Mutual, Inc. | |||||||||||
| 4.200% 01/15/10 | 400,000 | 382,399 | |||||||||
| 5.625% 01/15/07 | 14,000 | 14,005 | |||||||||
| 396,404 | |||||||||||
| 6,466,923 | |||||||||||
| Industrials (1.3%) | |||||||||||
| Aerospace & Defense (0.5%) | |||||||||||
| Boeing Co. | |||||||||||
| 5.125% 02/15/13 | 1,000 | 977 | |||||||||
| Lockheed Martin Corp. | |||||||||||
| 8.500% 12/01/29 | 160,000 | 204,575 | |||||||||
| United Technologies Corp. | |||||||||||
| 7.125% 11/15/10 | 100,000 | 106,193 | |||||||||
| 311,745 | |||||||||||
| Environmental Control (0.3%) | |||||||||||
| Waste Management, Inc. | |||||||||||
| 7.375% 08/01/10 | 150,000 | 159,082 | |||||||||
| Transportation (0.5%) | |||||||||||
| Canadian National Railway Co. | |||||||||||
| 7.195% 01/02/16 | 74,295 | 82,015 | |||||||||
| Union Pacific Corp. | |||||||||||
| 3.875% 02/15/09 | 185,000 | 178,236 | |||||||||
| 260,251 | |||||||||||
| 731,078 | |||||||||||
| Technology (0.5%) | |||||||||||
| Computers (0.5%) | |||||||||||
| Hewlett-Packard Co. | |||||||||||
| 5.750% 12/15/06 | 18,000 | 18,014 | |||||||||
| International Business Machines Corp. | |||||||||||
| 6.220% 08/01/27 | 250,000 | 253,227 | |||||||||
| 271,241 | |||||||||||
| Utilities (2.1%) | |||||||||||
| Electric (1.9%) | |||||||||||
| American Electric Power Co., Inc. | |||||||||||
| 5.250% 06/01/15 | 225,000 | 212,675 | |||||||||
See Accompanying Notes to Financial Statements.
26
CMG CORE BOND FUND
A Portfolio of Columbia Funds Institutional Trust
SCHEDULE OF INVESTMENTS
| Par | Value | ||||||||||
| Corporate Fixed-Income Bonds & Notes (continued) | |||||||||||
| Electric (continued) | |||||||||||
| CenterPoint Energy Houston Electric LLC | |||||||||||
| 5.750% 01/15/14 | $ | 175,000 | $ | 171,995 | |||||||
| Commonwealth Edison Co. | |||||||||||
| 3.700% 02/01/08 | 11,000 | 10,671 | |||||||||
| Exelon Generation Co. LLC | |||||||||||
| 6.950% 06/15/11 | 175,000 | 183,358 | |||||||||
| FPL Group Capital, Inc. | |||||||||||
| 7.625% 09/15/06 | 3,000 | 3,007 | |||||||||
| MidAmerican Energy Holdings Co. | |||||||||||
| 6.125% 04/01/36 (a) | 225,000 | 216,512 | |||||||||
| Public Service Electric & Gas Co. | |||||||||||
| 4.000% 11/01/08 | 5,000 | 4,837 | |||||||||
| Scottish Power PLC | |||||||||||
| 5.375% 03/15/15 | 250,000 | 239,280 | |||||||||
| Virginia Electric & Power Co. | |||||||||||
| 5.375% 02/01/07 | 6,000 | 5,992 | |||||||||
| 1,048,327 | |||||||||||
| Gas (0.2%) | |||||||||||
| Sempra Energy | |||||||||||
| 4.750% 05/15/09 | 100,000 | 97,819 | |||||||||
| 1,146,146 | |||||||||||
| Total Corporate Fixed-Income Bonds & Notes (Cost of $14,923,524) | 14,613,049 | ||||||||||
| Mortgage-Backed Securities (22.9%) | |||||||||||
| Federal Home Loan Mortgage Corp. | |||||||||||
| 3.500% 10/01/18 | 286,128 | 260,125 | |||||||||
| 4.000% 11/01/20 | 268,723 | 250,022 | |||||||||
| 5.500% 11/01/17 | 103,562 | 102,702 | |||||||||
| 5.500% 03/01/18 | 85,490 | 84,780 | |||||||||
| 5.500% 03/01/21 | 454,905 | 449,807 | |||||||||
| 5.500% 07/01/21 | 989,000 | 977,915 | |||||||||
| 5.500% 08/01/35 | 1,575,904 | 1,531,875 | |||||||||
| 6.000% 05/01/17 | 158,401 | 159,549 | |||||||||
| TBA, | |||||||||||
| 5.500% 08/01/16 (b) | 2,455,000 | 2,426,615 | |||||||||
| Federal National Mortgage Association | |||||||||||
| 5.000% 11/01/34 | 461,141 | 437,883 | |||||||||
| 5.000% 12/01/34 | 245,002 | 232,646 | |||||||||
| 5.000% 09/01/35 | 603,790 | 571,741 | |||||||||
| 5.500% 08/01/35 | 366,595 | 356,260 | |||||||||
| 5.500% 09/01/35 | 485,342 | 471,659 | |||||||||
| 5.500% 10/01/35 | 943,800 | 917,191 | |||||||||
| 5.500% 11/01/35 | 1,810,018 | 1,758,988 | |||||||||
| 5.500% 04/01/36 | 918,683 | 892,235 | |||||||||
| 6.500% 02/01/13 | 16,292 | 16,533 | |||||||||
| 6.500% 08/01/34 | 81,828 | 82,883 | |||||||||
| 7.000% 07/01/32 | 24,738 | 25,406 | |||||||||
See Accompanying Notes to Financial Statements.
27
CMG CORE BOND FUND
A Portfolio of Columbia Funds Institutional Trust
SCHEDULE OF INVESTMENTS
| Par | Value | ||||||||||
| Mortgage-Backed Securities (continued) | |||||||||||
| TBA, | |||||||||||
| 5.500% 08/01/21 (b) | $ | 818,000 | $ | 809,053 | |||||||
| Government National Mortgage Association | |||||||||||
| 7.000% 01/15/32 | 9,348 | 9,647 | |||||||||
| 7.000% 03/15/32 | 29,482 | 30,423 | |||||||||
| 7.000% 06/15/32 | 5,131 | 5,295 | |||||||||
| Total Mortgage-Backed Securities (Cost of $13,028,071) | 12,861,233 | ||||||||||
| Collateralized Mortgage Obligations (21.7%) | |||||||||||
| Agency (12.6%) | |||||||||||
| Federal Home Loan Mortgage Corp. | |||||||||||
| 3.750% 12/15/11 | 72,479 | 69,624 | |||||||||
| 4.000% 07/15/14 | 953,270 | 931,167 | |||||||||
| 4.000% 09/15/15 | 510,000 | 490,846 | |||||||||
| 4.500% 03/15/18 | 1,580,000 | 1,520,238 | |||||||||
| 4.500% 10/15/18 | 389,477 | 381,800 | |||||||||
| 4.500% 02/15/27 | 900,000 | 872,336 | |||||||||
| 6.500% 10/15/23 | 100,000 | 102,496 | |||||||||
| Federal National Mortgage Association | |||||||||||
| 4.500% 11/25/14 | 900,000 | 877,631 | |||||||||
| 6.000% 04/25/32 | 600,000 | 602,348 | |||||||||
| Government National Mortgage Association | |||||||||||
| 4.430% 04/16/34 | 90,000 | 85,588 | |||||||||
| 4.500% 04/16/28 | 1,000,000 | 970,765 | |||||||||
| 4.807% 08/16/32 | 90,000 | 86,387 | |||||||||
| 4.954% 05/16/31 | 100,000 | 94,335 | |||||||||
| 7,085,561 | |||||||||||
| Non-Agency (9.1%) | |||||||||||
| Bear Stearns Asset Backed Securities, Inc. | |||||||||||
| 5.000% 01/25/34 | 274,035 | 264,645 | |||||||||
| Countrywide Alternative Loan Trust | |||||||||||
| 5.250% 03/25/35 | 890,305 | 875,056 | |||||||||
| 5.250% 08/25/35 | 771,808 | 766,689 | |||||||||
| 5.500% 10/25/35 | 746,990 | 740,248 | |||||||||
| Countrywide Home Loan Mortgage Pass Through Trust | |||||||||||
| 4.594% 12/19/33 (c) | 244,153 | 232,991 | |||||||||
| Structured Asset Securities Corp. | |||||||||||
| 5.500% 07/25/33 | 1,039,470 | 1,026,778 | |||||||||
| Washington Mutual Mortgage Securities Corp. | |||||||||||
| 5.500% 10/25/35 | 1,200,000 | 1,192,627 | |||||||||
| 5,099,034 | |||||||||||
| Total Collateralized Mortgage Obligations (Cost of $12,503,890) | 12,184,595 | ||||||||||
See Accompanying Notes to Financial Statements.
28
CMG CORE BOND FUND
A Portfolio of Columbia Funds Institutional Trust
SCHEDULE OF INVESTMENTS
| Par | Value | ||||||||||
| Government & Agency Obligations (19.5%) | |||||||||||
| Foreign Government Obligations (1.6%) | |||||||||||
| Hellenic Republic of Greece | |||||||||||
| 6.950% 03/04/08 | $ | 13,000 | $ | 13,322 | |||||||
| Province of Ontario | |||||||||||
| 3.500% 09/17/07 | 350,000 | 342,822 | |||||||||
| Province of Quebec | |||||||||||
| 5.000% 07/17/09 | 350,000 | 347,106 | |||||||||
| Republic of Italy | |||||||||||
| 2.750% 12/15/06 | 10,000 | 9,903 | |||||||||
| United Mexican States | |||||||||||
| 7.500% 04/08/33 | 205,000 | 227,755 | |||||||||
| 940,908 | |||||||||||
| U.S. Government Agencies (5.6%) | |||||||||||
| Federal Home Loan Bank | |||||||||||
| 4.375% 09/11/09 | 1,210,000 | 1,181,865 | |||||||||
| 4.875% 05/15/07 | 25,000 | 24,890 | |||||||||
| Federal Home Loan Mortgage Corp. | |||||||||||
| 4.875% 11/15/13 | 130,000 | 126,335 | |||||||||
| 5.500% 07/18/16 | 525,000 | 529,010 | |||||||||
| Federal National Mortgage Association | |||||||||||
| 3.375% 12/15/08 | 25,000 | 23,974 | |||||||||
| 4.625% 10/15/14 | 34,000 | 32,351 | |||||||||
| 5.250% 08/01/12 | 1,250,000 | 1,233,583 | |||||||||
| 3,152,008 | |||||||||||
| U.S. Government Obligations (12.3%) | |||||||||||
| U.S. Treasury Bonds | |||||||||||
| 6.250% 08/15/23 | 2,730,000 | 3,056,961 | |||||||||
| 7.250% 05/15/16 | 1,305,000 | 1,527,666 | |||||||||
| U.S. Treasury Inflation Index Notes | |||||||||||
| 3.875% 01/15/09 | 901,229 | 932,912 | |||||||||
| U.S. Treasury Notes | |||||||||||
| 3.875% 02/15/13 | 1,475,000 | 1,388,747 | |||||||||
| 6,906,286 | |||||||||||
| Total Government & Agency Obligations (Cost of $11,202,231) | 10,999,202 | ||||||||||
| Commercial Mortgage-Backed Securities (5.4%) | |||||||||||
| Asset Securitization Corp. | |||||||||||
| 7.400% 10/13/26 | 253,525 | 256,618 | |||||||||
| Bear Stearns Commercial Mortgage Securities | |||||||||||
| 4.680% 08/13/39 | 30,000 | 28,419 | |||||||||
| 5.625% 03/11/39 (c) | 730,000 | 719,446 | |||||||||
| CS First Boston Mortgage Securities Corp. | |||||||||||
| 4.512% 07/15/37 | 500,000 | 483,160 | |||||||||
| Greenwich Capital Commercial Funding Corp. | |||||||||||
| 5.479% 04/10/37 (c) | 100,000 | 97,013 | |||||||||
| LB-UBS Commercial Mortgage Trust | |||||||||||
| 5.103% 11/15/30 | 600,000 | 590,944 | |||||||||
| Merrill Lynch Mortgage Trust | |||||||||||
| 5.417% 11/12/37 (c) | 720,000 | 699,476 | |||||||||
See Accompanying Notes to Financial Statements.
29
CMG CORE BOND FUND
A Portfolio of Columbia Funds Institutional Trust
SCHEDULE OF INVESTMENTS
| Par | Value | ||||||||||
| Commercial Mortgage-Backed Securities (continued) | |||||||||||
| Morgan Stanley Capital I | |||||||||||
| 4.970% 12/15/41 | $ | 71,000 | $ | 68,079 | |||||||
| Nationslink Funding Corp. | |||||||||||
| 6.888% 11/10/30 (d) | 90,000 | 90,518 | |||||||||
| Total Commercial Mortgage-Backed Securities (Cost of $3,107,811) | 3,033,673 | ||||||||||
| Asset-Backed Securities (2.1%) | |||||||||||
| ABFS Mortgage Loan Trust | |||||||||||
| 4.428% 12/15/33 | 152,268 | 147,591 | |||||||||
| AmeriCredit Automobile Receivables Trust | |||||||||||
| 2.070% 08/06/08 | 9,776 | 9,748 | |||||||||
| 4.870% 12/06/10 | 250,000 | 247,908 | |||||||||
| BMW Vehicle Owner Trust | |||||||||||
| 3.320% 02/25/09 | 51,000 | 50,027 | |||||||||
| Capital One Multi-Asset Execution Trust | |||||||||||
| 4.050% 03/15/13 | 250,000 | 239,362 | |||||||||
| Ford Credit Auto Owner Trust | |||||||||||
| 3.540% 11/15/08 | 116,000 | 113,700 | |||||||||
| Honda Auto Receivables Owner Trust | |||||||||||
| 3.060% 10/21/09 | 59,000 | 57,658 | |||||||||
| Household Automotive Trust | |||||||||||
| 2.310% 04/17/08 | 500 | 499 | |||||||||
| IMC Home Equity Loan Trust | |||||||||||
| 7.310% 11/20/28 | 62,899 | 62,687 | |||||||||
| 7.520% 08/20/28 | 34,617 | 34,510 | |||||||||
| Nissan Auto Receivables Owner Trust | |||||||||||
| 2.700% 12/17/07 | 12,665 | 12,590 | |||||||||
| Onyx Acceptance Grantor Trust | |||||||||||
| 3.890% 02/15/11 | 135,000 | 132,698 | |||||||||
| Volkswagen Auto Loan Enhanced Trust | |||||||||||
| 2.270% 10/22/07 | 5,572 | 5,560 | |||||||||
| Wilshire Mortgage Loan Trust | |||||||||||
| 7.255% 05/25/28 | 57,783 | 57,559 | |||||||||
| Total Asset-Backed Securities (Cost of $1,186,595) | 1,172,097 | ||||||||||
| Short-Term Obligation (7.5%) | |||||||||||
| Repurchase agreement with State Street Bank & Trust Co., dated 07/31/06, due 08/01/06 at 5.160%, collateralized by a U.S. Treasury Note maturing 02/28/11, market value of $4,295,363 (repurchase proceeds $4,210,603) | 4,210,000 | 4,210,000 | |||||||||
| Total Short-Term Obligation (Cost of $4,210,000) | 4,210,000 | ||||||||||
| Total Investments (105.1%) (Cost of $60,162,122) (e) | 59,073,849 | ||||||||||
| Other Assets & Liabilities, Net (-5.1%) | (2,892,745 | ) | |||||||||
| Net Assets (100.0%) | $ | 56,181,104 | |||||||||
See Accompanying Notes to Financial Statements.
30
CMG CORE BOND FUND
A Portfolio of Columbia Funds Institutional Trust
SCHEDULE OF INVESTMENTS
Notes to Schedule of Investments:
(a) Security exempt from registration pursuant to Rule 144A under the Securities Act of 1933. These securities may be resold in transactions exempt from registration, normally to qualified institutional buyers. At July 31, 2006, these securities, which are not illiquid, amounted to $365,536, which represents 0.7% of net assets.
(b) Security purchased on a delayed delivery basis.
(c) The interest rate shown on floating rate or variable rate securities reflects the rate at July 31, 2006.
(d) Investments in affiliates during the year ended July 31, 2006:
Security name: Nationslink Funding Corp., 6.888%, 11/10/30
| Par as of 07/31/05: | $ | 90,000 | |||||
| Par purchased: | $ | - | |||||
| Par sold: | $ | - | |||||
| Par as of 07/31/06: | $ | 90,000 | |||||
| Net realized gain/loss: | $ | - | |||||
| Interest income earned: | $ | 6,199 | |||||
| Value at end of period: | $ | 90,518 | |||||
(e) Cost for federal income tax purposes is $60,360,861.
At July 31, 2006, the asset allocation of the Fund is as follows:
Asset Allocation (Unaudited) | % of Net Assets | ||||||
| Corporate Fixed-Income Bonds & Notes | 26.0 | % | |||||
| Mortgage-Backed Securities | 22.9 | ||||||
| Collateralized Mortgage Obligations | 21.7 | ||||||
| Government & Agency Obligations | 19.5 | ||||||
| Commercial Mortgage-Backed Securities | 5.4 | ||||||
| Asset-Backed Securities | 2.1 | ||||||
| Short-Term Obligation | 7.5 | ||||||
| Other Assets & Liabilities, Net | (5.1 | ) | |||||
| 100.0 | % | ||||||
| Acronym | Name | ||||||
| TBA | To Be Announced | ||||||
See Accompanying Notes to Financial Statements.
31
CMG SHORT TERM BOND FUND
A Portfolio of Columbia Funds Institutional Trust
SCHEDULE OF INVESTMENTS
July 31, 2006
| Par | Value | ||||||||||
| Corporate Fixed-Income Bonds & Notes (32.1%) | |||||||||||
| Communications (3.1%) | |||||||||||
| Media (0.6%) | |||||||||||
| Jones Intercable, Inc. | |||||||||||
| 7.625% 04/15/08 | $ | 110,000 | $ | 113,395 | |||||||
| Time Warner, Inc. | |||||||||||
| 6.150% 05/01/07 | 375,000 | 376,642 | |||||||||
| 490,037 | |||||||||||
| Telecommunication Services (2.5%) | |||||||||||
| Deutsche Telekom International Finance BV | |||||||||||
| 8.000% 06/15/10 | 250,000 | 269,793 | |||||||||
| New Cingular Wireless Services, Inc. | |||||||||||
| 7.500% 05/01/07 | 300,000 | 304,090 | |||||||||
| SBC Communications, Inc. | |||||||||||
| 4.125% 09/15/09 | 350,000 | 335,365 | |||||||||
| Sprint Capital Corp. | |||||||||||
| 6.375% 05/01/09 | 245,000 | 249,842 | |||||||||
| Verizon Global Funding Corp. | |||||||||||
| 7.600% 03/15/07 | 575,000 | 581,790 | |||||||||
| Vodafone Group PLC | |||||||||||
| 7.750% 02/15/10 | 350,000 | 371,891 | |||||||||
| 2,112,771 | |||||||||||
| 2,602,808 | |||||||||||
| Consumer Cyclical (2.0%) | |||||||||||
| Auto Manufacturers (0.2%) | |||||||||||
| DaimlerChrysler NA Holding Corp. | |||||||||||
| 4.750% 01/15/08 | 200,000 | 197,116 | |||||||||
| Home Builders (0.3%) | |||||||||||
| DR Horton, Inc. | |||||||||||
| 4.875% 01/15/10 | 275,000 | 262,598 | |||||||||
| Retail (1.5%) | |||||||||||
| Costco Wholesale Corp. | |||||||||||
| 5.500% 03/15/07 | 275,000 | 274,455 | |||||||||
| Home Depot, Inc. | |||||||||||
| 3.750% 09/15/09 | 600,000 | 573,367 | |||||||||
| Wal-Mart Stores, Inc. | |||||||||||
| 6.875% 08/10/09 | 350,000 | 364,332 | |||||||||
| 1,212,154 | |||||||||||
| 1,671,868 | |||||||||||
| Consumer Non-Cyclical (4.3%) | |||||||||||
| Beverages (1.3%) | |||||||||||
| Bottling Group LLC | |||||||||||
| 2.450% 10/16/06 | 375,000 | 372,713 | |||||||||
| Coca-Cola Enterprises, Inc. | |||||||||||
| 5.750% 11/01/08 | 325,000 | 327,413 | |||||||||
| Diageo Capital PLC | |||||||||||
| 3.375% 03/20/08 | 400,000 | 386,768 | |||||||||
| 1,086,894 | |||||||||||
See Accompanying Notes to Financial Statements.
32
CMG SHORT TERM BOND FUND
A Portfolio of Columbia Funds Institutional Trust
SCHEDULE OF INVESTMENTS
| Par | Value | ||||||||||
| Corporate Fixed-Income Bonds & Notes (continued) | |||||||||||
| Cosmetics/Personal Care (0.5%) | |||||||||||
| Procter & Gamble Co. | |||||||||||
| 4.750% 06/15/07 | $ | 410,000 | $ | 407,579 | |||||||
| Food (1.1%) | |||||||||||
| Fred Meyer, Inc. | |||||||||||
| 7.450% 03/01/08 | 275,000 | 282,043 | |||||||||
| General Mills, Inc. | |||||||||||
| 3.875% 11/30/07 | 400,000 | 390,487 | |||||||||
| Safeway, Inc. | |||||||||||
| 4.950% 08/16/10 | 280,000 | 271,427 | |||||||||
| 943,957 | |||||||||||
| Healthcare Products (0.3%) | |||||||||||
| Baxter FinCo BV | |||||||||||
| 4.750% 10/15/10 | 250,000 | 241,138 | |||||||||
| Healthcare Services (0.7%) | |||||||||||
| UnitedHealth Group, Inc. | |||||||||||
| 3.375% 08/15/07 | 350,000 | 342,106 | |||||||||
| WellPoint, Inc. | |||||||||||
| 3.500% 09/01/07 | 300,000 | 292,391 | |||||||||
| 634,497 | |||||||||||
| Household Products/Wares (0.4%) | |||||||||||
| Fortune Brands, Inc. | |||||||||||
| 5.125% 01/15/11 | 325,000 | 314,764 | |||||||||
| 3,628,829 | |||||||||||
| Energy (1.8%) | |||||||||||
| Oil & Gas (1.8%) | |||||||||||
| ChevronTexaco Capital Co. | |||||||||||
| 3.500% 09/17/07 | 725,000 | 709,439 | |||||||||
| Devon Energy Corp. | |||||||||||
| 2.750% 08/01/06 | 400,000 | 400,000 | |||||||||
| Marathon Oil Corp. | |||||||||||
| 5.375% 06/01/07 | 350,000 | 349,257 | |||||||||
| 1,458,696 | |||||||||||
| Financials (15.9%) | |||||||||||
| Banks (3.5%) | |||||||||||
| Fifth Third Bank | |||||||||||
| 2.700% 01/30/07 | 486,000 | 479,597 | |||||||||
| Marshall & Ilsley Corp. | |||||||||||
| 4.375% 08/01/09 | 425,000 | 412,194 | |||||||||
| U.S. Bancorp | |||||||||||
| 3.125% 03/15/08 | 850,000 | 820,093 | |||||||||
| Wachovia Corp. | |||||||||||
| 3.500% 08/15/08 | 600,000 | 578,036 | |||||||||
| Wells Fargo & Co. | |||||||||||
| 3.120% 08/15/08 | 700,000 | 670,410 | |||||||||
| 2,960,330 | |||||||||||
See Accompanying Notes to Financial Statements.
33
CMG SHORT TERM BOND FUND
A Portfolio of Columbia Funds Institutional Trust
SCHEDULE OF INVESTMENTS
| Par | Value | ||||||||||
| Corporate Fixed-Income Bonds & Notes (continued) | |||||||||||
| Diversified Financial Services (9.1%) | |||||||||||
| American Express Credit Corp. | |||||||||||
| 3.000% 05/16/08 | $ | 700,000 | $ | 671,257 | |||||||
| Bear Stearns Companies, Inc. | |||||||||||
| 3.250% 03/25/09 | 375,000 | 354,786 | |||||||||
| Capital One Bank | |||||||||||
| 4.875% 05/15/08 | 150,000 | 148,389 | |||||||||
| CIT Group, Inc. | |||||||||||
| 5.500% 11/30/07 | 350,000 | 349,455 | |||||||||
| Citigroup, Inc. | |||||||||||
| 4.250% 07/29/09 | 850,000 | 823,128 | |||||||||
| Countrywide Home Loans, Inc. | |||||||||||
| 4.125% 09/15/09 | 400,000 | 383,265 | |||||||||
| Credit Suisse First Boston USA, Inc. | |||||||||||
| 4.625% 01/15/08 | 375,000 | 370,828 | |||||||||
| General Electric Capital Corp. | |||||||||||
| 4.250% 01/15/08 | 1,000,000 | 983,771 | |||||||||
| Goldman Sachs Group, Inc. | |||||||||||
| 4.125% 01/15/08 | 400,000 | 392,770 | |||||||||
| HSBC Finance Corp. | |||||||||||
| 6.400% 06/17/08 | 650,000 | 660,479 | |||||||||
| JPMorgan Chase & Co. | |||||||||||
| 3.800% 10/02/09 | 550,000 | 524,380 | |||||||||
| Lehman Brothers Holdings, Inc. | |||||||||||
| 7.000% 02/01/08 | 375,000 | 382,491 | |||||||||
| Merrill Lynch & Co., Inc. | |||||||||||
| 4.125% 01/15/09 | 325,000 | 314,917 | |||||||||
| Morgan Stanley | |||||||||||
| 3.875% 01/15/09 | 475,000 | 458,444 | |||||||||
| Pitney Bowes Credit Corp. | |||||||||||
| 5.750% 08/15/08 | 250,000 | 251,562 | |||||||||
| USA Education, Inc. | |||||||||||
| 5.625% 04/10/07 | 600,000 | 599,833 | |||||||||
| 7,669,755 | |||||||||||
| Insurance (1.6%) | |||||||||||
| Allstate Financial Global Funding II | |||||||||||
| 2.625% 10/22/06 (a) | 350,000 | 347,722 | |||||||||
| American International Group, Inc. | |||||||||||
| 2.875% 05/15/08 | 700,000 | 670,592 | |||||||||
| Genworth Financial, Inc. | |||||||||||
| 4.750% 06/15/09 | 350,000 | 343,738 | |||||||||
| 1,362,052 | |||||||||||
| Real Estate Investment Trusts (REITs) (0.5%) | |||||||||||
| American Health Properties | |||||||||||
| 7.500% 01/15/07 | 400,000 | 403,431 | |||||||||
| Savings & Loans (1.2%) | |||||||||||
| Washington Mutual, Inc. | |||||||||||
| 4.000% 01/15/09 | 450,000 | 434,199 | |||||||||
See Accompanying Notes to Financial Statements.
34
CMG SHORT TERM BOND FUND
A Portfolio of Columbia Funds Institutional Trust
SCHEDULE OF INVESTMENTS
| Par | Value | ||||||||||
| Corporate Fixed-Income Bonds & Notes (continued) | |||||||||||
| Savings & Loans (continued) | |||||||||||
| World Savings Bank | |||||||||||
| 4.125% 03/10/08 | $ | 550,000 | $ | 538,292 | |||||||
| 972,491 | |||||||||||
| 13,368,059 | |||||||||||
| Industrials (2.8%) | |||||||||||
| Aerospace & Defense (0.9%) | |||||||||||
| Boeing Co. | |||||||||||
| 8.100% 11/15/06 | 375,000 | 377,501 | |||||||||
| United Technologies Corp. | |||||||||||
| 4.875% 11/01/06 | 400,000 | 399,345 | |||||||||
| 776,846 | |||||||||||
| Environmental Control (0.4%) | |||||||||||
| USA Waste Services, Inc. | |||||||||||
| 7.125% 10/01/07 | 300,000 | 304,242 | |||||||||
| Machinery (0.8%) | |||||||||||
| Caterpillar Financial Services Corp. | |||||||||||
| 3.625% 11/15/07 | 425,000 | 414,991 | |||||||||
| John Deere Capital Corp. | |||||||||||
| 4.625% 04/15/09 | 300,000 | 293,560 | |||||||||
| 708,551 | |||||||||||
| Transportation (0.7%) | |||||||||||
| CSX Corp. | |||||||||||
| 6.750% 03/15/11 | 225,000 | 235,009 | |||||||||
| Union Pacific Corp. | |||||||||||
| 3.875% 02/15/09 | 325,000 | 313,117 | |||||||||
| 548,126 | |||||||||||
| 2,337,765 | |||||||||||
| Technology (0.4%) | |||||||||||
| Computers (0.4%) | |||||||||||
| International Business Machines Corp. | |||||||||||
| 3.800% 02/01/08 | 375,000 | 366,183 | |||||||||
| Utilities (1.8%) | |||||||||||
| Electric (1.5%) | |||||||||||
| American Electric Power Co., Inc. | |||||||||||
| 5.375% 03/15/10 | 275,000 | 272,388 | |||||||||
| Exelon Generation Co. LLC | |||||||||||
| 6.950% 06/15/11 | 350,000 | 366,716 | |||||||||
| Scottish Power PLC | |||||||||||
| 4.910% 03/15/10 | 275,000 | 267,562 | |||||||||
| Virginia Electric & Power Co. | |||||||||||
| 5.375% 02/01/07 | 325,000 | 324,541 | |||||||||
| 1,231,207 | |||||||||||
See Accompanying Notes to Financial Statements.
35
CMG SHORT TERM BOND FUND
A Portfolio of Columbia Funds Institutional Trust
SCHEDULE OF INVESTMENTS
| Par | Value | ||||||||||
| Corporate Fixed-Income Bonds & Notes (continued) | |||||||||||
| Gas (0.3%) | |||||||||||
| Sempra Energy | |||||||||||
| 4.750% 05/15/09 | $ | 250,000 | $ | 244,548 | |||||||
| 1,475,755 | |||||||||||
| Total Corporate Fixed-Income Bonds & Notes (Cost of $27,219,742) | 26,909,963 | ||||||||||
| Collateralized Mortgage Obligations (18.1%) | |||||||||||
| Agency (8.3%) | |||||||||||
| Federal Home Loan Mortgage Corp. | |||||||||||
| 4.000% 09/15/15 | 640,000 | 622,050 | |||||||||
| 4.500% 02/15/15 | 1,300,000 | 1,278,045 | |||||||||
| 5.000% 06/15/24 | 1,143,969 | 1,133,929 | |||||||||
| 5.000% 05/15/26 | 287,962 | 285,169 | |||||||||
| 5.500% 11/15/27 | 964,449 | 961,666 | |||||||||
| 6.000% 06/15/25 | 1,200,000 | 1,211,054 | |||||||||
| Federal National Mortgage Association | |||||||||||
| 6.000% 06/25/27 | 1,493,404 | 1,502,626 | |||||||||
| 6,994,539 | |||||||||||
| Non-Agency (9.8%) | |||||||||||
| Bear Stearns Adjustable Rate Mortgage Trust | |||||||||||
| 3.514% 06/25/34 (b) | 1,000,000 | 956,864 | |||||||||
| Bear Stearns Asset Backed Securities, Inc. | |||||||||||
| 5.000% 01/25/34 | 890,142 | 859,639 | |||||||||
| Countrywide Alternative Loan Trust | |||||||||||
| 5.250% 08/25/35 | 1,157,712 | 1,150,034 | |||||||||
| 5.500% 02/25/36 | 2,565,616 | 2,532,142 | |||||||||
| Countrywide Home Loan Mortgage Pass Through Trust | |||||||||||
| 5.000% 02/25/33 | 1,300,000 | 1,282,179 | |||||||||
| IMPAC CMB Trust | |||||||||||
| 6.145% 12/25/33 (b) | 186,385 | 186,464 | |||||||||
| PNC Mortgage Securities Corp. | |||||||||||
| 0.000% 04/28/27 (a)(b) | 6,739 | 6,099 | |||||||||
| Residential Accredit Loans, Inc. | |||||||||||
| 5.750% 01/25/36 | 362,621 | 361,947 | |||||||||
| SACO I, Inc. | |||||||||||
| 7.000% 08/25/36 (a) | 153,841 | 152,398 | |||||||||
| Structured Asset Securities Corp. | |||||||||||
| 5.750% 04/25/33 | 731,712 | 718,826 | |||||||||
| 8,206,592 | |||||||||||
| Total Collateralized Mortgage Obligations (Cost of $15,321,388) | 15,201,131 | ||||||||||
| Asset-Backed Securities (17.8%) | |||||||||||
| Americredit Automobile Receivables Trust | |||||||||||
| 4.050% 02/06/10 | 400,000 | 395,542 | |||||||||
| Bear Stearns Asset Backed Securities, Inc. | |||||||||||
| 5.495% 06/25/35 (b) | 210,525 | 210,544 | |||||||||
See Accompanying Notes to Financial Statements.
36
CMG SHORT TERM BOND FUND
A Portfolio of Columbia Funds Institutional Trust
SCHEDULE OF INVESTMENTS
| Par | Value | ||||||||||
| Asset-Backed Securities (continued) | |||||||||||
| Capital Auto Receivables Asset Trust | |||||||||||
| 3.580% 01/15/09 | $ | 2,000,000 | $ | 1,962,190 | |||||||
| Citigroup Mortgage Loan Trust, Inc. | |||||||||||
| 5.595% 02/25/35 (b) | 759,082 | 759,740 | |||||||||
| Cityscape Home Equity Loan Trust | |||||||||||
| 7.410% 05/25/28 | 63,597 | 63,340 | |||||||||
| 7.650% 09/25/25 | 254,084 | 253,099 | |||||||||
| Countrywide Asset-Backed Certificates | |||||||||||
| 5.665% 09/25/33 (b) | 790,449 | 790,909 | |||||||||
| Harley-Davidson Motorcycle Trust | |||||||||||
| 2.760% 05/15/11 | 925,674 | 908,993 | |||||||||
| Home Equity Mortgage Trust | |||||||||||
| 5.472% 09/25/36 (b) | 389,183 | 388,754 | |||||||||
| IMC Home Equity Loan Trust | |||||||||||
| 7.500% 04/25/26 | 323,138 | 322,058 | |||||||||
| 7.520% 08/20/28 | 82,549 | 82,293 | |||||||||
| KeyCorp Student Loan Trust | |||||||||||
| 5.758% 08/27/25 (b) | 816,775 | 819,081 | |||||||||
| 5.988% 01/27/23 (a)(b) | 750,256 | 754,473 | |||||||||
| Long Beach Auto Receivables Trust | |||||||||||
| 4.050% 04/15/11 | 1,700,000 | 1,670,367 | |||||||||
| Mastr Asset Backed Securities Trust | |||||||||||
| 5.435% 03/25/36 (b) | 1,761,642 | 1,761,763 | |||||||||
| 5.535% 11/25/35 (b) | 761,187 | 761,346 | |||||||||
| Navistar Financial Corp. Owner Trust | |||||||||||
| 3.250% 10/15/10 | 1,000,000 | 974,703 | |||||||||
| Novastar Home Equity Loan | |||||||||||
| 5.515% 01/25/36 (b) | 292,716 | 292,748 | |||||||||
| SACO I, Inc. | |||||||||||
| 5.585% 04/25/35 (a)(b) | 535,896 | 535,819 | |||||||||
| UCFC Home Equity Loan | |||||||||||
| 6.315% 04/15/30 | 294,833 | 294,533 | |||||||||
| WFS Financial Owner Trust | |||||||||||
| 2.810% 08/22/11 | 1,000,000 | 977,851 | |||||||||
| Total Asset-Backed Securities (Cost of $14,971,265) | 14,980,146 | ||||||||||
| Mortgage-Backed Securities (11.4%) | |||||||||||
| Federal Home Loan Mortgage Corp. | |||||||||||
| 4.000% 05/01/11 | 1,494,680 | 1,433,680 | |||||||||
| 4.500% 11/01/07 | 487,638 | 481,284 | |||||||||
| 4.500% 03/01/21 | 1,758,283 | 1,675,089 | |||||||||
| 5.500% 07/01/19 | 1,456,921 | 1,442,892 | |||||||||
| 5.500% 01/01/21 | 773,001 | 764,602 | |||||||||
| 5.500% 07/01/21 | 123,000 | 121,621 | |||||||||
| TBA, | |||||||||||
| 5.500% 08/17/21 (c) | 1,360,000 | 1,344,276 | |||||||||
See Accompanying Notes to Financial Statements.
37
CMG SHORT TERM BOND FUND
A Portfolio of Columbia Funds Institutional Trust
SCHEDULE OF INVESTMENTS
| Par | Value | ||||||||||
| Mortgage-Backed Securities (continued) | |||||||||||
| Federal National Mortgage Association | |||||||||||
| 6.000% 03/01/09 | $ | 22,562 | $ | 22,418 | |||||||
| 6.000% 05/01/09 | 244,326 | 242,762 | |||||||||
| TBA: | |||||||||||
| 5.500% 08/17/21 (c) | 453,000 | 448,045 | |||||||||
| 6.000% 08/17/21 (c) | 1,000,000 | 1,008,438 | |||||||||
| Small Business Administration | |||||||||||
| 5.875% 10/25/21 (b) | 15,643 | 15,781 | |||||||||
| 5.875% 03/25/22 (b) | 119,755 | 120,826 | |||||||||
| 5.875% 06/25/22 (b) | 398,383 | 401,980 | |||||||||
| 6.000% 07/25/21 (b) | 25,576 | 25,360 | |||||||||
| 6.000% 11/25/21 (b) | 51,726 | 52,203 | |||||||||
| Total Mortgage-Backed Securities (Cost of $9,724,945) | 9,601,257 | ||||||||||
| Government & Agency Obligations (8.9%) | |||||||||||
| Foreign Government Obligations (1.4%) | |||||||||||
| Morocco Government AID Bond | |||||||||||
| 5.563% 05/01/23 (b) | 340,000 | 344,474 | |||||||||
| Province of Quebec | |||||||||||
| 5.000% 07/17/09 | 500,000 | 495,866 | |||||||||
| United Mexican States | |||||||||||
| 4.625% 10/08/08 | 325,000 | 318,500 | |||||||||
| 1,158,840 | |||||||||||
| U.S. Government Agencies (4.1%) | |||||||||||
| Federal National Mortgage Association | |||||||||||
| 4.750% 08/03/07 | 3,450,000 | 3,428,689 | |||||||||
| U.S. Government Obligations (3.4%) | |||||||||||
| U.S. Treasury Inflation Index Notes | |||||||||||
| 3.875% 01/15/09 | 2,197,517 | 2,274,773 | |||||||||
| U.S. Treasury Notes | |||||||||||
| 4.375% 12/31/07 | 620,000 | 614,284 | |||||||||
| 2,889,057 | |||||||||||
| Total Government & Agency Obligations (Cost of $7,583,470) | 7,476,586 | ||||||||||
| Commercial Mortgage-Backed Securities (4.8%) | |||||||||||
| Chase Commercial Mortgage Securities Corp. | |||||||||||
| 7.093% 10/15/32 | 1,261,211 | 1,278,113 | |||||||||
| LB-UBS Commercial Mortgage Trust | |||||||||||
| 5.642% 12/15/25 | 628,494 | 630,814 | |||||||||
| Nationslink Funding Corp. | |||||||||||
| 6.888% 11/10/30 (d) | 500,000 | 502,875 | |||||||||
| Prudential Securities Secured Financing Corp. | |||||||||||
| 6.480% 11/01/31 | 1,564,448 | 1,591,252 | |||||||||
| Total Commercial Mortgage-Backed Securities (Cost of $4,126,439) | 4,003,054 | ||||||||||
See Accompanying Notes to Financial Statements.
38
CMG SHORT TERM BOND FUND
A Portfolio of Columbia Funds Institutional Trust
SCHEDULE OF INVESTMENTS
| Par | Value | ||||||||||
| Short-Term Obligation (11.6%) | |||||||||||
| Repurchase agreement with State Street Bank & Trust Co., dated 07/31/06, due 08/01/06 at 5.160%, collateralized by a U.S. Treasury Note maturing 02/28/11, market value of $9,957,431 (repurchase proceeds $9,761,399) | $ | 9,760,000 | $ | 9,760,000 | |||||||
| Total Short-Term Obligation (Cost of $9,760,000) | 9,760,000 | ||||||||||
| Total Investments (104.7%) (Cost of $88,707,249) (e) | 87,932,137 | ||||||||||
| Other Assets & Liabilities, Net (-4.7%) | (3,947,977 | ) | |||||||||
| Net Assets (100.0%) | $ | 83,984,160 | |||||||||
Notes to Schedule of Investments:
(a) Security exempt from registration pursuant to Rule 144A under the Securities Act of 1933. These securities may be resold in transactions exempt from registration, normally to qualified institutional buyers. At July 31, 2006, these securities, which are not illiquid, amounted to $1,796,511, which represents 2.1% of net assets.
(b) The interest rate shown on floating rate or variable rate securities reflects the rate at July 31, 2006.
(c) Security purchased on a delayed delivery basis.
(d) Investments in affiliates during the year ended July 31, 2006:
Security name: Nationslink Funding Corp., 6.888% 11/10/30
| Par as of 07/31/05: | $ | 500,000 | |||||
| Par purchased: | $ | - | |||||
| Par sold: | $ | - | |||||
| Par as of 07/31/06: | $ | 500,000 | |||||
| Net realized gain/loss: | $ | - | |||||
| Interest income earned: | $ | 34,440 | |||||
| Value at end of period: | $ | 502,875 | |||||
(e) Cost for federal income tax purposes is $89,033,604.
At July 31, 2006, the asset allocation of the Fund is as follows:
Asset Allocation (Unaudited) | % of Net Assets | ||||||
| Corporate Fixed-Income Bonds & Notes | 32.1 | % | |||||
| Collateralized Mortgage Obligations | 18.1 | ||||||
| Asset-Backed Securities | 17.8 | ||||||
| Mortgage-Backed Securities | 11.4 | ||||||
| Government & Agency Obligations | 8.9 | ||||||
| Commercial Mortgage-Backed Securities | 4.8 | ||||||
| Short-Term Obligation | 11.6 | ||||||
| Other Assets & Liabilities, Net | (4.7 | ) | |||||
| 100.0 | % | ||||||
| Acronym | Name | ||||||
| TBA | To Be Announced | ||||||
See Accompanying Notes to Financial Statements.
39
CMG ULTRA SHORT TERM BOND FUND
A Portfolio of Columbia Funds Institutional Trust
SCHEDULE OF INVESTMENTS
July 31, 2006
| Par | Value | ||||||||||
| Corporate Fixed-Income Bonds & Notes (30.2%) | |||||||||||
| Communications (3.5%) | |||||||||||
| Media (0.5%) | |||||||||||
| Walt Disney Co. | |||||||||||
| 5.500% 12/29/06 | $ | 475,000 | $ | 475,214 | |||||||
| Telecommunications (3.0%) | |||||||||||
| Sprint Capital Corp. | |||||||||||
| 4.780% 08/17/06 | 600,000 | 599,822 | |||||||||
| Verizon Global Funding Corp. | |||||||||||
| 5.300% 08/15/07 (a) | 600,000 | 600,313 | |||||||||
| Verizon Wireless Capital LLC | |||||||||||
| 5.375% 12/15/06 | 750,000 | 749,837 | |||||||||
| Vodafone Group PLC | |||||||||||
| 5.590% 12/28/07 (a) | 700,000 | 699,966 | |||||||||
| 2,649,938 | |||||||||||
| 3,125,152 | |||||||||||
| Consumer Cyclical (3.9%) | |||||||||||
| Apparel (0.8%) | |||||||||||
| Nike, Inc. | |||||||||||
| 5.500% 08/15/06 | 750,000 | 749,755 | |||||||||
| Auto Manufacturers (0.7%) | |||||||||||
| DaimlerChrysler NA Holding Corp. | |||||||||||
| 5.750% 05/18/09 | 575,000 | 573,591 | |||||||||
| Retail (1.6%) | |||||||||||
| McDonald's Corp. | |||||||||||
| 5.375% 04/30/07 | 610,000 | 609,314 | |||||||||
| Target Corp. | |||||||||||
| 5.500% 04/01/07 | 850,000 | 849,821 | |||||||||
| 1,459,135 | |||||||||||
| Textiles (0.8%) | |||||||||||
| Cintas Corp. | |||||||||||
| 5.125% 06/01/07 | 750,000 | 747,156 | |||||||||
| 3,529,637 | |||||||||||
| Consumer Non-Cyclical (3.3%) | |||||||||||
| Beverages (1.4%) | |||||||||||
| Bottling Group LLC | |||||||||||
| 2.450% 10/16/06 | 700,000 | 695,731 | |||||||||
| Coca-Cola Enterprises, Inc. | |||||||||||
| 5.375% 08/15/06 | 550,000 | 549,959 | |||||||||
| 1,245,690 | |||||||||||
See Accompanying Notes to Financial Statements.
40
CMG ULTRA SHORT TERM BOND FUND
A Portfolio of Columbia Funds Institutional Trust
SCHEDULE OF INVESTMENTS
| Par | Value | ||||||||||
| Corporate Fixed-Income Bonds & Notes (continued) | |||||||||||
| Food (1.4%) | |||||||||||
| Campbell Soup Co. | |||||||||||
| 6.900% 10/15/06 | $ | 750,000 | $ | 751,984 | |||||||
| General Mills, Inc. | |||||||||||
| 5.125% 02/15/07 | 500,000 | 498,822 | |||||||||
| 1,250,806 | |||||||||||
| Healthcare Services (0.5%) | |||||||||||
| WellPoint, Inc. | |||||||||||
| 3.750% 12/14/07 | 500,000 | 487,968 | |||||||||
| 2,984,464 | |||||||||||
| Energy (0.4%) | |||||||||||
| Oil & Gas (0.4%) | |||||||||||
| Ras Laffan Liquefied Natural Gas Co., Ltd. | |||||||||||
| 3.437% 09/15/09 (b) | 361,900 | 348,307 | |||||||||
| Financials (15.1%) | |||||||||||
| Banks (1.1%) | |||||||||||
| Societe Generale of North America, Inc. | |||||||||||
| 5.140% 11/20/06 | 1,000,000 | 984,152 | |||||||||
| Diversified Financial Services (12.0%) | |||||||||||
| American Express Credit Corp. | |||||||||||
| 5.529% 06/16/11 (a) | 1,000,000 | 1,000,570 | |||||||||
| American Honda Finance Corp. | |||||||||||
| 5.214% 08/23/07 (a)(b) | 500,000 | 500,154 | |||||||||
| CIT Group, Inc. | |||||||||||
| 5.370% 02/15/07 (a) | 1,000,000 | 1,001,119 | |||||||||
| Countrywide Home Loans, Inc. | |||||||||||
| 3.250% 05/21/08 | 500,000 | 480,936 | |||||||||
| Credit Suisse First Boston USA, Inc. | |||||||||||
| 4.875% 08/15/10 | 200,000 | 195,192 | |||||||||
| 5.670% 02/15/07 (a) | 1,000,000 | 1,002,689 | |||||||||
| General Electric Capital Corp. | |||||||||||
| 6.500% 12/10/07 | 500,000 | 506,723 | |||||||||
| Goldman Sachs Group LP | |||||||||||
| 7.200% 03/01/07 (b) | 250,000 | 252,543 | |||||||||
| Goldman Sachs Group, Inc. | |||||||||||
| 5.647% 01/09/07 (a) | 1,500,000 | 1,501,177 | |||||||||
| Household Financial Corp. | |||||||||||
| 7.650% 05/15/07 | 650,000 | 660,018 | |||||||||
| John Deere Capital Corp. | |||||||||||
| 3.625% 05/25/07 | 500,000 | 492,254 | |||||||||
| Merrill Lynch & Co. | |||||||||||
| 3.000% 04/30/07 | 200,000 | 196,362 | |||||||||
| Morgan Stanley | |||||||||||
| 5.358% 11/24/06 (a) | 1,500,000 | 1,500,696 | |||||||||
| SLM Corp. | |||||||||||
| 5.529% 09/15/06 (a) | 1,510,000 | 1,510,143 | |||||||||
| 10,800,576 | |||||||||||
See Accompanying Notes to Financial Statements.
41
CMG ULTRA SHORT TERM BOND FUND
A Portfolio of Columbia Funds Institutional Trust
SCHEDULE OF INVESTMENTS
| Par | Value | ||||||||||
| Corporate Fixed-Income Bonds & Notes (continued) | |||||||||||
| Insurance (2.0%) | |||||||||||
| Berkshire Hathaway Finance Corp. | |||||||||||
| 5.230% 05/16/08 (a) | $ | 500,000 | $ | 500,633 | |||||||
| Genworth Financial, Inc. | |||||||||||
| 5.479% 06/15/07 (a) | 1,100,000 | 1,101,730 | |||||||||
| Prudential Financial, Inc. | |||||||||||
| 4.104% 11/15/06 | 225,000 | 224,171 | |||||||||
| 1,826,534 | |||||||||||
| 13,611,262 | |||||||||||
| Industrials (1.0%) | |||||||||||
| Aerospace & Defense (0.6%) | |||||||||||
| United Technologies Corp. | |||||||||||
| 7.000% 09/15/06 | 500,000 | 500,676 | |||||||||
| Transportation (0.4%) | |||||||||||
| CSX Corp. | |||||||||||
| 5.430% 08/03/06 (a) | 387,000 | 387,000 | |||||||||
| 887,676 | |||||||||||
| Information Technology (1.2%) | |||||||||||
| Computers (0.9%) | |||||||||||
| International Business Machines Corp. | |||||||||||
| 5.490% 06/28/07 (a) | 750,000 | 750,427 | |||||||||
| IT Services (0.3%) | |||||||||||
| First Data Corp. | |||||||||||
| 4.700% 11/01/06 | 300,000 | 299,306 | |||||||||
| 1,049,733 | |||||||||||
| Utilities (1.8%) | |||||||||||
| Electric (1.8%) | |||||||||||
| Alabama Power Co. | |||||||||||
| 2.800% 12/01/06 | 400,000 | 396,505 | |||||||||
| Nisource Finance Corp. | |||||||||||
| 3.200% 11/01/06 | 500,000 | 496,917 | |||||||||
| Wisconsin Electric Power Co. | |||||||||||
| 3.500% 12/01/07 | 750,000 | 731,311 | |||||||||
| 1,624,733 | |||||||||||
| Total Corporate Fixed-Income Bonds & Notes (Cost of $27,233,105) | 27,160,964 | ||||||||||
| Asset-Backed Securities (30.2%) | |||||||||||
| AmeriCredit Automobile Receivables Trust | |||||||||||
| 3.930% 10/06/11 | 500,000 | 488,868 | |||||||||
| 4.310% 09/08/08 | 463,079 | 462,113 | |||||||||
| Bay View Auto Trust | |||||||||||
| 5.010% 06/25/14 | 300,000 | 296,507 | |||||||||
| Capital Auto Receivables Asset Trust | |||||||||||
| 3.350% 02/15/08 | 1,000,000 | 992,377 | |||||||||
See Accompanying Notes to Financial Statements.
42
CMG ULTRA SHORT TERM BOND FUND
A Portfolio of Columbia Funds Institutional Trust
SCHEDULE OF INVESTMENTS
| Par | Value | ||||||||||
| Asset-Backed Securities (continued) | |||||||||||
| Capital One Auto Finance Trust | |||||||||||
| 4.790% 05/15/09 | $ | 858,428 | $ | 855,697 | |||||||
| Carmax Auto Owner Trust | |||||||||||
| 4.100% 05/15/08 | 794,124 | 791,344 | |||||||||
| Centex Home Equity | |||||||||||
| 5.495% 10/25/35 (a) | 432,905 | 432,950 | |||||||||
| 6.540% 01/25/32 | 256,635 | 255,556 | |||||||||
| Chase Credit Card Master Trust | |||||||||||
| 5.489% 02/15/10 (a) | 1,000,000 | 1,001,406 | |||||||||
| Chase Funding Mortgage Loan Asset-Backed Certificates | |||||||||||
| 7.140% 09/25/28 | 147,254 | 146,641 | |||||||||
| Chase Manhattan Auto Owner Trust | |||||||||||
| 4.770% 03/15/08 | 800,000 | 798,293 | |||||||||
| CNH Equipment Trust | |||||||||||
| 3.380% 02/15/11 | 750,000 | 736,160 | |||||||||
| 5.200% 08/16/10 | 750,000 | 747,999 | |||||||||
| DaimlerChrysler Auto Trust | |||||||||||
| 3.090% 01/08/08 | 110,010 | 109,943 | |||||||||
| 5.300% 10/08/08 | 500,000 | 499,455 | |||||||||
| Ford Credit Floorplan Master Owner Trust | |||||||||||
| 5.549% 06/15/11 (a) | 700,000 | 699,985 | |||||||||
| Franklin Auto Trust | |||||||||||
| 3.130% 11/15/11 | 376,068 | 369,103 | |||||||||
| 4.910% 04/20/10 | 1,000,000 | 992,958 | |||||||||
| GMAC Mortgage Corp. Loan Trust | |||||||||||
| 6.200% 05/25/36 | 984,994 | 984,994 | |||||||||
| Gracechurch Card Funding PLC | |||||||||||
| 5.479% 03/15/10 (a) | 1,000,000 | 1,001,089 | |||||||||
| GS Auto Loan Trust | |||||||||||
| 4.320% 05/15/08 | 418,642 | 417,241 | |||||||||
| Harley-Davidson Motorcycle Trust | |||||||||||
| 2.630% 11/15/10 | 148,561 | 145,420 | |||||||||
| 5.360% 10/15/10 | 932,520 | 931,541 | |||||||||
| Honda Auto Receivables Owner Trust | |||||||||||
| 4.850% 06/18/08 | 750,000 | 747,903 | |||||||||
| Household Automotive Trust | |||||||||||
| 2.220% 11/17/09 | 560,631 | 551,099 | |||||||||
| John Deere Owner Trust | |||||||||||
| 5.364% 07/13/07 | 464,006 | 463,802 | |||||||||
| Long Beach Auto Receivables Trust | |||||||||||
| 3.402% 09/15/09 | 416,766 | 413,421 | |||||||||
| 4.050% 04/15/11 | 800,000 | 786,055 | |||||||||
| 4.080% 06/15/10 | 700,000 | 692,195 | |||||||||
| 4.325% 06/15/09 | 558,601 | 556,349 | |||||||||
| 4.406% 05/15/10 | 600,000 | 592,181 | |||||||||
| Long Beach Mortgage Loan Trust | |||||||||||
| 4.500% 12/25/06 I.O. (c) | 2,734,097 | 33,515 | |||||||||
| Nissan Auto Lease Trust | |||||||||||
| 2.570% 06/15/09 | 33,795 | 33,746 | |||||||||
| Nomura Asset Acceptance Corp. | |||||||||||
| 5.525% 01/25/36 (a)(b) | 757,898 | 757,986 | |||||||||
See Accompanying Notes to Financial Statements.
43
CMG ULTRA SHORT TERM BOND FUND
A Portfolio of Columbia Funds Institutional Trust
SCHEDULE OF INVESTMENTS
| Par | Value | ||||||||||
| Asset-Backed Securities (continued) | |||||||||||
| Onyx Acceptance Grantor Trust | |||||||||||
| 3.090% 09/15/08 | $ | 134,216 | $ | 133,599 | |||||||
| Ownit Mortgage Loan Asset-Backed Certificates | |||||||||||
| 5.424% 12/25/36 (a) | 664,473 | 659,812 | |||||||||
| Providian Gateway Master Trust | |||||||||||
| 3.350% 09/15/11 (b) | 1,500,000 | 1,466,241 | |||||||||
| Residential Asset Mortgage Products, Inc. | |||||||||||
| 3.420% 10/25/27 (a) | 266,837 | 265,494 | |||||||||
| Residential Funding Mortgage Securities II, Inc. | |||||||||||
| 5.505% 09/25/35 (a) | 647,957 | 646,547 | |||||||||
| Soundview Home Equity Loan Trust | |||||||||||
| 5.555% 04/25/35 (a) | 114,384 | 114,411 | |||||||||
| Triad Auto Receivables Owner Trust | |||||||||||
| 4.220% 06/12/12 | 750,000 | 730,796 | |||||||||
| 5.360% 11/12/09 | 900,000 | 898,908 | |||||||||
| Volkswagen Auto Loan Enhanced Trust | |||||||||||
| 2.270% 10/22/07 | 15,496 | 15,462 | |||||||||
| WFS Financial Owner Trust | |||||||||||
| 2.850% 09/22/08 | 157,966 | 157,373 | |||||||||
| 3.020% 05/20/11 | 538,206 | 530,385 | |||||||||
| 3.150% 05/20/11 | 782,959 | 770,898 | |||||||||
| 3.250% 05/20/11 | 941,599 | 927,605 | |||||||||
| Total Asset-Backed Securities (Cost of $27,197,932) | 27,103,423 | ||||||||||
| Collateralized Mortgage Obligations (16.3%) | |||||||||||
| Agency (10.4%) | |||||||||||
| Federal Home Loan Mortgage Corp. | |||||||||||
| 2.351% 08/15/08 (a) | 643,530 | 633,692 | |||||||||
| 3.000% 06/15/23 | 782,778 | 771,301 | |||||||||
| 4.000% 05/15/14 | 100,000 | 97,593 | |||||||||
| 4.000% 07/15/24 | 455,950 | 446,962 | |||||||||
| 4.250% 03/15/17 | 669,401 | 663,638 | |||||||||
| 4.500% 11/15/16 | 439,125 | 431,688 | |||||||||
| 5.000% 07/15/14 | 400,000 | 397,150 | |||||||||
| 5.000% 11/15/15 | 261,510 | 259,120 | |||||||||
| 5.000% 02/15/16 | 867,421 | 858,926 | |||||||||
| 5.000% 09/15/19 | 876,291 | 871,756 | |||||||||
| 5.000% 05/15/26 | 468,145 | 463,604 | |||||||||
| 5.500% 04/15/27 | 1,825,408 | 1,822,835 | |||||||||
| Federal National Mortgage Association | |||||||||||
| 5.000% 01/25/23 | 614,939 | 609,973 | |||||||||
| 6.000% 01/25/31 | 1,011,980 | 1,013,265 | |||||||||
| 9,341,503 | |||||||||||
| Non-Agency (5.9%) | |||||||||||
| Granite Master Issuer PLC | |||||||||||
| 5.388% 04/20/31 (a) | 886,303 | 886,091 | |||||||||
| JP Morgan Mortgage Trust | |||||||||||
| 5.500% 04/25/36 | 400,000 | 397,352 | |||||||||
See Accompanying Notes to Financial Statements.
44
CMG ULTRA SHORT TERM BOND FUND
A Portfolio of Columbia Funds Institutional Trust
SCHEDULE OF INVESTMENTS
| Par | Value | ||||||||||
| Collateralized Mortgage Obligations (continued) | |||||||||||
| Non-Agency (continued) | |||||||||||
| Opteum Mortgage Acceptance Corp. | |||||||||||
| 5.470% 12/25/35 (a) | $ | 668,990 | $ | 665,151 | |||||||
| Paragon Mortgages PLC | |||||||||||
| 5.369% 06/15/41 (a)(b) | 481,804 | 481,804 | |||||||||
| Residential Mortgage Securities PLC | |||||||||||
| 5.602% 11/14/31 (a)(b) | 1,000,000 | 1,000,000 | |||||||||
| Washington Mutual, Inc. | |||||||||||
| 3.624% 04/25/35 (a) | 179,560 | 178,851 | |||||||||
| 4.841% 10/25/35 (a) | 744,710 | 732,565 | |||||||||
| 6.250% 07/25/36 | 958,630 | 959,491 | |||||||||
| 5,301,305 | |||||||||||
| Total Collateralized Mortgage Obligations (Cost of $14,725,770) | 14,642,808 | ||||||||||
| Government & Agency Obligations (12.4%) | |||||||||||
| U.S. Government Agencies (12.4%) | |||||||||||
| Federal Home Loan Bank | |||||||||||
| 2.625% 02/16/07 | 500,000 | 492,465 | |||||||||
| 4.000% 04/25/07 | 1,000,000 | 989,351 | |||||||||
| 4.000% 03/10/08 | 500,000 | 490,047 | |||||||||
| 4.875% 05/15/07 | 1,000,000 | 995,609 | |||||||||
| 5.375% 02/15/07 | 1,250,000 | 1,249,249 | |||||||||
| Federal Home Loan Mortgage Corp. | |||||||||||
| 2.750% 10/15/06 | 1,500,000 | 1,491,480 | |||||||||
| 2.875% 12/15/06 | 2,000,000 | 1,980,702 | |||||||||
| 3.750% 11/15/06 | 1,000,000 | 995,021 | |||||||||
| 4.125% 04/02/07 | 2,000,000 | 1,982,684 | |||||||||
| Federal National Mortgage Association | |||||||||||
| 5.111% 09/07/06 (a) | 500,000 | 499,887 | |||||||||
| Total Government & Agency Obligations (Cost of $11,241,624) | 11,166,495 | ||||||||||
| Mortgage-Backed Securities (3.4%) | |||||||||||
| Federal Home Loan Mortgage Corp. | |||||||||||
| 5.000% 12/01/19 | 1,579,134 | 1,534,503 | |||||||||
| Federal National Mortgage Association | |||||||||||
| 6.000% 09/01/19 | 1,264,242 | 1,275,430 | |||||||||
| 6.500% 07/01/34 | 232,688 | 236,209 | |||||||||
| Total Mortgage-Backed Securities (Cost of $3,167,994) | 3,046,142 | ||||||||||
| Municipal Bonds (2.3%) | |||||||||||
| KS Wyandotte County Kansas City Unified Government Special Obligation Revenue | |||||||||||
| Series 2005, | |||||||||||
| 4.670% 12/01/09 (a)(d) | 490,000 | 483,101 | |||||||||
See Accompanying Notes to Financial Statements.
45
CMG ULTRA SHORT TERM BOND FUND
A Portfolio of Columbia Funds Institutional Trust
SCHEDULE OF INVESTMENTS
| Par | Value | ||||||||||
| Municipal Bonds (continued) | |||||||||||
| NJ Camden County Improvement Authority | |||||||||||
| Series 2005, | |||||||||||
| 4.220% 08/03/06 (a)(d) | $ | 500,000 | $ | 499,900 | |||||||
| NY City | |||||||||||
| Series 2005 L, | |||||||||||
| 4.000% 12/01/06 (a)(d) | 300,000 | 298,584 | |||||||||
| NY Urban Development Corp. Revenue | |||||||||||
| Series 2004 B-3, | |||||||||||
| 3.580% 12/15/07 (a)(d) | 800,000 | 781,624 | |||||||||
| Total Municipal Bonds (Cost of $2,090,888) | 2,063,209 | ||||||||||
| Short-Term Obligation (4.7%) | |||||||||||
| Repurchase agreement with State Street Bank & Trust Co., dated 07/31/06, due 08/01/06 at 5.160%, collateralized by a U.S. Treasury Bond maturing 05/15/09, market value of $4,352,400 (repurchase proceeds $4,267,612). | 4,267,000 | 4,267,000 | |||||||||
| Total Short-Term Obligation (Cost of $4,267,000) | 4,267,000 | ||||||||||
| Total Investments (99.5%) (Cost of $89,924,313) (e) | 89,450,041 | ||||||||||
| Other Assets & Liabilities, Net (0.5%) | 413,311 | ||||||||||
| Net Assets (100.0%) | $ | 89,863,352 | |||||||||
| Notes to Schedule of Investments: | |||||||||||
(a) The interest rate shown on floating rate or variable rate securities reflects the rate at July 31, 2006.
(b) Security exempt from registration pursuant to Rule 144A under the Securities Act of 1933. These securities may be resold in transactions exempt from registration, normally to qualified institutional buyers. At July 31, 2006, these securities, which are not illiquid, amounted to $4,807,035, which represents 5.3% of net assets.
(c) Accrued interest accumulates in the value of this security and is payable at redemption.
(d) Auction rate security. A debt security in which the interest rate is reset periodically, at intervals established at the time of issuance.
(e) Cost for federal income tax purposes is $90,087,545.
Investments in affiliates during the year ended July 31, 2006:
Security name: MBNA Credit Card Master Note Trust, 5.750% 10/15/08
(MBNA became an affiliate of the Fund on January 1, 2006)
| Par as of 07/31/05: | $ | 439,000 | |||||
| Par purchased: | $ | - | |||||
| Par sold: | $ | 439,000 | |||||
| Par as of 07/31/06: | $ | - | |||||
| Net realized gain/loss: | $ | (20,510 | ) | ||||
| Interest income earned: | $ | 19,914 | |||||
| Value at end of period: | $ | - | |||||
See Accompanying Notes to Financial Statements.
46
CMG ULTRA SHORT TERM BOND FUND
A Portfolio of Columbia Funds Institutional Trust
SCHEDULE OF INVESTMENTS
Investments in affiliates during the year ended July 31, 2006:
Security name: MBNA America Bank N.A., 7.750% 09/15/05
(MBNA became an affiliate of the Fund on January 1, 2006)
| Par as of 07/31/05: | $ | 280,000 | |||||
| Par purchased: | $ | - | |||||
| Par sold: | $ | 280,000 | |||||
| Par as of 07/31/06: | $ | - | |||||
| Net realized gain/loss: | $ | (21,277 | ) | ||||
| Interest income earned: | $ | 2,652 | |||||
| Value at end of period: | $ | - | |||||
At July 31, 2006, the asset allocation of the Fund is as follows:
| % of Asset Allocation (Unaudited) | Net Assets | ||||||
| Corporate Fixed-Income Bonds & Notes | 30.2 | % | |||||
| Asset-Backed Securities | 30.2 | ||||||
| Collateralized Mortgage Obligations | 16.3 | ||||||
| Government & Agency Obligations | 12.4 | ||||||
| Mortgage-Backed Securities | 3.4 | ||||||
| Municipal Bonds | 2.3 | ||||||
| Short-Term Obligation | 4.7 | ||||||
| Other Assets & Liabilities, Net | 0.5 | ||||||
| 100.0 | % | ||||||
| Acronym | Name | ||||||
| I.O. | Interest only security | ||||||
See Accompanying Notes to Financial Statements.
47
CMG HIGH YIELD FUND
A Portfolio of Columbia Funds Institutional Trust
SCHEDULE OF INVESTMENTS
July 31, 2006
| Par | Value | ||||||||||
| Corporate Fixed-Income Bonds & Notes (93.2%) | |||||||||||
| Basic Materials (5.2%) | |||||||||||
| Chemicals (2.4%) | |||||||||||
| Chemicals-Diversified (1.4%) | |||||||||||
| EquiStar Chemicals LP | |||||||||||
| 10.125% 09/01/08 | $ | 375,000 | $ | 394,688 | |||||||
| 10.625% 05/01/11 | 585,000 | 628,875 | |||||||||
| NOVA Chemicals Corp. | |||||||||||
| 6.500% 01/15/12 | 355,000 | 330,150 | |||||||||
| 1,353,713 | |||||||||||
| Chemicals-Specialty (0.7%) | |||||||||||
| Nalco Co. | |||||||||||
| 7.750% 11/15/11 | 685,000 | 688,425 | |||||||||
| Industrial-Gases (0.3%) | |||||||||||
| Airgas, Inc. | |||||||||||
| 9.125% 10/01/11 | 310,000 | 323,175 | |||||||||
| 2,365,313 | |||||||||||
| Forest Products & Paper (0.9%) | |||||||||||
| Paper & Related Products (0.9%) | |||||||||||
| Boise Cascade LLC | |||||||||||
| 7.125% 10/15/14 | 960,000 | 847,200 | |||||||||
| Iron/Steel (1.9%) | |||||||||||
| Steel-Producers (1.9%) | |||||||||||
| Russel Metals, Inc. | |||||||||||
| 6.375% 03/01/14 | 1,185,000 | 1,116,862 | |||||||||
| United States Steel Corp. | |||||||||||
| 9.750% 05/15/10 | 650,000 | 692,250 | |||||||||
| 1,809,112 | |||||||||||
| 5,021,625 | |||||||||||
| Communications (14.2%) | |||||||||||
| Media (7.6%) | |||||||||||
| Cable TV (4.1%) | |||||||||||
| CSC Holdings, Inc. | |||||||||||
| 7.625% 04/01/11 | 490,000 | 493,062 | |||||||||
| DirecTV Holdings LLC | |||||||||||
| 6.375% 06/15/15 | 1,080,000 | 1,000,350 | |||||||||
| 8.375% 03/15/13 | 159,000 | 166,553 | |||||||||
| EchoStar DBS Corp. | |||||||||||
| 5.750% 10/01/08 | 150,000 | 148,125 | |||||||||
| 6.625% 10/01/14 | 1,280,000 | 1,235,200 | |||||||||
| Rogers Cable, Inc. | |||||||||||
| 7.875% 05/01/12 | 890,000 | 920,037 | |||||||||
| 3,963,327 | |||||||||||
See Accompanying Notes to Financial Statements.
48
CMG HIGH YIELD FUND
A Portfolio of Columbia Funds Institutional Trust
SCHEDULE OF INVESTMENTS
| Par | Value | ||||||||||
| Corporate Fixed-Income Bonds & Notes (continued) | |||||||||||
| Multimedia (1.5%) | |||||||||||
| Emmis Operating Co. | |||||||||||
| 6.875% 05/15/12 | $ | 465,000 | $ | 456,281 | |||||||
| Lamar Media Corp. | |||||||||||
| 7.250% 01/01/13 | 975,000 | 957,938 | |||||||||
| 1,414,219 | |||||||||||
| Publishing-Periodicals (1.2%) | |||||||||||
| Dex Media West LLC | |||||||||||
| 9.875% 08/15/13 | 210,000 | 226,275 | |||||||||
| R.H. Donnelley Finance Corp. | |||||||||||
| 10.875% 12/15/12 (a) | 820,000 | 900,975 | |||||||||
| 1,127,250 | |||||||||||
| Television (0.8%) | |||||||||||
| LIN Television Corp. | |||||||||||
| 6.500% 05/15/13 | 850,000 | 774,563 | |||||||||
| 7,279,359 | |||||||||||
| Telecommunication Services (6.6%) | |||||||||||
| Cellular Telecommunications (2.2%) | |||||||||||
| Nextel Communications, Inc. | |||||||||||
| 7.375% 08/01/15 | 1,085,000 | 1,111,548 | |||||||||
| Rogers Wireless, Inc. | |||||||||||
| 8.000% 12/15/12 | 985,000 | 1,014,550 | |||||||||
| 2,126,098 | |||||||||||
| Satellite Telecommunications (0.3%) | |||||||||||
| Intelsat Bermuda Ltd. | |||||||||||
| 9.250% 06/15/16 (a) | 265,000 | 270,962 | |||||||||
| Telecommunication Equipment (0.3%) | |||||||||||
| Lucent Technologies, Inc. | |||||||||||
| 6.450% 03/15/29 | 340,000 | 289,850 | |||||||||
| Telecommunication Services (0.3%) | |||||||||||
| Embarq Corp. | |||||||||||
| 7.082% 06/01/16 | 155,000 | 155,991 | |||||||||
| 7.995% 06/01/36 | 155,000 | 159,000 | |||||||||
| 314,991 | |||||||||||
| Telephone-Integrated (3.0%) | |||||||||||
| Cincinnati Bell, Inc. | |||||||||||
| 7.000% 02/15/15 | 280,000 | 265,300 | |||||||||
| Citizens Communications Co. | |||||||||||
| 9.000% 08/15/31 | 505,000 | 517,625 | |||||||||
| Qwest Corp. | |||||||||||
| 7.500% 06/15/23 | 465,000 | 447,563 | |||||||||
| 8.875% 03/15/12 | 1,255,000 | 1,352,262 | |||||||||
| Windstream Corp. | |||||||||||
| 8.625% 08/01/16 (a) | 310,000 | 322,400 | |||||||||
| 2,905,150 | |||||||||||
See Accompanying Notes to Financial Statements.
49
CMG HIGH YIELD FUND
A Portfolio of Columbia Funds Institutional Trust
SCHEDULE OF INVESTMENTS
| Par | Value | ||||||||||
| Corporate Fixed-Income Bonds & Notes (continued) | |||||||||||
| Wireless Equipment (0.5%) | |||||||||||
| American Towers, Inc. | |||||||||||
| 7.250% 12/01/11 | $ | 430,000 | $ | 441,825 | |||||||
| 6,348,876 | |||||||||||
| 13,628,235 | |||||||||||
| Consumer Cyclical (18.4%) | |||||||||||
| Apparel (0.8%) | |||||||||||
| Apparel Manufacturers (0.8%) | |||||||||||
| Phillips-Van Heusen Corp. | |||||||||||
| 7.250% 02/15/11 | 775,000 | 769,188 | |||||||||
| Auto Parts & Equipment (0.9%) | |||||||||||
| Auto/Truck Parts & Equipment-Original (0.9%) | |||||||||||
| Accuride Corp. | |||||||||||
| 8.500% 02/01/15 | 510,000 | 474,300 | |||||||||
| TRW Automotive, Inc. | |||||||||||
| 9.375% 02/15/13 | 410,000 | 435,625 | |||||||||
| 909,925 | |||||||||||
| Entertainment (2.9%) | |||||||||||
| Music (1.2%) | |||||||||||
| Steinway Musical Instruments, Inc. | |||||||||||
| 7.000% 03/01/14 (a) | 815,000 | 780,362 | |||||||||
| Warner Music Group | |||||||||||
| 7.375% 04/15/14 | 410,000 | 395,650 | |||||||||
| 1,176,012 | |||||||||||
| Racetracks (1.0%) | |||||||||||
| Speedway Motorsports, Inc. | |||||||||||
| 6.750% 06/01/13 | 930,000 | 897,450 | |||||||||
| Theaters (0.7%) | |||||||||||
| Cinemark USA, Inc. | |||||||||||
| 9.000% 02/01/13 | 665,000 | 696,588 | |||||||||
| 2,770,050 | |||||||||||
| Home Builders (3.2%) | |||||||||||
| Building-Residential/Commercial (3.2%) | |||||||||||
| K. Hovnanian Enterprises, Inc. | |||||||||||
| 6.000% 01/15/10 | 775,000 | 713,000 | |||||||||
| 6.375% 12/15/14 | 665,000 | 578,550 | |||||||||
| 6.500% 01/15/14 | 950,000 | 847,875 | |||||||||
| KB Home | |||||||||||
| 8.625% 12/15/08 | 885,000 | 917,222 | |||||||||
| 3,056,647 | |||||||||||
See Accompanying Notes to Financial Statements.
50
CMG HIGH YIELD FUND
A Portfolio of Columbia Funds Institutional Trust
SCHEDULE OF INVESTMENTS
| Par | Value | ||||||||||
| Corporate Fixed-Income Bonds & Notes (continued) | |||||||||||
| Home Furnishings (0.4%) | |||||||||||
| Sealy Mattress Co. | |||||||||||
| 8.250% 06/15/14 | $ | 340,000 | $ | 340,000 | |||||||
| Leisure Time (2.2%) | |||||||||||
| Cruise Lines (1.1%) | |||||||||||
| Royal Caribbean Cruises Ltd. | |||||||||||
| 6.875% 12/01/13 | 900,000 | 887,506 | |||||||||
| 8.750% 02/02/11 | 185,000 | 199,525 | |||||||||
| 1,087,031 | |||||||||||
| Leisure & Recreational Products (1.1%) | |||||||||||
| Leslie's Poolmart | |||||||||||
| 7.750% 02/01/13 | 1,035,000 | 1,003,950 | |||||||||
| 2,090,981 | |||||||||||
| Lodging (5.2%) | |||||||||||
| Casino Hotels (3.9%) | |||||||||||
| CCM Merger, Inc. | |||||||||||
| 8.000% 08/01/13 (a) | 290,000 | 277,675 | |||||||||
| Chukchansi Economic Development Authority | |||||||||||
| 8.000% 11/15/13 (a) | 420,000 | 420,525 | |||||||||
| Kerzner International Ltd. | |||||||||||
| 6.750% 10/01/15 | 670,000 | 705,175 | |||||||||
| MGM Mirage | |||||||||||
| 6.000% 10/01/09 | 360,000 | 350,100 | |||||||||
| 8.500% 09/15/10 | 290,000 | 302,688 | |||||||||
| Station Casinos, Inc. | |||||||||||
| 6.875% 03/01/16 | 665,000 | 611,800 | |||||||||
| Wynn Las Vegas LLC | |||||||||||
| 6.625% 12/01/14 | 1,215,000 | 1,145,137 | |||||||||
| 3,813,100 | |||||||||||
| Hotels & Motels (1.3%) | |||||||||||
| Hilton Hotels Corp. | |||||||||||
| 7.500% 12/15/17 | 425,000 | 436,754 | |||||||||
| Starwood Hotels & Resorts Worldwide, Inc. | |||||||||||
| 7.875% 05/01/12 | 755,000 | 796,525 | |||||||||
| 1,233,279 | |||||||||||
| 5,046,379 | |||||||||||
| Retail (2.8%) | |||||||||||
| Retail-Automobiles (1.1%) | |||||||||||
| AutoNation, Inc. | |||||||||||
| 7.000% 04/15/14 (a) | 235,000 | 232,650 | |||||||||
| 7.507% 04/15/13 (a)(b) | 140,000 | 141,400 | |||||||||
| Group 1 Automotive, Inc. | |||||||||||
| 8.250% 08/15/13 | 620,000 | 624,650 | |||||||||
| 998,700 | |||||||||||
See Accompanying Notes to Financial Statements.
51
CMG HIGH YIELD FUND
A Portfolio of Columbia Funds Institutional Trust
SCHEDULE OF INVESTMENTS
| Par | Value | ||||||||||
| Corporate Fixed-Income Bonds & Notes (continued) | |||||||||||
| Retail-Convenience Store (0.6%) | |||||||||||
| Couche-Tard US LP | |||||||||||
| 7.500% 12/15/13 | $ | 605,000 | $ | 603,488 | |||||||
| Retail-Propane Distributors (0.4%) | |||||||||||
| AmeriGas Partners LP | |||||||||||
| 7.125% 05/20/16 | 430,000 | 414,950 | |||||||||
| Retail-Restaurants (0.7%) | |||||||||||
| Domino's, Inc. | |||||||||||
| 8.250% 07/01/11 | 650,000 | 671,125 | |||||||||
| 2,688,263 | |||||||||||
| 17,671,433 | |||||||||||
| Consumer Non-Cyclical (16.1%) | |||||||||||
| Agriculture (0.3%) | |||||||||||
| Tobacco (0.3%) | |||||||||||
| Reynolds American, Inc. | |||||||||||
| 7.625% 06/01/16 (a) | 250,000 | 254,556 | |||||||||
| Beverages (2.0%) | |||||||||||
| Beverages-Non-Alcoholic (1.0%) | |||||||||||
| Cott Beverages, Inc. | |||||||||||
| 8.000% 12/15/11 | 945,000 | 954,450 | |||||||||
| Beverages-Wine/Spirits (1.0%) | |||||||||||
| Constellation Brands, Inc. | |||||||||||
| 8.125% 01/15/12 | 955,000 | 983,650 | |||||||||
| 1,938,100 | |||||||||||
| Commercial Services (4.2%) | |||||||||||
| Commercial Services (0.5%) | |||||||||||
| Iron Mountain, Inc. | |||||||||||
| 7.750% 01/15/15 | 455,000 | 443,625 | |||||||||
| Funeral Services & Related Items (0.7%) | |||||||||||
| Service Corp. International | |||||||||||
| 6.750% 04/01/16 | 250,000 | 233,125 | |||||||||
| Stewart Enterprises, Inc. | |||||||||||
| 6.250% 02/15/13 | 545,000 | 486,412 | |||||||||
| 719,537 | |||||||||||
| Printing-Commercial (0.4%) | |||||||||||
| Quebecor World Capital Corp. | |||||||||||
| 8.750% 03/15/16 (a) | 375,000 | 344,063 | |||||||||
See Accompanying Notes to Financial Statements.
52
CMG HIGH YIELD FUND
A Portfolio of Columbia Funds Institutional Trust
SCHEDULE OF INVESTMENTS
| Par | Value | ||||||||||
| Corporate Fixed-Income Bonds & Notes (continued) | |||||||||||
| Private Corrections (1.1%) | |||||||||||
| Corrections Corp. of America | |||||||||||
| 6.250% 03/15/13 | $ | 665,000 | $ | 628,425 | |||||||
| 7.500% 05/01/11 | 445,000 | 449,450 | |||||||||
| 1,077,875 | |||||||||||
| Rental Auto/Equipment (1.5%) | |||||||||||
| Avis Budget Car Rental LLC | |||||||||||
| 7.625% 05/15/14 (a) | 160,000 | 156,800 | |||||||||
| 7.750% 05/15/16 (a) | 235,000 | 229,125 | |||||||||
| NationsRent Companies, Inc. | |||||||||||
| 9.500% 10/15/10 | 340,000 | 369,389 | |||||||||
| United Rentals North America, Inc. | |||||||||||
| 7.750% 11/15/13 | 725,000 | 690,563 | |||||||||
| 1,445,877 | |||||||||||
| 4,030,977 | |||||||||||
| Food (1.4%) | |||||||||||
| Food-Dairy Products (0.6%) | |||||||||||
| Dean Foods Co. | |||||||||||
| 7.000% 06/01/16 | 615,000 | 595,013 | |||||||||
| Food-Miscellaneous/Diversified (0.8%) | |||||||||||
| Del Monte Corp. | |||||||||||
| 6.750% 02/15/15 | 775,000 | 722,687 | |||||||||
| 1,317,700 | |||||||||||
| Healthcare Services (5.6%) | |||||||||||
| Medical Products (1.3%) | |||||||||||
| Fisher Scientific International, Inc. | |||||||||||
| 6.750% 08/15/14 | 1,230,000 | 1,222,313 | |||||||||
| Medical-Hospitals (2.4%) | |||||||||||
| Community Health Systems | |||||||||||
| 6.500% 12/15/12 | 450,000 | 424,125 | |||||||||
| HCA, Inc. | |||||||||||
| 6.950% 05/01/12 | 1,000,000 | 877,500 | |||||||||
| Triad Hospitals, Inc. | |||||||||||
| 7.000% 05/15/12 | 1,000,000 | 993,750 | |||||||||
| 2,295,375 | |||||||||||
| Medical-Nursing Homes (1.6%) | |||||||||||
| Extendicare Health Services, Inc. | |||||||||||
| 6.875% 05/01/14 | 1,200,000 | 1,248,000 | |||||||||
| 9.500% 07/01/10 | 255,000 | 266,156 | |||||||||
| 1,514,156 | |||||||||||
| Medical-Outpatient/Home Medical (0.3%) | |||||||||||
| Select Medical Corp. | |||||||||||
| 7.625% 02/01/15 | 410,000 | 348,500 | |||||||||
| 5,380,344 | |||||||||||
See Accompanying Notes to Financial Statements.
53
CMG HIGH YIELD FUND
A Portfolio of Columbia Funds Institutional Trust
SCHEDULE OF INVESTMENTS
| Par | Value | ||||||||||
| Corporate Fixed-Income Bonds & Notes (continued) | |||||||||||
| Household Products/Wares (0.9%) | |||||||||||
| Consumer Products-Miscellaneous (0.9%) | |||||||||||
| American Greetings Corp. | |||||||||||
| 7.375% 06/01/16 | $ | 275,000 | $ | 275,000 | |||||||
| Scotts Co. | |||||||||||
| 6.625% 11/15/13 | 630,000 | 605,587 | |||||||||
| 880,587 | |||||||||||
| Pharmaceuticals (1.7%) | |||||||||||
| Medical-Generic Drugs (0.5%) | |||||||||||
| Mylan Laboratories, Inc. | |||||||||||
| 6.375% 08/15/15 | 460,000 | 443,900 | |||||||||
| Medical-Wholesale Drug Distribution (0.7%) | |||||||||||
| AmerisourceBergen Corp. | |||||||||||
| 5.625% 09/15/12 | 755,000 | 721,554 | |||||||||
| Pharmacy Services (0.5%) | |||||||||||
| Omnicare, Inc. | |||||||||||
| 6.750% 12/15/13 | 510,000 | 491,513 | |||||||||
| 1,656,967 | |||||||||||
| 15,459,231 | |||||||||||
| Energy (13.8%) | |||||||||||
| Coal (2.0%) | |||||||||||
| Coal (2.0%) | |||||||||||
| Arch Western Finance LLC | |||||||||||
| 6.750% 07/01/13 | 830,000 | 790,575 | |||||||||
| Massey Energy Co. | |||||||||||
| 6.875% 12/15/13 | 455,000 | 419,738 | |||||||||
| Peabody Energy Corp. | |||||||||||
| 6.875% 03/15/13 | 725,000 | 705,062 | |||||||||
| 1,915,375 | |||||||||||
| Oil & Gas (5.3%) | |||||||||||
| Oil & Gas Drilling (0.8%) | |||||||||||
| Pride International, Inc. | |||||||||||
| 7.375% 07/15/14 | 810,000 | 818,100 | |||||||||
| Oil Companies-Exploration & Production (3.9%) | |||||||||||
| Chesapeake Energy Corp. | |||||||||||
| 6.375% 06/15/15 | 995,000 | 935,300 | |||||||||
| Compton Petroleum Corp. | |||||||||||
| 7.625% 12/01/13 | 570,000 | 548,625 | |||||||||
| Newfield Exploration Co. | |||||||||||
| 6.625% 09/01/14 | 715,000 | 692,656 | |||||||||
| Plains Exploration & Production Co. | |||||||||||
| 7.125% 06/15/14 | 665,000 | 658,350 | |||||||||
See Accompanying Notes to Financial Statements.
54
CMG HIGH YIELD FUND
A Portfolio of Columbia Funds Institutional Trust
SCHEDULE OF INVESTMENTS
| Par | Value | ||||||||||
| Corporate Fixed-Income Bonds & Notes (continued) | |||||||||||
| Oil Companies-Exploration & Production (continued) | |||||||||||
| Pogo Producing Co. | |||||||||||
| 6.625% 03/15/15 | $ | 965,000 | $ | 911,925 | |||||||
| 3,746,856 | |||||||||||
| Oil Refining & Marketing (0.6%) | |||||||||||
| Tesoro Corp. | |||||||||||
| 6.625% 11/01/15 (a) | 565,000 | 540,988 | |||||||||
| 5,105,944 | |||||||||||
| Oil & Gas Services (2.6%) | |||||||||||
| Oil Field Machinery & Equipment (0.9%) | |||||||||||
| Grant Prideco, Inc. | |||||||||||
| 6.125% 08/15/15 | 890,000 | 838,825 | |||||||||
| Oil-Field Services (1.7%) | |||||||||||
| Hornbeck Offshore Services, Inc. | |||||||||||
| 6.125% 12/01/14 | 810,000 | 755,325 | |||||||||
| Universal Compression, Inc. | |||||||||||
| 7.250% 05/15/10 | 915,000 | 917,287 | |||||||||
| 1,672,612 | |||||||||||
| 2,511,437 | |||||||||||
| Pipelines (3.9%) | |||||||||||
| Pipelines (3.9%) | |||||||||||
| Atlas Pipeline Partners LP | |||||||||||
| 8.125% 12/15/15 (a) | 475,000 | 478,562 | |||||||||
| Colorado Interstate Gas Co. | |||||||||||
| 6.800% 11/15/15 | 955,000 | 930,009 | |||||||||
| MarkWest Energy Partners LP | |||||||||||
| 6.875% 11/01/14 | 860,000 | 795,500 | |||||||||
| Williams Companies, Inc. | |||||||||||
| 6.375% 10/01/10 (a) | 190,000 | 185,963 | |||||||||
| 8.125% 03/15/12 | 1,315,000 | 1,377,462 | |||||||||
| 3,767,496 | |||||||||||
| 13,300,252 | |||||||||||
| Financials (2.6%) | |||||||||||
| Diversified Financial Services (1.3%) | |||||||||||
| Finance-Investment Banker/Broker (1.3%) | |||||||||||
| E*Trade Financial Corp. | |||||||||||
| 7.375% 09/15/13 | 870,000 | 872,175 | |||||||||
| LaBranche & Co., Inc. | |||||||||||
| 11.000% 05/15/12 | 305,000 | 324,825 | |||||||||
| 1,197,000 | |||||||||||
| Real Estate Investment Trusts (REITs) (1.3%) | |||||||||||
| REITS-Hotels (0.8%) | |||||||||||
| Host Marriott LP | |||||||||||
| 6.375% 03/15/15 | 815,000 | 771,194 | |||||||||
See Accompanying Notes to Financial Statements.
55
CMG HIGH YIELD FUND
A Portfolio of Columbia Funds Institutional Trust
SCHEDULE OF INVESTMENTS
| Par | Value | ||||||||||
| Corporate Fixed-Income Bonds & Notes (continued) | |||||||||||
| REITS-Regional Malls (0.5%) | |||||||||||
| Rouse Co. LP | |||||||||||
| 6.750% 05/01/13 (a) | $ | 500,000 | $ | 495,038 | |||||||
| 1,266,232 | |||||||||||
| 2,463,232 | |||||||||||
| Industrials (14.2%) | |||||||||||
| Aerospace & Defense (2.3%) | |||||||||||
| Aerospace/Defense-Equipment (1.4%) | |||||||||||
| DRS Technologies, Inc. | |||||||||||
| 6.625% 02/01/16 | 700,000 | 673,750 | |||||||||
| Sequa Corp. | |||||||||||
| 9.000% 08/01/09 | 615,000 | 647,288 | |||||||||
| 1,321,038 | |||||||||||
| Electronics-Military (0.9%) | |||||||||||
| L-3 Communications Corp. | |||||||||||
| 6.375% 10/15/15 | 940,000 | 902,400 | |||||||||
| 2,223,438 | |||||||||||
| Electronics (0.4%) | |||||||||||
| Electronic Components-Miscellaneous (0.4%) | |||||||||||
| Flextronics International Ltd. | |||||||||||
| 6.250% 11/15/14 | 385,000 | 367,675 | |||||||||
| Environmental Control (1.2%) | |||||||||||
| Non-Hazardous Waste Disposal (1.2%) | |||||||||||
| Allied Waste North America, Inc. | |||||||||||
| 7.125% 05/15/16 (a) | 1,155,000 | 1,100,138 | |||||||||
| Machinery-Diversified (2.4%) | |||||||||||
| Machinery-General Industry (2.4%) | |||||||||||
| Manitowoc Co., Inc. | |||||||||||
| 7.125% 11/01/13 | 1,095,000 | 1,053,937 | |||||||||
| Westinghouse Air Brake Technologies Corp. | |||||||||||
| 6.875% 07/31/13 | 1,290,000 | 1,270,650 | |||||||||
| 2,324,587 | |||||||||||
| Miscellaneous Manufacturing (1.4%) | |||||||||||
| Diversified Manufacturing Operators (1.4%) | |||||||||||
| Bombardier, Inc. | |||||||||||
| 6.300% 05/01/14 (a) | 825,000 | 721,875 | |||||||||
| Trinity Industries, Inc. | |||||||||||
| 6.500% 03/15/14 | 635,000 | 615,950 | |||||||||
| 1,337,825 | |||||||||||
| Packaging & Containers (3.4%) | |||||||||||
| Containers-Metal/Glass (2.9%) | |||||||||||
| Ball Corp. | |||||||||||
| 6.875% 12/15/12 | 445,000 | 442,775 | |||||||||
See Accompanying Notes to Financial Statements.
56
CMG HIGH YIELD FUND
A Portfolio of Columbia Funds Institutional Trust
SCHEDULE OF INVESTMENTS
| Par | Value | ||||||||||
| Corporate Fixed-Income Bonds & Notes (continued) | |||||||||||
| Containers-Metal/Glass (continued) | |||||||||||
| Crown Americas LLC & Crown Americas Capital Corp. | |||||||||||
| 7.750% 11/15/15 (a) | $ | 725,000 | $ | 715,031 | |||||||
| Owens-Brockway Glass Container, Inc. | |||||||||||
| 8.875% 02/15/09 | 15,000 | 15,469 | |||||||||
| Owens-Illinois, Inc. | |||||||||||
| 7.500% 05/15/10 | 900,000 | 886,500 | |||||||||
| Silgan Holdings, Inc. | |||||||||||
| 6.750% 11/15/13 | 730,000 | 722,700 | |||||||||
| 2,782,475 | |||||||||||
| Containers-Paper/Plastic (0.5%) | |||||||||||
| Smurfit-Stone Container Corp. | |||||||||||
| 8.375% 07/01/12 | 555,000 | 527,944 | |||||||||
| 3,310,419 | |||||||||||
| Transportation (3.1%) | |||||||||||
| Transportation-Marine (2.7%) | |||||||||||
| Overseas Shipholding Group | |||||||||||
| 8.250% 03/15/13 | 855,000 | 884,925 | |||||||||
| Stena AB | |||||||||||
| 7.500% 11/01/13 | 640,000 | 619,200 | |||||||||
| Teekay Shipping Corp. | |||||||||||
| 8.875% 07/15/11 | 1,030,000 | 1,084,075 | |||||||||
| 2,588,200 | |||||||||||
| Transportation-Services (0.4%) | |||||||||||
| Offshore Logistics, Inc. | |||||||||||
| 6.125% 06/15/13 | 435,000 | 403,462 | |||||||||
| 2,991,662 | |||||||||||
| 13,655,744 | |||||||||||
| Technology (1.7%) | |||||||||||
| Office/Business Equipment (0.8%) | |||||||||||
| Office Automation & Equipment (0.8%) | |||||||||||
| Xerox Corp. | |||||||||||
| 6.400% 03/15/16 | 215,000 | 206,131 | |||||||||
| 7.125% 06/15/10 | 600,000 | 609,000 | |||||||||
| 815,131 | |||||||||||
| Semiconductors (0.9%) | |||||||||||
| Electronic Components-Semiconductors (0.9%) | |||||||||||
| Freescale Semiconductor, Inc. | |||||||||||
| 6.875% 07/15/11 | 830,000 | 842,450 | |||||||||
| 1,657,581 | |||||||||||
| Utilities (7.0%) | |||||||||||
| Electric (7.0%) | |||||||||||
| Electric-Generation (2.0%) | |||||||||||
| AES Corp. | |||||||||||
| 7.750% 03/01/14 | 1,335,000 | 1,348,350 | |||||||||
| Edison Mission Energy | |||||||||||
| 7.730% 06/15/09 | 590,000 | 598,850 | |||||||||
| 1,947,200 | |||||||||||
See Accompanying Notes to Financial Statements.
57
CMG HIGH YIELD FUND
A Portfolio of Columbia Funds Institutional Trust
SCHEDULE OF INVESTMENTS
| Par | Value | ||||||||||
| Corporate Fixed-Income Bonds & Notes (continued) | |||||||||||
| Electric-Integrated (3.0%) | |||||||||||
| CMS Energy Corp. | |||||||||||
| 6.875% 12/15/15 | $ | 310,000 | $ | 297,600 | |||||||
| 8.500% 04/15/11 | 260,000 | 273,650 | |||||||||
| Nevada Power Co. | |||||||||||
| 5.875% 01/15/15 | 705,000 | 679,366 | |||||||||
| 6.500% 04/15/12 | 585,000 | 588,877 | |||||||||
| NorthWestern Corp. | |||||||||||
| 5.875% 11/01/14 | 175,000 | 173,138 | |||||||||
| TECO Energy, Inc. | |||||||||||
| 7.000% 05/01/12 | 840,000 | 840,000 | |||||||||
| 2,852,631 | |||||||||||
| Independent Power Producer (2.0%) | |||||||||||
| Mirant North America LLC | |||||||||||
| 7.375% 12/31/13 (a) | 935,000 | 898,769 | |||||||||
| MSW Energy Holdings II LLC | |||||||||||
| 7.375% 09/01/10 | 540,000 | 540,000 | |||||||||
| NRG Energy, Inc. | |||||||||||
| 7.250% 02/01/14 | 130,000 | 127,237 | |||||||||
| 7.375% 02/01/16 | 380,000 | 371,450 | |||||||||
| 1,937,456 | |||||||||||
| 6,737,287 | |||||||||||
| Total Corporate Fixed-Income Bonds & Notes (Cost of $93,304,851) | 89,594,620 | ||||||||||
| Short-Term Obligation (5.1%) | |||||||||||
| Repurchase agreement with State Street Bank & Trust Co., dated 07/31/06, due 08/01/06 at 5.160%, collateralized by a U.S. Treasury Note maturing 02/28/11, market value of $5,026,275 (repurchase proceeds $4,924,706) | 4,924,000 | 4,924,000 | |||||||||
| Total Short-Term Obligation (Cost of $4,924,000) | 4,924,000 | ||||||||||
| Total Investments (98.3%) (Cost of $98,228,851) (c) | 94,518,620 | ||||||||||
| Other Assets & Liabilities, Net (1.7%) | 1,601,553 | ||||||||||
| Net Assets (100.0%) | $ | 96,120,173 | |||||||||
| Notes to Schedule of Investments: | |||||||||||
(a) Security exempt from registration pursuant to Rule 144A under the Securities Act of 1933. These securities may be resold in transactions exempt from registration, normally to qualified institutional buyers. At July 31, 2006, these securities, which are not illiquid, amounted to $9,467,857, which represents 9.9% of net assets.
(b) The interest rate shown on floating rate or variable rate securities reflects the rate at July 31, 2006.
(c) Cost for federal income tax purposes is $98,796,175.
See Accompanying Notes to Financial Statements.
58
CMG HIGH YIELD FUND
A Portfolio of Columbia Funds Institutional Trust
SCHEDULE OF INVESTMENTS
At July 31, 2006, the asset allocation of the Fund is as follows:
| % of Asset Allocation (Unaudited) | Net Assets | ||||||
| Consumer Cyclical | 18.4 | % | |||||
| Consumer Non-Cyclical | 16.1 | ||||||
| Industrials | 14.2 | ||||||
| Communications | 14.2 | ||||||
| Energy | 13.8 | ||||||
| Utilities | 7.0 | ||||||
| Basic Materials | 5.2 | ||||||
| Financials | 2.6 | ||||||
| Technology | 1.7 | ||||||
| Short-Term Obligation | 5.1 | ||||||
| Other Assets & Liabilities, Net | 1.7 | ||||||
| 100.0 | % | ||||||
See Accompanying Notes to Financial Statements.
59
STATEMENTS OF ASSETS AND LIABILITIES
July 31, 2006
| CMG Core Bond Fund | CMG Short Term Bond Fund | CMG Ultra Short Term Bond Fund | CMG High Yield Fund | ||||||||||||||||
| ASSETS: | |||||||||||||||||||
| Unaffiliated investments, at identified cost (including repurchase agreements) | $ | 60,073,416 | $ | 88,173,499 | $ | 89,924,313 | $ | 98,228,851 | |||||||||||
| Affiliated investments, at identified cost | 88,706 | 533,750 | - | - | |||||||||||||||
| Unaffiliated investments, at value | $ | 54,773,331 | $ | 77,669,262 | $ | 85,183,041 | $ | 89,594,620 | |||||||||||
| Affiliated investments, at value | 90,518 | 502,875 | - | - | |||||||||||||||
| Repurchase agreement | 4,210,000 | 9,760,000 | 4,267,000 | 4,924,000 | |||||||||||||||
| Total investments, at value | 59,073,849 | 87,932,137 | 89,450,041 | 94,518,620 | |||||||||||||||
| Cash | 320 | 335 | 782 | 779 | |||||||||||||||
| Receivable for: | |||||||||||||||||||
| Capital stock sold | - | - | - | 245,028 | |||||||||||||||
| Interest | 526,341 | 591,933 | 681,192 | 1,717,811 | |||||||||||||||
| Foreign tax reclaim | 1,025 | - | - | - | |||||||||||||||
| Expense reimbursement due from Investment Advisor | 15,903 | 14,140 | 16,473 | 18,574 | |||||||||||||||
| Deferred Trustees' compensation plan | 4,157 | 5,467 | 3,238 | 8,446 | |||||||||||||||
| Total Assets | 59,621,595 | 88,544,012 | 90,151,726 | 96,509,258 | |||||||||||||||
| LIABILITIES: | |||||||||||||||||||
| Payable for: | |||||||||||||||||||
| Investments purchased | - | 1,503,702 | - | - | |||||||||||||||
| Investments purchased on a delayed delivery basis | 3,230,883 | 2,794,837 | - | - | |||||||||||||||
| Capital stock redeemed | - | 33,643 | - | 875 | |||||||||||||||
| Distributions | 155,178 | 164,572 | 230,249 | 302,536 | |||||||||||||||
| Investment advisory fee | 12,882 | 19,400 | 18,402 | 31,838 | |||||||||||||||
| Trustees' fees | 467 | 457 | 581 | 1,146 | |||||||||||||||
| Audit fee | 35,950 | 36,650 | 34,650 | 40,350 | |||||||||||||||
| Deferred Trustees' compensation plan | 4,157 | 5,467 | 3,238 | 8,446 | |||||||||||||||
| Other liabilities | 974 | 1,124 | 1,254 | 3,894 | |||||||||||||||
| Total liabilities | 3,440,491 | 4,559,852 | 288,374 | 389,085 | |||||||||||||||
| NET ASSETS | $ | 56,181,104 | $ | 83,984,160 | $ | 89,863,352 | $ | 96,120,173 | |||||||||||
| NET ASSETS consist of: | |||||||||||||||||||
| Paid-in capital | $ | 58,914,800 | $ | 89,628,207 | $ | 91,967,837 | $ | 148,616,601 | |||||||||||
| Overdistributed net investment income | (76,968 | ) | (196,999 | ) | (397,427 | ) | (565,665 | ) | |||||||||||
| Accumulated net realized loss | (1,568,455 | ) | (4,671,936 | ) | (1,232,786 | ) | (48,220,532 | ) | |||||||||||
| Net unrealized depreciation on investments | (1,088,273 | ) | (775,112 | ) | (474,272 | ) | (3,710,231 | ) | |||||||||||
| NET ASSETS | $ | 56,181,104 | $ | 83,984,160 | $ | 89,863,352 | $ | 96,120,173 | |||||||||||
| Shares of capital stock outstanding | 5,590,675 | 7,245,819 | 9,341,068 | 12,549,246 | |||||||||||||||
| Net asset value, offering and redemption price per share | $ | 10.05 | $ | 11.59 | $ | 9.62 | $ | 7.66 | |||||||||||
See Accompanying Notes to Financial Statements.
60
STATEMENTS OF OPERATIONS
For the Year Ended July 31, 2006
| CMG Core Bond Fund | CMG Short Term Bond Fund | CMG Ultra Short Term Bond Fund | CMG High Yield Fund | ||||||||||||||||
| NET INVESTMENT INCOME: | |||||||||||||||||||
| Income: | |||||||||||||||||||
| Interest | $ | 2,998,188 | $ | 3,457,604 | $ | 3,519,516 | $ | 12,796,940 | |||||||||||
| Interest from affiliates | 6,199 | 34,440 | 22,566 | - | |||||||||||||||
| Total investment income | 3,004,387 | 3,492,044 | 3,542,082 | 12,796,940 | |||||||||||||||
| Expenses: | |||||||||||||||||||
| Investment advisory fee | 153,161 | 191,752 | 211,656 | 755,331 | |||||||||||||||
| Trustees' fees | 13,112 | 13,546 | 14,286 | 21,373 | |||||||||||||||
| Audit fee | 41,607 | 42,384 | 38,819 | 45,049 | |||||||||||||||
| Non-recurring costs (See Note 10) | 774 | 912 | 997 | 2,550 | |||||||||||||||
| Other expenses | 4,233 | 5,064 | 5,705 | 16,918 | |||||||||||||||
| Total expenses | 212,887 | 253,658 | 271,463 | 841,221 | |||||||||||||||
| Expense reimbursement from Investment Advisor | (58,952 | ) | (60,994 | ) | (58,810 | ) | (80,689 | ) | |||||||||||
| Non-recurring costs assumed by Investment Advisor (See Note 10) | (774 | ) | (912 | ) | (997 | ) | (2,550 | ) | |||||||||||
| Net expenses | 153,161 | 191,752 | 211,656 | 757,982 | |||||||||||||||
| Net investment income | 2,851,226 | 3,300,292 | 3,330,426 | 12,038,958 | |||||||||||||||
| NET REALIZED AND UNREALIZED GAIN (LOSS) ON INVESTMENTS AND FUTURES CONTRACTS: | |||||||||||||||||||
| Net realized gain (loss) on: | |||||||||||||||||||
| Unaffiliated investments | (1,319,006 | ) | (640,244 | ) | (140,203 | ) | (1,263,762 | ) | |||||||||||
| Affiliated investments | - | - | (41,787 | ) | - | ||||||||||||||
| Futures contracts | 83,606 | 105,589 | - | - | |||||||||||||||
| Net realized loss | (1,235,400 | ) | (534,655 | ) | (181,990 | ) | (1,263,762 | ) | |||||||||||
| Net change in unrealized appreciation (depreciation) on: | |||||||||||||||||||
| Investments | (807,623 | ) | (238,635 | ) | 60,266 | (7,431,304 | ) | ||||||||||||
| Futures contracts | (49,688 | ) | (49,687 | ) | - | - | |||||||||||||
| Net change in unrealized appreciation (depreciation) | (857,311 | ) | (288,322 | ) | 60,266 | (7,431,304 | ) | ||||||||||||
| Net loss | (2,092,711 | ) | (822,977 | ) | (121,724 | ) | (8,695,066 | ) | |||||||||||
| NET INCREASE IN NET ASSETS FROM OPERATIONS | $ | 758,515 | $ | 2,477,315 | $ | 3,208,702 | $ | 3,343,892 | |||||||||||
See Accompanying Notes to Financial Statements.
61
STATEMENTS OF CHANGES IN NET ASSETS
| CMG Core Bond Fund | CMG Short Term Bond Fund | ||||||||||||||||||
| Year Ended July 31, | Year Ended July 31, | ||||||||||||||||||
| 2006 | 2005 | 2006 | 2005 | ||||||||||||||||
| Operations: | |||||||||||||||||||
| Net investment income | $ | 2,851,226 | $ | 2,383,988 | $ | 3,300,292 | $ | 3,601,627 | |||||||||||
| Net realized gain (loss) on investments and futures contracts | (1,235,400 | ) | 176,270 | (534,655 | ) | (176,900 | ) | ||||||||||||
| Net change in unrealized appreciation (depreciation) on investments and futures contracts | (857,311 | ) | (216,570 | ) | (288,322 | ) | (877,571 | ) | |||||||||||
| Net increase from operations | 758,515 | 2,343,688 | 2,477,315 | 2,547,156 | |||||||||||||||
| Distributions declared to shareholders: | |||||||||||||||||||
| From net investment income | (3,061,621 | ) | (2,560,924 | ) | (3,690,742 | ) | (4,015,551 | ) | |||||||||||
| From net realized gains | (21,839 | ) | - | - | - | ||||||||||||||
| Total distributions declared to shareholders | (3,083,460 | ) | (2,560,924 | ) | (3,690,742 | ) | (4,015,551 | ) | |||||||||||
| Share transactions: | |||||||||||||||||||
| Subscriptions | 12,221,511 | 58,926,891 | 30,797,725 | 26,264,611 | |||||||||||||||
| Distributions reinvested | 750,818 | 329,461 | 1,914,965 | 2,577,783 | |||||||||||||||
| Redemptions | (33,568,744 | ) | (12,746,687 | ) | (43,357,147 | ) | (50,657,075 | ) | |||||||||||
| Net increase (decrease) in share transactions | (20,596,415 | ) | 46,509,665 | (10,644,457 | ) | (21,814,681 | ) | ||||||||||||
| Net increase (decrease) in net assets | (22,921,360 | ) | 46,292,429 | (11,857,884 | ) | (23,283,076 | ) | ||||||||||||
| NET ASSETS: | |||||||||||||||||||
| Beginning of period | 79,102,464 | 32,810,035 | 95,842,044 | 119,125,120 | |||||||||||||||
| End of period | $ | 56,181,104 | $ | 79,102,464 | $ | 83,984,160 | $ | 95,842,044 | |||||||||||
| Overdistributed net investment income | $ | (76,968 | ) | $ | (129,609 | ) | $ | (196,999 | ) | $ | (402,571 | ) | |||||||
| Changes in shares: | |||||||||||||||||||
| Subscriptions | 1,194,394 | 5,606,416 | 2,641,344 | 2,196,838 | |||||||||||||||
| Issued for distributions reinvested | 73,922 | 31,434 | 164,066 | 216,646 | |||||||||||||||
| Redemptions | (3,269,168 | ) | (1,214,434 | ) | (3,691,976 | ) | (4,251,192 | ) | |||||||||||
| Net increase (decrease) | (2,000,852 | ) | 4,423,416 | (886,566 | ) | (1,837,708 | ) | ||||||||||||
See Accompanying Notes to Financial Statements.
62
STATEMENTS OF CHANGES IN NET ASSETS
| CMG Ultra Short Term Bond Fund | CMG High Yield Fund | ||||||||||||||||||
| Year Ended July 31, | Year Ended July 31, | ||||||||||||||||||
| 2006 | 2005 | 2006 | 2005 | ||||||||||||||||
| Operations: | |||||||||||||||||||
| Net investment income | $ | 3,330,426 | $ | 1,798,336 | $ | 12,038,958 | $ | 21,282,171 | |||||||||||
| Net realized gain (loss) on investments | (181,990 | ) | (23,356 | ) | (1,263,762 | ) | 8,588,241 | ||||||||||||
| Net change in unrealized appreciation (depreciation) on investments | 60,266 | (366,837 | ) | (7,431,304 | ) | (3,213,339 | ) | ||||||||||||
| Net increase from operations | 3,208,702 | 1,408,143 | 3,343,892 | 26,657,073 | |||||||||||||||
| Distributions declared to shareholders: | |||||||||||||||||||
| From net investment income | (3,636,758 | ) | (2,717,420 | ) | (12,800,444 | ) | (22,727,424 | ) | |||||||||||
| Return of capital | (1,580 | ) | (206,594 | ) | - | - | |||||||||||||
| Total distributions declared to shareholders | (3,638,338 | ) | (2,924,014 | ) | (12,800,444 | ) | (22,727,424 | ) | |||||||||||
| Share transactions: | |||||||||||||||||||
| Subscriptions | 25,443,944 | 36,802,190 | 12,320,348 | 32,168,726 | |||||||||||||||
| Distributions reinvested | 1,242,616 | 1,256,886 | 8,511,776 | 17,597,737 | |||||||||||||||
| Redemptions | (17,968,775 | ) | (22,203,245 | ) | (184,498,010 | ) | (166,610,851 | ) | |||||||||||
| Net increase (decrease) in share transactions | 8,717,785 | 15,855,831 | (163,665,886 | ) | (116,844,388 | ) | |||||||||||||
| Net increase (decrease) in net assets | 8,288,149 | 14,339,960 | (173,122,438 | ) | (112,914,739 | ) | |||||||||||||
| NET ASSETS: | |||||||||||||||||||
| Beginning of period | 81,575,203 | 67,235,243 | 269,242,611 | 382,157,350 | |||||||||||||||
| End of period | $ | 89,863,352 | $ | 81,575,203 | $ | 96,120,173 | $ | 269,242,611 | |||||||||||
| Overdistributed net investment income | $ | (397,427 | ) | $ | (596,700 | ) | $ | (565,665 | ) | $ | (1,346,465 | ) | |||||||
| Changes in shares: | |||||||||||||||||||
| Subscriptions | 2,640,382 | 3,774,819 | 1,561,452 | 3,950,673 | |||||||||||||||
| Issued for distributions reinvested | 128,967 | 128,653 | 1,075,896 | 2,166,477 | |||||||||||||||
| Redemptions | (1,863,156 | ) | (2,274,518 | ) | (23,417,941 | ) | (20,573,327 | ) | |||||||||||
| Net increase (decrease) | 906,193 | 1,628,954 | (20,780,593 | ) | (14,456,177 | ) | |||||||||||||
See Accompanying Notes to Financial Statements.
63
NOTES TO FINANCIAL STATEMENTS
July 31, 2006
Note 1. Organization
Columbia Funds Institutional Trust (the "Trust") is a Massachusetts business trust registered under the Investment Company Act of 1940, as amended, as an open-end management investment company. Information presented in these financial statements pertains to the following diversified funds (individually referred to as a "Fund", collectively referred to as the "Funds"):
CMG Core Bond Fund
CMG Short Term Bond Fund
CMG Ultra Short Term Bond Fund
CMG High Yield Fund
Shares in the Funds are available for purchase by institutional buyers and certain advisory clients of Columbia Management Advisors, LLC ("Columbia") or one of its affiliates. Each Fund's minimum initial investment requirement for investors purchasing shares directly from Columbia is $3 million. Each Fund may waive the investment minimum in their sole discretion. Please see the Funds' prospectus for further details.
Effective March 27, 2006, each Fund was redomiciled into a new series of Columbia Funds Institutional Trust. Prior to March 27, 2006, each Fund was a series of CMG Fund Trust.
Investment goals. CMG Core Bond Fund seeks a high level of current income consistent with capital preservation. CMG Short Term Bond Fund seeks a high level of current income consistent with a high degree of stability of principal. CMG Ultra Short Term Bond Fund seeks a high level of current income consistent with the maintenance of liquidity and the preservation of capital. CMG High Yield Fund seeks a high level of current income. Capital appreciation is a secondary objective when consistent with a high level of current income.
Fund shares. Each Fund may issue an unlimited number of shares of no par value capital stock, which are offered continuously at net asset value.
Note 2. Significant accounting policies
Use of estimates. The preparation of financial statements in conformity with accounting principles generally accepted in the United States of America ("GAAP") requires management to make estimates and assumptions that affect the reported amounts of assets and liabilities, the disclosure of contingent assets and liabilities at the date of the financial statements and the reported amounts of revenue and expenses during the reporting period. Actual results could differ from those estimates. The following is a summary of significant accounting policies consistently followed by the Funds in the preparation of their financial statements.
Security valuation. Debt securities generally are valued by pricing services approved by the Trust's Board of Trustees, based upon market transactions for normal, institutional-size trading units of similar securities. The services may use various pricing techniques which take into account appropriate factors such as yield, quality, coupon rate, maturity, type of issue, trading characteristics and other data, as well as broker quotes. Debt securities for which quotations are readily available are valued at an over-the-counter or exchange bid quotation. Certain debt securities, which tend to be more thinly traded and of lesser quality, are priced based on fundamental analysis of the financial condition of the issuer and the estimated value of any collateral. Valuations developed through pricing techniques may vary from the actual amounts realized upon sale of the securities, and the potential variation may be greater for those securities valued using fundamental analysis.
64
NOTES TO FINANCIAL STATEMENTS (continued)
July 31, 2006
Short-term debt obligations maturing within 60 days are valued at amortized cost, which approximates market value.
Futures contracts are valued at the settlement price established each day by the board of trade or exchange on which they are traded.
Investments for which market quotations are not readily available, or that have quotations which management believes are not appropriate, are valued at fair value as determined in good faith under consistently applied procedures established by and under the general supervision of the Board of Trustees. If a security is valued at "fair value", such value is likely to be different from the last quoted market price for the security.
Security transactions. Security transactions are accounted for on the trade date. Cost is determined and gains (losses) are based upon the specific identification method for both financial statement and federal income tax purposes.
Futures contracts. Each Fund may invest in futures contracts to hedge against the effects of changes in the value of portfolio securities due to anticipated changes in interest rates and/or market conditions, for duration management, or when the transactions are economically appropriate to the reduction of risk inherent in the management of the Funds and not for trading purposes. The use of futures contracts involves certain risks, which include: (1) imperfect correlation between the price movement of the instruments and the underlying securities, (2) inability to close out positions due to differing trading hours, or the temporary absence of a liquid market, for either the instrument or the underlying securities, or (3) an inaccurate prediction by Columbia Management Advisors, LLC of the future direction of interest rates. Any of these risks may involve amo unts exceeding the variation margin recorded in the Funds' Statements of Assets and Liabilities at any given time.
Upon entering into a futures contract, each Fund deposits cash or securities with the broker in an amount sufficient to meet the initial margin requirement. Subsequent payments are made or received by the Funds equal to the daily change in the contract value and are recorded as variation margin receivable or payable and offset in unrealized gains or losses. The Funds recognize a realized gain or loss when the contract is closed or expires.
Repurchase agreements. Each Fund may engage in repurchase agreement transactions with institutions that the Funds' investment advisor has determined are creditworthy. Each Fund, through its custodian, receives delivery of underlying securities collateralizing a repurchase agreement. Collateral is at least equal, at all times, to the value of the repurchase obligation including interest. A repurchase agreement transaction involves certain risks in the event of default or insolvency of the counterparty. These risks include possible delays or restrictions upon each Fund's ability to dispose of the underlying securities and a possible decline in the value of the underlying securities during the period while the Funds seek to assert their rights.
Delayed delivery securities. The Funds may trade securities on other than normal settlement terms, including securities purchased or sold on a "when-issued" basis. This may increase the risk if the other party to the transaction fails to deliver and causes the Funds to subsequently invest at less advantageous prices. The Funds identify liquid portfolio securities in their records in amounts equal to the delayed delivery commitments.
Treasury Inflation Indexed Securities. The Funds may invest in Treasury Inflation-Indexed Securities ("TIPS"). The principal amount of TIPS is adjusted periodically for inflation based on a monthly published index. Interest payments are based on the inflation-adjusted principal at the time the interest is paid.
Stripped securities. Stripped mortgage-backed securities are derivative multi-class mortgage securities structured so that one receives most, if not all, of the principal from the underlying mortgage assets, while the other class receives most, if not all, of the interest and the remainder of the principal. If the underlying mortgage assets experience greater than anticipated prepayments of principal, a Fund may fail to fully recoup its initial investment in an interest-only security. The market value of these securities consisting entirely of principal or interest payments can be extremely
65
NOTES TO FINANCIAL STATEMENTS (continued)
July 31, 2006
volatile in response to changes in interest rates. Credit risk reflects the risk that a Fund may not receive all or part of its principal because the issuer or credit enhancer has defaulted on its obligation.
Mortgage dollar rolls. The Funds may enter into mortgage "dollar rolls" in which the Funds sell securities for delivery in the current month and simultaneously contract with the same counterparty to repurchase similar (same type, coupon and maturity) but not identical securities on a specified future date not exceeding 120 days. During the roll period, the Funds lose the right to receive principal and interest paid on the securities sold. However, the Funds would benefit to the extent of any difference between the price received for the securities sold and the lower forward price for the future purchase (often referred to as the "drop") or fee income plus the interest earned on the cash proceeds of the securities sold until the settlement date of the forward purchase. Unless such benefits exceed the income, capital appreciation and gain or loss due to mortga ge prepayments that would have been realized on the securities sold as part of the mortgage dollar roll, the use of this technique will diminish the investment performance of the Funds compared with what such performance would have been without the use of mortgage dollar rolls. All cash proceeds will be invested in instruments that are permissible investments for the Funds. The Funds will hold and maintain in segregated accounts until the settlement date, cash or liquid securities in amounts equal to the forward purchase price.
The Funds' policy is to record the components of dollar rolls using "to be announced" mortgage-backed securities ("TBA Dollar Rolls"). For financial reporting and tax purposes, the Funds treat mortgage dollar rolls as two separate transactions, one involving the purchase of a security and a separate transaction involving a sale. The Funds do not currently enter into mortgage dollar rolls that are accounted for as a financing.
Mortgage dollar rolls involve certain risks. If the broker-dealer to whom the Funds sell the security becomes insolvent, the Funds' right to purchase or repurchase the mortgage-related securities may be restricted and the instrument which the Funds are required to repurchase may be worth less than an instrument which the Funds originally held. Successful use of mortgage dollar rolls may depend upon the Advisor's ability to predict correctly interest rates and mortgage prepayments. For these reasons, there is no assurance that mortgage dollar rolls can be successfully employed.
Income recognition. Interest income is recorded on the accrual basis and includes accretion of discounts, amortization of premiums and paydown gains and losses, net of any non-reclaimable tax withholdings of foreign securities.
Federal income tax status. Each Fund intends to qualify each year as a "regulated investment company" under Subchapter M of the Internal Revenue Code, as amended, and will distribute substantially all of its taxable income, if any, for its tax year, and as such will not be subject to federal income taxes. In addition, each Fund intends to distribute in each calendar year substantially all of its net investment income, capital gains and certain other amounts, if any, such that each Fund should not be subject to federal excise tax. Therefore, no federal income or excise tax provision is recorded.
Distributions to shareholders. Dividends from net investment income, if any, are generally declared daily and paid monthly. Net realized capital gains, if any, are distributed at least annually.
Note 3. Federal tax information
The timing and character of income and capital gain distributions are determined in accordance with income tax regulations, which may differ from GAAP. Reclassifications are made to the Funds' capital accounts for permanent tax differences to reflect income and gains available for distribution (or available capital loss carryforwards) under income tax regulations.
66
NOTES TO FINANCIAL STATEMENTS (continued)
July 31, 2006
For the year ended July 31, 2006, permanent book and tax basis differences resulting primarily from differing treatments for distribution reclassifications, amortization/accretion adjustments and paydown gain/loss reclassifications were identified and reclassified among the components of the Funds' net assets as follows:
| Overdistributed Net Investment Income | Accumulated Net Realized Loss | Paid-In Capital | |||||||||||||
| CMG Core Bond Fund | $ | 263,036 | $ | (263,036 | ) | $ | - | ||||||||
| CMG Short Term Bond Fund | 596,022 | (595,761 | ) | (261 | ) | ||||||||||
| CMG Ultra Short Term Bond Fund | 505,605 | (505,606 | ) | 1 | |||||||||||
| CMG High Yield Fund | 1,542,286 | (1,542,284 | ) | (2 | ) | ||||||||||
Net investment income and net realized gains (losses), as disclosed on the Statements of Operations, and net assets were not affected by these reclassifications.
The tax character of distributions paid during the years ended July 31, 2006 and July 31, 2005 was as follows:
| July 31, 2006 | |||||||||||||||
| Ordinary Income* | Long-Term Capital Gains | Tax Return of Capital | |||||||||||||
| CMG Core Bond Fund | $ | 3,064,202 | $ | 19,258 | $ | - | |||||||||
| CMG Short Term Bond Fund | 3,690,742 | - | - | ||||||||||||
| CMG Ultra Short Term Bond Fund | 3,636,758 | - | 1,580 | ||||||||||||
| CMG High Yield Fund | 12,800,444 | - | - | ||||||||||||
| July 31, 2005 | |||||||||||||||
| Ordinary Income* | Long-Term Capital Gains | Tax Return of Capital | |||||||||||||
| CMG Core Bond Fund | $ | 2,560,924 | $ | - | $ | - | |||||||||
| CMG Short Term Bond Fund | 4,015,551 | - | - | ||||||||||||
| CMG Ultra Short Term Bond Fund | 2,717,420 | - | 206,594 | ||||||||||||
| CMG High Yield Fund | 22,727,424 | - | - | ||||||||||||
*For tax purposes short-term capital gains distributions, if any, are considered ordinary income distributions.
As of July 31, 2006, the components of distributable earnings on a tax basis were as follows:
| Undistributed Ordinary Income | Undistributed Long-Term Capital Gains | Net Unrealized Depreciation* | |||||||||||||
| CMG Core Bond Fund | $ | 184,443 | $ | - | $ | (1,287,012 | ) | ||||||||
| CMG Short Term Bond Fund | 291,679 | - | (1,101,467 | ) | |||||||||||
| CMG Ultra Short Term Bond Fund | - | - | (637,504 | ) | |||||||||||
| CMG High Yield Fund | 314,008 | - | (4,277,555 | ) | |||||||||||
*The differences between book-basis and tax-basis net unrealized appreciation/depreciation are primarily due to deferral of losses from wash sales and amortization/accretion adjustments.
67
NOTES TO FINANCIAL STATEMENTS (continued)
July 31, 2006
Unrealized appreciation and depreciation at July 31, 2006, based on cost of investments for federal income tax purposes was:
| Unrealized Appreciation | Unrealized Depreciation | Net Unrealized Depreciation | |||||||||||||
| CMG Core Bond Fund | $ | 134,741 | $ | (1,421,753 | ) | $ | (1,287,012 | ) | |||||||
| CMG Short Term Bond Fund | 83,188 | (1,184,655 | ) | (1,101,467 | ) | ||||||||||
| CMG Ultra Short Term Bond Fund | 40,581 | (678,085 | ) | (637,504 | ) | ||||||||||
| CMG High Yield Fund | 238,103 | (4,515,658 | ) | (4,277,555 | ) | ||||||||||
The following capital loss carryforwards, determined as of July 31, 2006, may be available to reduce taxable income arising from future net realized gains on investments, if any, to the extent permitted by the Internal Revenue Code:
| 2008 | 2009 | 2010 | 2012 | 2013 | 2014 | Total | |||||||||||||||||||||||||
| CMG Core Bond Fund | $ | - | $ | - | $ | - | $ | - | $ | - | $ | 304,526 | $ | 304,526 | |||||||||||||||||
| CMG Short Term Bond Fund | 537,548 | - | 2,365,257 | 19,156 | 25,391 | 989,127 | 3,936,479 | ||||||||||||||||||||||||
| CMG Ultra Short Term Bond Fund | - | - | - | 29,640 | 47,961 | 627,248 | 704,849 | ||||||||||||||||||||||||
| CMG High Yield Fund | - | 20,046,499 | 25,194,365 | - | - | - | 45,240,864 | ||||||||||||||||||||||||
Capital loss carryforwards of $152,878, for CMG High Yield Fund, were utilized during the year ended July 31, 2006. Expired capital loss carryforwards are recorded as a reduction of paid-in capital.
Utilization of these losses could be subject to limitations imposed by the Internal Revenue Code.
Under current tax rules, certain capital losses realized after October 31 may be deferred and treated as occurring on the first day of the following fiscal year. As of July 31, 2006, post-October capital losses attributed to security transactions were deferred to August 1, 2006, as follows:
| Capital Losses | |||||||
| CMG Core Bond Fund | $ | 1,166,490 | |||||
| CMG Short Term Bond Fund | 727,380 | ||||||
| CMG Ultra Short Term Bond Fund | 527,938 | ||||||
| CMG High Yield Fund | 2,979,541 | ||||||
In June 2006, the Financial Accounting Standards Board ("FASB") issued FASB Interpretation No. 48, Accounting for Uncertainty in Income Taxes, an Interpretation of FASB Statement 109 (the "Interpretation"). This Interpretation is effective for fiscal years beginning after December 15, 2006 and is to be applied to open tax positions upon initial adoption. This Interpretation prescribes a minimum recognition threshold and measurement method for the financial statement recognition of tax positions taken or expected to be taken in a tax return and also requires certain expanded disclosures. Management has recently begun to evaluate the application of this Interpretation to the Funds and has not at this time quantified the impact, if any, resulting from the adoption of this Interpretat ion on the Funds' financial statements.
68
NOTES TO FINANCIAL STATEMENTS (continued)
July 31, 2006
Note 4. Fees and compensation paid to affiliates
Investment advisory fee. Columbia Management Advisors, LLC ("Columbia"), an indirect, wholly-owned subsidiary of Bank of America Corporation ("BOA"), is the investment advisor to the Funds. Prior to September 30, 2005, Columbia Management Advisors, Inc. was the investment advisor to the Funds under the same fee structure. On September 30, 2005, Columbia Management Advisors, Inc. merged into Banc of America Capital Management, LLC. At that time, the investment advisor was then renamed Columbia Management Advisors, LLC.
Each Fund's investment advisory fee is a unified fee. Columbia, out of the unified fee it receives from the Funds, pays all accounting fees, legal fees, transfer agent fees, custody fees, expenses of the Chief Compliance Officer, fees for Sarbanes-Oxley compliance, the commitment fee for the line of credit and miscellaneous expenses of the Funds. The unified fee does not include brokerage fees, taxes, Trustees' fees, Trustee legal counsel fees, audit fees, interest expense associated with any borrowings by the Funds or extraordinary expenses, if any. The unified fees are paid monthly to Columbia based on each Fund's average daily net assets at the following annual rates:
| CMG Core Bond Fund | 0.25 | % | |||||
| CMG Short Term Bond Fund | 0.25 | % | |||||
| CMG Ultra Short Term Bond Fund | 0.25 | % | |||||
| CMG High Yield Fund | 0.40 | % | |||||
Pricing & bookkeeping fees. Columbia is responsible for providing pricing and bookkeeping services to each Fund under a pricing, bookkeeping and fund administration agreement. Under a separate agreement (the "Outsourcing Agreement"), Columbia has delegated certain of those functions to State Street Corporation ("State Street"). As a result, Columbia pays fees to State Street under the Outsourcing Agreement. The pricing and bookkeeping fees for the Funds are included in the unified fee.
Transfer agent fee. Columbia Management Services, Inc. (formerly Columbia Funds Services, Inc.) (the "Transfer Agent"), an affiliate of Columbia and an indirect, wholly-owned subsidiary of BOA, provides shareholder services to the Fund and has contracted with Boston Financial Data Services ("BFDS") to serve as sub-transfer agent. The transfer agent fees for the Funds are included in the unified fee. The Transfer Agent may also retain, as additional compensation for its services, fees for wire, telephone and redemption orders, IRA trustee agent fees and account transcript fees due the Transfer Agent from shareholders of the Fund and credits (net of bank charges) earned with respect to balances in accounts the Transfer Agent maintains in connection with its services to the Fund.
Fee waivers. Columbia has contractually agreed to reimburse the Funds through March 1, 2009 for certain expenses so that the expenses incurred by the Funds, including the investment advisory fees, will not exceed the following annual rates based on each Fund's average daily net assets:
| CMG Core Bond Fund | 0.25 | % | |||||
| CMG Short Term Bond Fund | 0.25 | % | |||||
| CMG Ultra Short Term Bond Fund | 0.25 | % | |||||
| CMG High Yield Fund | 0.40 | % | |||||
Fees paid to officers and trustees. All officers of the Funds, with the exception of the Funds' Chief Compliance Officer, are employees of Columbia or its affiliates and receive no compensation from the Funds. The Board of Trustees has appointed a Chief Compliance Officer to the Funds in accordance with federal securities regulations. The expenses of the Chief Compliance Officer are included in the unified fee.
69
NOTES TO FINANCIAL STATEMENTS (continued)
July 31, 2006
The Funds' Trustees may participate in a deferred compensation plan which may be terminated at any time. Obligations of the plan will be paid solely out of the Funds' assets.
Other. Columbia provides certain services to the Funds related to Sarbanes-Oxley compliance. The fees for such services are included in the unified fee.
Note 5. Portfolio information
For the year ended July 31, 2006, the cost of purchases and proceeds from sales of securities, excluding short-term obligations, were as follows:
| U.S. Government Securities | Other Investment Securities | ||||||||||||||||||
| Purchases | Sales | Purchases | Sales | ||||||||||||||||
| CMG Core Bond Fund | $ | 52,729,317 | $ | 63,866,940 | $ | 12,577,655 | $ | 23,745,786 | |||||||||||
| CMG Short Term Bond Fund | 53,993,354 | 53,553,820 | 39,303,113 | 54,496,736 | |||||||||||||||
| CMG Ultra Short Term Bond Fund | 22,105,839 | 11,128,399 | 43,785,502 | 26,152,746 | |||||||||||||||
| CMG High Yield Fund | - | - | 51,834,928 | 203,718,898 | |||||||||||||||
Note 6. Subscription in-kind
CMG Core Bond Fund received an in-kind contribution. Such contributions are accounted for at the fair market value of the in-kind securities contributed on the date of the contribution. The Fund's cost basis in securities contributed in-kind is generally established at their fair market value. For the year ended July 31, 2006, the total value of securities delivered through an in-kind contribution amounted to $8,687,151.
Note 7. Line of credit
The Funds and other affiliated funds participate in a $350,000,000 committed unsecured revolving line of credit provided by State Street Bank and Trust Company. Borrowings are used for temporary or emergency purposes to facilitate portfolio liquidity. Interest is charged to each participating fund based on its borrowings at a rate per annum equal to the Federal Funds rate plus 0.50%. In addition, a commitment fee of 0.10% per annum is accrued and apportioned among the participating funds based on their pro-rata portion of the unutilized line of credit. The commitment fee is included in "Other expenses" on the Statements of Operations.
For the year ended July 31, 2006, the Funds did not borrow under this arrangement.
Note 8. Shares of Beneficial Interest
As of July 31, 2006, the Funds had shareholders whose shares were beneficially owned by participant accounts over which Bank of America and/or its affiliates had either sole or joint investment discretion. Subscription and redemption
70
NOTES TO FINANCIAL STATEMENTS (continued)
July 31, 2006
activity of these accounts may have a significant effect on the operations of the Funds. The numbers of accounts and the percentages of shares of beneficial interest outstanding held therein are as follows:
| Number of Shareholders | % of Shares Outstanding Held | ||||||||||
| CMG Core Bond Fund | 1 | 85.0 | % | ||||||||
| CMG Short Term Bond Fund | 1 | 87.3 | % | ||||||||
| CMG Ultra Short Term Bond Fund | 1 | 99.9 | % | ||||||||
| CMG High Yield Fund | 1 | 62.9 | % | ||||||||
As of July 31, 2006, three of the Funds had shareholders that held greater than 5% of the shares outstanding and Bank of America and/or its affiliates did not have investment discretion. Subscription and redemption activity of these shareholders may have a material effect on the Funds. The numbers of accounts and the percentages of shares of beneficial interest outstanding held therein are as follows:
| Number of Shareholders | % of Shares Outstanding Held | ||||||||||
| CMG Core Bond Fund | 1 | 14.9 | % | ||||||||
| CMG Short Term Bond Fund | 1 | 5.3 | % | ||||||||
| CMG High Yield Fund | 1 | 11.8 | % | ||||||||
Note 9. Other related party transactions
During the year ended July 31, 2006, CMG High Yield Fund used Bank of America Securities, a wholly-owned subsidiary of BOA, as a broker. No commissions were paid to Bank of America Securities during the period.
Note 10. Disclosure of significant risks and contingencies
High-yield securities. Investing in high-yield securities may involve greater credit risk and considerations not typically associated with investing in U.S. government bonds and other higher quality fixed income securities. These securities are non-investment grade securities, often referred to as "junk" bonds. Economic downturns may disrupt the high yield market and impair the ability of issuers to repay principal and interest. Also, an increase in interest rates would likely have an adverse impact on the value of such obligations. Moreover, high-yield securities may be less liquid to the extent that there is no established secondary market.
Industry focus. The Funds may focus their investments in certain industries, subjecting them to greater risk than a fund that is more diversified.
Legal proceedings. On February 9, 2005, Columbia Management Advisors, Inc. (which has since merged into Banc of America Capital Management, LLC (now named Columbia Management Advisors, LLC)) ("Columbia") and Columbia Funds Distributor, Inc. (which has been renamed Columbia Management Distributors, Inc.) (the "Distributor") (collectively, the "Columbia Group") entered into an Assurance of Discontinuance with the New York Attorney General ("NYAG") (the "NYAG Settlement") and consented to the entry of a cease-and-desist order by the Securities and Exchange Commission ("SEC") (the "SEC Order"). The SEC Order and the NYAG Settlement are referred to
71
NOTES TO FINANCIAL STATEMENTS (continued)
July 31, 2006
collectively as the "Settlements". The Settlements contain substantially the same terms and conditions as outlined in the agreements in principle which Columbia Group entered into with the SEC and NYAG in March 2004.
Under the terms of the SEC Order, the Columbia Group agreed, among other things, to: pay $70 million in disgorgement and $70 million in civil money penalties; cease and desist from violations of the antifraud provisions and certain other provisions of the federal securities laws; maintain certain compliance and ethics oversight structures; retain an independent consultant to review the Columbia Group's applicable supervisory, compliance, control and other policies and procedures; and retain an independent distribution consultant (see below). The Columbia Funds have also voluntarily undertaken to implement certain governance measures designed to maintain the independence of their boards of trustees. The NYAG Settlement also, among other things, requires Columbia and its affiliates to reduce management fees for certain Columbia Funds (including the former Nations Funds) and other mutual funds collectively by $32 million per year f or five years, for a projected total of $160 million in management fee reductions.
Pursuant to the procedures set forth in the SEC order, the $140 million in settlement amounts described above will be distributed in accordance with a distribution plan developed by an independent distribution consultant and approved by the SEC. The independent distribution consultant has been in consultation with the staff of the SEC and has submitted a proposed plan of distribution. The SEC has not yet approved a final plan of distribution.
As a result of these matters or any adverse publicity or other developments resulting from them, there may be increased redemptions or reduced sales of fund shares, which could increase transaction costs or operating expenses, or have other adverse consequences for the funds.
A copy of the SEC Order is available on the SEC website at http://www.sec.gov. A copy of the NYAG Settlement is available as part of the Bank of America Corporation Form 8-K filing on February 10, 2005.
In connection with the events described in detail above, various parties have filed suit against certain funds, the Trustees of the Columbia Funds, FleetBoston Financial Corporation and its affiliated entities and/or Bank of America and its affiliated entities.
On February 20, 2004, the Judicial Panel on Multidistrict Litigation transferred these cases and cases against several other mutual fund companies based on similar allegations to the United States District Court in Maryland for consolidated or coordinated pretrial proceedings (the "MDL"). Subsequently, additional related cases were transferred to the MDL. On September 29, 2004, the plaintiffs in the MDL filed amended and consolidated complaints. One of these amended complaints is a putative class action that includes claims under the federal securities laws and state common law, and that names Columbia, the Distributor, the Trustees of the Columbia Funds, Bank of America Corporation and others as defendants. Another of the amended complaints is a derivative action purportedly on behalf of the Columbia Funds that asserts claims under federal securities laws and state common law.
On February 25, 2005, Columbia and other defendants filed motions to dismiss the claims in the pending cases. On March 1, 2006, for reasons stated in the court's memoranda dated November 3, 2005, the U.S. District Court for the District of Maryland granted in part and denied in part the defendants' motions to dismiss. The court dismissed all of the class action claims pending against the Columbia Funds Trusts and the Columbia Acorn Trusts. As to Columbia and the Distributor, the claims under the Securities Act of 1933, the claims under Sections 34(b) and 36(a) of the Investment Company Act of 1940 ("ICA") and the state law claims were dismissed. The claims under Sections 10(b) and 20(a) of the Securities Exchange Act of 1934 and claims under Section 36(b) of the ICA along with related claims under Section 48(a) of the ICA were not dismissed.
72
NOTES TO FINANCIAL STATEMENTS (continued)
July 31, 2006
On March 21, 2005, a purported class action was filed in Massachusetts state court alleging that the conduct, including market timing, entitles Class B shareholders in certain Columbia funds to an exemption from contingent deferred sales charges upon early redemption ("the CDSC Lawsuit"). The CDSC Lawsuit has been removed to federal court in Massachusetts and the federal Judicial Panel has transferred the CDSC Lawsuit to the MDL.
On April 4, 2006, the plaintiffs and the Columbia defendants named in the MDL, including the Columbia Funds, entered into a term sheet containing the principal terms of a stipulation of settlement that would settle all Columbia-related claims in the MDL described above, including the CDSC Lawsuit. On April 6, 2006, the U.S. District Court for the District of Maryland stayed all actions with respect to these Columbia-related claims.
The MDL is ongoing. Accordingly, an estimate of the financial impact of this litigation on any fund, if any, cannot currently be made.
In 2004, certain Columbia funds, the Trustees of the Columbia Funds, advisers and affiliated entities were named as defendants in certain purported shareholder class and derivative actions making claims, including claims under the Investment Company and the Investment Advisers Acts of 1940 and state law. The suits allege, inter alia, that the fees and expenses paid by the funds are excessive and that the advisers and their affiliates inappropriately used fund assets to distribute the funds and for other improper purpose. On March 2, 2005, the actions were consolidated in the Massachusetts federal court as In re Columbia Entities Litigation. The plaintiffs filed a consolidated amended complaint on June 9, 2005. On November 30, 2005, the judge dismissed all claims by plaintiffs and ordered that the case be closed. The plaintiffs filed a notice of appeal on December 30, 2005 and this appeal is pending.
For the year ended July 31, 2006, Columbia has assumed legal, consulting services and Trustees' fees incurred by the Fund in connection with these matters as follows:
| CMG Core Bond Fund | $ | 774 | |||||
| CMG Short Term Bond Fund | 912 | ||||||
| CMG Ultra Short Term Bond Fund | 997 | ||||||
| CMG High Yield Fund | 2,550 | ||||||
73
Report of Independent Registered Public Accounting Firm
To the Trustees of Columbia Funds Institutional Trust and the Shareholders of CMG Core Bond Fund, CMG Short Term Bond Fund, CMG Ultra Short Term Bond Fund and CMG High Yield Fund
In our opinion, the accompanying statements of assets and liabilities, including the schedules of investments, and the related statements of operations and of changes in net assets and the financial highlights present fairly, in all material respects, the financial position of CMG Core Bond Fund, CMG Short Term Bond Fund, CMG Ultra Short Term Bond Fund and CMG High Yield Fund (the "Funds") (each a series of Columbia Funds Institutional Trust) at July 31, 2006, the results of each of their operations for the year then ended, the changes in each of their net assets for each of the two years in the period then ended, and their financial highlights for each of the periods indicated, in conformity with accounting principles generally accepted in the United States of America. These financial statements and financial highlights (hereafter referred to as "financial statements") are the responsibility of the Funds' management. Our respon sibility is to express an opinion on these financial statements based on our audits. We conducted our audits of these financial statements in accordance with the standards of the Public Company Accounting Oversight Board (United States). Those standards require that we plan and perform the audits to obtain reasonable assurance about whether the financial statements are free of material misstatement. An audit includes examining, on a test basis, evidence supporting the amounts and disclosures in the financial statements, assessing the accounting principles used and significant estimates made by management, and evaluating the overall financial statement presentation. We believe that our audits, which included confirmation of securities at July 31, 2006 by correspondence with the custodian and brokers, provide a reasonable basis for our opinion.
PricewaterhouseCoopers LLP
Boston, Massachusetts
September 25, 2006
74
Fund Governance
Trustees
The Trustees serve terms of indefinite duration. The names, addresses and ages of the Trustees and officers of the Funds in the Columbia Funds Complex, the year each was first elected or appointed to office, their principal business occupations during at least the last five years, the number of portfolios overseen by each Trustee and other directorships they hold are shown below. Each officer listed below serves as an officer of each Fund in the Columbia Funds Complex.
| Name, Address and Age, Position with Funds, Year First Elected or Appointed to Office1 | Principal Occupation(s) During Past Five Years, Number of Portfolios in Columbia Funds Complex Overseen by Trustee, Other Directorships Held | ||||||
| Disinterested Trustees | |||||||
| Douglas A. Hacker (Born 1955) c/o Columbia Management Advisors, LLC One Financial Center Boston, MA 02111 Trustee (since 1996) | Independent Business Executive since May, 2006; Executive Vice President–Strategy of United Airlines (airline) from December, 2002 to May, 2006; (formerly President of UAL Loyalty Services (airline) from September, 2001 to December, 2002; Executive Vice President and Chief Financial Officer of United Airlines from July, 1999 to September, 2001; Senior Vice President–Finance from March, 1993 to July, 1999). Oversees 83, Nash Finch Company (food distributor) and Aircastle Limited (aircraft leasing) | ||||||
| Janet Langford Kelly (Born 1957) c/o Columbia Management Advisors, LLC One Financial Center Boston, MA 02111 Trustee (since 1996) | Deputy General Counsel–Corporate Legal Services, ConocoPhillips (integrated petroleum company) since August, 2006; Partner, Zelle, Hofmann, Voelbel, Mason & Gette LLP (law firm) from March, 2005 to July, 2006; Adjunct Professor of Law, Northwestern University, since September, (formerly Chief Administrative Officer and Senior Vice President, Kmart Holding Corporation (consumer goods), from September, 2003 to March, 2004; Executive Vice President–Corporate Development and Administration, General Counsel and Secretary, Kellogg Company (food manufacturer), from September, 1999 to August, 2003. Oversees 83, UAL Corporation (airline) | ||||||
| Richard W. Lowry (Born 1936) c/o Columbia Management Advisors, LLC One Financial Center Boston, MA 02111 Trustee (since 1995) | Private Investor since August, 1987 (formerly Chairman and Chief Executive Officer, U.S. Plywood Corporation (building products manufacturer until 1987)). Oversees 852, None | ||||||
| Charles R. Nelson (Born 1943) c/o Columbia Management Advisors, LLC One Financial Center Boston, MA 02111 Trustee (since 1981) | Professor of Economics, University of Washington, since January, 1976; Ford and Louisa Van Voorhis Professor of Political Economy, University of Washington, since September, 1993 (formerly Director, Institute for Economic Research, University of Washington from September, 2001 to June, 2003); Adjunct Professor of Statistics, University of Washington, since September, 1980; Associate Editor, Journal of Money Credit and Banking, since September, 1993; consultant on econometric and statistical matters. Oversees 83, None | ||||||
| John J. Neuhauser (Born 1942) c/o Columbia Management Advisors, LLC One Financial Center Boston, MA 02111 Trustee (since 1985) | University Professor, Boston College since November, 2005; Academic Vice President and Dean of Faculties from August, 1999 to October, 2005, Boston College. Oversees 852, None | ||||||
| Patrick J. Simpson (Born 1944) c/o Columbia Management Advisors, LLC One Financial Center Boston, MA 02111 Trustee (since 2000) | Partner, Perkins Coie LLP (law firm). Oversees 83, None | ||||||
75
Fund Governance (continued)
Trustees
| Name, Address and Age, Position with Funds, Year First Elected or Appointed to Office1 | Principal Occupation(s) During Past Five Years, Number of Portfolios in Columbia Funds Complex Overseen by Trustee, Other Directorships Held | ||||||
| Disinterested Trustees | |||||||
| Thomas E. Stitzel (Born 1936) c/o Columbia Management Advisors, LLC One Financial Center Boston, MA 02111 Trustee (since 1998) | Business Consultant since 1999; Chartered Financial Analyst. Oversees 83, None | ||||||
| Thomas C. Theobald (Born 1937) c/o Columbia Management Advisors, LLC One Financial Center Boston, MA 02111 Trustee and Chairman of the Board3 (since 1996) | Partner and Senior Advisor, Chicago Growth Partners (private equity investing) since September, 2004 (formerly Managing Director, William Blair Capital Partners (private equity investing) from September, 1994 to September, 2004). Oversees 83, Anixter International (network support equipment distributor); Ventas, Inc. (real estate investment trust); Jones Lang LaSalle (real estate management services) and Ambac Financial Group (financial guaranty insurance) | ||||||
| Anne-Lee Verville (Born 1945) c/o Columbia Management Advisors, LLC One Financial Center Boston, MA 02111 Trustee (since 1998) | Retired since 1997 (formerly General Manager, Global Education Industry, IBM Corporation (computer and technology) from 1994 to 1997). Oversees 83, Chairman of the Board of Directors, Enesco Group, Inc. (producer of giftware and home and garden decor products) | ||||||
| Interested Trustee | |||||||
| William E. Mayer (Born 1940) c/o Columbia Management Advisors, LLC One Financial Center Boston, MA 02111 Trustee4 (since 1994) | Partner, Park Avenue Equity Partners (private equity) since February, 1999 (formerly Partner, Development Capital LLC from November, 1996 to February, 1999). Oversees 83, Lee Enterprises (print media), WR Hambrecht + Co. (financial service provider); Reader's Digest (publishing); OPENFIELD Solutions (retail industry technology provider) | ||||||
(1) In December 2000, the boards of each of the former Liberty Funds and former Stein Roe Funds were combined into one board of trustees responsible for the oversight of both fund groups (collectively, the "Liberty Board"). In October 2003, the trustees on the Liberty Board were elected to the boards of the Columbia Funds (the "Columbia Board") and of the Columbia Funds Institutional Trust (the "CMG Funds Board"); simultaneous with that election, Patrick J. Simpson who had been a director on the Columbia Board and trustee on the CMG Funds Board, was appointed to serve as trustee of the Liberty Board. The date shown is the earliest date on which a trustee/director was elected or appointed to the board of a Fund in the Columbia Funds Complex.
(2) Messrs. Lowry and Neuhauser also serve as directors/trustees of the Liberty All-Star Funds, currently consisting of 2 funds, which are advised by an affiliate of the Advisor.
(3) Mr. Theobald was appointed as Chairman of the Board effective December 10, 2003.
(4) Mr. Mayer is an "interested person" (as defined in the Investment Company Act of 1940 (1940 Act)) by reason of his affiliation with WR Hambrecht + Co.
The Statement of Additional Information includes additional information about the Trustees of the Funds and is available, without charge, upon request by calling 800-426-3750.
76
Fund Governance
Officers
| Name, Address and Age, Position with Columbia Funds, Year First Elected or Appointed to Office | Principal Occupation(s) During Past Five Years | ||||||
| Christopher L. Wilson (Born 1957) One Financial Center Boston, MA 02111 President (since 2004) | Head of Mutual Funds since August, 2004 and Managing Director of the Advisor since September, 2005; President and Chief Executive Officer, CDC IXIS Asset Management Services, Inc. (investment management) from September, 1998 to August, 2004. | ||||||
| James R. Bordewick, Jr. (Born 1959) One Financial Center Boston, MA 02111 Senior Vice President, Secretary and Chief Legal Officer (since 2006) | Associate General Counsel, Bank of America since April, 2005; Senior Vice President and Associate General Counsel, MFS Investment Management (investment management) prior to April, 2005. | ||||||
| J. Kevin Connaughton (Born 1964) One Financial Center Boston, MA 02111 Senior Vice President, Chief Financial Officer and Treasurer (since 2000) | Managing Director of the Advisor since February, 1998. | ||||||
| Mary Joan Hoene (Born 1949) 100 Federal Street Boston, MA 02110 Senior Vice President and Chief Compliance Officer (since 2004) | Senior Vice President and Chief Compliance Officer of various funds in the Fund Complex; Partner, Carter, Ledyard & Milburn LLP (law firm) from January, 2001 to August, 2004. | ||||||
| Michael G. Clarke (Born 1969) One Financial Center Boston, MA 02111 Chief Accounting Officer and Assistant Treasurer (since 2004) | Director of Fund Administration since January, 2006; Managing Director of Columbia Management Advisors, LLC September, 2004 to December, 2005; Vice President Fund Administration June, 2002 to September, 2004. Vice President Product Strategy and Development from February, 2001 to June, 2002. | ||||||
| Jeffrey R. Coleman (Born 1969) One Financial Center Boston, MA 02111 Deputy Treasurer (since 2006) | Director of Fund Administration since January, 2006; Fund Controller from October 2004 to January 2006; Vice President of CDC IXIS Asset Management Services, Inc. (investment management) from August, 2000 to September, 2004. | ||||||
| Joseph F. DiMaria (Born 1968) One Financial Center Boston, MA 02111 Deputy Treasurer (since 2006) | Director of Fund Administration since January, 2006; Head of Tax/Compliance and Assistant Treasurer from November, 2004 to December, 2005; Director of Trustee Administration (Sarbanes-Oxley) from May, 2003 to October, 2004; Senior Audit Manager, PricewaterhouseCoopers (independent registered public accounting firm) from July, 2000 to April, 2003. | ||||||
| Ty S. Edwards (Born 1966) One Financial Center Boston, MA 02111 Deputy Treasurer (since 2006) | Director of Fund Administration since January, 2006; Vice President of the Advisor from July, 2002 to December, 2005; Assistant Vice president and Director, State Street Corporation (financial services) prior to 2002. | ||||||
| Barry S. Vallan (Born 1969) One Financial Center Boston, MA 02111 Controller (since 2006) | Vice President–Fund Treasury of the Advisor since October, 2004; Vice President–Trustee Reporting from April, 2002 to October, 2004; Management Consultant, PricewaterhouseCoopers (independent registered public accounting firm) prior to October, 2002. | ||||||
77
COLUMBIA FUNDS INSTITUTIONAL TRUST
121 S.W. MORRISON STREET, PORTLAND, OREGON 97201
- INVESTMENT ADVISOR -
COLUMBIA MANAGEMENT ADVISORS, LLC
100 FEDERAL STREET
BOSTON, MASSACHUSETTS 02110-2624
- LEGAL COUNSEL -
ROPES & GRAY LLP
ONE INTERNATIONAL PLACE
BOSTON, MASSACHUSETTS 02110-2624
- TRANSFER AGENT -
COLUMBIA MANAGEMENT SERVICES, INC.
P.O. BOX 8081
BOSTON, MASSACHUSETTS 02266-8081
SHC-42/112620-0706 (09/06) 06/29445
A description of the funds' proxy voting policies and procedures is available (i) on the funds' website, www.columbiamanagement.com; (ii) on the Securities and Exchange Commission's website at www.sec.gov, and (iii) without charge, upon request, by calling 800-368-0346. Information regarding how the funds voted proxies relating to portfolio securities during the 12-month period ended June 30 is available from the SEC's website. Information regarding how the funds voted proxies relating to portfolio securities is also available from the funds' website.
Each fund files a complete schedule of portfolio holdings with the SEC for the first and third quarters of each fiscal year on Form N-Q. Each fund's Form N-Q is available on the SEC's website at www.sec.gov and may be reviewed and copied at the SEC's Public Reference Room in Washington, D.C. Information on the operation of the Public Reference Room may be obtained by calling 1-800-SEC-0330.
The CMG funds are offered by prospectus through Columbia Management Distributors, Inc. Please consider the investment objectives, risks, charges and expenses of a mutual fund carefully before investing. Contact your Columbia Management representative or visit www.columbiamanagement.com for a prospectus, which contains this and other important information about the fund. Read it carefully before you invest.
Fund distributed by Columbia Management Distributors, Inc., One Financial Center, Boston, MA 02111-2621
![]()
CMG ENHANCED S&P 500® INDEX FUND
CMG LARGE CAP GROWTH FUND
CMG LARGE CAP VALUE FUND
CMG MID CAP GROWTH FUND
CMG MID CAP VALUE FUND
CMG SMALL CAP GROWTH FUND
(FORMERLY CMG SMALL CAP FUND)
CMG SMALL CAP VALUE FUND
CMG SMALL/MID CAP FUND
CMG INTERNATIONAL STOCK FUND
PORTFOLIOS OF COLUMBIA FUNDS INSTITUTIONAL TRUST
Annual Report
July 31, 2006
Advised by Columbia Management Advisors, LLC.
Not FDIC
Insured
May Lose Value
No Bank Guarantee
Columbia Management Group, LLC ("Columbia Management") is the primary investment management division of Bank of America Corporation. Columbia Management entities furnish investment management services and advise institutional and mutual fund portfolios. CMG Funds are distributed by Columbia Management Distributors, Inc., member of NASD, SIPC, part of Columbia Management and an affiliate of Bank of America Corporation.
Table of Contents
| Management Discussion of Fund Performance | |||||||
| CMG Enhanced S&P 500® Index Fund | 1 | ||||||
| CMG Large Cap Growth Fund | 6 | ||||||
| CMG Large Cap Value Fund | 12 | ||||||
| CMG Mid Cap Growth Fund | 18 | ||||||
| CMG Mid Cap Value Fund | 24 | ||||||
| CMG Small Cap Growth Fund | 30 | ||||||
| CMG Small Cap Value Fund | 36 | ||||||
| CMG Small/Mid Cap Fund | 42 | ||||||
| CMG International Stock Fund | 48 | ||||||
| Financial Statements | |||||||
| Financial Highlights | 54 | ||||||
| Schedules of Investments | 63 | ||||||
| Statements of Assets and Liabilities | 124 | ||||||
| Statements of Operations | 126 | ||||||
| Statements of Changes in Net Assets | 128 | ||||||
| Notes to Financial Statements | 133 | ||||||
| Report of Independent Registered Public Accounting Firm | 145 | ||||||
| Unaudited Information | 146 | ||||||
| Trustees | 148 | ||||||
| Officers | 150 | ||||||
The views expressed in the Management Discussion of Fund Performance reflect the current views of the Portfolio Managers. These views are not guarantees of future performance and involve certain risks, uncertainties and assumptions that are difficult to predict so actual outcomes and results may differ significantly from the views expressed. These views are subject to change at any time based upon economic, market or other conditions and the Portfolio Managers disclaim any responsibility to update such views. These views may not be relied on as investment advice and, because investment decisions for a CMG Fund are based on numerous factors, may not be relied on as an indication of trading intent on behalf of any particular CMG Fund. References to specific company securities should not be constructed as a recommendation or investment advice.
Performance data quoted represents past performance and current performance may be lower or higher. Past performance is no guarantee of future results. The investment return and principal value will fluctuate so that shares, when redeemed, may be worth more or less than the original cost. Please visit www.columbiamanagement.com for daily and most recent month-end performance updates.
CMG ENHANCED S&P 500® INDEX FUND
A Portfolio of Columbia Funds Institutional Trust
MANAGEMENT DISCUSSION OF FUND PERFORMANCE
CMG Enhanced S&P 500® Index Fund returned 7.56% for the 12-month period ended July 31, 2006. The fund's return was higher than that of the S&P 500 Index,1 which was 5.38% for the same period. The fund also outperformed the 3.77% average return for the Lipper Large Cap Core Funds Category.2 A decision to emphasize certain key stocks in the materials and consumer staples sectors helped the fund outperform both its benchmark and peer group.
The broad US stock market delivered a modest but respectable return for the 12-month period, despite bouts of volatility in response to rising energy prices, higher interest rates and growing concerns about inflation. Corporate profit growth remained strong, business spending helped spur job growth and the generally positive employment picture helped bolster consumer confidence. Economic growth showed signs of slowing in the final months of the period, but slower growth raised hopes that the Federal Reserve Board would soon end its long series of short-term interest rate hikes.
Against this backdrop, the materials sector was the fund's strongest contributor to performance over the period. Over the year, the fund had more exposure than the index to Nucor Corp., Freeport-McMoRan Copper & Gold, Inc., Phelps Dodge Corp. (1.3%, 0.7% and 0.2% of net assets, respectively) and Georgia Pacific (no longer in the portfolio), which aided performance relative to the benchmark. Nucor, a mini-mill producer of steel and steel products, benefited from industry consolidation and an improved balance between worldwide supply and demand. Improved pricing and higher revenues resulted in strong earnings growth for the company, whose share price more than doubled during the period. Freeport-McMoRan, which operates a vast gold, copper and silver mine in Indonesia, benefited from higher metals prices, as did Phelps Dodge, the world's leading copper producer. Both companies reported higher revenues and earnings. Georgia Paci fic, the second largest paper & forest-products company, was another strong performer. The company was acquired by Koch Industries, which is privately held.
In addition to materials stocks, the consumer staples sector performed well for the fund. An overweight position in Reynolds American, Inc. (1.3% of net assets) paid off, as a legal turn favoring the tobacco industry helped boost the company's share price. Strong volume and margin gains were also beneficial to Reynolds' profitability.
By contrast, the fund lost ground relative to its benchmark in the financials sector. Although financial stocks made a solid contribution to performance overall, the fund missed out on strong gains generated by the stock of an affiliate of the fund, which we are not allowed to own. Also, a decision to overweight Cendant Corp. (0.7% of net assets) in the industrials sector, turned out poorly. The company experienced difficulties on a number of fronts—a poorly-executed acquisition, weak travel-related consumer spending and rising concerns over the company's real estate brokerage operations. These factors resulted in a general exodus from the stock and poor performance for the industrials sector in the fund.
1
Looking ahead, we believe that both economic and profit growth appear solid with reasonable valuation levels. In this environment, we believe that US large-cap stocks have the potential to hold up better than stocks of smaller, less established companies—especially if economic growth continues to slow. And because many of the companies in the fund participate in multiple global markets, we believe they may be better positioned than smaller companies to weather further declines in the US dollar.
The fund's top ten holdings (as a percentage of net assets) as of July 31, 2006 were:
| (%) | |||||||
| Exxon Mobil | 4.3 | ||||||
| Citigroup | 2.9 | ||||||
| Microsoft | 2.6 | ||||||
| Pfizer | 2.5 | ||||||
| General Electric | 1.9 | ||||||
| Amgen | 1.8 | ||||||
| ConocoPhillips | 1.7 | ||||||
| Goldman Sachs Group | 1.6 | ||||||
| Altria Group | 1.5 | ||||||
| McGraw-Hill | 1.5 | ||||||
We appreciate your continued confidence in CMG Enhanced S&P 500® Index Fund.
Vikram Kuriyan has managed the CMG Enhanced S&P 500® Index Fund since June 2005 and has been with the advisor or its predecessors or affiliate organizations since 2000.
Equity investments are affected by stock market fluctuations that occur in response to economic and business developments.
Investing in the fund also includes market risk and tracking error risk. Unlike the S&P 500 Index, the fund incurs administrative expenses and transaction costs in trading stocks. The composition of the S&P 500 Index and the stocks held by the fund will diverge.
1 The Standard & Poor's (S&P) 500 Index tracks the performance of 500 widely held, large-capitalization US stocks. Indices are not investments, do not incur fees or expenses and are not professionally managed. It is not possible to invest directly in an index. Securities in the fund may not match those in an index.
2 Lipper Inc., a widely respected data provider in the industry, calculates an average total return (assuming reinvestment of distributions) for mutual funds with investment objectives similar to those of the fund. Lipper makes no adjustment for the effect of sales loads.
Holdings are calculated as a percentage of net assets, and are subject to change. Because the fund is actively managed, there is no guarantee the fund will continue to maintain the holdings breakdown listed. The fund's holdings and their weights within the portfolio may change as market conditions change.
2
Average annual total return as of July 31, 2006 (%)
| Inception | 1-year | Life | |||||||||||||
| CMG Enhanced S&P 500® Index Fund | 05/05/03 | 7.56 | 13.14 | ||||||||||||
| S&P 500 Index | 5.38 | 12.40 | |||||||||||||
Average annual total return as of June 30, 2006 (%)
| Inception | 1-year | Life | |||||||||||||
| CMG Enhanced S&P 500® Index Fund | 05/05/03 | 10.53 | 13.23 | ||||||||||||
| S&P 500 Index | 8.63 | 12.53 | |||||||||||||
Index performance is from May 5, 2003.
Performance data quoted represents past performance and current performance may be lower or higher. Past performance is no guarantee of future results. The investment return and principal value will fluctuate so that shares, when redeemed, may be worth more or less than the original cost. Please visit www.columbiamanagement.com for daily and most recent month-end performance updates.
Performance results reflect any voluntary waivers or reimbursement of fund expenses by the advisor or its affiliates. Absent these waivers or reimbursement arrangements, performance results would have been lower. All results shown assume reinvestment of distributions.
The table does not reflect the deduction of taxes that a shareholder would pay on fund distributions or the redemption of fund shares.
Growth of a $3,000,000 investment, May 5, 2003 to July 31, 2006
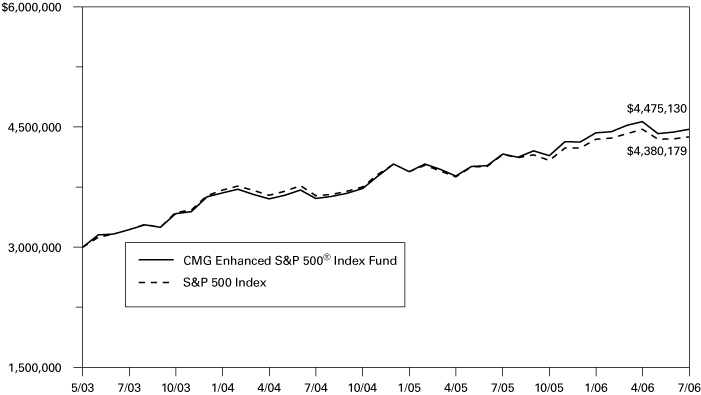
The Standard & Poor's (S&P) 500 Index tracks the performance of 500 widely held, large-capitalization US stocks. Indices are not investments, do not incur fees or expenses and are not professionally managed. It is not possible to invest directly in an index. Securities in the fund may not match those in an index.
The chart above shows the growth in value of a hypothetical minimum initial $3,000,000 investment in the fund compared to the index during the stated time period, and does not reflect the deduction of taxes that a shareholder would pay on fund distributions or the redemption of fund shares.
3
UNDERSTANDING YOUR EXPENSES – CMG Enhanced S&P 500® Index Fund
As a fund shareholder, you incur two types of costs. There are transaction costs and also ongoing costs, which generally include investment advisory fees and other fund expenses. The information on this page is intended to help you understand your ongoing costs of investing in the fund and to compare these costs with the ongoing costs of investing in other mutual funds.
Analyzing your fund's expenses
To illustrate these ongoing costs, we have provided an example and calculated the expenses paid by investors during the reporting period. The information in the following table is based on an initial investment of $1,000, which is invested at the beginning of the reporting period and held for the entire period. Expense information is calculated two ways and each method provides you with different information. The amount listed in the "actual" column is calculated using the fund's actual operating expenses and total return for the period. The amount listed in the "hypothetical" column assumes that the return each year is 5% before expenses and is calculated based on the fund's actual operating expenses. You should not use the hypothetical account values and expenses to estimate either your actual account balance at the end of the period or the expenses you paid during this reporting period.
Estimating your actual expenses
To estimate the expenses that you paid over the period, first you will need your account balance at the end of the period:
1. Divide your ending account balance by $1,000. For example, if an account balance was $8,600 at the end of the period, the result would be 8.6.
2. In the section of the table below titled "Expenses paid during the period," locate the amount under "actual." Multiply this number by the result from step 1. Your answer is an estimate of the expenses you paid on your account during the period.
February 1, 2006 – July 31, 2006
| Account value at the beginning of the period ($) | Account value at the end of the period ($) | Expenses paid during the period ($) | Fund's annualized expense ratio (%) | ||||||||||||||||||||||||
| Actual | Hypothetical | Actual | Hypothetical | Actual | Hypothetical | Actual | |||||||||||||||||||||
| 1,000.00 | 1,000.00 | 1,010.46 | 1,023.55 | 1.25 | 1.25 | 0.25 | |||||||||||||||||||||
Expenses paid during the period are equal to the fund's annualized expense ratio of 0.25%, multiplied by the average account value over the period, then multiplied by the number of days in the fund's most recent fiscal half-year and divided by 365.
Had the Investment Advisor not reimbursed a portion of expenses, total return would have been reduced.
It is important to note that the expense amounts shown in the table are meant to highlight only ongoing costs of investing in the fund and do not reflect any transaction costs, such as sales charges, redemption or exchange fees. Therefore, the hypothetical examples provided may not help you determine the relative total costs of owning shares of different funds. If these transaction costs were included, your costs would have been higher.
4
Compare with other funds
Since all mutual funds are required to include the same hypothetical calculations about expenses in shareholder reports, you can use this information to compare the ongoing cost of investing in the fund with other funds. To do so, compare the 5% hypothetical example with the 5% hypothetical examples that appear in the shareholder reports of other funds. As you compare hypothetical examples of other funds, it is important to note that hypothetical examples are meant to highlight the continuing costs of investing in a fund and do not reflect any transaction costs, such as sales charges or redemption or exchange fees.
5
Performance data quoted represents past performance and current performance may be lower or higher. Past performance is no guarantee of future results. The investment return and principal value will fluctuate so that shares, when redeemed, may be worth more or less than the original cost. Please visit www.columbiamanagement.com for daily and most recent month-end performance updates.
CMG LARGE CAP GROWTH FUND
A Portfolio of Columbia Funds Institutional Trust
MANAGEMENT DISCUSSION OF FUND PERFORMANCE
CMG Large Cap Growth Fund returned 1.63% for the 12-month period ended July 31, 2006. Strong stock selection helped the fund beat the Russell 1000 Growth Index1 and the Morningstar Large Growth Category average, which returned negative 0.76% and negative 0.35%, respectively, over the same period.2 Although worries over slowing consumer spending and mounting volatility pressured growth stocks, the fund remained focused on large-cap companies with above-average earnings growth, whose stocks were selling at valuations we considered attractive. We looked for companies with strong competitive positions, high sustainable profits and good balance sheets, selling stocks whose prospects weakened and adding new investments when better opportunities became available.
Positions in consumer discretionary and energy stocks had the single largest positive impact on the fund's return. Within consumer discretionary, we avoided retailers, because we were concerned that rising interest rates and high energy prices would pressure consumer spending. Instead, we focused on other areas within consumer discretionary, including media and gaming. In that regard, Las Vegas Sands Corp. (0.5% of net assets), a casino company, was one of the fund's top performers. The stock rallied nicely as investors began to recognize the importance of its properties in Macau, a developing gaming center in the Far East. Office Depot, Inc. (1.6% of net assets) also did well, as its core business continued to stage a turnaround.
Energy stocks climbed higher, as strong global demand and tight supply buoyed oil prices. Exploration and production companies Kerr-McGee Corp., which was bought out at a premium, and XTO Energy, Inc. (1.3% of net assets) were strong performers for the fund.
Health care and technology, the fund's two largest sectors, had little impact on relative performance. However, both sectors produced individual stocks that aided the fund's return. Standouts included Amylin Pharmaceuticals, Inc. and Thermo Electron Corp. (0.6% and 1.7% of net assets, respectively). Amylin, a biotechnology company with advanced therapies for diabetes, benefited from a new product launch. Thermo Electron, which makes laboratory instruments for drug companies, rallied after announcing the acquisition of Fisher Scientific International, Inc. Detractors included pharmaceutical company Abbott Laboratories and drug distributor Cardinal Health, Inc. (1.0% and 1.0% of net assets, respectively). The fund lost ground by not owning Abbott during its rebound and buying Cardinal a little too early.
Technology stocks suffered as the market corrected in the spring. However, Akamai Technologies, Inc. (1.2% of net assets), a service provider for Internet websites, and MEMC Electronics Materials, Inc., which makes the silicon used in semiconductor chips and solar cells, produced strong returns that aided performance. We took profits and sold MEMC early in the period. Disappointments included NVIDIA Corp. and Cisco Systems, Inc. (0.5% and 2.4% of net assets, respectively). NVIDIA, a leading manufacturer of chips for graphic
6
applications such as videogames, pulled back after our purchase. Cisco, a networking company, suffered when its operating results fell short of investors' expectations. The fund's lack of exposure to utilities also modestly hampered returns, as did its slight overweight position in the consumer staples sector.
We believe the outlook for large-cap growth stocks is encouraging. The economy appears to be in the late stages of expansion with earnings in many value or cyclical sectors at or near their peaks. If corporate profit growth slows and the economic cycle matures, we believe that companies with strong underlying earnings growth have the potential to lead the market. Many large companies have the added advantage of global footprints that make them less vulnerable to a US economic slowdown and better positioned to benefit from a weak US dollar. Finally, valuations within the growth sector have become relatively compressed, which helps level the playing field between large- and smaller-cap stocks.
The fund's top ten holdings (as a percentage of net assets) as of July 31, 2006 were:
| (%) | |||||||
| 2.8 | |||||||
| Microsoft | 2.7 | ||||||
| Johnson & Johnson | 2.6 | ||||||
| Cisco Systems | 2.4 | ||||||
| General Electric | 2.4 | ||||||
| News | 2.1 | ||||||
| American International Group | 2.1 | ||||||
| Wal-Mart Stores | 2.1 | ||||||
| Bank of New York | 2.0 | ||||||
| Caremark Rx | 2.0 | ||||||
Thank you for investing in CMG Large Cap Growth Fund.
Paul J. Berlinguet, lead manager for CMG Large Cap Growth Fund, has managed or co-managed the fund since October 2003 and has been with the advisor or its predecessors or affiliate organizations since 2003.
Roger Sullivan has co-managed the fund since June 2005 and has been with the advisor or its predecessors or affiliate organizations since January 2005.
John T. Wilson has co-managed the fund since August 2005 and has been with the advisor or its predecessors since July 2005.
Edward Hickey has co-managed the fund since June 2005 and has been with the advisor or its predecessors or affiliate organizations since 1998.
Mary-Ann Ward has co-managed the fund since June 2005 and has been with the advisor or its predecessors or affiliate organizations since 1997.
7
Equity investments are affected by stock market fluctuations that occur in response to economic and business developments.
Investing in growth stocks incurs the possibility of losses because their prices are sensitive to changes in current or expected earnings.
1 The Russell 1000 Growth Index measures the performance of those Russell 1000 Index companies with higher price-to-book ratios and higher forecasted growth values. Indices are not investments, do not incur fees or expenses and are not professionally managed. It is not possible to invest directly in an index. Securities in the fund may not match those in an index.
2 ©2006 by Morningstar, Inc. All rights reserved. The information contained herein is the proprietary information of Morningstar, Inc., may not be copied or redistributed for any purpose and may only be used for noncommercial, personal purposes. The information contained herein is not represented or warranted to be accurate, correct, complete or timely. Morningstar, Inc. shall not be responsible for investment decisions, damages or other losses resulting from the use of this information. Past performance is no guarantee of future performance. Morningstar, Inc. has not granted consent for it to be considered or deemed an "expert" under the Securities Act of 1933. Morningstar Categories compare the performance of funds with similar investment objectives and strategies.
Holdings are calculated as a percentage of net assets, and are subject to change. Because the fund is actively managed, there is no guarantee the fund will continue to maintain the holdings breakdown listed. The fund's holdings and their weights within the portfolio may change as market conditions change.
8
Average annual total return as of July 31, 2006 (%)
| Inception | 1-year | Life | |||||||||||||
| CMG Large Cap Growth Fund | 09/10/03 | 1.63 | 6.32 | ||||||||||||
| Russell 1000 Growth Index | (0.76 | ) | 5.39 | ||||||||||||
Average annual total return as of June 30, 2006 (%)
| Inception | 1-year | Life | |||||||||||||
| CMG Large Cap Growth Fund | 09/10/03 | 7.89 | 7.47 | ||||||||||||
| Russell 1000 Growth Index | 6.12 | 6.29 | |||||||||||||
Index performance is from September 10, 2003.
Performance data quoted represents past performance and current performance may be lower or higher. Past performance is no guarantee of future results. The investment return and principal value will fluctuate so that shares, when redeemed, may be worth more or less than the original cost. Please visit www.columbiamanagement.com for daily and most recent month-end performance updates.
Performance results may reflect any voluntary waivers or reimbursement of fund expenses by the advisor or its affiliates. Absent these waivers or reimbursement arrangements, performance results would have been lower. All results shown assume reinvestment of distributions.
The table does not reflect the deduction of taxes that a shareholder would pay on fund distributions or the redemption of fund shares.
Growth of a $3,000,000 investment, September 10, 2003 to July 31, 2006
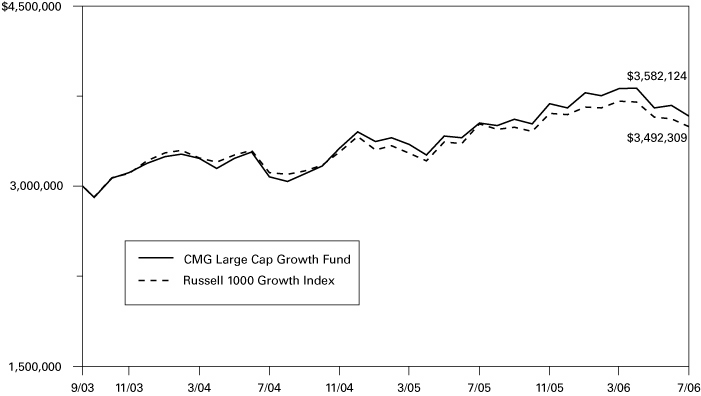
The Russell 1000 Growth Index measures the performance of those Russell 1000 Index companies with higher price-to-book ratios and higher forecasted growth values. Indices are not investments, do not incur fees or expenses and are not professionally managed. It is not possible to invest directly in an index. Securities in the fund may not match those in an index.
The chart above shows the growth in value of a hypothetical minimum initial $3,000,000 investment in the fund compared to the index during the stated time period, and does not reflect the deduction of taxes that a shareholder would pay on fund distributions or the redemption of fund shares.
9
UNDERSTANDING YOUR EXPENSES – CMG Large Cap Growth Fund
As a fund shareholder, you incur two types of costs. There are transaction costs and also ongoing costs, which generally include investment advisory fees and other fund expenses. The information on this page is intended to help you understand your ongoing costs of investing in the fund and to compare these costs with the ongoing costs of investing in other mutual funds.
Analyzing your fund's expenses
To illustrate these ongoing costs, we have provided an example and calculated the expenses paid by investors during the reporting period. The information in the following table is based on an initial investment of $1,000, which is invested at the beginning of the reporting period and held for the entire period. Expense information is calculated two ways and each method provides you with different information. The amount listed in the "actual" column is calculated using the fund's actual operating expenses and total return for the period. The amount listed in the "hypothetical" column assumes that the return each year is 5% before expenses and is calculated based on the fund's actual operating expenses. You should not use the hypothetical account values and expenses to estimate either your actual account balance at the end of the period or the expenses you paid during this reporting period.
Estimating your actual expenses
To estimate the expenses that you paid over the period, first you will need your account balance at the end of the period:
1. Divide your ending account balance by $1,000. For example, if an account balance was $8,600 at the end of the period, the result would be 8.6.
2. In the section of the table below titled "Expenses paid during the period," locate the amount under "actual." Multiply this number by the result from step 1. Your answer is an estimate of the expenses you paid on your account during the period.
February 1, 2006 – July 31, 2006
| Account value at the beginning of the period ($) | Account value at the end of the period ($) | Expenses paid during the period ($) | Fund's annualized expense ratio (%) | ||||||||||||||||||||||||
| Actual | Hypothetical | Actual | Hypothetical | Actual | Hypothetical | Actual | |||||||||||||||||||||
| 1,000.00 | 1,000.00 | 947.98 | 1,022.32 | 2.41 | 2.51 | 0.50 | |||||||||||||||||||||
Expenses paid during the period are equal to the fund's annualized expense ratio of 0.50%, multiplied by the average account value over the period, then multiplied by the number of days in the fund's most recent fiscal half-year and divided by 365.
Had the Investment Advisor not reimbursed a portion of expenses, total return would have been reduced.
It is important to note that the expense amounts shown in the table are meant to highlight only ongoing costs of investing in the fund and do not reflect any transaction costs, such as sales charges, redemption or exchange fees. Therefore, the hypothetical examples provided may not help you determine the relative total costs of owning shares of different funds. If these transaction costs were included, your costs would have been higher.
10
Compare with other funds
Since all mutual funds are required to include the same hypothetical calculations about expenses in shareholder reports, you can use this information to compare the ongoing cost of investing in the fund with other funds. To do so, compare the 5% hypothetical example with the 5% hypothetical examples that appear in the shareholder reports of other funds. As you compare hypothetical examples of other funds, it is important to note that hypothetical examples are meant to highlight the continuing costs of investing in a fund and do not reflect any transaction costs, such as sales charges or redemption or exchange fees.
11
Performance data quoted represents past performance and current performance may be lower or higher. Past performance is no guarantee of future results. The investment return and principal value will fluctuate so that shares, when redeemed, may be worth more or less than the original cost. Please visit www.columbiamanagement.com for daily and most recent month-end performance updates.
CMG LARGE CAP VALUE FUND
A Portfolio of Columbia Funds Institutional Trust
MANAGEMENT DISCUSSION OF FUND PERFORMANCE
CMG Large Cap Value Fund returned 9.85% for the 12-month period ended July 31, 2006. The fund underperformed the Russell 1000 Value Index,1 which returned 11.59%. Its return was higher than the 8.21% average return of its peer group, the Morningstar Large Value Category.2
Overweights in the industrial and information technology sectors and underweights in the energy and telecommunications sectors detracted from performance. Sector weights are the result of individual stock selection and do not, in themselves, reflect a sector view. An investment in defense and aerospace company, Goodrich Corp., in the industrials sector, was a particular drag on performance. A series of missteps by company management resulted in lower earnings. The stock lost ground and was sold from the portfolio. Within technology, the fund's position in Intel Corp. hindered performance. The company continued to struggle with weaker demand and pricing in the desktop computer market, and continued shortages of in-house desktop chipsets. As a result, we sold the stock.
Although the consumer discretionary sector was the market's weakest performer over the 12-month period, it was one of the best contributors to fund performance relative to the benchmark. Within consumer discretionary, we avoided many of the media and household durable stocks that were some of the weakest performers. In the financial sector, we focused on capital markets stocks and selected real estate investment trusts (REITs), which helped buoy returns. We avoided REITs that were linked to the residential housing market, which weakened considerably during the period. Instead, we owned Kimco Realty Corp. (0.6% of net assets), which focuses on neighborhood and community shopping centers, and Archstone-Smith Trust (0.5% of net assets), which invests primarily in garden and high-rise apartments in strong markets, such as Washington, D.C. and San Francisco. The fund had more exposure than the index to both Kimco and Archstone-Smith, which amplified the favorable impact of their 20%+ returns for the period.
Higher interest rates, geopolitical unrest and slower economic growth have resulted in considerable uncertainty among investors. However, we continue to believe that our emphasis on companies with strong business prospects and attractive valuations remains sound. The fund remains positioned with an emphasis on consumer and financial sectors and with slightly less exposure than the index to energy and utilities.
12
The fund's top ten holdings (as a percentage of net assets) as of July 31, 2006 were:
| (%) | |||||||
| Citigroup | 4.5 | ||||||
| JPMorgan Chase | 3.6 | ||||||
| Pfizer | 2.7 | ||||||
| Wells Fargo | 2.5 | ||||||
| U.S. Bancorp | 2.2 | ||||||
| Merrill Lynch | 2.1 | ||||||
| Occidental Petroleum | 1.9 | ||||||
| General Electric | 1.9 | ||||||
| PNC Financial Services Group | 1.8 | ||||||
| Bank of New York | 1.7 | ||||||
Thank you for investing in CMG Large Cap Value Fund.
Lori J. Ensinger is the lead manager for CMG Large Cap Value Fund and has managed the fund since August 2005. She has been with the advisor or its predecessors or affiliate organizations since 2001.
David I. Hoffman has co-managed the fund since August 2005 and has been with the advisor or its predecessors or affiliate organizations since 2001.
Noah J. Petrucci has co-managed the fund since August 2005 and has been with the advisor or its predecessors or affiliate organizations since 2002.
Diane L. Sobin has co-managed the fund since August 2005 and has been with the advisor or its predecessors or affiliate organizations since 2001.
Equity investments are affected by stock market fluctuations that occur in response to economic and business developments.
Value stocks are stocks of companies that may have experienced adverse business or industry developments or may be subject to special risks that have caused the stocks to be out of favor and, in the advisor's opinion, undervalued. If the advisor's assessment of a company's prospects is wrong, the price of the company's stock may not approach the value the advisor has placed on it.
1 The Russell 1000 Value Index measures the performance of those Russell 1000 Index companies with lower price-to-book ratios and lower forecasted growth values. Indices are not investments, do not incur fees or expenses and are not professionally managed. It is not possible to invest directly in an index. Securities in the fund may not match those in an index.
2 ©2006 by Morningstar, Inc. All rights reserved. The information contained herein is the proprietary information of Morningstar, Inc., may not be copied or redistributed for any purpose and may only be used for noncommercial, personal purposes. The information contained herein is not represented or warranted to be accurate, correct, complete or timely. Morningstar, Inc. shall not be responsible for investment decisions, damages or other losses resulting from the use of this information. Past performance is no guarantee of future performance. Morningstar, Inc. has not granted consent for it to be considered or deemed an "expert" under the
13
Securities Act of 1933. Morningstar Categories compare the performance of funds with similar investment objectives and strategies.
Holdings are calculated as a percentage of net assets, and are subject to change. Because the fund is actively managed, there is no guarantee the fund will continue to maintain the holdings breakdown listed. The fund's holdings and their weights within the portfolio may change as market conditions change.
14
Average annual total return as of July 31, 2006 (%)
| Inception | 1-year | Life | |||||||||||||
| CMG Large Cap Value Fund | 09/10/03 | 9.85 | 12.58 | ||||||||||||
| Russell 1000 Value Index | 11.59 | 15.58 | |||||||||||||
Average annual total return as of June 30, 2006 (%)
| Inception | 1-year | Life | |||||||||||||
| CMG Large Cap Value Fund | 09/10/03 | 11.69 | 12.65 | ||||||||||||
| Russell 1000 Value Index | 12.10 | 15.10 | |||||||||||||
Index performance is from September 10, 2003.
Performance data quoted represents past performance and current performance may be lower or higher. Past performance is no guarantee of future results. The investment return and principal value will fluctuate so that shares, when redeemed, may be worth more or less than the original cost. Please visit www.columbiamanagement.com for daily and most recent month-end performance updates.
Performance results may reflect any voluntary waivers or reimbursement of fund expenses by the advisor or its affiliates. Absent these waivers or reimbursement arrangements, performance results would have been lower. All results shown assume reinvestment of distributions.
The table does not reflect the deduction of taxes that a shareholder would pay on fund distributions or the redemption of fund shares.
Growth of a $3,000,000 investment, September 10, 2003 to July 31, 2006
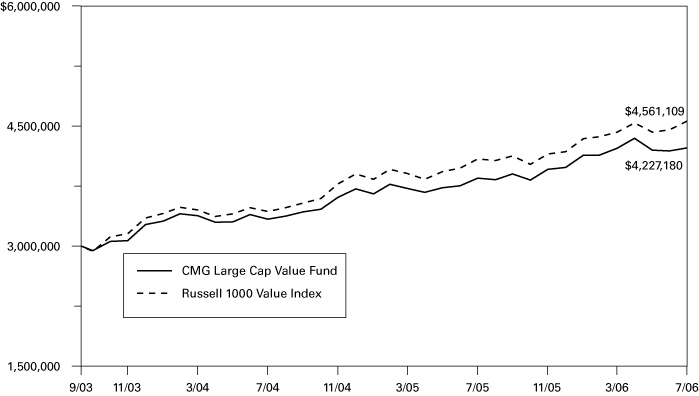
The Russell 1000 Value Index measures the performance of those Russell 1000 Index companies with lower price-to-book ratios and lower forecasted growth values. Indices are not investments, do not incur fees or expenses and are not professionally managed. It is not possible to invest directly in an index. Securities in the fund may not match those in an index.
The chart above shows the growth in value of a hypothetical minimum initial $3,000,000 investment in the fund compared to the index during the stated time period, and does not reflect the deduction of taxes that a shareholder would pay on fund distributions or the redemption of fund shares.
15
UNDERSTANDING YOUR EXPENSES – CMG Large Cap Value Fund
As a fund shareholder, you incur two types of costs. There are transaction costs and also ongoing costs, which generally include investment advisory fees and other fund expenses. The information on this page is intended to help you understand your ongoing costs of investing in the fund and to compare these costs with the ongoing costs of investing in other mutual funds.
Analyzing your fund's expenses
To illustrate these ongoing costs, we have provided an example and calculated the expenses paid by investors during the reporting period. The information in the following table is based on an initial investment of $1,000, which is invested at the beginning of the reporting period and held for the entire period. Expense information is calculated two ways and each method provides you with different information. The amount listed in the "actual" column is calculated using the fund's actual operating expenses and total return for the period. The amount listed in the "hypothetical" column assumes that the return each year is 5% before expenses and is calculated based on the fund's actual operating expenses. You should not use the hypothetical account values and expenses to estimate either your actual account balance at the end of the period or the expenses you paid during this reporting period.
Estimating your actual expenses
To estimate the expenses that you paid over the period, first you will need your account balance at the end of the period:
1. Divide your ending account balance by $1,000. For example, if an account balance was $8,600 at the end of the period, the result would be 8.6.
2. In the section of the table below titled "Expenses paid during the period," locate the amount under "actual." Multiply this number by the result from step 1. Your answer is an estimate of the expenses you paid on your account during the period.
February 1, 2006 – July 31, 2006
| Account value at the beginning of the period ($) | Account value at the end of the period ($) | Expenses paid during the period ($) | Fund's annualized expense ratio (%) | ||||||||||||||||||||||||
| Actual | Hypothetical | Actual | Hypothetical | Actual | Hypothetical | Actual | |||||||||||||||||||||
| 1,000.00 | 1,000.00 | 1,021.47 | 1,022.32 | 2.51 | 2.51 | 0.50 | |||||||||||||||||||||
Expenses paid during the period are equal to the fund's annualized expense ratio of 0.50%, multiplied by the average account value over the period, then multiplied by the number of days in the fund's most recent fiscal half-year and divided by 365.
Had the Investment Advisor not reimbursed a portion of expenses, total return would have been reduced.
It is important to note that the expense amounts shown in the table are meant to highlight only ongoing costs of investing in the fund and do not reflect any transaction costs, such as sales charges, redemption or exchange fees. Therefore, the hypothetical examples provided may not help you determine the relative total costs of owning shares of different funds. If these transaction costs were included, your costs would have been higher.
16
Compare with other funds
Since all mutual funds are required to include the same hypothetical calculations about expenses in shareholder reports, you can use this information to compare the ongoing cost of investing in the fund with other funds. To do so, compare the 5% hypothetical example with the 5% hypothetical examples that appear in the shareholder reports of other funds. As you compare hypothetical examples of other funds, it is important to note that hypothetical examples are meant to highlight the continuing costs of investing in a fund and do not reflect any transaction costs, such as sales charges or redemption or exchange fees.
17
Performance data quoted represents past performance and current performance may be lower or higher. Past performance is no guarantee of future results. The investment return and principal value will fluctuate so that shares, when redeemed, may be worth more or less than the original cost. Please visit www.columbiamanagement.com for daily and most recent month-end performance updates.
CMG MID CAP GROWTH FUND
A Portfolio of Columbia Funds Institutional Trust
MANAGEMENT DISCUSSION OF FUND PERFORMANCE
CMG Mid Cap Growth Fund returned 8.56% for the 12-month period ended July 31, 2006. The fund beat the 2.98% return of the Russell Midcap Growth Index1 and the 2.24% average return of the Morningstar Mid-Cap Growth Category for the same period.2 Solid stock selection and sector allocations propelled fund performance.
The energy sector was the strongest contributor for the period, led by FMC Technologies, Inc. (0.7% of net assets), an energy service company that benefited from demand across a variety of exploration and production customers. Peabody Energy Corp. (0.8% of net assets) rose, as higher oil and gas prices made coal relatively more attractive. XTO Energy, Inc., sold from the portfolio, gained from high natural gas prices. We replaced ENSCO International, Inc. with Diamond Offshore Drilling, Inc. (0.7% of net assets), which is leveraged to higher day rates as long-term contracts are renewed. We also sold Teekay Shipping Corp. as concerns about the future incremental supply of tankers hurt performance.
Information technology stocks outperformed the index and had a significant impact on returns. SanDisk Corp. (0.6% of net assets) benefited from its dominant position as a supplier of flash memory. MEMC Electrical Materials, Inc. (0.3% of net assets) advanced on improved pricing from increased demand for both silicon and semiconductors. Cognizant Technology Solutions Corp. (1.3% of net assets) continued to capitalize on the trend of outsourcing IT services to India. Broadcom Corp. did well for the fund, but was sold on concerns regarding stock option granting; we trimmed Comverse Technology, Inc. (0.5% of net assets), which declined on similar concerns. Slower growth expectations plagued NAVTEQ Corp. (0.5% of net assets), which fell 36% in the period.
The fund's industrial holdings outperformed the index, gaining 18% for the period. Top contributors included Joy Global, Inc. and Terex Corp. (0.8% and 0.7% of net assets, respectively), which benefited from exposure to mining and construction customers in a long-tailed replacement cycle. C.H. Robinson Worldwide, Inc. (0.5% of net assets), a logistics company, benefited from global trade and a high return on capital. On the downside, Hexcel Corp. (0.8% of net assets) fell as one of its major customers for airline composites delayed the introduction of new aircraft; we believe that earnings have the potential to recover and continue holding the stock.
Strong individual performances in health care, financials and telecommunication services enhanced results. Amylin Pharmaceuticals, Inc. (0.6% of net assets) surged ahead on the successful introduction of Byetta, a drug treating type-2 diabetes. Lazard Ltd. (0.7% of net assets) profited from increased activity in mergers and acquisitions, and Chicago Mercantile Exchange (0.7% of net assets) advanced due to increased use of derivatives and growing market share. American Tower Corp. and Crown Castle International Corp. (1.5% and 1.0% of net
18
assets, respectively) benefited from increased capacity needs from their wireless service customers, while Millicom International Cellular SA (0.3% of net assets) continued to benefit from its strong position in emerging markets.
Consumer staples stocks generally detracted from results for the period. We sold Corn Products International, Inc., which fell on reduced profit expectations, and Tyson Foods, Inc., which dropped as it struggled to improve margins. The consumer discretionary sector also hindered performance. We sold XM Satellite Radio Holdings, Inc., due to slowing growth in its subscriber base, and we liquidated Tempur-Pedic International, Inc. on concerns of price discounts and competition. Chico's FAS, Inc. (0.6% of net assets) declined as sales slowed.
We anticipate slowing economic growth and have adjusted the portfolio accordingly. We trimmed the fund's exposure to cyclical stocks and reduced the fund's weights in the industrials and materials sectors, as well as to certain parts of the energy sector. We increased exposure to certain areas, including health care and consumer staples. Across the portfolio, we continue to seek out growth companies that have the potential to perform well in a slowing economy.
The fund's top ten holdings (as a percentage of net assets) as of July 31, 2006 were:
| (%) | |||||||
| American Tower | 1.5 | ||||||
| Cognizant Technology Solutions | 1.3 | ||||||
| Allergan | 1.3 | ||||||
| AES | 1.2 | ||||||
| Corporate Executive Board | 1.2 | ||||||
| Potash | 1.0 | ||||||
| Robert Half International | 1.0 | ||||||
| Ambac Financial Group | 1.0 | ||||||
| Crown Castle International | 1.0 | ||||||
| Coach | 1.0 | ||||||
Thank you for investing in the CMG Mid Cap Growth Fund.
Kenneth A. Korngiebel is the lead manager for the CMG Mid Cap Growth Fund and has managed or co-managed the fund since June 2004. Mr. Korngiebel has been associated with Columbia Advisors or its predecessors since July 1996.
Wayne M. Collette has co-managed the fund since February 2006. Mr. Collette has been associated with Columbia Advisors or its predecessors since 2001.
J. Michael Kosicki has co-managed the fund since February 2006. Mr. Kosicki has been associated with Columbia Advisors or its predecessors since 2004.
George J. Myers has co-managed the fund since February 2006. Mr. Myers has been associated with Columbia Advisors or its predecessors since 2004.
Theodore R. Wendell has co-managed the fund since February 2006. Mr. Wendell has been associated with Columbia Advisors or its predecessors since 2000.
19
Equity investments are affected by stock market fluctuations that occur in response to economic and business developments.
Investing in growth stocks incurs the possibility of losses because their prices are sensitive to changes in current or expected earnings.
Investing in mid-cap stocks may present special risks, including possible illiquidity and greater price volatility than stocks of larger, more established companies.
1 The Russell Midcap Growth Index measures the performance of those Russell Midcap companies with higher price-to-book ratios and higher forecasted growth values. Indices are not investments, do not incur fees or expenses and are not professionally managed. It is not possible to invest directly in an index. Securities in the fund may not match those in an index.
2 ©2006 by Morningstar, Inc. All rights reserved. The information contained herein is the proprietary information of Morningstar, Inc., may not be copied or redistributed for any purpose and may only be used for noncommercial, personal purposes. The information contained herein is not represented or warranted to be accurate, correct, complete or timely. Morningstar, Inc. shall not be responsible for investment decisions, damages or other losses resulting from the use of this information. Past performance is no guarantee of future performance. Morningstar, Inc. has not granted consent for it to be considered or deemed an "expert" under the Securities Act of 1933. Morningstar Categories compare the performance of funds with similar investment objectives and strategies.
Holdings are calculated as a percentage of net assets, and are subject to change. Because the fund is actively managed, there is no guarantee the fund will continue to maintain the holdings breakdown listed. The fund's holdings and their weights within the portfolio may change as market conditions change.
20
Average annual total return as of July 31, 2006 (%)
| Inception | 1-year | Life | |||||||||||||
| CMG Mid Cap Growth Fund | 05/05/03 | 8.56 | 14.19 | ||||||||||||
| Russell Midcap Growth Index | 2.98 | 17.07 | |||||||||||||
Average annual total return as of June 30, 2006 (%)
| Inception | 1-year | Life | |||||||||||||
| CMG Mid Cap Growth Fund | 05/05/03 | 20.36 | 16.11 | ||||||||||||
| Russell Midcap Growth Index | 13.04 | 18.93 | |||||||||||||
Index performance is from May 5, 2003.
Performance data quoted represents past performance and current performance may be lower or higher. Past performance is no guarantee of future results. The investment return and principal value will fluctuate so that shares, when redeemed, may be worth more or less than the original cost. Please visit www.columbiamanagement.com for daily and most recent month-end performance updates.
Performance results may reflect any voluntary waivers or reimbursement of fund expenses by the advisor or its affiliates. Absent these waivers or reimbursement arrangements, performance results would have been lower. All results shown assume reinvestment of distributions.
The table does not reflect the deduction of taxes that a shareholder would pay on fund distributions or the redemption of fund shares.
Growth of a $3,000,000 investment, May 5, 2003 to July 31, 2006
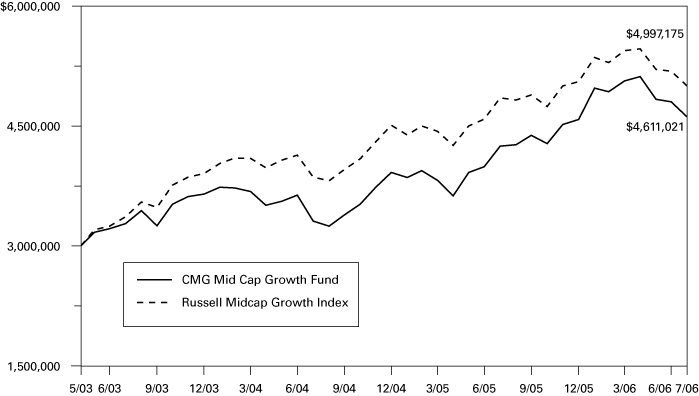
The Russell Midcap Growth Index measures the performance of those Russell Midcap companies with higher price-to-book ratios and higher forecasted growth values. Indices are not investments, do not incur fees or expenses and are not professionally managed. It is not possible to invest directly in an index. Securities in the fund may not match those in an index.
The chart above shows the growth in value of a hypothetical minimum initial $3,000,000 investment in the fund compared to the index during the stated time period, and does not reflect the deduction of taxes that a shareholder would pay on fund distributions or the redemption of fund shares.
21
UNDERSTANDING YOUR EXPENSES – CMG Mid Cap Growth Fund
As a fund shareholder, you incur two types of costs. There are transaction costs and also ongoing costs, which generally include investment advisory fees and other fund expenses. The information on this page is intended to help you understand your ongoing costs of investing in the fund and to compare these costs with the ongoing costs of investing in other mutual funds.
Analyzing your fund's expenses
To illustrate these ongoing costs, we have provided an example and calculated the expenses paid by investors during the reporting period. The information in the following table is based on an initial investment of $1,000, which is invested at the beginning of the reporting period and held for the entire period. Expense information is calculated two ways and each method provides you with different information. The amount listed in the "actual" column is calculated using the fund's actual operating expenses and total return for the period. The amount listed in the "hypothetical" column assumes that the return each year is 5% before expenses and is calculated based on the fund's actual operating expenses. You should not use the hypothetical account values and expenses to estimate either your actual account balance at the end of the period or the expenses you paid during this reporting period.
Estimating your actual expenses
To estimate the expenses that you paid over the period, first you will need your account balance at the end of the period:
1. Divide your ending account balance by $1,000. For example, if an account balance was $8,600 at the end of the period, the result would be 8.6.
2. In the section of the table below titled "Expenses paid during the period," locate the amount under "actual." Multiply this number by the result from step 1. Your answer is an estimate of the expenses you paid on your account during the period.
February 1, 2006 – July 31, 2006
| Account value at the beginning of the period ($) | Account value at the end of the period ($) | Expenses paid during the period ($) | Fund's annualized expense ratio (%) | ||||||||||||||||||||||||
| Actual | Hypothetical | Actual | Hypothetical | Actual | Hypothetical | Actual | |||||||||||||||||||||
| 1,000.00 | 1,000.00 | 927.55 | 1,021.32 | 3.35 | 3.51 | 0.70 | |||||||||||||||||||||
Expenses paid during the period are equal to the fund's annualized expense ratio of 0.70%, multiplied by the average account value over the period, then multiplied by the number of days in the fund's most recent fiscal half-year and divided by 365.
Had the Investment Advisor not reimbursed a portion of expenses, total return would have been reduced.
It is important to note that the expense amounts shown in the table are meant to highlight only ongoing costs of investing in the fund and do not reflect any transaction costs, such as sales charges, redemption or exchange fees. Therefore, the hypothetical examples provided may not help you determine the relative total costs of owning shares of different funds. If these transaction costs were included, your costs would have been higher.
22
Compare with other funds
Since all mutual funds are required to include the same hypothetical calculations about expenses in shareholder reports, you can use this information to compare the ongoing cost of investing in the fund with other funds. To do so, compare the 5% hypothetical example with the 5% hypothetical examples that appear in the shareholder reports of other funds. As you compare hypothetical examples of other funds, it is important to note that hypothetical examples are meant to highlight the continuing costs of investing in a fund and do not reflect any transaction costs, such as sales charges or redemption or exchange fees.
23
Performance data quoted represents past performance and current performance may be lower or higher. Past performance is no guarantee of future results. The investment return and principal value will fluctuate so that shares, when redeemed, may be worth more or less than the original cost. Please visit www.columbiamanagement.com for daily and most recent month-end performance updates.
CMG MID CAP VALUE FUND
A Portfolio of Columbia Funds Institutional Trust
MANAGEMENT DISCUSSION OF FUND PERFORMANCE
CMG Mid Cap Value Fund returned 9.30% for the 12-month period ended July 31, 2006. The fund outperformed its benchmark, the Russell Midcap Value Index,1 which returned 8.44% for the period. The fund's return was also higher than the 4.95% average return of the Morningstar Mid-Cap Value Category.2 The fund's performance benefited from favorable positioning relative to the benchmark in the consumer discretionary, energy and industrials sectors. Relative gains were further amplified by strong stock selection. Stock selection in the consumer staples, financial and telecommunications sectors hampered returns.
The fund's holdings are the result of individual stock selection rather than sector allocation. Nevertheless, stock selection sometimes results in under- or overweights relative to the benchmark, and these allocations can also have an impact on relative performance. For example, the fund was underweight relative to the benchmark in the weak-performing consumer discretionary sector, which aided performance. Stock selection within consumer discretionary was also positive for performance. We did well to avoid many of the media and household durable names that were among the weakest performers for the period.
The fund had more exposure than the index to energy and industrial stocks. Both sectors were strong performers and the fund gained ground because of their additional weight, as well as positive stock selection. As crude oil prices rose, the fund's positions in oil and gas producers, XTO Energy, Inc. and Hess Corp. (0.8% and 1.0% of net assets, respectively), and Peabody Energy Corp. (no longer in the portfolio), the world's largest coal producer, all rose strongly. We took advantage of a strong energy sector and used the opportunity to take profits and cut back on the fund's exposure, bringing it in line with the benchmark by the end of the period.
Continued global economic growth aided industrial names, including Manpower, Inc., which provides temporary employees, and ARAMARK Corp., a leading food service provider to educational, health care and public institutions, as well as sports arenas, national parks and other entertainment venues. Both stocks were sold from the portfolio.
Stock-specific disappointments within the consumer staples, financial and telecommunications sectors hampered the fund's return. Tyson Foods, Inc. (0.7% of net assets), a leading chicken distributor, struggled with weak pricing and oversupply, as well as the impact of fears about Avian flu. However, we believe that much of the bad news is behind the industry leader and that the company is well positioned to take advantage of its scale going forward. The fund did not have exposure to one of the best performers among agricultural companies and that restrained returns.
24
Higher interest rates, geopolitical unrest and slower economic growth have resulted in considerable uncertainty among investors. However, we continue to believe that our emphasis on companies with strong business prospects and attractive valuations remains sound.
The fund's top ten holdings (as a percentage of net assets) as of July 31, 2006 were:
| (%) | |||||||
| PG&E | 2.3 | ||||||
| Entergy | 1.9 | ||||||
| Edison International | 1.8 | ||||||
| PPL | 1.8 | ||||||
| Ambac Financial Group | 1.6 | ||||||
| Kroger | 1.5 | ||||||
| Comerica | 1.4 | ||||||
| Dean Foods | 1.4 | ||||||
| ProLogis | 1.4 | ||||||
| Marshall & Ilsley | 1.4 | ||||||
We appreciate your continued confidence in CMG Mid Cap Value Fund.
Diane L. Sobin has co-managed the CMG Mid Cap Value Fund since September 2004 and has been with the advisor or its predecessors or affiliate organizations since 2001.
David I. Hoffman has co-managed the fund since September 2004 and has been with the advisor or its predecessors or affiliate organizations since 2001.
Lori J. Ensinger has co-managed the fund since September 2004 and has been with the advisor or its predecessors or affiliate organizations since 2001.
Noah J. Petrucci has co-managed the fund since September 2004 and has been with the advisor or its predecessors or affiliate organizations since 2002.
Equity investments are affected by stock market fluctuations that occur in response to economic and business developments.
Investing in mid-cap stocks may present special risks, including possible illiquidity and greater price volatility than stocks of larger, more established companies.
Value stocks are stocks of companies that may have experienced adverse business or industry developments or may be subject to special risks that have caused the stocks to be out of favor and, in the advisor's opinion, undervalued. If the advisor's assessment of a company's prospects is wrong, the price of the company's stock may not approach the value the advisor has placed on it.
1 The Russell Midcap Value Index measures the performance of those Russell Midcap Index companies with lower price-to-book ratios and lower forecasted growth values. Indices are not investments, do not incur fees or expenses and are not professionally managed. It is not possible to invest directly in indices. Securities in the fund may not match those in an index.
25
2 ©2006 by Morningstar, Inc. All rights reserved. The information contained herein is the proprietary information of Morningstar, Inc., may not be copied or redistributed for any purpose and may only be used for noncommercial, personal purposes. The information contained herein is not represented or warranted to be accurate, correct, complete or timely. Morningstar, Inc. shall not be responsible for investment decisions, damages or other losses resulting from the use of this information. Past performance is no guarantee of future performance. Morningstar, Inc. has not granted consent for it to be considered or deemed an "expert" under the Securities Act of 1933. Morningstar Categories compare the performance of funds with similar investment objectives and strategies.
Holdings are calculated as a percentage of net assets, and are subject to change. Because the fund is actively managed, there is no guarantee the fund will continue to maintain the holdings breakdown listed. The fund's holdings and their weights within the portfolio may change as market conditions change.
26
Average annual total return as of July 31, 2006 (%)
| Inception | 1-year | Life | |||||||||||||
| CMG Mid Cap Value Fund | 05/05/03 | 9.30 | 17.43 | ||||||||||||
| Russell Midcap Value Index | 8.44 | 22.97 | |||||||||||||
Average annual total return as of June 30, 2006 (%)
| Inception | 1-year | Life | |||||||||||||
| CMG Mid Cap Value Fund | 05/05/03 | 15.01 | 18.15 | ||||||||||||
| Russell Midcap Value Index | 14.25 | 23.88 | |||||||||||||
Index performance is from May 5, 2003.
Performance data quoted represents past performance and current performance may be lower or higher. Past performance is no guarantee of future results. The investment return and principal value will fluctuate so that shares, when redeemed, may be worth more or less than the original cost. Please visit www.columbiamanagement.com for daily and most recent month-end performance updates.
Performance results may reflect any voluntary waivers or reimbursement of fund expenses by the advisor or its affiliates. Absent these waivers or reimbursement arrangements, performance results would have been lower. All results shown assume reinvestment of distributions.
The table does not reflect the deduction of taxes that a shareholder would pay on fund distributions or the redemption of fund shares.
Growth of a $3,000,000 investment, May 5, 2003 to July 31, 2006
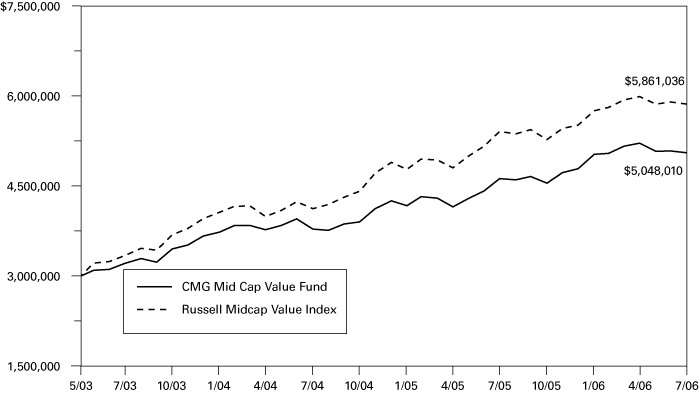
The Russell Midcap Value Index measures the performance of those Russell Midcap Index companies with lower price-to-book ratios and lower forecasted growth values. Indices are not investments, do not incur fees or expenses and are not professionally managed. It is not possible to invest directly in indices. Securities in the fund may not match those in an index.
The chart above shows the growth in value of a hypothetical minimum initial $3,000,000 investment in the fund compared to the index during the stated time period, and does not reflect the deduction of taxes that a shareholder would pay on fund distributions or the redemption of fund shares.
27
UNDERSTANDING YOUR EXPENSES – CMG Mid Cap Value Fund
As a fund shareholder, you incur two types of costs. There are transaction costs and also ongoing costs, which generally include investment advisory fees and other fund expenses. The information on this page is intended to help you understand your ongoing costs of investing in the fund and to compare these costs with the ongoing costs of investing in other mutual funds.
Analyzing your fund's expenses
To illustrate these ongoing costs, we have provided an example and calculated the expenses paid by investors during the reporting period. The information in the following table is based on an initial investment of $1,000, which is invested at the beginning of the reporting period and held for the entire period. Expense information is calculated two ways and each method provides you with different information. The amount listed in the "actual" column is calculated using the fund's actual operating expenses and total return for the period. The amount listed in the "hypothetical" column assumes that the return each year is 5% before expenses and is calculated based on the fund's actual operating expenses. You should not use the hypothetical account values and expenses to estimate either your actual account balance at the end of the period or the expenses you paid during this reporting period.
Estimating your actual expenses
To estimate the expenses that you paid over the period, first you will need your account balance at the end of the period:
1. Divide your ending account balance by $1,000. For example, if an account balance was $8,600 at the end of the period, the result would be 8.6.
2. In the section of the table below titled "Expenses paid during the period," locate the amount under "actual." Multiply this number by the result from step 1. Your answer is an estimate of the expenses you paid on your account during the period.
February 1, 2006 – July 31, 2006
| Account value at the beginning of the period ($) | Account value at the end of the period ($) | Expenses paid during the period ($) | Fund's annualized expense ratio (%) | ||||||||||||||||||||||||
| Actual | Hypothetical | Actual | Hypothetical | Actual | Hypothetical | Actual | |||||||||||||||||||||
| 1,000.00 | 1,000.00 | 1,004.31 | 1,021.32 | 3.48 | 3.51 | 0.70 | |||||||||||||||||||||
Expenses paid during the period are equal to the fund's annualized expense ratio of 0.70%, multiplied by the average account value over the period, then multiplied by the number of days in the fund's most recent fiscal half-year and divided by 365.
Had the Investment Advisor not reimbursed a portion of expenses, total return would have been reduced.
It is important to note that the expense amounts shown in the table are meant to highlight only ongoing costs of investing in the fund and do not reflect any transaction costs, such as sales charges, redemption or exchange fees. Therefore, the hypothetical examples provided may not help you determine the relative total costs of owning shares of different funds. If these transaction costs were included, your costs would have been higher.
28
Compare with other funds
Since all mutual funds are required to include the same hypothetical calculations about expenses in shareholder reports, you can use this information to compare the ongoing cost of investing in the fund with other funds. To do so, compare the 5% hypothetical example with the 5% hypothetical examples that appear in the shareholder reports of other funds. As you compare hypothetical examples of other funds, it is important to note that hypothetical examples are meant to highlight the continuing costs of investing in a fund and do not reflect any transaction costs, such as sales charges or redemption or exchange fees.
29
Performance data quoted represents past performance and current performance may be lower or higher. Past performance is no guarantee of future results. The investment return and principal value will fluctuate so that shares, when redeemed, may be worth more or less than the original cost. Please visit www.columbiamanagement.com for daily and most recent month-end performance updates.
CMG SMALL CAP GROWTH FUND
A Portfolio of Columbia Funds Institutional Trust
MANAGEMENT DISCUSSION OF FUND PERFORMANCE
CMG Small Cap Growth Fund returned 10.46% for the 12-month period ended July 31, 2006. For the same period, the Russell 2000 Growth Index1 returned 1.53%. The average return of the Morningstar Small Growth Category2 was 0.66%. Solid stock selection drove the fund's performance in the reporting period, and good sector allocation decisions contributed to relative results.
The fund's industrial holdings outperformed the index, gaining 22% for the period. Top contributors to performance included Joy Global, Inc. (sold from the portfolio) and Terex Corp. (0.6% of net assets), which benefited from exposure to mining and construction customers in a replacement cycle. Kenexa Corp. (1.2% of net assets) advanced on solid demand for its human resources software which is designed to manage workforce and benefits more efficiently. In addition, BE Aerospace, Inc. (1.6% of net assets) benefited from a new build cycle for commercial airlines, and Ceradyne, Inc. (0.9% of net assets) rose on increased military demand for body and vehicle armor. On the downside, LECG Corp. fell short of expected productivity and was sold from the portfolio.
The fund's energy holdings outperformed, as Core Laboratories NV, Tetra Technologies, Inc., Veritas DGC, Inc. and Atwood Oceanics, Inc. (1.0%, 0.9%, 0.6% and 1.2% of net assets, respectively) all benefited from increased spending by exploration and production companies. Disappointments in the group included Oil States International, Inc. (1.1% of net assets), which fell victim to the oil and gas correction late in the reporting period. The market correction presented an opportunity to upgrade the portfolio, and we replaced TODCO, down 28% in the reporting period, with higher quality names.
Financial stocks were solid during the period, and the fund's holdings outperformed the index. Affiliated Managers Group, Inc. (1.6% of net assets), a consolidator of mid-sized investment firms, experienced steady earnings. We purchased InterContinental Exchange, Inc. on the initial public offering, and it benefited from the increased use of derivatives focused on energy markets. We took profits and sold the stock during the period. Nasdaq Stock Market, Inc. (0.5% of net assets), however, declined because of competition from other exchanges and difficulties with acquiring the London Stock Exchange.
Standout performance among certain individual stocks enhanced the fund's returns. A telecommunication services holding, Millicom International Cellular SA (0.4% of net assets), benefited from its solid position in emerging markets. ICON PLC (1.9% of net assets), a health services firm, advanced as bookings for its clinical trial services accelerated and its lab business recovered. Among technology stocks, Hittite Microwave Corp.'s (0.6% of net assets) valuable technology in analog and integrated mixed-signal circuits was reflected in its profit margins.
30
The fund experienced weakness in the consumer discretionary and consumer staples sectors. Among the former, we sold Tempur-Pedic International, Inc. on concerns about discounting and competition. We also sold Radio One, Inc., because secular trends in the radio business have eroded value, offsetting its cable network investment. And although VistaPrint Ltd. performed well for the fund, we sold the stock because we were uncomfortable with the quality of the company's revenue stream. Among staples stocks, Central Garden & Pet Co. (0.8% of net assets) grappled with issues including weather, inventory reduction and confusion on an acquisition. We believe the issues are short-term in nature and remain patient with the stock.
We anticipate slowing economic growth and have adjusted the portfolio accordingly. We trimmed the fund's exposure to cyclical stocks and reduced the fund's weights in the industrials and materials sectors, as well as to certain parts of the energy sector. We increased exposure to certain areas, including health care and consumer staples. Across the portfolio, we continue to seek out growth companies that have the potential to perform well in a slowing economy.
The fund's top ten holdings (as a percentage of net assets) as of July 31, 2006 were:
| (%) | |||||||
| ICON PLC | 1.9 | ||||||
| ResMed | 1.7 | ||||||
| HealthExtras | 1.6 | ||||||
| BE Aerospace | 1.6 | ||||||
| Affiliated Managers Group | 1.6 | ||||||
| Allscripts Healthcare Solutions | 1.4 | ||||||
| ProAssurance | 1.3 | ||||||
| Huron Consulting Group | 1.2 | ||||||
| Kenexa | 1.2 | ||||||
| Atwood Oceanics | 1.2 | ||||||
Thank you for investing in CMG Small Cap Growth Fund.
Kenneth A. Korngiebel is the lead manager for the CMG Small Cap Growth Fund and has managed or co-managed the fund since September 2005. Mr. Korngiebel has been associated with Columbia Advisors or its predecessors since July 1996.
Wayne M. Collette has co-managed the fund since February 2006. Mr. Collette has been associated with Columbia Advisors or its predecessors since 2001.
J. Michael Kosicki has co-managed the fund since February 2006. Mr. Kosicki has been associated with Columbia Advisors or its predecessors since 2004.
George J. Myers has co-managed the fund since February 2006. Mr. Myers has been associated with Columbia Advisors or its predecessors since 2004.
Theodore R. Wendell has co-managed the fund since February 2006. Mr. Wendell has been associated with Columbia Advisors or its predecessors since 2000.
31
Equity investments are affected by stock market fluctuations that occur in response to economic and business developments.
Investing in growth stocks incurs the possibility of losses because their prices are sensitive to changes in current or expected earnings.
Investments in small-cap stocks may be subject to greater volatility and price fluctuations because they may be thinly traded and less liquid than investments in larger companies.
1 The Russell 2000 Growth Index measures the performance of those Russell 2000 Index companies with higher price-to-book ratios and higher forecasted growth values. Indices are not investments, do not incur fees or expenses and are not professionally managed. It is not possible to invest directly in an index. Securities in the fund may not match those in an index.
2 ©2006 by Morningstar, Inc. All rights reserved. The information contained herein is the proprietary information of Morningstar, Inc., may not be copied or redistributed for any purpose and may only be used for noncommercial, personal purposes. The information contained herein is not represented or warranted to be accurate, correct, complete or timely. Morningstar, Inc. shall not be responsible for investment decisions, damages or other losses resulting from the use of this information. Past performance is no guarantee of future performance. Morningstar, Inc. has not granted consent for it to be considered or deemed an "expert" under the Securities Act of 1933. Morningstar Categories compare the performance of funds with similar investment objectives and strategies.
Holdings are calculated as a percentage of net assets, and are subject to change. Because the fund is actively managed, there is no guarantee the fund will continue to maintain the holdings breakdown listed. The fund's holdings and their weights within the portfolio may change as market conditions change.
32
Average annual total return as of July 31, 2006 (%)
| Inception | 1-year | 5-year | 10-year | ||||||||||||||||
| CMG Small Cap Growth Fund | 08/30/89 | 10.46 | 6.57 | 11.06 | |||||||||||||||
| Russell 2000 Index | 4.24 | 8.99 | 9.69 | ||||||||||||||||
| Russell 2000 Growth Index | 1.53 | 4.23 | 4.93 | ||||||||||||||||
Average annual total return as of June 30, 2006 (%)
| Inception | 1-year | 5-year | 10-year | ||||||||||||||||
| CMG Small Cap Growth Fund | 08/30/89 | 24.35 | 6.76 | 10.77 | |||||||||||||||
| Russell 2000 Index | 14.58 | 8.50 | 9.05 | ||||||||||||||||
| Russell 2000 Growth Index | 14.58 | 3.49 | 4.12 | ||||||||||||||||
Performance data quoted represents past performance and current performance may be lower or higher. Past performance is no guarantee of future results. The investment return and principal value will fluctuate so that shares, when redeemed, may be worth more or less than the original cost. Please visit www.columbiamanagement.com for daily and most recent month-end performance updates.
Performance results reflect any voluntary waivers or reimbursement of fund expenses by the advisor or its affiliates. Absent these waivers or reimbursement arrangements, performance results would have been lower. All results shown assume reinvestment of distributions.
The table does not reflect the deduction of taxes that a shareholder would pay on fund distributions or the redemption of fund shares.
Growth of a $3,000,000 investment, August 1, 1996 to July 31, 2006
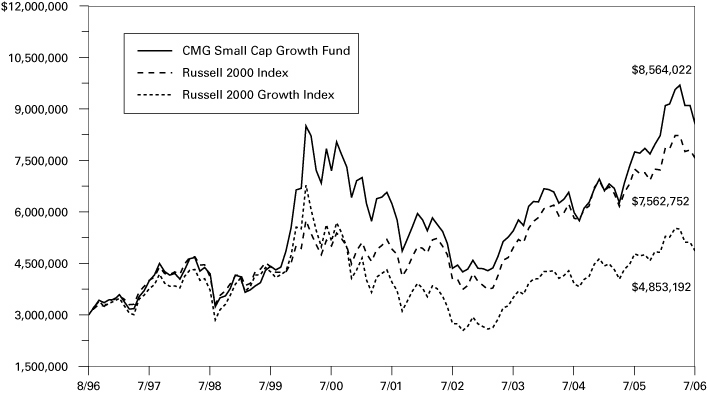
The Russell 2000 Index tracks the performance of the 2,000 smallest of the 3,000 largest U.S. companies based on market capitalization. The Russell 2000 Growth Index measures the performance of those Russell 2000 Index companies with higher price-to-book ratios and higher forecasted growth values. Indices are not investments, do not incur fees or expenses and are not professionally managed. It is not possible to invest directly in an index. Securities in the fund may not match those in an index.
The chart above shows the growth in value of a hypothetical minimum initial $3,000,000 investment in the fund compared to the indices during the period, and does not reflect the deduction of taxes that a shareholder would pay on fund distributions or the redemption of fund shares.
33
UNDERSTANDING YOUR EXPENSES — CMG Small Cap Growth Fund
As a fund shareholder, you incur two types of costs. There are transaction costs and also ongoing costs, which generally include investment advisory fees and other fund expenses. The information on this page is intended to help you understand your ongoing costs of investing in the fund and to compare these costs with the ongoing costs of investing in other mutual funds.
Analyzing your fund's expenses
To illustrate these ongoing costs, we have provided an example and calculated the expenses paid by investors during the reporting period. The information in the following table is based on an initial investment of $1,000, which is invested at the beginning of the reporting period and held for the entire period. Expense information is calculated two ways and each method provides you with different information. The amount listed in the "actual" column is calculated using the fund's actual operating expenses and total return for the period. The amount listed in the "hypothetical" column assumes that the return each year is 5% before expenses and is calculated based on the fund's actual operating expenses. You should not use the hypothetical account values and expenses to estimate either your actual account balance at the end of the period or the expenses you paid during this reporting period.
Estimating your actual expenses
To estimate the expenses that you paid over the period, first you will need your account balance at the end of the period:
1. Divide your ending account balance by $1,000. For example, if an account balance was $8,600 at the end of the period, the result would be 8.6.
2. In the section of the table below titled "Expenses paid during the period," locate the amount under "actual." Multiply this number by the result from step 1. Your answer is an estimate of the expenses you paid on your account during the period.
February 1, 2006 – July 31, 2006
| Account value at the beginning of the period ($) | Account value at the end of the period ($) | Expenses paid during the period ($) | Fund's annualized expense ratio (%) | ||||||||||||||||||||||||
| Actual | Hypothetical | Actual | Hypothetical | Actual | Hypothetical | Actual | |||||||||||||||||||||
| 1,000.00 | 1,000.00 | 939.80 | 1,019.89 | 4.76 | 4.96 | 0.99 | |||||||||||||||||||||
Expenses paid during the period are equal to the fund's annualized expense ratio of 0.99%, multiplied by the average account value over the period, then multiplied by the number of days in the fund's most recent fiscal half-year and divided by 365.
Had the Investment Advisor and/or Transfer Agent not waived/reimbursed a portion of expenses, total return would have been reduced.
Effective March 27, 2006, Columbia and its affiliates have contractually agreed to waive fees and reimburse the fund until November 30, 2009, for certain expenses so that total expenses (exclusive of brokerage commissions, interest, taxes and extraordinary expenses, if any) will not exceed 0.80% annually of the fund's average daily net assets. There is no guarantee that this arrangement will continue after November 30, 2009.
It is important to note that the expense amounts shown in the table are meant to highlight only ongoing costs of investing in the fund and do not reflect any transaction costs, such as sales charges, redemption or exchange fees.
34
Therefore, the hypothetical examples provided may not help you determine the relative total costs of owning shares of different funds. If these transaction costs were included, your costs would have been higher.
Compare with other funds
Since all mutual funds are required to include the same hypothetical calculations about expenses in shareholder reports, you can use this information to compare the ongoing cost of investing in the fund with other funds. To do so, compare the 5% hypothetical example with the 5% hypothetical examples that appear in the shareholder reports of other funds. As you compare hypothetical examples of other funds, it is important to note that hypothetical examples are meant to highlight the continuing costs of investing in a fund and do not reflect any transaction costs, such as sales charges or redemption or exchange fees.
35
Performance data quoted represents past performance and current performance may be lower or higher. Past performance is no guarantee of future results. The investment return and principal value will fluctuate so that shares, when redeemed, may be worth more or less than the original cost. Please visit www.columbiamanagement.com for daily and most recent month-end performance updates.
CMG SMALL CAP VALUE FUND
A Portfolio of Columbia Funds Institutional Trust
MANAGEMENT DISCUSSION OF FUND PERFORMANCE
CMG Small Cap Value Fund returned 7.90% for the 12-month period ended July 31, 2006. The fund outperformed its benchmark, the Russell 2000 Value Index1, which returned 6.93%. Its return was higher than the average return of the Morningstar Small Value Category, which was 3.72% over the same period.2 Sector allocation and stock selection were nearly equal contributors in helping the fund outpace the Russell index. Stock picking was especially strong in the financials, energy and consumer staples sectors, while the fund's energy and consumer discretionary sector weights made a positive contribution relative to the index. Generally speaking, we remained focused on companies we believe have strong competitive and financial positions, good earnings growth prospects and reasonable stock valuations.
Small-cap stocks led the market's rise, as investors' appetite for risk remained strong during most of the period. An accommodative lending environment further aided small companies. However, mounting uncertainty over the Federal Reserve Board's next moves and a tightening of global liquidity led to increased market volatility in the final months of the period. Small-cap stocks suffered more in the downturn than large-cap stocks.
The fund's most impressive returns came from financial stocks, particularly specialty financials, insurers and real estate investment trusts (REITs) that we had bought at valuations we believed to be attractive. Our focus was on companies that we believed could profit from rising interest rates. In the specialty finance group, Cash America International, Inc., (0.9% of net assets) a pawn shop operator in the United States and United Kingdom, stood out. The company benefited from growing demand for its services, higher interest rates and rising gold and silver prices. Insurers that realized rate increases after the Gulf Coast hurricanes also did well. Among them was Navigators Group, Inc., (0.8% of net assets) which specializes in insurance for marine boats and offshore energy rigs. The fund did well to have a below-average stake in REITs, which lagged other financial industries. Within REITs, sector selection was favorable. We f ocused on economically sensitive issues, such as apartments, office parks and industrials, which continued to do well.
Stock selection in the energy sector also boosted returns. In addition, the fund had slightly more exposure to the sector than the index, which amplified the impact of its good returns. Winners included Lufkin Industries, Inc. (1.0% of net assets), Western Gas Resources, Inc. and Maverick Tube Corp, which are no longer in the portfolio. Peabody Energy Corp. (0.4% of net assets), the largest publicly-held coal company in the world, had a stellar year, as coal prices climbed and the company's market share grew.
By contrast, stock selection in health care detracted from performance, as the relatively inexpensive but higher quality stocks that the fund owned trailed higher risk names, especially those in the biotechnology industry. The fund had no exposure to biotechnology or to
36
specialty pharmaceutical stocks, which did better than the overall index. In addition, many of the fund's health care service and facilities stocks posted disappointing returns. Detractors included Kindred Healthcare, Inc. (0.6% of net assets), an operator of hospital and nursing facilities, whose stock price fell amid concerns that the federal government would freeze or reduce certain hospital payment rates.
Going forward, we expect economic growth to slow and interest rates to creep higher. How small-cap stocks fare in that environment is likely to depend on whether investors remain comfortable with the risks associated with smaller companies, as well as the lending environment for small companies. However, we believe that the fund's quality bias should stand it in good stead if investors gravitate toward companies with stronger financial conditions in an environment of slower economic growth.
The fund's top ten holdings (as a percentage of net assets) as of July 31, 2006 were:
| (%) | |||||||
| Harsco | 1.1 | ||||||
| KHD Humboldt Wedag International | 1.0 | ||||||
| Precision Castparts | 1.0 | ||||||
| Lufkin Industries | 1.0 | ||||||
| Cash America International | 0.9 | ||||||
| Pediatrix Medical Group | 0.9 | ||||||
| Genlyte Group | 0.9 | ||||||
| Greif | 0.9 | ||||||
| Mid-America Apartment Communities | 0.8 | ||||||
| Consolidated Graphics | 0.8 | ||||||
Thank you for investing in CMG Small Cap Value Fund.
Stephen Barbaro has managed or co-managed the CMG Small Cap Value Fund since the fund's inception and has been with the advisor or its predecessors or affiliate organizations since 1976.
Jeremy Javidi has co-managed the fund since August 2005 and has been with the advisor or its predecessors or affiliate organizations since January 2000.
Equity investments are affected by stock market fluctuations that occur in response to economic and business developments.
Investments in small-cap stocks may be subject to greater volatility and price fluctuations because they may be thinly traded and less liquid than investments in larger companies.
Value stocks are stocks of companies that may have experienced adverse business or industry developments or may be subject to special risks that have caused the stocks to be out of favor and, in the advisor's opinion, undervalued. If the advisor's assessment of a company's prospects is wrong, the price of the company's stock may not approach the value the advisor has placed on it.
37
1 The Russell 2000 Value Index tracks the performance of those Russell 2000 Index companies with lower price-to-book ratios and lower forecasted growth values. The Russell 2000 Index tracks the performance of the 2,000 smallest of the 3,000 largest U.S. companies based on market capitalization. Indices are not investments, do not incur fees or expenses and are not professionally managed. It is not possible to invest directly in indices. Securities in the fund may not match those in an index.
2 ©2006 by Morningstar, Inc. All rights reserved. The information contained herein is the proprietary information of Morningstar, Inc., may not be copied or redistributed for any purpose and may only be used for noncommercial, personal purposes. The information contained herein is not represented or warranted to be accurate, correct, complete or timely. Morningstar, Inc. shall not be responsible for investment decisions, damages or other losses resulting from the use of this information. Past performance is no guarantee of future performance. Morningstar, Inc. has not granted consent for it to be considered or deemed an "expert" under the Securities Act of 1933.
Holdings are calculated as a percentage of net assets, and are subject to change. Because the fund is actively managed, there is no guarantee the fund will continue to maintain the holdings breakdown listed. The fund's holdings and their weights within the portfolio may change as market conditions change.
38
Average annual total return as of July 31, 2006 (%)
| Inception | 1-year | Life | |||||||||||||
| CMG Small Cap Value Fund | 05/05/03 | 7.90 | 21.79 | ||||||||||||
| Russell 2000 Value Index | 6.93 | 22.18 | |||||||||||||
| Russell 2000 Index | 4.24 | 19.37 | |||||||||||||
Average annual total return as of June 30, 2006 (%)
| Inception | 1-year | Life | |||||||||||||
| CMG Small Cap Value Fund | 05/05/03 | 16.99 | 23.40 | ||||||||||||
| Russell 2000 Value Index | 14.61 | 23.39 | |||||||||||||
| Russell 2000 Index | 14.58 | 21.21 | |||||||||||||
Index performance is from May 5, 2003.
Performance data quoted represents past performance and current performance may be lower or higher. Past performance is no guarantee of future results. The investment return and principal value will fluctuate so that shares, when redeemed, may be worth more or less than the original cost. Please visit www.columbiamanagement.com for daily and most recent month-end performance updates.
Performance results reflect any voluntary waivers or reimbursement of fund expenses by the advisor or its affiliates. Absent these waivers or reimbursement arrangements, performance results would have been lower. All results shown assume reinvestment of distributions.
The table does not reflect the deduction of taxes that a shareholder would pay on fund distributions or the redemption of fund shares.
Growth of a $3,000,000 investment, May 5, 2003 to July 31, 2006
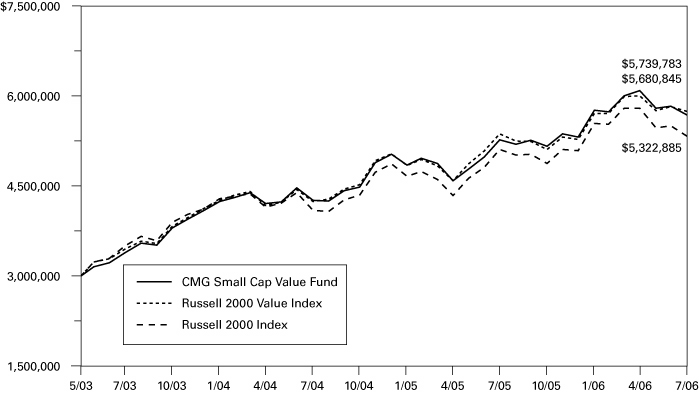
The Russell 2000 Value Index tracks the performance of those Russell 2000 Index companies with lower price-to-book ratios and lower forecasted growth values. The Russell 2000 Index tracks the performance of the 2,000 smallest of the 3,000 largest U.S. companies based on market capitalization. Indices are not investments, do not incur fees or expenses and are not professionally managed. It is not possible to invest directly in indices. Securities in the fund may not match those in an index.
The chart above shows the growth in value of a hypothetical minimum initial $3,000,000 investment in the fund compared to the indices during the stated time period, and does not reflect the deduction of taxes that a shareholder would pay on fund distributions or the redemption of fund shares.
39
UNDERSTANDING YOUR EXPENSES — CMG Small Cap Value Fund
As a fund shareholder, you incur two types of costs. There are transaction costs and also ongoing costs, which generally include investment advisory fees and other fund expenses. The information on this page is intended to help you understand your ongoing costs of investing in the fund and to compare these costs with the ongoing costs of investing in other mutual funds.
Analyzing your fund's expenses
To illustrate these ongoing costs, we have provided an example and calculated the expenses paid by investors during the reporting period. The information in the following table is based on an initial investment of $1,000, which is invested at the beginning of the reporting period and held for the entire period. Expense information is calculated two ways and each method provides you with different information. The amount listed in the "actual" column is calculated using the fund's actual operating expenses and total return for the period. The amount listed in the "hypothetical" column assumes that the return each year is 5% before expenses and is calculated based on the fund's actual operating expenses. You should not use the hypothetical account values and expenses to estimate either your actual account balance at the end of the period or the expenses you paid during this reporting period.
Estimating your actual expenses
To estimate the expenses that you paid over the period, first you will need your account balance at the end of the period:
1. Divide your ending account balance by $1,000. For example, if an account balance was $8,600 at the end of the period, the result would be 8.6.
2. In the section of the table below titled "Expenses paid during the period," locate the amount under "actual." Multiply this number by the result from step 1. Your answer is an estimate of the expenses you paid on your account during the period.
February 1, 2006 – July 31, 2006
| Account value at the beginning of the period ($) | Account value at the end of the period ($) | Expenses paid during the period ($) | Fund's annualized expense ratio (%) | ||||||||||||||||||||||||||||
| Actual | Hypothetical | Actual | Hypothetical | Actual | Hypothetical | Actual | |||||||||||||||||||||||||
| 1,000.00 | 1,000.00 | 986.46 | 1,020.83 | 3.94 | 4.01 | 0.80 | |||||||||||||||||||||||||
Expenses paid during the period are equal to the fund's annualized expense ratio of 0.80%, multiplied by the average account value over the period, then multiplied by the number of days in the fund's most recent fiscal half-year and divided by 365.
Had the Investment Advisor not reimbursed a portion of expenses, total return would have been reduced.
It is important to note that the expense amounts shown in the table are meant to highlight only ongoing costs of investing in the fund and do not reflect any transaction costs, such as sales charges, redemption or exchange fees. Therefore, the hypothetical examples provided may not help you determine the relative total costs of owning shares of different funds. If these transaction costs were included, your costs would have been higher.
40
Compare with other funds
Since all mutual funds are required to include the same hypothetical calculations about expenses in shareholder reports, you can use this information to compare the ongoing cost of investing in the fund with other funds. To do so, compare the 5% hypothetical example with the 5% hypothetical examples that appear in the shareholder reports of other funds. As you compare hypothetical examples of other funds, it is important to note that hypothetical examples are meant to highlight the continuing costs of investing in a fund and do not reflect any transaction costs, such as sales charges or redemption or exchange fees.
41
Performance data quoted represents past performance and current performance may be lower or higher. Past performance is no guarantee of future results. The investment return and principal value will fluctuate so that shares, when redeemed, may be worth more or less than the original cost. Please visit www.columbiamanagement.com for daily and most recent month-end performance updates.
CMG SMALL/MID CAP FUND
A Portfolio of Columbia Funds Institutional Trust
MANAGEMENT DISCUSSION OF FUND PERFORMANCE
CMG Small/Mid Cap Fund returned 9.17% for the 12-month period ended July 31, 2006, surpassing both the Russell 2500 Growth Index and the Russell 2500 Index1, which returned 2.38% and 3.82%, respectively. The fund also exceeded the 2.24% average return of the Morningstar Mid-Cap Growth Category2 for the same period. Good stock selection, particularly in industrials and health care, drove the fund's performance.
The fund's industrial holdings outperformed the index, gaining 22% for the period. Top contributors included Joy Global, Inc. and Terex Corp. (0.3% and 0.8% of net assets, respectively), which benefited from exposure to mining and construction customers in a long-tailed replacement cycle. Ceradyne, Inc. (0.9% of net assets) benefited from increased military orders for body and vehicle armor. On the downside, Hexcel Corp. (0.8% of net assets), a component supplier levered to the aerospace markets, fell as one of its major customers delayed the introduction of new aircraft; we believe earnings have the potential to recover and we continue to hold the stock.
The fund's health care stocks outperformed the index for the period. Amylin Pharmaceuticals, Inc. (0.3% of net assets) surged on the successful introduction of Byetta, a drug treating type-2 diabetes. ICON PLC (1.9% of net assets) benefited as bookings for its clinical trial services accelerated and its lab business recovered. HealthExtras, Inc. (1.6% of net assets) advanced on winning new business from larger competitors. Salix Pharmaceuticals Ltd. (0.2% of net assets), however, declined as efforts to build inventory and higher expenses delayed an anticipated increase in profitability, and we reduced the position. Medicis Pharmaceutical Corp. (0.7% of net assets) also declined as key products faced new and generic competition; we are holding the stock because approval for a new acne drug could help profitability.
The information technology sector was another strong contributor to fund performance. The value of Hittite Microwave Corp.'s technology in analog and integrated mixed-signal circuits was reflected in compelling profit margins (0.6% of net assets). Micromuse, Inc. gained on its acquisition by IBM and the position was liquidated. MEMC Electronic Materials, Inc. advanced on improved pricing from increased demand for both silicon and semiconductors and was sold from the portfolio. Ixia and NetLogic Microsystems, Inc. (0.8% and 0.5% of net assets, respectively), however, detracted from results.
The energy, financial and telecommunication services sectors all made solid contributions to fund performance. In energy, Tetra Technologies, Inc. and Veritas DGC, Inc (1.0% and 0.4% of net assets, respectively) benefited from increased spending by exploration and production companies. Among financials, Affiliated Managers Group, Inc. experienced steady earnings and Lazard Ltd. (1.4% and 0.8% of net assets, respectively) profited from increased activity in mergers and acquisitions. Telecommunication services holding Millicom International Cellular SA (0.5% of net assets) continued to benefit from its solid position in emerging markets.
42
The fund experienced weakness in the consumer staples and consumer discretionary sectors. In staples, we sold Corn Products International, Inc. because of reduced profit expectations. Central Garden & Pet Co. (0.8% of net assets) grappled with the weather, inventory reduction and confusion surrounding an acquisition; we believe the issues are short-term in nature and remain patient. Among consumer discretionary names, we sold Tempur-Pedic International, Inc. on worries of discounting and competition; a slowing subscriber base prompted liquidation of XM Satellite Radio Holdings, Inc. Although VistaPrint Ltd. performed well, we became uncomfortable with the quality of its revenue stream and sold the stock.
We anticipate slowing economic growth and have adjusted the portfolio accordingly. We trimmed the fund's exposure to cyclical stocks and reduced the fund's weights in the industrials and materials sectors, as well as to certain parts of the energy sector. We increased exposure to certain areas, including health care and consumer staples. Across the portfolio, we continue to seek out growth companies that have the potential to perform well in a slowing economy.
The fund's top ten holdings (as a percentage of net assets) as of July 31, 2006 were:
| (%) | |||||||
| ICON PLC | 1.9 | ||||||
| HealthExtras | 1.6 | ||||||
| Huron Consulting Group | 1.5 | ||||||
| Affiliated Managers Group | 1.4 | ||||||
| Allscripts Healthcare Solutions | 1.3 | ||||||
| Kenexa | 1.2 | ||||||
| ResMed | 1.2 | ||||||
| Alliance Data Systems | 1.2 | ||||||
| Potash Corp. of Saskatchewan | 1.2 | ||||||
| ProAssurance | 1.1 | ||||||
We appreciate your continued confidence in the CMG Small/Mid Cap Fund.
Kenneth A. Korngiebel is the lead manager for the CMG Small/Mid Cap Fund and has managed or co-managed the fund since June 2004. Mr. Korngiebel has been associated with Columbia Advisors or its predecessors since July 1996.
Wayne M. Collette has co-managed the fund since February 2006. Mr. Collette has been associated with Columbia Advisors or its predecessors since 2001.
J. Michael Kosicki has co-managed the fund since February 2006. Mr. Kosicki has been associated with Columbia Advisors or its predecessors since 2004.
George J. Myers has co-managed the fund since February 2006. Mr. Myers has been associated with Columbia Advisors or its predecessors since 2004.
Theodore R. Wendell has co-managed the fund since February 2006. Mr. Wendell has been associated with Columbia Advisors or its predecessors since 2000.
43
Equity investments are affected by stock market fluctuations that occur in response to economic and business developments.
Investing in growth stocks incurs the possibility of losses because their prices are sensitive to changes in current or expected earnings.
Investments in small- and mid-cap stocks may present special risks. They tend to be more volatile and may be less liquid than the stocks of larger companies. Small-cap stocks often have narrower markets, limited financial resources and tend to be more thinly traded than stocks of larger companies.
1 The Russell 2500 Growth Index measures the performance of those Russell 2500 Index companies with higher price-to-book ratios and higher forecasted growth values. The Russell 2500 Index tracks the performance of the 2,500 smallest companies of the Russell 3000 Index. Indices are not investments, do not incur fees or expenses and are not professionally managed. It is not possible to invest directly in an index. Securities in the fund may not match those in an index.
2 ©2006 by Morningstar, Inc. All rights reserved. The information contained herein is the proprietary information of Morningstar, Inc., may not be copied or redistributed for any purpose and may only be used for noncommercial, personal purposes. The information contained herein is not represented or warranted to be accurate, correct, complete or timely. Morningstar, Inc. shall not be responsible for investment decisions, damages or other losses resulting from the use of this information. Past performance is no guarantee of future performance. Morningstar, Inc. has not granted consent for it to be considered or deemed an "expert" under the Securities Act of 1933. Morningstar Categories compare the performance of funds with similar investment objectives and strategies.
Holdings are calculated as a percentage of net assets, and are subject to change. Because the fund is actively managed, there is no guarantee the fund will continue to maintain the holdings breakdown listed. The fund's holdings and their weights within the portfolio may change as market conditions change.
44
Average annual total return as of July 31, 2006 (%)
| Inception | 1-year | 5-year | Life | ||||||||||||||||
| CMG Small/Mid Cap Fund | 12/01/00 | 9.17 | 6.19 | 4.08 | |||||||||||||||
| Russell 2500 Growth Index | 2.38 | 4.94 | 3.51 | ||||||||||||||||
| Russell 2500 Index | 3.82 | 9.75 | 10.18 | ||||||||||||||||
Average annual total return as of June 30, 2006 (%)
| Inception | 1-year | 5-year | Life | ||||||||||||||||
| CMG Small/Mid Cap Fund | 12/01/00 | 22.77 | 6.56 | 5.17 | |||||||||||||||
| Russell 2500 Growth Index | 14.62 | 4.39 | 4.50 | ||||||||||||||||
| Russell 2500 Index | 13.53 | 9.65 | 10.97 | ||||||||||||||||
Index performance is from December 1, 2000.
Performance data quoted represents past performance and current performance may be lower or higher. Past performance is no guarantee of future results. The investment return and principal value will fluctuate so that shares, when redeemed, may be worth more or less than the original cost. Please visit www.columbiamanagement.com for daily and most recent month-end performance updates.
Performance results reflect any reimbursement of fund expenses by the advisor or its affiliates. Absent these reimbursement arrangements, performance results would have been lower. All results shown assume reinvestment of distributions.
The table does not reflect the deduction of taxes that a shareholder would pay on fund distributions or the redemption of fund shares.
Growth of a $3,000,000 investment, December 1, 2000 to July 31, 2006
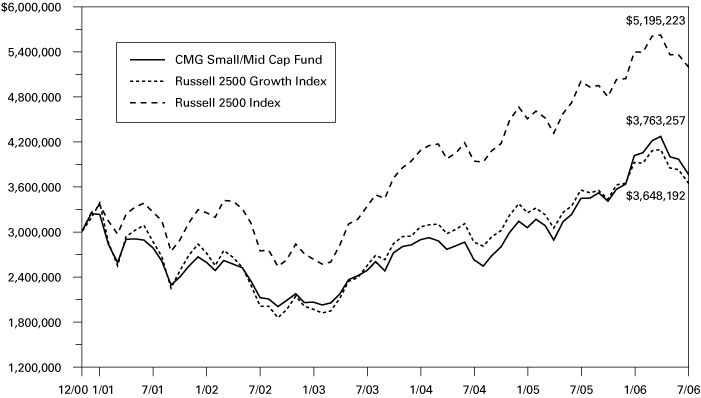
The Russell 2500 Growth Index measures the performance of those Russell 2500 Index companies with higher price-to-book ratios and higher forecasted growth values. The Russell 2500 Index tracks the performance of the 2,500 smallest companies of the Russell 3000 Index. Indices are not investments, do not incur fees or expenses and are not professionally managed. It is not possible to invest directly in indices. Securities in the fund may not match those in an index.
The chart above shows the growth in value of a hypothetical minimum initial $3,000,000 investment in the fund compared to the indices during the stated time period, and does not reflect the deduction of taxes that a shareholder would pay on fund distributions or the redemption of fund shares.
45
UNDERSTANDING YOUR EXPENSES — CMG Small/Mid Cap Fund
As a fund shareholder, you incur two types of costs. There are transaction costs and also ongoing costs, which generally include investment advisory fees and other fund expenses. The information on this page is intended to help you understand your ongoing costs of investing in the fund and to compare these costs with the ongoing costs of investing in other mutual funds.
Analyzing your fund's expenses
To illustrate these ongoing costs, we have provided an example and calculated the expenses paid by investors during the reporting period. The information in the following table is based on an initial investment of $1,000, which is invested at the beginning of the reporting period and held for the entire period. Expense information is calculated two ways and each method provides you with different information. The amount listed in the "actual" column is calculated using the fund's actual operating expenses and total return for the period. The amount listed in the "hypothetical" column assumes that the return each year is 5% before expenses and is calculated based on the fund's actual operating expenses. You should not use the hypothetical account values and expenses to estimate either your actual account balance at the end of the period or the expenses you paid during this reporting period.
Estimating your actual expenses
To estimate the expenses that you paid over the period, first you will need your account balance at the end of the period:
1. Divide your ending account balance by $1,000. For example, if an account balance was $8,600 at the end of the period, the result would be 8.6.
2. In the section of the table below titled "Expenses paid during the period," locate the amount under "actual." Multiply this number by the result from step 1. Your answer is an estimate of the expenses you paid on your account during the period.
February 1, 2006 – July 31, 2006
| Account value at the beginning of the period ($) | Account value at the end of the period ($) | Expenses paid during the period ($) | Fund's annualized expense ratio (%) | ||||||||||||||||||||||||||||
| Actual | Hypothetical | Actual | Hypothetical | Actual | Hypothetical | Actual | |||||||||||||||||||||||||
| 1,000.00 | 1,000.00 | 935.88 | 1,021.08 | 3.60 | 3.76 | 0.75 | |||||||||||||||||||||||||
Expenses paid during the period are equal to the fund's annualized expense ratio of 0.75%, multiplied by the average account value over the period, then multiplied by the number of days in the fund's most recent fiscal half-year and divided by 365.
Had the Investment Advisor not reimbursed a portion of expenses, total return would have been reduced.
It is important to note that the expense amounts shown in the table are meant to highlight only ongoing costs of investing in the fund and do not reflect any transaction costs, such as sales charges, redemption or exchange fees. Therefore, the hypothetical examples provided may not help you determine the relative total costs of owning shares of different funds. If these transaction costs were included, your costs would have been higher.
46
Compare with other funds
Since all mutual funds are required to include the same hypothetical calculations about expenses in shareholder reports, you can use this information to compare the ongoing cost of investing in the fund with other funds. To do so, compare the 5% hypothetical example with the 5% hypothetical examples that appear in the shareholder reports of other funds. As you compare hypothetical examples of other funds, it is important to note that hypothetical examples are meant to highlight the continuing costs of investing in a fund and do not reflect any transaction costs, such as sales charges or redemption or exchange fees.
47
Performance data quoted represents past performance and current performance may be lower or higher. Past performance is no guarantee of future results. The investment return and principal value will fluctuate so that shares, when redeemed, may be worth more or less than the original cost. Please visit www.columbiamanagement.com for daily and most recent month-end performance updates.
CMG INTERNATIONAL STOCK FUND
A Portfolio of Columbia Funds Institutional Trust
MANAGEMENT DISCUSSION OF FUND PERFORMANCE
For the 12-month period ended July 31, 2006, CMG International Stock Fund returned 24.31%. The fund's return was higher than the 24.01% return of its benchmark, the MSCI EAFE Index.1 The fund also outperformed the average return of its peer group, the Morningstar Foreign Large Blend Category, which was 23.17%.2 An above-average position in Japan was a major factor in the fund's above-average performance, as was stock selection in the energy and industrials sectors. The weak US dollar was also helpful, because the value of the fund's shares rose when converted to US dollars.
Robust global growth, tame inflation and the accommodative monetary policies of overseas central banks were positive for international stocks for most of the period. In May, however, concerns that high oil prices would spark inflation prompted central banks to boost interest rates. The actions of the central banks raised questions about the sustainability of economic growth and resulted in a decline in stock prices.
The fund was helped by an overweight position in Japan, the top-performing country for the period. Investor sentiment toward Japan improved, supported by an end of years of deflation, strong capital spending and a trend toward shareholder-oriented management within corporations. Prime Minister Koizumi's drastic structural reform on several different fronts—postal reform, pension reform, financial system reform—has worked out nicely and boosted confidence in the staying power of a rebound in fundamentals. Japan was also the source of the single biggest stock contributor to performance—Komatsu Ltd. (0.9% of net assets), an industrial machinery manufacturer. We favored Komatsu because we believed that investors had overlooked the earnings growth that could result from a recovery in global infrastructure spending, incremental orders from US highway construction projects and the capital outlays required to rebuild New Orleans. The stock price rose more than 100%. Electric Power Development Co., Ltd. (0.4% of net assets), a Japanese electric utility wholesaler, was another positive contributor to the fund's performance. We believed that the stock was attractively valued even though it is a low-cost provider. The company has generated strong cash flows and is led by a solid management team. Other companies that helped the fund's return were Norsk Hydro ASA (1.2% of net assets), an energy company in Norway, and Schering AG, the German pharmaceutical company, which made sizeable gains because of its merger with Bayer AG (0.5% of net assets). We sold Schering on news of the buyout and held onto our position in Bayer.
An underweight to the more defensive consumer staples and utilities sectors hurt performance as the markets moved downward late in the period. Merger and acquisitions activity in the utilities sector pushed prices beyond what we considered reasonable, and we cut back the fund's exposure to the sector. We also moved out of mining and metals stocks and into the chemicals sector. This move proved to be ill-timed, as demand for raw materials continued unabated and the more defensive chemicals sector struggled under the burden of high energy prices.
48
An emphasis on emerging markets stocks aided performance early in the period as strong demand for basic materials and other products drove emerging market returns higher. However, the sector pulled back near the end of the period as concerns about a potential slowdown in economic growth began to mount.
Looking forward, we expect the global economy to grow at a more moderate pace, with emerging markets likely continuing to drive global demand. We also expect the outsourcing of manufacturing to low-cost countries to continue, which, in conjunction with slower growth, could help keep inflation in check. We have used market weakness to add to positions that we believe may benefit from moderate global growth, particularly in the industrials and energy sectors, and expect international stocks to recover from the May correction.
The fund's top ten holdings and countries (as a percentage of net assets) as of July 31, 2006 were:
| Holdings | (%) | Countries | (%) | ||||||||||||
| Novartis | 2.1 | Japan | 24.5 | ||||||||||||
| Toyota Motor | 2.0 | United Kingdom | 16.6 | ||||||||||||
| AstraZeneca | 1.9 | Germany | 10.7 | ||||||||||||
| BP | 1.8 | France | 6.6 | ||||||||||||
| iShares MSCI EAFE Index Fund | 1.7 | Switzerland | 6.4 | ||||||||||||
| Banco Bilbao Vizcaya Argentaria | 1.7 | Spain | 4.0 | ||||||||||||
| Total | 1.7 | Finland | 3.1 | ||||||||||||
| Barclays | 1.6 | Canada | 2.8 | ||||||||||||
| ENI | 1.5 | Norway | 2.4 | ||||||||||||
| Nokia | 1.5 | Taiwan | 2.4 | ||||||||||||
We appreciate your continued confidence in the CMG International Stock Fund.
Fred Copper has managed or co-managed the CMG International Stock Fund since October 2005 and has been with the advisor or its predecessors since 2005.
Jasmine (Weili) Huang has co-managed the CMG International Stock Fund since May 2006 and has been with the advisor or its predecessors since 2003.
Timothy R. Anderson has co-managed the CMG International Stock Fund since May 2006 and has been with the advisor since March 2006.
Paul J. DiGiacomo has co-managed the CMG International Stock Fund since May 2006 and has been with the advisor since April 2006.
Daisuke Nomoto has co-managed the CMG International Stock Fund since May 2006 and has been with the advisor or its predecessors since 2005.
Equity investments are affected by stock market fluctuations that occur in response to economic and business developments.
International investing involves special risks, including foreign taxation, currency fluctuation, risks associated with possible differences in financial standards and other monetary and political risks.
49
A concentration of investments in a specific sector, such as the technology sector, may cause the fund to experience increased volatility.
1 The Morgan Stanley Capital International (MSCI) Europe, Australasia, Far East (EAFE) Index is a free float-adjusted market capitalization index that is designed to measure developed market equity performance, excluding the U.S. and Canada. Indices are not investments, do not incur fees or expenses and are not professionally managed. It is not possible to invest directly in an index.
2 ©2006 by Morningstar, Inc. All rights reserved. The information contained herein is the proprietary information of Morningstar, Inc., may not be copied or redistributed for any purpose and may only be used for noncommercial, personal purposes. The information contained herein is not represented or warranted to be accurate, correct, complete or timely. Morningstar, Inc. shall not be responsible for investment decisions, damages or other losses resulting from the use of this information. Past performance is no guarantee of future performance. Morningstar, Inc. has not granted consent for it to be considered or deemed an "expert" under the Securities Act of 1933. Morningstar Categories compare the performance of funds with similar investment objectives and strategies.
Holdings and country breakdowns are disclosed as a percentage of net assets, and are subject to change. Because the fund is actively managed, there is no guarantee the fund will continue to maintain the holdings and country breakdown listed. The fund's holdings and their weights within the portfolio may change as market conditions change.
50
Average annual total return as of July 31, 2006 (%)
| Inception | 1-year | 5-year | 10-year | ||||||||||||||||
| CMG International Stock Fund | 02/01/94 | 24.31 | 9.32 | 7.91 | |||||||||||||||
| MSCI EAFE Index | 24.01 | 10.64 | 6.82 | ||||||||||||||||
| MSCI All Country World ex US Index | 25.10 | 12.58 | 7.63 | ||||||||||||||||
Average annual total return as of June 30, 2006 (%)
| Inception | 1-year | 5-year | 10-year | ||||||||||||||||
| CMG International Stock Fund | 02/01/94 | 26.91 | 8.40 | 7.31 | |||||||||||||||
| MSCI EAFE Index | 26.56 | 10.02 | 6.39 | ||||||||||||||||
| MSCI All Country World ex US Index | 28.40 | 11.85 | 7.16 | ||||||||||||||||
Performance data quoted represents past performance and current performance may be lower or higher. Past performance is no guarantee of future results. The investment return and principal value will fluctuate so that shares, when redeemed, may be worth more or less than the original cost. Please visit www.columbiamanagement.com for daily and most recent month-end performance updates.
Performance results reflect any voluntary waivers or reimbursement of fund expenses by the advisor or its affiliates. Absent these waivers or reimbursement arrangements, performance results would have been lower. All results shown assume reinvestment of distributions.
The table does not reflect the deduction of taxes that a shareholder would pay on fund distributions or the redemption of fund shares.
Growth of a $3,000,000 investment, August 1, 1996 to July 31, 2006
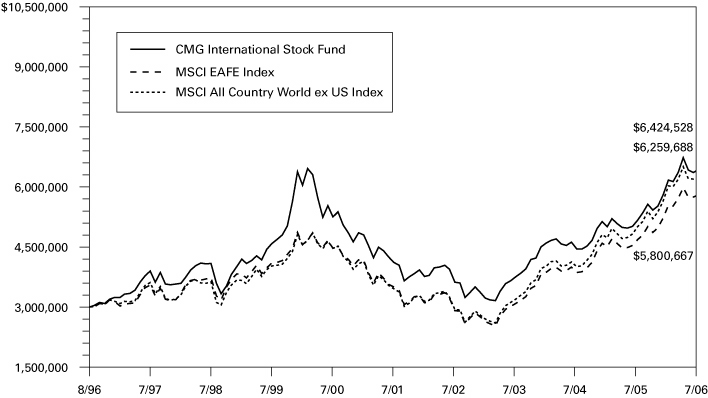
The Morgan Stanley Capital International (MSCI) Europe, Australasia, Far East (EAFE) Index is a free float-adjusted market capitalization index that is designed to measure developed market equity performance, excluding the U.S. and Canada. The Morgan Stanley Capital International (MSCI) All Country (AC) World ex US Index is an unmanaged index of global stock market performance that includes developed and emerging markets but excludes the U.S. Indices are not investments, do not incur fees or expenses and are not professionally managed. It is not possible to invest directly in an index. Securities in the fund may not match those in an index.
The chart above shows the growth in value of a hypothetical minimum initial $3,000,000 investment in the fund compared to the index during the stated time period, and does not reflect the deduction of taxes that a shareholder would pay on fund distributions or the redemption of fund shares.
51
UNDERSTANDING YOUR EXPENSES — CMG International Stock Fund
As a fund shareholder, you incur two types of costs. There are transaction costs and also ongoing costs, which generally include investment advisory fees and other fund expenses. The information on this page is intended to help you understand your ongoing costs of investing in the fund and to compare these costs with the ongoing costs of investing in other mutual funds.
Analyzing your fund's expenses
To illustrate these ongoing costs, we have provided an example and calculated the expenses paid by investors during the reporting period. The information in the following table is based on an initial investment of $1,000, which is invested at the beginning of the reporting period and held for the entire period. Expense information is calculated two ways and each method provides you with different information. The amount listed in the "actual" column is calculated using the fund's actual operating expenses and total return for the period. The amount listed in the "hypothetical" column assumes that the return each year is 5% before expenses and is calculated based on the fund's actual operating expenses. You should not use the hypothetical account values and expenses to estimate either your actual account balance at the end of the period or the expenses you paid during this reporting period.
Estimating your actual expenses
To estimate the expenses that you paid over the period, first you will need your account balance at the end of the period:
1. Divide your ending account balance by $1,000. For example, if an account balance was $8,600 at the end of the period, the result would be 8.6.
2. In the section of the table below titled "Expenses paid during the period," locate the amount under "actual." Multiply this number by the result from step 1. Your answer is an estimate of the expenses you paid on your account during the period.
February 1, 2006 – July 31, 2006
| Account value at the beginning of the period ($) | Account value at the end of the period ($) | Expenses paid during the period ($) | Fund's annualized expense ratio (%) | ||||||||||||||||||||||||||||
| Actual | Hypothetical | Actual | Hypothetical | Actual | Hypothetical | Actual | |||||||||||||||||||||||||
| 1,000.00 | 1,000.00 | 1,042.00 | 1,021.08 | 3.80 | 3.76 | 0.75 | |||||||||||||||||||||||||
Expenses paid during the period are equal to the fund's annualized expense ratio of 0.75%, multiplied by the average account value over the period, then multiplied by the number of days in the fund's most recent fiscal half-year and divided by 365.
Had the Investment Advisor not reimbursed a portion of expenses, total return would have been reduced.
It is important to note that the expense amounts shown in the table are meant to highlight only ongoing costs of investing in the fund and do not reflect any transaction costs, such as sales charges, redemption or exchange fees. Therefore, the hypothetical examples provided may not help you determine the relative total costs of owning shares of different funds. If these transaction costs were included, your costs would have been higher.
52
Compare with other funds
Since all mutual funds are required to include the same hypothetical calculations about expenses in shareholder reports, you can use this information to compare the ongoing cost of investing in the fund with other funds. To do so, compare the 5% hypothetical example with the 5% hypothetical examples that appear in the shareholder reports of other funds. As you compare hypothetical examples of other funds, it is important to note that hypothetical examples are meant to highlight the continuing costs of investing in a fund and do not reflect any transaction costs, such as sales charges or redemption or exchange fees.
53
CMG ENHANCED S&P 500® INDEX FUND
A Portfolio of Columbia Funds Institutional Trust
FINANCIAL HIGHLIGHTS
(For a Fund Share Outstanding Throughout Each Period)
| Period Ended | |||||||||||||||||||
| Year Ended July 31, | July 31, | ||||||||||||||||||
| 2006 | 2005 | 2004 | 2003 (a) | ||||||||||||||||
| Net asset value, beginning of period | $ | 13.49 | $ | 11.97 | $ | 10.73 | $ | 10.00 | |||||||||||
| Income from investment operations: | |||||||||||||||||||
| Net investment income (b) | 0.23 | 0.24 | (c) | 0.17 | 0.04 | ||||||||||||||
| Net realized and unrealized gain on investments and futures contracts | 0.76 | 1.58 | 1.13 | 0.69 | |||||||||||||||
| Total from investment operations | 0.99 | 1.82 | 1.30 | 0.73 | |||||||||||||||
| Less distributions declared to shareholders: | |||||||||||||||||||
| From net investment income | (0.25 | ) | (0.20 | ) | (0.05 | ) | - | ||||||||||||
| From net realized gains | (0.71 | ) | (0.10 | ) | (0.01 | ) | - | ||||||||||||
| Total distributions declared to shareholders | (0.96 | ) | (0.30 | ) | (0.06 | ) | - | ||||||||||||
| Net asset value, end of period | $ | 13.52 | $ | 13.49 | $ | 11.97 | $ | 10.73 | |||||||||||
| Total return (d)(e) | 7.56 | % | 15.32 | % | 12.08 | % | 7.30 | %(f) | |||||||||||
| Ratios/Supplemental data: | |||||||||||||||||||
| Net assets, end of period (000's) | $ | 100,973 | $ | 91,633 | $ | 98,247 | $ | 9,134 | |||||||||||
| Ratio of net operating expenses to average net assets | 0.25 | % | 0.25 | % | 0.25 | % | 0.25 | %(g) | |||||||||||
| Ratio of interest expense to average net assets | - | %(h) | - | - | - | ||||||||||||||
| Ratio of net expenses to average net assets | 0.25 | % | 0.25 | % | 0.25 | % | 0.25 | %(g) | |||||||||||
| Ratio of net investment income to average net assets | 1.70 | % | 1.91 | % | 1.43 | % | 1.50 | %(g) | |||||||||||
| Reimbursement | 0.06 | % | 0.04 | % | 0.05 | % | 1.37 | %(g) | |||||||||||
| Portfolio turnover rate | 66 | % | 49 | % | 60 | % | 2 | %(f) | |||||||||||
(a) The Fund commenced investment operations on May 5, 2003. Per share data, total return and portfolio turnover rate reflect activity from that date.
(b) Per share data was calculated using average shares outstanding during the period.
(c) Net investment income per share reflects a special dividend. The effect of this dividend amounted to $0.04 per share.
(d) Total return at net asset value assuming all distributions reinvested.
(e) Had the Investment Advisor not reimbursed a portion of expenses, total return would have been reduced.
(f) Not annualized.
(g) Annualized.
(h) Rounds to less than 0.01%.
See Accompanying Notes to Financial Statements.
54
CMG LARGE CAP GROWTH FUND
A Portfolio of Columbia Funds Institutional Trust
FINANCIAL HIGHLIGHTS
(For a Fund Share Outstanding Throughout Each Period)
| Period Ended | |||||||||||||||
| Year Ended July 31, | July 31, | ||||||||||||||
| 2006 | 2005 | 2004 (a) | |||||||||||||
| Net asset value, beginning of period | $ | 11.65 | $ | 10.25 | $ | 10.00 | |||||||||
| Income from investment operations: | |||||||||||||||
| Net investment income (b) | 0.07 | 0.12 | (c) | 0.03 | |||||||||||
| Net realized and unrealized gain on investments and foreign currency | 0.14 | 1.37 | 0.23 | ||||||||||||
| Total from investment operations | 0.21 | 1.49 | 0.26 | ||||||||||||
| Less distributions declared to shareholders: | |||||||||||||||
| From net investment income | (0.08 | ) | (0.09 | ) | (0.01 | ) | |||||||||
| From net realized gains | (0.66 | ) | - | - | |||||||||||
| Total distributions declared to shareholders | (0.74 | ) | (0.09 | ) | (0.01 | ) | |||||||||
| Net asset value, end of period | $ | 11.12 | $ | 11.65 | $ | 10.25 | |||||||||
| Total return (d)(e) | 1.63 | % | 14.55 | % | 2.57 | %(f) | |||||||||
| Ratios/Supplemental data: | |||||||||||||||
| Net assets, end of period (000's) | $ | 35,765 | $ | 40,312 | $ | 40,684 | |||||||||
| Ratio of net operating expenses to average net assets | 0.50 | % | 0.50 | % | 0.50 | %(g) | |||||||||
| Ratio of interest expense to average net assets | - | %(h) | - | - | |||||||||||
| Ratio of net expenses to average net assets | 0.50 | % | 0.50 | % | 0.50 | %(g) | |||||||||
| Ratio of net investment income to average net assets | 0.62 | % | 1.07 | % | 0.31 | %(g) | |||||||||
| Reimbursement | 0.13 | % | 0.07 | % | 0.14 | %(g) | |||||||||
| Portfolio turnover rate | 180 | % | 120 | % | 114 | %(f) | |||||||||
(a) The Fund commenced investment operations on September 10, 2003. Per share data, total return and portfolio turnover rate reflect activity from that date.
(b) Per share data was calculated using average shares outstanding during the period.
(c) Net investment income per share reflects a special dividend. The effect of this dividend amounted to $0.05 per share.
(d) Total return at net asset value assuming all distributions reinvested.
(e) Had the Investment Advisor not reimbursed a portion of expenses, total return would have been reduced.
(f) Not annualized.
(g) Annualized.
(h) Rounds to less than 0.01%.
See Accompanying Notes to Financial Statements.
55
CMG LARGE CAP VALUE FUND
A Portfolio of Columbia Funds Institutional Trust
FINANCIAL HIGHLIGHTS
(For a Fund Share Outstanding Throughout Each Period)
| Period Ended | |||||||||||||||
| Year Ended July 31, | July 31, | ||||||||||||||
| 2006 | 2005 | 2004 (a) | |||||||||||||
| Net asset value, beginning of period | $ | 12.54 | $ | 11.09 | $ | 10.00 | |||||||||
| Income from investment operations: | |||||||||||||||
| Net investment income (b) | 0.22 | 0.24 | 0.18 | ||||||||||||
| Net realized and unrealized gain on investments | 0.92 | 1.46 | 0.93 | ||||||||||||
| Total from investment operations | 1.14 | 1.70 | 1.11 | ||||||||||||
| Less distributions declared to shareholders: | |||||||||||||||
| From net investment income | (0.28 | ) | (0.22 | ) | (0.02 | ) | |||||||||
| From net realized gains | (1.51 | ) | (0.03 | ) | - | ||||||||||
| Total distributions declared to shareholders | (1.79 | ) | (0.25 | ) | (0.02 | ) | |||||||||
| Net asset value, end of period | $ | 11.89 | $ | 12.54 | $ | 11.09 | |||||||||
| Total return (c)(d) | 9.85 | %(e) | 15.41 | %(f) | 11.15 | %(g) | |||||||||
| Ratios/Supplemental data: | |||||||||||||||
| Net assets, end of period (000's) | $ | 37,280 | $ | 38,731 | $ | 47,855 | |||||||||
| Ratio of net expenses to average net assets | 0.50 | % | 0.50 | % | 0.50 | %(h) | |||||||||
| Ratio of net investment income to average net assets | 1.78 | % | 1.99 | % | 1.86 | %(h) | |||||||||
| Reimbursement | 0.13 | % | 0.07 | % | 0.14 | %(h) | |||||||||
| Portfolio turnover rate | 97 | % | 45 | % | 46 | %(g) | |||||||||
(a) The Fund commenced investment operations on September 10, 2003. Per share data, total return and portfolio turnover rate reflect activity from that date.
(b) Per share data was calculated using average shares outstanding during the period.
(c) Total return at net asset value assuming all distributions reinvested.
(d) Had the Investment Advisor not reimbursed a portion of expenses, total return would have been reduced.
(e) Total return includes a voluntary reimbursement by the Investment Advisor for a realized investment loss due to a trading error. This reimbursement had an impact of less than 0.01% on the Fund's total return.
(f) Total return includes a reimbursement of loss experienced by the Fund due to a compliance violation. The reimbursement had an impact of less than 0.01% on the Fund's total return.
(g) Not annualized.
(h) Annualized.
See Accompanying Notes to Financial Statements.
56
CMG MID CAP GROWTH FUND
A Portfolio of Columbia Funds Institutional Trust
FINANCIAL HIGHLIGHTS
(For a Fund Share Outstanding Throughout Each Period)
| Period Ended | |||||||||||||||||||
| Year Ended July 31, | July 31, | ||||||||||||||||||
| 2006 | 2005 | 2004 | 2003 (a) | ||||||||||||||||
| Net asset value, beginning of period | $ | 14.15 | $ | 11.04 | $ | 10.93 | $ | 10.00 | |||||||||||
| Income from investment operations: | |||||||||||||||||||
| Net investment income (loss) (b) | 0.01 | (0.03 | ) | (0.05 | ) | (0.01 | ) | ||||||||||||
| Net realized and unrealized gain on investments and foreign currency | 1.20 | 3.14 | 0.17 | 0.94 | |||||||||||||||
| Total from investment operations | 1.21 | 3.11 | 0.12 | 0.93 | |||||||||||||||
| Less distributions declared to shareholders: | |||||||||||||||||||
| From net realized gains | (0.38 | ) | - | (0.01 | ) | - | |||||||||||||
| Net asset value, end of period | $ | 14.98 | $ | 14.15 | $ | 11.04 | $ | 10.93 | |||||||||||
| Total return (c)(d) | 8.56 | % | 28.17 | % | 1.06 | % | 9.30 | % (e) | |||||||||||
| Ratios/Supplemental data: | |||||||||||||||||||
| Net assets, end of period (000's) | $ | 23,636 | $ | 24,881 | $ | 19,284 | $ | 2,161 | |||||||||||
| Ratio of net expenses to average net assets | 0.70 | % | 0.70 | % | 0.70 | % | 0.70 | % (f) | |||||||||||
| Ratio of net investment income (loss) to average net assets | 0.08 | % | (0.21 | )% | (0.38 | )% | (0.44 | )%(f) | |||||||||||
| Reimbursement | 0.20 | % | 0.21 | % | 0.22 | % | 3.85 | % (f) | |||||||||||
| Portfolio turnover rate | 65 | % | 141 | % | 169 | % | 23 | % (e) | |||||||||||
(a) The Fund commenced investment operations on May 5, 2003. Per share data, total return and portfolio turnover rate reflect activity from that date.
(b) Per share data was calculated using average shares outstanding during the period.
(c) Total return at net asset value assuming all distributions reinvested.
(d) Had the Investment Advisor not reimbursed a portion of expenses, total return would have been reduced.
(e) Not annualized.
(f) Annualized.
See Accompanying Notes to Financial Statements.
57
CMG MID CAP VALUE FUND
A Portfolio of Columbia Funds Institutional Trust
FINANCIAL HIGHLIGHTS
(For a Fund Share Outstanding Throughout Each Period)
| Period Ended | |||||||||||||||||||
| Year Ended July 31, | July 31, | ||||||||||||||||||
| 2006 | 2005 | 2004 | 2003 (a) | ||||||||||||||||
| Net asset value, beginning of period | $ | 15.17 | $ | 12.58 | $ | 10.69 | $ | 10.00 | |||||||||||
| Income from investment operations: | |||||||||||||||||||
| Net investment income (b) | 0.15 | 0.11 | 0.07 | 0.01 | |||||||||||||||
| Net realized and unrealized gain on investments | 1.14 | 2.66 | 1.84 | 0.68 | |||||||||||||||
| Total from investment operations | 1.29 | 2.77 | 1.91 | 0.69 | |||||||||||||||
| Less distributions declared to shareholders: | |||||||||||||||||||
| From net investment income | (0.16 | ) | (0.09 | ) | (0.02 | ) | - | ||||||||||||
| From net realized gains | (2.28 | ) | (0.09 | ) | - | (c) | - | ||||||||||||
| Total distributions declared to shareholders | (2.44 | ) | (0.18 | ) | (0.02 | ) | - | ||||||||||||
| Net asset value, end of period | $ | 14.02 | $ | 15.17 | $ | 12.58 | $ | 10.69 | |||||||||||
| Total return (d)(e) | 9.30 | % | 22.14 | % | 17.91 | % | 6.90 | %(f) | |||||||||||
| Ratios/Supplemental data: | |||||||||||||||||||
| Net assets, end of period (000's) | $ | 17,762 | $ | 21,277 | $ | 21,994 | $ | 2,651 | |||||||||||
| Ratio of net expenses to average net assets | 0.70 | % | 0.70 | % | 0.70 | % | 0.70 | %(g) | |||||||||||
| Ratio of net investment income to average net assets | 1.02 | % | 0.78 | % | 0.54 | % | 0.49 | %(g) | |||||||||||
| Reimbursement | 0.25 | % | 0.19 | % | 0.20 | % | 3.61 | %(g) | |||||||||||
| Portfolio turnover rate | 59 | % | 59 | % | 9 | % | 2 | %(f) | |||||||||||
(a) The Fund commenced investment operations on May 5, 2003. Per share data, total return and portfolio turnover rate reflect activity from that date.
(b) Per share data was calculated using average shares outstanding during the period.
(c) Rounds to less than $0.01 per share.
(d) Total return at net asset value assuming all distributions reinvested.
(e) Had the Investment Advisor not reimbursed a portion of expenses, total return would have been reduced.
(f) Not annualized.
(g) Annualized.
See Accompanying Notes to Financial Statements.
58
CMG SMALL CAP GROWTH FUND
A Portfolio of Columbia Funds Institutional Trust
FINANCIAL HIGHLIGHTS
(For a Fund Share Outstanding Throughout Each Period)
| Year Ended July 31, | Period Ended July 31, | Year Ended October 31, | |||||||||||||||||||||||||
| 2006 | 2005 | 2004 | 2003 (a) | 2002 | 2001 | ||||||||||||||||||||||
| Net asset value, beginning of period | $ | 6.57 | $ | 5.07 | $ | 4.62 | $ | 3.67 | $ | 4.41 | $ | 18.78 | |||||||||||||||
| Income from investment operations: | |||||||||||||||||||||||||||
| Net investment loss | (0.02 | )(b) | (0.03 | )(b) | (0.03 | )(b) | (0.02 | )(b) | (0.02 | )(b) | (0.01 | ) | |||||||||||||||
| Net realized and unrealized gain (loss) on investments | 0.53 | (c) | 1.53 | 0.48 | 0.97 | (0.72 | ) | (2.18 | ) | ||||||||||||||||||
| Total from investment operations | 0.51 | 1.50 | 0.45 | 0.95 | (0.74 | ) | (2.19 | ) | |||||||||||||||||||
| Less distributions declared to shareholders: | |||||||||||||||||||||||||||
| From net realized gains | (5.05 | )(j) | - | - | - | - | (d) | (12.18 | ) | ||||||||||||||||||
| Net asset value, end of period | $ | 2.03 | $ | 6.57 | $ | 5.07 | $ | 4.62 | $ | 3.67 | $ | 4.41 | |||||||||||||||
| Total return (e) | 10.46 | %(f) | 29.59 | % | 9.74 | % | 25.89 | % (g) | (16.76 | )% | (28.84 | )% | |||||||||||||||
| Ratios/Supplemental data: | |||||||||||||||||||||||||||
| Net assets, end of period (000's) | $ | 40,183 | $ | 30,317 | $ | 292,028 | $ | 293,924 | $ | 227,874 | $ | 283,521 | |||||||||||||||
| Ratio of net expenses to average net assets (h) | 1.09 | % | 0.85 | % | 0.79 | % | 0.81 | % (i) | 0.79 | % | 0.82 | % | |||||||||||||||
| Ratio of net investment loss to average net assets (h) | (0.88 | )% | (0.61 | )% | (0.62 | )% | (0.55 | )%(i) | (0.49 | )% | (0.22 | )% | |||||||||||||||
| Waiver/reimbursement | 0.21 | % | - | - | - | - | - | ||||||||||||||||||||
| Portfolio turnover rate | 112 | % | 119 | % | 123 | % | 89 | % (g) | 120 | % | 160 | % | |||||||||||||||
(a) The Fund changed its fiscal year end from October 31 to July 31.
(b) Per share data was calculated using average shares outstanding during the period.
(c) The amount shown for a share outstanding does not correspond with the aggregate gain (loss) on investments for the period due to timing of sales and repurchases of Fund shares in relation to fluctuating market values of the investments of the Fund.
(d) Rounds to less than $0.01 per share.
(e) Total return at net asset value assuming all distributions reinvested.
(f) Had the investment advisor and/or transfer agent not waived or reimbursed a portion of expenses, total return would have been reduced.
(g) Not annualized.
(h) The benefits derived from custody credits had an impact of less than 0.01%.
(i) Annualized.
(j) Capital gain distributions were declared after significant shareholder redemptions reduced the size of the Fund.
See Accompanying Notes to Financial Statements.
59
CMG SMALL CAP VALUE FUND
A Portfolio of Columbia Funds Institutional Trust
FINANCIAL HIGHLIGHTS
(For a Fund Share Outstanding Throughout Each Period)
| Period Ended | |||||||||||||||||||
| Year Ended July 31, | July 31, | ||||||||||||||||||
| 2006 | 2005 | 2004 | 2003 (a) | ||||||||||||||||
| Net asset value, beginning of period | $ | 16.06 | $ | 13.91 | $ | 11.29 | $ | 10.00 | |||||||||||
| Income from investment operations: | |||||||||||||||||||
| Net investment income (b) | 0.09 | 0.11 | 0.11 | 0.02 | |||||||||||||||
| Net realized and unrealized gain on investments | 1.06 | 3.11 | 2.79 | 1.27 | |||||||||||||||
| Total from investment operations | 1.15 | 3.22 | 2.90 | 1.29 | |||||||||||||||
| Less distributions declared to shareholders: | |||||||||||||||||||
| From net investment income | (0.13 | ) | (0.10 | ) | (0.06 | ) | - | ||||||||||||
| From net realized gains | (1.77 | ) | (0.97 | ) | (0.22 | ) | - | ||||||||||||
| Total distributions declared to shareholders | (1.90 | ) | (1.07 | ) | (0.28 | ) | - | ||||||||||||
| Net asset value, end of period | $ | 15.31 | $ | 16.06 | $ | 13.91 | $ | 11.29 | |||||||||||
| Total return (c)(d) | 7.90 | %(e) | 23.57 | % | 25.79 | % | 12.90 | %(f) | |||||||||||
| Ratios/Supplemental data: | |||||||||||||||||||
| Net assets, end of period (000's) | $ | 33,439 | $ | 36,989 | $ | 40,356 | $ | 21,356 | |||||||||||
| Ratio of net operating expenses to average net assets | 0.80 | % | 0.80 | % | 0.80 | % | 0.80 | %(g) | |||||||||||
| Ratio of interest expense to average net assets | - | %(h) | - | - | - | ||||||||||||||
| Ratio of net expenses to average net assets | 0.80 | % | 0.80 | % | 0.80 | % | 0.80 | %(g) | |||||||||||
| Ratio of net investment income to average net assets | 0.60 | % | 0.77 | % | 0.82 | % | 0.66 | %(g) | |||||||||||
| Reimbursement | 0.14 | % | 0.12 | % | 0.09 | % | 0.36 | %(g) | |||||||||||
| Portfolio turnover rate | 37 | % | 41 | % | 53 | % | 5 | %(f) | |||||||||||
(a) The Fund commenced investment operations on May 5, 2003. Per share data, total return and portfolio turnover rate reflect activity from that date.
(b) Per share data was calculated using average shares outstanding during the period.
(c) Total return at net asset value assuming all distributions reinvested.
(d) Had the Investment Advisor not reimbursed a portion of expenses, total return would have been reduced.
(e) Total return includes a voluntary reimbursement by the Investment Advisor for a realized investment loss due to a trading error. This reimbursement had an impact of less than 0.01% on the Fund's total return.
(f) Not annualized.
(g) Annualized.
(h) Rounds to less than 0.01%.
See Accompanying Notes to Financial Statements.
60
CMG SMALL/MID CAP FUND
A Portfolio of Columbia Funds Institutional Trust
FINANCIAL HIGHLIGHTS
(For a Fund Share Outstanding Throughout Each Period)
| Period Ended | Year Ended | Period Ended | |||||||||||||||||||||||||
| Year Ended July 31, | July 31, | October 31, | October 31, | ||||||||||||||||||||||||
| 2006 | 2005 | 2004 | 2003 (a) | 2002 | 2001 (b) | ||||||||||||||||||||||
| Net asset value, beginning of period | $ | 11.49 | $ | 8.77 | $ | 8.30 | $ | 6.96 | $ | 8.00 | $ | 10.00 | |||||||||||||||
| Income from investment operations: | |||||||||||||||||||||||||||
| Net investment loss | (0.05 | )(c) | (0.04 | )(c) | (0.05 | )(c) | (0.03 | )(c) | (0.04 | )(c) | (0.02 | ) | |||||||||||||||
| Net realized and unrealized gain (loss) on investments | 1.07 | 2.76 | 0.52 | 1.37 | (1.00 | ) | (1.98 | ) | |||||||||||||||||||
| Total from investment operations | 1.02 | 2.72 | 0.47 | 1.34 | (1.04 | ) | (2.00 | ) | |||||||||||||||||||
| Less distributions declared to shareholders: | |||||||||||||||||||||||||||
| From net realized gains | (1.27 | ) | - | - | - | - | - | ||||||||||||||||||||
| Net asset value, end of period | $ | 11.24 | $ | 11.49 | $ | 8.77 | $ | 8.30 | $ | 6.96 | $ | 8.00 | |||||||||||||||
| Total return (d)(e) | 9.17 | %(f) | 31.01 | % | 5.66 | % | 19.25 | % (g) | (13.00 | )% | (20.00 | )%(g) | |||||||||||||||
| Ratios/Supplemental data: | |||||||||||||||||||||||||||
| Net assets, end of period (000's) | $ | 8,773 | $ | 38,755 | $ | 50,662 | $ | 73,926 | $ | 54,769 | $ | 49,391 | |||||||||||||||
| Ratio of net expenses to average net assets | 0.75 | % | 0.75 | % | 0.75 | % | 0.78 | % (h)(i) | 0.80 | % (i) | 0.80 | % (h)(i) | |||||||||||||||
| Ratio of net investment loss to average net assets | (0.45 | )% | (0.37 | )% | (0.49 | )% | (0.50 | )%(h)(i) | (0.45 | )%(i) | (0.23 | )%(h)(i) | |||||||||||||||
| Reimbursement | 0.23 | % | 0.09 | % | 0.06 | % | 0.06 | % (h) | 0.06 | % | 0.17 | % (h) | |||||||||||||||
| Portfolio turnover rate | 109 | % | 170 | % | 91 | % | 84 | % (g) | 125 | % | 167 | % (g) | |||||||||||||||
(a) The Fund changed its fiscal year end from October 31 to July 31.
(b) The Fund commenced investment operations on December 1, 2000. Per share data, total return and portfolio turnover rate reflect activity from that date.
(c) Per share data was calculated using average shares outstanding during the period.
(d) Total return at net asset value assuming all distributions reinvested.
(e) Had the Investment Advisor not reimbursed a portion of expenses, total return would have been reduced.
(f) Total return includes a voluntary reimbursement by the Investment Advisor for a realized investment loss due to a trading error. This reimbursement had an impact of less than 0.01% on the Fund's total return.
(g) Not annualized.
(h) Annualized.
(i) The benefits derived from custody credits had an impact of less than 0.01%.
See Accompanying Notes to Financial Statements.
61
CMG INTERNATIONAL STOCK FUND
A Portfolio of Columbia Funds Institutional Trust
FINANCIAL HIGHLIGHTS
(For a Fund Share Outstanding Throughout Each Period)
| Year Ended July 31, | Period Ended July 31, | Year Ended October 31, | |||||||||||||||||||||||||
| 2006 | 2005 | 2004 | 2003 (a) | 2002 | 2001 | ||||||||||||||||||||||
| Net asset value, beginning of period | $ | 13.76 | $ | 12.17 | $ | 10.33 | $ | 9.32 | $ | 10.42 | $ | 16.20 | |||||||||||||||
| Income from investment operations: | |||||||||||||||||||||||||||
| Net investment income | 0.26 | (b) | 0.19 | (b) | 0.14 | (b) | 0.11 | (b) | 0.02 | (b) | 0.03 | ||||||||||||||||
| Net realized and unrealized gain (loss) on investments, foreign currency and foreign capital gains tax | 2.85 | 1.79 | 1.76 | 0.95 | (1.09 | ) | (3.09 | ) | |||||||||||||||||||
| Total from investment operations | 3.11 | 1.98 | 1.90 | 1.06 | (1.07 | ) | (3.06 | ) | |||||||||||||||||||
| Less distributions declared to shareholders: | |||||||||||||||||||||||||||
| From net investment income | (0.27 | ) | (0.10 | ) | (0.06 | ) | (0.05 | ) | (0.03 | ) | - | ||||||||||||||||
| From net realized gains | (1.97 | ) | (0.29 | ) | - | - | - | (2.72 | ) | ||||||||||||||||||
| Total distributions declared to shareholders | (2.24 | ) | (0.39 | ) | (0.06 | ) | (0.05 | ) | (0.03 | ) | (2.72 | ) | |||||||||||||||
| Net asset value, end of period | $ | 14.63 | $ | 13.76 | $ | 12.17 | $ | 10.33 | $ | 9.32 | $ | 10.42 | |||||||||||||||
| Total return (c) | 24.31 | %(d) | 16.31 | %(d) | 18.40 | %(d) | 11.39 | %(d)(e) | (10.28 | )% | (22.46 | )% | |||||||||||||||
| Ratios/Supplemental data: | |||||||||||||||||||||||||||
| Net assets, end of period (000's) | $ | 105,738 | $ | 136,144 | $ | 152,251 | $ | 58,488 | $ | 20,616 | $ | 20,553 | |||||||||||||||
| Ratio of net operating expenses to average net assets | 0.75 | % | 0.75 | % | 0.75 | % | 0.93 | %(f)(g) | 1.31 | %(g) | 1.26 | %(g) | |||||||||||||||
| Ratio of interest expense to average net assets | 0.01 | % | - | - | - | - | - | ||||||||||||||||||||
| Ratio of net expenses to average net assets | 0.76 | % | 0.75 | % | 0.75 | % | 0.93 | %(f)(g) | 1.31 | %(g) | 1.26 | %(g) | |||||||||||||||
| Ratio of net investment income to average net assets | 1.84 | % | 1.47 | % | 1.16 | % | 1.50 | %(f)(g) | 0.21 | %(g) | 0.29 | %(g) | |||||||||||||||
| Reimbursement | 0.06 | % | 0.03 | % | 0.05 | % | 0.06 | %(f) | - | - | |||||||||||||||||
| Portfolio turnover rate | 86 | % | 68 | % | 91 | % | 59 | %(e) | 111 | % | 117 | % | |||||||||||||||
(a) The Fund changed its fiscal year end from October 31 to July 31.
(b) Per share data was calculated using average shares outstanding during the period.
(c) Total return at net asset value assuming all distributions reinvested.
(d) Had the Investment Advisor not reimbursed a portion of expenses, total return would have been reduced.
(e) Not annualized.
(f) Annualized.
(g) The benefits derived from custody credits had an impact of less than 0.01%.
See Accompanying Notes to Financial Statements.
62
CMG ENHANCED S&P 500® INDEX FUND
A Portfolio of Columbia Funds Institutional Trust
SCHEDULE OF INVESTMENTS
July 31, 2006
| Shares | Value | ||||||||||
| Common Stocks (98.2%) | |||||||||||
| Consumer Discretionary (9.9%) | |||||||||||
| Automobiles (0.6%) | |||||||||||
| Harley-Davidson, Inc. | 9,900 | $ | 564,300 | ||||||||
| Hotels, Restaurants & Leisure (2.3%) | |||||||||||
| Darden Restaurants, Inc. | 34,000 | 1,149,200 | |||||||||
| McDonald's Corp. | 23,400 | 828,126 | |||||||||
| Yum! Brands, Inc. | 7,600 | 342,000 | |||||||||
| 2,319,326 | |||||||||||
| Household Durables (1.0%) | |||||||||||
| Centex Corp. | 13,800 | 652,878 | |||||||||
| Pulte Homes, Inc. | 12,100 | 344,850 | |||||||||
| 997,728 | |||||||||||
| Media (3.2%) | |||||||||||
| CBS Corp., Class B | 20,700 | 567,801 | |||||||||
| Gannett Co., Inc. | 2,600 | 135,512 | |||||||||
| McGraw-Hill Companies, Inc. | 27,000 | 1,520,100 | |||||||||
| Time Warner, Inc. | 44,300 | 730,950 | |||||||||
| Viacom, Inc., Class B (a) | 8,400 | 292,740 | |||||||||
| 3,247,103 | |||||||||||
| Multi-Line Retail (1.0%) | |||||||||||
| Dollar General Corp. | 19,100 | 256,322 | |||||||||
| J.C. Penney Co., Inc. | 3,500 | 220,360 | |||||||||
| Kohl's Corp. (a) | 4,100 | 232,183 | |||||||||
| Nordstrom, Inc. | 8,300 | 284,690 | |||||||||
| 993,555 | |||||||||||
| Specialty Retail (1.6%) | |||||||||||
| Autonation, Inc. (a) | 29,000 | 571,300 | |||||||||
| Home Depot, Inc. | 22,200 | 770,562 | |||||||||
| Limited Brands, Inc. | 300 | 7,548 | |||||||||
| Lowe's Companies, Inc. | 1,400 | 39,690 | |||||||||
| Office Depot, Inc. (a) | 200 | 7,210 | |||||||||
| Sherwin-Williams Co. | 800 | 40,480 | |||||||||
| Staples, Inc. | 7,700 | 166,474 | |||||||||
| 1,603,264 | |||||||||||
| Textiles, Apparel & Luxury Goods (0.2%) | |||||||||||
| Coach, Inc. (a) | 7,800 | 223,938 | |||||||||
| Consumer Staples (9.6%) | |||||||||||
| Beverages (1.8%) | |||||||||||
| Coca-Cola Co. | 28,200 | 1,254,900 | |||||||||
| PepsiCo, Inc. | 9,400 | 595,772 | |||||||||
| 1,850,672 | |||||||||||
See Accompanying Notes to Financial Statements.
63
CMG ENHANCED S&P 500® INDEX FUND
A Portfolio of Columbia Funds Institutional Trust
SCHEDULE OF INVESTMENTS
| Shares | Value | ||||||||||
| Common Stocks (continued) | |||||||||||
| Food & Staples Retailing (2.1%) | |||||||||||
| Kroger Co. | 21,400 | $ | 490,702 | ||||||||
| SUPERVALU, Inc. | 7,600 | 206,036 | |||||||||
| Sysco Corp. | 1,400 | 38,640 | |||||||||
| Wal-Mart Stores, Inc. | 30,700 | 1,366,150 | |||||||||
| 2,101,528 | |||||||||||
| Food Products (1.9%) | |||||||||||
| Archer-Daniels-Midland Co. | 4,900 | 215,600 | |||||||||
| Dean Foods Co. (a) | 18,800 | 705,564 | |||||||||
| General Mills, Inc. | 8,000 | 415,200 | |||||||||
| H.J. Heinz Co. | 6,300 | 264,411 | |||||||||
| Sara Lee Corp. | 16,300 | 275,470 | |||||||||
| 1,876,245 | |||||||||||
| Household Products (1.0%) | |||||||||||
| Clorox Co. | 4,900 | 293,706 | |||||||||
| Colgate-Palmolive Co. | 2,000 | 118,640 | |||||||||
| Kimberly-Clark Corp. | 4,200 | 256,410 | |||||||||
| Procter & Gamble Co. | 6,800 | 382,160 | |||||||||
| 1,050,916 | |||||||||||
| Personal Products (0.0%) | |||||||||||
| Estee Lauder Companies, Inc., Class A | 1,000 | 37,320 | |||||||||
| Tobacco (2.8%) | |||||||||||
| Altria Group, Inc. | 19,500 | 1,559,415 | |||||||||
| Reynolds American, Inc. | 10,000 | 1,267,800 | |||||||||
| 2,827,215 | |||||||||||
| Energy (10.5%) | |||||||||||
| Energy Equipment & Services (0.7%) | |||||||||||
| BJ Services Co. | 11,000 | 398,970 | |||||||||
| Nabors Industries Ltd. (a) | 6,300 | 222,516 | |||||||||
| Schlumberger Ltd. | 1,800 | 120,330 | |||||||||
| 741,816 | |||||||||||
| Oil, Gas & Consumable Fuels (9.8%) | |||||||||||
| Anadarko Petroleum Corp. | 22,900 | 1,047,446 | |||||||||
| Apache Corp. | 1,400 | 98,658 | |||||||||
| Chevron Corp. | 21,500 | 1,414,270 | |||||||||
| ConocoPhillips | 24,300 | 1,667,952 | |||||||||
| Devon Energy Corp. | 5,900 | 381,376 | |||||||||
| Exxon Mobil Corp. | 63,300 | 4,287,942 | |||||||||
| Hess Corp. | 6,600 | 349,140 | |||||||||
| Marathon Oil Corp. | 300 | 27,192 | |||||||||
| Sunoco, Inc. | 9,000 | 625,860 | |||||||||
| 9,899,836 | |||||||||||
See Accompanying Notes to Financial Statements.
64
CMG ENHANCED S&P 500® INDEX FUND
A Portfolio of Columbia Funds Institutional Trust
SCHEDULE OF INVESTMENTS
| Shares | Value | ||||||||||
| Common Stocks (continued) | |||||||||||
| Financials (21.3%) | |||||||||||
| Capital Markets (6.0%) | |||||||||||
| Ameriprise Financial, Inc. | 700 | $ | 31,220 | ||||||||
| Bank of New York Co., Inc. | 12,300 | 413,403 | |||||||||
| Bear Stearns Companies, Inc. | 700 | 99,309 | |||||||||
| Charles Schwab Corp. | 19,000 | 301,720 | |||||||||
| Federated Investors, Inc., Class B | 3,400 | 105,434 | |||||||||
| Goldman Sachs Group, Inc. | 10,600 | 1,619,150 | |||||||||
| Lehman Brothers Holdings, Inc. | 21,400 | 1,389,930 | |||||||||
| Merrill Lynch & Co., Inc. | 10,000 | 728,200 | |||||||||
| Morgan Stanley | 16,500 | 1,097,250 | |||||||||
| State Street Corp. | 4,300 | 258,258 | |||||||||
| T. Rowe Price Group, Inc. | 800 | 33,048 | |||||||||
| 6,076,922 | |||||||||||
| Commercial Banks (4.1%) | |||||||||||
| BB&T Corp. | 2,400 | 100,776 | |||||||||
| Comerica, Inc. | 6,200 | 363,010 | |||||||||
| First Horizon National Corp. | 3,400 | 142,460 | |||||||||
| KeyCorp | 2,900 | 107,010 | |||||||||
| National City Corp. | 11,600 | 417,600 | |||||||||
| PNC Financial Services Group, Inc. | 2,500 | 177,100 | |||||||||
| SunTrust Banks, Inc. | 1,400 | 110,418 | |||||||||
| U.S. Bancorp | 22,800 | 729,600 | |||||||||
| Wachovia Corp. | 22,500 | 1,206,675 | |||||||||
| Wells Fargo & Co. | 11,100 | 802,974 | |||||||||
| 4,157,623 | |||||||||||
| Consumer Finance (0.3%) | |||||||||||
| American Express Co. | 5,300 | 275,918 | |||||||||
| Diversified Financial Services (4.6%) | |||||||||||
| CIT Group, Inc. | 5,600 | 257,096 | |||||||||
| Citigroup, Inc. | 59,900 | 2,893,769 | |||||||||
| JPMorgan Chase & Co. | 33,000 | 1,505,460 | |||||||||
| 4,656,325 | |||||||||||
| Insurance (5.1%) | |||||||||||
| ACE Ltd. | 3,000 | 154,590 | |||||||||
| AFLAC, Inc. | 5,600 | 247,184 | |||||||||
| Allstate Corp. | 13,700 | 778,434 | |||||||||
| American International Group, Inc. | 21,500 | 1,304,405 | |||||||||
| Hartford Financial Services Group, Inc. | 1,400 | 118,776 | |||||||||
| MetLife, Inc. | 6,800 | 353,600 | |||||||||
| Principal Financial Group, Inc. | 3,600 | 194,400 | |||||||||
| Progressive Corp. | 2,300 | 55,637 | |||||||||
| Prudential Financial, Inc. | 11,300 | 888,632 | |||||||||
| SAFECO Corp. | 9,100 | 488,852 | |||||||||
| St. Paul Travelers Companies, Inc. | 7,800 | 357,240 | |||||||||
| XL Capital Ltd., Class A | 2,700 | 171,990 | |||||||||
| 5,113,740 | |||||||||||
See Accompanying Notes to Financial Statements.
65
CMG ENHANCED S&P 500® INDEX FUND
A Portfolio of Columbia Funds Institutional Trust
SCHEDULE OF INVESTMENTS
| Shares | Value | ||||||||||
| Common Stocks (continued) | |||||||||||
| Real Estate Investment Trusts (REITs) (0.2%) | |||||||||||
| Equity Office Properties Trust, REIT | 3,900 | $ | 147,849 | ||||||||
| Kimco Realty Corp., REIT | 200 | 7,848 | |||||||||
| Plum Creek Timber Co., Inc., REIT | 1,700 | 57,902 | |||||||||
| 213,599 | |||||||||||
| Thrifts & Mortgage Finance (1.0%) | |||||||||||
| Countrywide Financial Corp. | 9,800 | 351,134 | |||||||||
| Fannie Mae | 7,300 | 349,743 | |||||||||
| Freddie Mac | 5,600 | 324,016 | |||||||||
| Washington Mutual, Inc. | 800 | 35,760 | |||||||||
| 1,060,653 | |||||||||||
| Health Care (12.5%) | |||||||||||
| Biotechnology (2.4%) | |||||||||||
| Amgen, Inc. (a) | 25,500 | 1,778,370 | |||||||||
| Biogen Idec, Inc. (a) | 1,100 | 46,332 | |||||||||
| Gilead Sciences, Inc. (a) | 9,800 | 602,504 | |||||||||
| 2,427,206 | |||||||||||
| Health Care Equipment & Supplies (1.0%) | |||||||||||
| Becton, Dickinson & Co. | 1,200 | 79,104 | |||||||||
| Biomet, Inc. | 13,600 | 447,984 | |||||||||
| Boston Scientific Corp. (a) | 19,900 | 338,499 | |||||||||
| Medtronic, Inc. | 2,000 | 101,040 | |||||||||
| Zimmer Holdings, Inc. (a) | 500 | 31,620 | |||||||||
| 998,247 | |||||||||||
| Health Care Providers & Services (3.7%) | |||||||||||
| Aetna, Inc. | 17,800 | 560,522 | |||||||||
| AmerisourceBergen Corp. | 8,200 | 352,600 | |||||||||
| Cardinal Health, Inc. | 4,600 | 308,200 | |||||||||
| Caremark Rx, Inc. | 3,300 | 174,240 | |||||||||
| CIGNA Corp. | 8,000 | 730,000 | |||||||||
| Coventry Health Care, Inc. (a) | 5,400 | 284,580 | |||||||||
| Express Scripts, Inc. (a) | 1,600 | 123,248 | |||||||||
| Humana, Inc. (a) | 200 | 11,186 | |||||||||
| McKesson Corp. | 5,000 | 251,950 | |||||||||
| UnitedHealth Group, Inc. | 14,700 | 703,101 | |||||||||
| WellPoint, Inc. (a) | 3,400 | 253,300 | |||||||||
| 3,752,927 | |||||||||||
| Life Sciences Tools & Services (0.2%) | |||||||||||
| Fisher Scientific International, Inc. (a) | 1,300 | 96,343 | |||||||||
| PerkinElmer, Inc. | 7,400 | 133,422 | |||||||||
| 229,765 | |||||||||||
| Pharmaceuticals (5.2%) | |||||||||||
| Abbott Laboratories | 16,100 | 769,097 | |||||||||
| Barr Pharmaceuticals, Inc. (a) | 1,400 | 69,664 | |||||||||
| Forest Laboratories, Inc. (a) | 8,700 | 402,897 | |||||||||
See Accompanying Notes to Financial Statements.
66
CMG ENHANCED S&P 500® INDEX FUND
A Portfolio of Columbia Funds Institutional Trust
SCHEDULE OF INVESTMENTS
| Shares | Value | ||||||||||
| Common Stocks (continued) | |||||||||||
| Pharmaceuticals (continued) | |||||||||||
| Johnson & Johnson | 10,100 | $ | 631,755 | ||||||||
| King Pharmaceuticals, Inc. (a) | 1,800 | 30,636 | |||||||||
| Merck & Co., Inc. | 7,200 | 289,944 | |||||||||
| Pfizer, Inc. | 97,500 | 2,534,025 | |||||||||
| Watson Pharmaceuticals, Inc. (a) | 1,400 | 31,346 | |||||||||
| Wyeth | 10,100 | 489,547 | |||||||||
| 5,248,911 | |||||||||||
| Industrials (10.6%) | |||||||||||
| Aerospace & Defense (2.1%) | |||||||||||
| Boeing Co. | 7,000 | 541,940 | |||||||||
| General Dynamics Corp. | 6,300 | 422,226 | |||||||||
| Lockheed Martin Corp. | 4,000 | 318,720 | |||||||||
| Northrop Grumman Corp. | 1,100 | 72,809 | |||||||||
| Raytheon Co. | 10,200 | 459,714 | |||||||||
| United Technologies Corp. | 5,600 | 348,264 | |||||||||
| 2,163,673 | |||||||||||
| Air Freight & Logistics (0.9%) | |||||||||||
| FedEx Corp. | 1,400 | 146,594 | |||||||||
| United Parcel Service, Inc., Class B | 11,000 | 758,010 | |||||||||
| 904,604 | |||||||||||
| Building Products (0.2%) | |||||||||||
| Masco Corp. | 9,300 | 248,589 | |||||||||
| Commercial Services & Supplies (0.9%) | |||||||||||
| Cendant Corp. | 44,500 | 667,945 | |||||||||
| Equifax, Inc. | 3,900 | 125,892 | |||||||||
| R.R. Donnelley & Sons Co. | 2,800 | 81,732 | |||||||||
| Robert Half International, Inc. | 1,200 | 38,832 | |||||||||
| 914,401 | |||||||||||
| Electrical Equipment (1.1%) | |||||||||||
| Cooper Industries Ltd., Class A | 1,100 | 94,776 | |||||||||
| Emerson Electric Co. | 10,100 | 797,092 | |||||||||
| Rockwell Automation, Inc. | 2,800 | 173,544 | |||||||||
| 1,065,412 | |||||||||||
| Industrial Conglomerates (3.7%) | |||||||||||
| 3M Co. | 18,700 | 1,316,480 | |||||||||
| General Electric Co. | 59,300 | 1,938,517 | |||||||||
| Tyco International Ltd. | 18,300 | 477,447 | |||||||||
| 3,732,444 | |||||||||||
| Machinery (1.0%) | |||||||||||
| Danaher Corp. | 600 | 39,120 | |||||||||
| Illinois Tool Works, Inc. | 13,700 | 626,501 | |||||||||
| Ingersoll-Rand Co., Ltd., Class A | 6,100 | 218,380 | |||||||||
| Parker Hannifin Corp. | 1,600 | 115,584 | |||||||||
| 999,585 | |||||||||||
See Accompanying Notes to Financial Statements.
67
CMG ENHANCED S&P 500® INDEX FUND
A Portfolio of Columbia Funds Institutional Trust
SCHEDULE OF INVESTMENTS
| Shares | Value | ||||||||||
| Common Stocks (continued) | |||||||||||
| Road & Rail (0.6%) | |||||||||||
| Burlington Northern Santa Fe Corp. | 5,000 | $ | 344,550 | ||||||||
| CSX Corp. | 1,600 | 97,088 | |||||||||
| Norfolk Southern Corp. | 3,000 | 130,260 | |||||||||
| 571,898 | |||||||||||
| Trading Companies & Distributors (0.1%) | |||||||||||
| W.W. Grainger, Inc. | 1,600 | 99,344 | |||||||||
| Information Technology (14.2%) | |||||||||||
| Communications Equipment (2.7%) | |||||||||||
| Cisco Systems, Inc. (a) | 70,900 | 1,265,565 | |||||||||
| Motorola, Inc. | 31,900 | 726,044 | |||||||||
| QUALCOMM, Inc. | 18,700 | 659,362 | |||||||||
| 2,650,971 | |||||||||||
| Computers & Peripherals (4.5%) | |||||||||||
| Apple Computer, Inc. (a) | 6,800 | 462,128 | |||||||||
| Dell, Inc. (a) | 56,200 | 1,218,416 | |||||||||
| Hewlett-Packard Co. | 46,200 | 1,474,242 | |||||||||
| International Business Machines Corp. | 18,100 | 1,401,121 | |||||||||
| 4,555,907 | |||||||||||
| Internet Software & Services (0.2%) | |||||||||||
| eBay, Inc. (a) | 7,100 | 170,897 | |||||||||
| IT Services (0.2%) | |||||||||||
| Computer Sciences Corp. (a) | 2,200 | 115,258 | |||||||||
| Fiserv, Inc. (a) | 2,300 | 100,418 | |||||||||
| 215,676 | |||||||||||
| Semiconductors & Semiconductor Equipment (2.3%) | |||||||||||
| Advanced Micro Devices, Inc. (a) | 21,700 | 420,763 | |||||||||
| Intel Corp. | 45,800 | 824,400 | |||||||||
| National Semiconductor Corp. | 5,500 | 127,930 | |||||||||
| NVIDIA Corp. (a) | 3,400 | 75,242 | |||||||||
| Texas Instruments, Inc. | 29,800 | 887,444 | |||||||||
| 2,335,779 | |||||||||||
| Software (4.3%) | |||||||||||
| Autodesk, Inc. (a) | 13,700 | 467,307 | |||||||||
| Intuit, Inc. (a) | 14,600 | 450,702 | |||||||||
| Microsoft Corp. (b) | 109,400 | 2,628,882 | |||||||||
| Oracle Corp. (a) | 54,700 | 818,859 | |||||||||
| 4,365,750 | |||||||||||
| Materials (2.9%) | |||||||||||
| Chemicals (0.6%) | |||||||||||
| Dow Chemical Co. | 8,900 | 307,762 | |||||||||
| PPG Industries, Inc. | 5,500 | 338,470 | |||||||||
| 646,232 | |||||||||||
See Accompanying Notes to Financial Statements.
68
CMG ENHANCED S&P 500® INDEX FUND
A Portfolio of Columbia Funds Institutional Trust
SCHEDULE OF INVESTMENTS
| Shares | Value | ||||||||||
| Common Stocks (continued) | |||||||||||
| Metals & Mining (2.3%) | |||||||||||
| Freeport-McMoRan Copper & Gold, Inc., Class B | 12,800 | $ | 698,368 | ||||||||
| Nucor Corp. | 25,600 | 1,361,152 | |||||||||
| Phelps Dodge Corp. | 2,400 | 209,616 | |||||||||
| 2,269,136 | |||||||||||
| Telecommunication Services (3.3%) | |||||||||||
| Diversified Telecommunication Services (2.7%) | |||||||||||
| AT&T, Inc. | 16,600 | 497,834 | |||||||||
| BellSouth Corp. | 21,100 | 826,487 | |||||||||
| CenturyTel, Inc. | 1,400 | 53,998 | |||||||||
| Citizens Communications Co. | 14,100 | 180,903 | |||||||||
| Embarq Corp. (a) | 2,100 | 95,026 | |||||||||
| Verizon Communications, Inc. | 31,400 | 1,061,948 | |||||||||
| 2,716,196 | |||||||||||
| Wireless Telecommunication Services (0.6%) | |||||||||||
| Sprint Nextel Corp. | 30,000 | 594,000 | |||||||||
| Utilities (3.4%) | |||||||||||
| Electric Utilities (0.8%) | |||||||||||
| American Electric Power Co., Inc. | 1,800 | 65,016 | |||||||||
| Edison International | 900 | 37,242 | |||||||||
| Exelon Corp. | 1,400 | 81,060 | |||||||||
| FirstEnergy Corp. | 8,300 | 464,800 | |||||||||
| PPL Corp. | 4,400 | 149,688 | |||||||||
| Progress Energy, Inc. | 200 | 8,710 | |||||||||
| 806,516 | |||||||||||
| Independent Power Producers & Energy Traders (0.7%) | |||||||||||
| Constellation Energy Group, Inc. | 3,800 | 220,058 | |||||||||
| TXU Corp. | 7,400 | 475,302 | |||||||||
| 695,360 | |||||||||||
| Multi-Utilities (1.9%) | |||||||||||
| CenterPoint Energy, Inc. | 38,500 | 528,990 | |||||||||
| DTE Energy Co. | 12,400 | 524,768 | |||||||||
| Duke Energy Corp. | 14,900 | 451,768 | |||||||||
| PG&E Corp. | 9,800 | 408,464 | |||||||||
| 1,913,990 | |||||||||||
| Total Common Stocks (Cost of $90,143,656) | 99,182,958 | ||||||||||
See Accompanying Notes to Financial Statements.
69
CMG ENHANCED S&P 500® INDEX FUND
A Portfolio of Columbia Funds Institutional Trust
SCHEDULE OF INVESTMENTS
| Par | Value | ||||||||||
| Short-Term Obligation (1.7%) | |||||||||||
| Repurchase agreement with State Street Bank & Trust Co., dated 07/31/06, due 08/01/06 at 5.160%, collateralized by a U.S. Treasury Bond maturing 02/15/20, market value of $1,783,741 (repurchase proceeds $1,745,250) | $ | 1,745,000 | $ | 1,745,000 | |||||||
| Total Short-Term Obligation (Cost of $1,745,000) | 1,745,000 | ||||||||||
| Total Investments (99.9%) (Cost of $91,888,656) (c) | 100,927,958 | ||||||||||
| Other Assets & Liabilities, Net (0.1%) | 45,209 | ||||||||||
| Net Assets (100.0%) | $ | 100,973,167 | |||||||||
Notes to Schedule of Investments:
(a) Non-income producing security.
(b) A portion of the security with a market value of $286,314 is pledged as collateral for open futures contracts.
(c) Cost for federal income tax purposes is $92,384,984.
At July 31, 2006, the Fund held the following open long futures contracts:
| Type | Number of Contracts | Value | Aggregate Face Value | Expiration Date | Unrealized Appreciation | ||||||||||||||||||
| S&P 500® Index | 6 | $ | 1,922,700 | $ | 1,883,953 | Sept-2006 | $ | 38,747 | |||||||||||||||
At July 31, 2006, the Fund held investments in the following sectors:
Sector (Unaudited) | % of Net Assets | ||||||
| Financials | 21.3 | % | |||||
| Information Technology | 14.2 | ||||||
| Health Care | 12.5 | ||||||
| Industrials | 10.6 | ||||||
| Energy | 10.5 | ||||||
| Consumer Discretionary | 9.9 | ||||||
| Consumer Staples | 9.6 | ||||||
| Utilities | 3.4 | ||||||
| Telecommunication Services | 3.3 | ||||||
| Materials | 2.9 | ||||||
| Short-Term Obligation | 1.7 | ||||||
| Other Assets & Liabilities, Net | 0.1 | ||||||
| 100.0 | % | ||||||
| Acronym | Name | ||||||
| REIT | Real Estate Investment Trust | ||||||
See Accompanying Notes to Financial Statements.
70
CMG LARGE CAP GROWTH FUND
A Portfolio of Columbia Funds Institutional Trust
SCHEDULE OF INVESTMENTS
July 31, 2006
| Shares | Value | ||||||||||
| Common Stocks (98.2%) | |||||||||||
| Consumer Discretionary (14.1%) | |||||||||||
| Diversified Consumer Services (0.6%) | |||||||||||
| Sotheby's | 8,400 | $ | 232,092 | ||||||||
| Hotels, Restaurants & Leisure (1.5%) | |||||||||||
| Las Vegas Sands Corp. (a) | 2,898 | 179,763 | |||||||||
| Starbucks Corp. (a) | 10,900 | 373,434 | |||||||||
| 553,197 | |||||||||||
| Media (6.6%) | |||||||||||
| Comcast Corp., Class A (a) | 18,800 | 646,344 | |||||||||
| EchoStar Communications Corp., Class A (a) | 15,700 | 550,285 | |||||||||
| Lamar Advertising Co., Class A (a) | 5,300 | 259,912 | |||||||||
| News Corp., Class A | 39,700 | 763,828 | |||||||||
| Viacom, Inc., Class B (a) | 4,000 | 139,400 | |||||||||
| 2,359,769 | |||||||||||
| Multi-Line Retail (1.3%) | |||||||||||
| Kohl's Corp. (a) | 8,000 | 453,040 | |||||||||
| Specialty Retail (4.1%) | |||||||||||
| Best Buy Co., Inc. | 3,500 | 158,690 | |||||||||
| Office Depot, Inc. (a) | 15,500 | 558,775 | |||||||||
| OfficeMax, Inc. | 9,200 | 378,212 | |||||||||
| TJX Companies., Inc. | 14,600 | 355,802 | |||||||||
| 1,451,479 | |||||||||||
| Consumer Staples (10.8%) | |||||||||||
| Beverages (2.6%) | |||||||||||
| Anheuser-Busch Companies, Inc. | 7,700 | 370,755 | |||||||||
| Coca-Cola Co. | 12,800 | 569,600 | |||||||||
| 940,355 | |||||||||||
| Food & Staples Retailing (4.5%) | |||||||||||
| CVS Corp. | 10,800 | 353,376 | |||||||||
| Kroger Co. | 22,600 | 518,218 | |||||||||
| Wal-Mart Stores, Inc. | 16,500 | 734,250 | |||||||||
| 1,605,844 | |||||||||||
| Food Products (0.8%) | |||||||||||
| Campbell Soup Co. | 7,600 | 278,768 | |||||||||
| Household Products (1.4%) | |||||||||||
| Colgate-Palmolive Co. | 8,733 | 518,042 | |||||||||
| Tobacco (1.5%) | |||||||||||
| Altria Group, Inc. | 6,600 | 527,802 | |||||||||
See Accompanying Notes to Financial Statements.
71
CMG LARGE CAP GROWTH FUND
A Portfolio of Columbia Funds Institutional Trust
SCHEDULE OF INVESTMENTS
| Shares | Value | ||||||||||
| Common Stocks (continued) | |||||||||||
| Energy (5.5%) | |||||||||||
| Energy Equipment & Services (0.9%) | |||||||||||
| Halliburton Co. | 9,300 | $ | 310,248 | ||||||||
| Oil, Gas & Consumable Fuels (4.6%) | |||||||||||
| EnCana Corp. | 10,300 | 556,818 | |||||||||
| Occidental Petroleum Corp. | 5,800 | 624,950 | |||||||||
| XTO Energy, Inc. | 10,100 | 474,599 | |||||||||
| 1,656,367 | |||||||||||
| Financials (9.7%) | |||||||||||
| Capital Markets (5.4%) | |||||||||||
| Bank of New York Co., Inc. | 21,700 | 729,337 | |||||||||
| Franklin Resources, Inc. | 2,200 | 201,190 | |||||||||
| Goldman Sachs Group, Inc. | 1,200 | 183,300 | |||||||||
| Merrill Lynch & Co., Inc. | 5,800 | 422,356 | |||||||||
| State Street Corp. | 6,450 | 387,387 | |||||||||
| 1,923,570 | |||||||||||
| Commercial Banks (1.0%) | |||||||||||
| Wells Fargo & Co. | 4,890 | 353,743 | |||||||||
| Diversified Financial Services (0.5%) | |||||||||||
| Nasdaq Stock Market, Inc. (a) | 7,300 | 200,969 | |||||||||
| Insurance (2.8%) | |||||||||||
| Ambac Financial Group, Inc. | 3,200 | 265,952 | |||||||||
| American International Group, Inc. | 12,180 | 738,960 | |||||||||
| 1,004,912 | |||||||||||
| Health Care (20.7%) | |||||||||||
| Biotechnology (4.9%) | |||||||||||
| Amgen, Inc. (a) | 7,100 | 495,154 | |||||||||
| Amylin Pharmaceuticals, Inc. (a) | 4,200 | 204,960 | |||||||||
| Genzyme Corp. (a) | 9,000 | 614,520 | |||||||||
| Vertex Pharmaceuticals, Inc. (a) | 12,800 | 429,056 | |||||||||
| 1,743,690 | |||||||||||
| Health Care Providers & Services (5.5%) | |||||||||||
| Cardinal Health, Inc. | 5,500 | 368,500 | |||||||||
| Caremark Rx, Inc. | 13,810 | 729,168 | |||||||||
| Quest Diagnostics, Inc. | 8,700 | 523,044 | |||||||||
| WellPoint, Inc. (a) | 4,600 | 342,700 | |||||||||
| 1,963,412 | |||||||||||
| Life Sciences Tools & Services (2.8%) | |||||||||||
| Covance, Inc. (a) | 5,800 | 369,808 | |||||||||
| Thermo Electron Corp. (a) | 16,730 | 619,177 | |||||||||
| 988,985 | |||||||||||
See Accompanying Notes to Financial Statements.
72
CMG LARGE CAP GROWTH FUND
A Portfolio of Columbia Funds Institutional Trust
SCHEDULE OF INVESTMENTS
| Shares | Value | ||||||||||
| Common Stocks (continued) | |||||||||||
| Pharmaceuticals (7.5%) | |||||||||||
| Abbott Laboratories | 7,700 | $ | 367,829 | ||||||||
| AstraZeneca PLC, ADR | 8,500 | 518,755 | |||||||||
| Johnson & Johnson | 14,700 | 919,485 | |||||||||
| Merck & Co., Inc. | 8,900 | 358,403 | |||||||||
| Novartis AG, ADR | 9,380 | 527,344 | |||||||||
| 2,691,816 | |||||||||||
| Industrials (9.9%) | |||||||||||
| Aerospace & Defense (3.3%) | |||||||||||
| Boeing Co. | 7,000 | 541,940 | |||||||||
| United Technologies Corp. | 10,000 | 621,900 | |||||||||
| 1,163,840 | |||||||||||
| Commercial Services & Supplies (2.6%) | |||||||||||
| Manpower, Inc. | 5,800 | 344,984 | |||||||||
| Waste Management, Inc. | 17,300 | 594,774 | |||||||||
| 939,758 | |||||||||||
| Construction & Engineering (0.8%) | |||||||||||
| Foster Wheeler Ltd. (a) | 7,400 | 282,236 | |||||||||
| Electrical Equipment (0.8%) | |||||||||||
| Emerson Electric Co. | 3,600 | 284,112 | |||||||||
| Industrial Conglomerates (2.4%) | |||||||||||
| General Electric Co. | 26,200 | 856,478 | |||||||||
| Information Technology (20.9%) | |||||||||||
| Communications Equipment (4.1%) | |||||||||||
| Cisco Systems, Inc. (a) | 48,280 | 861,798 | |||||||||
| CommScope, Inc. (a) | 7,000 | 218,610 | |||||||||
| Nokia Oyj, ADR | 10,900 | 216,365 | |||||||||
| QUALCOMM, Inc. | 5,300 | 186,878 | |||||||||
| 1,483,651 | |||||||||||
| Computers & Peripherals (3.4%) | |||||||||||
| Apple Computer, Inc. (a) | 5,700 | 387,372 | |||||||||
| Hewlett-Packard Co. | 9,800 | 312,718 | |||||||||
| International Business Machines Corp. | 6,900 | 534,129 | |||||||||
| 1,234,219 | |||||||||||
| Internet Software & Services (4.0%) | |||||||||||
| Akamai Technologies, Inc. (a) | 10,700 | 424,041 | |||||||||
| Google, Inc., Class A (a) | 2,578 | 996,655 | |||||||||
| 1,420,696 | |||||||||||
| IT Services (0.3%) | |||||||||||
| Cognizant Technology Solutions Corp., Class A (a) | 1,600 | 104,784 | |||||||||
See Accompanying Notes to Financial Statements.
73
CMG LARGE CAP GROWTH FUND
A Portfolio of Columbia Funds Institutional Trust
SCHEDULE OF INVESTMENTS
| Shares | Value | ||||||||||
| Common Stocks (continued) | |||||||||||
| Semiconductors & Semiconductor Equipment (3.4%) | |||||||||||
| Intel Corp. | 29,800 | $ | 536,400 | ||||||||
| NVIDIA Corp. (a) | 7,600 | 168,188 | |||||||||
| Samsung Electronics Co., Ltd., GDR (b) | 500 | 159,125 | |||||||||
| Texas Instruments, Inc. | 11,710 | 348,724 | |||||||||
| 1,212,437 | |||||||||||
| Software (5.7%) | |||||||||||
| Autodesk, Inc. (a) | 5,800 | 197,838 | |||||||||
| Citrix Systems, Inc. (a) | 4,100 | 130,257 | |||||||||
| Intuit, Inc. (a) | 6,000 | 185,220 | |||||||||
| Microsoft Corp. | 40,520 | 973,695 | |||||||||
| Oracle Corp. (a) | 23,700 | 354,789 | |||||||||
| SAP AG, ADR | 4,100 | 187,083 | |||||||||
| 2,028,882 | |||||||||||
| Materials (2.6%) | |||||||||||
| Chemicals (2.6%) | |||||||||||
| Air Products & Chemicals, Inc. | 6,300 | 402,759 | |||||||||
| Monsanto Co. | 11,788 | 506,766 | |||||||||
| 909,525 | |||||||||||
| Telecommunication Services (4.0%) | |||||||||||
| Diversified Telecommunication Services (0.9%) | |||||||||||
| Time Warner Telecom, Inc., Class A (a) | 18,158 | 304,146 | |||||||||
| Wireless Telecommunication Services (3.1%) | |||||||||||
| ALLTEL Corp. | 7,200 | 397,224 | |||||||||
| American Tower Corp., Class A (a) | 16,100 | 544,180 | |||||||||
| NII Holdings, Inc. (a) | 3,300 | 174,174 | |||||||||
| 1,115,578 | |||||||||||
| Total Common Stocks (Cost of $33,071,348) | 35,098,442 | ||||||||||
See Accompanying Notes to Financial Statements.
74
CMG LARGE CAP GROWTH FUND
A Portfolio of Columbia Funds Institutional Trust
SCHEDULE OF INVESTMENTS
| Par | Value | ||||||||||
| Short-Term Obligation (3.7%) | |||||||||||
| Repurchase agreement with State Street Bank & Trust Co., dated 07/31/06, due 08/01/06 at 5.160%, collateralized by a U.S. Treasury Note maturing 02/28/11, market value of $1,356,694 (repurchase proceeds $1,330,191) | $ | 1,330,000 | $ | 1,330,000 | |||||||
| Total Short-Term Obligation (Cost of $1,330,000) | 1,330,000 | ||||||||||
| Total Investments (101.9%) (Cost of $34,401,348) (c) | 36,428,442 | ||||||||||
| Other Assets & Liabilities, Net (-1.9%) | (663,260 | ) | |||||||||
| Net Assets (100.0%) | $ | 35,765,182 | |||||||||
Notes to Schedule of Investments:
(a) Non-income producing security.
(b) Security exempt from registration pursuant to Rule 144A under the Securities Act of 1933. This security may be resold in transactions exempt from registration, normally to qualified institutional buyers. At July 31, 2006, the value of this security, which is not illiquid, represents 0.4% of net assets.
(c) Cost for federal income tax purposes is $34,562,489.
At July 31, 2006, the Fund held investments in the following sectors:
| Sector (Unaudited) | % of Net Assets | ||||||
| Information Technology | 20.9 | % | |||||
| Health Care | 20.7 | ||||||
| Consumer Discretionary | 14.1 | ||||||
| Consumer Staples | 10.8 | ||||||
| Industrials | 9.9 | ||||||
| Financials | 9.7 | ||||||
| Energy | 5.5 | ||||||
| Telecommunication Services | 4.0 | ||||||
| Materials | 2.6 | ||||||
| Short-Term Obligation | 3.7 | ||||||
| Other Assets & Liabilities, Net | (1.9 | ) | |||||
| 100.0 | % | ||||||
| Acronym | Name | ||||||
| ADR | American Depositary Receipt | ||||||
| GDR | Global Depositary Receipt | ||||||
See Accompanying Notes to Financial Statements.
75
CMG LARGE CAP VALUE FUND
A Portfolio of Columbia Funds Institutional Trust
SCHEDULE OF INVESTMENTS
July 31, 2006
| Shares | Value | ||||||||||
| Common Stocks (97.8%) | |||||||||||
| Consumer Discretionary (8.0%) | |||||||||||
| Auto Components (0.3%) | |||||||||||
| Johnson Controls, Inc. | 1,700 | $ | 130,492 | ||||||||
| Hotels, Restaurants & Leisure (2.4%) | |||||||||||
| McDonald's Corp. | 11,266 | 398,704 | |||||||||
| Starwood Hotels & Resorts Worldwide, Inc. | 9,600 | 504,768 | |||||||||
| 903,472 | |||||||||||
| Household Durables (0.7%) | |||||||||||
| Newell Rubbermaid, Inc. | 10,136 | 267,185 | |||||||||
| Media (1.0%) | |||||||||||
| News Corp., Class A | 19,200 | 369,408 | |||||||||
| Multi-Line Retail (2.0%) | |||||||||||
| Federated Department Stores, Inc. | 15,432 | 541,817 | |||||||||
| J.C. Penney Co., Inc. | 2,976 | 187,369 | |||||||||
| 729,186 | |||||||||||
| Specialty Retail (1.6%) | |||||||||||
| Office Depot, Inc. (a) | 8,800 | 317,240 | |||||||||
| Staples, Inc. | 12,100 | 261,602 | |||||||||
| 578,842 | |||||||||||
| Consumer Staples (8.3%) | |||||||||||
| Beverages (3.9%) | |||||||||||
| Anheuser-Busch Companies, Inc. | 8,400 | 404,460 | |||||||||
| Coca-Cola Enterprises, Inc. | 8,600 | 184,556 | |||||||||
| Diageo PLC, ADR | 6,899 | 485,138 | |||||||||
| PepsiCo, Inc. | 6,058 | 383,956 | |||||||||
| 1,458,110 | |||||||||||
| Food Products (2.0%) | |||||||||||
| Cadbury Schweppes PLC, ADR | 9,600 | 376,896 | |||||||||
| Kraft Foods, Inc., Class A | 7,600 | 246,240 | |||||||||
| Tyson Foods, Inc., Class A | 7,900 | 111,785 | |||||||||
| 734,921 | |||||||||||
| Tobacco (2.4%) | |||||||||||
| Altria Group, Inc. | 7,229 | 578,103 | |||||||||
| Loews Corp.-Carolina Group | 5,600 | 321,328 | |||||||||
| 899,431 | |||||||||||
| Energy (13.6%) | |||||||||||
| Energy Equipment & Services (2.8%) | |||||||||||
| Halliburton Co. | 11,754 | 392,113 | |||||||||
| National-Oilwell Varco, Inc. (a) | 4,300 | 288,272 | |||||||||
| Schlumberger Ltd. | 5,750 | 384,388 | |||||||||
| 1,064,773 | |||||||||||
See Accompanying Notes to Financial Statements.
76
CMG LARGE CAP VALUE FUND
A Portfolio of Columbia Funds Institutional Trust
SCHEDULE OF INVESTMENTS
| Shares | Value | ||||||||||
| Common Stocks (continued) | |||||||||||
| Oil, Gas & Consumable Fuels (10.8%) | |||||||||||
| ConocoPhillips | 8,932 | $ | 613,092 | ||||||||
| EnCana Corp. | 5,500 | 297,330 | |||||||||
| Exxon Mobil Corp. | 9,035 | 612,031 | |||||||||
| Hess Corp. | 7,000 | 370,300 | |||||||||
| Marathon Oil Corp. | 6,664 | 604,025 | |||||||||
| Occidental Petroleum Corp. | 6,600 | 711,150 | |||||||||
| Total SA, ADR | 5,800 | 395,734 | |||||||||
| Williams Companies, Inc. | 16,900 | 409,825 | |||||||||
| 4,013,487 | |||||||||||
| Financials (33.4%) | |||||||||||
| Capital Markets (5.2%) | |||||||||||
| Bank of New York Co., Inc. | 18,795 | 631,700 | |||||||||
| Deutsche Bank AG, Registered Shares | 2,300 | 265,880 | |||||||||
| Merrill Lynch & Co., Inc. | 10,880 | 792,282 | |||||||||
| Nuveen Investments, Inc., Class A | 5,000 | 237,450 | |||||||||
| 1,927,312 | |||||||||||
| Commercial Banks (11.1%) | |||||||||||
| Marshall & Ilsley Corp. | 9,820 | 461,245 | |||||||||
| Mitsubishi UFJ Financial Group, Inc., ADR | 21,200 | 295,740 | |||||||||
| PNC Financial Services Group, Inc. | 9,600 | 680,064 | |||||||||
| SunTrust Banks, Inc. | 2,400 | 189,288 | |||||||||
| U.S. Bancorp | 25,146 | 804,672 | |||||||||
| UnionBanCal Corp. | 4,000 | 247,160 | |||||||||
| Wachovia Corp. | 9,586 | 514,097 | |||||||||
| Wells Fargo & Co. | 13,028 | 942,446 | |||||||||
| 4,134,712 | |||||||||||
| Diversified Financial Services (8.5%) | |||||||||||
| CIT Group, Inc. | 3,600 | 165,276 | |||||||||
| Citigroup, Inc. | 34,585 | 1,670,801 | |||||||||
| JPMorgan Chase & Co. | 29,600 | 1,350,352 | |||||||||
| 3,186,429 | |||||||||||
| Insurance (5.5%) | |||||||||||
| Ambac Financial Group, Inc. | 5,735 | 476,636 | |||||||||
| American International Group, Inc. | 7,451 | 452,052 | |||||||||
| Genworth Financial, Inc., Class A | 11,200 | 384,160 | |||||||||
| Hartford Financial Services Group, Inc. | 5,055 | 428,866 | |||||||||
| St. Paul Travelers Companies, Inc. | 7,100 | 325,180 | |||||||||
| 2,066,894 | |||||||||||
| Real Estate Investment Trusts (REITs) (1.8%) | |||||||||||
| Archstone-Smith Trust, REIT | 3,855 | 202,272 | |||||||||
| Kimco Realty Corp., REIT | 5,436 | 213,309 | |||||||||
| ProLogis, REIT | 4,400 | 243,540 | |||||||||
| 659,121 | |||||||||||
See Accompanying Notes to Financial Statements.
77
CMG LARGE CAP VALUE FUND
A Portfolio of Columbia Funds Institutional Trust
SCHEDULE OF INVESTMENTS
| Shares | Value | ||||||||||
| Common Stocks (continued) | |||||||||||
| Thrifts & Mortgage Finance (1.3%) | |||||||||||
| Golden West Financial Corp. | 6,400 | $ | 471,424 | ||||||||
| Health Care (7.5%) | |||||||||||
| Health Care Providers & Services (1.3%) | |||||||||||
| Aetna, Inc. | 7,244 | 228,114 | |||||||||
| CIGNA Corp. | 2,852 | 260,245 | |||||||||
| 488,359 | |||||||||||
| Pharmaceuticals (6.2%) | |||||||||||
| AstraZeneca PLC, ADR | 7,400 | 451,622 | |||||||||
| GlaxoSmithKline PLC, ADR | 3,265 | 180,652 | |||||||||
| Novartis AG, ADR | 6,848 | 384,995 | |||||||||
| Pfizer, Inc. | 38,662 | 1,004,825 | |||||||||
| Sanofi-Aventis, ADR | 5,900 | 279,601 | |||||||||
| 2,301,695 | |||||||||||
| Industrials (10.7%) | |||||||||||
| Aerospace & Defense (4.8%) | |||||||||||
| Boeing Co. | 6,700 | 518,714 | |||||||||
| General Dynamics Corp. | 6,374 | 427,186 | |||||||||
| L-3 Communications Holdings, Inc. | 3,600 | 265,140 | |||||||||
| United Technologies Corp. | 9,496 | 590,556 | |||||||||
| 1,801,596 | |||||||||||
| Electrical Equipment (1.0%) | |||||||||||
| ABB Ltd., ADR | 29,997 | 387,861 | |||||||||
| Industrial Conglomerates (1.9%) | |||||||||||
| General Electric Co. | 21,192 | 692,766 | |||||||||
| Machinery (1.7%) | |||||||||||
| Caterpillar, Inc. | 4,000 | 283,480 | |||||||||
| Eaton Corp. | 529 | 33,909 | |||||||||
| Ingersoll-Rand Co., Ltd., Class A | 8,600 | 307,880 | |||||||||
| 625,269 | |||||||||||
| Road & Rail (1.3%) | |||||||||||
| Burlington Northern Santa Fe Corp. | 3,600 | 248,076 | |||||||||
| Norfolk Southern Corp. | 5,500 | 238,810 | |||||||||
| 486,886 | |||||||||||
| Information Technology (4.0%) | |||||||||||
| Communications Equipment (0.7%) | |||||||||||
| Nokia Oyj, ADR | 12,600 | 250,110 | |||||||||
| Computers & Peripherals (1.2%) | |||||||||||
| Hewlett-Packard Co. | 14,600 | 465,886 | |||||||||
See Accompanying Notes to Financial Statements.
78
CMG LARGE CAP VALUE FUND
A Portfolio of Columbia Funds Institutional Trust
SCHEDULE OF INVESTMENTS
| Shares | Value | ||||||||||
| Common Stocks (continued) | |||||||||||
| Electronic Equipment & Instruments (1.0%) | |||||||||||
| Agilent Technologies, Inc. (a) | 13,300 | $ | 378,252 | ||||||||
| Semiconductors & Semiconductor Equipment (1.1%) | |||||||||||
| Fairchild Semiconductor International, Inc. (a) | 9,800 | 160,328 | |||||||||
| Taiwan Semiconductor Manufacturing Co., Ltd., ADR | 27,295 | 236,645 | |||||||||
| 396,973 | |||||||||||
| Materials (4.2%) | |||||||||||
| Chemicals (0.7%) | |||||||||||
| Rohm & Haas Co. | 5,500 | 253,660 | |||||||||
| Construction Materials (1.3%) | |||||||||||
| Cemex SA de CV, ADR | 9,008 | 255,107 | |||||||||
| Vulcan Materials Co. | 3,300 | 221,001 | |||||||||
| 476,108 | |||||||||||
| Containers & Packaging (0.2%) | |||||||||||
| Crown Holdings, Inc. (a) | 5,600 | 93,296 | |||||||||
| Metals & Mining (2.0%) | |||||||||||
| Allegheny Technologies, Inc. | 2,900 | 185,281 | |||||||||
| Freeport-McMoRan Copper & Gold, Inc., Class B | 3,800 | 207,328 | |||||||||
| Nucor Corp. | 2,100 | 111,657 | |||||||||
| Phelps Dodge Corp. | 2,000 | 174,680 | |||||||||
| United States Steel Corp. | 1,000 | 63,070 | |||||||||
| 742,016 | |||||||||||
| Telecommunication Services (2.5%) | |||||||||||
| Diversified Telecommunication Services (2.5%) | |||||||||||
| AT&T, Inc. | 15,957 | 478,551 | |||||||||
| Verizon Communications, Inc. | 13,470 | 455,555 | |||||||||
| 934,106 | |||||||||||
| Utilities (5.6%) | |||||||||||
| Electric Utilities (4.8%) | |||||||||||
| Edison International | 12,300 | 508,974 | |||||||||
| Entergy Corp. | 6,173 | 475,938 | |||||||||
| Exelon Corp. | 7,051 | 408,253 | |||||||||
| PPL Corp. | 11,400 | 387,828 | |||||||||
| 1,780,993 | |||||||||||
| Multi-Utilities (0.8%) | |||||||||||
| PG&E Corp. | 7,233 | 301,472 | |||||||||
| Total Common Stocks (Cost of $31,992,191) | 36,452,503 | ||||||||||
See Accompanying Notes to Financial Statements.
79
CMG LARGE CAP VALUE FUND
A Portfolio of Columbia Funds Institutional Trust
SCHEDULE OF INVESTMENTS
| Par | Value | ||||||||||
| Short-Term Obligation (1.7%) | |||||||||||
| Repurchase agreement with State Street Bank & Trust Co., dated 07/31/06, due 08/01/06 at 5.160%, collateralized by a U.S. Treasury Bond maturing 02/15/20, market value of $660,392 (repurchase proceeds $647,093) | $ | 647,000 | $ | 647,000 | |||||||
| Total Short-Term Obligation (Cost of $647,000) | 647,000 | ||||||||||
| Total Investments (99.5%) (Cost of $32,639,191) (b) | 37,099,503 | ||||||||||
| Other Assets & Liabilities, Net (0.5%) | 180,683 | ||||||||||
| Net Assets (100.0%) | $ | 37,280,186 | |||||||||
Notes to Schedule of Investments:
(a) Non-income producing security.
(b) Cost for federal income tax purposes is $32,675,433.
At July 31, 2006, the Fund held investments in the following sectors:
| Sector (Unaudited) | % of Net Assets | ||||||
| Financials | 33.4 | % | |||||
| Energy | 13.6 | ||||||
| Industrials | 10.7 | ||||||
| Consumer Staples | 8.3 | ||||||
| Consumer Discretionary | 8.0 | ||||||
| Health Care | 7.5 | ||||||
| Utilities | 5.6 | ||||||
| Materials | 4.2 | ||||||
| Information Technology | 4.0 | ||||||
| Telecommunication Services | 2.5 | ||||||
| Short-Term Obligation | 1.7 | ||||||
| Other Assets & Liabilities, Net | 0.5 | ||||||
| 100.0 | % | ||||||
| Acronym | Name | ||||||
| ADR | American Depositary Receipt | ||||||
| REIT | Real Estate Investment Trust | ||||||
See Accompanying Notes to Financial Statements.
80
CMG MID CAP GROWTH FUND
A Portfolio of Columbia Funds Institutional Trust
SCHEDULE OF INVESTMENTS
July 31, 2006
| Shares | Value | ||||||||||
| Common Stocks (91.6%) | |||||||||||
| Consumer Discretionary (14.8%) | |||||||||||
| Automobiles (0.5%) | |||||||||||
| Harley-Davidson, Inc. | 2,250 | $ | 128,250 | ||||||||
| Hotels, Restaurants & Leisure (4.7%) | |||||||||||
| Brinker International, Inc. | 2,670 | 86,508 | |||||||||
| Darden Restaurants, Inc. | 3,350 | 113,230 | |||||||||
| Harrah's Entertainment, Inc. | 1,495 | 89,864 | |||||||||
| Hilton Hotels Corp. | 7,950 | 190,244 | |||||||||
| International Game Technology, Inc. | 4,030 | 155,800 | |||||||||
| Marriott International, Inc., Class A | 3,820 | 134,388 | |||||||||
| Scientific Games Corp., Class A (a) | 3,220 | 109,383 | |||||||||
| Starwood Hotels & Resorts Worldwide, Inc. | 1,760 | 92,541 | |||||||||
| Yum! Brands, Inc. | 3,090 | 139,050 | |||||||||
| 1,111,008 | |||||||||||
| Household Durables (0.5%) | |||||||||||
| D.R. Horton, Inc. | 2,213 | 47,425 | |||||||||
| Fortune Brands, Inc. | 1,000 | 72,520 | |||||||||
| 119,945 | |||||||||||
| Internet & Catalog Retail (0.2%) | |||||||||||
| Nutri/System, Inc. (a) | 830 | 43,924 | |||||||||
| Leisure Equipment & Products (0.5%) | |||||||||||
| Pool Corp. | 2,930 | 114,065 | |||||||||
| Media (1.3%) | |||||||||||
| Cablevision Systems Corp., Class A | 3,390 | 75,427 | |||||||||
| Grupo Televisa SA, ADR | 8,250 | 152,790 | |||||||||
| Lamar Advertising Co., Class A (a) | 1,800 | 88,272 | |||||||||
| 316,489 | |||||||||||
| Multi-Line Retail (1.4%) | |||||||||||
| J.C. Penney Co., Inc. | 3,590 | 226,026 | |||||||||
| Nordstrom, Inc. | 2,710 | 92,953 | |||||||||
| 318,979 | |||||||||||
| Specialty Retail (4.0%) | |||||||||||
| Abercrombie & Fitch Co., Class A | 2,890 | 153,054 | |||||||||
| Chico's FAS, Inc. (a) | 5,810 | 131,597 | |||||||||
| Children's Place Retail Stores, Inc. (a) | 1,820 | 101,592 | |||||||||
| GameStop Corp., Class A (a) | 4,970 | 206,802 | |||||||||
| PetSmart, Inc. | 4,340 | 102,250 | |||||||||
| Ross Stores, Inc. | 2,990 | 74,421 | |||||||||
| TJX Companies., Inc. | 7,350 | 179,120 | |||||||||
| 948,836 | |||||||||||
| Textiles, Apparel & Luxury Goods (1.7%) | |||||||||||
| Coach, Inc. (a) | 8,070 | 231,689 | |||||||||
| Phillips-Van Heusen Corp. | 4,860 | 172,676 | |||||||||
| 404,365 | |||||||||||
See Accompanying Notes to Financial Statements.
81
CMG MID CAP GROWTH FUND
A Portfolio of Columbia Funds Institutional Trust
SCHEDULE OF INVESTMENTS
| Shares | Value | ||||||||||
| Common Stocks (continued) | |||||||||||
| Consumer Staples (6.1%) | |||||||||||
| Beverages (0.6%) | |||||||||||
| Pepsi Bottling Group, Inc. | 4,000 | $ | 133,000 | ||||||||
| Food & Staples Retailing (0.4%) | |||||||||||
| Whole Foods Market, Inc. | 1,800 | 103,518 | |||||||||
| Food Products (3.4%) | |||||||||||
| Campbell Soup Co. | 4,620 | 169,462 | |||||||||
| Dean Foods Co. (a) | 3,990 | 149,745 | |||||||||
| H.J. Heinz Co. | 4,160 | 174,595 | |||||||||
| Hershey Co. | 3,300 | 181,401 | |||||||||
| McCormick & Co., Inc. | 3,440 | 120,606 | |||||||||
| 795,809 | |||||||||||
| Personal Products (1.3%) | |||||||||||
| Alberto-Culver Co. | 1,720 | 83,833 | |||||||||
| Avon Products, Inc. | 5,390 | 156,256 | |||||||||
| Estee Lauder Companies, Inc., Class A | 1,860 | 69,415 | |||||||||
| 309,504 | |||||||||||
| Tobacco (0.4%) | |||||||||||
| UST, Inc. | 2,150 | 108,682 | |||||||||
| Energy (8.0%) | |||||||||||
| Energy Equipment & Services (4.0%) | |||||||||||
| BJ Services Co. | 5,330 | 193,319 | |||||||||
| Diamond Offshore Drilling, Inc. | 2,100 | 165,753 | |||||||||
| FMC Technologies, Inc. (a) | 2,440 | 153,769 | |||||||||
| Nabors Industries Ltd. (a) | 2,170 | 76,645 | |||||||||
| National-Oilwell Varco, Inc. (a) | 1,980 | 132,739 | |||||||||
| Smith International, Inc. | 5,060 | 225,524 | |||||||||
| 947,749 | |||||||||||
| Oil, Gas & Consumable Fuels (4.0%) | |||||||||||
| Chesapeake Energy Corp. | 6,110 | 201,019 | |||||||||
| Denbury Resources, Inc. (a) | 2,330 | 80,781 | |||||||||
| EOG Resources, Inc. | 2,870 | 212,810 | |||||||||
| Peabody Energy Corp. | 3,850 | 192,115 | |||||||||
| Southwestern Energy Co. (a) | 2,359 | 81,150 | |||||||||
| Tesoro Corp. | 2,320 | 173,536 | |||||||||
| 941,411 | |||||||||||
| Financials (7.5%) | |||||||||||
| Capital Markets (3.4%) | |||||||||||
| Affiliated Managers Group, Inc. (a) | 2,360 | 216,058 | |||||||||
| Greenhill & Co., Inc. | 1,384 | 80,217 | |||||||||
| Lazard Ltd., Class A | 4,430 | 172,991 | |||||||||
| Legg Mason, Inc. | 1,320 | 110,180 | |||||||||
| T. Rowe Price Group, Inc. | 5,100 | 210,681 | |||||||||
| 790,127 | |||||||||||
See Accompanying Notes to Financial Statements.
82
CMG MID CAP GROWTH FUND
A Portfolio of Columbia Funds Institutional Trust
SCHEDULE OF INVESTMENTS
| Shares | Value | ||||||||||
| Common Stocks (continued) | |||||||||||
| Commercial Banks (1.9%) | |||||||||||
| City National Corp. | 2,170 | $ | 144,761 | ||||||||
| East West Bancorp, Inc. | 4,520 | 182,382 | |||||||||
| Zions Bancorporation | 1,460 | 119,924 | |||||||||
| 447,067 | |||||||||||
| Diversified Financial Services (0.7%) | |||||||||||
| Chicago Mercantile Exchange | 350 | 161,420 | |||||||||
| Insurance (1.0%) | |||||||||||
| Ambac Financial Group, Inc. | 2,915 | 242,266 | |||||||||
| Real Estate Investment Trusts (REITs) (0.5%) | |||||||||||
| General Growth Properties, Inc., REIT | 2,770 | 126,423 | |||||||||
| Health Care (17.8%) | |||||||||||
| Biotechnology (2.5%) | |||||||||||
| Amylin Pharmaceuticals, Inc. (a) | 2,670 | 130,296 | |||||||||
| Celgene Corp. (a) | 3,090 | 147,980 | |||||||||
| Cephalon, Inc. (a) | 2,860 | 188,017 | |||||||||
| PDL BioPharma, Inc. (a) | 6,240 | 112,382 | |||||||||
| 578,675 | |||||||||||
| Health Care Equipment & Supplies (4.3%) | |||||||||||
| Beckman Coulter, Inc. | 1,730 | 99,042 | |||||||||
| Biomet, Inc. | 4,600 | 151,524 | |||||||||
| DENTSPLY International, Inc. | 3,080 | 96,404 | |||||||||
| Gen-Probe, Inc. (a) | 2,880 | 149,616 | |||||||||
| ResMed, Inc. (a) | 3,902 | 181,092 | |||||||||
| St. Jude Medical, Inc. (a) | 3,880 | 143,172 | |||||||||
| Varian Medical Systems, Inc. (a) | 4,563 | 206,795 | |||||||||
| 1,027,645 | |||||||||||
| Health Care Providers & Services (6.9%) | |||||||||||
| Community Health Systems, Inc. (a) | 3,065 | 111,137 | |||||||||
| Coventry Health Care, Inc. (a) | 2,650 | 139,655 | |||||||||
| DaVita, Inc. (a) | 3,517 | 175,920 | |||||||||
| Express Scripts, Inc. (a) | 1,780 | 137,114 | |||||||||
| Henry Schein, Inc. (a) | 1,530 | 72,537 | |||||||||
| Humana, Inc. (a) | 3,730 | 208,619 | |||||||||
| Laboratory Corp. of America Holdings (a) | 2,750 | 177,155 | |||||||||
| Lincare Holdings, Inc. (a) | 3,910 | 136,107 | |||||||||
| Manor Care, Inc. | 2,120 | 106,106 | |||||||||
| Medco Health Solutions, Inc. (a) | 2,710 | 160,784 | |||||||||
| Patterson Companies, Inc. (a) | 2,090 | 69,513 | |||||||||
| Quest Diagnostics, Inc. | 2,130 | 128,056 | |||||||||
| 1,622,703 | |||||||||||
| Health Care Technology (0.3%) | |||||||||||
| IMS Health, Inc. | 2,680 | 73,539 | |||||||||
See Accompanying Notes to Financial Statements.
83
CMG MID CAP GROWTH FUND
A Portfolio of Columbia Funds Institutional Trust
SCHEDULE OF INVESTMENTS
| Shares | Value | ||||||||||
| Common Stocks (continued) | |||||||||||
| Life Sciences Tools & Services (2.1%) | |||||||||||
| Invitrogen Corp. (a) | 1,410 | $ | 87,124 | ||||||||
| Nektar Therapeutics (a) | 6,900 | 112,470 | |||||||||
| Thermo Electron Corp. (a) | 5,220 | 193,192 | |||||||||
| Waters Corp. (a) | 2,570 | 104,548 | |||||||||
| 497,334 | |||||||||||
| Pharmaceuticals (1.7%) | |||||||||||
| Allergan, Inc. | 2,930 | 316,001 | |||||||||
| Medicis Pharmaceutical Corp., Class A | 3,290 | 90,672 | |||||||||
| 406,673 | |||||||||||
| Industrials (12.1%) | |||||||||||
| Aerospace & Defense (2.4%) | |||||||||||
| Armor Holdings, Inc. (a) | 1,810 | 93,505 | |||||||||
| BE Aerospace, Inc. (a) | 6,660 | 164,835 | |||||||||
| Hexcel Corp. (a) | 12,930 | 185,804 | |||||||||
| Rockwell Collins, Inc. | 2,500 | 133,425 | |||||||||
| 577,569 | |||||||||||
| Air Freight & Logistics (1.0%) | |||||||||||
| C.H. Robinson Worldwide, Inc. | 2,740 | 125,437 | |||||||||
| UTI Worldwide, Inc. | 4,710 | 109,743 | |||||||||
| 235,180 | |||||||||||
| Airlines (0.6%) | |||||||||||
| Southwest Airlines Co. | 8,290 | 149,137 | |||||||||
| Commercial Services & Supplies (3.1%) | |||||||||||
| ChoicePoint, Inc. (a) | 4,065 | 138,860 | |||||||||
| Cintas Corp. | 1,980 | 69,894 | |||||||||
| Corporate Executive Board Co. | 2,905 | 273,070 | |||||||||
| Robert Half International, Inc. | 7,490 | 242,377 | |||||||||
| 724,201 | |||||||||||
| Electrical Equipment (1.2%) | |||||||||||
| Rockwell Automation, Inc. | 3,310 | 205,154 | |||||||||
| Roper Industries, Inc. | 1,550 | 70,060 | |||||||||
| 275,214 | |||||||||||
| Machinery (2.3%) | |||||||||||
| JLG Industries, Inc. | 3,570 | 64,617 | |||||||||
| Joy Global, Inc. | 5,115 | 191,914 | |||||||||
| Terex Corp. (a) | 3,820 | 171,289 | |||||||||
| Timken Co. | 4,030 | 129,766 | |||||||||
| 557,586 | |||||||||||
| Marine (0.3%) | |||||||||||
| Kirby Corp. (a) | 1,980 | 63,578 | |||||||||
| Road & Rail (1.2%) | |||||||||||
| CSX Corp. | 1,230 | 74,636 | |||||||||
| Landstar System, Inc. | 4,760 | 203,205 | |||||||||
| 277,841 | |||||||||||
See Accompanying Notes to Financial Statements.
84
CMG MID CAP GROWTH FUND
A Portfolio of Columbia Funds Institutional Trust
SCHEDULE OF INVESTMENTS
| Shares | Value | ||||||||||
| Common Stocks (continued) | |||||||||||
| Information Technology (15.7%) | |||||||||||
| Communications Equipment (2.0%) | |||||||||||
| Comverse Technology, Inc. (a) | 6,660 | $ | 129,071 | ||||||||
| CSR PLC (a) | 5,800 | 122,970 | |||||||||
| F5 Networks, Inc. (a) | 1,840 | 85,266 | |||||||||
| Harris Corp. | 2,850 | 129,817 | |||||||||
| 467,124 | |||||||||||
| Computers & Peripherals (1.1%) | |||||||||||
| Network Appliance, Inc. (a) | 4,100 | 121,729 | |||||||||
| SanDisk Corp. (a) | 3,120 | 145,579 | |||||||||
| 267,308 | |||||||||||
| Electronic Equipment & Instruments (0.9%) | |||||||||||
| Jabil Circuit, Inc. | 3,440 | 79,464 | |||||||||
| Trimble Navigation Ltd. (a) | 2,730 | 131,122 | |||||||||
| 210,586 | |||||||||||
| IT Services (4.3%) | |||||||||||
| Affiliated Computer Services, Inc., Class A (a) | 1,396 | 71,098 | |||||||||
| Alliance Data Systems Corp. (a) | 4,430 | 227,348 | |||||||||
| Cognizant Technology Solutions Corp., Class A (a) | 4,850 | 317,626 | |||||||||
| Fiserv, Inc. (a) | 1,930 | 84,264 | |||||||||
| Global Payments, Inc. | 3,951 | 168,076 | |||||||||
| Paychex, Inc. | 4,250 | 145,265 | |||||||||
| 1,013,677 | |||||||||||
| Semiconductors & Semiconductor Equipment (3.1%) | |||||||||||
| Kla-Tencor Corp. | 2,720 | 114,757 | |||||||||
| Lam Research Corp. (a) | 1,660 | 69,039 | |||||||||
| Marvell Technology Group Ltd. (a) | 11,020 | 204,421 | |||||||||
| MEMC Electronic Materials, Inc. (a) | 2,690 | 81,830 | |||||||||
| Micron Technology, Inc. (a) | 5,200 | 81,068 | |||||||||
| NVIDIA Corp. (a) | 5,500 | 121,715 | |||||||||
| SiRF Technology Holdings, Inc. (a) | 2,710 | 51,761 | |||||||||
| 724,591 | |||||||||||
| Software (4.3%) | |||||||||||
| Amdocs Ltd. (a) | 4,050 | 146,934 | |||||||||
| Autodesk, Inc. (a) | 2,217 | 75,622 | |||||||||
| Citrix Systems, Inc. (a) | 6,150 | 195,386 | |||||||||
| Electronic Arts, Inc. (a) | 2,680 | 126,255 | |||||||||
| Hyperion Solutions Corp. (a) | 4,237 | 132,025 | |||||||||
| Intuit, Inc. (a) | 2,422 | 74,767 | |||||||||
| Mercury Interactive Corp. (a) | 3,045 | 152,859 | |||||||||
| NAVTEQ Corp. (a) | 4,040 | 113,847 | |||||||||
| 1,017,695 | |||||||||||
| Materials (4.1%) | |||||||||||
| Chemicals (1.5%) | |||||||||||
| Ecolab, Inc. | 2,650 | 114,135 | |||||||||
| Potash Corp. of Saskatchewan, Inc. | 2,590 | 244,755 | |||||||||
| 358,890 | |||||||||||
See Accompanying Notes to Financial Statements.
85
CMG MID CAP GROWTH FUND
A Portfolio of Columbia Funds Institutional Trust
SCHEDULE OF INVESTMENTS
| Shares | Value | ||||||||||
| Common Stocks (continued) | |||||||||||
| Construction Materials (0.8%) | |||||||||||
| Cemex SA de CV, ADR | 3,120 | $ | 88,358 | ||||||||
| Martin Marietta Materials, Inc. | 1,270 | 102,261 | |||||||||
| 190,619 | |||||||||||
| Metals & Mining (1.8%) | |||||||||||
| Allegheny Technologies, Inc. | 1,050 | 67,085 | |||||||||
| Freeport-McMoRan Copper & Gold, Inc., Class B | 2,350 | 128,216 | |||||||||
| Phelps Dodge Corp. | 1,560 | 136,250 | |||||||||
| Zinifex Ltd. | 10,690 | 86,423 | |||||||||
| 417,974 | |||||||||||
| Telecommunication Services (3.7%) | |||||||||||
| Wireless Telecommunication Services (3.7%) | |||||||||||
| American Tower Corp., Class A (a) | 10,436 | 352,737 | |||||||||
| Crown Castle International Corp. (a) | 6,620 | 233,223 | |||||||||
| Millicom International Cellular SA (a) | 2,250 | 78,727 | |||||||||
| NII Holdings, Inc. (a) | 3,890 | 205,314 | |||||||||
| 870,001 | |||||||||||
| Utilities (1.8%) | |||||||||||
| Gas Utilities (0.6%) | |||||||||||
| Questar Corp. | 1,660 | 147,076 | |||||||||
| Independent Power Producers & Energy Traders (1.2%) | |||||||||||
| AES Corp. (a) | 14,080 | 279,629 | |||||||||
| Total Common Stocks (Cost of $17,972,668) | 21,644,882 | ||||||||||
| Par | |||||||||||
| Short-Term Obligation (8.8%) | |||||||||||
| Repurchase agreement with State Street Bank & Trust Co., dated 07/31/06, due 08/01/06 at 5.160%, collateralized by a U.S. Treasury Note maturing 02/28/11, market value of $2,122,650 (repurchase proceeds $2,081,298) | $ | 2,081,000 | 2,081,000 | ||||||||
| Total Short-Term Obligation (Cost of $2,081,000) | 2,081,000 | ||||||||||
| Total Investments (100.4%) (Cost of $20,053,668) (b) | 23,725,882 | ||||||||||
| Other Assets & Liabilities, Net (-0.4%) | (90,192 | ) | |||||||||
| Net Assets (100.0%) | $ | 23,635,690 | |||||||||
See Accompanying Notes to Financial Statements.
86
CMG MID CAP GROWTH FUND
A Portfolio of Columbia Funds Institutional Trust
SCHEDULE OF INVESTMENTS
Notes to Schedule of Investments:
(a) Non-income producing security.
(b) Cost for federal income tax purposes is $20,197,226.
At July 31, 2006, the Fund held investments in the following sectors:
| Sector (Unaudited) | % of Net Assets | ||||||
| Health Care | 17.8 | % | |||||
| Information Technology | 15.7 | ||||||
| Consumer Discretionary | 14.8 | ||||||
| Industrials | 12.1 | ||||||
| Energy | 8.0 | ||||||
| Financials | 7.5 | ||||||
| Consumer Staples | 6.1 | ||||||
| Materials | 4.1 | ||||||
| Telecommunication Services | 3.7 | ||||||
| Utilities | 1.8 | ||||||
| Short-Term Obligation | 8.8 | ||||||
| Other Assets & Liabilities, Net | (0.4 | ) | |||||
| 100.0 | % | ||||||
| Acronym | Name | ||||||
| ADR | American Depositary Receipt | ||||||
| REIT | Real Estate Investment Trust | ||||||
See Accompanying Notes to Financial Statements.
87
CMG MID CAP VALUE FUND
A Portfolio of Columbia Funds Institutional Trust
SCHEDULE OF INVESTMENTS
July 31, 2006
| Shares | Value | ||||||||||
| Common Stocks (98.7%) | |||||||||||
| Consumer Discretionary (7.8%) | |||||||||||
| Auto Components (1.2%) | |||||||||||
| BorgWarner, Inc. | 1,350 | $ | 81,000 | ||||||||
| Johnson Controls, Inc. | 1,650 | 126,654 | |||||||||
| 207,654 | |||||||||||
| Hotels, Restaurants & Leisure (1.6%) | |||||||||||
| Burger King Holdings, Inc. (a) | 2,132 | 32,513 | |||||||||
| Harrah's Entertainment, Inc. | 1,300 | 78,143 | |||||||||
| Starwood Hotels & Resorts Worldwide, Inc. | 3,525 | 185,345 | |||||||||
| 296,001 | |||||||||||
| Media (1.0%) | |||||||||||
| Dow Jones & Co., Inc. | 4,925 | 172,572 | |||||||||
| Multi-Line Retail (1.6%) | |||||||||||
| Federated Department Stores, Inc. | 3,916 | 137,491 | |||||||||
| J.C. Penney Co., Inc. | 2,275 | 143,234 | |||||||||
| 280,725 | |||||||||||
| Specialty Retail (2.4%) | |||||||||||
| Office Depot, Inc. (a) | 5,350 | 192,867 | |||||||||
| TJX Companies., Inc. | 9,700 | 236,389 | |||||||||
| 429,256 | |||||||||||
| Consumer Staples (8.2%) | |||||||||||
| Beverages (2.1%) | |||||||||||
| Coca-Cola Enterprises, Inc. | 4,200 | 90,132 | |||||||||
| Fomento Economico Mexicano SA de CV, ADR | 1,525 | 133,895 | |||||||||
| Pepsi Bottling Group, Inc. | 4,500 | 149,625 | |||||||||
| 373,652 | |||||||||||
| Food & Staples Retailing (2.2%) | |||||||||||
| Kroger Co. | 11,250 | 257,963 | |||||||||
| SUPERVALU, Inc. | 4,713 | 127,769 | |||||||||
| 385,732 | |||||||||||
| Food Products (2.0%) | |||||||||||
| Dean Foods Co. (a) | 6,500 | 243,945 | |||||||||
| Tyson Foods, Inc., Class A | 8,350 | 118,152 | |||||||||
| 362,097 | |||||||||||
| Household Products (1.3%) | |||||||||||
| Clorox Co. | 3,750 | 224,775 | |||||||||
| Personal Products (0.6%) | |||||||||||
| Estee Lauder Companies, Inc., Class A | 2,800 | 104,496 | |||||||||
| Energy (6.1%) | |||||||||||
| Energy Equipment & Services (1.8%) | |||||||||||
| National-Oilwell Varco, Inc. (a) | 1,425 | 95,532 | |||||||||
| Technip SA, ADR | 1,825 | 98,605 | |||||||||
| Tidewater, Inc. | 2,500 | 119,275 | |||||||||
| 313,412 | |||||||||||
See Accompanying Notes to Financial Statements.
88
CMG MID CAP VALUE FUND
A Portfolio of Columbia Funds Institutional Trust
SCHEDULE OF INVESTMENTS
| Shares | Value | ||||||||||
| Common Stocks (continued) | |||||||||||
| Oil, Gas & Consumable Fuels (4.3%) | |||||||||||
| Hess Corp. | 3,275 | $ | 173,248 | ||||||||
| Marathon Oil Corp. | 639 | 57,919 | |||||||||
| Newfield Exploration Co. (a) | 2,600 | 120,588 | |||||||||
| Tesoro Corp. | 1,000 | 74,800 | |||||||||
| Williams Companies, Inc. | 8,300 | 201,275 | |||||||||
| XTO Energy, Inc. | 2,866 | 134,673 | |||||||||
| 762,503 | |||||||||||
| Financials (30.5%) | |||||||||||
| Capital Markets (0.8%) | |||||||||||
| Nuveen Investments, Class A | 3,150 | 149,594 | |||||||||
| Commercial Banks (11.5%) | |||||||||||
| Bank of Hawaii Corp. | 3,900 | 193,206 | |||||||||
| City National Corp. | 3,200 | 213,472 | |||||||||
| Comerica, Inc. | 4,275 | 250,301 | |||||||||
| Cullen/Frost Bankers, Inc. | 3,325 | 195,244 | |||||||||
| Marshall & Ilsley Corp. | 5,125 | 240,721 | |||||||||
| Mercantile Bankshares Corp. | 3,750 | 133,350 | |||||||||
| SVB Financial Group (a) | 3,850 | 172,557 | |||||||||
| TCF Financial Corp. | 4,900 | 131,859 | |||||||||
| UnionBanCal Corp. | 3,150 | 194,638 | |||||||||
| Whitney Holding Corp. | 3,375 | 121,804 | |||||||||
| Zions Bancorporation | 2,275 | 186,869 | |||||||||
| 2,034,021 | |||||||||||
| Diversified Financial Services (0.5%) | |||||||||||
| CIT Group, Inc. | 1,975 | 90,672 | |||||||||
| Insurance (7.8%) | |||||||||||
| ACE Ltd. | 1,800 | 92,754 | |||||||||
| Ambac Financial Group, Inc. | 3,400 | 282,574 | |||||||||
| Axis Capital Holdings Ltd. | 3,100 | 91,636 | |||||||||
| Conseco, Inc. (a) | 7,600 | 173,280 | |||||||||
| Genworth Financial, Inc., Class A | 5,100 | 174,930 | |||||||||
| Lincoln National Corp. | 2,550 | 144,534 | |||||||||
| Loews Corp. | 4,275 | 158,432 | |||||||||
| Old Republic International Corp. | 6,300 | 134,001 | |||||||||
| Platinum Underwriters Holdings Ltd. | 4,800 | 135,792 | |||||||||
| 1,387,933 | |||||||||||
| Real Estate Investment Trusts (REITs) (7.1%) | |||||||||||
| Archstone-Smith Trust, REIT | 2,975 | 156,098 | |||||||||
| Boston Properties, Inc., REIT | 2,150 | 211,130 | |||||||||
| Equity Office Properties Trust, REIT | 6,200 | 235,042 | |||||||||
| Equity Residential Property Trust, REIT | 2,900 | 134,879 | |||||||||
| General Growth Properties, Inc., REIT | 2,975 | 135,779 | |||||||||
| Host Hotels & Resorts, Inc., REIT | 6,560 | 139,203 | |||||||||
| ProLogis Trust, REIT | 4,400 | 243,540 | |||||||||
| 1,255,671 | |||||||||||
See Accompanying Notes to Financial Statements.
89
CMG MID CAP VALUE FUND
A Portfolio of Columbia Funds Institutional Trust
SCHEDULE OF INVESTMENTS
| Shares | Value | ||||||||||
| Common Stocks (continued) | |||||||||||
| Thrifts & Mortgage Finance (2.8%) | |||||||||||
| Golden West Financial Corp. | 1,875 | $ | 138,113 | ||||||||
| PMI Group, Inc. | 4,125 | 175,147 | |||||||||
| Sovereign Bancorp, Inc. | 9,293 | 191,797 | |||||||||
| 505,057 | |||||||||||
| Health Care (4.9%) | |||||||||||
| Health Care Equipment & Supplies (0.9%) | |||||||||||
| Hospira, Inc. (a) | 3,675 | 160,561 | |||||||||
| Health Care Providers & Services (1.9%) | |||||||||||
| CIGNA Corp. | 1,350 | 123,187 | |||||||||
| Community Health Systems, Inc. (a) | 2,475 | 89,744 | |||||||||
| Universal Health Services, Inc., Class B | 2,200 | 123,200 | |||||||||
| 336,131 | |||||||||||
| Life Sciences Tools & Services (1.2%) | |||||||||||
| Millipore Corp. (a) | 1,950 | 122,167 | |||||||||
| Varian, Inc. (a) | 2,200 | 98,956 | |||||||||
| 221,123 | |||||||||||
| Pharmaceuticals (0.9%) | |||||||||||
| Shire PLC, ADR | 3,100 | 150,381 | |||||||||
| Industrials (10.9%) | |||||||||||
| Aerospace & Defense (0.7%) | |||||||||||
| L-3 Communications Holdings, Inc. | 1,800 | 132,570 | |||||||||
| Construction & Engineering (1.1%) | |||||||||||
| Fluor Corp. | 1,025 | 90,026 | |||||||||
| Jacobs Engineering Group, Inc. (a) | 1,175 | 97,513 | |||||||||
| 187,539 | |||||||||||
| Electrical Equipment (0.8%) | |||||||||||
| Cooper Industries Ltd., Class A | 1,750 | 150,780 | |||||||||
| Industrial Conglomerates (1.6%) | |||||||||||
| McDermott International, Inc. (a) | 2,250 | 102,465 | |||||||||
| Textron, Inc. | 2,050 | 184,315 | |||||||||
| 286,780 | |||||||||||
| Machinery (4.6%) | |||||||||||
| Barnes Group, Inc. | 7,318 | 124,479 | |||||||||
| Dover Corp. | 2,950 | 139,063 | |||||||||
| Eaton Corp. | 1,350 | 86,535 | |||||||||
| Harsco Corp. | 1,425 | 114,869 | |||||||||
| JLG Industries, Inc. | 4,500 | 81,450 | |||||||||
| Kennametal, Inc. | 2,475 | 131,794 | |||||||||
| Parker Hannifin Corp. | 1,800 | 130,032 | |||||||||
| 808,222 | |||||||||||
See Accompanying Notes to Financial Statements.
90
CMG MID CAP VALUE FUND
A Portfolio of Columbia Funds Institutional Trust
SCHEDULE OF INVESTMENTS
| Shares | Value | ||||||||||
| Common Stocks (continued) | |||||||||||
| Marine (0.7%) | |||||||||||
| Alexander & Baldwin, Inc. | 3,125 | $ | 125,313 | ||||||||
| Road & Rail (1.4%) | |||||||||||
| Canadian Pacific Railway Ltd. | 2,900 | 138,823 | |||||||||
| Norfolk Southern Corp. | 2,650 | 115,063 | |||||||||
| 253,886 | |||||||||||
| Information Technology (8.1%) | |||||||||||
| Communications Equipment (0.4%) | |||||||||||
| CommScope, Inc. (a) | 2,500 | 78,075 | |||||||||
| Electronic Equipment & Instruments (3.2%) | |||||||||||
| Agilent Technologies, Inc. (a) | 6,000 | 170,640 | |||||||||
| Arrow Electronics, Inc. (a) | 5,525 | 156,137 | |||||||||
| Mettler-Toledo International, Inc. (a) | 1,500 | 92,295 | |||||||||
| Tektronix, Inc. | 5,100 | 139,077 | |||||||||
| 558,149 | |||||||||||
| IT Services (0.4%) | |||||||||||
| Mastercard, Inc., Class A (a) | 1,604 | 73,575 | |||||||||
| Semiconductors & Semiconductor Equipment (2.8%) | |||||||||||
| ATI Technologies, Inc. (a) | 3,900 | 78,507 | |||||||||
| Fairchild Semiconductor International, Inc. (a) | 4,975 | 81,391 | |||||||||
| Freescale Semiconductor, Inc., Class A (a) | 3,700 | 105,931 | |||||||||
| KLA-Tencor Corp. | 2,150 | 90,708 | |||||||||
| Lam Research Corp. (a) | 1,225 | 50,948 | |||||||||
| Novellus Systems, Inc. (a) | 1,850 | 46,824 | |||||||||
| NVIDIA Corp. (a) | 2,200 | 48,686 | |||||||||
| 502,995 | |||||||||||
| Software (1.3%) | |||||||||||
| Activision, Inc. (a) | 4,733 | 56,559 | |||||||||
| Cadence Design Systems, Inc. (a) | 4,275 | 69,212 | |||||||||
| Electronic Arts, Inc. (a) | 1,325 | 62,421 | |||||||||
| Synopsys, Inc. (a) | 2,150 | 38,485 | |||||||||
| 226,677 | |||||||||||
| Materials (8.7%) | |||||||||||
| Chemicals (4.1%) | |||||||||||
| Air Products & Chemicals, Inc. | 3,150 | 201,379 | |||||||||
| Ashland, Inc. | 1,625 | 108,079 | |||||||||
| Cytec Industries, Inc. | 1,650 | 88,126 | |||||||||
| Nalco Holding Co. (a) | 5,275 | 88,884 | |||||||||
| PPG Industries, Inc. | 1,800 | 110,772 | |||||||||
| Rohm and Haas Co. | 2,800 | 129,136 | |||||||||
| 726,376 | |||||||||||
See Accompanying Notes to Financial Statements.
91
CMG MID CAP VALUE FUND
A Portfolio of Columbia Funds Institutional Trust
SCHEDULE OF INVESTMENTS
| Shares | Value | ||||||||||
| Common Stocks (continued) | |||||||||||
| Construction Materials (1.5%) | |||||||||||
| Cemex SA de CV, ADR | 3,084 | $ | 87,339 | ||||||||
| Martin Marietta Materials, Inc. | 1,225 | 98,637 | |||||||||
| Vulcan Materials Co. | 1,400 | 93,758 | |||||||||
| 279,734 | |||||||||||
| Containers & Packaging (1.6%) | |||||||||||
| Crown Holdings, Inc. (a) | 8,900 | 148,274 | |||||||||
| Packaging Corp. of America | 5,800 | 132,994 | |||||||||
| 281,268 | |||||||||||
| Metals & Mining (1.5%) | |||||||||||
| Allegheny Technologies, Inc. | 1,500 | 95,835 | |||||||||
| Freeport-McMoRan Copper & Gold, Inc., Class B | 1,700 | 92,752 | |||||||||
| Nucor Corp. | 1,400 | 74,438 | |||||||||
| 263,025 | |||||||||||
| Utilities (13.5%) | |||||||||||
| Electric Utilities (6.9%) | |||||||||||
| Edison International | 7,575 | 313,453 | |||||||||
| Entergy Corp. | 4,400 | 339,240 | |||||||||
| FPL Group, Inc. | 3,775 | 162,854 | |||||||||
| Hawaiian Electric Industries, Inc. | 3,575 | 102,460 | |||||||||
| PPL Corp. | 9,125 | 310,432 | |||||||||
| 1,228,439 | |||||||||||
| Gas Utilities (0.6%) | |||||||||||
| AGL Resources, Inc. | 2,775 | 108,281 | |||||||||
| Independent Power Producers & Energy Traders (0.7%) | |||||||||||
| AES Corp. (a) | 6,450 | 128,097 | |||||||||
| Multi-Utilities (5.3%) | |||||||||||
| Energy East Corp. | 6,450 | 156,928 | |||||||||
| PG&E Corp. | 9,625 | 401,170 | |||||||||
| Sempra Energy | 3,075 | 148,400 | |||||||||
| Wisconsin Energy Corp. | 5,300 | 223,660 | |||||||||
| 930,158 | |||||||||||
| Total Common Stocks (Cost of $14,985,358) | 17,533,958 | ||||||||||
See Accompanying Notes to Financial Statements.
92
CMG MID CAP VALUE FUND
A Portfolio of Columbia Funds Institutional Trust
SCHEDULE OF INVESTMENTS
| Par | Value | ||||||||||
| Short-Term Obligation (1.1%) | |||||||||||
| Repurchase agreement with State Street Bank & Trust Co., dated 07/31/06, due 08/01/06 at 5.160%, collateralized by a U.S. Treasury Bond maturing 02/15/20, market value of $197,437 (repurchase proceeds $191,027) | $ | 191,000 | $ | 191,000 | |||||||
| Total Short-Term Obligation (Cost of $191,000) | 191,000 | ||||||||||
| Total Investments (99.8%) (Cost of $15,176,358) (b) | 17,724,958 | ||||||||||
| Other Assets & Liabilities, Net (0.2%) | 36,656 | ||||||||||
| Net Assets (100.0%) | $ | 17,761,614 | |||||||||
Notes to Schedule of Investments:
(a) Non-income producing security.
(b) Cost for federal income tax purposes is $15,180,839.
At July 31, 2006, the Fund held investments in the following sectors:
| Sector (Unaudited) | % of Net Assets | ||||||
| Financials | 30.5 | % | |||||
| Utilities | 13.5 | ||||||
| Industrials | 10.9 | ||||||
| Materials | 8.7 | ||||||
| Consumer Staples | 8.2 | ||||||
| Information Technology | 8.1 | ||||||
| Consumer Discretionary | 7.8 | ||||||
| Energy | 6.1 | ||||||
| Health Care | 4.9 | ||||||
| Short-Term Obligation | 1.1 | ||||||
| Other Assets & Liabilities, Net | 0.2 | ||||||
| 100.0 | % | ||||||
| Acronym | Name | ||||||
| ADR | American Depositary Receipt | ||||||
| REIT | Real Estate Investment Trust | ||||||
See Accompanying Notes to Financial Statements.
93
CMG SMALL CAP GROWTH FUND
A Portfolio of Columbia Funds Institutional Trust
SCHEDULE OF INVESTMENTS
July 31, 2006
| Shares | Value | ||||||||||
| Common Stocks (95.0%) | |||||||||||
| Consumer Discretionary (14.3%) | |||||||||||
| Diversified Consumer Services (0.6%) | |||||||||||
| Laureate Education, Inc. (a) | 5,170 | $ | 236,011 | ||||||||
| Hotels, Restaurants & Leisure (4.8%) | |||||||||||
| Pinnacle Entertainment, Inc. (a) | 11,660 | 319,834 | |||||||||
| RARE Hospitality International, Inc. (a) | 6,970 | 183,311 | |||||||||
| Red Robin Gourmet Burgers, Inc. (a) | 6,260 | 243,201 | |||||||||
| Ruby Tuesday, Inc. | 5,340 | 117,266 | |||||||||
| Scientific Games Corp., Class A (a) | 13,340 | 453,160 | |||||||||
| Shuffle Master, Inc. (a) | 9,910 | 288,877 | |||||||||
| Trump Entertainment Resorts, Inc. (a) | 18,740 | 341,630 | |||||||||
| 1,947,279 | |||||||||||
| Internet & Catalog Retail (1.0%) | |||||||||||
| Nutri/System, Inc. (a) | 7,900 | 418,068 | |||||||||
| Leisure Equipment & Products (1.0%) | |||||||||||
| Pool Corp. | 9,800 | 381,514 | |||||||||
| Specialty Retail (4.4%) | |||||||||||
| Aaron Rents, Inc. | 6,722 | 162,269 | |||||||||
| Children's Place Retail Stores, Inc. (a) | 4,580 | 255,656 | |||||||||
| Christopher & Banks Corp. | 12,940 | 364,779 | |||||||||
| GameStop Corp., Class A (a) | 8,743 | 363,796 | |||||||||
| Gymboree Corp. (a) | 5,003 | 167,700 | |||||||||
| Hibbett Sporting Goods, Inc. (a) | 8,450 | 166,972 | |||||||||
| Tractor Supply Co. (a) | 2,980 | 136,305 | |||||||||
| Tween Brands, Inc. (a) | 4,110 | 152,974 | |||||||||
| 1,770,451 | |||||||||||
| Textiles, Apparel & Luxury Goods (2.5%) | |||||||||||
| Carter's, Inc. (a) | 15,270 | 333,039 | |||||||||
| Phillips-Van Heusen Corp. | 9,090 | 322,968 | |||||||||
| Quiksilver, Inc. (a) | 17,920 | 232,064 | |||||||||
| Timberland Co., Class A (a) | 4,590 | 118,192 | |||||||||
| 1,006,263 | |||||||||||
| Consumer Staples (2.4%) | |||||||||||
| Beverages (0.5%) | |||||||||||
| Hansen Natural Corp. (a) | 4,640 | 213,394 | |||||||||
| Household Products (0.8%) | |||||||||||
| Central Garden & Pet Co. (a) | 7,830 | 309,598 | |||||||||
| Personal Products (1.1%) | |||||||||||
| USANA Health Sciences, Inc. (a) | 9,710 | 430,638 | |||||||||
See Accompanying Notes to Financial Statements.
94
CMG SMALL CAP GROWTH FUND
A Portfolio of Columbia Funds Institutional Trust
SCHEDULE OF INVESTMENTS
| Shares | Value | ||||||||||
| Common Stocks (continued) | |||||||||||
| Energy (8.0%) | |||||||||||
| Energy Equipment & Services (4.8%) | |||||||||||
| Atwood Oceanics, Inc. (a) | 10,469 | $ | 491,310 | ||||||||
| Core Laboratories NV (a) | 5,660 | 413,180 | |||||||||
| Oil States International, Inc. (a) | 13,200 | 424,512 | |||||||||
| Tetra Technologies, Inc. (a) | 12,586 | 360,085 | |||||||||
| Veritas DGC, Inc. (a) | 4,210 | 241,107 | |||||||||
| 1,930,194 | |||||||||||
| Oil, Gas & Consumable Fuels (3.2%) | |||||||||||
| Carrizo Oil & Gas, Inc. (a) | 8,790 | 260,272 | |||||||||
| Foundation Coal Holdings, Inc. | 11,520 | 439,373 | |||||||||
| Frontier Oil Corp. | 7,740 | 272,835 | |||||||||
| Holly Corp. | 6,410 | 324,346 | |||||||||
| 1,296,826 | |||||||||||
| Financials (8.8%) | |||||||||||
| Capital Markets (2.4%) | |||||||||||
| Affiliated Managers Group, Inc. (a) | 6,840 | 626,202 | |||||||||
| Greenhill & Co., Inc. | 5,660 | 328,053 | |||||||||
| 954,255 | |||||||||||
| Commercial Banks (2.2%) | |||||||||||
| Signature Bank (a) | 9,630 | 309,412 | |||||||||
| Sterling Financial Corp. | 7,430 | 237,537 | |||||||||
| UCBH Holdings, Inc. | 19,460 | 324,593 | |||||||||
| 871,542 | |||||||||||
| Diversified Financial Services (0.9%) | |||||||||||
| International Securities Exchange, Inc. | 4,300 | 174,967 | |||||||||
| Nasdaq Stock Market, Inc. (a) | 7,490 | 206,200 | |||||||||
| 381,167 | |||||||||||
| Insurance (2.0%) | |||||||||||
| Hanover Insurance Group, Inc. | 6,330 | 292,952 | |||||||||
| ProAssurance Corp. (a) | 10,280 | 511,019 | |||||||||
| 803,971 | |||||||||||
| Real Estate Investment Trusts (REITs) (1.3%) | |||||||||||
| Alexandria Real Estate Equities, Inc., REIT | 2,910 | 274,762 | |||||||||
| Washington Real Estate Investment Trust, REIT | 7,050 | 261,414 | |||||||||
| 536,176 | |||||||||||
| Health Care (19.1%) | |||||||||||
| Biotechnology (2.5%) | |||||||||||
| Alkermes, Inc. (a) | 6,870 | 117,889 | |||||||||
| Amylin Pharmaceuticals, Inc. (a) | 2,480 | 121,024 | |||||||||
| Digene Corp. (a) | 11,230 | 474,018 | |||||||||
| ICOS Corp. (a) | 5,550 | 126,762 | |||||||||
| United Therapeutics Corp. (a) | 2,680 | 158,951 | |||||||||
| 998,644 | |||||||||||
See Accompanying Notes to Financial Statements.
95
CMG SMALL CAP GROWTH FUND
A Portfolio of Columbia Funds Institutional Trust
SCHEDULE OF INVESTMENTS
| Shares | Value | ||||||||||
| Common Stocks (continued) | |||||||||||
| Health Care Equipment & Supplies (6.7%) | |||||||||||
| ArthroCare Corp. (a) | 5,960 | $ | 262,478 | ||||||||
| Bespak PLC | 27,050 | 325,409 | |||||||||
| Foxhollow Technologies, Inc. (a) | 6,350 | 165,037 | |||||||||
| Haemonetics Corp. (a) | 6,904 | 302,879 | |||||||||
| Hologic, Inc. (a) | 5,053 | 226,930 | |||||||||
| Kyphon, Inc. (a) | 7,512 | 255,859 | |||||||||
| NuVasive, Inc. (a) | 9,100 | 159,159 | |||||||||
| OraSure Technologies, Inc. (a) | 31,760 | 296,638 | |||||||||
| ResMed, Inc. (a) | 14,762 | 685,105 | |||||||||
| 2,679,494 | |||||||||||
| Health Care Providers & Services (4.8%) | |||||||||||
| HealthExtras, Inc. (a) | 24,975 | 648,351 | |||||||||
| Healthways, Inc. (a) | 3,720 | 199,838 | |||||||||
| Pediatrix Medical Group, Inc. (a) | 4,760 | 201,824 | |||||||||
| Psychiatric Solutions, Inc. (a) | 9,100 | 286,559 | |||||||||
| United Surgical Partners International, Inc. (a) | 11,335 | 279,975 | |||||||||
| WellCare Health Plans, Inc. (a) | 6,281 | 308,146 | |||||||||
| 1,924,693 | |||||||||||
| Health Care Technology (1.4%) | |||||||||||
| Allscripts Healthcare Solutions, Inc. (a) | 29,122 | 555,065 | |||||||||
| Life Sciences Tools & Services (2.6%) | |||||||||||
| ICON PLC, ADR (a) | 11,655 | 767,365 | |||||||||
| Nektar Therapeutics (a) | 17,800 | 290,140 | |||||||||
| 1,057,505 | |||||||||||
| Pharmaceuticals (1.1%) | |||||||||||
| BioMimetic Therapeutics, Inc. (a) | 11,623 | 86,940 | |||||||||
| Medicis Pharmaceutical Corp., Class A | 10,480 | 288,829 | |||||||||
| Salix Pharmaceuticals Ltd. (a) | 8,045 | 82,059 | |||||||||
| 457,828 | |||||||||||
| Industrials (20.0%) | |||||||||||
| Aerospace & Defense (4.4%) | |||||||||||
| Armor Holdings, Inc. (a) | 4,592 | 237,223 | |||||||||
| BE Aerospace, Inc. (a) | 25,547 | 632,288 | |||||||||
| Ceradyne, Inc. (a) | 7,732 | 378,018 | |||||||||
| DynCorp International, Inc., Class A (a) | 17,546 | 158,089 | |||||||||
| Hexcel Corp. (a) | 25,450 | 365,717 | |||||||||
| 1,771,335 | |||||||||||
| Air Freight & Logistics (1.4%) | |||||||||||
| Forward Air Corp. | 12,437 | 399,103 | |||||||||
| UTI Worldwide, Inc. | 7,220 | 168,226 | |||||||||
| 567,329 | |||||||||||
| Airlines (0.7%) | |||||||||||
| Alaska Air Group, Inc. (a) | 7,940 | 294,812 | |||||||||
See Accompanying Notes to Financial Statements.
96
CMG SMALL CAP GROWTH FUND
A Portfolio of Columbia Funds Institutional Trust
SCHEDULE OF INVESTMENTS
| Shares | Value | ||||||||||
| Common Stocks (continued) | |||||||||||
| Building Products (0.5%) | |||||||||||
| ElkCorp. | 7,540 | $ | 188,048 | ||||||||
| Commercial Services & Supplies (5.5%) | |||||||||||
| Administaff, Inc. | 4,670 | 147,619 | |||||||||
| Corporate Executive Board Co. | 2,573 | 241,862 | |||||||||
| Global Cash Access, Inc. (a) | 13,324 | 199,593 | |||||||||
| Huron Consulting Group, Inc. (a) | 14,235 | 493,670 | |||||||||
| Kenexa Corp. (a) | 20,778 | 491,400 | |||||||||
| Resources Connection, Inc. (a) | 17,270 | 408,781 | |||||||||
| Waste Connections, Inc. (a) | 5,470 | 204,468 | |||||||||
| 2,187,393 | |||||||||||
| Construction & Engineering (0.4%) | |||||||||||
| Perini Corp. (a) | 7,848 | 177,522 | |||||||||
| Electrical Equipment (1.1%) | |||||||||||
| General Cable Corp. (a) | 12,700 | 453,390 | |||||||||
| Machinery (4.5%) | |||||||||||
| Basin Water, Inc. (a) | 10,020 | 88,176 | |||||||||
| Bucyrus International, Inc., Class A | 4,800 | 233,808 | |||||||||
| ESCO Technologies, Inc. (a) | 8,043 | 423,786 | |||||||||
| JLG Industries, Inc. | 12,660 | 229,146 | |||||||||
| RBC Bearings, Inc. (a) | 7,651 | 170,770 | |||||||||
| Terex Corp. (a) | 5,470 | 245,275 | |||||||||
| Wabtec Corp. | 15,520 | 412,211 | |||||||||
| 1,803,172 | |||||||||||
| Marine (0.5%) | |||||||||||
| American Commercial Lines, Inc. (a) | 3,700 | 203,315 | |||||||||
| Road & Rail (1.0%) | |||||||||||
| Landstar System, Inc. | 9,460 | 403,847 | |||||||||
| Information Technology (19.4%) | |||||||||||
| Communications Equipment (2.1%) | |||||||||||
| CSR PLC (a) | 10,468 | 221,941 | |||||||||
| F5 Networks, Inc. (a) | 4,780 | 221,505 | |||||||||
| Ixia (a) | 44,867 | 415,917 | |||||||||
| 859,363 | |||||||||||
| Computers & Peripherals (0.6%) | |||||||||||
| Presstek, Inc. (a) | 28,943 | 232,412 | |||||||||
| Electronic Equipment & Instruments (0.8%) | |||||||||||
| FLIR Systems, Inc. (a) | 6,690 | 160,627 | |||||||||
| Sunpower Corp., Class A (a) | 4,970 | 158,692 | |||||||||
| 319,319 | |||||||||||
See Accompanying Notes to Financial Statements.
97
CMG SMALL CAP GROWTH FUND
A Portfolio of Columbia Funds Institutional Trust
SCHEDULE OF INVESTMENTS
| Shares | Value | ||||||||||
| Common Stocks (continued) | |||||||||||
| Internet Software & Services (2.2%) | |||||||||||
| aQuantive, Inc. (a) | 13,350 | $ | 273,675 | ||||||||
| Ariba, Inc. (a) | 11,920 | 92,976 | |||||||||
| Equinix, Inc. (a) | 5,240 | 274,471 | |||||||||
| Liquidity Services, Inc. (a) | 17,965 | 228,515 | |||||||||
| 869,637 | |||||||||||
| IT Services (3.1%) | |||||||||||
| Acxiom Corp. | 10,260 | 251,165 | |||||||||
| CACI International, Inc., Class A (a) | 2,989 | 168,430 | |||||||||
| Euronet Worldwide, Inc. (a) | 14,484 | 368,038 | |||||||||
| Global Payments, Inc. | 5,028 | 213,891 | |||||||||
| Heartland Payment Systems, Inc. (a) | 9,640 | 251,122 | |||||||||
| 1,252,646 | |||||||||||
| Semiconductors & Semiconductor Equipment (5.0%) | |||||||||||
| Atheros Communications, Inc. (a) | 20,483 | 338,379 | |||||||||
| FormFactor, Inc. (a) | 5,530 | 237,071 | |||||||||
| Hittite Microwave Corp. (a) | 5,880 | 239,610 | |||||||||
| Netlogic Microsystems, Inc. (a) | 12,470 | 305,515 | |||||||||
| SiRf Technology Holdings, Inc. (a) | 20,543 | 392,371 | |||||||||
| Techwell, Inc. (a) | 2,925 | 30,713 | |||||||||
| Tessera Technologies, Inc. (a) | 3,029 | 95,323 | |||||||||
| Varian Semiconductor Equipment Associates, Inc. (a) | 5,700 | 180,690 | |||||||||
| Zoran Corp. (a) | 10,680 | 171,414 | |||||||||
| 1,991,086 | |||||||||||
| Software (5.6%) | |||||||||||
| Embarcadero Technologies, Inc. (a) | 8,994 | 52,885 | |||||||||
| Hyperion Solutions Corp. (a) | 8,903 | 277,417 | |||||||||
| Informatica Corp. (a) | 19,950 | 278,702 | |||||||||
| Micros Systems, Inc. (a) | 5,479 | 219,160 | |||||||||
| Nuance Communications, Inc. (a) | 15,582 | 144,289 | |||||||||
| Quest Software, Inc. (a) | 16,430 | 224,598 | |||||||||
| Transaction Systems Architects, Inc. (a) | 12,805 | 474,041 | |||||||||
| Ultimate Software Group, Inc. (a) | 18,470 | 383,068 | |||||||||
| Verint Systems, Inc. (a) | 7,570 | 207,040 | |||||||||
| 2,261,200 | |||||||||||
| Materials (1.2%) | |||||||||||
| Metals & Mining (1.2%) | |||||||||||
| Century Aluminum Co. (a) | 4,743 | 146,416 | |||||||||
| Cleveland-Cliffs, Inc. | 5,040 | 182,196 | |||||||||
| Zinifex Ltd. | 19,510 | 157,728 | |||||||||
| 486,340 | |||||||||||
| Telecommunication Services (1.8%) | |||||||||||
| Wireless Telecommunication Services (1.8%) | |||||||||||
| Dobson Communications Corp., Class A (a) | 21,940 | 147,217 | |||||||||
| Millicom International Cellular SA (a) | 4,090 | 143,109 | |||||||||
| SBA Communications Corp., Class A (a) | 17,270 | 412,408 | |||||||||
| 702,734 | |||||||||||
| Total Common Stocks (Cost of $34,529,009) | 38,185,476 | ||||||||||
See Accompanying Notes to Financial Statements.
98
CMG SMALL CAP GROWTH FUND
A Portfolio of Columbia Funds Institutional Trust
SCHEDULE OF INVESTMENTS
| Shares | Value | ||||||||||
| Investment Companies (1.2%) | |||||||||||
| Biotech HOLDRs Trust | 1,300 | $ | 231,595 | ||||||||
| iShares Nasdaq Biotechnology Index Fund (a) | 3,310 | 236,632 | |||||||||
| Total Investment Companies (Cost of $473,315) | 468,227 | ||||||||||
| Par | |||||||||||
| Short-Term Obligation (3.8%) | |||||||||||
| Repurchase agreement with State Street Bank & Trust Co., dated 07/31/06, due 08/01/06 at 5.160%, collateralized by a U.S. Treasury Note maturing 05/15/09, market value of $1,576,738 (repurchase proceeds $1,541,221) | $ | 1,541,000 | 1,541,000 | ||||||||
| Total Short-Term Obligation (Cost of $1,541,000) | 1,541,000 | ||||||||||
| Total Investments (100.0%) (Cost of $36,543,324) (b) | 40,194,703 | ||||||||||
| Other Assets & Liabilities, Net (-0.0%) | (11,511 | ) | |||||||||
| Net Assets (100.0%) | $ | 40,183,192 | |||||||||
Notes to Schedule of Investments:
(a) Non-income producing security.
(b) Cost for federal income tax purposes is $36,918,114.
See Accompanying Notes to Financial Statements.
99
CMG SMALL CAP GROWTH FUND
A Portfolio of Columbia Funds Institutional Trust
SCHEDULE OF INVESTMENTS
At July 31, 2006, the Fund held investments in the following sectors:
| Sector (Unaudited) | % of Net Assets | ||||||
| Industrials | 20.0 | % | |||||
| Information Technology | 19.4 | ||||||
| Health Care | 19.1 | ||||||
| Consumer Discretionary | 14.3 | ||||||
| Financials | 8.8 | ||||||
| Energy | 8.0 | ||||||
| Consumer Staples | 2.4 | ||||||
| Telecommunication Services | 1.8 | ||||||
| Materials | 1.2 | ||||||
| Investment Companies | 1.2 | ||||||
| Short-Term Obligation | 3.8 | ||||||
| Other Assets & Liabilities, Net | (0.0 | )* | |||||
| 100.0 | % | ||||||
* Represents less than 0.1%
| Acronym | Name | ||||||
| ADR | American Depositary Receipt | ||||||
| REIT | Real Estate Investment Trust | ||||||
See Accompanying Notes to Financial Statements.
100
CMG SMALL CAP VALUE FUND
A Portfolio of Columbia Funds Institutional Trust
SCHEDULE OF INVESTMENTS
July 31, 2006
| Shares | Value | ||||||||||
| Common Stocks (100.0%) | |||||||||||
| Consumer Discretionary (9.9%) | |||||||||||
| Auto Components (0.9%) | |||||||||||
| BorgWarner, Inc. | 3,280 | $ | 196,800 | ||||||||
| Modine Manufacturing Co. | 5,110 | 120,443 | |||||||||
| 317,243 | |||||||||||
| Distributors (0.3%) | |||||||||||
| Building Material Holding Corp. | 4,330 | 92,792 | |||||||||
| Hotels, Restaurants & Leisure (2.4%) | |||||||||||
| Bob Evans Farms, Inc. | 3,050 | 83,997 | |||||||||
| Jack in the Box, Inc. (a) | 772 | 30,448 | |||||||||
| Landry's Restaurants, Inc. | 5,470 | 154,746 | |||||||||
| Lone Star Steakhouse & Saloon, Inc. | 7,260 | 169,811 | |||||||||
| Multimedia Games, Inc. (a) | 3,498 | 34,245 | |||||||||
| Scientific Games Corp., Class A (a) | 6,070 | 206,198 | |||||||||
| Vail Resorts, Inc. (a) | 3,280 | 113,390 | |||||||||
| 792,835 | |||||||||||
| Household Durables (1.8%) | |||||||||||
| American Greetings Corp., Class A | 11,920 | 268,558 | |||||||||
| CSS Industries, Inc. | 3,380 | 96,837 | |||||||||
| Furniture Brands International, Inc. | 5,070 | 101,704 | |||||||||
| Kimball International, Inc., Class B | 7,260 | 129,010 | |||||||||
| 596,109 | |||||||||||
| Media (0.3%) | |||||||||||
| 4Kids Entertainment, Inc. (a) | 6,460 | 105,233 | |||||||||
| Specialty Retail (2.5%) | |||||||||||
| Borders Group, Inc. | 5,250 | 99,803 | |||||||||
| GameStop Corp., Class A (a) | 3,890 | 161,863 | |||||||||
| Monro Muffler, Inc. | 5,590 | 173,346 | |||||||||
| Payless Shoesource, Inc. (a) | 4,320 | 111,802 | |||||||||
| Rent-A-Center, Inc. (a) | 6,150 | 165,619 | |||||||||
| Zale Corp. (a) | 4,510 | 115,501 | |||||||||
| 827,934 | |||||||||||
| Textiles, Apparel & Luxury Goods (1.7%) | |||||||||||
| Delta Apparel, Inc. | 4,070 | 70,981 | |||||||||
| Hampshire Group Ltd. (a) | 7,550 | 124,650 | |||||||||
| Hartmarx Corp. (a) | 14,479 | 90,639 | |||||||||
| Stride Rite Corp. | 6,750 | 85,455 | |||||||||
| Wolverine World Wide, Inc. | 7,950 | 202,248 | |||||||||
| 573,973 | |||||||||||
| Consumer Staples (3.4%) | |||||||||||
| Food & Staples Retailing (1.1%) | |||||||||||
| BJ's Wholesale Club, Inc. (a) | 2,980 | 84,871 | |||||||||
| Weis Markets, Inc. | 6,630 | 262,813 | |||||||||
| 347,684 | |||||||||||
See Accompanying Notes to Financial Statements.
101
CMG SMALL CAP VALUE FUND
A Portfolio of Columbia Funds Institutional Trust
SCHEDULE OF INVESTMENTS
| Shares | Value | ||||||||||
| Common Stocks (continued) | |||||||||||
| Food Products (2.3%) | |||||||||||
| Flowers Foods, Inc. | 4,109 | $ | 117,024 | ||||||||
| J&J Snack Foods Corp. | 3,660 | 110,129 | |||||||||
| Lancaster Colony Corp. | 3,160 | 121,091 | |||||||||
| Lance, Inc. | 5,260 | 125,346 | |||||||||
| Maui Land & Pineapple Co., Inc. (a) | 2,330 | 85,861 | |||||||||
| Premium Standard Farms, Inc. | 4,893 | 82,692 | |||||||||
| Ralcorp Holdings, Inc. (a) | 3,180 | 132,542 | |||||||||
| 774,685 | |||||||||||
| Energy (5.4%) | |||||||||||
| Energy Equipment & Services (2.8%) | |||||||||||
| Complete Production Services, Inc. (a) | 2,973 | 61,244 | |||||||||
| Grey Wolf, Inc. (a) | 20,480 | 156,877 | |||||||||
| Lone Star Technologies, Inc. (a) | 1,760 | 82,896 | |||||||||
| Lufkin Industries, Inc. | 5,262 | 326,297 | |||||||||
| NS Group, Inc. (a) | 1,680 | 84,974 | |||||||||
| Superior Well Services, Inc. (a) | 1,590 | 39,702 | |||||||||
| TriCo Marine Services, Inc. (a) | 5,093 | 186,658 | |||||||||
| 938,648 | |||||||||||
| Oil, Gas & Consumable Fuels (2.6%) | |||||||||||
| Alpha Natural Resources, Inc. (a) | 4,900 | 79,233 | |||||||||
| Bois d'Arc Energy, Inc. (a) | 4,798 | 79,647 | |||||||||
| Comstock Resources, Inc. (a) | 2,110 | 62,076 | |||||||||
| Harvest Natural Resources, Inc. (a) | 9,440 | 132,066 | |||||||||
| Nordic American Tanker Shipping | 4,133 | 160,567 | |||||||||
| Peabody Energy Corp. | 2,960 | 147,704 | |||||||||
| Range Resources Corp. | 7,740 | 217,571 | |||||||||
| 878,864 | |||||||||||
| Financials (28.7%) | |||||||||||
| Capital Markets (0.7%) | |||||||||||
| Piper Jaffray Companies, Inc. (a) | 3,120 | 159,713 | |||||||||
| Thomas Weisel Partners Group, Inc. (a) | 5,536 | 83,261 | |||||||||
| 242,974 | |||||||||||
| Commercial Banks (12.0%) | |||||||||||
| BancFirst Corp. | 2,510 | 119,576 | |||||||||
| BancTrust Financial Group, Inc. | 4,792 | 131,732 | |||||||||
| Bank of Granite Corp. | 6,894 | 149,944 | |||||||||
| Bryn Mawr Bank Corp. | 5,496 | 120,912 | |||||||||
| Capitol Bancorp Ltd. | 5,956 | 237,644 | |||||||||
| Central Pacific Financial Corp. | 2,948 | 103,180 | |||||||||
| Chemical Financial Corp. | 6,215 | 190,241 | |||||||||
| Chittenden Corp. | 6,060 | 171,013 | |||||||||
| Citizens Banking Corp. | 6,680 | 169,605 | |||||||||
| City Holding Co. | 3,470 | 134,462 | |||||||||
| Columbia Banking System, Inc. | 4,330 | 135,226 | |||||||||
| Community Trust Bancorp, Inc. | 4,896 | 180,173 | |||||||||
| First Citizens BancShares, Inc., Class A | 540 | 111,866 | |||||||||
| First Financial Bankshares, Inc. | 3,522 | 135,139 | |||||||||
See Accompanying Notes to Financial Statements.
102
CMG SMALL CAP VALUE FUND
A Portfolio of Columbia Funds Institutional Trust
SCHEDULE OF INVESTMENTS
| Shares | Value | ||||||||||
| Common Stocks (continued) | |||||||||||
| Commercial Banks (continued) | |||||||||||
| First Financial Corp. | 4,520 | $ | 135,329 | ||||||||
| Mass Financial Corp., Class A (a) | 13,010 | 18,865 | |||||||||
| Merchants Bancshares, Inc. | 4,720 | 114,460 | |||||||||
| Mid-State Bancshares | 7,540 | 203,505 | |||||||||
| Northrim BanCorp, Inc. | 4,590 | 113,602 | |||||||||
| S&T Bancorp, Inc. | 3,500 | 109,445 | |||||||||
| Sandy Spring Bancorp, Inc. | 3,050 | 109,617 | |||||||||
| Sterling Bancorp NY | 5,980 | 120,617 | |||||||||
| Susquehanna Bancshares, Inc. | 6,760 | 163,457 | |||||||||
| Taylor Capital Group, Inc. | 4,100 | 129,437 | |||||||||
| TriCo Bancshares | 6,072 | 150,768 | |||||||||
| Trustmark Corp. | 3,450 | 109,400 | |||||||||
| UMB Financial Corp. | 6,270 | 215,500 | |||||||||
| Whitney Holding Corp. | 6,540 | 236,029 | |||||||||
| 4,020,744 | |||||||||||
| Consumer Finance (1.4%) | |||||||||||
| Advance America Cash Advance Centers, Inc. | 11,780 | 156,910 | |||||||||
| Cash America International, Inc. | 9,050 | 309,962 | |||||||||
| 466,872 | |||||||||||
| Insurance (7.0%) | |||||||||||
| American Physicians Capital, Inc. (a) | 3,210 | 148,751 | |||||||||
| Argonaut Group, Inc. (a) | 3,500 | 102,060 | |||||||||
| Baldwin & Lyons, Inc., Class B | 4,671 | 117,476 | |||||||||
| CNA Surety Corp. (a) | 8,970 | 163,702 | |||||||||
| Commerce Group, Inc. | 5,170 | 156,186 | |||||||||
| Delphi Financial Group, Inc., Class A | 6,610 | 251,775 | |||||||||
| Harleysville Group, Inc. | 4,279 | 135,773 | |||||||||
| Horace Mann Educators Corp. | 7,880 | 133,724 | |||||||||
| KMG America Corp. (a) | 14,031 | 117,159 | |||||||||
| National Western Life Insurance Co., Class A | 469 | 107,870 | |||||||||
| Navigators Group, Inc. (a) | 6,254 | 265,857 | |||||||||
| Phoenix Companies, Inc. | 12,411 | 168,790 | |||||||||
| ProCentury Corp. | 10,581 | 154,377 | |||||||||
| RLI Corp. | 3,202 | 151,390 | |||||||||
| United America Indemnity Ltd., Class A (a) | 7,720 | 160,113 | |||||||||
| 2,335,003 | |||||||||||
| Real Estate Investment Trusts (REITs) (6.8%) | |||||||||||
| Cousins Properties, Inc., REIT | 4,570 | 145,189 | |||||||||
| Crescent Real Estate Equities Co., REIT | 5,900 | 115,168 | |||||||||
| EastGroup Properties, Inc., REIT | 1,940 | 91,238 | |||||||||
| Entertainment Properties Trust, REIT | 2,300 | 97,911 | |||||||||
| Equity One, Inc., REIT | 6,860 | 150,028 | |||||||||
| Franklin Street Properties Corp., REIT | 7,276 | 135,334 | |||||||||
| Getty Realty Corp., REIT | 5,070 | 144,901 | |||||||||
| Healthcare Realty Trust, Inc. | 4,908 | 162,406 | |||||||||
| Highland Hospitality Corp., REIT | 9,990 | 133,366 | |||||||||
| Lexington Corporate Properties Trust, REIT | 7,141 | 142,249 | |||||||||
| Mid-America Apartment Communities, Inc., REIT | 4,970 | 283,886 | |||||||||
See Accompanying Notes to Financial Statements.
103
CMG SMALL CAP VALUE FUND
A Portfolio of Columbia Funds Institutional Trust
SCHEDULE OF INVESTMENTS
| Shares | Value | ||||||||||
| Common Stocks (continued) | |||||||||||
| Real Estate Investment Trusts (REITs) (continued) | |||||||||||
| Potlatch Corp., REIT | 319 | $ | 11,041 | ||||||||
| PS Business Parks, Inc., REIT | 1,865 | 111,900 | |||||||||
| Strategic Hotel Capital, Inc., REIT | 8,315 | 165,884 | |||||||||
| U-Store-It Trust, REIT | 7,290 | 138,947 | |||||||||
| Universal Health Realty Income Trust, REIT | 3,760 | 122,388 | |||||||||
| Urstadt Biddle Properties, Inc., Class A, REIT | 7,330 | 123,657 | |||||||||
| 2,275,493 | |||||||||||
| Thrifts & Mortgage Finance (0.8%) | |||||||||||
| Corus Bankshares, Inc. | 6,460 | 149,162 | |||||||||
| TrustCo Bank Corp. NY | 8,940 | 98,429 | |||||||||
| 247,591 | |||||||||||
| Health Care (9.0%) | |||||||||||
| Health Care Equipment & Supplies (2.5%) | |||||||||||
| Analogic Corp. | 1,940 | 88,736 | |||||||||
| DJ Orthopedics, Inc. (a) | 2,530 | 99,859 | |||||||||
| Greatbatch, Inc. (a) | 3,580 | 87,746 | |||||||||
| Haemonetics Corp. (a) | 4,020 | 176,357 | |||||||||
| STERIS Corp. | 9,230 | 213,859 | |||||||||
| Viasys Healthcare, Inc. (a) | 3,180 | 81,917 | |||||||||
| Vital Signs, Inc. | 1,500 | 77,235 | |||||||||
| 825,709 | |||||||||||
| Health Care Providers & Services (4.9%) | |||||||||||
| Cross Country Healthcare, Inc. (a) | 8,500 | 151,895 | |||||||||
| Genesis HealthCare Corp. (a) | 4,370 | 212,251 | |||||||||
| Gentiva Health Services, Inc. (a) | 8,930 | 143,684 | |||||||||
| Hooper Holmes, Inc. (a) | 14,600 | 43,800 | |||||||||
| Kindred Healthcare, Inc. (a) | 7,850 | 207,475 | |||||||||
| Owens & Minor, Inc. | 4,320 | 130,507 | |||||||||
| Pediatrix Medical Group, Inc. (a) | 7,260 | 307,824 | |||||||||
| RehabCare Group, Inc. (a) | 3,970 | 74,318 | |||||||||
| Res-Care, Inc. (a) | 7,930 | 150,829 | |||||||||
| Symbion, Inc. (a) | 5,070 | 95,367 | |||||||||
| U.S. Physical Therapy, Inc. (a) | 1,761 | 26,926 | |||||||||
| United Surgical Partners International, Inc. (a) | 3,920 | 96,824 | |||||||||
| 1,641,700 | |||||||||||
| Life Sciences Tools & Services (1.3%) | |||||||||||
| Bio-Rad Laboratories, Inc., Class A (a) | 2,380 | 156,818 | |||||||||
| PAREXEL International Corp. (a) | 7,160 | 212,437 | |||||||||
| Varian, Inc. (a) | 1,900 | 85,462 | |||||||||
| 454,717 | |||||||||||
| Pharmaceuticals (0.3%) | |||||||||||
| Alpharma, Inc., Class A | 4,430 | 100,029 | |||||||||
See Accompanying Notes to Financial Statements.
104
CMG SMALL CAP VALUE FUND
A Portfolio of Columbia Funds Institutional Trust
SCHEDULE OF INVESTMENTS
| Shares | Value | ||||||||||
| Common Stocks (continued) | |||||||||||
| Industrials (16.8%) | |||||||||||
| Aerospace & Defense (2.6%) | |||||||||||
| AAR Corp. (a) | 8,185 | $ | 193,821 | ||||||||
| Esterline Technologies Corp. (a) | 5,670 | 240,011 | |||||||||
| Moog, Inc., Class A (a) | 2,840 | 98,520 | �� | ||||||||
| Precision Castparts Corp. | 5,770 | 344,180 | |||||||||
| 876,532 | |||||||||||
| Airlines (1.1%) | |||||||||||
| JetBlue Airways Corp. (a) | 10,455 | 111,764 | |||||||||
| Republic Airways Holdings, Inc. (a) | 5,870 | 97,559 | |||||||||
| Skywest, Inc. | 6,160 | 149,380 | |||||||||
| 358,703 | |||||||||||
| Building Products (1.2%) | |||||||||||
| Goodman Global, Inc. (a) | 5,234 | 64,378 | |||||||||
| Lennox International, Inc. | 3,780 | 86,222 | |||||||||
| NCI Building Systems, Inc. (a) | 5,120 | 239,309 | |||||||||
| 389,909 | |||||||||||
| Commercial Services & Supplies (3.5%) | |||||||||||
| ABM Industries, Inc. | 6,160 | 101,640 | |||||||||
| Casella Waste Systems, Inc., Class A (a) | 8,460 | 98,897 | |||||||||
| CBIZ, Inc. (a) | 7,792 | 57,505 | |||||||||
| Consolidated Graphics, Inc. (a) | 5,760 | 283,334 | |||||||||
| Healthcare Services Group, Inc. | 7,149 | 154,490 | |||||||||
| IKON Office Solutions, Inc. | 6,170 | 85,208 | |||||||||
| Korn/Ferry International (a) | 5,870 | 109,006 | |||||||||
| TeleTech Holdings, Inc. (a) | 12,105 | 152,523 | |||||||||
| United Stationers, Inc. (a) | 2,750 | 135,218 | |||||||||
| 1,177,821 | |||||||||||
| Construction & Engineering (2.1%) | |||||||||||
| EMCOR Group, Inc. (a) | 3,780 | 194,745 | |||||||||
| KHD Humboldt Wedag International Ltd. (a) | 11,920 | 345,562 | |||||||||
| Washington Group International, Inc. | 3,000 | 162,000 | |||||||||
| 702,307 | |||||||||||
| Electrical Equipment (1.8%) | |||||||||||
| Belden CDT, Inc. | 3,730 | 121,039 | |||||||||
| Genlyte Group, Inc. (a) | 4,370 | 303,933 | |||||||||
| Woodward Governor Co. | 6,460 | 189,343 | |||||||||
| 614,315 | |||||||||||
| Machinery (1.8%) | |||||||||||
| EnPro Industries, Inc. (a) | 6,160 | 192,685 | |||||||||
| Harsco Corp. | 4,370 | 352,266 | |||||||||
| Kadant, Inc. (a) | 2,743 | 57,356 | |||||||||
| 602,307 | |||||||||||
| Road & Rail (1.5%) | |||||||||||
| Dollar Thrifty Automotive Group (a) | 1,890 | 84,596 | |||||||||
| Ryder System, Inc. | 2,580 | 130,032 | |||||||||
| Swift Transportation Co., Inc. (a) | 2,490 | 66,608 | |||||||||
| Werner Enterprises, Inc. | 12,300 | 221,400 | |||||||||
| 502,636 | |||||||||||
See Accompanying Notes to Financial Statements.
105
CMG SMALL CAP VALUE FUND
A Portfolio of Columbia Funds Institutional Trust
SCHEDULE OF INVESTMENTS
| Shares | Value | ||||||||||
| Common Stocks (continued) | |||||||||||
| Trading Companies & Distributors (0.9%) | |||||||||||
| Kaman Corp. | 5,620 | $ | 103,127 | ||||||||
| Watsco, Inc. | 4,590 | 203,429 | |||||||||
| 306,556 | |||||||||||
| Transportation Infrastructure (0.3%) | |||||||||||
| Interpool, Inc. | 4,750 | 95,570 | |||||||||
| Information Technology (15.4%) | |||||||||||
| Communications Equipment (1.7%) | |||||||||||
| Anaren, Inc. (a) | 10,130 | 181,023 | |||||||||
| Black Box Corp. | 2,381 | 97,883 | |||||||||
| Dycom Industries, Inc. (a) | 7,400 | 133,126 | |||||||||
| Polycom, Inc. (a) | 3,750 | 83,250 | |||||||||
| Tollgrade Communications, Inc. (a) | 6,260 | 58,093 | |||||||||
| 553,375 | |||||||||||
| Computers & Peripherals (1.2%) | |||||||||||
| Electronics for Imaging, Inc. (a) | 7,050 | 142,269 | |||||||||
| Emulex Corp. (a) | 6,518 | 97,053 | |||||||||
| Imation Corp. | 3,080 | 125,418 | |||||||||
| Mobility Electronics, Inc. (a) | 6,615 | 37,176 | |||||||||
| 401,916 | |||||||||||
| Electronic Equipment & Instruments (3.6%) | |||||||||||
| Agilysys, Inc. | 4,770 | 74,746 | |||||||||
| Anixter International, Inc. | 3,230 | 178,070 | |||||||||
| Benchmark Electronics, Inc. (a) | 7,260 | 176,636 | |||||||||
| Brightpoint, Inc. (a) | 15,306 | 224,539 | |||||||||
| Coherent, Inc. (a) | 3,012 | 96,565 | |||||||||
| MTS Systems Corp. | 4,270 | 157,392 | |||||||||
| NAM TAI Electronics, Inc. | 5,890 | 100,778 | |||||||||
| Vishay Intertechnology, Inc. (a) | 13,020 | 182,670 | |||||||||
| 1,191,396 | |||||||||||
| Internet Software & Services (0.2%) | |||||||||||
| Digitas, Inc. (a) | 4,890 | 40,343 | |||||||||
| Keynote Systems, Inc. (a) | 2,871 | 30,346 | |||||||||
| 70,689 | |||||||||||
| IT Services (1.8%) | |||||||||||
| Acxiom Corp. | 8,610 | 210,773 | |||||||||
| CSG Systems International, Inc. (a) | 2,161 | 56,272 | |||||||||
| MAXIMUS, Inc. | 2,590 | 70,293 | |||||||||
| MPS Group, Inc. (a) | 21,460 | 278,765 | |||||||||
| 616,103 | |||||||||||
| Semiconductors & Semiconductor Equipment (4.0%) | |||||||||||
| Actel Corp. (a) | 6,808 | 92,316 | |||||||||
| Advanced Energy Industries, Inc. (a) | 5,970 | 77,252 | |||||||||
| Asyst Technologies, Inc. (a) | 12,573 | 87,634 | |||||||||
| ATMI, Inc. (a) | 4,030 | 107,077 | |||||||||
| Brooks Automation, Inc. (a) | 4,954 | 55,931 | |||||||||
See Accompanying Notes to Financial Statements.
106
CMG SMALL CAP VALUE FUND
A Portfolio of Columbia Funds Institutional Trust
SCHEDULE OF INVESTMENTS
| Shares | Value | ||||||||||
| Common Stocks (continued) | |||||||||||
| Semiconductors & Semiconductor Equipment (continued) | |||||||||||
| Cabot Microelectronics Corp. (a) | 2,530 | $ | 75,343 | ||||||||
| Cymer, Inc. (a) | 2,470 | 96,626 | |||||||||
| Exar Corp. (a) | 7,360 | 95,312 | |||||||||
| Fairchild Semiconductor International, Inc. (a) | 8,480 | 138,733 | |||||||||
| MEMC Electronic Materials, Inc. (a) | 3,740 | 113,771 | |||||||||
| Standard Microsystems Corp. (a) | 6,560 | 174,365 | |||||||||
| Varian Semiconductor Equipment Associates, Inc. (a) | 3,950 | 125,215 | |||||||||
| Veeco Instruments, Inc. (a) | 4,960 | 110,509 | |||||||||
| 1,350,084 | |||||||||||
| Software (2.9%) | |||||||||||
| Captaris, Inc. (a) | 15,210 | 69,662 | |||||||||
| Internet Security Systems, Inc. (a) | 6,960 | 156,530 | |||||||||
| Lawson Software, Inc. (a) | 17,990 | 120,533 | |||||||||
| MSC.Software Corp. (a) | 9,740 | 155,840 | |||||||||
| Sybase, Inc. (a) | 6,260 | 131,773 | |||||||||
| Synchronoss Technologies, Inc. (a) | 8,776 | 68,014 | |||||||||
| Transaction Systems Architects, Inc. (a) | 7,260 | 268,765 | |||||||||
| 971,117 | |||||||||||
| Materials (7.1%) | |||||||||||
| Chemicals (1.3%) | |||||||||||
| H.B. Fuller Co. | 5,070 | 202,698 | |||||||||
| Minerals Technologies, Inc. | 2,580 | 130,600 | |||||||||
| Sensient Technologies Corp. | 4,571 | 91,146 | |||||||||
| 424,444 | |||||||||||
| Construction Materials (0.7%) | |||||||||||
| Eagle Materials, Inc. | 6,400 | 230,144 | |||||||||
| Containers & Packaging (1.4%) | |||||||||||
| AptarGroup, Inc. | 3,380 | 174,070 | |||||||||
| Greif, Inc., Class A | 4,270 | 295,527 | |||||||||
| 469,597 | |||||||||||
| Metals & Mining (2.9%) | |||||||||||
| AMCOL International Corp. | 3,970 | 91,985 | |||||||||
| Carpenter Technology Corp. | 2,780 | 273,552 | |||||||||
| Metal Management, Inc. | 5,570 | 158,634 | |||||||||
| RTI International Metals, Inc. (a) | 3,880 | 178,790 | |||||||||
| Worthington Industries, Inc. | 12,280 | 250,757 | |||||||||
| 953,718 | |||||||||||
| Paper & Forest Products (0.8%) | |||||||||||
| Glatfelter Co. | 10,180 | 158,808 | |||||||||
| Mercer International, Inc. (a) | 13,210 | 119,947 | |||||||||
| 278,755 | |||||||||||
| Telecommunication Services (0.5%) | |||||||||||
| Diversified Telecommunication Services (0.5%) | |||||||||||
| North Pittsburgh Systems, Inc. | �� | 4,570 | 118,043 | ||||||||
| TALK America Holdings, Inc. (a) | 9,112 | 54,034 | |||||||||
| 172,077 | |||||||||||
See Accompanying Notes to Financial Statements.
107
CMG SMALL CAP VALUE FUND
A Portfolio of Columbia Funds Institutional Trust
SCHEDULE OF INVESTMENTS
| Shares | Value | ||||||||||
| Common Stocks (continued) | |||||||||||
| Utilities (3.8%) | |||||||||||
| Electric Utilities (2.2%) | |||||||||||
| ALLETE, Inc. | 2,680 | $ | 124,406 | ||||||||
| El Paso Electric Co. (a) | 7,360 | 161,331 | |||||||||
| Maine & Maritimes Corp. | 1,490 | 24,064 | |||||||||
| MGE Energy, Inc. | 3,790 | 123,099 | |||||||||
| Otter Tail Corp. | 4,860 | 144,148 | |||||||||
| Puget Energy, Inc. | 7,030 | 156,136 | |||||||||
| 733,184 | |||||||||||
| Gas Utilities (0.9%) | |||||||||||
| Northwest Natural Gas Co. | 3,680 | 139,730 | |||||||||
| WGL Holdings, Inc. | 5,250 | 157,657 | |||||||||
| 297,387 | |||||||||||
| Multi-Utilities (0.7%) | |||||||||||
| CH Energy Group, Inc. | 4,970 | 246,462 | |||||||||
| Total Common Stocks (Cost of $24,208,742) | 33,443,936 | ||||||||||
| Total Investments (100.0%) (Cost of $24,208,742) (b) | 33,443,936 | ||||||||||
| Other Assets & Liabilities, Net (-0.0%) | (4,762 | ) | |||||||||
| Net Assets (100.0%) | $ | 33,439,174 | |||||||||
Notes to Schedule of Investments:
(a) Non-income producing security.
(b) Cost for federal income tax purposes is $24,340,305.
At July 31, 2006, the Fund held investments in the following sectors:
| Sector (Unaudited) | % of Net Assets | ||||||
| Financials | 28.7 | % | |||||
| Industrials | 16.8 | ||||||
| Information Technology | 15.4 | ||||||
| Consumer Discretionary | 9.9 | ||||||
| Health Care | 9.0 | ||||||
| Materials | 7.1 | ||||||
| Energy | 5.4 | ||||||
| Utilities | 3.8 | ||||||
| Consumer Staples | 3.4 | ||||||
| Telecommunication Services | 0.5 | ||||||
| Other Assets & Liabilities, Net | (-0.0 | )* | |||||
| 100.0 | % | ||||||
* Rounds to less than 0.1%.
| Acronym | Name | ||||||
| REIT | Real Estate Investment Trust | ||||||
See Accompanying Notes to Financial Statements.
108
CMG SMALL/MID CAP FUND
A Portfolio of Columbia Funds Institutional Trust
SCHEDULE OF INVESTMENTS
July 31, 2006
| Shares | Value | ||||||||||
| Common Stocks (96.9%) | |||||||||||
| Consumer Discretionary (13.9%) | |||||||||||
| Hotels, Restaurants & Leisure (5.0%) | |||||||||||
| Brinker International, Inc. | 620 | $ | 20,088 | ||||||||
| Cheesecake Factory, Inc. (a) | 2,440 | 55,754 | |||||||||
| Hilton Hotels Corp. | 2,790 | 66,765 | |||||||||
| Pinnacle Entertainment, Inc. (a) | 2,460 | 67,478 | |||||||||
| RARE Hospitality International, Inc. (a) | 1,490 | 39,187 | |||||||||
| Red Robin Gourmet Burgers, Inc. (a) | 1,050 | 40,792 | |||||||||
| Scientific Games Corp., Class A (a) | 2,280 | 77,452 | |||||||||
| Trump Entertainment Resorts, Inc. (a) | 3,950 | 72,008 | |||||||||
| 439,524 | |||||||||||
| Internet & Catalog Retail (1.0%) | |||||||||||
| Nutri/System, Inc. (a) | 1,730 | 91,552 | |||||||||
| Leisure Equipment & Products (1.0%) | |||||||||||
| Pool Corp. | 2,130 | 82,921 | |||||||||
| Media (0.7%) | |||||||||||
| Grupo Televisa SA, ADR | 3,130 | 57,968 | |||||||||
| Specialty Retail (3.0%) | |||||||||||
| Christopher & Banks Corp. | 2,510 | 70,757 | |||||||||
| GameStop Corp., Class A (a) | 1,890 | 78,643 | |||||||||
| Gymboree Corp. (a) | 810 | 27,151 | |||||||||
| Hibbett Sporting Goods, Inc. (a) | 1,470 | 29,047 | |||||||||
| Ross Stores, Inc. | 1,150 | 28,624 | |||||||||
| Tween Brands, Inc. (a) | 850 | 31,637 | |||||||||
| 265,859 | |||||||||||
| Textiles, Apparel & Luxury Goods (3.2%) | |||||||||||
| Carter's, Inc. (a) | 2,970 | 64,776 | |||||||||
| Coach, Inc. (a) | 2,370 | 68,042 | |||||||||
| Phillips-Van Heusen Corp. | 1,970 | 69,994 | |||||||||
| Quiksilver, Inc. (a) | 3,880 | 50,246 | |||||||||
| Timberland Co., Class A (a) | 980 | 25,235 | |||||||||
| 278,293 | |||||||||||
| Consumer Staples (4.4%) | |||||||||||
| Beverages (0.2%) | |||||||||||
| Hansen Natural Corp. (a) | 400 | 18,396 | |||||||||
| Food Products (1.8%) | |||||||||||
| Campbell Soup Co. | 1,470 | 53,920 | |||||||||
| Dean Foods Co. (a) | 730 | 27,397 | |||||||||
| Hershey Co. | 610 | 33,532 | |||||||||
| McCormick & Co., Inc. | 1,290 | 45,227 | |||||||||
| 160,076 | |||||||||||
See Accompanying Notes to Financial Statements.
109
CMG SMALL/MID CAP FUND
A Portfolio of Columbia Funds Institutional Trust
SCHEDULE OF INVESTMENTS
| Shares | Value | ||||||||||
| Common Stocks (continued) | |||||||||||
| Household Products (0.8%) | |||||||||||
| Central Garden & Pet Co. (a) | 1,710 | $ | 67,613 | ||||||||
| Personal Products (1.2%) | |||||||||||
| Estee Lauder Companies, Inc., Class A | 670 | 25,004 | |||||||||
| USANA Health Sciences, Inc. (a) | 1,850 | 82,048 | |||||||||
| 107,052 | |||||||||||
| Tobacco (0.4%) | |||||||||||
| UST, Inc. | 640 | 32,352 | |||||||||
| Energy (9.5%) | |||||||||||
| Energy Equipment & Services (3.7%) | |||||||||||
| Atwood Oceanics, Inc. (a) | 1,095 | 51,388 | |||||||||
| FMC Technologies, Inc. (a) | 780 | 49,155 | |||||||||
| Nabors Industries Ltd. (a) | 1,660 | 58,631 | |||||||||
| Oil States International, Inc. (a) | 1,360 | 43,738 | |||||||||
| Tetra Technologies, Inc. (a) | 3,147 | 90,036 | |||||||||
| Veritas DGC, Inc. (a) | 610 | 34,935 | |||||||||
| 327,883 | |||||||||||
| Oil, Gas & Consumable Fuels (5.8%) | |||||||||||
| Denbury Resources, Inc. (a) | 1,150 | 39,871 | |||||||||
| Foundation Coal Holdings, Inc. | 2,520 | 96,113 | |||||||||
| Frontier Oil Corp. | 1,640 | 57,810 | |||||||||
| Helix Energy Solutions Group, Inc. (a) | 1,170 | 45,618 | |||||||||
| Quicksilver Resources, Inc. (a) | 2,200 | 77,792 | |||||||||
| Range Resources Corp. | 1,320 | 37,105 | |||||||||
| Southwestern Energy Co. (a) | 2,510 | 86,344 | |||||||||
| Tesoro Corp. | 900 | 67,320 | |||||||||
| 507,973 | |||||||||||
| Financials (9.0%) | |||||||||||
| Capital Markets (2.7%) | |||||||||||
| Affiliated Managers Group, Inc. (a) | 1,300 | 119,015 | |||||||||
| Greenhill & Co., Inc. | 823 | 47,701 | |||||||||
| Lazard Ltd., Class A | 1,810 | 70,681 | |||||||||
| 237,397 | |||||||||||
| Commercial Banks (1.9%) | |||||||||||
| City National Corp. | 350 | 23,348 | |||||||||
| East West Bancorp, Inc. | 1,720 | 69,402 | |||||||||
| Signature Bank (a) | 2,190 | 70,365 | |||||||||
| 163,115 | |||||||||||
| Insurance (3.1%) | |||||||||||
| Ambac Financial Group, Inc. | 1,100 | 91,421 | |||||||||
| Hanover Insurance Group, Inc. | 1,740 | 80,527 | |||||||||
| ProAssurance Corp. (a) | 2,010 | 99,917 | |||||||||
| 271,865 | |||||||||||
See Accompanying Notes to Financial Statements.
110
CMG SMALL/MID CAP FUND
A Portfolio of Columbia Funds Institutional Trust
SCHEDULE OF INVESTMENTS
| Shares | Value | ||||||||||
| Common Stocks (continued) | |||||||||||
| Real Estate Investment Trusts (REITs) (1.3%) | |||||||||||
| Alexandria Real Estate Equities, Inc., REIT | 420 | $ | 39,656 | ||||||||
| General Growth Properties, Inc., REIT | 800 | 36,512 | |||||||||
| Washington Real Estate Investment Trust, REIT | 1,020 | 37,822 | |||||||||
| 113,990 | |||||||||||
| Health Care (20.5%) | |||||||||||
| Biotechnology (2.4%) | |||||||||||
| Amylin Pharmaceuticals, Inc. (a) | 540 | 26,352 | |||||||||
| Cephalon, Inc. (a) | 1,060 | 69,684 | |||||||||
| Digene Corp. (a) | 2,090 | 88,219 | |||||||||
| PDL BioPharma, Inc. (a) | 1,260 | 22,693 | |||||||||
| 206,948 | |||||||||||
| Health Care Equipment & Supplies (5.6%) | |||||||||||
| Beckman Coulter, Inc. | 510 | 29,197 | |||||||||
| Bespak PLC | 5,710 | 68,691 | |||||||||
| Gen-Probe, Inc. (a) | 1,330 | 69,093 | |||||||||
| Haemonetics Corp. (a) | 1,488 | 65,279 | |||||||||
| IDEXX Laboratories, Inc. (a) | 250 | 22,125 | |||||||||
| Intuitive Surgical, Inc. (a) | 290 | 27,608 | |||||||||
| OraSure Technologies, Inc. (a) | 6,280 | 58,655 | |||||||||
| ResMed, Inc. (a) | 2,248 | 104,330 | |||||||||
| Varian Medical Systems, Inc. (a) | 1,126 | 51,030 | |||||||||
| 496,008 | |||||||||||
| Health Care Providers & Services (5.9%) | |||||||||||
| Community Health Systems, Inc. (a) | 780 | 28,283 | |||||||||
| DaVita, Inc. (a) | 1,247 | 62,375 | |||||||||
| HealthExtras, Inc. (a) | 5,325 | 138,237 | |||||||||
| Healthways, Inc. (a) | 800 | 42,976 | |||||||||
| Laboratory Corp. of America Holdings (a) | 970 | 62,487 | |||||||||
| Lincare Holdings, Inc. (a) | 1,970 | 68,576 | |||||||||
| Psychiatric Solutions, Inc. (a) | 1,680 | 52,903 | |||||||||
| WellCare Health Plans, Inc. (a) | 1,357 | 66,574 | |||||||||
| 522,411 | |||||||||||
| Health Care Technology (1.3%) | |||||||||||
| Allscripts Healthcare Solutions, Inc. (a) | 5,784 | 110,243 | |||||||||
| Life Sciences Tools & Services (3.6%) | |||||||||||
| ICON PLC, ADR (a) | 2,538 | 167,102 | |||||||||
| Invitrogen Corp. (a) | 520 | 32,131 | |||||||||
| Nektar Therapeutics (a) | 3,300 | 53,790 | |||||||||
| Thermo Electron Corp. (a) | 1,600 | 59,216 | |||||||||
| 312,239 | |||||||||||
| Pharmaceuticals (1.7%) | |||||||||||
| Allergan, Inc. | 680 | 73,338 | |||||||||
| Medicis Pharmaceutical Corp., Class A | 2,210 | 60,908 | |||||||||
| Salix Pharmaceuticals Ltd. (a) | 1,760 | 17,952 | |||||||||
| 152,198 | |||||||||||
See Accompanying Notes to Financial Statements.
111
CMG SMALL/MID CAP FUND
A Portfolio of Columbia Funds Institutional Trust
SCHEDULE OF INVESTMENTS
| Shares | Value | ||||||||||
| Common Stocks (continued) | |||||||||||
| Industrials (16.8%) | |||||||||||
| Aerospace & Defense (3.8%) | |||||||||||
| Armor Holdings, Inc. (a) | 940 | $ | 48,560 | ||||||||
| BE Aerospace, Inc. (a) | 3,640 | 90,090 | |||||||||
| Ceradyne, Inc. (a) | 1,670 | 81,646 | |||||||||
| DynCorp International, Inc., Class A (a) | 1,944 | 17,515 | |||||||||
| Hexcel Corp. (a) | 4,980 | 71,563 | |||||||||
| Rockwell Collins, Inc. | 510 | 27,219 | |||||||||
| 336,593 | |||||||||||
| Air Freight & Logistics (1.1%) | |||||||||||
| C.H. Robinson Worldwide, Inc. | 1,050 | 48,069 | |||||||||
| UTI Worldwide, Inc. | 2,300 | 53,590 | |||||||||
| 101,659 | |||||||||||
| Commercial Services & Supplies (5.1%) | |||||||||||
| ChoicePoint, Inc. (a) | 896 | 30,607 | |||||||||
| Global Cash Access, Inc. (a) | 2,871 | 43,008 | |||||||||
| Huron Consulting Group, Inc. (a) | 3,775 | 130,917 | |||||||||
| Kenexa Corp. (a) | 4,532 | 107,182 | |||||||||
| Resources Connection, Inc. (a) | 3,720 | 88,053 | |||||||||
| Robert Half International, Inc. | 1,390 | 44,980 | |||||||||
| 444,747 | |||||||||||
| Construction & Engineering (0.4%) | |||||||||||
| Perini Corp. (a) | 1,678 | 37,956 | |||||||||
| Electrical Equipment (1.3%) | |||||||||||
| General Cable Corp. (a) | 2,600 | 92,820 | |||||||||
| Roper Industries, Inc. | 510 | 23,052 | |||||||||
| 115,872 | |||||||||||
| Machinery (3.5%) | |||||||||||
| ESCO Technologies, Inc. (a) | 1,390 | 73,239 | |||||||||
| JLG Industries, Inc. | 2,640 | 47,784 | |||||||||
| Joy Global, Inc. | 631 | 23,675 | |||||||||
| Terex Corp. (a) | 1,590 | 71,296 | |||||||||
| Wabtec Corp. | 3,360 | 89,241 | |||||||||
| 305,235 | |||||||||||
| Marine (0.5%) | |||||||||||
| American Commercial Lines, Inc. (a) | 750 | 41,213 | |||||||||
| Road & Rail (1.1%) | |||||||||||
| Landstar System, Inc. | 2,190 | 93,491 | |||||||||
| Information Technology (17.0%) | |||||||||||
| Communications Equipment (2.4%) | |||||||||||
| CSR PLC (a) | 2,250 | 47,704 | |||||||||
| F5 Networks, Inc. (a) | 1,040 | 48,194 | |||||||||
| Harris Corp. | 980 | 44,639 | |||||||||
| Ixia (a) | 7,687 | 71,258 | |||||||||
| 211,795 | |||||||||||
See Accompanying Notes to Financial Statements.
112
CMG SMALL/MID CAP FUND
A Portfolio of Columbia Funds Institutional Trust
SCHEDULE OF INVESTMENTS
| Shares | Value | ||||||||||
| Common Stocks (continued) | |||||||||||
| Computers & Peripherals (0.4%) | |||||||||||
| Presstek, Inc. (a) | 4,639 | $ | 37,251 | ||||||||
| Electronic Equipment & Instruments (1.1%) | |||||||||||
| SunPower Corp., Class A (a) | 1,290 | 41,190 | |||||||||
| Trimble Navigation Ltd. (a) | 1,070 | 51,392 | |||||||||
| 92,582 | |||||||||||
| Internet Software & Services (1.7%) | |||||||||||
| aQuantive, Inc. (a) | 2,020 | 41,410 | |||||||||
| Ariba, Inc. (a) | 2,580 | 20,124 | |||||||||
| Digital River, Inc. (a) | 940 | 42,150 | |||||||||
| Liquidity Services, Inc. (a) | 3,803 | 48,374 | |||||||||
| 152,058 | |||||||||||
| IT Services (3.9%) | |||||||||||
| Alliance Data Systems Corp. (a) | 1,990 | 102,127 | |||||||||
| Cognizant Technology Solutions Corp., Class A (a) | 1,040 | 68,109 | |||||||||
| Euronet Worldwide, Inc. (a) | 3,165 | 80,423 | |||||||||
| Global Payments, Inc. | 2,170 | 92,312 | |||||||||
| 342,971 | |||||||||||
| Semiconductors & Semiconductor Equipment (3.3%) | |||||||||||
| Atheros Communications, Inc. (a) | 2,207 | 36,460 | |||||||||
| FormFactor, Inc. (a) | 720 | 30,866 | |||||||||
| Hittite Microwave Corp. (a) | 1,275 | 51,956 | |||||||||
| Marvell Technology Group Ltd. (a) | 2,912 | 54,018 | |||||||||
| Netlogic Microsystems, Inc. (a) | 1,875 | 45,937 | |||||||||
| SiRF Technology Holdings, Inc. (a) | 2,320 | 44,312 | |||||||||
| Zoran Corp. (a) | 1,790 | 28,730 | |||||||||
| 292,279 | |||||||||||
| Software (4.2%) | |||||||||||
| Amdocs Ltd. (a) | 2,180 | 79,090 | |||||||||
| Informatica Corp. (a) | 5,030 | 70,269 | |||||||||
| Mercury Interactive Corp. (a) | 880 | 44,176 | |||||||||
| NAVTEQ Corp. (a) | 630 | 17,753 | |||||||||
| Nuance Communications, Inc. (a) | 3,231 | 29,919 | |||||||||
| Quest Software, Inc. (a) | 2,850 | 38,960 | |||||||||
| Transaction Systems Architects, Inc. (a) | 1,090 | 40,352 | |||||||||
| Verint Systems, Inc. (a) | 1,660 | 45,401 | |||||||||
| 365,920 | |||||||||||
| Materials (3.5%) | |||||||||||
| Chemicals (1.2%) | |||||||||||
| Potash Corp. of Saskatchewan, Inc. | 1,080 | 102,060 | |||||||||
| Construction Materials (0.5%) | |||||||||||
| Martin Marietta Materials, Inc. | 510 | 41,065 | |||||||||
See Accompanying Notes to Financial Statements.
113
CMG SMALL/MID CAP FUND
A Portfolio of Columbia Funds Institutional Trust
SCHEDULE OF INVESTMENTS
| Shares | Value | ||||||||||
| Common Stocks (continued) | |||||||||||
| Metals & Mining (1.8%) | |||||||||||
| Allegheny Technologies, Inc. | 640 | $ | 40,890 | ||||||||
| Century Aluminum Co. (a) | 715 | 22,072 | |||||||||
| Freeport-McMoRan Copper & Gold, Inc., Class B | 390 | 21,279 | |||||||||
| Phelps Dodge Corp. | 500 | 43,670 | |||||||||
| Zinifex Ltd. (a) | 4,040 | 32,661 | |||||||||
| 160,572 | |||||||||||
| Telecommunication Services (2.3%) | |||||||||||
| Wireless Telecommunication Services (2.3%) | |||||||||||
| American Tower Corp., Class A (a) | 1,249 | 42,216 | |||||||||
| Crown Castle International Corp. (a) | 1,260 | 44,390 | |||||||||
| Millicom International Cellular SA (a) | 1,210 | 42,338 | |||||||||
| NII Holdings, Inc. (a) | 1,480 | 78,114 | |||||||||
| 207,058 | |||||||||||
| Total Common Stocks (Cost of $7,158,689) | 8,506,253 | ||||||||||
| Par | |||||||||||
| Short-Term Obligation (3.8%) | |||||||||||
| Repurchase agreement with State Street Bank & Trust Co., dated 07/31/06, due 08/01/06 at 5.160%, collateralized by a U.S. Treasury Note maturing 02/28/11, market value of $340,425 (repurchase proceeds $332,048) | $ | 332,000 | 332,000 | ||||||||
| Total Short-Term Obligation (Cost of $332,000) | 332,000 | ||||||||||
| Total Investments (100.7%) (Cost of $7,490,689) (b) | 8,838,253 | ||||||||||
| Other Assets & Liabilities, Net (-0.7)% | (65,297 | ) | |||||||||
| Net Assets (100.0%) | $ | 8,772,956 | |||||||||
Notes to Schedule of Investments:
(a) Non-income producing security.
(b) Cost for federal income tax purposes is $7,563,572.
See Accompanying Notes to Financial Statements.
114
CMG SMALL/MID CAP FUND
A Portfolio of Columbia Funds Institutional Trust
SCHEDULE OF INVESTMENTS
At July 31, 2006, the Fund held investments in the following sectors:
| Sector (Unaudited) | % of Net Assets | ||||||
| Health Care | 20.5 | % | |||||
| Information Technology | 17.0 | ||||||
| Industrials | 16.8 | ||||||
| Consumer Discretionary | 13.9 | ||||||
| Energy | 9.5 | ||||||
| Financials | 9.0 | ||||||
| Consumer Staples | 4.4 | ||||||
| Materials | 3.5 | ||||||
| Telecommunication Services | 2.3 | ||||||
| Short-Term Obligation | 3.8 | ||||||
| Other Assets & Liabilities, Net | (0.7 | ) | |||||
| 100.0 | % | ||||||
| Acronym | Name | ||||||
| ADR | American Depositary Receipt | ||||||
| REIT | Real Estate Investment Trust | ||||||
See Accompanying Notes to Financial Statements.
115
CMG INTERNATIONAL STOCK FUND
A Portfolio of Columbia Funds Institutional Trust
SCHEDULE OF INVESTMENTS
July 31, 2006
| Shares | Value | ||||||||||
| Common Stocks (97.4%) | |||||||||||
| Consumer Discretionary (11.3%) | |||||||||||
| Auto Components (2.9%) | |||||||||||
| Compagnie Generale des Etablissements Michelin, Class B | 13,617 | $ | 827,276 | ||||||||
| Continental AG | 7,154 | 731,082 | |||||||||
| Denso Corp. | 27,400 | 939,264 | |||||||||
| Leoni AG | 14,583 | 570,213 | |||||||||
| 3,067,835 | |||||||||||
| Automobiles (2.3%) | |||||||||||
| Suzuki Motor Corp. | 10,900 | 266,688 | |||||||||
| Toyota Motor Corp. | 40,900 | 2,161,926 | |||||||||
| 2,428,614 | |||||||||||
| Distributors (0.7%) | |||||||||||
| Canon Marketing Japan, Inc. | 30,500 | 667,757 | |||||||||
| Hotels, Restaurants & Leisure (0.3%) | |||||||||||
| Genting Bhd | 48,100 | 328,777 | |||||||||
| Household Durables (2.9%) | |||||||||||
| JM AB | 44,400 | 653,027 | |||||||||
| Makita Corp. | 15,000 | 491,954 | |||||||||
| Matsushita Electric Industrial Co., Ltd. | 49,000 | 1,019,364 | |||||||||
| Taylor Woodrow PLC | 136,200 | 875,846 | |||||||||
| 3,040,191 | |||||||||||
| Leisure Equipment & Products (0.4%) | |||||||||||
| Sega Sammy Holdings, Inc. | 13,000 | 430,895 | |||||||||
| Media (1.3%) | |||||||||||
| Vivendi SA | 41,273 | 1,397,664 | |||||||||
| Specialty Retail (0.5%) | |||||||||||
| HMV Group PLC | 179,411 | 527,845 | |||||||||
| Consumer Staples (2.4%) | |||||||||||
| Beverages (0.8%) | |||||||||||
| Diageo PLC | 47,938 | 842,648 | |||||||||
| Food Products (0.4%) | |||||||||||
| Toyo Suisan Kaisha Ltd. | 25,000 | 403,637 | |||||||||
| Unilever PLC | 1 | 24 | |||||||||
| 403,661 | |||||||||||
| Tobacco (1.2%) | |||||||||||
| Imperial Tobacco Group PLC | 24,700 | 807,443 | |||||||||
| Japan Tobacco, Inc. | 133 | 509,285 | |||||||||
| 1,316,728 | |||||||||||
See Accompanying Notes to Financial Statements.
116
CMG INTERNATIONAL STOCK FUND
A Portfolio of Columbia Funds Institutional Trust
SCHEDULE OF INVESTMENTS
| Shares | Value | ||||||||||
| Common Stocks (continued) | |||||||||||
| Energy (11.9%) | |||||||||||
| Oil, Gas & Consumable Fuels (11.9%) | |||||||||||
| BP PLC, ADR | 25,780 | $ | 1,869,566 | ||||||||
| EnCana Corp. | 16,200 | 873,772 | |||||||||
| ENI S.p.A. | 53,041 | 1,626,788 | |||||||||
| Norsk Hydro ASA | 46,300 | 1,316,516 | |||||||||
| PetroChina Co., Ltd., Class H | 878,000 | 995,493 | |||||||||
| Petroleo Brasileiro SA, ADR | 4,300 | 395,084 | |||||||||
| Royal Dutch Shell PLC, Class A | 23,322 | 822,952 | |||||||||
| Royal Dutch Shell PLC, Class B | 41,610 | 1,532,008 | |||||||||
| Statoil ASA | 28,400 | 842,148 | |||||||||
| Total SA | 25,792 | 1,754,412 | |||||||||
| Yanzhou Coal Mining Co., Ltd., Class H | 830,000 | 585,365 | |||||||||
| 12,614,104 | |||||||||||
| Financials (32.0%) | |||||||||||
| Capital Markets (4.5%) | |||||||||||
| Credit Suisse Group, Registered Shares | 17,229 | 965,373 | |||||||||
| Daiwa Securities Group, Inc. | 53,000 | 592,202 | |||||||||
| Deutsche Bank AG, Registered Shares | 11,093 | 1,278,861 | |||||||||
| Nomura Holdings, Inc. | 50,600 | 898,173 | |||||||||
| UBS AG, Registered Shares | 18,306 | 995,966 | |||||||||
| 4,730,575 | |||||||||||
| Commercial Banks (18.4%) | |||||||||||
| Australia & New Zealand Banking Group Ltd. | 29,613 | 572,984 | |||||||||
| Banco Bilbao Vizcaya Argentaria SA | 84,270 | 1,791,238 | |||||||||
| Banco Santander Central Hispano SA | 89,617 | 1,357,695 | |||||||||
| Bangkok Bank Public Co., Ltd., NVDR | 187,200 | 499,398 | |||||||||
| Barclays PLC | 142,714 | 1,674,183 | |||||||||
| BNP Paribas SA | 16,181 | 1,575,025 | |||||||||
| Depfa Bank PLC | 50,810 | 856,093 | |||||||||
| ForeningsSparbanken AB | 21,100 | 566,508 | |||||||||
| HBOS PLC | 81,766 | 1,488,440 | |||||||||
| HSBC Holdings PLC | 87,760 | 1,591,815 | |||||||||
| Industrial Bank Of Korea | 36,130 | 646,800 | |||||||||
| Mega Financial Holding Co., Ltd. | 694,000 | 464,079 | |||||||||
| Mitsubishi UFJ Financial Group, Inc. | 63 | 890,226 | |||||||||
| Mizuho Financial Group, Inc. | 60 | 503,991 | |||||||||
| Societe Generale | 9,604 | 1,432,920 | |||||||||
| Sumitomo Mitsui Financial Group, Inc. | 85 | 904,531 | |||||||||
| Sumitomo Trust & Banking Co., Ltd. | 66,000 | 700,615 | |||||||||
| United Overseas Bank Ltd. | 114,000 | 1,126,389 | |||||||||
| Westpac Banking Corp. | 50,364 | 849,067 | |||||||||
| 19,491,997 | |||||||||||
| Consumer Finance (0.7%) | |||||||||||
| ORIX Corp. | 2,920 | 765,371 | |||||||||
| Diversified Financial Services (2.1%) | |||||||||||
| Fortis | 26,943 | 957,481 | |||||||||
| ING Groep NV | 30,405 | 1,234,315 | |||||||||
| 2,191,796 | |||||||||||
See Accompanying Notes to Financial Statements.
117
CMG INTERNATIONAL STOCK FUND
A Portfolio of Columbia Funds Institutional Trust
SCHEDULE OF INVESTMENTS
| Shares | Value | ||||||||||
| Common Stocks (continued) | |||||||||||
| Insurance (5.2%) | |||||||||||
| Allianz AG, Registered Shares | 7,216 | $ | 1,133,595 | ||||||||
| Aviva PLC | 66,917 | 897,507 | |||||||||
| Baloise Holding AG, Registered Shares | 8,399 | 668,889 | |||||||||
| Muenchener Rueckversicherungs-Gesellschaft AG, Registered Shares | 4,456 | 613,779 | |||||||||
| Sampo Oyj, Class A | 56,700 | 1,069,770 | |||||||||
| Storebrand ASA | 40,000 | 415,956 | |||||||||
| Zurich Financial Services AG, Registered Shares | 3,393 | 761,705 | |||||||||
| 5,561,201 | |||||||||||
| Real Estate Management & Development (1.1%) | |||||||||||
| Sun Hung Kai Properties Ltd. | 36,000 | 378,523 | |||||||||
| Swire Pacific Ltd., Class A | 72,500 | 752,040 | |||||||||
| 1,130,563 | |||||||||||
| Health Care (9.7%) | |||||||||||
| Pharmaceuticals (9.7%) | |||||||||||
| Altana AG | 11,099 | 636,728 | |||||||||
| AstraZeneca PLC | 33,642 | 2,054,346 | |||||||||
| Biovail Corp. | 46,300 | 1,027,397 | |||||||||
| Eisai Co., Ltd. | 22,600 | 1,042,819 | |||||||||
| GlaxoSmithKline PLC | 37,312 | 1,032,239 | |||||||||
| H. Lundbeck A/S | 27,200 | 663,545 | |||||||||
| Hisamitsu Pharmaceutical Co., Inc. | 13,000 | 412,753 | |||||||||
| Novartis AG, Registered Shares | 38,461 | 2,184,734 | |||||||||
| Takeda Pharmaceutical Co., Ltd. | 18,700 | 1,207,030 | |||||||||
| 10,261,591 | |||||||||||
| Industrials (9.6%) | |||||||||||
| Aerospace & Defense (0.5%) | |||||||||||
| MTU Aero Engines Holding AG | 15,260 | 542,689 | |||||||||
| Airlines (0.7%) | |||||||||||
| British Airways PLC (a) | 105,123 | 759,951 | |||||||||
| Construction & Engineering (0.6%) | |||||||||||
| YIT Oyj | 28,550 | 627,280 | |||||||||
| Electrical Equipment (0.7%) | |||||||||||
| Mitsubishi Electric Corp. | 98,000 | 769,331 | |||||||||
| Industrial Conglomerates (0.3%) | |||||||||||
| SembCorp Industries Ltd. | 116,040 | 249,888 | |||||||||
| Machinery (4.7%) | |||||||||||
| Andritz AG | 5,023 | 879,044 | |||||||||
| Georg Fischer AG, Registered Shares (a) | 1,362 | 615,393 | |||||||||
| Komatsu Ltd. | 46,000 | 924,855 | |||||||||
| Saurer AG, Registered Shares (a) | 7,918 | 585,542 | |||||||||
See Accompanying Notes to Financial Statements.
118
CMG INTERNATIONAL STOCK FUND
A Portfolio of Columbia Funds Institutional Trust
SCHEDULE OF INVESTMENTS
| Shares | Value | ||||||||||
| Common Stocks (continued) | |||||||||||
| Machinery (continued) | |||||||||||
| SKF AB, Class B | 49,000 | $ | 693,488 | ||||||||
| Stork NV | 19,735 | 942,835 | |||||||||
| Volvo AB, Class B | 5,900 | 312,312 | |||||||||
| 4,953,469 | |||||||||||
| Road & Rail (1.5%) | |||||||||||
| Central Japan Railway Co. | 122 | 1,351,476 | |||||||||
| ComfortDelGro Corp., Ltd. | 256,000 | 252,944 | |||||||||
| 1,604,420 | |||||||||||
| Trading Companies & Distributors (0.6%) | |||||||||||
| Hitachi High-Technologies Corp. | 21,200 | 619,477 | |||||||||
| Information Technology (7.2%) | |||||||||||
| Communications Equipment (1.5%) | |||||||||||
| Nokia Oyj | 80,850 | 1,603,904 | |||||||||
| Computers & Peripherals (1.5%) | |||||||||||
| FUJITSU Ltd. | 51,000 | 395,473 | |||||||||
| Lite-On Technology Corp. | 452,000 | 610,028 | |||||||||
| Wincor Nixdorf AG | 4,146 | 546,981 | |||||||||
| 1,552,482 | |||||||||||
| Electronic Equipment & Instruments (1.0%) | |||||||||||
| Hoya Corp. | 14,200 | 496,681 | |||||||||
| Kyocera Corp. | 7,300 | 597,907 | |||||||||
| 1,094,588 | |||||||||||
| Internet Software & Services (0.5%) | |||||||||||
| NetEase.com, Inc., ADR (a) | 30,443 | 526,664 | |||||||||
| IT Services (0.6%) | |||||||||||
| CGI Group, Inc., Class A (a) | 106,500 | 622,983 | |||||||||
| Office Electronics (1.2%) | |||||||||||
| Canon, Inc. | 25,950 | 1,247,194 | |||||||||
| Semiconductors & Semiconductor Equipment (0.5%) | |||||||||||
| Infineon Technologies AG (a) | 28,001 | 299,024 | |||||||||
| Taiwan Semiconductor Manufacturing Co., Ltd., ADR | 32,511 | 281,867 | |||||||||
| 580,891 | |||||||||||
| Software (0.4%) | |||||||||||
| Cognos, Inc. (a) | 13,700 | 428,125 | |||||||||
| Materials (6.9%) | |||||||||||
| Chemicals (4.0%) | |||||||||||
| BASF AG | 18,603 | 1,497,337 | |||||||||
| Bayer AG | 9,896 | 487,569 | |||||||||
See Accompanying Notes to Financial Statements.
119
CMG INTERNATIONAL STOCK FUND
A Portfolio of Columbia Funds Institutional Trust
SCHEDULE OF INVESTMENTS
| Shares | Value | ||||||||||
| Common Stocks (continued) | |||||||||||
| Chemicals (continued) | |||||||||||
| Shin-Etsu Chemical Co., Ltd. | 13,700 | $ | 793,476 | ||||||||
| Sumitomo Chemical Co., Ltd. | 93,000 | 734,947 | |||||||||
| Teijin Ltd. | 121,000 | 681,809 | |||||||||
| 4,195,138 | |||||||||||
| Metals & Mining (2.9%) | |||||||||||
| Kobe Steel Ltd. | 238,000 | 718,287 | |||||||||
| Rio Tinto PLC | 14,998 | 774,649 | |||||||||
| Salzgitter AG | 12,180 | 961,219 | |||||||||
| ThyssenKrupp AG | 18,374 | 643,104 | |||||||||
| 3,097,259 | |||||||||||
| Telecommunication Services (2.4%) | |||||||||||
| Diversified Telecommunication Services (1.5%) | |||||||||||
| Chunghwa Telecom Co., Ltd., ADR | 36,800 | 683,376 | |||||||||
| Nippon Telegraph & Telephone Corp. | 158 | 825,522 | |||||||||
| 1,508,898 | |||||||||||
| Wireless Telecommunication Services (0.9%) | |||||||||||
| China Mobile Ltd. | 70,500 | 454,110 | |||||||||
| Taiwan Mobile Co., Ltd | 563,000 | 520,883 | |||||||||
| 974,993 | |||||||||||
| Utilities (4.0%) | |||||||||||
| Electric Utilities (3.1%) | |||||||||||
| E.ON AG | 11,317 | 1,364,390 | |||||||||
| Endesa SA | 31,202 | 1,066,585 | |||||||||
| Terna S.p.A. | 291,326 | 803,822 | |||||||||
| 3,234,797 | |||||||||||
| Gas Utilities (0.5%) | |||||||||||
| Tokyo Gas Co., Ltd. | 104,000 | 517,074 | |||||||||
| Independent Power Producers & Energy Traders (0.4%) | |||||||||||
| Electric Power Development Co., Ltd. | 12,600 | 470,391 | |||||||||
| Total Common Stocks (Cost of $84,992,851) | 102,981,699 | ||||||||||
| Investment Company (1.7%) | |||||||||||
| iShares MSCI EAFE Index Fund | 27,633 | 1,821,567 | |||||||||
| Total Investment Company (Cost of $1,732,577) | 1,821,567 | ||||||||||
See Accompanying Notes to Financial Statements.
120
CMG INTERNATIONAL STOCK FUND
A Portfolio of Columbia Funds Institutional Trust
SCHEDULE OF INVESTMENTS
| Par | Value | ||||||||||
| Short-Term Obligation (0.4%) | |||||||||||
| Repurchase agreement with State Street Bank & Trust Co., dated 07/31/06, due 08/01/06 at 5.160%, collateralized by a U.S. Treasury Note maturing 02/28/11, market value of $435,544 (repurchase proceeds $427,061) | $ | 427,000 | $ | 427,000 | |||||||
| Total Short-Term Obligation (Cost of $427,000) | 427,000 | ||||||||||
| Total Investments (99.5%) (Cost of $87,152,428) (b) | 105,230,266 | ||||||||||
| Other Assets & Liabilities, Net (0.5%) | 507,373 | ||||||||||
| Net Assets (100.0%) | $ | 105,737,639 | |||||||||
Notes to Schedule of Investments:
(a) Non-income producing security.
(b) Cost for federal income tax purposes is $87,326,385.
See Accompanying Notes to Financial Statements.
121
CMG INTERNATIONAL STOCK FUND
A Portfolio of Columbia Funds Institutional Trust
SCHEDULE OF INVESTMENTS
The Fund invested in the following countries at July 31, 2006:
| Summary of Securities by Country (Unaudited) | Value | % of Total Investments | |||||||||
| Japan | $ | 25,952,383 | 24.7 | % | |||||||
| United Kingdom | 17,551,463 | 16.7 | |||||||||
| Germany | 11,306,570 | 10.7 | |||||||||
| France | 6,987,296 | 6.6 | |||||||||
| Switzerland | 6,777,602 | 6.4 | |||||||||
| Spain | 4,215,518 | 4.0 | |||||||||
| Finland | 3,300,955 | 3.1 | |||||||||
| Canada | 2,952,277 | 2.8 | |||||||||
| United States* | 2,775,231 | 2.6 | |||||||||
| Norway | 2,574,620 | 2.5 | |||||||||
| Taiwan | 2,560,232 | 2.5 | |||||||||
| Italy | 2,430,610 | 2.3 | |||||||||
| Sweden | 2,225,335 | 2.1 | |||||||||
| Netherlands | 2,177,150 | 2.1 | |||||||||
| Singapore | 1,629,221 | 1.6 | |||||||||
| Hong Kong | 1,584,673 | 1.5 | |||||||||
| China | 1,580,858 | 1.5 | |||||||||
| Australia | 1,422,051 | 1.4 | |||||||||
| Belgium | 957,481 | 0.9 | |||||||||
| Austria | 879,044 | 0.8 | |||||||||
| Ireland | 856,093 | 0.8 | |||||||||
| Denmark | 663,545 | 0.6 | |||||||||
| South Korea | 646,800 | 0.6 | |||||||||
| Thailand | 499,398 | 0.5 | |||||||||
| Brazil | 395,084 | 0.4 | |||||||||
| Malaysia | 328,776 | 0.3 | |||||||||
| $ | 105,230,266 | 100.0 | % | ||||||||
*Includes short-term obligation and investment company.
Certain securities are listed by country of underlying exposure but may trade predominantly on other exchanges.
| Acronym | Name | ||||||
| ADR | American Depositary Receipt | ||||||
| NVDR | Non-Voting Depositary Receipt | ||||||
See Accompanying Notes to Financial Statements.
122
This page is intentionally left blank.
STATEMENTS OF ASSETS AND LIABILITIES
July 31, 2006
| CMG Enhanced S&P 500® Index Fund | CMG Large Cap Growth Fund | CMG Large Cap Value Fund | CMG Mid Cap Growth Fund | CMG Mid Cap Value Fund | CMG Small Cap Growth Fund | CMG Small Cap Value Fund | CMG Small/Mid Cap Fund | CMG International Stock Fund | |||||||||||||||||||||||||||||||
| ASSETS: | |||||||||||||||||||||||||||||||||||||||
| Investments, at identified cost | $ | 91,888,656 | $ | 34,401,348 | $ | 32,639,191 | $ | 20,053,668 | $ | 15,176,358 | $ | 36,543,324 | $ | 24,208,742 | $ | 7,490,689 | $ | 87,152,428 | |||||||||||||||||||||
| Investments, at value | $ | 100,927,958 | $ | 36,428,442 | $ | 37,099,503 | $ | 23,725,882 | $ | 17,724,958 | $ | 40,194,703 | $ | 33,443,936 | $ | 8,838,253 | $ | 105,230,266 | |||||||||||||||||||||
| Cash | 674 | 92 | 905 | 936 | 506 | 90 | 79,212 | 124 | 632 | ||||||||||||||||||||||||||||||
| Foreign currency (cost of $2,855) | - | - | - | - | - | - | - | - | 2,859 | ||||||||||||||||||||||||||||||
| Receivable for: | |||||||||||||||||||||||||||||||||||||||
| Investments sold | - | 1,232,349 | 359,693 | 132,641 | 225,092 | 616,837 | 117,749 | 80,648 | 689,692 | ||||||||||||||||||||||||||||||
| Interest | 250 | 191 | 93 | 298 | 27 | 221 | - | 48 | 61 | ||||||||||||||||||||||||||||||
| Dividends | 88,654 | 12,350 | 24,205 | 3,525 | 10,833 | 1,335 | 25,935 | 260 | 94,295 | ||||||||||||||||||||||||||||||
| Foreign tax reclaims | - | - | 312 | - | - | - | - | - | 74,718 | ||||||||||||||||||||||||||||||
| Reimbursement due from Investment Advisor | - | - | 1,054 | - | - | - | - | - | - | ||||||||||||||||||||||||||||||
| Expense reimbursement due from Investment Advisor | 5,345 | 4,483 | 4,509 | 5,671 | 5,289 | 45,161 | 9,796 | 11,572 | 15,044 | ||||||||||||||||||||||||||||||
| Deferred Trustees' compensation plan | 4,501 | 3,744 | 3,805 | 3,678 | 3,504 | 10,975 | 4,015 | 4,020 | 5,777 | ||||||||||||||||||||||||||||||
| Other assets | 234 | - | - | - | 6,524 | - | 1,576 | - | - | ||||||||||||||||||||||||||||||
| Total Assets | 101,027,616 | 37,681,651 | 37,494,079 | 23,872,631 | 17,976,733 | 40,869,322 | 33,682,219 | 8,934,925 | 106,113,344 | ||||||||||||||||||||||||||||||
| LIABILITIES: | |||||||||||||||||||||||||||||||||||||||
| Payable for: | |||||||||||||||||||||||||||||||||||||||
| Investments purchased | - | 1,868,141 | 165,106 | 190,044 | 171,896 | 564,905 | 187,093 | 119,090 | 265,535 | ||||||||||||||||||||||||||||||
| Futures variation margin | 3,750 | - | - | - | - | - | - | - | - | ||||||||||||||||||||||||||||||
| Investment advisory fee | 20,388 | 15,054 | 15,462 | 13,959 | 10,582 | 27,712 | 21,663 | 5,590 | 64,906 | ||||||||||||||||||||||||||||||
| Trustees' fees | 150 | 150 | 150 | 150 | 150 | 1,036 | 150 | 565 | 736 | ||||||||||||||||||||||||||||||
| Transfer agent fees | - | - | - | - | - | 98 | - | - | - | ||||||||||||||||||||||||||||||
| Merger fee | - | - | - | - | - | 26,465 | - | - | - | ||||||||||||||||||||||||||||||
| Custody fee | - | - | - | - | - | 5,921 | - | - | - | ||||||||||||||||||||||||||||||
| Audit fee | 23,900 | 28,600 | 28,600 | 28,600 | 28,600 | 34,990 | 28,600 | 32,250 | 36,350 | ||||||||||||||||||||||||||||||
| Chief compliance officer expenses | - | - | - | - | - | 306 | - | - | - | ||||||||||||||||||||||||||||||
| Deferred Trustees' fees | 4,501 | 3,744 | 3,805 | 3,678 | 3,504 | 10,975 | 4,015 | 4,020 | 5,777 | ||||||||||||||||||||||||||||||
| Other liabilities | 1,760 | 780 | 770 | 510 | 387 | 13,722 | 1,524 | 454 | 2,401 | ||||||||||||||||||||||||||||||
| Total Liabilities | 54,449 | 1,916,469 | 213,893 | 236,941 | 215,119 | 686,130 | 243,045 | 161,969 | 375,705 | ||||||||||||||||||||||||||||||
| NET ASSETS | $ | 100,973,167 | $ | 35,765,182 | $ | 37,280,186 | $ | 23,635,690 | $ | 17,761,614 | $ | 40,183,192 | $ | 33,439,174 | $ | 8,772,956 | $ | 105,737,639 | |||||||||||||||||||||
| NET ASSETS consist of: | |||||||||||||||||||||||||||||||||||||||
| Paid-in-capital | $ | 84,977,591 | $ | 32,323,863 | $ | 30,253,941 | $ | 17,888,095 | $ | 13,123,504 | $ | 29,232,790 | $ | 20,892,788 | $ | 983,091 | $ | 68,613,848 | |||||||||||||||||||||
| Undistributed net investment income | 802,166 | 128,856 | 349,092 | 16,910 | 82,198 | - | 104,160 | - | 1,450,664 | ||||||||||||||||||||||||||||||
| Accumulated net investment loss | - | - | - | - | - | (15,114 | ) | - | (4,738 | ) | - | ||||||||||||||||||||||||||||
| Accumulated net realized gain | 6,115,361 | 1,285,369 | 2,216,841 | 2,058,471 | 2,007,312 | 7,314,137 | 3,207,032 | 6,447,039 | 17,591,948 | ||||||||||||||||||||||||||||||
| Net unrealized appreciation on: | |||||||||||||||||||||||||||||||||||||||
| Investments | 9,039,302 | 2,027,094 | 4,460,312 | 3,672,214 | 2,548,600 | 3,651,379 | 9,235,194 | 1,347,564 | 18,077,838 | ||||||||||||||||||||||||||||||
| Foreign currency translations | - | - | - | - | - | - | - | - | 3,341 | ||||||||||||||||||||||||||||||
| Futures contracts | 38,747 | - | - | - | - | - | - | - | - | ||||||||||||||||||||||||||||||
| NET ASSETS | $ | 100,973,167 | $ | 35,765,182 | $ | 37,280,186 | $ | 23,635,690 | $ | 17,761,614 | $ | 40,183,192 | $ | 33,439,174 | $ | 8,772,956 | $ | 105,737,639 | |||||||||||||||||||||
| Shares of capital stock outstanding | 7,466,117 | 3,216,091 | 3,136,189 | 1,577,944 | 1,267,011 | 19,802,172 | 2,184,316 | 780,276 | 7,229,446 | ||||||||||||||||||||||||||||||
| Net asset value, offering and redemption price per share | $ | 13.52 | $ | 11.12 | $ | 11.89 | $ | 14.98 | $ | 14.02 | $ | 2.03 | $ | 15.31 | $ | 11.24 | $ | 14.63 | |||||||||||||||||||||
See Accompanying Notes to Financial Statements.
124
See Accompanying Notes to Financial Statements.
125
STATEMENTS OF OPERATIONS
For the Year Ended July 31, 2006
| CMG Enhanced S&P 500® Index Fund | CMG Large Cap Growth Fund | CMG Large Cap Value Fund | CMG Mid Cap Growth Fund | CMG Mid Cap Value Fund | CMG Small Cap Growth Fund | CMG Small Cap Value Fund | CMG Small/Mid Cap Fund | CMG International Stock Fund | |||||||||||||||||||||||||||||||
| NET INVESTMENT INCOME: | |||||||||||||||||||||||||||||||||||||||
| Income: | |||||||||||||||||||||||||||||||||||||||
| Dividends | $ | 1,677,439 | $ | 388,899 | $ | 827,494 | $ | 159,771 | $ | 312,344 | $ | 25,586 | $ | 497,003 | $ | 47,154 | $ | 3,277,622 | |||||||||||||||||||||
| Interest | 81,315 | 43,541 | 30,073 | 37,686 | 15,233 | 32,280 | 6,061 | 16,857 | 41,184 | ||||||||||||||||||||||||||||||
| Foreign withholding tax | - | (4,493 | ) | (7,135 | ) | (839 | ) | (640 | ) | - | - | (343 | ) | (288,501 | ) | ||||||||||||||||||||||||
| Total income | 1,758,754 | 427,947 | 850,432 | 196,618 | 326,937 | 57,866 | 503,064 | 63,668 | 3,030,305 | ||||||||||||||||||||||||||||||
| Expenses: | |||||||||||||||||||||||||||||||||||||||
| Investment advisory fee | 225,402 | 190,536 | 186,428 | 175,688 | 132,838 | 205,536 | 287,985 | 157,489 | 877,242 | ||||||||||||||||||||||||||||||
| Transfer agent fee | - | - | - | - | - | 212 | - | - | - | ||||||||||||||||||||||||||||||
| Trustees' fees | 14,206 | 11,995 | 11,998 | 12,854 | 11,203 | 11,650 | 16,784 | 11,098 | 15,675 | ||||||||||||||||||||||||||||||
| Custody fee | - | - | - | - | - | 32,151 | - | - | - | ||||||||||||||||||||||||||||||
| Audit fee | 29,870 | 34,565 | 34,564 | 34,564 | 34,562 | 41,315 | 31,327 | 37,070 | 47,412 | ||||||||||||||||||||||||||||||
| Registration fee | - | - | - | - | - | 23,738 | - | - | - | ||||||||||||||||||||||||||||||
| Merger costs | - | - | - | - | - | 19,195 | - | - | - | ||||||||||||||||||||||||||||||
| Chief compliance officer expenses (See Note 4) | - | - | - | - | - | 4,082 | - | - | |||||||||||||||||||||||||||||||
| Non-recurring costs (See Note 9) | 1,053 | 460 | 443 | 296 | 229 | 287 | 427 | 319 | 1,430 | ||||||||||||||||||||||||||||||
| Other expenses | 6,343 | 2,742 | 2,724 | 1,708 | 1,360 | 19,102 | 2,728 | 868 | 7,884 | ||||||||||||||||||||||||||||||
| Total operating expenses | 276,874 | 240,298 | 236,157 | 225,110 | 180,192 | 357,268 | 339,251 | 206,844 | 949,643 | ||||||||||||||||||||||||||||||
| Interest expense | 1,102 | 795 | - | - | - | - | 941 | - | 7,833 | ||||||||||||||||||||||||||||||
| Total expenses | 277,976 | 241,093 | 236,157 | 225,110 | 180,192 | 357,268 | 340,192 | 206,844 | 957,476 | ||||||||||||||||||||||||||||||
| Fees and expenses waived or reimbursed by Transfer Agent | - | - | - | - | - | (23 | ) | - | - | - | |||||||||||||||||||||||||||||
| Expense reimbursement from Investment Advisor | (50,418 | ) | (49,302 | ) | (49,287 | ) | (49,126 | ) | (47,125 | ) | (57,662 | ) | (50,838 | ) | (48,428 | ) | (70,970 | ) | |||||||||||||||||||||
| Non-recurring costs assumed by Investment Advisor (See Note 9) | (1,053 | ) | (460 | ) | (443 | ) | (296 | ) | (229 | ) | (287 | ) | (427 | ) | (319 | ) | (1,430 | ) | |||||||||||||||||||||
| Custody earnings credit | - | - | - | - | - | (73 | ) | - | - | - | |||||||||||||||||||||||||||||
| Net expenses | 226,505 | 191,331 | 186,427 | 175,688 | 132,838 | 299,223 | 288,927 | 158,097 | 885,076 | ||||||||||||||||||||||||||||||
| Net investment income (loss) | 1,532,249 | 236,616 | 664,005 | 20,930 | 194,099 | (241,357 | ) | 214,137 | (94,429 | ) | 2,145,229 | ||||||||||||||||||||||||||||
| NET REALIZED AND UNREALIZED GAIN (LOSS) ON INVESTMENTS, FOREIGN CURRENCY AND FUTURES CONTRACTS: | |||||||||||||||||||||||||||||||||||||||
| Net realized gain (loss) on: | |||||||||||||||||||||||||||||||||||||||
| Investments | 8,035,180 | 2,208,284 | 3,683,361 | 2,631,011 | 2,848,467 | 9,400,140 | 4,366,840 | 7,686,286 | 23,883,422 | ||||||||||||||||||||||||||||||
| Foreign currency transactions | - | (13 | ) | - | (1,975 | ) | 33 | (1,201 | ) | - | (1,107 | ) | (193,195 | ) | |||||||||||||||||||||||||
| Futures contracts | 56,500 | - | - | - | - | - | - | - | - | ||||||||||||||||||||||||||||||
| Net realized loss on the disposal of investments purchased/sold in error (See Note 8) | - | - | - | - | - | - | - | - | - | ||||||||||||||||||||||||||||||
| Net realized gain | 8,091,680 | 2,208,271 | 3,683,361 | 2,629,036 | 2,848,500 | 9,398,939 | 4,366,840 | 7,685,179 | 23,690,227 | ||||||||||||||||||||||||||||||
| Net change in unrealized appreciation (depreciation) on: | |||||||||||||||||||||||||||||||||||||||
| Investments | (3,060,327 | ) | (1,726,056 | ) | (884,539 | ) | (433,276 | ) | (1,416,704 | ) | (11,061,310 | ) | (1,837,919 | ) | (4,880,243 | ) | 1,009,564 | ||||||||||||||||||||||
| Foreign currency translations | - | - | - | - | (12 | ) | - | - | - | 9,824 | |||||||||||||||||||||||||||||
| Futures contracts | 38,747 | - | - | - | - | - | - | - | - | ||||||||||||||||||||||||||||||
| Net change in unrealized appreciation (depreciation) | (3,021,580 | ) | (1,726,056 | ) | (884,539 | ) | (433,276 | ) | (1,416,716 | ) | (11,061,310 | ) | (1,837,919 | ) | (4,880,243 | ) | 1,019,388 | ||||||||||||||||||||||
| Net gain (loss) | 5,070,100 | 482,215 | 2,798,822 | 2,195,760 | 1,431,784 | (1,662,371 | ) | 2,528,921 | 2,804,936 | 24,709,615 | |||||||||||||||||||||||||||||
| NET INCREASE (DECREASE) IN NET ASSETS FROM OPERATIONS | $ | 6,602,349 | $ | 718,831 | $ | 3,462,827 | $ | 2,216,690 | $ | 1,625,883 | $ | (1,903,728 | ) | $ | 2,743,058 | $ | 2,710,507 | $ | 26,854,844 | ||||||||||||||||||||
See Accompanying Notes to Financial Statements.
126
See Accompanying Notes to Financial Statements.
127
STATEMENTS OF CHANGES IN NET ASSETS
| CMG Enhanced S&P 500® Index Fund | |||||||||||
| Year Ended July 31, | |||||||||||
| 2006 | 2005 | ||||||||||
| Operations: | |||||||||||
| Net investment income | $ | 1,532,249 | $ | 1,901,574 | |||||||
| Net realized gain on investments and futures contracts | 8,091,680 | 2,731,812 | |||||||||
| Net change in unrealized appreciation (depreciation) on investments and futures contracts | (3,021,580 | ) | 9,378,890 | ||||||||
| Net increase from operations | 6,602,349 | 14,012,276 | |||||||||
| Distributions declared to shareholders: | |||||||||||
| From net investment income | (1,547,386 | ) | (1,713,416 | ) | |||||||
| From net realized gains | (4,395,562 | ) | (896,196 | ) | |||||||
| Total distributions declared to shareholders | (5,942,948 | ) | (2,609,612 | ) | |||||||
| Share transactions: | |||||||||||
| Subscriptions | 25,772,014 | 17,245,602 | |||||||||
| Distributions reinvested | 1,192,965 | 408,128 | |||||||||
| Redemptions | (18,284,280 | ) | (35,670,610 | ) | |||||||
| Net increase (decrease) in share transactions | 8,680,699 | (18,016,880 | ) | ||||||||
| Net increase (decrease) in net assets | 9,340,100 | (6,614,216 | ) | ||||||||
| NET ASSETS: | |||||||||||
| Beginning of period | 91,633,067 | 98,247,283 | |||||||||
| End of period | $ | 100,973,167 | $ | 91,633,067 | |||||||
| Undistributed net investment income, at end of period | $ | 802,166 | $ | 821,661 | |||||||
| Change in shares: | |||||||||||
| Subscriptions | 1,932,072 | 1,353,553 | |||||||||
| Issued for distributions reinvested | 90,582 | 31,274 | |||||||||
| Redemptions | (1,347,447 | ) | (2,804,223 | ) | |||||||
| Net increase (decrease) | 675,207 | (1,419,396 | ) | ||||||||
See Accompanying Notes to Financial Statements.
128
STATEMENTS OF CHANGES IN NET ASSETS
| CMG Large Cap Growth Fund | CMG Large Cap Value Fund | ||||||||||||||||||
| Year Ended July 31, | Year Ended July 31, | ||||||||||||||||||
| 2006 | 2005 | 2006 | 2005 | ||||||||||||||||
| Operations: | |||||||||||||||||||
| Net investment income | $ | 236,616 | $ | 430,830 | $ | 664,005 | $ | 917,233 | |||||||||||
| Net realized gain on investments and foreign currency transactions | 2,208,271 | 2,173,562 | 3,683,361 | 2,822,819 | |||||||||||||||
| Net change in unrealized appreciation (depreciation) on investments | (1,726,056 | ) | 2,991,580 | (884,539 | ) | 2,693,045 | |||||||||||||
| Net increase from operations | 718,831 | 5,595,972 | 3,462,827 | 6,433,097 | |||||||||||||||
| Distributions declared to shareholders: | |||||||||||||||||||
| From net investment income | (244,682 | ) | (349,571 | ) | (786,000 | ) | (908,008 | ) | |||||||||||
| From net realized gains | (2,107,614 | ) | - | (4,217,978 | ) | (142,837 | ) | ||||||||||||
| Total distributions declared to shareholders | (2,352,296 | ) | (349,571 | ) | (5,003,978 | ) | (1,050,845 | ) | |||||||||||
| Share transactions: | |||||||||||||||||||
| Subscriptions | 607,996 | 4,995,496 | 2,117,201 | 2,725,323 | |||||||||||||||
| Distributions reinvested | 1,081,858 | 60,880 | 2,230,353 | 327,447 | |||||||||||||||
| Redemptions | (4,602,728 | ) | (10,674,833 | ) | (4,257,442 | ) | (17,558,515 | ) | |||||||||||
| Net increase (decrease) in share transactions | (2,912,874 | ) | (5,618,457 | ) | 90,112 | (14,505,745 | ) | ||||||||||||
| Net decrease in net assets | (4,546,339 | ) | (372,056 | ) | (1,451,039 | ) | (9,123,493 | ) | |||||||||||
| NET ASSETS: | |||||||||||||||||||
| Beginning of period | 40,311,521 | 40,683,577 | 38,731,225 | 47,854,718 | |||||||||||||||
| End of period | $ | 35,765,182 | $ | 40,311,521 | $ | 37,280,186 | $ | 38,731,225 | |||||||||||
| Undistributed net investment income, at end of period | $ | 128,856 | $ | 140,220 | $ | 349,092 | $ | 482,730 | |||||||||||
| Change in shares: | |||||||||||||||||||
| Subscriptions | 51,129 | 458,901 | 186,275 | 227,396 | |||||||||||||||
| Issued for distributions reinvested | 94,075 | 5,349 | 197,376 | 27,061 | |||||||||||||||
| Redemptions | (388,044 | ) | (974,348 | ) | (336,132 | ) | (1,480,049 | ) | |||||||||||
| Net increase (decrease) | (242,840 | ) | (510,098 | ) | 47,519 | (1,225,592 | ) | ||||||||||||
See Accompanying Notes to Financial Statements.
129
STATEMENTS OF CHANGES IN NET ASSETS
| CMG Mid Cap Growth Fund | CMG Mid Cap Value Fund | ||||||||||||||||||
| Year Ended July 31, | Year Ended July 31, | ||||||||||||||||||
| 2006 | 2005 | 2006 | 2005 | ||||||||||||||||
| Operations: | |||||||||||||||||||
| Net investment income (loss) | $ | 20,930 | $ | (42,193 | ) | $ | 194,099 | $ | 177,527 | ||||||||||
| Net realized gain on investments and foreign currency transactions | 2,629,036 | 1,198,457 | 2,848,500 | 2,034,357 | |||||||||||||||
| Net change in unrealized appreciation (depreciation) on investments and foreign currency translations | (433,276 | ) | 3,842,377 | (1,416,716 | ) | 2,345,276 | |||||||||||||
| Net increase from operations | 2,216,690 | 4,998,641 | 1,625,883 | 4,557,160 | |||||||||||||||
| Distributions declared to shareholders: | |||||||||||||||||||
| From net investment income | - | - | (193,534 | ) | (147,310 | ) | |||||||||||||
| From net realized gains | (596,195 | ) | - | (2,793,995 | ) | (163,069 | ) | ||||||||||||
| Total distributions declared to shareholders | (596,195 | ) | - | (2,987,529 | ) | (310,379 | ) | ||||||||||||
| Share transactions: | |||||||||||||||||||
| Subscriptions | 2,478,025 | 6,916,364 | 989,569 | 1,333,206 | |||||||||||||||
| Distributions reinvested | 256,151 | - | 1,221,997 | 93,631 | |||||||||||||||
| Redemptions | (5,599,689 | ) | (6,317,811 | ) | (4,365,601 | ) | (6,390,522 | ) | |||||||||||
| Net increase (decrease) in share transactions | (2,865,513 | ) | 598,553 | (2,154,035 | ) | (4,963,685 | ) | ||||||||||||
| Net increase (decrease) in net assets | (1,245,018 | ) | 5,597,194 | (3,515,681 | ) | (716,904 | ) | ||||||||||||
| NET ASSETS: | |||||||||||||||||||
| Beginning of period | 24,880,708 | 19,283,514 | 21,277,295 | 21,994,199 | |||||||||||||||
| End of period | $ | 23,635,690 | $ | 24,880,708 | $ | 17,761,614 | $ | 21,277,295 | |||||||||||
| Undistributed net investment income, at end of period | $ | 16,910 | $ | - | $ | 82,198 | $ | 86,708 | |||||||||||
| Accumulated net investment loss, at end of period | $ | - | $ | (1,732 | ) | $ | - | $ | - | ||||||||||
| Change in shares: | |||||||||||||||||||
| Subscriptions | 161,008 | 523,196 | 69,276 | 99,662 | |||||||||||||||
| Issued for distributions reinvested | 17,122 | - | 91,536 | 6,769 | |||||||||||||||
| Redemptions | (358,183 | ) | (511,129 | ) | (295,964 | ) | (452,689 | ) | |||||||||||
| Net increase (decrease) | (180,053 | ) | 12,067 | (135,152 | ) | (346,258 | ) | ||||||||||||
See Accompanying Notes to Financial Statements.
130
STATEMENTS OF CHANGES IN NET ASSETS
| CMG Small Cap Growth Fund | CMG Small Cap Value Fund | ||||||||||||||||||
| Year Ended July 31, | Year Ended July 31, | ||||||||||||||||||
| 2006 | 2005 | 2006 | 2005 | ||||||||||||||||
| Operations: | |||||||||||||||||||
| Net investment income (loss) | $ | (241,357 | ) | $ | (677,591 | ) | $ | 214,137 | $ | 314,346 | |||||||||
| Net realized gain on investments and foreign currency transactions | 9,398,939 | 46,457,512 | 4,366,840 | 3,348,725 | |||||||||||||||
| Net change in unrealized appreciation (depreciation) on investments | (11,061,310 | ) | (25,488,632 | ) | (1,837,919 | ) | 5,239,285 | ||||||||||||
| Net increase (decrease) from operations | (1,903,728 | ) | 20,291,289 | 2,743,058 | 8,902,356 | ||||||||||||||
| Distributions declared to shareholders: | |||||||||||||||||||
| From net investment income | - | - | (279,581 | ) | (284,580 | ) | |||||||||||||
| From net realized gains | (8,639,807 | ) | - | (3,938,120 | ) | (2,878,862 | ) | ||||||||||||
| Total distributions declared to shareholders | (8,639,807 | ) | - | (4,217,701 | ) | (3,163,442 | ) | ||||||||||||
| Share transactions: | |||||||||||||||||||
| Subscriptions | 5,297,768 | 4,562,259 | 2,488,587 | 4,687,869 | |||||||||||||||
| Proceeds received in connection with merger | 40,504,741 | - | - | - | |||||||||||||||
| Distributions reinvested | 5,234,864 | - | 2,926,706 | 1,901,545 | |||||||||||||||
| Redemptions | (30,627,476 | ) | (286,564,984 | ) | (7,490,753 | ) | (15,695,410 | ) | |||||||||||
| Net increase (decrease) in share transactions | 20,409,897 | (282,002,725 | ) | (2,075,460 | ) | (9,105,996 | ) | ||||||||||||
| Net increase (decrease) in net assets | 9,866,362 | (261,711,436 | ) | (3,550,103 | ) | (3,367,082 | ) | ||||||||||||
| NET ASSETS: | |||||||||||||||||||
| Beginning of period | 30,316,830 | 292,028,266 | 36,989,277 | 40,356,359 | |||||||||||||||
| End of period | $ | 40,183,192 | $ | 30,316,830 | $ | 33,439,174 | $ | 36,989,277 | |||||||||||
| Undistributed net investment income, at end of period | $ | - | $ | - | $ | 104,160 | $ | 169,604 | |||||||||||
| Accumulated net investment loss, at end of period | $ | (15,114 | ) | $ | (5,022 | ) | $ | - | $ | - | |||||||||
| Change in shares: | |||||||||||||||||||
| Subscriptions | 2,641,989 | 801,259 | 160,463 | 322,487 | |||||||||||||||
| Issued in connection with merger | 18,087,654 | - | - | - | |||||||||||||||
| Issued for distributions reinvested | 2,670,849 | - | 203,243 | 124,773 | |||||||||||||||
| Redemptions | (8,212,815 | ) | (53,836,059 | ) | (481,975 | ) | (1,045,818 | ) | |||||||||||
| Net increase (decrease) | 15,187,677 | (53,034,800 | ) | (118,269 | ) | (598,558 | ) | ||||||||||||
See Accompanying Notes to Financial Statements.
131
STATEMENTS OF CHANGES IN NET ASSETS
| CMG Small/Mid Cap Fund | CMG International Stock Fund | ||||||||||||||||||
| Year Ended July 31, | Year Ended July 31, | ||||||||||||||||||
| 2006 | 2005 | 2006 | 2005 | ||||||||||||||||
| Operations: | |||||||||||||||||||
| Net investment income (loss) | $ | (94,429 | ) | $ | (162,021 | ) | $ | 2,145,229 | $ | 2,249,362 | |||||||||
| Net realized gain on investments and foreign currency transactions | 7,685,179 | 12,002,485 | 23,690,227 | 12,958,426 | |||||||||||||||
| Net change in unrealized appreciation (depreciation) on investments, foreign currency translations and foreign capital gains tax | (4,880,243 | ) | (736,986 | ) | 1,019,388 | 9,070,617 | |||||||||||||
| Net increase from operations | 2,710,507 | 11,103,478 | 26,854,844 | 24,278,405 | |||||||||||||||
| Distributions declared to shareholders: | |||||||||||||||||||
| From net investment income | - | - | (2,041,358 | ) | (1,284,092 | ) | |||||||||||||
| From net realized gains | (1,443,974 | ) | - | (14,728,492 | ) | (3,640,598 | ) | ||||||||||||
| Total distributions declared to shareholders | (1,443,974 | ) | - | (16,769,850 | ) | (4,924,690 | ) | ||||||||||||
| Share transactions: | |||||||||||||||||||
| Subscriptions | - | 4,646,441 | 7,527,480 | 15,229,078 | |||||||||||||||
| Distributions reinvested | 1,443,974 | - | 10,430,452 | 2,823,586 | |||||||||||||||
| Redemptions | (32,692,430 | ) | (27,656,623 | ) | (58,449,515 | ) | (53,513,076 | ) | |||||||||||
| Net decrease in share transactions | (31,248,456 | ) | (23,010,182 | ) | (40,491,583 | ) | (35,460,412 | ) | |||||||||||
| Net decrease in net assets | (29,981,923 | ) | (11,906,704 | ) | (30,406,589 | ) | (16,106,697 | ) | |||||||||||
| NET ASSETS: | |||||||||||||||||||
| Beginning of period | 38,754,879 | 50,661,583 | 136,144,228 | 152,250,925 | |||||||||||||||
| End of period | $ | 8,772,956 | $ | 38,754,879 | $ | 105,737,639 | $ | 136,144,228 | |||||||||||
| Undistributed net investment income, at end of period | $ | - | $ | - | $ | 1,450,664 | $ | 1,525,484 | |||||||||||
| Accumulated net investment loss, at end of period | $ | (4,738 | ) | $ | (2,107 | ) | $ | - | $ | - | |||||||||
| Change in shares: | |||||||||||||||||||
| Subscriptions | - | 439,948 | 534,955 | 1,177,932 | |||||||||||||||
| Issued for distributions reinvested | 132,353 | - | 788,394 | 209,932 | |||||||||||||||
| Redemptions | (2,724,333 | ) | (2,842,595 | ) | (3,989,516 | ) | (3,998,529 | ) | |||||||||||
| Net decrease | (2,591,980 | ) | (2,402,647 | ) | (2,666,167 | ) | (2,610,665 | ) | |||||||||||
See Accompanying Notes to Financial Statements.
132
NOTES TO FINANCIAL STATEMENTS
July 31, 2006
Note 1. Organization:
Columbia Funds Institutional Trust (the "Trust") is a Massachusetts business trust registered under the Investment Company Act of 1940, as amended, as an open-end management investment company. Information presented in these financial statements pertains to the following diversified funds (individually referred to as a "Fund", collectively referred to as the "Funds"):
CMG Enhanced S&P 500® Index Fund
CMG Large Cap Growth Fund
CMG Large Cap Value Fund
CMG Mid Cap Growth Fund
CMG Mid Cap Value Fund
CMG Small Cap Growth Fund
CMG Small Cap Value Fund
CMG Small/Mid Cap Fund
CMG International Stock Fund
Shares in the Funds are available for purchase by institutional buyers and certain advisory clients of Columbia Management Advisors, LLC ("Columbia") or one of its affiliates. Each Fund's minimum initial investment requirement for investors purchasing shares directly from Columbia is $3 million. Each Fund may waive the investment minimum in its sole discretion. Please see the Funds' prospectuses for further details.
Effective March 27, 2006, each Fund was redomiciled into a new series of Columbia Funds Institutional Trust. Immediately following the redomiciling, CMG Small Cap Growth Fund was reorganized into CMG Small Cap Fund. CMG Small Cap Fund then changed its name to CMG Small Cap Growth Fund. Prior to March 27, 2006, each Fund was a series of CMG Fund Trust.
Investment goals. CMG Enhanced S&P 500® Index Fund seeks to outperform the total return, over the long run, of the Standard & Poor's 500 Composite Stock Index (the "S&P 500®"). CMG Large Cap Growth Fund and CMG Large Cap Value Fund seek long-term growth by investing primarily in large capitalization equities. CMG Mid Cap Growth Fund and CMG Mid Cap Value Fund seek long-term growth by investing primarily in middle capitalization equities. CMG Small Cap Growth Fund seeks long-term capital appreciation by investing primarily in smaller capitalization companies. CMG Small Cap Value Fund seeks long-term growth by investing primarily in small capitalization equities. CMG Small/Mid Cap Fund seeks long-term capital appreciation by investing in small and middle capitalization equities. CMG International Stock Fund seeks long- term capital appreciation.
Fund shares. Each Fund may issue an unlimited number of shares of beneficial interest, which are offered continuously at net asset value.
Note 2. Significant accounting policies:
Use of estimates. The preparation of financial statements in conformity with accounting principles generally accepted in the United States of America ("GAAP") requires management to make estimates and assumptions that affect the reported amounts of assets and liabilities, the disclosure of contingent assets and liabilities at the date of the financial statements and the reported amounts of revenue and expenses during the reporting period. Actual results could differ from those estimates. The following is a summary of significant accounting policies consistently followed by the Funds in the preparation of their financial statements.
133
NOTES TO FINANCIAL STATEMENTS (continued)
July 31, 2006
Security valuation. Equity securities, exchange traded funds and securities of certain investment companies are valued at the last sale price on the principal exchange on which they trade, except for securities traded on the NASDAQ, which are valued at the NASDAQ official close price. Unlisted securities or listed securities for which there were no sales during the day are valued at the closing bid price on such exchanges or over-the-counter markets.
Short-term debt obligations maturing within 60 days are valued at amortized cost, which approximates market value.
Futures contracts are valued at the settlement price established each day by the board of trade or exchange on which they are traded.
Foreign securities are generally valued at the last sale price on the foreign exchange or market on which they trade. If any foreign share prices are not readily available as a result of limited share activity, the securities are valued at the last sale price of the local shares in the principal market in which such securities are normally traded.
Generally, trading in foreign securities is substantially completed each day at various times prior to the close of the New York Stock Exchange ("NYSE"). The values of such securities used in computing the net asset value of the Funds' shares are determined as of such times. Foreign currency exchange rates are generally determined at 4:00 p.m. Eastern (U.S.) time. Events affecting the values of such foreign securities and such exchange rates may occur between the times at which they are determined and the close of the customary trading session of the NYSE, which would not be reflected in the computation of the Funds' net asset value. If events materially affecting the values of such foreign securities occur and it is determined that market quotations are not reliable, then these foreign securities will be valued at their fair value using procedures approved by the Board of Trustees. The CMG International Stock Fund may use a sys tematic fair valuation model provided by an independent third party to value securities principally traded in foreign markets in order to adjust for possible stale pricing that may occur between the close of the foreign exchanges and the time for valuation. If a security is valued at a "fair value", such value is likely to be different from the last quoted market price for the security.
Investments for which market quotations are not readily available, or that have quotations which management believes are not appropriate, are valued at fair value as determined in good faith under consistently applied procedures established by and under the general supervision of the Board of Trustees.
Security transactions. Security transactions are accounted for on the trade date. Cost is determined and gains (losses) are based upon the specific identification method for both financial statement and federal income tax purposes.
Repurchase agreements. Each Fund may engage in repurchase agreement transactions with institutions that the Funds' investment advisor has determined are creditworthy. Each Fund, through its custodian, receives delivery of underlying securities collateralizing a repurchase agreement. Collateral is at least equal, at all times, to the value of the repurchase obligation including interest. A repurchase agreement transaction involves certain risks in the event of default or insolvency of the counterparty. These risks include possible delays or restrictions upon each Fund's ability to dispose of the underlying securities and a possible decline in the value of the underlying securities during the period while the Funds seek to assert their rights.
Futures contracts. Certain Funds may invest in futures contracts to hedge against the effects of changes in the value of portfolio securities due to anticipated changes in interest rates and/or market conditions, for duration management, or when the transactions are economically appropriate to the reduction of risk inherent in the management of the Funds and not for trading purposes. The use of futures contracts involves certain risks, which include: (1) imperfect correlation between the price movement of the instruments and the underlying securities, (2) inability to close out positions due to differing trading hours, or the temporary absence of a liquid market, for either the instrument or the underlying securities, or (3) an inaccurate prediction by Columbia Management Advisors, LLC of the future direction
134
NOTES TO FINANCIAL STATEMENTS (continued)
July 31, 2006
of interest rates. Any of these risks may involve amounts exceeding the variation margin recorded in the Funds' Statements of Assets and Liabilities at any given time.
Upon entering into a futures contract, each Fund deposits cash or securities with the broker in an amount sufficient to meet the initial margin requirement. Subsequent payments are made or received by the Funds equal to the daily change in the contract value and are recorded as variation margin receivable or payable and offset in unrealized gains or losses. The Funds recognize a realized gain or loss when the contract is closed or expires.
Income recognition. Interest income is recorded on the accrual basis. Corporate actions and dividend income are recorded on the ex-date, except for certain foreign securities which are recorded as soon after ex-date as the Funds become aware of such, net of non-reclaimable tax withholdings. The Funds estimate components of distributions from real estate investment trusts (REITs). Distributions received from REITs in excess of income are recorded as a reduction of the cost of the related investments and/or realized gain, as applicable. If the Funds no longer own the applicable securities, any distributions received in excess of income are recorded as realized gains.
Foreign currency transactions. The values of all assets and liabilities quoted in foreign currencies are translated into U.S. dollars at that day's exchange rates. Net realized and unrealized gains (losses) on foreign currency transactions include gains (losses) arising from the fluctuation in exchange rates between trade and settlement dates on securities transactions, gains (losses) arising from the disposition of foreign currency and currency gains (losses) between the accrual and payment dates on dividends, interest income and foreign withholding taxes.
For financial statement purposes, the Funds do not distinguish that portion of gains (losses) on investments which is due to changes in foreign exchange rates from that which is due to changes in market prices of the investments. Such fluctuations are included with the net realized and unrealized gains (losses) on investments.
Federal income tax status. Each Fund intends to qualify each year as a "regulated investment company" under Subchapter M of the Internal Revenue Code, as amended, and will distribute substantially all of its taxable income, if any, for its tax year, and as such will not be subject to federal income taxes. In addition, each Fund intends to distribute in each calendar year substantially all of its net investment income, capital gains and certain other amounts, if any, such that each Fund should not be subject to federal excise tax. Therefore, no federal income or excise tax provision is recorded.
Distributions to shareholders. Distributions to shareholders are recorded on the ex-dividend date. Net realized capital gains, if any, are distributed at least annually.
Note 3. Federal tax information:
The timing and character of income and capital gain distributions are determined in accordance with income tax regulations, which may differ from GAAP. Reclassifications are made to the Funds' capital accounts for permanent tax differences to reflect income and gains available for distribution (or available capital loss carryforwards) under income tax regulations.
135
NOTES TO FINANCIAL STATEMENTS (continued)
July 31, 2006
For the year ended July 31, 2006, permanent book and tax basis differences resulting primarily from differing treatments for Section 988 foreign currency transactions, net operating losses, distribution reclassifications and REIT adjustments were identified and reclassified among the components of the Funds' net assets as follows:
| Undistributed or Accumulated Net Investment Income (Loss) | Accumulated Net Realized Gain | Paid-In Capital | |||||||||||||
| CMG Enhanced S&P 500® Index Fund | $ | (4,358 | ) | $ | 4,358 | $ | - | ||||||||
| CMG Large Cap Growth Fund | (3,298 | ) | 3,298 | - | |||||||||||
| CMG Large Cap Value Fund | (11,643 | ) | 11,643 | - | |||||||||||
| CMG Mid Cap Growth Fund | (2,288 | ) | 2,288 | - | |||||||||||
| CMG Mid Cap Value Fund | (5,075 | ) | 5,075 | - | |||||||||||
| CMG Small Cap Growth Fund | 231,265 | (312,229 | ) | 80,964 | |||||||||||
| CMG Small Cap Value Fund | - | - | - | ||||||||||||
| CMG Small/Mid Cap Fund | 91,798 | (91,798 | ) | - | |||||||||||
| CMG International Stock Fund | (178,691 | ) | 178,691 | - | |||||||||||
Net investment income and net realized gains (losses), as disclosed on the Statements of Operations, and net assets were not affected by these reclassifications.
The tax character of distributions paid during the years ended July 31, 2006 and July 31, 2005 was as follows:
| July 31, 2006 | |||||||||||
| Ordinary Income* | Long-Term Capital Gains | ||||||||||
| CMG Enhanced S&P 500® Index Fund | $ | 3,814,830 | $ | 2,128,118 | |||||||
| CMG Large Cap Growth Fund | 563,021 | 1,789,275 | |||||||||
| CMG Large Cap Value Fund | 1,661,382 | 3,342,596 | |||||||||
| CMG Mid Cap Growth Fund | 209,153 | 387,042 | |||||||||
| CMG Mid Cap Value Fund | 1,001,723 | 1,985,806 | |||||||||
| CMG Small Cap Growth Fund | 281,083 | 8,358,724 | |||||||||
| CMG Small Cap Value Fund | 1,247,123 | 2,970,578 | |||||||||
| CMG Small/Mid Cap Fund | 241,708 | 1,202,266 | |||||||||
| CMG International Stock Fund | 2,772,501 | 13,997,349 | |||||||||
| July 31, 2005 | |||||||||||
| Ordinary Income* | Long-Term Capital Gains | ||||||||||
| CMG Enhanced S&P 500® Index Fund | $ | 2,576,992 | $ | 32,620 | |||||||
| CMG Large Cap Growth Fund | 349,571 | - | |||||||||
| CMG Large Cap Value Fund | 1,050,685 | 160 | |||||||||
| CMG Mid Cap Growth Fund | - | - | |||||||||
| CMG Mid Cap Value Fund | 303,737 | 6,642 | |||||||||
| CMG Small Cap Growth Fund | 1,856,510 | 431,538 | |||||||||
| CMG Small Cap Value Fund | 2,640,925 | 522,517 | |||||||||
| CMG Small/Mid Cap Fund | - | - | |||||||||
| CMG International Stock Fund | 1,263,220 | 3,661,470 | |||||||||
* For tax purposes short-term capital gains distributions, if any, are considered ordinary income distributions.
136
NOTES TO FINANCIAL STATEMENTS (continued)
July 31, 2006
As of July 31, 2006, the components of distributable earnings on a tax basis were as follows:
| Undistributed Ordinary Income | Undistributed Long-term Capital Gains | Net Unrealized Appreciation* | |||||||||||||
| CMG Enhanced S&P 500® Index Fund | $ | 2,467,466 | $ | 4,990,470 | $ | 8,542,974 | |||||||||
| CMG Large Cap Growth Fund | 133,126 | 1,446,509 | 1,865,953 | ||||||||||||
| CMG Large Cap Value Fund | 696,575 | 1,908,599 | 4,424,070 | ||||||||||||
| CMG Mid Cap Growth Fund | 679,517 | 1,543,997 | 3,528,656 | ||||||||||||
| CMG Mid Cap Value Fund | 549,246 | 1,548,605 | 2,544,119 | ||||||||||||
| CMG Small Cap Growth Fund | 4,099,467 | 3,589,461 | 3,276,589 | ||||||||||||
| CMG Small Cap Value Fund | 470,244 | 2,977,109 | 9,103,631 | ||||||||||||
| CMG Small/Mid Cap Fund | 2,786,513 | 3,733,409 | 1,274,681 | ||||||||||||
| CMG International Stock Fund | 7,546,105 | 13,169,851 | 17,908,194 | ||||||||||||
* The differences between book-basis and tax-basis net unrealized appreciation are primarily due to deferral of losses from wash sales and changes in the value of assets and liabilities resulting from changes in exchange rates.
Unrealized appreciation and depreciation at July 31, 2006, based on cost of investments for federal income tax purposes, excluding any unrealized appreciation and depreciation from changes in the value of other assets and liabilities resulting from changes in exchange rates, was:
| Unrealized Appreciation | Unrealized Depreciation | Net Unrealized Appreciation | |||||||||||||
| CMG Enhanced S&P 500® Index Fund | $ | 12,460,666 | $ | (3,917,692 | ) | $ | 8,542,974 | ||||||||
| CMG Large Cap Growth Fund | 2,446,834 | (580,881 | ) | 1,865,953 | |||||||||||
| CMG Large Cap Value Fund | 5,021,442 | (597,372 | ) | 4,424,070 | |||||||||||
| CMG Mid Cap Growth Fund | 4,262,587 | (733,931 | ) | 3,528,656 | |||||||||||
| CMG Mid Cap Value Fund | 2,844,462 | (300,343 | ) | 2,544,119 | |||||||||||
| CMG Small Cap Growth Fund | 5,758,004 | (2,481,415 | ) | 3,276,589 | |||||||||||
| CMG Small Cap Value Fund | 9,761,248 | (657,617 | ) | 9,103,631 | |||||||||||
| CMG Small/Mid Cap Fund | 1,616,520 | (341,839 | ) | 1,274,681 | |||||||||||
| CMG International Stock Fund | 19,577,064 | (1,673,183 | ) | 17,903,881 | |||||||||||
The following capital loss carryforwards, determined as of July 31, 2006, may be available to reduce taxable income arising from future net realized gains on investments, if any, to the extent permitted by the Internal Revenue Code:
| Year of Expiration | |||||||||||||||
| 2010 | 2011 | Total | |||||||||||||
| CMG International Stock Fund | $ | 1,072,288 | $ | 420,427 | $ | 1,492,715 | |||||||||
Capital loss carryforwards of $1,646,856 were utilized during the year ended July 31, 2006 for CMG International Stock Fund.
In June 2006, the Financial Accounting Standards Board ("FASB") issued FASB Interpretation No. 48, Accounting for Uncertainty in Income Taxes, an Interpretation of FASB Statement No. 109 (the "Interpretation"). This Interpretation is effective for fiscal years beginning after December 15, 2006 and is to be applied to tax positions upon initial adoption. This Interpretation prescribes a minimum recognition threshold and measurement method for the financial statement recognition of tax positions taken or expected to be taken in a tax return and also requires certain expanded disclosures. Management has recently begun to evaluate the application of this Interpretation to the Funds and has not at this time quantified the impact, if any, resulting from the adoption of this Interpretati on on each Fund's financial statements.
137
NOTES TO FINANCIAL STATEMENTS (continued)
July 31, 2006
Note 4. Fees and compensation paid to affiliates:
Investment advisory fee. Columbia, an indirect, wholly-owned subsidiary of Bank of America Corporation ("BOA"), is the investment advisor to the Funds. Prior to September 30, 2005, Columbia Management Advisors, Inc. was the investment advisor to the Funds under the same fee structure. On September 30, 2005, Columbia Management Advisors, Inc. merged into Banc of America Capital Management, LLC. At that time, the investment advisor was then renamed Columbia Management Advisors, LLC.
With the exception of CMG Small Cap Growth Fund, each Fund's investment advisory fee is a unified fee. Columbia, out of the unified fee it receives from the Funds, pays all accounting fees, legal fees, transfer agent fees, custody fees and miscellaneous expenses of the Funds. The unified fee does not include brokerage fees, taxes, Trustees' fees, Trustee legal counsel fees, audit fees, interest expense associated with any borrowings by the Funds or extraordinary expenses, if any. The unified fees are paid monthly to Columbia based on each Fund's average daily net assets at the following annual rates:
| CMG Enhanced S&P 500® Index Fund | 0.25 | % | |||||
| CMG Large Cap Growth Fund | 0.50 | % | |||||
| CMG Large Cap Value Fund | 0.50 | % | |||||
| CMG Mid Cap Growth Fund | 0.70 | % | |||||
| CMG Mid Cap Value Fund | 0.70 | % | |||||
| CMG Small Cap Value Fund | 0.80 | % | |||||
| CMG Small/Mid Cap Fund | 0.75 | % | |||||
| CMG International Stock Fund | 0.75 | % | |||||
Columbia receives a monthly investment advisory fee from CMG Small Cap Growth Fund at the annual rate of 0.75% of the Fund's average daily net assets.
Pricing & bookkeeping fees. Columbia is responsible for providing pricing and bookkeeping services to each Fund under a pricing, bookkeeping and fund administration agreement. Under a separate agreement (the "Outsourcing Agreement"), Columbia has delegated certain of those functions to State Street Corporation ("State Street"). As a result, Columbia pays fees to State Street under the Outsourcing Agreement. The pricing and bookkeeping fees for each Fund, with the exception of CMG Small Cap Growth Fund, are included in the unified fee. The CMG Small Cap Growth Fund is not charged a fee for pricing and bookkeeping services.
Transfer agent fee. Columbia Management Services, Inc. (the "Transfer Agent"), an affiliate of Columbia and an indirect, wholly-owned subsidiary of BOA, provides shareholder services to the Funds and has contracted with Boston Financial Data Services ("BFDS") to serve as sub-transfer agent. The transfer agent fees for each Fund, with the exception of CMG Small Cap Growth Fund, are included in the unified fee.
The Transfer Agent may also retain, as additional compensation for its services, fees for wire, telephone and redemption orders, IRA trustee agent fees and account transcript fees due the Transfer Agent from shareholders of the Funds and credits (net of bank charges) earned with respect to balances in accounts the Transfer Agent maintains in connection with its services to the Funds.
The Transfer Agent is entitled to receive a fee from CMG Small Cap Growth Fund, paid monthly, at the annual rate of $17.00 per open account plus sub-transfer agent fees (exclusive of BFDS fees) calculated based on assets held in omnibus accounts and intended to recover the cost of payments to third parties for services to those accounts. The annual rate was $15.23 from November 1, 2005 through March 31, 2006.
138
NOTES TO FINANCIAL STATEMENTS (continued)
July 31, 2006
Prior to November 1, 2005, the Transfer Agent received a fee from the former CMG Small Cap Fund at the annual rate of $28.00 per open account. For the period from September 1, 2005 through October 31, 2005, the Transfer Agent voluntarily waived fees of $23 for the former CMG Small Cap Fund. For the year ended July 31, 2006, the effective transfer agent fee rate for CMG Small Cap Growth Fund, net of fee waivers, was less than 0.01% of the Fund's average daily net assets.
Expense limits and fee waivers. Columbia has contractually agreed to reimburse each Fund, with the exception of CMG Small Cap Growth Fund, through March 1, 2009 for certain expenses so that the expenses incurred by the Funds, including the investment advisory fees, will not exceed the following annual rates (exclusive of brokerage commissions, interest, taxes and extraordinary expenses, if any) based on each Fund's average daily net assets:
| CMG Enhanced S&P 500® Index Fund | 0.25 | % | |||||
| CMG Large Cap Growth Fund | 0.50 | % | |||||
| CMG Large Cap Value Fund | 0.50 | % | |||||
| CMG Mid Cap Growth Fund | 0.70 | % | |||||
| CMG Mid Cap Value Fund | 0.70 | % | |||||
| CMG Small Cap Value Fund | 0.80 | % | |||||
| CMG Small/Mid Cap Fund | 0.75 | % | |||||
| CMG International Stock Fund | 0.75 | % | |||||
Effective March 27, 2006, Columbia and its affiliates have contractually agreed to waive fees and reimburse the CMG Small Cap Growth Fund until November 30, 2009, for certain expenses so that total expenses (exclusive of brokerage commissions, interest, taxes and extraordinary expenses, if any) will not exceed 0.80% annually of the Fund's average daily net assets. There is no guarantee that this arrangement will continue after November 30, 2009.
Custody credits. CMG Small Cap Growth Fund has an agreement with its custodian bank under which custody fees may be reduced by balance credits. These credits are recorded as a reduction of total expenses on the Statements of Operations. The Fund could have invested a portion of the assets utilized in connection with the expense offset arrangement in an income-producing asset if it had not entered into such an agreement.
Fees paid to officers and trustees. All officers of the Funds, with the exception of the Funds' Chief Compliance Officer, are employees of Columbia or its affiliates and receive no compensation from the Funds. The Board of Trustees has appointed a Chief Compliance Officer to the Funds in accordance with federal securities regulations. The expenses of the Chief Compliance Officer for each Fund, with the exception of CMG Small Cap Growth Fund, are included in the unified fee. CMG Small Cap Growth Fund, along with other affiliated funds, pays its pro-rata share of the expenses associated with the Chief Compliance Officer. CMG Small Cap Growth Fund's expenses for the Chief Compliance Officer will not exceed $15,000 per year.
The Funds' Trustees may participate in a deferred compensation plan which may be terminated at any time. Obligations of the plan will be paid solely out of the Funds' assets.
Other. Columbia provides certain services to the Funds related to Sarbanes-Oxley compliance. The fees for such services for each Fund, with the exception of CMG Small Cap Growth Fund, are included in the unified fee. For the year ended July 31, 2006, CMG Small Cap Growth Fund paid $2,201 to Columbia for such services. This amount is included in "Other expenses" on the Statement of Operations.
139
NOTES TO FINANCIAL STATEMENTS (continued)
July 31, 2006
Note 5. Portfolio information:
For the year ended July 31, 2006, the cost of purchases and proceeds from sales of securities, excluding short-term obligations, were as follows:
| Purchases | Sales | ||||||||||
| CMG Enhanced S&P 500® Index Fund | $ | 62,674,607 | $ | 59,390,599 | |||||||
| CMG Large Cap Growth Fund | 67,038,429 | 70,683,353 | |||||||||
| CMG Large Cap Value Fund | 35,568,806 | 40,268,501 | |||||||||
| CMG Mid Cap Growth Fund | 15,851,238 | 21,100,176 | |||||||||
| CMG Mid Cap Value Fund | 11,087,190 | 15,780,017 | |||||||||
| CMG Small Cap Growth Fund | 32,290,224 | 61,688,630 | |||||||||
| CMG Small Cap Value Fund | 13,508,259 | 19,444,920 | |||||||||
| CMG Small/Mid Cap Fund | 23,023,064 | 55,753,037 | |||||||||
| CMG International Stock Fund | 99,686,776 | 153,320,954 | |||||||||
Note 6. Line of credit:
The Funds and other affiliated funds participate in a $350,000,000 committed unsecured revolving line of credit provided by State Street Bank and Trust Company. Borrowings are used for temporary or emergency purposes to facilitate portfolio liquidity. Interest is charged to each participating fund based on its borrowings at a rate per annum equal to the Federal Funds rate plus 0.50%. In addition, a commitment fee of 0.10% per annum is accrued and apportioned among the participating funds based on their pro-rata portion of the unutilized line of credit. The commitment fee is included in the unified fee, with the exception of CMG Small Cap Growth Fund.
For the year ended July 31, 2006, the average daily loan balance outstanding on days where borrowings existed and the weighted average interest rates for Funds that participated in this arrangement are as follows:
| Average Borrowings | Weighted Average Interest Rates | ||||||||||
| CMG Enhanced S&P 500® Index Fund | $ | 1,800,000 | 4.53 | % | |||||||
| CMG Large Cap Growth Fund | 1,000,000 | 4.77 | % | ||||||||
| CMG Small Cap Value Fund | 1,000,000 | 5.61 | % | ||||||||
| CMG International Stock Fund | 3,352,941 | 4.95 | % | ||||||||
140
NOTES TO FINANCIAL STATEMENTS (continued)
July 31, 2006
Note 7. Shares of beneficial interest:
As of July 31, 2006, the Funds had shareholders whose shares were beneficially owned by participant accounts over which Bank of America and/or its affiliates had either sole or joint investment discretion. Subscription and redemption activity of these accounts may have a significant effect on the operations of the Funds. The percentage of shares of beneficial interest outstanding held therein are as follows:
| % of Shares Outstanding Held | |||||||
| CMG Enhanced S&P 500® Index Fund | 100.0 | % | |||||
| CMG Large Cap Growth Fund | 100.0 | % | |||||
| CMG Large Cap Value Fund | 100.0 | % | |||||
| CMG Mid Cap Growth Fund | 100.0 | % | |||||
| CMG Mid Cap Value Fund | 100.0 | % | |||||
| CMG Small Cap Growth Fund | 97.9 | % | |||||
| CMG Small Cap Value Fund | 97.4 | % | |||||
| CMG International Stock Fund | 100.0 | % | |||||
In addition, as of July 31, 2006, CMG Small/Mid Cap Fund had one shareholder that held 100.0% of the shares outstanding. Subscription and redemption activity of this shareholder may have a material effect on the Fund.
Note 8. Other:
During the year ended July 31, 2006, CMG Large Cap Value Fund, CMG Small Cap Value Fund and CMG Small/Mid Cap Fund each had a realized loss due to a trading error. These losses of $694, $474 and $1,551, respectively, were reimbursed by Columbia.
Note 9. Disclosure of significant risks and contingencies:
Foreign securities. There are certain additional risks involved when investing in foreign securities that are not inherent with investments in domestic securities. These risks may involve foreign currency exchange rate fluctuations, adverse political and economic developments and the possible prevention of currency exchange or other foreign governmental laws or restrictions. In addition, the liquidity of foreign securities may be more limited than that of domestic securities.
Investments in emerging market countries are subject to additional risk. The risk of foreign investments is typically increased in less developed countries. These countries are also more likely to experience high levels of inflation, deflation or currency devaluation which could hurt their economies and securities markets.
Industry focus. The Funds may focus their investments in certain industries, subjecting them to greater risk than a fund that is more diversified.
Legal proceedings. On February 9, 2005, Columbia Management Advisors, Inc. (which has since merged into Banc of America Capital Management, LLC (now named Columbia Management Advisors, LLC) ("Columbia") and Columbia Funds Distributor, Inc. (which has been renamed Columbia Management Distributors, Inc.) (the "Distributor") (collectively, the "Columbia Group") entered into an Assurance of Discontinuance with the New York Attorney General ("NYAG") (the "NYAG Settlement") and consented to the entry of a cease-and-desist order by the Securities and Exchange Commission ("SEC") (the "SEC Order"). The SEC Order and the NYAG Settlement are referred to
141
NOTES TO FINANCIAL STATEMENTS (continued)
July 31, 2006
collectively as the "Settlements". The Settlements contain substantially the same terms and conditions as outlined in the agreements in principle which Columbia Group entered into with the SEC and NYAG in March 2004.
Under the terms of the SEC Order, the Columbia Group has agreed among other things, to: pay $70 million in disgorgement and $70 million in civil money penalties; cease and desist from violations of the antifraud provisions and certain other provisions of the federal securities laws; maintain certain compliance and ethics oversight structures; retain an independent consultant to review the Columbia Group's applicable supervisory, compliance, control and other policies and procedures; and retain an independent distribution consultant (see below). The Columbia Funds have also voluntarily undertaken to implement certain governance measures designed to maintain the independence of their boards of trustees. The NYAG Settlement also, among other things, requires Columbia Management and its affiliates, Banc of America Capital Management, LLC and BACAP Distributors, LLC to reduce certain Columbia Funds, Nations Funds and other mutual fun ds management fees collectively by $32 million per year for five years, for a projected total of $160 million in management fee reductions.
Pursuant to the procedures set forth in the SEC order, the $140 million in settlement amounts described above will be distributed in accordance with a distribution plan developed by an independent distribution consultant and approved by the SEC. The independent distribution consultant has been in consultation with the staff of the SEC and has submitted a proposed plan of distribution. The SEC has not yet approved a final plan of distribution.
As a result of these matters or any adverse publicity or other developments resulting from them, there may be increased redemptions or reduced sales of fund shares, which could increase transaction costs or operating expenses, or have other adverse consequences for the funds.
A copy of the SEC Order is available on the SEC website at http://www.sec.gov. A copy of the NYAG Settlement is available as part of the Bank of America Corporation Form 8-K filing on February 10, 2005.
In connection with the events described in detail above, various parties have filed suit against certain funds, the Trustees of the Columbia Funds, FleetBoston Financial Corporation and its affiliated entities and/or Bank of America Corporation and its affiliated entities.
On February 20, 2004, the Judicial Panel on Multidistrict Litigation transferred these cases and cases against several other mutual fund companies based on similar allegations to the United States District Court in Maryland for consolidated or coordinated pretrial proceedings (the "MDL"). Subsequently, additional related cases were transferred to the MDL. On September 29, 2004, the plaintiffs in the MDL filed amended and consolidated complaints. One of these amended complaints is a putative class action that includes claims under the federal securities laws and state common law, and that names Columbia, the Distributor, the Trustees of the Columbia Funds, Bank of America Corporation and others as defendants. Another of the amended complaints is a derivative action purportedly on behalf of the Columbia Funds that asserts claims under federal securities laws and state common law.
On February 25, 2005, Columbia and other defendants filed motions to dismiss the claims in the pending cases. On March 1, 2006, for reasons stated in the court's memoranda dated November 3, 2005, the U.S. District Court for the District of Maryland granted in part and denied in part the defendants' motions to dismiss. The court dismissed all of the class action claims pending against the Columbia Funds Trusts and the Columbia Acorn Trust. As to Columbia and the Distributor, the claims under the Securities Act of 1933, the claims under Sections 34(b) and 36(a) of the Investment Company Act of 1940 ("ICA") and the state law claims were dismissed. The claims under Sections 10(b) and 20(a) of the Securities Exchange Act of 1934 and claims under Section 36(b) of the ICA along with related claims under Section 48(a) of the ICA were not dismissed.
142
NOTES TO FINANCIAL STATEMENTS (continued)
July 31, 2006
On March 21, 2005, purported class action plaintiffs filed suit in Massachusetts state court alleging that the conduct, including market timing, entitles Class B shareholders in certain Columbia Funds to an exemption from contingent deferred sales charges upon early redemption ("the CDSC Lawsuit"). The CDSC Lawsuit has been removed to federal court in Massachusetts and the federal Judicial Panel has transferred the CDSC Lawsuit to the MDL.
On April 4, 2006, the plaintiffs and the Columbia defendants named in the MDL, including the Columbia Funds, entered into a term sheet containing the principal terms of a stipulation of settlement that would settle all Columbia-related claims in the MDL described above, including the CDSC Lawsuit. On April 6, 2006, the U.S. District Court for the District of Maryland stayed all actions with respect to these Columbia-related claims.
The MDL is ongoing. Accordingly, an estimate of the financial impact of the litigation on any fund, if any, cannot currently be made.
In 2004, certain Columbia Funds, the Trustees of the Columbia Funds, advisers and affiliated entities were named as defendants in certain purported shareholder class and derivative actions making claims, including claims under the Investment Company and the Investment Advisers Acts of 1940 and state law. The suits seek damage and allege, inter alia, that the fees and expenses paid by the funds are excessive and that the advisers and their affiliates inappropriately used fund assets to distribute the funds and for other improper purpose. On March 2, 2005, the actions were consolidated in the Massachusetts federal court as In re Columbia Entities Litigation. The plaintiffs filed a consolidated amended complaint on June 9, 2005. On November 30, 2005, the judge dismissed all claims by plaintiffs and ordered that the case be closed. The plaintiffs filed a notice of appeal on December 30, 2005 and this appeal is pending.
For the year ended July 31, 2006, Columbia has assumed legal, consulting services and Trustees' fees incurred by the Funds in connection with these matters as follows:
| CMG Enhanced S&P 500® Index Fund | $ | 1,053 | |||||
| CMG Large Cap Growth Fund | 460 | ||||||
| CMG Large Cap Value Fund | 443 | ||||||
| CMG Mid Cap Growth Fund | 296 | ||||||
| CMG Mid Cap Value Fund | 229 | ||||||
| CMG Small Cap Growth Fund | 287 | ||||||
| CMG Small Cap Value Fund | 427 | ||||||
| CMG Small/Mid Cap Fund | 319 | ||||||
| CMG International Stock Fund | 1,430 | ||||||
143
NOTES TO FINANCIAL STATEMENTS (continued)
July 31, 2006
Note 10. Business combinations and mergers:
Effective March 27, 2006, CMG Small Cap Growth Fund, a series of Columbia Funds Institutional Trust, merged into CMG Small Cap Fund. CMG Small Cap Fund was then renamed CMG Small Cap Growth Fund. CMG Small Cap Fund received a tax-free transfer of assets from CMG Small Cap Growth Fund as follows:
| Shares Issued | Net Assets Received | Unrealized Appreciation1 | |||||||||
| 18,087,654 | $ | 40,504,741 | $ | 8,060,601 | |||||||
| Net Assets of CMG Small Cap Fund Prior to Combination | Net Assets of CMG Small Cap Growth Fund Immediately Prior to Combination | Net Assets of CMG Small Cap Fund Immediately After Combination | |||||||||
| $ | 6,118,119 | $ | 40,504,741 | $ | 46,622,860 | ||||||
1Unrealized appreciation is included in the Net Assets Received.
144
Report of Independent Registered Public Accounting Firm
To the Trustees of Columbia Funds Institutional Trust and Shareholders of CMG Enhanced S&P 500® Index Fund, CMG Large Cap Growth Fund, CMG Large Cap Value Fund, CMG Mid Cap Growth Fund, CMG Mid Cap Value Fund, CMG Small Cap Growth Fund, CMG Small Cap Value Fund, CMG Small/Mid Cap Fund and CMG International Stock Fund
In our opinion, the accompanying statements of assets and liabilities, including the schedules of investments, and the related statements of operations and of changes in net assets and the financial highlights present fairly, in all material respects, the financial position of CMG Enhanced S&P 500® Index Fund, CMG Large Cap Growth Fund, CMG Large Cap Value Fund, CMG Mid Cap Growth Fund, CMG Mid Cap Value Fund, CMG Small Cap Growth Fund (formerly CMG Small Cap Fund), CMG Small Cap Value Fund, CMG Small/Mid Cap Fund and CMG International Stock Fund (the "Funds") (each a series of Columbia Funds Institutional Trust) at July 31, 2006, the results of each of their operations for the year then ended, the changes in each of their net assets for each of the two years in the period then ended and the financial highlights for each of the periods indicated, in conformity with accounting principles generally accepted in t he United States of America. These financial statements and financial highlights (hereafter referred to as "financial statements") are the responsibility of the Funds' management. Our responsibility is to express an opinion on these financial statements based on our audits. We conducted our audits of these financial statements in accordance with the standards of the Public Company Accounting Oversight Board (United States). Those standards require that we plan and perform the audit to obtain reasonable assurance about whether the financial statements are free of material misstatement. An audit includes examining, on a test basis, evidence supporting the amounts and disclosures in the financial statements, assessing the accounting principles used and significant estimates made by management, and evaluating the overall financial statement presentation. We believe that our audits, which included confirmation of securities at July 31, 2006 by correspondence with the custodian and brokers, provide a reasonable ba sis for our opinion.
PricewaterhouseCoopers LLP
Boston, Massachusetts
September 25, 2006
145
Unaudited Information
Federal Income Tax Information
CMG Enhanced S&P 500® Index Fund
For the fiscal year ended July 31, 2006, the Fund designates long-term capital gains of $6,122,577.
48.70% of the ordinary income distributed by the Fund, for the year ended July 31, 2006, qualifies for the corporate dividends received deduction.
For non-corporate shareholders 53.32%, or the maximum amount allowable under the Jobs and Growth Tax Relief Reconciliation Act of 2003, of income earned by the Fund for the period August 1, 2005 to July 31, 2006 may represent qualified dividend income. Final information will be provided in your 2006 1099-DIV Form.
CMG Large Cap Growth Fund
For the fiscal year ended July 31, 2006, the Fund designates long-term capital gains of $1,869,034.
82.51% of the ordinary income distributed by the Fund, for the year ended July 31, 2006, qualifies for the corporate dividends received deduction.
For non-corporate shareholders 85.31%, or the maximum amount allowable under the Jobs and Growth Tax Relief Reconciliation Act of 2003, of income earned by the Fund for the period August 1, 2005 to July 31, 2006 may represent qualified dividend income. Final information will be provided in your 2006 1099-DIV Form.
CMG Large Cap Value Fund
For the fiscal year ended July 31, 2006, the Fund designates long-term capital gains of $3,137,362.
61.03% of the ordinary income distributed by the Fund, for the year ended July 31, 2006, qualifies for the corporate dividends received deduction.
For non-corporate shareholders 65.62%, or the maximum amount allowable under the Jobs and Growth Tax Relief Reconciliation Act of 2003, of income earned by the Fund for the period August 1, 2005 to July 31, 2006 may represent qualified dividend income. Final information will be provided in your 2006 1099-DIV Form.
CMG Mid Cap Growth Fund
For the fiscal year ended July 31, 2006, the Fund designates long-term capital gains of $1,685,273.
15.46% of the ordinary income distributed by the Fund, for the year ended July 31, 2006, qualifies for the corporate dividends received deduction.
For non-corporate shareholders 16.65%, or the maximum amount allowable under the Jobs and Growth Tax Relief Reconciliation Act of 2003, of income earned by the Fund for the period August 1, 2005 to July 31, 2006 may represent qualified dividend income. Final information will be provided in your 2006 1099-DIV Form.
CMG Mid Cap Value Fund
For the fiscal year ended July 31, 2006, the Fund designates long-term capital gains of $2,171,126.
146
Unaudited Information (continued)
33.59% of the ordinary income distributed by the Fund, for the year ended July 31, 2006, qualifies for the corporate dividends received deduction.
For non-corporate shareholders 34.78%, or the maximum amount allowable under the Jobs and Growth Tax Relief Reconciliation Act of 2003, of income earned by the Fund for the period August 1, 2005 to July 31, 2006 may represent qualified dividend income. Final information will be provided in your 2006 1099-DIV Form.
CMG Small Cap Growth Fund
For the fiscal year ended July 31, 2006, the Fund designates long-term capital gains of $4,232,489.
CMG Small Cap Value Fund
For the fiscal year ended July 31, 2006, the Fund designates long-term capital gains of $4,030,858.
40.78% of the ordinary income distributed by the Fund, for the year ended July 31, 2006, qualifies for the corporate dividends received deduction.
For non-corporate shareholders 40.17%, or the maximum amount allowable under the Jobs and Growth Tax Relief Reconciliation Act of 2003, of income earned by the Fund for the period August 1, 2005 to July 31, 2006 may represent qualified dividend income. Final information will be provided in your 2006 1099-DIV Form.
CMG Small/Mid Cap Fund
For the fiscal year ended July 31, 2006, the Fund designates long-term capital gains of $4,464,206.
CMG International Stock Fund
For the fiscal year ended July 31, 2006, the Fund designates long-term capital gains of $16,207,777.
Foreign taxes paid during the fiscal year ended July 31, 2006, amounting to $265,964 ($0.04 per share) are expected to be passed through to shareholders as 100% allowable foreign tax credits on Form 1099-DIV for the year ending December 31, 2006.
Gross income derived from sources within foreign countries amounted to $2,995,644 ($0.41 per share) for the fiscal year ended July 31, 2006.
For non-corporate shareholders 83.64%, or the maximum amount allowable under the Jobs and Growth Tax Relief Reconciliation Act of 2003, of income earned by the Fund for the period August 1, 2005 to July 31, 2006 may represent qualified dividend income. Final information will be provided in your 2006 1099-DIV Form.
147
Fund Governance
Trustees
The Trustees serve terms of indefinite duration. The names, addresses and ages of the Trustees and officers of the Funds in the Columbia Funds Complex, the year each was first elected or appointed to office, their principal business occupations during at least the last five years, the number of portfolios overseen by each Trustee and other directorships they hold are shown below. Each officer listed below serves as an officer of each Fund in the Columbia Funds Complex.
| Name, Address and Age, Position with Funds, Year First Elected or Appointed to Office1 | Principal Occupation(s) During Past Five Years, Number of Portfolios in Columbia Funds Complex Overseen by Trustee, Other Directorships Held | ||||||
| Disinterested Trustees | |||||||
| Douglas A. Hacker (Born 1955) c/o Columbia Management Advisors, LLC One Financial Center Boston, MA 02111 Trustee (since 1996) | Independent Business Executive since May, 2006; Executive Vice President–Strategy of United Airlines (airline) from December, 2002 to May, 2006; (formerly President of UAL Loyalty Services (airline) from September, 2001 to December, 2002; Executive Vice President and Chief Financial Officer of United Airlines from July, 1999 to September, 2001; Senior Vice President—Finance from March, 1993 to July, 1999). Oversees 83, Nash Finch Company (food distributor) and Aircastle Limited (aircraft leasing) | ||||||
| Janet Langford Kelly (Born 1957) c/o Columbia Management Advisors, LLC One Financial Center Boston, MA 02111 Trustee (since 1996) | Deputy General Counsel—Corporate Legal Services, ConocoPhillips (integrated petroleum company) since August, 2006; Partner, Zelle, Hofmann, Voelbel, Mason & Gette LLP (law firm) from March, 2005 to July, 2006; Adjunct Professor of Law, Northwestern University, since September, 2004 (formerly Chief Administrative Officer and Senior Vice President, Kmart Holding Corporation (consumer goods), from September, 2003 to March, 2004; Executive Vice President—Corporate Development and Administration, General Counsel and Secretary, Kellogg Company (food manufacturer), from September, 1999 to August, 2003. Oversees 83, UAL Corporation (airline) | ||||||
| Richard W. Lowry (Born 1936) c/o Columbia Management Advisors, LLC One Financial Center Boston, MA 02111 Trustee (since 1995) | Private Investor since August, 1987 (formerly Chairman and Chief Executive Officer, U.S. Plywood Corporation (building products manufacturer until 1987)). Oversees 852, None | ||||||
| Charles R. Nelson (Born 1943) c/o Columbia Management Advisors, LLC One Financial Center Boston, MA 02111 Trustee (since 1981) | Professor of Economics, University of Washington, since January, 1976; Ford and Louisa Van Voorhis Professor of Political Economy, University of Washington, since September, 1993 (formerly Director, Institute for Economic Research, University of Washington from September, 2001 to June, 2003); Adjunct Professor of Statistics, University of Washington, since September, 1980; Associate Editor, Journal of Money Credit and Banking, since September, 1993; consultant on econometric and statistical matters. Oversees 83, None | ||||||
| John J. Neuhauser (Born 1942) c/o Columbia Management Advisors, LLC One Financial Center Boston, MA 02111 Trustee (since 1985) | University Professor, Boston College since November, 2005; Academic Vice President and Dean of Faculties from August, 1999 to October, 2005, Boston College. Oversees 852, None | ||||||
| Patrick J. Simpson (Born 1944) c/o Columbia Management Advisors, LLC One Financial Center Boston, MA 02111 Trustee (since 2000) | Partner, Perkins Coie LLP (law firm). Oversees 83, None | ||||||
148
Fund Governance (Continued)
Trustees
| Name, Address and Age, Position with Funds, Year First Elected or Appointed to Office1 | Principal Occupation(s) During Past Five Years, Number of Portfolios in Columbia Funds Complex Overseen by Trustee, Other Directorships Held | ||||||
| Disinterested Trustees | |||||||
| Thomas E. Stitzel (Born 1936) c/o Columbia Management Advisors, LLC One Financial Center Boston, MA 02111 Trustee (since 1998) | Business Consultant since 1999; Chartered Financial Analyst. Oversees 83, None | ||||||
| Thomas C. Theobald (Born 1937) c/o Columbia Management Advisors, LLC One Financial Center Boston, MA 02111 Trustee and Chairman of the Board3 (since 1996) | Partner and Senior Advisor, Chicago Growth Partners (private equity investing) since September, 2004 (formerly Managing Director, William Blair Capital Partners (private equity investing) from September, 1994 to September, 2004). Oversees 83, Anixter International (network support equipment distributor); Ventas, Inc. (real estate investment trust); Jones Lang LaSalle (real estate management services) and Ambac Financial Group (financial guaranty insurance) | ||||||
| Anne-Lee Verville (Born 1945) c/o Columbia Management Advisors, LLC One Financial Center Boston, MA 02111 Trustee (since 1998) | Retired since 1997 (formerly General Manager, Global Education Industry, IBM Corporation (computer and technology) from 1994 to 1997). Oversees 83, Chairman of the Board of Directors, Enesco Group, Inc. (producer of giftware and home and garden decor products) | ||||||
| Interested Trustees | |||||||
| William E. Mayer (Born 1940) c/o Columbia Management Advisors, LLC One Financial Center Boston, MA 02111 Trustee4 (since 1994) | Partner, Park Avenue Equity Partners (private equity) since February, 1999 (formerly Partner, Development Capital LLC from November, 1996 to February, 1999). Oversees 83, Lee Enterprises (print media), WR Hambrecht + Co. (financial service provider); Reader's Digest (publishing); OPENFIELD Solutions (retail industry technology provider) | ||||||
1 In December 2000, the boards of each of the former Liberty Funds and former Stein Roe Funds were combined into one board of trustees responsible for the oversight of both fund groups (collectively, the "Liberty Board"). In October 2003, the trustees on the Liberty Board were elected to the boards of the Columbia Funds (the "Columbia Board") and of the CMG Fund Trust (the "CMG Funds Board"); simultaneous with that election, Patrick J. Simpson who had been a director on the Columbia Board and trustee on the CMG Funds Board, was appointed to serve as trustee of the Liberty Board. The date shown is the earliest date on which a trustee/director was elected or appointed to the board of a Fund in the Columbia Funds Complex.
2 Messrs. Lowry and Neuhauser also serve as directors/trustees of the Liberty All-Star Funds, currently consisting of 2 funds, which are advised by an affiliate of the Advisor.
3 Mr. Theobald was appointed as Chairman of the Board effective December 10, 2003.
4 Mr. Mayer is an "interested person" (as defined in the Investment Company Act of 1940 (1940 Act)) by reason of his affiliation with WR Hambrecht + Co.
The Statement of Additional Information includes additional information about the Trustees of the Funds and is available, without charge, upon request by calling 800-426-3750.
149
Fund Governance (Continued)
Officers
| Name, Address and Age, Position with Columbia Funds, Year First Elected or Appointed to Office | Principal Occupation(s) During Past Five Years | ||||||
| Christopher L. Wilson (Born 1957) One Financial Center Boston, MA 02111 President (since 2004) | Head of Mutual Funds since August, 2004 and Managing Director of the Advisor since September, 2005; President and Chief Executive Officer, CDC IXIS Asset Management Services, Inc. (investment management) from September, 1998 to August, 2004. | ||||||
| James R. Bordewick, Jr. (Born 1959) One Financial Center Boston, MA 02111 Senior Vice President, Secretary and Chief Legal Officer (since 2006) | Associate General Counsel, Bank of America since April, 2005; Senior Vice President and Associate General Counsel, MFS Investment Management (investment management) prior to April, 2005. | ||||||
| J. Kevin Connaughton (Born 1964) One Financial Center Boston, MA 02111 Senior Vice President, Chief Financial Officer and Treasurer (since 2000) | Managing Director of the Advisor since February, 1998. | ||||||
| Mary Joan Hoene (Born 1949) 100 Federal Street Boston, MA 02110 Senior Vice President and Chief Compliance Officer (since 2004) | Senior Vice President and Chief Compliance Officer of various funds in the Fund Complex; Partner, Carter, Ledyard & Milburn LLP (law firm) from January, 2001 to August, 2004. | ||||||
| Michael G. Clarke (Born 1969) One Financial Center Boston, MA 02111 Chief Accounting Officer and Assistant Treasurer (since 2004) | Director of Fund Administration since January, 2006; Managing Director of Columbia Management Advisors, LLC September, 2004 to December, 2005; Vice President Fund Administration June, 2002 to September, 2004. Vice President Product Strategy and Development from February, 2001 to June, 2002. | ||||||
| Jeffrey R. Coleman (Born 1969) One Financial Center Boston, MA 02111 Deputy Treasurer (since 2006) | Director of Fund Administration since January, 2006; Fund Controller from October 2004 to January 2006; Vice President of CDC IXIS Asset Management Services, Inc. (investment management) from August, 2000 to September, 2004. | ||||||
| Joseph F. DiMaria (Born 1968) One Financial Center Boston, MA 02111 Deputy Treasurer (since 2006) | Director of Fund Administration since January, 2006; Head of Tax/Compliance and Assistant Treasurer from November, 2004 to December, 2005; Director of Trustee Administration (Sarbanes-Oxley) from May, 2003 to October, 2004; Senior Audit Manager, PricewaterhouseCoopers (independent registered public accounting firm) from July, 2000 to April, 2003. | ||||||
| Ty S. Edwards (Born 1966) One Financial Center Boston, MA 02111 Deputy Treasurer (since 2006) | Director of Fund Administration since January, 2006; Vice President of the Advisor from July, 2002 to December, 2005; Assistant Vice president and Director, State Street Corporation (financial services) prior to 2002. | ||||||
| Barry S. Vallan (Born 1969) One Financial Center Boston, MA 02111 Controller (since 2006) | Vice President-Fund Treasury of the Advisor since October, 2004; Vice President-Trustee Reporting from April, 2002 to October, 2004; Management Consultant, PricewaterhouseCoopers (independent registered public accounting firm) prior to October, 2002. | ||||||
150
COLUMBIA FUNDS INSTITUTIONAL TRUST
121 S.W. MORRISON STREET, PORTLAND, OREGON 97201
- INVESTMENT ADVISOR -
COLUMBIA MANAGEMENT ADVISORS, LLC
100 FEDERAL STREET
BOSTON, MASSACHUSETTS 02110-2624
- LEGAL COUNSEL -
ROPES & GRAY LLP
ONE INTERNATIONAL PLACE
BOSTON, MA 02110-2624
- TRANSFER AGENT -
COLUMBIA MANAGEMENT SERVICES, INC.
P.O. BOX 8081
BOSTON, MASSACHUSETTS 02266-8081
SHC-42/112820-0706 (09/06) 06/29342
A description of the funds' proxy voting policies and procedures is available (i) at www.columbiamanagement.com; (ii) on the Securities and Exchange Commission's website at www.sec.gov, and (iii) without charge, upon request, by calling 800-368-0346. Information regarding how the funds voted proxies relating to portfolio securities during the 12-month period ended June 30 is available from the SEC's website. Information regarding how the funds voted proxies relating to portfolio securities is also available from the funds' website.
Each fund files a complete schedule of portfolio holdings with the SEC for the first and third quarters of each fiscal year on Form N-Q. Each fund's Form N-Q is available on the SEC's website at www.sec.gov and may be reviewed and copied at the SEC's Public Reference Room in Washington, D.C. Information on the operation of the Public Reference Room may be obtained by calling 800-SEC-0330.
The CMG funds are offered by prospectus through Columbia Management Distributors, Inc. Please consider the investment objectives, risks, charges and expenses of a mutual fund carefully before investing. Contact your Columbia Management representative or visit www.columbiamanagement.com for a prospectus, which contains this and other important information about the fund. Read it carefully before you invest.
Fund distributed by Columbia Management Distributors, Inc., One Financial Center, Boston, MA 02111-2621
![]()
CMG STRATEGIC EQUITY FUND
A PORTFOLIO OF COLUMBIA FUNDS INSTITUTIONAL TRUST
Annual Report
July 31, 2006
Advised by Columbia Management Advisors, LLC.
Not FDIC
Insured
May Lose Value
No Bank Guarantee
Columbia Management Group, LLC ("Columbia Management") is the primary investment manager of Bank of America Corporation. Columbia Management entities furnish investment management services and advise institutional and mutual fund portfolios. CMG Funds are distributed by Columbia Management Distributors, Inc., member of NASD, SIPC, part of Columbia Management and an affiliate of Bank of America Corporation.
The views expressed in the Management Discussion of Fund Performance reflect the current views of the Portfolio Managers. These views are not guarantees of future performance and involve certain risks, uncertainties and assumptions that are difficult to predict so actual outcomes and results may differ significantly from the views expressed. These views are subject to change at any time based upon economic, market or other conditions and the Portfolio Managers disclaim any responsibility to update such views. These views may not be relied on as investment advice and, because investment decisions for a CMG Fund are based on numerous factors, may not be relied on as an indication of trading intent on behalf of any particular CMG Fund. References to specific company securities should not be construed as a recommendation or investment advice.
Performance data quoted represents past performance, and current performance may be lower or higher. Past performance is no guarantee of future results. The investment return and principal value will fluctuate so that shares, when redeemed, may be worth more or less than the original cost. Please visit www.columbiamanagement.com for daily and most recent month-end performance updates.
CMG STRATEGIC EQUITY FUND
A Portfolio of Columbia Funds Institutional Trust
MANAGEMENT DISCUSSION OF FUND PERFORMANCE
CMG Strategic Equity Fund returned 7.58% for the 12-month period ended July 31, 2006. The fund surpassed the 5.38% return of the S&P 500 Index1 and the 4.96% average return of the Morningstar Large Blend Category.2 Solid stock selection helped propel the fund's return ahead of its benchmark and peer group.
The financial sector was an area of relative strength for the fund. Japanese holdings, including Mizuho Financial Group, Inc. and Mitsubishi UFJ Financial Group, Inc., were top performers.3 On the domestic front, the fund benefited from positions in JPMorgan Chase & Co., Morgan Stanley and Lazard Ltd. Although the financial sector enhanced fund performance, Sumitomo Trust & Banking Co. Ltd. (sold from the portfolio) and Asset Acceptance Capital Corp. were two disappointments.
The energy and health care sectors were also areas of relative strength for the fund. In the energy sector, Schlumberger Ltd. was the strongest position in the group, followed by Transocean, Inc., Exxon Mobil Corp. and TGS-NOPEC Geophysical Co. ASA (sold from the portfolio). However, certain names detracted from results, including Massey Energy Co. and Alpha Natural Resources, Inc., both of which were sold from the portfolio. Among health care stocks, Applera Corp.—Applied Biosystems Group was the strongest contributor in the sector. Other positive contributors during the period included Novartis AG, Elan Corp. PLC and Richter Gedeon Ltd. (the latter two were sold from the portfolio). Names that detracted from results included Zimmer Holdings, Inc. and Patterson Companies (sold from the portfolio).
The industrials, telecommunication services and materials sectors all made modest contributions to performance. Among industrial stocks, Hitachi Construction Machinery Co. Ltd. (sold from the portfolio), Caterpillar, Inc. and Thomas & Betts Corp. made solid contributions. Although the information technology sector struggled in the period, the sector was an area of relative strength; good stock selection helped the portfolio's holdings outperform the benchmark and mitigate losses here.
The fund experienced relative weakness in the consumer discretionary, consumer staples and utilities sectors. Consumer discretionary stocks generally fared poorly during the period, and the fund's holdings did not keep pace with their counterparts in the index. Media General, Inc. and Chico's FAS, Inc. detracted from performance and were sold from the portfolio. The fund's consumer staples stocks advanced in the period, but trailed the index. Nestle SA and Anheuser-Busch Companies, Inc. made solid contributions, but gains were offset by disappointments such as Wal-Mart Stores, Inc. and Wm. Wrigley Jr. Co. Finally, the utilities sector was an area of relative weakness, as the fund's stocks were flat compared to solid gains reported for the index.
1
We continue to believe that recent interest rate increases could result in some slowing in the economy. As the economic cycle matures, we have focused our attention on companies with less sensitivity to economic cycles and the ability to maintain stable growth. In addition, we will continue to evaluate investment opportunities overseas, considering areas with potentially compelling growth trends.
The fund's top ten holdings (as a percentage of net assets) as of July 31, 2006 were:
| (%) | |||||||
| Exxon Mobil Corp. | 2.7 | ||||||
| General Electric Co. | 2.3 | ||||||
| Citigroup, Inc. | 1.9 | ||||||
| Johnson & Johnson | 1.6 | ||||||
| Schlumberger Ltd. | 1.5 | ||||||
| Wal-Mart Stores, Inc. | 1.5 | ||||||
| Coca-Cola Co. | 1.5 | ||||||
| JPMorgan Chase & Co. | 1.4 | ||||||
| Samsung Electronics Co. Ltd., GDR | 1.4 | ||||||
| Novartis AG, ADR | 1.4 | ||||||
We appreciate your continued confidence in CMG Strategic Equity Fund.
Emil A. Gjester has managed or co-managed the fund since January 2004 and has been with the advisor or its predecessors or affiliate organizations since 1996.
Jonas Patrikson has co-managed the fund since February 2006 and has been with the advisor or its predecessors or affiliate organizations since 2004.
Dara White has co-managed the fund since February 2006 and has been with the advisor since January 2006.
Michael T. Welter has co-managed the fund since July 2006 and has been with the advisor since July 2006.
Equity investments are affected by stock market fluctuations that occur in response to economic and business developments.
International investing may involve certain risks, including foreign taxation, currency fluctuations, risks associated with possible differences in financial standards and other monetary and political risks.
Holdings are calculated as a percentage of net assets and are subject to change. Because the fund is actively managed, there is no guarantee the fund will continue to maintain the holdings breakdown listed. The fund's holdings and their weights within the portfolio may change as market conditions change.
2
1 The Standard & Poor's (S&P) 500 Index tracks the performance of 500 widely held, large-capitalization U.S. stocks. Unlike the fund, indices are not investments, do not incur fees or expenses and are not professionally managed. It is not possible to invest directly in an index. Securities in the fund may not match those in an index.
2 ©2006 by Morningstar, Inc. All rights reserved. The information contained here is the proprietary information of Morningstar, Inc., may not be copied or redistributed for any purpose and may only be used for noncommercial, personal purposes. The information contained herein is not represented or warranted to be accurate, correct, complete, or timely. Morningstar, Inc. shall not be responsible for investment decisions, damages or other losses resulting from the use of this information. Past performance is no guarantee of future performance. Morningstar, Inc. has not granted consent for it to be considered or deemed an "expert" under the Securities Act of 1933. Morningstar Categories compare the performance of funds with similar investment objectives and strategies.
3 Holdings are disclosed as a percentage of net assets on July 31, 2006, and are subject to change: Mizuho Financial Group, Inc. (1.2%), Mitsubishi UFJ Financial Group, Inc. (1.0%), JPMorgan Chase & Co. (1.4%), Morgan Stanley (0.9%), Lazard Ltd. (0.6%), Asset Acceptance Capital Corp. (0.3%), Schlumberger Ltd. (1.5%), Transocean, Inc. (1.1%), Exxon Mobil Corp. (2.7%), Applera Corp.—Applied Biosystems Group (0.7%), Novartis AG (1.4%), Zimmer Holdings, Inc. (0.6%), Caterpillar, Inc. (0.5%), Thomas & Betts Corp. (0.3%), Telekomunikasi Indonesia (0.4%), Nestle SA (0.7%), Anheuser-Busch Companies, Inc. (0.7%), Wal-Mart Stores, Inc. (1.5%), Wm. Wrigley Jr. Co. (0.9%).
3
Average annual total return as of July 31, 2006 (%)
| Inception | 1-year | Life | |||||||||||||
| CMG Strategic Equity Fund | 10/09/01 | 7.58 | 12.73 | ||||||||||||
| S&P 500 Index | 5.38 | 5.83 | |||||||||||||
Average annual total return as of June 30, 2006 (%)
| Inception | 1-year | Life | |||||||||||||
| CMG Strategic Equity Fund | 10/09/01 | 11.48 | 12.87 | ||||||||||||
| S&P 500 Index | 8.63 | 5.80 | |||||||||||||
Performance data quoted represents past performance and current performance may be lower or higher. Past performance is no guarantee of future results. The investment return and principal value will fluctuate so that shares, when redeemed, may be worth more or less than the original cost. Please visit www.columbiamanagement.com for daily and most recent month-end performance updates.
Performance results reflect any voluntary waivers or reimbursement of fund expenses by the advisor or its affiliates. Absent these waivers or reimbursement arrangements, performance results would have been lower. All results shown assume reinvestment of distributions.
The table does not reflect the deduction of taxes that a shareholder would pay on fund distributions or the redemption of fund shares.
Growth of a $5,000,000 investment, October 9, 2001 to July 31, 2006
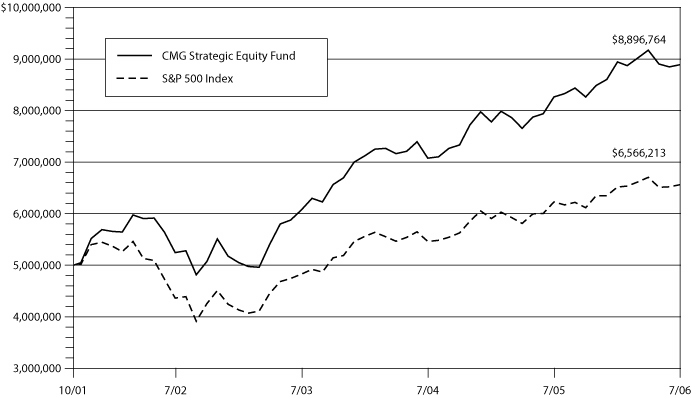
The chart above shows the growth in value of a hypothetical minimum initial $5,000,000 investment in the fund compared to the index during the period, and does not reflect the deduction of taxes that a shareholder would pay on fund distributions or the redemption of fund shares.
The Standard & Poor's (S&P) 500 Index tracks the performance of 500 widely held, large-capitalization U.S. stocks. Unlike the fund, indices are not investments, do not incur fees or expenses and are not professionally managed. It is not possible to invest directly in an index. Securities in the fund may not match those in an index.
Index performance is from October 9, 2001.
4
UNDERSTANDING YOUR EXPENSES – CMG Strategic Equity Fund
As a fund shareholder, you incur two types of costs. There are transaction costs and also ongoing costs, which generally include investment advisory fees and other fund expenses. The information on this page is intended to help you understand your ongoing costs of investing in the fund and to compare these costs with the ongoing costs of investing in other mutual funds.
Analyzing your fund's expenses
To illustrate these ongoing costs, we have provided an example and calculated the expenses paid by investors during the reporting period. The information in the following table is based on an initial investment of $1,000, which is invested at the beginning of the reporting period and held for the entire period. Expense information is calculated two ways and each method provides you with different information. The amount listed in the "actual" column is calculated using the fund's actual operating expenses and total return for the period. The amount listed in the "hypothetical" column assumes that the return each year is 5% before expenses and is calculated based on the fund's actual operating expenses. You should not use the hypothetical account values and expenses to estimate either your actual account balance at the end of the period or the expenses you paid during this reporting period.
Estimating your actual expenses
To estimate the expenses that you paid over the period, first you will need your account balance at the end of the period:
1. Divide your ending account balance by $1,000. For example, if an account balance was $8,600 at the end of the period, the result would be 8.6.
2. In the section of the table below titled "Expenses paid during the period," locate the amount under "actual." Multiply this number by the result from step 1. Your answer is an estimate of the expenses you paid on your account during the period.
February 1, 2006 — July 31, 2006
| Account value at the beginning of the period ($) | Account value at the end of the period ($) | Expenses paid during the period ($) | Fund's annualized expense ratio (%) | ||||||||||||||||||||||||
| Actual | Hypothetical | Actual | Hypothetical | Actual | Hypothetical | Actual | |||||||||||||||||||||
| 1,000.00 | 1,000.00 | 994.00 | 1,022.81 | 1.98 | 2.01 | 0.40 | |||||||||||||||||||||
Expenses paid during the period are equal to the annualized expense ratio of 0.40%, multiplied by the average account value over the period, then multiplied by the number of days in the fund's most recent fiscal half-year and divided by 365.
Had the Investment Advisor not reimbursed a portion of expenses, total return would have been reduced.
It is important to note that the expense amounts shown in the table are meant to highlight only ongoing costs of investing in the fund and do not reflect any transaction costs, such as sales charges, redemption or exchange fees. Therefore, the hypothetical examples provided may not help you determine the relative total costs of owning shares of different funds. If these transaction costs were included, your costs would have been higher.
Compare with other funds
Since all mutual funds are required to include the same hypothetical calculations about expenses in shareholder reports, you can use this information to compare the ongoing cost of investing in the fund with other funds. To do so, compare the 5% hypothetical example with the 5% hypothetical examples that appear in the shareholder reports of other funds. As you compare hypothetical examples of other funds, it is important to note that hypothetical examples are meant to highlight the continuing costs of investing in a fund and do not reflect any transaction costs, such as sales charges or redemption or exchange fees.
5
CMG STRATEGIC EQUITY FUND
A Portfolio of Columbia Funds Institutional Trust
FINANCIAL HIGHLIGHTS
(For a Fund Share Outstanding Throughout Each Period)
| Year Ended July 31, | Period Ended July 31, | Year Ended October 31, | Period Ended October 31, | ||||||||||||||||||||||||
| 2006 | 2005 | 2004 | 2003 (a) | 2002 | 2001 (b) | ||||||||||||||||||||||
| Net asset value, beginning of period | $ | 15.22 | $ | 13.80 | $ | 12.06 | $ | 10.14 | $ | 10.10 | $ | 10.00 | |||||||||||||||
| Income from investment operations: | |||||||||||||||||||||||||||
| Net investment income | 0.14 | (c) | 0.19 | (c)(d) | 0.12 | (c) | 0.10 | (c) | 0.11 | (c) | - | (e) | |||||||||||||||
| Net realized and unrealized gain (loss) on investments and foreign currency | 0.82 | 2.09 | 1.87 | 1.88 | (0.05 | ) | 0.10 | ||||||||||||||||||||
| Total from investment operations | 0.96 | 2.28 | 1.99 | 1.98 | 0.06 | 0.10 | |||||||||||||||||||||
| Less distributions declared to shareholders: | |||||||||||||||||||||||||||
| From net investment income | (0.57 | ) | (0.14 | ) | (0.09 | ) | (0.06 | ) | (0.02 | ) | - | ||||||||||||||||
| From net realized gains | (12.48 | )(f) | (0.72 | ) | (0.16 | ) | - | - | - | ||||||||||||||||||
| Total distributions declared to shareholders | (13.05 | ) | (0.86 | ) | (0.25 | ) | (0.06 | ) | (0.02 | ) | - | ||||||||||||||||
| Net asset value, end of period | $ | 3.13 | $ | 15.22 | $ | 13.80 | $ | 12.06 | $ | 10.14 | $ | 10.10 | |||||||||||||||
| Total return (g)(h) | 7.58 | %(i) | 16.77 | % | 16.58 | % | 19.66 | %(j) | 0.53 | % | 1.00 | %(j) | |||||||||||||||
| Ratios/Supplemental data: | |||||||||||||||||||||||||||
| Net assets, end of period (000's) | $ | 120,541 | $ | 755,860 | $ | 618,714 | $ | 370,620 | $ | 188,179 | $ | 36,942 | |||||||||||||||
| Ratio of net expenses to average net assets (k) | 0.40 | % | 0.40 | % | 0.40 | % | 0.40 | %(l) | 0.40 | % | 0.40 | %(l) | |||||||||||||||
| Ratio of net investment income to average net assets (k) | 1.09 | % | 1.31 | % | 0.88 | % | 1.22 | %(l) | 1.01 | % | 0.04 | %(l) | |||||||||||||||
| Waiver/reimbursement | 0.07 | % | 0.03 | % | 0.05 | % | 0.05 | %(l) | 0.07 | % | 0.80 | %(l) | |||||||||||||||
| Portfolio turnover rate | 47 | % | 64 | % | 81 | % | 78 | %(j) | 172 | % | 14 | %(j) | |||||||||||||||
(a) The Fund changed its fiscal year end from October 31 to July 31.
(b) The Fund commenced investment operations on October 9, 2001. Per share data, total return and portfolio turnover rate reflect activity from that date.
(c) Per share data was calculated using average shares outstanding during the period.
(d) Net investment income per share reflects a special dividend. The effect of this dividend amount to $0.02 per share.
(e) Rounds to less than $0.01 per share.
(f) Capital gain distributions were declared after significant shareholder redemptions reduced the size of the Fund.
(g) Total return at net asset value assuming all distributions reinvested.
(h) Had the Investment Advisor and/or Transfer Agent not waived or reimbursed a portion of expenses, total return would have been reduced.
(i) Total return includes a voluntary reimbursement by the Investment Advisor for a realized investment loss due to a trading error. This reimbursement had an impact of less than 0.01% on the Fund's total return.
(j) Not annualized.
(k) The benefits derived from custody credits had an impact of less than 0.01%.
(l) Annualized.
See Accompanying Notes to Financial Statements.
6
CMG STRATEGIC EQUITY FUND
A Portfolio of Columbia Funds Institutional Trust
SCHEDULE OF INVESTMENTS
July 31, 2006
| Shares | Value | ||||||||||
| Common Stocks (92.0%) | |||||||||||
| Consumer Discretionary (8.2%) | |||||||||||
| Automobiles (0.6%) | |||||||||||
| Harley-Davidson, Inc. | 14,020 | $ | 799,140 | ||||||||
| Diversified Consumer Services (0.4%) | |||||||||||
| Apollo Group, Inc., Class A (a) | 10,470 | 495,440 | |||||||||
| Hotels, Restaurants & Leisure (1.1%) | |||||||||||
| Trump Entertainment Resorts, Inc. (a) | 21,190 | 386,294 | |||||||||
| Yum! Brands, Inc. | 19,960 | 898,200 | |||||||||
| 1,284,494 | |||||||||||
| Household Durables (0.4%) | |||||||||||
| Desarrolladora Homex SA de CV, ADR (a) | 11,830 | 437,710 | |||||||||
| Media (1.9%) | |||||||||||
| Comcast Corp., Class A (a) | 33,500 | 1,148,380 | |||||||||
| Liberty Global, Inc., Class A (a) | 12,110 | 264,603 | |||||||||
| News Corp., Class A | 28,978 | 557,537 | |||||||||
| Time Warner, Inc. | 22,820 | 376,530 | |||||||||
| 2,347,050 | |||||||||||
| Multi-Line Retail (1.0%) | |||||||||||
| Federated Department Stores, Inc. | 11,656 | 409,242 | |||||||||
| Kohl's Corp. (a) | 13,660 | 773,566 | |||||||||
| 1,182,808 | |||||||||||
| Specialty Retail (1.7%) | |||||||||||
| Bebe Stores, Inc. | 20,080 | 310,838 | |||||||||
| Bed Bath & Beyond, Inc. (a) | 13,280 | 444,614 | |||||||||
| Gap, Inc. | 28,810 | 499,854 | |||||||||
| Home Depot, Inc. | 7,350 | 255,119 | |||||||||
| TJX Companies, Inc. | 22,080 | 538,090 | |||||||||
| 2,048,515 | |||||||||||
| Textiles, Apparel & Luxury Goods (1.1%) | |||||||||||
| Carter's, Inc. (a) | 9,310 | 203,051 | |||||||||
| NIKE, Inc., Class B | 13,960 | 1,102,840 | |||||||||
| 1,305,891 | |||||||||||
| Consumer Staples (11.6%) | |||||||||||
| Beverages (2.7%) | |||||||||||
| Anheuser-Busch Companies, Inc. | 17,660 | 850,329 | |||||||||
| Coca-Cola Co. | 39,490 | 1,757,305 | |||||||||
| Coca-Cola Enterprises, Inc. | 26,770 | 574,484 | |||||||||
| 3,182,118 | |||||||||||
| Food & Staples Retailing (3.0%) | |||||||||||
| Safeway, Inc. | 10,260 | 288,101 | |||||||||
| Wal-Mart Stores, Inc. | 39,830 | 1,772,435 | |||||||||
| Walgreen Co. | 33,390 | 1,561,984 | |||||||||
| 3,622,520 | |||||||||||
See Accompanying Notes to Financial Statements.
7
CMG STRATEGIC EQUITY FUND
A Portfolio of Columbia Funds Institutional Trust
SCHEDULE OF INVESTMENTS
| Shares | Value | ||||||||||
| Common Stocks (continued) | |||||||||||
| Food Products (3.7%) | |||||||||||
| ConAgra Foods, Inc. | 26,550 | $ | 570,825 | ||||||||
| General Mills, Inc. | 9,670 | 501,873 | |||||||||
| Hershey Co. | 8,170 | 449,105 | |||||||||
| Nestle SA, Registered Shares | 2,690 | 881,510 | |||||||||
| Unilever NV, N.Y. Registered Shares | 41,090 | 973,011 | |||||||||
| Wm. Wrigley Jr. Co. | 22,625 | 1,037,583 | |||||||||
| 4,413,907 | |||||||||||
| Household Products (1.7%) | |||||||||||
| Colgate-Palmolive Co. | 10,510 | 623,453 | |||||||||
| Procter & Gamble Co. | 26,100 | 1,466,820 | |||||||||
| 2,090,273 | |||||||||||
| Personal Products (0.5%) | |||||||||||
| Avon Products, Inc. | 10,190 | 295,408 | |||||||||
| Shiseido Co. Ltd. | 15,800 | 315,601 | |||||||||
| 611,009 | |||||||||||
| Energy (11.3%) | |||||||||||
| Energy Equipment & Services (5.5%) | |||||||||||
| Cameron International Corp. (a) | 16,180 | 815,634 | |||||||||
| Dresser-Rand Group, Inc. (a) | 20,950 | 477,031 | |||||||||
| Nabors Industries Ltd. (a) | 13,390 | 472,935 | |||||||||
| National-Oilwell Varco, Inc. (a) | 10,220 | 685,149 | |||||||||
| Noble Corp. | 4,660 | 334,355 | |||||||||
| Schlumberger Ltd. | 26,600 | 1,778,210 | |||||||||
| Smith International, Inc. | 5,000 | 222,850 | |||||||||
| Transocean, Inc. (a) | 16,600 | 1,282,018 | |||||||||
| Veritas DGC, Inc. (a) | 10,350 | 592,744 | |||||||||
| 6,660,926 | |||||||||||
| Oil, Gas & Consumable Fuels (5.8%) | |||||||||||
| Chevron Corp. | 12,870 | 846,589 | |||||||||
| ConocoPhillips | 12,870 | 883,397 | |||||||||
| Exxon Mobil Corp. | 47,390 | 3,210,198 | |||||||||
| Newfield Exploration Co. (a) | 25,500 | 1,182,690 | |||||||||
| Peabody Energy Corp. | 5,030 | 250,997 | |||||||||
| Valero Energy Corp. | 9,260 | 624,402 | |||||||||
| 6,998,273 | |||||||||||
| Financials (19.4%) | |||||||||||
| Capital Markets (4.1%) | |||||||||||
| Ameriprise Financial, Inc. | 11,180 | 498,628 | |||||||||
| Bank of New York Co., Inc. | 15,560 | 522,972 | |||||||||
| Charles Schwab Corp. | 32,380 | 514,194 | |||||||||
| Lazard Ltd., Class A | 19,740 | 770,847 | |||||||||
| Merrill Lynch & Co., Inc. | 11,340 | 825,779 | |||||||||
| Morgan Stanley | 16,330 | 1,085,945 | |||||||||
| Nomura Holdings, Inc., ADR | 37,070 | 660,587 | |||||||||
| 4,878,952 | |||||||||||
See Accompanying Notes to Financial Statements.
8
CMG STRATEGIC EQUITY FUND
A Portfolio of Columbia Funds Institutional Trust
SCHEDULE OF INVESTMENTS
| Shares | Value | ||||||||||
| Common Stocks (continued) | |||||||||||
| Commercial Banks (5.4%) | |||||||||||
| HSBC Holdings PLC, ADR | 13,560 | $ | 1,233,418 | ||||||||
| ICICI Bank Ltd., ADR | 16,810 | 439,077 | |||||||||
| Mitsubishi UFJ Financial Group, Inc., ADR | 85,470 | 1,192,306 | |||||||||
| Mizuho Financial Group, Inc. | 170 | 1,427,973 | |||||||||
| Raiffeisen International Bank Holding AG | 7,050 | 605,541 | |||||||||
| SunTrust Banks, Inc. | 6,770 | 533,950 | |||||||||
| U.S. Bancorp | 15,940 | 510,080 | |||||||||
| Wachovia Corp. | 10,390 | 557,216 | |||||||||
| 6,499,561 | |||||||||||
| Consumer Finance (1.3%) | |||||||||||
| American Express Co. | 16,150 | 840,769 | |||||||||
| SLM Corp. | 14,680 | 738,404 | |||||||||
| 1,579,173 | |||||||||||
| Diversified Financial Services (3.6%) | |||||||||||
| Asset Acceptance Capital Corp. (a) | 22,230 | 404,141 | |||||||||
| Citigroup, Inc. | 46,383 | 2,240,763 | |||||||||
| JPMorgan Chase & Co. | 37,356 | 1,704,181 | |||||||||
| 4,349,085 | |||||||||||
| Insurance (5.0%) | |||||||||||
| AFLAC, Inc. | 14,680 | 647,975 | |||||||||
| American International Group, Inc. | 25,624 | 1,554,608 | |||||||||
| Axis Capital Holdings Ltd. | 14,160 | 418,570 | |||||||||
| Berkshire Hathaway, Inc., Class B (a) | 540 | 1,645,380 | |||||||||
| Hannover Rueckversicherung AG, Registered Shares (a) | 11,830 | 417,535 | |||||||||
| Platinum Underwriters Holdings Ltd. | 7,540 | 213,307 | |||||||||
| St. Paul Travelers Companies, Inc. | 16,050 | 735,090 | |||||||||
| Willis Group Holdings Ltd. | 12,450 | 404,998 | |||||||||
| 6,037,463 | |||||||||||
| Health Care (13.2%) | |||||||||||
| Biotechnology (1.5%) | |||||||||||
| Amgen, Inc. (a) | 7,330 | 511,194 | |||||||||
| Biogen Idec, Inc. (a) | 12,300 | 518,076 | |||||||||
| Genzyme Corp. (a) | 5,520 | 376,906 | |||||||||
| Gilead Sciences, Inc. (a) | 6,070 | 373,184 | |||||||||
| 1,779,360 | |||||||||||
| Health Care Equipment & Supplies (3.8%) | |||||||||||
| Baxter International, Inc. | 18,890 | 793,380 | |||||||||
| DENTSPLY International, Inc. | 25,440 | 796,272 | |||||||||
| Hospira, Inc. (a) | 25,590 | 1,118,027 | |||||||||
| Medtronic, Inc. | 22,050 | 1,113,966 | |||||||||
| Zimmer Holdings, Inc. (a) | 11,680 | 738,643 | |||||||||
| 4,560,288 | |||||||||||
See Accompanying Notes to Financial Statements.
9
CMG STRATEGIC EQUITY FUND
A Portfolio of Columbia Funds Institutional Trust
SCHEDULE OF INVESTMENTS
| Shares | Value | ||||||||||
| Common Stocks (continued) | |||||||||||
| Health Care Providers & Services (1.4%) | |||||||||||
| Community Health Systems, Inc. (a) | 11,210 | $ | 406,475 | ||||||||
| Health Management Associates, Inc., Class A | 22,490 | 457,222 | |||||||||
| McKesson Corp. | 8,340 | 420,252 | |||||||||
| Omnicare, Inc. | 8,450 | 382,447 | |||||||||
| 1,666,396 | |||||||||||
| Health Care Technology (0.2%) | |||||||||||
| IMS Health, Inc. | 8,250 | 226,380 | |||||||||
| Life Sciences Tools & Services (1.1%) | |||||||||||
| Applera Corp. - Applied Biosystems Group | 26,840 | 862,906 | |||||||||
| Qiagen N.V. (a) | 15,490 | 235,293 | |||||||||
| Thermo Electron Corp. (a) | 7,510 | 277,945 | |||||||||
| 1,376,144 | |||||||||||
| Pharmaceuticals (5.2%) | |||||||||||
| Abbott Laboratories | 12,970 | 619,577 | |||||||||
| Eli Lilly & Co. | 7,940 | 450,754 | |||||||||
| Johnson & Johnson | 30,710 | 1,920,911 | |||||||||
| Novartis AG, ADR | 29,450 | 1,655,679 | |||||||||
| Novo-Nordisk A/S, Class B | 7,690 | 473,932 | |||||||||
| Pfizer, Inc. | 15,460 | 401,805 | |||||||||
| Sanofi-Aventis, ADR | 6,970 | 330,308 | |||||||||
| Wyeth | 10,390 | 503,603 | |||||||||
| 6,356,569 | |||||||||||
| Industrials (8.4%) | |||||||||||
| Aerospace & Defense (0.7%) | |||||||||||
| Goodrich Corp. | 13,850 | 559,125 | |||||||||
| Hexcel Corp. (a) | 15,490 | 222,591 | |||||||||
| 781,716 | |||||||||||
| Air Freight & Logistics (1.2%) | |||||||||||
| United Parcel Service, Inc., Class B | 20,570 | 1,417,479 | |||||||||
| Airlines (0.2%) | |||||||||||
| Gol Linhas Aereas Inteligentes SA, ADR | 7,380 | 236,308 | |||||||||
| Building Products (0.3%) | |||||||||||
| Assa Abloy AB, Class B | 24,400 | 401,190 | |||||||||
| Commercial Services & Supplies (0.5%) | |||||||||||
| Avery Dennison Corp. | 10,670 | 625,582 | |||||||||
| Electrical Equipment (0.3%) | |||||||||||
| Thomas & Betts Corp. (a) | 8,290 | 392,366 | |||||||||
See Accompanying Notes to Financial Statements.
10
CMG STRATEGIC EQUITY FUND
A Portfolio of Columbia Funds Institutional Trust
SCHEDULE OF INVESTMENTS
| Shares | Value | ||||||||||
| Common Stocks (continued) | |||||||||||
| Industrial Conglomerates (3.4%) | |||||||||||
| 3M Co. | 11,140 | $ | 784,256 | ||||||||
| General Electric Co. | 85,030 | 2,779,631 | |||||||||
| Siemens AG, ADR | 6,000 | 484,380 | |||||||||
| 4,048,267 | |||||||||||
| Machinery (1.0%) | |||||||||||
| Caterpillar, Inc. | 8,680 | 615,151 | |||||||||
| Deere & Co. | 2,540 | 184,328 | |||||||||
| Pall Corp. | 8,910 | 232,373 | |||||||||
| Timken Co. | 7,090 | 228,298 | |||||||||
| 1,260,150 | |||||||||||
| Marine (0.4%) | |||||||||||
| A.P. Moller - Maersk A/S | 60 | 452,977 | |||||||||
| Trading Companies & Distributors (0.4%) | |||||||||||
| GATX Corp. | 11,390 | 446,374 | |||||||||
| Information Technology (12.4%) | |||||||||||
| Communications Equipment (2.8%) | |||||||||||
| Cisco Systems, Inc. (a) | 49,460 | 882,861 | |||||||||
| Corning, Inc. (a) | 34,910 | 665,734 | |||||||||
| CSR PLC (a) | 29,480 | 625,029 | |||||||||
| Ericsson (LM) Telefonaktiebolaget-SP, ADR | 10,190 | 320,781 | |||||||||
| Motorola, Inc. | 12,560 | 285,866 | |||||||||
| QUALCOMM, Inc. | 16,670 | 587,784 | |||||||||
| 3,368,055 | |||||||||||
| Computers & Peripherals (1.2%) | |||||||||||
| Hewlett-Packard Co. | 22,540 | 719,251 | |||||||||
| International Business Machines Corp. | 6,980 | 540,322 | |||||||||
| SanDisk Corp. (a) | 2,960 | 138,114 | |||||||||
| 1,397,687 | |||||||||||
| Internet Software & Services (0.8%) | |||||||||||
| eBay, Inc. (a) | 13,110 | 315,558 | |||||||||
| Yahoo!, Inc. (a) | 22,860 | 620,420 | |||||||||
| 935,978 | |||||||||||
| IT Services (0.8%) | |||||||||||
| DST Systems, Inc. (a) | 8,370 | 471,315 | |||||||||
| First Data Corp. | 12,140 | 495,919 | |||||||||
| 967,234 | |||||||||||
| Office Electronics (0.4%) | |||||||||||
| Zebra Technologies Corp., Class A (a) | 14,335 | 449,402 | |||||||||
| Semiconductors & Semiconductor Equipment (3.8%) | |||||||||||
| Advanced Micro Devices, Inc. (a) | 7,540 | 146,201 | |||||||||
| Analog Devices, Inc. | 15,070 | 487,213 | |||||||||
| Applied Materials, Inc. | 21,340 | 335,892 | |||||||||
| ASML Holding N.V., N.Y. Registered Shares (a) | 13,840 | 275,416 | |||||||||
See Accompanying Notes to Financial Statements.
11
CMG STRATEGIC EQUITY FUND
A Portfolio of Columbia Funds Institutional Trust
SCHEDULE OF INVESTMENTS
| Shares | Value | ||||||||||
| Common Stocks (continued) | |||||||||||
| Semiconductors & Semiconductor Equipment (continued) | |||||||||||
| Intel Corp. | 11,910 | $ | 214,380 | ||||||||
| Intersil Corp., Class A | 15,490 | 364,170 | |||||||||
| Marvell Technology Group Ltd. (a) | 20,860 | 386,953 | |||||||||
| Samsung Electronics Co. Ltd., GDR (b) | 5,270 | 1,677,177 | |||||||||
| Silicon Laboratories, Inc. (a) | 7,310 | 269,885 | |||||||||
| Texas Instruments, Inc. | 15,420 | 459,207 | |||||||||
| 4,616,494 | |||||||||||
| Software (2.6%) | |||||||||||
| Activision, Inc. (a) | 31,320 | 374,274 | |||||||||
| Electronic Arts, Inc. (a) | 5,910 | 278,420 | |||||||||
| Microsoft Corp. | 59,420 | 1,427,863 | |||||||||
| Oracle Corp. (a) | 55,110 | 824,997 | |||||||||
| Quest Software, Inc. (a) | 21,190 | 289,667 | |||||||||
| 3,195,221 | |||||||||||
| Materials (2.9%) | |||||||||||
| Chemicals (0.9%) | |||||||||||
| Dow Chemical Co. | 14,710 | 508,672 | |||||||||
| International Flavors & Fragrances, Inc. | 17,480 | 646,760 | |||||||||
| 1,155,432 | |||||||||||
| Metals & Mining (2.0%) | |||||||||||
| Companhia Vale do Rio Doce, ADR | 22,190 | 514,808 | |||||||||
| Freeport-McMoRan Copper & Gold, Inc., Class B | 8,500 | 463,760 | |||||||||
| Mittal Steel Co. N.V., N.Y. Registered Shares, Class A | 12,590 | 430,704 | |||||||||
| Newmont Mining Corp. | 19,060 | 976,443 | |||||||||
| 2,385,715 | |||||||||||
| Telecommunication Services (2.9%) | |||||||||||
| Diversified Telecommunication Services (2.8%) | |||||||||||
| AT&T, Inc. | 30,670 | 919,793 | |||||||||
| BellSouth Corp. | 14,860 | 582,066 | |||||||||
| Chunghwa Telecom Co. Ltd., ADR | 19,475 | 361,651 | |||||||||
| Nippon Telegraph & Telephone Corp., ADR | 19,070 | 495,820 | |||||||||
| Philippine Long Distance Telephone Co., ADR | 4,510 | 176,747 | |||||||||
| Telekomunikasi Indonesia, ADR | 14,070 | 468,953 | |||||||||
| Verizon Communications, Inc. | 11,240 | 380,137 | |||||||||
| 3,385,167 | |||||||||||
| Wireless Telecommunication Services (0.1%) | |||||||||||
| Turkcell Iletisim Hizmet AS, ADR | 14,580 | 166,062 | |||||||||
| Utilities (1.7%) | |||||||||||
| Electric Utilities (1.2%) | |||||||||||
| Edison International | 22,150 | 916,567 | |||||||||
| Exelon Corp. | 8,570 | 496,203 | |||||||||
| 1,412,770 | |||||||||||
See Accompanying Notes to Financial Statements.
12
CMG STRATEGIC EQUITY FUND
A Portfolio of Columbia Funds Institutional Trust
SCHEDULE OF INVESTMENTS
| Shares | Value | ||||||||||
| Common Stocks (continued) | |||||||||||
| Multi-Utilities (0.5%) | |||||||||||
| Dominion Resources, Inc. | 5,350 | $ | 419,868 | ||||||||
| Duke Energy Corp. | 8,500 | 257,720 | |||||||||
| 677,588 | |||||||||||
| Total Common Stocks (Cost of $88,158,718) | 110,964,659 | ||||||||||
| Par | |||||||||||
| Short-Term Obligation (6.8%) | |||||||||||
| Repurchase agreement with State Street Bank & Trust Co., dated 07/31/06, due 08/01/06 at 5.160%, collateralized by a U.S. Treasury Note maturing 02/28/11, market value of $8,350,425 (repurchase proceeds $8,184,173) | $ | 8,183,000 | 8,183,000 | ||||||||
| Total Short-Term Obligation (Cost of $8,183,000) | 8,183,000 | ||||||||||
| Total Investments (98.8%) (Cost of $96,341,718) (c) | 119,147,659 | ||||||||||
| Other Assets & Liabilities, Net (1.2%) | 1,392,961 | ||||||||||
| Net Assets (100.0%) | $ | 120,540,620 | |||||||||
| Notes to Schedule of Investments: | |||||||||||
(a) Non-income producing security.
(b) Security exempt from registration pursuant to Rule 144A under the Securities Act of 1933. This security may be resold in transactions exempt from registration, normally to qualified institutional buyers. At July 31, 2006, the value of this security, which is not illiquid, represents 1.4% of net assets.
(c) Cost for federal income tax purposes is $97,149,295.
See Accompanying Notes to Financial Statements.
13
CMG STRATEGIC EQUITY FUND
A Portfolio of Columbia Funds Institutional Trust
SCHEDULE OF INVESTMENTS
At July 31, 2006, the Fund held investments in the following sectors:
| Sector | % of Net Assets | ||||||
| Financials | 19.4 | % | |||||
| Health Care | 13.2 | ||||||
| Information Technology | 12.4 | ||||||
| Consumer Staples | 11.6 | ||||||
| Energy | 11.3 | ||||||
| Industrials | 8.4 | ||||||
| Consumer Discretionary | 8.2 | ||||||
| Materials | 2.9 | ||||||
| Telecommunication Services | 2.9 | ||||||
| Utilities | 1.7 | ||||||
| Short-Term Obligation | 6.8 | ||||||
| Other Assets & Liabilities, Net | 1.2 | ||||||
| 100.0 | % | ||||||
| Acronym | Name | ||||||
| ADR | American Depositary Receipt | ||||||
| GDR | Global Depositary Receipt | ||||||
See Accompanying Notes to Financial Statements.
14
CMG STRATEGIC EQUITY FUND
A Portfolio of Columbia Funds Institutional Trust
STATEMENT OF ASSETS AND LIABILITIES
July 31, 2006
| ASSETS: | |||||||
| Investments, at identified cost | $ | 96,341,718 | |||||
| Investments, at value | $ | 119,147,659 | |||||
| Cash | 753 | ||||||
| Receivable for: | |||||||
| Investments sold | 775,554 | ||||||
| Fund shares sold | 2,408,790 | ||||||
| Interest | 1,173 | ||||||
| Dividends | 76,354 | ||||||
| Foreign tax reclaims | 7,838 | ||||||
| Deferred Trustees' compensation plan | 12,255 | ||||||
| Total Assets | 122,430,376 | ||||||
| LIABILITIES: | |||||||
| Payable for: | |||||||
| Investments purchased | 1,632,148 | ||||||
| Fund shares repurchased | 115,754 | ||||||
| Investment advisory fee | 70,114 | ||||||
| Transfer agent fee | 18 | ||||||
| Trustees' fees | 2,001 | ||||||
| Audit fee | 34,950 | ||||||
| Custody fee | 2,947 | ||||||
| Chief compliance officer expenses | 356 | ||||||
| Deferred Trustees' fees | 12,255 | ||||||
| Other liabilities | 19,213 | ||||||
| Total Liabilities | 1,889,756 | ||||||
| NET ASSETS | $ | 120,540,620 | |||||
| NET ASSETS consist of: | |||||||
| Paid-in capital | $ | 93,595,057 | |||||
| Overdistributed net investment income | (13,277 | ) | |||||
| Accumulated net realized gain | 4,152,493 | ||||||
| Net unrealized appreciation on: | |||||||
| Investments | 22,805,941 | ||||||
| Foreign currency translations | 406 | ||||||
| NET ASSETS | $ | 120,540,620 | |||||
| Shares of capital stock outstanding | 38,481,590 | ||||||
| Net asset value, offering and redemption price per share | $ | 3.13 | |||||
See Accompanying Notes to Financial Statements.
15
CMG STRATEGIC EQUITY FUND
A Portfolio of Columbia Funds Institutional Trust
STATEMENT OF OPERATIONS
| For the Year Ended July 31, 2006 | |||||||
| NET INVESTMENT INCOME: | |||||||
| Income: | |||||||
| Dividends | $ | 3,666,067 | |||||
| Interest | 1,181,168 | ||||||
| Foreign withholding tax | (56,052 | ) | |||||
| Total Investment Income | 4,791,183 | ||||||
| Expenses: | |||||||
| Investment advisory fee | 1,280,801 | ||||||
| Transfer agent fee | 700 | ||||||
| Trustees' fees | 29,618 | ||||||
| Custody fee | 45,475 | ||||||
| Chief compliance officer expenses (See Note 4) | 7,442 | ||||||
| Non-recurring costs (See Note 9) | 4,979 | ||||||
| Other expenses | 161,721 | ||||||
| Total Expenses | 1,530,736 | ||||||
| Expenses reimbursed by Investment Advisor | (236,062 | ) | |||||
| Fees and expenses waived by Transfer Agent | (146 | ) | |||||
| Non-recurring costs assumed by Investment Advisor (See Note 9) | (4,979 | ) | |||||
| Custody earnings credit | (757 | ) | |||||
| Net Expenses | 1,288,792 | ||||||
| Net Investment Income | 3,502,391 | ||||||
| NET REALIZED AND UNREALIZED GAIN (LOSS) ON INVESTMENTS AND FOREIGN CURRENCY: | |||||||
| Net realized gain (loss) on: | |||||||
| Investments | 139,242,158 | ||||||
| Foreign currency transactions | (207,375 | ) | |||||
| Net realized loss on disposal of investments purchased/sold in error (See Note 8) | - | ||||||
| Net realized gain | 139,034,783 | ||||||
| Net change in unrealized appreciation (depreciation) on: | |||||||
| Investments | (122,207,215 | ) | |||||
| Foreign currency translations | 2,082 | ||||||
| Net change in unrealized appreciation (depreciation) | (122,205,133 | ) | |||||
| Net Gain | 16,829,650 | ||||||
| NET INCREASE IN NET ASSETS FROM OPERATIONS | $ | 20,332,041 | |||||
See Accompanying Notes to Financial Statements.
16
CMG STRATEGIC EQUITY FUND
A Portfolio of Columbia Funds Institutional Trust
STATEMENT OF CHANGES IN NET ASSETS
| Year Ended July 31, | |||||||||||
| Increase (Decrease) in Net Assets: | 2006 | 2005 | |||||||||
| Operations: | |||||||||||
| Net investment income | $ | 3,502,391 | $ | 9,248,695 | |||||||
| Net realized gain on investments and foreign currency transactions | 139,034,783 | 34,789,566 | |||||||||
| Net change in unrealized appreciation (depreciation) on investments and foreign currency translations | (122,205,133 | ) | 62,844,592 | ||||||||
| Net increase from operations | 20,332,041 | 106,882,853 | |||||||||
| Distributions declared to shareholders: | |||||||||||
| From net investment income | (8,532,614 | ) | (6,517,434 | ) | |||||||
| From net realized gains | (165,009,285 | ) | (33,081,757 | ) | |||||||
| Total distributions declared to shareholders | (173,541,899 | ) | (39,599,191 | ) | |||||||
| Share Transactions: | |||||||||||
| Subscriptions | 51,206,578 | 107,867,251 | |||||||||
| Distributions reinvested | 158,121,863 | 38,913,285 | |||||||||
| Redemptions | (691,437,711 | ) | (76,918,698 | ) | |||||||
| Net increase (decrease) from share transactions | (482,109,270 | ) | 69,861,838 | ||||||||
| Net increase (decrease) in net assets | (635,319,128 | ) | 137,145,500 | ||||||||
| NET ASSETS: | |||||||||||
| Beginning of period | 755,859,748 | 618,714,248 | |||||||||
| End of period | $ | 120,540,620 | $ | 755,859,748 | |||||||
| Undistributed (overdistributed) net investment income | $ | (13,277 | ) | $ | 5,520,856 | ||||||
| Changes in Shares: | |||||||||||
| Subscriptions | 5,650,804 | 7,444,993 | |||||||||
| Issued for distributions reinvested | 36,117,727 | 2,670,781 | |||||||||
| Redemptions | (52,950,990 | ) | (5,281,801 | ) | |||||||
| Net increase (decrease) | (11,182,459 | ) | 4,833,973 | ||||||||
See Accompanying Notes to Financial Statements.
17
CMG STRATEGIC EQUITY FUND
A Portfolio of Columbia Funds Institutional Trust
NOTES TO FINANCIAL STATEMENTS
July 31, 2006
Note 1. Organization
CMG Strategic Equity Fund (the "Fund"), a series of Columbia Funds Institutional Trust (the "Trust"), is a diversified portfolio. The Trust is a Massachusetts business trust registered under the Investment Company Act of 1940, as amended, as an open-end management investment company. Effective March 27, 2006, the Fund was redomiciled into a new series of Columbia Funds Institutional Trust. Prior to March 27, 2006, the Fund was a series of CMG Fund Trust.
Shares in the Fund are available for purchase by institutional buyers and certain individual and institutional advisory clients of Columbia Management Advisors, LLC ("Columbia") or one of its affiliates. The Fund's minimum initial investment requirement for investors purchasing shares directly from Columbia is $5 million. The Fund may waive the investment minimum in its sole discretion. Please see the Fund's prospectus for further details.
Investment goal. The Fund seeks long-term growth of capital and total returns greater than those of the market over time.
Fund shares. The Fund may issue an unlimited number of shares of beneficial interest which are offered continuously at net asset value.
Note 2. Significant accounting policies
Use of estimates. The preparation of financial statements in conformity with accounting principles generally accepted in the United States of America ("GAAP") requires management to make estimates and assumptions that affect the reported amounts of assets and liabilities, the disclosure of contingent assets and liabilities at the date of the financial statements and the reported amounts of revenue and expenses during the reporting period. Actual results could differ from those estimates. The following is a summary of significant accounting policies consistently followed by the Fund in the preparation of its financial statements.
Security valuation. Equity securities and certain investment companies are valued at the last sale price on the principal exchange on which they trade, except for securities traded on the NASDAQ, which are valued at the NASDAQ official close price. Unlisted securities or listed securities for which there were no sales during the day are valued at the closing bid price on such exchanges or over-the-counter markets.
Short-term debt obligations maturing within 60 days are valued at amortized cost, which approximates market value.
Foreign securities are generally valued at the last sale price on the foreign exchange or market on which they trade. If any foreign share prices are not readily available as a result of limited share activity, the securities are valued at the last sale price of the local shares in the principal market in which such securities are normally traded.
Generally, trading in foreign securities is substantially completed each day at various times prior to the close of the New York Stock Exchange ("NYSE"). The values of such securities used in computing the net asset value of the Fund's shares are determined as of such times. Foreign currency exchange rates are generally determined at 2:00 p.m. Eastern (U.S.) time. Events affecting the values of such foreign securities and such exchange rates may occur between the times at which they are determined and the close of the customary trading session of the NYSE, which would not be reflected in the computation of the Fund's net asset value. If events materially affecting the values of such foreign securities occur and it is determined that market quotations are not reliable, then these foreign securities will be valued at their fair value using procedures approved by the Board of Trustees.
18
CMG STRATEGIC EQUITY FUND
A Portfolio of Columbia Funds Institutional Trust
NOTES TO FINANCIAL STATEMENTS
July 31, 2006
Investments for which market quotations are not readily available, or that have quotations which management believes are not appropriate, are valued at fair value as determined in good faith under consistently applied procedures established by and under the general supervision of the Board of Trustees. If a security is valued at a "fair value", such value is likely to be different from the last quoted market price for the security.
Security transactions. Security transactions are accounted for on the trade date. Cost is determined and gains (losses) are based upon the specific identification method for both financial statement and federal income tax purposes.
Repurchase agreements. The Fund may engage in repurchase agreement transactions with institutions that the Fund's investment advisor has determined are creditworthy. The Fund, through its custodian, receives delivery of underlying securities collateralizing a repurchase agreement. Collateral is at least equal, at all times, to the value of the repurchase obligation including interest. A repurchase agreement transaction involves certain risks in the event of default or insolvency of the counterparty. These risks include possible delays or restrictions upon the Fund's ability to dispose of the underlying securities and a possible decline in the value of the underlying securities during the period while the Fund seeks to assert its rights.
Income recognition. Interest income is recorded on the accrual basis. Corporate actions and dividend income are recorded on the ex-date, except for certain foreign securities which are recorded as soon after ex-date as the Fund becomes aware of such, net of non-reclaimable tax withholdings. Distributions paid by real estate investment trusts (REITs) in excess of their income are recorded as a reduction of the cost of the related investments. If the Fund no longer owns the applicable securities, any distributions received in excess of income are recorded as realized gains.
Foreign currency transactions. The values of all assets and liabilities quoted in foreign currencies are translated into U.S. dollars at that day's exchange rates. Net realized and unrealized gains (losses) on foreign currency transactions include gains (losses) arising from the fluctuation in exchange rates between trade and settlement dates on securities transactions, gains (losses) arising from the disposition of foreign currency and currency gains (losses) between the accrual and payment dates on dividends, interest income and foreign withholding taxes.
For financial statement purposes, the Fund does not distinguish that portion of gains (losses) on investments which is due to changes in foreign exchange rates from that which is due to changes in market prices of the investments. Such fluctuations are included with the net realized and unrealized gains (losses) on investments.
Federal income tax status. The Fund intends to qualify each year as a "regulated investment company" under Subchapter M of the Internal Revenue Code, as amended, and will distribute substantially all of its taxable income, if any, for its tax year, and as such will not be subject to federal income taxes. In addition, the Fund intends to distribute in each calendar year substantially all of its net investment income, capital gains and certain other amounts, if any, such that the Fund should not be subject to federal excise tax. Therefore, no federal income or excise tax provision is recorded.
Distributions to shareholders. Distributions to shareholders are recorded on ex-dividend date. Net realized capital gains, if any, are distributed at least annually.
Note 3. Federal tax information
The timing and character of income and capital gain distributions are determined in accordance with income tax regulations, which may differ from GAAP. Reclassifications are made to the Fund's capital accounts for permanent tax differences to reflect income and gains available for distribution (or available capital loss carryforwards) under income tax regulations.
19
CMG STRATEGIC EQUITY FUND
A Portfolio of Columbia Funds Institutional Trust
NOTES TO FINANCIAL STATEMENTS
July 31, 2006
For the year ended July 31, 2006, permanent book and tax basis differences resulting primarily from differing treatments for Section 988 foreign currency transactions, distribution reclassification and Real Estate Investment Trust (REIT) adjustments were identified and reclassified among the components of the Fund's net assets as follows:
| Overdistributed Net Investment Income | Accumulated Net Realized Gain | Paid-In Capital | |||||||||
| $ | (503,910 | ) | $ | 503,910 | $ | - | |||||
Net investment income and net realized gains (losses), as disclosed on the Statement of Operations, and net assets were not affected by this reclassification.
The tax character of distributions paid during the years ended July 31, 2006 and July 31, 2005 was as follows:
| July 31, 2006 | July 31, 2005 | ||||||||||
| Distributions paid from: | |||||||||||
| Ordinary Income* | $ | 32,828,472 | $ | 20,070,000 | |||||||
| Long-Term Capital Gains | 140,713,427 | 19,529,191 | |||||||||
*For tax purposes short-term capital gains distributions, if any, are considered ordinary income distributions.
As of July 31, 2006, the components of distributable earnings on a tax basis were as follows:
| Undistributed Ordinary Income | Undistributed Long-term Capital Gains | Net Unrealized Appreciation* | |||||||||
| $ | - | $ | 4,960,538 | $ | 21,998,364 | ||||||
*The differences between book-basis and tax-basis net unrealized appreciation are primarily due to deferral of losses from wash sales.
Unrealized appreciation and depreciation at July 31, 2006, based on cost of investments for federal income tax purposes was:
| Unrealized appreciation | $ | 23,645,777 | |||||
| Unrealized depreciation | (1,647,413 | ) | |||||
| Net unrealized appreciation | $ | 21,998,364 | |||||
In June 2006, the Financial Accounting Standards Board ("FASB") issued FASB Interpretation No. 48, Accounting for Uncertainty in Income Taxes, an Interpretation of FASB Statement No. 109 (the "Interpretation"). This Interpretation is effective for fiscal years beginning after December 15, 2006 and is to be applied to tax positions upon initial adoption. This Interpretation prescribes a minimum recognition threshold and measurement method for the financial statement recognition of tax positions taken or expected to be taken in a tax return and also requires certain expanded disclosures. Management has recently begun to evaluate the application of this Interpretation to the Fund and has not at this time quantified the impact, if any, resulting from the adoption of this Interpretatio n on the Fund's financial statements.
20
CMG STRATEGIC EQUITY FUND
A Portfolio of Columbia Funds Institutional Trust
NOTES TO FINANCIAL STATEMENTS
July 31, 2006
Note 4. Fees and compensation paid to affiliates
Investment advisory fee. Columbia Management Advisors, LLC ("Columbia"), an indirect, wholly-owned subsidiary of Bank of America Corporation ("BOA"), is the investment advisor to the Fund and provides administrative and other services to the Fund. Prior to September 30, 2005, Columbia Management Advisors, Inc. was the investment advisor to the Fund under the same fee structure. On September 30, 2005, Columbia Management Advisors, Inc. merged into Banc of America Capital Management, LLC. At that time, the investment advisor was then renamed Columbia Management Advisors, LLC. Columbia receives a monthly investment advisory fee at the annual rate of 0.40% of the Fund's average daily net assets.
In addition to the annual Fund operating expenses, each shareholder may enter into a written administrative services agreement with the Advisor or its affiliate. Pursuant to this Agreement, the Advisor or its affiliate will provide the shareholder specialized reports regarding the Fund, performance of the shareholder's investment, and market conditions and economic indicators. For such services, each shareholder will pay an annual fee calculated as a percentage of the shareholder's net assets in the Fund. The annual fee will be 0.20% on the first $25 million of the shareholder's assets in the Fund, and 0.00% on the shareholder's assets in the Fund in excess of $25 million.
Pricing & bookkeeping fees. Columbia is responsible for providing services to the Fund under a pricing, bookkeeping and fund administration agreement. Under a separate agreement (the "Outsourcing Agreement"), Columbia has delegated certain of those functions to State Street Corporation ("State Street"). As a result, Columbia pays fees to State Street under the Outsourcing Agreement. The Fund is not charged a fee for pricing and bookkeeping services.
Transfer agent fee. Columbia Management Services, Inc. (formerly Columbia Funds Services, Inc.) (the "Transfer Agent"), an affiliate of Columbia and an indirect, wholly-owned subsidiary of BOA, provides shareholder services to the Fund and has contracted with Boston Financial Data Services ("BFDS") to serve as sub-transfer agent. The Transfer Agent is entitled to receive a fee for its services, paid monthly, at the annual rate of $17.00 per open account plus sub-transfer agent fees (exclusive of BFDS fees) calculated based on assets held in omnibus accounts and intended to recover the cost of payments to third parties for services to those accounts. The annual rate was $15.23 per open account from November 1, 2005 through March 31, 2006 and $28.00 per open account prior to November 1, 2005. The Transfer Agent may also retain, as additional compensation for i ts services, fees for wire, telephone and redemption orders, IRA trustee agent fees and account transcript fees due the Transfer Agent from shareholders of the Fund and credits (net of bank charges) earned with respect to balances in accounts the Transfer Agent maintains in connection with its services to the Fund.
For the period from September 1, 2005 through October 31, 2005, the Transfer Agent voluntarily waived a portion of its fees of $146 for the Fund.
For the year ended July 31, 2006, the Fund's effective transfer agent fee rate, net of fee waivers, was less than 0.01% of the Fund's average daily net assets.
Expense limits and fee reimbursements. Columbia has contractually agreed to reimburse the Fund through November 30, 2006 for certain expenses so that the expenses incurred by the Fund, exclusive of interest, taxes and extraordinary expenses, will not exceed 0.40% of the Fund's average daily net assets.
Custody credits. The Fund has an agreement with its custodian bank under which custody fees may be reduced by balance credits. These credits are recorded as a reduction of total expenses on the Statement of Operations. The Fund could have invested a portion of the assets utilized in connection with the expense offset arrangement in an income-producing asset if it had not entered into such an agreement.
21
CMG STRATEGIC EQUITY FUND
A Portfolio of Columbia Funds Institutional Trust
NOTES TO FINANCIAL STATEMENTS
July 31, 2006
Fees paid to officers and trustees. All officers of the Fund, with the exception of the Fund's Chief Compliance Officer, are employees of Columbia or its affiliates and receive no compensation from the Fund. The Board of Trustees has appointed a Chief Compliance Officer to the Fund in accordance with federal securities regulations. The Fund, along with other affiliated funds, pays its pro-rata share of the expenses associated with the Chief Compliance Officer. The Fund's expenses for the Chief Compliance Officer will not exceed $15,000 per year.
The Fund's Trustees may participate in a deferred compensation plan which may be terminated at any time. Obligations of the plan will be paid solely out of the Fund's assets.
Other. Columbia provides certain services to the Fund related to Sarbanes-Oxley compliance. For the year ended July 31, 2006, the Fund paid $2,567 to Columbia for such services. This amount is included in "Other expenses" on the Statement of Operations.
Note 5. Portfolio information
For the year ended July 31, 2006, the cost of purchases and proceeds from sales of securities, excluding short-term obligations, were $136,978,608 and $667,149,372, respectively.
Note 6. Line of credit
The Fund and other affiliated funds participate in a $350,000,000 committed unsecured revolving line of credit provided by State Street Bank and Trust Company. Borrowings are used for temporary or emergency purposes to facilitate portfolio liquidity. Interest is charged to each participating fund based on its borrowings at a rate per annum equal to the Federal Funds rate plus 0.50%. In addition, a commitment fee of 0.10% per annum is accrued and apportioned among the participating funds based on their pro-rata portion of the unutilized line of credit. The commitment fee is included in "Other expenses" on the Statement of Operations.
For the year ended July 31, 2006, the Fund did not borrow under this arrangement.
Note 7. Shares of beneficial interest
As of July 31, 2006, the Fund had a shareholder that held 56.3% of the shares outstanding whose shares were beneficially owned by participant accounts over which Bank of America and/or its affiliates had either sole or joint investment discretion. Subscription and redemption activity of this account may have a significant effect on the operations of the Fund.
As of July 31, 2006, the Fund also had other shareholders that held greater than 5% of the shares outstanding. Subscription and redemption activity of these accounts may have a significant effect on the operations of the Fund. There were three accounts holding 35.6% of the shares outstanding.
Note 8. Other
During the year ended July 31, 2006, CMG Strategic Equity had a realized loss due to a trading error. The loss of $20,833 was reimbursed by Columbia.
22
CMG STRATEGIC EQUITY FUND
A Portfolio of Columbia Funds Institutional Trust
NOTES TO FINANCIAL STATEMENTS
July 31, 2006
Note 9. Disclosure of significant risks and contingencies
Industry focus. The Fund may focus its investments in certain industries, subjecting it to greater risk than a fund that is more diversified.
Foreign securities. There are certain additional risks involved when investing in foreign securities that are not inherent with investments in domestic securities. These risks may involve foreign currency exchange rate fluctuations, adverse political and economic developments and the possible prevention of currency exchange or other foreign governmental laws or restrictions. In addition, the liquidity of foreign securities may be more limited than that of domestic securities.
Legal proceedings. On February 9, 2005, Columbia Management Advisors, Inc. (which has since merged into Banc of America Capital Management, LLC (now named Columbia Management Advisors, LLC)) ("Columbia") and Columbia Funds Distributor, Inc. (which has been renamed Columbia Management Distributors, Inc.) (the "Distributor") (collectively, the "Columbia Group") entered into an Assurance of Discontinuance with the New York Attorney General ("NYAG") (the "NYAG Settlement") and consented to the entry of a cease-and-desist order by the Securities and Exchange Commission ("SEC") (the "SEC Order"). The SEC Order and the NYAG Settlement are referred to collectively as the "Settlements". The Settlements contain substantially the same terms and conditions as outlined in the agreements in principle which Columbia Group entered into with the SEC and NYAG in March 2004.
Under the terms of the SEC Order, the Columbia Group agreed, among other things, to: pay $70 million in disgorgement and $70 million in civil money penalties; cease and desist from violations of the antifraud provisions and certain other provisions of the federal securities laws; maintain certain compliance and ethics oversight structures; retain an independent consultant to review the Columbia Group's applicable supervisory, compliance, control and other policies and procedures; and retain an independent distribution consultant (see below). The Columbia Funds have also voluntarily undertaken to implement certain governance measures designed to maintain the independence of their boards of trustees. The NYAG Settlement also, among other things, requires Columbia and its affiliates to reduce management fees for certain Columbia Funds (including the former Nations Funds) and other mutual funds collectively by $32 million per year f or five years, for a projected total of $160 million in management fee reductions.
Pursuant to the procedures set forth in the SEC order, the $140 million in settlement amounts described above will be distributed in accordance with a distribution plan developed by an independent distribution consultant and approved by the SEC. The independent distribution consultant has been in consultation with the staff of the SEC and has submitted a proposed plan of distribution. The SEC has not yet approved a final plan of distribution.
As a result of these matters or any adverse publicity or other developments resulting from them, there may be increased redemptions or reduced sales of fund shares, which could increase transaction costs or operating expenses, or have other adverse consequences for the funds.
A copy of the SEC Order is available on the SEC website at http://www.sec.gov. A copy of the NYAG Settlement is available as part of the Bank of America Corporation Form 8-K filing on February 10, 2005.
In connection with the events described in detail above, various parties have filed suit against certain funds, the Trustees of the Columbia Funds, FleetBoston Financial Corporation and its affiliated entities and/or Bank of America and its affiliated entities.
23
CMG STRATEGIC EQUITY FUND
A Portfolio of Columbia Funds Institutional Trust
NOTES TO FINANCIAL STATEMENTS
July 31, 2006
On February 20, 2004, the Judicial Panel on Multidistrict Litigation transferred these cases and cases against several other mutual fund companies based on similar allegations to the United States District Court in Maryland for consolidated or coordinated pretrial proceedings (the "MDL"). Subsequently, additional related cases were transferred to the MDL. On September 29, 2004, the plaintiffs in the MDL filed amended and consolidated complaints. One of these amended complaints is a putative class action that includes claims under the federal securities laws and state common law, and that names Columbia, the Distributor, the Trustees of the Columbia Funds, Bank of America Corporation and others as defendants. Another of the amended complaints is a derivative action purportedly on behalf of the Columbia Funds that asserts claims under federal securities laws and state common law.
On February 25, 2005, Columbia and other defendants filed motions to dismiss the claims in the pending cases. On March 1, 2006, for reasons stated in the court's memoranda dated November 3, 2005, the U.S. District Court for the District of Maryland granted in part and denied in part the defendants' motions to dismiss. The court dismissed all of the class action claims pending against the Columbia Funds Trusts and the Columbia Acorn Trusts. As to Columbia and the Distributor, the claims under the Securities Act of 1933, the claims under Sections 34(b) and 36(a) of the Investment Company Act of 1940 ("ICA") and the state law claims were dismissed. The claims under Sections 10(b) and 20(a) of the Securities Exchange Act of 1934 and claims under Section 36(b) of the ICA along with related claims under Section 48(a) of the ICA were not dismissed.
On March 21, 2005, a purported class action was filed in Massachusetts state court alleging that the conduct, including market timing, entitles Class B shareholders in certain Columbia funds to an exemption from contingent deferred sales charges upon early redemption ("the CDSC Lawsuit"). The CDSC Lawsuit has been removed to federal court in Massachusetts and the federal Judicial Panel has transferred the CDSC Lawsuit to the MDL.
On April 4, 2006, the plaintiffs and the Columbia defendants named in the MDL, including the Columbia Funds, entered into a term sheet containing the principal terms of a stipulation of settlement that would settle all Columbia-related claims in the MDL described above, including the CDSC Lawsuit. On April 6, 2006, the U.S. District Court for the District of Maryland stayed all actions with respect to these Columbia-related claims.
The MDL is ongoing. Accordingly, an estimate of the financial impact of this litigation on any fund, if any, cannot currently be made.
In 2004, certain Columbia funds, the Trustees of the Columbia Funds, advisers and affiliated entities were named as defendants in certain purported shareholder class and derivative actions making claims, including claims under the Investment Company and the Investment Advisers Acts of 1940 and state law. The suits allege, inter alia, that the fees and expenses paid by the funds are excessive and that the advisers and their affiliates inappropriately used fund assets to distribute the funds and for other improper purpose. On March 2, 2005, the actions were consolidated in the Massachusetts federal court as In re Columbia Entities Litigation. The plaintiffs filed a consolidated amended complaint on June 9, 2005. On November 30, 2005, the judge dismissed all claims by plaintiffs and ordered that the case be closed. The plaintiffs filed a notice of appeal on December 30, 2005 and this appeal is pending.
For the year ended July 31, 2006, Columbia has assumed $4,979 of legal, consulting services and Trustees' fees incurred by the Fund in connection with these matters.
24
Report of Independent Registered Public Accounting Firm
To the Trustees of Columbia Funds Institutional Trust and Shareholders of CMG Strategic Equity Fund
In our opinion, the accompanying statement of assets and liabilities, including the schedule of investments, and the related statements of operations and of changes in net assets and the financial highlights present fairly, in all material respects, the financial position of CMG Strategic Equity Fund (the "Fund"), a portfolio of Columbia Funds Institutional Trust, at July 31, 2006, and the results of its operations, the changes in its net assets and the financial highlights for the periods indicated, in conformity with accounting principles generally accepted in the United States of America. These financial statements and financial highlights (hereafter referred to as "financial statements") are the responsibility of the Fund's management. Our responsibility is to express an opinion on these financial statements based on our audits. We conducted our audits of these financial statements in accordance with the standards of the Pub lic Company Accounting Oversight Board (United States). Those standards require that we plan and perform the audit to obtain reasonable assurance about whether the financial statements are free of material misstatement. An audit includes examining on a test basis, evidence supporting the amounts and disclosures in the financial statements, assessing the accounting principles used and significant estimates made by management, and evaluating the overall financial statement presentation. We believe that our audits, which included confirmation of securities at July 31, 2006 by correspondence with the custodian and brokers, provide a reasonable basis for our opinion.
PricewaterhouseCoopers LLP
Boston, Massachusetts
September 25, 2006
25
Unaudited Information
Federal Income Tax Information
23.60% of the ordinary income distributed by the Fund, for the year ended July 31, 2006, qualifies for the corporate dividends received deduction.
For non-corporate shareholders 30.97%, or the maximum amount allowable under the Jobs and Growth Tax Relief Reconciliation Act of 2003, of income earned by the Fund for the period August 1, 2005 to July 31, 2006 may represent qualified dividend income. Final information will be provided in your 2006 1099-DIV Form.
For the fiscal year ended July 31, 2006, the Fund designates long-term capital gains of $118,014,258.
26
Fund Governance
Trustees
The Trustees serve terms of indefinite duration. The names, addresses and ages of the Trustees and officers of the Funds in the Columbia Funds Complex, the year each was first elected or appointed to office, their principal business occupations during at least the last five years, the number of portfolios overseen by each Trustee and other directorships they hold are shown below. Each officer listed below serves as an officer of each Fund in the Columbia Funds Complex.
| Name, Address and Age, Position with Funds, Year First Elected or Appointed to Office1 | Principal Occupation(s) During Past Five Years, Number of Portfolios in Columbia Funds Complex Overseen by Trustee, Other Directorships Held | ||||||
| Disinterested Trustees | |||||||
| Douglas A. Hacker (Born 1955) c/o Columbia Management Advisors, LLC One Financial Center Boston, MA 02111 Trustee (since 1996) | Independent Business Executive since May, 2006; Executive Vice President–Strategy of United Airlines (airline) from December, 2002 to May, 2006; (formerly President of UAL Loyalty Services (airline) from September, 2001 to December, 2002; Executive Vice President and Chief Financial Officer of United Airlines from July, 1999 to September, 2001; Senior Vice President–Finance from March, 1993 to July, 1999). Oversees 83, Nash Finch Company (food distributor) and Aircastle Limited (aircraft leasing) | ||||||
| Janet Langford Kelly (Born 1957) c/o Columbia Management Advisors, LLC One Financial Center Boston, MA 02111 Trustee (since 1996) | Deputy General Counsel–Corporate Legal Services, ConocoPhillips (integrated petroleum company) since August, 2006; Partner, Zelle, Hofmann, Voelbel, Mason & Gette LLP (law firm) from March, 2005 to July, 2006; Adjunct Professor of Law, Northwestern University, since September, 2004 (formerly Chief Administrative Officer and Senior Vice President, Kmart Holding Corporation (consumer goods), from September, 2003 to March, 2004; Executive Vice President–Corporate Development and Administration, General Counsel and Secretary, Kellogg Company (food manufacturer), from September, 1999 to August, 2003. Oversees 83, UAL Corporation (airline) | ||||||
| Richard W. Lowry (Born 1936) c/o Columbia Management Advisors, LLC One Financial Center Boston, MA 02111 Trustee (since 1995) | Private Investor since August, 1987 (formerly Chairman and Chief Executive Officer, U.S. Plywood Corporation (building products manufacturer until 1987)). Oversees 852, None | ||||||
| Charles R. Nelson (Born 1943) c/o Columbia Management Advisors, LLC One Financial Center Boston, MA 02111 Trustee (since 1981) | Professor of Economics, University of Washington, since January, 1976; Ford and Louisa Van Voorhis Professor of Political Economy, University of Washington, since September, 1993 (formerly Director, Institute for Economic Research, University of Washington from September, 2001 to June, 2003); Adjunct Professor of Statistics, University of Washington, since September, 1980; Associate Editor, Journal of Money Credit and Banking, since September, 1993; consultant on econometric and statistical matters. Oversees 83, None | ||||||
| John J. Neuhauser (Born 1942) c/o Columbia Management Advisors, LLC One Financial Center Boston, MA 02111 Trustee (since 1985) | University Professor, Boston College since November, 2005; Academic Vice President and Dean of Faculties from August, 1999 to October, 2005, Boston College. Oversees 852, None | ||||||
27
Fund Governance (Continued)
Trustees
| Name, Address and Age, Position with Funds, Year First Elected or Appointed to Office1 | Principal Occupation(s) During Past Five Years, Number of Portfolios in Columbia Funds Complex Overseen by Trustee, Other Directorships Held | ||||||
| Disinterested Trustees | |||||||
| Patrick J. Simpson (Born 1944) c/o Columbia Management Advisors, LLC One Financial Center Boston, MA 02111 Trustee (since 2000) | Partner, Perkins Coie LLP (law firm). Oversees 83, None | ||||||
| Thomas E. Stitzel (Born 1936) c/o Columbia Management Advisors, LLC One Financial Center Boston, MA 02111 Trustee (since 1998) | Business Consultant since 1999; Chartered Financial Analyst. Oversees 83, None | ||||||
| Thomas C. Theobald (Born 1937) c/o Columbia Management Advisors, LLC One Financial Center Boston, MA 02111 Trustee and Chairman of the Board3 (since 1996) | Partner and Senior Advisor, Chicago Growth Partners (private equity investing) since September, 2004 (formerly Managing Director, William Blair Capital Partners (private equity investing) from September, 1994 to September, 2004). Oversees 83, Anixter International (network support equipment distributor); Ventas, Inc. (real estate investment trust); Jones Lang LaSalle (real estate management services) and Ambac Financial Group (financial guaranty insurance) | ||||||
| Anne-Lee Verville (Born 1945) c/o Columbia Management Advisors, LLC One Financial Center Boston, MA 02111 Trustee (since 1998) | Retired since 1997 (formerly General Manager, Global Education Industry, IBM Corporation (computer and technology) from 1994 to 1997). Oversees 83, Chairman of the Board of Directors, Enesco Group, Inc. (producer of giftware and home and garden decor products) | ||||||
| Interested Trustee | |||||||
| William E. Mayer (Born 1940) c/o Columbia Management Advisors, LLC One Financial Center Boston, MA 02111 Trustee4 (since 1994) | Partner, Park Avenue Equity Partners (private equity) since February, 1999 (formerly Partner, Development Capital LLC from November, 1996 to February, 1999). Oversees 83, Lee Enterprises (print media), WR Hambrecht + Co. (financial service provider); Reader's Digest (publishing); OPENFIELD Solutions (retail industry technology provider) | ||||||
(1) In December 2000, the boards of each of the former Liberty Funds and former Stein Roe Funds were combined into one board of trustees responsible for the oversight of both fund groups (collectively, the "Liberty Board"). In October 2003, the trustees on the Liberty Board were elected to the boards of the Columbia Funds (the "Columbia Board") and of the Columbia Funds Institutional Trust (the "CMG Funds Board"); simultaneous with that election, Patrick J. Simpson who had been a director on the Columbia Board and trustee on the CMG Funds Board, was appointed to serve as trustee of the Liberty Board. The date shown is the earliest date on which a trustee/director was elected or appointed to the board of a Fund in the Columbia Funds Complex.
(2) Messrs. Lowry and Neuhauser also serve as directors/trustees of the Liberty All-Star Funds, currently consisting of 2 funds, which are advised by an affiliate of the Advisor.
(3) Mr. Theobald was appointed as Chairman of the Board effective December 10, 2003.
(4) Mr. Mayer is an "interested person" (as defined in the Investment Company Act of 1940 (1940 Act)) by reason of his affiliation with WR Hambrecht + Co.
The Statement of Additional Information includes additional information about the Trustees of the Funds and is available, without charge, upon request by calling 800-426-3750.
28
Fund Governance (Continued)
Officers
| Name, Address and Age, Position with Columbia Funds, Year First Elected or Appointed to Office | Principal Occupation(s) During Past Five Years | ||||||
| Christopher L. Wilson (Born 1957) One Financial Center Boston, MA 02111 President (since 2004) | Head of Mutual Funds since August, 2004 and Managing Director of the Advisor since September, 2005; President and Chief Executive Officer, CDC IXIS Asset Management Services, Inc. (investment management) from September, 1998 to August, 2004. | ||||||
| James R. Bordewick, Jr. (Born 1959) One Financial Center Boston, MA 02111 Senior Vice President, Secretary and Chief Legal Officer (since 2006) | Associate General Counsel, Bank of America since April, 2005; Senior Vice President and Associate General Counsel, MFS Investment Management (investment management) prior to April, 2005. | ||||||
| J. Kevin Connaughton (Born 1964) One Financial Center Boston, MA 02111 Senior Vice President, Chief Financial Officer and Treasurer (since 2000) | Managing Director of the Advisor since February, 1998. | ||||||
| Mary Joan Hoene (Born 1949) 100 Federal Street Boston, MA 02110 Senior Vice President and Chief Compliance Officer (since 2004) | Senior Vice President and Chief Compliance Officer of various funds in the Fund Complex; Partner, Carter, Ledyard & Milburn LLP (law firm) from January, 2001 to August, 2004. | ||||||
| Michael G. Clarke (Born 1969) One Financial Center Boston, MA 02111 Chief Accounting Officer and Assistant Treasurer (since 2004) | Director of Fund Administration since January, 2006; Managing Director of Columbia Management Advisors, LLC September, 2004 to December, 2005; Vice President Fund Administration June, 2002 to September, 2004. Vice President Product Strategy and Development from February, 2001 to June, 2002. | ||||||
| Jeffrey R. Coleman (Born 1969) One Financial Center Boston, MA 02111 Deputy Treasurer (since 2006) | Director of Fund Administration since January, 2006; Fund Controller from October 2004 to January 2006; Vice President of CDC IXIS Asset Management Services, Inc. (investment management) from August, 2000 to September, 2004. | ||||||
| Joseph F. DiMaria (Born 1968) One Financial Center Boston, MA 02111 Deputy Treasurer (since 2006) | Director of Fund Administration since January, 2006; Head of Tax/Compliance and Assistant Treasurer from November, 2004 to December, 2005; Director of Trustee Administration (Sarbanes-Oxley) from May, 2003 to October, 2004; Senior Audit Manager, PricewaterhouseCoopers (independent registered public accounting firm) from July, 2000 to April, 2003. | ||||||
| Ty S. Edwards (Born 1966) One Financial Center Boston, MA 02111 Deputy Treasurer (since 2006) | Director of Fund Administration since January, 2006; Vice President of the Advisor from July, 2002 to December, 2005; Assistant Vice president and Director, State Street Corporation (financial services) prior to 2002. | ||||||
| Barry S. Vallan (Born 1969) One Financial Center Boston, MA 02111 Controller (since 2006) | Vice President-Fund Treasury of the Advisor since October, 2004; Vice President-Trustee Reporting from April, 2002 to October, 2004; Management Consultant, PricewaterhouseCoopers (independent registered public accounting firm) prior to October, 2002. | ||||||
29
COLUMBIA FUNDS INSTITUTIONAL TRUST
121 S.W. MORRISON STREET, PORTLAND, OREGON 97201
- INVESTMENT ADVISOR -
COLUMBIA MANAGEMENT ADVISORS, LLC
100 FEDERAL STREET
BOSTON, MASSACHUSETTS 02110-2624
- LEGAL COUNSEL -
ROPES & GRAY LLP
ONE INTERNATIONAL PLACE
BOSTON, MASSACHUSETTS 02110-2624
- TRANSFER AGENT -
COLUMBIA MANAGEMENT SERVICES, INC.
P.O. BOX 8081
BOSTON, MASSACHUSETTS 02266-8081
SHC-42/112621-0706 (09/06) 06/28524
A description of the fund's proxy voting policies and procedures is available (i) on the fund's website, www.columbiamanagement.com; (ii) on the Securities and Exchange Commission's website at www.sec.gov, and (iii) without charge, upon request, by calling 800-368-0346. Information regarding how the fund voted proxies relating to portfolio securities during the 12-month period ended June 30 is available from the SEC's website. Information regarding how the fund voted proxies relating to portfolio securities is also available from the fund's website.
The fund files a complete schedule of portfolio holdings with the SEC for the first and third quarters of each fiscal year on Form N-Q. The fund's Form N-Q is available on the SEC's website at www.sec.gov and may be reviewed and copied at the SEC's Public Reference Room in Washington, D.C. Information on the operation of the Public Reference Room may be obtained by calling 1-800-SEC-0330.
The CMG funds are offered by prospectus through Columbia Management Distributors, Inc. Please consider the investment objectives, risks, charges and expenses of a mutual fund carefully before investing. Contact your Columbia Management representative or visit www.columbiamanagement.com for a prospectus, which contains this and other important information about the fund. Read it carefully before you invest.
Fund distributed by Columbia Management Distributors, Inc., One Financial Center, Boston, MA 02111-2621
Item 2. Code of Ethics.
(a) The registrant has, as of the end of the period covered by this report, adopted a code of ethics that applies to the registrant’s principal executive officer, principal financial officer, principal accounting officer or controller, or persons performing similar functions, regardless of whether these individuals are employed by the registrant or a third party.
(b) The registrant’s Board adopted, effective January 3, 2006, a revised code of ethics described in 2(a) above. This revised code of ethics, which is attached as an exhibit hereto, does not differ materially from the code of ethics in effect for the year ended July 31, 2005.
(c) During the period covered by this report, there were no waivers, including any implicit waivers, from a provision of the code of ethics described in 2(a) above that relates to one or more of the items set forth in paragraph (b) of this item’s instructions.
Item 3. Audit Committee Financial Expert.
The registrant’s Board of Trustees has determined that Douglas A. Hacker, Thomas E. Stitzel and Anne-Lee Verville, each of whom are members of the registrant’s Board of Trustees and Audit Committee, each qualify as an audit committee financial expert. Mr. Hacker, Mr. Stitzel and Ms. Verville are each independent trustees, as defined in paragraph (a)(2) of this item’s instructions and collectively constitute the entire Audit Committee.
Item 4. Principal Accountant Fees and Services.
Fee information below is disclosed for the fourteen series of the registrant whose reports to stockholders are included in this annual filing.
(a) Audit Fees. Aggregate Audit Fees billed by the principal accountant for professional services rendered during the fiscal years ended July 31, 2006 and July 31, 2005 are approximately as follows:
2006 |
| 2005 |
| ||
$ | 404,100 |
| $ | 390,300 |
|
Audit Fees include amounts related to the audit of the registrant’s annual financial statements or services that are normally provided by the accountant in connection with statutory and regulatory filings or engagements for those fiscal years.
(b) Audit-Related Fees. Aggregate Audit-Related Fees billed to the registrant by the principal accountant for professional services rendered during the fiscal years ended July 31, 2006 and July 31, 2005 are approximately as follows:
2006 |
| 2005 |
| ||
$ | 58,400 |
| $ | 55,500 |
|
Audit-Related Fees include amounts for assurance and related services by the principal accountant that are reasonably related to the performance of the audit of the registrant’s financial statements and are not reported in Audit Fees above. In both fiscal years 2006 and 2005, Audit-Related Fees include agreed-upon procedures performed for semi-annual shareholder reports.
During the fiscal years ended July 31, 2006 and July 31, 2005, there were no Audit-Related Fees billed by the registrant’s principal accountant to the registrant’s investment adviser (not including any sub-adviser whose role is primarily portfolio management and is subcontracted with or overseen by another investment adviser) and any entity controlling, controlled by, or under common control with the adviser that provides ongoing services to the registrant for an engagement that related directly to the operations and financial reporting of the registrant.
(c) Tax Fees. Aggregate Tax Fees billed by the principal accountant to the registrant for professional services rendered during the fiscal years ended July 31, 2006 and July 31, 2005 are approximately as follows:
2006 |
| 2005 |
| ||
$ | 71,800 |
| $ | 48,800 |
|
Tax Fees consist primarily of the review of annual tax returns, the review of required shareholder distribution calculations and include amounts for professional services by the principal accountant for tax compliance, tax advice and tax planning. Fiscal year 2006 also includes tax fees of approximately $13,000 for agreed-upon procedures related to fund mergers and the review of final tax returns and assistance with foreign tax filings.
During the fiscal years ended July 31, 2006 and July 31, 2005, there were no Tax Fees billed by the registrant’s principal accountant to the registrant’s investment adviser (not including any sub-adviser whose role is primarily portfolio management and is subcontracted with or overseen by another investment adviser) and any entity controlling, controlled by, or under common control with the adviser that provides ongoing services to the registrant for an engagement that related directly to the operations and financial reporting of the registrant.
(d) All Other Fees. Aggregate All Other Fees billed by the principal accountant to the registrant for professional services rendered during the fiscal years ended July 31, 2006 and July 31, 2005 are approximately as follows:
2006 |
| 2005 |
| ||
$ | 2,600 |
| $ | 0 |
|
All Other Fees include amounts for products and services provided by the principal accountant, other than the services reported in paragraphs (a) through (c) above. Fiscal year 2006 includes Audit-Related Fees for agreed-upon procedures related to the review of the registrant’s anti-money laundering program.
Aggregate All Other Fees billed by the registrant’s principal accountant to the registrant’s investment adviser (not including any sub-adviser whose role is primarily portfolio management and is subcontracted with or overseen by another investment adviser) and any entity controlling, controlled by, or under common control with the adviser that provides ongoing services to the registrant for an engagement that related directly to the operations and financial reporting of the registrant during the fiscal years ended July 31, 2006 and July 31, 2005 are approximately as follows:
2006 |
| 2005 |
| ||
$ | 359,600 |
| $ | 95,500 |
|
In both fiscal years 2006 and 2005, All Other Fees include an internal control review of the registrant’s transfer agent. Also included in fiscal year 2006 All Other Fees is an internal control examination of the registrant’s investment advisor.
(e)(1) Audit Committee Pre-Approval Policies and Procedures
The registrant’s Audit Committee is required to pre-approve the engagement of the registrant’s independent accountants to provide audit and non-audit services to the registrant and non-audit services to its investment adviser (not including any sub-adviser whose role is primarily portfolio management and is subcontracted with or overseen by another investment adviser) or any entity controlling, controlled by or under common control with such investment adviser that provides ongoing services to the registrant (“Adviser Affiliates”), if the engagement relates directly to the operations and financial reporting of the registrant.
The Audit Committee has adopted a Policy for Engagement of Independent Accountants for Audit and Non-Audit Services (“Policy”). The Po licy sets forth the understanding of the Audit Committee regarding the engagement of the registrant’s independent accountants to provide (i) audit and permissible audit-related, tax and other services to the registrant (collectively “Fund Services”); (ii) non-audit services to the registrant’s investment adviser (not including any sub-adviser whose role is primarily portfolio management and is subcontracted with or overseen by another investment adviser) and Adviser Affiliates, if the engagement relates directly to the operations or
financial reporting of a Fund (collectively “Fund-related Adviser Services”); and (iii) certain other audit and non-audit services to the registrant’s investment adviser (not including any sub-adviser whose role is primarily portfolio management and is subcontracted with or overseen by another investment adviser) and Adviser Affiliates. Unless a type of service receives general pre-approval under the Policy, it requires specific pre-approval by the Audit Committee if it is to be provided by the independent accountants. Pre-approval of non-audit services to the registrant, the registrant’s investment adviser (not including any sub-adviser whose role is primarily portfolio management and is subcontracted with or overseen by another investment adviser) and Adviser Affiliates may be waived provided that the “de minimis” requirements set forth under paragraph (c)(7)(i)(C) of Rule 2 - -01 of Regulation S-X are met.
Under the Policy, the Audit Committee may delegate pre-approval authority to any pre-designated member or members who are Independent Trustees/Directors. The member(s) to whom such authority is delegated must report, for informational purposes only, any pre-approval decisions to the Audit Committee at its next regular meeting. The Audit Committee’s responsibilities with respect to the pre-approval of services performed by the independent accountants may not be delegated to management.
The Policy requires the Fund Treasurer and/or Director of Board Administration to submit to the Audit Committee, on an annual basis, a schedule of the types of services that are subject to general pre-approval. The schedule(s) provide a description of each type of service that is subject to general pre-approval and, where possible, will provide estimated fee caps for each instance of providing each service. The Audit Committees will review and approve the types of services and review the projected fees for the next fiscal year and may add to, or subtract from, the list of general pre-approved services from time to time based on subsequent determinations. That approval acknowledges that the Audit Committee is in agreement with the specific types of services that the independent accountants will be permitted to perform.
The Fund Treasurer and/or Director of Board Administration shall report to the Audit Committee at each of its regular meetings regarding all Fund Services or Fund-related Adviser Services initiated since the last such report was rendered, including a general description of the services, actual billed and projected fees, and the means by which such Fund Services or Fund-related Adviser Services were pre-approved by the Audit Committee.
*****
(e)(2) The percentage of services described in paragraphs (b) through (d) of this Item approved pursuant to the “de minimis” exception under paragraph (c)(7)(i)(C) of Rule 2-01 of Regulation S-X during both fiscal years ended July 31, 2006 and July 31, 2005 was zero.
(f) Not applicable.
(g) The aggregate non-audit fees billed by the registrant’s accountant for services rendered to the registrant, and rendered to the registrant’s investment adviser (not including any sub-adviser whose role is primarily portfolio management and is subcontracted with or overseen by another investment adviser), and any entity controlling, controlled by, or under common control with the adviser that provides ongoing services to the registrant for the fiscal years ended July 31, 2006 and July 31, 2005 are approximately as follows:
2006 |
| 2005 |
| ||
$ | 492,400 |
| $ | 199,800 |
|
(h) The registrant’s Audit Committee of the Board of Directors has considered whether the provision of non-audit services that were rendered to the registrant’s adviser (not including any sub-adviser whose role is primarily portfolio management and is subcontracted with or overseen by another investment adviser), and any entity controlling, controlled by, or under common control with the investment adviser that provides ongoing services to the registrant that were not pre-approved pursuant to paragraph (c)(7)(ii) of Rule 2-01 of Regulation S-X, is compatible with maintaining the principal accountant’s independence.
Item 5. Audit Committee of Listed Registrants.
Not applicable.
Item 6. Schedule of Investments
The registrant’s “Schedule I – Investments in securities of unaffiliated issuers” (as set forth in 17 CFR 210.12-12) is included in Item 1 of this Form N-CSR.
Item 7. Disclosure of Proxy Voting Policies and Procedures for Closed-End Management Investment Companies.
Not applicable.
Item 8. Portfolio Managers of Closed-End Management Investment Companies.
Not applicable.
Item 9. Purchases of Equity Securities by Closed-End Management Investment Company and Affiliated Purchasers.
Not applicable.
Item 10. Submission of Matters to a Vote of Security Holders.
There have not been any material changes to the procedures by which shareholders may recommend nominees to the registrant’s board of directors, since those procedures were last disclosed in response to requirements of Item 7(d)(2)(ii)(G) of Schedule 14A or this Item.
Item 11. Controls and Procedures.
(a) The registrant’s principal executive officer and principal financial officers, based on their evaluation of the registrant’s disclosure controls and procedures as of a date within 90 days of the filing of this report, have concluded that such controls and procedures are adequately designed to ensure that information required to be disclosed by the registrant in Form N-CSR is accumulated and communicated to the registrant’s management, including the principal executive officer and principal financial officer, or persons performing similar functions, as appropriate to allow timely decisions regarding required disclosure.
(b) There were no changes in the registrant’s internal control over financial reporting that occurred during the registrant’s second fiscal quarter of the period covered by this report that has materially affected, or is reasonably likely to materially affect, the registrant’s internal control over financial reporting.
Item 12. Exhibits.
(a)(1) Code of ethics required to be disclosed under Item 2 of Form N-CSR attached hereto as Exhibit 99.CODE ETH.
(a)(2) Certifications pursuant to Rule 30a-2(a) under the Investment Company Act of 1940 (17 CFR 270.30a-2(a)) attached hereto as Exhibit 99.CERT.
(a)(3) Not applicable.
(b) Certification pursuant to Rule 30a-2(b) under the Investment Company Act of 1940 (17 CFR 270.30a-2(b)) attached hereto as Exhibit 99.906CERT.
SIGNATURES
Pursuant to the requirements of the Securities Exchange Act of 1934 and the Investment Company Act of 1940, the registrant has duly caused this report to be signed on its behalf by the undersigned, thereunto duly authorized.
(registrant) |
| Columbia Funds Institutional Trust |
| ||
| |||||
| |||||
By (Signature and Title) |
| /s/ Christopher L. Wilson |
| ||
| Christopher L. Wilson, President | ||||
| |||||
| |||||
Date |
| September 28, 2006 |
| ||
Pursuant to the requirements of the Securities Exchange Act of 1934 and the Investment Company Act of 1940, this report has been signed below by the following persons on behalf of the registrant and in the capacities and on the dates indicated.
By (Signature and Title) |
| /s/ Christopher L. Wilson |
| |
| Christopher L. Wilson, President | |||
|
| |||
|
| |||
Date |
| September 28, 2006 |
| |
|
|
| ||
|
|
| ||
By (Signature and Title) |
| /s/ J. Kevin Connaughton |
| |
| J. Kevin Connaughton, Treasurer |
| ||
|
|
| ||
|
|
| ||
Date |
| September 28, 2006 |
| |