UNITED STATES
SECURITIES AND EXCHANGE COMMISSION
Washington, D.C. 20549
FORM N-CSR
CERTIFIED SHAREHOLDER REPORT OF REGISTERED
MANAGEMENT INVESTMENT COMPANIES
Investment Company Act file number | 811-5857 | |||||||
| ||||||||
Columbia Funds Institutional Trust | ||||||||
(Exact name of registrant as specified in charter) | ||||||||
| ||||||||
One Financial Center, Boston, Massachusetts |
| 02111 | ||||||
(Address of principal executive offices) |
| (Zip code) | ||||||
| ||||||||
James R. Bordewick, Jr., Esq. Columbia Management Advisors, LLC One Financial Center Boston, MA 02111 | ||||||||
(Name and address of agent for service) | ||||||||
| ||||||||
Registrant’s telephone number, including area code: | 1-617-426-3750 |
| ||||||
| ||||||||
Date of fiscal year end: | July 31, 2008 |
| ||||||
| ||||||||
Date of reporting period: | July 31, 2008 |
| ||||||
Form N-CSR is to be used by management investment companies to file reports with the Commission not later than 10 days after the transmission to stockholders of any report that is required to be transmitted to stockholders under Rule 30e-1 under the Investment Company Act of 1940 (17 CFR 270.30e-1). The Commission may use the information provided on Form N-CSR in its regulatory, disclosure review, inspection, and policymaking roles.
A registrant is required to disclose the information specified by Form N-CSR, and the Commission will make this information public. A registrant is not required to respond to the collection of information contained in Form N-CSR unless the Form displays a currently valid Office of Management and Budget (“OMB”) control number. Please direct comments concerning the accuracy of the information collection burden estimate and any suggestions for reducing the burden to Secretary, Securities and Exchange Commission, 450 Fifth Street, NW, Washington, DC 20549-0609. The OMB has reviewed this collection of information under the clearance requirements of 44 U.S.C. § 3507.
Item 1. Reports to Stockholders.
![]()
CMG CORE BOND FUND
CMG SHORT TERM BOND FUND
CMG ULTRA SHORT TERM BOND FUND
CMG HIGH YIELD FUND
PORTFOLIOS OF COLUMBIA FUNDS INSTITUTIONAL TRUST
Annual Report
July 31, 2008
NOT FDIC INSURED
May Lose Value
No Bank Guarantee
NOT BANK ISSUED
Columbia Management Group, LLC ("Columbia Management") is the investment management division of Bank of America Corporation. Columbia Management entities furnish investment management services and products for institutional and individual investors. The funds are distributed by Columbia Management Distributors, Inc., member of FINRA, SIPC, part of Columbia Management and an affiliate of Bank of America Corporation.
Columbia Management Advisors, LLC ("CMA") is an SEC-registered investment advisor and an indirect, wholly owned subsidiary of Bank of America Corporation and is part of Columbia Management.
Table of Contents
| Management Discussion of Fund Performance | |||||||
| CMG Core Bond Fund | 1 | ||||||
| CMG Short Term Bond Fund | 5 | ||||||
| CMG Ultra Short Term Bond Fund | 9 | ||||||
| CMG High Yield Fund | 13 | ||||||
| Financial Statements | |||||||
| Financial Highlights | 17 | ||||||
| Schedules of Investments | 21 | ||||||
| Statements of Assets and Liabilities | 64 | ||||||
| Statements of Operations | 65 | ||||||
| Statements of Changes in Net Assets | 66 | ||||||
| Notes to Financial Statements | 68 | ||||||
| Report of Independent Registered Public Accounting Firm | 81 | ||||||
| Fund Governance | 82 | ||||||
The views expressed in this report reflect the current views of the respective parties. These views are not guarantees of future performance and involve certain risks, uncertainties and assumptions that are difficult to predict so actual outcomes and results may differ significantly from the views expressed. These views are subject to change at any time based upon economic, market or other conditions and the respective parties disclaim any responsibility to update such views. These views may not be relied on as investment advice and, because investment decisions for a CMG Fund are based on numerous factors, may not be relied on as an indication of trading intent on behalf of any particular CMG Fund. References to specific securities should not be construed as a recommendation or investment advice.
Performance data quoted represents past performance and current performance may be lower or higher. Past performance is no guarantee of future results. The investment return and principal value will fluctuate so that shares, when redeemed, may be worth more or less than the original cost. Please visit www.columbiamanagement.com for daily and most recent month-end performance updates.
CMG CORE BOND FUND
A Portfolio of Columbia Funds Institutional Trust
MANAGEMENT DISCUSSION OF FUND PERFORMANCE
For the twelve-month period that ended July 31, 2008, the CMG Core Bond Fund returned 3.84%. The fund's return was lower than the return of its benchmark, the Lehman Brothers U.S. Aggregate Bond Index,1 which returned 6.15%. However, it was higher than the average return of its peer group, the Lipper Corporate Debt Funds A Rated Classification, which was 1.74% over the same period.2 During the period, funds with lower risk profiles generally tended to be better performers relative to funds with higher risk profiles.
The past twelve months were challenging for the fixed-income markets. As the period began, delinquency rates had already begun to spike for certain classes of lower-quality mortgages. Then, as the economy grew weaker, investors began to question the creditworthiness of virtually all forms of asset-backed securities and structured investments. As investors recoiled from risk, they flocked to the Treasury markets, and, in turn, liquidity dried up throughout the structured investment arena, creating a day-to-day management challenge that persisted through June before moderating somewhat in the final month of the period. Against this risk-averse backdrop, Treasury securities were, by far, the best-performing asset class within the fixed-income markets.
Unfortunately, the fund entered the period with overweight positions in many of the market sectors that would be the hardest hit in the environment that followed, including mortgage-backed securities and long-term corporate bonds. In addition, the fund's holdings included a substantial commitment to homebuilders and financial companies, both of which underperformed the rest of the market. The fund's commercial mortgage-backed securities included holdings that were lower down in their issuers' capital structure. Although our ownership of these riskier assets had boosted portfolio performance in previous periods, the reverse was true during this reporting period. As a result, we devoted much of our attention to reducing the fund's risk exposure, first in corporate obligations and then in mortgage credit holdings, to fit the changed environment, an especially difficult undertaking in an illiquid market.
However, it is important to note that these challenges were faced by most of the fund's peer group. Yet, the fund outperformed its peer group average largely because of two specific decisions made during the period: 1) to keep the average maturity of the fund longer than the
1 The Lehman Brothers U.S. Aggregate Bond Index is a market value-weighted index that tracks the daily price, coupon, pay-downs, and total return performance of fixed-rate, publicly placed, dollar-denominated, and non-convertible investment-grade debt issues with at least $250 million par amount outstanding and with at least one year to final maturity. Indices are not investments, do not incur fees or expenses and are not professionally managed. It is not possible to invest directly in an index. Securities in the fund may not match those in an index.
2 Lipper Inc., a widely respected data provider in the industry, calculates an average total return (assuming reinvestment of distributions) for mutual funds with investment objectives similar to those of the fund. Lipper makes no adjustment for the effect of sales loads.
1
index, a strategy that was a good fit for a weakening economy and paid off throughout the first half of 2008; and 2) to position the bonds in the portfolio to achieve our desired positioning across the yield curve versus the benchmark and the peer group, thereby benefiting performance each time the Federal Reserve Board ("the Fed") lowered short-term interest rates, which it did on seven occasions during the period.
Looking forward, we believe the Fed will continue to walk a fine line on interest rate policy as it seeks to combat inflation without triggering an outright recession. While we believe that economic concerns should keep a lid on rates in the near term, the current structure of the portfolio does not reflect any meaningful bet on the direction of interest rates or the economy. What the portfolio does reflect is a year-long effort to restructure holdings into those subsectors of the traditional fixed-income asset classes in which we have the greatest confidence.
We appreciate your continued confidence in the CMG Core Bond Fund.
Portfolio Management
Alexander D. Powers has co-managed the fund since December 2007 and has been with the advisor or its predecessors or affiliate organizations since 1996.
Jonathan P. Carlson has co-managed the fund since December 2007 and has been with the advisor or its predecessors or affiliate organizations since June 2007.
Michael Zazzarino has co-managed the fund since December 2007 and has been with the advisor or its predecessors or affiliate organizations since March 2005.
Carl W. Pappo has co-managed the fund since March 2008 and has been with the advisor or its predecessors or affiliate organizations since January 1993.
The fund's top ten holdings (as a percentage of net assets) as of July 31, 2008 were:
| (%) | |||||||
| Federal National Mortgage Association, 5.500% 07/01/2038* | 9.9 | ||||||
| Federal National Mortgage Association, 6.000% 05/01/2038* | 5.3 | ||||||
| Federal National Mortgage Association, 5.000% 06/01/2038* | 5.3 | ||||||
| U.S Treasury Notes, 3.875% 05/15/2018 | 4.1 | ||||||
| Federal National Mortgage Association, 6.500% 01/01/2038* | 3.7 | ||||||
| U.S Treasury Notes, 3.375% 06/30/2013 | 3.7 | ||||||
| Federal National Mortgage Association, 5.000% 04/01/2038* | 3.0 | ||||||
| U.S Treasury Bonds, 5.000% 05/15/2037 | 2.3 | ||||||
| Federal National Mortgage Association, 5.500% 09/01/2037* | 1.8 | ||||||
| Chase Mortgage Finance Corp., 6.000% 03/25/2037 | 1.5 | ||||||
| * Mortgage-backed securities | |||||||
Holdings are calculated as a percentage of net assets and are subject to change. Because the fund is actively managed, there is no guarantee the fund will continue to maintain the holdings breakdown listed. The fund's holdings and their weights within the portfolio may change as market conditions change.
Investing in fixed-income securities may involve certain risks, including the credit quality of individual issuers, possible prepayments, market or economic developments and yield and share price fluctuations due to changes in interest rates. When interest rates go up, bond prices generally drop, and vice versa.
2
Performance data quoted represents past performance and current performance may be lower or higher. Past performance is no guarantee of future results. The investment return and principal value will fluctuate so that shares, when redeemed, may be worth more or less than the original cost. Please visit www.columbiamanagement.com for daily and most recent month-end performance updates.
Average annual total return as of July 31, 2008 (%)
| Inception | 1-year | 5-year | Life | ||||||||||||||||
| CMG Core Bond Fund | 09/01/00 | 3.84 | 3.99 | 5.25 | |||||||||||||||
| Lehman Brothers U.S. Aggregate Bond Index | 6.15 | 4.55 | 5.89 | ||||||||||||||||
Average annual total return as of June 30, 2008 (%)
| Inception | 1-year | 5-year | Life | ||||||||||||||||
| CMG Core Bond Fund | 09/01/00 | 4.99 | 3.45 | 5.39 | |||||||||||||||
| Lehman Brothers U.S. Aggregate Bond Index | 7.12 | 3.86 | 5.97 | ||||||||||||||||
Performance results reflect any fee waivers or reimbursements of fund expenses by the investment advisor and/or any of its affiliates. Absent these fee waivers or expense reimbursement arrangements, performance results would have been lower. All results shown assume reinvestment of distributions and do not reflect the deduction of taxes that a shareholder may pay on fund distributions or on the redemption of fund shares.
The fund's annual operating expense ratios, with and without contractual waivers, as stated in the fund's prospectus that is current as of the date of this report, are 0.25% and 0.38%, respectively, of average annual net assets. Differences in expense ratios disclosed elsewhere in this report may result from including fee waivers and expense reimbursements as well as different time periods used in calculating the ratios. The contractual waiver expires 03/01/2009.
Growth of a $3,000,000 investment, September 1, 2000 to July 31, 2008
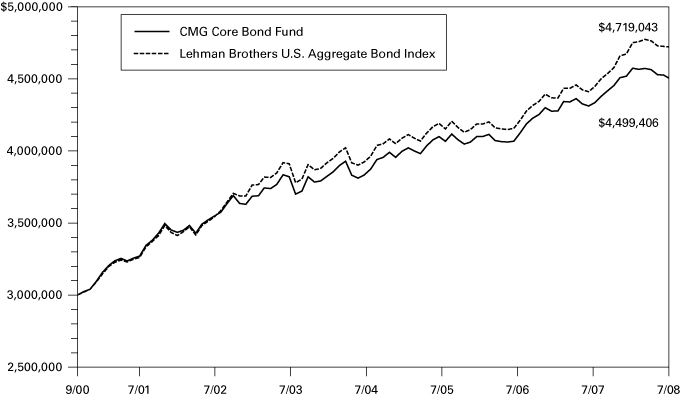
The chart above shows the growth in value of a hypothetical minimum initial $3,000,000 investment in the fund compared to the index during the stated time period and does not reflect the deduction of taxes that a shareholder may pay on fund distributions or on the redemption of fund shares.
The Lehman Brothers U.S. Aggregate Bond Index is a market value-weighted index that tracks the daily price, coupon, pay-downs, and total return performance of fixed-rate, publicly placed, dollar-denominated, and non-convertible investment-grade debt issues with at least $250 million par amount outstanding and with at least one year to final maturity. Indices are not investments, do not incur fees or expenses and are not professionally managed. It is not possible to invest directly in an index. Securities in the fund may not match those in an index.
Index performance is from September 1, 2000.
3
UNDERSTANDING YOUR EXPENSES – CMG Core Bond Fund
As a fund shareholder, you incur two types of costs. There are transaction costs and also ongoing costs, which generally include investment advisory fees and other fund expenses. The information on this page is intended to help you understand the ongoing costs of investing in the fund and to compare these costs with the ongoing costs of investing in other mutual funds.
Analyzing your fund's expenses
To illustrate these ongoing costs, we have provided an example and calculated the expenses paid by investors during the reporting period. The information in the following table is based on an initial investment of $1,000, which is invested at the beginning of the reporting period and held for the entire period. Expense information is calculated two ways and each method provides you with different information. The amount listed in the "actual" column is calculated using the fund's actual operating expenses and total return for the period. The amount listed in the "hypothetical" column assumes that the return each year is 5% before expenses and is calculated based on the fund's actual operating expenses. You should not use the hypothetical account values and expenses to estimate either your actual account balance at the end of the period or the expenses you paid during this reporting period.
Estimating your actual expenses
To estimate the expenses that you paid over the period, first you will need your account balance at the end of the period:
1. Divide your ending account balance by $1,000. For example, if an account balance was $8,600 at the end of the period, the result would be 8.6.
2. In the section of the table below titled "Expenses paid during the period," locate the amount under "actual." Multiply this number by the result from step 1. Your answer is an estimate of the expenses you paid on your account during the period.
February 1, 2008 – July 31, 2008
| Account value at the beginning of the period ($) | Account value at the end of the period ($) | Expenses paid during the period ($) | Fund's annualized expense ratio (%) | ||||||||||||||||||||||||
| Actual | Hypothetical | Actual | Hypothetical | Actual | Hypothetical | Actual | |||||||||||||||||||||
| 1,000.00 | 1,000.00 | 983.89 | 1,023.62 | 1.23 | 1.26 | 0.25 | |||||||||||||||||||||
Expenses paid during the period are equal to the annualized expense ratio of 0.25%, multiplied by the average account value over the period, then multiplied by the number of days in the fund's most recent fiscal half-year and divided by 366.
Had the investment advisor and/or any of its affiliates not waived fees or reimbursed a portion of expenses, account value at end of the period would have been reduced.
It is important to note that the expense amounts shown in the table are meant to highlight only ongoing costs of investing in the fund. Therefore, the hypothetical examples provided may not help you determine the relative total costs of owning shares of different funds.
Compare with other funds
Since all mutual funds are required to include the same hypothetical calculations about expenses in shareholder reports, you can use this information to compare the ongoing costs of investing in the fund with other funds. To do so, compare the 5% hypothetical example with the 5% hypothetical examples that appear in the shareholder reports of other funds. As you compare hypothetical examples of other funds, it is important to note that hypothetical examples are meant to highlight the ongoing costs of investing in a fund.
4
Performance data quoted represents past performance, and current performance may be lower or higher. Past performance is no guarantee of future results. The investment return and principal value will fluctuate so that shares, when redeemed, may be worth more or less than the original cost. Please visit www.columbiamanagement.com for daily and most recent month-end performance updates.
CMG SHORT TERM BOND FUND
A Portfolio of Columbia Funds Institutional Trust
MANAGEMENT DISCUSSION OF FUND PERFORMANCE
For the twelve-month period that ended July 31, 2008, CMG Short Term Bond Fund returned 4.60%. The fund underperformed its benchmark, the Merrill Lynch 1-3 Year U.S. Treasury Index,1 which returned 6.76% during the period. The fund's benchmark is composed of Treasury securities and does not have exposure to many of the other bond sectors included in the fund. These other sectors underperformed Treasuries due to a "flight to quality." Investors bid up the price of Treasury securities while ignoring higher yielding investment grade bonds. By contrast, the fund outperformed the average return of its peer group, the Lipper Short Investment Grade Debt Funds Classification, which was only 0.26%.2
The period was characterized by severe investor reaction to a series of well-publicized difficulties in the mortgage and housing markets. Extensive writedowns by brokerages and other financial companies created a market environment in which trading slowed to a standstill for anything but government bonds. Corporate bonds, asset-backed securities and mortgage-backed securities were left behind in this flight to quality and underperformed comparable Treasury securities by several percentage points.
During the reporting period, the Federal Reserve Board ("the Fed") acted on seven different occasions to help stimulate the sagging economy by lowering the federal funds rate, a closely watched overnight lending rate to banks. Altogether the fed funds rate was pushed 3.25 percentage points lower, finishing the period at just 2.00%. The portfolio was well-positioned to benefit from the trend to lower rates, as it maintained a longer-than-average maturity profile for most of the period. In particular, we maintained a bulleted portfolio structure that emphasized securities with maturities of two years. This strategy paid off as yields on two-year Treasury securities declined by over two percentage points, well above the 1.33 percentage point decline in the five-year area. Yields and bond prices move in opposite directions.
The Fed has signaled that it may not lower short-term rates further as inflation risks have risen. However, the risks of higher rates to a struggling economy are well understood, and there are more than enough worrisome economic headlines to lead us to believe that the Fed is not likely to raise short-term interest rates during the next few months. Overall, we have
1 The Merrill Lynch 1-3 Year U.S. Treasury Index tracks the performance of sovereign debt publicly issued in the US domestic market with maturities of 1-3 years and a minimum amount outstanding of $1 billion. Indices are not investments, do not incur fees or expenses and are not professionally managed. It is not possible to invest directly in an index. Securities in the fund may not match those in an index.
2 Lipper Inc., a widely respected data provider in the industry, calculates an average total return (assuming reinvestment of distributions) for mutual funds with investment objectives similar to those of the fund. Lipper makes no adjustment for the effect of sales loads.
5
maintained a maturity profile that is neutral to the fund's benchmark, meaning that we have not made any significant bet on the future direction of interest rates.
While corporate bonds as a group underperformed the Treasury market, the fund was aided by its emphasis on sectors such as energy, utilities, capital goods and consumer non-cyclicals, all of which outperformed the broader corporate market. In particular, the fund was aided relative to its peer group by maintaining a high-quality orientation and by avoiding many of the specific problem areas that plagued the bond market during the period.
Although the past twelve months were a difficult period throughout the fixed-income markets, we remain committed to our strategy of emphasizing non-Treasury markets, a strategy that has proved itself over several market cycles. Today, yields on corporate bonds and securitized investments are at historically high levels versus Treasury securities of comparable maturities. When markets stabilize and relative yields return to more normal levels, we believe that the fund's strategy has the potential to provide excess returns relative to its benchmark and peer group.
We appreciate your continued confidence in CMG Short Term Bond Fund.
Portfolio Management
Leonard A. Aplet has co-managed the fund since February 1998 and has been with the advisor or its predecessors or affiliate organizations since 1987.
Ronald Stahl has co-managed the fund since November 2006 and has been with the advisor or its predecessors or affiliate organizations since 1998.
The fund's top ten holdings (as a percentage of net assets) as of July 31, 2008 were:
| (%) | |||||||
| Federal Home Loan Mortgage Corp, 5.500% 11/15/2028 | 2.8 | ||||||
| AmeriCredit Automobile Receivables Trust, 5.420% 05/07/2012 | 1.9 | ||||||
| USAA Auto Owner Trust, 4.890% 8/15/2012 | 1.8 | ||||||
| Federal Home Loan Bank, 5.250% 06/11/2010 | 1.7 | ||||||
| Bear Stearns Commercial Mortgage Securities, Inc., 3.869% 02/11/2041 | 1.7 | ||||||
| Nissan Auto Receivables Owner Trust, 5.220% 11/15/2011 | 1.6 | ||||||
| Federal Home Loan Mortgage Corp., 5.500% 08/01/2023 | 1.6 | ||||||
| Federal Home Loan Mortgage Corp, 5.500% 5/15/2034 | 1.6 | ||||||
| Capital One Auto Finance Trust, 5.030% 4/15/2012 | 1.4 | ||||||
| U.S. Treasury Notes, 3.875% 10/31/2012 | 1.4 | ||||||
Holdings are calculated as a percentage of net assets and are subject to change. Because the fund is actively managed, there is no guarantee the fund will continue to maintain the holdings breakdown listed. The fund's holdings and their weights within the portfolio may change as market conditions change.
Investing in fixed-income securities may involve certain risks, including the credit quality of individual issuers, possible prepayments, market or economic developments and yield and share price fluctuations due to changes in interest rates. When interest rates go up, bond prices typically drop, and vice versa.
6
Performance data quoted represents past performance and current performance may be lower or higher. Past performance is no guarantee of future results. The investment return and principal value will fluctuate so that shares, when redeemed, may be worth more or less than the original cost. Please visit www.columbiamanagement.com for daily and most recent month-end performance updates.
Average annual total return as of July 31, 2008 (%)
| Inception | 1-year | 5-year | 10-year | ||||||||||||||||
| CMG Short Term Bond Fund | 02/02/98 | 4.60 | 3.63 | 4.78 | |||||||||||||||
| Merrill Lynch 1-3 Year U.S. Treasury Index | 6.76 | 3.48 | 4.65 | ||||||||||||||||
Average annual total return as of June 30, 2008 (%)
| Inception | 1-year | 5-year | 10-year | ||||||||||||||||
| CMG Short Term Bond Fund | 02/02/98 | 5.15 | 3.36 | 4.82 | |||||||||||||||
| Merrill Lynch 1-3 Year U.S. Treasury Index | 7.30 | 3.29 | 4.66 | ||||||||||||||||
Performance results reflect any fee waivers or reimbursements of fund expenses by the investment advisor and/or any of its affiliates. Absent these fee waivers or expense reimbursement arrangements, performance results would have been lower. All results shown assume reinvestment of distributions and do not reflect the deduction of taxes that a shareholder may pay on fund distributions or on the redemption of fund shares.
The fund's annual operating expense ratios, with and without contractual waivers, as stated in the fund's prospectus that is current as of the date of this report, are 0.25% and 0.32%, respectively, of average annual net assets. Differences in expense ratios disclosed elsewhere in this report may result from including fee waivers and expense reimbursements as well as different time periods used in calculating the ratios. The contractual waiver expires 03/01/2009.
Growth of a $3,000,000 investment, August 1, 1998 to July 31, 2008
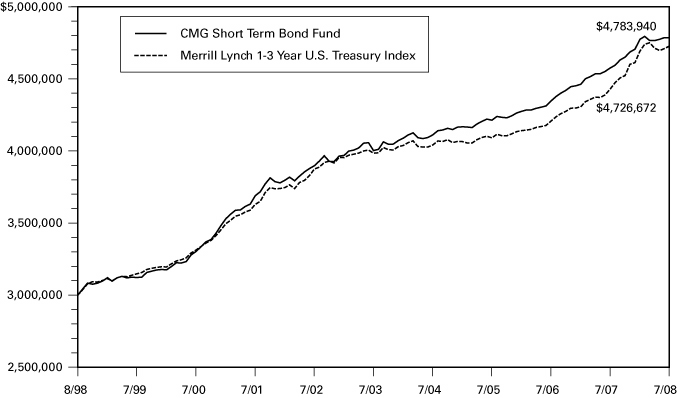
The chart above shows the growth in value of a hypothetical minimum initial $3,000,000 investment in the fund compared to the index during the stated time period and does not reflect the deduction of taxes that a shareholder may pay on fund distributions or on the redemption of fund shares.
The Merrill Lynch 1-3 Year U.S. Treasury Index tracks the performance of sovereign debt publicly issued in the U.S. domestic market with maturities of 1-3 years and a minimum amount outstanding of $1 billion. Indices are not investments, do not incur fees or expenses and are not professionally managed. It is not possible to invest directly in an index. Securities in the fund may not match those in an index.
7
UNDERSTANDING YOUR EXPENSES – CMG Short Term Bond Fund
As a fund shareholder, you incur two types of costs. There are transaction costs and also ongoing costs, which generally include investment advisory fees and other fund expenses. The information on this page is intended to help you understand the ongoing costs of investing in the fund and to compare these costs with the ongoing costs of investing in other mutual funds.
Analyzing your fund's expenses
To illustrate these ongoing costs, we have provided an example and calculated the expenses paid by investors during the reporting period. The information in the following table is based on an initial investment of $1,000, which is invested at the beginning of the reporting period and held for the entire period. Expense information is calculated two ways and each method provides you with different information. The amount listed in the "actual" column is calculated using the fund's actual operating expenses and total return for the period. The amount listed in the "hypothetical" column assumes that the return each year is 5% before expenses and is calculated based on the fund's actual operating expenses. You should not use the hypothetical account values and expenses to estimate either your actual account balance at the end of the period or the expenses you paid during this reporting period.
Estimating your actual expenses
To estimate the expenses that you paid over the period, first you will need your account balance at the end of the period:
1. Divide your ending account balance by $1,000. For example, if an account balance was $8,600 at the end of the period, the result would be 8.6.
2. In the section of the table below titled "Expenses paid during the period," locate the amount under "actual." Multiply this number by the result from step 1. Your answer is an estimate of the expenses you paid on your account during the period.
February 1, 2008 – July 31, 2008
| Account value at the beginning of the period ($) | Account value at the end of the period ($) | Expenses paid during the period ($) | Fund's annualized expense ratio (%) | ||||||||||||||||||||||||
| Actual | Hypothetical | Actual | Hypothetical | Actual | Hypothetical | Actual | |||||||||||||||||||||
| 1,000.00 | 1,000.00 | 1,002.29 | 1,023.62 | 1.24 | 1.26 | 0.25 | |||||||||||||||||||||
Expenses paid during the period are equal to the annualized expense ratio of 0.25%, multiplied by the average account value over the period, then multiplied by the number of days in the fund's most recent fiscal half-year and divided by 366.
Had the investment advisor and/or any of its affiliates not waived fees or reimbursed a portion of expenses, account value at end of the period would have been reduced.
It is important to note that the expense amounts shown in the table are meant to highlight only ongoing costs of investing in the fund. Therefore, the hypothetical examples provided may not help you determine the relative total costs of owning shares of different funds.
Compare with other funds
Since all mutual funds are required to include the same hypothetical calculations about expenses in shareholder reports, you can use this information to compare the ongoing costs of investing in the fund with other funds. To do so, compare the 5% hypothetical example with the 5% hypothetical examples that appear in the shareholder reports of other funds. As you compare hypothetical examples of other funds, it is important to note that hypothetical examples are meant to highlight the ongoing costs of investing in a fund.
8
Performance data quoted represents past performance, and current performance may be lower or higher. Past performance is no guarantee of future results. The investment return and principal value will fluctuate so that shares, when redeemed, may be worth more or less than the original cost. Please visit www.columbiamanagement.com for daily and most recent month-end performance updates.
CMG ULTRA SHORT TERM BOND FUND
A Portfolio of Columbia Funds Institutional Trust
MANAGEMENT DISCUSSION OF FUND PERFORMANCE
For the twelve-month period that ended July 31, 2008, CMG Ultra Short Term Bond Fund returned 1.42%. The fund underperformed its benchmark, the Citigroup One-Year U.S. Treasury Bill Index, which returned 5.24%.1 The fund outperformed the negative 1.97% average return of its peer group, the Lipper Ultra-Short Obligations Funds Classification.2 Because the fund holds positions in corporate bonds, as well as mortgage-backed and asset-backed securities, it could not compete effectively versus its all-Treasury one-year benchmark as Treasuries outperformed all other fixed-income sectors during the period. However, the fund's emphasis on securities backed by credit card debt and auto loans, and specifically its corresponding de-emphasis on mortgage-backed securities, enabled it to outperform its peer group.
The past twelve months were a challenging period for the fixed-income marketplace. Well-publicized difficulties in the mortgage and housing markets caused investors to become skeptical of virtually any security not backed by the U.S. government. As a result, all but the highest quality market sectors experienced an unprecedented loss of liquidity. The flight to quality caused Treasury yields to decline to unusually low levels—and prices to rise—relative to other short-term instruments.
The fixed income market experienced significant illiquidity during the past twelve months which in turn impacted the underlying market values of all securities except those which the market considers risk free: U.S. Treasuries. The fund tried to minimize some of the volatility and impact of price fluctuations by increasing exposure to the U.S. Government sector during the period, even though the yield level for those securities may not have been as high. Liquidity was in demand and, as a result, the percentage of the fund dedicated to these assets was not always attractive. The percentage of the fund dedicated to these ultra safe sectors of the market rose from 4.6% of net assets at the end of 2007 to 10% of net assets by the end of the period. We also sought to change the composition of the fund's corporate holdings, trading out of the financials sector whenever possible and into high-quality industrial companies with what we b elieve to be good business prospects.
Short-term yields declined throughout the period, the result of an extended effort by the Federal Reserve Board to aid the economy by lowering the overnight lending rate. And there
1 The Citigroup One-Year U.S. Treasury Bill Index consists of a single 1-year U.S. Treasury Bill whose return is tracked until its maturity. Indices are not investments, do not incur fees or expenses and are not professionally managed. It is not possible to invest directly in an index. Securities in the fund may not match those in an index.
2 Lipper Inc., a widely respected data provider in the industry, calculates an average total return (assuming reinvestment of distributions) for mutual funds with similar investment objectives as those of the fund. Lipper makes no adjustments for the effect of sales loads.
9
was little difference in yields between short- and longer-term securities (within the fund's short-term parameters), which means that investors, for most of the period, were not being compensated for taking on the additional risk of owning securities with longer maturities. Against this backdrop, we kept the fund's maturity profile relatively short. However, in the first quarter of 2008, we began to purchase selected longer maturities when a slight rise in relative yields made it more attractive to own six-month securities rather than one-month securities.
We plan to continue to extend the fund's exposure to longer-term maturities within the short-term range and to improve the fund's credit quality in the year ahead. However, market conditions remain difficult, and the experiences of the past twelve months suggest that maintaining liquidity will continue to be one of the fund's primary objectives.
We appreciate your continued confidence in the CMG Ultra Short Term Bond Fund.
Portfolio Management
Guy C. Holbrook has managed the fund since March 2004 and has been with the advisor or its predecessors or affiliate organizations since 1998.
The fund's top ten holdings (as a percentage of net assets) as of July 31, 2008 were:
| (%) | |||||||
| Federal National Mortgage Association, 4.250% 05/15/2009 | 3.1 | ||||||
| Bank One Issuance Trust, 3.940% 04/16/2012 | 2.1 | ||||||
| E.I. Du Pont de Nemours & Co., 6.875% 10/15/2009 | 1.6 | ||||||
| Federal Home Loan Mortgage Corp., 5.000% 06/11/2009 | 1.6 | ||||||
| AmeriCredit Automobile Receivables Trust, 5.420% 08/08/2011 | 1.6 | ||||||
| Citibank Credit Card Issuance Trust, 4.400% 09/15/2010 | 1.6 | ||||||
| Berkshire Hathaway Finance Corp., 3.092% 01/11/2011 | 1.6 | ||||||
| AmeriCredit Automobile Receivables Trust, 5.190% 11/06/2011 | 1.5 | ||||||
| Leek Finance PLC, 2.911% 12/21/2038 | 1.4 | ||||||
| Chase Issuance Trust, 4.520% 12/15/2010 | 1.3 | ||||||
Holdings are calculated as a percentage of net assets and are subject to change. Because the fund is actively managed, there is no guarantee the fund will continue to maintain the holdings breakdown listed. The fund's holdings and their weights within the portfolio may change as market conditions change.
Investing in fixed-income securities may involve certain risks, including the credit quality of individual issuers, possible prepayments, market or economic developments and yield and share price fluctuations due to changes in interest rates. When interest rates go up, bond prices typically drop, and vice versa.
10
Performance data quoted represents past performance and current performance may be lower or higher. Past performance is no guarantee of future results. The investment return and principal value will fluctuate so that shares, when redeemed, may be worth more or less than the original cost. Please visit www.columbiamanagement.com for daily and most recent month-end performance updates.
Average annual total return as of July 31, 2008 (%)
| Inception | 1-year | Life | |||||||||||||
| CMG Ultra Short Term Bond Fund | 03/08/04 | 1.42 | 2.63 | ||||||||||||
| Citigroup One-Year U.S. Treasury Bill Index | 5.24 | 3.42 | |||||||||||||
Average annual total return as of June 30, 2008 (%)
| Inception | 1-year | Life | |||||||||||||
| CMG Ultra Short Term Bond Fund | 03/08/04 | 1.33 | 2.71 | ||||||||||||
| Citigroup One-Year U.S. Treasury Bill Index | 5.43 | 3.41 | |||||||||||||
Performance results reflect any fee waivers or reimbursements of fund expenses by the investment advisor and/or any of its affiliates. Absent these fee waivers or expense reimbursement arrangements, performance results would have been lower. All results shown assume reinvestment of distributions and do not reflect the deduction of taxes that a shareholder may pay on fund distributions or on the redemption of fund shares.
The fund's annual operating expense ratios, with and without contractual waivers, as stated in the fund's prospectus that is current as of the date of this report, are 0.25% and 0.31%, respectively, of average annual net assets. Differences in expense ratios disclosed elsewhere in this report may result from including fee waivers and expense reimbursements as well as different time periods used in calculating the ratios. The contractual waiver expires 03/01/2009.
Growth of a $3,000,000 investment, March 8, 2004 to July 31, 2008
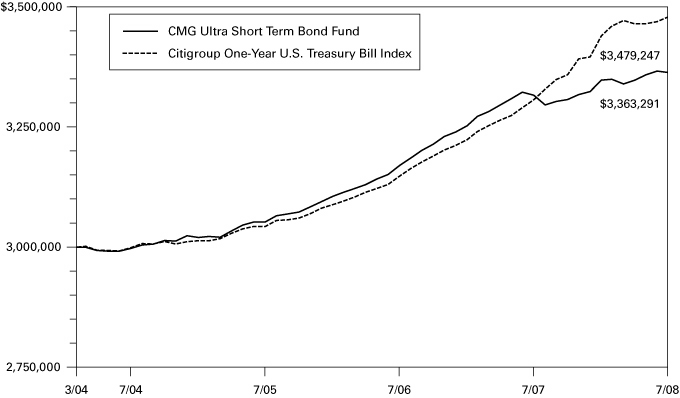
The chart above shows the growth in value of a hypothetical minimum initial $3,000,000 investment in the fund compared to the index during the stated time period and does not reflect the deduction of taxes that a shareholder may pay on fund distributions or on the redemption of fund shares.
The Citigroup One-Year U.S. Treasury Bill Index consists of a single 1-year U.S. Treasury Bill whose return is tracked until its maturity. Indices are not investments, do not incur fees or expenses and are not professionally managed. It is not possible to invest directly in an index. Securities in the fund may not match those in an index.
Index performance is from March 8, 2004.
11
UNDERSTANDING YOUR EXPENSES – CMG Ultra Short Term Bond Fund
As a fund shareholder, you incur two types of costs. There are transaction costs and also ongoing costs, which generally include investment advisory fees and other fund expenses. The information on this page is intended to help you understand the ongoing costs of investing in the fund and to compare these costs with the ongoing costs of investing in other mutual funds.
Analyzing your fund's expenses
To illustrate these ongoing costs, we have provided an example and calculated the expenses paid by investors during the reporting period. The information in the following table is based on an initial investment of $1,000, which is invested at the beginning of the reporting period and held for the entire period. Expense information is calculated two ways and each method provides you with different information. The amount listed in the "actual" column is calculated using the fund's actual operating expenses and total return for the period. The amount listed in the "hypothetical" column assumes that the return each year is 5% before expenses and is calculated based on the fund's actual operating expenses. You should not use the hypothetical account values and expenses to estimate either your actual account balance at the end of the period or the expenses you paid during this reporting period.
Estimating your actual expenses
To estimate the expenses that you paid over the period, first you will need your account balance at the end of the period:
1. Divide your ending account balance by $1,000. For example, if an account balance was $8,600 at the end of the period, the result would be 8.6.
2. In the section of the table below titled "Expenses paid during the period," locate the amount under "actual." Multiply this number by the result from step 1. Your answer is an estimate of the expenses you paid on your account during the period.
February 1, 2008 – July 31, 2008
| Account value at the beginning of the period ($) | Account value at the end of the period ($) | Expenses paid during the period ($) | Fund's annualized expense ratio (%) | ||||||||||||||||||||||||
| Actual | Hypothetical | Actual | Hypothetical | Actual | Hypothetical | Actual | |||||||||||||||||||||
| 1,000.00 | 1,000.00 | 1,004.62 | 1,023.62 | 1.25 | 1.26 | 0.25 | |||||||||||||||||||||
Expenses paid during the period are equal to the annualized expense ratio of 0.25%, multiplied by the average account value over the period, then multiplied by the number of days in the fund's most recent fiscal half-year and divided by 366.
Had the investment advisor and/or any of its affiliates not waived fees or reimbursed a portion of expenses, account value at end of the period would have been reduced.
It is important to note that the expense amounts shown in the table are meant to highlight only ongoing costs of investing in the fund. Therefore, the hypothetical examples provided may not help you determine the relative total costs of owning shares of different funds.
Compare with other funds
Since all mutual funds are required to include the same hypothetical calculations about expenses in shareholder reports, you can use this information to compare the ongoing costs of investing in the fund with other funds. To do so, compare the 5% hypothetical example with the 5% hypothetical examples that appear in the shareholder reports of other funds. As you compare hypothetical examples of other funds, it is important to note that hypothetical examples are meant to highlight the ongoing costs of investing in a fund.
12
Performance data quoted represents past performance, and current performance may be lower or higher. Past performance is no guarantee of future results. The investment return and principal value will fluctuate so that shares, when redeemed, may be worth more or less than the original cost. Please visit www.columbiamanagement.com for daily and most recent month-end performance updates.
CMG HIGH YIELD FUND
A Portfolio of Columbia Funds Institutional Trust
MANAGEMENT DISCUSSION OF FUND PERFORMANCE
For the twelve-month period that ended July 31, 2008, the CMG High Yield Fund returned 2.81%. It underperformed its benchmark, the JPMorgan Developed BB High Yield Index,1 which returned 3.79%. It outperformed the average return of its peer group, the Lipper High Current Yield Funds Classification, which was negative 1.37% for the period.2 The performance differential was the result of the fund's positioning relative to risk: we believe it was more conservatively positioned than its peer group but less conservatively positioned than its benchmark during a period when market sentiment was highly risk-averse.
The fund has historically concentrated on the higher quality segments of the high-yield market, and this positioning was helpful in the twelve months gone by. Turmoil in the mortgage markets created an environment in which fixed-income investors made near-term safety a much greater priority than long-term potential. As a result, Treasury securities were the single best-performing asset class within the fixed-income markets, and, more generally, lower credit-quality translated into weaker near-term performance. The high-yield market was rendered especially vulnerable as the economy slowed and corporate earnings came under pressure.
The fund's underweight position in riskier CCC bonds was a good match for this risk-averse environment. Specific holdings that benefited the fund were Teekay Shipping; power generating companies, such as Intergen and Mirant; and forest-products company Domtar and packaging/containers companies Owens-Illinois and Crown Holdings. The fund's holdings in hospital company HCA and mining company Freeport-McMoran were also helpful to overall performance, because the industries they represent were somewhat insulated from the fortunes of the national economy.3
Holdings that detracted from performance included a range of more economically sensitive companies, notably printer Quebecor and telephone directory companies R.H. Donnelley and Idearc. A position in Sprint was hurt by poor operating performance and, ultimately, a ratings downgrade, while GMAC (General Motors Acceptance Corporation) came under pressure as
The credit quality ratings represent those of Moody's Investors Service, Inc. ("Moody's") or Standard & Poor's Corporation ("S&P") credit ratings. The ratings represent their opinions as to the quality of the securities they rate. Ratings are relative and subjective and are not absolute standards of quality. The security's credit quality does not eliminate risk.
1 The JPMorgan Developed BB High Yield Index is designed to mirror the investable universe of the U.S. dollar developed, BB-rated, high yield corporate debt market. Indices are not investments, do not incur fees or expenses and are not professionally managed. It is not possible to invest directly in an index. Securities in the fund may not match those in an index.
2 Lipper Inc., a widely respected data provider in the industry, calculates an average total return (assuming reinvestment of distributions) for mutual funds with investment objectives similar to those of the fund. Lipper makes no adjustment for the effect of sales loads.
3 Holdings are disclosed as a percentage of net assets on July 31, 2008, and are subject to change: Teekay Shipping (0.7%), Intergen (1.2%), Mirant (1.1%), Owens-Illinois (1.0%), Domtar (0.6%), Crown Holdings (0.8%), HCA (3.0%), Freeport-McMoRan (1.7%), Quebecor (0.8%), R.H. Donnelley (0.4%), Idearc (0.2%), GMAC (0.6%).
13
mortgage and auto financing became more difficult. We sold Sprint before the end of the period. More generally, the fund was underweighted in BB-rated bonds relative to its benchmark. This hurt relative performance because BB bonds represent the best credit quality available in the high-yield markets.
We believe that the financial markets will continue to be volatile in the year ahead. As the economy struggles, we would not be surprised to see an increase in the corporate default rate, representing a significant challenge for the high-yield marketplace. We intend to maintain the fund's focus on conservative, higher quality issues, a stance that we believe should continue to benefit our shareholders. We will continue to seek out what we believe are companies with strong underlying assets that generate solid free cash flow. We believe such companies are well-positioned to survive near-term economic weakness and offer upside potential when market conditions improve.
We appreciate your continued confidence in the CMG High Yield Fund.
Portfolio Management
Kevin L. Cronk has co-managed the fund since September 2005. He has been with the advisor or its predecessors or affiliate organizations since August 1999.
Thomas A. LaPointe has co-managed the fund since September 2005. He has been with the advisor or its predecessors or affiliate organizations since February 1999.
The fund's top ten holdings (as a percentage of net assets) as of July 31, 2008 were:
| (%) | |||||||
| HCA, Inc., 9.625% 11/15/2016 | 2.3 | ||||||
| Edison Mission Energy, 7.000% 05/15/2017 | 1.9 | ||||||
| Freeport-McMoRan Copper & Gold, Inc., 8.375% 04/01/2017 | 1.7 | ||||||
| EchoStar DBS Corp., 6.625% 10/01/2014 | 1.5 | ||||||
| TXU Energy Co. LLC, 6.234% 10/10/2014 | 1.5 | ||||||
| DirecTV Holdings LLC, 6.375% 06/15/2015 | 1.5 | ||||||
| Chesapeake Energy Corp., 6.375% 06/15/2015 | 1.4 | ||||||
| Allied Waste North America, Inc., 7.125% 05/15/2016 | 1.2 | ||||||
| Intergen NV, 9.000% 06/30/2017 | 1.2 | ||||||
| Qwest Corp., 7.500% 10/01/2014 | 1.2 | ||||||
Holdings are calculated as a percentage of net assets and are subject to change. Because the fund is actively managed, there is no guarantee the fund will continue to maintain the holdings breakdown listed. The fund's holdings and their weights within the portfolio may change as market conditions change.
Investing in fixed-income securities may involve certain risks, including the credit quality of individual issuers, possible prepayments, market or economic developments, yields and share price fluctuations due to changes in interest rates. When interest rates go up, bond prices generally drop, and vice versa.
Investments in high yield or "junk" bonds offer the potential for higher income than investments in investment-grade bonds, but they also have a higher degree of risk. Changes in economic conditions or other circumstances may adversely affect a high-yield bond issuer's ability to make timely principal and interest payments.
14
Performance data quoted represents past performance and current performance may be lower or higher. Past performance is no guarantee of future results. The investment return and principal value will fluctuate so that shares, when redeemed, may be worth more or less than the original cost. Please visit www.columbiamanagement.com for daily and most recent month-end performance updates.
Average annual total return as of July 31, 2008 (%)
| Inception | 1-year | 5-year | 10-year | ||||||||||||||||
| CMG High Yield Fund | 07/06/94 | 2.81 | 5.09 | 5.10 | |||||||||||||||
| JPMorgan Developed BB High Yield Index | 3.79 | 6.36 | 6.67 | ||||||||||||||||
Average annual total return as of June 30, 2008 (%)
| Inception | 1-year | 5-year | 10-year | ||||||||||||||||
| CMG High Yield Fund | 07/06/94 | 0.48 | 4.79 | 5.26 | |||||||||||||||
| JPMorgan Developed BB High Yield Index | 1.70 | 6.05 | 6.77 | ||||||||||||||||
Performance results reflect any fee waivers or reimbursements of fund expenses by the investment advisor and/or any of its affiliates. Absent these fee waivers or expense reimbursement arrangements, performance results would have been lower. All results shown assume reinvestment of distributions and do not reflect the deduction of taxes that a shareholder may pay on fund distributions or on the redemption of fund shares.
The fund's annual operating expense ratios, with and without contractual waivers, as stated in the fund's prospectus that is current as of the date of this report, are 0.40% and 0.49%, respectively, of average annual net assets. Differences in expense ratios disclosed elsewhere in this report may result from including fee waivers and expense reimbursements as well as different time periods used in calculating the ratios. The contractual waiver expires 03/01/2009.
Growth of a $3,000,000 investment, August 1, 1998 to July 31, 2008
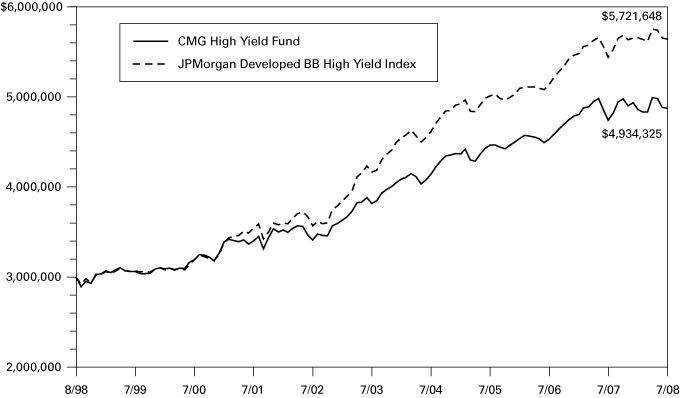
The chart above shows the growth in value of a hypothetical minimum initial $3,000,000 investment in the fund compared to the index during the stated time period and does not reflect the deduction of taxes that a shareholder may pay on fund distributions or on the redemption of fund shares.
The JPMorgan Developed BB High Yield Index is designed to mirror the investable universe of the U.S. dollar developed, BB-rated, high yield corporate debt market. Indices are not investments, do not incur fees or expenses and are not professionally managed. It is not possible to invest directly in an index. Securities in the fund may not match those in an index.
15
UNDERSTANDING YOUR EXPENSES – CMG High Yield Fund
As a fund shareholder, you incur two types of costs. There are transaction costs and also ongoing costs, which generally include investment advisory fees and other fund expenses. The information on this page is intended to help you understand the ongoing costs of investing in the fund and to compare these costs with the ongoing costs of investing in other mutual funds.
Analyzing your fund's expenses
To illustrate these ongoing costs, we have provided an example and calculated the expenses paid by investors during the reporting period. The information in the following table is based on an initial investment of $1,000, which is invested at the beginning of the reporting period and held for the entire period. Expense information is calculated two ways and each method provides you with different information. The amount listed in the "actual" column is calculated using the fund's actual operating expenses and total return for the period. The amount listed in the "hypothetical" column assumes that the return each year is 5% before expenses and is calculated based on the fund's actual operating expenses. You should not use the hypothetical account values and expenses to estimate either your actual account balance at the end of the period or the expenses you paid during this reporting period.
Estimating your actual expenses
To estimate the expenses that you paid over the period, first you will need your account balance at the end of the period:
1. Divide your ending account balance by $1,000. For example, if an account balance was $8,600 at the end of the period, the result would be 8.6.
2. In the section of the table below titled "Expenses paid during the period," locate the amount under "actual." Multiply this number by the result from step 1. Your answer is an estimate of the expenses you paid on your account during the period.
February 1, 2008 – July 31, 2008
| Account value at the beginning of the period ($) | Account value at the end of the period ($) | Expenses paid during the period ($) | Fund's annualized expense ratio (%) | ||||||||||||||||||||||||
| Actual | Hypothetical | Actual | Hypothetical | Actual | Hypothetical | Actual | |||||||||||||||||||||
| 1,000.00 | 1,000.00 | 1,002.39 | 1,022.87 | 1.99 | 2.01 | 0.40 | |||||||||||||||||||||
Expenses paid during the period are equal to the annualized expense ratio of 0.40%, multiplied by the average account value over the period, then multiplied by the number of days in the fund's most recent fiscal half-year and divided by 366.
Had the investment advisor and/or any of its affiliates not waived fees or reimbursed a portion of expenses, account value at end of the period would have been reduced.
It is important to note that the expense amounts shown in the table are meant to highlight only ongoing costs of investing in the fund. Therefore, the hypothetical examples provided may not help you determine the relative total costs of owning shares of different funds.
Compare with other funds
Since all mutual funds are required to include the same hypothetical calculations about expenses in shareholder reports, you can use this information to compare the ongoing costs of investing in the fund with other funds. To do so, compare the 5% hypothetical example with the 5% hypothetical examples that appear in the shareholder reports of other funds. As you compare hypothetical examples of other funds, it is important to note that hypothetical examples are meant to highlight the ongoing costs of investing in a fund.
16
CMG CORE BOND FUND
A Portfolio of Columbia Funds Institutional Trust
FINANCIAL HIGHLIGHTS
(For a Share Outstanding Throughout Each Period)
| Year Ended July 31, | |||||||||||||||||||||||
| 2008 | 2007 | 2006 | 2005 | 2004 | |||||||||||||||||||
| Net asset value, beginning of period | $ | 10.03 | $ | 10.05 | $ | 10.42 | $ | 10.36 | $ | 10.38 | |||||||||||||
| Income from investment operations: | |||||||||||||||||||||||
| Net investment income (a) | 0.51 | 0.52 | 0.48 | 0.42 | 0.37 | ||||||||||||||||||
| Net realized and unrealized gain (loss) on investments and futures contracts | (0.12 | ) | (0.02 | ) | (0.33 | ) | 0.09 | 0.11 | |||||||||||||||
| Total from investment operations | 0.39 | 0.50 | 0.15 | 0.51 | 0.48 | ||||||||||||||||||
| Less distributions to shareholders: | |||||||||||||||||||||||
| From net investment income | (0.54 | ) | (0.52 | ) | (0.51 | ) | (0.45 | ) | (0.41 | ) | |||||||||||||
| From net realized gains | - | - | (0.01 | ) | - | (0.09 | ) | ||||||||||||||||
| Total distributions | (0.54 | ) | (0.52 | ) | (0.52 | ) | (0.45 | ) | (0.50 | ) | |||||||||||||
| Net asset value, end of period | $ | 9.88 | $ | 10.03 | $ | 10.05 | $ | 10.42 | $ | 10.36 | |||||||||||||
| Total return (b)(c) | 3.84 | % | 5.06 | % | 1.46 | % | 4.98 | % | 4.67 | % | |||||||||||||
| Ratios to Average Net Assets/Supplemental Data: | |||||||||||||||||||||||
| Net expenses before interest expense | 0.25 | % | 0.25 | % | 0.25 | %(d) | 0.25 | %(d) | 0.35 | %(d) | |||||||||||||
| Interest expense | - | %(e) | - | - | - | - | |||||||||||||||||
| Net expenses | 0.25 | % | 0.25 | % | 0.25 | % | 0.25 | % | 0.25 | % | |||||||||||||
| Waiver/Reimbursement | 0.08 | % | 0.13 | % | 0.10 | % | 0.06 | % | 0.25 | % | |||||||||||||
| Net investment income | 5.07 | % | 5.07 | % | 4.65 | %(d) | 4.01 | %(d) | 3.54 | %(d) | |||||||||||||
| Portfolio turnover rate | 272 | % | 95 | % | 109 | % | 130 | % | 231 | % | |||||||||||||
| Net assets, end of period (000's) | $ | 88,124 | $ | 67,673 | $ | 56,181 | $ | 79,102 | $ | 32,810 | |||||||||||||
(a) Per share data was calculated using the average shares outstanding during the period.
(b) Total return at net asset value assuming all distributions reinvested.
(c) Had the investment advisor and/or any of its affiliates not waived fees or reimbursed a portion of expenses, total return would have been reduced.
(d) The benefits derived from custody credits had an impact of less than 0.01%.
(e) Rounds to less than 0.01%.
See Accompanying Notes to Financial Statements.
17
CMG SHORT TERM BOND FUND
A Portfolio of Columbia Funds Institutional Trust
FINANCIAL HIGHLIGHTS
(For a Share Outstanding Throughout Each Period)
| Year Ended July 31, | |||||||||||||||||||||||
| 2008 | 2007 | 2006 | 2005 | 2004 | |||||||||||||||||||
| Net asset value, beginning of period | $ | 11.58 | $ | 11.59 | $ | 11.79 | $ | 11.95 | $ | 12.01 | |||||||||||||
| Income from investment operations: | |||||||||||||||||||||||
| Net investment income (a) | 0.57 | 0.57 | 0.50 | 0.40 | 0.35 | ||||||||||||||||||
| Net realized and unrealized gain (loss) on investments, foreign currency and futures contracts | (0.05 | ) | 0.03 | (0.14 | ) | (0.11 | ) | (0.03 | ) | ||||||||||||||
| Total from investment operations | 0.52 | 0.60 | 0.36 | 0.29 | 0.32 | ||||||||||||||||||
| Less distributions to shareholders: | |||||||||||||||||||||||
| From net investment income | (0.60 | ) | (0.61 | ) | (0.56 | ) | (0.45 | ) | (0.38 | ) | |||||||||||||
| Net asset value, end of period | $ | 11.50 | $ | 11.58 | $ | 11.59 | $ | 11.79 | $ | 11.95 | |||||||||||||
| Total return (b)(c) | 4.60 | % | 5.25 | % | 3.15 | % | 2.47 | % | 2.72 | % | |||||||||||||
| Ratios to Average Net Assets/Supplemental Data: | |||||||||||||||||||||||
| Net expenses | 0.25 | % | 0.25 | % | 0.25 | %(d) | 0.25 | %(d) | 0.25 | %(d) | |||||||||||||
| Waiver/Reimbursement | 0.05 | % | 0.07 | % | 0.08 | % | 0.04 | % | 0.10 | % | |||||||||||||
| Net investment income | 4.87 | % | 4.87 | % | 4.31 | %(d) | 3.38 | %(d) | 2.91 | %(d) | |||||||||||||
| Portfolio turnover rate | 46 | % | 67 | % | 128 | % | 51 | % | 79 | % | |||||||||||||
| Net assets, end of period (000's) | $ | 205,543 | $ | 138,432 | $ | 83,984 | $ | 95,842 | $ | 119,125 | |||||||||||||
(a) Per share data was calculated using the average shares outstanding during the period.
(b) Total return at net asset value assuming all distributions reinvested.
(c) Had the investment advisor and/or any of its affiliates not waived fees or reimbursed a portion of expenses, total return would have been reduced.
(d) The benefits derived from custody credits had an impact of less than 0.01%.
See Accompanying Notes to Financial Statements.
18
CMG ULTRA SHORT TERM BOND FUND
A Portfolio of Columbia Funds Institutional Trust
FINANCIAL HIGHLIGHTS
(For a Share Outstanding Throughout Each Period)
| Year Ended July 31, | Period Ended July 31, | ||||||||||||||||||||||
| 2008 | 2007 | 2006 | 2005 | 2004 (a) | |||||||||||||||||||
| Net asset value, beginning of period | $ | 9.59 | $ | 9.62 | $ | 9.67 | $ | 9.88 | $ | 10.00 | |||||||||||||
| Income from investment operations: | |||||||||||||||||||||||
| Net investment income (b) | 0.43 | 0.47 | 0.38 | 0.24 | 0.07 | ||||||||||||||||||
| Net realized and unrealized loss on investments | (0.30 | ) | (0.03 | ) | (0.02 | ) | (0.06 | ) | (0.08 | ) | |||||||||||||
| Total from investment operations | 0.13 | 0.44 | 0.36 | 0.18 | (0.01 | ) | |||||||||||||||||
| Less distributions to shareholders: | |||||||||||||||||||||||
| From net investment income | (0.43 | ) | (0.47 | ) | (0.41 | ) | (0.36 | ) | (0.11 | ) | |||||||||||||
| Return of capital | - | - | - | (c) | (0.03 | ) | - | ||||||||||||||||
| Total distributions to shareholders | (0.43 | ) | (0.47 | ) | (0.41 | ) | (0.39 | ) | (0.11 | ) | |||||||||||||
| Net asset value, end of period | $ | 9.29 | $ | 9.59 | $ | 9.62 | $ | 9.67 | $ | 9.88 | |||||||||||||
| Total return (d)(e) | 1.42 | % | 4.62 | %(f) | 3.84 | % | 1.83 | % | (0.08 | )%(g) | |||||||||||||
| Ratios to Average Net Assets/Supplemental Data: | |||||||||||||||||||||||
| Net expenses | 0.25 | % | 0.25 | % | 0.25 | %(h) | 0.25 | %(h) | 0.25 | %(h)(i) | |||||||||||||
| Waiver/Reimbursement | 0.07 | % | 0.06 | % | 0.07 | % | 0.05 | % | 0.22 | %(i) | |||||||||||||
| Net investment income | 4.58 | % | 4.88 | % | 3.93 | %(h) | 2.44 | %(h) | 1.69 | %(h)(i) | |||||||||||||
| Portfolio turnover rate | 69 | % | 108 | % | 48 | % | 75 | % | 12 | %(g) | |||||||||||||
| Net assets, end of period (000's) | $ | 96,595 | $ | 152,793 | $ | 89,863 | $ | 81,575 | $ | 67,235 | |||||||||||||
(a) The Fund commenced investment operations on March 8, 2004. Per share data, total return and portfolio turnover reflect activity from that date.
(b) Per share data was calculated using the average shares outstanding during the period.
(c) Rounds to less than $0.01 per share.
(d) Total return at net asset value assuming all distributions reinvested.
(e) Had the investment advisor and/or any of its affiliates not waived fees or reimbursed a portion of expenses, total return would have been reduced.
(f) Total return includes a voluntary reimbursement by the invesment advisor for a realized investment loss due to a trading error. This reimbursement had an impact of less than 0.01% on the Fund's total return.
(g) Not annualized.
(h) The benefits derived from custody credits had an impact of less than 0.01%.
(i) Annualized.
See Accompanying Notes to Financial Statements.
19
CMG HIGH YIELD FUND
A Portfolio of Columbia Funds Institutional Trust
FINANCIAL HIGHLIGHTS
(For a Share Outstanding Throughout Each Period)
| Year Ended July 31, | |||||||||||||||||||||||
| 2008 | 2007 | 2006 | 2005 | 2004 | |||||||||||||||||||
| Net asset value, beginning of period | $ | 7.48 | $ | 7.66 | $ | 8.08 | $ | 8.00 | $ | 7.90 | |||||||||||||
| Income from investment operations: | |||||||||||||||||||||||
| Net investment income (a) | 0.52 | 0.53 | 0.50 | 0.51 | 0.53 | ||||||||||||||||||
| Net realized and unrealized gain (loss) on investments and foreign currency | (0.31 | ) | (0.16 | ) | (0.38 | ) | 0.11 | 0.14 | |||||||||||||||
| Total from investment operations | 0.21 | 0.37 | 0.12 | 0.62 | 0.67 | ||||||||||||||||||
| Less distributions to shareholders: | |||||||||||||||||||||||
| From net investment income | (0.53 | ) | (0.55 | ) | (0.54 | ) | (0.54 | ) | (0.57 | ) | |||||||||||||
| Net asset value, end of period | $ | 7.16 | $ | 7.48 | $ | 7.66 | $ | 8.08 | $ | 8.00 | |||||||||||||
| Total return (b)(c) | 2.81 | % | 4.76 | % | 1.47 | % | 7.98 | % | 8.60 | % | |||||||||||||
| Ratios to Average Net Assets/Supplemental Data: | |||||||||||||||||||||||
| Net expenses before interest expense | 0.40 | % | 0.40 | % | 0.40 | %(d) | 0.40 | %(d) | 0.40 | %(d) | |||||||||||||
| Interest expense | - | %(e) | - | - | - | - | |||||||||||||||||
| Net expenses | 0.40 | % | 0.40 | % | 0.40 | %(d) | 0.40 | %(d) | 0.40 | %(d) | |||||||||||||
| Waiver/Reimbursement | 0.14 | % | 0.09 | % | 0.04 | % | 0.02 | % | 0.02 | % | |||||||||||||
| Net investment income | 7.01 | % | 6.70 | % | 6.38 | %(d) | 6.26 | %(d) | 6.64 | %(d) | |||||||||||||
| Portfolio turnover rate | 37 | % | 57 | % | 30 | % | 39 | % | 47 | % | |||||||||||||
| Net assets, end of period (000's) | $ | 45,697 | $ | 62,173 | $ | 96,120 | $ | 269,243 | $ | 382,157 | |||||||||||||
(a) Per share data was calculated using the average shares outstanding during the period.
(b) Total return at net asset value assuming all distributions reinvested.
(c) Had the investment advisor and/or any of its affiliates not waived fees or reimbursed a portion of expenses, total return would have been reduced.
(d) The benefits derived from custody credits had an impact of less than 0.01%.
(e) Rounds to less than 0.01%.
See Accompanying Notes to Financial Statements.
20
CMG CORE BOND FUND
A Portfolio of Columbia Funds Institutional Trust
SCHEDULE OF INVESTMENTS
July 31, 2008
| Par | Value | ||||||||||
| Mortgage-Backed Securities (39.0%) | |||||||||||
| Federal Home Loan Mortgage Corp. | |||||||||||
| 4.000% 11/01/20 | $ | 207,407 | $ | 193,431 | |||||||
| 4.913% 04/01/38 (a) | 843,397 | 830,944 | |||||||||
| 5.000% 11/01/21 | 1,343 | 1,325 | |||||||||
| 5.000% 12/01/36 | 1,204,661 | 1,145,947 | |||||||||
| Federal National Mortgage Association | |||||||||||
| 4.856% 04/01/38 (a) | 574,672 | 565,880 | |||||||||
| 4.899% 04/01/38 (a) | 569,407 | 560,981 | |||||||||
| 4.924% 04/01/38 (a) | 661,254 | 661,233 | |||||||||
| 5.000% 05/01/37 | 1,106,480 | 1,051,624 | |||||||||
| 5.000% 03/01/38 (b) | 1,354,868 | 1,287,562 | |||||||||
| 5.000% 04/01/38 | 2,809,997 | 2,670,685 | |||||||||
| 5.000% 06/01/38 | 4,919,616 | 4,675,224 | |||||||||
| 5.500% 04/01/36 | 142,127 | 139,350 | |||||||||
| 5.500% 09/01/37 | 1,663,326 | 1,629,428 | |||||||||
| 5.500% 06/01/38 | 1,187,383 | 1,163,066 | |||||||||
| 5.500% 07/01/38 | 8,892,645 | 8,710,532 | |||||||||
| 6.000% 05/01/38 | 4,650,615 | 4,676,629 | |||||||||
| 6.000% 06/01/38 | 1,043,990 | 1,049,830 | |||||||||
| 6.500% 01/01/38 | 3,207,916 | 3,297,791 | |||||||||
| 7.000% 07/01/32 | 10,895 | 11,485 | |||||||||
| Government National Mortgage Association | |||||||||||
| 7.000% 01/15/32 | 5,992 | 6,392 | |||||||||
| 7.000% 03/15/32 | 16,267 | 17,353 | |||||||||
| 7.000% 06/15/32 | 3,405 | 3,632 | |||||||||
| Total Mortgage-Backed Securities (Cost of $34,635,652) | 34,350,324 | ||||||||||
| Corporate Fixed-Income Bonds & Notes (21.8%) | |||||||||||
| Basic Materials (0.7%) | |||||||||||
| Chemicals (0.4%) | |||||||||||
| Dow Chemical Co. | |||||||||||
| 5.700% 05/15/18 | 375,000 | 354,006 | |||||||||
| Iron/Steel (0.3%) | |||||||||||
| Nucor Corp. | |||||||||||
| 5.000% 06/01/13 | 195,000 | 196,065 | |||||||||
| 5.850% 06/01/18 (c) | 105,000 | 105,301 | |||||||||
| 301,366 | |||||||||||
| 655,372 | |||||||||||
| Communications (3.1%) | |||||||||||
| Media (1.6%) | |||||||||||
| Comcast Corp. | |||||||||||
| 5.700% 05/15/18 | 40,000 | 37,953 | |||||||||
| 7.050% 03/15/33 | 350,000 | 347,699 | |||||||||
| News America, Inc. | |||||||||||
| 6.550% 03/15/33 | 275,000 | 260,853 | |||||||||
See Accompanying Notes to Financial Statements.
21
CMG CORE BOND FUND
A Portfolio of Columbia Funds Institutional Trust
SCHEDULE OF INVESTMENTS
| Par | Value | ||||||||||
| Corporate Fixed-Income Bonds & Notes (continued) | |||||||||||
| Media (continued) | |||||||||||
| Time Warner Cable, Inc. | |||||||||||
| 6.200% 07/01/13 | $ | 500,000 | $ | 510,685 | |||||||
| Time Warner, Inc. | |||||||||||
| 6.875% 05/01/12 | 165,000 | 168,518 | |||||||||
| Viacom, Inc. | |||||||||||
| 6.125% 10/05/17 | 100,000 | 94,264 | |||||||||
| 1,419,972 | |||||||||||
| Telecommunication Services (1.5%) | |||||||||||
| AT&T, Inc. | |||||||||||
| 5.100% 09/15/14 | 325,000 | 318,623 | |||||||||
| British Telecommunications PLC | |||||||||||
| 5.150% 01/15/13 | 280,000 | 273,879 | |||||||||
| Deutsche Telekom International Finance BV | |||||||||||
| 8.500% 06/15/10 | 205,000 | 216,449 | |||||||||
| New Cingular Wireless Services, Inc. | |||||||||||
| 8.750% 03/01/31 | 250,000 | 291,149 | |||||||||
| Telefonica Emisones SAU | |||||||||||
| 5.984% 06/20/11 | 225,000 | 227,706 | |||||||||
| 1,327,806 | |||||||||||
| 2,747,778 | |||||||||||
| Consumer Cyclical (1.2%) | |||||||||||
| Retail (1.2%) | |||||||||||
| Best Buy Co., Inc. | |||||||||||
| 6.750% 07/15/13 (d) | 240,000 | 243,796 | |||||||||
| CVS Caremark Corp. | |||||||||||
| 5.750% 06/01/17 | 250,000 | 244,406 | |||||||||
| Wal-Mart Stores, Inc. | |||||||||||
| 4.125% 07/01/10 | 525,000 | 532,438 | |||||||||
| 1,020,640 | |||||||||||
| Consumer Non-Cyclical (1.5%) | |||||||||||
| Beverages (0.1%) | |||||||||||
| Anheuser-Busch Companies, Inc. | |||||||||||
| 5.950% 01/15/33 | 12,000 | 10,372 | |||||||||
| Coca-Cola Co. | |||||||||||
| 5.750% 03/15/11 | 4,000 | 4,196 | |||||||||
| Diageo Capital PLC | |||||||||||
| 4.375% 05/03/10 | 75,000 | 75,120 | |||||||||
| 89,688 | |||||||||||
| Food (0.9%) | |||||||||||
| ConAgra Foods, Inc. | |||||||||||
| 6.750% 09/15/11 | 150,000 | 155,188 | |||||||||
| 7.875% 09/15/10 | 185,000 | 195,507 | |||||||||
| Kraft Foods, Inc. | |||||||||||
| 6.500% 08/11/17 | 240,000 | 241,132 | |||||||||
| Kroger Co. | |||||||||||
| 6.200% 06/15/12 | 185,000 | 190,539 | |||||||||
| 782,366 | |||||||||||
See Accompanying Notes to Financial Statements.
22
CMG CORE BOND FUND
A Portfolio of Columbia Funds Institutional Trust
SCHEDULE OF INVESTMENTS
| Par | Value | ||||||||||
| Corporate Fixed-Income Bonds & Notes (continued) | |||||||||||
| Healthcare Products (0.0%) | |||||||||||
| Johnson & Johnson | |||||||||||
| 6.625% 09/01/09 | $ | 7,000 | $ | 7,218 | |||||||
| Household Products/Wares (0.2%) | |||||||||||
| Fortune Brands, Inc. | |||||||||||
| 5.375% 01/15/16 | 225,000 | 207,558 | |||||||||
| Kimberly-Clark Corp. | |||||||||||
| 5.625% 02/15/12 | 7,000 | 7,299 | |||||||||
| 214,857 | |||||||||||
| Pharmaceuticals (0.3%) | |||||||||||
| Wyeth | |||||||||||
| 5.500% 02/01/14 | 250,000 | 252,941 | |||||||||
| 1,347,070 | |||||||||||
| Energy (1.8%) | |||||||||||
| Oil & Gas (0.8%) | |||||||||||
| Nexen, Inc. | |||||||||||
| 5.875% 03/10/35 | 250,000 | 219,065 | |||||||||
| Talisman Energy, Inc. | |||||||||||
| 6.250% 02/01/38 | 290,000 | 255,974 | |||||||||
| Valero Energy Corp. | |||||||||||
| 6.875% 04/15/12 | 200,000 | 206,450 | |||||||||
| 681,489 | |||||||||||
| Oil & Gas Services (0.4%) | |||||||||||
| Weatherford International Ltd. | |||||||||||
| 5.150% 03/15/13 | 295,000 | 292,365 | |||||||||
| 7.000% 03/15/38 | 65,000 | 65,156 | |||||||||
| 357,521 | |||||||||||
| Pipelines (0.6%) | |||||||||||
| Energy Transfer Partners LP | |||||||||||
| 6.000% 07/01/13 | 215,000 | 217,073 | |||||||||
| 6.625% 10/15/36 (c) | 200,000 | 184,151 | |||||||||
| TransCanada Pipelines Ltd. | |||||||||||
| 6.350% 05/15/67 (a) | 190,000 | 160,560 | |||||||||
| 561,784 | |||||||||||
| 1,600,794 | |||||||||||
| Financials (9.3%) | |||||||||||
| Banks (2.6%) | |||||||||||
| ANZ National International Ltd. | |||||||||||
| 6.200% 07/19/13 (d) | 150,000 | 150,039 | |||||||||
| Bank One Corp. | |||||||||||
| 6.000% 08/01/08 | 27,000 | 27,000 | |||||||||
| Barclays Bank PLC | |||||||||||
| 7.400% 12/15/09 | 3,000 | 3,099 | |||||||||
| Citigroup, Inc. | |||||||||||
| 5.000% 09/15/14 | 460,000 | 417,222 | |||||||||
See Accompanying Notes to Financial Statements.
23
CMG CORE BOND FUND
A Portfolio of Columbia Funds Institutional Trust
SCHEDULE OF INVESTMENTS
| Par | Value | ||||||||||
| Corporate Fixed-Income Bonds & Notes (continued) | |||||||||||
| Banks (continued) | |||||||||||
| Credit Suisse/NY | |||||||||||
| 6.000% 02/15/18 | $ | 155,000 | $ | 148,410 | |||||||
| Deutsche Bank AG | |||||||||||
| 4.875% 05/20/13 | 520,000 | 510,365 | |||||||||
| JPMorgan Chase & Co. | |||||||||||
| 6.000% 01/15/18 | 280,000 | 271,666 | |||||||||
| National City Bank | |||||||||||
| 4.625% 05/01/13 (c) | 18,000 | 12,686 | |||||||||
| SunTrust Banks, Inc. | |||||||||||
| 6.375% 04/01/11 | 3,000 | 3,007 | |||||||||
| SunTrust Preferred Capital I | |||||||||||
| 5.853% 12/15/11 (a) | 240,000 | 160,200 | |||||||||
| USB Capital IX | |||||||||||
| 6.189% 04/15/49 (a) | 375,000 | 262,500 | |||||||||
| Wachovia Capital Trust III | |||||||||||
| 5.800% 03/15/42 (a) | 440,000 | 248,600 | |||||||||
| Wachovia Corp. | |||||||||||
| 5.500% 05/01/13 | 120,000 | 110,795 | |||||||||
| 2,325,589 | |||||||||||
| Diversified Financial Services (4.5%) | |||||||||||
| AGFC Capital Trust I | |||||||||||
| 6.000% 01/15/67 (a)(d) | 185,000 | 145,401 | |||||||||
| American Express Centurion Bank | |||||||||||
| 5.200% 11/26/10 (c) | 250,000 | 249,627 | |||||||||
| American Express Credit Corp. | |||||||||||
| 5.875% 05/02/13 | 125,000 | 122,732 | |||||||||
| Associates Corp. of North America | |||||||||||
| 6.950% 11/01/18 | 11,000 | 11,097 | |||||||||
| Capital One Financial Corp. | |||||||||||
| 5.500% 06/01/15 | 400,000 | 349,707 | |||||||||
| Citigroup, Inc. | |||||||||||
| 6.125% 05/15/18 | 150,000 | 143,567 | |||||||||
| Credit Suisse First Boston USA, Inc. | |||||||||||
| 4.875% 08/15/10 | 500,000 | 503,119 | |||||||||
| Goldman Sachs Group, Inc. | |||||||||||
| 6.150% 04/01/18 | 75,000 | 72,248 | |||||||||
| 6.250% 09/01/17 | 540,000 | 527,296 | |||||||||
| HSBC Finance Corp. | |||||||||||
| 5.000% 06/30/15 | 475,000 | 450,839 | |||||||||
| Lehman Brothers Holdings, Inc. | |||||||||||
| 5.625% 01/24/13 (f) | 150,000 | 140,231 | |||||||||
| 5.750% 07/18/11 (c)(f) | 325,000 | 311,609 | |||||||||
| 6.875% 05/02/18 (c)(f) | 30,000 | 28,164 | |||||||||
| Merrill Lynch & Co., Inc. | |||||||||||
| 6.050% 08/15/12 | 475,000 | 452,656 | |||||||||
| 7.750% 05/14/38 | 170,000 | 154,234 | |||||||||
See Accompanying Notes to Financial Statements.
24
CMG CORE BOND FUND
A Portfolio of Columbia Funds Institutional Trust
SCHEDULE OF INVESTMENTS
| Par | Value | ||||||||||
| Corporate Fixed-Income Bonds & Notes (continued) | |||||||||||
| Diversified Financial Services (continued) | |||||||||||
| Morgan Stanley | |||||||||||
| 5.750% 10/18/16 | $ | 350,000 | $ | 313,975 | |||||||
| 3,976,502 | |||||||||||
| Insurance (1.2%) | |||||||||||
| John Hancock Financial Services, Inc. | |||||||||||
| 5.625% 12/01/08 | 15,000 | 15,107 | |||||||||
| Metlife, Inc. | |||||||||||
| 5.375% 12/15/12 (c) | 20,000 | 19,726 | |||||||||
| Metropolitan Life Global Funding I | |||||||||||
| 5.125% 04/10/13 (d) | 360,000 | 354,970 | |||||||||
| New York Life Global Funding | |||||||||||
| 4.650% 05/09/13 (d) | 345,000 | 341,937 | |||||||||
| Principal Life Income Funding Trusts | |||||||||||
| 5.300% 04/24/13 | 80,000 | 79,869 | |||||||||
| UnitedHealth Group, Inc. | |||||||||||
| 5.250% 03/15/11 | 250,000 | 247,433 | |||||||||
| 1,059,042 | |||||||||||
| Real Estate Investment Trusts (REITs) (0.6%) | |||||||||||
| Health Care Property Investors, Inc. | |||||||||||
| 6.450% 06/25/12 (c) | 150,000 | 142,625 | |||||||||
| Simon Property Group LP | |||||||||||
| 5.750% 12/01/15 | 400,000 | 389,860 | |||||||||
| 532,485 | |||||||||||
| Savings & Loans (0.4%) | |||||||||||
| Washington Mutual, Inc. | |||||||||||
| 4.200% 01/15/10 | 400,000 | 308,000 | |||||||||
| 8,201,618 | |||||||||||
| Industrials (1.3%) | |||||||||||
| Aerospace & Defense (0.0%) | |||||||||||
| Boeing Co. | |||||||||||
| 5.125% 02/15/13 | 1,000 | 1,014 | |||||||||
| Machinery (0.7%) | |||||||||||
| Caterpillar Financial Services Corp. | |||||||||||
| 4.300% 06/01/10 | 400,000 | 403,278 | |||||||||
| 5.450% 04/15/18 | 200,000 | 196,882 | |||||||||
| 600,160 | |||||||||||
| Transportation (0.6%) | |||||||||||
| Burlington Northern Santa Fe Corp. | |||||||||||
| 6.200% 08/15/36 | 200,000 | 185,526 | |||||||||
| Union Pacific Corp. | |||||||||||
| 3.875% 02/15/09 | 310,000 | 309,594 | |||||||||
| 495,120 | |||||||||||
| 1,096,294 | |||||||||||
See Accompanying Notes to Financial Statements.
25
CMG CORE BOND FUND
A Portfolio of Columbia Funds Institutional Trust
SCHEDULE OF INVESTMENTS
| Par | Value | ||||||||||
| Corporate Fixed-Income Bonds & Notes (continued) | |||||||||||
| Technology (0.5%) | |||||||||||
| Software (0.5%) | |||||||||||
| Oracle Corp. | |||||||||||
| 4.950% 04/15/13 | $ | 460,000 | $ | 464,566 | |||||||
| Utilities (2.4%) | |||||||||||
| Electric (1.9%) | |||||||||||
| Commonwealth Edison Co. | |||||||||||
| 5.950% 08/15/16 | 200,000 | 198,350 | |||||||||
| 6.150% 09/15/17 | 360,000 | 359,202 | |||||||||
| Indiana Michigan Power Co. | |||||||||||
| 5.650% 12/01/15 | 205,000 | 196,899 | |||||||||
| Pacific Gas & Electric Co. | |||||||||||
| 5.800% 03/01/37 | 340,000 | 309,416 | |||||||||
| Progress Energy, Inc. | |||||||||||
| 7.750% 03/01/31 | 200,000 | 221,601 | |||||||||
| Public Service Electric & Gas Co. | |||||||||||
| 4.000% 11/01/08 | 5,000 | 5,001 | |||||||||
| Southern California Edison Co. | |||||||||||
| 5.000% 01/15/14 | 350,000 | 347,999 | |||||||||
| 1,638,468 | |||||||||||
| Gas (0.5%) | |||||||||||
| Atmos Energy Corp. | |||||||||||
| 6.350% 06/15/17 | 175,000 | 171,726 | |||||||||
| Sempra Energy | |||||||||||
| 4.750% 05/15/09 | 300,000 | 301,140 | |||||||||
| 472,866 | |||||||||||
| 2,111,334 | |||||||||||
| Total Corporate Fixed-Income Bonds & Notes (Cost of $19,980,230) | 19,245,466 | ||||||||||
| Government & Agency Obligations (13.9%) | |||||||||||
| Foreign Government Obligations (1.5%) | |||||||||||
| European Investment Bank | |||||||||||
| 4.250% 07/15/13 | 180,000 | 182,457 | |||||||||
| 5.125% 05/30/17 | 295,000 | 307,604 | |||||||||
| Kreditanstalt fuer Wiederaufbau | |||||||||||
| 4.500% 07/16/18 | 425,000 | 421,929 | |||||||||
| Province of Quebec | |||||||||||
| 4.625% 05/14/18 (c) | 435,000 | 426,726 | |||||||||
| 1,338,716 | |||||||||||
| U.S. Government Agency (1.1%) | |||||||||||
| Federal Home Loan Mortgage Corp. | |||||||||||
| 4.500% 06/12/13 | 965,000 | 970,399 | |||||||||
See Accompanying Notes to Financial Statements.
26
CMG CORE BOND FUND
A Portfolio of Columbia Funds Institutional Trust
SCHEDULE OF INVESTMENTS
| Par | Value | ||||||||||
| Government & Agency Obligations (continued) | |||||||||||
| U.S. Government Obligations (11.3%) | |||||||||||
| U.S. Treasury Bonds | |||||||||||
| 5.000% 05/15/37 (c) | $ | 1,905,000 | $ | 2,023,914 | |||||||
| U.S. Treasury Inflation Indexed Notes | |||||||||||
| 3.000% 07/15/12 (c) | 174,657 | 188,493 | |||||||||
| U.S. Treasury Notes | |||||||||||
| 2.750% 07/31/10 | 325,000 | 326,447 | |||||||||
| 3.375% 06/30/13 (c) | 3,215,000 | 3,230,573 | |||||||||
| 3.875% 05/15/18 (c) | 3,645,000 | 3,613,675 | |||||||||
| 4.375% 12/15/10 (c) | 505,000 | 525,161 | |||||||||
| 9,908,263 | |||||||||||
| Total Government & Agency Obligations (Cost of $12,165,613) | 12,217,378 | ||||||||||
| Commercial Mortgage-Backed Securities (9.3%) | |||||||||||
| Bear Stearns Commercial Mortgage Securities | |||||||||||
| 4.680% 08/13/39 (a) | 30,000 | 28,467 | |||||||||
| 4.740% 03/13/40 | 445,000 | 429,297 | |||||||||
| 4.933% 02/13/42 (a) | 335,000 | 312,632 | |||||||||
| Citigroup/Deutsche Bank Commercial Mortgage Trust | |||||||||||
| 5.322% 12/11/49 | 750,000 | 678,259 | |||||||||
| Commercial Mortgage Pass Through Certificates | |||||||||||
| 5.306% 12/10/46 | 460,000 | 423,932 | |||||||||
| Credit Suisse Mortgage Capital Certificates | |||||||||||
| 5.827% 06/15/38 (a) | 560,000 | 539,233 | |||||||||
| CW Capital Cobalt Ltd. | |||||||||||
| 5.820% 05/15/46 (a) | 460,000 | 429,728 | |||||||||
| JPMorgan Chase Commercial Mortgage Securities Corp. | |||||||||||
| 5.440% 06/12/47 | 495,000 | 450,274 | |||||||||
| 5.447% 06/12/47 | 539,000 | 491,640 | |||||||||
| 5.814% 06/12/43 (a) | 560,000 | 536,374 | |||||||||
| 5.819% 06/15/49 (a) | 450,000 | 420,631 | |||||||||
| LB-UBS Commercial Mortgage Trust | |||||||||||
| 4.853% 09/15/31 | 450,000 | 435,054 | |||||||||
| 5.103% 11/15/30 | 600,000 | 597,657 | |||||||||
| 6.462% 03/15/31 | 405,000 | 416,995 | |||||||||
| Morgan Stanley Capital I | |||||||||||
| 5.208% 11/14/42 (a) | 205,000 | 196,648 | |||||||||
| 5.283% 11/12/41 | 460,000 | 453,432 | |||||||||
| 5.328% 11/12/41 | 350,000 | 323,872 | |||||||||
| Morgan Stanley Dean Witter Capital I | |||||||||||
| 4.920% 03/12/35 | 390,000 | 376,408 | |||||||||
| Wachovia Bank Commercial Mortgage Trust | |||||||||||
| 5.678% 05/15/46 | 705,000 | 649,158 | |||||||||
| Total Commercial Mortgage-Backed Securities (Cost of $8,426,797) | 8,189,691 | ||||||||||
| Asset-Backed Securities (8.7%) | |||||||||||
| ABFS Mortgage Loan Trust | |||||||||||
| 4.428% 12/15/33 | 13,654 | 13,061 | |||||||||
See Accompanying Notes to Financial Statements.
27
CMG CORE BOND FUND
A Portfolio of Columbia Funds Institutional Trust
SCHEDULE OF INVESTMENTS
| Par | Value | ||||||||||
| Asset-Backed Securities (continued) | |||||||||||
| AmeriCredit Automobile Receivables Trust | |||||||||||
| 4.870% 12/06/10 | $ | 69,151 | $ | 68,570 | |||||||
| Capital One Multi-Asset Execution Trust | |||||||||||
| 4.050% 03/15/13 | 250,000 | 250,049 | |||||||||
| 4.850% 02/18/14 | 525,000 | 519,889 | |||||||||
| Capital One Prime Auto Receivables Trust | |||||||||||
| 4.890% 01/17/12 | 350,000 | 353,560 | |||||||||
| Carmax Auto Owner Trust | |||||||||||
| 5.270% 11/15/12 | 500,000 | 506,383 | |||||||||
| Chase Issuance Trust | |||||||||||
| 4.260% 05/15/13 | 640,000 | 634,845 | |||||||||
| 4.650% 12/17/12 | 465,000 | 468,021 | |||||||||
| Citibank Credit Card Issuance Trust | |||||||||||
| 5.350% 02/07/20 | 450,000 | 429,570 | |||||||||
| 5.500% 06/22/12 | 455,000 | 465,363 | |||||||||
| Discover Card Master Trust | |||||||||||
| 5.100% 10/15/13 | 595,000 | 592,366 | |||||||||
| Ford Credit Auto Owner Trust | |||||||||||
| 4.950% 03/15/13 | 495,000 | 489,559 | |||||||||
| 5.160% 04/15/13 | 560,000 | 564,366 | |||||||||
| Franklin Auto Trust | |||||||||||
| 5.360% 05/20/16 | 300,000 | 298,826 | |||||||||
| GE Capital Credit Card Master Note Trust | |||||||||||
| 4.130% 06/15/13 | 450,000 | 444,997 | |||||||||
| Honda Auto Receivables Owner Trust | |||||||||||
| 4.470% 01/18/12 | 410,000 | 411,649 | |||||||||
| IMC Home Equity Loan Trust | |||||||||||
| 7.520% 08/20/28 | 32,767 | 32,703 | |||||||||
| USAA Auto Owner Trust | |||||||||||
| 4.280% 10/15/12 | 670,000 | 665,967 | |||||||||
| 4.900% 02/15/12 | 470,000 | 476,957 | |||||||||
| Wilshire Mortgage Loan Trust | |||||||||||
| 7.255% 05/25/28 (a) | 5,893 | 5,782 | |||||||||
| Total Asset-Backed Securities (Cost of $7,736,007) | 7,692,483 | ||||||||||
| Collateralized Mortgage Obligations (6.0%) | |||||||||||
| Agency (2.5%) | |||||||||||
| Federal Home Loan Mortgage Corp. | |||||||||||
| 3.750% 12/15/11 | 50,686 | 50,543 | |||||||||
| 4.000% 09/15/15 | 510,000 | 510,552 | |||||||||
| 4.500% 10/15/18 | 216,371 | 217,410 | |||||||||
| 6.500% 10/15/23 | 91,318 | 95,108 | |||||||||
| Government National Mortgage Association | |||||||||||
| 4.430% 04/16/34 | 90,000 | 88,388 | |||||||||
| 4.500% 04/16/28 | 1,000,000 | 1,004,696 | |||||||||
| 4.807% 08/16/32 | 90,000 | 88,855 | |||||||||
| 4.954% 05/16/31 | 100,000 | 95,538 | |||||||||
| 2,151,090 | |||||||||||
See Accompanying Notes to Financial Statements.
28
CMG CORE BOND FUND
A Portfolio of Columbia Funds Institutional Trust
SCHEDULE OF INVESTMENTS
| Par | Value | ||||||||||
| Collateralized Mortgage Obligations (continued) | |||||||||||
| Non-Agency (3.5%) | |||||||||||
| Chase Mortgage Finance Corp. | |||||||||||
| 6.000% 03/25/37 (a) | $ | 1,330,054 | $ | 1,302,891 | |||||||
| Countrywide Home Loan Mortgage Pass Through Trust | |||||||||||
| 4.594% 12/19/33 (a) | 204,114 | 192,516 | |||||||||
| Structured Asset Securities Corp. | |||||||||||
| 5.500% 07/25/33 | 761,795 | 753,733 | |||||||||
| Washington Mutual Alternative Mortgage Pass-Through Certificates | |||||||||||
| 5.500% 10/25/35 | 894,466 | 868,941 | |||||||||
| 3,118,081 | |||||||||||
| Total Collateralized Mortgage Obligations (Cost of $5,368,182) | 5,269,171 | ||||||||||
| Shares | |||||||||||
| Securities Lending Collateral (12.5%) | |||||||||||
| State Street Navigator Securities Lending Prime Portfolio (e) (7 day yield of 2.654%) | 11,032,313 | 11,032,313 | |||||||||
| Total Securities Lending Collateral (Cost of $11,032,313) | 11,032,313 | ||||||||||
| Par | |||||||||||
| Short-Term Obligation (0.3%) | |||||||||||
| Repurchase agreement with Fixed Income Clearing Corp., dated 07/31/08, due on 08/01/08, at 2.070%, collateralized by a U.S. Government Agency Obligation maturing 07/20/09, market value of $320,925 (repurchase proceeds $311,018) | $ | 311,000 | 311,000 | ||||||||
| Total Short-Term Obligation (Cost of $311,000) | 311,000 | ||||||||||
| Total Investments (111.5%) (Cost of $99,655,794) (g) | 98,307,826 | ||||||||||
| Obligation to Return Collateral for Securities Loaned (-12.5%) | (11,032,313 | ) | |||||||||
| Other Assets & Liabilities, Net (1.0%) | 848,773 | ||||||||||
| Net Assets (100.0%) | $ | 88,124,286 | |||||||||
See Accompanying Notes to Financial Statements.
29
CMG CORE BOND FUND
A Portfolio of Columbia Funds Institutional Trust
SCHEDULE OF INVESTMENTS
Notes to Schedule of Investments:
(a) The interest rate shown on floating rate or variable rate securities reflects the rate at July 31, 2008.
(b) Security purchased on a delayed delivery basis.
(c) All or a portion of this security was on loan at July 31, 2008. The total market value of securities on loan at July 31, 2008 is $10,809,928.
(d) Security exempt from registration pursuant to Rule 144A under the Securities Act of 1933. These securities may be resold in transactions exempt from registration, normally to qualified institutional buyers. At July 31, 2008, these securities, which are not illiquid, amounted to $1,236,143, which represents 1.4% of net assets.
(e) Investment made with cash collateral received from securities lending activity.
(f) The issuer filed for bankruptcy protection under Chapter 11 on September 15, 2008. As a result of this bankruptcy filing, income is no longer being accrued on this security.
(g) Cost for federal income tax purposes is $99,796,287.
At July 31, 2008, the asset allocation of the Fund was as follows:
Asset Allocation (Unaudited) | % of Net Assets | ||||||
| Mortgage-Backed Securities | 39.0 | ||||||
| Corporate Fixed-Income Bonds & Notes | 21.8 | ||||||
| Government & Agency Obligations | 13.9 | ||||||
| Commercial Mortgage-Backed Securities | 9.3 | ||||||
| Asset-Backed Securities | 8.7 | ||||||
| Collateralized Mortgage Obligations | 6.0 | ||||||
| 98.7 | |||||||
| Securities Lending Collateral | 12.5 | ||||||
| Short-Term Obligation | 0.3 | ||||||
| Obligation to Return Collateral for Securities Loaned | (12.5 | ) | |||||
| Other Assets & Liabilities, Net | 1.0 | ||||||
| 100.0 | |||||||
See Accompanying Notes to Financial Statements.
30
CMG SHORT TERM BOND FUND
A Portfolio of Columbia Funds Institutional Trust
SCHEDULE OF INVESTMENTS
July 31, 2008
| Par | Value | ||||||||||
| Corporate Fixed-Income Bonds & Notes (30.4%) | |||||||||||
| Basic Materials (0.5%) | |||||||||||
| Chemicals (0.2%) | |||||||||||
| EI Du Pont de Nemours & Co. | |||||||||||
| 5.000% 07/15/13 | $ | 355,000 | $ | 355,465 | |||||||
| Iron/Steel (0.3%) | |||||||||||
| Nucor Corp. | |||||||||||
| 5.000% 06/01/13 | 700,000 | 703,823 | |||||||||
| 1,059,288 | |||||||||||
| Communications (3.5%) | |||||||||||
| Media (0.7%) | |||||||||||
| Comcast Corp. | |||||||||||
| 5.500% 03/15/11 | 200,000 | 200,069 | |||||||||
| 5.850% 01/15/10 | 600,000 | 608,671 | |||||||||
| Time Warner Cable, Inc. | |||||||||||
| 6.200% 07/01/13 | 650,000 | 663,890 | |||||||||
| 1,472,630 | |||||||||||
| Telecommunication Services (2.8%) | |||||||||||
| AT&T, Inc. | |||||||||||
| 6.250% 03/15/11 | 1,500,000 | 1,551,833 | |||||||||
| British Telecommunications PLC | |||||||||||
| 5.150% 01/15/13 | 700,000 | 684,697 | |||||||||
| Deutsche Telekom International Finance BV | |||||||||||
| 8.500% 06/15/10 | 800,000 | 844,678 | |||||||||
| Telefonica Emisones SAU | |||||||||||
| 5.984% 06/20/11 | 750,000 | 759,019 | |||||||||
| Verizon Global Funding Corp. | |||||||||||
| 7.250% 12/01/10 | 900,000 | 951,068 | |||||||||
| Vodafone Group PLC | |||||||||||
| 7.750% 02/15/10 | 800,000 | 836,272 | |||||||||
| 5,627,567 | |||||||||||
| 7,100,197 | |||||||||||
| Consumer Cyclical (1.5%) | |||||||||||
| Retail (1.5%) | |||||||||||
| CVS Caremark Corp. | |||||||||||
| 5.750% 08/15/11 | 677,000 | 694,276 | |||||||||
| Target Corp. | |||||||||||
| 6.350% 01/15/11 | 1,000,000 | 1,043,456 | |||||||||
| Wal-Mart Stores, Inc. | |||||||||||
| 6.875% 08/10/09 | 1,350,000 | 1,403,476 | |||||||||
| 3,141,208 | |||||||||||
| Consumer Non-Cyclical (2.9%) | |||||||||||
| Beverages (0.8%) | |||||||||||
| Coca-Cola Enterprises, Inc. | |||||||||||
| 5.750% 11/01/08 | 725,000 | 728,888 | |||||||||
See Accompanying Notes to Financial Statements.
31
CMG SHORT TERM BOND FUND
A Portfolio of Columbia Funds Institutional Trust
SCHEDULE OF INVESTMENTS
| Par | Value | ||||||||||
| Corporate Fixed-Income Bonds & Notes (continued) | |||||||||||
| Beverages (continued) | |||||||||||
| Diageo Capital PLC | |||||||||||
| 4.375% 05/03/10 | $ | 950,000 | $ | 951,518 | |||||||
| 1,680,406 | |||||||||||
| Food (0.7%) | |||||||||||
| ConAgra Foods, Inc. | |||||||||||
| 7.875% 09/15/10 | 700,000 | 739,757 | |||||||||
| Kraft Foods, Inc. | |||||||||||
| 5.625% 08/11/10 | 625,000 | 639,795 | |||||||||
| 1,379,552 | |||||||||||
| Healthcare Services (0.4%) | |||||||||||
| UnitedHealth Group, Inc. | |||||||||||
| 4.125% 08/15/09 | 800,000 | 792,073 | |||||||||
| Pharmaceuticals (1.0%) | |||||||||||
| Abbott Laboratories | |||||||||||
| 5.600% 05/15/11 | 1,100,000 | 1,149,411 | |||||||||
| Wyeth | |||||||||||
| 6.950% 03/15/11 | 940,000 | 993,089 | |||||||||
| 2,142,500 | |||||||||||
| 5,994,531 | |||||||||||
| Energy (1.6%) | |||||||||||
| Oil & Gas (1.1%) | |||||||||||
| Canadian Natural Resources Ltd. | |||||||||||
| 5.450% 10/01/12 | 600,000 | 601,433 | |||||||||
| Conoco Funding Co. | |||||||||||
| 6.350% 10/15/11 | 1,000,000 | 1,058,969 | |||||||||
| Valero Energy Corp. | |||||||||||
| 6.875% 04/15/12 | 575,000 | 593,543 | |||||||||
| 2,253,945 | |||||||||||
| Oil & Gas Services (0.3%) | |||||||||||
| Weatherford International Ltd. | |||||||||||
| 5.150% 03/15/13 | 650,000 | 644,194 | |||||||||
| Pipelines (0.2%) | |||||||||||
| TransCanada Pipelines Ltd. | |||||||||||
| 6.125% 02/19/10 | 350,000 | 359,458 | |||||||||
| 3,257,597 | |||||||||||
| Financials (15.1%) | |||||||||||
| Banks (4.4%) | |||||||||||
| Barclays Bank PLC | |||||||||||
| 7.400% 12/15/09 | 1,300,000 | 1,342,982 | |||||||||
| Deutsche Bank AG London | |||||||||||
| 4.875% 05/20/13 | 1,000,000 | 981,471 | |||||||||
| Fifth Third Bank | |||||||||||
| 4.200% 02/23/10 | 1,000,000 | 955,279 | |||||||||
See Accompanying Notes to Financial Statements.
32
CMG SHORT TERM BOND FUND
A Portfolio of Columbia Funds Institutional Trust
SCHEDULE OF INVESTMENTS
| Par | Value | ||||||||||
| Corporate Fixed-Income Bonds & Notes (continued) | |||||||||||
| Banks (continued) | |||||||||||
| Mellon Funding Corp. | |||||||||||
| 3.250% 04/01/09 | $ | 1,175,000 | $ | 1,168,184 | |||||||
| PNC Funding Corp. | |||||||||||
| 4.500% 03/10/10 | 800,000 | 795,678 | |||||||||
| SunTrust Banks, Inc. | |||||||||||
| 4.250% 10/15/09 | 925,000 | 914,994 | |||||||||
| U.S. Bank National Association | |||||||||||
| 6.375% 08/01/11 | 1,500,000 | 1,566,307 | |||||||||
| Wells Fargo & Co. | |||||||||||
| 3.120% 08/15/08 | 810,000 | 809,729 | |||||||||
| 4.000% 08/15/08 | 600,000 | 600,232 | |||||||||
| 9,134,856 | |||||||||||
| Diversified Financial Services (7.8%) | |||||||||||
| American Express Credit Corp. | |||||||||||
| 5.875% 05/02/13 | 1,600,000 | 1,570,963 | |||||||||
| Capital One Bank | |||||||||||
| 5.750% 09/15/10 (a) | 925,000 | 912,204 | |||||||||
| Citigroup, Inc. | |||||||||||
| 4.250% 07/29/09 | 825,000 | 825,242 | |||||||||
| Countrywide Home Loans, Inc. | |||||||||||
| 4.125% 09/15/09 (b) | 600,000 | 583,174 | |||||||||
| Credit Suisse First Boston USA, Inc. | |||||||||||
| 4.875% 08/15/10 | 1,500,000 | 1,509,357 | |||||||||
| General Electric Capital Corp. | |||||||||||
| 4.875% 10/21/10 | 1,800,000 | 1,839,114 | |||||||||
| Goldman Sachs Group, Inc. | |||||||||||
| 4.500% 06/15/10 | 1,400,000 | 1,402,682 | |||||||||
| HSBC Finance Corp. | |||||||||||
| 7.000% 05/15/12 | 1,500,000 | 1,557,648 | |||||||||
| JPMorgan Chase & Co. | |||||||||||
| 3.800% 10/02/09 | 1,500,000 | 1,493,826 | |||||||||
| Lehman Brothers Holdings, Inc. | |||||||||||
| 3.950% 11/10/09 (g) | 1,100,000 | 1,060,035 | |||||||||
| Merrill Lynch & Co., Inc. | |||||||||||
| 4.125% 01/15/09 | 1,000,000 | 989,755 | |||||||||
| Morgan Stanley | |||||||||||
| 3.875% 01/15/09 | 1,200,000 | 1,195,630 | |||||||||
| National Rural Utilities Cooperative Finance Corp. | |||||||||||
| 5.750% 08/28/09 (a) | 1,000,000 | 1,017,164 | |||||||||
| 15,956,794 | |||||||||||
| Insurance (1.9%) | |||||||||||
| Allstate Corp. | |||||||||||
| 7.200% 12/01/09 | 1,250,000 | 1,296,186 | |||||||||
| American International Group, Inc. | |||||||||||
| 5.375% 10/18/11 | 850,000 | 828,045 | |||||||||
| Berkshire Hathaway Finance Corp. | |||||||||||
| 5.000% 08/15/13 (c) | 500,000 | 501,063 | |||||||||
See Accompanying Notes to Financial Statements.
33
CMG SHORT TERM BOND FUND
A Portfolio of Columbia Funds Institutional Trust
SCHEDULE OF INVESTMENTS
| Par | Value | ||||||||||
| Corporate Fixed-Income Bonds & Notes (continued) | |||||||||||
| Insurance (continued) | |||||||||||
| Genworth Financial, Inc. | |||||||||||
| 4.750% 06/15/09 | $ | 600,000 | $ | 596,254 | |||||||
| Principal Life Income Funding Trusts | |||||||||||
| 5.300% 04/24/13 | 700,000 | 698,851 | |||||||||
| 3,920,399 | |||||||||||
| Real Estate Investment Trusts (REITs) (0.3%) | |||||||||||
| Simon Property Group LP | |||||||||||
| 4.875% 03/18/10 | 600,000 | 596,110 | |||||||||
| Savings & Loans (0.7%) | |||||||||||
| Western Financial Bank | |||||||||||
| 9.625% 05/15/12 | 1,325,000 | 1,368,181 | |||||||||
| 30,976,340 | |||||||||||
| Industrials (1.9%) | |||||||||||
| Aerospace & Defense (0.5%) | |||||||||||
| United Technologies Corp. | |||||||||||
| 6.500% 06/01/09 | 970,000 | 998,194 | |||||||||
| Machinery (0.8%) | |||||||||||
| Caterpillar Financial Services Corp. | |||||||||||
| 4.300% 06/01/10 | 825,000 | 831,762 | |||||||||
| John Deere Capital Corp. | |||||||||||
| 4.500% 04/03/13 | 800,000 | 789,693 | |||||||||
| 1,621,455 | |||||||||||
| Miscellaneous Manufacturing (0.1%) | |||||||||||
| 3M Co. | |||||||||||
| 5.125% 11/06/09 | 225,000 | 230,914 | |||||||||
| Transportation (0.5%) | |||||||||||
| Burlington Northern Santa Fe Corp. | |||||||||||
| 6.750% 07/15/11 | 700,000 | 733,397 | |||||||||
| Union Pacific Corp. | |||||||||||
| 3.875% 02/15/09 | 415,000 | 414,457 | |||||||||
| 1,147,854 | |||||||||||
| 3,998,417 | |||||||||||
| Technology (1.2%) | |||||||||||
| Computers (0.4%) | |||||||||||
| International Business Machines Corp. | |||||||||||
| 4.950% 03/22/11 (a) | 800,000 | 823,359 | |||||||||
| Networking & Telecom Equipment (0.5%) | |||||||||||
| Cisco Systems, Inc. | |||||||||||
| 5.250% 02/22/11 | 1,000,000 | 1,029,354 | |||||||||
See Accompanying Notes to Financial Statements.
34
CMG SHORT TERM BOND FUND
A Portfolio of Columbia Funds Institutional Trust
SCHEDULE OF INVESTMENTS
| Par | Value | ||||||||||
| Corporate Fixed-Income Bonds & Notes (continued) | |||||||||||
| Software (0.3%) | |||||||||||
| Oracle Corp. | |||||||||||
| 5.000% 01/15/11 | $ | 700,000 | $ | 715,107 | |||||||
| 2,567,820 | |||||||||||
| Utilities (2.2%) | |||||||||||
| Electric (1.9%) | |||||||||||
| American Electric Power Co., Inc. | |||||||||||
| 5.375% 03/15/10 | 800,000 | 808,365 | |||||||||
| Consolidated Edison Co. of New York | |||||||||||
| 4.700% 06/15/09 | 1,000,000 | 1,010,136 | |||||||||
| Dominion Resources, Inc. | |||||||||||
| 5.125% 12/15/09 | 450,000 | 455,487 | |||||||||
| Exelon Generation Co. LLC | |||||||||||
| 6.950% 06/15/11 | 800,000 | 827,409 | |||||||||
| Pacific Gas & Electric Co. | |||||||||||
| 4.200% 03/01/11 | 850,000 | 843,786 | |||||||||
| 3,945,183 | |||||||||||
| Gas (0.3%) | |||||||||||
| Sempra Energy | |||||||||||
| 4.750% 05/15/09 | 484,000 | 485,839 | |||||||||
| 4,431,022 | |||||||||||
| Total Corporate Fixed-Income Bonds & Notes (Cost of $62,610,705) | 62,526,420 | ||||||||||
| Asset-Backed Securities (20.1%) | |||||||||||
| AmeriCredit Automobile Receivables Trust | |||||||||||
| 4.870% 12/06/10 | 497,884 | 493,707 | |||||||||
| 5.190% 11/06/11 | 1,600,000 | 1,588,856 | |||||||||
| 5.210% 10/06/11 | 555,435 | 546,545 | |||||||||
| 5.290% 11/06/10 | 10,648 | 10,645 | |||||||||
| 5.420% 08/08/11 | 799,271 | 780,147 | |||||||||
| 5.420% 05/07/12 | 4,000,000 | 3,867,831 | |||||||||
| Americredit Prime Automobile Receivable | |||||||||||
| 5.270% 11/08/11 | 1,000,000 | 1,006,961 | |||||||||
| Capital One Auto Finance Trust | |||||||||||
| 5.030% 04/15/12 | 3,000,000 | 2,910,751 | |||||||||
| Cityscape Home Equity Loan Trust | |||||||||||
| 7.380% 07/25/28 | 429,406 | 428,354 | |||||||||
| 7.410% 05/25/28 | 42,522 | 42,074 | |||||||||
| CPS Auto Trust | |||||||||||
| 5.040% 09/15/11 (c) | 400,000 | 381,527 | |||||||||
| Daimler Chrysler Auto Trust | |||||||||||
| 4.980% 02/08/11 | 1,107,861 | 1,118,445 | |||||||||
| Fifth Third Auto Trust | |||||||||||
| 4.070% 01/17/12 | 1,400,000 | 1,400,690 | |||||||||
| Ford Credit Auto Owner Trust | |||||||||||
| 5.050% 03/15/10 | 871,098 | 875,838 | |||||||||
See Accompanying Notes to Financial Statements.
35
CMG SHORT TERM BOND FUND
A Portfolio of Columbia Funds Institutional Trust
SCHEDULE OF INVESTMENTS
| Par | Value | ||||||||||
| Asset-Backed Securities (continued) | |||||||||||
| Franklin Auto Trust | |||||||||||
| 5.040% 01/20/11 | $ | 596,102 | $ | 600,539 | |||||||
| GE Equipment Midticket LLC | |||||||||||
| 4.530% 06/14/11 | 2,000,000 | 2,018,983 | |||||||||
| GS Auto Loan Trust | |||||||||||
| 5.480% 12/15/14 | 2,000,000 | 2,019,894 | |||||||||
| Hyundai Auto Receivables Trust | |||||||||||
| 5.110% 04/15/11 | 677,106 | 685,186 | |||||||||
| IMC Home Equity Loan Trust | |||||||||||
| 7.500% 04/25/26 | 152,127 | 151,496 | |||||||||
| 7.520% 08/20/28 | 443,621 | 442,752 | |||||||||
| Nissan Auto Lease Trust | |||||||||||
| 5.200% 05/17/10 | 1,000,000 | 1,012,255 | |||||||||
| Nissan Auto Receivables Owner Trust | |||||||||||
| 5.220% 11/15/11 | 3,150,000 | 3,213,306 | |||||||||
| Pinnacle Capital Asset Trust | |||||||||||
| 5.770% 05/25/10 (c) | 870,000 | 867,597 | |||||||||
| Santander Drive Auto Receivables Trust | |||||||||||
| 5.050% 09/15/11 | 500,000 | 492,031 | |||||||||
| SLM Student Loan Trust | |||||||||||
| 2.836% 03/15/17 (e) | 799,252 | 787,598 | |||||||||
| 2.856% 12/15/20 (e) | 1,532,000 | 1,444,258 | |||||||||
| Triad Auto Receivables Owner Trust | |||||||||||
| 4.220% 06/12/12 | 2,057,491 | 1,967,520 | |||||||||
| UCFC Home Equity Loan | |||||||||||
| 6.315% 04/15/30 | 294,833 | 294,444 | |||||||||
| UPFC Auto Receivables Trust | |||||||||||
| 5.010% 08/15/12 | 1,211,879 | 1,172,553 | |||||||||
| USAA Auto Owner Trust | |||||||||||
| 4.130% 11/15/11 | 1,803,248 | 1,809,781 | |||||||||
| 4.170% 02/15/11 | 1,430,000 | 1,436,991 | |||||||||
| 4.890% 08/15/12 | 3,655,000 | 3,700,088 | |||||||||
| 5.070% 06/15/13 | 750,000 | 758,422 | |||||||||
| Wachovia Auto Loan Owner Trust | |||||||||||
| 5.080% 04/20/12 (c) | 1,000,000 | 1,006,503 | |||||||||
| Total Asset-Backed Securities (Cost of $41,228,796) | 41,334,568 | ||||||||||
| Collateralized Mortgage Obligations (19.1%) | |||||||||||
| Agency (10.5%) | |||||||||||
| Federal Home Loan Mortgage Corp. | |||||||||||
| 4.000% 09/15/15 | 357,578 | 357,535 | |||||||||
| 4.500% 02/15/15 | 635,465 | 640,019 | |||||||||
| 5.000% 09/15/24 | 592,925 | 596,989 | |||||||||
| 5.000% 03/15/26 | 1,163,906 | 1,177,748 | |||||||||
| 5.000% 05/15/26 | 133,883 | 135,074 | |||||||||
| 5.500% 02/15/25 | 1,485,968 | 1,512,044 | |||||||||
| 5.500% 12/15/26 | 551,596 | 560,812 | |||||||||
| 5.500% 06/15/28 | 1,700,000 | 1,738,661 | |||||||||
| 5.500% 11/15/28 | 5,594,873 | 5,711,067 | |||||||||
See Accompanying Notes to Financial Statements.
36
CMG SHORT TERM BOND FUND
A Portfolio of Columbia Funds Institutional Trust
SCHEDULE OF INVESTMENTS
| Par | Value | ||||||||||
| Collateralized Mortgage Obligations (continued) | |||||||||||
| Agency (continued) | |||||||||||
| 5.500% 10/15/29 | $ | 579,880 | $ | 592,641 | |||||||
| 5.500% 05/15/34 | 3,144,689 | 3,194,887 | |||||||||
| 6.000% 06/15/25 | 913,007 | 933,410 | |||||||||
| 6.000% 05/15/27 | 1,046,511 | 1,071,566 | |||||||||
| Federal National Mortgage Association | |||||||||||
| 4.500% 01/25/29 | 911,647 | 913,332 | |||||||||
| 5.500% 07/25/25 | 1,263,646 | 1,283,006 | |||||||||
| 6.000% 06/25/27 | 1,035,433 | 1,058,188 | |||||||||
| 21,476,979 | |||||||||||
| Non-Agency (8.6%) | |||||||||||
| Chase Mortgage Finance Corp. | |||||||||||
| 5.935% 03/25/37 (e) | 863,323 | 827,211 | |||||||||
| Countrywide Alternative Loan Trust | |||||||||||
| 5.250% 08/25/35 | 1,123,177 | 1,047,153 | |||||||||
| 5.500% 02/25/36 | 1,912,448 | 1,757,513 | |||||||||
| Countrywide Home Loan Mortgage Pass Through Trust | |||||||||||
| 5.485% 01/25/36 (e) | 1,031,886 | 988,173 | |||||||||
| 6.000% 12/25/36 | 452,745 | 453,456 | |||||||||
| JPMorgan Mortgage Trust | |||||||||||
| 5.755% 04/25/36 (e) | 1,309,239 | 1,204,800 | |||||||||
| 6.041% 10/25/36 (e) | 2,627,339 | 2,495,804 | |||||||||
| MASTR Asset Securitization Trust | |||||||||||
| 5.750% 05/25/36 | 1,188,645 | 1,187,236 | |||||||||
| PNC Mortgage Securities Corp. | |||||||||||
| 0.110% 04/28/27 (e) | 4,759 | 4,741 | |||||||||
| Residential Accredit Loans, Inc. | |||||||||||
| 5.750% 01/25/36 | 226,202 | 219,925 | |||||||||
| SACO I, Inc. | |||||||||||
| 7.000% 08/25/36 (c) | 71,824 | 71,465 | |||||||||
| Structured Adjustable Rate Mortgage Loan Trust | |||||||||||
| 5.796% 07/25/36 (e) | 2,069,203 | 1,582,156 | |||||||||
| Structured Asset Securities Corp. | |||||||||||
| 5.750% 04/25/33 | 542,741 | 505,464 | |||||||||
| Washington Mutual Mortgage Pass-Through Certificates | |||||||||||
| 5.645% 11/25/36 (e) | 1,846,248 | 1,747,388 | |||||||||
| 5.877% 07/25/37 (e) | 2,453,404 | 1,939,183 | |||||||||
| Wells Fargo Mortgage Backed Securities Trust | |||||||||||
| 5.240% 04/25/36 (e) | 472,957 | 456,295 | |||||||||
| 6.000% 07/25/37 | 1,276,939 | 1,248,840 | |||||||||
| 17,736,803 | |||||||||||
| Total Collateralized Mortgage Obligations (Cost of $40,675,700) | 39,213,782 | ||||||||||
| Mortgage-Backed Securities (11.5%) | |||||||||||
| Federal Home Loan Mortgage Corp. | |||||||||||
| 4.000% 05/01/11 | 1,132,393 | 1,124,240 | |||||||||
| 4.500% 03/01/21 | 1,425,939 | 1,371,732 | |||||||||
See Accompanying Notes to Financial Statements.
37
CMG SHORT TERM BOND FUND
A Portfolio of Columbia Funds Institutional Trust
SCHEDULE OF INVESTMENTS
| Par | Value | ||||||||||
| Mortgage-Backed Securities (continued) | |||||||||||
| 5.000% 06/01/22 | $ | 880,666 | $ | 864,499 | |||||||
| 5.500% 01/01/21 | 318,228 | 320,012 | |||||||||
| 5.500% 07/01/21 | 86,564 | 86,860 | |||||||||
| 5.500% 08/01/21 | 967,044 | 970,349 | |||||||||
| 5.500% 09/01/21 | 721,237 | 723,702 | |||||||||
| 5.500% 01/01/22 | 701,031 | 703,059 | |||||||||
| 5.500% 03/01/22 | 743,609 | 745,760 | |||||||||
| 5.500% 06/01/23 | 1,733,914 | 1,738,757 | |||||||||
| 5.500% 08/01/23 | 3,200,000 | 3,208,937 | |||||||||
| 6.000% 11/01/14 | 3,868 | 3,949 | |||||||||
| 6.000% 08/01/21 | 424,012 | 432,951 | |||||||||
| 6.000% 02/01/22 | 364,872 | 372,491 | |||||||||
| 6.000% 06/01/22 | 928,709 | 948,102 | |||||||||
| 6.000% 08/01/22 | 488,335 | 498,532 | |||||||||
| 6.000% 10/01/22 | 787,481 | 803,925 | |||||||||
| 6.000% 11/01/22 | 2,000,000 | 2,042,163 | |||||||||
| TBA, | |||||||||||
| 6.000% 08/01/23 (d) | 1,600,000 | 1,631,000 | |||||||||
| Federal National Mortgage Association | |||||||||||
| 5.000% 06/01/20 | 1,024,837 | 1,012,327 | |||||||||
| 5.000% 05/01/23 | 1,735,409 | 1,706,090 | |||||||||
| 5.500% 11/01/21 | 309,868 | 311,412 | |||||||||
| 5.500% 08/01/22 | 1,632,660 | 1,639,934 | |||||||||
| 6.000% 03/01/09 | 11,563 | 11,809 | |||||||||
| 6.000% 05/01/09 | 125,131 | 127,794 | |||||||||
| Small Business Administration | |||||||||||
| 2.625% 03/25/22 (e) | 70,353 | 70,672 | |||||||||
| 2.625% 06/25/22 (e) | 161,102 | 161,842 | |||||||||
| Total Mortgage-Backed Securities (Cost of $23,639,393) | 23,632,900 | ||||||||||
| Commercial Mortgage-Backed Securities (8.3%) | |||||||||||
| Bear Stearns Commercial Mortgage Securities, Inc. | |||||||||||
| 3.869% 02/11/41 | 3,425,000 | 3,410,476 | |||||||||
| Capco America Securitization Corp. | |||||||||||
| 6.260% 10/15/30 | 251,615 | 251,824 | |||||||||
| CS First Boston Mortgage Securities Corp. | |||||||||||
| 4.512% 07/15/37 | 800,000 | 791,850 | |||||||||
| 5.017% 08/15/38 | 350,000 | 348,651 | |||||||||
| First Union National Bank Commercial Mortgage | |||||||||||
| 7.841% 05/17/32 | 1,943,078 | 2,014,767 | |||||||||
| JPMorgan Chase Commercial Mortgage Securities Corp. | |||||||||||
| 4.914% 07/12/37 | 1,415,441 | 1,412,184 | |||||||||
| 5.538% 02/12/49 | 1,696,215 | 1,687,052 | |||||||||
| JPMorgan Commercial Mortgage Finance Corp. | |||||||||||
| 6.812% 01/15/30 | 700,000 | 718,339 | |||||||||
| LB-UBS Commercial Mortgage Trust | |||||||||||
| 4.243% 10/15/29 | 1,000,000 | 976,654 | |||||||||
| 5.642% 12/15/25 | 361,030 | 364,317 | |||||||||
See Accompanying Notes to Financial Statements.
38
CMG SHORT TERM BOND FUND
A Portfolio of Columbia Funds Institutional Trust
SCHEDULE OF INVESTMENTS
| Par | Value | ||||||||||
| Commercial Mortgage-Backed Securities (continued) | |||||||||||
| Merrill Lynch Mortgage Trust | |||||||||||
| 4.446% 09/12/42 | $ | 734,511 | $ | 732,979 | |||||||
| Merrill Lynch/Countrywide Commercial Mortgage Trust | |||||||||||
| 5.549% 06/12/50 | 1,727,083 | 1,715,880 | |||||||||
| Morgan Stanley Capital I | |||||||||||
| 7.020% 03/15/32 (e) | 689,066 | 693,862 | |||||||||
| Prudential Securities Secured Financing Corp. | |||||||||||
| 6.480% 11/01/31 | 217,208 | 217,097 | |||||||||
| 7.511% 06/16/31 (e) | 1,700,000 | 1,737,606 | |||||||||
| Total Commercial Mortgage-Backed Securities (Cost of $17,017,854) | 17,073,538 | ||||||||||
| Government & Agency Obligations (6.0%) | |||||||||||
| Foreign Government Obligations (0.7%) | |||||||||||
| Morocco Government AID Bond | |||||||||||
| 3.125% 05/01/23 (e) | 300,000 | 287,478 | |||||||||
| Province of Quebec | |||||||||||
| 5.000% 07/17/09 (a) | 875,000 | 890,018 | |||||||||
| United Mexican States | |||||||||||
| 4.625% 10/08/08 | 325,000 | 325,000 | |||||||||
| 1,502,496 | |||||||||||
| U.S. Government Agencies (3.3%) | |||||||||||
| Federal Home Loan Bank | |||||||||||
| 5.250% 06/11/10 (a) | 3,400,000 | 3,527,306 | |||||||||
| Federal National Mortgage Association | |||||||||||
| 4.625% 06/01/10 | 1,700,000 | 1,742,316 | |||||||||
| 5.000% 04/20/09 | 1,400,000 | 1,421,469 | |||||||||
| 5.375% 08/15/09 | 100,000 | 102,652 | |||||||||
| 6,793,743 | |||||||||||
| U.S. Government Obligations (2.0%) | |||||||||||
| U.S. Treasury Inflation Indexed Bond | |||||||||||
| 3.500% 01/15/11 (a) | 1,219,463 | 1,305,302 | |||||||||
| U.S. Treasury Notes | |||||||||||
| 3.875% 10/31/12 (a) | 2,700,000 | 2,781,843 | |||||||||
| 4,087,145 | |||||||||||
| Total Government & Agency Obligations (Cost of $12,383,078) | 12,383,384 | ||||||||||
| Shares | |||||||||||
| Securities Lending Collateral (3.1%) | |||||||||||
| State Street Navigator Securities Lending Prime Portfolio (f) (7 day yield of 2.654%) | 6,312,979 | 6,312,979 | |||||||||
| Total Securities Lending Collateral (Cost of $6,312,979) | 6,312,979 | ||||||||||
See Accompanying Notes to Financial Statements.
39
CMG SHORT TERM BOND FUND
A Portfolio of Columbia Funds Institutional Trust
SCHEDULE OF INVESTMENTS
| Par | Value | ||||||||||
| Short-Term Obligation (6.1%) | |||||||||||
| Repurchase agreement with Fixed Income Clearing Corp., dated 07/31/08, due 08/01/08 at 2.070%, collateralized by U.S. Government Agency Obligation maturing 05/28/09, market value $12,725,000 (repurchase proceeds $12,473,717) | $ | 12,473,000 | $ | 12,473,000 | |||||||
| Total Short-Term Obligation (Cost of $12,473,000) | 12,473,000 | ||||||||||
| Total Investments (104.6%) (Cost of $216,341,505) (h) | 214,950,571 | ||||||||||
| Obligation to Return Collateral for Securities Loaned (-3.1%) | (6,312,979 | ) | |||||||||
| Other Assets & Liabilities, Net (-1.5%) | (3,094,137 | ) | |||||||||
| Net Assets (100.0%) | $ | 205,543,455 | |||||||||
Notes to Schedule of Investments:
(a) All or a portion of this security was on loan at July 31, 2008. The total market value of securities on loan at July 31, 2008 is $6,214,200.
(b) Investments in affiliates during the year ended July 31, 2008:
Security name: Countrywide Home Loans, Inc., 4.125% 09/15/09
| Par as of 07/31/07: | $ | 600,000 | |||||
| Par purchased: | $ | - | |||||
| Par sold: | $ | - | |||||
| Par as of 07/31/08: | $ | 600,000 | |||||
| Net realized gain: | $ | - | |||||
| Interest income earned: | $ | 24,750 | |||||
| Value at end of period: | $ | 583,174 | |||||
| Countrywide became an affiliate on July 1, 2008. | |||||||
(c) Security exempt from registration pursuant to Rule 144A under the Securities Act of 1933. These securities may be resold in transactions exempt from registration, normally to qualified institutional buyers. At July 31, 2008, these securities, which are not illiquid, amounted to $2,828,155, which represents 1.4% of net assets.
(d) Security purchased on a delayed delivery basis.
(e) The interest rate shown on floating rate or variable rate securities reflects the rate at July 31, 2008.
(f) Investment made with cash collateral received from securities lending activity.
(g) The issuer filed for bankruptcy protection under Chapter 11 on September 15, 2008. As a result of this bankruptcy filing, income is no longer being accrued on this security.
(h) Cost for federal income tax purposes is $216,760,565.
See Accompanying Notes to Financial Statements.
40
CMG SHORT TERM BOND FUND
A Portfolio of Columbia Funds Institutional Trust
SCHEDULE OF INVESTMENTS
At July 31, 2008, the asset allocation of the Fund is as follows:
Asset Allocation (Unaudited) | % of Net Assets | ||||||
| Corporate Fixed-Income Bonds & Notes | 30.4 | ||||||
| Asset-Backed Securities | 20.1 | ||||||
| Collateralized Mortgage Obligations | 19.1 | ||||||
| Mortgage-Backed Securities | 11.5 | ||||||
| Commercial Mortgage-Backed Securities | 8.3 | ||||||
| Government & Agency Obligations | 6.0 | ||||||
| 95.4 | |||||||
| Securities Lending Collateral | 3.1 | ||||||
| Short-Term Obligation | 6.1 | ||||||
| Obligation to Return Collateral for Securities Loaned | (3.1 | ) | |||||
| Other Assets & Liabilities, Net | (1.5 | ) | |||||
| 100.0 | |||||||
| Acronym | Name | ||||||
| TBA | To Be Announced | ||||||
See Accompanying Notes to Financial Statements.
41
CMG ULTRA SHORT TERM BOND FUND
A Portfolio of Columbia Funds Institutional Trust
SCHEDULE OF INVESTMENTS
July 31, 2008
| Par | Value | ||||||||||
| Corporate Fixed-Income Bonds & Notes (31.0%) | |||||||||||
| Basic Materials (1.6%) | |||||||||||
| Chemicals (1.6%) | |||||||||||
| E.I. Du Pont de Nemours & Co. | |||||||||||
| 6.875% 10/15/09 | $ | 1,500,000 | $ | 1,554,530 | |||||||
| Communications (3.2%) | |||||||||||
| Media (2.7%) | |||||||||||
| Comcast MO of Delaware LLC | |||||||||||
| 9.000% 09/01/08 | 1,000,000 | 1,001,999 | |||||||||
| Time Warner Entertainment Co. LP | |||||||||||
| 7.250% 09/01/08 (a) | 1,000,000 | 1,002,467 | |||||||||
| Walt Disney Co. | |||||||||||
| 2.796% 09/10/09 (b) | 580,000 | 579,988 | |||||||||
| 2,584,454 | |||||||||||
| Telecommunications (0.5%) | |||||||||||
| Cisco Systems, Inc. | |||||||||||
| 2.738% 02/20/09 (b) | 500,000 | 500,255 | |||||||||
| 3,084,709 | |||||||||||
| Consumer Cyclical (0.5%) | |||||||||||
| Retail (0.5%) | |||||||||||
| Wal-Mart Stores, Inc. | |||||||||||
| 6.875% 08/10/09 | 500,000 | 519,806 | |||||||||
| Consumer Non-Cyclical (3.4%) | |||||||||||
| Beverages (1.1%) | |||||||||||
| Diageo Finance BV | |||||||||||
| 2.921% 03/30/09 (b) | 1,000,000 | 998,821 | |||||||||
| Cosmetics/Personal Care (0.1%) | |||||||||||
| Procter & Gamble Co. | |||||||||||
| 3.500% 12/15/08 | 100,000 | 100,197 | |||||||||
| Food (1.2%) | |||||||||||
| Pepsi Bottling Holdings, Inc. | |||||||||||
| 5.625% 02/17/09 (c) | 1,150,000 | 1,160,788 | |||||||||
| Healthcare Services (1.0%) | |||||||||||
| UnitedHealth Group Inc. | |||||||||||
| 2.762% 03/02/09 (b) | 1,000,000 | 989,077 | |||||||||
| 3,248,883 | |||||||||||
| Energy (0.4%) | |||||||||||
| Oil & Gas (0.4%) | |||||||||||
| Conoco Funding Co. | |||||||||||
| 6.350% 10/15/11 | 400,000 | 423,588 | |||||||||
See Accompanying Notes to Financial Statements.
42
CMG ULTRA SHORT TERM BOND FUND
A Portfolio of Columbia Funds Institutional Trust
SCHEDULE OF INVESTMENTS
| Par | Value | ||||||||||
| Corporate Fixed-Income Bonds & Notes (continued) | |||||||||||
| Financials (16.7%) | |||||||||||
| Banks (3.0%) | |||||||||||
| American Express Centurion Bank | |||||||||||
| 5.200% 11/26/10 (a) | $ | 750,000 | $ | 748,882 | |||||||
| Comerica Bank | |||||||||||
| 2.788% 08/24/11 (b) | 1,000,000 | 907,794 | |||||||||
| Deutsche Bank AG | |||||||||||
| 4.875% 05/20/13 | 625,000 | 613,419 | |||||||||
| National Westminster Bank PLC | |||||||||||
| 7.375% 10/01/09 | 641,000 | 656,806 | |||||||||
| 2,926,901 | |||||||||||
| Diversified Financial Services (10.2%) | |||||||||||
| Bear Stearns Companies, Inc. | |||||||||||
| 3.096% 01/30/09 (b) | 1,000,000 | 997,307 | |||||||||
| Capital One Bank USA | |||||||||||
| 5.000% 06/15/09 | 800,000 | 798,522 | |||||||||
| Citigroup, Inc. | |||||||||||
| 4.125% 02/22/10 | 850,000 | 839,157 | |||||||||
| Credit Suisse USA, Inc. | |||||||||||
| 6.125% 11/15/11 | 785,000 | 805,664 | |||||||||
| General Electric Capital Corp. | |||||||||||
| 2.845% 01/26/11 (a)(b) | 1,000,000 | 988,153 | |||||||||
| Goldman Sachs Group, Inc. | |||||||||||
| 2.964% 02/06/12 (b) | 1,000,000 | 950,995 | |||||||||
| 6.650% 05/15/09 | 500,000 | 511,351 | |||||||||
| HSBC Finance Corp. | |||||||||||
| 2.944% 08/09/11 (b) | 850,000 | 803,435 | |||||||||
| JPMorgan Chase & Co. | |||||||||||
| 4.600% 01/17/11 | 750,000 | 745,760 | |||||||||
| Lehman Brothers Holdings, Inc. | |||||||||||
| 2.871% 03/23/09 (b)(j) | 750,000 | 722,879 | |||||||||
| Merrill Lynch & Co., Inc. | |||||||||||
| 4.250% 02/08/10 | 800,000 | 782,197 | |||||||||
| Morgan Stanley | |||||||||||
| 3.035% 01/18/11 (b) | 1,000,000 | 941,022 | |||||||||
| 9,886,442 | |||||||||||
| Insurance (1.6%) | |||||||||||
| Berkshire Hathaway Finance Corp. | |||||||||||
| 3.092% 01/11/11 (b) | 1,500,000 | 1,498,207 | |||||||||
| Savings & Loans (1.9%) | |||||||||||
| Wachovia Mortgage FSB | |||||||||||
| 2.807% 03/02/09 (b) | 1,000,000 | 999,593 | |||||||||
| Washington Mutual Bank | |||||||||||
| 2.874% 11/06/09 (b) | 1,000,000 | 820,209 | |||||||||
| 1,819,802 | |||||||||||
| 16,131,352 | |||||||||||
See Accompanying Notes to Financial Statements.
43
CMG ULTRA SHORT TERM BOND FUND
A Portfolio of Columbia Funds Institutional Trust
SCHEDULE OF INVESTMENTS
| Par | Value | ||||||||||
| Corporate Fixed-Income Bonds & Notes (continued) | |||||||||||
| Industrials (1.0%) | |||||||||||
| Transportation (1.0%) | |||||||||||
| Union Pacific Corp. | |||||||||||
| 3.875% 02/15/09 | $ | 1,000,000 | $ | 998,692 | |||||||
| Information Technology (1.6%) | |||||||||||
| Computers (1.6%) | |||||||||||
| Hewlett-Packard Co. | |||||||||||
| 2.786% 06/15/09 (b) | 1,000,000 | 999,967 | |||||||||
| International Business Machines Corp. | |||||||||||
| 4.375% 06/01/09 | 500,000 | 505,726 | |||||||||
| 1,505,693 | |||||||||||
| Utilities (2.6%) | |||||||||||
| Electric (1.6%) | |||||||||||
| Consolidated Edison Co. of New York, Inc. | |||||||||||
| 4.700% 06/15/09 | 500,000 | 505,068 | |||||||||
| Duke Energy Carolinas LLC | |||||||||||
| 4.500% 04/01/10 | 1,000,000 | 1,011,240 | |||||||||
| 1,516,308 | |||||||||||
| Gas (1.0%) | |||||||||||
| Sempra Energy | |||||||||||
| 4.750% 05/15/09 | 1,000,000 | 1,003,800 | |||||||||
| 2,520,108 | |||||||||||
| Total Corporate Fixed-Income Bonds & Notes (Cost of $30,449,026) | 29,987,361 | ||||||||||
| Asset-Backed Securities (30.4%) | |||||||||||
| Advanta Business Card Master Trust | |||||||||||
| 5.300% 05/21/12 | 1,000,000 | 1,000,354 | |||||||||
| AmeriCredit Automobile Receivables Trust | |||||||||||
| 3.930% 10/06/11 | 357,249 | 345,939 | |||||||||
| 5.190% 11/06/11 | 1,500,000 | 1,489,552 | |||||||||
| 5.210% 10/06/11 | 669,199 | 658,488 | |||||||||
| 5.420% 08/08/11 | 1,554,137 | 1,516,952 | |||||||||
| Bank One Issuance Trust | |||||||||||
| 3.940% 04/16/12 | 2,000,000 | 2,013,054 | |||||||||
| Bay View Auto Trust | |||||||||||
| 4.550% 02/25/14 | 943,520 | 949,964 | |||||||||
| 5.010% 06/25/14 | 300,000 | 302,592 | |||||||||
| Capital One Multi-Asset Execution Trust | |||||||||||
| 4.400% 08/15/11 | 1,000,000 | 1,002,994 | |||||||||
| Capital One Prime Auto Receivables Trust | |||||||||||
| 4.990% 09/15/10 | 256,101 | 257,855 | |||||||||
| Carmax Auto Owner Trust | |||||||||||
| 5.150% 02/15/11 | 1,226,157 | 1,239,044 | |||||||||
See Accompanying Notes to Financial Statements.
44
CMG ULTRA SHORT TERM BOND FUND
A Portfolio of Columbia Funds Institutional Trust
SCHEDULE OF INVESTMENTS
| Par | Value | ||||||||||
| Asset-Backed Securities (continued) | |||||||||||
| Centex Home Equity | |||||||||||
| 6.540% 01/25/32 (b) | $ | 189,463 | $ | 129,293 | |||||||
| Chase Issuance Trust | |||||||||||
| 4.520% 12/15/10 | 1,300,000 | 1,302,571 | |||||||||
| CIT Equipment Collateral | |||||||||||
| 5.070% 02/20/10 | 806,657 | 811,161 | |||||||||
| 5.160% 02/20/13 | 600,000 | 603,867 | |||||||||
| Citibank Credit Card Issuance Trust | |||||||||||
| 4.400% 09/15/10 | 1,500,000 | 1,501,986 | |||||||||
| 5.300% 05/20/11 | 1,000,000 | 1,015,257 | |||||||||
| CNH Equipment Trust | |||||||||||
| 5.200% 06/15/10 | 453,336 | 456,278 | |||||||||
| 5.200% 08/16/10 | 606,935 | 609,925 | |||||||||
| Drive Auto Receivables Trust | |||||||||||
| 5.300% 07/15/11 (c) | 648,642 | 645,947 | |||||||||
| 5.490% 05/15/11 (c) | 319,134 | 319,254 | |||||||||
| Ford Credit Floorplan Master Owner Trust | |||||||||||
| 2.638% 06/15/11 (b) | 700,000 | 685,483 | |||||||||
| Franklin Auto Trust | |||||||||||
| 4.910% 04/20/10 | 4,833 | 4,838 | |||||||||
| GE Equipment Small Ticket LLC | |||||||||||
| 4.880% 10/22/09 (c) | 195,930 | 196,205 | |||||||||
| GMAC Mortgage Corp. Loan Trust | |||||||||||
| 6.310% 05/25/36 | 246,010 | 224,661 | |||||||||
| GS Auto Loan Trust | |||||||||||
| 4.450% 05/17/10 | 150,517 | 151,067 | |||||||||
| Harley-Davidson Motorcycle Trust | |||||||||||
| 5.360% 10/15/10 | 8,747 | 8,756 | |||||||||
| Household Automotive Trust | |||||||||||
| 5.280% 09/17/11 | 1,095,646 | 1,104,598 | |||||||||
| 5.300% 11/17/11 | 1,000,000 | 999,828 | |||||||||
| 5.430% 06/17/11 | 560,688 | 561,365 | |||||||||
| Long Beach Auto Receivables Trust | |||||||||||
| 4.080% 06/15/10 | 26,338 | 26,336 | |||||||||
| 4.972% 10/15/11 | 750,000 | 741,300 | |||||||||
| 5.170% 08/15/11 | 1,139,006 | 1,128,506 | |||||||||
| Nomura Asset Acceptance Corp. | |||||||||||
| 2.601% 01/25/36 (b)(c) | 89,037 | 83,608 | |||||||||
| Onyx Acceptance Grantor Trust | |||||||||||
| 4.180% 03/15/10 | 63,222 | 62,870 | |||||||||
| Ownit Mortgage Loan Asset-Backed Certificates | |||||||||||
| 5.424% 12/25/36 | 102,899 | 102,684 | |||||||||
| Residential Funding Mortgage Securities II, Inc. | |||||||||||
| 2.581% 09/25/35 (b) | 77,118 | 75,034 | |||||||||
| Santander Drive Auto Receivables Trust | |||||||||||
| 5.050% 09/15/11 | 1,000,000 | 984,062 | |||||||||
See Accompanying Notes to Financial Statements.
45
CMG ULTRA SHORT TERM BOND FUND
A Portfolio of Columbia Funds Institutional Trust
SCHEDULE OF INVESTMENTS
| Par | Value | ||||||||||
| Asset-Backed Securities (continued) | |||||||||||
| Triad Auto Receivables Owner Trust | |||||||||||
| 4.220% 06/12/12 | $ | 670,921 | $ | 641,583 | |||||||
| 4.280% 06/14/10 | 138,247 | 137,885 | |||||||||
| 4.770% 01/12/11 | 352,931 | 349,316 | |||||||||
| 5.260% 11/14/11 | 1,204,748 | 1,184,836 | |||||||||
| 5.410% 08/12/11 | 834,254 | 827,125 | |||||||||
| Wachovia Auto Owner Trust | |||||||||||
| 4.790% 04/20/10 | 13,989 | 14,004 | |||||||||
| World Omni Auto Receivables Trust | |||||||||||
| 4.130% 03/15/11 | 925,000 | 924,908 | |||||||||
| Total Asset-Backed Securities (Cost of $29,449,764) | 29,393,185 | ||||||||||
| Government & Agency Obligations (9.7%) | |||||||||||
| Foreign Government Obligations (0.5%) | |||||||||||
| Svensk Exportkredit AB | |||||||||||
| 4.000% 06/15/10 | 500,000 | 506,342 | |||||||||
| U.S. Government Agencies (9.2%) | |||||||||||
| Federal Home Loan Bank | |||||||||||
| 3.500% 07/16/10 (a) | 1,000,000 | 1,005,740 | |||||||||
| 4.375% 10/22/10 (a) | 1,000,000 | 1,022,926 | |||||||||
| 5.800% 09/02/08 | 200,000 | 200,525 | |||||||||
| Federal Home Loan Mortgage Corp. | |||||||||||
| 4.250% 07/15/09 (a) | 1,000,000 | 1,012,394 | |||||||||
| 5.000% 06/11/09 (a) | 1,500,000 | 1,526,751 | |||||||||
| Federal National Mortgage Association | |||||||||||
| 4.250% 05/15/09 (a) | 3,000,000 | 3,032,805 | |||||||||
| 4.750% 12/15/10 | 1,000,000 | 1,032,049 | |||||||||
| 8,833,190 | |||||||||||
| Total Government & Agency Obligations (Cost of $9,353,920) | 9,339,532 | ||||||||||
| Collateralized Mortgage Obligations (7.5%) | |||||||||||
| Agency (2.8%) | |||||||||||
| Federal Home Loan Mortgage Corp. | |||||||||||
| 4.000% 05/15/14 | 37,473 | 37,497 | |||||||||
| 4.000% 07/15/24 | 141,780 | 141,822 | |||||||||
| 4.500% 11/15/16 | 213,528 | 214,803 | |||||||||
| 5.000% 07/15/14 | 167,453 | 167,723 | |||||||||
| 5.000% 11/15/15 | 119,967 | 121,087 | |||||||||
| 5.000% 02/15/16 | 412,170 | 416,271 | |||||||||
| 5.000% 05/15/26 | 217,656 | 219,592 | |||||||||
| 5.500% 02/15/24 | 194,685 | 196,629 | |||||||||
See Accompanying Notes to Financial Statements.
46
CMG ULTRA SHORT TERM BOND FUND
A Portfolio of Columbia Funds Institutional Trust
SCHEDULE OF INVESTMENTS
| Par | Value | ||||||||||
| Collateralized Mortgage Obligations (continued) | |||||||||||
| Agency (continued) | |||||||||||
| Federal National Mortgage Association | |||||||||||
| 4.500% 03/25/13 | $ | 197,847 | $ | 197,942 | |||||||
| 5.000% 01/25/23 | 46,629 | 46,566 | |||||||||
| 5.500% 11/25/26 | 797,883 | 810,346 | |||||||||
| 6.000% 01/25/31 | 129,076 | 129,274 | |||||||||
| 2,699,552 | |||||||||||
| Non-Agency (4.7%) | |||||||||||
| Axon Financial Funding Ltd. | |||||||||||
| 3.391% 04/04/17 (b)(c)(d)(e)(f) | 1,750,000 | 17,500 | |||||||||
| Bear Stearns Alt-A Trust | |||||||||||
| 2.681% 12/25/46 (b) | 786,107 | 239,969 | |||||||||
| Granite Master Issuer PLC | |||||||||||
| 2.949% 12/17/54 (b)(d) | 750,000 | 635,625 | |||||||||
| Indymac Index Mortgage Loan Trust | |||||||||||
| 2.701% 04/25/37 (b) | 294,306 | 78,996 | |||||||||
| JPMorgan Mortgage Trust | |||||||||||
| 5.500% 04/25/36 | 296,320 | 293,422 | |||||||||
| Kildare Securities Ltd. | |||||||||||
| 2.756% 12/10/43 (b)(c) | 949,336 | 923,223 | |||||||||
| Leek Finance PLC | |||||||||||
| 2.911% 12/21/38 (b)(c) | 1,500,000 | 1,320,753 | |||||||||
| Opteum Mortgage Acceptance Corp. | |||||||||||
| 5.470% 12/25/35 (b) | 98,151 | 98,140 | |||||||||
| Residential Mortgage Securities PLC | |||||||||||
| 2.748% 11/14/31 (b)(c) | 204,650 | 203,915 | |||||||||
| Washington Mutual, Inc. | |||||||||||
| 4.833% 10/25/35 (b) | 550,714 | 530,700 | |||||||||
| 6.250% 07/25/36 | 190,980 | 189,869 | |||||||||
| 4,532,112 | |||||||||||
| Total Collateralized Mortgage Obligations (Cost of $9,883,401) | 7,231,664 | ||||||||||
| Mortgage-Backed Securities (2.7%) | |||||||||||
| Federal Home Loan Mortgage Corp. | |||||||||||
| 3.500% 09/01/08 | 717,064 | 716,410 | |||||||||
| 5.060% 02/01/36 (b) | 1,027,677 | 1,032,535 | |||||||||
| Federal National Mortgage Association | |||||||||||
| 4.247% 03/01/34 (b) | 811,155 | 810,707 | |||||||||
| Total Mortgage-Backed Securities (Cost of $2,534,014) | 2,559,652 | ||||||||||
See Accompanying Notes to Financial Statements.
47
CMG ULTRA SHORT TERM BOND FUND
A Portfolio of Columbia Funds Institutional Trust
SCHEDULE OF INVESTMENTS
| Shares | Value | ||||||||||
| Securities Lending Collateral (10.6%) | |||||||||||
| State Street Navigator Securities Lending Prime Portfolio (g) (7 day yield of 2.654%) | 10,256,013 | $ | 10,256,013 | ||||||||
| Total Securities Lending Collateral (Cost of $10,256,013) | 10,256,013 | ||||||||||
| Par | |||||||||||
| Short-Term Obligations (18.4%) | |||||||||||
| Commercial Paper (16.8%) | |||||||||||
| Amstel Funding Corp. | |||||||||||
| 2.750% 08/07/08 | $ | 1,800,000 | 1,799,175 | ||||||||
| Barclays Bank PLC | |||||||||||
| 3.080% 04/21/09 (h) | 1,000,000 | 997,500 | |||||||||
| CAFCO LLC | |||||||||||
| 2.750% 10/16/08 | 850,000 | 844,724 | |||||||||
| 2.690% 09/09/08 | 500,000 | 498,543 | |||||||||
| Cancara Asset Securitisation LLC | |||||||||||
| 2.900% 10/16/08 | 1,000,000 | 993,793 | |||||||||
| Charta Corp. | |||||||||||
| 2.690% 09/10/08 | 500,000 | 498,506 | |||||||||
| Ciesco LLC | |||||||||||
| 2.690% 09/09/08 | 500,000 | 498,543 | |||||||||
| Clipper Receivables Co. LLC | |||||||||||
| 2.750% 08/11/08 | 700,000 | 699,465 | |||||||||
| Eureka Securitization, Inc. | |||||||||||
| 2.570% 08/11/08 | 1,800,000 | 1,798,715 | |||||||||
| Gotham Funding Corp. | |||||||||||
| 2.770% 10/17/08 | 1,000,000 | 993,639 | |||||||||
| Natixis NY | |||||||||||
| 3.050% 10/27/08 | 750,000 | 750,305 | |||||||||
| Royal Bank of Scotland PLC NY | |||||||||||
| 2.650% 08/27/08 | 500,000 | 500,000 | |||||||||
| 2.870% 10/21/08 | 1,000,000 | 993,668 | |||||||||
| Scaldis Capital LLC | |||||||||||
| 2.900% 10/16/08 | 750,000 | 745,329 | |||||||||
| Solitaire Funding LLC | |||||||||||
| 2.900% 09/17/08 | 250,000 | 249,054 | |||||||||
| Thames Asset Global Securitization, Inc. | |||||||||||
| 2.640% 08/28/08 | 500,000 | 499,010 | |||||||||
| 2.900% 09/15/08 | 250,000 | 249,094 | |||||||||
| Unicredito Italiano Bank Ireland | |||||||||||
| 2.950% 10/07/08 | 600,000 | 596,894 | |||||||||
| Variable Funding Capital Corp. | |||||||||||
| 2.570% 08/18/08 | 500,000 | 499,393 | |||||||||
| Viacom, Inc. | |||||||||||
| 2.850% 08/04/08 | 1,500,000 | 1,499,644 | |||||||||
| 16,204,994 | |||||||||||
See Accompanying Notes to Financial Statements.
48
CMG ULTRA SHORT TERM BOND FUND
A Portfolio of Columbia Funds Institutional Trust
SCHEDULE OF INVESTMENTS
| Par | Value | ||||||||||
| U.S. Government Agencies (1.0%) | |||||||||||
| Federal National Mortgage Association | |||||||||||
| 2.146% 08/20/08 (a)(i) | $ | 1,000,000 | $ | 998,878 | |||||||
| U.S. Government Obligations (0.6%) | |||||||||||
| U.S. Treasury Bill | |||||||||||
| 2.061% 12/04/08 (i) | 600,000 | 595,746 | |||||||||
| Total Short-Term Obligations (Cost of $17,802,440) | 17,799,618 | ||||||||||
| Total Investments (110.3%) (Cost of $109,728,578) (k) | 106,567,025 | ||||||||||
| Obligation to Return Collateral for Securities Loaned (-10.6%) | (10,256,013 | ) | |||||||||
| Other Assets & Liabilities, Net (0.3%) | 284,006 | ||||||||||
| Net Assets (100.0%) | $ | 96,595,018 | |||||||||
Notes to Schedule of Investments:
(a) All or a portion of this security was on loan at July 31, 2008. The total market value of securities on loan at July 31, 2008 is $10,068,552.
(b) The interest rate shown on floating rate or variable rate securities reflects the rate at July 31, 2008.
(c) Security exempt from registration pursuant to Rule 144A under the Securities Act of 1933. These securities may be resold in transactions exempt from registration, normally to qualified institutional buyers. At July 31, 2008, these securities, which are not illiquid except for those in the following table, amounted to $4,871,193, which represents 5.0% of net assets.
| Security | Acquisition Date | Par | Cost | Value | |||||||||||||||
| Axon Financial Funding Ltd., 3.391% 04/04/17 | 04/04/07 | $ | 1,750,000 | $ | 1,750,000 | $ | 17,500 | ||||||||||||
(d) Represents fair value as determined in good faith under procedures approved by the Board of Trustees. The value of these securities amounted to $653,125, which represents 0.7% of net assets.
(e) Security issued by a structured investment vehicle.
(f) The issuer is in default of certain debt covenants. Income is not being accrued. At July 31, 2008, the value of these securities amounted to $17,500, which represents less than 0.1% of net assets.
(g) Investment made with cash collateral received from securities lending activity.
(h) The rate shown represents the discount rate at the date of purchase.
(i) The rate shown represents the annualized yield at the date of purchase.
(j) The issuer filed for bankruptcy protection under Chapter 11 on September 15, 2008. As a result of this bankruptcy filing, income is no longer being accrued on this security.
(k) Cost for federal income tax purposes is $109,870,887.
See Accompanying Notes to Financial Statements.
49
CMG ULTRA SHORT TERM BOND FUND
A Portfolio of Columbia Funds Institutional Trust
SCHEDULE OF INVESTMENTS
| At July 31, 2008, the asset allocation of the Fund is as follows: | |||
Asset Allocation (Unaudited) | % of Net Assets | ||||||
| Corporate Fixed-Income Bonds & Notes | 31.0 | ||||||
| Asset-Backed Securities | 30.4 | ||||||
| Government & Agency Obligations | 9.7 | ||||||
| Collateralized Mortgage Obligations | 7.5 | ||||||
| Mortgage-Backed Securities | 2.7 | ||||||
| 81.3 | |||||||
| Securities Lending Collateral | 10.6 | ||||||
| Obligation to Return Collateral for Securities Loaned | (10.6 | ) | |||||
| Short-Term Obligations | 18.4 | ||||||
| Other Assets & Liabilities, Net | 0.3 | ||||||
| 100.0 | |||||||
See Accompanying Notes to Financial Statements.
50
CMG HIGH YIELD FUND
A Portfolio of Columbia Funds Institutional Trust
SCHEDULE OF INVESTMENTS
July 31, 2008
| Par (a) | Value | ||||||||||
| Corporate Fixed-Income Bonds & Notes (90.3%) | |||||||||||
| Basic Materials (9.6%) | |||||||||||
| Chemicals (3.3%) | |||||||||||
| Agricultural Chemicals (1.0%) | |||||||||||
| Mosaic Co. | |||||||||||
| 7.625% 12/01/16 (b) | $ | 315,000 | $ | 330,750 | |||||||
| Terra Capital, Inc. | |||||||||||
| 7.000% 02/01/17 | 135,000 | 133,312 | |||||||||
| 464,062 | |||||||||||
| Chemicals-Diversified (1.6%) | |||||||||||
| Huntsman International LLC | |||||||||||
| 6.875% 11/15/13 (b) | EUR | 165,000 | 223,917 | ||||||||
| 7.875% 11/15/14 | 290,000 | 271,875 | |||||||||
| NOVA Chemicals Corp. | |||||||||||
| 6.500% 01/15/12 | 275,000 | 250,250 | |||||||||
| 746,042 | |||||||||||
| Chemicals-Specialty (0.7%) | |||||||||||
| Chemtura Corp. | |||||||||||
| 6.875% 06/01/16 | 345,000 | 291,525 | |||||||||
| 1,501,629 | |||||||||||
| Forest Products & Paper (1.8%) | |||||||||||
| Paper & Related Products (1.8%) | |||||||||||
| Cascades, Inc. | |||||||||||
| 7.250% 02/15/13 | 250,000 | 212,500 | |||||||||
| Domtar Corp. | |||||||||||
| 7.125% 08/15/15 | 305,000 | 286,700 | |||||||||
| Georgia-Pacific Corp. | |||||||||||
| 8.000% 01/15/24 | 300,000 | 276,000 | |||||||||
| NewPage Corp. | |||||||||||
| 10.000% 05/01/12 | 70,000 | 67,025 | |||||||||
| 842,225 | |||||||||||
| Iron/Steel (1.9%) | |||||||||||
| Steel-Producers (1.9%) | |||||||||||
| Russel Metals, Inc. | |||||||||||
| 6.375% 03/01/14 | 470,000 | 440,625 | |||||||||
| Steel Dynamics, Inc. | |||||||||||
| 7.750% 04/15/16 (b) | 455,000 | 448,175 | |||||||||
| 888,800 | |||||||||||
| Metals & Mining (2.6%) | |||||||||||
| Diversified Minerals (0.9%) | |||||||||||
| FMG Finance Ltd. | |||||||||||
| 10.625% 09/01/16 (b) | 345,000 | 400,200 | |||||||||
| Metal-Diversified (1.7%) | |||||||||||
| Freeport-McMoRan Copper & Gold, Inc. | |||||||||||
| 8.375% 04/01/17 | 730,000 | 764,675 | |||||||||
| 1,164,875 | |||||||||||
| 4,397,529 | |||||||||||
See Accompanying Notes to Financial Statements.
51
CMG HIGH YIELD FUND
A Portfolio of Columbia Funds Institutional Trust
SCHEDULE OF INVESTMENTS
| Par (a) | Value | ||||||||||
| Corporate Fixed-Income Bonds & Notes (continued) | |||||||||||
| Communications (13.2%) | |||||||||||
| Media (7.3%) | |||||||||||
| Broadcast Services/Programs (0.8%) | |||||||||||
| Liberty Media LLC | |||||||||||
| 8.250% 02/01/30 | $ | 425,000 | $ | 376,470 | |||||||
| Cable TV (4.0%) | |||||||||||
| Charter Communications Holdings II LLC/ Charter Communications Holdings II/Capital Corp. | |||||||||||
| 10.250% 09/15/10 | 170,000 | 161,925 | |||||||||
| CSC Holdings, Inc. | |||||||||||
| 7.625% 04/01/11 | 300,000 | 296,625 | |||||||||
| DirecTV Holdings LLC | |||||||||||
| 6.375% 06/15/15 | 710,000 | 669,175 | |||||||||
| EchoStar DBS Corp. | |||||||||||
| 6.625% 10/01/14 | 770,000 | 706,475 | |||||||||
| 1,834,200 | |||||||||||
| Multimedia (1.8%) | |||||||||||
| Lamar Media Corp. | |||||||||||
| 7.250% 01/01/13 | 465,000 | 444,075 | |||||||||
| Quebecor Media, Inc. | |||||||||||
| 7.750% 03/15/16 | 385,000 | 355,162 | |||||||||
| 799,237 | |||||||||||
| Publishing-Periodicals (0.7%) | |||||||||||
| Idearc, Inc. | |||||||||||
| 8.000% 11/15/16 | 245,000 | 111,475 | |||||||||
| RH Donnelley Corp. | |||||||||||
| 8.875% 10/15/17 | 390,000 | 187,200 | |||||||||
| 298,675 | |||||||||||
| 3,308,582 | |||||||||||
| Telecommunication Services (5.9%) | |||||||||||
| Satellite Telecommunications (0.5%) | |||||||||||
| Intelsat Corp. | |||||||||||
| 9.250% 06/15/16 (b) | 225,000 | 221,063 | |||||||||
| Telecommunication Equipment (0.8%) | |||||||||||
| Lucent Technologies, Inc. | |||||||||||
| 6.450% 03/15/29 | 515,000 | 363,075 | |||||||||
| Telecommunication Services (0.5%) | |||||||||||
| Time Warner Telecom Holdings, Inc. | |||||||||||
| 9.250% 02/15/14 | 220,000 | 223,300 | |||||||||
| Telephone-Integrated (4.1%) | |||||||||||
| Citizens Communications Co. | |||||||||||
| 7.875% 01/15/27 | 490,000 | 431,200 | |||||||||
See Accompanying Notes to Financial Statements.
52
CMG HIGH YIELD FUND
A Portfolio of Columbia Funds Institutional Trust
SCHEDULE OF INVESTMENTS
| Par (a) | Value | ||||||||||
| Corporate Fixed-Income Bonds & Notes (continued) | |||||||||||
| Telephone-Integrated (continued) | |||||||||||
| Qwest Communications International, Inc. | |||||||||||
| 7.500% 02/15/14 | $ | 200,000 | $ | 184,500 | |||||||
| Qwest Corp. | |||||||||||
| 7.500% 10/01/14 | 580,000 | 532,150 | |||||||||
| 7.500% 06/15/23 | 100,000 | 82,000 | |||||||||
| Windstream Corp. | |||||||||||
| 7.000% 03/15/19 | 250,000 | 228,750 | |||||||||
| 8.625% 08/01/16 | 440,000 | 445,500 | |||||||||
| 1,904,100 | |||||||||||
| 2,711,538 | |||||||||||
| 6,020,120 | |||||||||||
| Consumer Cyclical (8.8%) | |||||||||||
| Apparel (0.5%) | |||||||||||
| Apparel Manufacturers (0.5%) | |||||||||||
| Levi Strauss & Co. | |||||||||||
| 9.750% 01/15/15 | 245,000 | 230,913 | |||||||||
| Auto Parts & Equipment (1.6%) | |||||||||||
| Auto/Truck Parts & Equipment-Original (0.8%) | |||||||||||
| ArvinMeritor, Inc. | |||||||||||
| 8.125% 09/15/15 | 125,000 | 102,031 | |||||||||
| TRW Automotive, Inc. | |||||||||||
| 7.000% 03/15/14 (b) | 305,000 | 269,163 | |||||||||
| 371,194 | |||||||||||
| Auto/Truck Parts & Equipment-Replacement (0.2%) | |||||||||||
| Commercial Vehicle Group, Inc. | |||||||||||
| 8.000% 07/01/13 | 100,000 | 85,000 | |||||||||
| Rubber-Tires (0.6%) | |||||||||||
| Goodyear Tire & Rubber Co. | |||||||||||
| 8.625% 12/01/11 | 81,000 | 82,013 | |||||||||
| 9.000% 07/01/15 | 175,000 | 176,312 | |||||||||
| 258,325 | |||||||||||
| 714,519 | |||||||||||
| Entertainment (0.9%) | |||||||||||
| Music (0.7%) | |||||||||||
| Steinway Musical Instruments, Inc. | |||||||||||
| 7.000% 03/01/14 (b) | 195,000 | 174,525 | |||||||||
| WMG Acquisition Corp. | |||||||||||
| 7.375% 04/15/14 | 210,000 | 165,900 | |||||||||
| 340,425 | |||||||||||
| Racetracks (0.2%) | |||||||||||
| Speedway Motorsports, Inc. | |||||||||||
| 6.750% 06/01/13 | 72,000 | 68,940 | |||||||||
| 409,365 | |||||||||||
See Accompanying Notes to Financial Statements.
53
CMG HIGH YIELD FUND
A Portfolio of Columbia Funds Institutional Trust
SCHEDULE OF INVESTMENTS
| Par (a) | Value | ||||||||||
| Corporate Fixed-Income Bonds & Notes (continued) | |||||||||||
| Home Builders (0.6%) | |||||||||||
| Building-Residential/Commercial (0.6%) | |||||||||||
| KB Home | |||||||||||
| 5.875% 01/15/15 | $ | 365,000 | $ | 299,300 | |||||||
| Leisure Time (0.6%) | |||||||||||
| Cruise Lines (0.6%) | |||||||||||
| Royal Caribbean Cruises Ltd. | |||||||||||
| 6.875% 12/01/13 | 215,000 | 188,125 | |||||||||
| 7.000% 06/15/13 | 95,000 | 84,312 | |||||||||
| 272,437 | |||||||||||
| Lodging (2.3%) | |||||||||||
| Casino Hotels (1.1%) | |||||||||||
| MGM Mirage | |||||||||||
| 7.500% 06/01/16 | 490,000 | 390,775 | |||||||||
| Pinnacle Entertainment, Inc. | |||||||||||
| 7.500% 06/15/15 | 155,000 | 115,475 | |||||||||
| 506,250 | |||||||||||
| Gambling (Non-Hotel) (1.2%) | |||||||||||
| Mashantucket Western Pequot Tribe | |||||||||||
| 8.500% 11/15/15 (b) | 370,000 | 284,900 | |||||||||
| Seminole Indian Tribe of Florida | |||||||||||
| 7.804% 10/01/20 (b) | 260,000 | 251,332 | |||||||||
| 536,232 | |||||||||||
| 1,042,482 | |||||||||||
| Retail (1.7%) | |||||||||||
| Retail-Apparel/Shoe (0.4%) | |||||||||||
| Phillips-Van Heusen Corp. | |||||||||||
| 7.250% 02/15/11 | 195,000 | 195,000 | |||||||||
| Retail-Automobiles (0.5%) | |||||||||||
| AutoNation, Inc. | |||||||||||
| 7.000% 04/15/14 | 235,000 | 202,394 | |||||||||
| Retail-Propane Distributors (0.8%) | |||||||||||
| AmeriGas Partners LP | |||||||||||
| 7.125% 05/20/16 | 305,000 | 276,787 | |||||||||
| 7.250% 05/20/15 | 90,000 | 83,250 | |||||||||
| 360,037 | |||||||||||
| 757,431 | |||||||||||
| Textiles (0.6%) | |||||||||||
| Textile-Products (0.6%) | |||||||||||
| INVISTA | |||||||||||
| 9.250% 05/01/12 (b) | 295,000 | 297,950 | |||||||||
| 4,024,397 | |||||||||||
See Accompanying Notes to Financial Statements.
54
CMG HIGH YIELD FUND
A Portfolio of Columbia Funds Institutional Trust
SCHEDULE OF INVESTMENTS
| Par (a) | Value | ||||||||||
| Corporate Fixed-Income Bonds & Notes (continued) | |||||||||||
| Consumer Non-Cyclical (10.4%) | |||||||||||
| Agriculture (0.7%) | |||||||||||
| Tobacco (0.7%) | |||||||||||
| Reynolds American, Inc. | |||||||||||
| 7.625% 06/01/16 | $ | 305,000 | $ | 315,186 | |||||||
| Beverages (0.9%) | |||||||||||
| Beverages-Wine/Spirits (0.9%) | |||||||||||
| Constellation Brands, Inc. | |||||||||||
| 8.125% 01/15/12 | 400,000 | 401,000 | |||||||||
| Biotechnology (0.6%) | |||||||||||
| Medical-Biomedical/Gene (0.6%) | |||||||||||
| Bio-Rad Laboratories, Inc. | |||||||||||
| 7.500% 08/15/13 | 295,000 | 294,262 | |||||||||
| Commercial Services (2.0%) | |||||||||||
| Commercial Services (0.5%) | |||||||||||
| Iron Mountain, Inc | |||||||||||
| 8.000% 06/15/20 | 215,000 | 209,088 | |||||||||
| Funeral Services & Related Items (0.6%) | |||||||||||
| Service Corp. International | |||||||||||
| 6.750% 04/01/16 | 100,000 | 92,000 | |||||||||
| 7.375% 10/01/14 | 215,000 | 208,012 | |||||||||
| 300,012 | |||||||||||
| Private Corrections (0.9%) | |||||||||||
| Corrections Corp. of America | |||||||||||
| 6.250% 03/15/13 | 415,000 | 405,662 | |||||||||
| 914,762 | |||||||||||
| Food (1.0%) | |||||||||||
| Food-Dairy Products (0.2%) | |||||||||||
| Dean Foods Co. | |||||||||||
| 7.000% 06/01/16 | 110,000 | 99,550 | |||||||||
| Food-Meat Products (0.4%) | |||||||||||
| Smithfield Foods, Inc. | |||||||||||
| 7.750% 07/01/17 | 205,000 | 175,275 | |||||||||
| Food-Miscellaneous/Diversified (0.4%) | |||||||||||
| Del Monte Corp. | |||||||||||
| 6.750% 02/15/15 | 200,000 | 187,000 | |||||||||
| 461,825 | |||||||||||
See Accompanying Notes to Financial Statements.
55
CMG HIGH YIELD FUND
A Portfolio of Columbia Funds Institutional Trust
SCHEDULE OF INVESTMENTS
| Par (a) | Value | ||||||||||
| Corporate Fixed-Income Bonds & Notes (continued) | |||||||||||
| Healthcare Products (0.6%) | |||||||||||
| Medical Products (0.6%) | |||||||||||
| Biomet, Inc. | |||||||||||
| PIK, | |||||||||||
| 10.375% 10/15/17 | $ | 255,000 | $ | 268,388 | |||||||
| Healthcare Services (2.9%) | |||||||||||
| Medical-Hospitals (2.9%) | |||||||||||
| HCA, Inc. | |||||||||||
| 9.250% 11/15/16 | 270,000 | 278,100 | |||||||||
| PIK, | |||||||||||
| 9.625% 11/15/16 | 1,015,000 | 1,045,450 | |||||||||
| 1,323,550 | |||||||||||
| Household Products/Wares (0.4%) | |||||||||||
| Consumer Products-Miscellaneous (0.4%) | |||||||||||
| American Greetings Corp. | |||||||||||
| 7.375% 06/01/16 | 190,000 | 181,450 | |||||||||
| Pharmaceuticals (1.3%) | |||||||||||
| Medical-Drugs (0.5%) | |||||||||||
| Elan Finance PLC | |||||||||||
| 8.875% 12/01/13 | 225,000 | 219,375 | |||||||||
| Pharmacy Services (0.8%) | |||||||||||
| Omnicare, Inc. | |||||||||||
| 6.750% 12/15/13 | 410,000 | 381,300 | |||||||||
| 600,675 | |||||||||||
| 4,761,098 | |||||||||||
| Energy (14.9%) | |||||||||||
| Coal (2.5%) | |||||||||||
| Coal (2.5%) | |||||||||||
| Arch Western Finance LLC | |||||||||||
| 6.750% 07/01/13 | 475,000 | 473,812 | |||||||||
| Massey Energy Co. | |||||||||||
| 6.875% 12/15/13 | 200,000 | 195,750 | |||||||||
| Peabody Energy Corp. | |||||||||||
| 6.875% 03/15/13 | 455,000 | 459,550 | |||||||||
| 1,129,112 | |||||||||||
| Oil & Gas (8.6%) | |||||||||||
| Oil & Gas Drilling (0.7%) | |||||||||||
| Pride International, Inc. | |||||||||||
| 7.375% 07/15/14 | 335,000 | 337,513 | |||||||||
| Oil Companies-Exploration & Production (7.3%) | |||||||||||
| Chesapeake Energy Corp. | |||||||||||
| 6.375% 06/15/15 | 700,000 | 661,500 | |||||||||
See Accompanying Notes to Financial Statements.
56
CMG HIGH YIELD FUND
A Portfolio of Columbia Funds Institutional Trust
SCHEDULE OF INVESTMENTS
| Par (a) | Value | ||||||||||
| Corporate Fixed-Income Bonds & Notes (continued) | |||||||||||
| Oil Companies-Exploration & Production (continued) | |||||||||||
| Cimarex Energy Co. | |||||||||||
| 7.125% 05/01/17 | $ | 210,000 | $ | 206,850 | |||||||
| Compton Petroleum Corp. | |||||||||||
| 7.625% 12/01/13 | 320,000 | 312,000 | |||||||||
| KCS Energy, Inc. | |||||||||||
| 7.125% 04/01/12 | 225,000 | 216,000 | |||||||||
| Newfield Exploration Co. | |||||||||||
| 6.625% 09/01/14 | 345,000 | 326,025 | |||||||||
| 6.625% 04/15/16 | 95,000 | 88,588 | |||||||||
| OPTI Canada, Inc. | |||||||||||
| 8.250% 12/15/14 | 440,000 | 443,300 | |||||||||
| PetroHawk Energy Corp. | |||||||||||
| 7.875% 06/01/15 (b) | 115,000 | 111,262 | |||||||||
| Pioneer Natural Resources Co. | |||||||||||
| 5.875% 07/15/16 | 225,000 | 201,771 | |||||||||
| Quicksilver Resources, Inc. | |||||||||||
| 7.125% 04/01/16 | 350,000 | 301,875 | |||||||||
| Range Resources Corp. | |||||||||||
| 7.500% 05/15/16 | 155,000 | 151,512 | |||||||||
| Southwestern Energy Co. | |||||||||||
| 7.500% 02/01/18 (b) | 295,000 | 302,375 | |||||||||
| 3,323,058 | |||||||||||
| Oil Refining & Marketing (0.6%) | |||||||||||
| Tesoro Corp. | |||||||||||
| 6.625% 11/01/15 | 295,000 | 259,600 | |||||||||
| 3,920,171 | |||||||||||
| Pipelines (3.8%) | |||||||||||
| Pipelines (3.8%) | |||||||||||
| Atlas Pipeline Partners LP | |||||||||||
| 8.125% 12/15/15 | 255,000 | 249,263 | |||||||||
| Colorado Interstate Gas Co. | |||||||||||
| 6.800% 11/15/15 | 116,000 | 118,442 | |||||||||
| El Paso Corp. | |||||||||||
| 6.875% 06/15/14 | 430,000 | 428,969 | |||||||||
| 7.250% 06/01/18 | 175,000 | 173,250 | |||||||||
| El Paso Performance-Linked Trust | |||||||||||
| 7.750% 07/15/11 (b) | 110,000 | 111,312 | |||||||||
| Kinder Morgan Finance Co. ULC | |||||||||||
| 5.700% 01/05/16 | 325,000 | 299,406 | |||||||||
| MarkWest Energy Partners LP | |||||||||||
| 6.875% 11/01/14 | 415,000 | 386,987 | |||||||||
| 1,767,629 | |||||||||||
| 6,816,912 | |||||||||||
See Accompanying Notes to Financial Statements.
57
CMG HIGH YIELD FUND
A Portfolio of Columbia Funds Institutional Trust
SCHEDULE OF INVESTMENTS
| Par (a) | Value | ||||||||||
| Corporate Fixed-Income Bonds & Notes (continued) | |||||||||||
| Financials (5.1%) | |||||||||||
| Capital Markets (2.0%) | |||||||||||
| Investment Management/Advisor Service (2.0%) | |||||||||||
| Nuveen Investments Bank Debt Term Loan | |||||||||||
| 5.460% 11/13/14 (c)(d) | $ | 453,564 | $ | 418,413 | |||||||
| 5.483% 11/13/14 (c)(d) | 518,359 | 478,186 | |||||||||
| Nuveen Investments Bank Debt Term Loan II | |||||||||||
| 5.463% 11/13/14 (c)(d) | 25,578 | 23,595 | |||||||||
| 920,194 | |||||||||||
| Diversified Financial Services (1.5%) | |||||||||||
| Finance-Auto Loans (0.6%) | |||||||||||
| GMAC LLC | |||||||||||
| 8.000% 11/01/31 | 515,000 | 288,576 | |||||||||
| Finance-Investment Banker/Broker (0.5%) | |||||||||||
| E*Trade Financial Corp. | |||||||||||
| 7.375% 09/15/13 | 245,000 | 207,025 | |||||||||
| Special Purpose Entity (0.4%) | |||||||||||
| Goldman Sachs Capital II | |||||||||||
| 5.793% 12/29/49 (c) | 300,000 | 198,554 | |||||||||
| 694,155 | |||||||||||
| Insurance (0.6%) | |||||||||||
| Property/Casualty Insurance (0.6%) | |||||||||||
| Crum & Forster Holdings Corp. | |||||||||||
| 7.750% 05/01/17 | 290,000 | 267,887 | |||||||||
| Real Estate Investment Trusts (REITs) (1.0%) | |||||||||||
| REITS-Hotels (1.0%) | |||||||||||
| Host Marriott LP | |||||||||||
| 6.375% 03/15/15 | 530,000 | 461,100 | |||||||||
| 2,343,336 | |||||||||||
| Industrials (15.6%) | |||||||||||
| Aerospace & Defense (2.3%) | |||||||||||
| Aerospace/Defense-Equipment (0.9%) | |||||||||||
| BE Aerospace, Inc. | |||||||||||
| 8.500% 07/01/18 | 130,000 | 134,225 | |||||||||
| DRS Technologies, Inc. | |||||||||||
| 6.625% 02/01/16 | 290,000 | 292,900 | |||||||||
| 427,125 | |||||||||||
| Electronics-Military (1.4%) | |||||||||||
| L-3 Communications Corp. | |||||||||||
| 5.875% 01/15/15 | 200,000 | 185,500 | |||||||||
| 6.375% 10/15/15 | 465,000 | 437,100 | |||||||||
| 622,600 | |||||||||||
| 1,049,725 | |||||||||||
See Accompanying Notes to Financial Statements.
58
CMG HIGH YIELD FUND
A Portfolio of Columbia Funds Institutional Trust
SCHEDULE OF INVESTMENTS
| Par (a) | Value | ||||||||||
| Corporate Fixed-Income Bonds & Notes (continued) | |||||||||||
| Electrical Components & Equipment (1.1%) | |||||||||||
| Wire & Cable Products (1.1%) | |||||||||||
| Belden, Inc. | |||||||||||
| 7.000% 03/15/17 | $ | 265,000 | $ | 251,088 | |||||||
| General Cable Corp. | |||||||||||
| 5.166% 04/01/15 (c) | 145,000 | 127,600 | |||||||||
| 7.125% 04/01/17 | 145,000 | 137,025 | |||||||||
| 515,713 | |||||||||||
| Electronics (0.6%) | |||||||||||
| Electronic Components-Miscellaneous (0.6%) | |||||||||||
| Flextronics International Ltd. | |||||||||||
| 6.250% 11/15/14 | 300,000 | 277,500 | |||||||||
| Environmental Control (1.2%) | |||||||||||
| Non-Hazardous Waste Disposal (1.2%) | |||||||||||
| Allied Waste North America, Inc. | |||||||||||
| 7.125% 05/15/16 | 580,000 | 562,600 | |||||||||
| Machinery-Construction & Mining (0.9%) | |||||||||||
| Machinery-Construction & Mining (0.9%) | |||||||||||
| Terex Corp. | |||||||||||
| 8.000% 11/15/17 | 430,000 | 420,325 | |||||||||
| Machinery-Diversified (1.1%) | |||||||||||
| Machinery-General Industry (1.1%) | |||||||||||
| Manitowoc Co., Inc. | |||||||||||
| 7.125% 11/01/13 | 240,000 | 225,000 | |||||||||
| Westinghouse Air Brake Technologies Corp. | |||||||||||
| 6.875% 07/31/13 | 250,000 | 248,125 | |||||||||
| 473,125 | |||||||||||
| Miscellaneous Manufacturing (2.2%) | |||||||||||
| Diversified Manufacturing Operators (1.6%) | |||||||||||
| Bombardier, Inc. | |||||||||||
| 6.300% 05/01/14 (b) | 465,000 | 441,750 | |||||||||
| Koppers Holdings, Inc. | |||||||||||
| (e) 11/15/14 (9.875% 11/15/09) | 75,000 | 67,500 | |||||||||
| Trinity Industries, Inc. | |||||||||||
| 6.500% 03/15/14 | 255,000 | 244,162 | |||||||||
| 753,412 | |||||||||||
| Miscellaneous Manufacturing (0.6%) | |||||||||||
| American Railcar Industries, Inc. | |||||||||||
| 7.500% 03/01/14 | 275,000 | 254,375 | |||||||||
| 1,007,787 | |||||||||||
See Accompanying Notes to Financial Statements.
59
CMG HIGH YIELD FUND
A Portfolio of Columbia Funds Institutional Trust
SCHEDULE OF INVESTMENTS
| Par (a) | Value | ||||||||||
| Corporate Fixed-Income Bonds & Notes (continued) | |||||||||||
| Packaging & Containers (2.7%) | |||||||||||
| Containers-Metal/Glass (2.7%) | |||||||||||
| Crown Americas LLC & Crown Americas Capital Corp. | |||||||||||
| 7.750% 11/15/15 | $ | 370,000 | $ | 382,025 | |||||||
| Owens-Illinois, Inc. | |||||||||||
| 7.500% 05/15/10 | 420,000 | 427,350 | |||||||||
| Silgan Holdings, Inc. | |||||||||||
| 6.750% 11/15/13 | 460,000 | 436,425 | |||||||||
| 1,245,800 | |||||||||||
| Transportation (3.5%) | |||||||||||
| Transportation-Marine (2.1%) | |||||||||||
| Navios Maritime Holdings, Inc. | |||||||||||
| 9.500% 12/15/14 | 200,000 | 195,500 | |||||||||
| Stena AB | |||||||||||
| 7.500% 11/01/13 | 460,000 | 450,800 | |||||||||
| Teekay Corp. | |||||||||||
| 8.875% 07/15/11 | 310,000 | 325,500 | |||||||||
| 971,800 | |||||||||||
| Transportation-Railroad (0.5%) | |||||||||||
| Kansas City Southern de Mexico SA de CV | |||||||||||
| 7.375% 06/01/14 | 220,000 | 211,750 | |||||||||
| Transportation-Services (0.9%) | |||||||||||
| Bristow Group, Inc. | |||||||||||
| 7.500% 09/15/17 | 400,000 | 394,000 | |||||||||
| 1,577,550 | |||||||||||
| 7,130,125 | |||||||||||
| Technology (1.0%) | |||||||||||
| Semiconductors (1.0%) | |||||||||||
| Electronic Components-Miscellaneous (0.4%) | |||||||||||
| NXP BV/NXP Funding LLC | |||||||||||
| 7.875% 10/15/14 | 185,000 | 154,012 | |||||||||
| Electronic Components-Semiconductors (0.6%) | |||||||||||
| Freescale Semiconductor, Inc. | |||||||||||
| PIK, | |||||||||||
| 9.125% 12/15/14 | 355,000 | 287,550 | |||||||||
| 441,562 | |||||||||||
| Utilities (11.7%) | |||||||||||
| Electric (11.7%) | |||||||||||
| Electric-Generation (4.6%) | |||||||||||
| AES Corp. | |||||||||||
| 7.750% 03/01/14 | 405,000 | 401,963 | |||||||||
| 8.000% 10/15/17 | 265,000 | 261,025 | |||||||||
| Edison Mission Energy | |||||||||||
| 7.000% 05/15/17 | 935,000 | 883,575 | |||||||||
See Accompanying Notes to Financial Statements.
60
CMG HIGH YIELD FUND
A Portfolio of Columbia Funds Institutional Trust
SCHEDULE OF INVESTMENTS
| Par (a) | Value | ||||||||||
| Corporate Fixed-Income Bonds & Notes (continued) | |||||||||||
| Electric-Generation (continued) | |||||||||||
| Intergen NV | |||||||||||
| 9.000% 06/30/17 (b) | $ | 525,000 | $ | 535,500 | |||||||
| 2,082,063 | |||||||||||
| Electric-Integrated (3.0%) | |||||||||||
| CMS Energy Corp. | |||||||||||
| 6.875% 12/15/15 | 185,000 | 183,341 | |||||||||
| Ipalco Enterprises, Inc. | |||||||||||
| 7.250% 04/01/16 (b) | 240,000 | 240,600 | |||||||||
| TXU Energy Co. LLC | |||||||||||
| 5.961% 10/10/14 (c)(d) | 120,714 | 113,428 | |||||||||
| 6.234% 10/10/14 (c)(d) | 731,429 | 687,282 | |||||||||
| 6.478% 10/10/14 (c)(d) | 140,357 | 131,886 | |||||||||
| 1,356,537 | |||||||||||
| Independent Power Producer (4.1%) | |||||||||||
| Dynegy Holdings, Inc. | |||||||||||
| 7.125% 05/15/18 | 330,000 | 289,575 | |||||||||
| 7.750% 06/01/19 | 135,000 | 124,200 | |||||||||
| Mirant North America LLC | |||||||||||
| 7.375% 12/31/13 | 490,000 | 490,000 | |||||||||
| NRG Energy, Inc. | |||||||||||
| 7.250% 02/01/14 | 85,000 | 82,875 | |||||||||
| 7.375% 02/01/16 | 380,000 | 368,600 | |||||||||
| 7.375% 01/15/17 | 45,000 | 43,425 | |||||||||
| NSG Holdings LLC/NSG Holdings, Inc. | |||||||||||
| 7.750% 12/15/25 (b) | 415,000 | 406,770 | |||||||||
| Reliant Energy, Inc. | |||||||||||
| 7.875% 06/15/17 | 85,000 | 82,025 | |||||||||
| 1,887,400 | |||||||||||
| 5,326,000 | |||||||||||
| Total Corporate Fixed-Income Bonds & Notes (Cost of $44,227,308) | 41,261,079 | ||||||||||
| Municipal Bond (0.5%) | |||||||||||
| Virginia (0.5%) | |||||||||||
| Tobacco (0.5%) | |||||||||||
| VA Tobacco Settlement Financing Corp. | |||||||||||
| Series 2007 A1, | |||||||||||
| 6.706% 06/01/46 | 275,000 | 221,622 | |||||||||
| Total Municipal Bond (Cost of $274,973) | 221,622 | ||||||||||
See Accompanying Notes to Financial Statements.
61
CMG HIGH YIELD FUND
A Portfolio of Columbia Funds Institutional Trust
SCHEDULE OF INVESTMENTS
| Par (a) | Value | ||||||||||
| Short-Term Obligation (7.9%) | |||||||||||
| Repurchase agreement with Fixed Income Clearing Corp., dated 07/31/08, due 08/01/08 at 2.070%, collateralized by a U.S. Government Agency Obligation maturing 05/06/10, market value $3,717,540 (repurchase proceeds $3,640,209) | $ | 3,640,000 | $ | 3,640,000 | |||||||
| Total Short-Term Obligation (Cost of $3,640,000) | 3,640,000 | ||||||||||
| Total Investments (98.7%) (Cost of $48,142,281) (f) | 45,122,701 | ||||||||||
| Other Assets & Liabilities, Net (1.3%) | 574,615 | ||||||||||
| Net Assets (100.0%) | $ | 45,697,316 | |||||||||
Notes to Schedule of Investments:
(a) Principal amount is stated in U.S. dollars unless otherwise noted.
(b) Security exempt from registration pursuant to Rule 144A under the Securities Act of 1933. These securities may be resold in transactions exempt from registration, normally to qualified institutional buyers. At July 31, 2008, these securities, which are not illiquid, except for those in the following table, amounted to $5,051,544, which represents 11.1% of net assets.
| Security | Acquisition Date | Par | Cost | Value | |||||||||||||||
| Seminole Indian Tribe of Florida 7.804% 10/01/20 | 09/26/07 | $ | 260,000 | $ | 263,643 | $ | 251,332 | ||||||||||||
(c) The interest rate shown on floating rate or variable rate securities reflects the rate at July 31, 2008.
(d) Loan participation agreement.
(e) Step bond. This security is currently not paying coupon. Shown parenthetically is the next coupon rate to be paid and the date the security will begin accruing at this rate.
(f) Cost for federal income tax purposes is $48,332,319.
At July 31, 2008, the asset allocation of the Fund was as follows:
Asset Allocation (Unaudited) | % of Net Assets | ||||||
| Industrials | 15.6 | ||||||
| Energy | 14.9 | ||||||
| Communications | 13.2 | ||||||
| Utilities | 11.7 | ||||||
| Consumer Non-Cyclical | 10.4 | ||||||
| Basic Materials | 9.6 | ||||||
| Consumer Cyclical | 8.8 | ||||||
| Financials | 5.1 | ||||||
| Technology | 1.0 | ||||||
| Municipal Bond | 0.5 | ||||||
| 90.8 | |||||||
| Short-Term Obligation | 7.9 | ||||||
| Other Assets & Liabilities, Net | 1.3 | ||||||
| 100.0 | |||||||
See Accompanying Notes to Financial Statements.
62
CMG HIGH YIELD FUND
A Portfolio of Columbia Funds Institutional Trust
SCHEDULE OF INVESTMENTS
Forward foreign currency exchange contract outstanding on July 31, 2008 is:
| Foreign Currency Contract to Sell | Value | Aggregate Face Value | Settlement Date | Unrealized Appreciation | |||||||||||||||
| EUR | $ | 219,618 | $ | 220,390 | 08/28/08 | $ | 772 | ||||||||||||
| Acronym | Name | ||||||
| EUR | Euro | ||||||
| PIK | Payment-In-Kind | ||||||
See Accompanying Notes to Financial Statements.
63
STATEMENTS OF ASSETS AND LIABILITIES
July 31, 2008
| CMG Core Bond Fund | CMG Short Term Bond Fund | CMG Ultra Short Term Bond Fund | CMG High Yield Fund | ||||||||||||||||
| ASSETS: | |||||||||||||||||||
| Unaffiliated investments, at identified cost (including repurchase agreements) | $ | 99,655,794 | $ | 215,751,946 | $ | 109,728,578 | $ | 48,142,281 | |||||||||||
| Affiliated investment, at identified cost | - | 589,559 | - | - | |||||||||||||||
| Total investments, at identified cost | 99,655,794 | 216,341,505 | 109,728,578 | 48,142,281 | |||||||||||||||
| Unaffiliated investments, at value (including securities on loan of $10,809,928, $6,214,200, $10,068,552 and $-, respectively) | $ | 98,307,826 | $ | 214,367,397 | $ | 106,567,025 | $ | 45,122,701 | |||||||||||
| Affiliated investment, at value | - | 583,174 | - | - | |||||||||||||||
| Total investments, at value | 98,307,826 | 214,950,571 | 106,567,025 | 45,122,701 | |||||||||||||||
| Cash | 326 | 1,042 | - | 2,776 | |||||||||||||||
| Unrealized appreciation on foreign forward currency contracts | - | - | - | 772 | |||||||||||||||
| Receivable for: | |||||||||||||||||||
| Investments sold | 478,381 | - | 1,099,093 | 203,427 | |||||||||||||||
| Investments sold on a delayed delivery basis | 1,732,981 | - | - | - | |||||||||||||||
| Capital stock sold | - | 844,029 | - | - | |||||||||||||||
| Interest | 643,047 | 1,464,249 | 552,482 | 778,069 | |||||||||||||||
| Securities lending | 5,695 | 3,273 | 4,201 | - | |||||||||||||||
| Foreign tax reclaim | - | 2,032 | 945 | - | |||||||||||||||
| Expense reimbursement due from investment advisor | 7,956 | 9,799 | 11,828 | 7,347 | |||||||||||||||
| Trustees' deferred compensation plan | 11,195 | 13,579 | 11,320 | 17,158 | |||||||||||||||
| Total Assets | 101,187,407 | 217,288,574 | 108,246,894 | 46,132,250 | |||||||||||||||
| LIABILITIES: | |||||||||||||||||||
| Collateral on securities loaned | 11,032,313 | 6,312,979 | 10,256,013 | - | |||||||||||||||
| Payable to custodian bank | - | - | 1,019,261 | - | |||||||||||||||
| Payable for: | |||||||||||||||||||
| Investments purchased | 415,937 | 2,433,428 | - | 221,252 | |||||||||||||||
| Investments purchased on a delayed delivery basis | 1,288,959 | 2,122,553 | - | - | |||||||||||||||
| Capital stock redeemed | - | 10,000 | - | - | |||||||||||||||
| Distributions | 250,034 | 763,400 | 299,113 | 134,258 | |||||||||||||||
| Investment advisory fee | 19,913 | 44,039 | 19,498 | 15,403 | |||||||||||||||
| Trustees' fees | 1,651 | 1,925 | 2,314 | 2,954 | |||||||||||||||
| Audit fee | 38,161 | 37,084 | 36,362 | 41,610 | |||||||||||||||
| Interest expense | 219 | - | - | - | |||||||||||||||
| Trustees' deferred compensation plan | 11,195 | 13,579 | 11,320 | 17,158 | |||||||||||||||
| Other liabilities | 4,739 | 6,132 | 7,995 | 2,299 | |||||||||||||||
| Total liabilities | 13,063,121 | 11,745,119 | 11,651,876 | 434,934 | |||||||||||||||
| NET ASSETS | $ | 88,124,286 | $ | 205,543,455 | $ | 96,595,018 | $ | 45,697,316 | |||||||||||
| NET ASSETS CONSIST OF: | |||||||||||||||||||
| Paid-in capital | $ | 92,718,407 | $ | 212,283,114 | $ | 103,478,844 | $ | 65,463,300 | |||||||||||
| Overdistributed net investment income | (15,938 | ) | (277,393 | ) | (70,674 | ) | (138,303 | ) | |||||||||||
| Accumulated net realized loss | (3,230,215 | ) | (5,071,332 | ) | (3,651,599 | ) | (16,608,858 | ) | |||||||||||
| Net unrealized appreciation (depreciation) on: | |||||||||||||||||||
| Investments | (1,347,968 | ) | (1,390,934 | ) | (3,161,553 | ) | (3,019,580 | ) | |||||||||||
| Foreign currency translations | - | - | - | 757 | |||||||||||||||
| NET ASSETS | $ | 88,124,286 | $ | 205,543,455 | $ | 96,595,018 | $ | 45,697,316 | |||||||||||
| Shares of capital stock outstanding | 8,922,994 | 17,880,575 | 10,395,762 | 6,382,053 | |||||||||||||||
| Net asset value, offering and redemption price per share | $ | 9.88 | $ | 11.50 | $ | 9.29 | $ | 7.16 | |||||||||||
See Accompanying Notes to Financial Statements.
64
STATEMENTS OF OPERATIONS
For the Year Ended July 31, 2008
| CMG Core Bond Fund | CMG Short Term Bond Fund | CMG Ultra Short Term Bond Fund | CMG High Yield Fund | ||||||||||||||||
| NET INVESTMENT INCOME: | |||||||||||||||||||
| Investment income: | |||||||||||||||||||
| Interest | $ | 4,580,636 | $ | 8,513,358 | $ | 5,828,462 | $ | 3,951,910 | |||||||||||
| Interest from affiliate | - | 24,750 | - | - | |||||||||||||||
| Securities lending | 110,577 | 58,228 | 57,368 | - | |||||||||||||||
| Foreign withholding tax | - | - | (2,539 | ) | - | ||||||||||||||
| Total investment income | 4,691,213 | 8,596,336 | 5,883,291 | 3,951,910 | |||||||||||||||
| Expenses: | |||||||||||||||||||
| Investment advisory fee | 220,112 | 419,068 | 304,921 | 213,146 | |||||||||||||||
| Trustees' fees | 14,884 | 16,998 | 17,066 | 17,218 | |||||||||||||||
| Audit fee | 46,231 | 46,316 | 51,470 | 47,500 | |||||||||||||||
| Other expenses | 13,303 | 19,160 | 20,036 | 9,931 | |||||||||||||||
| Expenses before interest expense | 294,530 | 501,542 | 393,493 | 287,795 | |||||||||||||||
| Interest expense | 764 | - | - | 1,125 | |||||||||||||||
| Total expenses | 295,294 | 501,542 | 393,493 | 288,920 | |||||||||||||||
| Fees and expenses waived or reimbursed by investment advisor | (74,418 | ) | (82,474 | ) | (88,572 | ) | (74,649 | ) | |||||||||||
| Net expenses | 220,876 | 419,068 | 304,921 | 214,271 | |||||||||||||||
| Net investment income | 4,470,337 | 8,177,268 | 5,578,370 | 3,737,639 | |||||||||||||||
| NET REALIZED AND UNREALIZED GAIN (LOSS) ON INVESTMENTS, FOREIGN CURRENCY AND FUTURES CONTRACTS: | |||||||||||||||||||
| Net realized gain (loss) on: | |||||||||||||||||||
| Investments | (998,360 | ) | (138,271 | ) | (1,876,094 | ) | (2,383,454 | ) | |||||||||||
| Foreign currency transactions | - | - | - | (27,127 | ) | ||||||||||||||
| Futures contracts | - | 176,662 | - | - | |||||||||||||||
| Net realized gain (loss) | (998,360 | ) | 38,391 | (1,876,094 | ) | (2,410,581 | ) | ||||||||||||
| Net change in unrealized appreciation (depreciation) on: | |||||||||||||||||||
| Investments | (458,717 | ) | (1,041,658 | ) | (2,191,777 | ) | 264,596 | ||||||||||||
| Foreign currency translations | - | - | - | (1,069 | ) | ||||||||||||||
| Futures contracts | - | 11,254 | - | - | |||||||||||||||
| Net change in unrealized appreciation (depreciation) | (458,717 | ) | (1,030,404 | ) | (2,191,777 | ) | 263,527 | ||||||||||||
| Net loss | (1,457,077 | ) | (992,013 | ) | (4,067,871 | ) | (2,147,054 | ) | |||||||||||
| NET INCREASE RESULTING FROM OPERATIONS | $ | 3,013,260 | $ | 7,185,255 | $ | 1,510,499 | $ | 1,590,585 | |||||||||||
See Accompanying Notes to Financial Statements.
65
STATEMENTS OF CHANGES IN NET ASSETS
| CMG Core Bond Fund | CMG Short Term Bond Fund | ||||||||||||||||||
| Year Ended July 31, | Year Ended July 31, | ||||||||||||||||||
| 2008 | 2007 | 2008 | 2007 | ||||||||||||||||
| Operations: | |||||||||||||||||||
| Net investment income | $ | 4,470,337 | $ | 2,834,176 | $ | 8,177,268 | $ | 4,821,539 | |||||||||||
| Net realized gain (loss) on investments and futures contracts | (998,360 | ) | (370,838 | ) | 38,391 | (190,355 | ) | ||||||||||||
| Net change in unrealized appreciation (depreciation) on investments and futures contracts | (458,717 | ) | 199,022 | (1,030,404 | ) | 414,582 | |||||||||||||
| Net increase resulting from operations | 3,013,260 | 2,662,360 | 7,185,255 | 5,045,766 | |||||||||||||||
| Distributions to shareholders: | |||||||||||||||||||
| From net investment income | (4,651,794 | ) | (2,884,251 | ) | (8,705,705 | ) | (5,163,909 | ) | |||||||||||
| Share transactions: | |||||||||||||||||||
| Subscriptions | 40,729,229 | 22,467,688 | 127,068,209 | 84,402,331 | |||||||||||||||
| Distributions reinvested | 1,588,459 | 1,175,961 | 1,341,771 | 2,006,462 | |||||||||||||||
| Redemptions | (20,228,185 | ) | (11,929,545 | ) | (59,777,866 | ) | (31,843,019 | ) | |||||||||||
| Net increase from share transactions | 22,089,503 | 11,714,104 | 68,632,114 | 54,565,774 | |||||||||||||||
| Total increase in net assets | 20,450,969 | 11,492,213 | 67,111,664 | 54,447,631 | |||||||||||||||
| NET ASSETS: | |||||||||||||||||||
| Beginning of period | 67,673,317 | 56,181,104 | 138,431,791 | 83,984,160 | |||||||||||||||
| End of period | $ | 88,124,286 | $ | 67,673,317 | $ | 205,543,455 | $ | 138,431,791 | |||||||||||
| Undistributed (overdistributed) net investment income, at end of period | $ | (15,938 | ) | $ | 19,688 | $ | (277,393 | ) | $ | (65,836 | ) | ||||||||
| Changes in shares: | |||||||||||||||||||
| Subscriptions | 4,024,573 | 2,216,484 | 10,954,738 | 7,273,049 | |||||||||||||||
| Issued for distributions reinvested | 156,722 | 115,624 | 115,417 | 172,759 | |||||||||||||||
| Redemptions | (2,008,322 | ) | (1,172,762 | ) | (5,139,763 | ) | (2,741,444 | ) | |||||||||||
| Net increase | 2,172,973 | 1,159,346 | 5,930,392 | 4,704,364 | |||||||||||||||
See Accompanying Notes to Financial Statements.
66
STATEMENTS OF CHANGES IN NET ASSETS
| CMG Ultra Short Term Bond Fund | CMG High Yield Fund | ||||||||||||||||||
| Year Ended July 31, | Year Ended July 31, | ||||||||||||||||||
| 2008 | 2007 | 2008 | 2007 | ||||||||||||||||
| Operations: | |||||||||||||||||||
| Net investment income | $ | 5,578,370 | $ | 5,601,789 | $ | 3,737,639 | $ | 5,624,962 | |||||||||||
| Net realized loss on investments and foreign currency transactions | (1,876,094 | ) | (105,723 | ) | (2,410,581 | ) | (699,567 | ) | |||||||||||
| Net change in unrealized appreciation (depreciation) on investments and foreign currency translations | (2,191,777 | ) | (495,504 | ) | 263,527 | 427,881 | |||||||||||||
| Net increase resulting from operations | 1,510,499 | 5,000,562 | 1,590,585 | 5,353,276 | |||||||||||||||
| Distributions to shareholders: | |||||||||||||||||||
| From net investment income | (5,705,300 | ) | (5,585,102 | ) | (3,778,512 | ) | (5,912,719 | ) | |||||||||||
| Share transactions: | |||||||||||||||||||
| Subscriptions | 40,228,402 | 83,925,690 | 12,887,905 | 25,687,068 | |||||||||||||||
| Distributions reinvested | 835,828 | 1,714,428 | 1,950,122 | 3,327,328 | |||||||||||||||
| Redemptions | (93,067,069 | ) | (22,126,272 | ) | (29,125,959 | ) | (62,401,951 | ) | |||||||||||
| Net increase (decrease) from share transactions | (52,002,839 | ) | 63,513,846 | (14,287,932 | ) | (33,387,555 | ) | ||||||||||||
| Total increase (decrease) in net assets | (56,197,640 | ) | 62,929,306 | (16,475,859 | ) | (33,946,998 | ) | ||||||||||||
| NET ASSETS: | |||||||||||||||||||
| Beginning of period | 152,792,658 | 89,863,352 | 62,173,175 | 96,120,173 | |||||||||||||||
| End of period | $ | 96,595,018 | $ | 152,792,658 | $ | 45,697,316 | $ | 62,173,175 | |||||||||||
| Overdistributed net investment income, at end of period | $ | (70,674 | ) | $ | (102,958 | ) | $ | (138,303 | ) | $ | (334,330 | ) | |||||||
| Changes in shares: | |||||||||||||||||||
| Subscriptions | 4,274,964 | 8,701,439 | 1,692,130 | 3,272,380 | |||||||||||||||
| Distributions reinvested | 88,630 | 177,745 | 261,129 | 425,081 | |||||||||||||||
| Redemptions | (9,893,831 | ) | (2,294,253 | ) | (3,886,936 | ) | (7,930,977 | ) | |||||||||||
| Net increase (decrease) | (5,530,237 | ) | 6,584,931 | (1,933,677 | ) | (4,233,516 | ) | ||||||||||||
See Accompanying Notes to Financial Statements.
67
NOTES TO FINANCIAL STATEMENTS
July 31, 2008
Note 1. Organization
Columbia Funds Institutional Trust (the "Trust") is a Massachusetts business trust registered under the Investment Company Act of 1940, as amended, as an open-end management investment company. Information presented in these financial statements pertains only to the following diversified funds (individually referred to as a "Fund", collectively referred to as the "Funds"):
CMG Core Bond Fund
CMG Short Term Bond Fund
CMG Ultra Short Term Bond Fund
CMG High Yield Fund
Shares in the Funds are available for purchase by institutional investors investing directly in the Funds, by institutional investors investing in the Funds as an advisory client of Columbia Management Advisors, LLC ("Columbia"), the Funds' investment advisor, and by institutional investors investing in the Funds as an advisory client of U.S. Trust, Bank of America Private Wealth Management. Please see the Funds' prospectuses for further details including applicable investment minimums.
Investment objectives. CMG Core Bond Fund seeks to provide investors a high level of current income consistent with capital preservation. CMG Short Term Bond Fund seeks to provide investors a high level of current income consistent with a high degree of stability of principal. CMG Ultra Short Term Bond Fund seeks a high level of current income consistent with the maintenance of liquidity and the preservation of capital. CMG High Yield Fund seeks a high level of current income. Capital appreciation is a secondary objective when consistent with a high level of current income.
Fund shares. The Trust may issue an unlimited number of shares of beneficial interest which are offered continuously at net asset value.
Note 2. Significant accounting policies
The preparation of financial statements in accordance with accounting principles generally accepted in the United States of America ("GAAP") requires management to make certain estimates and assumptions that affect the reported amounts of assets and liabilities, the disclosure of contingent assets and liabilities at the date of the financial statements and the reported amounts of revenue and expenses during the reporting period. Actual results could differ from those estimates. The following is a summary of significant accounting policies consistently followed by the Funds in the preparation of their financial statements.
Security valuation. Debt securities generally are valued by pricing services approved by the Trust's Board of Trustees, based upon market transactions for normal, institutional-size trading units of similar securities. The services may use various pricing techniques which take into account appropriate factors such as yield, quality, coupon rate, maturity, type of issue, trading characteristics and other data, as well as broker quotes. Debt securities for which quotations are readily available are valued at an over-the-counter or exchange bid quotation. Certain debt securities, which tend to be more thinly traded and of lesser quality, are priced based on fundamental analysis of the financial condition of the issuer and the estimated value of any collateral. Valuations developed through pricing techniques may vary from the actual amounts realized upon sale of the securities, and the potential variation may be greater for those securities valued using fundamental analysis.
68
NOTES TO FINANCIAL STATEMENTS (continued)
July 31, 2008
Short-term debt obligations maturing within 60 days are valued at amortized cost, which approximates market value.
Futures contracts are valued at the settlement price established each day by the board of trade or exchange on which they are traded.
Forward foreign currency exchange contracts are valued at the prevailing forward exchange rate of the underlying currencies.
Foreign securities are generally valued at the last sale price on the foreign exchange or market on which they trade. If any foreign share prices are not readily available as a result of limited share activity, the securities are valued at the last sale price of the local shares in the principal market in which such securities are normally traded.
Generally, trading in foreign securities is substantially completed each day at various times prior to the close of the New York Stock Exchange ("NYSE"). The values of such securities used in computing the net asset value of the Funds' shares are determined as of such times. Foreign currency exchange rates are generally determined at 4:00 p.m. Eastern (U.S.) time. Occasionally, events affecting the values of such foreign securities and such exchange rates may occur between the times at which they are determined and the close of the customary trading session of the NYSE, which would not be reflected in the computation of the Funds' net asset value. If events materially affecting the values of such foreign securities occur and it is determined that market quotations are not reliable, then these foreign securities will be valued at their f air value using procedures approved by the Board of Trustees.
Investments for which market quotations are not readily available, or that have quotations which management believes are not reliable, are valued at fair value as determined in good faith under consistently applied procedures established by and under the general supervision of the Board of Trustees. If a security is valued at fair value, such value is likely to be different from the last quoted market price for the security.
In September 2006, Statement of Financial Accounting Standards No. 157, Fair Value Measurements ("SFAS 157"), was issued. SFAS 157 is effective for fiscal years beginning after November 15, 2007. SFAS 157 defines fair value, establishes a framework for measuring fair value and expands disclosures about fair value measurements. Management is evaluating the impact the application of SFAS 157 will have on each Fund's financial statement disclosures.
Security transactions. Security transactions are accounted for on the trade date. Cost is determined and gains (losses) are based upon the specific identification method for both financial statement and federal income tax purposes.
In March 2008, Statement of Financial Accounting Standards No. 161, Disclosures about Derivative Instruments and Hedging Activities–an amendment of FASB Statement No. 133 ("SFAS 161"), was issued. SFAS 161 is effective for fiscal years beginning after November 15, 2008. SFAS 161 requires additional discussion about the reporting entity's derivative instruments and hedging activities, by providing for qualitative disclosures about the objectives and strategies for using derivatives, quantitative data about the fair value of and gains and losses on derivative contracts, and details of credit-risk-related contingent features in their hedged positions. Management is evaluating the impact the application of SFAS 161 will have on the Funds' financial statement disclosures.
Futures contracts. The Funds may invest in futures contracts for both hedging and non-hedging purposes, including, for example, to seek to enhance returns or as a substitute for a position in an underlying asset.
The use of futures contracts involves certain risks, which include: (1) imperfect correlation between the price movement of the instruments and the underlying securities, (2) inability to close out positions due to differing trading
69
NOTES TO FINANCIAL STATEMENTS (continued)
July 31, 2008
hours, or the temporary absence of a liquid market, for either the instruments or the underlying securities, or (3) an inaccurate prediction by Columbia of the future direction of interest rates. Any of these risks may involve amounts exceeding the variation margin recorded in the Funds' Statements of Assets and Liabilities at any given time.
Upon entering into a futures contract, a Fund pledges cash or securities with the broker in an amount sufficient to meet the initial margin requirement. Subsequent payments are made or received by a Fund equal to the daily change in the contract value and are recorded as variation margin receivable or payable and offset in unrealized gains or losses. A Fund recognizes a realized gain or loss when the contract is closed or expires.
Forward foreign currency exchange contracts. Forward foreign currency exchange contracts are agreements to exchange one currency for another at a future date at a specified price. These contracts are used to minimize the exposure to foreign exchange rate fluctuations during the period between trade and settlement date of the contract. Certain Funds may utilize forward foreign currency exchange contracts in connection with the settlement of purchases and sales of securities. Certain Funds may also enter into these contracts to hedge certain other foreign currency denominated assets. Contracts to buy generally are used to acquire exposure to foreign currencies, while contracts to sell are generally used to hedge the Funds' investments against currency fluctuations. Forward foreign currency exchange contracts are valued daily at the current exchange rate of the underlying currency, resulting in unrealized gains (losses) which become realized at the time the forward foreign currency exchange contracts are closed or mature. Realized and unrealized gains (losses) arising from such transactions are included in net realized and unrealized gains (losses) on foreign currency transactions. The use of forward foreign currency exchange contracts does not eliminate fluctuations in the prices of the Funds' portfolio securities. While the maximum potential loss from such contracts is the aggregate face value in U.S. dollars at the time the contract was opened, exposure is typically limited to the change in value of the contract (in U.S. dollars) over the period it remains open. The Funds could also be exposed to risk that counterparties of the contracts may be unable to fulfill the terms of the contracts.
Repurchase agreements. Each Fund may engage in repurchase agreement transactions with institutions that Columbia has determined are creditworthy. Each Fund, through its custodian, receives delivery of the underlying securities collateralizing a repurchase agreement. Columbia is responsible for determining that the collateral is at least equal, at all times, to the value of the repurchase obligation including interest. A repurchase agreement transaction involves certain risks in the event of default or insolvency of the counterparty. These risks include possible delays in or restrictions on each Fund's ability to dispose of the underlying securities and a possible decline in the value of the underlying securities during the period while the Funds seek to assert their rights.
Loan participations and commitments. CMG High Yield Fund may invest in loan participations. When the CMG High Yield Fund purchases a loan participation, the CMG High Yield Fund typically enters into a contractual relationship with the lender or third party selling such participation ("Selling Participant"), but not the borrower. However, the CMG High Yield Fund assumes the credit risk of the borrower, Selling Participant and any other persons interpositioned between the CMG High Yield Fund and the borrower. The CMG High Yield Fund may not directly benefit from the collateral supporting the senior loan which it has purchased from the Selling Participant.
Mortgage dollar roll transactions. The Funds may enter into mortgage "dollar rolls" in which the Funds sell securities for delivery in the current month and simultaneously contract with the same counterparty to repurchase similar (same type, coupon and maturity) but not identical securities on a specified future date not exceeding 120 days. During the roll period, the Funds lose the right to receive principal and interest paid on the securities sold. However, the Funds would benefit to the extent of any difference between the price received for the securities sold and the lower forward price for the future purchase (often referred to as the "drop") or fee income plus the interest earned on the cash proceeds of the securities sold until the settlement date of the forward purchase. Unless such benefits exceed the
70
NOTES TO FINANCIAL STATEMENTS (continued)
July 31, 2008
income, capital appreciation and gain or loss due to mortgage prepayments that would have been realized on the securities sold as part of the mortgage dollar roll, the use of this technique will diminish the investment performance of the Funds compared with what such performance would have been without the use of mortgage dollar rolls. All cash proceeds will be invested in instruments that are permissible investments for the Funds. The Funds will hold and maintain in a segregated account until the settlement date, cash or liquid securities in an amount equal to the forward purchase price.
The Funds' policy is to record the components of mortgage dollar rolls using "to be announced" mortgage-backed securities. For financial reporting and tax purposes, the Funds treat mortgage dollar rolls as two separate transactions, one involving the purchase of a security and a separate transaction involving a sale. The Funds do not currently enter into mortgage dollar rolls that are accounted for as financing transactions.
Mortgage dollar rolls involve certain risks. If the broker-dealer to whom the Funds sell the securities becomes insolvent, the Funds' right to purchase or repurchase the mortgage-related securities may be restricted and the instruments which the Funds are required to repurchase may be worth less than the instruments which the Funds originally held. Successful use of mortgage dollar rolls may depend upon the investment advisor's ability to predict correctly interest rates and mortgage prepayments. For these reasons, there is no assurance that mortgage dollar rolls can be successfully employed.
Delayed delivery securities. Each Fund may trade securities on other than normal settlement terms, including securities purchased or sold on a "when-issued" basis. This may increase the risk if the other party to the transaction fails to deliver and causes the Funds to subsequently invest at less advantageous prices. Each Fund holds until the settlement date, in a segregated account, cash or liquid securities in an amount equal to the delayed delivery commitment.
Treasury inflation protected securities. The Funds may invest in treasury inflation protected securities ("TIPS"). The principal amount of TIPS is adjusted periodically for inflation based on a monthly published index. Interest payments are based on the inflation-adjusted principal at the time the interest is paid. These adjustments are recorded as interest income on the Statements of Operations.
Stripped securities. Stripped mortgage-backed securities are derivative multi-class mortgage securities structured so that one class receives most, if not all, of the principal from the underlying mortgage assets, while the other class receives most, if not all, of the interest and the remainder of the principal. If the underlying mortgage assets experience greater than anticipated prepayments of principal, a Fund may fail to fully recoup its initial investment in an interest-only security. The market value of these securities can be extremely volatile in response to changes in interest rates. Credit risk reflects the risk that a Fund may not receive all or part of its principal because the issuer or credit enhancer has defaulted on its obligation.
Income recognition. Interest income is recorded on an accrual basis and includes accretion of discounts, amortization of premiums and paydown gains and losses, net of any non-reclaimable tax withholding on foreign securities. Fee income attributable to mortgage dollar roll transactions is recorded on the accrual basis over the term of the transaction. The value of additional securities received as an income payment is recorded as income and as the cost basis of such securities. Corporate actions and dividend income are recorded on the ex-date except for certain foreign securities which are recorded as soon after the ex-date as the Funds become aware of such, net of any non-reclaimable tax withholdings.
71
NOTES TO FINANCIAL STATEMENTS (continued)
July 31, 2008
Foreign currency transactions. The values of all assets and liabilities quoted in foreign currencies are translated into U.S. dollars at that day's exchange rates. Net realized and unrealized gains (losses) on foreign currency transactions include gains (losses) arising from the fluctuation in exchange rates between trade and settlement dates on securities transactions, gains (losses) arising from the disposition of foreign currency and currency gains (losses) between the accrual and payment dates on dividends, interest income and foreign withholding taxes.
For financial statement purposes, the Funds do not distinguish that portion of gains (losses) on investments which is due to changes in foreign exchange rates from that which is due to changes in market prices of the investments. Such fluctuations are included with the net realized and unrealized gains (losses) on investments on the Statements of Operations.
Expenses. General expenses of the Trust are allocated to the Funds and the other series of the Trust based upon relative net assets or other expense allocation methodologies determined by the nature of the expense. Expenses directly attributable to a Fund are charged to such Fund.
Federal income tax status. Each Fund intends to qualify each year as a "regulated investment company" under Subchapter M of the Internal Revenue Code, as amended, and will distribute substantially all of its taxable income, for its tax year, and as such will not be subject to federal income taxes. In addition, each Fund intends to distribute in each calendar year substantially all of its net investment income, capital gains and certain other amounts, if any, such that each Fund should not be subject to federal excise tax. Therefore, no federal income or excise tax provision is recorded.
Distributions to shareholders. Dividends from net investment income are declared daily and paid monthly. Net realized capital gains, if any, are distributed at least annually. Income distributions and capital gain distributions are determined in accordance with federal income tax regulations which may differ from GAAP.
Indemnification. In the normal course of business, each Fund enters into contracts that contain a variety of representations and warranties and which provide general indemnities. A Fund's maximum exposure under these arrangements is unknown because this would involve future claims against a Fund. Also, under the Trust's organizational documents and by contract, the Trustees and officers of the Trust are indemnified against certain liabilities that may arise out of actions relating to their duties to the Trust. However, based on experience, the Funds expect the risk of loss due to these representations, warranties and indemnities to be minimal.
Note 3. Federal tax information
The timing and character of income and capital gain distributions are determined in accordance with income tax regulations, which may differ from GAAP. Reclassifications are made to the Funds' capital accounts for permanent tax differences to reflect income and gains available for distribution (or available capital loss carryforwards) under income tax regulations.
72
NOTES TO FINANCIAL STATEMENTS (continued)
July 31, 2008
For the year ended July 31, 2008, permanent book and tax basis differences resulting primarily from differing treatments for distribution reclassifications, expired capital loss carryforwards, foreign currency transactions, amortization/accretion adjustments and paydown gain/loss reclassifications were identified and reclassified among the components of the Funds' net assets as follows:
| Overdistributed Net Investment Income | Accumulated Net Realized Loss | Paid-In Capital | |||||||||||||
| CMG Core Bond Fund | $ | 145,831 | $ | (145,830 | ) | $ | (1 | ) | |||||||
| CMG Short Term Bond Fund | 316,880 | 220,667 | (537,547 | ) | |||||||||||
| CMG Ultra Short Term Bond Fund | 159,214 | (159,213 | ) | (1 | ) | ||||||||||
| CMG High Yield Fund | 236,900 | (236,900 | ) | - | |||||||||||
Net investment income and net realized gains (losses), as disclosed on the Statements of Operations, and net assets were not affected by these reclassifications.
The tax character of distributions paid during the years ended July 31, 2008 and July 31, 2007 was as follows:
| July 31, 2008 | |||||||||||
| Ordinary Income* | Long-term Capital Gains | ||||||||||
| CMG Core Bond Fund | $ | 4,651,794 | $ | - | |||||||
| CMG Short Term Bond Fund | 8,705,705 | - | |||||||||
| CMG Ultra Short Term Bond Fund | 5,705,300 | - | |||||||||
| CMG High Yield Fund | 3,778,512 | - | |||||||||
| July 31, 2007 | |||||||||||
| Ordinary Income* | Long-term Capital Gains | ||||||||||
| CMG Core Bond Fund | $ | 2,884,251 | $ | - | |||||||
| CMG Short Term Bond Fund | 5,163,909 | - | |||||||||
| CMG Ultra Short Term Bond Fund | 5,585,102 | - | |||||||||
| CMG High Yield Fund | 5,912,719 | - | |||||||||
*For tax purposes short-term capital gains distributions, if any, are considered ordinary income distributions.
73
NOTES TO FINANCIAL STATEMENTS (continued)
July 31, 2008
As of July 31, 2008, the components of distributable earnings on a tax basis were as follows:
| Undistributed Ordinary Income | Undistributed Long-term Capital Gains | Net Unrealized Depreciation* | |||||||||||||
| CMG Core Bond Fund | $ | 281,927 | $ | - | $ | (1,488,461 | ) | ||||||||
| CMG Short Term Bond Fund | 855,352 | - | (1,809,994 | ) | |||||||||||
| CMG Ultra Short Term Bond Fund | 438,845 | - | (3,303,862 | ) | |||||||||||
| CMG High Yield Fund | 198,530 | - | (3,209,618 | ) | |||||||||||
*The differences between book-basis and tax-basis net unrealized depreciation are primarily due to deferral of losses from wash sales and amortization/accretion adjustments.
Unrealized appreciation and depreciation at July 31, 2008, based on cost of investments for federal income tax purposes, were:
| Unrealized Appreciation | Unrealized Depreciation | Net Unrealized Appreciation (Depreciation) | |||||||||||||
| CMG Core Bond Fund | $ | 174,711 | $ | (1,663,172 | ) | $ | (1,488,461 | ) | |||||||
| CMG Short Term Bond Fund | 1,015,093 | (2,825,087 | ) | (1,809,994 | ) | ||||||||||
| CMG Ultra Short Term Bond Fund | 313,711 | (3,617,573 | ) | (3,303,862 | ) | ||||||||||
| CMG High Yield Fund | 177,808 | (3,387,426 | ) | (3,209,618 | ) | ||||||||||
The following capital loss carryforwards, determined as of July 31, 2008, may be available to reduce taxable income arising from future net realized gains on investments, if any, to the extent permitted by the Internal Revenue Code:
| Year of Expiration | |||||||||||||||||||||||||||||||||||
| 2009 | 2010 | 2012 | 2013 | 2014 | 2015 | 2016 | Total | ||||||||||||||||||||||||||||
| CMG Core Bond Fund | $ | - | $ | - | $ | - | $ | - | $ | 304,526 | $ | 1,461,747 | $ | 399,785 | $ | 2,166,058 | |||||||||||||||||||
| CMG Short Term Bond Fund | - | 2,365,257 | 19,156 | 25,391 | 989,127 | 899,128 | 650,370 | 4,948,429 | |||||||||||||||||||||||||||
| CMG Ultra Short Term Bond Fund | - | - | 29,640 | 47,961 | 627,248 | 685,751 | 213,699 | 1,604,299 | |||||||||||||||||||||||||||
| CMG High Yield Fund | 6,776,032 | 2,987,019 | - | - | - | 3,691,106 | 835,787 | 14,289,944 | |||||||||||||||||||||||||||
Utilization of the capital loss carryforwards in the above table could be subject to limitations imposed by the Internal Revenue Code.
Capital loss carryforwards of $537,548 for CMG Short Term Bond Fund expired during the year ended July 31, 2008. Expired capital loss carryforwards are recorded as a reduction of paid-in capital.
74
NOTES TO FINANCIAL STATEMENTS (continued)
July 31, 2008
Under current tax rules, certain capital losses realized after October 31 may be deferred and treated as occurring on the first day of the following fiscal year. As of July 31, 2008, post-October capital losses attributed to security transactions were deferred to August 1, 2008, as follows:
| Capital Losses | |||||||
| CMG Core Bond Fund | $ | 958,625 | |||||
| CMG Short Term Bond Fund | 57,876 | ||||||
| CMG Ultra Short Term Bond Fund | 2,047,300 | ||||||
| CMG High Yield Fund | 2,310,873 | ||||||
The Funds adopted Financial Accounting Standards Board ("FASB") Interpretation No. 48, Accounting for Uncertainty in Income Taxes, an Interpretation of FASB Statement No. 109 ("FIN 48") effective January 31, 2008. FIN 48 requires management to determine whether a tax position of the Funds is more likely than not to be sustained upon examination by the applicable taxing authority, including resolution of any related appeals or litigation processes, based on the technical merits of the position. The tax benefit to be recognized is measured as the largest amount of benefit that is greater than fifty percent likely of being realized upon ultimate settlement. FIN 48 was applied to all existing tax positions upon initial adoption. Management has evaluated the known implications of FIN 4 8 on its computation of net assets for each Fund. As a result of this evaluation, management has concluded that FIN 48 did not have any effect on the Funds' financial statements and no cumulative effect adjustments were recorded. However, management's conclusions regarding FIN 48 may be subject to review and adjustment at a later date based on factors including, but not limited to, further implementation guidance from the FASB, new tax laws, regulations, and administrative interpretations (including relevant court decisions). The Funds' federal tax returns for the prior three fiscal years remain subject to examination by the Internal Revenue Service. The Funds are not aware of any tax positions for which it is reasonably possible that the total amounts of unrecognized tax benefits will significantly change in the next twelve months.
Note 4. Fees and compensation paid to affiliates
Investment advisory fee. Columbia, an indirect, wholly owned subsidiary of Bank of America Corporation ("BOA"), provides investment advisory, administrative and other services to the Funds. In rendering investment advisory services to the Funds, Columbia may use the portfolio management and research resources of Columbia Management Pte. Ltd., an affiliate of Columbia. Each Fund's investment advisory fee is a unified fee. Columbia, out of the unified fee it receives from the Funds, pays accounting fees, legal fees, transfer agent fees, custody fees, expenses of the Chief Compliance Officer, the commitment fee for the line of credit (see Note 6) and miscellaneous expenses of the Funds. The unified fee does not include brokerage fees, taxes, fees and expenses of the independent Trustees (including legal counsel fees), audit fees, interest expense associated wit h any borrowings by the Funds or extraordinary expenses, if any. The unified fees are paid monthly to Columbia based on each Fund's average daily net assets at the following annual rates:
| CMG Core Bond Fund | 0.25 | % | |||||
| CMG Short Term Bond Fund | 0.25 | % | |||||
| CMG Ultra Short Term Bond Fund | 0.25 | % | |||||
| CMG High Yield Fund | 0.40 | % | |||||
Pricing and bookkeeping fees. The Funds have entered into a Financial Reporting Services Agreement (the "Financial Reporting Services Agreement") with State Street Bank & Trust Company ("State Street") and Columbia pursuant to which State Street provides financial reporting services to the Funds. The Funds have also entered into an Accounting
75
NOTES TO FINANCIAL STATEMENTS (continued)
July 31, 2008
Services Agreement (collectively with the Financial Reporting Services Agreement, the "State Street Agreements") with State Street and Columbia pursuant to which State Street provides accounting services to the Funds.
The Funds have entered into a Pricing and Bookkeeping Oversight and Services Agreement (the "Services Agreement") with Columbia. Under the Services Agreement, Columbia provides services related to Fund expenses and the requirements of the Sarbanes-Oxley Act of 2002, and provides oversight of the accounting and financial reporting services provided by State Street. The pricing and bookkeeping fees for each Fund are payable by Columbia.
Transfer agent fee. Columbia Management Services, Inc. (the "Transfer Agent"), an affiliate of Columbia and an indirect, wholly owned subsidiary of BOA, provides shareholder services to the Funds and has contracted with Boston Financial Data Services ("BFDS") to serve as sub-transfer agent. The transfer agent fees for the Funds are payable by Columbia. The Transfer Agent pays the fees of BFDS for services as sub-transfer agent and is not entitled to reimbursement for such fees from the Funds or Columbia.
The Transfer Agent may also retain, as additional compensation for its services, fees for wire, telephone and redemption orders, IRA trustee agent fees and account transcript fees due the Transfer Agent from shareholders of the Funds and credits (net of bank charges) earned with respect to balances in accounts the Transfer Agent maintains in connection with its services to the Funds.
Fee waivers and expense reimbursements. Columbia has contractually agreed to waive its management fee and to the extent necessary bear other expenses of each Fund through March 1, 2009, so that the expenses incurred by the Funds will not exceed the following annual rates (exclusive of brokerage commissions, interest, taxes and extraordinary expenses, but inclusive of custodial charges relating to overdrafts, if any), after giving effect to any balance credits from the Funds' custodian, based on each Fund's average daily net assets:
| CMG Core Bond Fund | 0.25 | % | |||||
| CMG Short Term Bond Fund | 0.25 | % | |||||
| CMG Ultra Short Term Bond Fund | 0.25 | % | |||||
| CMG High Yield Fund | 0.40 | % | |||||
There is no guarantee that these arrangements will continue after March 1, 2009.
Fees paid to officers and trustees. All officers of the Funds are employees of Columbia or its affiliates and, with the exception of the Funds' Chief Compliance Officer, receive no compensation from the Funds. The Board of Trustees has appointed a Chief Compliance Officer to the Funds in accordance with federal securities regulations. The Funds, along with other affiliated funds, are charged their pro-rata share of the expenses associated with the Chief Compliance Officer. The expenses of the Chief Compliance Officer charged to each Fund are payable by Columbia.
The Trust's eligible Trustees may participate in a deferred compensation plan which may be terminated at any time. Obligations of the plan will be paid solely out of the Funds' assets.
76
NOTES TO FINANCIAL STATEMENTS (continued)
July 31, 2008
Note 5. Portfolio information
For the year ended July 31, 2008, the cost of purchases and proceeds from sales of securities, excluding short-term obligations, were as follows:
| U.S. Government Securities | Other Investment Securities | ||||||||||||||||||
| Purchases | Sales | Purchases | Sales | ||||||||||||||||
| CMG Core Bond Fund | $ | 217,322,469 | $ | 199,836,259 | $ | 36,517,676 | $ | 30,422,910 | |||||||||||
| CMG Short Term Bond Fund | 60,662,677 | 38,126,807 | 100,486,659 | 37,850,525 | |||||||||||||||
| CMG Ultra Short Term Bond Fund | 14,201,456 | 24,014,484 | 56,465,641 | 49,532,292 | |||||||||||||||
| CMG High Yield Fund | - | - | 18,446,381 | 31,867,740 | |||||||||||||||
Note 6. Line of credit
The Funds and other affiliated funds participate in a $350,000,000 committed, unsecured revolving line of credit and a $150,000,000 uncommitted, unsecured line of credit, both provided by State Street. Borrowings are available for short-term liquidity or temporary or emergency purposes.
Interest on the committed line of credit is charged to each participating fund based on the fund's borrowings at a rate per annum equal to the Federal Funds Rate plus 0.50%. In addition, a commitment fee of 0.10% per annum is accrued and apportioned among the participating funds pro rata based on their relative net assets. Effective September 17, 2007, interest on the uncommitted line of credit is charged to each participating fund based on the fund's borrowings at a rate per annum equal to the Federal Funds Rate plus 0.375%. Prior to September 17, 2007, interest on the uncommitted line of credit was charged to each participating fund based on the fund's borrowings at a rate per annum equal to the Federal Funds Rate plus 0.50%. State Street charges an annual operations agency fee of $40,000 for the committed line of credit and may charge an annual administration fee of $15,000 for the uncommitted line of credit. The commitment f ee, the operations agency fee and the administration fee are accrued and apportioned among the participating funds pro rata based on their relative net assets. The commitment fee, the operations agency fee and the administration fee are included in the unified fee for the Funds.
For the year ended July 31, 2008, the average daily loan balance outstanding on days where borrowing existed, and the weighted average interest rate of each Fund that borrowed under these arrangements were as follows:
| Average Borrowings | Weighted Average Interest Rates | ||||||||||
| CMG Core Bond Fund | $ | 2,200,000 | 2.488 | % | |||||||
| CMG High Yield Bond | 1,000,000 | 4.234 | |||||||||
Note 7. Securities lending
Each Fund may lend their securities to certain approved brokers, dealers and other financial institutions. Each loan is collateralized by cash, in an amount at least equal to the market value of the securities loaned plus accrued income from the investment of collateral. The market value of the loaned securities is determined at the close of business of
77
NOTES TO FINANCIAL STATEMENTS (continued)
July 31, 2008
the Funds and any additional required collateral is delivered to the Funds on the next business day. The collateral received is invested and the income generated by the investment of the collateral, net of any fees remitted to State Street as the lending agent and borrower rebates, is paid to the Funds. Generally, in the event of borrower default, the Funds have the right to use the collateral to offset any losses incurred. In the event the Funds are delayed or prevented from exercising their right to dispose of the collateral, there may be a potential loss to the Funds. The Funds bear the risk of loss with respect to the investment of collateral.
Note 8. Shares of beneficial interest
As of July 31, 2008, shares of the Funds were beneficially owned by participant accounts over which BOA and/or any of its affiliates had either sole or joint investment discretion. The number of accounts and the percentages of shares of beneficial interest outstanding held therein were as follows:
| Number of Shareholders | % of Shares Outstanding Held | ||||||||||
| CMG Core Bond Fund | 1 | 90.0 | |||||||||
| CMG Short Term Bond Fund | 1 | 95.0 | |||||||||
| CMG Ultra Short Term Bond Fund | 1 | 100.0 | |||||||||
| CMG High Yield Fund | 1 | 81.7 | |||||||||
As of July 31, 2008, two of the Funds had shareholders that held greater than 5% of the shares outstanding of a Fund, over which BOA and/or any of its affiliates did not have investment discretion. The number of accounts and the percentages of shares of beneficial interest outstanding held therein were as follows:
| Number of Shareholders | % of Shares Outstanding Held | ||||||||||
| CMG Core Bond Fund | 1 | 10.0 | |||||||||
| CMG High Yield Fund | 1 | 8.5 | |||||||||
Subscription and redemption activity of these accounts may have a significant effect on the operations of the Funds.
Note 9. Significant risks and contingencies
Foreign securities risk. There are certain additional risks involved when investing in foreign securities. These risks may involve foreign currency exchange rate fluctuations, adverse political and economic developments and the possible prevention of currency exchange or other foreign governmental laws or restrictions. In addition, the liquidity of foreign securities may be more limited than that of domestic securities.
Investments in emerging market countries are subject to additional risk. The risk of foreign investments is typically increased in less developed countries. These countries are also more likely to experience high levels of inflation, deflation or currency devaluation which could hurt their economies and securities markets.
Asset-backed securities risk. The value of asset-backed securities may be affected by changes in interest rates, the quality of underlying assets or the market's assessment thereof, the creditworthiness of the servicer for the underlying
78
NOTES TO FINANCIAL STATEMENTS (continued)
July 31, 2008
assets, information concerning the originator of the underlying assets, or the creditworthiness or rating of the entities that provide any supporting letters of credit, surety bonds, derivative instruments, or other credit enhancement.
Mortgage-backed securities risk. The value of the mortgage-backed securities may be affected by, changes in interest rates, factors concerning the interests in and structure of the issuer or the originator of the mortgages, the creditworthiness of the entities that provide any supporting letters of credit, surety bonds or other credit enhancements or the quality of underlying assets or the market's assessment thereof. Mortgage-backed securities are subject to prepayment risk, which is the possibility that the underlying mortgage may be refinanced or prepaid prior to maturity during periods of declining or low interest rates, causing the Funds to have to reinvest the money received in securities that have lower yields. In addition, the impact of prepayments on the value of mortgage-backed securities may be difficult to predict and may result in greater volati lity.
High-yield securities risk. Investing in high-yield securities may involve greater credit risk and considerations not typically associated with investing in U.S. Government bonds and other higher quality fixed income securities. These securities are non-investment grade securities, often referred to as "junk" bonds. Economic downturns may disrupt the high yield market and impair the ability of issuers to repay principal and interest. Also, an increase in interest rates would likely have an adverse impact on the value of such obligations. Moreover, high-yield securities may be less liquid to the extent that there is no established secondary market.
Sector focus risk. Certain Funds may focus their investments in certain sectors, subjecting them to greater risk than a fund that is less focused.
Legal proceedings. The Funds are not named as parties to any regulatory proceedings or litigation.
On February 9, 2005, Columbia Management Advisors, Inc. (which has since merged into Banc of America Capital Management, LLC (now named Columbia Management Advisors, LLC)) ("Columbia") and Columbia Funds Distributor, Inc. (which has been renamed Columbia Management Distributors, Inc.) (the "Distributor") (collectively, the "Columbia Group") entered into an Assurance of Discontinuance with the New York Attorney General ("NYAG") (the "NYAG Settlement") and consented to the entry of a cease-and-desist order by the Securities and Exchange Commission ("SEC") (the "SEC Order") on matters relating to mutual fund trading.
Under the terms of the SEC Order, the Columbia Group agreed, among other things, to: pay $70 million in disgorgement and $70 million in civil money penalties; cease and desist from violations of the antifraud provisions and certain other provisions of the federal securities laws; maintain certain compliance and ethics oversight structures; retain an independent consultant to review the Columbia Group's applicable supervisory, compliance, control and other policies and procedures; and retain an independent distribution consultant (see below). The Columbia Funds have also voluntarily undertaken to implement certain governance measures designed to maintain the independence of their boards of trustees. The NYAG Settlement also, among other things, requires Columbia and its affiliates to reduce management fees for certain Columbia Funds (including the former Nations Funds) and other mutual funds collectively by $32 million per year f or five years, for a projected total of $160 million in management fee reductions.
Pursuant to the procedures set forth in the SEC Order, the $140 million in settlement amounts described above is being distributed in accordance with a distribution plan that was developed by an independent distribution consultant and approved by the SEC on April 6, 2007. Distributions under the distribution plan began in late June 2007.
A copy of the SEC Order is available on the SEC website at http://www.sec.gov. A copy of the NYAG Settlement is available as part of the Bank of America Corporation Form 8-K filing on February 10, 2005.
79
NOTES TO FINANCIAL STATEMENTS (continued)
July 31, 2008
In connection with the events described above, various parties have filed suit against certain funds, the Trustees of the Columbia Funds, FleetBoston Financial Corporation and its affiliated entities and/or Bank of America and its affiliated entities.
On February 20, 2004, the Judicial Panel on Multidistrict Litigation transferred these cases and cases against other mutual fund companies based on similar allegations to the United States District Court in Maryland for consolidated or coordinated pretrial proceedings (the "MDL"). Subsequently, additional related cases were transferred to the MDL. On September 29, 2004, the plaintiffs in the MDL filed amended and consolidated complaints. One of these amended complaints is a putative class action that includes claims under the federal securities laws and state common law, and that names Columbia, the Distributor, the Trustees of the Columbia Funds, Bank of America Corporation and others as defendants. Another of the amended complaints is a derivative action purportedly on behalf of the Columbia Funds that asserts claims under federal securities laws and state common law.
On February 25, 2005, Columbia and other defendants filed motions to dismiss the claims in the pending cases. On March 1, 2006, for reasons stated in the court's memoranda dated November 3, 2005, the United States District Court for the District of Maryland granted in part and denied in part the defendants' motions to dismiss. The court dismissed all of the class action claims pending against the Columbia Funds Trusts. As to Columbia and the Distributor, the claims under the Securities Act of 1933, the claims under Sections 34(b) and 36(a) of the Investment Company Act of 1940 ("ICA") and the state law claims were dismissed. The claims under Sections 10(b) and 20(a) of the Securities Exchange Act of 1934 and claims under Section 36(b) of the ICA were not dismissed.
On March 21, 2005, a purported class action was filed in Massachusetts state court alleging that certain conduct, including market timing, entitled Class B shareholders in certain Columbia funds to an exemption from contingent deferred sales charges upon early redemption ("the CDSC Lawsuit"). The CDSC Lawsuit was removed to federal court in Massachusetts and transferred to the MDL.
On September 14, 2007, the plaintiffs and the Columbia defendants named in the MDL, including the Columbia Funds, entered into a stipulation of settlement with respect to all Columbia-related claims in the MDL described above, including the CDSC Lawsuit. The settlement is subject to court approval.
In 2004, the Columbia Funds' adviser and distributor and certain affiliated entities and individuals were named as defendants in certain purported shareholder class and derivative actions making claims, including claims under the Investment Company and the Investment Advisers Acts of 1940 and state law. Certain Columbia Funds were named as nominal defendants. The suits allege, inter alia, that the fees and expenses paid by the funds are excessive and that the advisers and their affiliates inappropriately used fund assets to distribute the funds and for other improper purposes. On March 2, 2005, the actions were consolidated in the Massachusetts federal court as In re Columbia Entities Litigation. The plaintiffs filed a consolidated amended complaint on June 9, 2005. On November 30, 2005, the judge dismissed all claims by plaintiffs and entered final judgment in favor of the defendants. The plaintiffs appealed to the United States Court of Appeals for the First Circuit on December 30, 2005. A stipulation and settlement agreement dated January 19, 2007 was filed in the First Circuit on February 14, 2007, with a joint stipulation of dismissal and motion for remand to obtain district court approval of the settlement. That joint motion was granted and the appeal was dismissed. On March 6, 2007, the case was remanded to the District Court. The settlement, approved by the District Court on September 18, 2007, became effective October 19, 2007. Pursuant to the settlement, the funds' adviser and/or its affiliates made certain payments, including plaintiffs' attorneys' fees and costs of notice to class members.
80
Report of Independent Registered Public Accounting Firm
To the Trustees of Columbia Funds Institutional Trust and the Shareholders of CMG Core Bond Fund, CMG Short Term Bond Fund, CMG Ultra Short Term Bond Fund and CMG High Yield Fund
In our opinion, the accompanying statements of assets and liabilities, including the schedules of investments, and the related statements of operations and of changes in net assets and the financial highlights present fairly, in all material respects, the financial position of CMG Core Bond Fund, CMG Short Term Bond Fund, CMG Ultra Short Term Bond Fund and CMG High Yield Fund (the "Funds") (each a series of Columbia Funds Institutional Trust) at July 31, 2008, the results of each of their operations for the year then ended, the changes in each of their net assets for each of the two years in the period then ended, and their financial highlights for each of the periods indicated, in conformity with accounting principles generally accepted in the United States of America. These financial statements and financial highlights (hereafter referred to as "financial statements") are the responsibility of the Funds' management. Our respon sibility is to express an opinion on these financial statements based on our audits. We conducted our audits of these financial statements in accordance with the standards of the Public Company Accounting Oversight Board (United States). Those standards require that we plan and perform the audits to obtain reasonable assurance about whether the financial statements are free of material misstatement. An audit includes examining, on a test basis, evidence supporting the amounts and disclosures in the financial statements, assessing the accounting principles used and significant estimates made by management, and evaluating the overall financial statement presentation. We believe that our audits, which included confirmation of securities at July 31, 2008 by correspondence with the custodian and brokers, provide a reasonable basis for our opinion.
PricewaterhouseCoopers LLP
Boston, Massachusetts
September 19, 2008
81
Fund Governance
The Trustees serve terms of indefinite duration. The names, addresses and ages of the Trustees and officers of the Funds in Columbia Funds Institutional Trust, the year each was first elected or appointed to office, their principal business occupations during at least the last five years, the number of portfolios overseen by each Trustee and other directorships they hold are shown below. Each officer listed below serves as an officer of each Fund in the Columbia Funds Complex.
| Name, Address and Year of Birth, Position with Funds, Year First Elected or Appointed to Office | Principal Occupation(s) During Past Five Years, Number of Portfolios in Columbia Funds Complex Overseen by Trustee, Other Directorships Held | ||||||
| Independent Trustees | |||||||
| John D. Collins (Born 1938) c/o Columbia Management Advisors, LLC One Financial Center Boston, MA 02111 Trustee1 (since 2007) | Retired. Consultant, KPMG, LLP (accounting and tax firm) from July 1999 to June 2000; Partner, KPMG, LLP from March 1962 to June 1999. Oversees 77, Mrs. Fields Famous Brands LLC (consumer products); Suburban Propane Partners, L.P.; and Montpelier Re (underwriting firm) | ||||||
| Rodman L. Drake (Born 1943) c/o Columbia Management Advisors, LLC One Financial Center Boston, MA 02111 Trustee1 (since 2007) | Co-Founder of Baringo Capital LLC (private equity) since 2002; President, Continuation Investments Group, Inc. from 1997 to 2001. Oversees 77, Jackson Hewitt Tax Service Inc. (tax preparation services); Crystal Capital River Inc. (real estate investment trust); Student Loan Corporation (student loan provider); Celgene Corporation (global biotechnology company); Apex Silver Mines Ltd. (mining); and Hyperion Brookfield Total Return Fund, Inc. and Hyperion Brookfield Strategic Mortgage Income Fund, Inc. (exchange-traded funds) | ||||||
| Douglas A. Hacker (Born 1955) c/o Columbia Management Advisors, LLC One Financial Center Boston, MA 02111 Trustee (since 1996) | Independent business executive since May 2006; Executive Vice President—Strategy of United Airlines (airline) from December 2002 to May 2006; President of UAL Loyalty Services (airline marketing company) from September 2001 to December 2002; Executive Vice President and Chief Financial Officer of United Airlines from July 1999 to September 2001. Oversees 77, Nash Finch Company (food distributor); Aircastle Limited (aircraft leasing) | ||||||
| Janet Langford Kelly (Born 1957) c/o Columbia Management Advisors, LLC One Financial Center Boston, MA 02111 Trustee (since 1996) | Senior Vice President, General Counsel and Corporate Secretary, ConocoPhillips (integrated energy company) since September 2007; Deputy General Counsel—Corporate Legal Services, ConocoPhillips from August 2006 to August 2007; Partner, Zelle, Hofmann, Voelbel, Mason & Gette LLP (law firm) from March 2005 to July 2006; Adjunct Professor of Law, Northwestern University, from September 2004 to June 2006; Director, UAL Corporation (airline) from February 2006 to July 2006; Chief Administrative Officer and Senior Vice President, Kmart Holding Corporation (consumer goods), from September 2003 to March 2004; Executive Vice President—Corporate Development and Administration, General Counsel and Secretary, Kellogg Company (food manufacturer), from September 1999 to August 2003. Oversees 77, None | ||||||
| Charles R. Nelson (Born 1942) c/o Columbia Management Advisors, LLC One Financial Center Boston, MA 02111 Trustee (since 1981) | Professor of Economics, University of Washington, since January 1976; Ford and Louisa Van Voorhis Professor of Political Economy, University of Washington, since September 1993; Director, Institute for Economic Research, University of Washington from September 2001 to June 2003; Adjunct Professor of Statistics, University of Washington, since September 1980; Associate Editor, Journal of Money Credit and Banking, since September 1993; Consultant on econometric and statistical matters. Oversees 77, None | ||||||
82
Fund Governance (continued)
| Name, Address and Year of Birth, Position with Funds, Year First Elected or Appointed to Office | Principal Occupation(s) During Past Five Years, Number of Portfolios in Columbia Funds Complex Overseen by Trustee, Other Directorships Held | ||||||
| Independent Trustees (continued) | |||||||
| John J. Neuhauser (Born 1943) c/o Columbia Management Advisors, LLC One Financial Center Boston, MA 02111 Trustee (since 1985) | President, Saint Michael's College, since August 2007; University Professor, Boston College from November 2005 to August 2007; Academic Vice President and Dean of Faculties, Boston College from August 1999 to October 2005. Oversees 77, Liberty All-Star Equity Fund and Liberty All-Star Growth Fund, Inc. (closed-end funds) | ||||||
| Jonathan Piel (Born 1938) c/o Columbia Management Advisors, LLC One Financial Center Boston, MA 02111 Trustee1 (since 2007) | Cable television producer and website designer; The Editor, Scientific American from 1984 to 1994; Vice President, Scientific American, Inc. from 1984 to 1994; Member, Advisory Board, Stone Age Institute, Bloomington, Indiana (research institute that explores the effect of technology on human evolution); Member, Board of Directors of the National Institute of Social Sciences, New York City; and Member, Board of Trustees of the William Alanson White Institute, New York City (institution for training psychoanalysts). Oversees 77, None | ||||||
| Patrick J. Simpson (Born 1944) c/o Columbia Management Advisors, LLC One Financial Center Boston, MA 02111 Trustee (since 2000) | Partner, Perkins Coie LLP (law firm). Oversees 77, None | ||||||
| Thomas C. Theobald (Born 1937) c/o Columbia Management Advisors, LLC One Financial Center Boston, MA 02111 Trustee and Chairman of the Board (since 1996) | Partner and Senior Advisor, Chicago Growth Partners (private equity investing) since September 2004; Managing Director, William Blair Capital Partners (private equity investing) from September 1994 to September 2004. Oversees 77, Anixter International (network support equipment distributor); Ventas, Inc. (real estate investment trust); Jones Lang LaSalle (real estate management services); Ambac Financial Group (financial guaranty insurance) | ||||||
| Anne-Lee Verville (Born 1945) c/o Columbia Management Advisors, LLC One Financial Center Boston, MA 02111 Trustee (since 1998) | Retired since 1997 (formerly General Manager—Global Education Industry (from 1994 to 1997), President—Application Systems Division (from 1991 to 1994), Chief Financial Officer—US Marketing & Services (from 1988 to 1991), and Chief Information Officer (from 1987 to 1988), IBM Corporation (computer and technology)). Oversees 77, None | ||||||
| Interested Trustee | |||||||
| William E. Mayer (Born 1940) c/o Columbia Management Advisors, LLC One Financial Center Boston, MA 02111 Trustee2 (since 1994) | Partner, Park Avenue Equity Partners (private equity) since February 1999; Dean and Professor, College of Business, University of Maryland from 1992 to 1997. Oversees 77, Lee Enterprises (print media), WR Hambrecht + Co. (financial service provider); BlackRock Kelso Capital Corporation (investment company) | ||||||
1 Messrs. Drake, Piel and Collins have served as directors/trustees of the Excelsior Funds since 1996, 1996 and 2005, respectively. The Excelsior Funds consisted of 27 portfolios managed by affiliates of Columbia Management Advisors, LLC. Effective December 12, 2007, the Board elected Messrs. Drake, Piel and Collins as Trustees of the Trust.
2 Mr. Mayer is an "interested person" (as defined in the Investment Company Act of 1940) by reason of his affiliation with WR Hambrecht + Co., a registered broker/dealer that may execute portfolio transactions for or engage in principal transactions with the Funds or other funds or accounts advised/managed by the Advisor or other Bank of America affiliates.
The Statement of Additional Information includes additional information about the Trustees of the Funds and is available, without charge, upon request by calling 1-800-426-3750.
83
Fund Governance (continued)
Officers
| Name, Address and Year of Birth, Position with Columbia Funds, Year First Elected or Appointed to Office | Principal Occupation(s) During Past Five Years | ||||||
| Christopher L. Wilson (Born 1957) One Financial Center Boston, MA 02111 President (since 2004) | President—Columbia Funds, since October 2004; Managing Director—Columbia Management Advisors, LLC, since September 2005; Senior Vice President—Columbia Management Distributors, Inc., since January 2005; Director—Columbia Management Services, Inc., since January 2005; Director—Bank of America Global Liquidity Funds, plc and Banc of America Capital Management (Ireland), Limited, since May 2005; Director—FIM Funding, Inc., since January 2005; President and Chief Executive Officer—CDC IXIS AM Services, Inc. (investment management), from September 1998 through August 2004; and a senior officer or director of various other Bank of America affiliated entities, including other registered and unregistered funds. | ||||||
| James R. Bordewick, Jr. (Born 1959) One Financial Center Boston, MA 02111 Senior Vice President, Secretary and Chief Legal Officer (since 2006) | Associate General Counsel, Bank of America since April 2005; Senior Vice President and Associate General Counsel, MFS Investment Management (investment management) prior to April 2005. | ||||||
| J. Kevin Connaughton (Born 1964) One Financial Center Boston, MA 02111 Senior Vice President and Chief Financial Officer (since 2000) | Managing Director of Columbia Management Advisors, LLC since December 2004; Treasurer—Columbia Funds, from October 2003 to May 2008; Treasurer—the Liberty Funds, Stein Roe Funds and Liberty All-Star Funds, December 2000—December 2006; Senior Vice President—Columbia Management Advisors, LLC, from April 2003 to December 2004; President—Columbia Funds, Liberty Funds and Stein Roe Funds, February 2004 to October 2004; Treasurer—Galaxy Funds, September 2002 to December 2005; Treasurer, December 2002 to December 2004, and President, February 2004 to December 2004—Columbia Management Multi-Strategy Hedge Fund, LLC; and a senior officer of various other Bank of America-affiliated entities, including other registered and unregistered funds. | ||||||
| Linda J. Wondrack (Born 1964) One Financial Center Boston, MA 02111 Senior Vice President and Chief Compliance Officer (since 2007) | Director (Columbia Management Group LLC and Investment Product Group Compliance), Bank of America since June 2005; Director of Corporate Compliance and Conflicts Officer, MFS Investment Management (investment management), August 2004 to May 2005; Managing Director, Deutsche Asset Management (investment management) prior to August 2004. | ||||||
| Michael G. Clarke (Born 1969) One Financial Center Boston, MA 02111 Treasurer (since 2008) | Director of Fund Administration of the Advisor since January 2006; Managing Director of the Advisor September 2004 to December 2005; Vice President Fund Administration June 2002 to September 2004. | ||||||
| Jeffrey R. Coleman (Born 1969) One Financial Center Boston, MA 02111 Deputy Treasurer (since 2006) | Director of Fund Administration of the Advisor since January 2006; Fund Controller of the Advisor from October 2004 to January 2006; Vice President of CDC IXIS Asset Management Services, Inc. (investment management) from August 2000 to September 2004. | ||||||
84
Fund Governance (continued)
Officers (continued)
| Name, Address and Year of Birth, Position with Columbia Funds, Year First Elected or Appointed to Office | Principal Occupation(s) During Past Five Years | ||||||
| Joseph F. DiMaria (Born 1968) One Financial Center Boston, MA 02111 Chief Accounting Officer (since 2008) | Director of Fund Administration of the Advisor since January 2006; Head of Tax/Compliance and Assistant Treasurer of the Advisor from November 2004 to December 2005; Director of Trustee Administration (Sarbanes-Oxley) of the Advisor from May 2003 to October 2004. | ||||||
| Julian Quero (Born 1967) One Financial Center Boston, MA 02111 Deputy Treasurer (since 2008) | Senior Tax Manager of the Advisor since August 2006; Senior Compliance Manager of the Advisor from April 2002 to August 2006. | ||||||
| Barry S. Vallan (Born 1969) One Financial Center Boston, MA 02111 Controller (since 2006) | Vice President—Fund Treasury of the Advisor since October 2004; Vice President—Trustee Reporting of the Advisor from April 2002 to October 2004. | ||||||
85
COLUMBIA FUNDS INSTITUTIONAL TRUST
ONE FINANCIAL CENTER, BOSTON, MASSACHUSETTS, 02111-2621
- INVESTMENT ADVISOR -
COLUMBIA MANAGEMENT ADVISORS, LLC
100 FEDERAL STREET
BOSTON, MASSACHUSETTS 02110-2624
- LEGAL COUNSEL -
ROPES & GRAY LLP
ONE INTERNATIONAL PLACE
BOSTON, MASSACHUSETTS 02110-2624
- TRANSFER AGENT -
COLUMBIA MANAGEMENT SERVICES, INC.
P.O. BOX 8081
BOSTON, MASSACHUSETTS 02266-8081
SHC-42/154962-0708 (09/08) 08/56960
A description of the policies and procedures that each fund uses to determine how to vote proxies and a copy of each fund's voting records are available (i) at www.columbiamanagement.com; (ii) on the Securities and Exchange Commission's website at www.sec.gov, and (iii) without charge, upon request, by calling 1-800-368-0346. Information regarding how each fund voted proxies relating to portfolio securities during the 12-month period ended June 30 is available from the SEC's website. Information regarding how each fund voted proxies relating to portfolio securities is also available from the funds' website, www.columbiamanagement.com.
Each fund files a complete schedule of portfolio holdings with the SEC for the first and third quarters of each fiscal year on Form N-Q. Each fund's Form N-Q is available on the SEC's website at www.sec.gov and may be reviewed and copied at the SEC's Public Reference Room in Washington, D.C. Information on the operation of the Public Reference Room may be obtained by calling 1-800-SEC-0330.
Please read and consider the investment objectives, risks, charges and expenses for any fund carefully before investing. For a prospectus which contains this and other important information about the fund, contact your Columbia Management representative or go to www.columbiamanagement.com.
©2008 Columbia Management Distributors, Inc.
One Financial Center, Boston, MA 02111-2621
![]()
CMG ENHANCED S&P 500® INDEX FUND
CMG LARGE CAP GROWTH FUND
CMG LARGE CAP VALUE FUND
CMG MID CAP GROWTH FUND
CMG MID CAP VALUE FUND
CMG SMALL CAP GROWTH FUND
CMG SMALL CAP VALUE FUND
CMG SMALL/MID CAP FUND
CMG INTERNATIONAL STOCK FUND
PORTFOLIOS OF COLUMBIA FUNDS INSTITUTIONAL TRUST
Annual Report
July 31, 2008
NOT FDIC INSURED
May Lose Value
NOT BANK ISSUED
No Bank Guarantee
Columbia Management Group, LLC ("Columbia Management") is the investment management division of Bank of America Corporation. Columbia Management entities furnish investment management services and products for institutional and individual investors. CMG Funds are distributed by Columbia Management Distributors, Inc., member of FINRA, SIPC, part of Columbia Management and an affiliate of Bank of America Corporation.
Columbia Management Advisors, LLC ("CMA") is an SEC-registered investment advisor and an indirect, wholly-owned subsidiary of Bank of America Corporation and is part of Columbia Management.
Table of Contents
| Management Discussion of Fund Performance | |||||||
| CMG Enhanced S&P 500® Index Fund | 1 | ||||||
| CMG Large Cap Growth Fund | 5 | ||||||
| CMG Large Cap Value Fund | 9 | ||||||
| CMG Mid Cap Growth Fund | 13 | ||||||
| CMG Mid Cap Value Fund | 17 | ||||||
| CMG Small Cap Growth Fund | 21 | ||||||
| CMG Small Cap Value Fund | 25 | ||||||
| CMG Small/Mid Cap Fund | 29 | ||||||
| CMG International Stock Fund | 33 | ||||||
| Financial Statements | |||||||
| Financial Highlights | 37 | ||||||
| Schedules of Investments | 46 | ||||||
| Statements of Assets and Liabilities | 114 | ||||||
| Statements of Operations | 116 | ||||||
| Statements of Changes in Net Assets | 118 | ||||||
| Notes to Financial Statements | 123 | ||||||
| Report of Independent Registered Public Accounting Firm | 136 | ||||||
| Federal Income Tax Information | 137 | ||||||
| Fund Governance | 139 | ||||||
The views expressed in this report reflect the current views of the respective parties. These views are not guarantees of future performance and involve certain risks, uncertainties and assumptions that are difficult to predict so actual outcomes and results may differ significantly from the views expressed. These views are subject to change at any time based upon economic, market or other conditions and the respective parties disclaim any responsibility to update such views. These views may not be relied on as investment advice and, because investment decisions for a CMG Fund are based on numerous factors, may not be relied on as an indication of trading intent on behalf of any particular CMG Fund. References to specific securities should not be construed as a recommendation or investment advice.
Performance data quoted represents past performance and current performance may be lower or higher. Past performance is no guarantee of future results. The investment return and principal value will fluctuate so that shares, when redeemed, may be worth more or less than the original cost. Please visit www.columbiamanagement.com for daily and most recent month-end performance updates.
CMG ENHANCED S&P 500® INDEX FUND
A Portfolio of Columbia Funds Institutional Trust
MANAGEMENT DISCUSSION OF FUND PERFORMANCE
CMG Enhanced S&P 500® Index Fund returned negative 12.20% for the 12-month period ended July 31, 2008. The fund's return was lower than the return of its benchmark, the S&P 500 Index,1 which was negative 11.09% for the same period. The fund underperformed the negative 10.75% average return for its peer group, the Lipper Large Cap Core Funds Classification.2 Consumer discretionary, financials, health care, technology and utilities had a positive impact on performance relative to the index. However, energy, materials, industrials, consumer staples and telecommunication services detracted from relative return.
In the energy sector, stock selection was a source of negative performance. The fund had more exposure than the index to Sunoco and Valero Energy (0.5% and 0.8% of net assets, respectively), which lost ground as rising commodity prices hurt refining margins. An underweight relative to the index in Hess (0.8% of net assets), an energy distributor, also hampered performance as the stock rose 38% for the period. The fund also had more exposure than the index to the exploration and production activities of EOG Resources (0.3% of net assets), which dropped 19% for the period. Within the materials sector, an overweight in Monsanto (0.7% of net assets) detracted from performance as the company's shares soared on investor enthusiasm for its biotech products in light of strong corn prices.
A combination of stock selection and sector weights aided returns in the consumer discretionary, financials, health care, technology and utilities sectors. In the consumer discretionary sector, a decision to own more McDonald's (0.8% of net assets) than the index was rewarded as strong global sales drove its share price 30% higher. An above-index weight in DIRECTV (0.8% of net assets) also produced positive results for the fund. In the financials sector, the fund had less exposure than the index to Fannie Mae and Wachovia (0.1% of net assets) and it is not permitted to own shares of Columbia's parent company Bank of America, which aided performance as all three were hit hard by weakness in the housing industry, deterioration of consumer spending and credit quality questions.3 We sold Fannie Mae before the end of the period. In the health care sector, a positive return from Amgen (1.3% of net
1 The Standard & Poor's (S&P) 500 Index tracks the performance of 500 widely held, large-capitalization US stocks. Indices are not investments, do not incur fees or expenses and are not professionally managed. It is not possible to invest directly in an index. Securities in the fund may not match those in an index.
"Standard & Poor's" and "S&P" are trademarks of the McGraw-Hill Companies, Inc., and have been licensed for use by the Advisor. The Fund is not sponsored, endorsed, sold or promoted by Standard and Poor's and Standard and Poor's makes no representation regarding the advisability of investing in the Fund.
2 Lipper Inc., a widely respected data provider in the industry, calculates an average total return (assuming reinvestment of distributions) for mutual funds with investment objectives similar to those of the fund. Lipper makes no adjustment for the effect of sales loads.
3 The fund is not permitted to own Bank of America stock. As of July 31, 2008, Bank of America represented 1.36% of the S&P 500 Index; for the 12-month period ending July 31, 2008, BAC decreased 26.07%.
1
assets) aided performance. The company's drug for the treatment of osteoporosis and cancer-related bone loss was well received by investors. Stock selection in technology and utilities also aided performance. In the utilities sector, a decision to overweight FirstEnergy (0.7% of net assets) was beneficial as investors gravitated to the company as a relatively safe haven after the tumultuous market conditions of the past year.
Although we expect market volatility to continue over the next year, we are encouraged by the economy's resilience in 2008, despite the powerful negatives of rising energy prices, a weak housing market and continued problems in the credit markets. If there is some relief in any or all of these areas of the economy, we believe that growth could pick up in 2009. In this environment, we believe investors are well served by having broad diversification within their portfolios. Diversification does not ensure a profit or prevent a loss but it can help modulate the ups and downs in any particular sector in any market environment.
We appreciate your continued confidence in CMG Enhanced S&P 500® Index Fund.
Portfolio Management
Vikram Kuriyan has managed the fund since August 2004 and has been with the advisor or its predecessors or affiliate organizations since 2000.
The fund's top ten holdings (as a percentage of net assets) as of July 31, 2008 were:
| (%) | |||||||
| Exxon Mobil | 4.1 | ||||||
| Microsoft | 2.8 | ||||||
| Chevron | 2.0 | ||||||
| Johnson & Johnson | 2.0 | ||||||
| Procter & Gamble | 1.9 | ||||||
| Pfizer | 1.8 | ||||||
| International Business Machines | 1.8 | ||||||
| AT&T | 1.6 | ||||||
| Altria Group | 1.6 | ||||||
| General Electric | 1.6 | ||||||
Holdings are calculated as a percentage of net assets and are subject to change. Because the fund is actively managed, there is no guarantee the fund will continue to maintain the holdings breakdown listed. The fund's holdings and their weights within the portfolio may change as market conditions change.
Equity investments are affected by stock market fluctuations that occur in response to economic and business developments.
Investing in the fund also includes market risk and tracking error risk. Unlike the S&P 500 Index, the fund incurs administrative expenses and transaction costs in trading stocks. The composition of the S&P 500 Index and the stocks held by the fund will diverge.
2
Performance data quoted represents past performance and current performance may be lower or higher. Past performance is no guarantee of future results. The investment return and principal value will fluctuate so that shares, when redeemed, may be worth more or less than the original cost. Please visit www.columbiamanagement.com for daily and most recent month-end performance updates.
Average annual total return as of July 31, 2008 (%)
| Inception | 1-year | 5-year | Life | ||||||||||||||||
| CMG Enhanced S&P 500® Index Fund | 05/05/03 | -12.20 | 7.18 | 8.29 | |||||||||||||||
| S&P 500 Index | -11.09 | 7.03 | 8.15 | ||||||||||||||||
Average annual total return as of June 30, 2008 (%)
| Inception | 1-year | 5-year | Life | ||||||||||||||||
| CMG Enhanced S&P 500® Index Fund | 05/05/03 | -14.86 | 7.76 | 8.62 | |||||||||||||||
| S&P 500 Index | -13.12 | 7.58 | 8.47 | ||||||||||||||||
Index performance is from May 5, 2003.
Performance results reflect any fee waivers or reimbursements of fund expenses by the investment advisor and/or any of its affiliates. Absent these fee waivers or expense reimbursement arrangements, performance results would have been lower. All results shown assume reinvestment of distributions and do not reflect the deduction of taxes that a shareholder may pay on fund distributions or on the redemption of fund shares.
The fund's annual operating expense ratios, with and without contractual waivers, as stated in the fund's prospectus that is current as of the date of this report, are 0.25% and 0.30%, respectively, of average annual net assets. Differences in expense ratios disclosed elsewhere in this report may result from including fee waivers and expense reimbursements as well as different time periods used in calculating the ratios. The contractual waiver expires 03/01/09.
Growth of a $3,000,000 investment, May 5, 2003 to July 31, 2008
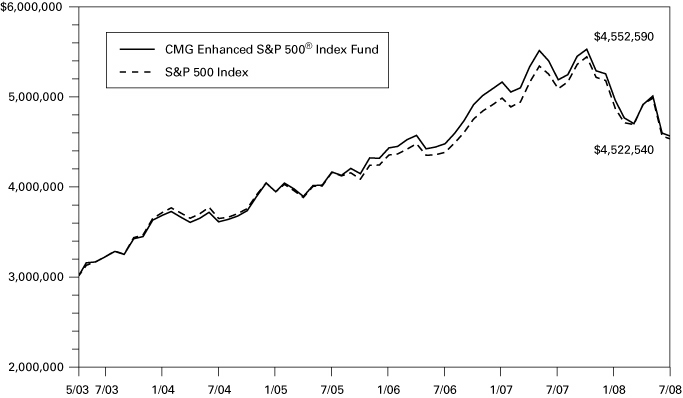
The chart above shows the growth in value of a hypothetical minimum initial $3,000,000 investment in the fund compared to the index during the stated time period and does not reflect the deduction of taxes that a shareholder may pay on fund distributions or on the redemption of fund shares.
The Standard & Poor's (S&P) 500 Index tracks the performance of 500 widely held, large-capitalization US stocks. Indices are not investments, do not incur fees or expenses and are not professionally managed. It is not possible to invest directly in an index. Securities in the fund may not match those in an index.
3
UNDERSTANDING YOUR EXPENSES – CMG Enhanced S&P 500® Index Fund
As a fund shareholder, you incur ongoing costs, which generally include investment advisory fees and other fund expenses. The information on this page is intended to help you understand the ongoing costs of investing in the fund and to compare these costs with the ongoing costs of investing in other mutual funds.
Analyzing your fund's expenses
To illustrate these ongoing costs, we have provided an example and calculated the expenses paid by investors during the period. The information in the following table is based on an initial investment of $1,000, which is invested at the beginning of the period and held for the entire period. Expense information is calculated two ways and each method provides you with different information. The amount listed in the "actual" column is calculated using the fund's actual operating expenses and total return for the period. The amount listed in the "hypothetical" column assumes that the return each year is 5% before expenses and is calculated based on the fund's actual operating expenses. You should not use the hypothetical account values and expenses to estimate either your actual account balance at the end of the period or the expenses you paid during this period.
Estimating your actual expenses
To estimate the expenses that you paid over the period, first you will need your account balance at the end of the period:
1. Divide your ending account balance by $1,000. For example, if an account balance was $8,600 at the end of the period, the result would be 8.6.
2. In the section of the table below titled "Expenses paid during the period," locate the amount labeled "actual." Multiply this number by the result from step 1. Your answer is an estimate of the expenses you paid on your account during the period.
February 1, 2008 – July 31, 2008
| Account value at the beginning of the period ($) | Account value at the end of the period ($) | Expenses paid during the period ($) | Fund's annualized expense ratio (%) | ||||||||||||||||||||||||
| Actual | Hypothetical | Actual | Hypothetical | Actual | Hypothetical | Actual | |||||||||||||||||||||
| 1,000.00 | 1,000.00 | 918.60 | 1,023.62 | 1.19 | 1.26 | 0.25 | |||||||||||||||||||||
Expenses paid during the period are equal to the fund's annualized expense ratio of 0.25%, multiplied by the average account value over the period, then multiplied by the number of days in the fund's most recent fiscal half-year and divided by 366.
Had the investment advisor and/or any of its affiliates not waived fees or reimbursed a portion of expenses, account value at the end of the period would have been reduced.
It is important to note that the expense amounts shown in the table are meant to highlight only ongoing costs of investing in the fund. Therefore, the hypothetical examples provided may not help you determine the relative total costs of owning shares of different funds.
Compare with other funds
Since all mutual funds are required to include the same hypothetical calculations about expenses in shareholder reports, you can use this information to compare the ongoing costs of investing in the fund with other funds. To do so, compare the 5% hypothetical example with the 5% hypothetical examples that appear in the shareholder reports of other funds. As you compare hypothetical examples of other funds, it is important to note that hypothetical examples are meant to highlight the ongoing costs of investing in a fund.
4
Performance data quoted represents past performance and current performance may be lower or higher. Past performance is no guarantee of future results. The investment return and principal value will fluctuate so that shares, when redeemed, may be worth more or less than the original cost. Please visit www.columbiamanagement.com for daily and most recent month-end performance updates.
CMG LARGE CAP GROWTH FUND
A Portfolio of Columbia Funds Institutional Trust
MANAGEMENT DISCUSSION OF FUND PERFORMANCE
For the 12-month period that ended July 31, 2008, CMG Large Cap Growth Fund returned negative 3.57%. Although the fund's return was negative, the fund held up better than its benchmark and peer group in a difficult environment for stocks overall. The fund's benchmark, the Russell 1000 Growth Index1 returned negative 6.29% and the average return for the fund's peer group, the Lipper Large-Cap Growth Funds Classification, was negative 5.72%.2 Stock selection helped performance, as we remained focused on companies with strong competitive positions, good balance sheets, attractive stock valuations and above-average earnings growth prospects.
Stock selection worked especially well in the energy sector, where soaring oil and natural gas prices fueled sharp gains in exploration and production (E&P) stocks with strong production growth. Standouts included E&P companies Southwestern Energy, which we sold, and Hess (0.8% of net assets). As E&P companies boosted production to take advantage of high energy prices, Halliburton, an oilfield service company, and Nabors Industries, a land driller, (1.2% and 1.0% of net assets, respectively) also posted sharp gains.
In the materials sector, agricultural stocks were winners, as the growing demand for ethanol drove corn prices higher, and increased global food consumption, particularly in the emerging markets of China and India, pressured farmers to increase crop yields. In this environment, Potash Corp. of Saskatchewan, which supplies potash for fertilizer, and Monsanto Co. (1.0% of net assets), which sells genetically-enhanced seeds, enjoyed strong demand, leading to strong returns for the year. We sold Potash before period end, as it reached our price objective.
In industrials, alternative energy stocks did well as interest in alternative power increased globally and solar companies reduced costs to become more competitive. First Solar (0.5% of net assets), a U.S. solar company with a presence in Germany, was a top performer. Health care investments further aided returns, led by gains from biotechnology giant Amgen and from BioMarin Pharmaceuticals (1.5% and 0.4% of net assets, respectively). Amgen's stock spiked following the release of positive data on a new osteoporosis drug, while BioMarin's climbed after receiving regulatory approval for a new drug to treat a rare neural disorder.
Technology stocks, which were about 30% of assets, declined as investors became concerned that a slowing economy would curb corporate spending. Detractors included Akamai Technologies, which makes products that help corporate websites run more efficiently, and EMC (0.9% of net assets), a storage company. We sold Akamai before the end of the period. In the consumer sector, the fund's positioning was defensive, as rising energy costs presented
1 The Russell 1000 Growth Index measures the performance of those Russell 1000 Index companies with higher price-to-book ratios and higher forecasted growth values. Indices are not investments, do not incur fees or expenses and are not professionally managed. It is not possible to invest directly in an index. Securities in the fund may not match those in an index.
2 Lipper Inc., a widely respected data provider in the industry, calculates an average total return (assuming reinvestment of distributions) for mutual funds with investment objectives similar to those of the fund. Lipper makes no adjustment for the effect of sales loads.
5
consumers with a spending headwind. Strong performance from holdings such as Urban Outfitters (0.8% of net assets) was offset by Nordstrom and OfficeMax, which failed to meet expectations. Elsewhere, Coventry Health Care, a managed health care company, fell sharply, as pricing failed to keep pace with rising health care costs. We sold Nordstrom, OfficeMax and Coventry Health Care.
Going forward, we believe market volatility will continue as long as the economic outlook remains uncertain. However, we remain optimistic about the long-term prospects for large-cap growth stocks. We believe that they stand to benefit as investors seek out companies with the potential to sustain their earnings growth rates in the face of decelerating earnings across the market. In addition, we believe the diverse nature of large-cap businesses tends to make them less susceptible to economic swings. We plan to focus on companies that are in a position to pass on rising input costs as well as companies that can help other businesses run more efficiently and productively.
Thank you for investing in CMG Large Cap Growth Fund.
Portfolio Management
John T. Wilson, lead manager for CMG Large Cap Growth Fund, has managed or co-managed the fund since August 2005 and has been with the advisor or its predecessors or affiliate organizations since 2005.
Roger R. Sullivan has co-managed the fund since June 2005 and has been with the advisor or its predecessors or affiliate organizations since 2005.
Paul J. Berlinguet has co-managed the fund since October 2003 and has been with the advisor or its predecessors or affiliate organizations since 2003.
The fund's top ten holdings (as a percentage of net assets) as of July 31, 2008 were:
| (%) | |||||||
| QUALCOMM | 3.2 | ||||||
| International Business Machines | 2.6 | ||||||
| 2.3 | |||||||
| Apple | 2.2 | ||||||
| Wal-Mart Stores | 2.2 | ||||||
| Microsoft | 2.2 | ||||||
| Oracle | 2.0 | ||||||
| Schlumberger | 1.9 | ||||||
| Cisco Systems | 1.9 | ||||||
| Johnson & Johnson | 1.8 | ||||||
Holdings are calculated as a percentage of net assets and are subject to change. Because the fund is actively managed, there is no guarantee the fund will continue to maintain the holdings breakdown listed. The fund's holdings and their weights within the portfolio may change as market conditions change.
Equity investments are affected by stock market fluctuations that occur in response to economic and business developments.
Investing in growth stocks incurs the possibility of losses because their prices are sensitive to changes in current or expected earnings.
6
Performance data quoted represents past performance and current performance may be lower or higher. Past performance is no guarantee of future results. The investment return and principal value will fluctuate so that shares, when redeemed, may be worth more or less than the original cost. Please visit www.columbiamanagement.com for daily and most recent month-end performance updates.
Average annual total return as of July 31, 2008 (%)
| Inception | 1-year | Life | |||||||||||||
| CMG Large Cap Growth Fund | 09/10/03 | -3.57 | 6.79 | ||||||||||||
| Russell 1000 Growth Index | -6.29 | 5.85 | |||||||||||||
Average annual total return as of June 30, 2008 (%)
| Inception | 1-year | Life | |||||||||||||
| CMG Large Cap Growth Fund | 09/10/03 | -3.02 | 7.45 | ||||||||||||
| Russell 1000 Growth Index | -5.96 | 6.38 | |||||||||||||
Index performance is from September 10, 2003.
Performance results reflect any fee waivers or reimbursements of fund expenses by the investment advisor and/or any of its affiliates. Absent these fee waivers or expense reimbursement arrangements, performance results would have been lower. All results shown assume reinvestment of distributions and do not reflect the deduction of taxes that a shareholder may pay on fund distributions or on the redemption of fund shares.
The fund's annual operating expense ratios, with and without contractual waivers, as stated in the fund's prospectus that is current as of the date of this report, are 0.50% and 0.66%, respectively, of average annual net assets. Differences in expense ratios disclosed elsewhere in this report may result from including fee waivers and expense reimbursements as well as different time periods used in calculating the ratios. The contractual waiver expires 03/01/09.
Growth of a $3,000,000 investment, September 10, 2003 to July 31, 2008
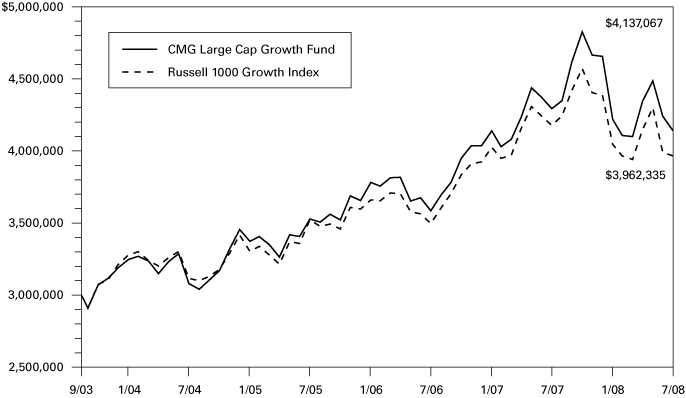
The chart above shows the growth in value of a hypothetical minimum initial $3,000,000 investment in the fund compared to the index during the stated time period and does not reflect the deduction of taxes that a shareholder may pay on fund distributions or on the redemption of fund shares.
The Russell 1000 Growth Index measures the performance of those Russell 1000 Index companies with higher price-to-book ratios and higher forecasted growth values. Indices are not investments, do not incur fees or expenses and are not professionally managed. It is not possible to invest directly in an index. Securities in the fund may not match those in an index.
7
UNDERSTANDING YOUR EXPENSES – CMG Large Cap Growth Fund
As a fund shareholder, you incur ongoing costs, which generally include investment advisory fees and other fund expenses. The information on this page is intended to help you understand the ongoing costs of investing in the fund and to compare these costs with the ongoing costs of investing in other mutual funds.
Analyzing your fund's expenses
To illustrate these ongoing costs, we have provided an example and calculated the expenses paid by investors during the period. The information in the following table is based on an initial investment of $1,000, which is invested at the beginning of the period and held for the entire period. Expense information is calculated two ways and each method provides you with different information. The amount listed in the "actual" column is calculated using the fund's actual operating expenses and total return for the period. The amount listed in the "hypothetical" column assumes that the return each year is 5% before expenses and is calculated based on the fund's actual operating expenses. You should not use the hypothetical account values and expenses to estimate either your actual account balance at the end of the period or the expenses you paid during this period.
Estimating your actual expenses
To estimate the expenses that you paid over the period, first you will need your account balance at the end of the period:
1. Divide your ending account balance by $1,000. For example, if an account balance was $8,600 at the end of the period, the result would be 8.6.
2. In the section of the table below titled "Expenses paid during the period," locate the amount labeled "actual." Multiply this number by the result from step 1. Your answer is an estimate of the expenses you paid on your account during the period.
February 1, 2008 – July 31, 2008
| Account value at the beginning of the period ($) | Account value at the end of the period ($) | Expenses paid during the period ($) | Fund's annualized expense ratio (%) | ||||||||||||||||||||||||
| Actual | Hypothetical | Actual | Hypothetical | Actual | Hypothetical | Actual | |||||||||||||||||||||
| 1,000.00 | 1,000.00 | 981.50 | 1,022.38 | 2.46 | 2.51 | 0.50 | |||||||||||||||||||||
Expenses paid during the period are equal to the fund's annualized expense ratio of 0.50%, multiplied by the average account value over the period, then multiplied by the number of days in the fund's most recent fiscal half-year and divided by 366.
Had the investment advisor and/or any of its affiliates not waived fees or reimbursed a portion of expenses, account value at the end of the period would have been reduced.
It is important to note that the expense amounts shown in the table are meant to highlight only ongoing costs of investing in the fund. Therefore, the hypothetical examples provided may not help you determine the relative total costs of owning shares of different funds.
Compare with other funds
Since all mutual funds are required to include the same hypothetical calculations about expenses in shareholder reports, you can use this information to compare the ongoing costs of investing in the fund with other funds. To do so, compare the 5% hypothetical example with the 5% hypothetical examples that appear in the shareholder reports of other funds. As you compare hypothetical examples of other funds, it is important to note that hypothetical examples are meant to highlight the ongoing costs of investing in a fund.
8
Performance data quoted represents past performance and current performance may be lower or higher. Past performance is no guarantee of future results. The investment return and principal value will fluctuate so that shares, when redeemed, may be worth more or less than the original cost. Please visit www.columbiamanagement.com for daily and most recent month-end performance updates.
CMG LARGE CAP VALUE FUND
A Portfolio of Columbia Funds Institutional Trust
MANAGEMENT DISCUSSION OF FUND PERFORMANCE
For the 12-month period that ended July 31, 2008, CMG Large Cap Value Fund returned negative 14.50%. Considering the current state of the domestic economic environment and the global economic pressures that provided a challenging environment for equity investors, the fund held up better than its benchmark, the Russell 1000 Value Index, which returned negative 15.15%1, and the average return of its peer group, the Lipper Multi-Cap Value Funds Classification, which returned negative 15.71%.2 In a weak economic environment marked by continued credit and liquidity woes, poor results from the financials and consumer discretionary sectors generally accounted for the fund's negative overall return. While exposure to the poor-performing financials sector hurt the fund during the period, its light exposure to the sector compared to the index helped the fund outperform its benchmark. Positive stock selection within t he financials sector and significant exposure to the strong-performing energy sector also aided relative returns.
Within financials, the fund benefited from positive performance among its commercial bank holdings. Standout performers for the fund included PNC Financial Services Group and U.S. Bancorp (1.5% and 2.7% of net assets, respectively). Similarly, the fund's research process led to the selection of capital markets companies that proved capable of weathering the credit and liquidity storms. State Street and Goldman Sachs Group (1.3% and 1.2% of net assets, respectively) were among holdings in this area that saw positive results. The fund has selectively and steadily increased its overall exposure to financial stocks, ending the period with an overweight in the sector. The emphasis has been on identifying companies that we believe are capable of being better positioned to take advantage of the stability and the upturn that we believe the economy will eventually witness.
Stock selection was also central to a strong showing from the fund's energy holdings. The fund was underweight in energy relative to the index, which hurt relative results. However, a decision to emphasize energy equipment and service names, such as Halliburton and Weatherford International (0.9% and 0.6% of net assets, respectively), proved beneficial to performance. While rising oil prices provided a boost to energy returns, these companies were also the beneficiaries of new drilling opportunities, strong backlogs of work and rising demand for services. The fund also reaped continued positive results from integrated oil companies Occidental Petroleum and Hess (1.0% and 1.1% of net assets, respectively). Stock selection in health care, including Amgen Inc. (2.2% of net assets), a leading biotechnology company, and in telecommunications was also beneficial to the fund's relative performance.
During the period, detractors from performance included an underexposure to chemical companies in the materials group, which had a boost from rising demand for fertilizers, and an underweight to the utilities group. Among the largest detractors were commodity-linked names in the consumer staples sector. Food packager ConAgra Foods (1.4% of net assets) underperformed due to concerns over weak results in the firm's consumer goods division. The
1 The Russell 1000 Value Index measures the performance of those Russell 1000 Index companies with lower price-to-book ratios and lower forecasted growth values. Indices are not investments, do not incur fees or expenses and are not professionally managed. It is not possible to invest directly in an index. Securities in the fund may not match those in an index.
2 Lipper Inc., a widely respected data provider in the industry, calculates an average total return (assuming reinvestment of distributions) for mutual funds with investment objectives similar to those of the fund. Lipper makes no adjustment for the effect of sales loads.
9
stock has since recovered marginally and we continue to hold it given the improved performance of its core brands. An underweight in the household products area, including limited exposure to strong performer Proctor & Gamble (1.5% of net assets), also hurt the fund's returns. We have since added to the fund's position in this group, marginally boosting its position in household product companies that are successfully passing along rising costs to the consumer through price increases.
We are encouraged by the resilience of the U.S. economy, particularly in light of significant headwinds faced over the past 12 months, including rising commodity prices, falling housing prices, reduced availability of credit and increased consumer uncertainty. We believe that recent market volatility has created buying opportunities for managers who focus, as we do, on individual stock selection. We seek to invest in companies whose shares are not only undervalued, but whose operating margins have been compressed and whose future performance has the potential to expand those margins.
Thank you for investing in CMG Large Cap Value Fund.
Portfolio Management
Lori J. Ensinger is the lead manager for CMG Large Cap Value Fund and has managed the fund since August 2005. She has been with the advisor or its predecessors or affiliate organizations since 2001.
Diane L. Sobin has co-managed the fund since August 2005 and has been with the advisor or its predecessors or affiliate organizations since 2001.
David I. Hoffman has co-managed the fund since August 2005 and has been with the advisor or its predecessors or affiliate organizations since 2001.
Noah J. Petrucci has co-managed the fund since August 2005 and has been with the advisor or its predecessors or affiliate organizations since 2002.
The fund's top ten holdings (as a percentage of net assets) as of July 31, 2008 were:
| (%) | |||||||
| Exxon Mobil | 4.8 | ||||||
| JPMorgan Chase | 4.2 | ||||||
| AT&T | 3.3 | ||||||
| Wells Fargo | 3.1 | ||||||
| Johnson & Johnson | 2.8 | ||||||
| U.S. Bancorp | 2.7 | ||||||
| General Electric | 2.4 | ||||||
| ConocoPhillips | 2.3 | ||||||
| Amgen | 2.2 | ||||||
| ACE Ltd. | 2.1 | ||||||
Holdings are calculated as a percentage of net assets and are subject to change. Because the fund is actively managed, there is no guarantee the fund will continue to maintain the holdings breakdown listed. The fund's holdings and their weights within the portfolio may change as market conditions change.
Equity investments are affected by stock market fluctuations that occur in response to economic and business developments.
Value stocks are stocks of companies that may have experienced adverse business or industry developments or may be subject to special risks that have caused the stocks to be out of favor and, in the advisor's opinion, undervalued. The price of the company's stock may not approach the value the advisor has placed on it.
10
Performance data quoted represents past performance and current performance may be lower or higher. Past performance is no guarantee of future results. The investment return and principal value will fluctuate so that shares, when redeemed, may be worth more or less than the original cost. Please visit www.columbiamanagement.com for daily and most recent month-end performance updates.
Average annual total return as of July 31, 2008 (%)
| Inception | 1-year | Life | |||||||||||||
| CMG Large Cap Value Fund | 09/10/03 | -14.50 | 6.64 | ||||||||||||
| Russell 1000 Value Index | -15.15 | 8.39 | |||||||||||||
Average annual total return as of June 30, 2008 (%)
| Inception | 1-year | Life | |||||||||||||
| CMG Large Cap Value Fund | 09/10/03 | -17.18 | 6.97 | ||||||||||||
| Russell 1000 Value Index | -18.78 | 8.63 | |||||||||||||
Index performance is from September 10, 2003.
Performance results reflect any fee waivers or reimbursements of fund expenses by the investment advisor and/or any of its affiliates. Absent these fee waivers or expense reimbursement arrangements, performance results would have been lower. All results shown assume reinvestment of distributions and do not reflect the deduction of taxes that a shareholder may pay on fund distributions or on the redemption of fund shares.
The fund's annual operating expense ratios, with and without contractual waivers, as stated in the fund's prospectus that is current as of the date of this report, are 0.50% and 0.68%, respectively, of average annual net assets. Differences in expense ratios disclosed elsewhere in this report may result from including fee waivers and expense reimbursements as well as different time periods used in calculating the ratios. The contractual waiver expires 03/01/09.
Growth of a $3,000,000 investment, September 10, 2003 to July 31, 2008
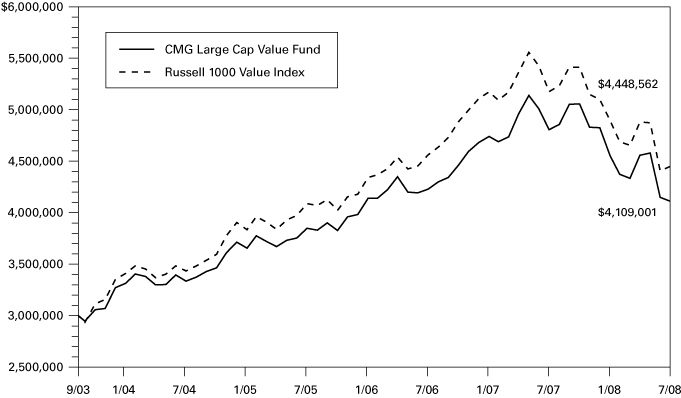
The chart above shows the growth in value of a hypothetical minimum initial $3,000,000 investment in the fund compared to the index during the stated time period and does not reflect the deduction of taxes that a shareholder may pay on fund distributions or on the redemption of fund shares.
The Russell 1000 Value Index measures the performance of those Russell 1000 Index companies with lower price-to-book ratios and lower forecasted growth values. Indices are not investments, do not incur fees or expenses and are not professionally managed. It is not possible to invest directly in an index. Securities in the fund may not match those in an index.
11
UNDERSTANDING YOUR EXPENSES – CMG Large Cap Value Fund
As a fund shareholder, you incur ongoing costs, which generally include investment advisory fees and other fund expenses. The information on this page is intended to help you understand the ongoing costs of investing in the fund and to compare these costs with the ongoing costs of investing in other mutual funds.
Analyzing your fund's expenses
To illustrate these ongoing costs, we have provided an example and calculated the expenses paid by investors during the period. The information in the following table is based on an initial investment of $1,000, which is invested at the beginning of the period and held for the entire period. Expense information is calculated two ways and each method provides you with different information. The amount listed in the "actual" column is calculated using the fund's actual operating expenses and total return for the period. The amount listed in the "hypothetical" column assumes that the return each year is 5% before expenses and is calculated based on the fund's actual operating expenses. You should not use the hypothetical account values and expenses to estimate either your actual account balance at the end of the period or the expenses you paid during this period.
Estimating your actual expenses
To estimate the expenses that you paid over the period, first you will need your account balance at the end of the period:
1. Divide your ending account balance by $1,000. For example, if an account balance was $8,600 at the end of the period, the result would be 8.6.
2. In the section of the table below titled "Expenses paid during the period," locate the amount labeled "actual." Multiply this number by the result from step 1. Your answer is an estimate of the expenses you paid on your account during the period.
February 1, 2008 – July 31, 2008
| Account value at the beginning of the period ($) | Account value at the end of the period ($) | Expenses paid during the period ($) | Fund's annualized expense ratio (%) | ||||||||||||||||||||||||
| Actual | Hypothetical | Actual | Hypothetical | Actual | Hypothetical | Actual | |||||||||||||||||||||
| 1,000.00 | 1,000.00 | 902.59 | 1,022.38 | 2.37 | 2.51 | 0.50 | |||||||||||||||||||||
Expenses paid during the period are equal to the fund's annualized expense ratio of 0.50%, multiplied by the average account value over the period, then multiplied by the number of days in the fund's most recent fiscal half-year and divided by 366.
Had the investment advisor and/or any of its affiliates not waived fees or reimbursed a portion of expenses, account value at the end of the period would have been reduced.
It is important to note that the expense amounts shown in the table are meant to highlight only ongoing costs of investing in the fund. Therefore, the hypothetical examples provided may not help you determine the relative total costs of owning shares of different funds.
Compare with other funds
Since all mutual funds are required to include the same hypothetical calculations about expenses in shareholder reports, you can use this information to compare the ongoing costs of investing in the fund with other funds. To do so, compare the 5% hypothetical example with the 5% hypothetical examples that appear in the shareholder reports of other funds. As you compare hypothetical examples of other funds, it is important to note that hypothetical examples are meant to highlight the ongoing costs of investing in a fund.
12
Performance data quoted represents past performance, and current performance may be lower or higher. Past performance is no guarantee of future results. The investment return and principal value will fluctuate so that shares, when redeemed, may be worth more or less than the original cost. Please visit www.columbiamanagement.com for daily and most recent month-end performance updates.
CMG MID CAP GROWTH FUND
A Portfolio of Columbia Funds Institutional Trust
MANAGEMENT DISCUSSION OF FUND PERFORMANCE
For the 12-month period that ended July 31, 2008, CMG Mid Cap Growth Fund returned negative 0.67%. The fund's benchmark, the Russell Midcap Growth Index, returned negative 7.92%1 and the average return of its peer group, the Lipper Mid-Cap Growth Funds Classification, was negative 7.48%2. Positive stock selection helped the fund, with the biggest gains coming from materials and energy. Sector weights, despite being relatively close to those in the index, modestly hindered relative performance.
The fund's energy stocks climbed significantly for the year, benefiting as rising global demand and constrained supply drove oil prices up in the first seven months of 2008. Natural gas prices also rose sharply. Among the winners were domestic exploration and production companies Continental Resources, Denbury Resources and Concho Resources (1.1%, 1.4% and 0.5% of net assets, respectively). All three stocks posted outsized gains, driven by positive pricing as well as strong production growth.
In the materials sector, where the fund's investments experienced strong returns, agricultural stocks benefited as rising demand for ethanol and growing global food consumption, especially in emerging markets, drove commodity prices higher. Companies that could help farmers increase their crop yields did especially well. Among the winners were Potash Corp. of Saskatchewan (1.9% of net assets), which produces potash for fertilizer; Agrium (0.6% of net assets), another fertilizer company; and Monsanto (0.9% of net assets), which sells genetically-enhanced seeds. Some mining stocks also rallied nicely, including Cleveland-Cliffs (1.1% of net assets), an iron ore company that gained from positive pricing in the wake of growing global demand. Bucyrus International (0.6% of net assets), a mining equipment company, also rose sharply, as mining companies stepped up production to take advantage of higher commodity prices.
A modest overweight in and below-average performance from the fund's telecommunications services stocks hampered returns relative to the index. Disappointments included NII Holdings (0.6% of net assets), a leading Latin American wireless provider whose stock price declined as increased competition pressured subscriber growth rates. In technology, Equinix (0.6% of net assets), an operator of large offsite data centers, retreated amid concerns that corporate technology spending would slow.
Other detractors were spread across sectors. In the consumer discretionary sector, CROCS, a footwear manufacturer, and Scientific Games, which makes gaming systems, both fell sharply. CROCS suffered from decelerating sales, excess inventory and disappointing earnings. Scientific Games was hurt by the loss of a key contract and the weak economy. We sold both stocks. In
1 The Russell Midcap Growth Index measures the performance of those Russell Midcap Index companies with higher price-to-book ratios and higher forecasted growth values. Indices are not investments, do not incur fees or expenses and are not professionally managed. It is not possible to invest directly in an index. Securities in the fund may not match those in an index.
2 Lipper Inc., a widely respected data provider in the industry, calculates an average total return (assuming reinvestment of distributions) for mutual funds with investment objectives similar to those of the fund. Lipper makes no adjustment for the effect of sales loads.
13
health care, Hologic (0.7% of net assets), which specializes in digital mammography, declined amid worries that the stock's price had surpassed expectations.
Although we expect the market to remain volatile in the near term, we are confident that we can find ample opportunities to invest in mid-cap stocks that fit our investment criteria. We plan to focus on companies that can pass on rising input costs, as well as companies that can help other businesses be more efficient.
We appreciate your continued confidence in the CMG Mid Cap Growth Fund.
Portfolio Management
Wayne M. Collette has co-managed the fund since February 2006 and has been with the advisor or its predecessors or affiliate organizations since 2001.
George J. Myers has co-managed the fund since February 2006 and has been with the advisor or its predecessors or affiliate organizations since 2004.
Lawrence W. Lin has co-managed the fund since October 2007 and has been with the advisor since 2006.
Brian D. Neigut has co-managed the fund since October 2007 and has been with the advisor since 2007.
The fund's top ten holdings (as a percentage of net assets) as of July 31, 2008 were:
| (%) | |||||||
| Potash Corp. of Saskatchewan | 1.9 | ||||||
| Denbury Resources | 1.4 | ||||||
| McDermott International | 1.3 | ||||||
| Cummins | 1.2 | ||||||
| American Tower | 1.2 | ||||||
| Diamond Offshore Drilling | 1.2 | ||||||
| Continental Resources | 1.1 | ||||||
| Cleveland Cliffs | 1.1 | ||||||
| Waddell & Reed Financial | 1.1 | ||||||
| Precision Castparts | 1.0 | ||||||
Holdings are calculated as a percentage of net assets and are subject to change. Because the fund is actively managed, there is no guarantee the fund will continue to maintain the holdings breakdown listed. The fund's holdings and their weights within the portfolio may change as market conditions change.
Equity investments are affected by stock market fluctuations that occur in response to economic and business developments.
Investing in growth stocks incurs the possibility of losses because their prices are sensitive to changes in current or expected earnings.
Investing in mid-cap stocks may present special risks, including possible illiquidity and greater price volatility than stocks of larger, more established companies.
14
Performance data quoted represents past performance and current performance may be lower or higher. Past performance is no guarantee of future results. The investment return and principal value will fluctuate so that shares, when redeemed, may be worth more or less than the original cost. Please visit www.columbiamanagement.com for daily and most recent month-end performance updates.
Average annual total return as of July 31, 2008 (%)
| Inception | 1-year | 5-year | Life | ||||||||||||||||
| CMG Mid Cap Growth Fund | 05/05/03 | -0.67 | 11.47 | 12.82 | |||||||||||||||
| Russell Midcap Growth Index | -7.92 | 10.67 | 12.60 | ||||||||||||||||
Average annual total return as of June 30, 2008 (%)
| Inception | 1-year | 5-year | Life | ||||||||||||||||
| CMG Mid Cap Growth Fund | 05/05/03 | 3.93 | 13.15 | 14.28 | |||||||||||||||
| Russell Midcap Growth Index | -6.42 | 12.32 | 13.67 | ||||||||||||||||
Index performance is from May 5, 2003.
Performance results reflect any fee waivers or reimbursements of fund expenses by the investment advisor and/or any of its affiliates. Absent these fee waivers or expense reimbursement arrangements, performance results would have been lower. All results shown assume reinvestment of distributions and do not reflect the deduction of taxes that a shareholder may pay on fund distributions or on the redemption of fund shares.
The fund's annual operating expense ratios, with and without contractual waivers, as stated in the fund's prospectus that is current as of the date of this report, are 0.70% and 0.95%, respectively, of average annual net assets. Differences in expense ratios disclosed elsewhere in this report may result from including fee waivers and expense reimbursements as well as different time periods used in calculating the ratios. The contractual waiver expires 03/01/09.
Growth of a $3,000,000 investment, May 5, 2003 to July 31, 2008
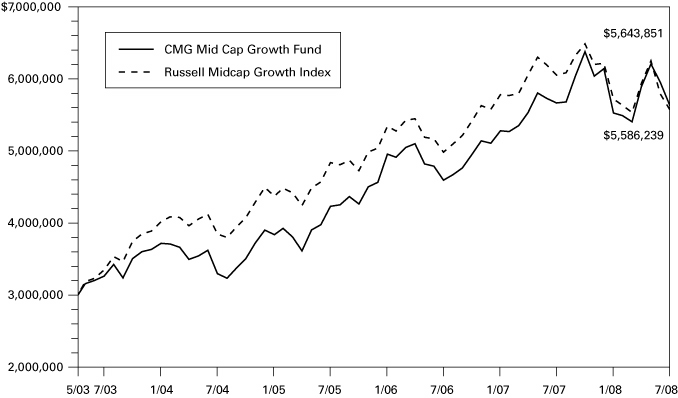
The chart above shows the growth in value of a hypothetical minimum initial $3,000,000 investment in the fund compared to the index during the stated time period and does not reflect the deduction of taxes that a shareholder may pay on fund distributions or on the redemption of fund shares.
The Russell Midcap Growth Index measures the performance of those Russell Midcap Index companies with higher price-to-book ratios and higher forecasted growth values. Indices are not investments, do not incur fees or expenses and are not professionally managed. It is not possible to invest directly in an index. Securities in the fund may not match those in an index.
15
UNDERSTANDING YOUR EXPENSES – CMG Mid Cap Growth Fund
As a fund shareholder, you incur ongoing costs, which generally include investment advisory fees and other fund expenses. The information on this page is intended to help you understand the ongoing costs of investing in the fund and to compare these costs with the ongoing costs of investing in other mutual funds.
Analyzing your fund's expenses
To illustrate these ongoing costs, we have provided an example and calculated the expenses paid by investors during the period. The information in the following table is based on an initial investment of $1,000, which is invested at the beginning of the period and held for the entire period. Expense information is calculated two ways and each method provides you with different information. The amount listed in the "actual" column is calculated using the fund's actual operating expenses and total return for the period. The amount listed in the "hypothetical" column assumes that the return each year is 5% before expenses and is calculated based on the fund's actual operating expenses. You should not use the hypothetical account values and expenses to estimate either your actual account balance at the end of the period or the expenses you paid during this period.
Estimating your actual expenses
To estimate the expenses that you paid over the period, first you will need your account balance at the end of the period:
1. Divide your ending account balance by $1,000. For example, if an account balance was $8,600 at the end of the period, the result would be 8.6.
2. In the section of the table below titled "Expenses paid during the period," locate the amount labeled "actual." Multiply this number by the result from step 1. Your answer is an estimate of the expenses you paid on your account during the period.
February 1, 2008 – July 31, 2008
| Account value at the beginning of the period ($) | Account value at the end of the period ($) | Expenses paid during the period ($) | Fund's annualized expense ratio (%) | ||||||||||||||||||||||||
| Actual | Hypothetical | Actual | Hypothetical | Actual | Hypothetical | Actual | |||||||||||||||||||||
| 1,000.00 | 1,000.00 | 1,018.30 | 1,021.38 | 3.51 | 3.52 | 0.70 | |||||||||||||||||||||
Expenses paid during the period are equal to the fund's annualized expense ratio of 0.70%, multiplied by the average account value over the period, then multiplied by the number of days in the fund's most recent fiscal half-year and divided by 366.
Had the investment advisor and/or any of its affiliates not waived fees or reimbursed a portion of expenses, account value at the end of the period would have been reduced.
It is important to note that the expense amounts shown in the table are meant to highlight only ongoing costs of investing in the fund. Therefore, the hypothetical examples provided may not help you determine the relative total costs of owning shares of different funds.
Compare with other funds
Since all mutual funds are required to include the same hypothetical calculations about expenses in shareholder reports, you can use this information to compare the ongoing costs of investing in the fund with other funds. To do so, compare the 5% hypothetical example with the 5% hypothetical examples that appear in the shareholder reports of other funds. As you compare hypothetical examples of other funds, it is important to note that hypothetical examples are meant to highlight the ongoing costs of investing in a fund.
16
Performance data quoted represents past performance and current performance may be lower or higher. Past performance is no guarantee of future results. The investment return and principal value will fluctuate so that shares, when redeemed, may be worth more or less than the original cost. Please visit www.columbiamanagement.com for daily and most recent month-end performance updates.
CMG MID CAP VALUE FUND
A Portfolio of Columbia Funds Institutional Trust
MANAGEMENT DISCUSSION OF FUND PERFORMANCE
For the 12-month period that ended July 31, 2008, CMG Mid Cap Value Fund returned negative 13.36%. The fund's return was slightly lower than the negative 13.20% return of its benchmark, the Russell Midcap Value Index,1 and also lower than the negative 8.92% average return of its peer group, the Lipper Mid-Cap Core Funds Classification.2 A weak U.S. economic environment and growing concerns that the global economy may also be slowing pushed stocks well into negative territory. This environment, combined with exposure to weakness in the financials, consumer discretionary and industrials sectors, contributed to the fund's negative results. Technology stocks helped buoy the fund's relative return.
Despite an underweight in the financials sector, poor performance from several holdings in the thrifts and mortgage area, including Freddie Mac and PMI Group, hurt the fund's return. We subsequently sold both stocks since we believe business prospects for the companies had not improved. While selected commercial bank and capital markets holdings did better on a relative basis, the absolute returns of these stocks were still negative. In recent months, we have selectively increased the fund's exposure to the financials sector, moving incrementally to a neutral weight relative to the index, as the frequency and magnitude of negative trends appears to have diminished. This positioning is balanced with our view that the financials sector has the potential to continue to experience volatility going forward and valuation opportunities abound.
Performance from the fund's holdings in the materials sector was similarly mixed. Among positive contributors were Crown Holdings and Packaging Corp. of America (0.8% and 1.0% of net assets, respectively), which manufactures basic packaging for consumer and industrial goods. The global businesses of these firms were boosted by strength in demand due to a rising level of global wealth. Detractors in the sector included steel manufacturer Allegheny Technologies (0.5% of net assets), which underperformed due to weak demand for flat-rolled steel. Nonetheless, the company saw strong demand from aerospace companies and we continued to hold the stock.
Holdings in the energy sector contributed positive returns, with integrated oil company Hess and coal company Peabody Energy (both 0.6% of net assets) providing the biggest boost. We lightened the fund's exposure to the sector, taking profits during the period, and retained a neutral weight relative to the index. We also took profits from holdings in the industrials and utilities sectors. While we continue to view the industrials sector positively in the long-term and maintain an overweight position in the sector relative to the benchmark, we adjusted the fund's exposure downwards to minimize potential risk from this sector in the event of a global economic slowdown.
Technology provided a boost for the fund, with strong performance from software holdings, including Activision Blizzard (0.6% of net assets), which saw continued positive results from its online and console games. NCR (1.4% of net assets) was another key contributor, buoyed by
1 The Russell Midcap Value Index measures the performance of those Russell Midcap Index companies with lower price-to-book ratios and lower forecasted growth values. Indices are not investments, do not incur fees or expenses and are not professionally managed. It is not possible to invest directly in an index. Securities in the fund may not match those in an index.
2 Lipper Inc., a widely respected data provider in the industry, calculates an average total return (assuming reinvestment of distributions) for mutual funds with investment objectives similar to those of the fund. Lipper makes no adjustment for the effect of sales loads.
17
continued growth of its ATM sales business and successful cost-cutting initiatives employed by management. The fund's relative performance also benefited from positive stock selection in the consumer discretionary sector, particularly the successful avoidance of broad weakness among newspaper companies.
We are encouraged by the resilience of the U.S. economy, particularly in light of the significant headwinds faced over the past 12 months, including rising commodity prices, falling housing prices, reduced availability of credit and increased consumer uncertainty. As a result, we remain optimistic about the longer-term prospects for mid-cap value stocks, particularly companies with management teams that are able to expand their businesses by capturing growing demand and increased pricing power. The market's recent volatility has depressed valuations across the sector, providing an opportunity to buy stocks that fit our investment criteria at a significant discount to historical levels.
We appreciate your continued confidence in CMG Mid Cap Value Fund.
Portfolio Management
Diane L. Sobin, lead manager, has co-managed the CMG Mid Cap Value Fund since September 2004 and has been with the advisor or its predecessors or affiliate organizations since 2001.
David I. Hoffman has co-managed the fund since September 2004 and has been with the advisor or its predecessors or affiliate organizations since 2001.
Lori J. Ensinger has co-managed the fund since September 2004 and has been with the advisor or its predecessors or affiliate organizations since 2001.
Noah J. Petrucci has co-managed the fund since September 2004 and has been with the advisor or its predecessors or affiliate organizations since 2002.
The fund's top ten holdings (as a percentage of net assets) as of July 31, 2008 were:
| (%) | |||||||
| Plum Creek Timber | 1.9 | ||||||
| Marsh & McLennan | 1.8 | ||||||
| Weyerhaeuser | 1.7 | ||||||
| Ameriprise Financial | 1.6 | ||||||
| ACE Ltd. | 1.6 | ||||||
| Rayonier | 1.5 | ||||||
| Equity Residential | 1.5 | ||||||
| Marshall & IIsley | 1.5 | ||||||
| Alexandria Real Estate Equities | 1.5 | ||||||
| Sempra Energy | 1.4 | ||||||
Holdings are calculated as a percentage of net assets and are subject to change. Because the fund is actively managed, there is no guarantee the fund will continue to maintain the holdings breakdown listed. The fund's holdings and their weights within the portfolio may change as market conditions change.
Equity investments are affected by stock market fluctuations that occur in response to economic and business developments.
Investing in mid-cap stocks may present special risks, including possible illiquidity and greater price volatility than stocks of larger, more established companies.
Value stocks are stocks of companies that may have experienced adverse business or industry developments or may be subject to special risks that have caused the stocks to be out of favor and, in the advisor's opinion, undervalued. The price of the company's stock may not approach the value the advisor has placed on it.
18
Performance data quoted represents past performance and current performance may be lower or higher. Past performance is no guarantee of future results. The investment return and principal value will fluctuate so that shares, when redeemed, may be worth more or less than the original cost. Please visit www.columbiamanagement.com for daily and most recent month-end performance updates.
Average annual total return as of July 31, 2008 (%)
| Inception | 1-year | 5-year | Life | ||||||||||||||||
| CMG Mid Cap Value Fund | 05/05/03 | -13.36 | 10.26 | 11.18 | |||||||||||||||
| Russell Midcap Value Index | -13.20 | 12.05 | 13.78 | ||||||||||||||||
Average annual total return as of June 30, 2008 (%)
| Inception | 1-year | 5-year | Life | ||||||||||||||||
| CMG Mid Cap Value Fund | 05/05/03 | -15.62 | 11.44 | 11.86 | |||||||||||||||
| Russell Midcap Value Index | -17.09 | 13.00 | 14.27 | ||||||||||||||||
Index performance is from May 5, 2003.
Performance results reflect any fee waivers or reimbursements of fund expenses by the investment advisor and/or any of its affiliates. Absent these fee waivers or expense reimbursement arrangements, performance results would have been lower. All results shown assume reinvestment of distributions and do not reflect the deduction of taxes that a shareholder may pay on fund distributions or on the redemption of fund shares.
The fund's annual operating expense ratios, with and without contractual waivers, as stated in the fund's prospectus that is current as of the date of this report, are 0.70% and 1.06%, respectively, of average annual net assets. Differences in expense ratios disclosed elsewhere in this report may result from including fee waivers and expense reimbursements as well as different time periods used in calculating the ratios. The contractual waiver expires 03/01/09.
Growth of a $3,000,000 investment, May 5, 2003 to July 31, 2008
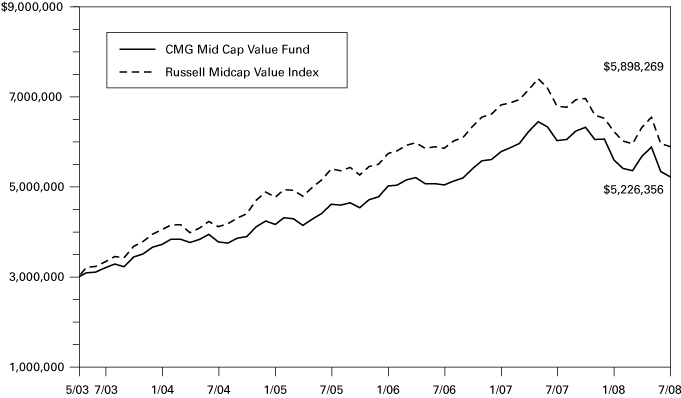
The chart above shows the growth in value of a hypothetical minimum initial $3,000,000 investment in the fund compared to the index during the stated time period and does not reflect the deduction of taxes that a shareholder may pay on fund distributions or on the redemption of fund shares.
The Russell Midcap Value Index measures the performance of those Russell Midcap Index companies with lower price-to-book ratios and lower forecasted growth values. Indices are not investments, do not incur fees or expenses and are not professionally managed. It is not possible to invest directly in an index. Securities in the fund may not match those in an index.
19
UNDERSTANDING YOUR EXPENSES – CMG Mid Cap Value Fund
As a fund shareholder, you incur ongoing costs, which generally include investment advisory fees and other fund expenses. The information on this page is intended to help you understand the ongoing costs of investing in the fund and to compare these costs with the ongoing costs of investing in other mutual funds.
Analyzing your fund's expenses
To illustrate these ongoing costs, we have provided an example and calculated the expenses paid by investors during the period. The information in the following table is based on an initial investment of $1,000, which is invested at the beginning of the period and held for the entire period. Expense information is calculated two ways and each method provides you with different information. The amount listed in the "actual" column is calculated using the fund's actual operating expenses and total return for the period. The amount listed in the "hypothetical" column assumes that the return each year is 5% before expenses and is calculated based on the fund's actual operating expenses. You should not use the hypothetical account values and expenses to estimate either your actual account balance at the end of the period or the expenses you paid during this period.
Estimating your actual expenses
To estimate the expenses that you paid over the period, first you will need your account balance at the end of the period:
1. Divide your ending account balance by $1,000. For example, if an account balance was $8,600 at the end of the period, the result would be 8.6.
2. In the section of the table below titled "Expenses paid during the period," locate the amount labeled "actual." Multiply this number by the result from step 1. Your answer is an estimate of the expenses you paid on your account during the period.
February 1, 2008 – July 31, 2008
| Account value at the beginning of the period ($) | Account value at the end of the period ($) | Expenses paid during the period ($) | Fund's annualized expense ratio (%) | ||||||||||||||||||||||||
| Actual | Hypothetical | Actual | Hypothetical | Actual | Hypothetical | Actual | |||||||||||||||||||||
| 1,000.00 | 1,000.00 | 933.22 | 1,021.38 | 3.36 | 3.52 | 0.70 | |||||||||||||||||||||
Expenses paid during the period are equal to the fund's annualized expense ratio of 0.70%, multiplied by the average account value over the period, then multiplied by the number of days in the fund's most recent fiscal half-year and divided by 366.
Had the investment advisor and/or any of its affiliates not waived fees or reimbursed a portion of expenses, account value at the end of the period would have been reduced.
It is important to note that the expense amounts shown in the table are meant to highlight only ongoing costs of investing in the fund. Therefore, the hypothetical examples provided may not help you determine the relative total costs of owning shares of different funds.
Compare with other funds
Since all mutual funds are required to include the same hypothetical calculations about expenses in shareholder reports, you can use this information to compare the ongoing costs of investing in the fund with other funds. To do so, compare the 5% hypothetical example with the 5% hypothetical examples that appear in the shareholder reports of other funds. As you compare hypothetical examples of other funds, it is important to note that hypothetical examples are meant to highlight the ongoing costs of investing in a fund.
20
Performance data quoted represents past performance and current performance may be lower or higher. Past performance is no guarantee of future results. The investment return and principal value will fluctuate so that shares, when redeemed, may be worth more or less than the original cost. Please visit www.columbiamanagement.com for daily and most recent month-end performance updates.
CMG SMALL CAP GROWTH FUND
A Portfolio of Columbia Funds Institutional Trust
MANAGEMENT DISCUSSION OF FUND PERFORMANCE
For the 12-month period that ended July 31, 2008, CMG Small Cap Growth Fund returned 1.49%. For the same period, the fund's benchmarks, the Russell 2000 Growth Index and the Russell 2000 Index, returned negative 3.76% and negative 6.71%, respectively.1 The average return of the fund's peer group, the Lipper Small-Cap Growth Funds Classification2, was negative 10.66%. Stock selection, with a focus on companies that have high or improving returns on invested capital, high or improving profit margins and strong management teams, accounted for the fund's strong relative performance. Sector weights remained close to those in the Russell 2000 Growth Index.
Health care stocks, which accounted for approximately 22% of assets, delivered outsized gains. Standouts included ICON (3.0% of net assets), an Irish contract research organization, and NuVasive (1.4% of net assets), a medical device company. ICON benefited as more companies outsourced their clinical drug trials. Nuvasive rose in anticipation of more orthopedic surgeons using its innovative, minimally invasive approach to spine surgery. Illumina (1.5% of net assets), a medical device company, also rallied nicely, buoyed by expectations for its human genome analyzer, a unique tool to help uncover genetic markers for disease.
The fund's materials and energy stocks, which together accounted for another 20% of assets, each had strong returns for the year. In the materials sector, agricultural stocks gained nicely as growing worldwide food consumption drove commodity prices higher. Fertilizer companies, including CF Industries Holdings (1.1% of net assets), did especially well, as farmers sought to increase crop yields. Metals stocks — led by Cleveland-Cliffs (1.2% of net assets), an iron ore producer — also rallied nicely, buoyed by rising demand and improved pricing.
Energy stocks benefited as growing global demand and constrained supply drove oil and natural gas prices to new highs. Standouts included exploration and production companies Concho Resources and PetroHawk Energy (0.9% and 0.7% of net assets, respectively). Other top contributors came from a variety of sectors. Bucyrus International (1.5% of net assets), a mining equipment company, rallied as higher commodity prices led to increased demand for its services. Vocus (1.1% of net assets), which provides online public relations software, climbed as companies looked for ways to cut costs and improve efficiency.
Financial stocks declined, pressured by continued woes in the subprime mortgage sector and tight credit. Detractors included First Cash Financial Services, a pawn shop that suffered as the economy weakened and loan defaults increased. Elsewhere, disappointments included consumer discretionary holdings CROCS and J Crew (0.7% of net assets). CROCS, a footwear maker,
1 The Russell 2000 Growth Index measures the performance of those Russell 2000 Index companies with higher price-to-book ratios and higher forecasted growth values. The Russell 2000 Index measures the performance of the 2,000 smallest of 3,000 largest U.S. companies based on market capitalization. Indices are not investments, do not incur fees or expenses and are not professionally managed. It is not possible to invest directly in an index. Securities in the fund may not match those in an index.
2 Lipper Inc., a widely respected data provider in the industry, calculates an average total return (assuming reinvestment of distributions) for mutual funds with investment objectives similar to those of the fund. Lipper makes no adjustment for the effect of sales loads.
21
sank as sales slowed and inventory grew. J Crew, a clothing retailer, was hurt by the slowdown in consumer spending. In health care, Hologic (1.2% of net assets), which specializes in digital mammography, pulled back after a 2007 acquisition drove the stock price ahead of expectations. We sold First Cash Financial Services and CROCS before period end.
We believe that small-cap stocks, which led the downturn, will be among the first to rebound once the economy improves. In the meantime, investors appear to be willing to pay a premium for companies that can still sustain or grow their earnings. Our focus will remain on small-cap growth companies that can pass on rising input costs through improved pricing, as well as companies that can help other businesses run more efficiently. We plan to remain diversified across sectors, while looking for opportunities in companies with good earnings growth prospects and attractive valuations.
We appreciate your continued confidence in CMG Small Cap Growth Fund.
Portfolio Management
Wayne M. Collette has co-managed the fund since February 2006 and has been with the advisor or its predecessors or affiliate organizations since 2001.
George J. Myers has co-managed the fund since February 2006 and has been with the advisor or its predecessors or affiliate organizations since 2004.
Lawrence W. Lin has co-managed the fund since October 2007 and has been with the advisor or its predecessors or affiliate organizations since 2006.
Brian D. Neigut has co-managed the fund since October 2007 and has been with the advisor or its predecessors or affiliate organizations since 2007.
The fund's top ten holdings (as a percentage of net assets) as of July 31, 2008 were:
| % | |||||||
| ICON | 3.0 | ||||||
| Illumina | 1.5 | ||||||
| Alexion Pharmaceuticals | 1.5 | ||||||
| Atwood Oceanics | 1.5 | ||||||
| Waddell & Reed Financial | 1.5 | ||||||
| Bucyrus International | 1.5 | ||||||
| NuVasive | 1.4 | ||||||
| Intrepid Potash | 1.5 | ||||||
| Terra Industries | 1.3 | ||||||
| OSI Pharmaceuticals | 1.3 | ||||||
Holdings are calculated as a percentage of net assets and are subject to change. Because the fund is actively managed, there is no guarantee the fund will continue to maintain the holdings breakdown listed. The fund's holdings and their weights within the portfolio may change as market conditions change.
Equity investments are affected by stock market fluctuations that occur in response to economic and business developments.
Investing in growth stocks incurs the possibility of losses because their prices are sensitive to changes in current or expected earnings.
Investments in small-cap stocks may be subject to greater volatility and price fluctuations because they may be thinly traded and less liquid than investments in larger companies.
22
Performance data quoted represents past performance and current performance may be lower or higher. Past performance is no guarantee of future results. The investment return and principal value will fluctuate so that shares, when redeemed, may be worth more or less than the original cost. Please visit www.columbiamanagement.com for daily and most recent month-end performance updates.
Average annual total return as of July 31, 2008 (%)
| Inception | 1-year | 5-year | 10-year | ||||||||||||||||
| CMG Small Cap Growth Fund | 08/30/89 | 1.49 | 14.36 | 9.80 | |||||||||||||||
| Russell 2000 Growth Index | -3.76 | 9.27 | 3.94 | ||||||||||||||||
| Russell 2000 Index | -6.71 | 9.75 | 6.81 | ||||||||||||||||
Average annual total return as of June 30, 2008 (%)
| Inception | 1-year | 5-year | 10-year | ||||||||||||||||
| CMG Small Cap Growth Fund | 08/30/89 | -0.39 | 15.44 | 9.45 | |||||||||||||||
| Russell 2000 Growth Index | -10.83 | 10.37 | 2.80 | ||||||||||||||||
| Russell 2000 Index | -16.19 | 10.29 | 5.53 | ||||||||||||||||
Performance results reflect any fee waivers or reimbursements of fund expenses by the investment advisor and/or any of its affiliates. Absent these fee waivers or expense reimbursement arrangements, performance results would have been lower. All results shown assume reinvestment of distributions and do not reflect the deduction of taxes that a shareholder may pay on fund distributions or on the redemption of fund shares.
The fund's annual operating expense ratios, with and without contractual waivers, as stated in the fund's prospectus that is current as of the date of this report, are 0.80% and 1.07%, respectively, of average annual net assets. Differences in expense ratios disclosed elsewhere in this report may result from including fee waivers and expense reimbursements as well as different time periods used in calculating the ratios. The contractual waiver expires 11/30/09.
Growth of a $3,000,000 investment, August 1, 1998 to July 31, 2008
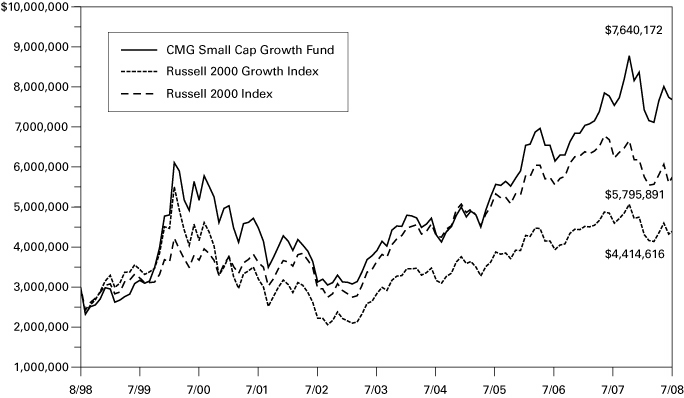
The chart above shows the growth in value of a hypothetical minimum initial $3,000,000 investment in the fund compared to the indices during the stated time period and does not reflect the deduction of taxes that a shareholder may pay on fund distributions or on the redemption of fund shares.
The Russell 2000 Growth Index measures the performance of those Russell 2000 Index companies with higher price-to-book ratios and higher forecasted growth values. The Russell 2000 Index measures the performance of the 2,000 smallest of 3,000 largest U.S. companies based on market capitalization. Indices are not investments, do not incur fees or expenses and are not professionally managed. It is not possible to invest directly in an index. Securities in the fund may not match those in an index.
23
UNDERSTANDING YOUR EXPENSES — CMG Small Cap Growth Fund
As a fund shareholder, you incur ongoing costs, which generally include investment advisory fees and other fund expenses. The information on this page is intended to help you understand the ongoing costs of investing in the fund and to compare these costs with the ongoing costs of investing in other mutual funds.
Analyzing your fund's expenses
To illustrate these ongoing costs, we have provided an example and calculated the expenses paid by investors during the period. The information in the following table is based on an initial investment of $1,000, which is invested at the beginning of the period and held for the entire period. Expense information is calculated two ways and each method provides you with different information. The amount listed in the "actual" column is calculated using the fund's actual operating expenses and total return for the period. The amount listed in the "hypothetical" column assumes that the return each year is 5% before expenses and is calculated based on the fund's actual operating expenses. You should not use the hypothetical account values and expenses to estimate either your actual account balance at the end of the period or the expenses you paid during this period.
Estimating your actual expenses
To estimate the expenses that you paid over the period, first you will need your account balance at the end of the period:
1. Divide your ending account balance by $1,000. For example, if an account balance was $8,600 at the end of the period, the result would be 8.6.
2. In the section of the table below titled "Expenses paid during the period," locate the amount in the column labeled "actual." Multiply this number by the result from step 1. Your answer is an estimate of the expenses you paid on your account during the period.
February 1, 2008 – July 31, 2008
| Account value at the beginning of the period ($) | Account value at the end of the period ($) | Expenses paid during the period ($) | Fund's annualized expense ratio (%) | ||||||||||||||||||||||||
| Actual | Hypothetical | Actual | Hypothetical | Actual | Hypothetical | Actual | |||||||||||||||||||||
| 1,000.00 | 1,000.00 | 1,024.12 | 1,020.89 | 4.03 | 4.02 | 0.80 | |||||||||||||||||||||
Expenses paid during the period are equal to the fund's annualized expense ratio of 0.80%, multiplied by the average account value over the period, then multiplied by the number of days in the fund's most recent fiscal half-year and divided by 366.
Had the investment advisor and/or any of its affiliates not waived fees or reimbursed a portion of expenses, account value at the end of the period would have been reduced.
It is important to note that the expense amounts shown in the table are meant to highlight only ongoing costs of investing in the fund. Therefore, the hypothetical examples provided may not help you determine the relative total costs of owning shares of different funds.
Compare with other funds
Since all mutual funds are required to include the same hypothetical calculations about expenses in shareholder reports, you can use this information to compare the ongoing costs of investing in the fund with other funds. To do so, compare the 5% hypothetical example with the 5% hypothetical examples that appear in the shareholder reports of other funds. As you compare hypothetical examples of other funds, it is important to note that hypothetical examples are meant to highlight the ongoing costs of investing in a fund.
24
Performance data quoted represents past performance and current performance may be lower or higher. Past performance is no guarantee of future results. The investment return and principal value will fluctuate so that shares, when redeemed, may be worth more or less than the original cost. Please visit www.columbiamanagement.com for daily and most recent month-end performance updates.
CMG SMALL CAP VALUE FUND
A Portfolio of Columbia Funds Institutional Trust
MANAGEMENT DISCUSSION OF FUND PERFORMANCE
For the 12-month period that ended July 31, 2008, CMG Small Cap Value Fund returned negative 7.73%. The fund's benchmarks, the Russell 2000 Value Index and the Russell 2000 Index, returned negative 9.95% and negative 6.71%, respectively.1 The fund's return was higher than the average return of its peer group, the Lipper Small-Cap Value Funds Classification, which was negative 11.72% over the same period.2 Although most sectors across the market and across the fund were down for the period, the fund gained some downside protection from stock selection, as well as positive sector weights, particularly in consumer discretionary, health care and financials.
In selecting stocks for the fund, we remained focused on companies with strong balance sheets, positive earnings growth and attractive stock valuations. This strategy worked particularly well during the past year as economic uncertainty triggered concerns about earnings and capital, which pushed investors toward companies with demonstrated financial strength. The fund further benefited from overweights in less economically-sensitive sectors, such as health care, which held up relatively well in the downturn, and underweights in the weakest sectors, including consumer discretionary and financials.
Stock selection was strongest in some of the sectors that declined the most. In consumer discretionary, the fund avoided media stocks and greatly underweighted autos and auto parts —among the sector's worst performing industries. In addition, specialty retail holdings posted strong gains, led by America's Car-Mart (0.6% of net assets), which sells used vehicles in small markets to customers who need financing help. The company benefited from strong execution on its strategy. In financials, the fund successfully avoided some of the biggest blow-ups, while generating returns — particularly from real estate investment trusts and from thrifts and mortgage finance companies — that were down much less than those in the fund's primary benchmark, the Russell 2000 Value Index. An overweight in insurance further aided returns, as did investments in selected commercial banks, such as UMB Financial, a top holding that climbed sharply after reporting record first quarter profits. The stock was sold in the last month of the period.
The fund's health care investments made a positive contribution to return, despite the sector's overall weakness in the index. Stock and industry selection made the difference, particularly among health care providers and services, where we found some higher quality and less expensive stocks. Among the winners were Owens & Minor (0.7% of net assets), a medical and surgical supply distributor, and Amedisys (0.5% of net assets), a home health and hospice provider, both of which generated solid double-digit gains for the year. In addition, life sciences tools and services investments posted strong gains, led by PAREXEL International (0.5% of net
1 The Russell 2000 Value Index measures the performance of those Russell 2000 Index companies with lower price-to-book ratios and lower forecasted growth values. The Russell 2000 Index measures the performance of the 2,000 smallest of 3,000 largest U.S. companies based on market capitalization. Indices are not investments, do not incur fees or expenses and are not professionally managed. It is not possible to invest directly in an index. Securities in the fund may not match those in an index.
2 Lipper Inc., a widely respected data provider in the industry, calculates an average total return (assuming reinvestment of distributions) for mutual funds with investment objectives similar to those of the fund. Lipper makes no adjustment for the effect of sales loads.
25
assets), a contract researcher that saw increased demand from drug companies doing more outsourcing. Other positive contributions versus the Russell 2000 Value Index came from consumer staples, where stock selection was especially helpful in food retailing and food-related companies. Investments in energy, an overweight, did not help relative returns, but were only slightly behind the return posted by the sector in the Russell 2000 Value Index.
Materials stock selection detracted from returns versus the Russell 2000 Value Index. The fund did not own some of the Russell 2000 Value Index's best performers in the metals and mining and agricultural chemicals industries, largely because the stocks had expensive stock valuations and heavy debt loads. Some of these stocks were heavily weighted in the Russell 2000 Value Index and generated triple digit returns as growing global demand pushed commodity prices higher.
The fund remains defensively positioned, both in terms of its focus on higher quality stocks and its sector weights. We are cautiously optimistic about the fund's prospects, largely because of the financial strength and attractive valuations of its holdings. In addition, small-cap stocks have often led the market into a downturn, as they did in this recent cycle, and have the potential to be among the first to recover once investor confidence is restored.
Thank you for investing in CMG Small Cap Value Fund.
Portfolio Management
Stephen Barbaro has managed or co-managed the fund since May 2003 and has been with the advisor or its predecessors or affiliate organizations since 1976.
Jeremy Javidi has co-managed the fund since August 2005 and has been with the advisor or its predecessors or affiliate organizations since 2000.
The fund's top ten holdings (as a percentage of net assets) as of July 31, 2008 were:
| (%) | |||||||
| Cash America International | 1.0 | ||||||
| CH Energy Group | 1.0 | ||||||
| STERIS | 1.0 | ||||||
| Werner Enterprises | 1.0 | ||||||
| Gentiva Health Services | 0.8 | ||||||
| H.B. Fuller | 0.8 | ||||||
| Potlatch | 0.8 | ||||||
| United America Indemnity | 0.8 | ||||||
| Anixter International | 0.8 | ||||||
| MPS Group | 0.8 | ||||||
Holdings are calculated as a percentage of net assets and are subject to change. Because the fund is actively managed, there is no guarantee the fund will continue to maintain the holdings breakdown listed. The fund's holdings and their weights within the portfolio may change as market conditions change.
Equity investments are affected by stock market fluctuations that occur in response to economic and business developments.
Investments in small-cap stocks may be subject to greater volatility and price fluctuations because they may be thinly traded and less liquid than investments in larger companies.
Value stocks are stocks of companies that may have experienced adverse business or industry developments or may be subject to special risks that have caused the stocks to be out of favor and, in the advisors opinion, undervalued. The price of the company's stock may not approach the value the advisor has placed on it.
26
Performance data quoted represents past performance and current performance may be lower or higher. Past performance is no guarantee of future results. The investment return and principal value will fluctuate so that shares, when redeemed, may be worth more or less than the original cost. Please visit www.columbiamanagement.com for daily and most recent month-end performance updates.
Average annual total return as of July 31, 2008 (%)
| Inception | 1-year | 5-year | Life | ||||||||||||||||
| CMG Small Cap Value Fund | 05/05/03 | -7.73 | 11.79 | 13.83 | |||||||||||||||
| Russell 2000 Value Index | -9.95 | 10.05 | 12.52 | ||||||||||||||||
| Russell 2000 Index | -6.71 | 9.75 | 12.53 | ||||||||||||||||
Average annual total return as of June 30, 2008 (%)
| Inception | 1-year | 5-year | Life | ||||||||||||||||
| CMG Small Cap Value Fund | 05/05/03 | -16.51 | 12.08 | 13.22 | |||||||||||||||
| Russell 2000 Value Index | -21.63 | 10.02 | 11.65 | ||||||||||||||||
| Russell 2000 Index | -16.19 | 10.29 | 11.96 | ||||||||||||||||
Index performance is from May 5, 2003.
Performance results reflect any fee waivers or reimbursements of fund expenses by the investment advisor and/or any of its affiliates. Absent these fee waivers or expense reimbursement arrangements, performance results would have been lower. All results shown assume reinvestment of distributions and do not reflect the deduction of taxes that a shareholder may pay on fund distributions or on the redemption of fund shares.
The fund's annual operating expense ratios, with and without contractual waivers, as stated in the fund's prospectus that is current as of the date of this report, are 0.80% and 1.02%, respectively, of average annual net assets. Differences in expense ratios disclosed elsewhere in this report may result from including fee waivers and expense reimbursements as well as different time periods used in calculating the ratios. The contractual waiver expires 03/01/09.
Growth of a $3,000,000 investment, May 5, 2003 to July 31, 2008
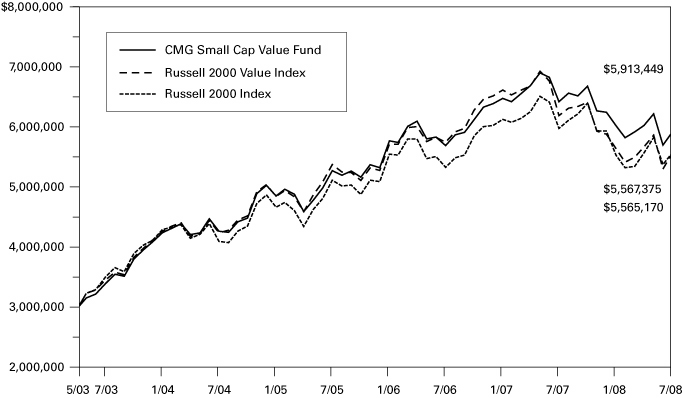
The chart above shows the growth in value of a hypothetical minimum initial $3,000,000 investment in the fund compared to the indices during the stated time period and does not reflect the deduction of taxes that a shareholder may pay on fund distributions or on the redemption of fund shares.
The Russell 2000 Value Index measures the performance of those Russell 2000 Index companies with lower price-to-book ratios and lower forecasted growth values. The Russell 2000 Index measures the performance of the 2,000 smallest of 3,000 largest U.S. companies based on market capitalization. Indices are not investments, do not incur fees or expenses and are not professionally managed. It is not possible to invest directly in an index. Securities in the fund may not match those in an index.
27
UNDERSTANDING YOUR EXPENSES — CMG Small Cap Value Fund
As a fund shareholder, you incur ongoing costs, which generally include investment advisory fees and other fund expenses. The information on this page is intended to help you understand the ongoing costs of investing in the fund and to compare these costs with the ongoing costs of investing in other mutual funds.
Analyzing your fund's expenses
To illustrate these ongoing costs, we have provided an example and calculated the expenses paid by investors during the period. The information in the following table is based on an initial investment of $1,000, which is invested at the beginning of the period and held for the entire period. Expense information is calculated two ways and each method provides you with different information. The amount listed in the "actual" column is calculated using the fund's actual operating expenses and total return for the period. The amount listed in the "hypothetical" column assumes that the return each year is 5% before expenses and is calculated based on the fund's actual operating expenses. You should not use the hypothetical account values and expenses to estimate either your actual account balance at the end of the period or the expenses you paid during this period.
Estimating your actual expenses
To estimate the expenses that you paid over the period, first you will need your account balance at the end of the period:
1. Divide your ending account balance by $1,000. For example, if an account balance was $8,600 at the end of the period, the result would be 8.6.
2. In the section of the table below titled "Expenses paid during the period," locate the amount in the column labeled "actual." Multiply this number by the result from step 1. Your answer is an estimate of the expenses you paid on your account during the period.
February 1, 2008 – July 31, 2008
| Account value at the beginning of the period ($) | Account value at the end of the period ($) | Expenses paid during the period ($) | Fund's annualized expense ratio (%) | ||||||||||||||||||||||||
| Actual | Hypothetical | Actual | Hypothetical | Actual | Hypothetical | Actual | |||||||||||||||||||||
| 1,000.00 | 1,000.00 | 983.99 | 1,020.89 | 3.95 | 4.02 | 0.80 | |||||||||||||||||||||
Expenses paid during the period are equal to the fund's annualized expense ratio of 0.80%, multiplied by the average account value over the period, then multiplied by the number of days in the fund's most recent fiscal half-year and divided by 366.
Had the investment advisor and/or any of its affiliates not waived fees or reimbursed a portion of expenses, account value at the end of the period would have been reduced.
It is important to note that the expense amounts shown in the table are meant to highlight only ongoing costs of investing in the fund. Therefore, the hypothetical examples provided may not help you determine the relative total costs of owning shares of different funds.
Compare with other funds
Since all mutual funds are required to include the same hypothetical calculations about expenses in shareholder reports, you can use this information to compare the ongoing costs of investing in the fund with other funds. To do so, compare the 5% hypothetical example with the 5% hypothetical examples that appear in the shareholder reports of other funds. As you compare hypothetical examples of other funds, it is important to note that hypothetical examples are meant to highlight the ongoing costs of investing in a fund.
28
Performance data quoted represents past performance and current performance may be lower or higher. Past performance is no guarantee of future results. The investment return and principal value will fluctuate so that shares, when redeemed, may be worth more or less than the original cost. Please visit www.columbiamanagement.com for daily and most recent month-end performance updates.
CMG SMALL/MID CAP FUND
A Portfolio of Columbia Funds Institutional Trust
MANAGEMENT DISCUSSION OF FUND PERFORMANCE
For the 12-month period that ended July 31, 2008, CMG Small/Mid Cap Fund returned 2.12%. This return was higher than the returns of the fund's benchmarks, the Russell 2500 Growth Index and the Russell 2500 Index, which returned negative 5.56% and negative 8.42%, respectively.1 The fund also outpaced the negative 7.48% average return of its peer group, the Lipper Mid-Cap Growth Funds Classification,2 for the same period. Stock selection was the key to the fund's strong relative performance. We focused on companies with high or improving returns on invested capital, high or improving profit margins and strong management teams, and our strategy was rewarded by positive performance in a negative environment for stocks overall. Sector weights remained close to those in the Russell 2500 Growth Index, the fund's primary benchmark.
Energy stocks gave the biggest boost to returns, surging as growing global demand, constrained supply and investor interest pushed oil and natural gas prices to new highs. Continental Resources and PetroHawk Energy (1.1% and 1.0% of net assets, respectively), exploration and production companies with strong production growth, each delivered huge returns. Alpha Natural Resources (1.3% of net assets), a coal producer, also was up sharply, buoyed by demand from emerging markets, which helped push coal prices higher.
Materials stocks rallied nicely, led by gains from agricultural stocks. Growing demand for corn, which is used in ethanol, and rising food consumption worldwide pushed commodity prices sharply higher. As farmers looked for ways to boost their crop yields, fertilizer companies, including Potash Corp. of Saskatchewan (1.9% of net assets), profited. Mining stocks, such as Cleveland-Cliffs (1.4% of net assets), an iron ore company, also did well as increased global demand pushed up pricing.
The fund's technology stocks were down much less than those in the Russell 2500 Growth Index, despite concerns that a weak economy would lead corporations to reduce technology spending. We focused on companies with products and services that help businesses reduce expenses and become more efficient. One standout was Vocus (1.1% of net assets), a company that offers online software to improve public relations functions.
Health care stocks, 21.3% of net assets, also helped performance. The fund owned a broad mix of names, from pharmaceuticals to medical devices and health services. ICON (1.4% of net assets), an Irish contract research organization, was a top performer. It rose sharply as more companies outsourced their clinical drug trials. Gains like these more than offset detractors, such as Hologic (1.0% of net assets), which specializes in digital mammography and fell amid worries the stock had gotten ahead of itself.
1 The Russell 2500 Growth Index measures the performance of those Russell 2500 companies with higher price-to-book ratios and higher forecasted growth values. The Russell 2500 Index measures the performance of the 2,500 smallest companies of the Russell 3000 Index. Indices are not investments, do not incur fees or expenses and are not professionally managed. It is not possible to invest directly in an index. Securities in the fund may not match those in an index.
2 Lipper Inc., a widely respected data provider in the industry, calculates an average total return (assuming reinvestment of distributions) for mutual funds with investment objectives similar to those of the fund. Lipper makes no adjustment for the effect of sales loads.
29
Consumer discretionary stocks were down sharply, as the housing downturn and weak economy pressured consumer spending. Detractors included CROCS, a footwear company hit by excess inventory and decelerating sales, and Noah Education, a Chinese-based company that had labeling problems with some of its digital learning devices. Elsewhere, Nii Holdings, a leading Latin American wireless company, declined as competition increased and subscriber growth rates slowed. We sold all three holdings.
Going forward, we plan to focus on companies that are able to pass along higher input costs, companies with good brands and pricing power, even in the face of a weak economy, and companies that can help other businesses save costs by improving their productivity. We plan to maintain a sector-neutral and diversified approach to the small/mid cap market.
We appreciate your continued confidence in the CMG Small/Mid Cap Fund.
Portfolio Management
Wayne M. Collette has co-managed the fund since February 2006 and has been with the advisor or its predecessors or affiliate organizations since 2001.
George J. Myers has co-managed the fund since February 2006 and has been with the advisor or its predecessors or affiliate organizations since 2004.
Lawrence W. Lin has co-managed the fund since October 2007 and has been with the advisor or its predecessors or affiliate organizations since 2006.
Brian D. Neigut has co-managed the fund since October 2007 and has been with the advisor or its predecessors or affiliate organizations since 2007.
The fund's top ten holdings (as a percentage of net assets) as of July 31, 2008 were:
| (%) | |||||||
| Potash Corp. of Saskatchewan | 1.9 | ||||||
| Waddell and Reed Financial | 1.5 | ||||||
| Denbury Resources | 1.4 | ||||||
| Cleveland-Cliffs | 1.4 | ||||||
| ICON | 1.4 | ||||||
| Alpha Natural Resources | 1.3 | ||||||
| Continental Resources | 1.1 | ||||||
| CF Industries | 1.1 | ||||||
| Vocus | 1.1 | ||||||
| Covance | 1.1 | ||||||
Holdings are calculated as a percentage of net assets and are subject to change. Because the fund is actively managed, there is no guarantee the fund will continue to maintain the holdings breakdown listed. The fund's holdings and their weights within the portfolio may change as market conditions change.
Equity investments are affected by stock market fluctuations that occur in response to economic and business developments.
Investing in growth stocks incurs the possibility of losses because their prices are sensitive to changes in current or expected earnings.
Investments in small- and mid-cap stocks may present special risks. They tend to be more volatile and may be less liquid than the stocks of larger companies. Small-cap stocks often have narrower markets, limited financial resources and tend to be more thinly traded than stocks of larger companies.
30
Performance data quoted represents past performance and current performance may be lower or higher. Past performance is no guarantee of future results. The investment return and principal value will fluctuate so that shares, when redeemed, may be worth more or less than the original cost. Please visit www.columbiamanagement.com for daily and most recent month-end performance updates.
Average annual total return as of July 31, 2008 (%)
| Inception | 1-year | 5-year | Life | ||||||||||||||||
| CMG Small/Mid Cap Fund | 12/01/00 | 2.12 | 13.43 | 5.96 | |||||||||||||||
| Russell 2500 Growth Index | -5.56 | 10.11 | 4.26 | ||||||||||||||||
| Russell 2500 Index | -8.42 | 10.48 | 8.22 | ||||||||||||||||
Average annual total return as of June 30, 2008 (%)
| Inception | 1-year | 5-year | Life | ||||||||||||||||
| CMG Small/Mid Cap Fund | 12/01/00 | 1.78 | 14.66 | 6.37 | |||||||||||||||
| Russell 2500 Growth Index | -9.20 | 11.61 | 4.36 | ||||||||||||||||
| Russell 2500 Index | -14.28 | 11.49 | 8.22 | ||||||||||||||||
Index performance is from December 1, 2000.
Performance results reflect any fee waivers or reimbursements of fund expenses by the investment advisor and/or any of its affiliates. Absent these fee waivers or expense reimbursement arrangements, performance results would have been lower. All results shown assume reinvestment of distributions and do not reflect the deduction of taxes that a shareholder may pay on fund distributions or on the redemption of fund shares.
The fund's annual operating expense ratios, with and without contractual waivers, as stated in the fund's prospectus that is current as of the date of this report, are 0.75% and 1.32%, respectively, of average annual net assets. Differences in expense ratios disclosed elsewhere in this report may result from including fee waivers and expense reimbursements as well as different time periods used in calculating the ratios. The contractual waiver expires 03/01/09.
Growth of a $3,000,000 investment, December 1, 2000 to July 31, 2008
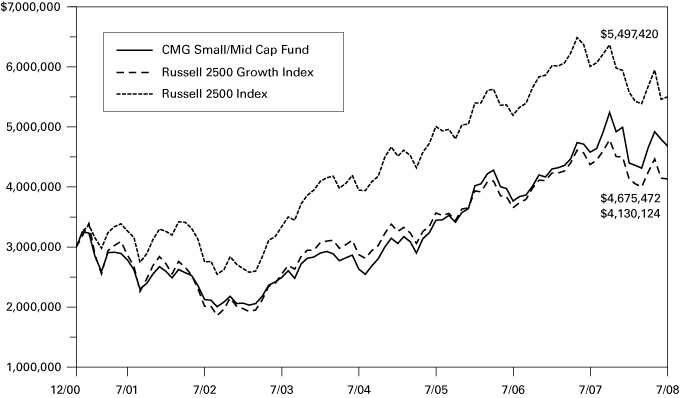
The chart above shows the growth in value of a hypothetical minimum initial $3,000,000 investment in the fund compared to the indices during the stated time period and does not reflect the deduction of taxes that a shareholder may pay on fund distributions or on the redemption of fund shares.
The Russell 2500 Growth Index measures the performance of those Russell 2500 Index companies with higher price-to-book ratios and higher forecasted growth values. The Russell 2500 Index measures the performance of the 2,500 smallest companies of the Russell 3000 Index. Indices are not investments, do not incur fees or expenses and are not professionally managed. It is not possible to invest directly in an index. Securities in the fund may not match those in an index.
31
UNDERSTANDING YOUR EXPENSES — CMG Small/Mid Cap Fund
As a fund shareholder, you incur ongoing costs, which generally include investment advisory fees and other fund expenses. The information on this page is intended to help you understand the ongoing costs of investing in the fund and to compare these costs with the ongoing costs of investing in other mutual funds.
Analyzing your fund's expenses
To illustrate these ongoing costs, we have provided an example and calculated the expenses paid by investors during the period. The information in the following table is based on an initial investment of $1,000, which is invested at the beginning of the period and held for the entire period. Expense information is calculated two ways and each method provides you with different information. The amount listed in the "actual" column is calculated using the fund's actual operating expenses and total return for the period. The amount listed in the "hypothetical" column assumes that the return each year is 5% before expenses and is calculated based on the fund's actual operating expenses. You should not use the hypothetical account values and expenses to estimate either your actual account balance at the end of the period or the expenses you paid during this period.
Estimating your actual expenses
To estimate the expenses that you paid over the period, first you will need your account balance at the end of the period:
1. Divide your ending account balance by $1,000. For example, if an account balance was $8,600 at the end of the period, the result would be 8.6.
2. In the section of the table below titled "Expenses paid during the period," locate the amount in the column labeled "actual." Multiply this number by the result from step 1. Your answer is an estimate of the expenses you paid on your account during the period.
February 1, 2008 – July 31, 2008
| Account value at the beginning of the period ($) | Account value at the end of the period ($) | Expenses paid during the period ($) | Fund's annualized expense ratio (%) | ||||||||||||||||||||||||
| Actual | Hypothetical | Actual | Hypothetical | Actual | Hypothetical | Actual | |||||||||||||||||||||
| 1,000.00 | 1,000.00 | 1,063.80 | 1,021.13 | 3.85 | 3.77 | 0.75 | |||||||||||||||||||||
Expenses paid during the period are equal to the fund's annualized expense ratio of 0.75%, multiplied by the average account value over the period, then multiplied by the number of days in the fund's most recent fiscal half-year and divided by 366.
Had the investment advisor and/or any of its affiliates not waived fees or reimbursed a portion of expenses, account value at the end of the period would have been reduced.
It is important to note that the expense amounts shown in the table are meant to highlight only ongoing costs of investing in the fund. Therefore, the hypothetical examples provided may not help you determine the relative total costs of owning shares of different funds.
Compare with other funds
Since all mutual funds are required to include the same hypothetical calculations about expenses in shareholder reports, you can use this information to compare the ongoing costs of investing in the fund with other funds. To do so, compare the 5% hypothetical example with the 5% hypothetical examples that appear in the shareholder reports of other funds. As you compare hypothetical examples of other funds, it is important to note that hypothetical examples are meant to highlight the ongoing costs of investing in a fund.
32
Performance data quoted represents past performance and current performance may be lower or higher. Past performance is no guarantee of future results. The investment return and principal value will fluctuate so that shares, when redeemed, may be worth more or less than the original cost. Please visit www.columbiamanagement.com for daily and most recent month-end performance updates.
CMG INTERNATIONAL STOCK FUND
A Portfolio of Columbia Funds Institutional Trust
MANAGEMENT DISCUSSION OF FUND PERFORMANCE
For the 12-month period that ended July 31, 2008, CMG International Stock Fund returned negative 13.82%. The fund's return was lower than the return of its benchmarks, the MSCI EAFE Index and the MSCI All Country World ex U.S. Index, which returned negative 12.19% and negative 9.30%, respectively.1 The fund underperformed the average return of its peer group, the Lipper International Multi-Cap Core Classification, which was negative 11.39%.2 Stock selection drove the underperformance relative to the benchmarks. As economic growth slowed, investors were willing to pay a premium for more defensive stocks, such as consumer staples, utilities and health care. Because the fund employs a value strategy, we did not participate in the run-up of these stocks, which we felt were overvalued relative to their earnings prospects. Underweights in Australia and the UK, markets that declined less than other overseas market s, also held back returns.
Individual stocks that underperformed included: MTU Aero Engines Holdings (0.5% of net assets), which suffered from general problems in the airline industry; Societe Generale, a French bank with large U.S. holdings, which was at the center of the credit crisis; and Biovail (0.6% of net assets), a Canadian pharmaceutical company, which declined because one of its blockbuster drugs faced generic competition. Societe Generale was sold, but the others remain in the portfolio.
Utility companies contributed to performance, with the biggest boost coming from British Energy, which owns licenses for some of the available sites for building nuclear power plants. Its share price rose significantly on speculation that it might be a takeover target, and we sold the stock. In Japan, Toyo Suisan Kaisha (0.7% of net assets), a maker of processed foods, surpassed market expectations. In Ireland, Paddy Power (0.7% of net assets), a gaming company, proved to be resilient despite weakness in consumer spending.
We maintained an overweight in China, even though the market declined when the government took measures to slow the economy to reduce inflation. We believe China's rate of economic growth will stabilize at around 10%. In light of this expectation, we have taken advantage of companies with valuations that are on par with competitors in markets that are growing far less than this anticipated growth rate. We added to the position in Brazil, a country rich in fresh water, arable land and other natural resources.
We raised the fund's position in banks from an underweight to a neutral weight relative to its benchmarks, because we believe these stocks have dropped to levels that reflect the worst of the news in the financials sector. We also added commodity stocks after they sold off sharply. Because coal is in short supply, we favored Centennial Coal and PT Bumi Resources and maintained a position in Yanzhou Coal Mining (0.6%, 0.4% and 0.8% of net assets, respectively.)
1 The Morgan Stanley Capital International (MSCI) Europe, Australasia, Far East (EAFE) Index is a free float-adjusted market capitalization index that is designed to measure developed market equity performance, excluding the U.S. and Canada. The MSCI All Country (AC) World ex U.S. Index is an index of global stock market performance that includes developed and emerging markets but excludes the U.S. Indices are not investments, do not incur fees or expenses and are not professionally managed. It is not possible to invest directly in an index. Securities in the fund may not match those in an index.
2 Lipper Inc., a widely respected data provider in the industry, calculates an average total return (assuming reinvestment of distributions) for mutual funds with investment objectives similar to those of the fund. Lipper makes no adjustment for the effect of sales loads.
33
Infrastructure development has been a portfolio theme for a long time, and our relatively large position in ABB in Switzerland (1.0% of net assets), a global engineering company, reflects our belief that trillions of dollars could be spent on infrastructure expansion. Alternative energy is also a focus, with Vestas Wind Systems being an example (1.0% of net assets). While these stocks underperformed during this reporting period, we believe they are multi-year investments that offer exceptional value.
Looking ahead, we anticipate market volatility to continue as weak economic news persists. However, we believe that the market has the potential to rally before news gets better and have positioned the portfolio to take advantage of that outlook.
We appreciate your continued confidence in the CMG International Stock Fund.
Portfolio Management
Fred Copper has managed or co-managed the fund since October 2005 and has been with the advisor or its predecessors or affiliate organization since 2005.
Jasmine (Weili) Huang has co-managed the fund since May 2006 and has been with the advisor or its predecessors or affiliate organization since 2003.
Timothy R. Anderson has co-managed the fund since May 2006 and has been with the advisor or predecessors or affiliate organizations since 2006.
Paul J. DiGiacomo has co-managed the fund since May 2006 and has been with the advisor or predecessors or affiliate organizations since 2006.
Daisuke Nomoto has co-managed the fund since May 2006 and has been with the advisor or its predecessors or affiliate organization since 2005.
The fund's top ten holdings and countries (as a percentage of net assets) as of July 31, 2008 were:
| Holdings | (%) | Countries | (%) | ||||||||||||
| E.ON AG | 2.2 | Japan | 18.8 | ||||||||||||
| Novartis AG, Registered Shares | 2.1 | United Kingdom | 16.3 | ||||||||||||
| Banco Santander SA | 2.1 | Switzerland | 9.3 | ||||||||||||
| Roche Holdings AG, Genusschein Shares | 2.0 | Germany | 7.8 | ||||||||||||
| Total SA | 1.7 | France | 5.9 | ||||||||||||
| Nokia Oyj | 1.7 | United States | 5.3 | ||||||||||||
| BHP Biliton PLC | 1.6 | Spain | 5.0 | ||||||||||||
| AstraZeneca PLC | 1.5 | Singapore | 3.1 | ||||||||||||
| iShares MSCI EAFE Index Fund | 1.5 | Sweden | 2.8 | ||||||||||||
| Vivendi | 1.5 | China | 2.6 | ||||||||||||
Holdings and country breakdowns are disclosed as a percentage of net assets and are subject to change. Because the fund is actively managed, there is no guarantee the fund will continue to maintain the holdings and country breakdown listed. The fund's holdings and their weights within the portfolio may change as market conditions change.
Equity investments are affected by stock market fluctuations that occur in response to economic and business developments.
International investing may involve certain risks, including foreign taxation, currency fluctuation, risks associated with possible differences in financial standards and other monetary and political risks.
A concentration of investments in a specific sector, such as the financials sector, may cause the fund to experience increased volatility.
34
Performance data quoted represents past performance and current performance may be lower or higher. Past performance is no guarantee of future results. The investment return and principal value will fluctuate so that shares, when redeemed, may be worth more or less than the original cost. Please visit www.columbiamanagement.com for daily and most recent month-end performance updates.
Average annual total return as of July 31, 2008 (%)
| Inception | 1-year | 5-year | 10-year | ||||||||||||||||
| CMG International Stock Fund | 02/01/94 | -13.82 | 12.98 | 5.39 | |||||||||||||||
| MSCI EAFE Index | -12.19 | 15.36 | 5.38 | ||||||||||||||||
| MSCI All Country World ex U.S. Index | -9.30 | 17.93 | 7.24 | ||||||||||||||||
Average annual total return as of June 30, 2008 (%)
| Inception | 1-year | 5-year | 10-year | ||||||||||||||||
| CMG International Stock Fund | 02/01/94 | -12.35 | 14.36 | 5.77 | |||||||||||||||
| MSCI EAFE Index | -10.61 | 16.67 | 5.83 | ||||||||||||||||
| MSCI All Country World ex U.S. Index | -6.20 | 19.42 | 7.73 | ||||||||||||||||
Performance results reflect any fee waivers or reimbursements of fund expenses by the investment advisor and/or any of its affiliates. Absent these fee waivers or expense reimbursement arrangements, performance results would have been lower. All results shown assume reinvestment of distributions and do not reflect the deduction of taxes that a shareholder may pay on fund distributions or on the redemption of fund shares.
The fund's annual operating expense ratios, with and without contractual waivers, as stated in the fund's prospectus that is current as of the date of this report, are 0.75% and 0.82%, respectively, of average annual net assets. Differences in expense ratios disclosed elsewhere in this report may result from including fee waivers and expense reimbursements as well as different time periods used in calculating the ratios. The contractual waiver expires 03/01/09.
Growth of a $3,000,000 investment, August 1, 1998 to July 31, 2008
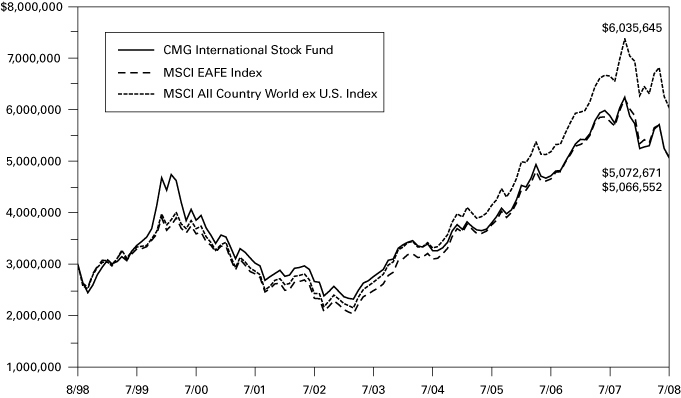
The chart above shows the growth in value of a hypothetical minimum initial $3,000,000 investment in the fund compared to the indices during the stated time period and does not reflect the deduction of taxes that a shareholder may pay on fund distributions or on the redemption of fund shares.
The Morgan Stanley Capital International (MSCI) Europe, Australasia, Far East (EAFE) Index is a free float-adjusted market capitalization index that is designed to measure developed market equity performance, excluding the U.S. and Canada. The MSCI All Country (AC) World ex U.S. Index is an index of global stock market performance that includes developed and emerging markets but excludes the U.S. Indices are not investments, do not incur fees or expenses and are not professionally managed. It is not possible to invest directly in an index. Securities in the fund may not match those in an index.
35
UNDERSTANDING YOUR EXPENSES — CMG International Stock Fund
As a fund shareholder, you incur ongoing costs, which generally include investment advisory fees and other fund expenses. The information on this page is intended to help you understand the ongoing costs of investing in the fund and to compare these costs with the ongoing costs of investing in other mutual funds.
Analyzing your fund's expenses
To illustrate these ongoing costs, we have provided an example and calculated the expenses paid by investors during the period. The information in the following table is based on an initial investment of $1,000, which is invested at the beginning of the period and held for the entire period. Expense information is calculated two ways and each method provides you with different information. The amount listed in the "actual" column is calculated using the fund's actual operating expenses and total return for the period. The amount listed in the "hypothetical" column assumes that the return each year is 5% before expenses and is calculated based on the fund's actual operating expenses. You should not use the hypothetical account values and expenses to estimate either your actual account balance at the end of the period or the expenses you paid during this period.
Estimating your actual expenses
To estimate the expenses that you paid over the period, first you will need your account balance at the end of the period:
1. Divide your ending account balance by $1,000. For example, if an account balance was $8,600 at the end of the period, the result would be 8.6.
2. In the section of the table below titled "Expenses paid during the period," locate the amount in the column labeled "actual." Multiply this number by the result from step 1. Your answer is an estimate of the expenses you paid on your account during the period.
February 1, 2008 – July 31, 2008
| Account value at the beginning of the period ($) | Account value at the end of the period ($) | Expenses paid during the period ($) | Fund's annualized expense ratio (%) | ||||||||||||||||||||||||
| Actual | Hypothetical | Actual | Hypothetical | Actual | Hypothetical | Actual | |||||||||||||||||||||
| 1,000.00 | 1,000.00 | 967.28 | 1,021.13 | 3.67 | 3.77 | 0.75 | |||||||||||||||||||||
Expenses paid during the period are equal to the fund's annualized expense ratio of 0.75%, multiplied by the average account value over the period, then multiplied by the number of days in the fund's most recent fiscal half-year and divided by 366.
Had the investment advisor and/or any of its affiliates not waived fees or reimbursed a portion of expenses, account value at the end of the period would have been reduced.
It is important to note that the expense amounts shown in the table are meant to highlight only ongoing costs of investing in the fund. Therefore, the hypothetical examples provided may not help you determine the relative total costs of owning shares of different funds.
Compare with other funds
Since all mutual funds are required to include the same hypothetical calculations about expenses in shareholder reports, you can use this information to compare the ongoing costs of investing in the fund with other funds. To do so, compare the 5% hypothetical example with the 5% hypothetical examples that appear in the shareholder reports of other funds. As you compare hypothetical examples of other funds, it is important to note that hypothetical examples are meant to highlight the ongoing costs of investing in a fund.
36
CMG ENHANCED S&P 500® INDEX FUND
A Portfolio of Columbia Funds Institutional Trust
FINANCIAL HIGHLIGHTS
(For a Share Outstanding Throughout Each Period)
| Year Ended July 31, | |||||||||||||||||||||||
| 2008 | 2007 | 2006 | 2005 | 2004 | |||||||||||||||||||
| Net asset value, beginning of period | $ | 14.53 | $ | 13.52 | $ | 13.49 | $ | 11.97 | $ | 10.73 | |||||||||||||
| Income from investment operations: | |||||||||||||||||||||||
| Net investment income (a) | 0.25 | 0.25 | 0.23 | 0.24 | (b) | 0.17 | |||||||||||||||||
| Net realized and unrealized gain (loss) on investments and futures contracts | (1.94 | ) | 1.88 | 0.76 | 1.58 | 1.13 | |||||||||||||||||
| Total from investment operations | (1.69 | ) | 2.13 | 0.99 | 1.82 | 1.30 | |||||||||||||||||
| Less distributions to shareholders: | |||||||||||||||||||||||
| From net investment income | (0.22 | ) | (0.22 | ) | (0.25 | ) | (0.20 | ) | (0.05 | ) | |||||||||||||
| From net realized gains | (0.43 | ) | (0.90 | ) | (0.71 | ) | (0.10 | ) | (0.01 | ) | |||||||||||||
| Total distributions to shareholders | (0.65 | ) | (1.12 | ) | (0.96 | ) | (0.30 | ) | (0.06 | ) | |||||||||||||
| Net asset value, end of period | $ | 12.19 | $ | 14.53 | $ | 13.52 | $ | 13.49 | $ | 11.97 | |||||||||||||
| Total return (c)(d) | (12.20 | )% | 15.87 | % | 7.56 | % | 15.32 | % | 12.08 | % | |||||||||||||
| Ratios to average net assets/Supplemental data: | |||||||||||||||||||||||
| Net expenses before interest expense | 0.25 | % | 0.25 | % | 0.25 | % | 0.25 | % | 0.25 | % | |||||||||||||
| Interest expense | - | %(e) | - | %(e) | - | %(e) | - | - | |||||||||||||||
| Net expenses | 0.25 | % | 0.25 | % | 0.25 | % | 0.25 | % | 0.25 | % | |||||||||||||
| Waiver/Reimbursement | 0.05 | % | 0.05 | % | 0.06 | % | 0.04 | % | 0.05 | % | |||||||||||||
| Net investment income | 1.81 | % | 1.73 | % | 1.70 | % | 1.91 | % | 1.43 | % | |||||||||||||
| Portfolio turnover rate | 49 | % | 45 | % | 66 | % | 49 | % | 60 | % | |||||||||||||
| Net assets, end of period (000's) | $ | 165,206 | $ | 222,698 | $ | 100,973 | $ | 91,633 | $ | 98,247 | |||||||||||||
(a) Per share data was calculated using the average shares outstanding during the period.
(b) Net investment income per share reflects a special dividend. The effect of this dividend amounted to $0.04 per share.
(c) Total return at net asset value assuming all distributions reinvested.
(d) Had the investment advisor and/or any of its affiliates not waived fees or reimbursed a portion of expenses, total return would have been reduced.
(e) Rounds to less than 0.01%.
See Accompanying Notes to Financial Statements.
37
CMG LARGE CAP GROWTH FUND
A Portfolio of Columbia Funds Institutional Trust
FINANCIAL HIGHLIGHTS
(For a Share Outstanding Throughout Each Period)
| Year Ended July 31, | Period Ended July 31, | ||||||||||||||||||||||
| 2008 | 2007 | 2006 | 2005 | 2004 (a) | |||||||||||||||||||
| Net asset value, beginning of period | $ | 12.51 | $ | 11.12 | $ | 11.65 | $ | 10.25 | $ | 10.00 | |||||||||||||
| Income from investment operations: | |||||||||||||||||||||||
| Net investment income (b) | 0.07 | 0.08 | 0.07 | 0.12 | (c) | 0.03 | |||||||||||||||||
| Net realized and unrealized gain (loss) on investments | (0.42 | ) | 2.08 | 0.14 | 1.37 | 0.23 | |||||||||||||||||
| Total from investment operations | (0.35 | ) | 2.16 | 0.21 | 1.49 | 0.26 | |||||||||||||||||
| Less distributions to shareholders: | |||||||||||||||||||||||
| From net investment income | (0.07 | ) | (0.08 | ) | (0.08 | ) | (0.09 | ) | (0.01 | ) | |||||||||||||
| From net realized gains | (0.93 | ) | (0.69 | ) | (0.66 | ) | - | - | |||||||||||||||
| Total distributions to shareholders | (1.00 | ) | (0.77 | ) | (0.74 | ) | (0.09 | ) | (0.01 | ) | |||||||||||||
| Net asset value, end of period | $ | 11.16 | $ | 12.51 | $ | 11.12 | $ | 11.65 | $ | 10.25 | |||||||||||||
| Total return (d)(e) | (3.57 | )% | 19.77 | % | 1.63 | % | 14.55 | % | 2.57 | %(f) | |||||||||||||
| Ratios to average net assets/Supplemental data: | |||||||||||||||||||||||
| Net expenses before interest expense | 0.50 | % | 0.50 | % | 0.50 | % | 0.50 | % | 0.50 | %(g) | |||||||||||||
| Interest expense | - | %(h) | - | - | %(h) | - | - | ||||||||||||||||
| Net expenses | 0.50 | % | 0.50 | % | 0.50 | % | 0.50 | % | 0.50 | %(g) | |||||||||||||
| Waiver/Reimbursement | 0.15 | % | 0.16 | % | 0.13 | % | 0.07 | % | 0.14 | %(g) | |||||||||||||
| Net investment income | 0.62 | % | 0.63 | % | 0.62 | % | 1.07 | % | 0.31 | %(g) | |||||||||||||
| Portfolio turnover rate | 161 | % | 179 | % | 180 | % | 120 | % | 114 | %(f) | |||||||||||||
| Net assets, end of period (000's) | $ | 51,230 | $ | 58,978 | $ | 35,765 | $ | 40,312 | $ | 40,684 | |||||||||||||
(a) The Fund commenced investment operations on September 10, 2003. Per share data, total return and portfolio turnover rate reflect activity from that date.
(b) Per share data was calculated using the average shares outstanding during the period.
(c) Net investment income per share reflects a special dividend. The effect of this dividend amounted to $0.05 per share.
(d) Total return at net asset value assuming all distributions reinvested.
(e) Had the investment advisor and/or any of its affiliates not waived fees or reimbursed a portion of expenses, total return would have been reduced.
(f) Not annualized.
(g) Annualized.
(h) Rounds to less than 0.01%.
See Accompanying Notes to Financial Statements.
38
CMG LARGE CAP VALUE FUND
A Portfolio of Columbia Funds Institutional Trust
FINANCIAL HIGHLIGHTS
(For a Share Outstanding Throughout Each Period)
| Year Ended July 31, | Period Ended July 31, | ||||||||||||||||||||||
| 2008 | 2007 | 2006 | 2005 | 2004 (a) | |||||||||||||||||||
| Net asset value, beginning of period | $ | 12.30 | $ | 11.89 | $ | 12.54 | $ | 11.09 | $ | 10.00 | |||||||||||||
| Income from investment operations: | |||||||||||||||||||||||
| Net investment income (b) | 0.23 | 0.22 | 0.22 | 0.24 | 0.18 | ||||||||||||||||||
| Net realized and unrealized gain (loss) on investments and written options | (1.83 | ) | 1.38 | 0.92 | 1.46 | 0.93 | |||||||||||||||||
| Total from investment operations | (1.60 | ) | 1.60 | 1.14 | 1.70 | 1.11 | |||||||||||||||||
| Less distributions to shareholders: | |||||||||||||||||||||||
| From net investment income | (0.22 | ) | (0.22 | ) | (0.28 | ) | (0.22 | ) | (0.02 | ) | |||||||||||||
| From net realized gains | (1.12 | ) | (0.97 | ) | (1.51 | ) | (0.03 | ) | - | ||||||||||||||
| Total distributions to shareholders | (1.34 | ) | (1.19 | ) | (1.79 | ) | (0.25 | ) | (0.02 | ) | |||||||||||||
| Net asset value, end of period | $ | 9.36 | $ | 12.30 | $ | 11.89 | $ | 12.54 | $ | 11.09 | |||||||||||||
| Total return (c)(d) | (14.50 | )% | 13.69 | % | 9.85 | %(e) | 15.41 | %(f) | 11.15 | %(g) | |||||||||||||
| Ratios to average net assets/Supplemental data: | |||||||||||||||||||||||
| Net expenses | 0.50 | % | 0.50 | % | 0.50 | % | 0.50 | % | 0.50 | %(h) | |||||||||||||
| Waiver/Reimbursement | 0.20 | % | 0.18 | % | 0.13 | % | 0.07 | % | 0.14 | %(h) | |||||||||||||
| Net investment income | 2.09 | % | 1.78 | % | 1.78 | % | 1.99 | % | 1.86 | %(h) | |||||||||||||
| Portfolio turnover rate | 57 | % | 92 | % | 97 | % | 45 | % | 46 | %(g) | |||||||||||||
| Net assets, end of period (000's) | $ | 37,741 | $ | 44,830 | $ | 37,280 | $ | 38,731 | $ | 47,855 | |||||||||||||
(a) The Fund commenced investment operations on September 10, 2003. Per share data, total return and portfolio turnover rate reflect activity from that date.
(b) Per share data was calculated using the average shares outstanding during the period.
(c) Total return at net asset value assuming all distributions reinvested.
(d) Had the investment advisor and/or any of its affiliates not waived fees or reimbursed a portion of expenses, total return would have been reduced.
(e) Total return includes a voluntary reimbursement by the investment advisor for a realized investment loss due to a trading error. This reimbursement had an impact of less than 0.01% on the Fund's total return.
(f) Total return includes a reimbursement of loss experienced by the Fund due to a compliance violation. The reimbursement had an impact of less than 0.01% on the Fund's total return.
(g) Not annualized.
(h) Annualized.
See Accompanying Notes to Financial Statements.
39
CMG MID CAP GROWTH FUND
A Portfolio of Columbia Funds Instituional Trust
FINANCIAL HIGHLIGHTS
(For a Share Outstanding Throughout Each Period)
| Year Ended July 31, | |||||||||||||||||||||||
| 2008 | 2007 | 2006 | 2005 | 2004 | |||||||||||||||||||
| Net asset value, beginning of period | $ | 16.48 | $ | 14.98 | $ | 14.15 | $ | 11.04 | $ | 10.93 | |||||||||||||
| Income from investment operations: | |||||||||||||||||||||||
| Net investment income (loss) (a) | (0.01 | ) | 0.09 | 0.01 | (0.03 | ) | (0.05 | ) | |||||||||||||||
| Net realized and unrealized gain on investments, written options and foreign currency | 0.06 | 3.21 | 1.20 | 3.14 | 0.17 | ||||||||||||||||||
| Total from investment operations | 0.05 | 3.30 | 1.21 | 3.11 | 0.12 | ||||||||||||||||||
| Less distributions to shareholders: | |||||||||||||||||||||||
| From net investment income | (0.06 | ) | (0.05 | ) | - | - | - | ||||||||||||||||
| From net realized gains | (2.59 | ) | (1.75 | ) | (0.38 | ) | - | (0.01 | ) | ||||||||||||||
| Total distributions to shareholders | (2.65 | ) | (1.80 | ) | (0.38 | ) | - | (0.01 | ) | ||||||||||||||
| Net asset value, end of period | $ | 13.88 | $ | 16.48 | $ | 14.98 | $ | 14.15 | $ | 11.04 | |||||||||||||
| Total return (b)(c) | (0.67 | )% | 23.22 | % | 8.56 | % | 28.17 | % | 1.06 | % | |||||||||||||
| Ratios to average net assets/Supplemental data: | |||||||||||||||||||||||
| Net expenses | 0.70 | % | 0.70 | % | 0.70 | % | 0.70 | % | 0.70 | % | |||||||||||||
| Waiver/Reimbursement | 0.30 | % | 0.25 | % | 0.20 | % | 0.21 | % | 0.22 | % | |||||||||||||
| Net investment income (loss) | (0.08 | )% | 0.54 | % | 0.08 | % | (0.21 | )% | (0.38 | )% | |||||||||||||
| Portfolio turnover rate | 168 | % | 152 | % | 65 | % | 141 | % | 169 | % | |||||||||||||
| Net assets, end of period (000's) | $ | 25,012 | $ | 28,674 | $ | 23,636 | $ | 24,881 | $ | 19,284 | |||||||||||||
(a) Per share data was calculated using the average shares outstanding during the period.
(b) Total return at net asset value assuming all distributions reinvested.
(c) Had the investment advisor and/or any of its affiliates not waived fees or reimbursed a portion of expenses, total return would have been reduced.
See Accompanying Notes to Financial Statements.
40
CMG MID CAP VALUE FUND
A Portfolio of Columbia Funds Institutional Trust
FINANCIAL HIGHLIGHTS
(For a Share Outstanding Throughout Each Period)
| Year Ended July 31, | |||||||||||||||||||||||
| 2008 | 2007 | 2006 | 2005 | 2004 | |||||||||||||||||||
| Net asset value, beginning of period | $ | 14.09 | $ | 14.02 | $ | 15.17 | $ | 12.58 | $ | 10.69 | |||||||||||||
| Income from investment operations: | |||||||||||||||||||||||
| Net investment income (a) | 0.11 | 0.22 | 0.15 | 0.11 | 0.07 | ||||||||||||||||||
| Net realized and unrealized gain (loss) on investments, written options and foreign currency | (1.80 | ) | 2.34 | 1.14 | 2.66 | 1.84 | |||||||||||||||||
| Total from investment operations | (1.69 | ) | 2.56 | 1.29 | 2.77 | 1.91 | |||||||||||||||||
| Less distributions to shareholders: | |||||||||||||||||||||||
| From net investment income | (0.22 | ) | (0.18 | ) | (0.16 | ) | (0.09 | ) | (0.02 | ) | |||||||||||||
| From net realized gains | (1.28 | ) | (2.31 | ) | (2.28 | ) | (0.09 | ) | - | (b) | |||||||||||||
| Total distributions to shareholders | (1.50 | ) | (2.49 | ) | (2.44 | ) | (0.18 | ) | (0.02 | ) | |||||||||||||
| Net asset value, end of period | $ | 10.90 | $ | 14.09 | $ | 14.02 | $ | 15.17 | $ | 12.58 | |||||||||||||
| Total return (c)(d) | (13.36 | )% | 19.50 | % | 9.30 | % | 22.14 | % | 17.91 | % | |||||||||||||
| Ratios to average net assets/Supplemental data: | |||||||||||||||||||||||
| Net expenses | 0.70 | % | 0.70 | % | 0.70 | % | 0.70 | % | 0.70 | % | |||||||||||||
| Waiver/Reimbursement | 0.44 | % | 0.36 | % | 0.25 | % | 0.19 | % | 0.20 | % | |||||||||||||
| Net investment income | 0.85 | % | 1.49 | % | 1.02 | % | 0.78 | % | 0.54 | % | |||||||||||||
| Portfolio turnover rate | 51 | % | 63 | % | 59 | % | 59 | % | 9 | % | |||||||||||||
| Net assets, end of period (000's) | $ | 17,079 | $ | 19,296 | $ | 17,762 | $ | 21,277 | $ | 21,994 | |||||||||||||
(a) Per share data was calculated using the average shares outstanding during the period.
(b) Rounds to less than $0.01 per share.
(c) Total return at net asset value assuming all distributions reinvested.
(d) Had the investment advisor and/or any of its affiliates not waived fees or reimbursed a portion of expenses, total return would have been reduced.
See Accompanying Notes to Financial Statements.
41
CMG SMALL CAP GROWTH FUND
A Portfolio of Columbia Funds Institutional Trust
FINANCIAL HIGHLIGHTS
(For a Share Outstanding Throughout Each Period)
| Year Ended July 31, | |||||||||||||||||||||||
| 2008 | 2007 | 2006 | 2005 | 2004 | |||||||||||||||||||
| Net asset value, beginning of period | $ | 1.95 | $ | 2.03 | $ | 6.57 | $ | 5.07 | $ | 4.62 | |||||||||||||
| Income from investment operations: | |||||||||||||||||||||||
| Net investment loss (a) | - | (b) | (0.01 | ) | (0.02 | ) | (0.03 | ) | (0.03 | ) | |||||||||||||
| Net realized and unrealized gain on investments, written options and foreign currency | 0.05 | 0.42 | 0.53 | (c) | 1.53 | 0.48 | |||||||||||||||||
| Total from investment operations | 0.05 | 0.41 | 0.51 | 1.50 | 0.45 | ||||||||||||||||||
| Less distributions to shareholders: | |||||||||||||||||||||||
| From net realized gains | (0.28 | ) | (0.49 | ) | (5.05 | )(d) | - | - | |||||||||||||||
| From return of capital | (0.01 | ) | - | - | - | - | |||||||||||||||||
| Total distributions to shareholders | (0.29 | ) | (0.49 | ) | (5.05 | ) | - | - | |||||||||||||||
| Net asset value, end of period | $ | 1.71 | $ | 1.95 | $ | 2.03 | $ | 6.57 | $ | 5.07 | |||||||||||||
| Total return (e) | 1.49 | %(f) | 22.69 | %(f) | 10.46 | %(f) | 29.59 | % | 9.74 | % | |||||||||||||
| Ratios to average net assets/Supplemental data: | |||||||||||||||||||||||
| Net expenses before interest expense (g) | 0.80 | % | 0.80 | % | 1.09 | % | 0.85 | % | 0.79 | % | |||||||||||||
| Interest expense | - | %(h) | - | %(h) | - | - | - | ||||||||||||||||
| Net expenses (g) | 0.80 | % | 0.80 | % | 1.09 | % | 0.85 | % | 0.79 | % | |||||||||||||
| Waiver/Reimbursement | 0.26 | % | 0.27 | % | 0.21 | % | - | - | |||||||||||||||
| Net investment loss (g) | (0.21 | )% | (0.25 | )% | (0.88 | )% | (0.61 | )% | (0.62 | )% | |||||||||||||
| Portfolio turnover rate | 191 | % | 158 | % | 112 | % | 119 | % | 123 | % | |||||||||||||
| Net assets, end of period (000's) | $ | 40,818 | $ | 39,899 | $ | 40,183 | $ | 30,317 | $ | 292,028 | |||||||||||||
(a) Per share data was calculated using the average shares outstanding during the period.
(b) Rounds to less than $0.01 per share.
(c) The amount shown for a share outstanding does not correspond with the aggregate gain (loss) on investments for the period due to timing of sales and repurchases of Fund shares in relation to fluctuating market values of the investments of the Fund.
(d) Capital gain distributions were declared after significant shareholder redemptions reduced the size of the Fund.
(e) Total return at net asset value assuming all distributions reinvested.
(f) Had the investment advisor and/or any of its affiliates not waived fees or reimbursed a portion of expenses, total return would have been reduced.
(g) The benefits derived from custody credits had an impact of less than 0.01%.
(h) Rounds to less than 0.01%.
See Accompanying Notes to Financial Statements.
42
CMG SMALL CAP VALUE FUND
A Portfolio of Columbia Funds Institutional Trust
FINANCIAL HIGHLIGHTS
(For a Share Outstanding Throughout Each Period)
| Year Ended July 31, | |||||||||||||||||||||||
| 2008 | 2007 | 2006 | 2005 | 2004 | |||||||||||||||||||
| Net asset value, beginning of period | $ | 13.94 | $ | 15.31 | $ | 16.06 | $ | 13.91 | $ | 11.29 | |||||||||||||
| Income from investment operations: | |||||||||||||||||||||||
| Net investment income (a) | 0.08 | 0.11 | 0.09 | 0.11 | 0.11 | ||||||||||||||||||
| Net realized and unrealized gain (loss) on investments | (1.08 | ) | 1.82 | 1.06 | 3.11 | 2.79 | |||||||||||||||||
| Total from investment operations | (1.00 | ) | 1.93 | 1.15 | 3.22 | 2.90 | |||||||||||||||||
| Less distributions to shareholders: | |||||||||||||||||||||||
| From net investment income | (0.13 | ) | (0.12 | ) | (0.13 | ) | (0.10 | ) | (0.06 | ) | |||||||||||||
| From net realized gains | (1.75 | ) | (3.18 | ) | (1.77 | ) | (0.97 | ) | (0.22 | ) | |||||||||||||
| Total distributions to shareholders | (1.88 | ) | (3.30 | ) | (1.90 | ) | (1.07 | ) | (0.28 | ) | |||||||||||||
| Net asset value, end of period | $ | 11.06 | $ | 13.94 | $ | 15.31 | $ | 16.06 | $ | 13.91 | |||||||||||||
| Total return (b)(c) | (7.73 | )% | 12.82 | % | 7.90 | %(d) | 23.57 | % | 25.79 | % | |||||||||||||
| Ratios to average net assets/Supplemental data: | |||||||||||||||||||||||
| Net expenses before interest expense | 0.80 | % | 0.80 | % | 0.80 | % | 0.80 | % | 0.80 | % | |||||||||||||
| Interest expense | 0.01 | % | 0.01 | % | - | %(e) | - | - | |||||||||||||||
| Net expenses | 0.81 | % | 0.81 | % | 0.80 | % | 0.80 | % | 0.80 | % | |||||||||||||
| Waiver/Reimbursement | 0.29 | % | 0.22 | % | 0.14 | % | 0.12 | % | 0.09 | % | |||||||||||||
| Net investment income | 0.67 | % | 0.75 | % | 0.60 | % | 0.77 | % | 0.82 | % | |||||||||||||
| Portfolio turnover rate | 49 | % | 50 | % | 37 | % | 41 | % | 53 | % | |||||||||||||
| Net assets, end of period (000's) | $ | 26,748 | $ | 31,952 | $ | 33,439 | $ | 36,989 | $ | 40,356 | |||||||||||||
(a) Per share data was calculated using the average shares outstanding during the period.
(b) Total return at net asset value assuming all distributions reinvested.
(c) Had the investment advisor and/or any of its affiliates not waived fees or reimbursed a portion of expenses, total return would have been reduced.
(d) Total return includes a voluntary reimbursement by the investment advisor for a realized investment loss due to a trading error. This reimbursement had an impact of less than 0.01% on the Fund's total return.
(e) Rounds to less than 0.01%.
See Accompanying Notes to Financial Statements.
43
CMG SMALL/MID CAP FUND
A Portfolio of Columbia Funds Institutional Trust
FINANCIAL HIGHLIGHTS
(For a Share Outstanding Throughout Each Period)
| Year Ended July 31, | |||||||||||||||||||||||
| 2008 | 2007 | 2006 | 2005 | 2004 | |||||||||||||||||||
| Net asset value, beginning of period | $ | 4.56 | $ | 11.24 | $ | 11.49 | $ | 8.77 | $ | 8.30 | |||||||||||||
| Income from investment operations: | |||||||||||||||||||||||
| Net investment loss (a) | (0.01 | ) | - | (b) | (0.05 | ) | (0.04 | ) | (0.05 | ) | |||||||||||||
| Net realized and unrealized gain (loss) on investments, written options and foreign currency | 0.14 | 1.01 | 1.07 | 2.76 | 0.52 | ||||||||||||||||||
| Total from investment operations | 0.13 | 1.01 | 1.02 | 2.72 | 0.47 | ||||||||||||||||||
| Less distributions to shareholders: | |||||||||||||||||||||||
| From net realized gains | (0.66 | ) | (7.69 | )(c) | (1.27 | ) | - | - | |||||||||||||||
| Return of capital | (0.03 | ) | - | - | - | - | |||||||||||||||||
| Total distributions to shareholders | (0.69 | ) | (7.69 | ) | (1.27 | ) | - | - | |||||||||||||||
| Net asset value, end of period | $ | 4.00 | $ | 4.56 | $ | 11.24 | $ | 11.49 | $ | 8.77 | |||||||||||||
| Total return (d)(e) | 2.12 | % | 21.66 | % | 9.17 | %(f) | 31.01 | % | 5.66 | % | |||||||||||||
| Ratios to average net assets/Supplemental data: | |||||||||||||||||||||||
| Net expenses | 0.75 | % | 0.75 | % | 0.75 | % | 0.75 | % | 0.75 | % | |||||||||||||
| Waiver/Reimbursement | 0.52 | % | 0.57 | % | 0.23 | % | 0.09 | % | 0.06 | % | |||||||||||||
| Net investment loss | (0.22 | )% | (0.01 | )% | (0.45 | )% | (0.37 | )% | (0.49 | )% | |||||||||||||
| Portfolio turnover rate | 179 | % | 158 | % | 109 | % | 170 | % | 91 | % | |||||||||||||
| Net assets, end of period (000's) | $ | 11,474 | $ | 12,516 | $ | 8,773 | $ | 38,755 | $ | 50,662 | |||||||||||||
(a) Per share data was calculated using the average shares outstanding during the period.
(b) Rounds to less than $0.01 per share.
(c) Capital gain distributions were declared in the current year after significant shareholder redemptions reduced the size of the Fund in the prior year.
(d) Total return at net asset value assuming all distributions reinvested.
(e) Had the investment advisor and/or any of its affiliates not waived fees or reimbursed a portion of expenses, total return would have been reduced.
(f) Total return includes a voluntary reimbursement by the investment advisor for a realized investment loss due to a trading error. This reimbursement had an impact of less than 0.01% on the Fund's total return.
See Accompanying Notes to Financial Statements.
44
CMG INTERNATIONAL STOCK FUND
A Portfolio of Columbia Funds Institutional Trust
FINANCIAL HIGHLIGHTS
(For a Share Outstanding Throughout Each Period)
| Year Ended July 31, | |||||||||||||||||||||||
| 2008 | 2007 | 2006 | 2005 | 2004 | |||||||||||||||||||
| Net asset value, beginning of period | $ | 14.60 | $ | 14.63 | $ | 13.76 | $ | 12.17 | $ | 10.33 | |||||||||||||
| Income from investment operations: | |||||||||||||||||||||||
| Net investment income (a) | 0.31 | (b) | 0.27 | 0.26 | 0.19 | 0.14 | |||||||||||||||||
| Net realized and unrealized gain (loss) on investments, written options, foreign currency and foreign capital gains tax | (2.14 | ) | 2.98 | 2.85 | 1.79 | 1.76 | |||||||||||||||||
| Total from investment operations | (1.83 | ) | 3.25 | 3.11 | 1.98 | 1.90 | |||||||||||||||||
| Less distributions to shareholders: | |||||||||||||||||||||||
| From net investment income | (0.47 | ) | (0.36 | ) | (0.27 | ) | (0.10 | ) | (0.06 | ) | |||||||||||||
| From net realized gains | (1.65 | ) | (2.92 | ) | (1.97 | ) | (0.29 | ) | - | ||||||||||||||
| Total distributions to shareholders | (2.12 | ) | (3.28 | ) | (2.24 | ) | (0.39 | ) | (0.06 | ) | |||||||||||||
| Net asset value, end of period | $ | 10.65 | $ | 14.60 | $ | 14.63 | $ | 13.76 | $ | 12.17 | |||||||||||||
| Total return (c)(d) . | (13.82 | )%(e) | 24.77 | %(e) | 24.31 | % | 16.31 | % | 18.40 | % | |||||||||||||
| Ratios to average net assets/Supplemental data: | |||||||||||||||||||||||
| Net expenses before interest expense | 0.75 | % | 0.75 | % | 0.75 | % | 0.75 | % | 0.75 | % | |||||||||||||
| Interest expense | - | %(f) | 0.01 | % | 0.01 | % | - | - | |||||||||||||||
| Net expenses | 0.75 | % | 0.76 | % | 0.76 | % | 0.75 | % | 0.75 | % | |||||||||||||
| Waiver/Reimbursement | 0.08 | % | 0.07 | % | 0.06 | % | 0.03 | % | 0.05 | % | |||||||||||||
| Net investment income | 2.51 | % | 1.87 | % | 1.84 | % | 1.47 | % | 1.16 | % | |||||||||||||
| Portfolio turnover rate | 62 | % | 80 | % | 86 | % | 68 | % | 91 | % | |||||||||||||
| Net assets, end of period (000's) | $ | 91,740 | $ | 120,314 | $ | 105,738 | $ | 136,144 | $ | 152,251 | |||||||||||||
(a) Per share data was calculated using the average shares outstanding during the period.
(b) Net investment income per share reflects a special dividend. The effect of this dividend amounted to $0.03 per share.
(c) Total return at net asset value assuming all distributions reinvested.
(d) Had the investment advisor and/or any of its affiliates not waived fees or reimbursed a portion of expenses, total return would have been reduced.
(e) Total return includes a voluntary reimbursement by the investment advisor for a realized investment loss due to a trading error. This reimbursement had an impact of less than 0.01% on the Fund's total return.
(f) Rounds to less than 0.01%.
See Accompanying Notes to Financial Statements.
45
CMG ENHANCED S&P 500® INDEX FUND
A Portfolio of Columbia Funds Institutional Trust
SCHEDULE OF INVESTMENTS
July 31, 2008
| Shares | Value | ||||||||||
| Common Stocks (97.9%) | |||||||||||
| Consumer Discretionary (8.1%) | |||||||||||
| Diversified Consumer Services (0.9%) | |||||||||||
| Apollo Group, Inc., Class A (a) | 16,200 | $ | 1,009,098 | ||||||||
| H&R Block, Inc. | 19,700 | 479,301 | |||||||||
| 1,488,399 | |||||||||||
| Hotels, Restaurants & Leisure (1.5%) | |||||||||||
| Darden Restaurants, Inc. | 5,300 | 172,621 | |||||||||
| McDonald's Corp. | 21,800 | 1,303,422 | |||||||||
| Wyndham Worldwide Corp. | 37,000 | 663,780 | |||||||||
| Yum! Brands, Inc. | 10,900 | 390,438 | |||||||||
| 2,530,261 | |||||||||||
| Internet & Catalog Retail (0.2%) | |||||||||||
| Expedia, Inc. (a) | 10,700 | 209,399 | |||||||||
| IAC/InterActiveCorp (a) | 1,500 | 26,190 | |||||||||
| 235,589 | |||||||||||
| Media (2.9%) | |||||||||||
| CBS Corp., Class B | 31,000 | 507,160 | |||||||||
| DIRECTV Group, Inc. (a)(b) | 48,200 | 1,302,364 | |||||||||
| Gannett Co., Inc. | 17,400 | 315,288 | |||||||||
| McGraw-Hill Companies, Inc. (b) | 6,300 | 256,221 | |||||||||
| New York Times Co., Class A (b) | 2,200 | 27,698 | |||||||||
| Omnicom Group, Inc. | 4,400 | 187,836 | |||||||||
| Time Warner, Inc. | 56,700 | 811,944 | |||||||||
| Viacom, Inc., Class B (a) | 25,600 | 715,008 | |||||||||
| Walt Disney Co. | 21,200 | 643,420 | |||||||||
| 4,766,939 | |||||||||||
| Specialty Retail (2.2%) | |||||||||||
| Abercrombie & Fitch Co., Class A (b) | 1,900 | 104,918 | |||||||||
| Autozone, Inc. (a) | 3,100 | 403,899 | |||||||||
| Best Buy Co., Inc. (b) | 25,000 | 993,000 | |||||||||
| GameStop Corp., Class A (a) | 7,500 | 303,825 | |||||||||
| Gap, Inc. | 50,400 | 812,448 | |||||||||
| Home Depot, Inc. | 24,800 | 590,984 | |||||||||
| Lowe's Companies, Inc. | 100 | 2,032 | |||||||||
| RadioShack Corp. | 24,300 | 405,324 | |||||||||
| Sherwin-Williams Co. (b) | 200 | 10,650 | |||||||||
| TJX Companies, Inc. | 2,100 | 70,791 | |||||||||
| 3,697,871 | |||||||||||
| Textiles, Apparel & Luxury Goods (0.4%) | |||||||||||
| Coach, Inc. (a) | 28,000 | 714,280 | |||||||||
| 13,433,339 | |||||||||||
| Consumer Staples (11.0%) | |||||||||||
| Beverages (2.1%) | |||||||||||
| Brown-Forman Corp., Class B | 200 | 14,392 | |||||||||
| Coca-Cola Co. | 31,700 | 1,632,550 | |||||||||
| PepsiCo, Inc. | 28,000 | 1,863,680 | |||||||||
| 3,510,622 | |||||||||||
See Accompanying Notes to Financial Statements.
46
CMG ENHANCED S&P 500® INDEX FUND
A Portfolio of Columbia Funds Institutional Trust
SCHEDULE OF INVESTMENTS
| Shares | Value | ||||||||||
| Common Stocks (continued) | |||||||||||
| Food & Staples Retailing (2.0%) | |||||||||||
| CVS Caremark Corp. | 22,100 | $ | 806,650 | ||||||||
| Kroger Co. | 14,400 | 407,232 | |||||||||
| SUPERVALU, Inc. | 31,000 | 794,220 | |||||||||
| Sysco Corp. (b) | 5,600 | 158,816 | |||||||||
| Wal-Mart Stores, Inc. | 20,500 | 1,201,710 | |||||||||
| 3,368,628 | |||||||||||
| Food Products (0.6%) | |||||||||||
| General Mills, Inc. | 4,000 | 257,560 | |||||||||
| Kellogg Co. | 6,400 | 339,584 | |||||||||
| Kraft Foods, Inc., Class A | 9,900 | 315,018 | |||||||||
| Sara Lee Corp. | 2,700 | 36,882 | |||||||||
| 949,044 | |||||||||||
| Household Products (2.8%) | |||||||||||
| Clorox Co. | 4,500 | 245,250 | |||||||||
| Colgate-Palmolive Co. | 5,100 | 378,777 | |||||||||
| Kimberly-Clark Corp. | 14,700 | 850,101 | |||||||||
| Procter & Gamble Co. | 47,200 | 3,090,656 | |||||||||
| 4,564,784 | |||||||||||
| Personal Products (0.1%) | |||||||||||
| Avon Products, Inc. | 3,200 | 135,680 | |||||||||
| Estee Lauder Companies, Inc., Class A (b) | 1,300 | 57,330 | |||||||||
| 193,010 | |||||||||||
| Tobacco (3.4%) | |||||||||||
| Altria Group, Inc. | 131,900 | 2,684,165 | |||||||||
| Philip Morris International, Inc. | 38,000 | 1,962,700 | |||||||||
| Reynolds American, Inc. (b) | 17,500 | 977,025 | |||||||||
| 5,623,890 | |||||||||||
| 18,209,978 | |||||||||||
| Energy (14.1%) | |||||||||||
| Energy Equipment & Services (1.5%) | |||||||||||
| BJ Services Co. | 3,000 | 88,200 | |||||||||
| ENSCO International, Inc. | 9,300 | 643,002 | |||||||||
| Halliburton Co. | 12,500 | 560,250 | |||||||||
| National-Oilwell Varco, Inc. (a) | 800 | 62,904 | |||||||||
| Schlumberger Ltd. | 11,100 | 1,127,760 | |||||||||
| 2,482,116 | |||||||||||
| Oil, Gas & Consumable Fuels (12.6%) | |||||||||||
| Anadarko Petroleum Corp. | 11,200 | 648,592 | |||||||||
| Apache Corp. | 7,300 | 818,841 | |||||||||
| Chevron Corp. | 39,800 | 3,365,488 | |||||||||
| ConocoPhillips | 30,000 | 2,448,600 | |||||||||
| EOG Resources, Inc. | 5,600 | 562,968 | |||||||||
| Exxon Mobil Corp. | 83,600 | 6,723,948 | |||||||||
| Hess Corp. | 12,300 | 1,247,220 | |||||||||
| Marathon Oil Corp. | 20,000 | 989,400 | |||||||||
| Noble Energy, Inc. | 2,000 | 147,740 | |||||||||
See Accompanying Notes to Financial Statements.
47
CMG ENHANCED S&P 500® INDEX FUND
A Portfolio of Columbia Funds Institutional Trust
SCHEDULE OF INVESTMENTS
| Shares | Value | ||||||||||
| Common Stocks (continued) | |||||||||||
| Oil, Gas & Consumable Fuels (continued) | |||||||||||
| Occidental Petroleum Corp. | 19,100 | $ | 1,505,653 | ||||||||
| Sunoco, Inc. (b) | 21,800 | 885,298 | |||||||||
| Tesoro Corp. (b) | 7,500 | 115,800 | |||||||||
| Valero Energy Corp. | 38,400 | 1,282,944 | |||||||||
| 20,742,492 | |||||||||||
| 23,224,608 | |||||||||||
| Financials (14.5%) | |||||||||||
| Capital Markets (3.3%) | |||||||||||
| Bank of New York Mellon Corp. | 7,100 | 252,050 | |||||||||
| Charles Schwab Corp. | 35,600 | 814,884 | |||||||||
| Federated Investors, Inc., Class B | 1,500 | 49,290 | |||||||||
| Franklin Resources, Inc. | 3,700 | 372,257 | |||||||||
| Goldman Sachs Group, Inc. | 9,700 | 1,785,188 | |||||||||
| Janus Capital Group, Inc. | 12,500 | 379,250 | |||||||||
| Lehman Brothers Holdings, Inc. (b)(e) | 9,300 | 161,262 | |||||||||
| Merrill Lynch & Co., Inc. (b) | 4,300 | 114,595 | |||||||||
| Morgan Stanley | 27,200 | 1,073,856 | |||||||||
| Northern Trust Corp. | 4,600 | 359,582 | |||||||||
| State Street Corp. | 1,300 | 93,132 | |||||||||
| 5,455,346 | |||||||||||
| Commercial Banks (1.3%) | |||||||||||
| BB&T Corp. (b) | 1,700 | 47,634 | |||||||||
| Regions Financial Corp. (b) | 2,500 | 23,700 | |||||||||
| U.S. Bancorp | 24,400 | 746,884 | |||||||||
| Wachovia Corp. (b) | 5,200 | 89,804 | |||||||||
| Wells Fargo & Co. (b) | 39,100 | 1,183,557 | |||||||||
| 2,091,579 | |||||||||||
| Consumer Finance (0.4%) | |||||||||||
| American Express Co. | 14,600 | 541,952 | |||||||||
| Capital One Financial Corp. (b) | 1,400 | 58,604 | |||||||||
| 600,556 | |||||||||||
| Diversified Financial Services (1.5%) | |||||||||||
| Citigroup, Inc. | 15,600 | 291,564 | |||||||||
| JPMorgan Chase & Co. | 52,300 | 2,124,949 | |||||||||
| Moody's Corp. (b) | 100 | 3,481 | |||||||||
| 2,419,994 | |||||||||||
| Insurance (5.4%) | |||||||||||
| ACE Ltd. | 7,000 | 354,900 | |||||||||
| AFLAC, Inc. | 8,000 | 444,880 | |||||||||
| Allstate Corp. | 12,600 | 582,372 | |||||||||
| American International Group, Inc. | 52,800 | 1,375,440 | |||||||||
| Assurant, Inc. | 4,900 | 294,588 | |||||||||
| Chubb Corp. | 14,600 | 701,384 | |||||||||
| Genworth Financial, Inc., Class A | 1,300 | 20,761 | |||||||||
| Hartford Financial Services Group, Inc. | 10,300 | 652,917 | |||||||||
| Lincoln National Corp. | 2,800 | 133,560 | |||||||||
| Loews Corp. (b) | 15,400 | 686,224 | |||||||||
See Accompanying Notes to Financial Statements.
48
CMG ENHANCED S&P 500® INDEX FUND
A Portfolio of Columbia Funds Institutional Trust
SCHEDULE OF INVESTMENTS
| Shares | Value | ||||||||||
| Common Stocks (continued) | |||||||||||
| Insurance (continued) | |||||||||||
| MetLife, Inc. | 22,700 | $ | 1,152,479 | ||||||||
| Principal Financial Group, Inc. | 2,500 | 106,275 | |||||||||
| Prudential Financial, Inc. | 17,000 | 1,172,490 | |||||||||
| Travelers Companies, Inc. | 25,900 | 1,142,708 | |||||||||
| XL Capital Ltd., Class A (b) | 9,600 | 171,744 | |||||||||
| 8,992,722 | |||||||||||
| Real Estate Investment Trusts (REITs) (2.4%) | |||||||||||
| Developers Diversified Realty Corp. (b) | 7,800 | 249,288 | |||||||||
| Equity Residential Property Trust | 23,000 | 992,910 | |||||||||
| General Growth Properties, Inc. (b) | 1,700 | 46,597 | |||||||||
| Host Hotels & Resorts, Inc. (b) | 66,900 | 877,059 | |||||||||
| ProLogis (b) | 16,400 | 801,632 | |||||||||
| Public Storage | 8,900 | 728,821 | |||||||||
| Simon Property Group, Inc. | 2,900 | 268,627 | |||||||||
| 3,964,934 | |||||||||||
| Thrifts & Mortgage Finance (0.2%) | |||||||||||
| Hudson City Bancorp, Inc. | 23,800 | 434,588 | |||||||||
| 23,959,719 | |||||||||||
| Health Care (12.7%) | |||||||||||
| Biotechnology (2.8%) | |||||||||||
| Amgen, Inc. (a) | 34,400 | 2,154,472 | |||||||||
| Biogen Idec, Inc. (a) | 15,000 | 1,046,400 | |||||||||
| Genzyme Corp. (a) | 400 | 30,660 | |||||||||
| Gilead Sciences, Inc. (a) | 25,500 | 1,376,490 | |||||||||
| 4,608,022 | |||||||||||
| Health Care Equipment & Supplies (2.0%) | |||||||||||
| Baxter International, Inc. | 11,400 | 782,154 | |||||||||
| Boston Scientific Corp. (a) | 11,500 | 136,735 | |||||||||
| Covidien Ltd. | 6,600 | 324,984 | |||||||||
| Medtronic, Inc. | 37,100 | 1,959,993 | |||||||||
| St. Jude Medical, Inc. (a) | 800 | 37,264 | |||||||||
| Zimmer Holdings, Inc. (a) | 500 | 34,455 | |||||||||
| 3,275,585 | |||||||||||
| Health Care Providers & Services (1.8%) | |||||||||||
| Aetna, Inc. | 8,400 | 344,484 | |||||||||
| AmerisourceBergen Corp. | 10,000 | 418,700 | |||||||||
| Cardinal Health, Inc. | 5,900 | 317,007 | |||||||||
| Express Scripts, Inc. (a) | 2,200 | 155,188 | |||||||||
| UnitedHealth Group, Inc. | 19,400 | 544,752 | |||||||||
| WellPoint, Inc. (a) | 24,400 | 1,279,780 | |||||||||
| 3,059,911 | |||||||||||
| Life Sciences Tools & Services (0.6%) | |||||||||||
| Applied Biosystems, Inc. | 9,600 | 354,528 | |||||||||
| PerkinElmer, Inc. | 3,500 | 101,850 | |||||||||
| Thermo Fisher Scientific, Inc. (a) | 9,900 | 599,148 | |||||||||
| 1,055,526 | |||||||||||
See Accompanying Notes to Financial Statements.
49
CMG ENHANCED S&P 500® INDEX FUND
A Portfolio of Columbia Funds Institutional Trust
SCHEDULE OF INVESTMENTS
| Shares | Value | ||||||||||
| Common Stocks (continued) | |||||||||||
| Pharmaceuticals (5.5%) | |||||||||||
| Abbott Laboratories | 13,600 | $ | 766,224 | ||||||||
| Bristol-Myers Squibb Co. | 9,200 | 194,304 | |||||||||
| Eli Lilly & Co. | 5,800 | 273,238 | |||||||||
| Forest Laboratories, Inc. (a) | 22,900 | 813,179 | |||||||||
| Johnson & Johnson | 48,600 | 3,327,642 | |||||||||
| King Pharmaceuticals, Inc. (a) | 15,000 | 172,650 | |||||||||
| Merck & Co., Inc. | 17,600 | 579,040 | |||||||||
| Pfizer, Inc. | 156,400 | 2,919,988 | |||||||||
| 9,046,265 | |||||||||||
| 21,045,309 | |||||||||||
| Industrials (11.0%) | |||||||||||
| Aerospace & Defense (3.7%) | |||||||||||
| Boeing Co. | 29,000 | 1,772,190 | |||||||||
| Honeywell International, Inc. | 10,200 | 518,568 | |||||||||
| L-3 Communications Holdings, Inc. | 4,800 | 473,712 | |||||||||
| Lockheed Martin Corp. | 5,900 | 615,547 | |||||||||
| Northrop Grumman Corp. | 20,300 | 1,368,017 | |||||||||
| Raytheon Co. | 10,100 | 574,993 | |||||||||
| United Technologies Corp. | 12,600 | 806,148 | |||||||||
| 6,129,175 | |||||||||||
| Air Freight & Logistics (1.0%) | |||||||||||
| C.H. Robinson Worldwide, Inc. | 100 | 4,820 | |||||||||
| FedEx Corp. | 3,900 | 307,476 | |||||||||
| United Parcel Service, Inc., Class B | 20,600 | 1,299,448 | |||||||||
| 1,611,744 | |||||||||||
| Commercial Services & Supplies (0.0%) | |||||||||||
| Robert Half International, Inc. | 700 | 17,703 | |||||||||
| Construction & Engineering (0.7%) | |||||||||||
| Fluor Corp. (b) | 4,400 | 357,940 | |||||||||
| Jacobs Engineering Group, Inc. (a)(b) | 10,200 | 788,868 | |||||||||
| 1,146,808 | |||||||||||
| Electrical Equipment (0.7%) | |||||||||||
| Emerson Electric Co. | 9,100 | 443,170 | |||||||||
| Rockwell Automation, Inc. | 17,900 | 796,729 | |||||||||
| 1,239,899 | |||||||||||
| Industrial Conglomerates (3.0%) | |||||||||||
| 3M Co. | 11,900 | 837,641 | |||||||||
| General Electric Co. | 90,900 | 2,571,561 | |||||||||
| Tyco International Ltd. | 33,100 | 1,474,936 | |||||||||
| 4,884,138 | |||||||||||
| Machinery (1.3%) | |||||||||||
| Caterpillar, Inc. (b) | 11,000 | 764,720 | |||||||||
| Ingersoll-Rand Co., Ltd., Class A | 24,400 | 878,400 | |||||||||
| ITT Corp. | 400 | 26,784 | |||||||||
See Accompanying Notes to Financial Statements.
50
CMG ENHANCED S&P 500® INDEX FUND
A Portfolio of Columbia Funds Institutional Trust
SCHEDULE OF INVESTMENTS
| Shares | Value | ||||||||||
| Common Stocks (continued) | |||||||||||
| Machinery (continued) | |||||||||||
| Paccar, Inc. | 100 | $ | 4,206 | ||||||||
| Parker Hannifin Corp. | 2,500 | 154,200 | |||||||||
| Terex Corp. (a) | 7,400 | 350,242 | |||||||||
| 2,178,552 | |||||||||||
| Road & Rail (0.5%) | |||||||||||
| Norfolk Southern Corp. | 5,100 | 366,792 | |||||||||
| Ryder System, Inc. | 7,300 | 481,508 | |||||||||
| 848,300 | |||||||||||
| Trading Companies & Distributors (0.1%) | |||||||||||
| W.W. Grainger, Inc. (b) | 1,200 | 107,412 | |||||||||
| 18,163,731 | |||||||||||
| Information Technology (15.9%) | |||||||||||
| Communications Equipment (1.9%) | |||||||||||
| Cisco Systems, Inc. (a) | 94,500 | 2,078,055 | |||||||||
| Juniper Networks, Inc. (a) | 9,500 | 247,285 | |||||||||
| QUALCOMM, Inc. | 15,800 | 874,372 | |||||||||
| 3,199,712 | |||||||||||
| Computers & Peripherals (4.5%) | |||||||||||
| Apple, Inc. (a) | 7,300 | 1,160,335 | |||||||||
| Dell, Inc. (a) | 30,500 | 749,385 | |||||||||
| Hewlett-Packard Co. | 45,400 | 2,033,920 | |||||||||
| International Business Machines Corp. | 22,800 | 2,917,944 | |||||||||
| Lexmark International, Inc., Class A (a)(b) | 11,000 | 385,880 | |||||||||
| Sun Microsystems, Inc. (a)(b) | 22,400 | 238,112 | |||||||||
| 7,485,576 | |||||||||||
| Internet Software & Services (1.4%) | |||||||||||
| eBay, Inc. (a) | 69,500 | 1,749,315 | |||||||||
| Google, Inc., Class A (a) | 900 | 426,375 | |||||||||
| Yahoo!, Inc. (a) | 5,200 | 103,428 | |||||||||
| 2,279,118 | |||||||||||
| IT Services (0.3%) | |||||||||||
| Western Union Co. | 16,000 | 442,240 | |||||||||
| Semiconductors & Semiconductor Equipment (3.2%) | |||||||||||
| Applied Materials, Inc. | 45,600 | 789,792 | |||||||||
| Intel Corp. | 66,400 | 1,473,416 | |||||||||
| Linear Technology Corp. (b) | 6,900 | 214,245 | |||||||||
| MEMC Electronic Materials, Inc. (a) | 22,100 | 1,021,241 | |||||||||
| National Semiconductor Corp. | 800 | 16,760 | |||||||||
| NVIDIA Corp. (a) | 17,100 | 195,624 | |||||||||
| Texas Instruments, Inc. | 63,000 | 1,535,940 | |||||||||
| 5,247,018 | |||||||||||
| Software (4.6%) | |||||||||||
| Autodesk, Inc. (a) | 21,200 | 676,068 | |||||||||
| Compuware Corp. (a) | 16,700 | 183,700 | |||||||||
| Microsoft Corp. (c) | 181,800 | 4,675,896 | |||||||||
See Accompanying Notes to Financial Statements.
51
CMG ENHANCED S&P 500® INDEX FUND
A Portfolio of Columbia Funds Institutional Trust
SCHEDULE OF INVESTMENTS
| Shares | Value | ||||||||||
| Common Stocks (continued) | |||||||||||
| Software (continued) | |||||||||||
| Oracle Corp. (a) | 73,600 | $ | 1,584,608 | ||||||||
| Symantec Corp. (a) | 21,700 | 457,219 | |||||||||
| 7,577,491 | |||||||||||
| 26,231,155 | |||||||||||
| Materials (3.8%) | |||||||||||
| Chemicals (1.9%) | |||||||||||
| Dow Chemical Co. | 25,000 | 832,750 | |||||||||
| E.I. Du Pont de Nemours & Co. (b) | 9,800 | 429,338 | |||||||||
| Monsanto Co. | 9,900 | 1,179,189 | |||||||||
| PPG Industries, Inc. (b) | 1,200 | 72,768 | |||||||||
| Rohm and Haas Co. | 7,900 | 592,500 | |||||||||
| 3,106,545 | |||||||||||
| Metals & Mining (1.6%) | |||||||||||
| AK Steel Holding Corp. | 2,100 | 133,350 | |||||||||
| Alcoa, Inc. | 6,300 | 212,625 | |||||||||
| Allegheny Technologies, Inc. (b) | 6,700 | 316,843 | |||||||||
| Freeport-McMoRan Copper & Gold, Inc. | 11,300 | 1,093,275 | |||||||||
| Nucor Corp. | 12,800 | 732,416 | |||||||||
| United States Steel Corp. | 700 | 112,252 | |||||||||
| 2,600,761 | |||||||||||
| Paper & Forest Products (0.3%) | |||||||||||
| International Paper Co. | 22,300 | 618,156 | |||||||||
| 6,325,462 | |||||||||||
| Telecommunication Services (3.1%) | |||||||||||
| Diversified Telecommunication Services (2.9%) | |||||||||||
| AT&T, Inc. | 88,300 | 2,720,523 | |||||||||
| CenturyTel, Inc. | 300 | 11,157 | |||||||||
| Embarq Corp. | 4,500 | 205,965 | |||||||||
| Qwest Communications International, Inc. (b) | 66,700 | 255,461 | |||||||||
| Verizon Communications, Inc. | 48,100 | 1,637,324 | |||||||||
| 4,830,430 | |||||||||||
| Wireless Telecommunication Services (0.2%) | |||||||||||
| American Tower Corp., Class A (a) | 400 | 16,760 | |||||||||
| Sprint Nextel Corp. | 33,600 | 273,504 | |||||||||
| 290,264 | |||||||||||
| 5,120,694 | |||||||||||
| Utilities (3.7%) | |||||||||||
| Electric Utilities (2.3%) | |||||||||||
| American Electric Power Co., Inc. | 1,800 | 71,100 | |||||||||
| Duke Energy Corp. | 4,900 | 86,142 | |||||||||
| Edison International | 21,000 | 1,015,140 | |||||||||
| Exelon Corp. | 3,200 | 251,584 | |||||||||
| FirstEnergy Corp. | 16,400 | 1,206,220 | |||||||||
| FPL Group, Inc. | 4,800 | 309,744 | |||||||||
See Accompanying Notes to Financial Statements.
52
CMG ENHANCED S&P 500® INDEX FUND
A Portfolio of Columbia Funds Institutional Trust
SCHEDULE OF INVESTMENTS
| Shares | Value | ||||||||||
| Common Stocks (continued) | |||||||||||
| Electric Utilities (continued) | |||||||||||
| Pepco Holdings, Inc. | 28,300 | $ | 705,802 | ||||||||
| Pinnacle West Capital Corp. | 2,000 | 67,140 | |||||||||
| Progress Energy, Inc. | 200 | 8,462 | |||||||||
| 3,721,334 | |||||||||||
| Gas Utilities (0.0%) | |||||||||||
| Questar Corp. | 400 | 21,152 | |||||||||
| Independent Power Producers & Energy Traders (0.7%) | |||||||||||
| Constellation Energy Group, Inc. | 13,300 | 1,106,028 | |||||||||
| Multi-Utilities (0.7%) | |||||||||||
| CenterPoint Energy, Inc. | 14,000 | 220,780 | |||||||||
| Integrys Energy Group, Inc. (b) | 6,400 | 326,784 | |||||||||
| NiSource, Inc. (b) | 100 | 1,708 | |||||||||
| PG&E Corp. | 1,200 | 46,236 | |||||||||
| Public Service Enterprise Group, Inc. | 14,000 | 585,200 | |||||||||
| 1,180,708 | |||||||||||
| 6,029,222 | |||||||||||
| Total Common Stocks (Cost of $166,202,308) | 161,743,217 | ||||||||||
| Securities Lending Collateral (7.9%) | |||||||||||
| State Street Navigator Securities Lending Prime Portfolio (d) (7 day yield of 2.654%) | 13,161,109 | 13,161,109 | |||||||||
| Total Securities Lending Collateral (Cost of $13,161,109) | 13,161,109 | ||||||||||
| Par | |||||||||||
| Short-Term Obligation (1.8%) | |||||||||||
| Repurchase agreement with Fixed Income Clearing Corp., dated 07/31/08, due 08/01/08, at 2.070%, collateralized by a U.S. Government Agency Obligation maturing 05/06/10, market value $2,979,825 (repurchase proceeds $2,920,168) | $ | 2,920,000 | 2,920,000 | ||||||||
| Total Short-Term Obligation (Cost of $2,920,000) | 2,920,000 | ||||||||||
| Total Investments (107.6%) (Cost of $182,283,417) (f) | 177,824,326 | ||||||||||
| Obligation to Return Collateral for Securities Loaned (-7.9%) | (13,161,109 | ) | |||||||||
| Other Assets & Liabilities, Net (0.3%) | 543,156 | ||||||||||
| Net Assets (100.0%) | $ | 165,206,373 | |||||||||
See Accompanying Notes to Financial Statements.
53
CMG ENHANCED S&P 500® INDEX FUND
A Portfolio of Columbia Funds Institutional Trust
SCHEDULE OF INVESTMENTS
Notes to Schedule of Investments:
(a) Non-income producing security.
(b) All or a portion of this security was on loan at July 31, 2008. The total market value of securities on loan at July 31, 2008 is $12,577,303.
(c) The security or a portion of the security is pledged as collateral for open futures contracts. At July 31, 2008, the total market value of securities pledged amounted to $1,131,680.
(d) Investment made with cash collateral received from securities lending activity.
(e) The issuer filed for bankruptcy protection under Chapter 11 on September 15, 2008.
(f) Cost for federal income tax purposes is $182,499,201.
At July 31, 2008, the Fund held the following open long futures contract:
| Type | Number of Contracts | Value | Aggregate Face Value | Expiration Date | Unrealized Appreciation | ||||||||||||||||||
| S&P 500 Index | 11 | $ | 3,484,525 | $ | 3,476,205 | Sep-08 | $ | 8,320 | |||||||||||||||
At July 31, 2008, the Fund held investments in the following sectors:
| Sector (Unaudited) | % of Net Assets | ||||||
| Information Technology | 15.9 | ||||||
| Financials | 14.5 | ||||||
| Energy | 14.1 | ||||||
| Health Care | 12.7 | ||||||
| Consumer Staples | 11.0 | ||||||
| Industrials | 11.0 | ||||||
| Consumer Discretionary | 8.1 | ||||||
| Materials | 3.8 | ||||||
| Utilities | 3.7 | ||||||
| Telecommunication Services | 3.1 | ||||||
| 97.9 | |||||||
| Securities Lending Collateral | 7.9 | ||||||
| Short-Term Obligation | 1.8 | ||||||
| Obligation to Return Collateral for Securities Loaned | (7.9 | ) | |||||
| Other Assets & Liabilities, Net | 0.3 | ||||||
| 100.0 | |||||||
See Accompanying Notes to Financial Statements.
54
CMG LARGE CAP GROWTH FUND
A Portfolio of Columbia Funds Institutional Trust
SCHEDULE OF INVESTMENTS
July 31, 2008
| Shares | Value | ||||||||||
| Common Stocks (98.1%) | |||||||||||
| Consumer Discretionary (8.4%) | |||||||||||
| Hotels, Restaurants & Leisure (1.6%) | |||||||||||
| Burger King Holdings, Inc. (a) | 15,780 | $ | 423,377 | ||||||||
| McDonald's Corp. | 6,250 | 373,688 | |||||||||
| 797,065 | |||||||||||
| Media (2.7%) | |||||||||||
| Comcast Corp., Class A | 13,890 | 286,412 | |||||||||
| DIRECTV Group, Inc. (a)(b) | 28,880 | 780,337 | |||||||||
| McGraw-Hill Companies, Inc. | 7,610 | 309,499 | |||||||||
| 1,376,248 | |||||||||||
| Multiline Retail (0.5%) | |||||||||||
| Kohl's Corp. (a)(b) | 6,560 | 274,929 | |||||||||
| Specialty Retail (2.6%) | |||||||||||
| Best Buy Co., Inc. (a) | 5,940 | 235,937 | |||||||||
| Dick's Sporting Goods, Inc. (a)(b) | 9,480 | 166,374 | |||||||||
| Staples, Inc. (a) | 22,520 | 506,700 | |||||||||
| Urban Outfitters, Inc. (a)(b) | 12,930 | 426,819 | |||||||||
| 1,335,830 | |||||||||||
| Textiles, Apparel & Luxury Goods (1.0%) | |||||||||||
| Hanesbrands, Inc. (a)(b) | 3,690 | 79,114 | |||||||||
| NIKE, Inc., Class B | 7,290 | 427,777 | |||||||||
| 506,891 | |||||||||||
| 4,290,963 | |||||||||||
| Consumer Staples (11.2%) | |||||||||||
| Beverages (2.1%) | |||||||||||
| Molson Coors Brewing Co., Class B (a) | 9,560 | 515,953 | |||||||||
| PepsiCo, Inc. | 8,850 | 589,056 | |||||||||
| 1,105,009 | |||||||||||
| Food & Staples Retailing (4.4%) | |||||||||||
| BJ's Wholesale Club, Inc. (a)(b) | 11,520 | 432,345 | |||||||||
| CVS Caremark Corp. | 9,930 | 362,445 | |||||||||
| Kroger Co. | 11,970 | 338,512 | |||||||||
| Wal-Mart Stores, Inc. | 19,160 | 1,123,159 | |||||||||
| 2,256,461 | |||||||||||
| Food Products (2.2%) | |||||||||||
| Cadbury PLC, ADR (a) | 4,049 | 191,801 | |||||||||
| General Mills, Inc. (a) | 6,150 | 395,999 | |||||||||
| H.J. Heinz Co. | 11,030 | 555,691 | |||||||||
| 1,143,491 | |||||||||||
| Household Products (0.8%) | |||||||||||
| Procter & Gamble Co. | 6,020 | 394,190 | |||||||||
| Tobacco (1.7%) | |||||||||||
| Philip Morris International, Inc. | 16,730 | 864,105 | |||||||||
| 5,763,256 | |||||||||||
See Accompanying Notes to Financial Statements.
55
CMG LARGE CAP GROWTH FUND
A Portfolio of Columbia Funds Institutional Trust
SCHEDULE OF INVESTMENTS
| Shares | Value | ||||||||||
| Common Stocks (continued) | |||||||||||
| Energy (10.6%) | |||||||||||
| Energy Equipment & Services (6.4%) | |||||||||||
| Halliburton Co. (a) | 14,200 | $ | 636,444 | ||||||||
| Nabors Industries Ltd. (a)(b) | 14,500 | 528,670 | |||||||||
| Schlumberger Ltd. | 9,760 | 991,616 | |||||||||
| Transocean, Inc. (b) | 4,935 | 671,308 | |||||||||
| Weatherford International Ltd. (b) | 12,570 | 474,266 | |||||||||
| 3,302,304 | |||||||||||
| Oil, Gas & Consumable Fuels (4.2%) | |||||||||||
| CONSOL Energy, Inc. (a) | 4,700 | 349,633 | |||||||||
| Devon Energy Corp. | 2,590 | 245,765 | |||||||||
| El Paso Corp. (a) | 25,380 | 455,064 | |||||||||
| Hess Corp. | 3,950 | 400,530 | |||||||||
| Occidental Petroleum Corp. | 4,270 | 336,604 | |||||||||
| Petroleo Brasileiro SA, ADR | 6,590 | 368,447 | |||||||||
| 2,156,043 | |||||||||||
| 5,458,347 | |||||||||||
| Financials (4.3%) | |||||||||||
| Capital Markets (4.3%) | |||||||||||
| Goldman Sachs Group, Inc. | 3,390 | 623,896 | |||||||||
| Janus Capital Group, Inc. (a) | 13,520 | 410,197 | |||||||||
| State Street Corp. | 5,250 | 376,110 | |||||||||
| TD Ameritrade Holding Corp. (b) | 20,250 | 403,177 | |||||||||
| Waddell & Reed Financial, Inc., Class A | 11,210 | 374,414 | |||||||||
| 2,187,794 | |||||||||||
| Health Care (13.7%) | |||||||||||
| Biotechnology (5.1%) | |||||||||||
| Amgen, Inc. (b) | 12,350 | 773,480 | |||||||||
| BioMarin Pharmaceuticals, Inc. (a)(b) | 6,180 | 201,159 | |||||||||
| Celgene Corp. (b) | 8,900 | 671,861 | |||||||||
| Genentech, Inc. (b) | 7,260 | 691,515 | |||||||||
| Gilead Sciences, Inc. (b) | 4,920 | 265,582 | |||||||||
| 2,603,597 | |||||||||||
| Health Care Equipment & Supplies (2.0%) | |||||||||||
| Baxter International, Inc. | 8,390 | 575,638 | |||||||||
| Covidien Ltd. (a) | 7,330 | 360,929 | |||||||||
| Edwards Lifesciences Corp. (a)(b) | 1,310 | 82,111 | |||||||||
| 1,018,678 | |||||||||||
| Health Care Providers & Services (1.0%) | |||||||||||
| Express Scripts, Inc. (b) | 7,440 | 524,818 | |||||||||
| Life Sciences Tools & Services (1.8%) | |||||||||||
| Covance, Inc. (a)(b) | 4,780 | 438,804 | |||||||||
| Thermo Fisher Scientific, Inc. (b) | 7,631 | 461,828 | |||||||||
| 900,632 | |||||||||||
See Accompanying Notes to Financial Statements.
56
CMG LARGE CAP GROWTH FUND
A Portfolio of Columbia Funds Institutional Trust
SCHEDULE OF INVESTMENTS
| Shares | Value | ||||||||||
| Common Stocks (continued) | |||||||||||
| Pharmaceuticals (3.8%) | |||||||||||
| Johnson & Johnson (a) | 13,470 | $ | 922,291 | ||||||||
| Schering-Plough Corp. (a) | 11,220 | 236,517 | |||||||||
| Teva Pharmaceutical Industries Ltd., ADR | 7,200 | 322,848 | |||||||||
| Wyeth | 12,090 | 489,887 | |||||||||
| 1,971,543 | |||||||||||
| 7,019,268 | |||||||||||
| Industrials (13.1%) | |||||||||||
| Aerospace & Defense (3.1%) | |||||||||||
| Goodrich Corp. | 8,160 | 400,982 | |||||||||
| Honeywell International, Inc. | 12,950 | 658,378 | |||||||||
| Raytheon Co. (a) | 9,280 | 528,311 | |||||||||
| 1,587,671 | |||||||||||
| Commercial Services & Supplies (1.1%) | |||||||||||
| Dun & Bradstreet Corp. (a) | 5,780 | 558,579 | |||||||||
| Construction & Engineering (0.9%) | |||||||||||
| Quanta Services, Inc. (a)(b) | 14,800 | 457,024 | |||||||||
| Electrical Equipment (0.5%) | |||||||||||
| First Solar, Inc. (b) | 800 | 228,088 | |||||||||
| Industrial Conglomerates (0.7%) | |||||||||||
| General Electric Co. | 12,310 | 348,250 | |||||||||
| Machinery (5.5%) | |||||||||||
| Caterpillar, Inc. (a) | 4,990 | 346,905 | |||||||||
| Cummins, Inc. | 5,210 | 345,631 | |||||||||
| Eaton Corp. (a) | 3,110 | 220,934 | |||||||||
| Harsco Corp. | 5,320 | 287,812 | |||||||||
| Illinois Tool Works, Inc. (a) | 8,230 | 385,576 | |||||||||
| Joy Global, Inc. | 6,800 | 491,096 | |||||||||
| SPX Corp. (a) | 5,960 | 755,609 | |||||||||
| 2,833,563 | |||||||||||
| Road & Rail (1.3%) | |||||||||||
| Union Pacific Corp. | 8,330 | 686,725 | |||||||||
| 6,699,900 | |||||||||||
| Information Technology (29.7%) | |||||||||||
| Communications Equipment (5.9%) | |||||||||||
| Cisco Systems, Inc. (b) | 43,890 | 965,141 | |||||||||
| Corning, Inc. | 21,850 | 437,219 | |||||||||
| QUALCOMM, Inc. | 29,400 | 1,626,996 | |||||||||
| 3,029,356 | |||||||||||
See Accompanying Notes to Financial Statements.
57
CMG LARGE CAP GROWTH FUND
A Portfolio of Columbia Funds Institutional Trust
SCHEDULE OF INVESTMENTS
| Shares | Value | ||||||||||
| Common Stocks (continued) | |||||||||||
| Computers & Peripherals (8.1%) | |||||||||||
| Apple, Inc. (b) | 7,230 | $ | 1,149,208 | ||||||||
| Dell, Inc. (b) | 13,870 | 340,786 | |||||||||
| EMC Corp. (a)(b) | 31,250 | 469,063 | |||||||||
| Hewlett-Packard Co. | 19,670 | 881,216 | |||||||||
| International Business Machines Corp. (a) | 10,290 | 1,316,914 | |||||||||
| 4,157,187 | |||||||||||
| Electronic Equipment & Instruments (0.9%) | |||||||||||
| Dolby Laboratories, Inc., Class A (b) | 4,740 | 192,871 | |||||||||
| FLIR Systems, Inc. (a)(b) | 6,740 | 274,587 | |||||||||
| 467,458 | |||||||||||
| Internet Software & Services (3.2%) | |||||||||||
| Equinix, Inc. (a)(b) | 3,960 | 322,185 | |||||||||
| Google, Inc., Class A (b) | 2,528 | 1,197,640 | |||||||||
| VeriSign, Inc. (a)(b) | 3,420 | 111,287 | |||||||||
| 1,631,112 | |||||||||||
| IT Services (1.5%) | |||||||||||
| Accenture Ltd., Class A | 10,860 | 453,514 | |||||||||
| MasterCard, Inc., Class A (a) | 1,290 | 314,953 | |||||||||
| 768,467 | |||||||||||
| Semiconductors & Semiconductor Equipment (3.6%) | |||||||||||
| Applied Materials, Inc. (a) | 19,290 | 334,103 | |||||||||
| Broadcom Corp., Class A (b) | 13,560 | 329,373 | |||||||||
| Intel Corp. | 30,390 | 674,354 | |||||||||
| Intersil Corp., Class A (a) | 10,280 | 248,056 | |||||||||
| Microchip Technology, Inc. (a) | 8,360 | 266,935 | |||||||||
| 1,852,821 | |||||||||||
| Software (6.5%) | |||||||||||
| Activision Blizzard, Inc. (b) | 16,740 | 602,305 | |||||||||
| BMC Software, Inc. (a)(b) | 10,270 | 337,780 | |||||||||
| Microsoft Corp. | 43,450 | 1,117,534 | |||||||||
| Oracle Corp. (b) | 46,520 | 1,001,576 | |||||||||
| Salesforce.com, Inc. (a)(b) | 4,040 | 257,712 | |||||||||
| 3,316,907 | |||||||||||
| 15,223,308 | |||||||||||
| Materials (3.7%) | |||||||||||
| Chemicals (1.5%) | |||||||||||
| Monsanto Co. | 4,228 | 503,597 | |||||||||
| Praxair, Inc. (a) | 2,940 | 275,566 | |||||||||
| 779,163 | |||||||||||
| Metals & Mining (2.2%) | |||||||||||
| Freeport-McMoRan Copper & Gold, Inc. | 4,880 | 472,140 | |||||||||
| Goldcorp, Inc. | 6,470 | 241,655 | |||||||||
| United States Steel Corp. | 2,390 | 383,260 | |||||||||
| 1,097,055 | |||||||||||
| 1,876,218 | |||||||||||
See Accompanying Notes to Financial Statements.
58
CMG LARGE CAP GROWTH FUND
A Portfolio of Columbia Funds Institutional Trust
SCHEDULE OF INVESTMENTS
| Shares | Value | ||||||||||
| Common Stocks (continued) | |||||||||||
| Telecommunication Services (2.3%) | |||||||||||
| Wireless Telecommunication Services (2.3%) | |||||||||||
| American Tower Corp., Class A (b) | 14,400 | $ | 603,360 | ||||||||
| NII Holdings, Inc. (a)(b) | 10,370 | 566,824 | |||||||||
| 1,170,184 | |||||||||||
| Utilities (1.1%) | |||||||||||
| Electric Utilities (1.1%) | |||||||||||
| Entergy Corp. | 5,540 | 592,337 | |||||||||
| Total Common Stocks (Cost of $46,749,328) | 50,281,575 | ||||||||||
| Securities Lending Collateral (23.2%) | |||||||||||
| State Street Navigator Securities Lending Prime Portfolio (c) (7 day yield of 2.654%) | 11,888,773 | 11,888,773 | |||||||||
| Total Securities Lending Collateral (Cost of $11,888,773) | 11,888,773 | ||||||||||
| Par | |||||||||||
| Short-Term Obligation (2.1%) | |||||||||||
| Repurchase agreement with Fixed Income Clearing Corp., dated 07/31/08, due 08/01/08 at 1.990%, collateralized by a U.S. Treasury Obligation maturing 05/15/13, market value $1,091,400 (repurchase proceeds $1,070,059) | $ | 1,070,000 | 1,070,000 | ||||||||
| Total Short-Term Obligation (Cost of $1,070,000) | 1,070,000 | ||||||||||
| Total Investments (123.4%) (Cost of $59,708,101) (d) | 63,240,348 | ||||||||||
| Obligation to Return Collateral for Securities Loaned (-23.2%) | (11,888,773 | ) | |||||||||
| Other Assets & Liabilities, Net (-0.2%) | (121,102 | ) | |||||||||
| Net Assets (100.0%) | $ | 51,230,473 | |||||||||
Notes to Schedule of Investments:
(a) All or a portion of this security was on loan at July 31, 2008. The total market value of securities on loan at July 31, 2008 is $11,131,590.
(b) Non-income producing security.
(c) Investment made with cash collateral received from securities lending activity.
(d) Cost for federal income tax purposes is $59,913,870.
See Accompanying Notes to Financial Statements.
59
CMG LARGE CAP GROWTH FUND
A Portfolio of Columbia Funds Institutional Trust
SCHEDULE OF INVESTMENTS
At July 31, 2008, the Fund held investments in the following sectors:
Sector (Unaudited) | % of Net Assets | ||||||
| Information Technology | 29.7 | ||||||
| Health Care | 13.7 | ||||||
| Industrials | 13.1 | ||||||
| Consumer Staples | 11.2 | ||||||
| Energy | 10.6 | ||||||
| Consumer Discretionary | 8.4 | ||||||
| Financials | 4.3 | ||||||
| Materials | 3.7 | ||||||
| Telecommunication Services | 2.3 | ||||||
| Utilities | 1.1 | ||||||
| 98.1 | |||||||
| Securities Lending Collateral | 23.2 | ||||||
| Short-Term Obligation | 2.1 | ||||||
| Obligation to Return Collateral for Securities Loaned | (23.2 | ) | |||||
| Other Assets & Liabilities, Net | (0.2 | ) | |||||
| 100.0 | |||||||
| Acronym | Name | ||||||
| ADR | American Depositary Receipt | ||||||
See Accompanying Notes to Financial Statements.
60
CMG LARGE CAP VALUE FUND
A Portfolio of Columbia Funds Institutional Trust
SCHEDULE OF INVESTMENTS
July 31, 2008
| Shares | Value | ||||||||||
| Common Stocks (96.3%) | |||||||||||
| Consumer Discretionary (7.0%) | |||||||||||
| Hotels, Restaurants & Leisure (2.1%) | |||||||||||
| Carnival Corp. (a) | 10,800 | $ | 398,952 | ||||||||
| McDonald's Corp. | 6,666 | 398,560 | |||||||||
| 797,512 | |||||||||||
| Multiline Retail (2.2%) | |||||||||||
| Kohl's Corp. (a)(b) | 10,800 | 452,628 | |||||||||
| Macy's, Inc. (a) | 19,900 | 374,319 | |||||||||
| 826,947 | |||||||||||
| Specialty Retail (1.3%) | |||||||||||
| Lowe's Companies, Inc. (a) | 24,100 | 489,712 | |||||||||
| Textiles, Apparel & Luxury Goods (1.4%) | |||||||||||
| V.F. Corp. (a) | 7,300 | 522,534 | |||||||||
| 2,636,705 | |||||||||||
| Consumer Staples (12.0%) | |||||||||||
| Beverages (1.6%) | |||||||||||
| Anheuser-Busch Companies, Inc. (a) | 3,000 | 203,280 | |||||||||
| Diageo PLC, ADR | 5,399 | 379,982 | |||||||||
| 583,262 | |||||||||||
| Food & Staples Retailing (1.6%) | |||||||||||
| Sysco Corp. (a) | 11,600 | 328,976 | |||||||||
| Wal-Mart Stores, Inc. | 4,900 | 287,238 | |||||||||
| 616,214 | |||||||||||
| Food Products (2.6%) | |||||||||||
| ConAgra Foods, Inc. | 24,200 | 524,656 | |||||||||
| Smithfield Foods, Inc. (a)(b) | 12,500 | 268,500 | |||||||||
| Tyson Foods, Inc., Class A | 11,800 | 175,820 | |||||||||
| 968,976 | |||||||||||
| Household Products (1.5%) | |||||||||||
| Procter & Gamble Co. | 8,700 | 569,676 | |||||||||
| Personal Products (1.7%) | |||||||||||
| Avon Products, Inc. | 15,365 | 651,476 | |||||||||
| Tobacco (3.0%) | |||||||||||
| Lorillard, Inc. (a)(b) | 10,500 | 704,655 | |||||||||
| Philip Morris International, Inc. | 8,329 | 430,193 | |||||||||
| 1,134,848 | |||||||||||
| 4,524,452 | |||||||||||
| Energy (14.4%) | |||||||||||
| Energy Equipment & Services (2.0%) | |||||||||||
| Halliburton Co. | 7,954 | 356,499 | |||||||||
| Smith International, Inc. (a) | 2,300 | 171,074 | |||||||||
| Weatherford International Ltd. (b) | 6,200 | 233,926 | |||||||||
| 761,499 | |||||||||||
See Accompanying Notes to Financial Statements.
61
CMG LARGE CAP VALUE FUND
A Portfolio of Columbia Funds Institutional Trust
SCHEDULE OF INVESTMENTS
| Shares | Value | ||||||||||
| Common Stocks (continued) | |||||||||||
| Oil, Gas & Consumable Fuels (12.4%) | |||||||||||
| Chevron Corp. | 6,700 | $ | 566,552 | ||||||||
| ConocoPhillips (a) | 10,507 | 857,581 | |||||||||
| El Paso Corp. (a) | 14,500 | 259,985 | |||||||||
| Exxon Mobil Corp. | 22,535 | 1,812,490 | |||||||||
| Hess Corp. | 4,200 | 425,880 | |||||||||
| Newfield Exploration Co. (b) | 3,700 | 181,226 | |||||||||
| Occidental Petroleum Corp. | 4,900 | 386,267 | |||||||||
| Valero Energy Corp. (a) | 5,875 | 196,284 | |||||||||
| 4,686,265 | |||||||||||
| 5,447,764 | |||||||||||
| Financials (27.9%) | |||||||||||
| Capital Markets (3.9%) | |||||||||||
| Goldman Sachs Group, Inc. | 2,400 | 441,696 | |||||||||
| Merrill Lynch & Co., Inc. (a) | 8,700 | 231,855 | |||||||||
| Morgan Stanley (a) | 7,000 | 276,360 | |||||||||
| State Street Corp. | 7,100 | 508,644 | |||||||||
| 1,458,555 | |||||||||||
| Commercial Banks (8.9%) | |||||||||||
| PNC Financial Services Group, Inc. (a) | 7,700 | 548,933 | |||||||||
| SunTrust Banks, Inc. (a) | 9,100 | 373,646 | |||||||||
| U.S. Bancorp (a) | 33,446 | 1,023,782 | |||||||||
| Wachovia Corp. (a) | 14,122 | 243,887 | |||||||||
| Wells Fargo & Co. (a) | 38,956 | 1,179,198 | |||||||||
| 3,369,446 | |||||||||||
| Diversified Financial Services (5.9%) | |||||||||||
| Citigroup, Inc. (a) | 32,685 | 610,883 | |||||||||
| JPMorgan Chase & Co. (a) | 39,400 | 1,600,822 | |||||||||
| 2,211,705 | |||||||||||
| Insurance (6.4%) | |||||||||||
| ACE Ltd. | 16,000 | 811,200 | |||||||||
| Hartford Financial Services Group, Inc. (a) | 5,655 | 358,470 | |||||||||
| Loews Corp. (a) | 11,400 | 507,984 | |||||||||
| Marsh & McLennan Companies, Inc. (a) | 12,800 | 361,600 | |||||||||
| Prudential Financial, Inc. (a) | 5,400 | 372,438 | |||||||||
| 2,411,692 | |||||||||||
| Real Estate Investment Trusts (REITs) (2.8%) | |||||||||||
| General Growth Properties, Inc. (a) | 8,600 | 235,726 | |||||||||
| Plum Creek Timber Co., Inc. (a) | 8,900 | 433,608 | |||||||||
| Rayonier, Inc. (a) | 8,400 | 392,448 | |||||||||
| 1,061,782 | |||||||||||
| 10,513,180 | |||||||||||
| Health Care (8.9%) | |||||||||||
| Biotechnology (2.2%) | |||||||||||
| Amgen, Inc. (b) | 13,200 | 826,716 | |||||||||
See Accompanying Notes to Financial Statements.
62
CMG LARGE CAP VALUE FUND
A Portfolio of Columbia Funds Institutional Trust
SCHEDULE OF INVESTMENTS
| Shares | Value | ||||||||||
| Common Stocks (continued) | |||||||||||
| Health Care Providers & Services (1.9%) | |||||||||||
| CIGNA Corp. | 7,631 | $ | 282,500 | ||||||||
| Medco Health Solutions, Inc. (b) | 8,400 | 416,472 | |||||||||
| 698,972 | |||||||||||
| Life Sciences Tools & Services (1.3%) | |||||||||||
| Thermo Fisher Scientific, Inc. (b) | 8,000 | 484,160 | |||||||||
| Pharmaceuticals (3.5%) | |||||||||||
| Johnson & Johnson (a) | 15,500 | 1,061,285 | |||||||||
| Merck & Co., Inc. | 8,300 | 273,070 | |||||||||
| 1,334,355 | |||||||||||
| 3,344,203 | |||||||||||
| Industrials (7.8%) | |||||||||||
| Aerospace & Defense (3.7%) | |||||||||||
| Goodrich Corp. | 5,100 | 250,614 | |||||||||
| L-3 Communications Holdings, Inc. (a) | 4,850 | 478,646 | |||||||||
| United Technologies Corp. | 10,696 | 684,330 | |||||||||
| 1,413,590 | |||||||||||
| Construction & Engineering (0.4%) | |||||||||||
| KBR, Inc. | 5,500 | 156,750 | |||||||||
| Industrial Conglomerates (2.8%) | |||||||||||
| General Electric Co. | 31,392 | 888,080 | |||||||||
| McDermott International, Inc. (b) | 3,170 | 151,114 | |||||||||
| 1,039,194 | |||||||||||
| Machinery (0.9%) | |||||||||||
| Eaton Corp. | 4,600 | 326,784 | |||||||||
| 2,936,318 | |||||||||||
| Information Technology (5.4%) | |||||||||||
| Computers & Peripherals (3.2%) | |||||||||||
| EMC Corp. (b) | 28,000 | 420,280 | |||||||||
| Hewlett-Packard Co. | 17,600 | 788,480 | |||||||||
| 1,208,760 | |||||||||||
| IT Services (0.3%) | |||||||||||
| Visa, Inc., Class A (a)(b) | 1,804 | 131,800 | |||||||||
| Semiconductors & Semiconductor Equipment (1.4%) | |||||||||||
| Intel Corp. (a) | 13,600 | 301,784 | |||||||||
| Intersil Corp., Class A (a) | 9,700 | 234,061 | |||||||||
| 535,845 | |||||||||||
| Software (0.5%) | |||||||||||
| BMC Software, Inc. (a)(b) | 5,300 | 174,317 | |||||||||
| 2,050,722 | |||||||||||
See Accompanying Notes to Financial Statements.
63
CMG LARGE CAP VALUE FUND
A Portfolio of Columbia Funds Institutional Trust
SCHEDULE OF INVESTMENTS
| Shares | Value | ||||||||||
| Common Stocks (continued) | |||||||||||
| Materials (3.2%) | |||||||||||
| Chemicals (0.9%) | |||||||||||
| E.I. Du Pont de Nemours & Co. (a) | 7,700 | $ | 337,337 | ||||||||
| Metals & Mining (1.8%) | |||||||||||
| Alcoa, Inc. | 9,500 | 320,625 | |||||||||
| Allegheny Technologies, Inc. (a) | 1,300 | 61,477 | |||||||||
| Freeport-McMoRan Copper & Gold, Inc. | 1,300 | 125,775 | |||||||||
| Nucor Corp. (a) | 3,200 | 183,104 | |||||||||
| 690,981 | |||||||||||
| Paper & Forest Products (0.5%) | |||||||||||
| Weyerhaeuser Co. (a) | 3,700 | 197,802 | |||||||||
| 1,226,120 | |||||||||||
| Telecommunication Services (4.4%) | |||||||||||
| Diversified Telecommunication Services (4.4%) | |||||||||||
| AT&T, Inc. | 39,857 | 1,227,994 | |||||||||
| Verizon Communications, Inc. (a) | 12,370 | 421,075 | |||||||||
| 1,649,069 | |||||||||||
| Utilities (5.3%) | |||||||||||
| Electric Utilities (3.5%) | |||||||||||
| Exelon Corp. | 5,600 | 440,272 | |||||||||
| FPL Group, Inc. (a) | 8,300 | 535,599 | |||||||||
| PPL Corp. | 7,400 | 347,504 | |||||||||
| 1,323,375 | |||||||||||
| Multi-Utilities (1.8%) | |||||||||||
| PG&E Corp. (a) | 7,033 | 270,981 | |||||||||
| Public Service Enterprise Group, Inc. | 10,086 | 421,595 | |||||||||
| 692,576 | |||||||||||
| 2,015,951 | |||||||||||
| Total Common Stocks (Cost of $36,492,057) | 36,344,484 | ||||||||||
| Convertible Preferred Stocks (0.4%) | |||||||||||
| Health Care (0.4%) | |||||||||||
| Pharmaceuticals (0.4%) | |||||||||||
| Schering-Plough Corp., 6.000% | 800 | 156,920 | |||||||||
| Total Convertible Preferred Stocks (Cost of $212,152) | 156,920 | ||||||||||
| Securities Lending Collateral (27.8%) | |||||||||||
| State Street Navigator Securities Lending Prime Portfolio (c) (7 day yield of 2.654%) | 10,510,738 | 10,510,738 | |||||||||
| Total Securities Lending Collateral (Cost of $10,510,738) | 10,510,738 | ||||||||||
See Accompanying Notes to Financial Statements.
64
CMG LARGE CAP VALUE FUND
A Portfolio of Columbia Funds Institutional Trust
SCHEDULE OF INVESTMENTS
| Par | Value | ||||||||||
| Short-Term Obligation (2.7%) | |||||||||||
| Repurchase agreement with Fixed Income Clearing Corp., dated 07/31/08, due 08/01/08 at 1.990%, collateralized by a U.S. Treasury Obligation maturing 02/12/15, market value $1,039,775 (repurchase proceeds $1,015,056) | $ | 1,015,000 | $ | 1,015,000 | |||||||
| Total Short-Term Obligation (Cost of $1,015,000) | 1,015,000 | ||||||||||
| Total Investments (127.2%) (Cost of $48,229,947) (d) | 48,027,142 | ||||||||||
| Obligation to Return Collateral for Securities Loaned (-27.8%) | (10,510,738 | ) | |||||||||
| Other Assets & Liabilities, Net (0.6%) | 224,224 | ||||||||||
| Net Assets (100.0%) | $ | 37,740,628 | |||||||||
Notes to Schedule of Investments:
(a) All or a portion of this security was on loan at July 31, 2008. The total market value of securities on loan at July 31, 2008 is $10,183,653.
(b) Non-income producing security.
(c) Investment made with cash collateral received from securities lending activity.
(d) Cost for federal income tax purposes is $48,243,024.
For the year ended July 31, 2008, transactions in written option contracts were as follows:
| Number of contracts | Premium received | ||||||||||
| Options outstanding at July 31, 2007 | - | $ | - | ||||||||
| Options written | 161 | 39,995 | |||||||||
| Options exercised | (52 | ) | (9,931 | ) | |||||||
| Options expired | (86 | ) | (24,905 | ) | |||||||
| Options bought back | (23 | ) | (5,159 | ) | |||||||
| Options outstanding at July 31, 2008 | - | $ | - | ||||||||
See Accompanying Notes to Financial Statements.
65
CMG LARGE CAP VALUE FUND
A Portfolio of Columbia Funds Institutional Trust
SCHEDULE OF INVESTMENTS
At July 31, 2008, the Fund held investments in the following sectors:
| Sector (Unaudited) | % of Net Assets | ||||||
| Financials | 27.9 | ||||||
| Energy | 14.4 | ||||||
| Consumer Staples | 12.0 | ||||||
| Health Care | 9.3 | ||||||
| Industrials | 7.8 | ||||||
| Consumer Discretionary | 7.0 | ||||||
| Information Technology | 5.4 | ||||||
| Utilities | 5.3 | ||||||
| Telecommunication Services | 4.4 | ||||||
| Materials | 3.2 | ||||||
| 96.7 | |||||||
| Securities Lending Collateral | 27.8 | ||||||
| Short-Term Obligation | 2.7 | ||||||
| Obligation to Return Collateral for Securities Loaned | (27.8 | ) | |||||
| Other Assets & Liabilities, Net | 0.6 | ||||||
| 100.0 | |||||||
| Acronym | Name | ||||||
| ADR | American Depositary Receipt | ||||||
See Accompanying Notes to Financial Statements.
66
CMG MID CAP GROWTH FUND
A Portfolio of Columbia Funds Institutional Trust
SCHEDULE OF INVESTMENTS
July 31, 2008
| Shares | Value | ||||||||||
| Common Stocks (97.9%) | |||||||||||
| Consumer Discretionary (15.3%) | |||||||||||
| Auto Components (0.3%) | |||||||||||
| WABCO Holdings, Inc. | 1,807 | $ | 81,604 | ||||||||
| Diversified Consumer Services (2.2%) | |||||||||||
| Apollo Group, Inc., Class A (a) | 2,560 | 159,462 | |||||||||
| DeVry, Inc. | 1,940 | 110,211 | |||||||||
| ITT Educational Services, Inc. (a) | 1,920 | 170,074 | |||||||||
| New Oriental Education & Technology Group, ADR (a) | 1,710 | 119,700 | |||||||||
| 559,447 | |||||||||||
| Hotels, Restaurants & Leisure (3.7%) | |||||||||||
| Ctrip.com International Ltd., ADR | 2,452 | 110,561 | |||||||||
| Darden Restaurants, Inc. | 5,040 | 164,153 | |||||||||
| International Game Technology, Inc. | 4,350 | 94,438 | |||||||||
| Starbucks Corp. (a) | 10,770 | 158,211 | |||||||||
| Starwood Hotels & Resorts Worldwide, Inc. | 2,700 | 92,583 | |||||||||
| WMS Industries, Inc. (a) | 3,270 | 92,149 | |||||||||
| Yum! Brands, Inc. | 6,240 | 223,517 | |||||||||
| 935,612 | |||||||||||
| Internet & Catalog Retail (0.7%) | |||||||||||
| Priceline.com, Inc. (a) | 1,500 | 172,425 | |||||||||
| Media (2.6%) | |||||||||||
| Central European Media Enterprises Ltd., Class A (a) | 1,390 | 115,718 | |||||||||
| Discovery Holding Co., Class A (a) | 6,680 | 132,798 | |||||||||
| Liberty Media Corp., Class A (a) | 10,310 | 253,832 | |||||||||
| McGraw-Hill Companies, Inc. | 3,290 | 133,804 | |||||||||
| 636,152 | |||||||||||
| Multiline Retail (0.5%) | |||||||||||
| Kohl's Corp. (a) | 2,880 | 120,701 | |||||||||
| Specialty Retail (4.0%) | |||||||||||
| GameStop Corp., Class A (a) | 3,380 | 136,924 | |||||||||
| Guess ?, Inc. | 3,040 | 96,277 | |||||||||
| J Crew Group, Inc. (a) | 3,560 | 102,386 | |||||||||
| Ross Stores, Inc. | 4,010 | 152,219 | |||||||||
| Tiffany & Co. | 2,900 | 109,591 | |||||||||
| TJX Companies, Inc. | 5,240 | 176,640 | |||||||||
| Urban Outfitters, Inc. (a) | 6,690 | 220,837 | |||||||||
| 994,874 | |||||||||||
| Textiles, Apparel & Luxury Goods (1.3%) | |||||||||||
| Deckers Outdoor Corp. (a) | 1,550 | 175,166 | |||||||||
| Phillips-Van Heusen Corp. | 4,350 | 153,990 | |||||||||
| 329,156 | |||||||||||
| 3,829,971 | |||||||||||
See Accompanying Notes to Financial Statements.
67
CMG MID CAP GROWTH FUND
A Portfolio of Columbia Funds Institutional Trust
SCHEDULE OF INVESTMENTS
| Shares | Value | ||||||||||
| Common Stocks (continued) | |||||||||||
| Consumer Staples (3.6%) | |||||||||||
| Food & Staples Retailing (0.7%) | |||||||||||
| Kroger Co. | 6,110 | $ | 172,791 | ||||||||
| Food Products (1.1%) | |||||||||||
| H.J. Heinz Co. | 2,370 | 119,401 | |||||||||
| Wm. Wrigley Jr. Co. | 1,910 | 150,813 | |||||||||
| 270,214 | |||||||||||
| Household Products (0.4%) | |||||||||||
| Clorox Co. | 1,840 | 100,280 | |||||||||
| Personal Products (0.8%) | |||||||||||
| Avon Products, Inc. | 5,090 | 215,816 | |||||||||
| Tobacco (0.6%) | |||||||||||
| Lorillard, Inc. (a) | 2,160 | 144,958 | |||||||||
| 904,059 | |||||||||||
| Energy (12.7%) | |||||||||||
| Energy Equipment & Services (5.0%) | |||||||||||
| Cameron International Corp. (a) | 4,140 | 197,727 | |||||||||
| Core Laboratories N.V. | 1,010 | 130,906 | |||||||||
| Diamond Offshore Drilling, Inc. | 2,460 | 293,478 | |||||||||
| FMC Technologies, Inc. (a) | 1,950 | 120,471 | |||||||||
| IHS, Inc., Class A (a) | 1,914 | 119,108 | |||||||||
| National-Oilwell Varco, Inc. (a) | 2,300 | 180,849 | |||||||||
| Noble Corp. | 3,960 | 205,405 | |||||||||
| 1,247,944 | |||||||||||
| Oil, Gas & Consumable Fuels (7.7%) | |||||||||||
| Concho Resources, Inc. (a) | 4,178 | 136,830 | |||||||||
| CONSOL Energy, Inc. | 3,250 | 241,767 | |||||||||
| Continental Resources, Inc. (a) | 5,019 | 286,685 | |||||||||
| Denbury Resources, Inc. (a) | 12,470 | 350,906 | |||||||||
| Frontier Oil Corp. | 5,500 | 100,375 | |||||||||
| Peabody Energy Corp. | 2,600 | 175,890 | |||||||||
| PetroHawk Energy Corp. (a) | 5,090 | 169,599 | |||||||||
| Range Resources Corp. | 2,200 | 106,832 | |||||||||
| Southwestern Energy Co. (a) | 6,688 | 242,841 | |||||||||
| Ultra Petroleum Corp. (a) | 1,510 | 107,784 | |||||||||
| 1,919,509 | |||||||||||
| 3,167,453 | |||||||||||
| Financials (6.0%) | |||||||||||
| Capital Markets (3.7%) | |||||||||||
| Invesco Ltd. | 7,000 | 163,030 | |||||||||
| Janus Capital Group, Inc. | 4,320 | 131,069 | |||||||||
| Northern Trust Corp. | 1,900 | 148,523 | |||||||||
See Accompanying Notes to Financial Statements.
68
CMG MID CAP GROWTH FUND
A Portfolio of Columbia Funds Institutional Trust
SCHEDULE OF INVESTMENTS
| Shares | Value | ||||||||||
| Common Stocks (continued) | |||||||||||
| Capital Markets (continued) | |||||||||||
| T. Rowe Price Group, Inc. | 3,640 | $ | 217,854 | ||||||||
| Waddell & Reed Financial, Inc., Class A | 8,060 | 269,204 | |||||||||
| 929,680 | |||||||||||
| Diversified Financial Services (1.1%) | |||||||||||
| CME Group, Inc. | 430 | 154,856 | |||||||||
| IntercontinentalExchange, Inc. (a) | 1,140 | 113,772 | |||||||||
| 268,628 | |||||||||||
| Real Estate Investment Trusts (REITs) (1.2%) | |||||||||||
| Macerich Co. | 1,650 | 91,294 | |||||||||
| Plum Creek Timber Co., Inc. | 2,260 | 110,107 | |||||||||
| ProLogis | 2,000 | 97,760 | |||||||||
| 299,161 | |||||||||||
| 1,497,469 | |||||||||||
| Health Care (14.3%) | |||||||||||
| Biotechnology (3.3%) | |||||||||||
| Alexion Pharmaceuticals, Inc. (a) | 1,620 | 151,875 | |||||||||
| Amylin Pharmaceuticals, Inc. (a) | 4,640 | 146,392 | |||||||||
| Celgene Corp. (a) | 2,730 | 206,088 | |||||||||
| ImClone Systems, Inc. (a) | 2,200 | 140,646 | |||||||||
| Onyx Pharmaceuticals, Inc. (a) | 4,350 | 176,175 | |||||||||
| 821,176 | |||||||||||
| Health Care Equipment & Supplies (2.2%) | |||||||||||
| Hologic, Inc. (a) | 9,128 | 168,594 | |||||||||
| Intuitive Surgical, Inc. (a) | 637 | 198,292 | |||||||||
| Varian Medical Systems, Inc. (a) | 3,070 | 184,200 | |||||||||
| 551,086 | |||||||||||
| Health Care Providers & Services (3.4%) | |||||||||||
| Express Scripts, Inc. (a) | 3,520 | 248,301 | |||||||||
| Laboratory Corp. of America Holdings (a) | 3,620 | 244,640 | |||||||||
| McKesson Corp. | 2,490 | 139,415 | |||||||||
| Medco Health Solutions, Inc. (a) | 2,630 | 130,395 | |||||||||
| Pediatrix Medical Group, Inc. (a) | 1,650 | 80,272 | |||||||||
| 843,023 | |||||||||||
| Life Sciences Tools & Services (4.3%) | |||||||||||
| Charles River Laboratories International, Inc. (a) | 3,610 | 239,920 | |||||||||
| Covance, Inc. (a) | 2,720 | 249,696 | |||||||||
| Illumina, Inc. (a) | 1,203 | 112,168 | |||||||||
| Pharmaceutical Product Development, Inc. | 4,890 | 186,505 | |||||||||
| Thermo Fisher Scientific, Inc. (a) | 2,350 | 142,222 | |||||||||
| Waters Corp. (a) | 2,220 | 150,827 | |||||||||
| 1,081,338 | |||||||||||
| Pharmaceuticals (1.1%) | |||||||||||
| Allergan, Inc. | 3,270 | 169,811 | |||||||||
| Perrigo Co. | 3,150 | 110,974 | |||||||||
| 280,785 | |||||||||||
| 3,577,408 | |||||||||||
See Accompanying Notes to Financial Statements.
69
CMG MID CAP GROWTH FUND
A Portfolio of Columbia Funds Institutional Trust
SCHEDULE OF INVESTMENTS
| Shares | Value | ||||||||||
| Common Stocks (continued) | |||||||||||
| Industrials (15.8%) | |||||||||||
| Aerospace & Defense (1.8%) | |||||||||||
| Goodrich Corp. | 3,910 | $ | 192,138 | ||||||||
| Precision Castparts Corp. | 2,800 | 261,604 | |||||||||
| 453,742 | |||||||||||
| Air Freight & Logistics (0.5%) | |||||||||||
| C.H. Robinson Worldwide, Inc. | 2,610 | 125,802 | |||||||||
| Commercial Services & Supplies (2.6%) | |||||||||||
| Dun & Bradstreet Corp. | 1,110 | 107,270 | |||||||||
| FTI Consulting, Inc. (a) | 1,580 | 112,433 | |||||||||
| Manpower, Inc. | 2,180 | 104,640 | |||||||||
| Robert Half International, Inc. | 3,820 | 96,608 | |||||||||
| Stericycle, Inc. (a) | 3,880 | 231,830 | |||||||||
| 652,781 | |||||||||||
| Construction & Engineering (1.0%) | |||||||||||
| Foster Wheeler Ltd. (a) | 4,410 | 250,356 | |||||||||
| Electrical Equipment (3.4%) | |||||||||||
| AMETEK, Inc. | 3,230 | 154,588 | |||||||||
| First Solar, Inc. (a) | 470 | 134,002 | |||||||||
| General Cable Corp. (a) | 4,530 | 261,064 | |||||||||
| Roper Industries, Inc. | 2,830 | 173,139 | |||||||||
| SunPower Corp., Class A (a) | 1,650 | 129,970 | |||||||||
| 852,763 | |||||||||||
| Industrial Conglomerates (2.1%) | |||||||||||
| McDermott International, Inc. (a) | 7,000 | 333,690 | |||||||||
| Textron, Inc. | 4,060 | 176,488 | |||||||||
| 510,178 | |||||||||||
| Machinery (3.7%) | |||||||||||
| Bucyrus International, Inc. | 2,160 | 151,221 | |||||||||
| Cummins, Inc. | 4,520 | 299,857 | |||||||||
| Flowserve Corp. | 1,200 | 160,008 | |||||||||
| Joy Global, Inc. | 3,155 | 227,854 | |||||||||
| Manitowoc Co., Inc. | 3,480 | 91,733 | |||||||||
| 930,673 | |||||||||||
| Road & Rail (0.7%) | |||||||||||
| Landstar System, Inc. | 3,590 | 181,582 | |||||||||
| 3,957,877 | |||||||||||
| Information Technology (16.7%) | |||||||||||
| Communications Equipment (2.1%) | |||||||||||
| CommScope, Inc. (a) | 2,220 | 98,990 | |||||||||
| Harris Corp. | 4,540 | 218,601 | |||||||||
| Juniper Networks, Inc. (a) | 3,790 | 98,654 | |||||||||
| Research In Motion Ltd. (a) | 820 | 100,712 | |||||||||
| 516,957 | |||||||||||
See Accompanying Notes to Financial Statements.
70
CMG MID CAP GROWTH FUND
A Portfolio of Columbia Funds Institutional Trust
SCHEDULE OF INVESTMENTS
| Shares | Value | ||||||||||
| Common Stocks (continued) | |||||||||||
| Computers & Peripherals (0.6%) | |||||||||||
| Seagate Technology | 10,120 | $ | 151,496 | ||||||||
| Electronic Equipment & Instruments (1.3%) | |||||||||||
| Amphenol Corp., Class A | 2,670 | 127,279 | |||||||||
| Avnet, Inc. (a) | 3,900 | 106,314 | |||||||||
| Tyco Electronics Ltd. | 2,640 | 87,490 | |||||||||
| 321,083 | |||||||||||
| Internet Software & Services (1.1%) | |||||||||||
| Equinix, Inc. (a) | 1,730 | 140,753 | |||||||||
| VeriSign, Inc. (a) | 4,530 | 147,406 | |||||||||
| 288,159 | |||||||||||
| IT Services (4.0%) | |||||||||||
| Alliance Data Systems Corp. (a) | 3,410 | 218,751 | |||||||||
| Cognizant Technology Solutions Corp., Class A (a) | 6,680 | 187,508 | |||||||||
| Fiserv, Inc. (a) | 2,680 | 128,158 | |||||||||
| Global Payments, Inc. | 2,450 | 108,511 | |||||||||
| Mastercard, Inc., Class A | 560 | 136,724 | |||||||||
| Paychex, Inc. | 3,460 | 113,903 | |||||||||
| Total System Services, Inc. | 4,880 | 95,550 | |||||||||
| 989,105 | |||||||||||
| Semiconductors & Semiconductor Equipment (3.4%) | |||||||||||
| ASML Holding N.V., N.Y. Registered Shares | 6,710 | 152,921 | |||||||||
| Broadcom Corp., Class A (a) | 8,790 | 213,509 | |||||||||
| Lam Research Corp. (a) | 3,400 | 111,826 | |||||||||
| Linear Technology Corp. | 3,250 | 100,912 | |||||||||
| Marvell Technology Group Ltd. (a) | 9,940 | 147,013 | |||||||||
| Microchip Technology, Inc. | 3,970 | 126,762 | |||||||||
| 852,943 | |||||||||||
| Software (4.2%) | |||||||||||
| Activision Blizzard, Inc. (a) | 3,480 | 125,210 | |||||||||
| Autodesk, Inc. (a) | 2,807 | 89,515 | |||||||||
| Citrix Systems, Inc. (a) | 2,978 | 79,334 | |||||||||
| FactSet Research Systems, Inc. | 2,250 | 129,758 | |||||||||
| Intuit, Inc. (a) | 5,610 | 153,321 | |||||||||
| McAfee, Inc. (a) | 5,070 | 166,043 | |||||||||
| Salesforce.com, Inc. (a) | 2,270 | 144,803 | |||||||||
| UBISOFT Entertainment (a) | 1,640 | 162,096 | |||||||||
| 1,050,080 | |||||||||||
| 4,169,823 | |||||||||||
| Materials (7.8%) | |||||||||||
| Chemicals (4.9%) | |||||||||||
| Agrium, Inc. | 1,760 | 154,880 | |||||||||
| Intrepid Potash, Inc. (a) | 2,175 | 120,277 | |||||||||
| Monsanto Co. | 1,940 | 231,073 | |||||||||
See Accompanying Notes to Financial Statements.
71
CMG MID CAP GROWTH FUND
A Portfolio of Columbia Funds Institutional Trust
SCHEDULE OF INVESTMENTS
| Shares | Value | ||||||||||
| Common Stocks (continued) | |||||||||||
| Chemicals (continued) | |||||||||||
| Potash Corp. of Saskatchewan, Inc. | 2,270 | $ | 463,693 | ||||||||
| Syngenta AG, ADR | 2,420 | 140,578 | |||||||||
| Wacker Chemie AG | 560 | 115,904 | |||||||||
| 1,226,405 | |||||||||||
| Metals & Mining (2.9%) | |||||||||||
| Agnico-Eagle Mines Ltd. | 2,170 | 118,590 | |||||||||
| AK Steel Holding Corp. | 1,740 | 110,490 | |||||||||
| Cleveland-Cliffs, Inc. | 2,560 | 277,530 | |||||||||
| Freeport-McMoRan Copper & Gold, Inc. | 1,367 | 132,257 | |||||||||
| Nucor Corp. | 1,440 | 82,397 | |||||||||
| 721,264 | |||||||||||
| 1,947,669 | |||||||||||
| Telecommunication Services (2.8%) | |||||||||||
| Wireless Telecommunication Services (2.8%) | |||||||||||
| American Tower Corp., Class A (a) | 7,086 | 296,904 | |||||||||
| Crown Castle International Corp. (a) | 4,810 | 183,742 | |||||||||
| Leap Wireless International, Inc. (a) | 1,900 | 81,947 | |||||||||
| NII Holdings, Inc. (a) | 2,720 | 148,675 | |||||||||
| 711,268 | |||||||||||
| Utilities (2.9%) | |||||||||||
| Electric Utilities (1.4%) | |||||||||||
| ITC Holdings Corp. | 2,319 | 120,866 | |||||||||
| PPL Corp. | 4,800 | 225,408 | |||||||||
| 346,274 | |||||||||||
| Gas Utilities (0.6%) | |||||||||||
| Questar Corp. | 2,910 | 153,881 | |||||||||
| Independent Power Producers & Energy Traders (0.9%) | |||||||||||
| Constellation Energy Group, Inc. | 1,200 | 99,792 | |||||||||
| NRG Energy, Inc. (a) | 3,330 | 120,846 | |||||||||
| 220,638 | |||||||||||
| 720,793 | |||||||||||
| Total Common Stocks (Cost of $21,051,464) | 24,483,790 | ||||||||||
See Accompanying Notes to Financial Statements.
72
CMG MID CAP GROWTH FUND
A Portfolio of Columbia Funds Institutional Trust
SCHEDULE OF INVESTMENTS
| Par | Value | ||||||||||
| Short-Term Obligation (5.1%) | |||||||||||
| Repurchase agreement with Fixed Income Clearing Corp., dated 07/31/08, due 08/01/08 at 1.990%, collateralized by U.S. Treasury Obligations maturing 02/12/15, market value $1,306,250 (repurchase proceeds $1,280,071) | $ | 1,280,000 | $ | 1,280,000 | |||||||
| Total Short-Term Obligation (Cost of $1,280,000) | 1,280,000 | ||||||||||
| Total Investments (103.0%) (Cost of $22,331,464) (b) | 25,763,790 | ||||||||||
| Other Assets & Liabilities, Net (-3.0%) | (752,180 | ) | |||||||||
| Net Assets (100.0%) | $ | 25,011,610 | |||||||||
Notes to Schedule of Investments:
(a) Non-income producing security.
(b) Cost for federal income tax purposes is $22,513,674.
For the year ended July 31, 2008, transactions in written option contracts were as follows:
| Number of contracts | Premium received | ||||||||||
| Options outstanding at July 31, 2007 | - | $ | - | ||||||||
| Options written | 71 | 24,827 | |||||||||
| Options terminated in closing purchase transactions | (71 | ) | (24,827 | ) | |||||||
| Options exercised | - | - | |||||||||
| Options expired | - | - | |||||||||
| Options outstanding at July 31, 2008 | - | $ | - | ||||||||
At July 31, 2008, the Fund held investments in the following sectors:
| Sector (Unaudited) | % of Net Assets | ||||||
| Information Technology | 16.7 | ||||||
| Industrials | 15.8 | ||||||
| Consumer Discretionary | 15.3 | ||||||
| Health Care | 14.3 | ||||||
| Energy | 12.7 | ||||||
| Materials | 7.8 | ||||||
| Financials | 6.0 | ||||||
| Consumer Staples | 3.6 | ||||||
| Utilities | 2.9 | ||||||
| Telecommunication Services | 2.8 | ||||||
| 97.9 | |||||||
| Short-Term Obligation | 5.1 | ||||||
| Other Assets & Liabilities, Net | (3.0 | ) | |||||
| 100.0 | |||||||
| Acronym | Name | ||||
| ADR | American Depositary Receipt | ||||
See Accompanying Notes to Financial Statements.
73
CMG MID CAP VALUE FUND
A Portfolio of Columbia Funds Institutional Trust
SCHEDULE OF INVESTMENTS
July 31, 2008
| Shares | Value | ||||||||||
| Common Stocks (95.3%) | |||||||||||
| Consumer Discretionary (9.7%) | |||||||||||
| Auto Components (2.9%) | |||||||||||
| BorgWarner, Inc. | 5,000 | $ | 201,600 | ||||||||
| Gentex Corp. | 5,600 | 86,576 | |||||||||
| Johnson Controls, Inc. | 6,850 | 206,596 | |||||||||
| 494,772 | |||||||||||
| Automobiles (0.4%) | |||||||||||
| Ford Motor Co. (a) | 15,222 | 73,066 | |||||||||
| Hotels, Restaurants & Leisure (2.1%) | |||||||||||
| Royal Caribbean Cruises Ltd. | 7,900 | 201,292 | |||||||||
| Starwood Hotels & Resorts Worldwide, Inc. | 4,425 | 151,733 | |||||||||
| 353,025 | |||||||||||
| Leisure Equipment & Products (1.0%) | |||||||||||
| Hasbro, Inc. | 4,400 | 170,368 | |||||||||
| Multiline Retail (2.4%) | |||||||||||
| Macy's, Inc. | 11,416 | 214,735 | |||||||||
| Saks, Inc. (a) | 19,000 | 193,610 | |||||||||
| 408,345 | |||||||||||
| Textiles, Apparel & Luxury Goods (0.9%) | |||||||||||
| Polo Ralph Lauren Corp. | 2,600 | 153,842 | |||||||||
| 1,653,418 | |||||||||||
| Consumer Staples (8.9%) | |||||||||||
| Beverages (1.5%) | |||||||||||
| Fomento Economico Mexicano SAB de CV, ADR | 2,975 | 136,434 | |||||||||
| Pepsi Bottling Group, Inc. | 4,600 | 128,110 | |||||||||
| 264,544 | |||||||||||
| Food & Staples Retailing (1.5%) | |||||||||||
| BJ's Wholesale Club, Inc. (a) | 3,500 | 131,355 | |||||||||
| Kroger Co. | 4,650 | 131,502 | |||||||||
| 262,857 | |||||||||||
| Food Products (3.7%) | |||||||||||
| ConAgra Foods, Inc. | 8,000 | 173,440 | |||||||||
| Dean Foods Co. (a) | 8,900 | 189,570 | |||||||||
| Hershey Co. | 2,400 | 88,248 | |||||||||
| Smithfield Foods, Inc. (a) | 3,000 | 64,440 | |||||||||
| Tyson Foods, Inc., Class A | 7,800 | 116,220 | |||||||||
| 631,918 | |||||||||||
| Household Products (0.5%) | |||||||||||
| Clorox Co. | 1,550 | 84,475 | |||||||||
See Accompanying Notes to Financial Statements.
74
CMG MID CAP VALUE FUND
A Portfolio of Columbia Funds Institutional Trust
SCHEDULE OF INVESTMENTS
| Shares | Value | ||||||||||
| Common Stocks (continued) | |||||||||||
| Personal Products (1.7%) | |||||||||||
| Avon Products, Inc. | 4,600 | $ | 195,040 | ||||||||
| Estee Lauder Companies, Inc., Class A | 1,975 | 87,097 | |||||||||
| 282,137 | |||||||||||
| 1,525,931 | |||||||||||
| Energy (7.1%) | |||||||||||
| Energy Equipment & Services (2.3%) | |||||||||||
| Complete Production Services, Inc. (a) | 3,700 | 117,808 | |||||||||
| National-Oilwell Varco, Inc. (a) | 1,150 | 90,425 | |||||||||
| Rowan Companies, Inc. | 2,125 | 84,575 | |||||||||
| Tidewater, Inc. | 1,700 | 101,898 | |||||||||
| 394,706 | |||||||||||
| Oil, Gas & Consumable Fuels (4.8%) | |||||||||||
| El Paso Corp. | 12,100 | 216,953 | |||||||||
| Forest Oil Corp. (a) | 2,300 | 131,169 | |||||||||
| Hess Corp. | 1,075 | 109,005 | |||||||||
| Newfield Exploration Co. (a) | 2,500 | 122,450 | |||||||||
| Peabody Energy Corp. | 1,400 | 94,710 | |||||||||
| Williams Companies, Inc. | 4,600 | 147,430 | |||||||||
| 821,717 | |||||||||||
| 1,216,423 | |||||||||||
| Financials (30.0%) | |||||||||||
| Capital Markets (3.0%) | |||||||||||
| Ameriprise Financial, Inc. | 6,500 | 276,250 | |||||||||
| Lazard Ltd., Class A | 5,600 | 228,536 | |||||||||
| 504,786 | |||||||||||
| Commercial Banks (9.6%) | |||||||||||
| Bank of Hawaii Corp. | 4,600 | 231,794 | |||||||||
| City National Corp. | 3,500 | 171,955 | |||||||||
| Comerica, Inc. | 6,875 | 197,450 | |||||||||
| Cullen/Frost Bankers, Inc. | 4,225 | 222,826 | |||||||||
| KeyCorp | 7,300 | 77,015 | |||||||||
| Marshall & Ilsley Corp. | 16,325 | 248,140 | |||||||||
| SVB Financial Group (a) | 3,150 | 181,409 | |||||||||
| TCF Financial Corp. | 14,500 | 184,875 | |||||||||
| Zions Bancorporation | 4,375 | 128,056 | |||||||||
| 1,643,520 | |||||||||||
| Insurance (7.5%) | |||||||||||
| ACE Ltd. | 5,300 | 268,710 | |||||||||
| Assurant, Inc. | 3,000 | 180,360 | |||||||||
| Loews Corp. | 4,075 | 181,582 | |||||||||
| Marsh & McLennan Companies, Inc. | 10,800 | 305,100 | |||||||||
| Platinum Underwriters Holdings Ltd. | 4,700 | 169,670 | |||||||||
| Reinsurance Group of America, Inc. | 3,500 | 173,950 | |||||||||
| 1,279,372 | |||||||||||
See Accompanying Notes to Financial Statements.
75
CMG MID CAP VALUE FUND
A Portfolio of Columbia Funds Institutional Trust
SCHEDULE OF INVESTMENTS
| Shares | Value | ||||||||||
| Common Stocks (continued) | |||||||||||
| Real Estate Investment Trusts (REITs) (9.9%) | |||||||||||
| Alexandria Real Estate Equities, Inc. | 2,400 | $ | 247,824 | ||||||||
| Boston Properties, Inc. | 2,150 | 206,808 | |||||||||
| Equity Residential Property Trust | 5,900 | 254,703 | |||||||||
| General Growth Properties, Inc. | 8,075 | 221,336 | |||||||||
| Plum Creek Timber Co., Inc. | 6,500 | 316,680 | |||||||||
| ProLogis | 4,000 | 195,520 | |||||||||
| Rayonier, Inc. | 5,500 | 256,960 | |||||||||
| 1,699,831 | |||||||||||
| 5,127,509 | |||||||||||
| Health Care (4.8%) | |||||||||||
| Health Care Equipment & Supplies (1.9%) | |||||||||||
| Beckman Coulter, Inc. | 1,900 | 137,446 | |||||||||
| Cooper Companies, Inc. | 1,600 | 53,920 | |||||||||
| Hospira, Inc. (a) | 3,675 | 140,238 | |||||||||
| 331,604 | |||||||||||
| Health Care Providers & Services (2.2%) | |||||||||||
| CIGNA Corp. | 3,450 | 127,719 | |||||||||
| Community Health Systems, Inc. (a) | 4,175 | 137,692 | |||||||||
| Universal Health Services, Inc., Class B | 1,700 | 103,054 | |||||||||
| 368,465 | |||||||||||
| Life Sciences Tools & Services (0.7%) | |||||||||||
| Varian, Inc. (a) | 2,300 | 113,620 | |||||||||
| 813,689 | |||||||||||
| Industrials (10.2%) | |||||||||||
| Aerospace & Defense (2.1%) | |||||||||||
| AerCap Holdings NV (a) | 6,500 | 99,190 | |||||||||
| L-3 Communications Holdings, Inc. | 1,400 | 138,166 | |||||||||
| Spirit Aerosystems Holdings, Inc., Class A (a) | 5,907 | 127,945 | |||||||||
| 365,301 | |||||||||||
| Construction & Engineering (0.8%) | |||||||||||
| Jacobs Engineering Group, Inc. (a) | 1,650 | 127,611 | |||||||||
| Electrical Equipment (0.7%) | |||||||||||
| Cooper Industries Ltd., Class A | 2,900 | 122,293 | |||||||||
| Industrial Conglomerates (2.5%) | |||||||||||
| McDermott International, Inc. (a) | 1,745 | 83,184 | |||||||||
| Teleflex, Inc. | 2,400 | 147,168 | |||||||||
| Textron, Inc. | 4,300 | 186,921 | |||||||||
| 417,273 | |||||||||||
See Accompanying Notes to Financial Statements.
76
CMG MID CAP VALUE FUND
A Portfolio of Columbia Funds Institutional Trust
SCHEDULE OF INVESTMENTS
| Shares | Value | ||||||||||
| Common Stocks (continued) | |||||||||||
| Machinery (2.6%) | |||||||||||
| Barnes Group, Inc. | 3,988 | $ | 90,089 | ||||||||
| Harsco Corp. | 1,650 | 89,265 | |||||||||
| Kennametal, Inc. | 3,850 | 114,576 | |||||||||
| Parker Hannifin Corp. | 2,525 | 155,742 | |||||||||
| 449,672 | |||||||||||
| Marine (0.8%) | |||||||||||
| Alexander & Baldwin, Inc. | 3,125 | 135,594 | |||||||||
| Road & Rail (0.7%) | |||||||||||
| Canadian Pacific Railway Ltd. | 2,000 | 125,620 | |||||||||
| 1,743,364 | |||||||||||
| Information Technology (7.0%) | |||||||||||
| Computers & Peripherals (1.6%) | |||||||||||
| Diebold, Inc. | 1,000 | 36,980 | |||||||||
| NCR Corp. (a) | 8,600 | 230,996 | |||||||||
| 267,976 | |||||||||||
| Electronic Equipment & Instruments (2.5%) | |||||||||||
| Agilent Technologies, Inc. (a) | 1,500 | 54,090 | |||||||||
| Arrow Electronics, Inc. (a) | 5,325 | 171,572 | |||||||||
| Avnet, Inc. (a) | 3,762 | 102,552 | |||||||||
| Mettler-Toledo International, Inc. (a) | 1,000 | 107,510 | |||||||||
| 435,724 | |||||||||||
| Semiconductors & Semiconductor Equipment (1.1%) | |||||||||||
| Intersil Corp., Class A | 3,000 | 72,390 | |||||||||
| KLA-Tencor Corp. | 1,550 | 58,264 | |||||||||
| Spansion, Inc., Class A (a) | 7,600 | 17,404 | |||||||||
| Verigy Ltd. (a) | 1,583 | 35,190 | |||||||||
| 183,248 | |||||||||||
| Software (1.8%) | |||||||||||
| Activision Blizzard, Inc. (a) | 2,933 | 105,529 | |||||||||
| Citrix Systems, Inc. (a) | 1,600 | 42,624 | |||||||||
| Electronic Arts, Inc. (a) | 2,625 | 113,348 | |||||||||
| Synopsys, Inc. (a) | 1,750 | 42,035 | |||||||||
| 303,536 | |||||||||||
| 1,190,484 | |||||||||||
| Materials (6.6%) | |||||||||||
| Chemicals (2.6%) | |||||||||||
| Air Products & Chemicals, Inc. | 1,750 | 166,618 | |||||||||
| Albemarle Corp. | 2,825 | 109,977 | |||||||||
| PPG Industries, Inc. | 2,900 | 175,856 | |||||||||
| 452,451 | |||||||||||
See Accompanying Notes to Financial Statements.
77
CMG MID CAP VALUE FUND
A Portfolio of Columbia Funds Institutional Trust
SCHEDULE OF INVESTMENTS
| Shares | Value | ||||||||||
| Common Stocks (continued) | |||||||||||
| Containers & Packaging (1.8%) | |||||||||||
| Crown Holdings, Inc. (a) | 4,700 | $ | 131,741 | ||||||||
| Packaging Corp. of America | 6,600 | 168,432 | |||||||||
| 300,173 | |||||||||||
| Metals & Mining (0.5%) | |||||||||||
| Allegheny Technologies, Inc. | 1,700 | 80,393 | |||||||||
| Paper & Forest Products (1.7%) | |||||||||||
| Weyerhaeuser Co. | 5,500 | 294,030 | |||||||||
| 1,127,047 | |||||||||||
| Utilities (11.0%) | |||||||||||
| Electric Utilities (5.0%) | |||||||||||
| American Electric Power Co., Inc. | 5,800 | 229,100 | |||||||||
| Edison International | 4,875 | 235,657 | |||||||||
| Entergy Corp. | 1,200 | 128,304 | |||||||||
| FPL Group, Inc. | 1,775 | 114,541 | |||||||||
| PPL Corp. | 3,225 | 151,446 | |||||||||
| 859,048 | |||||||||||
| Gas Utilities (0.9%) | |||||||||||
| AGL Resources, Inc. | 4,475 | 154,656 | |||||||||
| Independent Power Producers & Energy Traders (0.5%) | |||||||||||
| Reliant Energy, Inc. (a) | 5,000 | 90,550 | |||||||||
| Multi-Utilities (4.6%) | |||||||||||
| PG&E Corp. | 5,825 | 224,437 | |||||||||
| Public Service Enterprise Group, Inc. | 2,900 | 121,220 | |||||||||
| Sempra Energy | 4,275 | 240,084 | |||||||||
| Wisconsin Energy Corp. | 4,300 | 194,016 | |||||||||
| 779,757 | |||||||||||
| 1,884,011 | |||||||||||
| Total Common Stocks (Cost of $15,619,506) | 16,281,876 | ||||||||||
| Par | |||||||||||
| Convertible Bond (0.2%) | |||||||||||
| Consumer Discretionary (0.2%) | |||||||||||
| Automobiles (0.2%) | |||||||||||
| Ford Motor Co. | |||||||||||
| 4.250% 12/15/36 | $ | 38,000 | 26,410 | ||||||||
| Total Convertible Bond (Cost of $39,960) | 26,410 | ||||||||||
See Accompanying Notes to Financial Statements.
78
CMG MID CAP VALUE FUND
A Portfolio of Columbia Funds Institutional Trust
SCHEDULE OF INVESTMENTS
| Par | Value | ||||||||||
| Short-Term Obligation (4.3%) | |||||||||||
| Repurchase agreement with Fixed Income Clearing Corp., dated 07/31/08 due 08/01/08 at 1.990%, collateralized by a U.S. Treasury Obligation maturing 02/28/11, market value $747,300 (repurchase proceeds $732,040) | $ | 732,000 | $ | 732,000 | |||||||
| Total Short-Term Obligation (Cost of $732,000) | 732,000 | ||||||||||
| Total Investments (99.8%) (Cost of $16,391,466) (b) | 17,040,286 | ||||||||||
| Other Assets & Liabilities, Net (0.2%) | 39,128 | ||||||||||
| Net Assets (100.0%) | $ | 17,079,414 | |||||||||
Notes to Schedule of Investments:
(a) Non-income producing security.
(b) Cost for federal income tax purposes is $16,438,302.
For the year ended July 31, 2008, transactions in written option contracts were as follows:
| Number of contracts | Premium received | ||||||||||
| Options outstanding at July 31, 2007 | - | $ | - | ||||||||
| Options written | 32 | 21,982 | |||||||||
| Options expired | (32 | ) | (21,982 | ) | |||||||
| Options outstanding at July 31, 2008 | - | $ | - | ||||||||
At July 31, 2008, the Fund held investments in the following sectors:
| Sector (Unaudited) | % of Net Assets | ||||||
| Financials | 30.0 | ||||||
| Utilities | 11.0 | ||||||
| Industrials | 10.2 | ||||||
| Consumer Discretionary | 9.9 | ||||||
| Consumer Staples | 8.9 | ||||||
| Energy | 7.1 | ||||||
| Information Technology | 7.0 | ||||||
| Materials | 6.6 | ||||||
| Health Care | 4.8 | ||||||
| 95.5 | |||||||
| Short-Term Obligation | 4.3 | ||||||
| Other Assets & Liabilities, Net | 0.2 | ||||||
| 100.0 | |||||||
| Acronym | Name | ||||
| ADR | American Depositary Receipt | ||||
See Accompanying Notes to Financial Statements.
79
CMG SMALL CAP GROWTH FUND
A Portfolio of Columbia Funds Institutional Trust
SCHEDULE OF INVESTMENTS
July 31, 2008
| Shares | Value | ||||||||||
| Common Stocks (99.0%) | |||||||||||
| Consumer Discretionary (12.4%) | |||||||||||
| Auto Components (0.3%) | |||||||||||
| WABCO Holdings, Inc. | 2,948 | $ | 133,132 | ||||||||
| Distributors (0.6%) | |||||||||||
| LKQ Corp. (a) | 12,030 | 246,615 | |||||||||
| Diversified Consumer Services (2.4%) | |||||||||||
| Capella Education Co. (a) | 6,068 | 316,750 | |||||||||
| Coinstar, Inc. (a) | 8,540 | 294,545 | |||||||||
| DeVry, Inc. | 3,040 | 172,702 | |||||||||
| New Oriental Education & Technology Group, ADR (a) | 2,710 | 189,700 | |||||||||
| 973,697 | |||||||||||
| Hotels, Restaurants & Leisure (1.9%) | |||||||||||
| Ctrip.com International Ltd., ADR | 3,877 | 174,814 | |||||||||
| Panera Bread Co., Class A (a) | 4,030 | 201,903 | |||||||||
| Vail Resorts, Inc. (a) | 4,880 | 197,054 | |||||||||
| WMS Industries, Inc. (a) | 7,310 | 205,996 | |||||||||
| 779,767 | |||||||||||
| Household Durables (0.6%) | |||||||||||
| Tupperware Brands Corp. | 5,840 | 227,760 | |||||||||
| Internet & Catalog Retail (1.0%) | |||||||||||
| Priceline.com, Inc. (a) | 3,530 | 405,774 | |||||||||
| Leisure Equipment & Products (0.5%) | |||||||||||
| Polaris Industries, Inc. | 4,220 | 180,616 | |||||||||
| Media (1.0%) | |||||||||||
| Central European Media Enterprises Ltd., Class A (a) | 2,260 | 188,145 | |||||||||
| Morningstar, Inc. (a) | 3,700 | 232,952 | |||||||||
| 421,097 | |||||||||||
| Specialty Retail (2.1%) | |||||||||||
| Aeropostale, Inc. (a) | 5,010 | 161,572 | |||||||||
| Children's Place Retail Stores, Inc. (a) | 4,150 | 157,908 | |||||||||
| Gymboree Corp. (a) | 6,410 | 239,734 | |||||||||
| J Crew Group, Inc. (a) | 10,290 | 295,940 | |||||||||
| 855,154 | |||||||||||
| Textiles, Apparel & Luxury Goods (2.0%) | |||||||||||
| Deckers Outdoor Corp. (a) | 3,160 | 357,112 | |||||||||
| True Religion Apparel, Inc. (a) | 10,260 | 265,118 | |||||||||
| Warnaco Group, Inc. (a) | 4,890 | 205,135 | |||||||||
| 827,365 | |||||||||||
| 5,050,977 | |||||||||||
See Accompanying Notes to Financial Statements.
80
CMG SMALL CAP GROWTH FUND
A Portfolio of Columbia Funds Institutional Trust
SCHEDULE OF INVESTMENTS
| Shares | Value | ||||||||||
| Common Stocks (continued) | |||||||||||
| Consumer Staples (1.8%) | |||||||||||
| Beverages (1.0%) | |||||||||||
| Central European Distribution Corp. (a) | 5,570 | $ | 406,387 | ||||||||
| Food Products (0.4%) | |||||||||||
| Green Mountain Coffee Roasters, Inc. (a) | 4,470 | 162,485 | |||||||||
| Personal Products (0.4%) | |||||||||||
| Chattem, Inc. (a) | 2,390 | 154,083 | |||||||||
| 722,955 | |||||||||||
| Energy (11.3%) | |||||||||||
| Energy Equipment & Services (3.6%) | |||||||||||
| Atwood Oceanics, Inc. (a) | 13,030 | 598,207 | |||||||||
| Core Laboratories N.V. | 2,810 | 364,204 | |||||||||
| IHS, Inc., Class A (a) | 2,730 | 169,888 | |||||||||
| Tesco Corp. (a) | 10,220 | 317,536 | |||||||||
| 1,449,835 | |||||||||||
| Oil, Gas & Consumable Fuels (7.7%) | |||||||||||
| Arena Resources, Inc. (a) | 10,799 | 441,787 | |||||||||
| Berry Petroleum Co., Class A | 5,210 | 224,238 | |||||||||
| Carrizo Oil & Gas, Inc. (a) | 6,600 | 332,244 | |||||||||
| Concho Resources, Inc. (a) | 11,006 | 360,446 | |||||||||
| EXCO Resources, Inc. (a) | 7,490 | 195,115 | |||||||||
| Foundation Coal Holdings, Inc. | 4,190 | 248,886 | |||||||||
| Holly Corp. | 4,780 | 136,612 | |||||||||
| Parallel Petroleum Corp. (a) | 20,436 | 334,742 | |||||||||
| Penn Virginia Corp. | 3,430 | 208,373 | |||||||||
| PetroHawk Energy Corp. (a) | 7,990 | 266,227 | |||||||||
| Petroleum Development Corp. (a) | 2,840 | 157,080 | |||||||||
| Ship Finance International Ltd. | 8,380 | 249,221 | |||||||||
| 3,154,971 | |||||||||||
| 4,604,806 | |||||||||||
| Financials (3.7%) | |||||||||||
| Capital Markets (1.5%) | |||||||||||
| Waddell & Reed Financial, Inc., Class A | 17,910 | 598,194 | |||||||||
| Consumer Finance (0.4%) | |||||||||||
| Cash America International, Inc. | 4,330 | 182,553 | |||||||||
| Real Estate Investment Trusts (REITs) (1.8%) | |||||||||||
| Alexandria Real Estate Equities, Inc. | 2,450 | 252,987 | |||||||||
| Home Properties, Inc. | 4,950 | 272,349 | |||||||||
| Washington Real Estate Investment Trust | 6,160 | 211,041 | |||||||||
| 736,377 | |||||||||||
| 1,517,124 | |||||||||||
See Accompanying Notes to Financial Statements.
81
CMG SMALL CAP GROWTH FUND
A Portfolio of Columbia Funds Institutional Trust
SCHEDULE OF INVESTMENTS
| Shares | Value | ||||||||||
| Common Stocks (continued) | |||||||||||
| Health Care (22.7%) | |||||||||||
| Biotechnology (7.6%) | |||||||||||
| Alexion Pharmaceuticals, Inc. (a) | 6,400 | $ | 600,000 | ||||||||
| BioMarin Pharmaceuticals, Inc. (a) | 9,170 | 298,484 | |||||||||
| Celera Corp. (a) | 11,860 | 161,889 | |||||||||
| Cepheid, Inc. (a) | 6,340 | 108,541 | |||||||||
| Myriad Genetics, Inc. (a) | 3,250 | 216,125 | |||||||||
| Onyx Pharmaceuticals, Inc. (a) | 11,280 | 456,840 | |||||||||
| OSI Pharmaceuticals, Inc. (a) | 9,900 | 521,037 | |||||||||
| Savient Pharmaceuticals, Inc. (a) | 10,231 | 271,940 | |||||||||
| United Therapeutics Corp. (a) | 4,160 | 471,702 | |||||||||
| 3,106,558 | |||||||||||
| Health Care Equipment & Supplies (5.7%) | |||||||||||
| Haemonetics Corp. (a) | 4,410 | 256,045 | |||||||||
| Hologic, Inc. (a) | 27,286 | 503,972 | |||||||||
| Immucor, Inc. (a) | 5,880 | 177,164 | |||||||||
| Insulet Corp. (a) | 6,948 | 96,925 | |||||||||
| Masimo Corp. (a) | 6,078 | 229,566 | |||||||||
| Natus Medical, Inc. (a) | 10,778 | 250,157 | |||||||||
| NuVasive, Inc. (a) | 10,510 | 590,347 | |||||||||
| Spectranetics Corp. (a) | 26,230 | 234,759 | |||||||||
| 2,338,935 | |||||||||||
| Health Care Providers & Services (3.2%) | |||||||||||
| CardioNet, Inc. (a) | 4,592 | 126,556 | |||||||||
| Genoptix, Inc. (a) | 5,050 | 147,207 | |||||||||
| HealthExtras, Inc. (a) | 10,465 | 314,055 | |||||||||
| IPC The Hospitalist Co., Inc. (a) | 7,943 | 171,172 | |||||||||
| Pediatrix Medical Group, Inc. (a) | 1,840 | 89,516 | |||||||||
| Psychiatric Solutions, Inc. (a) | 13,477 | 471,964 | |||||||||
| 1,320,470 | |||||||||||
| Health Care Technology (0.5%) | |||||||||||
| Phase Forward, Inc. (a) | 11,208 | 206,227 | |||||||||
| Life Sciences Tools & Services (4.5%) | |||||||||||
| ICON PLC, ADR (a) | 15,150 | 1,217,151 | |||||||||
| Illumina, Inc. (a)(b) | 6,500 | 606,060 | |||||||||
| 1,823,211 | |||||||||||
| Pharmaceuticals (1.2%) | |||||||||||
| Cypress Bioscience, Inc. (a) | 14,180 | 123,366 | |||||||||
| Perrigo Co. | 10,620 | 374,142 | |||||||||
| 497,508 | |||||||||||
| 9,292,909 | |||||||||||
| Industrials (16.9%) | |||||||||||
| Aerospace & Defense (0.8%) | |||||||||||
| Hexcel Corp. (a) | 16,390 | 311,082 | |||||||||
See Accompanying Notes to Financial Statements.
82
CMG SMALL CAP GROWTH FUND
A Portfolio of Columbia Funds Institutional Trust
SCHEDULE OF INVESTMENTS
| Shares | Value | ||||||||||
| Common Stocks (continued) | |||||||||||
| Air Freight & Logistics (0.5%) | |||||||||||
| HUB Group, Inc., Class A (a) | 5,245 | $ | 203,821 | ||||||||
| Commercial Services & Supplies (5.3%) | |||||||||||
| Advisory Board Co. (a) | 3,930 | 150,715 | |||||||||
| CoStar Group, Inc. (a) | 4,270 | 213,030 | |||||||||
| EnergySolutions, Inc. | 7,158 | 146,811 | |||||||||
| FTI Consulting, Inc. (a) | 4,182 | 297,591 | |||||||||
| Geo Group, Inc. (a) | 9,400 | 225,976 | |||||||||
| Huron Consulting Group, Inc. (a) | 6,670 | 347,907 | |||||||||
| Ritchie Bros Auctioneers, Inc. | 13,060 | 340,997 | |||||||||
| Waste Connections, Inc. (a) | 12,430 | 452,328 | |||||||||
| 2,175,355 | |||||||||||
| Construction & Engineering (0.5%) | |||||||||||
| EMCOR Group, Inc. (a) | 7,480 | 225,298 | |||||||||
| Electrical Equipment (3.9%) | |||||||||||
| Acuity Brands, Inc. | 7,320 | 299,095 | |||||||||
| Energy Conversion Devices, Inc. (a) | 3,500 | 244,755 | |||||||||
| General Cable Corp. (a) | 7,430 | 428,191 | |||||||||
| GrafTech International Ltd. (a) | 18,200 | 426,790 | |||||||||
| SunPower Corp., Class A (a) | 2,210 | 174,082 | |||||||||
| 1,572,913 | |||||||||||
| Machinery (4.2%) | |||||||||||
| Actuant Corp., Class A | 6,400 | 194,944 | |||||||||
| Barnes Group, Inc. | 10,360 | 234,032 | |||||||||
| Bucyrus International, Inc., Class A | 8,470 | 592,985 | |||||||||
| Kaydon Corp. | 3,340 | 158,383 | |||||||||
| Key Technology, Inc. (a) | 6,842 | 219,286 | |||||||||
| RBC Bearings, Inc. (a) | 8,931 | 297,134 | |||||||||
| 1,696,764 | |||||||||||
| Road & Rail (1.2%) | |||||||||||
| Genesee & Wyoming, Inc., Class A (a) | 7,420 | 300,288 | |||||||||
| Landstar System, Inc. | 3,980 | 201,308 | |||||||||
| 501,596 | |||||||||||
| Transportation Infrastructure (0.5%) | |||||||||||
| Aegean Marine Petroleum Network, Inc. | 5,670 | 205,254 | |||||||||
| 6,892,083 | |||||||||||
| Information Technology (21.1%) | |||||||||||
| Communications Equipment (0.6%) | |||||||||||
| Neutral Tandem, Inc. (a) | 12,900 | 222,912 | |||||||||
| Electronic Equipment & Instruments (1.4%) | |||||||||||
| DTS, Inc. (a) | 11,879 | 339,621 | |||||||||
| Itron, Inc. (a) | 2,450 | 226,208 | |||||||||
| 565,829 | |||||||||||
See Accompanying Notes to Financial Statements.
83
CMG SMALL CAP GROWTH FUND
A Portfolio of Columbia Funds Institutional Trust
SCHEDULE OF INVESTMENTS
| Shares | Value | ||||||||||
| Common Stocks (continued) | |||||||||||
| Internet Software & Services (3.3%) | |||||||||||
| Bankrate, Inc. (a) | 7,294 | $ | 229,396 | ||||||||
| Equinix, Inc. (a) | 2,993 | 243,511 | |||||||||
| Omniture, Inc. (a) | 14,995 | 260,163 | |||||||||
| VistaPrint Ltd. (a) | 6,690 | 172,401 | |||||||||
| Vocus, Inc. (a) | 12,306 | 437,971 | |||||||||
| 1,343,442 | |||||||||||
| IT Services (1.5%) | |||||||||||
| Cybersource Corp. (a) | 12,520 | 222,230 | |||||||||
| Gartner, Inc. (a) | 7,900 | 192,444 | |||||||||
| Wright Express Corp. (a) | 7,650 | 203,108 | |||||||||
| 617,782 | |||||||||||
| Semiconductors & Semiconductor Equipment (5.3%) | |||||||||||
| Atheros Communications, Inc. (a) | 12,073 | 374,263 | |||||||||
| Entegris, Inc. (a) | 28,110 | 177,936 | |||||||||
| FEI Co. (a) | 4,560 | 115,140 | |||||||||
| Hittite Microwave Corp. (a) | 7,310 | 233,335 | |||||||||
| Microsemi Corp. (a) | 6,750 | 175,230 | |||||||||
| Monolithic Power Systems, Inc. (a) | 9,250 | 201,188 | |||||||||
| Netlogic Microsystems, Inc. (a) | 8,540 | 273,366 | |||||||||
| Power Integrations, Inc. (a) | 11,200 | 305,984 | |||||||||
| Trina Solar Ltd., ADR (a) | 5,770 | 158,790 | |||||||||
| Verigy Ltd. (a) | 7,110 | 158,055 | |||||||||
| 2,173,287 | |||||||||||
| Software (9.0%) | |||||||||||
| Advent Software, Inc. (a) | 6,900 | 300,426 | |||||||||
| Blackboard, Inc. (a) | 8,250 | 329,670 | |||||||||
| Concur Technologies, Inc. (a) | 8,771 | 361,541 | |||||||||
| FactSet Research Systems, Inc. | 3,100 | 178,777 | |||||||||
| Informatica Corp. (a) | 10,920 | 176,795 | |||||||||
| Jack Henry & Associates, Inc. | 6,260 | 135,153 | |||||||||
| Magma Design Automation, Inc. (a) | 24,150 | 153,111 | |||||||||
| Micros Systems, Inc. (a) | 10,190 | 322,819 | |||||||||
| Net 1 UEPS Technologies, Inc. (a) | 11,280 | 265,982 | |||||||||
| Netscout Systems, Inc. (a) | 17,290 | 235,490 | |||||||||
| Nuance Communications, Inc. (a) | 15,910 | 246,923 | |||||||||
| Solera Holdings, Inc. (a) | 11,670 | 338,313 | |||||||||
| SPSS, Inc. (a) | 5,880 | 194,334 | |||||||||
| Taleo Corp., Class A (a) | 15,160 | 284,099 | |||||||||
| Ultimate Software Group, Inc. (a) | 6,340 | 166,298 | |||||||||
| 3,689,731 | |||||||||||
| 8,612,983 | |||||||||||
| Materials (7.3%) | |||||||||||
| Chemicals (3.9%) | |||||||||||
| CF Industries Holdings, Inc. | 2,820 | 460,957 | |||||||||
| Intrepid Potash, Inc. (a) | 10,660 | 589,498 | |||||||||
| Terra Industries, Inc. | 9,880 | 533,520 | |||||||||
| 1,583,975 | |||||||||||
See Accompanying Notes to Financial Statements.
84
CMG SMALL CAP GROWTH FUND
A Portfolio of Columbia Funds Institutional Trust
SCHEDULE OF INVESTMENTS
| Shares | Value | ||||||||||
| Common Stocks (continued) | |||||||||||
| Containers & Packaging (0.7%) | |||||||||||
| Silgan Holdings, Inc. | 5,700 | $ | 301,074 | ||||||||
| Metals & Mining (2.7%) | |||||||||||
| Cleveland-Cliffs, Inc. | 4,450 | 482,424 | |||||||||
| PAN American Silver Corp. (a) | 9,790 | 303,001 | |||||||||
| Steel Dynamics, Inc. | 10,370 | 328,522 | |||||||||
| 1,113,947 | |||||||||||
| 2,998,996 | |||||||||||
| Telecommunication Services (1.3%) | |||||||||||
| Wireless Telecommunication Services (1.3%) | |||||||||||
| SBA Communications Corp., Class A (a) | 13,680 | 518,335 | |||||||||
| Utilities (0.5%) | |||||||||||
| Electric Utilities (0.5%) | |||||||||||
| ITC Holdings Corp. | 3,750 | 195,450 | |||||||||
| Total Common Stocks (Cost of $34,006,514) | 40,406,618 | ||||||||||
| Par | |||||||||||
| Short-Term Obligation (3.4%) | |||||||||||
| Repurchase agreement with Fixed Income Clearing Corp., dated 07/31/08, due 08/01/08 at 1.990%, collateralized by a U.S. Treasury Obligation maturing 05/15/13, market value $1,438,200 (repurchase proceeds $1,407,078) | $ | 1,407,000 | 1,407,000 | ||||||||
| Total Short-Term Obligation (Cost of $1,407,000) | 1,407,000 | ||||||||||
| Total Investments (102.4%) (Cost of $35,413,514) (c) | 41,813,618 | ||||||||||
| Other Assets & Liabilities, Net (-2.4%) | (995,365 | ) | |||||||||
| Net Assets (100.0%) | $ | 40,818,253 | |||||||||
Notes to Schedule of Investments:
(a) Non-income producing security.
(b) All or a portion of this security is pledged as collateral for open written options contracts.
(c) Cost for federal income tax purposes is $35,824,905.
See Accompanying Notes to Financial Statements.
85
CMG SMALL CAP GROWTH FUND
A Portfolio of Columbia Funds Institutional Trust
SCHEDULE OF INVESTMENTS
At July 31, 2008 the Fund held the following written call option contracts:
| Name of Issuer | Strike Price | Number of Contracts | Expiration Date | Premium | Value | ||||||||||||||||||
| Illumina, Inc | $ | 100 | 65 | 08/16/08 | $ | 8,362 | $ | 3,250 | |||||||||||||||
| Total written call options (proceeds $8,362) | |||||||||||||||||||||||
For the year ended July 31, 2008, transactions in written option contracts were as follows:
| Number of contracts | Premium received | ||||||||||
| Options outstanding at July 31, 2007 | - | $ | - | ||||||||
| Options written | 189 | 54,846 | |||||||||
| Options bought back | (94 | ) | (37,905 | ) | |||||||
| Options exercised | - | - | |||||||||
| Options expired | (30 | ) | (8,579 | ) | |||||||
| Options outstanding at July 31, 2008 | 65 | $ | 8,362 | ||||||||
At July 31, 2008, the Fund held investments in the following sectors:
| Sector (Unaudited) | % of Net Assets | ||||||
| Health Care | 22.7 | ||||||
| Information Technology | 21.1 | ||||||
| Industrials | 16.9 | ||||||
| Consumer Discretionary | 12.4 | ||||||
| Energy | 11.3 | ||||||
| Materials | 7.3 | ||||||
| Financials | 3.7 | ||||||
| Consumer Staples | 1.8 | ||||||
| Telecommunication Services | 1.3 | ||||||
| Utilities | 0.5 | ||||||
| 99.0 | |||||||
| Short-Term Obligation | 3.4 | ||||||
| Other Assets & Liabilities, Net | (2.4 | ) | |||||
| 100.0 | |||||||
| Acronym | Name | ||||
| ADR | American Depositary Receipt | ||||
See Accompanying Notes to Financial Statements.
86
CMG SMALL CAP VALUE FUND
A Portfolio of Columbia Funds Institutional Trust
SCHEDULE OF INVESTMENTS
July 31, 2008
| Shares | Value | ||||||||||
| Common Stocks (100.0%) | |||||||||||
| Consumer Discretionary (8.3%) | |||||||||||
| Auto Components (0.8%) | |||||||||||
| American Axle & Manufacturing Holdings, Inc. | 2,340 | $ | 13,759 | ||||||||
| BorgWarner, Inc. | 3,480 | 140,314 | |||||||||
| Modine Manufacturing Co. | 3,700 | 64,528 | |||||||||
| 218,601 | |||||||||||
| Diversified Consumer Services (0.1%) | |||||||||||
| Regis Corp. | 1,360 | 38,066 | |||||||||
| Hotels, Restaurants & Leisure (1.7%) | |||||||||||
| Benihana, Inc., Class A (a) | 6,950 | 46,357 | |||||||||
| Bob Evans Farms, Inc. | 3,800 | 108,832 | |||||||||
| CEC Entertainment, Inc. (a) | 3,100 | 108,066 | |||||||||
| Landry's Restaurants, Inc. | 5,070 | 73,870 | |||||||||
| O'Charleys, Inc. | 5,120 | 57,600 | |||||||||
| Red Robin Gourmet Burgers, Inc. (a) | 1,910 | 47,425 | |||||||||
| 442,150 | |||||||||||
| Household Durables (1.8%) | |||||||||||
| American Greetings Corp., Class A | 9,720 | 144,051 | |||||||||
| Cavco Industries, Inc. (a) | 1,386 | 46,708 | |||||||||
| CSS Industries, Inc. | 2,820 | 79,750 | |||||||||
| Ethan Allen Interiors, Inc. | 2,050 | 51,455 | |||||||||
| Furniture Brands International, Inc. | 5,020 | 59,587 | |||||||||
| Skyline Corp. | 938 | 24,454 | |||||||||
| Universal Electronics, Inc. (a) | 3,370 | 76,566 | |||||||||
| 482,571 | |||||||||||
| Internet & Catalog Retail (0.2%) | |||||||||||
| NutriSystem, Inc. | 3,060 | 52,662 | |||||||||
| Leisure Equipment & Products (0.3%) | |||||||||||
| Brunswick Corp. | 5,670 | 73,143 | |||||||||
| Specialty Retail (2.5%) | |||||||||||
| America's Car-Mart, Inc. (a) | 7,915 | 157,667 | |||||||||
| Foot Locker, Inc. | 4,986 | 75,089 | |||||||||
| MarineMax, Inc. (a) | 4,530 | 29,807 | |||||||||
| Monro Muffler Brake, Inc. | 7,200 | 131,112 | |||||||||
| Rent-A-Center, Inc. (a) | 8,209 | 174,031 | |||||||||
| Zale Corp. (a) | 3,880 | 85,826 | |||||||||
| 653,532 | |||||||||||
| Textiles, Apparel & Luxury Goods (0.9%) | |||||||||||
| Hampshire Group Ltd. (a) | 5,286 | 31,716 | |||||||||
| Movado Group, Inc. | 4,580 | 98,470 | |||||||||
| Wolverine World Wide, Inc. | 4,340 | 116,008 | |||||||||
| 246,194 | |||||||||||
| 2,206,919 | |||||||||||
See Accompanying Notes to Financial Statements.
87
CMG SMALL CAP VALUE FUND
A Portfolio of Columbia Funds Institutional Trust
SCHEDULE OF INVESTMENTS
| Shares | Value | ||||||||||
| Common Stocks (continued) | |||||||||||
| Consumer Staples (4.6%) | |||||||||||
| Beverages (0.2%) | |||||||||||
| MGP Ingredients, Inc. | 9,377 | $ | 51,573 | ||||||||
| Food & Staples Retailing (2.0%) | |||||||||||
| BJ's Wholesale Club, Inc. (a) | 3,160 | 118,595 | |||||||||
| Longs Drug Stores Corp. | 2,682 | 125,384 | |||||||||
| Ruddick Corp. | 2,600 | 80,496 | |||||||||
| Weis Markets, Inc. | 5,550 | 210,844 | |||||||||
| 535,319 | |||||||||||
| Food Products (1.8%) | |||||||||||
| Flowers Foods, Inc. | 2,828 | 85,038 | |||||||||
| Fresh Del Monte Produce, Inc. (a) | 2,310 | 48,695 | |||||||||
| J & J Snack Foods Corp. | 2,190 | 69,357 | |||||||||
| Lancaster Colony Corp. | 3,370 | 109,559 | |||||||||
| Lance, Inc. | 4,600 | 84,640 | |||||||||
| Ralcorp Holdings, Inc. (a) | 1,520 | 82,019 | |||||||||
| 479,308 | |||||||||||
| Personal Products (0.6%) | |||||||||||
| Bare Escentuals, Inc. (a) | 3,930 | 45,352 | |||||||||
| NBTY, Inc. (a) | 3,510 | 121,060 | |||||||||
| 166,412 | |||||||||||
| 1,232,612 | |||||||||||
| Energy (5.8%) | |||||||||||
| Energy Equipment & Services (2.8%) | |||||||||||
| Complete Production Services, Inc. (a) | 4,253 | 135,416 | |||||||||
| Key Energy Services, Inc. (a) | 6,120 | 98,287 | |||||||||
| Lufkin Industries, Inc. | 1,107 | 98,744 | |||||||||
| Oil States International, Inc. (a) | 1,590 | 87,259 | |||||||||
| Patterson-UTI Energy, Inc. | 2,520 | 71,618 | |||||||||
| TGC Industries, Inc. (a) | 7,649 | 61,728 | |||||||||
| Tidewater, Inc. | 1,970 | 118,082 | |||||||||
| TriCo Marine Services, Inc. (a) | 3,683 | 93,990 | |||||||||
| 765,124 | |||||||||||
| Oil, Gas & Consumable Fuels (3.0%) | |||||||||||
| Bois d'Arc Energy, Inc. (a) | 4,178 | 91,498 | |||||||||
| Comstock Resources, Inc. (a) | 2,440 | 148,864 | |||||||||
| Frontier Oil Corp. | 4,080 | 74,460 | |||||||||
| Harvest Natural Resources, Inc. (a) | 11,780 | 116,033 | |||||||||
| Holly Corp. | 2,620 | 74,880 | |||||||||
| Nordic American Tanker Shipping | 2,123 | 84,750 | |||||||||
| Stone Energy Corp. (a) | 2,430 | 123,979 | |||||||||
| Swift Energy Co. (a) | 1,610 | 81,820 | |||||||||
| 796,284 | |||||||||||
| 1,561,408 | |||||||||||
See Accompanying Notes to Financial Statements.
88
CMG SMALL CAP VALUE FUND
A Portfolio of Columbia Funds Institutional Trust
SCHEDULE OF INVESTMENTS
| Shares | Value | ||||||||||
| Common Stocks (continued) | |||||||||||
| Financials (30.5%) | |||||||||||
| Capital Markets (0.4%) | |||||||||||
| Piper Jaffray Companies, Inc. (a) | 3,300 | $ | 117,150 | ||||||||
| Commercial Banks (8.1%) | |||||||||||
| BancFirst Corp. | 2,700 | 127,575 | |||||||||
| BancTrust Financial Group, Inc. | 8,802 | 66,015 | |||||||||
| Bank of Granite Corp. | 9,727 | 80,150 | |||||||||
| Bryn Mawr Bank Corp. | 5,296 | 127,422 | |||||||||
| Capital Corp. of the West | 7,652 | 36,424 | |||||||||
| Capitol Bancorp Ltd. | 6,526 | 86,731 | |||||||||
| Chemical Financial Corp. | 7,265 | 193,031 | |||||||||
| Columbia Banking System, Inc. | 4,830 | 72,981 | |||||||||
| Community Trust Bancorp, Inc. | 3,410 | 105,096 | |||||||||
| First Citizens BancShares, Inc., Class A | 1,204 | 170,366 | |||||||||
| First Financial Corp. | 4,800 | 179,328 | |||||||||
| First Horizon National Corp. | 12,650 | 118,910 | |||||||||
| First National Bank of Alaska (b) | 43 | 79,550 | |||||||||
| Mass Financial Corp., Class A (a) | 13,010 | 58,545 | |||||||||
| Merchants Bancshares, Inc. | 5,108 | 105,991 | |||||||||
| Northfield Bancorp, Inc. (a) | 6,129 | 70,913 | |||||||||
| Northrim BanCorp, Inc. | 5,714 | 90,967 | |||||||||
| Sterling Bancorp NY | 7,950 | 111,618 | |||||||||
| Taylor Capital Group, Inc. | 6,000 | 41,460 | |||||||||
| West Coast Bancorp | 7,140 | 78,611 | |||||||||
| Whitney Holding Corp. | 8,650 | 177,844 | |||||||||
| 2,179,528 | |||||||||||
| Consumer Finance (1.3%) | |||||||||||
| Advance America Cash Advance Centers, Inc. | 14,130 | 77,291 | |||||||||
| Cash America International, Inc. | 6,240 | 263,078 | |||||||||
| 340,369 | |||||||||||
| Diversified Financial Services (0.5%) | |||||||||||
| Medallion Financial Corp. | 12,653 | 125,012 | |||||||||
| Insurance (9.0%) | |||||||||||
| Baldwin & Lyons, Inc., Class B | 4,781 | 101,596 | |||||||||
| CNA Surety Corp. (a) | 8,130 | 105,609 | |||||||||
| EMC Insurance Group, Inc. | 5,310 | 129,989 | |||||||||
| FBL Financial Group, Inc. | 3,042 | 63,426 | |||||||||
| Harleysville Group, Inc. | 3,515 | 125,239 | |||||||||
| Horace Mann Educators Corp. | 9,560 | 132,502 | |||||||||
| IPC Holdings Ltd. | 4,550 | 146,055 | |||||||||
| Max Capital Group Ltd. | 5,770 | 135,422 | |||||||||
| Mercury General Corp. | 1,900 | 95,969 | |||||||||
| National Western Life Insurance Co., Class A | 554 | 131,215 | |||||||||
| Navigators Group, Inc. (a) | 3,084 | 146,675 | |||||||||
| Phoenix Companies, Inc. | 18,781 | 182,739 | |||||||||
| ProCentury Corp. | 10,081 | 165,833 | |||||||||
See Accompanying Notes to Financial Statements.
89
CMG SMALL CAP VALUE FUND
A Portfolio of Columbia Funds Institutional Trust
SCHEDULE OF INVESTMENTS
| Shares | Value | ||||||||||
| Common Stocks (continued) | |||||||||||
| Insurance (continued) | |||||||||||
| RAM Holdings Ltd. (a) | 23,008 | $ | 38,193 | ||||||||
| RLI Corp. | 2,762 | 150,860 | |||||||||
| Safety Insurance Group, Inc. | 3,400 | 144,398 | |||||||||
| Selective Insurance Group, Inc. | 5,305 | 114,588 | |||||||||
| Stewart Information Services Corp. | 4,110 | 71,761 | |||||||||
| United America Indemnity Ltd., Class A (a) | 16,377 | 213,392 | |||||||||
| 2,395,461 | |||||||||||
| Real Estate Investment Trusts (REITs) (5.4%) | |||||||||||
| DiamondRock Hospitality Co. | 12,200 | 112,484 | |||||||||
| DuPont Fabros Technology, Inc. | 5,936 | 97,054 | |||||||||
| Franklin Street Properties Corp. | 10,986 | 134,798 | |||||||||
| Getty Realty Corp. | 4,420 | 82,698 | |||||||||
| LaSalle Hotel Properties | 5,780 | 131,264 | |||||||||
| National Health Investors, Inc. | 3,712 | 114,664 | |||||||||
| Potlatch Corp. | 4,770 | 222,139 | |||||||||
| Realty Income Corp. | 5,690 | 143,331 | |||||||||
| Sun Communities, Inc. | 7,430 | 126,161 | |||||||||
| Universal Health Realty Income Trust | 3,920 | 137,082 | |||||||||
| Urstadt Biddle Properties, Inc., Class A | 8,280 | 137,034 | |||||||||
| 1,438,709 | |||||||||||
| Real Estate Management & Development (0.4%) | |||||||||||
| Maui Land & Pineapple Co., Inc. (a) | 3,601 | 102,628 | |||||||||
| Thrifts & Mortgage Finance (5.4%) | |||||||||||
| Bank Mutual Corp. | 14,430 | 168,831 | |||||||||
| BankFinancial Corp. | 8,760 | 126,757 | |||||||||
| Beneficial Mutual Bancorp, Inc. (a) | 10,882 | 130,366 | |||||||||
| Brookline Bancorp, Inc. | 16,800 | 163,800 | |||||||||
| Clifton Savings Bancorp, Inc. | 8,830 | 95,011 | |||||||||
| Corus Bankshares, Inc. | 16,332 | 63,858 | |||||||||
| ESSA Bancorp, Inc. | 5,867 | 78,031 | |||||||||
| Flagstar BanCorp, Inc. | 18,930 | 84,049 | |||||||||
| Home Federal Bancorp, Inc. | 11,240 | 115,772 | |||||||||
| TrustCo Bank Corp. NY | 10,340 | 90,268 | |||||||||
| United Financial Bancorp, Inc. | 7,243 | 86,844 | |||||||||
| Washington Federal, Inc. | 6,240 | 116,064 | |||||||||
| Westfield Financial, Inc. | 13,004 | 128,090 | |||||||||
| 1,447,741 | |||||||||||
| 8,146,598 | |||||||||||
| Health Care (10.5%) | |||||||||||
| Health Care Equipment & Supplies (2.4%) | |||||||||||
| Analogic Corp. | 1,980 | 144,896 | |||||||||
| Haemonetics Corp. (a) | 2,940 | 170,697 | |||||||||
| Hill-Rom Holdings, Inc. | 2,520 | 70,787 | |||||||||
| STERIS Corp. | 7,540 | 257,642 | |||||||||
| 644,022 | |||||||||||
See Accompanying Notes to Financial Statements.
90
CMG SMALL CAP VALUE FUND
A Portfolio of Columbia Funds Institutional Trust
SCHEDULE OF INVESTMENTS
| Shares | Value | ||||||||||
| Common Stocks (continued) | |||||||||||
| Health Care Providers & Services (5.9%) | |||||||||||
| Amedisys, Inc. (a) | 2,060 | $ | 132,087 | ||||||||
| AmSurg Corp. (a) | 3,920 | 105,056 | |||||||||
| Cross Country Healthcare, Inc. (a) | 8,360 | 133,342 | |||||||||
| Gentiva Health Services, Inc. (a) | 8,750 | 223,475 | |||||||||
| Healthspring, Inc. (a) | 2,734 | 53,176 | |||||||||
| Kindred Healthcare, Inc. (a) | 6,800 | 183,396 | |||||||||
| Magellan Health Services, Inc. (a) | 1,630 | 68,052 | |||||||||
| NovaMed, Inc. (a) | 16,134 | 63,568 | |||||||||
| Owens & Minor, Inc. | 3,941 | 180,971 | |||||||||
| Pediatrix Medical Group, Inc. (a) | 2,600 | 126,490 | |||||||||
| RehabCare Group, Inc. (a) | 5,176 | 85,715 | |||||||||
| Res-Care, Inc. (a) | 7,630 | 140,087 | |||||||||
| U.S. Physical Therapy, Inc. (a) | 4,400 | 71,852 | |||||||||
| 1,567,267 | |||||||||||
| Life Sciences Tools & Services (1.5%) | |||||||||||
| Bio-Rad Laboratories, Inc., Class A (a) | 1,940 | 172,854 | |||||||||
| PAREXEL International Corp. (a) | 4,970 | 145,273 | |||||||||
| Varian, Inc. (a) | 1,740 | 85,956 | |||||||||
| 404,083 | |||||||||||
| Pharmaceuticals (0.7%) | |||||||||||
| Alpharma, Inc., Class A (a) | 5,270 | 119,682 | |||||||||
| Sciele Pharma, Inc. | 3,670 | 68,445 | |||||||||
| 188,127 | |||||||||||
| 2,803,499 | |||||||||||
| Industrials (14.8%) | |||||||||||
| Aerospace & Defense (0.9%) | |||||||||||
| AAR Corp. (a) | 3,738 | 64,256 | |||||||||
| Esterline Technologies Corp. (a) | 1,560 | 76,097 | |||||||||
| Moog, Inc., Class A (a) | 2,400 | 106,680 | |||||||||
| 247,033 | |||||||||||
| Airlines (0.6%) | |||||||||||
| AirTran Holdings, Inc. (a) | 7,870 | 22,980 | |||||||||
| JetBlue Airways Corp. (a) | 10,525 | 55,467 | |||||||||
| Skywest, Inc. | 5,810 | 88,428 | |||||||||
| 166,875 | |||||||||||
| Building Products (1.7%) | |||||||||||
| Builders FirstSource, Inc. (a) | 7,483 | 32,701 | |||||||||
| Lennox International, Inc. | 3,350 | 119,595 | |||||||||
| NCI Building Systems, Inc. (a) | 4,440 | 166,322 | |||||||||
| Trex Co., Inc. (a) | 5,039 | 84,857 | |||||||||
| Universal Forest Products, Inc. | 2,180 | 58,860 | |||||||||
| 462,335 | |||||||||||
| Commercial Services & Supplies (3.9%) | |||||||||||
| ABM Industries, Inc. | 3,850 | 92,131 | |||||||||
| Casella Waste Systems, Inc., Class A (a) | 7,460 | 96,383 | |||||||||
| CBIZ, Inc. (a) | 10,032 | 82,162 | |||||||||
See Accompanying Notes to Financial Statements.
91
CMG SMALL CAP VALUE FUND
A Portfolio of Columbia Funds Institutional Trust
SCHEDULE OF INVESTMENTS
| Shares | Value | ||||||||||
| Common Stocks (continued) | |||||||||||
| Commercial Services & Supplies (continued) | |||||||||||
| CDI Corp. | 2,902 | $ | 59,723 | ||||||||
| Consolidated Graphics, Inc. (a) | 3,750 | 125,625 | |||||||||
| Healthcare Services Group, Inc. | 6,163 | 102,367 | |||||||||
| Kimball International, Inc., Class B | 6,280 | 67,259 | |||||||||
| Korn/Ferry International (a) | 6,000 | 105,000 | |||||||||
| MPS Group, Inc. (a) | 18,460 | 212,659 | |||||||||
| United Stationers, Inc. (a) | 2,420 | 92,759 | |||||||||
| 1,036,068 | |||||||||||
| Construction & Engineering (1.7%) | |||||||||||
| Dycom Industries, Inc. (a) | 6,880 | 109,186 | |||||||||
| EMCOR Group, Inc. (a) | 6,680 | 201,201 | |||||||||
| KHD Humboldt Wedag International Ltd. (a) | 5,662 | 150,100 | |||||||||
| 460,487 | |||||||||||
| Electrical Equipment (0.8%) | |||||||||||
| Belden CDT, Inc. | 3,240 | 119,621 | |||||||||
| Woodward Governor Co. | 2,450 | 110,250 | |||||||||
| 229,871 | |||||||||||
| Machinery (1.4%) | |||||||||||
| EnPro Industries, Inc. (a) | 5,200 | 187,252 | |||||||||
| Harsco Corp. | 2,360 | 127,676 | |||||||||
| Kadant, Inc. (a) | 2,373 | 50,759 | |||||||||
| 365,687 | |||||||||||
| Road & Rail (2.6%) | |||||||||||
| Amerco, Inc. (a) | 1,650 | 75,999 | |||||||||
| Genesee & Wyoming, Inc., Class A (a) | 3,020 | 122,219 | |||||||||
| Heartland Express, Inc. | 5,800 | 98,832 | |||||||||
| Knight Transportation, Inc. | 3,490 | 66,031 | |||||||||
| Ryder System, Inc. | 1,080 | 71,237 | |||||||||
| Werner Enterprises, Inc. | 10,640 | 253,338 | |||||||||
| 687,656 | |||||||||||
| Trading Companies & Distributors (1.2%) | |||||||||||
| Kaman Corp. | 4,436 | 111,255 | |||||||||
| Watsco, Inc. | 4,020 | 200,477 | |||||||||
| 311,732 | |||||||||||
| 3,967,744 | |||||||||||
| Information Technology (12.7%) | |||||||||||
| Communications Equipment (2.0%) | |||||||||||
| Anaren, Inc. (a) | 8,133 | 77,345 | |||||||||
| Bel Fuse, Inc., Class B | 1,970 | 55,869 | |||||||||
| Black Box Corp. | 3,031 | 90,021 | |||||||||
| Brocade Communications Systems, Inc. (a) | 10,130 | 68,378 | |||||||||
| Comtech Telecommunications Corp. (a) | 1,750 | 85,977 | |||||||||
| Emulex Corp. (a) | 5,840 | 65,817 | |||||||||
| Polycom, Inc. (a) | 3,270 | 77,172 | |||||||||
| Tollgrade Communications, Inc. (a) | 5,280 | 27,456 | |||||||||
| 548,035 | |||||||||||
See Accompanying Notes to Financial Statements.
92
CMG SMALL CAP VALUE FUND
A Portfolio of Columbia Funds Institutional Trust
SCHEDULE OF INVESTMENTS
| Shares | Value | ||||||||||
| Common Stocks (continued) | |||||||||||
| Computers & Peripherals (0.7%) | |||||||||||
| Electronics for Imaging, Inc. (a) | 6,080 | $ | 85,181 | ||||||||
| QLogic Corp. (a) | 5,340 | 100,605 | |||||||||
| 185,786 | |||||||||||
| Electronic Equipment & Instruments (3.7%) | |||||||||||
| Anixter International, Inc. (a) | 3,130 | 212,934 | |||||||||
| Benchmark Electronics, Inc. (a) | 6,350 | 92,964 | |||||||||
| Brightpoint, Inc. (a) | 11,356 | 78,243 | |||||||||
| CPI International, Inc. (a) | 6,270 | 90,601 | |||||||||
| GSI Group Inc. (a) | 8,510 | 44,252 | |||||||||
| MTS Systems Corp. | 3,230 | 135,305 | |||||||||
| NAM TAI Electronics, Inc. | 12,930 | 149,083 | |||||||||
| Plexus Corp. (a) | 2,900 | 82,650 | |||||||||
| Vishay Intertechnology, Inc. (a) | 11,320 | 101,540 | |||||||||
| 987,572 | |||||||||||
| IT Services (1.1%) | |||||||||||
| CACI International, Inc., Class A (a) | 2,410 | 108,354 | |||||||||
| CSG Systems International, Inc. (a) | 2,858 | 50,701 | |||||||||
| MAXIMUS, Inc. | 2,250 | 83,497 | |||||||||
| TeleTech Holdings, Inc. (a) | 2,960 | 40,256 | |||||||||
| 282,808 | |||||||||||
| Semiconductors & Semiconductor Equipment (2.4%) | |||||||||||
| Actel Corp. (a) | 7,078 | 97,322 | |||||||||
| Advanced Energy Industries, Inc. (a) | 3,850 | 53,207 | |||||||||
| ATMI, Inc. (a) | 1,680 | 37,850 | |||||||||
| Cabot Microelectronics Corp. (a) | 1,560 | 60,902 | |||||||||
| Exar Corp. (a) | 6,410 | 49,357 | |||||||||
| Fairchild Semiconductor International, Inc. (a) | 4,990 | 60,629 | |||||||||
| Kulicke & Soffa Industries, Inc. (a) | 3,325 | 21,147 | |||||||||
| Mattson Technology, Inc. (a) | 13,690 | 61,742 | |||||||||
| MKS Instruments, Inc. (a) | 3,871 | 79,743 | |||||||||
| RF Micro Devices, Inc. (a) | 12,550 | 41,039 | |||||||||
| Ultra Clean Holdings (a) | 6,140 | 40,217 | |||||||||
| Varian Semiconductor Equipment Associates, Inc. (a) | 1,455 | 42,515 | |||||||||
| 645,670 | |||||||||||
| Software (2.8%) | |||||||||||
| ACI Worldwide, Inc. (a) | 4,410 | 86,259 | |||||||||
| Captaris, Inc. (a) | 12,880 | 43,277 | |||||||||
| Lawson Software, Inc. (a) | 5,340 | 43,307 | |||||||||
| Mentor Graphics Corp. (a) | 7,161 | 99,395 | |||||||||
| MSC.Software Corp. (a) | 10,220 | 128,772 | |||||||||
| Progress Software Corp. (a) | 3,100 | 91,233 | |||||||||
| SPSS, Inc. (a) | 2,100 | 69,405 | |||||||||
| Sybase, Inc. (a) | 5,370 | 180,486 | |||||||||
| 742,134 | |||||||||||
| 3,392,005 | |||||||||||
See Accompanying Notes to Financial Statements.
93
CMG SMALL CAP VALUE FUND
A Portfolio of Columbia Funds Institutional Trust
SCHEDULE OF INVESTMENTS
| Shares | Value | ||||||||||
| Common Stocks (continued) | |||||||||||
| Materials (5.3%) | |||||||||||
| Chemicals (1.8%) | |||||||||||
| H.B. Fuller Co. | 8,890 | $ | 222,250 | ||||||||
| Minerals Technologies, Inc. | 1,270 | 81,928 | |||||||||
| Sensient Technologies Corp. | 5,690 | 177,073 | |||||||||
| 481,251 | |||||||||||
| Construction Materials (0.4%) | |||||||||||
| Eagle Materials, Inc. | 4,220 | 104,698 | |||||||||
| Containers & Packaging (1.8%) | |||||||||||
| AptarGroup, Inc. | 1,780 | 68,886 | |||||||||
| Greif, Inc., Class A | 2,198 | 133,726 | |||||||||
| Greif, Inc., Class B | 3,683 | 198,882 | |||||||||
| Packaging Corp. of America | 3,344 | 85,339 | |||||||||
| 486,833 | |||||||||||
| Metals & Mining (1.0%) | |||||||||||
| Carpenter Technology Corp. | 1,700 | 65,790 | |||||||||
| Haynes International, Inc. (a) | 1,756 | 83,304 | |||||||||
| Worthington Industries, Inc. | 7,520 | 133,405 | |||||||||
| 282,499 | |||||||||||
| Paper & Forest Products (0.3%) | |||||||||||
| Mercer International, Inc. (a) | 11,380 | 70,784 | |||||||||
| 1,426,065 | |||||||||||
| Telecommunication Services (0.6%) | |||||||||||
| Diversified Telecommunication Services (0.2%) | |||||||||||
| Warwick Valley Telephone Co. | 5,850 | 62,712 | |||||||||
| Wireless Telecommunication Services (0.4%) | |||||||||||
| Syniverse Holdings, Inc. (a) | 6,848 | 110,938 | |||||||||
| 173,650 | |||||||||||
| Utilities (6.9%) | |||||||||||
| Electric Utilities (3.7%) | |||||||||||
| ALLETE, Inc. | 3,810 | 162,154 | |||||||||
| El Paso Electric Co. (a) | 8,600 | 177,676 | |||||||||
| Hawaiian Electric Industries, Inc. | 5,210 | 128,895 | |||||||||
| Maine & Maritimes Corp. (a) | 1,215 | 53,666 | |||||||||
| MGE Energy, Inc. | 4,130 | 145,004 | |||||||||
| Portland General Electric Co. | 6,957 | 163,420 | |||||||||
| UIL Holdings Corp. | 4,670 | 146,078 | |||||||||
| 976,893 | |||||||||||
| Gas Utilities (0.5%) | |||||||||||
| WGL Holdings, Inc. | 3,550 | 122,582 | |||||||||
| Independent Power Producers & Energy Traders (0.6%) | |||||||||||
| Black Hills Corp. | 5,260 | 169,740 | |||||||||
See Accompanying Notes to Financial Statements.
94
CMG SMALL CAP VALUE FUND
A Portfolio of Columbia Funds Institutional Trust
SCHEDULE OF INVESTMENTS
| Shares | Value | ||||||||||
| Common Stocks (continued) | |||||||||||
| Multi-Utilities (2.1%) | |||||||||||
| Avista Corp. | 8,060 | $ | 182,317 | ||||||||
| CH Energy Group, Inc. | 7,150 | 259,188 | |||||||||
| NorthWestern Corp. | 5,410 | 134,006 | |||||||||
| 575,511 | |||||||||||
| 1,844,726 | |||||||||||
| Total Common Stocks (Cost of $24,183,006) | 26,755,226 | ||||||||||
| Total Investments (100.0%) (Cost of $24,183,006) (c) | 26,755,226 | ||||||||||
| Other Assets & Liabilities, Net (0.0%) | (7,213 | ) | |||||||||
| Net Assets (100.0%) | $ | 26,748,013 | |||||||||
Notes to Schedule of Investments:
(a) Non-income producing security.
(b) Represents fair value as determined in good faith under procedures approved by the Board of Trustees.
(c) Cost for federal income tax purposes is $24,400,751.
At July 31, 2008, the Fund held investments in the following sectors:
| Sector (Unaudited) | % of Net Assets | ||||||
| Financials | 30.5 | ||||||
| Industrials | 14.8 | ||||||
| Information Technology | 12.7 | ||||||
| Health Care | 10.5 | ||||||
| Consumer Discretionary | 8.3 | ||||||
| Utilities | 6.9 | ||||||
| Energy | 5.8 | ||||||
| Materials | 5.3 | ||||||
| Consumer Staples | 4.6 | ||||||
| Telecommunication Services | 0.6 | ||||||
| 100.0 | |||||||
| Other Assets & Liabilities, Net | 0.0 | * | |||||
| * Rounds to less than 0.01%. | 100.0 | ||||||
See Accompanying Notes to Financial Statements.
95
CMG SMALL/MID CAP FUND
A Portfolio of Columbia Funds Institutional Trust
SCHEDULE OF INVESTMENTS
July 31, 2008
| Shares | Value | ||||||||||
| Common Stocks (99.1%) | |||||||||||
| Consumer Discretionary (14.2%) | |||||||||||
| Auto Components (0.3%) | |||||||||||
| WABCO Holdings, Inc. | 814 | $ | 36,760 | ||||||||
| Distributors (0.5%) | |||||||||||
| LKQ Corp. (a) | 3,040 | 62,320 | |||||||||
| Diversified Consumer Services (2.3%) | |||||||||||
| Capella Education Co. (a) | 784 | 40,925 | |||||||||
| Coinstar, Inc. (a) | 2,410 | 83,121 | |||||||||
| ITT Educational Services, Inc. (a) | 1,010 | 89,466 | |||||||||
| New Oriental Education & Technology Group, ADR (a) | 770 | 53,900 | |||||||||
| 267,412 | |||||||||||
| Hotels, Restaurants & Leisure (1.9%) | |||||||||||
| Ctrip.com International Ltd., ADR | 1,071 | 48,291 | |||||||||
| Panera Bread Co., Class A (a) | 1,130 | 56,613 | |||||||||
| Vail Resorts, Inc. (a) | 1,320 | 53,302 | |||||||||
| WMS Industries, Inc. (a) | 2,200 | 61,996 | |||||||||
| 220,202 | |||||||||||
| Household Durables (0.6%) | |||||||||||
| Tupperware Brands Corp. | 1,640 | 63,960 | |||||||||
| Internet & Catalog Retail (1.0%) | |||||||||||
| Priceline.com, Inc. (a) | 1,020 | 117,249 | |||||||||
| Leisure Equipment & Products (0.4%) | |||||||||||
| Polaris Industries, Inc. | 1,150 | 49,220 | |||||||||
| Media (1.7%) | |||||||||||
| Central European Media Enterprises Ltd., Class A (a) | 900 | 74,925 | |||||||||
| Discovery Holding Co., Class A (a) | 2,880 | 57,254 | |||||||||
| Morningstar, Inc. (a) | 1,000 | 62,960 | |||||||||
| 195,139 | |||||||||||
| Specialty Retail (3.6%) | |||||||||||
| GameStop Corp., Class A (a) | 1,900 | 76,969 | |||||||||
| Guess ?, Inc. | 1,380 | 43,705 | |||||||||
| J Crew Group, Inc. (a) | 2,810 | 80,816 | |||||||||
| Ross Stores, Inc. | 1,430 | 54,283 | |||||||||
| Tiffany & Co. | 1,380 | 52,150 | |||||||||
| Urban Outfitters, Inc. (a) | 3,020 | 99,690 | |||||||||
| 407,613 | |||||||||||
| Textiles, Apparel & Luxury Goods (1.9%) | |||||||||||
| Deckers Outdoor Corp. (a) | 770 | 87,018 | |||||||||
| True Religion Apparel, Inc. (a) | 2,780 | 71,835 | |||||||||
| Warnaco Group, Inc. (a) | 1,350 | 56,632 | |||||||||
| 215,485 | |||||||||||
| 1,635,360 | |||||||||||
See Accompanying Notes to Financial Statements.
96
CMG SMALL/MID CAP FUND
A Portfolio of Columbia Funds Institutional Trust
SCHEDULE OF INVESTMENTS
| Shares | Value | ||||||||||
| Common Stocks (continued) | |||||||||||
| Consumer Staples (1.6%) | |||||||||||
| Beverages (0.8%) | |||||||||||
| Central European Distribution Corp. (a) | 1,220 | $ | 89,011 | ||||||||
| Food Products (0.4%) | |||||||||||
| Green Mountain Coffee Roasters, Inc. (a) | 1,260 | 45,801 | |||||||||
| Personal Products (0.4%) | |||||||||||
| Chattem, Inc. (a) | 710 | 45,774 | |||||||||
| 180,586 | |||||||||||
| Energy (10.3%) | |||||||||||
| Energy Equipment & Services (2.7%) | |||||||||||
| Atwood Oceanics, Inc. (a) | 2,320 | 106,511 | |||||||||
| Cameron International Corp. (a) | 1,400 | 66,864 | |||||||||
| Core Laboratories N.V. | 630 | 81,654 | |||||||||
| FMC Technologies, Inc. (a) | 910 | 56,220 | |||||||||
| 311,249 | |||||||||||
| Oil, Gas & Consumable Fuels (7.6%) | |||||||||||
| Alpha Natural Resources, Inc. (a) | 1,500 | 148,425 | |||||||||
| Concho Resources, Inc. (a) | 2,135 | 69,921 | |||||||||
| Continental Resources, Inc. (a) | 2,250 | 128,520 | |||||||||
| Denbury Resources, Inc. (a) | 5,720 | 160,961 | |||||||||
| Foundation Coal Holdings, Inc. | 700 | 41,580 | |||||||||
| Frontier Oil Corp. | 1,720 | 31,390 | |||||||||
| Parallel Petroleum Corp. (a) | 4,000 | 65,520 | |||||||||
| PetroHawk Energy Corp. (a) | 3,450 | 114,954 | |||||||||
| Southwestern Energy Co. (a) | 2,960 | 107,478 | |||||||||
| 868,749 | |||||||||||
| 1,179,998 | |||||||||||
| Financials (4.3%) | |||||||||||
| Capital Markets (2.2%) | |||||||||||
| Janus Capital Group, Inc. | 2,870 | 87,076 | |||||||||
| Waddell & Reed Financial, Inc., Class A | 5,050 | 168,670 | |||||||||
| 255,746 | |||||||||||
| Real Estate Investment Trusts (REITs) (2.1%) | |||||||||||
| Alexandria Real Estate Equities, Inc. | 540 | 55,760 | |||||||||
| Nationwide Health Properties, Inc. | 1,720 | 63,829 | |||||||||
| Plum Creek Timber Co., Inc. | 1,350 | 65,772 | |||||||||
| Washington Real Estate Investment Trust | 1,690 | 57,900 | |||||||||
| 243,261 | |||||||||||
| 499,007 | |||||||||||
See Accompanying Notes to Financial Statements.
97
CMG SMALL/MID CAP FUND
A Portfolio of Columbia Funds Institutional Trust
SCHEDULE OF INVESTMENTS
| Shares | Value | ||||||||||
| Common Stocks (continued) | |||||||||||
| Health Care (21.3%) | |||||||||||
| Biotechnology (6.7%) | |||||||||||
| Alexion Pharmaceuticals, Inc. (a) | 1,070 | $ | 100,313 | ||||||||
| Amylin Pharmaceuticals, Inc. (a) | 2,760 | 87,078 | |||||||||
| BioMarin Pharmaceuticals, Inc. (a) | 2,000 | 65,100 | |||||||||
| Cepheid, Inc. (a) | 1,740 | 29,789 | |||||||||
| ImClone Systems, Inc. (a) | 1,200 | 76,716 | |||||||||
| Myriad Genetics, Inc. (a) | 610 | 40,565 | |||||||||
| Onyx Pharmaceuticals, Inc. (a) | 2,580 | 104,490 | |||||||||
| OSI Pharmaceuticals, Inc. (a) | 2,240 | 117,891 | |||||||||
| Savient Pharmaceuticals, Inc. (a) | 2,021 | 53,718 | |||||||||
| United Therapeutics Corp. (a) | 780 | 88,444 | |||||||||
| 764,104 | |||||||||||
| Health Care Equipment & Supplies (4.2%) | |||||||||||
| Hologic, Inc. (a) | 6,090 | 112,482 | |||||||||
| Intuitive Surgical, Inc. (a) | 234 | 72,842 | |||||||||
| Masimo Corp. (a) | 1,708 | 64,511 | |||||||||
| Natus Medical, Inc. (a) | 2,384 | 55,332 | |||||||||
| NuVasive, Inc. (a) | 1,881 | 105,656 | |||||||||
| Varian Medical Systems, Inc. (a) | 1,120 | 67,200 | |||||||||
| 478,023 | |||||||||||
| Health Care Providers & Services (3.2%) | |||||||||||
| CardioNet, Inc. (a) | 1,296 | 35,718 | |||||||||
| Genoptix, Inc. (a) | 1,380 | 40,227 | |||||||||
| HealthExtras, Inc. (a) | 2,145 | 64,371 | |||||||||
| IPC The Hospitalist Co., Inc. (a) | 2,266 | 48,832 | |||||||||
| Laboratory Corp. of America Holdings (a) | 970 | 65,553 | |||||||||
| Psychiatric Solutions, Inc. (a) | 3,150 | 110,313 | |||||||||
| 365,014 | |||||||||||
| Health Care Technology (0.5%) | |||||||||||
| Phase Forward, Inc. (a) | 3,267 | 60,113 | |||||||||
| Life Sciences Tools & Services (6.1%) | |||||||||||
| Charles River Laboratories International, Inc. (a) | 1,590 | 105,671 | |||||||||
| Covance, Inc. (a) | 1,320 | 121,176 | |||||||||
| ICON PLC, ADR (a) | 1,976 | 158,752 | |||||||||
| Illumina, Inc. (a) | 820 | 76,457 | |||||||||
| Pharmaceutical Product Development, Inc. | 2,490 | 94,969 | |||||||||
| Thermo Fisher Scientific, Inc. (a) | 1,040 | 62,941 | |||||||||
| Waters Corp. (a) | 1,260 | 85,604 | |||||||||
| 705,570 | |||||||||||
| Pharmaceuticals (0.6%) | |||||||||||
| Perrigo Co. | 1,870 | 65,880 | |||||||||
| 2,438,704 | |||||||||||
See Accompanying Notes to Financial Statements.
98
CMG SMALL/MID CAP FUND
A Portfolio of Columbia Funds Institutional Trust
SCHEDULE OF INVESTMENTS
| Shares | Value | ||||||||||
| Common Stocks (continued) | |||||||||||
| Industrials (18.2%) | |||||||||||
| Aerospace & Defense (1.4%) | |||||||||||
| Goodrich Corp. | 860 | $ | 42,260 | ||||||||
| Hexcel Corp. (a) | 3,030 | 57,510 | |||||||||
| Precision Castparts Corp. | 600 | 56,058 | |||||||||
| 155,828 | |||||||||||
| Air Freight & Logistics (0.6%) | |||||||||||
| HUB Group, Inc., Class A (a) | 1,826 | 70,958 | |||||||||
| Commercial Services & Supplies (4.8%) | |||||||||||
| Advisory Board Co. (a) | 980 | 37,583 | |||||||||
| CoStar Group, Inc. (a) | 1,160 | 57,872 | |||||||||
| Dun & Bradstreet Corp. | 550 | 53,152 | |||||||||
| FTI Consulting, Inc. (a) | 1,090 | 77,564 | |||||||||
| Geo Group, Inc. (a) | 2,390 | 57,456 | |||||||||
| Huron Consulting Group, Inc. (a) | 1,524 | 79,492 | |||||||||
| Ritchie Bros Auctioneers, Inc. | 3,650 | 95,302 | |||||||||
| Stericycle, Inc. (a) | 1,520 | 90,820 | |||||||||
| 549,241 | |||||||||||
| Construction & Engineering (0.9%) | |||||||||||
| Foster Wheeler Ltd. (a) | 1,890 | 107,295 | |||||||||
| Electrical Equipment (4.5%) | |||||||||||
| AMETEK, Inc. | 1,370 | 65,568 | |||||||||
| Energy Conversion Devices, Inc. (a) | 960 | 67,133 | |||||||||
| First Solar, Inc. (a) | 210 | 59,873 | |||||||||
| General Cable Corp. (a) | 2,030 | 116,989 | |||||||||
| GrafTech International Ltd. (a) | 3,300 | 77,385 | |||||||||
| Roper Industries, Inc. | 1,200 | 73,416 | |||||||||
| SunPower Corp., Class A (a) | 780 | 61,441 | |||||||||
| 521,805 | |||||||||||
| Industrial Conglomerates (0.8%) | |||||||||||
| McDermott International, Inc. (a) | 1,830 | 87,236 | |||||||||
| Machinery (3.8%) | |||||||||||
| Actuant Corp., Class A | 1,400 | 42,644 | |||||||||
| Barnes Group, Inc. | 2,660 | 60,089 | |||||||||
| Bucyrus International, Inc., Class A | 1,350 | 94,514 | |||||||||
| Flowserve Corp. | 610 | 81,337 | |||||||||
| Kaydon Corp. | 1,140 | 54,059 | |||||||||
| Manitowoc Co., Inc. | 1,350 | 35,586 | |||||||||
| RBC Bearings, Inc. (a) | 1,970 | 65,542 | |||||||||
| 433,771 | |||||||||||
See Accompanying Notes to Financial Statements.
99
CMG SMALL/MID CAP FUND
A Portfolio of Columbia Funds Institutional Trust
SCHEDULE OF INVESTMENTS
| Shares | Value | ||||||||||
| Common Stocks (continued) | |||||||||||
| Road & Rail (1.4%) | |||||||||||
| Genesee & Wyoming, Inc., Class A (a) | 2,050 | $ | 82,963 | ||||||||
| Landstar System, Inc. | 1,620 | 81,940 | |||||||||
| 164,903 | |||||||||||
| 2,091,037 | |||||||||||
| Information Technology (18.6%) | |||||||||||
| Communications Equipment (0.6%) | |||||||||||
| Harris Corp. | 1,550 | 74,633 | |||||||||
| Electronic Equipment & Instruments (1.3%) | |||||||||||
| DTS, Inc. (a) | 3,084 | 88,172 | |||||||||
| Mettler-Toledo International, Inc. (a) | 550 | 59,130 | |||||||||
| 147,302 | |||||||||||
| Internet Software & Services (2.8%) | |||||||||||
| Bankrate, Inc. (a) | 2,362 | 74,285 | |||||||||
| Equinix, Inc. (a) | 650 | 52,884 | |||||||||
| Omniture, Inc. (a) | 4,105 | 71,222 | |||||||||
| Vocus, Inc. (a) | 3,525 | 125,454 | |||||||||
| 323,845 | |||||||||||
| IT Services (3.2%) | |||||||||||
| Alliance Data Systems Corp. (a) | 1,450 | 93,018 | |||||||||
| Cognizant Technology Solutions Corp., Class A (a) | 2,240 | 62,877 | |||||||||
| Cybersource Corp. (a) | 2,810 | 49,878 | |||||||||
| Gartner, Inc. (a) | 2,290 | 55,784 | |||||||||
| Global Payments, Inc. | 1,360 | 60,234 | |||||||||
| Total System Services, Inc. | 2,130 | 41,705 | |||||||||
| 363,496 | |||||||||||
| Semiconductors & Semiconductor Equipment (2.9%) | |||||||||||
| Atheros Communications, Inc. (a) | 2,495 | 77,345 | |||||||||
| ATMI, Inc. (a) | 1,820 | 41,005 | |||||||||
| Entegris, Inc. (a) | 7,460 | 47,222 | |||||||||
| Hittite Microwave Corp. (a) | 2,010 | 64,159 | |||||||||
| Microsemi Corp. (a) | 1,800 | 46,728 | |||||||||
| Monolithic Power Systems, Inc. (a) | 2,550 | 55,462 | |||||||||
| 331,921 | |||||||||||
| Software (7.8%) | |||||||||||
| Activision Blizzard, Inc. (a) | 2,170 | 78,077 | |||||||||
| Advent Software, Inc. (a) | 1,910 | 83,161 | |||||||||
| Blackboard, Inc. (a) | 2,220 | 88,711 | |||||||||
| Concur Technologies, Inc. (a) | 2,020 | 83,264 | |||||||||
| FactSet Research Systems, Inc. | 830 | 47,866 | |||||||||
| McAfee, Inc. (a) | 2,070 | 67,793 | |||||||||
| Micros Systems, Inc. (a) | 1,910 | 60,509 | |||||||||
| Net 1 UEPS Technologies, Inc. (a) | 2,610 | 61,544 | |||||||||
| Solera Holdings, Inc. (a) | 2,750 | 79,722 | |||||||||
| SPSS, Inc. (a) | 1,550 | 51,228 | |||||||||
| Taleo Corp., Class A (a) | 4,120 | 77,209 | |||||||||
See Accompanying Notes to Financial Statements.
100
CMG SMALL/MID CAP FUND
A Portfolio of Columbia Funds Institutional Trust
SCHEDULE OF INVESTMENTS
| Shares | Value | ||||||||||
| Common Stocks (continued) | |||||||||||
| Software (continued) | |||||||||||
| UBISOFT Entertainment (a) | 680 | $ | 67,210 | ||||||||
| Ultimate Software Group, Inc. (a) | 1,750 | 45,903 | |||||||||
| 892,197 | |||||||||||
| 2,133,394 | |||||||||||
| Materials (8.2%) | |||||||||||
| Chemicals (4.4%) | |||||||||||
| Agrium, Inc. | 1,220 | 107,360 | |||||||||
| CF Industries Holdings, Inc. | 770 | 125,864 | |||||||||
| Intrepid Potash, Inc. (a) | 942 | 52,093 | |||||||||
| Potash Corp. of Saskatchewan, Inc. | 1,065 | 217,547 | |||||||||
| 502,864 | |||||||||||
| Containers & Packaging (0.5%) | |||||||||||
| Silgan Holdings, Inc. | 1,070 | 56,517 | |||||||||
| Metals & Mining (3.3%) | |||||||||||
| Cleveland-Cliffs, Inc. | 1,470 | 159,363 | |||||||||
| Freeport-McMoRan Copper & Gold, Inc. | 607 | 58,727 | |||||||||
| PAN American Silver Corp. (a) | 2,700 | 83,565 | |||||||||
| Steel Dynamics, Inc. | 2,520 | 79,834 | |||||||||
| 381,489 | |||||||||||
| 940,870 | |||||||||||
| Telecommunication Services (1.9%) | |||||||||||
| Wireless Telecommunication Services (1.9%) | |||||||||||
| American Tower Corp., Class A (a) | 1,949 | 81,663 | |||||||||
| Crown Castle International Corp. (a) | 1,380 | 52,716 | |||||||||
| SBA Communications Corp., Class A (a) | 2,300 | 87,147 | |||||||||
| 221,526 | |||||||||||
| Utilities (0.5%) | |||||||||||
| Electric Utilities (0.5%) | |||||||||||
| ITC Holdings Corp. | 1,021 | 53,215 | |||||||||
| Total Common Stocks (Cost of $9,595,428) | 11,373,697 | ||||||||||
See Accompanying Notes to Financial Statements.
101
CMG SMALL/MID CAP FUND
A Portfolio of Columbia Funds Institutional Trust
SCHEDULE OF INVESTMENTS
| Par | Value | ||||||||||
| Short-Term Obligation (2.2%) | |||||||||||
| Repurchase agreement with Fixed Income Clearing Corp., dated 07/31/08, due 08/01/08 at 1.990%, collateralized by a U.S. Treasury Obligation maturing 02/28/11, market value $259,700 (repurchase proceeds $253,014) | $ | 253,000 | $ | 253,000 | |||||||
| Total Short-Term Obligation (Cost of $253,000) | 253,000 | ||||||||||
| Total Investments (101.3%) (Cost of $9,848,428) (b) | 11,626,697 | ||||||||||
| Other Assets & Liabilities, Net (-1.3%) | (152,485 | ) | |||||||||
| Net Assets (100.0%) | $ | 11,474,212 | |||||||||
Notes to Schedule of Investments:
(a) Non-income producing security.
(b) Cost for federal income tax purposes is $9,906,429.
For the year ended July 31, 2008, transactions in written options contracts were as follows:
| Number of contracts | Premium received | ||||||||||
| Options outstanding at July 31, 2007 | - | $ | - | ||||||||
| Options written | 23 | 7,028 | |||||||||
| Options bought back | (23 | ) | (7,028 | ) | |||||||
| Options outstanding at July 31, 2008 | - | $ | - | ||||||||
At July 31, 2008, the Fund held investments in the following sectors:
Sector (Unaudited) | % of Net Assets | ||||||
| Health Care | 21.3 | ||||||
| Information Technology | 18.6 | ||||||
| Industrials | 18.2 | ||||||
| Consumer Discretionary | 14.2 | ||||||
| Energy | 10.3 | ||||||
| Materials | 8.2 | ||||||
| Financials | 4.3 | ||||||
| Telecommunication Services | 1.9 | ||||||
| Consumer Staples | 1.6 | ||||||
| Utilities | 0.5 | ||||||
| 99.1 | |||||||
| Short-Term Obligation | 2.2 | ||||||
| Other Assets & Liabilities, Net | (1.3 | ) | |||||
| 100.0 | |||||||
| Acronym | Name | ||||||
| ADR | American Depositary Receipt | ||||||
See Accompanying Notes to Financial Statements.
102
CMG INTERNATIONAL STOCK FUND
A Portfolio of Columbia Funds Institutional Trust
SCHEDULE OF INVESTMENTS
July 31, 2008
| Shares | Value | ||||||||||
| Common Stocks (96.5%) | |||||||||||
| Consumer Discretionary (7.6%) | |||||||||||
| Auto Components (0.3%) | |||||||||||
| Toyota Boshoku Corp. | 12,900 | $ | 284,830 | ||||||||
| Automobiles (1.3%) | |||||||||||
| Dongfeng Motor Group Co., Ltd., Class H | 1,212,000 | 522,492 | |||||||||
| Honda Motor Co., Ltd. | 10,900 | 348,496 | |||||||||
| Toyota Motor Corp. | 7,900 | 339,460 | |||||||||
| 1,210,448 | |||||||||||
| Distributors (0.3%) | |||||||||||
| Inchcape PLC | 60,440 | 298,750 | |||||||||
| Hotels, Restaurants & Leisure (1.2%) | |||||||||||
| Kangwon Land, Inc. | 20,070 | 475,940 | |||||||||
| Paddy Power PLC | 24,088 | 668,420 | |||||||||
| 1,144,360 | |||||||||||
| Household Durables (2.0%) | |||||||||||
| JM AB | 37,400 | 439,640 | |||||||||
| Matsushita Electric Industrial Co., Ltd. | 53,000 | 1,122,801 | |||||||||
| Sony Corp. | 7,800 | 293,775 | |||||||||
| 1,856,216 | |||||||||||
| Leisure Equipment & Products (0.4%) | |||||||||||
| Nikon Corp. | 11,000 | 321,942 | |||||||||
| Media (1.5%) | |||||||||||
| Vivendi | 32,690 | 1,366,355 | |||||||||
| Specialty Retail (0.6%) | |||||||||||
| Esprit Holdings Ltd. | 48,900 | 522,654 | |||||||||
| 7,005,555 | |||||||||||
| Consumer Staples (8.1%) | |||||||||||
| Beverages (1.3%) | |||||||||||
| Fomento Economico Mexicano SAB de CV, ADR (a) | 15,182 | 696,247 | |||||||||
| Heineken NV | 10,017 | 465,905 | |||||||||
| 1,162,152 | |||||||||||
| Food & Staples Retailing (1.1%) | |||||||||||
| Seven & I Holdings Co., Ltd. | 34,600 | 1,057,581 | |||||||||
| Food Products (2.8%) | |||||||||||
| China Milk Products Group Ltd. | 771,000 | 384,245 | |||||||||
| Nestle SA, Registered Shares | 20,950 | 918,147 | |||||||||
| Toyo Suisan Kaisha Ltd. | 25,000 | 628,642 | |||||||||
| Unilever PLC | 24,775 | 678,496 | |||||||||
| 2,609,530 | |||||||||||
See Accompanying Notes to Financial Statements.
103
CMG INTERNATIONAL STOCK FUND
A Portfolio of Columbia Funds Institutional Trust
SCHEDULE OF INVESTMENTS
| Shares | Value | ||||||||||
| Common Stocks (continued) | |||||||||||
| Household Products (0.5%) | |||||||||||
| Unicharm Corp. | 6,100 | $ | 430,472 | ||||||||
| Personal Products (0.6%) | |||||||||||
| Shiseido Co., Ltd. | 23,000 | 510,689 | |||||||||
| Tobacco (1.8%) | |||||||||||
| British American Tobacco PLC | 15,843 | 571,555 | |||||||||
| Imperial Tobacco Group PLC | 18,865 | 705,093 | |||||||||
| Japan Tobacco, Inc. | 79 | 369,669 | |||||||||
| 1,646,317 | |||||||||||
| 7,416,741 | |||||||||||
| Energy (9.5%) | |||||||||||
| Energy Equipment & Services (1.8%) | |||||||||||
| Noble Corp. | 7,332 | 380,311 | |||||||||
| Technip SA | 9,437 | 799,028 | |||||||||
| Wellstream Holdings PLC (b) | 21,003 | 494,075 | |||||||||
| 1,673,414 | |||||||||||
| Oil, Gas & Consumable Fuels (7.7%) | |||||||||||
| BP PLC, ADR | 22,208 | 1,364,460 | |||||||||
| Centennial Coal Co., Ltd. | 108,215 | 525,446 | |||||||||
| PetroChina Co., Ltd., Class H | 608,000 | 811,794 | |||||||||
| PT Bumi Resources Tbk | 515,500 | 380,839 | |||||||||
| Royal Dutch Shell PLC, Class B | 23,052 | 812,012 | |||||||||
| StatoilHydro ASA | 28,000 | 909,698 | |||||||||
| Total SA | 20,215 | 1,549,871 | |||||||||
| Yanzhou Coal Mining Co., Ltd., Class H | 384,000 | 691,201 | |||||||||
| 7,045,321 | |||||||||||
| 8,718,735 | |||||||||||
| Financials (23.6%) | |||||||||||
| Capital Markets (2.6%) | |||||||||||
| Credit Suisse Group AG, Registered Shares | 11,583 | 581,488 | |||||||||
| Deutsche Bank AG, Registered Shares | 11,572 | 1,074,827 | |||||||||
| Goldman Sachs Group, Inc. (a) | 1,184 | 217,903 | |||||||||
| State Street Corp. | 7,011 | 502,268 | |||||||||
| 2,376,486 | |||||||||||
| Commercial Banks (13.2%) | |||||||||||
| Australia & New Zealand Banking Group Ltd. | 25,032 | 375,970 | |||||||||
| Banco Bilbao Vizcaya Argentaria SA | 73,224 | 1,339,537 | |||||||||
| Banco Santander SA | 98,007 | 1,891,183 | |||||||||
| Barclays PLC | 110,200 | 740,064 | |||||||||
| BNP Paribas | 8,494 | 843,389 | |||||||||
| DBS Group Holdings Ltd. | 49,000 | 684,377 | |||||||||
| HBOS PLC | 94,474 | 542,244 | |||||||||
| HSBC Holdings PLC | 68,614 | 1,135,230 | |||||||||
| Industrial & Commercial Bank of China, Class H | 491,000 | 369,397 | |||||||||
See Accompanying Notes to Financial Statements.
104
CMG INTERNATIONAL STOCK FUND
A Portfolio of Columbia Funds Institutional Trust
SCHEDULE OF INVESTMENTS
| Shares | Value | ||||||||||
| Common Stocks (continued) | |||||||||||
| Commercial Banks (continued) | |||||||||||
| Lloyds TSB Group PLC | 68,402 | $ | 399,317 | ||||||||
| Mizuho Financial Group, Inc. | 177 | 847,586 | |||||||||
| Swedbank AB, Class A | 31,400 | 656,337 | |||||||||
| Uniao de Bancos Brasileiros SA, GDR | 3,039 | 400,024 | |||||||||
| United Overseas Bank Ltd. | 54,000 | 766,725 | |||||||||
| Westpac Banking Corp. | 43,720 | 871,713 | |||||||||
| Yamaguchi Financial Group, Inc. | 21,000 | 280,254 | |||||||||
| 12,143,347 | |||||||||||
| Consumer Finance (0.5%) | |||||||||||
| ORIX Corp. | 2,920 | 441,954 | |||||||||
| Diversified Financial Services (0.9%) | |||||||||||
| Fortis | 22,819 | 322,444 | |||||||||
| ING Groep NV | 15,330 | 501,140 | |||||||||
| 823,584 | |||||||||||
| Insurance (4.1%) | |||||||||||
| Aviva PLC | 50,393 | 500,006 | |||||||||
| Axis Capital Holdings Ltd. | 22,908 | 725,726 | |||||||||
| Baloise Holding AG, Registered Shares | 10,250 | 959,651 | |||||||||
| Brit Insurance Holdings PLC | 183,088 | 553,314 | |||||||||
| Swiss Reinsurance, Registered Shares | 15,743 | 977,680 | |||||||||
| 3,716,377 | |||||||||||
| Real Estate Management & Development (2.3%) | |||||||||||
| Emaar Properties PJSC | 214,999 | 614,592 | |||||||||
| Hongkong Land Holdings Ltd. | 195,000 | 802,617 | |||||||||
| Swire Pacific Ltd., Class A | 63,500 | 675,818 | |||||||||
| 2,093,027 | |||||||||||
| 21,594,775 | |||||||||||
| Health Care (8.1%) | |||||||||||
| Pharmaceuticals (8.1%) | |||||||||||
| AstraZeneca PLC | 28,893 | 1,400,474 | |||||||||
| Biovail Corp. | 55,442 | 562,736 | |||||||||
| Daiichi Sankyo Co., Ltd. | 19,200 | 572,279 | |||||||||
| Novartis AG, Registered Shares | 32,410 | 1,921,106 | |||||||||
| Novo-Nordisk A/S, Class B | 7,775 | 494,632 | |||||||||
| Roche Holding AG, Genusschein Shares | 9,802 | 1,810,120 | |||||||||
| Takeda Pharmaceutical Co., Ltd. | 12,500 | 663,999 | |||||||||
| 7,425,346 | |||||||||||
| Industrials (12.6%) | |||||||||||
| Aerospace & Defense (0.5%) | |||||||||||
| MTU Aero Engines Holding AG | 14,611 | 453,547 | |||||||||
| Commercial Services & Supplies (0.6%) | |||||||||||
| Randstad Holding NV | 18,397 | 518,998 | |||||||||
See Accompanying Notes to Financial Statements.
105
CMG INTERNATIONAL STOCK FUND
A Portfolio of Columbia Funds Institutional Trust
SCHEDULE OF INVESTMENTS
| Shares | Value | ||||||||||
| Common Stocks (continued) | |||||||||||
| Construction & Engineering (0.8%) | |||||||||||
| Outotec Oyj | 14,927 | $ | 764,892 | ||||||||
| Electrical Equipment (3.3%) | |||||||||||
| ABB Ltd., Registered Shares | 36,098 | 951,215 | |||||||||
| Gamesa Corp. Tecnologica SA | 11,978 | 570,228 | |||||||||
| Mitsubishi Electric Corp. | 67,000 | 649,893 | |||||||||
| Vestas Wind Systems A/S (b) | 6,793 | 893,047 | |||||||||
| 3,064,383 | |||||||||||
| Industrial Conglomerates (1.0%) | |||||||||||
| Keppel Corp. Ltd. | 121,000 | 930,799 | |||||||||
| Machinery (4.2%) | |||||||||||
| Georg Fischer AG, Registered Shares (b) | 1,154 | 416,149 | |||||||||
| Gildemeister AG | 12,290 | 353,602 | |||||||||
| Glory Ltd. | 33,900 | 737,737 | |||||||||
| Hino Motors Ltd. | 90,000 | 470,584 | |||||||||
| Komatsu Ltd. | 32,400 | 798,664 | |||||||||
| SKF AB, Class B | 30,000 | 508,536 | |||||||||
| Volvo AB, Class B | 44,600 | 537,593 | |||||||||
| 3,822,865 | |||||||||||
| Marine (0.5%) | |||||||||||
| U-Ming Marine Transport Corp. | 152,000 | 406,099 | |||||||||
| Road & Rail (0.7%) | |||||||||||
| Central Japan Railway Co. | 62 | 629,947 | |||||||||
| Trading Companies & Distributors (1.0%) | |||||||||||
| ITOCHU Corp. | 52,000 | 510,034 | |||||||||
| Mitsubishi Corp. | 14,700 | 426,270 | |||||||||
| 936,304 | |||||||||||
| 11,527,834 | |||||||||||
| Information Technology (6.0%) | |||||||||||
| Communications Equipment (1.6%) | |||||||||||
| Nokia Oyj | 55,556 | 1,518,547 | |||||||||
| Electronic Equipment & Instruments (0.7%) | |||||||||||
| FUJIFILM Holdings Corp. | 22,100 | 692,437 | |||||||||
| IT Services (0.6%) | |||||||||||
| Computershare Ltd. | 65,949 | 538,386 | |||||||||
| Office Electronics (1.3%) | |||||||||||
| Canon, Inc. | 25,700 | 1,174,389 | |||||||||
See Accompanying Notes to Financial Statements.
106
CMG INTERNATIONAL STOCK FUND
A Portfolio of Columbia Funds Institutional Trust
SCHEDULE OF INVESTMENTS
| Shares | Value | ||||||||||
| Common Stocks (continued) | |||||||||||
| Semiconductors & Semiconductor Equipment (0.5%) | |||||||||||
| Verigy Ltd. (b) | 18,894 | $ | 420,014 | ||||||||
| Software (1.3%) | |||||||||||
| Nintendo Co., Ltd. | 2,400 | 1,157,328 | |||||||||
| 5,501,101 | |||||||||||
| Materials (10.8%) | |||||||||||
| Chemicals (3.2%) | |||||||||||
| BASF SE | 21,538 | 1,365,666 | |||||||||
| Linde AG | 7,889 | 1,089,387 | |||||||||
| Potash Corp. of Saskatchewan (a) | 2,500 | 513,624 | |||||||||
| 2,968,677 | |||||||||||
| Construction Materials (0.9%) | |||||||||||
| Ciments Francais SA | 5,843 | 809,859 | |||||||||
| Metals & Mining (6.7%) | |||||||||||
| Anglo American PLC | 11,960 | 685,650 | |||||||||
| BHP Biliton PLC | 44,156 | 1,473,549 | |||||||||
| Freeport-McMoRan Copper & Gold, Inc. | 2,437 | 235,780 | |||||||||
| Norsk Hydro ASA | 43,400 | 545,945 | |||||||||
| Rio Tinto PLC | 6,695 | 702,110 | |||||||||
| Salzgitter AG | 5,143 | 842,790 | |||||||||
| SSAB Svenskt Stal AB, Series A | 15,100 | 415,437 | |||||||||
| Xstrata PLC | 4,924 | 352,985 | |||||||||
| Yamato Kogyo Co., Ltd. | 20,300 | 908,801 | |||||||||
| 6,163,047 | |||||||||||
| 9,941,583 | |||||||||||
| Telecommunication Services (6.0%) | |||||||||||
| Diversified Telecommunication Services (4.2%) | |||||||||||
| Bezeq Israeli Telecommunication Corp., Ltd. | 478,208 | 865,673 | |||||||||
| Chunghwa Telecom Co., Ltd., ADR | 15,426 | 388,581 | |||||||||
| Nippon Telegraph & Telephone Corp. | 122 | 618,441 | |||||||||
| Telefonica O2 Czech Republic AS | 30,969 | 1,038,764 | |||||||||
| Telekomunikacja Polska SA | 83,811 | 927,517 | |||||||||
| 3,838,976 | |||||||||||
| Wireless Telecommunication Services (1.8%) | |||||||||||
| China Mobile Ltd. | 55,500 | 742,381 | |||||||||
| Mobile TeleSystems OJSC, ADR | 7,289 | 520,435 | |||||||||
| Vodafone Group PLC | 162,692 | 436,825 | |||||||||
| 1,699,641 | |||||||||||
| 5,538,617 | |||||||||||
See Accompanying Notes to Financial Statements.
107
CMG INTERNATIONAL STOCK FUND
A Portfolio of Columbia Funds Institutional Trust
SCHEDULE OF INVESTMENTS
| Shares | Value | ||||||||||
| Common Stocks (continued) | |||||||||||
| Utilities (4.2%) | |||||||||||
| Electric Utilities (3.0%) | |||||||||||
| E.ON AG | 10,366 | $ | 1,977,937 | ||||||||
| Iberdrola SA | 56,273 | 764,129 | |||||||||
| 2,742,066 | |||||||||||
| Water Utilities (1.2%) | |||||||||||
| United Utilities Group PLC | 61,788 | 849,008 | |||||||||
| United Utilities Group PLC, Class B (c) | 79,962 | 269,444 | |||||||||
| 1,118,452 | |||||||||||
| 3,860,518 | |||||||||||
| Total Common Stocks (Cost of $83,828,776) | 88,530,805 | ||||||||||
| Investment Companies (1.9%) | |||||||||||
| iShares MSCI Brazil Index Fund | 4,211 | 342,102 | |||||||||
| iShares MSCI EAFE Index Fund | 20,998 | 1,394,057 | |||||||||
| Total Investment Companies (Cost of $1,860,148) | 1,736,159 | ||||||||||
| Preferred Stocks (0.6%) | |||||||||||
| Consumer Staples (0.3%) | |||||||||||
| Food Products (0.3%) | |||||||||||
| Sadia SA | 40,700 | 297,526 | |||||||||
| Utilities (0.3%) | |||||||||||
| Electric Utilities (0.3%) | |||||||||||
| Cia Energetica de Minas Gerais | 12,800 | 303,594 | |||||||||
| Total Preferred Stocks (Cost of $613,564) | 601,120 | ||||||||||
| Par | |||||||||||
| Short-Term Obligation (0.7%) | |||||||||||
| Repurchase agreement with Fixed Income Clearing Corp., dated 07/31/08, due 08/01/08 at 1.990%, collateralized by a U.S. Treasury Obligation maturing 02/28/11, market value $657,200 (repurchase proceeds $642,035) | $ | 642,000 | 642,000 | ||||||||
| Total Short-Term Obligation (Cost of $642,000) | 642,000 | ||||||||||
| Total Investments (99.7%) (Cost of $86,944,488) (d) | 91,510,084 | ||||||||||
| Other Assets & Liabilities, Net (0.3%) | 230,371 | ||||||||||
| Net Assets (100.0%) | $ | 91,740,455 | |||||||||
See Accompanying Notes to Financial Statements.
108
CMG INTERNATIONAL STOCK FUND
A Portfolio of Columbia Funds Institutional Trust
SCHEDULE OF INVESTMENTS
Notes to Schedule of Investments:
(a) All or a portion of these securities are pledged as collateral for open written options contracts.
(b) Non-income producing security.
(c) Represents fair value as determined in good faith under procedures approved by the Board of Trustees.
(d) Cost for federal income tax purposes is $87,532,839.
At July 31, 2008, the Fund held the following written call option contracts:
| Name of Issuer | Strike Price | Number of Contracts | Expiration Date | Premium | Value | ||||||||||||||||||
| Goldman Sachs Group, Inc. | $ | 200 | 11 | 08/16/08 | $ | 1,308 | $ | 770 | |||||||||||||||
| Fomento Economico Mexicano SAB de CV, ADR | 50 | 50 | 08/16/08 | 2,307 | 1,250 | ||||||||||||||||||
| Potash Corp. of Saskatchewan | 240 | 9 | 08/16/08 | 963 | 810 | ||||||||||||||||||
| Total written call options (proceeds $4,578) | $ | 2,830 | |||||||||||||||||||||
For the year ended July 31, 2008, transactions in written option contracts were as follows:
| Number of contracts | Premium received | ||||||||||
| Options outstanding at July 31, 2007 | 112 | $ | 5,297 | ||||||||
| Options written | 495 | 45,426 | |||||||||
| Options terminated in closing purchase transactions | (25 | ) | (2,458 | ) | |||||||
| Options exercised | (6 | ) | (1,992 | ) | |||||||
| Options expired | (506 | ) | (41,695 | ) | |||||||
| Options outstanding at July 31, 2008 | 70 | $ | 4,578 | ||||||||
Forward foreign currency exchange contracts outstanding on July 31, 2008 are:
| Forward Currency Contracts to Buy | Value | Aggregate Face Value | Settlement Date | Unrealized Appreciation (Depreciation) | |||||||||||||||
| AUD | $ | 4,236,145 | $ | 4,182,853 | 09/17/08 | $ | 53,292 | ||||||||||||
| AUD | 163,720 | 166,943 | 09/17/08 | (3,223 | ) | ||||||||||||||
| CAD | 178,611 | 178,786 | 09/17/08 | (175 | ) | ||||||||||||||
| CHF | 308,506 | 313,653 | 09/17/08 | (5,147 | ) | ||||||||||||||
| CHF | 157,596 | 159,078 | 09/17/08 | (1,482 | ) | ||||||||||||||
| EUR | 9,462,580 | 9,336,934 | 09/17/08 | 125,646 | |||||||||||||||
| EUR | 283,162 | 284,313 | 09/17/08 | (1,151 | ) | ||||||||||||||
| JPY | 1,304,786 | 1,306,160 | 09/17/08 | (1,374 | ) | ||||||||||||||
| JPY | 61,199 | 61,309 | 09/17/08 | (110 | ) | ||||||||||||||
| NOK | 549,974 | 555,752 | 09/17/08 | (5,778 | ) | ||||||||||||||
| NOK | 163,768 | 162,356 | 09/17/08 | 1,412 | |||||||||||||||
| NOK | 179,504 | 178,585 | 09/17/08 | 919 | |||||||||||||||
| GBP | 4,007,153 | 3,918,932 | 09/17/08 | 88,221 | |||||||||||||||
| GBP | 173,795 | 173,870 | 09/17/08 | (75 | ) | ||||||||||||||
| SGD | 89,442 | 89,990 | 09/17/08 | (548 | ) | ||||||||||||||
| $ | 250,427 | ||||||||||||||||||
See Accompanying Notes to Financial Statements.
109
CMG INTERNATIONAL STOCK FUND
A Portfolio of Columbia Funds Institutional Trust
SCHEDULE OF INVESTMENTS
| Forward Currency Contracts to Sell | Value | Aggregate Face Value | Settlement Date | Unrealized Appreciation (Depreciation) | |||||||||||||||
| AUD | $ | 754,049 | $ | 767,731 | 09/17/08 | $ | 13,682 | ||||||||||||
| CAD | 1,030,671 | 1,028,538 | 09/17/08 | (2,133 | ) | ||||||||||||||
| CAD | 48,801 | 49,495 | 09/17/08 | 694 | |||||||||||||||
| CHF | 2,972,356 | 2,977,421 | 09/17/08 | 5,065 | |||||||||||||||
| CZK | 1,155,008 | 1,127,631 | 09/17/08 | (27,377 | ) | ||||||||||||||
| CZK | 54,164 | 55,224 | 09/17/08 | 1,060 | |||||||||||||||
| DKK | 473,059 | 466,623 | 09/17/08 | (6,436 | ) | ||||||||||||||
| DKK | 22,100 | 22,185 | 09/17/08 | 85 | |||||||||||||||
| EUR | 15,558 | 15,617 | 09/17/08 | 59 | |||||||||||||||
| GBP | 284,391 | 282,629 | 09/17/08 | (1,762 | ) | ||||||||||||||
| IDR | 293,384 | 281,806 | 09/17/08 | (11,578 | ) | ||||||||||||||
| IDR | 13,762 | 13,721 | 09/17/08 | (41 | ) | ||||||||||||||
| ILS | 1,364,183 | 1,399,095 | 09/17/08 | 34,912 | |||||||||||||||
| ILS | 64,026 | 64,127 | 09/17/08 | 101 | |||||||||||||||
| NOK | 1,139,578 | 1,115,103 | 09/17/08 | (24,475 | ) | ||||||||||||||
| KRW | 479,453 | 468,624 | 09/17/08 | (10,829 | ) | ||||||||||||||
| KRW | 22,490 | 22,587 | 09/17/08 | 97 | |||||||||||||||
| PLN | 498,618 | 466,838 | 09/17/08 | (31,780 | ) | ||||||||||||||
| PLN | 284,511 | 277,125 | 09/17/08 | (7,386 | ) | ||||||||||||||
| PLN | 36,649 | 36,733 | 09/17/08 | 84 | |||||||||||||||
| SEK | 188,268 | 186,920 | 09/17/08 | (1,348 | ) | ||||||||||||||
| SEK | 8,895 | 8,915 | 09/17/08 | 20 | |||||||||||||||
| SEK | 357,430 | 356,662 | 09/17/08 | (768 | ) | ||||||||||||||
| SGD | 1,415,679 | 1,403,649 | 09/17/08 | (12,030 | ) | ||||||||||||||
| SGD | 62,316 | 62,546 | 09/17/08 | 230 | |||||||||||||||
| TWD | 835,971 | 843,454 | 09/17/08 | 7,483 | |||||||||||||||
| TWD | 39,197 | 39,507 | 09/17/08 | 310 | |||||||||||||||
| $ | (74,061 | ) | |||||||||||||||||
See Accompanying Notes to Financial Statements.
110
CMG INTERNATIONAL STOCK FUND
A Portfolio of Columbia Funds Institutional Trust
SCHEDULE OF INVESTMENTS
At July 31, 2008, the Fund is invested in the following countries:
| Country (Unaudited) | Value | % of Total Investments | |||||||||
| Japan | $ | 17,288,954 | 18.9 | ||||||||
| United Kingdom | 14,964,661 | 16.4 | |||||||||
| Switzerland | 8,535,556 | 9.3 | |||||||||
| Germany | 7,157,756 | 7.8 | |||||||||
| France | 5,368,502 | 5.9 | |||||||||
| United States* | 4,862,453 | 5.3 | |||||||||
| Spain | 4,565,077 | 5.0 | |||||||||
| Singapore | 2,801,915 | 3.1 | |||||||||
| Sweden | 2,557,543 | 2.8 | |||||||||
| China | 2,394,884 | 2.6 | |||||||||
| Australia | 2,311,515 | 2.5 | |||||||||
| Finland | 2,283,439 | 2.5 | |||||||||
| Hong Kong | 1,940,853 | 2.1 | |||||||||
| Netherlands | 1,486,043 | 1.6 | |||||||||
| Norway | 1,455,643 | 1.6 | |||||||||
| Denmark | 1,387,679 | 1.5 | |||||||||
| Canada | 1,076,360 | 1.2 | |||||||||
| Czech Republic | 1,038,764 | 1.1 | |||||||||
| Brazil | 1,001,144 | 1.1 | |||||||||
| Poland | 927,517 | 1.0 | |||||||||
| Israel | 865,673 | 0.9 | |||||||||
| Taiwan | 794,680 | 0.9 | |||||||||
| Cayman Islands | 764,556 | 0.8 | |||||||||
| Mexico | 696,247 | 0.8 | |||||||||
| Ireland | 668,420 | 0.7 | |||||||||
| United Arab Emirates | 614,592 | 0.7 | |||||||||
| Russia | 520,435 | 0.6 | |||||||||
| Korea | 475,940 | 0.5 | |||||||||
| Indonesia | 380,839 | 0.4 | |||||||||
| Belgium | 322,444 | 0.4 | |||||||||
| $ | 91,510,084 | 100.0 | |||||||||
*Includes short-term obligation and investment companies.
Certain securities are listed by country of underlying exposure but may trade predominantly on other exchanges.
| Acronym | Name | ||||||
| ADR | American Depositary Receipt | ||||||
| AUD | Australian Dollar | ||||||
| CAD | Canadian Dollar | ||||||
| CHF | Swiss Franc | ||||||
| CZK | Czech Koruna | ||||||
| DKK | Danish Krone | ||||||
| EUR | Euro | ||||||
| GBP | Pound Sterling | ||||||
See Accompanying Notes to Financial Statements.
111
CMG INTERNATIONAL STOCK FUND
A Portfolio of Columbia Funds Institutional Trust
SCHEDULE OF INVESTMENTS
| Acronym | Name | ||||||
| GDR | Global Depositary Receipt | ||||||
| IDR | Indonesian Rupiah | ||||||
| ILS | Israeli Shekel | ||||||
| JPY | Japanese Yen | ||||||
| KRW | South Korean Won | ||||||
| NOK | Norwegian Krone | ||||||
| PLN | Polish Zloty | ||||||
| SEK | Swedish Krona | ||||||
| SGD | Singapore Dollar | ||||||
| TWD | Taiwan Dollar | ||||||
See Accompanying Notes to Financial Statements.
112
This page is intentionally left blank.
STATEMENTS OF ASSETS AND LIABILITIES
July 31, 2008
| CMG Enhanced S&P 500® Index Fund | CMG Large Cap Growth Fund | CMG Large Cap Value Fund | CMG Mid Cap Growth Fund | CMG Mid Cap Value Fund | |||||||||||||||||||
| ASSETS: | |||||||||||||||||||||||
| Investments, at identified cost | $ | 182,283,417 | $ | 59,708,101 | $ | 48,229,947 | $ | 22,331,464 | $ | 16,391,466 | |||||||||||||
| Investments, at value (including securities on loan of $12,577,303, $11,131,590, $10,183,653, $- ,$- ,$- ,$- ,$- and $-, respectively) | $177,824,326 | $63,240,348 | $48,027,142 | $25,763,790 | $17,040,286 | ||||||||||||||||||
| Cash | 516 | 868 | 811 | 575 | 131 | ||||||||||||||||||
| Foreign currency (cost of $-, $-, $-, $-, $-, $-, $-, $- and $27,311, respectively) | - | - | - | - | - | ||||||||||||||||||
| Unrealized appreciation on forward foreign currency exchange contracts | - | - | - | - | - | ||||||||||||||||||
| Receivable for: | |||||||||||||||||||||||
| Investments sold | - | 944,855 | 880,335 | 681,855 | 92,657 | ||||||||||||||||||
| Fund shares sold | 494,000 | - | - | 40,000 | - | ||||||||||||||||||
| Interest | 168 | 59 | 56 | 71 | 247 | ||||||||||||||||||
| Dividends | 157,802 | 21,623 | 58,575 | 13,839 | 13,631 | ||||||||||||||||||
| Securities lending | 7,543 | 6,531 | 4,725 | - | - | ||||||||||||||||||
| Foreign tax reclaims | - | - | - | 158 | - | ||||||||||||||||||
| Expense reimbursement due from investment advisor | 5,311 | 5,439 | 5,469 | 5,523 | 5,567 | ||||||||||||||||||
| Trustees' deferred compensation plan | 13,365 | 10,372 | 10,352 | 10,837 | 9,541 | ||||||||||||||||||
| Other assets | - | - | - | - | - | ||||||||||||||||||
| Total Assets | 178,503,031 | 64,230,095 | 48,987,465 | 26,516,648 | 17,162,060 | ||||||||||||||||||
| LIABILITIES: | |||||||||||||||||||||||
| Payable to custodian bank | - | - | - | - | - | ||||||||||||||||||
| Collateral on securities loaned | 13,161,109 | 11,888,773 | 10,510,738 | - | - | ||||||||||||||||||
| Unrealized depreciation on forward foreign currency exchange contracts | - | - | - | - | - | ||||||||||||||||||
| Written options at value (premium $-, $-, $-, $-, $-, $8,362, $-, $-, and $4,578, respectively) | - | - | - | - | - | ||||||||||||||||||
| Payable for: | |||||||||||||||||||||||
| Investments purchased | - | 1,032,823 | 664,080 | 1,433,407 | 6,257 | ||||||||||||||||||
| Fund shares repurchased | - | - | - | - | - | ||||||||||||||||||
| Futures variation margin | 44,105 | - | - | - | - | ||||||||||||||||||
| Investment advisory fee | 35,711 | 21,661 | 15,785 | 15,040 | 10,142 | ||||||||||||||||||
| Trustees' fees | 100 | 50 | 50 | 50 | 50 | ||||||||||||||||||
| Transfer agent fees | - | - | - | - | - | ||||||||||||||||||
| Custody fee | - | - | - | - | - | ||||||||||||||||||
| Audit fee | 30,375 | 35,575 | 35,575 | 35,575 | 35,575 | ||||||||||||||||||
| Reports to shareholders | - | - | - | - | - | ||||||||||||||||||
| Chief compliance officer expenses | - | - | - | - | - | ||||||||||||||||||
| Trustees' deferred compensation plan | 13,365 | 10,372 | 10,352 | 10,837 | 9,541 | ||||||||||||||||||
| Other liabilities | 11,893 | 10,368 | 10,257 | 10,129 | 21,081 | ||||||||||||||||||
| Total Liabilities | 13,296,658 | 12,999,622 | 11,246,837 | 1,505,038 | 82,646 | ||||||||||||||||||
| NET ASSETS | $ | 165,206,373 | $ | 51,230,473 | $ | 37,740,628 | $ | 25,011,610 | $ | 17,079,414 | |||||||||||||
| NET ASSETS CONSIST OF: | |||||||||||||||||||||||
| Paid-in capital | $ | 181,369,302 | $ | 49,091,930 | $ | 40,775,577 | $ | 20,911,599 | $ | 16,621,701 | |||||||||||||
| Undistributed (overdistributed) net investment income | 2,022,617 | 174,486 | 453,010 | (12,319 | ) | 16,605 | |||||||||||||||||
| Accumulated net investment loss | - | - | - | - | - | ||||||||||||||||||
| Accumulated net realized gain (loss) | (13,734,775 | ) | (1,568,190 | ) | (3,285,154 | ) | 680,002 | (207,712 | ) | ||||||||||||||
| Net unrealized appreciation (depreciation) on: | |||||||||||||||||||||||
| Investments | (4,459,091 | ) | 3,532,247 | (202,805 | ) | 3,432,326 | 648,820 | ||||||||||||||||
| Foreign currency translations | - | - | - | 2 | - | ||||||||||||||||||
| Futures contracts | 8,320 | - | - | - | - | ||||||||||||||||||
| Written options | - | - | - | - | - | ||||||||||||||||||
| NET ASSETS | $ | 165,206,373 | $ | 51,230,473 | $ | 37,740,628 | $ | 25,011,610 | $ | 17,079,414 | |||||||||||||
| Shares of capital stock outstanding | 13,555,439 | 4,591,084 | 4,030,893 | 1,802,097 | 1,567,555 | ||||||||||||||||||
| Net asset value, offering and redemption price per share | $ | 12.19 | $ | 11.16 | $ | 9.36 | $ | 13.88 | $ | 10.90 | |||||||||||||
See Accompanying Notes to Financial Statements.
114
| CMG Small Cap Growth Fund | CMG Small Cap Value Fund | CMG Small/Mid Cap Fund | CMG International Stock Fund | ||||||||||||||||
| ASSETS: | |||||||||||||||||||
| Investments, at identified cost | $ | 35,413,514 | $ | 24,183,006 | $ | 9,848,428 | $ | 86,944,488 | |||||||||||
| Investments, at value (including securities on loan of $12,577,303, $11,131,590, $10,183,653, $- ,$- ,$- ,$- ,$- and $-, respectively) | $41,813,618 | $26,755,226 | $11,626,697 | $91,510,084 | |||||||||||||||
| Cash | 707 | 47,299 | 48 | - | |||||||||||||||
| Foreign currency (cost of $-, $-, $-, $-, $-, $-, $-, $- and $27,311, respectively) | - | - | - | 27,119 | |||||||||||||||
| Unrealized appreciation on forward foreign currency exchange contracts | - | - | - | 333,372 | |||||||||||||||
| Receivable for: | |||||||||||||||||||
| Investments sold | 1,216,006 | 18,881 | 516,951 | 963 | |||||||||||||||
| Fund shares sold | - | - | - | - | |||||||||||||||
| Interest | 78 | - | 14 | 36 | |||||||||||||||
| Dividends | 6,057 | 23,756 | 1,833 | 108,442 | |||||||||||||||
| Securities lending | - | - | - | - | |||||||||||||||
| Foreign tax reclaims | - | - | - | 103,993 | |||||||||||||||
| Expense reimbursement due from investment advisor | 7,690 | 5,553 | 6,511 | 14,094 | |||||||||||||||
| Trustees' deferred compensation plan | 18,553 | 11,745 | 9,954 | 14,353 | |||||||||||||||
| Other assets | 380 | - | - | - | |||||||||||||||
| Total Assets | 43,063,089 | 26,862,460 | 12,162,008 | 92,112,456 | |||||||||||||||
| LIABILITIES: | |||||||||||||||||||
| Payable to custodian bank | - | - | - | 320 | |||||||||||||||
| Collateral on securities loaned | - | - | - | - | |||||||||||||||
| Unrealized depreciation on forward foreign currency exchange contracts | - | - | - | 157,006 | |||||||||||||||
| Written options at value (premium $-, $-, $-, $-, $-, $8,362, $-, $-, and $4,578, respectively) | 3,250 | - | - | 2,830 | |||||||||||||||
| Payable for: | |||||||||||||||||||
| Investments purchased | 2,129,041 | 39,380 | 636,404 | - | |||||||||||||||
| Fund shares repurchased | - | - | - | 100,000 | |||||||||||||||
| Futures variation margin | - | - | - | - | |||||||||||||||
| Investment advisory fee | 25,694 | 17,561 | 7,155 | 57,881 | |||||||||||||||
| Trustees' fees | 60 | 50 | 774 | 1,278 | |||||||||||||||
| Transfer agent fees | 6 | - | - | - | |||||||||||||||
| Custody fee | 4,019 | - | - | - | |||||||||||||||
| Audit fee | 34,102 | 35,575 | 29,957 | 33,600 | |||||||||||||||
| Reports to shareholders | 17,979 | - | - | - | |||||||||||||||
| Chief compliance officer expenses | 59 | - | - | - | |||||||||||||||
| Trustees' deferred compensation plan | 18,553 | 11,745 | 9,954 | 14,353 | |||||||||||||||
| Other liabilities | 12,073 | 10,136 | 3,552 | 4,733 | |||||||||||||||
| Total Liabilities | 2,244,836 | 114,447 | 687,796 | 372,001 | |||||||||||||||
| NET ASSETS | $ | 40,818,253 | $ | 26,748,013 | $ | 11,474,212 | $ | 91,740,455 | |||||||||||
| NET ASSETS CONSIST OF: | |||||||||||||||||||
| Paid-in capital | $ | 35,977,064 | $ | 22,108,914 | $ | 10,011,940 | $ | 85,566,430 | |||||||||||
| Undistributed (overdistributed) net investment income | - | 51,209 | - | 271,721 | |||||||||||||||
| Accumulated net investment loss | (22,337 | ) | - | (12,289 | ) | - | |||||||||||||
| Accumulated net realized gain (loss) | (1,541,690 | ) | 2,015,670 | (303,708 | ) | 1,152,855 | |||||||||||||
| Net unrealized appreciation (depreciation) on: | |||||||||||||||||||
| Investments | 6,400,104 | 2,572,220 | 1,778,269 | 4,565,596 | |||||||||||||||
| Foreign currency translations | - | - | - | 182,105 | |||||||||||||||
| Futures contracts | - | - | - | - | |||||||||||||||
| Written options | 5,112 | - | - | 1,748 | |||||||||||||||
| NET ASSETS | $ | 40,818,253 | $ | 26,748,013 | $ | 11,474,212 | $ | 91,740,455 | |||||||||||
| Shares of capital stock outstanding | 23,936,194 | 2,419,198 | 2,866,553 | 8,618,029 | |||||||||||||||
| Net asset value, offering and redemption price per share | $ | 1.71 | $ | 11.06 | $ | 4.00 | $ | 10.65 | |||||||||||
See Accompanying Notes to Financial Statements.
115
STATEMENTS OF OPERATIONS
For the Year Ended July 31, 2008
| CMG Enhanced S&P 500® Index Fund | CMG Large Cap Growth Fund | CMG Large Cap Value Fund | CMG Mid Cap Growth Fund | CMG Mid Cap Value Fund | |||||||||||||||||||
| INVESTMENT INCOME: | |||||||||||||||||||||||
| Income: | |||||||||||||||||||||||
| Dividends | $ | 4,242,975 | $ | 516,553 | $ | 1,012,842 | $ | 145,734 | $ | 267,393 | |||||||||||||
| Interest | 138,270 | 52,445 | 36,158 | 26,820 | 16,839 | ||||||||||||||||||
| Securities lending | 84,808 | 59,786 | 41,611 | - | - | ||||||||||||||||||
| Foreign withholding tax | - | (400 | ) | (992 | ) | (1,714 | ) | (352 | ) | ||||||||||||||
| Total investment income | 4,466,053 | 628,384 | 1,089,619 | 170,840 | 283,880 | ||||||||||||||||||
| Expenses: | |||||||||||||||||||||||
| Investment advisory fee | 540,937 | 281,635 | 210,397 | 192,548 | 127,887 | ||||||||||||||||||
| Transfer agent fee | - | - | - | - | - | ||||||||||||||||||
| Trustees' fees | 21,929 | 15,071 | 14,565 | 13,997 | 13,595 | ||||||||||||||||||
| Custody fee | - | - | - | - | - | ||||||||||||||||||
| Pricing and bookkeeping fees | - | - | - | - | - | ||||||||||||||||||
| Audit fee | 38,122 | 43,319 | 43,320 | 43,320 | 43,321 | ||||||||||||||||||
| Reports to shareholders | - | - | - | - | - | ||||||||||||||||||
| Chief compliance officer expenses | - | - | - | - | - | ||||||||||||||||||
| Other expenses | 37,372 | 26,371 | 25,429 | 24,626 | 24,071 | ||||||||||||||||||
| Expenses before interest expense | 638,360 | 366,396 | 293,711 | 274,491 | 208,874 | ||||||||||||||||||
| Interest expense | 2,302 | 130 | - | - | - | ||||||||||||||||||
| Total expenses | 640,662 | 366,526 | 293,711 | 274,491 | 208,874 | ||||||||||||||||||
| Fees and expenses waived or reimbursed by investment advisor | (97,423 | ) | (84,761 | ) | (83,314 | ) | (81,943 | ) | (80,987 | ) | |||||||||||||
| Custody earnings credit | - | - | - | - | - | ||||||||||||||||||
| Net expenses | 543,239 | 281,765 | 210,397 | 192,548 | 127,887 | ||||||||||||||||||
| Net investment income (loss) | 3,922,814 | 346,619 | 879,222 | (21,708 | ) | 155,993 | |||||||||||||||||
| NET REALIZED AND UNREALIZED GAIN (LOSS) ON INVESTMENTS, WRITTEN OPTIONS, FOREIGN CURRENCY AND FUTURES CONTRACTS: | |||||||||||||||||||||||
| Net realized gain (loss) on: | |||||||||||||||||||||||
| Investments | (12,463,036 | ) | (1,282,517 | ) | (3,232,984 | ) | 1,649,697 | (63,643 | ) | ||||||||||||||
| Written options | - | - | (7,687 | ) | (39,012 | ) | 21,982 | ||||||||||||||||
| Foreign currency transactions | - | - | - | (5,792 | ) | 13 | |||||||||||||||||
| Futures contracts | (1,030,167 | ) | - | - | - | - | |||||||||||||||||
| Realized loss due to a trading error | - | - | - | - | - | ||||||||||||||||||
| Reimbursement of a trading loss by investment advisor (See Note 9) | - | - | - | - | - | ||||||||||||||||||
| Net realized gain (loss) | (13,493,203 | ) | (1,282,517 | ) | (3,240,671 | ) | 1,604,893 | (41,648 | ) | ||||||||||||||
| Net change in unrealized appreciation (depreciation) on: | |||||||||||||||||||||||
| Investments | (17,503,515 | ) | (280,959 | ) | (3,947,592 | ) | (1,521,370 | ) | (2,548,016 | ) | |||||||||||||
| Written options | - | - | - | - | - | ||||||||||||||||||
| Foreign currency translations | - | - | - | (1 | ) | - | |||||||||||||||||
| Futures contracts | 155,052 | - | - | - | - | ||||||||||||||||||
| Net change in unrealized appreciation (depreciation) | (17,348,463 | ) | (280,959 | ) | (3,947,592 | ) | (1,521,371 | ) | (2,548,016 | ) | |||||||||||||
| Net gain (loss) | (30,841,666 | ) | (1,563,476 | ) | (7,188,263 | ) | 83,522 | (2,589,664 | ) | ||||||||||||||
| NET INCREASE (DECREASE) RESULTING FROM OPERATIONS | $ | (26,918,852 | ) | $ | (1,216,857 | ) | $ | (6,309,041 | ) | $ | 61,814 | $ | (2,433,671 | ) | |||||||||
See Accompanying Notes to Financial Statements.
116
| CMG Small Cap Growth Fund | CMG Small Cap Value Fund | CMG Small/Mid Cap Fund | CMG International Stock Fund | ||||||||||||||||
| INVESTMENT INCOME: | |||||||||||||||||||
| Income: | |||||||||||||||||||
| Dividends | $ | 166,927 | $ | 414,685 | $ | 43,957 | $ | 3,817,098 | |||||||||||
| Interest | 94,389 | 3,210 | 21,255 | 25,924 | |||||||||||||||
| Securities lending | - | - | - | - | |||||||||||||||
| Foreign withholding tax | (582 | ) | - | (430 | ) | (300,684 | ) | ||||||||||||
| Total investment income | 260,734 | 417,895 | 64,782 | 3,542,338 | |||||||||||||||
| Expenses: | |||||||||||||||||||
| Investment advisory fee | 330,544 | 227,357 | 91,245 | 815,774 | |||||||||||||||
| Transfer agent fee | 31 | - | - | - | |||||||||||||||
| Trustees' fees | 12,152 | 14,110 | 14,656 | 15,960 | |||||||||||||||
| Custody fee | 21,804 | - | - | - | |||||||||||||||
| Pricing and bookkeeping fees | 1,147 | - | - | - | |||||||||||||||
| Audit fee | 43,160 | 43,321 | 38,534 | 54,858 | |||||||||||||||
| Reports to shareholders | 26,018 | - | - | - | |||||||||||||||
| Chief compliance officer expenses | 519 | - | - | - | |||||||||||||||
| Other expenses | 32,509 | 24,641 | 10,120 | 16,179 | |||||||||||||||
| Expenses before interest expense | 467,884 | 309,429 | 154,555 | 902,771 | |||||||||||||||
| Interest expense | 144 | 1,590 | - | 495 | |||||||||||||||
| Total expenses | 468,028 | 311,019 | 154,555 | 903,266 | |||||||||||||||
| Fees and expenses waived or reimbursed by investment advisor | (114,563 | ) | (82,072 | ) | (63,310 | ) | (86,997 | ) | |||||||||||
| Custody earnings credit | (339 | ) | - | - | - | ||||||||||||||
| Net expenses | 353,126 | 228,947 | 91,245 | 816,269 | |||||||||||||||
| Net investment income (loss) | (92,392 | ) | 188,948 | (26,463 | ) | 2,726,069 | |||||||||||||
| NET REALIZED AND UNREALIZED GAIN (LOSS) ON INVESTMENTS, WRITTEN OPTIONS, FOREIGN CURRENCY AND FUTURES CONTRACTS: | |||||||||||||||||||
| Net realized gain (loss) on: | |||||||||||||||||||
| Investments | 218,757 | 2,295,661 | 143,482 | 3,485,445 | |||||||||||||||
| Written options | (70,266 | ) | - | (6,947 | ) | 38,807 | |||||||||||||
| Foreign currency transactions | (2,040 | ) | - | (1,080 | ) | (561,365 | ) | ||||||||||||
| Futures contracts | - | - | - | - | |||||||||||||||
| Realized loss due to a trading error | - | - | - | (371 | ) | ||||||||||||||
| Reimbursement of a trading loss by investment advisor (See Note 9) | - | - | - | 371 | |||||||||||||||
| Net realized gain (loss) | 146,451 | 2,295,661 | 135,455 | 2,962,887 | |||||||||||||||
| Net change in unrealized appreciation (depreciation) on: | |||||||||||||||||||
| Investments | 319,370 | (4,519,602 | ) | 86,830 | (21,368,414 | ) | |||||||||||||
| Written options | 5,112 | - | - | (189 | ) | ||||||||||||||
| Foreign currency translations | - | - | - | 23,530 | |||||||||||||||
| Futures contracts | - | - | - | - | |||||||||||||||
| Net change in unrealized appreciation (depreciation) | 324,482 | (4,519,602 | ) | 86,830 | (21,345,073 | ) | |||||||||||||
| Net gain (loss) | 470,933 | (2,223,941 | ) | �� | 222,285 | (18,382,186 | ) | ||||||||||||
| NET INCREASE (DECREASE) RESULTING FROM OPERATIONS | $ | 378,541 | $ | (2,034,993 | ) | $ | 195,822 | $ | (15,656,117 | ) | |||||||||
See Accompanying Notes to Financial Statements.
117
STATEMENTS OF CHANGES IN NET ASSETS
| CMG Enhanced S&P 500® Index Fund | |||||||||||
| Year Ended July 31, | |||||||||||
| 2008 | 2007 | ||||||||||
| Operations: | |||||||||||
| Net investment income | $ | 3,922,814 | $ | 2,521,206 | |||||||
| Net realized gain (loss) on investments and futures contracts | (13,493,203 | ) | 7,728,176 | ||||||||
| Net change in unrealized appreciation (depreciation) on investments and futures contracts | (17,348,463 | ) | 3,819,643 | ||||||||
| Net increase (decrease) resulting from operations | (26,918,852 | ) | 14,069,025 | ||||||||
| Distributions to shareholders: | |||||||||||
| From net investment income | (3,477,461 | ) | (1,720,935 | ) | |||||||
| From net realized gains | (7,014,878 | ) | (7,095,404 | ) | |||||||
| Total distributions to shareholders | (10,492,339 | ) | (8,816,339 | ) | |||||||
| Share transactions: | |||||||||||
| Subscriptions | 33,444,264 | 124,166,877 | |||||||||
| Distributions reinvested | 3,895,305 | 3,163,765 | |||||||||
| Redemptions | (57,420,084 | ) | (10,858,416 | ) | |||||||
| Net increase (decrease) in share transactions | (20,080,515 | ) | 116,472,226 | ||||||||
| Net increase (decrease) in net assets | (57,491,706 | ) | 121,724,912 | ||||||||
| NET ASSETS: | |||||||||||
| Beginning of period | 222,698,079 | 100,973,167 | |||||||||
| End of period | $ | 165,206,373 | $ | 222,698,079 | |||||||
| Undistributed net investment income, at end of period | $ | 2,022,617 | $ | 1,601,700 | |||||||
| Change in shares: | |||||||||||
| Subscriptions | 2,362,098 | 8,393,109 | |||||||||
| Distributions reinvested | 280,036 | 221,397 | |||||||||
| Redemptions | (4,417,810 | ) | (749,508 | ) | |||||||
| Net increase (decrease) | (1,775,676 | ) | 7,864,998 | ||||||||
See Accompanying Notes to Financial Statements.
118
STATEMENTS OF CHANGES IN NET ASSETS
| CMG Large Cap Growth Fund | CMG Large Cap Value Fund | ||||||||||||||||||
| Year Ended July 31, | Year Ended July 31, | ||||||||||||||||||
| 2008 | 2007 | 2008 | 2007 | ||||||||||||||||
| Operations: | |||||||||||||||||||
| Net investment income | $ | 346,619 | $ | 263,995 | $ | 879,222 | $ | 681,690 | |||||||||||
| Net realized gain (loss) on investments and written options | (1,282,517 | ) | 4,510,122 | (3,240,671 | ) | 4,545,392 | |||||||||||||
| Net change in unrealized appreciation (depreciation) on investments | (280,959 | ) | 1,786,112 | (3,947,592 | ) | (715,525 | ) | ||||||||||||
| Net increase (decrease) resulting from operations | (1,216,857 | ) | 6,560,229 | (6,309,041 | ) | 4,511,557 | |||||||||||||
| Distributions to shareholders: | |||||||||||||||||||
| From net investment income | (307,640 | ) | (240,113 | ) | (813,201 | ) | (638,584 | ) | |||||||||||
| From net realized gains | (3,957,565 | ) | (2,140,830 | ) | (4,036,007 | ) | (2,775,916 | ) | |||||||||||
| Total distributions to shareholders | (4,265,205 | ) | (2,380,943 | ) | (4,849,208 | ) | (3,414,500 | ) | |||||||||||
| Share transactions: | |||||||||||||||||||
| Subscriptions | 3,175,927 | 21,201,017 | 2,649,929 | 13,098,066 | |||||||||||||||
| Distributions reinvested | 2,330,690 | 1,159,364 | 2,336,648 | 1,648,088 | |||||||||||||||
| Redemptions | (7,772,535 | ) | (3,326,396 | ) | (918,028 | ) | (8,293,069 | ) | |||||||||||
| Net increase (decrease) in share transactions | (2,265,918 | ) | 19,033,985 | 4,068,549 | 6,453,085 | ||||||||||||||
| Net increase (decrease) in net assets | (7,747,980 | ) | 23,213,271 | (7,089,700 | ) | 7,550,142 | |||||||||||||
| NET ASSETS | |||||||||||||||||||
| Beginning of period | 58,978,453 | 35,765,182 | 44,830,328 | 37,280,186 | |||||||||||||||
| End of period | $ | 51,230,473 | $ | 58,978,453 | $ | 37,740,628 | $ | 44,830,328 | |||||||||||
| Undistributed net investment income, at end of period | $ | 174,486 | $ | 152,738 | $ | 453,010 | $ | 389,628 | |||||||||||
| Change in shares: | |||||||||||||||||||
| Subscriptions | 262,993 | 1,682,234 | 245,081 | 1,042,361 | |||||||||||||||
| Distributions reinvested | 188,415 | 97,754 | 215,161 | 137,341 | |||||||||||||||
| Redemptions | (574,762 | ) | (281,641 | ) | (73,903 | ) | (671,337 | ) | |||||||||||
| Net increase (decrease) | (123,354 | ) | 1,498,347 | 386,339 | 508,365 | ||||||||||||||
See Accompanying Notes to Financial Statements.
119
STATEMENTS OF CHANGES IN NET ASSETS
| CMG Mid Cap Growth Fund | CMG Mid Cap Value Fund | ||||||||||||||||||
| Year Ended July 31, | Year Ended July 31, | ||||||||||||||||||
| 2008 | 2007 | 2008 | 2007 | ||||||||||||||||
| Operations: | |||||||||||||||||||
| Net investment income (loss) | $ | (21,708 | ) | $ | 146,419 | $ | 155,993 | $ | 270,962 | ||||||||||
| Net realized gain (loss) on investments, written options and foreign currency transactions | 1,604,893 | 4,221,220 | (41,648 | ) | 2,120,276 | ||||||||||||||
| Net change in unrealized appreciation (depreciation) on investments and foreign currency translations | (1,521,371 | ) | 1,281,485 | (2,548,016 | ) | 648,236 | |||||||||||||
| Net increase (decrease) resulting from operations | 61,814 | 5,649,124 | (2,433,671 | ) | 3,039,474 | ||||||||||||||
| Distributions to shareholders: | |||||||||||||||||||
| From net investment income | (89,956 | ) | (93,030 | ) | (287,840 | ) | (196,538 | ) | |||||||||||
| From net realized gains | (4,351,636 | ) | (2,823,900 | ) | (1,695,514 | ) | (2,606,305 | ) | |||||||||||
| Total distributions to shareholders | (4,441,592 | ) | (2,916,930 | ) | (1,983,354 | ) | (2,802,843 | ) | |||||||||||
| Share transactions: | |||||||||||||||||||
| Subscriptions | 2,487,868 | 5,926,804 | 3,915,371 | 5,217,552 | |||||||||||||||
| Distributions reinvested | 2,336,715 | 1,214,957 | 980,570 | 1,292,451 | |||||||||||||||
| Redemptions | (4,106,793 | ) | (4,836,047 | ) | (2,695,952 | ) | (5,211,798 | ) | |||||||||||
| Net increase in share transactions | 717,790 | 2,305,714 | 2,199,989 | 1,298,205 | |||||||||||||||
| Net increase (decrease) in net assets | (3,661,988 | ) | 5,037,908 | (2,217,036 | ) | 1,534,836 | |||||||||||||
| NET ASSETS: | |||||||||||||||||||
| Beginning of period | 28,673,598 | 23,635,690 | 19,296,450 | 17,761,614 | |||||||||||||||
| End of period | $ | 25,011,610 | $ | 28,673,598 | $ | 17,079,414 | $ | 19,296,450 | |||||||||||
| Undistributed (overdistributed) net investment income, at end of period | $ | (12,319 | ) | $ | 66,919 | $ | 16,605 | $ | 155,300 | ||||||||||
| Change in shares: | |||||||||||||||||||
| Subscriptions | 171,048 | 389,503 | 325,999 | 365,557 | |||||||||||||||
| Distributions reinvested | 158,421 | 80,889 | 78,571 | 98,285 | |||||||||||||||
| Redemptions | (267,602 | ) | (308,106 | ) | (206,528 | ) | (361,340 | ) | |||||||||||
| Net increase | 61,867 | 162,286 | 198,042 | 102,502 | |||||||||||||||
See Accompanying Notes to Financial Statements.
120
STATEMENTS OF CHANGES IN NET ASSETS
| CMG Small Cap Growth Fund | CMG Small Cap Value Fund | ||||||||||||||||||
| Year Ended July 31, | Year Ended July 31, | ||||||||||||||||||
| 2008 | 2007 | 2008 | 2007 | ||||||||||||||||
| Operations: | |||||||||||||||||||
| Net investment income (loss) | $ | (92,392 | ) | $ | (101,978 | ) | $ | 188,948 | $ | 240,354 | |||||||||
| Net realized gain on investments, written options and foreign currency transactions | 146,451 | 6,024,819 | 2,295,661 | 5,783,692 | |||||||||||||||
| Net change in unrealized appreciation (depreciation) on investments and written options | 324,482 | 2,429,355 | (4,519,602 | ) | (2,143,372 | ) | |||||||||||||
| Net increase (decrease) resulting from operations | 378,541 | 8,352,196 | (2,034,993 | ) | 3,880,674 | ||||||||||||||
| Distributions to shareholders: | |||||||||||||||||||
| From net investment income | - | - | (274,060 | ) | (208,296 | ) | |||||||||||||
| From net realized gains | (6,279,372 | ) | (8,560,579 | ) | (3,718,779 | ) | (5,551,832 | ) | |||||||||||
| From return of capital | (159,987 | ) | - | - | - | ||||||||||||||
| Total distributions to shareholders | (6,439,359 | ) | (8,560,579 | ) | (3,992,839 | ) | (5,760,128 | ) | |||||||||||
| Share transactions: | |||||||||||||||||||
| Subscriptions | 10,835,393 | 4,449,121 | 4,608,081 | 5,437,309 | |||||||||||||||
| Distributions reinvested | 5,412,921 | 6,665,647 | 3,292,542 | 4,751,572 | |||||||||||||||
| Redemptions | (9,268,493 | ) | (11,190,327 | ) | (7,076,591 | ) | (9,796,788 | ) | |||||||||||
| Net increase (decrease) in share transactions | 6,979,821 | (75,559 | ) | 824,032 | 392,093 | ||||||||||||||
| Net increase (decrease) in net assets | 919,003 | (283,942 | ) | (5,203,800 | ) | (1,487,361 | ) | ||||||||||||
| NET ASSETS | |||||||||||||||||||
| Beginning of period | 39,899,250 | 40,183,192 | 31,951,813 | 33,439,174 | |||||||||||||||
| End of period | $ | 40,818,253 | $ | 39,899,250 | $ | 26,748,013 | $ | 31,951,813 | |||||||||||
| Undistributed (overdistributed) net investment income, at end of period | $ | - | $ | - | $ | 51,209 | $ | 136,218 | |||||||||||
| Accumulated net investment loss, at end of period | $ | (22,337 | ) | $ | (19,597 | ) | $ | - | $ | - | |||||||||
| Change in shares: | |||||||||||||||||||
| Subscriptions | 5,512,467 | 2,240,488 | 390,255 | 370,997 | |||||||||||||||
| Distributions reinvested | 2,957,880 | 3,765,902 | 284,822 | 344,567 | |||||||||||||||
| Redemptions | (4,948,412 | ) | (5,394,303 | ) | (548,483 | ) | (607,276 | ) | |||||||||||
| Net increase | 3,521,935 | 612,087 | 126,594 | 108,288 | |||||||||||||||
See Accompanying Notes to Financial Statements.
121
STATEMENTS OF CHANGES IN NET ASSETS
| CMG Small/Mid Cap Fund | CMG International Stock Fund | ||||||||||||||||||
| Year Ended July 31, | Year Ended July 31, | ||||||||||||||||||
| 2008 | 2007 | 2008 | 2007 | ||||||||||||||||
| Operations: | |||||||||||||||||||
| Net investment income (loss) | $ | (26,463 | ) | $ | (1,211 | ) | $ | 2,726,069 | $ | 2,129,982 | |||||||||
| Net realized gain on investments, written options and foreign currency transactions | 135,455 | 1,727,847 | 2,962,887 | 15,093,417 | |||||||||||||||
| Net change in unrealized appreciation (depreciation) on investments, written options, and foreign currency translations | 86,830 | 343,875 | (21,345,073 | ) | 8,013,343 | ||||||||||||||
| Net increase (decrease) resulting from operations | 195,822 | 2,070,511 | (15,656,117 | ) | 25,236,742 | ||||||||||||||
| Distributions to shareholders: | |||||||||||||||||||
| From net investment income | - | - | (3,839,262 | ) | (2,513,869 | ) | |||||||||||||
| From net realized gains | (1,812,017 | ) | (6,782,938 | ) | (13,751,675 | ) | (20,428,853 | ) | |||||||||||
| From return of capital | (71,809 | ) | - | - | - | ||||||||||||||
| Total distributions to shareholders | (1,883,826 | ) | (6,782,938 | ) | (17,590,937 | ) | (22,942,722 | ) | |||||||||||
| Share transactions: | |||||||||||||||||||
| Subscriptions | - | 11,500,000 | 12,545,498 | 20,493,154 | |||||||||||||||
| Distributions reinvested | 1,646,043 | 6,782,938 | 11,751,665 | 14,502,772 | |||||||||||||||
| Redemptions | (1,000,000 | ) | (9,827,294 | ) | (19,624,059 | ) | (22,713,180 | ) | |||||||||||
| Net increase in share transactions | 646,043 | 8,455,644 | 4,673,104 | 12,282,746 | |||||||||||||||
| Net increase (decrease) in net assets | (1,041,961 | ) | 3,743,217 | (28,573,950 | ) | 14,576,766 | |||||||||||||
| NET ASSETS: | |||||||||||||||||||
| Beginning of period | 12,516,173 | 8,772,956 | 120,314,405 | 105,737,639 | |||||||||||||||
| End of period | $ | 11,474,212 | $ | 12,516,173 | $ | 91,740,455 | $ | 120,314,405 | |||||||||||
| Undistributed net investment income, at end of period | $ | - | $ | - | $ | 271,721 | $ | 1,825,095 | |||||||||||
| Accumulated net investment loss, at end of period | $ | (12,289 | ) | $ | (5,768 | ) | $ | - | $ | - | |||||||||
| Change in shares: | |||||||||||||||||||
| Subscriptions | - | 2,744,502 | 988,440 | 1,450,019 | |||||||||||||||
| Distributions reinvested | 393,790 | 1,559,556 | 1,007,862 | 1,105,394 | |||||||||||||||
| Redemptions | (271,739 | ) | (2,339,832 | ) | (1,617,185 | ) | (1,545,947 | ) | |||||||||||
| Net increase | 122,051 | 1,964,226 | 379,117 | 1,009,466 | |||||||||||||||
See Accompanying Notes to Financial Statements.
122
NOTES TO FINANCIAL STATEMENTS
July 31, 2008
Note 1. Organization
Columbia Funds Institutional Trust (the "Trust") is a Massachusetts business trust registered under the Investment Company Act of 1940, as amended, as an open-end management investment company. Information presented in these financial statements pertains to the following diversified funds (individually referred to as a "Fund", collectively referred to as the "Funds"):
CMG Enhanced S&P 500® Index Fund
CMG Large Cap Growth Fund
CMG Large Cap Value Fund
CMG Mid Cap Growth Fund
CMG Mid Cap Value Fund
CMG Small Cap Growth Fund
CMG Small Cap Value Fund
CMG Small/Mid Cap Fund
CMG International Stock Fund
Shares in the Funds are available for purchase by institutional investors investing directly in the Funds, by institutional investors investing in the Funds as an advisory client of Columbia Management Advisors, LLC ("Columbia"), the Funds' investment advisor, and by institutional investors investing in the Funds as an advisory client of U.S. Trust, Bank of America Private Wealth Management. Please see the Funds' prospectuses for further details, including applicable investment minimums.
Investment objectives. CMG Enhanced S&P 500® Index Fund seeks to outperform the total return, over the long term, of the Standard & Poor's 500® Composite Stock Price Index that measures the investment returns of stocks of large U.S. companies, while maintaining overall portfolio characteristics similar to those of the benchmark. CMG Large Cap Growth Fund and CMG Large Cap Value Fund seek long-term growth by investing primarily in large capitalization equities. CMG Mid Cap Growth Fund and CMG Mid Cap Value Fund seek long-term growth by investing in middle capitalization equities. CMG Small Cap Growth Fund seeks to provide investors with long-term capital appreciation. CMG Small Cap Value Fund seeks long-term growth by investing primarily in small capitalization equities. CMG Small/Mid Cap Fund seeks long-term capital appr eciation by investing in small capitalization and middle capitalization equities. CMG International Stock Fund seeks long-term capital appreciation.
Fund shares. The Trust may issue an unlimited number of shares of beneficial interest which are offered continuously at net asset value.
Note 2. Significant accounting policies
The preparation of financial statements in accordance with accounting principles generally accepted in the United States of America ("GAAP") requires management to make certain estimates and assumptions that affect the reported amounts of assets and liabilities, the disclosure of contingent assets and liabilities at the date of the financial statements and the reported amounts of revenue and expenses during the reporting period. Actual results could differ from those estimates. The following is a summary of significant accounting policies consistently followed by the Funds in the preparation of their financial statements.
Security valuation. Equity securities, exchange traded funds and securities of certain investment companies are valued at the last sale price on the principal exchange on which they trade, except for securities traded on the NASDAQ,
123
NOTES TO FINANCIAL STATEMENTS (continued)
July 31, 2008
which are valued at the NASDAQ official close price. Unlisted securities or listed securities for which there were no sales during the day are valued at the closing bid price on such exchanges or over-the-counter markets.
Short-term debt obligations maturing within 60 days are valued at amortized cost, which approximates market value.
Investments in other open-end investment companies are valued at net asset value.
Futures contracts are valued at the settlement price established each day by the board of trade or exchange on which they are traded.
Options are valued at the last reported sale price, or in the absence of a sale, the mean between the last quoted bid and ask price.
Forward foreign currency exchange contracts are valued at the prevailing forward exchange rate of the underlying currencies.
Foreign securities are generally valued at the last sale price on the foreign exchange or market on which they trade. If any foreign share prices are not readily available as a result of limited share activity, the securities are valued at the last sale price of the local shares in the principal market in which such securities are normally traded.
Generally, trading in foreign securities is substantially completed each day at various times prior to the close of the New York Stock Exchange ("NYSE"). The values of such securities used in computing the net asset value of the Funds' shares are determined as of such times. Foreign currency exchange rates are generally determined at 4:00 p.m. Eastern (U.S.) time. Occassionally, events affecting the values of such foreign securities and such exchange rates may occur between the times at which they are determined and the close of the customary trading session of the NYSE, which would not be reflected in the computation of the Funds' net asset value. If events materially affecting the values of such foreign securities occur and it is determined that market quotations are not reliable, then these foreign securities will be valued at their fair value using procedures approved by the Board of Trustees. CMG International Stock Fund ma y use a systematic fair valuation model provided by an independent third party to value securities principally traded in foreign markets in order to adjust for possible stale pricing that may occur between the close of the foreign exchanges and the time for valuation.
In September 2006, Statement of Financial Accounting Standards No. 157, Fair Value Measurements ("SFAS 157"), was issued. SFAS 157 is effective for fiscal years beginning after November 15, 2007. SFAS 157 defines fair value, establishes a framework for measuring fair value and expands disclosures about fair value measurements. Management is evaluating the impact the application of SFAS 157 will have on each Fund's financial statement disclosures.
Security transactions. Security transactions are accounted for on the trade date. Cost is determined and gains (losses) are based upon the specific identification method for both financial statement and federal income tax purposes.
In March 2008, Statement of Financial Accounting Standards No. 161, Disclosures about Derivative Instruments and Hedging Activities-an amendment of FASB Statement No. 133 ("SFAS 161"), was issued. SFAS 161 is effective for fiscal years beginning after November 15, 2008. SFAS 161 requires additional discussion about the reporting entity's derivative instruments and hedging activities, by providing for qualitative disclosures about the objectives and strategies for using derivatives, quantitative data about the fair value of and gains and losses on derivative contracts, and details of credit-risk-related contingent features in their hedged positions. Management is evaluating the impact the application of SFAS 161 will have on the Funds' financial statement disclosures.
Futures contracts. The Funds may invest in futures for both hedging and non-hedging purposes, including, for example, to seek to enhance returns or as a substitute for a position in an underlying asset.
124
NOTES TO FINANCIAL STATEMENTS (continued)
July 31, 2008
The use of futures contracts involves certain risks, which include: (1) imperfect correlation between the price movement of the instruments and the underlying securities, (2) inability to close out positions due to differing trading hours, or the temporary absence of a liquid market, for either the instruments or the underlying securities, or (3) an inaccurate prediction by Columbia of the future direction of interest rates. Any of these risks may involve amounts exceeding the variation margin recorded in the Funds' Statements of Assets and Liabilities at any given time.
Upon entering into a futures contract, a Fund pledges cash or securities with the broker in an amount sufficient to meet the initial margin requirement. Subsequent payments are made or received by a Fund equal to the daily change in the contract value and are recorded as variation margin receivable or payable and offset in unrealized gains or losses. A Fund recognizes a realized gain or loss when the contract is closed or expires.
Options. Each Fund may write call and put options on securities it owns or in which it may invest. Writing put options tends to increase a Fund's exposure to the underlying instrument. Writing call options tends to decrease a Fund's exposure to the underlying instrument. When a Fund writes a call or put option, an amount equal to the premium received is recorded as a liability and subsequently marked-to-market to reflect the current value of the option written. Premiums received from writing options which expire are treated as realized gains. Premiums received from writing options which are exercised or closed are added to the proceeds or offset against the amounts paid on the underlying security transaction to determine the realized gain or loss. Each Fund, as a writer of an option, has no control over whether the underlying security may be sold (call) or p urchased (put) and as a result bears the market risk of an unfavorable change in the price of the security underlying the written option. There is the risk that the Funds may not be able to enter into a closing transaction because of an illiquid market. The Funds' custodian will set aside cash or liquid portfolio securities equal to the amount of the written options contract commitment in a segregated account.
Each Fund may also purchase put and call options. Purchasing call options tends to increase a Fund's exposure to the underlying instrument. Purchasing put options tends to decrease a Fund's exposure to the underlying instrument. The Funds may pay a premium, which is included in the Funds' Statements of Assets and Liabilities as an investment and subsequently marked-to-market to reflect the current value of the option. The risk associated with purchasing put and call options is limited to the premium paid. Premiums paid for purchasing options which expire are treated as realized losses. Premiums paid for purchasing options which are exercised are added to the amounts paid (call) or offset against the proceeds (put) on the underlying security transaction to determine the realized gain or loss. If a Fund enters into a closing transaction, the Fund will realize a gain or loss, depending on whether the proceeds from the closing trans action are greater or less than the cost of the option.
Forward foreign currency exchange contracts. Forward foreign currency exchange contracts are agreements to exchange one currency for another at a future date at a specified price. These contracts are used to minimize the exposure to foreign exchange rate fluctuations during the period between trade and settlement date of the contract. Certain Funds may utilize forward foreign currency exchange contracts in connection with the settlement of purchases and sales of securities. Certain Funds may also enter into these contracts to hedge certain other foreign currency denominated assets. Contracts to buy generally are used to acquire exposure to foreign currencies, while contracts to sell are generally used to hedge the Funds' investments against currency fluctuations. Forward foreign currency exchange contracts are valued daily at the current exchange rate of the underlying currency, resulting in unrealized gains (losses) which become realized at the time the forward foreign currency exchange contracts are closed or mature. Realized and unrealized gains (losses) arising from such transactions are included in net realized and unrealized gains (losses) on foreign currency transactions. The use of forward foreign currency exchange contracts does not eliminate fluctuations in the prices of the Funds' portfolio securities. While the maximum potential loss from such contracts is the aggregate face value in U.S. dollars at the time the contract was opened, exposure is typically limited to the change in value of the contract (in U.S. dollars) over the period it remains open. The Funds could also be exposed to risk that counterparties of the contracts may be unable to fulfill the terms of the contracts.
125
NOTES TO FINANCIAL STATEMENTS (continued)
July 31, 2008
Repurchase agreements. Each Fund may engage in repurchase agreement transactions with institutions that Columbia has determined are creditworthy. Each Fund, through its custodian, receives delivery of the underlying securities collateralizing a repurchase agreement. Columbia is responsible for determining that the collateral is at least equal, at all times, to the value of the repurchase obligation including interest. A repurchase agreement transaction involves certain risks in the event of default or insolvency of the counterparty. These risks include possible delays in or restrictions on each Fund's ability to dispose of the underlying securities and a possible decline in the value of the underlying securities during the period while the Funds seek to assert their rights.
Foreign currency transactions. The values of all assets and liabilities quoted in foreign currencies are translated into U.S. dollars at that day's exchange rates. Net realized and unrealized gains (losses) on foreign currency transactions include gains (losses) arising from the fluctuation in exchange rates between trade and settlement dates on securities transactions, gains (losses) arising from the disposition of foreign currency and currency gains (losses) between the accrual and payment dates on dividends, interest income and foreign withholding taxes.
For financial statement purposes, the Funds do not distinguish that portion of gains (losses) on investments which is due to changes in foreign exchange rates from that which is due to changes in market prices of the investments. Such fluctuations are included with the net realized and unrealized gains (losses) on investments on the Statements of Operations.
Income recognition. Interest income is recorded on the accrual basis. Corporate actions and dividend income are recorded on the ex-date except for certain foreign securities which are recorded as soon after the ex-date as the Funds become aware of such, net of any non-reclaimable tax withholdings. Distributions received from real estate investment trusts (REITs) in excess of their income are recorded as a reduction of the cost of the related investments. If the Funds no longer own the applicable securities, any distributions received in excess of income are recorded as realized gains.
Expenses. General expenses of the Trust are allocated to the Funds and the other series of the Trust based upon relative net assets or other expense allocation methodologies determined by the nature of the expense. Expenses directly attributable to a Fund are charged to such Fund.
Federal income tax status. Each Fund intends to qualify each year as a "regulated investment company" under Subchapter M of the Internal Revenue Code, as amended, and will distribute substantially all of its taxable income for its tax year, and as such will not be subject to federal income taxes. In addition, each Fund intends to distribute in each calendar year substantially all of its net investment income, capital gains and certain other amounts, if any, such that each Fund should not be subject to federal excise tax. Therefore, no federal income or excise tax provision is recorded.
Distributions to shareholders. Distributions to shareholders are recorded on the ex-date. Dividends from net investment income, if any, are declared and distributed annually. Net realized capital gains, if any, are distributed at least annually. Income distributions and capital gain distributions are determined in accordance with federal income tax regulations which may differ from GAAP.
Indemnification. In the normal course of business, each Fund enters into contracts that contain a variety of representations and warranties and which provide general indemnities. A Fund's maximum exposure under these arrangements is unknown because this would involve future claims against a Fund. Also, under the Trust's organizational documents and by contract, the Trustees and officers of the Trust are indemnified against certain liabilities that may arise out of actions relating to their duties to the Trust. However, based on experience, the Funds expect the risk of loss due to these representations, warranties and indemnities to be minimal.
126
NOTES TO FINANCIAL STATEMENTS (continued)
July 31, 2008
Note 3. Federal tax information
The timing and character of income and capital gain distributions are determined in accordance with income tax regulations, which may differ from GAAP. Reclassifications are made to the Funds' capital accounts for permanent tax differences to reflect income and gains available for distribution (or available capital loss carryforwards) under income tax regulations.
For the year ended July 31, 2008, permanent book and tax basis differences resulting primarily from differing treatments for Section 988 foreign currency transactions, net operating losses, distribution reclassification and passive foreign investment companies (PFIC) adjustments were identified and reclassified among the components of the Funds' net assets as follows:
| Undistributed/ (Overdistributed) or (Accumulated) Net Investment Income (Loss) | Accumulated Net Gain/Loss | Paid-In Capital | |||||||||||||
| CMG Enhanced S&P 500® Index Fund | $ | (24,436 | ) | $ | 24,436 | $ | - | ||||||||
| CMG Large Cap Growth Fund | (17,231 | ) | 17,231 | - | |||||||||||
| CMG Large Cap Value Fund | (2,639 | ) | 2,639 | - | |||||||||||
| CMG Mid Cap Growth Fund | 32,426 | (32,426 | ) | - | |||||||||||
| CMG Mid Cap Value Fund | (6,848 | ) | 6,848 | - | |||||||||||
| CMG Small Cap Growth Fund | 89,652 | (89,652 | ) | - | |||||||||||
| CMG Small Cap Value Fund | 103 | (104 | ) | 1 | |||||||||||
| CMG Small/Mid Cap Fund | 19,942 | (19,942 | ) | - | |||||||||||
| CMG International Stock Fund | (440,181 | ) | 440,180 | 1 | |||||||||||
Net investment income and net realized gains (losses), as disclosed on the Statements of Operations, and net assets were not affected by these reclassifications.
The tax character of distributions paid during the years ended July 31, 2008 and July 31, 2007 was as follows:
| July 31, 2008 | |||||||||||||||
| Ordinary Income* | Long-Term Capital Gains | Return of Capital | |||||||||||||
| CMG Enhanced S&P 500® Index Fund | $ | 6,368,282 | $ | 4,124,057 | $ | - | |||||||||
| CMG Large Cap Growth Fund | 2,631,485 | 1,633,720 | - | ||||||||||||
| CMG Large Cap Value Fund | 1,706,031 | 3,143,177 | - | ||||||||||||
| CMG Mid Cap Growth Fund | 1,279,107 | 3,162,485 | - | ||||||||||||
| CMG Mid Cap Value Fund | 553,426 | 1,429,928 | - | ||||||||||||
| CMG Small Cap Growth Fund | 2,282,199 | 3,997,173 | 159,987 | ||||||||||||
| CMG Small Cap Value Fund | 711,327 | 3,281,512 | - | ||||||||||||
| CMG Small/Mid Cap Fund | 479,786 | 1,332,231 | 71,809 | ||||||||||||
| CMG International Stock Fund | 8,374,380 | 9,216,557 | - | ||||||||||||
127
NOTES TO FINANCIAL STATEMENTS (continued)
July 31, 2008
| July 31, 2007 | |||||||||||
| Ordinary Income* | Long-Term Capital Gains | ||||||||||
| CMG Enhanced S&P 500® Index Fund | $ | 3,598,247 | $ | 5,218,092 | |||||||
| CMG Large Cap Growth Fund | 625,288 | 1,755,655 | |||||||||
| CMG Large Cap Value Fund | 1,060,188 | 2,354,312 | |||||||||
| CMG Mid Cap Growth Fund | 759,124 | 2,157,806 | |||||||||
| CMG Mid Cap Value Fund | 750,522 | 2,052,321 | |||||||||
| CMG Small Cap Growth Fund | 4,265,461 | 4,295,118 | |||||||||
| CMG Small Cap Value Fund | 722,222 | 5,037,906 | |||||||||
| CMG Small/Mid Cap Fund | 2,808,947 | 3,973,991 | |||||||||
| CMG International Stock Fund | 8,584,045 | 14,358,677 | |||||||||
* For tax purposes short-term capital gain distributions, if any, are considered ordinary income distributions.
As of July 31, 2008, the components of distributable earnings on a tax basis were as follows:
| Undistributed Ordinary Income | Undistributed Long-term Capital Gains | Net Unrealized Appreciation (Depreciation)* | |||||||||||||
| CMG Enhanced S&P 500® Index Fund | $ | 2,036,753 | $ | - | $ | (4,674,875 | ) | ||||||||
| CMG Large Cap Growth Fund | 186,106 | - | 3,326,478 | ||||||||||||
| CMG Large Cap Value Fund | 464,791 | - | (215,882 | ) | |||||||||||
| CMG Mid Cap Growth Fund | - | 862,211 | 3,250,116 | ||||||||||||
| CMG Mid Cap Value Fund | 27,469 | 22,555 | 601,984 | ||||||||||||
| CMG Small Cap Growth Fund | - | - | 5,988,713 | ||||||||||||
| CMG Small Cap Value Fund | 64,481 | 2,233,416 | 2,354,475 | ||||||||||||
| CMG Small/Mid Cap Fund | - | - | 1,720,268 | ||||||||||||
| CMG International Stock Fund | 727,682 | 1,501,521 | 3,977,245 | ||||||||||||
* The differences between book-basis and tax-basis net unrealized appreciation/depreciation are primarily due to deferral of losses from wash sales and mark to market of passive foreign investment companies.
Unrealized appreciation and depreciation at July 31, 2008, based on cost of investments for federal income tax purposes, excluding any unrealized appreciation and depreciation from changes in the value of other assets and liabilities resulting from changes in exchange rates, were:
| Unrealized Appreciation | Unrealized Depreciation | Net Unrealized Appreciation (Depreciation) | |||||||||||||
| CMG Enhanced S&P 500® Index Fund | $ | 18,635,848 | $ | (23,310,723 | ) | $ | (4,674,875 | ) | |||||||
| CMG Large Cap Growth Fund | 5,096,299 | (1,769,821 | ) | 3,326,478 | |||||||||||
| CMG Large Cap Value Fund | 4,004,237 | (4,220,119 | ) | (215,882 | ) | ||||||||||
| CMG Mid Cap Growth Fund | 4,553,920 | (1,303,804 | ) | 3,250,116 | |||||||||||
| CMG Mid Cap Value Fund | 2,396,988 | (1,795,004 | ) | 601,984 | |||||||||||
| CMG Small Cap Growth Fund | 8,087,064 | (2,098,351 | ) | 5,988,713 | |||||||||||
| CMG Small Cap Value Fund | 5,335,424 | (2,980,949 | ) | 2,354,475 | |||||||||||
| CMG Small/Mid Cap Fund | 2,286,270 | (566,002 | ) | 1,720,268 | |||||||||||
| CMG International Stock Fund | 13,282,054 | (9,304,809 | ) | 3,977,245 | |||||||||||
128
NOTES TO FINANCIAL STATEMENTS (continued)
July 31, 2008
The following capital loss carryforwards, determined as of July 31, 2008, may be available to reduce taxable income arising from future net realized gains on investments, if any, to the extent permitted by the Internal Revenue Code:
| Year of Expiration | |||||||||||
| 2016 | Total | ||||||||||
| CMG Large Cap Value Fund | $ | 284,104 | $ | 284,104 | |||||||
Under current tax rules, certain currency and capital losses realized after October 31 may be deferred and treated as occurring on the first day of the following fiscal year. As of July 31, 2008, post-October currency and capital losses attributed to security transactions were deferred to August 1, 2008, as follows:
| Capital Losses | Currency Losses | ||||||||||
| CMG Enhanced S&P 500® Index Fund | $ | 13,510,670 | $ | - | |||||||
| CMG Large Cap Growth Fund | 1,362,421 | - | |||||||||
| CMG Large Cap Value Fund | 2,987,972 | - | |||||||||
| CMG Mid Cap Value Fund | 183,430 | - | |||||||||
| CMG Small Cap Growth Fund | 1,130,296 | 1,397 | |||||||||
| CMG Small/Mid Cap Fund | 245,709 | 892 | |||||||||
The Funds adopted Financial Accounting Standards Board ("FASB") Interpretation No. 48, Accounting for Uncertainty in Income Taxes—an Interpretation of FASB Statement No. 109 ("FIN 48") effective January 31, 2008. FIN 48 requires management to determine whether a tax position of the Funds is more likely than not to be sustained upon examination by the applicable taxing authority, including resolution of any related appeals or litigation processes, based on the technical merits of the position. The tax benefit to be recognized is measured as the largest amount of benefit that is greater than fifty percent likely of being realized upon u ltimate settlement. FIN 48 was applied to all existing tax positions upon initial adoption. Management has evaluated the known implications of FIN 48 on its computation of net assets for the Funds. As a result of this evaluation, management has concluded that FIN 48 did not have any effect on the Funds' financial statements and no cumulative effect adjustments were recorded. However, management's conclusions regarding FIN 48 may be subject to review and adjustment at a later date based on factors including, but not limited to, further implementation guidance from the FASB, new tax laws, regulations, and administrative interpretations (including relevant court decisions). The Funds' federal tax returns for the prior three fiscal years remain subject to examination by the Internal Revenue Service. The Funds are not aware of any tax positions for which it is reasonably possible that the total amounts of unrecognized tax benefits will significantly change in the next twelve months.
Note 4. Fees and compensation paid to affiliates
Investment advisory fee. Columbia, an indirect, wholly owned subsidiary of Bank of America Corporation ("BOA"), provides investment advisory, administrative and other services to the Funds. In rendering investment advisory services to the Funds, Columbia may use the portfolio management and research resources of Columbia Management Pte. Ltd., an affiliate of Columbia. With the exception of CMG Small Cap Growth Fund, each Fund's investment advisory fee is a unified fee. Columbia, out of the unified fee it receives from the Funds, pays accounting fees, legal fees, transfer agent fees, custody fees, expenses of the Chief Compliance Officer, the commitment fee for the line of credit (see Note 7) and miscellaneous expenses of the Funds. The unified fee does not include brokerage fees, taxes, fees and expenses of the independent Trustees (including legal counsel f ees), audit fees, interest expense associated with any
129
NOTES TO FINANCIAL STATEMENTS (continued)
July 31, 2008
borrowings by the Funds or extraordinary expenses, if any. The unified fees are paid monthly to Columbia based on each Fund's average daily net assets at the following annual rates:
| CMG Enhanced S&P 500® Index Fund | 0.25 | % | |||||
| CMG Large Cap Growth Fund | 0.50 | % | |||||
| CMG Large Cap Value Fund | 0.50 | % | |||||
| CMG Mid Cap Growth Fund | 0.70 | % | |||||
| CMG Mid Cap Value Fund | 0.70 | % | |||||
| CMG Small Cap Value Fund | 0.80 | % | |||||
| CMG Small/Mid Cap Fund | 0.75 | % | |||||
| CMG International Stock Fund | 0.75 | % | |||||
Columbia receives a monthly investment advisory fee from CMG Small Cap Growth Fund at the annual rate of 0.75% of the Fund's average daily net assets.
Pricing and bookkeeping fees. The Funds have entered into a Financial Reporting Services Agreement (the "Financial Reporting Services Agreement") with State Street Bank & Trust Company ("State Street") and Columbia pursuant to which State Street provides financial reporting services to the Funds. The Funds have also entered into an Accounting Services Agreement (collectively with the Financial Reporting Services Agreement, the "State Street Agreements") with State Street and Columbia pursuant to which State Street provides accounting services to the Funds.
The Funds have entered into a Pricing and Bookkeeping Oversight and Services Agreement (the "Services Agreement") with Columbia. Under the Services Agreement, Columbia provides services related to Fund expenses and the requirements of the Sarbanes-Oxley Act of 2002, and provides oversight of the accounting and financial reporting services provided by State Street.
The pricing and bookkeeping fees for each Fund are payable by Columbia. Prior to January 1, 2008, CMG Small Cap Growth Fund reimbursed Columbia for services related to the requirements of the Sarbanes-Oxley Act of 2002.
Transfer agent fee. Columbia Management Services, Inc. (the "Transfer Agent"), an affiliate of Columbia and an indirect, wholly owned subsidiary of BOA, provides shareholder services to the Funds and has contracted with Boston Financial Data Services ("BFDS") to serve as sub-transfer agent. The transfer agent fees for each Fund, with the exception of CMG Small Cap Growth Fund, are payable by Columbia under the investment advisory contracts.
The Transfer Agent is entitled to receive a fee, paid monthly, at the annual rate of $17.34 per open account plus reimbursement of certain sub-transfer agent fees (exclusive of BFDS fees), calculated based on assets held in omnibus accounts subject to certain limitations and intended to recover the cost of payments to other parties (including affiliates of BOA) for services to those accounts. Prior to November 1, 2007, the annual rate was $17.00 per open account. The Transfer Agent pays the fees of BFDS for services as sub-transfer agent and is not entitled to reimbursement for such fees from the Funds or Columbia.
The Transfer Agent may also retain, as additional compensation for its services, fees for wire, telephone and redemption orders, IRA trustee agent fees and account transcript fees due the Transfer Agent from shareholders of the Funds and credits (net of bank charges) earned with respect to balances in accounts the Transfer Agent maintains in connection with its services to the Funds.
Fee waivers and expense reimbursements. Columbia has contractually agreed to waive its management fee and to the extent necessary bear other expenses of each Fund, with the exception of CMG Small Cap Growth Fund, through March 1, 2009, so that the expenses incurred by the Funds will not exceed the following annual rates (exclusive of
130
NOTES TO FINANCIAL STATEMENTS (continued)
July 31, 2008
brokerage commissions, interest, taxes and extraordinary expenses, but inclusive of custodial charges relating to overdrafts), after giving effect to any balance credits from the Funds' custodian, based on each Fund's average daily net assets:
| CMG Enhanced S&P 500® Index Fund | 0.25 | % | |||||
| CMG Large Cap Growth Fund | 0.50 | % | |||||
| CMG Large Cap Value Fund | 0.50 | % | |||||
| CMG Mid Cap Growth Fund | 0.70 | % | |||||
| CMG Mid Cap Value Fund | 0.70 | % | |||||
| CMG Small Cap Value Fund | 0.80 | % | |||||
| CMG Small/Mid Cap Fund | 0.75 | % | |||||
| CMG International Stock Fund | 0.75 | % | |||||
There is no guarantee that these arrangements will continue after March 1, 2009.
Columbia and its affiliates have contractually agreed to waive fees and/or reimburse expenses of the CMG Small Cap Growth Fund until November 30, 2009, so that expenses (exclusive of brokerage commissions, interest, taxes and extraordinary expenses, but inclusive of custodial charges relating to overdrafts), after giving effect to any balance credits from the Fund's custodian, will not exceed 0.80% annually of the Fund's average daily net assets. There is no guarantee that this arrangement will continue after November 30, 2009.
Fees paid to officers and trustees. All officers of the Funds are employees of Columbia or its affiliates and, with the exception of the Funds' Chief Compliance Officer, receive no compensation from the Funds. The Board of Trustees has appointed a Chief Compliance Officer to the Funds in accordance with federal securities regulations. The expenses of the Chief Compliance Officer for each Fund, with the exception of CMG Small Cap Growth Fund, are payable by Columbia. CMG Small Cap Growth Fund, along with other affiliated funds, pays its pro-rata share of the expenses associated with the Chief Compliance Officer.
The Trust's eligible Trustees may participate in a deferred compensation plan which may be terminated at any time. Obligations of the plan will be paid solely out of the Funds' assets.
Note 5. Custody credits
With the exception of CMG Small Cap Growth Fund, any custody credits are applied to offset fund expenses prior to determining the expenses Columbia is required to bear. CMG Small Cap Growth Fund has an agreement with its custodian bank under which custody fees may be reduced by balance credits. These credits are recorded as a reduction of total expenses on the Statements of Operations. The Fund could have invested a portion of the assets utilized in connection with the expense offset arrangement in an income-producing asset if it had not entered into such an agreement.
131
NOTES TO FINANCIAL STATEMENTS (continued)
July 31, 2008
Note 6. Portfolio information
For the year ended July 31, 2008, the cost of purchases and proceeds from sales of securities, excluding short-term obligations, were as follows:
| Purchases | Sales | ||||||||||
| CMG Enhanced S&P 500® Index Fund | $ | 103,501,067 | $ | 129,771,466 | |||||||
| CMG Large Cap Growth Fund | 88,992,450 | 93,980,872 | |||||||||
| CMG Large Cap Value Fund | 23,513,329 | 23,904,942 | |||||||||
| CMG Mid Cap Growth Fund | 45,147,504 | 48,277,833 | |||||||||
| CMG Mid Cap Value Fund | 9,274,613 | 9,049,219 | |||||||||
| CMG Small Cap Growth Fund | 84,259,770 | 81,963,257 | |||||||||
| CMG Small Cap Value Fund | 13,945,893 | 16,770,683 | |||||||||
| CMG Small/Mid Cap Fund | 21,554,983 | 22,570,121 | |||||||||
| CMG International Stock Fund | 67,143,174 | 77,082,024 | |||||||||
Note 7. Line of credit
The Funds and other affiliated funds participate in a $350,000,000 committed, unsecured revolving line of credit and a $150,000,000 uncommitted, unsecured line of credit, both provided by State Street. Borrowings are available for short-term liquidity or temporary or emergency purposes.
Interest on the committed line of credit is charged to each participating fund based on the fund's borrowings at a rate per annum equal to the Federal Funds Rate plus 0.50%. In addition, a commitment fee of 0.10% per annum is accrued and apportioned among the participating funds pro rata based on their relative net assets. Effective September 17, 2007, interest on the uncommitted line of credit is charged to each participating fund based on the fund's borrowings at a rate per annum equal to the Federal Funds Rate plus 0.375%. Prior to September 17, 2007, interest on the uncommitted line of credit was charged to each participating fund based on the fund's borrowings at a rate per annum equal to the Federal Funds Rate plus 0.50%. State Street charges an annual operations agency fee of $40,000 for the committed line of credit and may charge an annual administration fee of $15,000 for the uncommitted line of credit. The commitment f ee, the operations agency fee and the administration fee are accrued and apportioned among the participating funds pro rata based on their relative net assets. The commitment fee, the operations agency fee and administration fee are included in the unified fee for the Funds.
For the year ended July 31, 2008, the average daily loan balance outstanding on days where borrowing existed, and the weighted average interest rate of each Fund that borrowed under these arrangements were as follows:
| Average Borrowings | Weighted Average Interest Rates | ||||||||||
| CMG Enhanced S&P 500® Index Fund | $ | 17,000,000 | 2.44 | % | |||||||
| CMG Large Cap Growth Fund | 1,000,000 | 4.69 | |||||||||
| CMG Small Cap Growth Fund | 1,000,000 | 5.19 | |||||||||
| CMG Small Cap Value Fund | 1,714,280 | 4.51 | |||||||||
| CMG International Stock Fund | 1,250,000 | 3.77 | |||||||||
132
NOTES TO FINANCIAL STATEMENTS (continued)
July 31, 2008
Note 8. Securities lending
CMG Enhanced S&P 500® Index Fund, CMG Large Cap Growth Fund, CMG Large Cap Value Fund and CMG Mid Cap Value Fund may lend their securities to certain approved brokers, dealers and other financial institutions. Each loan is collateralized by cash, in an amount at least equal to the market value of the securities loaned plus accrued income from the investment of collateral. The market value of the loaned securities is determined at the close of business of the Funds and any additional required collateral is delivered to the Funds on the next business day. The collateral received is invested and the income generated by the investment of the collateral, net of any fees remitted to State Street as the lending agent and borrower rebates, is paid to the Funds. Generally, in the event of borrower default, the Funds have the right to use the collateral to offset any losses incurred. In the event the Funds are delayed o r prevented from exercising their right to dispose of the collateral, there may be a potential loss to the Funds. The Funds bear the risk of loss with respect to the investment of collateral.
Note 9. Other
During the year ended July 31, 2008, Columbia voluntarily reimbursed CMG International Stock Fund $371 for a realized investment loss due to a trading error.
Note 10. Shares of beneficial interest
As of July 31, 2008, shares of the Funds were beneficially owned by participant accounts over which BOA and/or any of its affiliates had either sole or joint investment discretion. The percentages of shares of beneficial interest outstanding held therein are as follows:
| % of Shares Outstanding Held | |||||||
| CMG Enhanced S&P 500® Index Fund | 99.7 | ||||||
| CMG Large Cap Growth Fund | 100.0 | ||||||
| CMG Large Cap Value Fund | 100.0 | ||||||
| CMG Mid Cap Growth Fund | 99.8 | ||||||
| CMG Mid Cap Value Fund | 100.0 | ||||||
| CMG Small Cap Growth Fund | 92.1 | ||||||
| CMG Small Cap Value Fund | 98.5 | ||||||
| CMG Small/Mid Cap Fund | 97.4 | ||||||
| CMG International Stock Fund | 100.0 | ||||||
In addition, as of July 31, 2008, CMG Small Cap Growth Fund had one shareholder over which BOA and/or any of its affiliates did not have investment discretion that held 7.9% of the shares outstanding.
Subscription and redemption activity of these accounts may have a significant effect on the operations of the Funds.
Note 11. Significant risks and contingencies
Sector focus risk. Certain funds may focus their investments in certain sectors, subjecting them to greater risk than a fund that is less focused.
133
NOTES TO FINANCIAL STATEMENTS (continued)
July 31, 2008
Foreign securities risk. There are certain additional risks involved when investing in foreign securities. These risks may involve foreign currency exchange rate fluctuations, adverse political and economic developments and the possible prevention of currency exchange or other foreign governmental laws or restrictions. In addition, the liquidity of foreign securities may be more limited than that of domestic securities.
Legal proceedings. The Funds are not named as parties to any regulatory proceedings or litigation.
On February 9, 2005, Columbia Management Advisors, Inc. (which has since merged into Banc of America Capital Management, LLC (now named Columbia Management Advisors, LLC)) ("Columbia") and Columbia Funds Distributor, Inc. (which has been renamed Columbia Management Distributors, Inc.) (the "Distributor") (collectively, the "Columbia Group") entered into an Assurance of Discontinuance with the New York Attorney General ("NYAG") (the "NYAG Settlement") and consented to the entry of a cease-and-desist order by the Securities and Exchange Commission ("SEC") (the "SEC Order") on matters relating to mutual fund trading.
Under the terms of the SEC Order, the Columbia Group agreed, among other things, to: pay $70 million in disgorgement and $70 million in civil money penalties; cease and desist from violations of the antifraud provisions and certain other provisions of the federal securities laws; maintain certain compliance and ethics oversight structures; retain an independent consultant to review the Columbia Group's applicable supervisory, compliance, control and other policies and procedures; and retain an independent distribution consultant (see below). The Columbia Funds have also voluntarily undertaken to implement certain governance measures designed to maintain the independence of their boards of trustees. The NYAG Settlement also, among other things, requires Columbia and its affiliates to reduce management fees for certain Columbia Funds (including the former Nations Funds) and other mutual funds collectively by $32 million per year f or five years, for a projected total of $160 million in management fee reductions.
Pursuant to the procedures set forth in the SEC Order, the $140 million in settlement amounts described above is being distributed in accordance with a distribution plan that was developed by an independent distribution consultant and approved by the SEC on April 6, 2007. Distributions under the distribution plan began in late June 2007.
A copy of the SEC Order is available on the SEC website at http://www.sec.gov. A copy of the NYAG Settlement is available as part of the Bank of America Corporation Form 8-K filing on February 10, 2005.
In connection with the events described above, various parties have filed suit against certain funds, the Trustees of the Columbia Funds, FleetBoston Financial Corporation and its affiliated entities and/or Bank of America and its affiliated entities.
On February 20, 2004, the Judicial Panel on Multidistrict Litigation transferred these cases and cases against other mutual fund companies based on similar allegations to the United States District Court in Maryland for consolidated or coordinated pretrial proceedings (the "MDL"). Subsequently, additional related cases were transferred to the MDL. On September 29, 2004, the plaintiffs in the MDL filed amended and consolidated complaints. One of these amended complaints is a putative class action that includes claims under the federal securities laws and state common law, and that names Columbia, the Distributor, the Trustees of the Columbia Funds, Bank of America Corporation and others as defendants. Another of the amended complaints is a derivative action purportedly on behalf of the Columbia Funds that asserts claims under federal securities laws and state common law.
On February 25, 2005, Columbia and other defendants filed motions to dismiss the claims in the pending cases. On March 1, 2006, for reasons stated in the court's memoranda dated November 3, 2005, the United States District Court for the District of Maryland granted in part and denied in part the defendants' motions to dismiss. The court dismissed all of the class action claims pending against the Columbia Funds Trusts. As to Columbia and the Distributor, the claims under the Securities Act of 1933, the claims under Sections 34(b) and 36(a) of the Investment Company Act of
134
NOTES TO FINANCIAL STATEMENTS (continued)
July 31, 2008
1940 ("ICA") and the state law claims were dismissed. The claims under Sections 10(b) and 20(a) of the Securities Exchange Act of 1934 and claims under Section 36(b) of the ICA were not dismissed.
On March 21, 2005, a purported class action was filed in Massachusetts state court alleging that certain conduct, including market timing, entitled Class B shareholders in certain Columbia funds to an exemption from contingent deferred sales charges upon early redemption ("the CDSC Lawsuit"). The CDSC Lawsuit was removed to federal court in Massachusetts and transferred to the MDL.
On September 14, 2007, the plaintiffs and the Columbia defendants named in the MDL, including the Columbia Funds, entered into a stipulation of settlement with respect to all Columbia-related claims in the MDL described above, including the CDSC Lawsuit. The settlement is subject to court approval.
In 2004, the Columbia Funds' adviser and distributor and certain affiliated entities and individuals were named as defendants in certain purported shareholder class and derivative actions making claims, including claims under the Investment Company and the Investment Advisers Acts of 1940 and state law. Certain Columbia Funds were named as nominal defendants. The suits allege, inter alia, that the fees and expenses paid by the funds are excessive and that the advisers and their affiliates inappropriately used fund assets to distribute the funds and for other improper purposes. On March 2, 2005, the actions were consolidated in the Massachusetts federal court as In re Columbia Entities Litigation. The plaintiffs filed a consolidated amended complaint on June 9, 2005. On November 30, 2005, the judge dismissed all claims by plaintiffs and entered final judgment in favor of the defendants. The plaintiffs appealed to the United States Court of Appeals for the First Circuit on December 30, 2005. A stipulation and settlement agreement dated January 19, 2007 was filed in the First Circuit on February 14, 2007, with a joint stipulation of dismissal and motion for remand to obtain district court approval of the settlement. That joint motion was granted and the appeal was dismissed. On March 6, 2007, the case was remanded to the District Court. The settlement, approved by the District Court on September 18, 2007, became effective October 19, 2007. Pursuant to the settlement, the funds' adviser and/or its affiliates made certain payments, including plaintiffs' attorneys' fees and costs of notice to class members.
135
Report of Independent Registered Public Accounting Firm
To the Trustees of Columbia Funds Institutional Trust and Shareholders of CMG Enhanced S&P 500® Index Fund, CMG Large Cap Growth Fund, CMG Large Cap Value Fund, CMG Mid Cap Growth Fund, CMG Mid Cap Value Fund, CMG Small Cap Growth Fund, CMG Small Cap Value Fund, CMG Small/Mid Cap Fund and CMG International Stock Fund
In our opinion, the accompanying statements of assets and liabilities, including the schedules of investments, and the related statements of operations and of changes in net assets and the financial highlights present fairly, in all material respects, the financial position of CMG Enhanced S&P 500® Index Fund, CMG Large Cap Growth Fund, CMG Large Cap Value Fund, CMG Mid Cap Growth Fund, CMG Mid Cap Value Fund, CMG Small Cap Growth Fund, CMG Small Cap Value Fund, CMG Small/Mid Cap Fund and CMG International Stock Fund (the "Funds") (each a series of Columbia Funds Institutional Trust) at July 31, 2008, the results of each of their operations for the year then ended, the changes in each of their net assets for each of the two years in the period then ended and the financial highlights for each of the periods indicated, in conformity with accounting principles generally accepted in the United States of America. T hese financial statements and financial highlights (hereafter referred to as "financial statements") are the responsibility of the Funds' management. Our responsibility is to express an opinion on these financial statements based on our audits. We conducted our audits of these financial statements in accordance with the standards of the Public Company Accounting Oversight Board (United States). Those standards require that we plan and perform the audit to obtain reasonable assurance about whether the financial statements are free of material misstatement. An audit includes examining, on a test basis, evidence supporting the amounts and disclosures in the financial statements, assessing the accounting principles used and significant estimates made by management, and evaluating the overall financial statement presentation. We believe that our audits, which included confirmation of securities at July 31, 2008 by correspondence with the custodian and brokers, provide a reasonable basis for our opinion.
PricewaterhouseCoopers LLP
Boston, Massachusetts
September 19, 2008
136
Federal Income Tax Information (Unaudited)
CMG Enhanced S&P 500® Index Fund
For the fiscal year ended July 31, 2008, the Fund designates long-term capital gains of $51,581.
60.05% of the ordinary income distributed by the Fund, for the year ended July 31, 2008, qualifies for the corporate dividends received deduction.
For non-corporate shareholders 60.01%, or the maximum amount allowable under the Jobs and Growth Tax Relief Reconciliation Act of 2003, of income earned by the Fund for the period August 1, 2007 to July 31, 2008 may represent qualified dividend income. Final information will be provided in your 2008 Form 1099-DIV.
CMG Large Cap Growth Fund
For the fiscal year ended July 31, 2008, the Fund designates long-term capital gains of $126,263.
18.26% of the ordinary income distributed by the Fund, for the year ended July 31, 2008, qualifies for the corporate dividends received deduction.
For non-corporate shareholders 18.40%, or the maximum amount allowable under the Jobs and Growth Tax Relief Reconciliation Act of 2003, of income earned by the Fund for the period August 1, 2007 to July 31, 2008 may represent qualified dividend income. Final information will be provided in your 2008 Form 1099-DIV.
CMG Large Cap Value Fund
For the fiscal year ended July 31, 2008, the Fund designates long-term capital gains of $8,400.
73.45% of the ordinary income distributed by the Fund, for the year ended July 31, 2008, qualifies for the corporate dividends received deduction.
For non-corporate shareholders 60.64%, or the maximum amount allowable under the Jobs and Growth Tax Relief Reconciliation Act of 2003, of income earned by the Fund for the period August 1, 2007 to July 31, 2008 may represent qualified dividend income. Final information will be provided in your 2008 Form 1099-DIV.
CMG Mid Cap Growth Fund
For the fiscal year ended July 31, 2008, the Fund designates long-term capital gains of $1,734,094.
19.06% of the ordinary income distributed by the Fund, for the year ended July 31, 2008, qualifies for the corporate dividends received deduction.
For non-corporate shareholders 20.16%, or the maximum amount allowable under the Jobs and Growth Tax Relief Reconciliation Act of 2003, of income earned by the Fund for the period August 1, 2007 to July 31, 2008 may represent qualified dividend income. Final information will be provided in your 2008 Form 1099-DIV.
CMG Mid Cap Value Fund
For the fiscal year ended July 31, 2008, the Fund designates long-term capital gains of $187,084.
67.97% of the ordinary income distributed by the Fund, for the year ended July 31, 2008, qualifies for the corporate dividends received deduction.
137
Federal Income Tax Information (Unaudited) (continued)
For non-corporate shareholders 68.80%, or the maximum amount allowable under the Jobs and Growth Tax Relief Reconciliation Act of 2003, of income earned by the Fund for the period August 1, 2007 to July 31, 2008 may represent qualified dividend income. Final information will be provided in your 2008 Form 1099-DIV.
CMG Small Cap Growth Fund
For the fiscal year ended July 31, 2008, the Fund designates long-term capital gains of $1,085,816.
3.82% of the ordinary income distributed by the Fund, for the year ended July 31, 2008, qualifies for the corporate dividends received deduction.
For non-corporate shareholders 3.90%, or the maximum amount allowable under the Jobs and Growth Tax Relief Reconciliation Act of 2003, of income earned by the Fund for the period August 1, 2007 to July 31, 2008 may represent qualified dividend income. Final information will be provided in your 2008 Form 1099-DIV.
CMG Small Cap Value Fund
For the fiscal year ended July 31, 2008, the Fund designates long-term capital gains of $2,541,081.
66.16% of the ordinary income distributed by the Fund, for the year ended July 31, 2008, qualifies for the corporate dividends received deduction.
For non-corporate shareholders 65.93%, or the maximum amount allowable under the Jobs and Growth Tax Relief Reconciliation Act of 2003, of income earned by the Fund for the period August 1, 2007 to July 31, 2008 may represent qualified dividend income. Final information will be provided in your 2008 Form 1099-DIV.
CMG Small/Mid Cap Fund
For the fiscal year ended July 31, 2008, the Fund designates long-term capital gains of $295,567.
12.22% of the ordinary income distributed by the Fund, for the year ended July 31, 2008, qualifies for the corporate dividends received deduction.
For non-corporate shareholders 14.30%, or the maximum amount allowable under the Jobs and Growth Tax Relief Reconciliation Act of 2003, of income earned by the Fund for the period August 1, 2007 to July 31, 2008 may represent qualified dividend income. Final information will be provided in your 2008 Form 1099-DIV.
CMG International Stock Fund
For the fiscal year ended July 31, 2008, the Fund designates long-term capital gains of $2,772,723.
Foreign taxes paid during the fiscal year ended July 31, 2008, amounting to $300,684 ($0.03 per share) are expected to be passed through to shareholders as 100% allowable foreign tax credits on Form 1099-DIV for the year ending December 31, 2008.
Gross income derived from sources within foreign countries amounted to $3,364,718 ($0.39 per share) for the fiscal year ended July 31, 2008.
For non-corporate shareholders 84.47%, or the maximum amount allowable under the Jobs and Growth Tax Relief Reconciliation Act of 2003, of income earned by the Fund for the period August 1, 2007 to July 31, 2008 may represent qualified dividend income. Final information will be provided in your 2008 Form 1099-DIV.
138
Fund Governance
The Trustees serve terms of indefinite duration. The names, addresses and ages of the Trustees and officers of the Funds in Columbia Funds Institutional Trust, the year each was first elected or appointed to office, their principal business occupations during at least the last five years, the number of portfolios overseen by each Trustee and other directorships they hold are shown below. Each officer listed below serves as an officer of each Fund in the Columbia Funds Complex.
| Name, Address and Year of Birth, Position with Funds, Year First Elected or Appointed to Office | Principal Occupation(s) During Past Five Years, Number of Portfolios in Columbia Funds Complex Overseen by Trustee, Other Directorships Held | ||||||
| Independent Trustees | |||||||
| John D. Collins (Born 1938) c/o Columbia Management Advisors, LLC One Financial Center Boston, MA 02111 Trustee1 (since 2007) | Retired. Consultant, KPMG, LLP (accounting and tax firm) from July 1999 to June 2000; Partner, KPMG, LLP from March 1962 to June 1999. Oversees 77, Mrs. Fields Famous Brands LLC (consumer products); Suburban Propane Partners, L.P.; and Montpelier Re (underwriting firm) | ||||||
| Rodman L. Drake (Born 1943) c/o Columbia Management Advisors, LLC One Financial Center Boston, MA 02111 Trustee1 (since 2007) | Co-Founder of Baringo Capital LLC (private equity) since 2002; President, Continuation Investments Group, Inc. from 1997 to 2001. Oversees 77, Jackson Hewitt Tax Service Inc. (tax preparation services); Crystal Capital River Inc. (real estate investment trust); Student Loan Corporation (student loan provider); Celgene Corporation (global biotechnology company); Apex Silver Mines Ltd. (mining); and Hyperion Brookfield Total Return Fund, Inc. and Hyperion Brookfield Strategic Mortgage Income Fund, Inc. (exchange-traded funds) | ||||||
| Douglas A. Hacker (Born 1955) c/o Columbia Management Advisors, LLC One Financial Center Boston, MA 02111 Trustee (since 1996) | Independent business executive since May 2006; Executive Vice President—Strategy of United Airlines (airline) from December 2002 to May 2006; President of UAL Loyalty Services (airline marketing company) from September 2001 to December 2002; Executive Vice President and Chief Financial Officer of United Airlines from July 1999 to September 2001. Oversees 77, Nash Finch Company (food distributor); Aircastle Limited (aircraft leasing) | ||||||
| Janet Langford Kelly (Born 1957) c/o Columbia Management Advisors, LLC One Financial Center Boston, MA 02111 Trustee (since 1996) | Senior Vice President, General Counsel and Corporate Secretary, ConocoPhillips (integrated energy company) since September 2007; Deputy General Counsel—Corporate Legal Services, ConocoPhillips from August 2006 to August 2007; Partner, Zelle, Hofmann, Voelbel, Mason & Gette LLP (law firm) from March 2005 to July 2006; Adjunct Professor of Law, Northwestern University, from September 2004 to June 2006; Director, UAL Corporation (airline) from February 2006 to July 2006; Chief Administrative Officer and Senior Vice President, Kmart Holding Corporation (consumer goods), from September 2003 to March 2004; Executive Vice President—Corporate Development and Administration, General Counsel and Secretary, Kellogg Company (food manufacturer), from September 1999 to August 2003. Oversees 77, None | ||||||
| Charles R. Nelson (Born 1942) c/o Columbia Management Advisors, LLC One Financial Center Boston, MA 02111 Trustee (since 1981) | Professor of Economics, University of Washington, since January 1976; Ford and Louisa Van Voorhis Professor of Political Economy, University of Washington, since September 1993; Director, Institute for Economic Research, University of Washington from September 2001 to June 2003; Adjunct Professor of Statistics, University of Washington, since September 1980; Associate Editor, Journal of Money Credit and Banking since September 1993; Consultant on econometric and statistical matters. Oversees 77, None | ||||||
| John J. Neuhauser (Born 1943) c/o Columbia Management Advisors, LLC One Financial Center Boston, MA 02111 Trustee (since 1985) | President, Saint Michael's College, since August 2007; University Professor, Boston College from November 2005 to August 2007; Academic Vice President and Dean of Faculties, Boston College from August 1999 to October 2005. Oversees 77, Liberty All-Star Equity Fund and Liberty All-Star Growth Fund, Inc. (closed-end funds) | ||||||
139
Fund Governance (continued)
| Name, Address and Year of Birth, Position with Funds, Year First Elected or Appointed to Office1 | Principal Occupation(s) During Past Five Years, Number of Portfolios in Columbia Funds Complex Overseen by Trustee, Other Directorships Held | ||||||
| Independent Trustees (continued) | |||||||
| Jonathan Piel (Born 1938) c/o Columbia Management Advisors, LLC One Financial Center Boston, MA 02111 Trustee1 (since 2007) | Cable television producer and website designer; The Editor, Scientific American from 1984 to 1994; Vice President, Scientific American, Inc. from 1984 to 1994; Member, Advisory Board, Stone Age Institute, Bloomington, Indiana (research institute that explores the effect of technology on human evolution); Member, Board of Directors of the National Institute of Social Sciences, New York City; and Member, Board of Trustees of the William Alanson White Institute, New York City (institution for training psychoanalysts). Oversees 77, None | ||||||
| Patrick J. Simpson (Born 1944) c/o Columbia Management Advisors, LLC One Financial Center Boston, MA 02111 Trustee (since 2000) | Partner, Perkins Coie LLP (law firm). Oversees 77, None | ||||||
| Thomas C. Theobald (Born 1937) c/o Columbia Management Advisors, LLC One Financial Center Boston, MA 02111 Trustee and Chairman of the Board (since 1996) | Partner and Senior Advisor, Chicago Growth Partners (private equity investing) since September 2004; Managing Director, William Blair Capital Partners (private equity investing) from September 1994 to September 2004. Oversees 77, Anixter International (network support equipment distributor); Ventas, Inc. (real estate investment trust); Jones Lang LaSalle (real estate management services); Ambac Financial Group (financial guaranty insurance) | ||||||
| Anne-Lee Verville (Born 1945) c/o Columbia Management Advisors, LLC One Financial Center Boston, MA 02111 Trustee (since 1998) | Retired since 1997 (formerly General Manager–Global Education Industry (from 1994 to 1997), President—Application Systems Division (from 1991 to 1994), Chief Financial Officer—US Marketing & Services (from 1988 to 1991), and Chief Information Officer (from 1987 to 1988), IBM Corporation (computer and technology)). Oversees 77, None | ||||||
| Interested Trustee | |||||||
| William E. Mayer (Born 1940) c/o Columbia Management Advisors, LLC One Financial Center Boston, MA 02111 Trustee2 (since 1994) | Partner, Park Avenue Equity Partners (private equity) since February 1999; Dean and Professor, College of Business, University of Maryland from 1992 to 1997. Oversees 77, Lee Enterprises (print media), WR Hambrecht + Co. (financial service provider); BlackRock Kelso Capital Corporation (investment company) | ||||||
1 Messrs. Drake, Piel and Collins have served as directors/trustees of the Excelsior Funds since 1996, 1996 and 2005, respectively. The Excelsior Funds consisted of 27 portfolios managed by affiliates of Columbia Management Advisors, LLC. Effective December 12, 2007, the Board elected Messrs. Drake, Piel and Collins as Trustees of the Trust.
2 Mr. Mayer is an "interested person" (as defined in the Investment Company Act of 1940) by reason of his affiliation with WR Hambrecht + Co., a registered broker/dealer that may execute portfolio transactions for or engage in principal transactions with the Funds or other funds or accounts advised/managed by the Advisor or other Bank of America affiliates.
The Statement of Additional Information includes additional information about the Trustees of the Funds and is available, without charge, upon request by calling 1-800-426-3750.
140
Fund Governance (continued)
Officers
| Name, Address and Year of Birth, Position with Columbia Funds, Year First Elected or Appointed to Office | Principal Occupation(s) During Past Five Years | ||||||
| Christopher L. Wilson (Born 1957) One Financial Center Boston, MA 02111 President (since 2004) | President—Columbia Funds, since October 2004; Managing Director—Columbia Management Advisors, LLC, since September 2005; Senior Vice President—Columbia Management Distributors, Inc., since January 2005; Director—Columbia Management Services, Inc., since January 2005; Director—Bank of America Global Liquidity Funds, plc and Banc of America Capital Management (Ireland), Limited, since May 2005; Director—FIM Funding, Inc., since January 2005; President and Chief Executive Officer—CDC IXIS AM Services, Inc. (investment management), from September 1998 through August 2004; and a senior officer or director of various other Bank of America affiliated entities, including other registered and unregistered funds. | ||||||
| James R. Bordewick, Jr. (Born 1959) One Financial Center Boston, MA 02111 Senior Vice President, Secretary and Chief Legal Officer (since 2006) | Associate General Counsel, Bank of America since April 2005; Senior Vice President and Associate General Counsel, MFS Investment Management (investment management) prior to April 2005. | ||||||
| J. Kevin Connaughton (Born 1964) One Financial Center Boston, MA 02111 Senior Vice President and Chief Financial Officer (since 2000) | Managing Director of Columbia Management Advisors, LLC since December 2004; Treasurer—Columbia Funds, from October 2003 to May 2008; Treasurer—the Liberty Funds, Stein Roe Funds and Liberty All-Star Funds, December 2000—December 2006; Senior Vice President—Columbia Management Advisors, LLC, from April 2003 to December 2004; President—Columbia Funds, Liberty Funds and Stein Roe Funds, February 2004 to October 2004; Treasurer—Galaxy Funds, September 2002 to December 2005; Treasurer, December 2002 to December 2004, and President, February 2004 to December 2004—Columbia Management Multi-Strategy Hedge Fund, LLC; and a senior officer of various other Bank of America-affiliated entities, including other registered and unregistered funds. | ||||||
| Linda J. Wondrack (Born 1964) One Financial Center Boston, MA 02111 Senior Vice President and Chief Compliance Officer (since 2007) | Director (Columbia Management Group LLC and Investment Product Group Compliance), Bank of America since June 2005; Director of Corporate Compliance and Conflicts Officer, MFS Investment Management (investment management), August 2004 to May 2005; Managing Director, Deutsche Asset Management (investment management) prior to August 2004. | ||||||
| Michael G. Clarke (Born 1969) One Financial Center Boston, MA 02111 Treasurer (since 2008) | Director of Fund Administration of the Advisor since January 2006; Managing Director of the Advisor September 2004 to December 2005; Vice President Fund Administration June 2002 to September 2004. | ||||||
| Jeffrey R. Coleman (Born 1969) One Financial Center Boston, MA 02111 Deputy Treasurer (since 2006) | Director of Fund Administration of the Advisor since January 2006; Fund Controller of the Advisor from October 2004 to January 2006; Vice President of CDC IXIS Asset Management Services, Inc. (investment management) from August 2000 to September 2004. | ||||||
| Joseph F. DiMaria (Born 1968) One Financial Center Boston, MA 02111 Chief Accounting Officer (since 2008) | Director of Fund Administration of the Advisor since January 2006; Head of Tax/Compliance and Assistant Treasurer of the Advisor from November 2004 to December 2005; Director of Trustee Administration (Sarbanes-Oxley) of the Advisor from May 2003 to October 2004. | ||||||
141
Fund Governance (continued)
Officers (continued)
| Name, Address and Year of Birth, Position with Columbia Funds, Year First Elected or Appointed to Office | Principal Occupation(s) During Past Five Years | ||||||
| Julian Quero (Born 1967) One Financial Center Boston, MA 02111 Deputy Treasurer (since 2008) | Senior Tax Manager of the Advisor since August 2006; Senior Compliance Manager of the Advisor from April 2002 to August 2006. | ||||||
| Barry S. Vallan (Born 1969) One Financial Center Boston, MA 02111 Controller (since 2006) | Vice President—Fund Treasury of the Advisor since October 2004; Vice President—Trustee Reporting of the Advisor from April 2002 to October 2004. | ||||||
142
This page is intentionally left blank.
This page is intentionally left blank.
This page is intentionally left blank.
COLUMBIA FUNDS INSTITUTIONAL TRUST
ONE FINANCIAL CENTER BOSTON, MA 02111-2621
- INVESTMENT ADVISOR -
COLUMBIA MANAGEMENT ADVISORS, LLC
100 FEDERAL STREET
BOSTON, MASSACHUSETTS 02110-2624
- LEGAL COUNSEL -
ROPES & GRAY LLP
ONE INTERNATIONAL PLACE
BOSTON, MA 02110-2624
- TRANSFER AGENT -
COLUMBIA MANAGEMENT SERVICES, INC.
P.O. BOX 8081
BOSTON, MASSACHUSETTS 02266-8081
SHC-42/155059-0708 (09/08) 08/56634
A description of the policies and procedures that each fund uses to determine how to vote proxies and a copy of each fund's voting records are available (i) at www.columbiamanagement.com; (ii) on the Securities and Exchange Commission's website at www.sec.gov, and (iii) without charge, upon request, by calling 1-800-368-0346. Information regarding how the funds voted proxies relating to portfolio securities during the 12-month period ended June 30 is available from the SEC's website. Information regarding how the funds voted proxies relating to portfolio securities is also available from the funds' website, www.columbiamanagement.com.
Each fund files a complete schedule of portfolio holdings with the SEC for the first and third quarters of each fiscal year on Form N-Q. Each fund's Form N-Q is available on the SEC's website at www.sec.gov and may be reviewed and copied at the SEC's Public Reference Room in Washington, DC. Information on the operation of the Public Reference Room may be obtained by calling 1-800-SEC-0330.
Please read and consider the investment objectives, risks, charges and expenses for any fund carefully before investing. For a prospectus which contains this and other important information about a fund, contact your Columbia Management representative or go to www.columbiamanagement.com.
©2008 Columbia Management Distributors, Inc.
One Financial Center, Boston, MA 02111-2621
![]()
CMG STRATEGIC EQUITY FUND
A PORTFOLIO OF COLUMBIA FUNDS INSTITUTIONAL TRUST
Annual Report
July 31, 2008
NOT FDIC INSURED
May Lose Value
No Bank Guarantee
NOT BANK ISSUED
Columbia Management Group, LLC ("Columbia Management") is the investment management division of Bank of America Corporation. Columbia Management entities furnish investment management services and products for institutional and individual investors. The fund is distributed by Columbia Management Distributors, Inc., member of FINRA, SIPC, part of Columbia Management and an affiliate of Bank of America Corporation.
Columbia Management Advisors, LLC ("CMA") is an SEC-registered investment advisor and an indirect, wholly owned subsidiary of Bank of America Corporation and is part of Columbia Management.
The views expressed in this report reflect the current views of the respective parties. These views are not guarantees of future performance and involve certain risks, uncertainties and assumptions that are difficult to predict so actual outcomes and results may differ significantly from the views expressed. These views are subject to change at any time based upon economic, market or other conditions and the respective parties disclaim any responsibility to update such views. These views may not be relied on as investment advice and, because investment decisions for the Fund are based on numerous factors, may not be relied on as an indication of trading intent on behalf of the Fund. References to specific securities should not be construed as a recommendation or investment advice.
Performance data quoted represents past performance and current performance may be lower or higher. Past performance is no guarantee of future results. The investment return and principal value will fluctuate so that shares, when redeemed, may be worth more or less than the original cost. Please visit www.columbiamanagement.com for daily and most recent month-end performance updates.
CMG STRATEGIC EQUITY FUND
A Portfolio of Columbia Funds Institutional Trust
MANAGEMENT DISCUSSION OF FUND PERFORMANCE
Summary
• For the 12-month period that ended July 31, 2008, CMG Strategic Equity Fund returned negative 4.03%. The fund outperformed its benchmark, the Russell 1000 Index which returned negative 10.62%1. The average return of the fund's peer group, the Lipper Multi-Cap Core Funds Classification, was negative 10.73%.2 In a period that was generally challenging for stocks, the fund held up better than its benchmarks and peer group because of good stock selection and, to a lesser extent, because of favorable sector weights.
• Stock selection in the energy, health care and materials sectors benefited the fund's return. In the energy sector, Continental Resources and Wellstream Holdings were strong performers (0.3% and 0.6% of net assets, respectively). Among health care companies, Masimo, Express Scripts and Illumina contributed to results (0.6%, 0.3% and 0.4% of net assets, respectively). Monsanto was an important holding in the materials sector (0.6% of net assets).
• Throughout the period, the financials sector was in significant turmoil; however, the fund's financials positions held up better than the index, primarily because of stock selection. Digital Realty Trust, State Street and Goldman Sachs Group were particularly noteworthy (0.5%, 0.6% and 1.1% of net assets, respectively). However, holdings in Ambac Financial Group, National Financial Partners and Freddie Mac faced a challenging environment and were eliminated from the portfolio.
• Several other sectors contributed modestly to the fund's solid relative performance. In the consumer discretionary area, Nokian Renkaat of Finland, was helpful (0.5% of net assets). In consumer staples, Universal enhanced results (0.6% of net assets). Exelon in the utilities sector also helped performance (0.9% of net assets). The telecommunication services sector also contributed to the funds relative performance. Among the stocks that made a poor showing in these sectors were: Home Inns & Hotels in consumer discretionary; Bare Escentuals in consumer staples; NII Holdings in telecommunications; and Mirant in utilities. All of these poor performers were sold.
• The fund's investments in the industrials sector produced results that were almost in line with the benchmark. Joy Global and Union Pacific were particularly strong (0.5% and 0.9% of net assets, respectively). Stocks that disappointed included Ultrapetrol Bahamas, AerCap Holdings, Rockwell Collins and Huron Consulting Group. All of these disappointing companies were sold.
1 The Russell 1000 Index measures the performance of 1,000 of the largest US companies, based on market capitalization. Indices are not investments, do not incur fees or expenses and are not professionally managed. It is not possible to invest directly in an index. Securities in the fund may not match those in an index.
2 Lipper Inc., a widely respected data provider in the industry, calculates an average total return (assuming reinvestment of distributions) for mutual funds with investment objectives similar to those of the fund. Lipper makes no adjustment for the effect of sales loads.
1
• During the period, we have dealt with a U.S. economy that experienced declining consumer confidence, high energy prices, a weak housing sector and problems in the financial system. We believe that these issues will continue to weigh on the U.S. economy. However, we have begun to find selected opportunities in the consumer discretionary and financials sectors. We also continue to hold a favorable long term view of the energy sector. Finally, we plan to continue to evaluate compelling growth trends and valuations in overseas markets.
We appreciate your continued confidence in CMG Strategic Equity Fund.
Portfolio Management
Emil A. Gjester has managed or co-managed the fund since January 2004 and has been with the advisor or its predecessors or affiliate organizations since 1996.
Jonas Patrikson has co-managed the fund since February 2006 and has been with the advisor or its predecessors or affiliate organizations since 2004.
Michael T. Welter has co-managed the fund since July 2006 and has been with the advisor or its predecessors or affiliate organizations since 2006.
Mary-Ann Ward has co-managed the fund since April 2008 and has been with the advisor or its predecessors or affiliate organizations since 1997.
The fund's top ten holdings (as a percentage of net assets) as of July 31, 2008 were:
| (%) | |||||||
| Exxon Mobil | 2.0 | ||||||
| JPMorgan Chase | 1.7 | ||||||
| Hewlett-Packard | 1.5 | ||||||
| International Business Machines | 1.3 | ||||||
| Microsoft | 1.3 | ||||||
| Apple | 1.3 | ||||||
| ConocoPhillips | 1.2 | ||||||
| Cisco Systems | 1.2 | ||||||
| 1.1 | |||||||
| Freeport-McMoRan Copper & Gold | 1.1 | ||||||
Holdings are calculated as a percentage of net assets and are subject to change. Because the fund is actively managed, there is no guarantee the fund will continue to maintain the holdings breakdown listed. The fund's holdings and their weights within the portfolio may change as market conditions change.
Equity investments are affected by stock market fluctuations that occur in response to economic and business developments.
International investing may involve certain risks, including foreign taxation, currency fluctuations, risks associated with possible differences in financial standards and other monetary and political risks.
2
Performance data quoted represents past performance and current performance may be lower or higher. Past performance is no guarantee of future results. The investment return and principal value will fluctuate so that shares, when redeemed, may be worth more or less than the original cost. Please visit www.columbiamanagement.com for daily and most recent month-end performance updates.
Average annual total return as of July 31, 2008 (%)
| Inception | 1-year | 5-year | Life | ||||||||||||||||
| CMG Strategic Equity Fund | 10/09/01 | -4.03 | 10.47 | 10.71 | |||||||||||||||
| Russell 1000 Index | -10.62 | 7.55 | 5.21 | ||||||||||||||||
Average annual total return as of June 30, 2008 (%)
| Inception | 1-year | 5-year | Life | ||||||||||||||||
| CMG Strategic Equity Fund | 10/09/01 | -4.10 | 11.77 | 11.27 | |||||||||||||||
| Russell 1000 Index | -12.36 | 8.22 | 5.46 | ||||||||||||||||
Index performance is from October 9, 2001.
Performance results reflect any fee waivers or reimbursements of fund expenses by the investment advisor and/or any of its affiliates. Absent these fee waivers or expense reimbursement arrangements, performance results would have been lower. All results shown assume reinvestment of distributions and do not reflect the deduction of taxes that a shareholder may pay on fund distributions or on the redemption of fund shares.
The fund's annual operating expense ratios, with and without contractual waivers, as stated in the fund's prospectus that is current as of the date of this report, are 0.40% and 0.62%, respectively, of average annual net assets. Differences in expense ratios disclosed elsewhere in this report may result from including fee waivers and expense reimbursements as well as different time periods used in calculating the ratios. The contractual waiver expires 11/30/08.
Growth of a $5,000,000 investment, October 9, 2001 to July 31, 2008
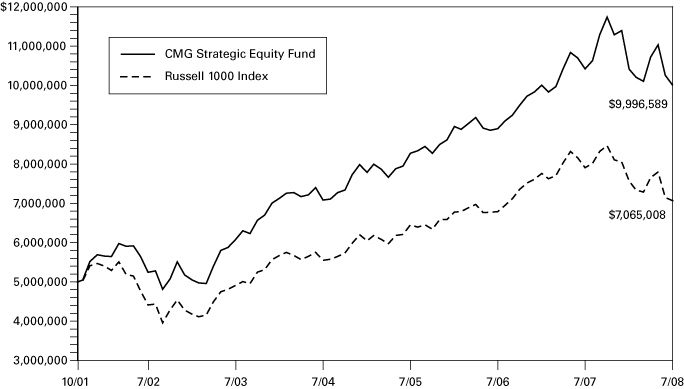
The chart above shows the growth in value of a hypothetical minimum initial $5,000,000 investment in the fund compared to the index during the stated time period and does not reflect the deduction of taxes that a shareholder may pay on fund distributions or on the redemption of fund shares.
The Russell 1000 Index measures the performance of 1,000 of the largest US companies, based on market capitalization. Indices are not investments, do not incur fees or expenses and are not professionally managed. It is not possible to invest directly in an index. Securities in the fund may not match those in an index.
3
UNDERSTANDING YOUR EXPENSES – CMG Strategic Equity Fund
As a fund shareholder, you incur ongoing costs, which generally include investment advisory fees and other fund expenses. The information on this page is intended to help you understand the ongoing costs of investing in the fund and to compare these costs with the ongoing costs of investing in other mutual funds.
Analyzing your fund's expenses
To illustrate these ongoing costs, we have provided an example and calculated the expenses paid by investors during the period. The information in the following table is based on an initial investment of $1,000, which is invested at the beginning of the period and held for the entire period. Expense information is calculated two ways and each method provides you with different information. The amount listed in the "actual" column is calculated using the fund's actual operating expenses and total return for the period. The amount listed in the "hypothetical" column assumes that the return each year is 5% before expenses and is calculated based on the fund's actual operating expenses. You should not use the hypothetical account values and expenses to estimate either your actual account balance at the end of the period or the expenses you paid during this period.
Estimating your actual expenses
To estimate the expenses that you paid over the period, first you will need your account balance at the end of the period:
1. Divide your ending account balance by $1,000. For example, if an account balance was $8,600 at the end of the period, the result would be 8.6.
2. In the section of the table below titled "Expenses paid during the period," locate the amount in the column labeled "actual." Multiply this number by the result from step 1. Your answer is an estimate of the expenses you paid on your account during the period.
February 1, 2008 — July 31, 2008
| Account value at the beginning of the period ($) | Account value at the end of the period ($) | Expenses paid during the period ($) | Fund's annualized expense ratio (%) | ||||||||||||||||||||||||
| Actual | Hypothetical | Actual | Hypothetical | Actual | Hypothetical | Actual | |||||||||||||||||||||
| 1,000.00 | 1,000.00 | 960.42 | 1,022.87 | 1.95 | 2.01 | 0.40 | |||||||||||||||||||||
Expenses paid during the period are equal to the annualized expense ratio of 0.40%, multiplied by the average account value over the period, then multiplied by the number of days in the fund's most recent fiscal half-year and divided by 366.
Had the investment advisor and/or any of its affiliates not waived fees or reimbursed a portion of expenses, account value at end of the period would have been reduced.
It is important to note that the expense amounts shown in the table are meant to highlight only ongoing costs of investing in the fund. Therefore, the hypothetical examples provided may not help you determine the relative total costs of owning shares of different funds.
Compare with other funds
Since all mutual funds are required to include the same hypothetical calculations about expenses in shareholder reports, you can use this information to compare the ongoing costs of investing in the fund with other funds. To do so, compare the 5% hypothetical example with the 5% hypothetical examples that appear in the shareholder reports of other funds. As you compare hypothetical examples of other funds, it is important to note that hypothetical examples are meant to highlight the ongoing costs of investing in a fund.
4
CMG STRATEGIC EQUITY FUND
A Portfolio of Columbia Funds Institutional Trust
FINANCIAL HIGHLIGHTS
(For a Share Outstanding Throughout Each Period)
| Year Ended July 31, | |||||||||||||||||||||||
| 2008 | 2007 | 2006 | 2005 | 2004 | |||||||||||||||||||
| Net asset value, beginning of period | $ | 3.01 | $ | 3.13 | $ | 15.22 | $ | 13.80 | $ | 12.06 | |||||||||||||
| Income from investment operations: | |||||||||||||||||||||||
| Net investment income (a) | 0.03 | 0.04 | 0.14 | 0.19 | (b) | 0.12 | |||||||||||||||||
| Net realized and unrealized gain (loss) on investments and foreign currency | (0.04 | ) | 0.46 | 0.82 | 2.09 | 1.87 | |||||||||||||||||
| Total from investment operations | (0.01 | ) | 0.50 | 0.96 | 2.28 | 1.99 | |||||||||||||||||
| Less distributions to shareholders: | |||||||||||||||||||||||
| From net investment income | (0.05 | ) | (0.03 | ) | (0.57 | ) | (0.14 | ) | (0.09 | ) | |||||||||||||
| From net realized gains | (1.01 | )(c) | (0.59 | ) | (12.48 | )(c) | (0.72 | ) | (0.16 | ) | |||||||||||||
| Total distributions to shareholders | (1.06 | ) | (0.62 | ) | (13.05 | ) | (0.86 | ) | (0.25 | ) | |||||||||||||
| Net asset value, end of period | $ | 1.94 | $ | 3.01 | $ | 3.13 | $ | 15.22 | $ | 13.80 | |||||||||||||
| Total return (d)(e) | (4.03 | )% | 17.08 | %(f) | 7.58 | %(g) | 16.77 | % | 16.58 | % | |||||||||||||
| Ratios to average net assets/Supplemental data: | |||||||||||||||||||||||
| Net expenses before interest expense (h) | 0.40 | % | 0.40 | % | 0.40 | % | 0.40 | % | 0.40 | % | |||||||||||||
| Interest expense | - | %(i) | - | %(i) | - | - | - | ||||||||||||||||
| Net Expenses (h) | 0.40 | % | 0.40 | % | 0.40 | % | 0.40 | % | 0.40 | % | |||||||||||||
| Waiver/Reimbursement | 0.33 | % | 0.22 | % | 0.07 | % | 0.03 | % | 0.05 | % | |||||||||||||
| Net investment income (h) | 1.20 | % | 1.31 | % | 1.09 | % | 1.31 | % | 0.88 | % | |||||||||||||
| Portfolio turnover rate | 100 | % | 127 | % | 47 | % | 64 | % | 81 | % | |||||||||||||
| Net assets, end of period (000's) | $ | 49,466 | $ | 46,106 | $ | 120,541 | $ | 755,860 | $ | 618,714 | |||||||||||||
(a) Per share data was calculated using the average shares outstanding during the period.
(b) Net investment income per share reflects a special dividend. The effect of this dividend amounted to $0.02 per share.
(c) Capital gain distributions were declared after significant shareholder redemptions reduced the size of the Fund.
(d) Total return at net asset value assuming all distributions reinvested.
(e) Had the investment advisor and/or any of its affiliates not waived fees or reimbursed a portion of expenses, total return would have been reduced.
(f) Includes a reimbursement by the investment advisor due to a compliance violation. This reimbursement increased total return and net asset value per share less than 0.01% and $0.01, respectively.
(g) Includes a voluntary reimbursement by the investment advisor for a realized investment loss due to a trading error. This reimbursement increased total return and net asset value per share by less than 0.01% and less than $0.01, respectively.
(h) The benefits derived from custody credits had an impact of less than 0.01%.
(i) Rounds to less than 0.01%.
See Accompanying Notes to Financial Statements.
5
CMG STRATEGIC EQUITY FUND
A Portfolio of Columbia Funds Institutional Trust
SCHEDULE OF INVESTMENTS
July 31, 2008
| Shares | Value | ||||||||||
| Common Stocks (98.9%) | |||||||||||
| Consumer Discretionary (8.5%) | |||||||||||
| Auto Components (0.5%) | |||||||||||
| Nokian Renkaat Oyj | 5,600 | $ | 241,410 | ||||||||
| Household Durables (1.1%) | |||||||||||
| Cyrela Brazil Realty SA | 13,670 | 198,989 | |||||||||
| Gafisa SA, ADR | 4,560 | 156,134 | |||||||||
| Whirlpool Corp. | 2,270 | 171,839 | |||||||||
| 526,962 | |||||||||||
| Internet & Catalog Retail (0.4%) | |||||||||||
| priceline.com, Inc. (a) | 1,540 | 177,023 | |||||||||
| Media (0.6%) | |||||||||||
| Comcast Corp., Class A | 7,130 | 147,021 | |||||||||
| News Corp., Class A | 11,640 | 164,473 | |||||||||
| 311,494 | |||||||||||
| Multiline Retail (1.9%) | |||||||||||
| Kohl's Corp. (a) | 5,580 | 233,858 | |||||||||
| Macy's, Inc. | 9,900 | 186,219 | |||||||||
| Stockmann Oyj Abp, Class B | 4,950 | 152,914 | |||||||||
| Target Corp. | 7,980 | 360,935 | |||||||||
| 933,926 | |||||||||||
| Specialty Retail (1.7%) | |||||||||||
| Best Buy Co., Inc. | 5,630 | 223,624 | |||||||||
| GameStop Corp., Class A (a) | 2,240 | 90,742 | |||||||||
| Home Depot, Inc. | 9,200 | 219,236 | |||||||||
| Stage Stores, Inc. | 10,750 | 159,315 | |||||||||
| Urban Outfitters, Inc. (a) | 5,010 | 165,380 | |||||||||
| 858,297 | |||||||||||
| Textiles, Apparel & Luxury Goods (2.3%) | |||||||||||
| Coach, Inc. (a) | 3,620 | 92,346 | |||||||||
| Hanesbrands, Inc. (a) | 8,540 | 183,098 | |||||||||
| Lululemon Athletica, Inc. (a) | 3,790 | 84,138 | |||||||||
| LVMH Moet Hennessy Louis Vuitton SA | 1,890 | 208,566 | |||||||||
| NIKE, Inc., Class B | 6,860 | 402,545 | |||||||||
| Polo Ralph Lauren Corp. | 3,120 | 184,610 | |||||||||
| 1,155,303 | |||||||||||
| 4,204,415 | |||||||||||
See Accompanying Notes to Financial Statements.
6
CMG STRATEGIC EQUITY FUND
A Portfolio of Columbia Funds Institutional Trust
SCHEDULE OF INVESTMENTS
| Shares | Value | ||||||||||
| Common Stocks (continued) | |||||||||||
| Consumer Staples (8.7%) | |||||||||||
| Beverages (2.4%) | |||||||||||
| Coca-Cola Co. | 6,700 | $ | 345,050 | ||||||||
| Diageo PLC, ADR | 2,430 | 171,024 | |||||||||
| Fomento Economico Mexicano SAB de CV, ADR | 5,620 | 257,733 | |||||||||
| PepsiCo, Inc. | 6,320 | 420,659 | |||||||||
| 1,194,466 | |||||||||||
| Food & Staples Retailing (2.2%) | |||||||||||
| Kroger Co. | 5,370 | 151,864 | |||||||||
| Longs Drug Stores Corp. | 4,740 | 221,595 | |||||||||
| United Natural Foods, Inc. (a) | 9,680 | 186,049 | |||||||||
| Wal-Mart Stores, Inc. | 5,990 | 351,134 | |||||||||
| Walgreen Co. | 5,060 | 173,760 | |||||||||
| 1,084,402 | |||||||||||
| Food Products (1.2%) | |||||||||||
| ConAgra Foods, Inc. | 9,470 | 205,310 | |||||||||
| Nestle SA, Registered Shares | 4,970 | 217,813 | |||||||||
| Unilever N.V., N.Y. Registered Shares | 6,580 | 182,332 | |||||||||
| 605,455 | |||||||||||
| Household Products (1.4%) | |||||||||||
| Colgate-Palmolive Co. | 2,580 | 191,616 | |||||||||
| Procter & Gamble Co. | 7,100 | 464,908 | |||||||||
| 656,524 | |||||||||||
| Personal Products (0.7%) | |||||||||||
| Avon Products, Inc. | 8,110 | 343,864 | |||||||||
| Tobacco (0.8%) | |||||||||||
| Altria Group, Inc. | 4,480 | 91,168 | |||||||||
| Universal Corp. | 6,100 | 314,882 | |||||||||
| 406,050 | |||||||||||
| 4,290,761 | |||||||||||
| Energy (15.0%) | |||||||||||
| Energy Equipment & Services (6.8%) | |||||||||||
| Cameron International Corp. (a) | 8,410 | 401,662 | |||||||||
| Core Laboratories N.V. | 2,100 | 272,181 | |||||||||
| Diamond Offshore Drilling, Inc. | 1,430 | 170,599 | |||||||||
| National-Oilwell Varco, Inc. (a) | 4,000 | 314,520 | |||||||||
| Noble Corp. | 3,970 | 205,924 | |||||||||
| Oceaneering International, Inc. (a) | 3,130 | 189,803 | |||||||||
| Schlumberger Ltd. | 4,940 | 501,904 | |||||||||
See Accompanying Notes to Financial Statements.
7
CMG STRATEGIC EQUITY FUND
A Portfolio of Columbia Funds Institutional Trust
SCHEDULE OF INVESTMENTS
| Shares | Value | ||||||||||
| Common Stocks (continued) | |||||||||||
| Energy Equipment & Services (continued) | |||||||||||
| Tenaris SA, ADR | 4,490 | $ | 270,522 | ||||||||
| Transocean, Inc. (a) | 2,958 | 402,377 | |||||||||
| Weatherford International Ltd. (a) | 9,630 | 363,340 | |||||||||
| Wellstream Holdings PLC (a) | 11,470 | 269,821 | |||||||||
| 3,362,653 | |||||||||||
| Oil, Gas & Consumable Fuels (8.2%) | |||||||||||
| Apache Corp. | 1,320 | 148,064 | |||||||||
| ConocoPhillips | 7,400 | 603,988 | |||||||||
| Continental Resources, Inc. (a) | 2,918 | 166,676 | |||||||||
| Devon Energy Corp. | 3,520 | 334,013 | |||||||||
| Exxon Mobil Corp. | 12,290 | 988,485 | |||||||||
| Hess Corp. | 2,350 | 238,290 | |||||||||
| Marathon Oil Corp. | 4,320 | 213,710 | |||||||||
| Occidental Petroleum Corp. | 4,190 | 330,298 | |||||||||
| Peabody Energy Corp. | 2,210 | 149,507 | |||||||||
| Petroleo Brasileiro SA, ADR | 4,450 | 248,799 | |||||||||
| SandRidge Energy, Inc. (a) | 1,976 | 96,607 | |||||||||
| Southwestern Energy Co. (a) | 6,540 | 237,467 | |||||||||
| XTO Energy, Inc. | 5,947 | 280,877 | |||||||||
| 4,036,781 | |||||||||||
| 7,399,434 | |||||||||||
| Financials (14.8%) | |||||||||||
| Capital Markets (3.5%) | |||||||||||
| Charles Schwab Corp. | 9,290 | 212,648 | |||||||||
| Goldman Sachs Group, Inc. | 2,860 | 526,354 | |||||||||
| Invesco Ltd. | 9,110 | 212,172 | |||||||||
| Lazard Ltd., Class A | 6,690 | 273,019 | |||||||||
| State Street Corp. | 4,090 | 293,008 | |||||||||
| Waddell & Reed Financial, Inc., Class A | 6,820 | 227,788 | |||||||||
| 1,744,989 | |||||||||||
| Commercial Banks (3.2%) | |||||||||||
| Banco Bradesco SA, ADR | 8,975 | 190,539 | |||||||||
| BB&T Corp. | 10,450 | 292,809 | |||||||||
| Glacier Bancorp, Inc. | 10,160 | 220,167 | |||||||||
| Prosperity Bancshares, Inc. | 6,670 | 214,107 | |||||||||
| Raiffeisen International Bank Holding AG | 850 | 106,036 | |||||||||
| Umpqua Holdings Corp. | 8,070 | 109,591 | |||||||||
| Wells Fargo & Co. | 14,840 | 449,207 | |||||||||
| 1,582,456 | |||||||||||
| Consumer Finance (0.9%) | |||||||||||
| American Express Co. | 11,750 | 436,160 | |||||||||
See Accompanying Notes to Financial Statements.
8
CMG STRATEGIC EQUITY FUND
A Portfolio of Columbia Funds Institutional Trust
SCHEDULE OF INVESTMENTS
| Shares | Value | ||||||||||
| Common Stocks (continued) | |||||||||||
| Diversified Financial Services (2.1%) | |||||||||||
| Citigroup, Inc. | 10,283 | $ | 192,189 | ||||||||
| JPMorgan Chase & Co. | 20,576 | 836,003 | |||||||||
| 1,028,192 | |||||||||||
| Insurance (3.8%) | |||||||||||
| ACE Ltd. | 5,270 | 267,189 | |||||||||
| Allstate Corp. | 6,210 | 287,026 | |||||||||
| Assurant, Inc. | 3,600 | 216,432 | |||||||||
| Marsh & McLennan Companies, Inc. | 9,440 | 266,680 | |||||||||
| Principal Financial Group, Inc. | 5,160 | 219,352 | |||||||||
| Prudential Financial, Inc. | 5,450 | 375,886 | |||||||||
| Unum Group | 11,130 | 268,901 | |||||||||
| 1,901,466 | |||||||||||
| Real Estate Investment Trusts (REITs) (1.3%) | |||||||||||
| Alexandria Real Estate Equities, Inc. | 1,500 | 154,890 | |||||||||
| Digital Realty Trust, Inc. | 5,750 | 246,733 | |||||||||
| SL Green Realty Corp. | 2,570 | 214,184 | |||||||||
| 615,807 | |||||||||||
| 7,309,070 | |||||||||||
| Health Care (12.0%) | |||||||||||
| Biotechnology (2.9%) | |||||||||||
| Amgen, Inc. (a) | 2,750 | 172,232 | |||||||||
| Biogen Idec, Inc. (a) | 1,360 | 94,874 | |||||||||
| BioMarin Pharmaceuticals, Inc. (a) | 3,060 | 99,603 | |||||||||
| Celgene Corp. (a) | 3,935 | 297,053 | |||||||||
| Genentech, Inc. (a) | 1,750 | 166,688 | |||||||||
| Gilead Sciences, Inc. (a) | 8,580 | 463,148 | |||||||||
| Onyx Pharmaceuticals, Inc. (a) | 3,220 | 130,410 | |||||||||
| 1,424,008 | |||||||||||
| Health Care Equipment & Supplies (2.3%) | |||||||||||
| Baxter International, Inc. | 6,860 | 470,664 | |||||||||
| Masimo Corp. (a) | 7,443 | 281,122 | |||||||||
| Mindray Medical International Ltd., ADR | 5,965 | 238,302 | |||||||||
| Varian Medical Systems, Inc. (a) | 2,920 | 175,200 | |||||||||
| 1,165,288 | |||||||||||
| Health Care Providers & Services (1.4%) | |||||||||||
| Express Scripts, Inc. (a) | 2,300 | 162,242 | |||||||||
| Laboratory Corp. of America Holdings (a) | 3,450 | 233,151 | |||||||||
| McKesson Corp. | 3,310 | 185,327 | |||||||||
| Medco Health Solutions, Inc. (a) | 2,010 | 99,656 | |||||||||
| 680,376 | |||||||||||
See Accompanying Notes to Financial Statements.
9
CMG STRATEGIC EQUITY FUND
A Portfolio of Columbia Funds Institutional Trust
SCHEDULE OF INVESTMENTS
| Shares | Value | ||||||||||
| Common Stocks (continued) | |||||||||||
| Life Sciences Tools & Services (3.2%) | |||||||||||
| Charles River Laboratories International, Inc. (a) | 2,720 | $ | 180,771 | ||||||||
| Covance, Inc. (a) | 3,150 | 289,170 | |||||||||
| Illumina, Inc. (a) | 2,006 | 187,040 | |||||||||
| Pharmaceutical Product Development, Inc. | 6,070 | 231,510 | |||||||||
| Qiagen N.V. (a) | 10,830 | 203,496 | |||||||||
| Thermo Fisher Scientific, Inc. (a) | 3,510 | 212,425 | |||||||||
| Waters Corp. (a) | 3,880 | 263,607 | |||||||||
| 1,568,019 | |||||||||||
| Pharmaceuticals (2.2%) | |||||||||||
| Abbott Laboratories | 9,190 | 517,764 | |||||||||
| Johnson & Johnson | 5,440 | 372,477 | |||||||||
| Novartis AG, ADR | 3,640 | 216,034 | |||||||||
| 1,106,275 | |||||||||||
| 5,943,966 | |||||||||||
| Industrials (11.7%) | |||||||||||
| Aerospace & Defense (2.1%) | |||||||||||
| Boeing Co. | 1,780 | 108,776 | |||||||||
| General Dynamics Corp. | 2,940 | 262,072 | |||||||||
| Goodrich Corp. | 3,890 | 191,155 | |||||||||
| Honeywell International, Inc. | 3,510 | 178,448 | |||||||||
| United Technologies Corp. | 4,830 | 309,023 | |||||||||
| 1,049,474 | |||||||||||
| Air Freight & Logistics (0.3%) | |||||||||||
| UTI Worldwide, Inc. | 7,770 | 141,336 | |||||||||
| Commercial Services & Supplies (1.2%) | |||||||||||
| Dun & Bradstreet Corp. | 2,830 | 273,491 | |||||||||
| Republic Services, Inc. | 5,870 | 190,775 | |||||||||
| Waste Connections, Inc. (a) | 3,340 | 121,543 | |||||||||
| 585,809 | |||||||||||
| Construction & Engineering (0.5%) | |||||||||||
| Quanta Services, Inc. (a) | 7,920 | 244,570 | |||||||||
| Electrical Equipment (0.4%) | |||||||||||
| GrafTech International Ltd. (a) | 4,830 | 113,263 | |||||||||
| Suntech Power Holdings Co., Ltd., ADR (a) | 3,000 | 100,380 | |||||||||
| 213,643 | |||||||||||
See Accompanying Notes to Financial Statements.
10
CMG STRATEGIC EQUITY FUND
A Portfolio of Columbia Funds Institutional Trust
SCHEDULE OF INVESTMENTS
| Shares | Value | ||||||||||
| Common Stocks (continued) | |||||||||||
| Industrial Conglomerates (2.2%) | |||||||||||
| General Electric Co. | 18,530 | $ | 524,214 | ||||||||
| McDermott International, Inc. (a) | 6,340 | 302,228 | |||||||||
| Siemens AG, ADR | 2,230 | 270,677 | |||||||||
| 1,097,119 | |||||||||||
| Machinery (2.5%) | |||||||||||
| AGCO Corp. (a) | 2,850 | 170,572 | |||||||||
| Deere & Co. | 2,740 | 192,238 | |||||||||
| GEA Group AG | 4,240 | 139,916 | |||||||||
| Joy Global, Inc. | 3,690 | 266,492 | |||||||||
| Paccar, Inc. | 4,695 | 197,472 | |||||||||
| Parker Hannifin Corp. | 2,710 | 167,153 | |||||||||
| SPX Corp. | 820 | 103,960 | |||||||||
| 1,237,803 | |||||||||||
| Marine (0.8%) | |||||||||||
| A.P. Moller - Maersk A/S | 13 | 151,025 | |||||||||
| D/S Norden | 970 | 94,105 | |||||||||
| DryShips, Inc. | 1,630 | 125,722 | |||||||||
| 370,852 | |||||||||||
| Road & Rail (1.7%) | |||||||||||
| Con-way, Inc. | 2,240 | 113,254 | |||||||||
| Landstar System, Inc. | 2,960 | 149,717 | |||||||||
| Norfolk Southern Corp. | 1,940 | 139,525 | |||||||||
| Union Pacific Corp. | 5,580 | 460,015 | |||||||||
| 862,511 | |||||||||||
| 5,803,117 | |||||||||||
| Information Technology (16.7%) | |||||||||||
| Communications Equipment (2.9%) | |||||||||||
| Cisco Systems, Inc. (a) | 26,530 | 583,395 | |||||||||
| Corning, Inc. | 4,890 | 97,849 | |||||||||
| Nokia Corp., ADR | 9,030 | 246,699 | |||||||||
| QUALCOMM, Inc. | 6,150 | 340,341 | |||||||||
| Research In Motion Ltd. (a) | 1,270 | 155,981 | |||||||||
| 1,424,265 | |||||||||||
| Computers & Peripherals (4.4%) | |||||||||||
| Apple, Inc. (a) | 3,960 | 629,442 | |||||||||
| EMC Corp. (a) | 11,560 | 173,516 | |||||||||
| Hewlett-Packard Co. | 16,070 | 719,936 | |||||||||
| International Business Machines Corp. | 5,090 | 651,418 | |||||||||
| 2,174,312 | |||||||||||
See Accompanying Notes to Financial Statements.
11
CMG STRATEGIC EQUITY FUND
A Portfolio of Columbia Funds Institutional Trust
SCHEDULE OF INVESTMENTS
| Shares | Value | ||||||||||
| Common Stocks (continued) | |||||||||||
| Electronic Equipment & Instruments (0.4%) | |||||||||||
| Mettler-Toledo International, Inc. (a) | 1,990 | $ | 213,945 | ||||||||
| Internet Software & Services (1.7%) | |||||||||||
| Equinix, Inc. (a) | 1,520 | 123,667 | |||||||||
| Google, Inc., Class A (a) | 1,170 | 554,288 | |||||||||
| Omniture, Inc. (a) | 9,080 | 157,538 | |||||||||
| 835,493 | |||||||||||
| IT Services (0.8%) | |||||||||||
| Paychex, Inc. | 5,560 | 183,035 | |||||||||
| Redecard SA | 10,800 | 201,341 | |||||||||
| 384,376 | |||||||||||
| Semiconductors & Semiconductor Equipment (1.9%) | |||||||||||
| ASML Holding N.V., N.Y. Registered Shares | 4,247 | 96,789 | |||||||||
| Intel Corp. | 15,560 | 345,276 | |||||||||
| Intersil Corp., Class A | 3,990 | 96,279 | |||||||||
| MEMC Electronic Materials, Inc. (a) | 3,456 | 159,702 | |||||||||
| Texas Instruments, Inc. | 10,670 | 260,134 | |||||||||
| 958,180 | |||||||||||
| Software (4.6%) | |||||||||||
| Advent Software, Inc. (a) | 3,540 | 154,132 | |||||||||
| Amdocs Ltd. (a) | 5,730 | 174,249 | |||||||||
| Concur Technologies, Inc. (a) | 1,320 | 54,410 | |||||||||
| McAfee, Inc. (a) | 5,100 | 167,025 | |||||||||
| Microsoft Corp. | 24,900 | 640,428 | |||||||||
| Nintendo Co., Ltd. | 290 | 139,844 | |||||||||
| Oracle Corp. (a) | 25,210 | 542,771 | |||||||||
| SAP AG, ADR | 3,220 | 186,148 | |||||||||
| UBISOFT Entertainment (a) | 1,100 | 108,723 | |||||||||
| VMware, Inc., Class A (a) | 2,930 | 105,041 | |||||||||
| 2,272,771 | |||||||||||
| 8,263,342 | |||||||||||
| Materials (5.6%) | |||||||||||
| Chemicals (2.3%) | |||||||||||
| Agrium, Inc. | 1,230 | 108,240 | |||||||||
| CF Industries Holdings, Inc. | 880 | 143,845 | |||||||||
| Ecolab, Inc. | 2,810 | 125,607 | |||||||||
| Monsanto Co. | 2,530 | 301,348 | |||||||||
| Potash Corp. of Saskatchewan, Inc. | 1,110 | 226,740 | |||||||||
| Syngenta AG, ADR | 3,890 | 225,970 | |||||||||
| 1,131,750 | |||||||||||
See Accompanying Notes to Financial Statements.
12
CMG STRATEGIC EQUITY FUND
A Portfolio of Columbia Funds Institutional Trust
SCHEDULE OF INVESTMENTS
| Shares | Value | ||||||||||
| Common Stocks (continued) | |||||||||||
| Metals & Mining (3.3%) | |||||||||||
| Alcoa, Inc. | 5,590 | $ | 188,662 | ||||||||
| ArcelorMittal, N.Y. Registered Shares | 4,150 | 362,793 | |||||||||
| Cia Vale do Rio Doce, ADR | 8,360 | 251,051 | |||||||||
| Freeport-McMoRan Copper & Gold, Inc. | 5,620 | 543,735 | |||||||||
| Nucor Corp. | 2,500 | 143,050 | |||||||||
| Thompson Creek Metals Co., Inc. (a) | 10,040 | 171,983 | |||||||||
| 1,661,274 | |||||||||||
| 2,793,024 | |||||||||||
| Telecommunication Services (2.4%) | |||||||||||
| Diversified Telecommunication Services (0.9%) | |||||||||||
| AT&T, Inc. | 9,144 | 281,727 | |||||||||
| Telekomunikasi Indonesia, ADR | 5,880 | 193,922 | |||||||||
| 475,649 | |||||||||||
| Wireless Telecommunication Services (1.5%) | |||||||||||
| American Tower Corp., Class A (a) | 3,850 | 161,315 | |||||||||
| China Mobile Ltd., ADR | 2,240 | 149,744 | |||||||||
| Millicom International Cellular SA | 1,320 | 102,142 | |||||||||
| Mobile TeleSystems OJSC, ADR | 2,200 | 157,080 | |||||||||
| Philippine Long Distance Telephone Co., ADR | 2,730 | 155,200 | |||||||||
| 725,481 | |||||||||||
| 1,201,130 | |||||||||||
| Utilities (3.5%) | |||||||||||
| Electric Utilities (2.9%) | |||||||||||
| Entergy Corp. | 3,040 | 325,037 | |||||||||
| Exelon Corp. | 5,450 | 428,479 | |||||||||
| FirstEnergy Corp. | 4,190 | 308,175 | |||||||||
| FPL Group, Inc. | 5,580 | 360,077 | |||||||||
| 1,421,768 | |||||||||||
| Multi-Utilities (0.6%) | |||||||||||
| Public Service Enterprise Group, Inc. | 7,110 | 297,198 | |||||||||
| 1,718,966 | |||||||||||
| Total Common Stocks (Cost of $42,265,821) | 48,927,225 | ||||||||||
See Accompanying Notes to Financial Statements.
13
CMG STRATEGIC EQUITY FUND
A Portfolio of Columbia Funds Institutional Trust
SCHEDULE OF INVESTMENTS
| Par | Value | ||||||||||
| Short-Term Obligation (1.0%) | |||||||||||
| Repurchase agreement with Fixed Income Clearing Corp, dated 07/31/08, due 08/01/08 at 1.990%, collateralized by a U.S. Treasury Obligation maturing 02/28/11, market value $477,000 (repurchase proceeds $465,026) | $ | 465,000 | $ | 465,000 | |||||||
| Total Short-Term Obligation (Cost of $465,000) | 465,000 | ||||||||||
| Total Investments (99.9%) (Cost of $42,730,821)(b) | 49,392,225 | ||||||||||
| Other Assets & Liabilities, Net (0.1%) | 73,953 | ||||||||||
| Net Assets (100.0%) | $ | 49,466,178 | |||||||||
Notes to Schedule of Investments:
(a) Non-income producing security.
(b) Cost for federal income tax purposes is $42,859,113.
At July 31, 2008, the Fund held investments in the following sectors:
| Sector (Unaudited) | % of Net Assets | ||||||
| Information Technology | 16.7 | ||||||
| Energy | 15.0 | ||||||
| Financials | 14.8 | ||||||
| Health Care | 12.0 | ||||||
| Industrials | 11.7 | ||||||
| Consumer Staples | 8.7 | ||||||
| Consumer Discretionary | 8.5 | ||||||
| Materials | 5.6 | ||||||
| Utilities | 3.5 | ||||||
| Telecommunication Services | 2.4 | ||||||
| 98.9 | |||||||
| Short-Term Obligation | 1.0 | ||||||
| Other Assets & Liabilities, Net | 0.1 | ||||||
| 100.0 | |||||||
| Acronym | Name | ||||||
| ADR | American Depositary Receipt | ||||||
See Accompanying Notes to Financial Statements.
14
CMG STRATEGIC EQUITY FUND
A Portfolio of Columbia Funds Institutional Trust
STATEMENT OF ASSETS AND LIABILITIES
July 31, 2008
| ASSETS: | |||||||
| Investments, at identified cost | $ | 42,730,821 | |||||
| Investments, at value | $ | 49,392,225 | |||||
| Cash | 16,873 | ||||||
| Foreign currency (cost of $29,090) | 29,117 | ||||||
| Receivable for: | |||||||
| Investments sold | 743,674 | ||||||
| Interest | 26 | ||||||
| Dividends | 55,742 | ||||||
| Foreign tax reclaims | 1,147 | ||||||
| Expense reimbursement due from investment advisor | 15,227 | ||||||
| Trustees' deferred compensation plan | 21,547 | ||||||
| Other assets | 438 | ||||||
| Total Assets | 50,276,016 | ||||||
| LIABILITIES: | |||||||
| Payable for: | |||||||
| Investments purchased | 700,943 | ||||||
| Investment advisory fee | 17,481 | ||||||
| Transfer agent fee | 15 | ||||||
| Trustees' fees | 887 | ||||||
| Audit fee | 33,101 | ||||||
| Custody fee | 6,442 | ||||||
| Reports to shareholders | 17,852 | ||||||
| Chief compliance officer expenses | 62 | ||||||
| Trustees' deferred compensation plan | 21,547 | ||||||
| Other liabilities | 11,508 | ||||||
| Total Liabilities | 809,838 | ||||||
| NET ASSETS | $ | 49,466,178 | |||||
| NET ASSETS CONSIST OF: | |||||||
| Paid-in capital | $ | 45,319,475 | |||||
| Undistributed net investment income | 240,877 | ||||||
| Accumulated net realized loss | (2,755,725 | ) | |||||
| Net unrealized appreciation on: | |||||||
| Investments | 6,661,404 | ||||||
| Foreign currency translations | 147 | ||||||
| NET ASSETS | $ | 49,466,178 | |||||
| Shares of capital stock outstanding | 25,540,176 | ||||||
| Net asset value, offering and redemption price per share | $ | 1.94 | |||||
See Accompanying Notes to Financial Statements.
15
CMG STRATEGIC EQUITY FUND
A Portfolio of Columbia Funds Institutional Trust
STATEMENT OF OPERATIONS
| For the Year Ended July 31, 2008 | |||||||
| NET INVESTMENT INCOME: | |||||||
| Income: | |||||||
| Dividends | $ | 754,842 | |||||
| Interest | 27,467 | ||||||
| Foreign withholding tax | (13,361 | ) | |||||
| Total Investment Income | 768,948 | ||||||
| Expenses: | |||||||
| Investment advisory fee | 192,623 | ||||||
| Transfer agent fee | 123 | ||||||
| Trustees' fees | 14,787 | ||||||
| Pricing and bookkeeping fees | 1,147 | ||||||
| Custody fee | 25,892 | ||||||
| Audit fee | 45,752 | ||||||
| Reports to shareholders | 32,460 | ||||||
| Chief compliance officer expenses | 536 | ||||||
| Other expenses | 38,717 | ||||||
| Expenses before interest expense | 352,037 | ||||||
| Interest expense | 142 | ||||||
| Total Expenses | 352,179 | ||||||
| Fees and expenses waived or reimbursed by investment advisor | (159,367 | ) | |||||
| Custody earnings credit | (47 | ) | |||||
| Net Expenses | 192,765 | ||||||
| Net Investment Income | 576,183 | ||||||
| NET REALIZED AND UNREALIZED GAIN (LOSS) ON INVESTMENTS AND FOREIGN CURRENCY: | |||||||
| Net realized loss on: | |||||||
| Investments | (1,673,365 | ) | |||||
| Foreign currency transactions | (4,454 | ) | |||||
| Net realized loss | (1,677,819 | ) | |||||
| Net change in unrealized appreciation (depreciation) on: | |||||||
| Investments | (1,114,555 | ) | |||||
| Foreign currency translations | 207 | ||||||
| Net change in unrealized appreciation (depreciation) | (1,114,348 | ) | |||||
| Net Loss | (2,792,167 | ) | |||||
| NET DECREASE RESULTING FROM OPERATIONS | $ | (2,215,984 | ) | ||||
See Accompanying Notes to Financial Statements.
16
CMG STRATEGIC EQUITY FUND
A Portfolio of Columbia Funds Institutional Trust
STATEMENT OF CHANGES IN NET ASSETS
| Year Ended July 31, | |||||||||||
| Increase (Decrease) in Net Assets | 2008 | 2007 | |||||||||
| Operations: | |||||||||||
| Net investment income | $ | 576,183 | $ | 1,025,687 | |||||||
| Net realized gain (loss) on investments and foreign currency transactions | (1,677,819 | ) | 27,291,836 | ||||||||
| Net change in unrealized appreciation (depreciation) on investments and foreign currency translations | (1,114,348 | ) | (15,030,448 | ) | |||||||
| Net increase (decrease) resulting from operations | (2,215,984 | ) | 13,287,075 | ||||||||
| Distributions to shareholders: | |||||||||||
| From net investment income | (680,722 | ) | (611,244 | ) | |||||||
| From net realized gain | (14,916,823 | ) | (14,482,350 | ) | |||||||
| Total distributions to shareholders | (15,597,545 | ) | (15,093,594 | ) | |||||||
| Share transactions: | |||||||||||
| Subscriptions | 10,415,789 | 4,636,132 | |||||||||
| Distributions reinvested | 14,891,743 | 14,633,613 | |||||||||
| Redemptions | (4,133,617 | ) | (91,898,054 | ) | |||||||
| Net increase (decrease) in share transactions | 21,173,915 | (72,628,309 | ) | ||||||||
| Net increase (decrease) in net assets | 3,360,386 | (74,434,828 | ) | ||||||||
| NET ASSETS: | |||||||||||
| Beginning of period | 46,105,792 | 120,540,620 | |||||||||
| End of period | $ | 49,466,178 | $ | 46,105,792 | |||||||
| Undistributed net investment income | $ | 240,877 | $ | 378,288 | |||||||
| Changes in shares: | |||||||||||
| Subscriptions | 4,862,073 | 1,499,855 | |||||||||
| Distributions reinvested | 6,894,326 | 5,134,601 | |||||||||
| Redemptions | (1,511,583 | ) | (29,820,686 | ) | |||||||
| Net increase (decrease) | 10,244,816 | (23,186,230 | ) | ||||||||
See Accompanying Notes to Financial Statements.
17
CMG STRATEGIC EQUITY FUND
A Portfolio of Columbia Funds Institutional Trust
NOTES TO FINANCIAL STATEMENTS
July 31, 2008
Note 1. Organization
CMG Strategic Equity Fund (the "Fund"), a series of Columbia Funds Institutional Trust (the "Trust"), is a diversified portfolio. The Trust is a Massachusetts business trust registered under the Investment Company Act of 1940, as amended, as an open-end management investment company.
Shares of the Fund are available for purchase by institutional investors investing directly in the Fund, by institutional investors investing in the Fund as an advisory client of Columbia Management Advisors, LLC ("Columbia"), the Fund's investment advisor, and by institutional investors investing in the Fund as an advisory client of U.S. Trust, Bank of America Private Wealth Management. Please see the Fund's prospectus for further details, including applicable investment minimums.
Investment objective. The Fund seeks to provide investors long-term growth of capital and total returns greater than those of the market over time.
Fund shares. The Fund may issue an unlimited number of shares of beneficial interest which are offered continuously at net asset value.
Note 2. Significant accounting policies
The preparation of financial statements in accordance with accounting principles generally accepted in the United States of America ("GAAP") requires management to make certain estimates and assumptions that affect the reported amounts of assets and liabilities, the disclosure of contingent assets and liabilities at the date of the financial statements and the reported amounts of revenue and expenses during the reporting period. Actual results could differ from those estimates. The following is a summary of significant accounting policies consistently followed by the Fund in the preparation of its financial statements.
Security valuation. Equity securities are valued at the last sale price on the principal exchange on which they trade, except for securities traded on the NASDAQ, which are valued at the NASDAQ official close price. Unlisted securities or listed securities for which there were no sales during the day are valued at the closing bid price on such exchanges or over-the-counter markets.
Short-term debt obligations maturing within 60 days are valued at amortized cost, which approximates market value.
Foreign securities are generally valued at the last sale price on the foreign exchange or market on which they trade. If any foreign share prices are not readily available as a result of limited share activity, the securities are valued at the last sale price of the local shares in the principal market in which such securities are normally traded.
Generally, trading in foreign securities is substantially completed each day at various times prior to the close of the New York Stock Exchange ("NYSE"). The values of such securities used in computing the net asset value of the Fund's shares are determined as of such times. Foreign currency exchange rates are generally determined at 4:00 p.m. Eastern (U.S.) time. Occasionally, events affecting the values of such foreign securities and such exchange rates may occur between the times at which they are determined and the close of the customary trading session of the NYSE, which would not be reflected in the computation of the Fund's net asset value. If events materially affecting the values of
18
CMG STRATEGIC EQUITY FUND
A Portfolio of Columbia Funds Institutional Trust
NOTES TO FINANCIAL STATEMENTS
July 31, 2008
such foreign securities occur and it is determined that market quotations are not reliable, then these foreign securities will be valued at their fair value using procedures approved by the Board of Trustees.
Investments for which market quotations are not readily available, or that have quotations which management believes are not reliable, are valued at fair value as determined in good faith under consistently applied procedures established by and under the general supervision of the Board of Trustees. If a security is valued at fair value, such value is likely to be different from the last quoted market price for the security.
In September 2006, Statement of Financial Accounting Standards No. 157, Fair Value Measurements ("SFAS 157"), was issued. SFAS 157 is effective for fiscal years beginning after November 15, 2007. SFAS 157 defines fair value, establishes a framework for measuring fair value and expands disclosures about fair value measurements. Management is evaluating the impact the application of SFAS 157 will have on the Fund's financial statement disclosures.
Security transactions. Security transactions are accounted for on the trade date. Cost is determined and gains (losses) are based upon the specific identification method for both financial statement and federal income tax purposes.
In March 2008, Statement of Financial Accounting Standards No. 161, Disclosures about Derivative Instruments and Hedging Activities—an amendment of FASB Statement No. 133 ("SFAS 161"), was issued. SFAS 161 is effective for fiscal years beginning after November 15, 2008. SFAS 161 requires additional discussion about the reporting entity's derivative instruments and hedging activities, by providing for qualitative disclosures about the objectives and strategies for using derivatives, quantitative data about the fair value of and gains and losses on derivative contracts, and details of credit-risk-related contingent features in their hedged positions. Management is evaluating the impact the application of SFAS 161 will have on the Fund's financial statement disclosures.
Repurchase agreements. The Fund may engage in repurchase agreement transactions with institutions that Columbia has determined are creditworthy. The Fund, through its custodian, receives delivery of the underlying securities collateralizing a repurchase agreement. Columbia is responsible for determining that the collateral is at least equal, at all times, to the value of the repurchase obligation including interest. A repurchase agreement transaction involves certain risks in the event of default or insolvency of the counterparty. These risks include possible delays in or restrictions on the Fund's ability to dispose of the underlying securities and a possible decline in the value of the underlying securities during the period while the Fund seeks to assert its rights.
Income recognition. Interest income is recorded on the accrual basis. Corporate actions and dividend income are recorded on the ex-date, except for certain foreign securities which are recorded as soon after the ex-date as the Fund becomes aware of such, net of any non-reclaimable tax withholdings. Distributions received from real estate investment trusts (REITs) in excess of their income are recorded as a reduction of the cost of the related investments and/or realized gains as applicable. If the Fund no longer owns the applicable securities, any distributions received in excess of income are recorded as realized gains.
Foreign currency transactions. The values of all assets and liabilities quoted in foreign currencies are translated into U.S. dollars at that day's exchange rates. Net realized and unrealized gains (losses) on foreign currency transactions include gains (losses) arising from the fluctuation in exchange rates between trade and settlement dates on securities transactions, gains (losses) arising from the disposition of foreign currency and currency gains (losses) between the accrual and payment dates on dividends, interest income and foreign withholding taxes.
For financial statement purposes, the Fund does not distinguish that portion of gains (losses) on investments which is due to changes in foreign exchange rates from that which is due to changes in market prices of the investments. Such
19
CMG STRATEGIC EQUITY FUND
A Portfolio of Columbia Funds Institutional Trust
NOTES TO FINANCIAL STATEMENTS
July 31, 2008
fluctuations are included with the net realized and unrealized gains (losses) on investments on the Statement of Operations.
Expenses. General expenses of the Trust are allocated to the Fund and the other series of the Trust based upon relative net assets or other expense allocation methodologies determined by the nature of the expense. Expenses directly attributable to the Fund are charged to the Fund.
Federal income tax status. The Fund intends to qualify each year as a "regulated investment company" under Subchapter M of the Internal Revenue Code, as amended, and will distribute substantially all of its taxable income, if any, for its tax year, and as such will not be subject to federal income taxes. In addition, the Fund intends to distribute in each calendar year substantially all of its net investment income, capital gains and certain other amounts, if any, such that the Fund should not be subject to federal excise tax. Therefore, no federal income or excise tax provision is recorded.
Distributions to shareholders. Distributions to shareholders are recorded on the ex-date. Dividends from net investment income, if any, are declared and distributed annually. Net realized capital gains, if any, are distributed at least annually. Income distributions and capital gain distributions are determined in accordance with federal income tax regulations which may differ from GAAP.
Indemnification. In the normal course of business, the Fund enters into contracts that contain a variety of representations and warranties and which provide general indemnities. The Fund's maximum exposure under these arrangements is unknown because this would involve future claims against the Fund. Also, under the Trust's organizational documents and by contract, the Trustees and officers of the Trust are indemnified against certain liabilities that may arise out of actions relating to their duties to the Trust. However, based on experience, the Fund expects the risk of loss due to these representations, warranties and indemnities to be minimal.
Note 3. Federal tax information
The timing and character of income and capital gain distributions are determined in accordance with income tax regulations, which may differ from GAAP. Reclassifications are made to the Fund's capital accounts for permanent tax differences to reflect income and gains available for distribution (or available capital loss carryforwards) under income tax regulations.
For the year ended July 31, 2008, permanent book and tax basis differences resulting primarily from differing treatments for Section 988 foreign currency gains (losses) and distributions were identified and reclassified among the components of the Fund's net assets as follows:
| Undistributed Net Investment Income | Accumulated Net Realized Loss | Paid-In Capital | |||||||||
| $ | (32,872 | ) | $ | 32,872 | $ | - | |||||
Net investment income and net realized gains (losses), as disclosed on the Statement of Operations, and net assets were not affected by this reclassification.
20
CMG STRATEGIC EQUITY FUND
A Portfolio of Columbia Funds Institutional Trust
NOTES TO FINANCIAL STATEMENTS
July 31, 2008
The tax character of distributions paid during the years ended July 31, 2008 and July 31, 2007 was as follows:
| July 31, 2008 | July 31, 2007 | ||||||||||
| Distributions paid from: | |||||||||||
| Ordinary Income* | $ | 3,560,000 | $ | 1,412,437 | |||||||
| Long-Term Capital Gains | 12,037,545 | 13,681,157 | |||||||||
*For tax purposes short-term capital gain distributions, if any, are considered ordinary income distributions.
As of July 31, 2008, the components of distributable earnings on a tax basis were as follows:
| Undistributed Ordinary Income | Undistributed Long-term Capital Gains | Net Unrealized Appreciation* | |||||||||
| $ | 266,086 | $ | - | $ | 6,533,112 | ||||||
*The differences between book-basis and tax-basis net unrealized depreciation are primarily due to deferral of losses from wash sales.
Unrealized appreciation and depreciation at July 31, 2008, based on cost of investments for federal income tax purposes, were:
| Unrealized appreciation | $ | 8,512,107 | |||||
| Unrealized depreciation | (1,978,995 | ) | |||||
| Net unrealized appreciation | $ | 6,533,112 | |||||
Under current tax rules, certain currency and capital losses realized after October 31 may be deferred and treated as occurring on the first day of the following fiscal year. As of July 31, 2008, post-October capital losses of $2,627,433 attributed to security transactions were deferred to August 1, 2008.
The Fund adopted Financial Accounting Standards Board ("FASB") Interpretation No. 48, Accounting for Uncertainty in Income Taxes—an Interpretation of FASB Statement No. 109 ("FIN 48") effective January 31, 2008. FIN 48 requires management to determine whether a tax position of the Fund is more likely than not to be sustained upon examination by the applicable taxing authority, including resolution of any related appeals or litigation processes, based on the technical merits of the position. The tax benefit to be recognized is measured as the largest amount of benefit that is greater than fifty percent likely of being realized upon ultimate settlement. FIN 48 was applied to all existing tax positions upon initial adoption. Management has evaluated the known implications of FIN 48 on its computation of net assets for the Fund. As a result of this evaluation, management has concluded that FIN 48 did not have any effect on the Fund's financial statements and no cumulative effect adjustments were recorded. However, management's conclusions regarding FIN 48 may be subject to review and adjustment at a later date based on factors including, but not limited to, further implementation guidance from the FASB, new tax laws, regulations, and administrative interpretations (including relevant court decisions). The Fund's federal tax returns for the prior three fiscal years remain subject to examination by the Internal Revenue Service. The Fund is not aware of any tax positions for which it is reasonably possible that the total amounts of unrecognized tax benefits will significantly change in the next twelve months.
21
CMG STRATEGIC EQUITY FUND
A Portfolio of Columbia Funds Institutional Trust
NOTES TO FINANCIAL STATEMENTS
July 31, 2008
Note 4. Fees and compensation paid to affiliates
Investment advisory fee. Columbia, an indirect, wholly owned subsidiary of Bank of America Corporation ("BOA"), provides investment advisory, administrative and other services to the Fund. In rendering investment advisory services to the Fund, Columbia may use the portfolio management and research resources of Columbia Management Pte. Ltd., an affiliate of Columbia. Columbia receives a monthly investment advisory fee at the annual rate of 0.40% of the Fund's average daily net assets.
In addition to the annual Fund operating expenses, each shareholder enters into a written administrative services agreement with Columbia or its affiliate. Pursuant to this Agreement, Columbia or its affiliate will provide the shareholder specialized reports regarding the Fund, performance of the shareholder's investments and market conditions and economic indicators. For such services, each shareholder (and not the Fund) will pay an annual fee calculated as a percentage of the shareholder's net assets in the Fund. The annual fee is 0.20% on the first $25 million of the shareholder's net assets in the Fund, and no fee payable on net assets in excess of $25 million.
Pricing and bookkeeping fees. The Fund has entered into a Financial Reporting Services Agreement (the "Financial Reporting Services Agreement") with State Street Bank & Trust Company ("State Street") and Columbia pursuant to which State Street provides financial reporting services to the Fund. The Fund has also entered into an Accounting Services Agreement (collectively with the Financial Reporting Services Agreement, the "State Street Agreements") with State Street and Columbia pursuant to which State Street provides accounting services to the Fund.
The Fund has entered into a Pricing and Bookkeeping Oversight and Services Agreement (the "Services Agreement") with Columbia. Under the Services Agreement, Columbia provides services related to Fund expenses and the requirements of the Sarbanes-Oxley Act of 2002, and provides oversight of the accounting and financial reporting services provided by State Street.
The pricing and bookkeeping fees for the Fund are payable by Columbia. Prior to January 1, 2008, the Fund reimbursed Columbia for services related to the requirements of the Sarbanes-Oxley Act of 2002.
Transfer agent fee. Columbia Management Services, Inc. (the "Transfer Agent"), an affiliate of Columbia and an indirect, wholly owned subsidiary of BOA, provides shareholder services to the Fund and has contracted with Boston Financial Data Services ("BFDS") to serve as sub-transfer agent. The Transfer Agent is entitled to receive a fee for its services, paid monthly, at the annual rate of $17.34 per open account plus reimbursement of certain sub-transfer agent fees paid by the Transfer Agent (exclusive of BFDS fees), calculated based on assets held in omnibus accounts and intended to recover the cost of payments to other parties (including affiliates of BOA) for services to those accounts. Prior to November 1, 2007, the annual rate was $17.00 per open account. The Transfer Agent pays the fees of BFDS for services as sub-transfer agent and is not entitled to reimbursement for such fees from the Fund.
The Transfer Agent may also retain, as additional compensation for its services, fees for wire, telephone and redemption orders, IRA trustee agent fees and account transcript fees due to the Transfer Agent from shareholders of the Fund and credits (net of bank charges) earned with respect to balances in accounts the Transfer Agent maintains in connection with its services to the Fund.
Fee waivers and expense reimbursements. Columbia has contractually agreed to waive fees and/or reimburse the Fund through November 30, 2008, for certain expenses so that the expenses incurred by the Fund (exclusive of brokerage commissions, interest, taxes and extraordinary expenses, but inclusive of custodial charges relating to overdrafts, if
22
CMG STRATEGIC EQUITY FUND
A Portfolio of Columbia Funds Institutional Trust
NOTES TO FINANCIAL STATEMENTS
July 31, 2008
any), after giving effect to any balance credits from the Fund's custodian, will not exceed 0.40% of the Fund's average daily net assets. There is no guarantee that this arrangement will continue after November 30, 2008.
Fees paid to officers and trustees. All officers of the Fund are employees of Columbia or its affiliates and, with the exception of the Fund's Chief Compliance Officer, receive no compensation from the Fund. The Board of Trustees has appointed a Chief Compliance Officer to the Fund in accordance with federal securities regulations. The Fund, along with other affiliated funds, pays its pro-rata share of the expenses associated with the Chief Compliance Officer. The Fund's expenses for the Chief Compliance Officer will not exceed $15,000 per year.
The Trust's eligible Trustees may participate in a deferred compensation plan which may be terminated at any time. Obligations of the plan will be paid solely out of the Fund's assets.
Note 5. Custody credits
The Fund has an agreement with its custodian bank under which custody fees may be reduced by balance credits. These credits are recorded as a reduction of total expenses on the Statement of Operations. The Fund could have invested a portion of the assets utilized in connection with the expense offset arrangement in an income-producing asset if it had not entered into such an agreement.
Note 6. Portfolio information
For the year ended July 31, 2008, the cost of purchases and proceeds from sales of securities, excluding short-term obligations, were $54,435,615 and $48,058,265, respectively.
Note 7. Line of credit
The Fund and other affiliated funds participate in a $350,000,000 committed, unsecured revolving line of credit and a $150,000,000 uncommitted, unsecured line of credit, both provided by State Street. Borrowings are available for short-term liquidity or temporary or emergency purposes.
Interest on the committed line of credit is charged to each participating fund based on the fund's borrowings at a rate per annum equal to the Federal Funds Rate plus 0.50%. In addition, a commitment fee of 0.10% per annum is accrued and apportioned among the participating funds pro rata based on their relative net assets. Effective September 17, 2007, interest on the uncommitted line of credit is charged to each participating fund based on the fund's borrowings at a rate per annum equal to the Federal Funds Rate plus 0.375%. Prior to September 17, 2007, interest on the uncommitted line of credit was charged to each participating fund based on the fund's borrowings at a rate per annum equal to the Federal Funds Rate plus 0.50%. State Street charges an annual operations agency fee of $40,000 for the committed line of credit and may charge an annual administration fee of $15,000 for the uncommitted line of credit. The commitment f ee, the operations agency fee and the administration fee are accrued and apportioned among the participating funds pro rata based on their relative net assets.
For the year ended July 31, 2008, the average daily loan balance outstanding on days where borrowing existed was $1,000,000 at a weighted average interest rate of 5.125%.
23
CMG STRATEGIC EQUITY FUND
A Portfolio of Columbia Funds Institutional Trust
NOTES TO FINANCIAL STATEMENTS
July 31, 2008
Note 8. Shares of beneficial interest
As of July 31, 2008, 97.75% of the shares outstanding of the Fund were beneficially owned by one participant account over which BOA and/or any of its affiliates had either sole or joint investment discretion. Subscription and redemption activity of this account may have a significant effect on the Fund.
Note 9. Significant risks and contingencies
Sector focus risk. The Fund may focus its investments in certain sectors, subjecting it to greater risk than a fund that is less focused.
Foreign securities risk. There are certain additional risks involved when investing in foreign securities. These risks may involve foreign currency exchange rate fluctuations, adverse political and economic developments and the possible prevention of currency exchange or other foreign governmental laws or restrictions. In addition, the liquidity of foreign securities may be more limited than that of domestic securities.
Legal proceedings. The Fund is not named as party to any regulatory proceedings or litigation.
On February 9, 2005, Columbia Management Advisors, Inc. (which has since merged into Banc of America Capital Management, LLC (now named Columbia Management Advisors, LLC)) ("Columbia") and Columbia Funds Distributor, Inc. (which has been renamed Columbia Management Distributors, Inc.) (the "Distributor") (collectively, the "Columbia Group") entered into an Assurance of Discontinuance with the New York Attorney General ("NYAG") (the "NYAG Settlement") and consented to the entry of a cease-and-desist order by the Securities and Exchange Commission ("SEC") (the "SEC Order") on matters relating to mutual fund trading.
Under the terms of the SEC Order, the Columbia Group agreed, among other things, to: pay $70 million in disgorgement and $70 million in civil money penalties; cease and desist from violations of the antifraud provisions and certain other provisions of the federal securities laws; maintain certain compliance and ethics oversight structures; retain an independent consultant to review the Columbia Group's applicable supervisory, compliance, control and other policies and procedures; and retain an independent distribution consultant (see below). The Columbia Funds have also voluntarily undertaken to implement certain governance measures designed to maintain the independence of their boards of trustees. The NYAG Settlement also, among other things, requires Columbia and its affiliates to reduce management fees for certain Columbia Funds (including the former Nations Funds) and other mutual funds collectively by $32 million per year f or five years, for a projected total of $160 million in management fee reductions.
Pursuant to the procedures set forth in the SEC Order, the $140 million in settlement amounts described above is being distributed in accordance with a distribution plan that was developed by an independent distribution consultant and approved by the SEC on April 6, 2007. Distributions under the distribution plan began in late June 2007.
A copy of the SEC Order is available on the SEC website at http://www.sec.gov. A copy of the NYAG Settlement is available as part of the Bank of America Corporation Form 8-K filing on February 10, 2005.
In connection with the events described above, various parties have filed suit against certain funds, the Trustees of the Columbia Funds, FleetBoston Financial Corporation and its affiliated entities and/or Bank of America and its affiliated entities.
24
CMG STRATEGIC EQUITY FUND
A Portfolio of Columbia Funds Institutional Trust
NOTES TO FINANCIAL STATEMENTS
July 31, 2008
On February 20, 2004, the Judicial Panel on Multidistrict Litigation transferred these cases and cases against other mutual fund companies based on similar allegations to the United States District Court in Maryland for consolidated or coordinated pretrial proceedings (the "MDL"). Subsequently, additional related cases were transferred to the MDL. On September 29, 2004, the plaintiffs in the MDL filed amended and consolidated complaints. One of these amended complaints is a putative class action that includes claims under the federal securities laws and state common law, and that names Columbia, the Distributor, the Trustees of the Columbia Funds, Bank of America Corporation and others as defendants. Another of the amended complaints is a derivative action purportedly on behalf of the Columbia Funds that asserts claims under federal securities laws and state common law.
On February 25, 2005, Columbia and other defendants filed motions to dismiss the claims in the pending cases. On March 1, 2006, for reasons stated in the court's memoranda dated November 3, 2005, the United States District Court for the District of Maryland granted in part and denied in part the defendants' motions to dismiss. The court dismissed all of the class action claims pending against the Columbia Funds Trusts. As to Columbia and the Distributor, the claims under the Securities Act of 1933, the claims under Sections 34(b) and 36(a) of the Investment Company Act of 1940 ("ICA") and the state law claims were dismissed. The claims under Sections 10(b) and 20(a) of the Securities Exchange Act of 1934 and claims under Section 36(b) of the ICA were not dismissed.
On March 21, 2005, a purported class action was filed in Massachusetts state court alleging that certain conduct, including market timing, entitled Class B shareholders in certain Columbia funds to an exemption from contingent deferred sales charges upon early redemption ("the CDSC Lawsuit"). The CDSC Lawsuit was removed to federal court in Massachusetts and transferred to the MDL.
On September 14, 2007, the plaintiffs and the Columbia defendants named in the MDL, including the Columbia Funds, entered into a stipulation of settlement with respect to all Columbia-related claims in the MDL described above, including the CDSC Lawsuit. The settlement is subject to court approval.
In 2004, the Columbia Funds' adviser and distributor and certain affiliated entities and individuals were named as defendants in certain purported shareholder class and derivative actions making claims, including claims under the Investment Company and the Investment Advisers Acts of 1940 and state law. Certain Columbia Funds were named as nominal defendants. The suits allege, inter alia, that the fees and expenses paid by the funds are excessive and that the advisers and their affiliates inappropriately used fund assets to distribute the funds and for other improper purposes. On March 2, 2005, the actions were consolidated in the Massachusetts federal court as In re Columbia Entities Litigation. The plaintiffs filed a consolidated amended complaint on June 9, 2005. On November 30, 2005, the judge dismissed all claims by plaintiffs and entered final judgment in favor of the defendants. The plaintiffs appealed to the United States Court of Appeals for the First Circuit on December 30, 2005. A stipulation and settlement agreement dated January 19, 2007 was filed in the First Circuit on February 14, 2007, with a joint stipulation of dismissal and motion for remand to obtain district court approval of the settlement. That joint motion was granted and the appeal was dismissed. On March 6, 2007, the case was remanded to the District Court. The settlement, approved by the District Court on September 18, 2007, became effective October 19, 2007. Pursuant to the settlement, the funds' adviser and/or its affiliates made certain payments, including plaintiffs' attorneys' fees and costs of notice to class members.
25
Report of Independent Registered Public Accounting Firm
To the Trustees of Columbia Funds Institutional Trust and the Shareholders of CMG Strategic Equity Fund
In our opinion, the accompanying statement of assets and liabilities, including the schedule of investments, and the related statements of operations and of changes in net assets and the financial highlights present fairly, in all material respects, the financial position of CMG Strategic Equity Fund (the "Fund") (a series of Columbia Funds Institutional Trust) at July 31, 2008, the results of its operations for the year then ended, the changes in its net assets for each of the two years in the period then ended and the financial highlights for each of the five years in the period then ended, in conformity with accounting principles generally accepted in the United States of America. These financial statements and financial highlights (hereafter referred to as "financial statements") are the responsibility of the Fund's management. Our responsibility is to express an opinion on these financial statements based on our audits. We conducted our audits of these financial statements in accordance with the standards of the Public Company Accounting Oversight Board (United States). Those standards require that we plan and perform the audit to obtain reasonable assurance about whether the financial statements are free of material misstatement. An audit includes examining, on a test basis, evidence supporting the amounts and disclosures in the financial statements, assessing the accounting principles used and significant estimates made by management, and evaluating the overall financial statement presentation. We believe that our audits, which included confirmation of securities at July 31, 2008 by correspondence with the custodian and brokers, provide a reasonable basis for our opinion.
PricewaterhouseCoopers LLP
Boston, Massachusetts
September 19, 2008
26
Federal Income Tax Information (Unaudited)
For the fiscal year ended July 31, 2008, the Fund designates long-term capital gains of $793,654.
27.88% of the ordinary income distributed by the Fund, for the year ended July 31, 2008, qualifies for the corporate dividends received deduction.
For non-corporate shareholders 31.88%, or the maximum amount allowable under the Jobs and Growth Tax Relief Reconciliation Act of 2003, of income earned by the Fund for the period August 1, 2007 to July 31, 2008 may represent qualified dividend income. Final information will be provided in your 2008 Form 1099-DIV.
27
Fund Governance
The Trustees serve terms of indefinite duration. The names, addresses and ages of the Trustees and officers of the Funds in Columbia Funds Institutional Trust, the year each was first elected or appointed to office, their principal business occupations during at least the last five years, the number of portfolios overseen by each Trustee and other directorships they hold are shown below. Each officer listed below serves as an officer of each Fund in the Columbia Funds Complex.
| Name, Address and Year of Birth, Position with Funds, Year First Elected or Appointed to Office | Principal Occupation(s) During Past Five Years, Number of Portfolios in Columbia Funds Complex Overseen by Trustee, Other Directorships Held | ||||||
| Independent Trustees | |||||||
| John D. Collins (Born 1938) c/o Columbia Management Advisors, LLC One Financial Center Boston, MA 02111 Trustee1 (since 2007) | Retired. Consultant, KPMG, LLP (accounting and tax firm) from July 1999 to June 2000; Partner, KPMG, LLP from March 1962 to June 1999. Oversees 77, Mrs. Fields Famous Brands LLC (consumer products); Suburban Propane Partners, L.P.; and Montpelier Re (underwriting firm) | ||||||
| Rodman L. Drake (Born 1943) c/o Columbia Management Advisors, LLC One Financial Center Boston, MA 02111 Trustee1 (since 2007) | Co-Founder of Baringo Capital LLC (private equity) since 2002; President, Continuation Investments Group, Inc. from 1997 to 2001. Oversees 77, Jackson Hewitt Tax Service Inc. (tax preparation services); Crystal Capital River Inc. (real estate investment trust); Student Loan Corporation (student loan provider); Celgene Corporation (global biotechnology company); Apex Silver Mines Ltd. (mining); and Hyperion Brookfield Total Return Fund, Inc. and Hyperion Brookfield Strategic Mortgage Income Fund, Inc. (exchange-traded funds) | ||||||
| Douglas A. Hacker (Born 1955) c/o Columbia Management Advisors, LLC One Financial Center Boston, MA 02111 Trustee (since 1996) | Independent business executive since May 2006; Executive Vice President—Strategy of United Airlines (airline) from December 2002 to May 2006; President of UAL Loyalty Services (airline marketing company) from September 2001 to December 2002; Executive Vice President and Chief Financial Officer of United Airlines from July 1999 to September 2001. Oversees 77, Nash Finch Company (food distributor); Aircastle Limited (aircraft leasing) | ||||||
| Janet Langford Kelly (Born 1957) c/o Columbia Management Advisors, LLC One Financial Center Boston, MA 02111 Trustee (since 1996) | Senior Vice President, General Counsel and Corporate Secretary, ConocoPhillips (integrated energy company) since September 2007; Deputy General Counsel—Corporate Legal Services, ConocoPhillips from August 2006 to August 2007; Partner, Zelle, Hofmann, Voelbel, Mason & Gette LLP (law firm) from March 2005 to July 2006; Adjunct Professor of Law, Northwestern University, from September, 2004 to June 2006; Director, UAL Corporation (airline) from February, 2006 to July 2006; Chief Administrative Officer and Senior Vice President, Kmart Holding Corporation (consumer goods), from September 2003 to March 2004; Executive Vice President—Corporate Development and Administration, General Counsel and Secretary, Kellogg Company (food manufacturer), from September 1999 to August 2003. Oversees 77, None | ||||||
| Charles R. Nelson (Born 1942) c/o Columbia Management Advisors, LLC One Financial Center Boston, MA 02111 Trustee (since 1981) | Professor of Economics, University of Washington, since January 1976; Ford and Louisa Van Voorhis Professor of Political Economy, University of Washington, since September 1993; Director, Institute for Economic Research, University of Washington from September 2001 to June 2003; Adjunct Professor of Statistics, University of Washington, since September 1980; Associate Editor, Journal of Money Credit and Banking, since September 1993; Consultant on econometric and statistical matters. Oversees 77, None | ||||||
28
Fund Governance (Continued)
| Name, Address and Year of Birth, Position with Funds, Year First Elected or Appointed to Office | Principal Occupation(s) During Past Five Years, Number of Portfolios in Columbia Funds Complex Overseen by Trustee, Other Directorships Held | ||||||
| Independent Trustees (Continued) | |||||||
| John J. Neuhauser (Born 1943) c/o Columbia Management Advisors, LLC One Financial Center Boston, MA 02111 Trustee (since 1985) | President, Saint Michael's College, since August 2007; University Professor, Boston College from November 2005 to August 2007; Academic Vice President and Dean of Faculties, Boston College from August 1999 to October, 2005. Oversees 77, Liberty All-Star Equity Fund and Liberty All-Star Growth Fund, Inc. (closed-end funds) | ||||||
| Jonathan Piel (Born 1938) c/o Columbia Management Advisors, LLC One Financial Center Boston, MA 02111 Trustee1 (since 2007) | Cable television producer and website designer; The Editor, Scientific American from 1984 to 1994; Vice President, Scientific American, Inc. from 1984 to 1994; Member, Advisory Board, Stone Age Institute, Bloomington, Indiana (research institute that explores the effect of technology on human evolution); Member, Board of Directors of the National Institute of Social Sciences, New York City; and Member, Board of Trustees of the William Alanson White Institute, New York City (institution for training psychoanalysts). Oversees 77, None | ||||||
| Patrick J. Simpson (Born 1944) c/o Columbia Management Advisors, LLC One Financial Center Boston, MA 02111 Trustee (since 2000) | Partner, Perkins Coie LLP (law firm). Oversees 77, None | ||||||
| Thomas C. Theobald (Born 1937) c/o Columbia Management Advisors, LLC One Financial Center Boston, MA 02111 Trustee and Chairman of the Board (since 1996) | Partner and Senior Advisor, Chicago Growth Partners (private equity investing) since September 2004; Managing Director, William Blair Capital Partners (private equity investing) from September 1994 to September 2004. Oversees 77, Anixter International (network support equipment distributor); Ventas, Inc. (real estate investment trust); Jones Lang LaSalle (real estate management services); Ambac Financial Group (financial guaranty insurance) | ||||||
| Anne-Lee Verville (Born 1945) c/o Columbia Management Advisors, LLC One Financial Center Boston, MA 02111 Trustee (since 1998) | Retired since 1997 (formerly General Manager—Global Education Industry (from 1994 to 1997), President—Application Systems Division (from 1991 to 1994), Chief Financial Officer—US Marketing & Services (from 1988 to 1991), and Chief Information Officer (from 1987 to 1988), IBM Corporation (computer and technology)). Oversees 77, None | ||||||
| Interested Trustee | |||||||
| William E. Mayer (Born 1940) c/o Columbia Management Advisors, LLC One Financial Center Boston, MA 02111 Trustee2 (since 1994) | Partner, Park Avenue Equity Partners (private equity) since February 1999; Dean and Professor, College of Business, University of Maryland from 1992 to 1997. Oversees 77, Lee Enterprises (print media), WR Hambrecht + Co. (financial service provider); BlackRock Kelso Capital Corporation (investment company) | ||||||
1 Messrs. Drake, Piel and Collins have served as directors/trustees of the Excelsior Funds since 1996, 1996 and 2005, respectively. The Excelsior Funds consisted of 27 portfolios managed by affiliates of Columbia Management Advisors, LLC. Effective December 12, 2007, the Board elected Messrs. Drake, Piel and Collins as Trustees of the Trust.
2 Mr. Mayer is an "interested person" (as defined in the Investment Company Act of 1940) by reason of his affiliation with WR Hambrecht + Co., a registered broker/dealer that may execute portfolio transactions for or engage in principal transactions with the Funds or other funds or accounts advised/managed by the Advisor or other Bank of America affiliates.
The Statement of Additional Information includes additional information about the Trustees of the Funds and is available, without charge, upon request by calling 1-800-426-3750.
29
Fund Governance (Continued)
Officers
| Name, Address and Year of Birth, Position with Columbia Funds, Year First Elected or Appointed to Office | Principal Occupation(s) During Past Five Years | ||||||
| Christopher L. Wilson (Born 1957) One Financial Center Boston, MA 02111 President (since 2004) | President—Columbia Funds, since October 2004; Managing Director—Columbia Management Advisors, LLC, since September 2005; Senior Vice President—Columbia Management Distributors, Inc., since January 2005; Director—Columbia Management Services, Inc., since January 2005; Director—Bank of America Global Liquidity Funds, plc and Banc of America Capital Management (Ireland), Limited, since May 2005; Director—FIM Funding, Inc., since January 2005; President and Chief Executive Officer—CDC IXIS AM Services, Inc. (investment management), from September 1998 through August 2004; and a senior officer or director of various other Bank of America affiliated entities, including other registered and unregistered funds. | ||||||
| James R. Bordewick, Jr. (Born 1959) One Financial Center Boston, MA 02111 Senior Vice President, Secretary and Chief Legal Officer (since 2006) | Associate General Counsel, Bank of America since April 2005; Senior Vice President and Associate General Counsel, MFS Investment Management (investment management) prior to April 2005. | ||||||
| J. Kevin Connaughton (Born 1964) One Financial Center Boston, MA 02111 Senior Vice President and Chief Financial Officer (since 2000) | Managing Director of Columbia Management Advisors, LLC since December 2004; Treasurer—Columbia Funds, from October 2003 to May 2008; Treasurer—the Liberty Funds, Stein Roe Funds and Liberty All-Star Funds, December 2000—December 2006; Senior Vice President—Columbia Management Advisors, LLC, from April 2003 to December 2004; President—Columbia Funds, Liberty Funds and Stein Roe Funds, February 2004 to October 2004; Treasurer—Galaxy Funds, September 2002 to December 2005; Treasurer, December 2002 to December 2004, and President, February 2004 to December 2004— Columbia Management Multi-Strategy Hedge Fund, LLC; and a senior officer of various other Bank of America-affiliated entities, including other registered and unregistered funds. | ||||||
| Linda J. Wondrack (Born 1964) One Financial Center Boston, MA 02111 Senior Vice President and Chief Compliance Officer (since 2007) | Director (Columbia Management Group LLC and Investment Product Group Compliance), Bank of America since June 2005; Director of Corporate Compliance and Conflicts Officer, MFS Investment Management (investment management), August 2004 to May 2005; Managing Director, Deutsche Asset Management (investment management) prior to August 2004. | ||||||
| Michael G. Clarke (Born 1969) One Financial Center Boston, MA 02111 Treasurer (since 2008) | Director of Fund Administration of the Advisor since January, 2006; Managing Director of the Advisor September 2004 to December 2005; Vice President Fund Administration June 2002 to September 2004. | ||||||
| Jeffrey R. Coleman (Born 1969) One Financial Center Boston, MA 02111 Deputy Treasurer (since 2006) | Director of Fund Administration of the Advisor since January 2006; Fund Controller of the Advisor from October 2004 to January 2006; Vice President of CDC IXIS Asset Management Services, Inc. (investment management) from August 2000 to September 2004. | ||||||
| Joseph F. DiMaria (Born 1968) One Financial Center Boston, MA 02111 Chief Accounting Officer (since 2008) | Director of Fund Administration of the Advisor since January, 2006; Head of Tax/Compliance and Assistant Treasurer of the Advisor from November 2004 to December 2005; Director of Trustee Administration (Sarbanes-Oxley) of the Advisor from May 2003 to October, 2004. | ||||||
30
Fund Governance (Continued)
Officers (Continued)
| Name, Address and Year of Birth, Position with Columbia Funds, Year First Elected or Appointed to Office | Principal Occupation(s) During Past Five Years | ||||||
| Julian Quero (Born 1967) One Financial Center Boston, MA 02111 Deputy Treasurer (since 2008) | Senior Tax Manager of the Advisor since August 2006; Senior Compliance Manager of the Advisor from April 2002 to August 2006. | ||||||
| Barry S. Vallan (Born 1969) One Financial Center Boston, MA 02111 Controller (since 2006) | Vice President—Fund Treasury of the Advisor since October 2004; Vice President—Trustee Reporting of the Advisor from April, 2002 to October 2004. | ||||||
31
This page is intentionally left blank.
This page is intentionally left blank.
COLUMBIA FUNDS INSTITUTIONAL TRUST
ONE FINANCIAL CENTER, BOSTON, MASSACHUSETTS 02111-2621
- INVESTMENT ADVISOR -
COLUMBIA MANAGEMENT ADVISORS, LLC
100 FEDERAL STREET
BOSTON, MASSACHUSETTS 02110-2624
- LEGAL COUNSEL -
ROPES & GRAY LLP
ONE INTERNATIONAL PLACE
BOSTON, MASSACHUSETTS 02110-2624
- TRANSFER AGENT -
COLUMBIA MANAGEMENT SERVICES, INC.
P.O. BOX 8081
BOSTON, MASSACHUSETTS 02266-8081
SHC-42/154963-0708 (09/08) 08/57076
A description of the policies and procedures that the fund uses to determine how to vote proxies to its portfolio securities and a copy of the fund's voting records is available (i) on the fund's website, www.columbiamanagement.com; (ii) on the Securities and Exchange Commission's website at www.sec.gov, and (iii) without charge, upon request, by calling 1-800-368-0346. Information regarding how the fund voted proxies relating to portfolio securities during the 12-month period ended June 30 is available from the SEC's website. Information regarding how the fund voted proxies relating to portfolio securities is also available from the fund's website, www.columbiamanagement.com.
The fund files a complete schedule of portfolio holdings with the SEC for the first and third quarters of each fiscal year on Form N-Q. The fund's Form N-Q is available on the SEC's website at www.sec.gov and may be reviewed and copied at the SEC's Public Reference Room in Washington, D.C. Information on the operation of the Public Reference Room may be obtained by calling 1-800-SEC-0330.
Please read and consider the investment objectives, risks, charges and expenses for any fund carefully before investing. For a prospectus which contains this and other important information about the fund, contact your Columbia Management representative or go to www.columbiamanagement.com.
© 2008 Columbia Management Distributors, Inc.
One Financial Center, Boston, MA 02111-2621
Item 2. Code of Ethics.
(a) The registrant has, as of the end of the period covered by this report, adopted a code of ethics that applies to the registrant’s principal executive officer, principal financial officer, principal accounting officer or controller, or persons performing similar functions, regardless of whether these individuals are employed by the registrant or a third party.
(b) During the period covered by this report, there were not any amendments to a provision of the code of ethics adopted in 2(a) above.
(c) During the period covered by this report, there were no waivers, including any implicit waivers, from a provision of the code of ethics described in 2(a) above that relates to one or more of the items set forth in paragraph (b) of this item’s instructions.
Item 3. Audit Committee Financial Expert.
The registrant’s Board of Trustees has determined that Douglas A. Hacker, John D. Collins and Anne-Lee Verville, each of whom are members of the registrant’s Board of Trustees and Audit Committee, each qualify as an audit committee financial expert. Mr. Hacker, Mr. Collins and Ms. Verville are each independent trustees, as defined in paragraph (a)(2) of this item’s instructions.
Item 4. Principal Accountant Fees and Services.
Fee information below is disclosed for the fourteen series of the registrant whose report to stockholders is included in this annual filing.
(a) Audit Fees. Aggregate Audit Fees billed by the principal accountant for professional services rendered during the fiscal years ended July 31, 2008 and July 31, 2007 are approximately as follows:
2008 |
| 2007 |
| ||
$ | 457,300 |
| $ | 435,300 |
|
Audit Fees include amounts related to the audit of the registrant’s annual financial statements or services that are normally provided by the accountant in connection with statutory and regulatory filings or engagements for those fiscal years.
(b) Audit-Related Fees. Aggregate Audit-Related Fees billed to the registrant by the principal accountant for professional services rendered during the fiscal years ended July 31, 2008 and July 31, 2007 are approximately as follows:
2008 |
| 2007 |
| ||
$ | 61,600 |
| $ | 57,400 |
|
Audit-Related Fees include amounts for assurance and related services by the principal accountant that are reasonably related to the performance of the audit of the registrant’s financial statements and are not reported in Audit Fees above. In both fiscal years 2008 and 2007, Audit-Related Fees consist of agreed-upon procedures performed for semi-annual shareholder reports.
During the fiscal years ended July 31, 2008 and July 31, 2007, there were no Audit-Related Fees billed by the registrant’s principal accountant to the registrant’s investment adviser (not including any sub-adviser whose role is primarily portfolio management and is subcontracted with or overseen by another investment adviser) and any entity controlling, controlled by, or under common control with the adviser that provides ongoing services to the registrant for an engagement that related directly to the operations and financial reporting of the registrant.
(c) Tax Fees. Aggregate Tax Fees billed by the principal accountant to the registrant for professional services rendered during the fiscal years ended July 31, 2008 and July 31, 2007 are approximately as follows:
2008 |
| 2007 |
| ||
$ | 85,600 |
| $ | 80,800 |
|
Tax Fees include amounts for the review of annual tax returns, the review of required shareholder distribution calculations and typically include amounts for professional services by the principal accountant for tax compliance, tax advice and tax planning. Fiscal years 2008 and 2007 include Tax Fees for assistance with foreign tax filings.
During the fiscal years ended July 31, 2008 and July 31, 2007, there were no Tax Fees billed by the registrant’s principal accountant to the registrant’s investment adviser (not including any sub-adviser whose role is primarily portfolio management and is subcontracted with or overseen by another investment adviser) and any entity controlling, controlled by, or under common control with the adviser that provides ongoing services to the registrant for an engagement that related directly to the operations and financial reporting of the registrant.
(d) All Other Fees. Aggregate All Other Fees billed by the principal accountant to the registrant for professional services rendered during the fiscal years ended July 31, 2008 and July 31, 2007 are approximately as follows:
2008 |
| 2007 |
| ||
$ | 0 |
| $ | 0 |
|
All Other Fees include amounts for products and services provided by the principal accountant, other than the services reported in paragraphs (a) through (c) above.
Aggregate All Other Fees billed by the registrant’s principal accountant to the registrant’s investment adviser (not including any sub-adviser whose role is primarily portfolio management and is subcontracted with or overseen by another investment adviser) and any entity controlling, controlled by, or under common control with the adviser that provides ongoing services to the registrant for an engagement that related directly to the operations and financial reporting of the registrant during the fiscal years ended July 31, 2008 and July 31, 2007 are approximately as follows:
2008 |
| 2007 |
| ||
$ | 1,460,800 |
| $ | 849,100 |
|
In both fiscal years 2008 and 2007, All Other Fees consist of fees billed for internal control examinations of the registrant’s transfer agent and investment advisor.
(e)(1) Audit Committee Pre-Approval Policies and Procedures
The registrant’s Audit Committee is required to pre-approve the engagement of the registrant’s independent accountants to provide audit and non-audit services to the registrant and non-audit services to its investment adviser (not including any sub-adviser whose role is primarily portfolio management and is subcontracted with or overseen by another investment adviser) or any entity controlling, controlled by or under common control with such investment adviser that provides ongoing services to the registrant (“Adviser Affiliates”), if the engagement relates directly to the operations and financial reporting of the registrant.
The Audit Committee has adop ted a Policy for Engagement of Independent Accountants for Audit and Non-Audit Services (“Policy”). The Policy sets forth the understanding of the Audit Committee regarding the engagement of the registrant’s independent accountants to provide (i) audit and permissible audit-related, tax and other services to the registrant (collectively “Fund Services”); (ii) non-audit services to the registrant’s investment adviser (not including any sub-adviser whose role is primarily portfolio management and is subcontracted with or overseen by another investment adviser) and Adviser Affiliates, if the engagement relates directly to the operations or financial reporting of a Fund (collectively “Fund-related Adviser Services”); and (iii) certain other audit and non-audit services to the registrant’s investment adviser (not including any sub-adviser whose role is primarily portfolio management and is subcontracted with or overseen by another investment adviser) and Adviser Affiliates. Unless a type of service receives general pre-approval under the Policy, it requires specific pre-approval by the Audit Committee if it is to be provided by the independent accountants. Pre-approval of non-audit services to the registrant, the registrant’s investment adviser (not including any sub-adviser whose role is primarily portfolio
management and is subcontracted with or overseen by another investment adviser) and Adviser Affiliates may be waived provided that the “de minimis” requirements set forth under paragraph (c)(7)(i)(C) of Rule 2-01 of Regulation S-X are met.
Under the Policy, the Audit Committee may delegate pre-approval authority to any pre-designated member or members who are Independent Trustees/Directors. The member(s) to whom such authority is delegated must report, for informational purposes only, any pre-approval decisions to the Audit Committee at its next regular meeting. The Audit Committee’s responsibilities with respect to the pre-approval of se rvices performed by the independent accountants may not be delegated to management.
The Policy requires the Fund Treasurer and/or Director of Board Administration to submit to the Audit Committee, on an annual basis, a schedule of the types of services that are subject to general pre-approval. The schedule(s) provide a description of each type of service that is subject to general pre-approval and, where possible, will provide estimated fee caps for each instance of providing each service. The Audit Committees will review and approve the types of services and review the projected fees for the next fiscal year and may add to, or subtract from, the list of general pre-approved services from time to time based on subsequent determinations. That approval acknowledges that the Audit Committee is in agreement with the specific types of services that the independent accountants will be permitted to perform.
The Fund Treasurer and/or Director of Board Administration shall report to the Audit Committee at each of its regular meetings regarding all Fund Services or Fund-related Adviser Services initiated since the last such report was rendered, including a general description of the services, actual billed and projected fees, and the means by which such Fund Services or Fund-related Adviser Services were pre-approved by the Audit Committee.
*****
(e)(2) The percentage of services described in paragraphs (b) through (d) of this Item approved pursuant to the “de minimis” exception under paragraph (c)(7)(i)(C) of Rule 2-01 of Regulation S-X during both fiscal years ended July 31, 2008 and July 31, 2007 was zero.
(f) Not applicable.
(g) The aggregate non-audit fees billed by the registrant’s accountant for services rendered to the registrant, and rendered to the registrant’s investment adviser (not including any sub-adviser whose role is primarily portfolio management and is subcontracted with or overseen by another investment adviser), and any entity controlling, controlled by, or under common control with the adviser that provides ongoing services to the registrant for the fiscal years ended July 31, 2008 and July 31, 2007 are approximately as follows:
2008 |
| 2007 |
| ||
$ | 1,608,000 |
| $ | 987,300 |
|
(h) The registrant’s Audit Committee of the Board of Directors has considered whether the provision of non-audit services that were rendered to the registrant’s adviser (not including any sub-adviser whose role is primarily portfolio management and is subcontracted with or overseen by another investment adviser), and any entity controlling, controlled by, or under common control with the investment adviser that provides ongoing services to the registrant that were not pre-approved pursuant to paragraph (c)(7)(ii) of Rule 2-01 of Regulation S-X, is compatible with maintaining the principal accountant’s independence.
Item 5. Audit Committee of Listed Registrants.
Not applicable.
Item 6. Investments
(a) The registrant’s “Schedule I – Investments in securities of unaffiliated issuers” (as set forth in 17 CFR 210.12-12) is included in Item 1 of this Form N-CSR.
(b) Not applicable.
Item 7. Disclosure of Proxy Voting Policies and Procedures for Closed-End Management Investment Companies.
Not applicable.
Item 8. Portfolio Managers of Closed-End Management Investment Companies.
Not applicable.
Item 9. Purchases of Equity Securities by Closed-End Management Investment Company and Affiliated Purchasers.
Not applicable.
Item 10. Submission of Matters to a Vote of Security Holders.
There have not been any material changes to the procedures by which shareholders may recommend nominees to the registrant’s board of directors, since those procedures were last disclosed in response to requirements of Item 407(c)(2)(iv) of Regulation S-K (as required by Item 22(b)(15) of Schedule 14A) or this Item.
Item 11. Controls and Procedures.
(a) The registrant’s principal executive officer and principal financial officers, based on their evaluation of the registrant’s disclosure controls and procedures as of a date within 90 days of the filing of this report, have concluded that such controls and procedures are adequately designed to ensure that information required to be disclosed by the registrant in Form N-CSR is accumulated and communicated to the registrant’s management, including the principal executive officer and principal financial officer, or persons performing similar functions, as appropriate to allow timely decisions regarding required disclosure.
(b) There was no change in the registrant’s internal control over financial reporting that occurred during the registrant’s second fiscal quarter of the period covered by this report that has materially affected, or is reasonably likely to materially affect, the registrant’s internal control over financial reporting.
Item 12. Exhibits.
(a)(1) Code of ethics required to be disclosed under Item 2 of Form N-CSR attached hereto as Exhibit 99.CODE ETH.
(a)(2) Certifications pursuant to Rule 30a-2(a) under the Investment Company Act of 1940 (17 CFR 270.30a-2(a)) attached hereto as Exhibit 99.CERT.
(a)(3) Not applicable.
(b) Certification pursuant to Rule 30a-2(b) under the Investment Company Act of 1940 (17 CFR 270.30a-2(b)) attached hereto as Exhibit 99.906CERT.
SIGNATURES
Pursuant to the requirements of the Securities Exchange Act of 1934 and the Investment Company Act of 1940, the registrant has duly caused this report to be signed on its behalf by the undersigned, thereunto duly authorized.
(registrant) |
| Columbia Funds Institutional Trust |
| |||||
|
|
| ||||||
|
|
| ||||||
By (Signature and Title) |
|
| /s/ Christopher L. Wilson | |||||
|
| Christopher L. Wilson, President |
| |||||
|
|
| ||||||
|
|
| ||||||
Date |
| September 22, 2008 |
| |||||
Pursuant to the requirements of the Securities Exchange Act of 1934 and the Investment Company Act of 1940, this report has been signed below by the following persons on behalf of the registrant and in the capacities and on the dates indicated.
By (Signature and Title) |
| /s/ Christopher L. Wilson | |||||
| Christopher L. Wilson, President | ||||||
| |||||||
| |||||||
Date |
| September 22, 2008 | |||||
|
| ||||||
|
| ||||||
By (Signature and Title) |
| /s/ J. Kevin Connaughton | |||||
| J. Kevin Connaughton, Chief Financial Officer | ||||||
| |||||||
| |||||||
Date |
| September 22, 2008 | |||||