UNITED STATES
SECURITIES AND EXCHANGE COMMISSION
Washington, D.C. 20549
FORM N-CSR
CERTIFIED SHAREHOLDER REPORT OF REGISTERED
MANAGEMENT INVESTMENT COMPANIES
Investment Company Act file number | 811-5857 | |||||||
| ||||||||
Columbia Funds Institutional Trust | ||||||||
(Exact name of registrant as specified in charter) | ||||||||
| ||||||||
One Financial Center, Boston, Massachusetts |
| 02111 | ||||||
(Address of principal executive offices) |
| (Zip code) | ||||||
| ||||||||
James R. Bordewick, Jr., Esq. Columbia Management Advisors, LLC One Financial Center Boston, MA 02111 | ||||||||
(Name and address of agent for service) | ||||||||
| ||||||||
Registrant’s telephone number, including area code: | 1-617-426-3750 |
| ||||||
| ||||||||
Date of fiscal year end: | July 31, 2007 |
| ||||||
| ||||||||
Date of reporting period: | July 31, 2007 |
| ||||||
Form N-CSR is to be used by management investment companies to file reports with the Commission not later than 10 days after the transmission to stockholders of any report that is required to be transmitted to stockholders under Rule 30e-1 under the Investment Company Act of 1940 (17 CFR 270.30e-1). The Commission may use the information provided on Form N-CSR in its regulatory, disclosure review, inspection, and policymaking roles.
A registrant is required to disclose the information specified by Form N-CSR, and the Commission will make this information public. A registrant is not required to respond to the collection of information contained in Form N-CSR unless the Form displays a currently valid Office of Management and Budget ("OMB") control number. Please direct comments concerning the accuracy of the information collection burden estimate and any suggestions for reducing the burden to Secretary, Securities and Exchange Commission, 450 Fifth Street, NW, Washington, DC 20549-0609. The OMB has reviewed this collection of information under the clearance requirements of 44 U.S.C. § 3507.
Item 1. Reports to Stockholders.
![]()
CMG CORE BOND FUND
CMG SHORT TERM BOND FUND
CMG ULTRA SHORT TERM BOND FUND
CMG HIGH YIELD FUND
PORTFOLIOS OF COLUMBIA FUNDS INSTITUTIONAL TRUST
Annual Report
July 31, 2007
NOT FDIC INSURED
May Lose Value
No Bank Guarantee
NOT BANK ISSUED
Columbia Management Group, LLC ("Columbia Management") is the investment management division of Bank of America Corporation. Columbia Management entities furnish investment management services and products for institutional and individual investors. The funds are distributed by Columbia Management Distributors, Inc., member of FINRA, SIPC, part of Columbia Management and an affiliate of Bank of America Corporation.
Columbia Management Advisors, LLC ("CMA") is an SEC-registered investment advisor and an indirect, wholly-owned subsidiary of Bank of America Corporation and is part of Columbia Management.
Table of Contents
| Management Discussion of Fund Performances | |||||||
| CMG Core Bond Fund | 1 | ||||||
| CMG Short Term Bond Fund | 5 | ||||||
| CMG Ultra Short Term Bond Fund | 9 | ||||||
| CMG High Yield Fund | 13 | ||||||
| Financial Statements | |||||||
| Financial Highlights | 17 | ||||||
| Schedules of Investments | 21 | ||||||
| Statements of Assets and Liabilities | 62 | ||||||
| Statements of Operations | 63 | ||||||
| Statements of Changes in Net Assets | 64 | ||||||
| Notes to Financial Statements | 66 | ||||||
| Report of Independent Registered Public Accounting Firm | 78 | ||||||
| Fund Governance | 79 | ||||||
The views expressed in this report reflect the current views of the respective parties. These views are not guarantees of future performance and involve certain risks, uncertainties and assumptions that are difficult to predict so actual outcomes and results may differ significantly from the views expressed. These views are subject to change at any time based upon economic, market or other conditions and the respective parties disclaim any responsibility to update such views. These views may not be relied on as investment advice and, because investment decisions for a CMG Fund are based on numerous factors, may not be relied on as an indication of trading intent on behalf of any particular CMG Fund. References to specific securities should not be construed as a recommendation or investment advice.
Performance data quoted represents past performance and current performance may be lower or higher. Past performance is no guarantee of future results. The investment return and principal value will fluctuate so that shares, when redeemed, may be worth more or less than the original cost. Please visit www.columbiamanagement.com for daily and most recent month-end performance updates.
CMG CORE BOND FUND
A Portfolio of Columbia Funds Institutional Trust
MANAGEMENT DISCUSSION OF FUND PERFORMANCE
For the 12-month period ended July 31, 2007, CMG Core Bond Fund returned 5.06%. The fund's return was less than the return of its benchmark, the Lehman Brothers U.S. Aggregate Bond Index,1 which returned 5.58%, but was higher than the average return of its peer group, the Lipper Corporate Debt Funds A Rated Classification,2 which was 4.83% over the same period. The fund benefited from owning bonds with intermediate maturities. However, its non-Treasury holdings underperformed same duration Treasuries late in the reporting period.
For the past twelve months, as a whole, fixed-income markets produced reasonable if unspectacular returns. The Federal Reserve Board kept the federal funds rate at 5.25% throughout the period, although there were some fluctuations in interest rates during the period. When there were signs of a slowing economy, rates declined for a period of time. At other times, there were some signs of potential inflationary pressures—notably tight labor markets and high energy prices—which created some upward pressure on long rates. On balance, Treasury rates ended the year down between 16 to 43 basis points. Non-Treasury markets showed weakness during the second half of the annual reporting period, when concerns about the housing sector showed up in the form of foreclosures and defaults on subprime and other risky mortgages.
Within this environment, we emphasized bonds with intermediate maturities, a strategy that aided relative performance. As a result, the fund's duration was slightly longer than the index on those occasions when interest rates went down, which also aided relative performance. The fund's relative performance also benefited from a decision to trim exposure to corporate bonds. Among the corporate bonds we retained for the fund, the best performance came from utilities, natural gas, media-cable and real estate investment trusts.
The main detraction to the fund's performance came from overweight positions outside the Treasury market. Investments in AAA rated commercial mortgage-backed securities, whose yields widened versus Treasuries, hurt relative performance, as did our overweight to 30-year mortgage pass-throughs. In several cases we added to these sectors as they weakened relative to Treasury securities. While this strategy has been successful over several market cycles, and we expect it to eventually add value, it
1 The Lehman Brothers U.S. Aggregate Bond Index is a market value-weighted index that tracks the daily price, coupon, pay-downs, and total return performance of fixed-rate, publicly placed, dollar-denominated, and non-convertible investment grade debt issues with at least $250 million par amount outstanding and with at least one year to final maturity. Indices are not investments, do not incur fees or expenses and are not professionally managed. It is not possible to invest directly in an index. Securities in the fund may not match those in an index.
2 Lipper Inc., a widely respected data provider in the industry, calculates an average total return (assuming reinvestment of distributions) for mutual funds with investment objectives similar to those of the fund. Lipper makes no adjustment for the effect of sales loads.
1
hampered performance during this period, as many of these sectors continued to exhibit substandard relative performance.
We expect some of the volatility that has marked the last six months to continue going forward. We currently have a duration that is slightly longer than both the index and maintain the overweight to the non-Treasury sectors. As a result, we believe that the fund is positioned to benefit from a return to more stable fixed-income markets in the future.
We appreciate your continued confidence in CMG Core Bond Fund.
Portfolio Management
Leonard A. Aplet has managed or co-managed CMG Core Bond Fund since September 2000 and has been with the advisor or its predecessors or affiliate organizations since 1987.
The fund's top ten holdings (as a percentage of net assets) as of July 31, 2007 were:
| (%) | |||||||
| Federal National Mortgage Association, 5.000% 05/01/2037 | 6.4 | ||||||
| U.S. Treasury Bonds, 5.375% 02/15/2031 | 4.0 | ||||||
| Federal National Mortgage Association, 6.500% 06/01/2037 | 3.3 | ||||||
| Federal National Mortgage Association, 5.500% 06/01/2037 | 3.0 | ||||||
| Federal National Mortgage Association, 5.250% 08/01/2012 | 2.3 | ||||||
| U.S. Treasury Notes, 3.375% 10/15/2009 | 2.2 | ||||||
| Federal National Mortgage Association, 5.500% 11/01/2036 | 2.1 | ||||||
| Federal Home Loan Mortgage Corp., 5.500% 08/01/2035 | 1.9 | ||||||
| Federal National Mortgage Association, 6.000% 07/01/2037 | 1.9 | ||||||
| Federal National Mortgage Association, 6.500% 03/01/2037 | 1.9 | ||||||
Holdings are calculated as a percentage of net assets, and are subject to change. Because the fund is actively managed, there is no guarantee the fund will continue to maintain the holdings breakdown listed. The fund's holdings and their weights within the portfolio may change as market conditions change.
Investing in fixed-income securities may involve certain risks, including the credit quality of individual issuers, possible prepayments, market or economic developments and yield and share price fluctuations due to changes in interest rates. When interest rates go up, bond prices typically drop, and vice versa.
2
Performance data quoted represents past performance and current performance may be lower or higher. Past performance is no guarantee of future results. The investment return and principal value will fluctuate so that shares, when redeemed, may be worth more or less than the original cost. Please visit www.columbiamanagement.com for daily and most recent month-end performance updates.
Average annual total return as of July 31, 2007 (%)
| Inception | 1-year | 5-year | Life | ||||||||||||||||
| CMG Core Bond Fund | 09/01/00 | 5.06 | 3.93 | 5.46 | |||||||||||||||
| Lehman Brothers U.S. Aggregate Bond Index | 5.58 | 4.41 | 5.85 | ||||||||||||||||
Average annual total return as of June 30, 2007 (%)
| Inception | 1-year | 5-year | Life | ||||||||||||||||
| CMG Core Bond Fund | 09/01/00 | 5.99 | 3.97 | 5.45 | |||||||||||||||
| Lehman Brothers U.S. Aggregate Bond Index | 6.12 | 4.48 | 5.80 | ||||||||||||||||
Performance results reflect any waivers or reimbursements of fund expenses by the investment advisor and/or any of its affiliates. Absent these waivers or reimbursement arrangements, performance results would have been lower. All results shown assume reinvestment of distributions.
The fund's annual operating expense ratios, with and without contractual waivers, as stated in the fund's prospectus that is current as of the date of this report, are 0.25% and 0.35%, respectively, of average annual net assets. Differences in expense ratios disclosed elsewhere in this report may result from including fee waivers and reimbursements as well as different time periods used in calculating the ratios. The contractual waiver expires 03/01/2009.
Growth of a $3,000,000 investment, September 1, 2000 to July 31, 2007
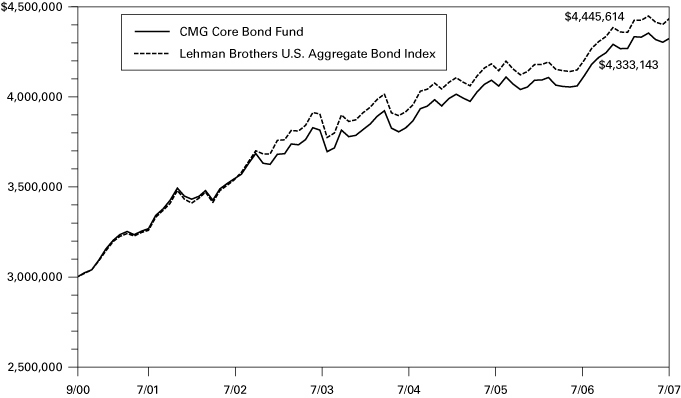
The chart above shows the growth in value of a hypothetical minimum initial $3,000,000 investment in the fund compared to the fund's benchmark during the stated time period.
The table and chart do not reflect the deduction of taxes that a shareholder may pay on fund distributions or the redemption of fund shares.
The Lehman Brothers U.S. Aggregate Bond Index is a market value-weighted index that tracks the daily price, coupon, pay-downs, and total return performance of fixed-rate, publicly placed, dollar-denominated, and non-convertible investment grade debt issues with at least $250 million par amount outstanding and with at least one year to final maturity. Indices are not investments, do not incur fees or expenses and are not professionally managed. It is not possible to invest directly in an index. Securities in the fund may not match those in an index.
Index performance is from September 1, 2000.
3
UNDERSTANDING YOUR EXPENSES – CMG Core Bond Fund
As a fund shareholder, you incur two types of costs. There are transaction costs and also ongoing costs, which generally include investment advisory fees and other fund expenses. The information on this page is intended to help you understand the ongoing costs of investing in the fund and to compare these costs with the ongoing costs of investing in other mutual funds.
Analyzing your fund's expenses
To illustrate these ongoing costs, we have provided an example and calculated the expenses paid by investors during the reporting period. The information in the following table is based on an initial investment of $1,000.00, which is invested at the beginning of the reporting period and held for the entire period. Expense information is calculated two ways and each method provides you with different information. The amount listed in the "actual" column is calculated using the fund's actual operating expenses and total return for the period. The amount listed in the "hypothetical" column assumes that the return each year is 5% before expenses and is calculated based on the fund's actual operating expenses. You should not use the hypothetical account values and expenses to estimate either your actual account balance at the end of the period or the expenses you paid during this reporting period.
Estimating your actual expenses
To estimate the expenses that you paid over the period, first you will need your account balance at the end of the period:
1. Divide your ending account balance by $1,000.00. For example, if an account balance was $8,600.00 at the end of the period, the result would be 8.6.
2. In the section of the table below titled "Expenses paid during the period," locate the amount under "actual." Multiply this number by the result from step 1. Your answer is an estimate of the expenses you paid on your account during the period.
February 1, 2007 – July 31, 2007
| Account value at the beginning of the period ($) | Account value at the end of the period ($) | Expenses paid during the period ($) | Fund's annualized expense ratio (%) | ||||||||||||||||||||||||
| Actual | Hypothetical | Actual | Hypothetical | Actual | Hypothetical | Actual | |||||||||||||||||||||
| 1,000.00 | 1,000.00 | 1,013.39 | 1,023.55 | 1.25 | 1.25 | 0.25 | |||||||||||||||||||||
Expenses paid during the period are equal to the annualized expense ratio of 0.25%, multiplied by the average account value over the period, then multiplied by the number of days in the fund's most recent fiscal half- year and divided by 365.
Had the investment advisor not reimbursed a portion of expenses, account value at end of the period would have been reduced.
It is important to note that the expense amounts shown in the table are meant to highlight only ongoing costs of investing in the fund. Therefore, the hypothetical examples provided may not help you determine the relative total costs of owning shares of different funds.
Compare with other funds
Since all mutual funds are required to include the same hypothetical calculations about expenses in shareholder reports, you can use this information to compare the ongoing costs of investing in the fund with other funds. To do so, compare the 5% hypothetical example with the 5% hypothetical examples that appear in the shareholder reports of other funds. As you compare hypothetical examples of other funds, it is important to note that hypothetical examples are meant to highlight the ongoing costs of investing in a fund.
4
Performance data quoted represents past performance, and current performance may be lower or higher. Past performance is no guarantee of future results. The investment return and principal value will fluctuate so that shares, when redeemed, may be worth more or less than the original cost. Please visit www.columbiamanagement.com for daily and most recent month-end performance updates.
CMG SHORT TERM BOND FUND
A Portfolio of Columbia Funds Institutional Trust
MANAGEMENT DISCUSSION OF FUND PERFORMANCE
CMG Short Term Bond Fund returned 5.25% for the 12-month period ended July 31, 2007. The fund's performance was in line with its benchmark, the Merrill Lynch 1-3 Year U.S. Treasury Index,1 which returned 5.26% during the period. The fund outperformed the average return of its peer group, the Lipper Short Investment Grade Debt Funds Classification,2 which was 4.66%. The fund's increased emphasis on two to three year securities aided performance as bonds with those maturities performed better than either shorter or longer maturities.
Over the past 12 months, fixed-income markets produced solid if unspectacular returns. The Federal Reserve Board kept the federal funds rate at 5.25% throughout the period, although there were some fluctuations in interest rates during the period. When there were signs of a slowing economy, rates declined for a period of time. At other times, there were some signs of potential inflationary pressures—notably tight labor markets and high energy prices—which created some upward pressure on long rates. On balance, Treasury rates ended the year down between 16 to 43 basis points. Treasury markets were thrust into their traditional role as a safe haven during the first half of 2007, when weakness in the housing sector showed up in the form of foreclosures and defaults on subprime and other risky mortgages. The ensuing credit crunch caused prices to fall and yields to rise among non-Treasury securities.
Within this mixed environment, we emphasized bonds with average maturities of two to three years, a strategy which aided relative performance. Relative performance was also aided by our decision to reduce the fund's exposure to the home equity sector. The home equity sector significantly underperformed other areas of the market during the period. Among the corporate bonds we retained for the fund, the best performance came from utilities, wire-line communications and real estate investment trusts.
The main detraction to the fund's performance came from its overweight positions outside the Treasury Market. As the yield on AAA rated commercial mortgage backed securities and similar securities began to rise versus Treasury securities, we augmented the fund's holdings in those sectors. This asset-allocation strategy has been successful over several market cycles, and we expect it to eventually add value, but it hampered performance during this period, as many of these sectors continued to exhibit substandard relative performance. Among the fund's
1 The Merrill Lynch 1-3 Year U.S. Treasury Index tracks the performance of sovereign debt publicly issued in the US domestic market with maturities of 1-3 years and a minimum amount outstanding of $1 billion. Indices are not investments, do not incur fees or expenses and are not professionally managed. It is not possible to invest directly in an index. Securities in the fund may not match those in an index.
2 Lipper Inc., a widely respected data provider in the industry, calculates an average total return (assuming reinvestment of distributions) for mutual funds with investment objectives similar to those of the fund. Lipper makes no adjustment for the effect of sales loads.
5
corporate holdings, the fund's exposure to financial companies was also costly, as the sector was especially hard-hit by investor fears concerning liquidity and credit quality.
We expect some of the volatility that has been demonstrated over the past six months to continue going forward. The fund is positioned neutrally to the duration of the benchmark index and we continue to overweight non-Treasury investments. Despite the recent underperformance of high quality non-Treasury assets, history suggests that as markets stabilize the yield advantage of these asset classes will narrow, leading to the possibility of positive excess returns.
We appreciate your continued confidence in the CMG Short Term Bond Fund.
Portfolio Management
Leonard A. Aplet has co-managed the CMG Short Term Bond Fund since February 1998 and has been with the advisor or its predecessors or affiliate organizations since 1987.
Ronald Stahl has co-managed the fund since November 2006 and has been with the advisor or its predecessors or affiliate organizations since 1998.
The fund's top ten holdings (as a percentage of net assets) as of July 31, 2007 were:
| (%) | |||||||
| Federal Home Loan Mortgage Corp, 6.625% 09/15/2009 | 3.0 | ||||||
| JPMorgan Mortgage Trust, 6.055% 10/25/2036 | 2.4 | ||||||
| Washington Mutual Mortgage Pass-Through Certificates, 5.901% 07/25/2037 | 2.1 | ||||||
| Structured Adjustable Rate Mortgage Loan Trust, 5.821% 07/25/2036 | 2.0 | ||||||
| U.S. Treasury Notes, 3.125% 10/15/2008 | 1.9 | ||||||
| Triad Auto Receivable Owner's Trust, 4.220% 06/12/2012 | 1.6 | ||||||
| Federal National Mortgage Association, 3.375% 12/15/2008 | 1.6 | ||||||
| Merrill Lynch/Countrywide Commercial Mortgage Trust, 5.549% 06/12/2050 | 1.5 | ||||||
| JPMorgan Chase Commercial Mortgage Securities Corp., 4.914% 07/12/2037 | 1.5 | ||||||
| Federal Home Loan Mortgage Corp., 5.500% 02/15/2025 | 1.4 | ||||||
Holdings are calculated as a percentage of net assets, and are subject to change. Because the fund is actively managed, there is no guarantee the fund will continue to maintain the holdings breakdown listed. The fund's holdings and their weights within the portfolio may change as market conditions change.
Investing in fixed-income securities may involve certain risks, including the credit quality of individual issuers, possible prepayments, market or economic developments and yield and share price fluctuations due to changes in interest rates. When interest rates go up, bond prices typically drop, and vice versa.
6
Performance data quoted represents past performance and current performance may be lower or higher. Past performance is no guarantee of future results. The investment return and principal value will fluctuate so that shares, when redeemed, may be worth more or less than the original cost. Please visit www.columbiamanagement.com for daily and most recent month-end performance updates.
Average annual total return as of July 31, 2007 (%)
| Inception | 1-year | 5-year | Life | ||||||||||||||||
| CMG Short Term Bond Fund | 02/02/98 | 5.25 | 3.26 | 4.85 | |||||||||||||||
| Merrill Lynch 1-3 Year U.S. Treasury Index | 5.26 | 2.71 | 4.46 | ||||||||||||||||
Average annual total return as of June 30, 2007 (%)
| Inception | 1-year | 5-year | Life | ||||||||||||||||
| CMG Short Term Bond Fund | 02/02/98 | 5.55 | 3.25 | 4.84 | |||||||||||||||
| Merrill Lynch 1-3 Year U.S. Treasury Index | 5.07 | 2.77 | 4.40 | ||||||||||||||||
Performance results reflect any waivers or reimbursements of fund expenses by the investment advisor and/ or any of its affiliates. Absent these waivers or reimbursement arrangements, performance results would have been lower. All results shown assume reinvestment of distributions.
The fund's annual operating expense ratios, with and without contractual waivers, as stated in the fund's prospectus that is current as of the date of this report, are 0.25% and 0.33%, respectively, of average annual net assets. Differences in expense ratios disclosed elsewhere in this report may result from including fee waivers and reimbursements as well as different time periods used in calculating the ratios. The contractual waiver expires 03/01/2009.
Growth of a $3,000,000 investment, February 2, 1998 to July 31, 2007
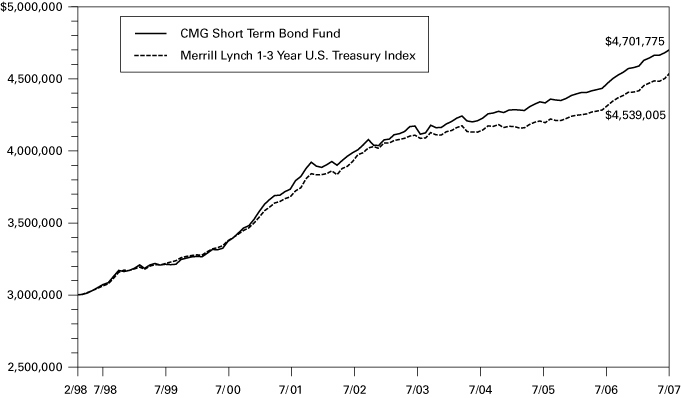
The chart above shows the growth in value of a hypothetical minimum initial $3,000,000 investment in the fund compared to the index during the stated time period.
The table and chart do not reflect the deduction of taxes that a shareholder may pay on fund distributions or the redemption of fund shares.
The Merrill Lynch 1-3 Year U.S. Treasury Index tracks the performance of sovereign debt publicly issued in the US domestic market with maturities of 1-3 years and a minimum amount outstanding of $1 billion. Indices are not investments, do not incur fees or expenses and are not professionally managed. It is not possible to invest directly in an index. Securities in the fund may not match those in an index.
Index performance is from February 2, 1998.
7
UNDERSTANDING YOUR EXPENSES – CMG Short Term Bond Fund
As a fund shareholder, you incur two types of costs. There are transaction costs and also ongoing costs, which generally include investment advisory fees and other fund expenses. The information on this page is intended to help you understand the ongoing costs of investing in the fund and to compare these costs with the ongoing costs of investing in other mutual funds.
Analyzing your fund's expenses
To illustrate these ongoing costs, we have provided an example and calculated the expenses paid by investors during the reporting period. The information in the following table is based on an initial investment of $1,000.00, which is invested at the beginning of the reporting period and held for the entire period. Expense information is calculated two ways and each method provides you with different information. The amount listed in the "actual" column is calculated using the fund's actual operating expenses and total return for the period. The amount listed in the "hypothetical" column assumes that the return each year is 5% before expenses and is calculated based on the fund's actual operating expenses. You should not use the hypothetical account values and expenses to estimate either your actual account balance at the end of the period or the expenses you paid during this reporting period.
Estimating your actual expenses
To estimate the expenses that you paid over the period, first you will need your account balance at the end of the period:
1. Divide your ending account balance by $1,000.00. For example, if an account balance was $8,600.00 at the end of the period, the result would be 8.6.
2. In the section of the table below titled "Expenses paid during the period," locate the amount under "actual." Multiply this number by the result from step 1. Your answer is an estimate of the expenses you paid on your account during the period.
February 1, 2007 – July 31, 2007
| Account value at the beginning of the period ($) | Account value at the end of the period ($) | Expenses paid during the period ($) | Fund's annualized expense ratio (%) | ||||||||||||||||||||||||
| Actual | Hypothetical | Actual | Hypothetical | Actual | Hypothetical | Actual | |||||||||||||||||||||
| 1,000.00 | 1,000.00 | 1,025.19 | 1,023.55 | 1.26 | 1.25 | 0.25 | |||||||||||||||||||||
Expenses paid during the period are equal to the annualized expense ratio of 0.25%, multiplied by the average account value over the period, then multiplied by the number of days in the fund's most recent fiscal half-year and divided by 365.
Had the investment advisor not reimbursed a portion of expenses, account value at end of the period would have been reduced.
It is important to note that the expense amounts shown in the table are meant to highlight only ongoing costs of investing in the fund. Therefore, the hypothetical examples provided may not help you determine the relative total costs of owning shares of different funds.
Compare with other funds
Since all mutual funds are required to include the same hypothetical calculations about expenses in shareholder reports, you can use this information to compare the ongoing costs of investing in the fund with other funds. To do so, compare the 5% hypothetical example with the 5% hypothetical examples that appear in the shareholder reports of other funds. As you compare hypothetical examples of other funds, it is important to note that hypothetical examples are meant to highlight the ongoing costs of investing in a fund.
8
Performance data quoted represents past performance, and current performance may be lower or higher. Past performance is no guarantee of future results. The investment return and principal value will fluctuate so that shares, when redeemed, may be worth more or less than the original cost. Please visit www.columbiamanagement.com for daily and most recent month-end performance updates.
CMG ULTRA SHORT TERM BOND FUND
A Portfolio of Columbia Funds Institutional Trust
MANAGEMENT DISCUSSION OF FUND PERFORMANCE
For the 12-month period ended July 31, 2007, CMG Ultra Short Term Bond Fund returned 4.62%. The fund underperformed its benchmark, the Citigroup One-Year U.S. Treasury Bill Index1 which returned 5.05%. The fund outperformed the 4.59% average return of its peer group, the Lipper Ultra-Short Obligations Funds Classification.2 We believe the fund's solid showing versus its peers was due to its exposure to corporate bonds, as well as asset-backed and mortgage-backed securities, which yielded more than comparable one-year Treasury bonds. The fund's slight underperformance relative to the index was the result of an emphasis on issues in the financials sector, which underperformed toward the end of the period.
During the past 12 months, short-term interest rates fluctuated in response to economic data releases and news from the Federal Reserve Board (the Fed) as investors tried to gauge the potential for inflationary pressures and the direction and timing of the Fed's next move with regard to the fed funds rate. The fund benefited from this environment by tactically adjusting its exposure to the front end of the short-term maturity spectrum through the purchase and sale of bonds with very short maturities. This allowed the fund to capture higher yields as short-term rates rose and to take gains after they came back down. The volatile interest rate environment allowed the fund to constantly modify its duration position throughout the period ending July 31, 2007. The fund took advantage of higher rates when they occurred by extending portfolio duration and then shortening duration during periods when interest rates declined.
During much of the period, short-term yields remained "inverted". In this environment, investors were paid less for accepting the risk of a longer maturity bond than for a shorter one, reflecting continued uncertainty about the near-term direction of interest rates and the economy. This hampered the fund's ability to increase exposure to the long end of the spectrum, as doing so would entail giving up too much yield. The fund's return was also dampened by its relatively low exposure to lower-rated BBB corporate bonds, as investors seeking income flocked to the sector and pushed prices for these bonds higher. The fund's significant exposure to corporate bonds backed by financial companies, including banks, detracted from returns when the sector underperformed during the last two months of the period. Concerns arising from potential losses by hedge funds run by Bear Stearns and fears that other firms may incur similar losses contr ibuted to the underperformance.
1 The Citigroup One-Year U.S. Treasury Bill Index consists of a single 1-year U.S. Treasury Bill whose return is tracked until its maturity. Indices are not investments, do not incur fees or expenses and are not professionally managed. It is not possible to invest directly in an index. Securities in the fund may not match those in an index.
2 Lipper Inc., a widely respected data provider in the industry, calculates an average total return (assuming reinvestment of distributions) for mutual funds with similar investment objectives as those of the fund. Lipper makes no adjustments for the effect of sales loads.
9
The market environment has changed substantially in the last few months with a significant decline in liquidity, an increased difference in yield between high and low quality bonds and rising market volatility. In the last three months of the period, exposure to asset-backed securities and collateralized mortgage obligations reduced the fund's return. Investors grew increasingly concerned about a weakening economy and repercussions from rising default rates in the subprime segment of the mortgage market. These concerns drove down prices of certain issues in the asset-backed and mortgage sectors. We believe high-quality, AAA-rated issues may continue to perform well in this unpredictable environment. While we continue to maintain a sizable weight in corporate bonds, reflecting a positive long-term outlook for corporate earnings, we plan to increase the fund's exposure to higher quality issues within that sector. We believe this d efensive positioning will give the portfolio a more conservative structure, which may potentially help cushion the fund should market conditions deteriorate further.
We appreciate your continued confidence in the CMG Ultra Short Term Bond Fund.
Portfolio Management
Guy C. Holbrook has managed the fund since its inception in March 2004 and has been with the advisor or its predecessors or affiliate organizations since 1998.
The fund's top ten holdings (as a percentage of net assets) as of July 31, 2007 were:
| (%) | |||||||
| Federal Home Loan Bank, 4.875% 05/14/2010 | 1.8 | ||||||
| *Ottimo Funding Ltd., 7.320% 07/28/2010 | 1.4 | ||||||
| Federal National Mortgage Association, 4.542% 07/01/2033 | 1.1 | ||||||
| GS Auto Loan Trust, 5.380% 01/15/2014 | 1.1 | ||||||
| AmeriCredit Automobile Receivables Trust, 5.420% 08/08/2011 | 1.1 | ||||||
| Triad Auto Receivables Owner Trust, 5.260% 11/14/2011 | 1.1 | ||||||
| *Axon Financial Funding Ltd., 5.960% 04/04/2017 | 1.1 | ||||||
| Chase Issuance Trust, 3.220% 06/15/2010 | 1.1 | ||||||
| Capital One Bank, 6.700% 05/15/2008 | 1.0 | ||||||
| Federal National Mortgage Association, 4.149% 03/01/2034 | 1.0 | ||||||
*The fund's holdings in Ottimo Funding Ltd., 7.320%, 7/28/2010 and Axon Financial Fund Ltd., 5.960%, 4/4/2017, subsequently have declined significantly in value and are no longer in the fund's top ten holdings as of August 31, 2007.
Holdings are calculated as a percentage of net assets, and are subject to change. Because the fund is actively managed, there is no guarantee the fund will continue to maintain the holdings breakdown listed. The fund's holdings and their weights within the portfolio may change as market conditions change.
Investing in fixed-income securities may involve certain risks, including the credit quality of individual issuers, possible prepayments, market or economic developments and yield and share price fluctuations due to changes in interest rates. When interest rates go up, bond prices typically drop, and vice versa.
10
Performance data quoted represents past performance and current performance may be lower or higher. Past performance is no guarantee of future results. The investment return and principal value will fluctuate so that shares, when redeemed, may be worth more or less than the original cost. Please visit www.columbiamanagement.com for daily and most recent month-end performance updates.
Average annual total return as of July 31, 2007 (%)
| Inception | 1-year | Life | |||||||||||||
| CMG Ultra Short Term Bond Fund | 03/08/04 | 4.62 | 2.99 | ||||||||||||
| Citigroup One-Year U.S. Treasury Bill Index | 5.05 | 2.89 | |||||||||||||
Average annual total return as of June 30, 2007 (%)
| Inception | 1-year | Life | |||||||||||||
| CMG Ultra Short Term Bond Fund | 03/08/04 | 5.44 | 3.12 | ||||||||||||
| Citigroup One-Year U.S. Treasury Bill Index | 5.11 | 2.82 | |||||||||||||
Performance results reflect any waivers or reimbursements of fund expenses by the investment advisor and/ or any of its affiliates. Absent these waivers or reimbursement arrangements, performance results would have been lower. All results shown assume reinvestment of distributions.
The fund's annual operating expense ratios, with and without contractual waivers, as stated in the fund's prospectus that is current as of the date of this report, are 0.25% and 0.32%, respectively, of average annual net assets. Differences in expense ratios disclosed elsewhere in this report may result from including fee waivers and reimbursements as well as different time periods used in calculating the ratios. The contractual waiver expires 03/01/2009.
Growth of a $3,000,000 investment, March 8, 2004 to July 31, 2007
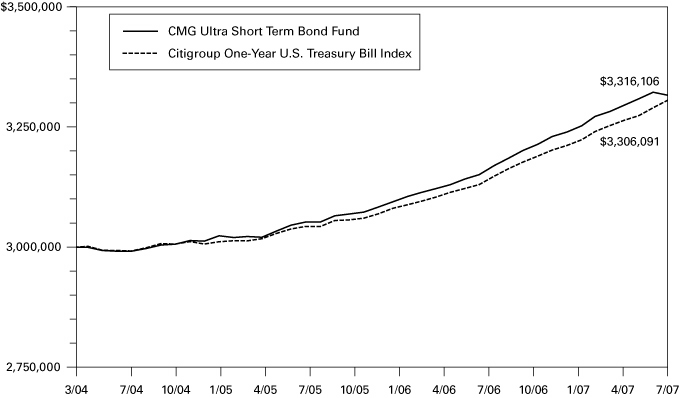
The chart above shows the growth in value of a hypothetical minimum initial $3,000,000 investment in the fund compared to the index during the stated time period.
The table and chart do not reflect the deduction of taxes that a shareholder may pay on fund distributions or the redemption of fund shares.
The Citigroup One-Year U.S. Treasury Bill Index consists of a single 1-year U.S. Treasury Bill whose return is tracked until its maturity. Indices are not investments, do not incur fees or expenses and are not professionally managed. It is not possible to invest directly in an index. Securities in the fund may not match those in an index.
Index performance is from March 8, 2004.
11
UNDERSTANDING YOUR EXPENSES – CMG Ultra Short Term Bond Fund
As a fund shareholder, you incur two types of costs. There are transaction costs and also ongoing costs, which generally include investment advisory fees and other fund expenses. The information on this page is intended to help you understand the ongoing costs of investing in the fund and to compare these costs with the ongoing costs of investing in other mutual funds.
Analyzing your fund's expenses
To illustrate these ongoing costs, we have provided an example and calculated the expenses paid by investors during the reporting period. The information in the following table is based on an initial investment of $1,000.00, which is invested at the beginning of the reporting period and held for the entire period. Expense information is calculated two ways and each method provides you with different information. The amount listed in the "actual" column is calculated using the fund's actual operating expenses and total return for the period. The amount listed in the "hypothetical" column assumes that the return each year is 5% before expenses and is calculated based on the fund's actual operating expenses. You should not use the hypothetical account values and expenses to estimate either your actual account balance at the end of the period or the expenses you paid during this reporting period.
Estimating your actual expenses
To estimate the expenses that you paid over the period, first you will need your account balance at the end of the period:
1. Divide your ending account balance by $1,000.00. For example, if an account balance was $8,600.00 at the end of the period, the result would be 8.6.
2. In the section of the table below titled "Expenses paid during the period," locate the amount under "actual." Multiply this number by the result from step 1. Your answer is an estimate of the expenses you paid on your account during the period.
February 1, 2007 – July 31, 2007
| Account value at the beginning of the period ($) | Account value at the end of the period ($) | Expenses paid during the period ($) | Fund's annualized expense ratio (%) | ||||||||||||||||||||||||
| Actual | Hypothetical | Actual | Hypothetical | Actual | Hypothetical | Actual | |||||||||||||||||||||
| 1,000.00 | 1,000.00 | 1,024.89 | 1,023.55 | 1.26 | 1.25 | 0.25 | |||||||||||||||||||||
Expenses paid during the period are equal to the annualized expense ratio of 0.25%, multiplied by the average account value over the period, then multiplied by the number of days in the fund's most recent fiscal half-year and divided by 365.
Had the investment advisor not reimbursed a portion of expenses, account value at end of the period would have been reduced.
It is important to note that the expense amounts shown in the table are meant to highlight only ongoing costs of investing in the fund. Therefore, the hypothetical examples provided may not help you determine the relative total costs of owning shares of different funds.
Compare with other funds
Since all mutual funds are required to include the same hypothetical calculations about expenses in shareholder reports, you can use this information to compare the ongoing costs of investing in the fund with other funds. To do so, compare the 5% hypothetical example with the 5% hypothetical examples that appear in the shareholder reports of other funds. As you compare hypothetical examples of other funds, it is important to note that hypothetical examples are meant to highlight the ongoing costs of investing in a fund.
12
Performance data quoted represents past performance, and current performance may be lower or higher. Past performance is no guarantee of future results. The investment return and principal value will fluctuate so that shares, when redeemed, may be worth more or less than the original cost. Please visit www.columbiamanagement.com for daily and most recent month-end performance updates.
CMG HIGH YIELD FUND
A Portfolio of Columbia Funds Institutional Trust
MANAGEMENT DISCUSSION OF FUND PERFORMANCE
For the 12-month period ended July 31, 2007, the CMG High Yield Fund returned 4.76%. It underperformed its benchmarks, the Merrill Lynch Intermediate BB Index and the JPMorgan Chase Developed BB High Yield Index,1 which returned 5.88% and 5.93%, respectively. It also underperformed the average return of its peer group, the Lipper High Current Yields Classification,2 which was 6.21% for the period. The fund was held back by its conservative positioning at a time when investors favored riskier assets.
The economy continued to grow over the past 12 months, pushing corporate profits higher and default rates lower. This environment was favorable for the high-yield marketplace. Although high-yield bonds could not match the performance of the equity markets during the period, they were among the best-performing sectors of the fixed-income universe. The riskiest segment of the high-yield market did the best over this period, which hampered the fund's performance. However, we believe that the fund's more conservative positioning has the potential to cushion it against a more volatile environment going forward.
In particular, we gave up some performance by underweighting the fund's position in the auto industry. We do not believe that these companies, which have had difficulty keeping expenses down and continue to experience significant cash losses, meet the fund's investment requirements. However, the bonds of several leading automakers performed well early in the 12-month period. The fund's positions in Harrah's Operating Co., Inc. and Clear Channel Communications, Inc. (0.7% and 0.4% of net assets, respectively) also detracted from performance, as both companies became subject to leveraged buyouts whose structure favors stockholders over pre-buyout bondholders.
On the plus side, the fund owned chemical producers Lyondell Chemical Co. and Huntsman International LLC (1.3% and 0.9% of net assets, respectively), and both companies were the targets of recent buyouts whose terms suggested that existing bonds might be retired at a premium. The fund's holdings in Rogers Wireless, Inc. (0.4% of net assets) also boosted returns, as the company's strong operating performance led to the refinancing of some of its
1 The Merrill Lynch Intermediate BB Index is a market-weighted index, consisting of BB cash pay bonds, which are US dollar denominated bonds issued in the US domestic market with maturities between 1 and 10 years. The JPMorgan Chase Developed BB High Yield Index is designed to mirror the investable universe of the US dollar developed, BB-rated, high yield corporate debt market. Indices are not investments, do not incur fees or expenses and are not professionally managed. It is not possible to invest directly in an index. Securities in the fund may not match those in an index.
2 Lipper Inc., a widely respected data provider in the industry, calculates an average total return (assuming reinvestment of distributions) for mutual funds with investment objectives similar to those of the fund. Lipper makes no adjustment for the effect of sales loads.
13
bonds. The fund also benefited from a decision to underweight the housing sector. Housing bonds experienced considerable weakness in 2007 following a wave of foreclosures stemming from defaults in subprime and other risky mortgages.
As weakness in the housing sector continued into the end of the period, the fund's conservative positioning began to prove beneficial. We believe that the recent volatility in the fixed-income markets will persist over the next several months, creating an environment that could potentially reward the higher quality sectors of the high-yield market.
We appreciate your continued confidence in CMG High Yield Fund.
Portfolio Management
Kevin L. Cronk has co-managed the fund since September 2005. He has been with the advisor or its predecessors or affiliate organizations since August 1999.
Thomas A. LaPointe has co-managed the fund since September 2005. He has been with the advisor or its predecessors or affiliate organizations since February 1999.
The fund's top ten issuers (as a percentage of net assets) as of July 31, 2007 were:
| (%) | |||||||
| GMAC LLC | 2.4 | ||||||
| Qwest Corp. | 2.1 | ||||||
| HCA, Inc. | 1.9 | ||||||
| Allied Waste North America, Inc. | 1.6 | ||||||
| Chesapeake Energy Corp. | 1.6 | ||||||
| AES Corp. | 1.6 | ||||||
| Williams Companies, Inc. | 1.5 | ||||||
| Owens-Illinois, Inc. | 1.5 | ||||||
| Lyondell Chemical Co. | 1.3 | ||||||
| Edison Mission Energy | 1.2 | ||||||
Holdings are calculated as a percentage of net assets, and are subject to change. Because the fund is actively managed, there is no guarantee the fund will continue to maintain the holdings breakdown listed. The fund's holdings and their weights within the portfolio may change as market conditions change.
Investing in fixed-income securities may involve certain risks, including the credit quality of individual issuers, possible prepayments, market or economic developments and yield and share price fluctuations due to changes in interest rates. When interest rates go up, bond prices typically drop, and vice versa.
Investments in high yield or "junk" bonds offer the potential for higher income than investments in investment-grade bonds but they also have a higher degree of risk. Changes in economic conditions or other circumstances may adversely affect a high-yield bond issuer's ability to make timely principal and interest payments.
14
Performance data quoted represents past performance and current performance may be lower or higher. Past performance is no guarantee of future results. The investment return and principal value will fluctuate so that shares, when redeemed, may be worth more or less than the original cost. Please visit www.columbiamanagement.com for daily and most recent month-end performance updates.
Average annual total return as of July 31, 2007 (%)
| Inception | 1-year | 5-year | 10-year | ||||||||||||||||
| CMG High Yield Fund | 07/06/94 | 4.76 | 6.93 | 5.77 | |||||||||||||||
| JPMorgan Chase Developed BB High Yield Index | 5.93 | 8.95 | 7.24 | ||||||||||||||||
| Merrill Lynch Intermediate BB Index | 5.88 | 8.66 | 5.76 | ||||||||||||||||
Average annual total return as of June 30, 2007 (%)
| Inception | 1-year | 5-year | 10-year | ||||||||||||||||
| CMG High Yield Fund | 07/06/94 | 8.37 | 7.12 | 6.32 | |||||||||||||||
| JPMorgan Chase Developed BB High Yield Index | 9.58 | 8.81 | 7.79 | ||||||||||||||||
| Merrill Lynch Intermediate BB Index | 9.40 | 8.22 | 6.24 | ||||||||||||||||
Performance results reflect any waivers or reimbursements of fund expenses by the investment advisor and/or any of its affiliates. Absent these waivers or reimbursement arrangements, performance results would have been lower. All results shown assume reinvestment of distributions.
The fund's annual operating expense ratios, with and without contractual waivers, as stated in the fund's prospectus that is current as of the date of this report, are 0.40% and 0.44%, respectively, of average annual net assets. Differences in expense ratios disclosed elsewhere in this report may result from including fee waivers and reimbursements as well as different time periods used in calculating the ratios. The contractual waiver expires 03/01/2009.
Growth of a $3,000,000 investment, August 1, 1997 to July 31, 2007
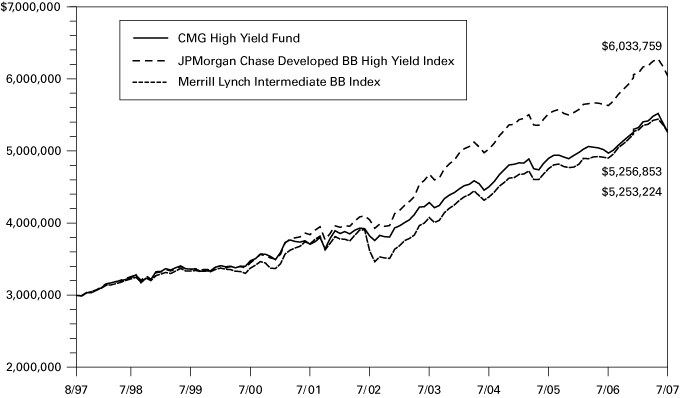
The chart above shows the growth in value of a hypothetical minimum initial $3,000,000 investment in the fund compared to the index during the stated time period.
The table and chart do not reflect the deduction of taxes that a shareholder may pay on fund distributions or the redemption of fund shares.
The JPMorgan Chase Developed BB High Yield Index is designed to mirror the investable universe of the US dollar developed, BB-rated, high yield corporate debt market. The Merrill Lynch Intermediate BB Index is a market-weighted index, consisting of BB cash pay bonds, which are US dollar denominated bonds issued in the US domestic market with maturities between 1 and 10 years. Indices are not investments, do not incur fees or expenses and are not professionally managed. It is not possible to invest directly in an index. Securities in the fund may not match those in an index.
15
UNDERSTANDING YOUR EXPENSES – CMG High Yield Fund
As a fund shareholder, you incur two types of costs. There are transaction costs and also ongoing costs, which generally include investment advisory fees and other fund expenses. The information on this page is intended to help you understand the ongoing costs of investing in the fund and to compare these costs with the ongoing costs of investing in other mutual funds.
Analyzing your fund's expenses
To illustrate these ongoing costs, we have provided an example and calculated the expenses paid by investors during the reporting period. The information in the following table is based on an initial investment of $1,000.00, which is invested at the beginning of the reporting period and held for the entire period. Expense information is calculated two ways and each method provides you with different information. The amount listed in the "actual" column is calculated using the fund's actual operating expenses and total return for the period. The amount listed in the "hypothetical" column assumes that the return each year is 5% before expenses and is calculated based on the fund's actual operating expenses. You should not use the hypothetical account values and expenses to estimate either your actual account balance at the end of the period or the expenses you paid during this reporting period.
Estimating your actual expenses
To estimate the expenses that you paid over the period, first you will need your account balance at the end of the period:
1. Divide your ending account balance by $1,000.00. For example, if an account balance was $8,600.00 at the end of the period, the result would be 8.6.
2. In the section of the table below titled "Expenses paid during the period," locate the amount under "actual." Multiply this number by the result from step 1. Your answer is an estimate of the expenses you paid on your account during the period.
February 1, 2007 – July 31, 2007
| Account value at the beginning of the period ($) | Account value at the end of the period ($) | Expenses paid during the period ($) | Fund's annualized expense ratio (%) | ||||||||||||||||||||||||
| Actual | Hypothetical | Actual | Hypothetical | Actual | Hypothetical | Actual | |||||||||||||||||||||
| 1,000.00 | 1,000.00 | 986.12 | 1,022.81 | 1.97 | 2.01 | 0.40 | |||||||||||||||||||||
Expenses paid during the period are equal to the annualized expense ratio of 0.40%, multiplied by the average account value over the period, then multiplied by the number of days in the fund's most recent fiscal half-year and divided by 365.
Had the investment advisor not reimbursed a portion of expenses, account value at end of the period would have been reduced.
It is important to note that the expense amounts shown in the table are meant to highlight only ongoing costs of investing in the fund. Therefore, the hypothetical examples provided may not help you determine the relative total costs of owning shares of different funds.
Compare with other funds
Since all mutual funds are required to include the same hypothetical calculations about expenses in shareholder reports, you can use this information to compare the ongoing costs of investing in the fund with other funds. To do so, compare the 5% hypothetical example with the 5% hypothetical examples that appear in the shareholder reports of other funds. As you compare hypothetical examples of other funds, it is important to note that hypothetical examples are meant to highlight the ongoing costs of investing in a fund.
16
CMG CORE BOND FUND
A Portfolio of Columbia Funds Institutional Trust
FINANCIAL HIGHLIGHTS
(For a Fund Share Outstanding Throughout Each Period)
| Year Ended July 31, | Period Ended July 31, | Year Ended October 31, | |||||||||||||||||||||||||
| 2007 | 2006 | 2005 | 2004 | 2003 (a) | 2002 | ||||||||||||||||||||||
| Net asset value, beginning of period | $ | 10.05 | $ | 10.42 | $ | 10.36 | $ | 10.38 | $ | 10.52 | $ | 10.83 | |||||||||||||||
| Income from investment operations: | |||||||||||||||||||||||||||
| Net investment income (b) | 0.52 | 0.48 | 0.42 | 0.37 | 0.31 | 0.56 | |||||||||||||||||||||
| Net realized and unrealized gain (loss) on investments and futures contracts | (0.02 | ) | (0.33 | ) | 0.09 | 0.11 | (0.12 | ) | (0.15 | ) | |||||||||||||||||
| Total from investment operations | 0.50 | 0.15 | 0.51 | 0.48 | 0.19 | 0.41 | |||||||||||||||||||||
| Less distributions declared to shareholders: | |||||||||||||||||||||||||||
| From net investment income | (0.52 | ) | (0.51 | ) | (0.45 | ) | (0.41 | ) | (0.33 | ) | (0.58 | ) | |||||||||||||||
| From net realized gains | - | (0.01 | ) | - | (0.09 | ) | - | (0.14 | ) | ||||||||||||||||||
| Total distributions | (0.52 | ) | (0.52 | ) | (0.45 | ) | (0.50 | ) | (0.33 | ) | (0.72 | ) | |||||||||||||||
| Net asset value, end of period | $ | 10.03 | $ | 10.05 | $ | 10.42 | $ | 10.36 | $ | 10.38 | $ | 10.52 | |||||||||||||||
| Total return (c)(d) | 5.06 | % | 1.46 | % | 4.98 | % | 4.67 | % | 1.76 | %(e) | 3.97 | % | |||||||||||||||
| Ratios/Supplemental data: | |||||||||||||||||||||||||||
| Net assets, end of period (000's) | $ | 67,673 | $ | 56,181 | $ | 79,102 | $ | 32,810 | $ | 30,512 | $ | 27,412 | |||||||||||||||
| Ratio of net expenses to average net assets | 0.25 | % | 0.25 | %(f) | 0.25 | %(f) | 0.35 | %(f) | 0.40 | %(f)(g) | 0.40 | %(f) | |||||||||||||||
| Ratio of net investment income to average net assets | 5.07 | % | 4.65 | %(f) | 4.01 | %(f) | 3.54 | %(f) | 3.95 | %(f)(g) | 5.34 | %(f) | |||||||||||||||
| Reimbursement | 0.13 | % | 0.10 | % | 0.06 | % | 0.25 | % | 0.29 | %(g) | 0.16 | % | |||||||||||||||
| Portfolio turnover rate | 95 | % | 109 | % | 130 | % | 231 | % | 181 | %(e) | 147 | % | |||||||||||||||
(a) The Fund changed its fiscal year end from October 31 to July 31.
(b) Per share data was calculated using the average shares outstanding during the period.
(c) Total return at net asset value assuming all distributions reinvested.
(d) Had the investment advisor not reimbursed a portion of expenses, total return would have been reduced.
(e) Not annualized.
(f) The benefits derived from custody credits had an impact of less than 0.01%.
(g) Annualized.
See Accompanying Notes to Financial Statements.
17
CMG SHORT TERM BOND FUND
A Portfolio of Columbia Funds Institutional Trust
FINANCIAL HIGHLIGHTS
(For a Fund Share Outstanding Throughout Each Period)
| Year Ended July 31, | Period Ended July 31, | Year Ended October 31, | |||||||||||||||||||||||||
| 2007 | 2006 | 2005 | 2004 | 2003 (a) | 2002 | ||||||||||||||||||||||
| Net asset value, beginning of period | $ | 11.59 | $ | 11.79 | $ | 11.95 | $ | 12.01 | $ | 12.15 | $ | 12.41 | |||||||||||||||
| Income from investment operations: | |||||||||||||||||||||||||||
| Net investment income (b) | 0.57 | 0.50 | 0.40 | 0.35 | 0.34 | 0.59 | |||||||||||||||||||||
| Net realized and unrealized gain (loss) on investments, foreign currency transactions and futures contracts | 0.03 | (0.14 | ) | (0.11 | ) | (0.03 | ) | (0.11 | ) | (0.22 | ) | ||||||||||||||||
| Total from investment operations | 0.60 | 0.36 | 0.29 | 0.32 | 0.23 | 0.37 | |||||||||||||||||||||
| Less distributions declared to shareholders: | |||||||||||||||||||||||||||
| From net investment income | (0.61 | ) | (0.56 | ) | (0.45 | ) | (0.38 | ) | (0.37 | ) | (0.63 | ) | |||||||||||||||
| Net asset value, end of period | $ | 11.58 | $ | 11.59 | $ | 11.79 | $ | 11.95 | $ | 12.01 | $ | 12.15 | |||||||||||||||
| Total return (c)(d) | 5.25 | % | 3.15 | % | 2.47 | % | 2.72 | % | 1.91 | %(e) | 3.12 | % | |||||||||||||||
| Ratios/Supplemental data: | |||||||||||||||||||||||||||
| Net assets, end of period (000's) | $ | 138,432 | $ | 83,984 | $ | 95,842 | $ | 119,125 | $ | 113,193 | $ | 140,757 | |||||||||||||||
| Ratio of net expenses to average net assets | 0.25 | % | 0.25 | %(f) | 0.25 | %(f) | 0.25 | %(f) | 0.25 | %(f)(g) | 0.25 | %(f) | |||||||||||||||
| Ratio of interest expense to average net assets | - | - | - | - | - | %(g)(h) | - | ||||||||||||||||||||
| Ratio of net investment income to average net assets | 4.87 | % | 4.31 | %(f) | 3.38 | %(f) | 2.91 | %(f) | 3.79 | %(f)(g) | 4.73 | %(f) | |||||||||||||||
| Reimbursement | 0.07 | % | 0.08 | % | 0.04 | % | 0.10 | % | 0.08 | %(g) | 0.05 | % | |||||||||||||||
| Portfolio turnover rate | 67 | % | 128 | % | 51 | % | 79 | % | 93 | %(e) | 132 | % | |||||||||||||||
(a) The Fund changed its fiscal year end from October 31 to July 31.
(b) Per share data was calculated using the average shares outstanding during the period.
(c) Total return at net asset value assuming all distributions reinvested.
(d) Had the investment advisor not reimbursed a portion of expenses, total return would have been reduced.
(e) Not annualized.
(f) The benefits derived from custody credits had an impact of less than 0.01%.
(g) Annualized.
(h) Rounds to less than 0.01%.
See Accompanying Notes to Financial Statements.
18
CMG ULTRA SHORT TERM BOND FUND
A Portfolio of Columbia Funds Institutional Trust
FINANCIAL HIGHLIGHTS
(For a Fund Share Outstanding Throughout Each Period)
| Year Ended July 31, | Period Ended July 31, | ||||||||||||||||||
| 2007 | 2006 | 2005 | 2004 (a) | ||||||||||||||||
| Net asset value, beginning of period | $ | 9.62 | $ | 9.67 | $ | 9.88 | $ | 10.00 | |||||||||||
| Income from investment operations: | |||||||||||||||||||
| Net investment income (b) | 0.47 | 0.38 | 0.24 | 0.07 | |||||||||||||||
| Net realized and unrealized loss on investments | (0.03 | ) | (0.02 | ) | (0.06 | ) | (0.08 | ) | |||||||||||
| Total from investment operations | 0.44 | 0.36 | 0.18 | (0.01 | ) | ||||||||||||||
| Less distributions declared to shareholders: | |||||||||||||||||||
| From net investment income | (0.47 | ) | (0.41 | ) | (0.36 | ) | (0.11 | ) | |||||||||||
| Return of capital | - | - | (c) | (0.03 | ) | - | |||||||||||||
| Total distributions | (0.47 | ) | (0.41 | ) | (0.39 | ) | (0.11 | ) | |||||||||||
| Net asset value, end of period | $ | 9.59 | $ | 9.62 | $ | 9.67 | $ | 9.88 | |||||||||||
| Total return (d)(e) | 4.62 | %(f) | 3.84 | % | 1.83 | % | (0.08 | )%(g) | |||||||||||
| Ratios/Supplemental data: | |||||||||||||||||||
| Net assets, end of period (000's) | $ | 152,793 | $ | 89,863 | $ | 81,575 | $ | 67,235 | |||||||||||
| Ratio of net expenses to average net assets | 0.25 | % | 0.25 | %(h) | 0.25 | %(h) | 0.25 | %(h)(i) | |||||||||||
| Ratio of net investment income to average net assets | 4.88 | % | 3.93 | %(h) | 2.44 | %(h) | 1.69 | %(h)(i) | |||||||||||
| Reimbursement | 0.06 | % | 0.07 | % | 0.05 | % | 0.22 | %(i) | |||||||||||
| Portfolio turnover rate | 108 | % | 48 | % | 75 | % | 12 | %(g) | |||||||||||
(a) The Fund commenced investment operations on March 8, 2004. Per share data, total return and portfolio turnover reflect activity from that date.
(b) Per share data was calculated using the average shares outstanding during the period.
(c) Rounds to less than $0.01 per share.
(d) Total return at net asset value assuming all distributions reinvested.
(e) Had the investment advisor not reimbursed a portion of expenses, total return would have been reduced.
(f) Total return includes a voluntary reimbursement by the investment adviser for a realized investment loss due to a trading error. This reimbursement had an impact of less than 0.01% on the Fund's total return.
(g) Not annualized.
(h) The benefits derived from custody credits had an impact of less than 0.01%.
(i) Annualized.
See Accompanying Notes to Financial Statements.
19
CMG HIGH YIELD FUND
A Portfolio of Columbia Funds Institutional Trust
FINANCIAL HIGHLIGHTS
(For a Fund Share Outstanding Throughout Each Period)
| Year Ended July 31, | Period Ended July 31, | Year Ended October 31, | |||||||||||||||||||||||||
| 2007 | 2006 | 2005 | 2004 | 2003 (a) | 2002 | ||||||||||||||||||||||
| Net asset value, beginning of period | $ | 7.66 | $ | 8.08 | $ | 8.00 | $ | 7.90 | $ | 7.55 | $ | 8.14 | |||||||||||||||
| Income from investment operations: | |||||||||||||||||||||||||||
| Net investment income (b) | 0.53 | 0.50 | 0.51 | 0.53 | 0.43 | 0.64 | |||||||||||||||||||||
| Net realized and unrealized gain (loss) on investments and foreign currency transactions | (0.16 | ) | (0.38 | ) | 0.11 | 0.14 | 0.37 | (0.58 | ) | ||||||||||||||||||
| Total from investment operations | 0.37 | 0.12 | 0.62 | 0.67 | 0.80 | 0.06 | |||||||||||||||||||||
| Less distributions declared to shareholders: | |||||||||||||||||||||||||||
| From net investment income | (0.55 | ) | (0.54 | ) | (0.54 | ) | (0.57 | ) | (0.45 | ) | (0.65 | ) | |||||||||||||||
| Net asset value, end of period | $ | 7.48 | $ | 7.66 | $ | 8.08 | $ | 8.00 | $ | 7.90 | $ | 7.55 | |||||||||||||||
| Total return (c) | 4.76 | %(d) | 1.47 | %(d) | 7.98 | %(d) | 8.60 | %(d) | 10.67 | %(d)(e) | 0.60 | % | |||||||||||||||
| Ratios/Supplemental data: | |||||||||||||||||||||||||||
| Net assets, end of period (000's) | $ | 62,173 | $ | 96,120 | $ | 269,243 | $ | 382,157 | $ | 429,042 | $ | 286,228 | |||||||||||||||
| Ratio of net expenses to average net assets | 0.40 | % | 0.40 | %(f) | 0.40 | %(f) | 0.40 | %(f) | 0.42 | %(f)(g) | 0.42 | %(f) | |||||||||||||||
| Ratio of net investment income to average net assets | 6.70 | % | 6.38 | %(f) | 6.26 | %(f) | 6.64 | %(f) | 7.32 | %(f)(g) | 7.98 | %(f) | |||||||||||||||
| Reimbursement | 0.09 | % | 0.04 | % | 0.02 | % | 0.02 | % | 0.01 | %(g) | - | ||||||||||||||||
| Portfolio turnover rate | 57 | % | 30 | % | 39 | % | 47 | % | 47 | %(e) | 62 | % | |||||||||||||||
(a) The Fund changed its fiscal year end from October 31 to July 31.
(b) Per share data was calculated using the average shares outstanding during the period.
(c) Total return at net asset value assuming all distributions reinvested.
(d) Had the investment advisor not reimbursed a portion of expenses, total return would have been reduced.
(e) Not annualized.
(f) The benefits derived from custody credits had an impact of less than 0.01%.
(g) Annualized.
See Accompanying Notes to Financial Statements.
20
CMG CORE BOND FUND
A Portfolio of Columbia Funds Institutional Trust
SCHEDULE OF INVESTMENTS
July 31, 2007
| Par | Value | ||||||||||
| Mortgage-Backed Securities (33.9%) | |||||||||||
| Federal Home Loan Mortgage Corp. | |||||||||||
| 4.000% 11/01/20 | $ | 242,610 | $ | 225,375 | |||||||
| 5.000% 11/01/21 | 361,005 | 350,406 | |||||||||
| 5.500% 11/01/17 | 86,698 | 86,024 | |||||||||
| 5.500% 03/01/18 | 68,786 | 68,251 | |||||||||
| 5.500% 07/01/21 | 133,338 | 131,701 | |||||||||
| 5.500% 08/01/21 | 541,996 | 535,343 | |||||||||
| 5.500% 11/01/21 | 290,417 | 286,852 | |||||||||
| 5.500% 08/01/35 | 1,360,734 | 1,318,144 | |||||||||
| 5.500% 06/01/37 | 781,253 | 754,745 | |||||||||
| 6.000% 05/01/17 | 128,424 | 129,356 | |||||||||
| Federal National Mortgage Association | |||||||||||
| 5.000% 05/01/37 | 4,647,500 | 4,362,686 | |||||||||
| 5.500% 11/01/21 | 702,000 | 693,399 | |||||||||
| 5.500% 04/01/36 | 158,237 | 152,904 | |||||||||
| 5.500% 11/01/36 | 1,469,650 | 1,420,120 | |||||||||
| 5.500% 04/01/37 | 793,125 | 765,966 | |||||||||
| 5.500% 06/01/37 | 2,116,380 | 2,043,910 | |||||||||
| 6.000% 07/01/35 | 166,363 | 165,146 | |||||||||
| 6.000% 05/01/36 | 532,191 | 527,664 | |||||||||
| 6.000% 09/01/36 | 1,061,146 | 1,052,120 | |||||||||
| 6.000% 10/01/36 | 344,758 | 341,826 | |||||||||
| 6.000% 11/01/36 | 455,531 | 451,657 | |||||||||
| 6.000% 03/01/37 | 74,801 | 74,119 | |||||||||
| 6.000% 06/01/37 | 844,701 | 837,006 | |||||||||
| 6.000% 07/01/37 | 1,287,577 | 1,275,848 | |||||||||
| 6.000% 08/01/37 | 903,904 | 895,430 | |||||||||
| 6.500% 02/01/13 | 11,931 | 12,198 | |||||||||
| 6.500% 08/01/34 | 68,052 | 69,057 | |||||||||
| 6.500% 03/01/37 | 1,247,098 | 1,259,734 | |||||||||
| 6.500% 06/01/37 | 2,220,000 | 2,242,495 | |||||||||
| 7.000% 07/01/32 | 20,638 | 21,388 | |||||||||
| TBA, | |||||||||||
| 6.000% 08/01/37 (a) | 336,000 | 332,850 | |||||||||
| Government National Mortgage Association | |||||||||||
| 7.000% 01/15/32 | 7,705 | 8,047 | |||||||||
| 7.000% 03/15/32 | 28,939 | 30,225 | |||||||||
| 7.000% 06/15/32 | 4,060 | 4,241 | |||||||||
| Total Mortgage-Backed Securities (Cost of $23,205,118) | 22,926,233 | ||||||||||
| Corporate Fixed-Income Bonds & Notes (23.0%) | |||||||||||
| Basic Materials (0.4%) | |||||||||||
| Chemicals (0.0%) | |||||||||||
| E.I. Dupont De Nemours & Co. | |||||||||||
| 3.375% 11/15/07 | 5,000 | 4,969 | |||||||||
See Accompanying Notes to Financial Statements.
21
CMG CORE BOND FUND
A Portfolio of Columbia Funds Institutional Trust
SCHEDULE OF INVESTMENTS
| Par | Value | ||||||||||
| Corporate Fixed-Income Bonds & Notes (continued) | |||||||||||
| Forest Products & Paper (0.2%) | |||||||||||
| Weyerhaeuser Co. | |||||||||||
| 7.375% 03/15/32 (b) | $ | 125,000 | $ | 123,432 | |||||||
| Metals & Mining (0.2%) | |||||||||||
| Vale Overseas Ltd. | |||||||||||
| 6.250% 01/23/17 | 150,000 | 148,479 | |||||||||
| 276,880 | |||||||||||
| Communications (3.3%) | |||||||||||
| Media (0.9%) | |||||||||||
| Comcast Corp. | |||||||||||
| 7.050% 03/15/33 | 250,000 | 255,180 | |||||||||
| News America, Inc. | |||||||||||
| 6.550% 03/15/33 | 175,000 | 170,044 | |||||||||
| Time Warner Cable, Inc. | |||||||||||
| 6.550% 05/01/37 (c) | 225,000 | 214,910 | |||||||||
| 640,134 | |||||||||||
| Telecommunication Services (2.4%) | |||||||||||
| AT&T, Inc. | |||||||||||
| 4.125% 09/15/09 | 200,000 | 195,098 | |||||||||
| New Cingular Wireless Services, Inc. | |||||||||||
| 8.750% 03/01/31 | 250,000 | 309,394 | |||||||||
| Sprint Capital Corp. | |||||||||||
| 6.875% 11/15/28 | 200,000 | 187,262 | |||||||||
| Telecom Italia Capital SA | |||||||||||
| 7.200% 07/18/36 | 250,000 | 253,784 | |||||||||
| Telefonica Emisones SAU | |||||||||||
| 5.984% 06/20/11 (b) | 225,000 | 226,078 | |||||||||
| Verizon Global Funding Corp. | |||||||||||
| 7.750% 12/01/30 | 250,000 | 276,109 | |||||||||
| Vodafone Group PLC | |||||||||||
| 5.000% 12/16/13 | 188,000 | 177,452 | |||||||||
| 1,625,177 | |||||||||||
| 2,265,311 | |||||||||||
| Consumer Cyclical (1.1%) | |||||||||||
| Home Builders (0.3%) | |||||||||||
| D.R. Horton, Inc. | |||||||||||
| 5.625% 09/15/14 | 225,000 | 200,227 | |||||||||
| Retail (0.8%) | |||||||||||
| Home Depot, Inc. | |||||||||||
| 5.875% 12/16/36 | 150,000 | 130,238 | |||||||||
| Macy's Retail Holdings, Inc. | |||||||||||
| 5.900% 12/01/16 | 175,000 | 169,264 | |||||||||
| Wal-Mart Stores, Inc. | |||||||||||
| 4.125% 07/01/10 | 225,000 | 218,652 | |||||||||
| 518,154 | |||||||||||
| 718,381 | |||||||||||
See Accompanying Notes to Financial Statements.
22
CMG CORE BOND FUND
A Portfolio of Columbia Funds Institutional Trust
SCHEDULE OF INVESTMENTS
| Par | Value | ||||||||||
| Corporate Fixed-Income Bonds & Notes (continued) | |||||||||||
| Consumer Non-Cyclical (1.6%) | |||||||||||
| Beverages (0.4%) | |||||||||||
| Anheuser-Busch Companies, Inc. | |||||||||||
| 5.950% 01/15/33 (b) | $ | 12,000 | $ | 11,311 | |||||||
| Coca-Cola Co. | |||||||||||
| 5.750% 03/15/11 (b) | 4,000 | 4,077 | |||||||||
| Diageo Capital PLC | |||||||||||
| 3.375% 03/20/08 (b) | 175,000 | 172,665 | |||||||||
| 3.500% 11/19/07 | 110,000 | 109,323 | |||||||||
| PepsiCo, Inc. | |||||||||||
| 5.750% 01/15/08 (b) | 6,000 | 6,008 | |||||||||
| 303,384 | |||||||||||
| Cosmetics/Personal Care (0.1%) | |||||||||||
| Gillette Co. | |||||||||||
| 2.500% 06/01/08 | 85,000 | 83,034 | |||||||||
| Food (0.5%) | |||||||||||
| ConAgra Foods, Inc. | |||||||||||
| 6.750% 09/15/11 (b) | 150,000 | 155,583 | |||||||||
| Kroger Co. | |||||||||||
| 6.200% 06/15/12 | 185,000 | 188,240 | |||||||||
| 343,823 | |||||||||||
| Healthcare Products (0.0%) | |||||||||||
| Johnson & Johnson | |||||||||||
| 6.625% 09/01/09 | 7,000 | 7,229 | |||||||||
| Healthcare Services (0.3%) | |||||||||||
| UnitedHealth Group, Inc. | |||||||||||
| 3.375% 08/15/07 | 200,000 | 199,855 | |||||||||
| Household Products/Wares (0.3%) | |||||||||||
| Fortune Brands, Inc. | |||||||||||
| 5.375% 01/15/16 | 175,000 | 166,159 | |||||||||
| Kimberly-Clark Corp. | |||||||||||
| 5.625% 02/15/12 (b) | 7,000 | 7,065 | |||||||||
| 173,224 | |||||||||||
| 1,110,549 | |||||||||||
| Energy (1.8%) | |||||||||||
| Oil & Gas (1.3%) | |||||||||||
| Canadian Natural Resources Ltd. | |||||||||||
| 5.700% 05/15/17 | 175,000 | 169,456 | |||||||||
| ChevronTexaco Capital Co. | |||||||||||
| 3.500% 09/17/07 | 211,000 | 210,549 | |||||||||
| Nexen, Inc. | �� | ||||||||||
| 5.875% 03/10/35 | 150,000 | 135,624 | |||||||||
| Talisman Energy, Inc. | |||||||||||
| 6.250% 02/01/38 (b) | 190,000 | 178,808 | |||||||||
See Accompanying Notes to Financial Statements.
23
CMG CORE BOND FUND
A Portfolio of Columbia Funds Institutional Trust
SCHEDULE OF INVESTMENTS
| Par | Value | ||||||||||
| Corporate Fixed-Income Bonds & Notes (continued) | |||||||||||
| Oil & Gas (continued) | |||||||||||
| Valero Energy Corp. | |||||||||||
| 6.875% 04/15/12 | $ | 200,000 | $ | 208,781 | |||||||
| 903,218 | |||||||||||
| Pipelines (0.5%) | |||||||||||
| Energy Transfer Partners LP | |||||||||||
| 6.625% 10/15/36 (b) | 150,000 | 141,604 | |||||||||
| TransCanada Pipelines Ltd. | |||||||||||
| 6.350% 05/15/67 (d) | 190,000 | 177,835 | |||||||||
| 319,439 | |||||||||||
| 1,222,657 | |||||||||||
| Financials (11.8%) | |||||||||||
| Banks (3.6%) | |||||||||||
| Bank of New York Co., Inc. | |||||||||||
| 3.900% 09/01/07 (b) | 12,000 | 11,986 | |||||||||
| Bank One Corp. | |||||||||||
| 6.000% 08/01/08 | 27,000 | 27,133 | |||||||||
| Barclays Bank PLC | |||||||||||
| 7.400% 12/15/09 | 3,000 | 3,153 | |||||||||
| Capital One Financial Corp. | |||||||||||
| 5.500% 06/01/15 (b) | 275,000 | 261,134 | |||||||||
| Marshall & Ilsley Corp. | |||||||||||
| 4.375% 08/01/09 | 325,000 | 318,826 | |||||||||
| National City Bank | |||||||||||
| 4.625% 05/01/13 | 18,000 | 17,146 | |||||||||
| PNC Funding Corp. | |||||||||||
| 5.625% 02/01/17 | 310,000 | 302,440 | |||||||||
| SunTrust Banks, Inc. | |||||||||||
| 6.375% 04/01/11 | 3,000 | 3,090 | |||||||||
| SunTrust Preferred Capital I | |||||||||||
| 5.853% 12/15/11 (d) | 240,000 | 235,931 | |||||||||
| USB Capital IX | |||||||||||
| 6.189% 04/15/49 (d) | 275,000 | 271,772 | |||||||||
| Wachovia Corp. | |||||||||||
| 4.875% 02/15/14 | 525,000 | 496,209 | |||||||||
| Wells Fargo & Co. | |||||||||||
| 3.500% 04/04/08 | 120,000 | 118,384 | |||||||||
| 5.125% 09/01/12 (b) | 400,000 | 394,669 | |||||||||
| 2,461,873 | |||||||||||
| Diversified Financial Services (6.4%) | |||||||||||
| AGFC Capital Trust I | |||||||||||
| 6.000% 01/15/67 (c) | 185,000 | 174,501 | |||||||||
| American Express Co. | |||||||||||
| 3.750% 11/20/07 | 5,000 | 4,974 | |||||||||
| 4.750% 06/17/09 | 8,000 | 7,941 | |||||||||
| American Express Credit Corp. | |||||||||||
| 3.000% 05/16/08 | 300,000 | 294,505 | |||||||||
See Accompanying Notes to Financial Statements.
24
CMG CORE BOND FUND
A Portfolio of Columbia Funds Institutional Trust
SCHEDULE OF INVESTMENTS
| Par | Value | ||||||||||
| Corporate Fixed-Income Bonds & Notes (continued) | |||||||||||
| Diversified Financial Services (continued) | |||||||||||
| American General Finance Corp. | |||||||||||
| 2.750% 06/15/08 (b) | $ | 5,000 | $ | 4,900 | |||||||
| Associates Corp. of North America | |||||||||||
| 6.950% 11/01/18 | 11,000 | 11,798 | |||||||||
| CIT Group, Inc. | |||||||||||
| 3.375% 04/01/09 | 23,000 | 22,167 | |||||||||
| 6.100% 03/15/67 (d) | 75,000 | 64,545 | |||||||||
| Citigroup Global Markets Holdings, Inc. | |||||||||||
| 6.500% 02/15/08 | 6,000 | 6,033 | |||||||||
| Citigroup, Inc. | |||||||||||
| 5.000% 09/15/14 | 555,000 | 527,202 | |||||||||
| Countrywide Financial Corp. | |||||||||||
| 5.800% 06/07/12 | 175,000 | 168,249 | |||||||||
| Credit Suisse First Boston USA, Inc. | |||||||||||
| 4.875% 08/15/10 | 500,000 | 494,073 | |||||||||
| General Electric Capital Corp. | |||||||||||
| 5.000% 01/08/16 (b) | 525,000 | 499,291 | |||||||||
| 6.750% 03/15/32 (b) | 27,000 | 29,401 | |||||||||
| Goldman Sachs Group, Inc. | |||||||||||
| 4.125% 01/15/08 | 4,000 | 3,975 | |||||||||
| 6.345% 02/15/34 (b) | 300,000 | 274,095 | |||||||||
| HSBC Finance Corp. | |||||||||||
| 5.000% 06/30/15 | 475,000 | 440,504 | |||||||||
| International Lease Finance Corp. | |||||||||||
| 4.500% 05/01/08 | 4,000 | 3,966 | |||||||||
| JPMorgan Chase Capital XVIII | |||||||||||
| 6.950% 08/17/36 | 275,000 | 263,574 | |||||||||
| Lehman Brothers Holdings, Inc. | |||||||||||
| 4.000% 01/22/08 | 27,000 | 26,780 | |||||||||
| Merrill Lynch & Co., Inc. | |||||||||||
| 3.700% 04/21/08 | 8,000 | 7,888 | |||||||||
| 4.125% 01/15/09 | 300,000 | 294,308 | |||||||||
| 6.000% 02/17/09 | 12,000 | 12,094 | |||||||||
| Morgan Stanley | |||||||||||
| 4.750% 04/01/14 | 425,000 | 398,495 | |||||||||
| Residential Capital LLC | |||||||||||
| 6.500% 04/17/13 | 145,000 | 130,120 | |||||||||
| SLM Corp. | |||||||||||
| 5.375% 05/15/14 | 150,000 | 128,797 | |||||||||
| 4,294,176 | |||||||||||
| Insurance (0.9%) | |||||||||||
| AMBAC Financial Group, Inc. | |||||||||||
| 6.150% 02/15/37 (d) | 90,000 | 73,157 | |||||||||
| American International Group, Inc. | |||||||||||
| 2.875% 05/15/08 | 250,000 | 245,014 | |||||||||
| Hartford Financial Services Group, Inc. | |||||||||||
| 4.700% 09/01/07 | 100,000 | 99,930 | |||||||||
See Accompanying Notes to Financial Statements.
25
CMG CORE BOND FUND
A Portfolio of Columbia Funds Institutional Trust
SCHEDULE OF INVESTMENTS
| Par | Value | ||||||||||
| Corporate Fixed-Income Bonds & Notes (continued) | |||||||||||
| Insurance (continued) | |||||||||||
| John Hancock Financial Services, Inc. | |||||||||||
| 5.625% 12/01/08 | $ | 15,000 | $ | 15,067 | |||||||
| Metlife, Inc. | |||||||||||
| 5.375% 12/15/12 (b) | 20,000 | 19,908 | |||||||||
| 6.400% 12/15/36 | 150,000 | 134,138 | |||||||||
| 587,214 | |||||||||||
| Real Estate Investment Trusts (REITs) (0.5%) | |||||||||||
| Health Care Property Investors, Inc. | |||||||||||
| 6.450% 06/25/12 | 150,000 | 153,157 | |||||||||
| Simon Property Group LP | |||||||||||
| 5.750% 12/01/15 | 175,000 | 172,598 | |||||||||
| 325,755 | |||||||||||
| Savings & Loans (0.4%) | |||||||||||
| Washington Mutual, Inc. | |||||||||||
| 4.200% 01/15/10 | 300,000 | 291,762 | |||||||||
| 7,960,780 | |||||||||||
| Industrials (1.0%) | |||||||||||
| Aerospace & Defense (0.4%) | |||||||||||
| Boeing Co. | |||||||||||
| 5.125% 02/15/13 | 1,000 | 992 | |||||||||
| United Technologies Corp. | |||||||||||
| 7.125% 11/15/10 | 250,000 | 264,921 | |||||||||
| 265,913 | |||||||||||
| Machinery (0.3%) | |||||||||||
| Caterpillar Financial Services Corp. | |||||||||||
| 4.300% 06/01/10 | 200,000 | 195,700 | |||||||||
| Transportation (0.3%) | |||||||||||
| Union Pacific Corp. | |||||||||||
| 3.875% 02/15/09 | 185,000 | 181,134 | |||||||||
| 642,747 | |||||||||||
| Utilities (2.0%) | |||||||||||
| Electric (1.6%) | |||||||||||
| Commonwealth Edison Co. | |||||||||||
| 3.700% 02/01/08 (b) | 11,000 | 10,901 | |||||||||
| 5.950% 08/15/16 | 200,000 | 197,880 | |||||||||
| Indiana Michigan Power Co. | |||||||||||
| 5.650% 12/01/15 | 205,000 | 200,672 | |||||||||
| National Rural Utilities Cooperative Finance Corp. | |||||||||||
| 3.250% 10/01/07 | 6,000 | 5,978 | |||||||||
| Pacific Gas & Electric Co. | |||||||||||
| 5.800% 03/01/37 | 240,000 | 224,710 | |||||||||
| Progress Energy, Inc. | |||||||||||
| 7.750% 03/01/31 | 200,000 | 230,573 | |||||||||
| Public Service Electric & Gas Co. | |||||||||||
| 4.000% 11/01/08 | 5,000 | 4,910 | |||||||||
| Southern California Edison Co. | |||||||||||
| 5.000% 01/15/14 | 200,000 | 192,588 | |||||||||
| 1,068,212 | |||||||||||
See Accompanying Notes to Financial Statements.
26
CMG CORE BOND FUND
A Portfolio of Columbia Funds Institutional Trust
SCHEDULE OF INVESTMENTS
| Par | Value | ||||||||||
| Corporate Fixed-Income Bonds & Notes (continued) | |||||||||||
| Gas (0.4%) | |||||||||||
| Atmos Energy Corp. | |||||||||||
| 6.350% 06/15/17 | $ | 175,000 | $ | 177,880 | |||||||
| Sempra Energy | |||||||||||
| 4.750% 05/15/09 | 100,000 | 99,047 | |||||||||
| 276,927 | |||||||||||
| 1,345,139 | |||||||||||
| Total Corporate Fixed-Income Bonds & Notes (Cost of $15,984,087) | 15,542,444 | ||||||||||
| Government & Agency Obligations (14.5%) | |||||||||||
| Foreign Government Obligations (1.4%) | |||||||||||
| Hellenic Republic of Greece | |||||||||||
| 6.950% 03/04/08 | 13,000 | 13,139 | |||||||||
| Province of Ontario | |||||||||||
| 3.500% 09/17/07 (b) | 350,000 | 349,125 | |||||||||
| Province of Quebec | |||||||||||
| 5.000% 07/17/09 | 350,000 | 349,779 | |||||||||
| United Mexican States | |||||||||||
| 7.500% 04/08/33 | 205,000 | 235,442 | |||||||||
| 947,485 | |||||||||||
| U.S. Government Agencies (6.2%) | |||||||||||
| Federal Home Loan Bank | |||||||||||
| 5.500% 08/13/14 (b) | 850,000 | 862,764 | |||||||||
| Federal Home Loan Mortgage Corp. | |||||||||||
| 4.875% 11/15/13 (b) | 130,000 | 127,668 | |||||||||
| 5.500% 08/23/17 (b) | 725,000 | 731,033 | |||||||||
| 6.625% 09/15/09 | 275,000 | 284,165 | |||||||||
| Federal National Mortgage Association | |||||||||||
| 3.375% 12/15/08 (b) | 610,000 | 597,504 | |||||||||
| 4.625% 10/15/14 (b) | 34,000 | 32,785 | |||||||||
| 5.250% 08/01/12 | 1,525,000 | 1,524,988 | |||||||||
| 4,160,907 | |||||||||||
| U.S. Government Obligations (6.9%) | |||||||||||
| U.S. Treasury Bonds | |||||||||||
| 5.375% 02/15/31 (b) | 2,570,000 | 2,713,157 | |||||||||
| U.S. Treasury Notes | |||||||||||
| 3.375% 10/15/09 (b) | 1,500,000 | 1,463,203 | |||||||||
| 3.875% 02/15/13 (b) | 530,000 | 511,119 | |||||||||
| 4,687,479 | |||||||||||
| Total Government & Agency Obligations (Cost of $9,642,931) | 9,795,871 | ||||||||||
See Accompanying Notes to Financial Statements.
27
CMG CORE BOND FUND
A Portfolio of Columbia Funds Institutional Trust
SCHEDULE OF INVESTMENTS
| Par | Value | ||||||||||
| Collateralized Mortgage Obligations (12.8%) | |||||||||||
| Agency (3.3%) | |||||||||||
| Federal Home Loan Mortgage Corp. | |||||||||||
| 3.750% 12/15/11 | $ | 57,934 | $ | 56,295 | |||||||
| 4.000% 09/15/15 | 510,000 | 498,131 | |||||||||
| 4.500% 10/15/18 | 297,304 | 292,903 | |||||||||
| 6.500% 10/15/23 | 100,000 | 102,756 | |||||||||
| Government National Mortgage Association | |||||||||||
| 4.430% 04/16/34 | 90,000 | 86,905 | |||||||||
| 4.500% 04/16/28 | 1,000,000 | 982,014 | |||||||||
| 4.807% 08/16/32 | 90,000 | 87,572 | |||||||||
| 4.954% 05/16/31 | 100,000 | 94,554 | |||||||||
| 2,201,130 | |||||||||||
| Non-Agency (9.5%) | |||||||||||
| Bear Stearns Adjustable Rate Mortgage Trust | |||||||||||
| 5.493% 02/25/47 (d) | 1,087,309 | 1,088,512 | |||||||||
| Bear Stearns Asset Backed Securities, Inc. | |||||||||||
| 5.000% 01/25/34 (d) | 227,805 | 224,610 | |||||||||
| Countrywide Alternative Loan Trust | |||||||||||
| 5.250% 03/25/35 | 706,018 | 694,658 | |||||||||
| 5.250% 08/25/35 | 567,233 | 563,726 | |||||||||
| 5.500% 10/25/35 | 638,740 | 633,151 | |||||||||
| Countrywide Home Loan Mortgage Pass Through Trust | |||||||||||
| 4.591% 12/19/33 (d) | 223,640 | 217,181 | |||||||||
| Structured Asset Securities Corp. | |||||||||||
| 5.500% 07/25/33 | 899,482 | 862,776 | |||||||||
| WaMu Mortgage Pass-Through Certificates | |||||||||||
| 5.720% 02/25/37 (d) | 1,072,642 | 1,075,848 | |||||||||
| Washington Mutual Mortgage Securities Corp. | |||||||||||
| 5.500% 10/25/35 | 1,105,020 | 1,099,967 | |||||||||
| 6,460,429 | |||||||||||
| Total Collateralized Mortgage Obligations (Cost of $8,817,475) | 8,661,559 | ||||||||||
| Commercial Mortgage-Backed Securities (9.6%) | |||||||||||
| Bear Stearns Commercial Mortgage Securities | |||||||||||
| 4.680% 08/13/39 (d) | 30,000 | 28,530 | |||||||||
| 5.624% 03/11/39 (d) | 730,000 | 712,201 | |||||||||
| CS First Boston Mortgage Securities Corp. | |||||||||||
| 4.512% 07/15/37 | 500,000 | 487,834 | |||||||||
| Greenwich Capital Commercial Funding Corp. | |||||||||||
| 5.479% 04/10/37 (d) | 100,000 | 95,888 | |||||||||
| JPMorgan Chase Commercial Mortgage Securities Corp. | |||||||||||
| 4.780% 07/15/42 | 1,040,000 | 965,676 | |||||||||
| 5.447% 06/12/47 | 539,000 | 524,255 | |||||||||
| 5.992% 06/15/49 (d) | 600,000 | 605,574 | |||||||||
| LB-UBS Commercial Mortgage Trust | |||||||||||
| 5.103% 11/15/30 | 600,000 | 594,055 | |||||||||
See Accompanying Notes to Financial Statements.
28
CMG CORE BOND FUND
A Portfolio of Columbia Funds Institutional Trust
SCHEDULE OF INVESTMENTS
| Par | Value | ||||||||||
| Commercial Mortgage-Backed Securities (continued) | |||||||||||
| Merrill Lynch/Countrywide Commercial Mortgage Trust | |||||||||||
| 5.903% 06/12/50 (d) | $ | 1,100,000 | $ | 1,081,582 | |||||||
| Merrill Lynch Mortgage Trust | |||||||||||
| 5.417% 11/12/37 (d) | 720,000 | 694,181 | |||||||||
| Morgan Stanley Capital I | |||||||||||
| 4.970% 12/15/41 | 71,000 | 68,189 | |||||||||
| 5.370% 12/15/43 | 630,000 | 600,594 | |||||||||
| Nationslink Funding Corp. | |||||||||||
| 6.888% 11/10/30 | 26,486 | 26,476 | |||||||||
| Total Commercial Mortgage-Backed Securities (Cost of $6,650,418) | 6,485,035 | ||||||||||
| Asset-Backed Securities (2.1%) | |||||||||||
| ABFS Mortgage Loan Trust | |||||||||||
| 4.428% 12/15/33 | 24,987 | 24,788 | |||||||||
| AmeriCredit Automobile Receivables Trust | |||||||||||
| 4.870% 12/06/10 | 182,585 | 182,141 | |||||||||
| BMW Vehicle Owner Trust | |||||||||||
| 3.320% 02/25/09 | 25,457 | 25,410 | |||||||||
| Capital One Multi-Asset Execution Trust | |||||||||||
| 4.050% 03/15/13 | 250,000 | 243,381 | |||||||||
| Citicorp Residential Mortgage Securities, Inc. | |||||||||||
| 6.080% 06/25/37 | 310,000 | 310,675 | |||||||||
| Ford Credit Auto Owner Trust | |||||||||||
| 3.540% 11/15/08 | 85,691 | 85,309 | |||||||||
| Honda Auto Receivables Owner Trust | |||||||||||
| 3.060% 10/21/09 | 40,271 | 40,088 | |||||||||
| IMC Home Equity Loan Trust | |||||||||||
| 7.310% 11/20/28 | 52,829 | 52,651 | |||||||||
| 7.520% 08/20/28 | 34,563 | 34,456 | |||||||||
| Onyx Acceptance Grantor Trust | |||||||||||
| 3.890% 02/15/11 | 432,094 | 428,279 | |||||||||
| Wilshire Mortgage Loan Trust | |||||||||||
| 7.255% 05/25/28 (d) | 30,474 | 30,355 | |||||||||
| Total Asset-Backed Securities (Cost of $1,457,897) | 1,457,533 | ||||||||||
See Accompanying Notes to Financial Statements.
29
CMG CORE BOND FUND
A Portfolio of Columbia Funds Institutional Trust
SCHEDULE OF INVESTMENTS
| Shares | Value | ||||||||||
| Securities Lending Collateral (12.6%) | |||||||||||
| State Street Navigator Securities Lending Prime Portfolio (e) (7 day yield of 5.271%) | 8,525,813 | $ | 8,525,813 | ||||||||
| Total Securities Lending Collateral (Cost of $8,525,813) | 8,525,813 | ||||||||||
| Par | |||||||||||
| Short-Term Obligation (5.3%) | |||||||||||
| Repurchase agreement with Fixed Income Clearing Corp., dated 07/31/07, due on 08/01/07, at 5.030%, collateralized by a U.S. Treasury Obligation maturing 11/30/11, market value of $3,684,188(repurchase proceeds $3,610,504) | $ | 3,610,000 | 3,610,000 | ||||||||
| Total Short-Term Obligation (Cost of $3,610,000) | 3,610,000 | ||||||||||
| Total Investments (113.8%) (Cost of $77,893,739) (f) | 77,004,488 | ||||||||||
| Other Assets & Liabilities, Net (-13.8%) | (9,331,171 | ) | |||||||||
| Net Assets (100.0%) | $ | 67,673,317 | |||||||||
Notes to Schedule of Investments:
(a) Security purchased on a delayed delivery basis.
(b) All or a portion of this security was on loan at July 31, 2007. The total market value of securities on loan at July 31, 2007, is $8,364,669.
(c) Security exempt from registration pursuant to Rule 144A under the Securities Act of 1933. These securities may be resold in transactions exempt from registration, normally to qualified institutional buyers. At July 31, 2007, these securities, which are not illiquid, amounted to $389,411, which represents 0.6% of net assets.
(d) The interest rate shown on floating rate or variable rate securities reflects the rate at July 31, 2007.
(e) Investment made with cash collateral received from securities lending activity.
(f) Cost for federal income tax purposes is $77,937,201.
See Accompanying Notes to Financial Statements.
30
CMG CORE BOND FUND
A Portfolio of Columbia Funds Institutional Trust
SCHEDULE OF INVESTMENTS
At July 31, 2007, the asset allocation of the Fund is as follows:
Asset Allocation (Unaudited) | % of Net Assets | ||||||
| Mortgage-Backed Securities | 33.9 | ||||||
| Corporate Fixed-Income Bonds & Notes | 23.0 | ||||||
| Government & Agency Obligations | 14.5 | ||||||
| Collateralized Mortgage Obligations | 12.8 | ||||||
| Commercial Mortgage-Backed Securities | 9.6 | ||||||
| Asset-Backed Securities | 2.1 | ||||||
| 95.9 | |||||||
| Securities Lending Collateral | 12.6 | ||||||
| Short-Term Obligation | 5.3 | ||||||
| Other Assets & Liabilities, Net | (13.8 | ) | |||||
| 100.0 | |||||||
| Acronym | Name | ||||||
| TBA | To Be Announced | ||||||
See Accompanying Notes to Financial Statements.
31
CMG SHORT TERM BOND FUND
A Portfolio of Columbia Funds Institutional Trust
SCHEDULE OF INVESTMENTS
July 31, 2007
| Par | Value | ||||||||||
| Corporate Fixed-Income Bonds & Notes (32.0%) | |||||||||||
| Communications (3.0%) | |||||||||||
| Media (0.7%) | |||||||||||
| Comcast Corp. | |||||||||||
| 5.850% 01/15/10 | $ | 375,000 | $ | 378,076 | |||||||
| Jones Intercable, Inc. | |||||||||||
| 7.625% 04/15/08 (a) | 110,000 | 111,330 | |||||||||
| Time Warner Entertainment Co. LP | |||||||||||
| 7.250% 09/01/08 | 425,000 | 433,130 | |||||||||
| 922,536 | |||||||||||
| Telecommunication Services (2.3%) | |||||||||||
| AT&T, Inc. | |||||||||||
| 4.125% 09/15/09 | 700,000 | 682,842 | |||||||||
| Deutsche Telekom International Finance BV | |||||||||||
| 3.875% 07/22/08 | 600,000 | 591,389 | |||||||||
| Sprint Capital Corp. | |||||||||||
| 6.375% 05/01/09 | 470,000 | 475,510 | |||||||||
| Telecom Italia Capital SA | |||||||||||
| 4.000% 01/15/10 | 400,000 | 385,562 | |||||||||
| Verizon Global Funding Corp. | |||||||||||
| 4.000% 01/15/08 | 575,000 | 571,403 | |||||||||
| Vodafone Group PLC | |||||||||||
| 7.750% 02/15/10 | 500,000 | 525,096 | |||||||||
| 3,231,802 | |||||||||||
| 4,154,338 | |||||||||||
| Consumer Cyclical (1.7%) | |||||||||||
| Auto Manufacturers (0.1%) | |||||||||||
| DaimlerChrysler NA Holding Corp. | |||||||||||
| 4.750% 01/15/08 | 200,000 | 199,142 | |||||||||
| Home Builders (0.2%) | |||||||||||
| DR Horton, Inc. | |||||||||||
| 4.875% 01/15/10 | 275,000 | �� | 260,385 | ||||||||
| Retail (1.4%) | |||||||||||
| Target Corp. | |||||||||||
| 3.375% 03/01/08 (a) | 500,000 | 493,829 | |||||||||
| Wal-Mart Stores, Inc. | |||||||||||
| 6.875% 08/10/09 | 1,350,000 | 1,397,492 | |||||||||
| 1,891,321 | |||||||||||
| 2,350,848 | |||||||||||
| Consumer Non-Cyclical (2.1%) | |||||||||||
| Beverages (1.0%) | |||||||||||
| Coca-Cola Enterprises, Inc. | |||||||||||
| 5.750% 11/01/08 | 725,000 | 727,664 | |||||||||
| Diageo Capital PLC | |||||||||||
| 3.375% 03/20/08 | 700,000 | 690,661 | |||||||||
| 1,418,325 | |||||||||||
See Accompanying Notes to Financial Statements.
32
CMG SHORT TERM BOND FUND
A Portfolio of Columbia Funds Institutional Trust
SCHEDULE OF INVESTMENTS
| Par | Value | ||||||||||
| Corporate Fixed-Income Bonds & Notes (continued) | |||||||||||
| Food (0.6%) | |||||||||||
| ConAgra Foods, Inc. | |||||||||||
| 7.875% 09/15/10 | $ | 525,000 | $ | 560,024 | |||||||
| Fred Meyer, Inc. | |||||||||||
| 7.450% 03/01/08 | 275,000 | 277,929 | |||||||||
| 837,953 | |||||||||||
| Healthcare Services (0.5%) | |||||||||||
| UnitedHealth Group, Inc. | |||||||||||
| 3.375% 08/15/07 | 350,000 | 349,746 | |||||||||
| WellPoint, Inc. | |||||||||||
| 3.500% 09/01/07 | 300,000 | 299,478 | |||||||||
| 649,224 | |||||||||||
| 2,905,502 | |||||||||||
| Energy (0.8%) | |||||||||||
| Oil & Gas (0.5%) | |||||||||||
| ChevronTexaco Capital Co. | |||||||||||
| 3.500% 09/17/07 (a) | 725,000 | 723,450 | |||||||||
| Pipelines (0.3%) | |||||||||||
| TransCanada Pipelines Ltd. | |||||||||||
| 6.125% 02/19/10 | 350,000 | 356,811 | |||||||||
| 1,080,261 | |||||||||||
| Financials (19.6%) | |||||||||||
| Banks (6.0%) | |||||||||||
| Barclays Bank PLC | |||||||||||
| 7.400% 12/15/09 | 500,000 | 525,601 | |||||||||
| Fifth Third Bank | |||||||||||
| 4.200% 02/23/10 | 1,050,000 | 1,025,123 | |||||||||
| Marshall & Ilsley Corp. | |||||||||||
| 4.375% 08/01/09 | 1,090,000 | 1,069,293 | |||||||||
| Mellon Funding Corp. | |||||||||||
| 3.250% 04/01/09 | 500,000 | 483,742 | |||||||||
| PNC Funding Corp. | |||||||||||
| 4.500% 03/10/10 (a) | 900,000 | 881,945 | |||||||||
| Regions Financial Corp. | |||||||||||
| 4.500% 08/08/08 | 790,000 | 781,594 | |||||||||
| SunTrust Banks, Inc. | |||||||||||
| 4.250% 10/15/09 | 925,000 | 909,009 | |||||||||
| U.S. Bancorp | |||||||||||
| 3.125% 03/15/08 | 1,250,000 | 1,231,563 | |||||||||
| Wells Fargo & Co. | |||||||||||
| 3.120% 08/15/08 | 810,000 | 787,876 | |||||||||
| 4.000% 08/15/08 | 600,000 | 590,401 | |||||||||
| 8,286,147 | |||||||||||
See Accompanying Notes to Financial Statements.
33
CMG SHORT TERM BOND FUND
A Portfolio of Columbia Funds Institutional Trust
SCHEDULE OF INVESTMENTS
| Par | Value | ||||||||||
| Corporate Fixed-Income Bonds & Notes (continued) | |||||||||||
| Diversified Financial Services (9.6%) | |||||||||||
| American Express Centurion Bank | |||||||||||
| 4.375% 07/30/09 | $ | 1,350,000 | $ | 1,332,424 | |||||||
| Bear Stearns Co., Inc. | |||||||||||
| 4.550% 06/23/10 | 650,000 | 626,310 | |||||||||
| Capital One Bank | |||||||||||
| 5.750% 09/15/10 | 625,000 | 627,388 | |||||||||
| CIT Group, Inc. | |||||||||||
| 5.500% 11/30/07 | 700,000 | 699,318 | |||||||||
| Citigroup, Inc. | |||||||||||
| 4.250% 07/29/09 | 1,300,000 | 1,280,301 | |||||||||
| Countrywide Home Loans, Inc. | |||||||||||
| 4.125% 09/15/09 | 600,000 | 577,830 | |||||||||
| Credit Suisse First Boston USA, Inc. | |||||||||||
| 4.625% 01/15/08 | 1,225,000 | 1,220,869 | |||||||||
| General Electric Capital Corp. | |||||||||||
| 4.250% 01/15/08 | 1,350,000 | 1,343,407 | |||||||||
| Goldman Sachs Group, Inc. | |||||||||||
| 4.500% 06/15/10 | 800,000 | 781,223 | |||||||||
| HSBC Finance Corp. | |||||||||||
| 6.400% 06/17/08 | 1,375,000 | 1,386,685 | |||||||||
| JPMorgan Chase & Co. | |||||||||||
| 3.800% 10/02/09 (a) | 1,050,000 | 1,020,376 | |||||||||
| Lehman Brothers Holdings, Inc. | |||||||||||
| 3.950% 11/10/09 | 700,000 | 680,914 | |||||||||
| Merrill Lynch & Co., Inc. | |||||||||||
| 4.125% 01/15/09 | 675,000 | 662,193 | |||||||||
| Morgan Stanley | |||||||||||
| 3.875% 01/15/09 | 775,000 | 757,921 | |||||||||
| SLM Corp. | |||||||||||
| 4.000% 01/15/09 | 400,000 | 386,825 | |||||||||
| 13,383,984 | |||||||||||
| Insurance (2.1%) | |||||||||||
| Allstate Corp. | |||||||||||
| 7.200% 12/01/09 | 1,050,000 | 1,094,848 | |||||||||
| American International Group, Inc. | |||||||||||
| 2.875% 05/15/08 | 1,200,000 | 1,176,066 | |||||||||
| Genworth Financial, Inc. | |||||||||||
| 4.750% 06/15/09 | 600,000 | 594,879 | |||||||||
| 2,865,793 | |||||||||||
| Real Estate Investment Trusts (REITs) (0.4%) | |||||||||||
| Simon Property Group LP | |||||||||||
| 4.875% 03/18/10 | 600,000 | 591,411 | |||||||||
| Savings & Loans (1.5%) | |||||||||||
| Washington Mutual, Inc. | |||||||||||
| 4.000% 01/15/09 | 625,000 | 612,152 | |||||||||
| Western Financial Bank | |||||||||||
| 9.625% 05/15/12 | 1,325,000 | 1,418,859 | |||||||||
| 2,031,011 | |||||||||||
| 27,158,346 | |||||||||||
See Accompanying Notes to Financial Statements.
34
CMG SHORT TERM BOND FUND
A Portfolio of Columbia Funds Institutional Trust
SCHEDULE OF INVESTMENTS
| Par | Value | ||||||||||
| Corporate Fixed-Income Bonds & Notes (continued) | |||||||||||
| Industrials (2.6%) | |||||||||||
| Aerospace & Defense (1.1%) | |||||||||||
| Boeing Capital Corp. | |||||||||||
| 7.375% 09/27/10(a) | $ | 500,000 | $ | 532,622 | |||||||
| United Technologies Corp. | |||||||||||
| 6.500% 06/01/09 | 970,000 | 990,910 | |||||||||
| 1,523,532 | |||||||||||
| Machinery (1.0%) | |||||||||||
| Caterpillar Financial Services Corp. | |||||||||||
| 4.300% 06/01/10 | 725,000 | 709,413 | |||||||||
| John Deere Capital Corp. | |||||||||||
| 4.875% 03/16/09 | 700,000 | 695,641 | |||||||||
| 1,405,054 | |||||||||||
| Miscellaneous Manufacturing (0.2%) | |||||||||||
| 3M Co. | |||||||||||
| 5.125% 11/06/09 | 225,000 | 225,554 | |||||||||
| Transportation (0.3%) | |||||||||||
| Union Pacific Corp. | |||||||||||
| 3.875% 02/15/09 | 415,000 | 406,328 | |||||||||
| 3,560,468 | |||||||||||
| Technology (0.5%) | |||||||||||
| Computers (0.5%) | |||||||||||
| International Business Machines Corp. | |||||||||||
| 3.800% 02/01/08 | 725,000 | 719,449 | |||||||||
| Utilities (1.7%) | |||||||||||
| Electric (1.4%) | |||||||||||
| American Electric Power Co., Inc. | |||||||||||
| 5.375% 03/15/10 | 500,000 | 499,715 | |||||||||
| Commonwealth Edison Co. | |||||||||||
| 3.700% 02/01/08 (a) | 350,000 | 346,860 | |||||||||
| Dominion Resources, Inc. | |||||||||||
| 5.687% 05/15/08 (b) | 400,000 | 400,526 | |||||||||
| National Rural Utilities Cooperative Finance Corp. | |||||||||||
| 5.750% 08/28/09 | 675,000 | 679,375 | |||||||||
| 1,926,476 | |||||||||||
| Gas (0.3%) | |||||||||||
| Sempra Energy | |||||||||||
| 4.750% 05/15/09 | 484,000 | 479,385 | |||||||||
| 2,405,861 | |||||||||||
| Total Corporate Fixed-Income Bonds & Notes (Cost of $44,429,204) | 44,335,073 | ||||||||||
See Accompanying Notes to Financial Statements.
35
CMG SHORT TERM BOND FUND
A Portfolio of Columbia Funds Institutional Trust
SCHEDULE OF INVESTMENTS
| Par | Value | ||||||||||
| Collateralized Mortgage Obligations (26.8%) | |||||||||||
| Agency (8.7%) | |||||||||||
| Federal Home Loan Mortgage Corp. | |||||||||||
| 4.000% 09/15/15 | $ | 523,487 | $ | 512,611 | |||||||
| 4.500% 02/15/15 | 982,022 | 969,329 | |||||||||
| 5.000% 05/15/26 | 214,621 | 213,271 | |||||||||
| 5.500% 02/15/25 | 2,001,430 | 2,004,524 | |||||||||
| 5.500% 12/15/26 | 804,976 | 805,470 | |||||||||
| 6.000% 06/15/25 | 1,182,807 | 1,193,398 | |||||||||
| 6.000% 05/15/27 | 1,326,826 | 1,340,383 | |||||||||
| Federal National Mortgage Association | |||||||||||
| 5.500% 07/25/25 | 1,783,155 | 1,782,592 | |||||||||
| 6.000% 06/25/27 | 1,326,526 | 1,337,092 | |||||||||
| Government National Mortgage Association | |||||||||||
| 5.000% 06/20/28 | 1,940,000 | 1,922,427 | |||||||||
| 12,081,097 | |||||||||||
| Non-Agency (18.1%) | |||||||||||
| Bear Stearns Adjustable Rate Mortgage Trust | |||||||||||
| 3.519% 06/25/34 (b) | 1,000,000 | 984,169 | |||||||||
| Bear Stearns Asset Backed Securities Trust | |||||||||||
| 5.000% 01/25/34 | 739,975 | 729,596 | |||||||||
| Chase Mortgage Finance Corp. | |||||||||||
| 5.686% 03/25/37 (b) | 1,228,765 | 1,225,382 | |||||||||
| Countrywide Alternative Loan Trust | |||||||||||
| 5.250% 08/25/35 | 850,850 | 845,588 | |||||||||
| 5.500% 02/25/36 | 2,205,242 | 2,176,580 | |||||||||
| Countrywide Home Loan Mortgage Pass Through Trust | |||||||||||
| 5.358% 05/25/37 (b) | 886,449 | 883,859 | |||||||||
| 5.508% 01/25/36 (b) | 1,278,900 | 1,273,605 | |||||||||
| 6.000% 12/25/36 | 563,000 | 565,043 | |||||||||
| JPMorgan Mortgage Trust | |||||||||||
| 5.755% 04/25/36 (b) | 1,548,965 | 1,547,701 | |||||||||
| 6.055% 10/25/36 (b) | 3,255,983 | 3,260,477 | |||||||||
| MASTR Asset Securitization Trust | |||||||||||
| 5.750% 05/25/36 | 1,483,132 | 1,482,411 | |||||||||
| PNC Mortgage Securities Corp. | |||||||||||
| 0.000% 04/28/27 (b) | 5,559 | 5,003 | |||||||||
| Residential Accredit Loans, Inc. | |||||||||||
| 5.750% 01/25/36 | 291,885 | 291,596 | |||||||||
| SACO I, Inc. | |||||||||||
| 7.000% 08/25/36 (c) | 98,540 | 97,549 | |||||||||
| Structured Adjustable Rate Mortgage Loan Trust | |||||||||||
| 5.821% 07/25/36 (b) | 2,822,605 | 2,821,375 | |||||||||
| Structured Asset Securities Corp. | |||||||||||
| 5.750% 04/25/33 | 617,602 | 614,663 | |||||||||
| Washington Mutual Mortgage Pass-Through Certificates | |||||||||||
| 5.649% 11/25/36 (b) | 1,295,788 | 1,292,496 | |||||||||
| 5.901% 07/25/37 (b) | 2,936,888 | 2,938,376 | |||||||||
See Accompanying Notes to Financial Statements.
36
CMG SHORT TERM BOND FUND
A Portfolio of Columbia Funds Institutional Trust
SCHEDULE OF INVESTMENTS
| Par | Value | ||||||||||
| Collateralized Mortgage Obligations (continued) | |||||||||||
| Non-Agency (continued) | |||||||||||
| Wells Fargo Mortgage Backed Securities Trust | |||||||||||
| 5.240% 04/25/36 (b) | $ | 575,842 | $ | 572,893 | |||||||
| 6.000% 07/25/37 | 1,366,978 | 1,369,878 | |||||||||
| 24,978,240 | |||||||||||
| Total Collateralized Mortgage Obligations (Cost of $37,113,433) | 37,059,337 | ||||||||||
| Asset-Backed Securities (12.0%) | |||||||||||
| AmeriCredit Automobile Receivables Trust | |||||||||||
| 4.050% 02/06/10 | 172,142 | 171,316 | |||||||||
| Americredit Prime Automobile Receivable | |||||||||||
| 5.270% 11/08/11 | 1,000,000 | 1,002,289 | |||||||||
| Capital Auto Receivables Asset Trust | |||||||||||
| 3.580% 01/15/09 | 1,607,797 | 1,600,620 | |||||||||
| Cityscape Home Equity Loan Trust | |||||||||||
| 7.410% 05/25/28 | 63,597 | 63,340 | |||||||||
| CPS Auto Trust | |||||||||||
| 5.040% 09/15/11 (c) | 400,000 | 398,687 | |||||||||
| Daimler Chrysler Auto Trust | |||||||||||
| 4.980% 02/08/11 | 1,200,000 | 1,197,194 | |||||||||
| Franklin Auto Trust | |||||||||||
| 5.040% 01/20/11 | 1,000,000 | 997,741 | |||||||||
| Harley-Davidson Motorcycle Trust | |||||||||||
| 2.760% 05/15/11 | 535,708 | 532,016 | |||||||||
| Home Equity Mortgage Trust | |||||||||||
| 5.472% 09/25/36 (b) | 1,121,046 | 1,120,866 | |||||||||
| Hyundai Auto Receivables Trust | |||||||||||
| 5.110% 04/15/11 | 770,000 | 769,967 | |||||||||
| IMC Home Equity Loan Trust | |||||||||||
| 7.500% 04/25/26 | 220,695 | 220,057 | |||||||||
| 7.520% 08/20/28 | 82,420 | 82,164 | |||||||||
| Long Beach Auto Receivables Trust | |||||||||||
| 4.050% 04/15/11 | 1,700,000 | 1,686,421 | |||||||||
| Navistar Financial Corp. Owner Trust | |||||||||||
| 3.250% 10/15/10 | 765,968 | 759,428 | |||||||||
| Nissan Auto Lease Trust | |||||||||||
| 5.320% 05/17/10 | 1,000,000 | 1,000,781 | |||||||||
| Pinnacle Capital Asset Trust | |||||||||||
| 5.770% 05/25/10 (c) | 870,000 | 869,502 | |||||||||
| Triad Auto Receivables Owner Trust | |||||||||||
| 4.220% 06/12/12 | 2,300,000 | 2,269,396 | |||||||||
| UCFC Home Equity Loan | |||||||||||
| 6.315% 04/15/30 | 294,833 | 294,101 | |||||||||
| Wachovia Auto Loan Owner Trust | |||||||||||
| 5.080% 04/20/12 (c) | 1,000,000 | 998,489 | |||||||||
| WFS Financial Owner Trust | |||||||||||
| 2.810% 08/22/11 | 513,483 | 509,262 | |||||||||
| Total Asset-Backed Securities (Cost of $16,503,624) | 16,543,637 | ||||||||||
See Accompanying Notes to Financial Statements.
37
CMG SHORT TERM BOND FUND
A Portfolio of Columbia Funds Institutional Trust
SCHEDULE OF INVESTMENTS
| Par | Value | ||||||||||
| Mortgage-Backed Securities (10.6%) | |||||||||||
| Federal Home Loan Mortgage Corp. | |||||||||||
| 4.000% 05/01/11 | $ | 1,313,389 | $ | 1,274,214 | |||||||
| 4.500% 11/01/07 | 322,575 | 320,700 | |||||||||
| 4.500% 03/01/21 | 1,584,454 | 1,510,158 | |||||||||
| 5.000% 06/01/22 | 1,016,485 | 985,224 | |||||||||
| 5.500% 01/01/21 | 401,659 | 397,118 | |||||||||
| 5.500% 07/01/21 | 108,613 | 107,280 | |||||||||
| 5.500% 08/01/21 | 1,245,455 | 1,230,168 | |||||||||
| 5.500% 09/01/21 | 919,412 | 908,127 | |||||||||
| 5.500% 01/01/22 | 943,823 | 932,199 | |||||||||
| 5.500% 03/01/22 | 983,263 | 971,153 | |||||||||
| 6.000% 07/01/08 | 3,696 | 3,695 | |||||||||
| 6.000% 11/01/14 | 5,996 | 6,030 | |||||||||
| 6.000% 08/01/21 | 710,956 | 715,249 | |||||||||
| 6.000% 09/01/21 | 796,143 | 800,951 | |||||||||
| 6.000% 02/01/22 | 498,191 | 501,177 | |||||||||
| 6.000% 06/01/22 | 996,768 | 1,002,742 | |||||||||
| TBA, | |||||||||||
| 6.000% 08/01/22 (d) | 700,000 | 703,937 | |||||||||
| Federal National Mortgage Association | |||||||||||
| 5.500% 11/01/21 | 389,000 | 384,234 | |||||||||
| 6.000% 03/01/09 | 17,020 | 17,150 | |||||||||
| 6.000% 05/01/09 | 169,146 | 170,439 | |||||||||
| 6.000% 11/01/21 | 1,405,247 | 1,414,118 | |||||||||
| Small Business Administration | |||||||||||
| 5.875% 10/25/21 (b) | 14,984 | 15,060 | |||||||||
| 5.875% 03/25/22 (b) | 74,056 | 74,445 | |||||||||
| 5.875% 06/25/22 (b) | 192,153 | 193,179 | |||||||||
| 6.000% 07/25/21 (b) | 16,251 | 15,993 | |||||||||
| Total Mortgage-Backed Securities (Cost of $14,787,124) | 14,654,740 | ||||||||||
| Government & Agency Obligations (9.6%) | |||||||||||
| Foreign Government Obligations (1.1%) | |||||||||||
| Morocco Government AID Bond | |||||||||||
| 5.375% 05/01/23 (b) | 320,000 | 318,339 | |||||||||
| Province of Quebec | |||||||||||
| 5.000% 07/17/09 | 875,000 | 874,447 | |||||||||
| United Mexican States | |||||||||||
| 4.625% 10/08/08 | 325,000 | 320,450 | |||||||||
| 1,513,236 | |||||||||||
| U.S. Government Agencies (5.5%) | |||||||||||
| Federal Home Loan Bank | |||||||||||
| 5.125% 08/08/08 (a)(e) | 85,000 | 85,051 | |||||||||
| Federal Home Loan Mortgage Corp. | |||||||||||
| 6.625% 09/15/09 (a) | 4,000,000 | 4,133,308 | |||||||||
| Federal National Mortgage Association | |||||||||||
| 3.375% 12/15/08 | 2,200,000 | 2,154,930 | |||||||||
| 3.875% 02/01/08 (a) | 1,350,000 | 1,340,519 | |||||||||
| 7,713,808 | |||||||||||
See Accompanying Notes to Financial Statements.
38
CMG SHORT TERM BOND FUND
A Portfolio of Columbia Funds Institutional Trust
SCHEDULE OF INVESTMENTS
| Par | Value | ||||||||||
| Government & Agency Obligations (continued) | |||||||||||
| U.S. Government Obligations (3.0%) | |||||||||||
| U.S. Treasury Notes | |||||||||||
| 3.125% 10/15/08 | $ | 2,700,000 | $ | 2,649,586 | |||||||
| 4.375% 12/31/07 (a) | 1,470,000 | 1,466,325 | |||||||||
| 4,115,911 | |||||||||||
| Total Government & Agency Obligations (Cost of $13,357,461) | 13,342,955 | ||||||||||
| Commercial Mortgage-Backed Securities (7.0%) | |||||||||||
| Bear Stearns Commercial Mortgage Securities, Inc. | |||||||||||
| 3.869% 02/11/41 | 1,025,000 | 1,001,954 | |||||||||
| Chase Commercial Mortgage Securities Corp. | |||||||||||
| 7.093% 10/15/32 | 629,891 | 629,771 | |||||||||
| CS First Boston Mortgage Securities Corp. | |||||||||||
| 5.017% 08/15/38 | 350,000 | 345,497 | |||||||||
| JPMorgan Chase Commercial Mortgage Securities Corp. | |||||||||||
| 4.914% 07/12/37 | 2,034,239 | 2,011,045 | |||||||||
| 5.538% 02/12/49 | 1,994,796 | 1,995,307 | |||||||||
| LB-UBS Commercial Mortgage Trust | |||||||||||
| 5.642% 12/15/25 | 439,463 | 440,601 | |||||||||
| Merrill Lynch/Countrywide Commercial Mortgage Trust | |||||||||||
| 5.549% 06/12/50 | 2,023,246 | 2,024,287 | |||||||||
| Nationslink Funding Corp. | |||||||||||
| 6.888% 11/10/30 | 147,147 | 147,091 | |||||||||
| Prudential Securities Secured Financing Corp. | |||||||||||
| 6.480% 11/01/31 | 1,153,350 | 1,160,614 | |||||||||
| Total Commercial Mortgage-Backed Securities (Cost of $9,850,339) | 9,756,167 | ||||||||||
| Shares | |||||||||||
| Securities Lending Collateral (7.7%) | |||||||||||
| State Street Navigator Securities Lending Prime Portfolio (f) (7 day yield of 5.271%) | 10,640,904 | 10,640,904 | |||||||||
| Total Securities Lending Collateral (Cost of $10,640,904) | 10,640,904 | ||||||||||
See Accompanying Notes to Financial Statements.
39
CMG SHORT TERM BOND FUND
A Portfolio of Columbia Funds Institutional Trust
SCHEDULE OF INVESTMENTS
| Par | Value | ||||||||||
| Short-Term Obligation (3.0%) | |||||||||||
| Repurchase agreement with Fixed Income Clearing Corp., dated 07/31/07, due 08/01/07 at 5.030%, collateralized by a U.S. Government Agency Obligation maturing 11/30/11, market value of $4,170,400 (repurchase proceeds $4,084,571) | $ | 4,084,000 | $ | 4,084,000 | |||||||
| Total Short-Term Obligation (Cost of $4,084,000) | 4,084,000 | ||||||||||
| Total Investments 108.7% (Cost of $150,766,089) (g) | 150,416,813 | ||||||||||
| Other Assets & Liabilities, Net (-8.7%) | (11,985,022 | ) | |||||||||
| Net Assets (100.0%) | $ | 138,431,791 | |||||||||
Notes to Schedule of Investments:
(a) All or a portion of this security was on loan at July 31, 2007. The total market value of securities on loan at July 31, 2007 is $10,407,541.
(b) The interest rate shown on floating rate or variable rate securities reflects the rate at July 31, 2007.
(c) Security exempt from registration pursuant to Rule 144A under the Securities Act of 1933. These securities may be resold in transactions exempt from registration, normally to qualified institutional buyers. At July 31, 2007, these securities, which are not illiquid, amounted to $2,364,227, which represents 1.7% of net assets.
(d) Security purchased on a delayed delivery basis.
(e) A portion of this security is pledged as collateral for open futures contracts. At July 31, 2007, the total market value of securities pledged amounted to $25,022.
(f) Investment made with cash collateral received from securities lending activity.
(g) Cost for federal income tax purposes is $150,902,148.
At July 31, 2007, the Fund held the following open short futures contracts:
| Type | Number of Contracts | Value | Aggregate Face Value | Expiration Date | Unrealized (Depreciation) | ||||||||||||||||||
| U.S. Treasury Note 2 year | 19 | $ | 3,893,812 | $ | 3,888,110 | Sep-2007 | $ | (5,702 | ) | ||||||||||||||
| U.S. Treasury Note 5 year | 16 | 1,687,500 | 1,681,948 | Sep-2007 | (5,552 | ) | |||||||||||||||||
| $ | 5,581,312 | $ | 5,570,058 | $ | (11,254 | ) | |||||||||||||||||
At July 31, 2007, the asset allocation of the Fund is as follows:
Asset Allocation (Unaudited) | % of Net Assets | ||||||
| Corporate Fixed-Income Bonds & Notes | 32.0 | ||||||
| Collateralized Mortgage Obligations | 26.8 | ||||||
| Asset-Backed Securities | 12.0 | ||||||
| Mortgage-Backed Securities | 10.6 | ||||||
| Government & Agency Obligations | 9.6 | ||||||
| Commercial Mortgage-Backed Securities | 7.0 | ||||||
| 98.0 | |||||||
| Securities Lending Collateral | 7.7 | ||||||
| Short-Term Obligation | 3.0 | ||||||
| Other Assets & Liabilities, Net | (8.7 | ) | |||||
| 100.0 | |||||||
| Acronym | Name | ||||||
| TBA | To Be Announced | ||||||
See Accompanying Notes to Financial Statements.
40
CMG ULTRA SHORT TERM BOND FUND
A Portfolio of Columbia Funds Institutional Trust
SCHEDULE OF INVESTMENTS
July 31, 2007
| Par | Value | ||||||||||
| Asset-Backed Securities (32.1%) | |||||||||||
| American Express Credit Account Master Trust | |||||||||||
| 5.690% 10/15/10 (a) | $ | 500,000 | $ | 501,000 | |||||||
| AmeriCredit Automobile Receivables Trust | |||||||||||
| 3.930% 10/06/11 | 500,000 | 493,583 | |||||||||
| 5.190% 11/06/11 | 1,500,000 | 1,500,273 | |||||||||
| 5.210% 10/06/11 | 1,000,000 | 999,574 | |||||||||
| 5.420% 08/08/11 | 1,750,000 | 1,755,433 | |||||||||
| Bay View Auto Trust | |||||||||||
| 4.550% 02/25/14 | 1,000,000 | 991,814 | |||||||||
| 5.010% 06/25/14 | 300,000 | 299,532 | |||||||||
| Capital Auto Receivables Asset Trust | |||||||||||
| 5.400% 01/20/09 (b) | 775,709 | 775,760 | |||||||||
| Capital One Master Trust | |||||||||||
| 6.356% 06/15/11 | 1,000,000 | 1,007,654 | |||||||||
| Capital One Prime Auto Receivables Trust | |||||||||||
| 4.990% 09/15/10 | 667,000 | 665,902 | |||||||||
| Centex Home Equity | |||||||||||
| 6.540% 01/25/32 | 201,630 | 195,245 | |||||||||
| Chase Credit Card Master Trust | |||||||||||
| 5.440% 02/15/10 (a) | 1,000,000 | 1,000,290 | |||||||||
| Chase Issuance Trust | |||||||||||
| 3.220% 06/15/10 | 1,662,000 | 1,655,029 | |||||||||
| 4.520% 12/15/10 | 1,300,000 | 1,289,198 | |||||||||
| CIT Equipment Collateral | |||||||||||
| 4.420% 05/20/09 | 498,985 | 497,168 | |||||||||
| 5.070% 02/20/10 | 1,000,000 | 998,942 | |||||||||
| 5.160% 02/20/13 | 600,000 | 600,674 | |||||||||
| Citibank Credit Card Issuance Trust | |||||||||||
| 4.400% 09/15/10 | 1,500,000 | 1,485,625 | |||||||||
| CNH Equipment Trust | |||||||||||
| 3.380% 02/15/11 | 365,343 | 363,541 | |||||||||
| 5.200% 06/15/10 | 1,000,000 | 999,094 | |||||||||
| 5.200% 08/16/10 | 1,350,000 | 1,350,409 | |||||||||
| 5.330% 01/15/09 | 1,000,000 | 999,690 | |||||||||
| DaimlerChrysler Auto Trust | |||||||||||
| 5.300% 10/08/08 | 67,897 | 67,885 | |||||||||
| Drive Auto Receivables Trust | |||||||||||
| 5.300% 07/15/11 (b) | 1,500,000 | 1,500,982 | |||||||||
| 5.490% 05/15/11 (b) | 1,000,000 | 1,001,392 | |||||||||
| Ford Credit Floorplan Master Owner Trust | |||||||||||
| 5.500% 06/15/11 (a) | 700,000 | 700,158 | |||||||||
| Franklin Auto Trust | |||||||||||
| 3.130% 11/15/11 | 184,758 | 182,074 | |||||||||
| 4.910% 04/20/10 | 801,526 | 800,298 | |||||||||
| GE Equipment Small Ticket LLC | |||||||||||
| 4.880% 10/22/09 (b) | 900,017 | 897,648 | |||||||||
| GMAC Mortgage Corp. Loan Trust | |||||||||||
| 6.310% 05/25/36 | 534,473 | 533,910 | |||||||||
| Gracechurch Card Funding PLC | |||||||||||
| 5.430% 03/15/10 (a) | 1,000,000 | 1,000,781 | |||||||||
See Accompanying Notes to Financial Statements.
41
CMG ULTRA SHORT TERM BOND FUND
A Portfolio of Columbia Funds Institutional Trust
SCHEDULE OF INVESTMENTS
| Par | Value | ||||||||||
| Asset-Backed Securities (continued) | |||||||||||
| GS Auto Loan Trust | |||||||||||
| 4.450% 05/17/10 | $ | 542,347 | $ | 539,683 | |||||||
| 5.380% 01/15/14 | 1,750,000 | 1,757,872 | |||||||||
| Harley-Davidson Motorcycle Trust | |||||||||||
| 2.630% 11/15/10 | 78,667 | 78,237 | |||||||||
| 5.360% 10/15/10 | 401,349 | 401,427 | |||||||||
| Honda Auto Receivables Owner Trust | |||||||||||
| 4.850% 06/18/08 | 16,100 | 16,094 | |||||||||
| Household Automotive Trust | |||||||||||
| 5.280% 09/17/11 | 1,500,000 | 1,502,012 | |||||||||
| 5.300% 11/17/11 | 1,000,000 | 1,002,309 | |||||||||
| 5.430% 06/17/11 | 1,000,000 | 1,001,805 | |||||||||
| Long Beach Auto Receivables Trust | |||||||||||
| 4.050% 04/15/11 | 800,000 | 793,610 | |||||||||
| 4.080% 06/15/10 | 364,259 | 361,961 | |||||||||
| 4.406% 05/15/10 | 639,481 | 637,501 | |||||||||
| 4.972% 10/15/11 | 750,000 | 747,832 | |||||||||
| 5.170% 08/15/11 | 1,500,000 | 1,498,320 | |||||||||
| Nomura Asset Acceptance Corp. | |||||||||||
| 5.460% 01/25/36 (a)(b) | 238,210 | 237,287 | |||||||||
| Onyx Acceptance Grantor Trust | |||||||||||
| 4.180% 03/15/10 | 442,235 | 439,946 | |||||||||
| Ownit Mortgage Loan Asset-Backed Certificates | |||||||||||
| 5.424% 12/25/36 (a) | 456,494 | 454,375 | |||||||||
| Providian Gateway Master Trust | |||||||||||
| 3.350% 09/15/11 (b) | 1,500,000 | 1,496,668 | |||||||||
| Residential Funding Mortgage Securities II, Inc. | |||||||||||
| 5.440% 09/25/35 (a) | 288,754 | 288,128 | |||||||||
| Santander Drive Auto Receivables Trust | |||||||||||
| 5.050% 09/15/11 | 1,000,000 | 997,417 | |||||||||
| Triad Auto Receivables Owner Trust | |||||||||||
| 4.220% 06/12/12 | 750,000 | 740,021 | |||||||||
| 4.280% 06/14/10 | 487,200 | 484,459 | |||||||||
| 4.770% 01/12/11 | 1,000,000 | 997,097 | |||||||||
| 5.260% 11/14/11 | 1,750,000 | 1,750,933 | |||||||||
| 5.360% 11/12/09 | 223,890 | 223,853 | |||||||||
| 5.410% 08/12/11 | 1,500,000 | 1,502,486 | |||||||||
| Wachovia Auto Owner Trust | |||||||||||
| 4.790% 04/20/10 | 1,000,000 | 997,842 | |||||||||
| WFS Financial Owner Trust | |||||||||||
| 3.020% 05/20/11 | 230,274 | 229,291 | |||||||||
| 3.150% 05/20/11 | 376,839 | 375,043 | |||||||||
| 3.250% 05/20/11 | 443,183 | 442,558 | |||||||||
| Total Asset-Backed Securities (Cost of $48,998,395) | 49,106,625 | ||||||||||
See Accompanying Notes to Financial Statements.
42
CMG ULTRA SHORT TERM BOND FUND
A Portfolio of Columbia Funds Institutional Trust
SCHEDULE OF INVESTMENTS
| Par | Value | ||||||||||
| Corporate Fixed-Income Bonds & Notes (22.5%) | |||||||||||
| Basic Materials (0.6%) | |||||||||||
| Chemicals (0.6%) | |||||||||||
| Praxair, Inc. | |||||||||||
| 2.750% 06/15/08 | $ | 1,000,000 | $ | 977,691 | |||||||
| Communications (4.1%) | |||||||||||
| Media (1.7%) | |||||||||||
| Comcast MO of Delaware LLC | |||||||||||
| 9.000% 09/01/08 | 1,000,000 | 1,035,927 | |||||||||
| Time Warner Entertainment Co. LP | |||||||||||
| 7.250% 09/01/08 | 1,000,000 | 1,019,130 | |||||||||
| Walt Disney Co. | |||||||||||
| 5.460% 09/10/09 (a) | 580,000 | 580,891 | |||||||||
| 2,635,948 | |||||||||||
| Telecommunications (2.4%) | |||||||||||
| AT&T, Inc. | |||||||||||
| 5.450% 05/15/08 (a) | 1,000,000 | 1,000,728 | |||||||||
| BellSouth Corp. | |||||||||||
| 5.460% 08/15/08 (a) | 600,000 | 600,500 | |||||||||
| Verizon Global Funding Corp. | |||||||||||
| 4.000% 01/15/08 (c) | 600,000 | 596,247 | |||||||||
| Vodafone Group PLC | |||||||||||
| 3.950% 01/30/08 (c) | 750,000 | 744,739 | |||||||||
| 5.450% 12/28/07 (a) | 700,000 | 700,258 | |||||||||
| 3,642,472 | |||||||||||
| 6,278,420 | |||||||||||
| Consumer Non-Cyclical (1.7%) | |||||||||||
| Beverages (0.7%) | |||||||||||
| Diageo Finance BV | |||||||||||
| 5.480% 03/30/09 (a) | 1,000,000 | 1,001,409 | |||||||||
| Healthcare Services (1.0%) | |||||||||||
| UnitedHealth Group, Inc. | |||||||||||
| 5.440% 03/02/09 (a) | 1,000,000 | 998,984 | |||||||||
| WellPoint, Inc. | |||||||||||
| 3.750% 12/14/07 | 500,000 | 496,562 | |||||||||
| 1,495,546 | |||||||||||
| 2,496,955 | |||||||||||
| Financials (14.5%) | |||||||||||
| Banks (3.7%) | |||||||||||
| Capital One Bank | |||||||||||
| 6.700% 05/15/08 | 1,600,000 | 1,611,904 | |||||||||
| Comerica Bank | |||||||||||
| 5.510% 08/24/11 (a) | 1,000,000 | 998,109 | |||||||||
See Accompanying Notes to Financial Statements.
43
CMG ULTRA SHORT TERM BOND FUND
A Portfolio of Columbia Funds Institutional Trust
SCHEDULE OF INVESTMENTS
| Par | Value | ||||||||||
| Corporate Fixed-Income Bonds & Notes (continued) | |||||||||||
| Banks (continued) | |||||||||||
| M&I Marshall & Ilsley Bank | |||||||||||
| 4.125% 09/04/07 | $ | 600,000 | $ | 599,279 | |||||||
| UBS AG Stamford CT | |||||||||||
| 5.400% 11/28/07 | 1,000,000 | 999,785 | |||||||||
| Westpac Banking Corp/NY | |||||||||||
| 5.280% 06/06/08 (a) | 500,000 | 499,983 | |||||||||
| 5.330% 07/11/08 (a)(b) | 1,000,000 | 1,000,011 | |||||||||
| 5,709,071 | |||||||||||
| Diversified Financial Services (7.8%) | |||||||||||
| American Express Credit Corp. | |||||||||||
| 5.480% 06/16/11 (a) | 1,000,000 | 998,778 | |||||||||
| American Honda Finance Corp. | |||||||||||
| 5.380% 06/23/08 (a)(b) | 1,200,000 | 1,200,893 | |||||||||
| Bear Stearns Companies, Inc. | |||||||||||
| 5.660% 01/30/09 (a)(c) | 350,000 | 350,371 | |||||||||
| Caterpillar Financial Services Corp. | |||||||||||
| 5.408% 08/11/09 (a) | 700,000 | 700,249 | |||||||||
| CIT Group, Inc. | |||||||||||
| 3.875% 11/03/08 (c) | 1,115,000 | 1,090,345 | |||||||||
| Citigroup Global Markets Holdings, Inc. | |||||||||||
| 6.500% 02/15/08 | 1,000,000 | 1,005,500 | |||||||||
| Countrywide Home Loans, Inc. | |||||||||||
| 3.250% 05/21/08 (c) | 500,000 | 489,575 | |||||||||
| General Electric Capital Corp. | |||||||||||
| 5.410% 01/26/11 (a) | 1,000,000 | 999,223 | |||||||||
| Goldman Sachs Group, Inc. | |||||||||||
| 5.536% 02/06/12 (a)(c) | 1,000,000 | 975,919 | |||||||||
| HSBC Finance Corp. | |||||||||||
| 5.567% 08/09/11 (a) | 850,000 | 850,581 | |||||||||
| Merrill Lynch & Co. | |||||||||||
| 5.410% 06/26/09 (a) | 750,000 | 747,797 | |||||||||
| Morgan Stanley | |||||||||||
| 5.610% 01/18/11 (a) | 1,000,000 | 997,226 | |||||||||
| SLM Corp. | |||||||||||
| 5.500% 07/27/09 (a)(c) | 1,000,000 | 967,773 | |||||||||
| Textron Financial Corp. | |||||||||||
| 4.125% 03/03/08 | 600,000 | 596,020 | |||||||||
| 11,970,250 | |||||||||||
| Insurance (1.6%) | |||||||||||
| Berkshire Hathaway Finance Corp. | |||||||||||
| 5.420% 05/16/08 (a)(c) | 500,000 | 500,408 | |||||||||
| Chubb Corp. | |||||||||||
| 4.934% 11/16/07 | 1,000,000 | 998,723 | |||||||||
| Hartford Financial Services Group, Inc. | |||||||||||
| 4.700% 09/01/07 | 1,000,000 | 999,303 | |||||||||
| 2,498,434 | |||||||||||
See Accompanying Notes to Financial Statements.
44
CMG ULTRA SHORT TERM BOND FUND
A Portfolio of Columbia Funds Institutional Trust
SCHEDULE OF INVESTMENTS
| Par | Value | ||||||||||
| Corporate Fixed-Income Bonds & Notes (continued) | |||||||||||
| Real Estate Investment Trusts (REITs) (0.7%) | |||||||||||
| Simon Property Group LP | |||||||||||
| 6.375% 11/15/07 | $ | 1,000,000 | $ | 1,001,380 | |||||||
| Savings & Loans (0.7%) | |||||||||||
| Washington Mutual Bank | |||||||||||
| 5.446% 11/06/09 (a) | 1,000,000 | 1,001,223 | |||||||||
| 22,180,358 | |||||||||||
| Industrials (0.5%) | |||||||||||
| Transportation (0.5%) | |||||||||||
| Norfolk Southern Corp. | |||||||||||
| 6.000% 04/30/08 | 700,000 | 701,330 | |||||||||
| Utilities (1.1%) | |||||||||||
| Electric (1.1%) | |||||||||||
| Alabama Power Co. | |||||||||||
| 3.500% 11/15/07 | 917,000 | 911,871 | |||||||||
| Wisconsin Electric Power Co. | |||||||||||
| 3.500% 12/01/07 | 750,000 | 745,301 | |||||||||
| 1,657,172 | |||||||||||
| Total Corporate Fixed-Income Bonds & Notes (Cost of $34,378,515) | 34,291,926 | ||||||||||
| Collateralized Mortgage Obligations (12.4%) | |||||||||||
| Agency (5.5%) | |||||||||||
| Federal Home Loan Mortgage Corp. | |||||||||||
| 2.479% 12/15/08 | 197,064 | 194,667 | |||||||||
| 3.000% 06/15/23 | 51,193 | 51,078 | |||||||||
| 4.000% 05/15/14 | 87,075 | 85,903 | |||||||||
| 4.000% 07/15/24 | 276,265 | 272,629 | |||||||||
| 4.250% 03/15/17 | 78,248 | 78,044 | |||||||||
| 4.500% 11/15/16 | 318,640 | 314,388 | |||||||||
| 5.000% 07/15/14 | 400,000 | 398,392 | |||||||||
| 5.000% 11/15/15 | 182,786 | 181,462 | |||||||||
| 5.000% 02/15/16 | 620,950 | 616,549 | |||||||||
| 5.000% 09/15/19 | 221,134 | 220,516 | |||||||||
| 5.000% 05/15/26 | 348,912 | 346,718 | |||||||||
| 5.500% 11/15/23 | 1,318,647 | 1,316,361 | |||||||||
| 5.500% 02/15/24 | 343,664 | 343,492 | |||||||||
| 5.500% 04/15/27 | 1,485,777 | 1,487,270 | |||||||||
| Federal National Mortgage Association | |||||||||||
| 4.500% 03/25/13 | 598,844 | 592,457 | |||||||||
| 5.000% 01/25/23 | 321,952 | 320,090 | |||||||||
| 5.500% 11/25/26 | 990,591 | 990,734 | |||||||||
| 6.000% 01/25/31 | 543,874 | 543,289 | |||||||||
| 8,354,039 | |||||||||||
See Accompanying Notes to Financial Statements.
45
CMG ULTRA SHORT TERM BOND FUND
A Portfolio of Columbia Funds Institutional Trust
SCHEDULE OF INVESTMENTS
| Par | Value | ||||||||||
| Collateralized Mortgage Obligations (continued) | |||||||||||
| Non-Agency (6.9%) | |||||||||||
| Axon Financial Funding Ltd. | |||||||||||
| 5.960% 04/04/17 (a)(b) | $ | 1,750,000 | $ | 1,749,935 | |||||||
| Granite Master Issuer PLC | |||||||||||
| 5.330% 04/20/31 (a) | 265,161 | 265,208 | |||||||||
| 5.520% 12/17/54 (a) | 750,000 | 747,750 | |||||||||
| JPMorgan Mortgage Trust | |||||||||||
| 5.500% 04/25/36 | 374,080 | 372,228 | |||||||||
| Kildare Securities Ltd. | |||||||||||
| 5.380% 06/10/14 (a)(b) | 387,354 | 387,256 | |||||||||
| 5.420% 12/10/43 (a)(b) | 1,000,000 | 1,001,132 | |||||||||
| Leek Finance PLC | |||||||||||
| 5.477% 12/21/38 (a)(b) | 1,500,000 | 1,495,050 | |||||||||
| Opteum Mortgage Acceptance Corp. | |||||||||||
| 5.470% 12/25/35 (a) | 277,573 | 276,473 | |||||||||
| Ottimo Funding Ltd. | |||||||||||
| 7.320% 07/28/10 (a)(b) | 3,000,000 | 2,100,000 | |||||||||
| Paragon Mortgages PLC | |||||||||||
| 5.300% 06/15/41 (a)(b) | 491,667 | 491,667 | |||||||||
| Residential Mortgage Securities PLC | |||||||||||
| 5.430% 11/14/31 (a)(b) | 705,810 | 705,881 | |||||||||
| Washington Mutual, Inc. | |||||||||||
| 4.835% 10/25/35 (a) | 627,826 | 620,353 | |||||||||
| 6.250% 07/25/36 | 423,147 | 422,250 | |||||||||
| 10,635,183 | |||||||||||
| Total Collateralized Mortgage Obligations (Cost of $19,962,489) | 18,989,222 | ||||||||||
| Mortgage-Backed Securities (3.9%) | |||||||||||
| Federal Home Loan Mortgage Corp. | |||||||||||
| 3.500% 09/01/08 | 1,271,525 | 1,235,661 | |||||||||
| 5.085% 02/01/36 (a) | 1,320,719 | 1,313,601 | |||||||||
| Federal National Mortgage Association | |||||||||||
| 4.149% 03/01/34 (a) | 1,614,151 | 1,597,532 | |||||||||
| 4.542% 07/01/33 (a) | 1,765,084 | 1,759,433 | |||||||||
| Total Mortgage-Backed Securities (Cost of $5,930,515) | 5,906,227 | ||||||||||
| Government & Agency Obligations (2.8%) | |||||||||||
| U.S. Government Agencies (2.8%) | |||||||||||
| Federal Home Loan Bank | |||||||||||
| 4.875% 05/14/10 (c) | 2,800,000 | 2,792,042 | |||||||||
| Federal Home Loan Mortgage Corp. | |||||||||||
| 5.000% 06/11/09 | 1,500,000 | 1,501,503 | |||||||||
| 4,293,545 | |||||||||||
| Total Government & Agency Obligations (Cost of $4,282,583) | 4,293,545 | ||||||||||
See Accompanying Notes to Financial Statements.
46
CMG ULTRA SHORT TERM BOND FUND
A Portfolio of Columbia Funds Institutional Trust
SCHEDULE OF INVESTMENTS
| Par | Value | ||||||||||
| Municipal Bond (0.5%) | |||||||||||
| NY Urban Development Corp. Revenue Series 2004 B-3, | |||||||||||
| 3.580% 12/15/07 (d) | $ | 800,000 | $ | 795,176 | |||||||
| Total Municipal Bond (Cost of $800,000) | 795,176 | ||||||||||
| Shares | |||||||||||
| Securities Lending Collateral (4.1%) | |||||||||||
| State Street Navigator Securities Lending Prime Portfolio (e) (7 day yield of 5.271%) | 6,325,565 | 6,325,565 | |||||||||
| Total Securities Lending Collateral (Cost of $6,325,565) | 6,325,565 | ||||||||||
| Par | |||||||||||
| Short-Term Obligations (25.6%) | |||||||||||
| Commercial Paper (25.2%) | |||||||||||
| Bank of Montreal | |||||||||||
| 5.330% 11/20/07 | $ | 1,000,000 | 1,000,000 | ||||||||
| Comerica Bank | |||||||||||
| 5.410% 11/26/07 | 610,500 | 609,828 | |||||||||
| Daimlerchrysler NA Holding Corp. | |||||||||||
| 5.330% 08/02/07 | 1,300,000 | 1,299,807 | |||||||||
| 5.350% 08/13/07 | 6,000,000 | 5,989,300 | |||||||||
| Deutsche Bank AG NY | |||||||||||
| 5.400% 11/21/07 | 1,000,000 | 999,980 | |||||||||
| Kraft Foods, Inc. | |||||||||||
| 5.370% 08/01/07 | 6,000,000 | 6,000,000 | |||||||||
| Natixis NY | |||||||||||
| 5.420% 04/02/08 (f) | 2,000,000 | 1,999,866 | |||||||||
| PHH Corp. | |||||||||||
| 5.580% 08/15/07 | 5,000,000 | 4,989,150 | |||||||||
| Rhibdge PLC | |||||||||||
| 5.330% 10/11/07 | 4,500,000 | 4,452,696 | |||||||||
| Rhineland Funding Capital | |||||||||||
| 5.400% 08/02/07 | 3,000,000 | 2,999,550 | |||||||||
| 5.400% 08/28/07 | 900,000 | 896,355 | |||||||||
| Time Warner, Inc. | |||||||||||
| 5.350% 08/27/07 | 1,400,000 | 1,394,591 | |||||||||
| Viacom, Inc. | |||||||||||
| 5.500% 08/02/07 | 5,891,000 | 5,890,100 | |||||||||
| 38,521,223 | |||||||||||
See Accompanying Notes to Financial Statements.
47
CMG ULTRA SHORT TERM BOND FUND
A Portfolio of Columbia Funds Institutional Trust
SCHEDULE OF INVESTMENTS
| Par | Value | ||||||||||
| Short-Term Obligations (continued) | |||||||||||
| Repurchase Agreement (0.4%) | |||||||||||
| Repurchase agreement with Fixed Income Clearing Corp., dated 07/31/07, due 08/01/07 at 5.160%, collateralized by a U.S. Government Agency maturing 05/12/15, market value of $587,788 (repurchase proceeds $575,082) | $ | 575,000 | $ | 575,000 | |||||||
| Total Short-Term Obligations (Cost of $39,096,223) | 39,096,223 | ||||||||||
| Total Investments (103.9%) (Cost of $159,774,285) (g) | 158,804,509 | ||||||||||
| Other Assets & Liabilities, Net (-3.9%) | (6,011,851 | ) | |||||||||
| Net Assets (100.0%) | $ | 152,792,658 | |||||||||
Notes to Schedule of Investments:
(a) The interest rate shown on floating rate or variable rate securities reflects the rate at July 31, 2007.
(b) Security exempt from registration pursuant to Rule 144A under the Securities Act of 1933. These securities may be resold in transactions exempt from registration, normally to qualified institutional buyers. At July 31, 2007, these securities, which are not illiquid, amounted to $16,041,562, which represents 10.5% of net assets.
(c) All or a portion of this security was on loan at July 31, 2007. The total market value of securities on loan at July 31, 2007 is $6,186,858.
(d) Auction rate security. A debt security in which the interest rate is reset periodically, at intervals established at the time of issuance.
(e) Investment made with cash collateral received from securities lending activity.
(f) The rate shown represents the discount rate at the date of purchase.
(g) Cost for federal income tax purposes is $159,812,944.
At July 31, 2007, the asset allocation of the Fund was as follows:
Asset Allocation (Unaudited) | % of Net Assets | ||||||
| Asset-Backed Securities | 32.1 | ||||||
| Corporate Fixed-Income Bonds & Notes | 22.5 | ||||||
| Collateralized Mortgage Obligations | 12.4 | ||||||
| Mortgage-Backed Securities | 3.9 | ||||||
| Government & Agency Obligations | 2.8 | ||||||
| Municipal Bond | 0.5 | ||||||
| 74.2 | |||||||
| Securities Lending Collateral | 4.1 | ||||||
| Short-Term Obligations | 25.6 | ||||||
| Other Assets & Liabilities, Net | (3.9 | ) | |||||
| 100.0 | |||||||
See Accompanying Notes to Financial Statements.
48
CMG HIGH YIELD FUND
A Portfolio of Columbia Funds Institutional Trust
SCHEDULE OF INVESTMENTS
July 31, 2007
| Par (a) | Value | ||||||||||
| Corporate Fixed-Income Bonds & Notes (93.4%) | |||||||||||
| Basic Materials (8.0%) | |||||||||||
| Chemicals (4.0%) | |||||||||||
| Agricultural Chemicals (0.7%) | |||||||||||
| Mosaic Co. | |||||||||||
| 7.625% 12/01/16 (b) | $ | 420,000 | $ | 422,100 | |||||||
| Chemicals-Diversified (2.6%) | |||||||||||
| Huntsman International LLC | |||||||||||
| 6.875% 11/15/13 (b) | EUR | 165,000 | 233,646 | ||||||||
| 7.875% 11/15/14 | 290,000 | 310,300 | |||||||||
| Lyondell Chemical Co. | |||||||||||
| 6.875% 06/15/17 | 220,000 | 231,000 | |||||||||
| 8.000% 09/15/14 | 220,000 | 235,400 | |||||||||
| 8.250% 09/15/16 | 290,000 | 317,550 | |||||||||
| NOVA Chemicals Corp. | |||||||||||
| 6.500% 01/15/12 | 330,000 | 298,650 | |||||||||
| 1,626,546 | |||||||||||
| Chemicals-Specialty (0.7%) | |||||||||||
| Chemtura Corp. | |||||||||||
| 6.875% 06/01/16 | 440,000 | 405,900 | |||||||||
| 2,454,546 | |||||||||||
| Forest Products & Paper (1.5%) | |||||||||||
| Paper & Related Products (1.5%) | |||||||||||
| Boise Cascade LLC | |||||||||||
| 7.125% 10/15/14 | 185,000 | 170,200 | |||||||||
| Cascades, Inc. | |||||||||||
| 7.250% 02/15/13 | 250,000 | 233,750 | |||||||||
| Domtar, Inc. | |||||||||||
| 7.125% 08/15/15 | 305,000 | 284,412 | |||||||||
| Georgia-Pacific Corp. | |||||||||||
| 8.000% 01/15/24 | 300,000 | 273,750 | |||||||||
| 962,112 | |||||||||||
| Iron/Steel (0.7%) | |||||||||||
| Steel-Producers (0.7%) | |||||||||||
| Russel Metals, Inc. | |||||||||||
| 6.375% 03/01/14 | 470,000 | 441,800 | |||||||||
| Metals & Mining (1.8%) | |||||||||||
| Diversified Minerals (1.0%) | |||||||||||
| FMG Finance Ltd. | |||||||||||
| 10.625% 09/01/16 (b) | 520,000 | 595,400 | |||||||||
| Metal-Diversified (0.8%) | |||||||||||
| Freeport-McMoRan Copper & Gold, Inc. | |||||||||||
| 8.375% 04/01/17 | 480,000 | 504,000 | |||||||||
| 1,099,400 | |||||||||||
| 4,957,858 | |||||||||||
See Accompanying Notes to Financial Statements.
49
CMG HIGH YIELD FUND
A Portfolio of Columbia Funds Institutional Trust
SCHEDULE OF INVESTMENTS
| Par (a) | Value | ||||||||||
| Corporate Fixed-Income Bonds & Notes (continued) | |||||||||||
| Communications (15.1%) | |||||||||||
| Media (7.7%) | |||||||||||
| Broadcast Services/Programs (0.9%) | |||||||||||
| Clear Channel Communications, Inc. | |||||||||||
| 4.900% 05/15/15 | $ | 335,000 | $ | 247,383 | |||||||
| Liberty Media LLC | |||||||||||
| 8.250% 02/01/30 | 350,000 | 333,700 | |||||||||
| 581,083 | |||||||||||
| Cable TV (3.5%) | |||||||||||
| Charter Communications Holdings II LLC | |||||||||||
| 10.250% 09/15/10 | 395,000 | 401,912 | |||||||||
| CSC Holdings, Inc. | |||||||||||
| 7.625% 04/01/11 | 345,000 | 330,338 | |||||||||
| 7.625% 07/15/18 | 130,000 | 115,700 | |||||||||
| DirecTV Holdings LLC | |||||||||||
| 6.375% 06/15/15 | 745,000 | 670,500 | |||||||||
| EchoStar DBS Corp. | |||||||||||
| 6.625% 10/01/14 | 710,000 | 660,300 | |||||||||
| 2,178,750 | |||||||||||
| Multimedia (1.4%) | |||||||||||
| Lamar Media Corp. | |||||||||||
| 7.250% 01/01/13 | 465,000 | 446,400 | |||||||||
| Quebecor Media, Inc. | |||||||||||
| 7.750% 03/15/16 | 435,000 | 408,900 | |||||||||
| 855,300 | |||||||||||
| Publishing-Periodicals (1.3%) | |||||||||||
| Idearc, Inc. | |||||||||||
| 8.000% 11/15/16 | 230,000 | 217,925 | |||||||||
| R.H. Donnelley, Inc. | |||||||||||
| 10.875% 12/15/12 | 535,000 | 564,425 | |||||||||
| 782,350 | |||||||||||
| Television (0.6%) | |||||||||||
| LIN Television Corp. | |||||||||||
| 6.500% 05/15/13 | 300,000 | 288,750 | |||||||||
| Sinclair Broadcast Group, Inc. | |||||||||||
| 8.000% 03/15/12 | 93,000 | 93,000 | |||||||||
| 381,750 | |||||||||||
| 4,779,233 | |||||||||||
| Telecommunication Services (7.4%) | |||||||||||
| Cellular Telecommunications (1.0%) | |||||||||||
| Nextel Communications, Inc. | |||||||||||
| 7.375% 08/01/15 | 360,000 | 349,200 | |||||||||
| Rogers Wireless, Inc. | |||||||||||
| 8.000% 12/15/12 | 245,000 | 258,544 | |||||||||
| 607,744 | |||||||||||
See Accompanying Notes to Financial Statements.
50
CMG HIGH YIELD FUND
A Portfolio of Columbia Funds Institutional Trust
SCHEDULE OF INVESTMENTS
| Par (a) | Value | ||||||||||
| Corporate Fixed-Income Bonds & Notes (continued) | |||||||||||
| Satellite Telecommunications (0.4%) | |||||||||||
| Intelsat Bermuda Ltd. | |||||||||||
| 9.250% 06/15/16 | $ | 285,000 | $ | 290,700 | |||||||
| Telecommunication Equipment (0.8%) | |||||||||||
| Lucent Technologies, Inc. | |||||||||||
| 6.450% 03/15/29 | 600,000 | 513,000 | |||||||||
| Telecommunication Services (1.0%) | |||||||||||
| Embarq Corp. | |||||||||||
| 7.082% 06/01/16 | 155,000 | 154,858 | |||||||||
| 7.995% 06/01/36 | 155,000 | 153,065 | |||||||||
| Time Warner Telecom Holdings, Inc. | |||||||||||
| 9.250% 02/15/14 | 290,000 | 296,525 | |||||||||
| 604,448 | |||||||||||
| Telephone-Integrated (4.2%) | |||||||||||
| Cincinnati Bell, Inc. | |||||||||||
| 7.000% 02/15/15 | 280,000 | 263,200 | |||||||||
| Citizens Communications Co. | |||||||||||
| 7.875% 01/15/27 | 425,000 | 374,000 | |||||||||
| Qwest Corp. | |||||||||||
| 7.500% 10/01/14 | 580,000 | 568,400 | |||||||||
| 7.500% 06/15/23 | 545,000 | 515,025 | |||||||||
| 8.875% 03/15/12 | 205,000 | 215,506 | |||||||||
| Windstream Corp. | |||||||||||
| 7.000% 03/15/19 | 250,000 | 225,000 | |||||||||
| 8.625% 08/01/16 | 440,000 | 445,500 | |||||||||
| 2,606,631 | |||||||||||
| 4,622,523 | |||||||||||
| 9,401,756 | |||||||||||
| Consumer Cyclical (14.4%) | |||||||||||
| Apparel (0.7%) | |||||||||||
| Apparel Manufacturers (0.7%) | |||||||||||
| Levi Strauss & Co. | |||||||||||
| 9.750% 01/15/15 | 250,000 | 252,500 | |||||||||
| Phillips-Van Heusen Corp. | |||||||||||
| 7.250% 02/15/11 | 195,000 | 194,025 | |||||||||
| 446,525 | |||||||||||
| Auto Parts & Equipment (2.0%) | |||||||||||
| Auto/Truck Parts & Equipment-Original (1.2%) | |||||||||||
| Accuride Corp. | |||||||||||
| 8.500% 02/01/15 | 270,000 | 256,500 | |||||||||
| ArvinMeritor, Inc. | |||||||||||
| 8.125% 09/15/15 | 255,000 | 226,950 | |||||||||
| TRW Automotive, Inc. | |||||||||||
| 7.000% 03/15/14 (b) | 305,000 | 285,175 | |||||||||
| 768,625 | |||||||||||
See Accompanying Notes to Financial Statements.
51
CMG HIGH YIELD FUND
A Portfolio of Columbia Funds Institutional Trust
SCHEDULE OF INVESTMENTS
| Par (a) | Value | ||||||||||
| Corporate Fixed-Income Bonds & Notes (continued) | |||||||||||
| Auto/Truck Parts & Equipment-Replacement (0.4%) | |||||||||||
| Commercial Vehicle Group, Inc. | |||||||||||
| 8.000% 07/01/13 | $ | 275,000 | $ | 253,000 | |||||||
| Rubber-Tires (0.4%) | |||||||||||
| Goodyear Tire & Rubber Co. | |||||||||||
| 8.625% 12/01/11 (b) | 81,000 | 82,417 | |||||||||
| 9.000% 07/01/15 | 145,000 | 148,625 | |||||||||
| 231,042 | |||||||||||
| 1,252,667 | |||||||||||
| Entertainment (2.0%) | |||||||||||
| Music (1.2%) | |||||||||||
| Steinway Musical Instruments, Inc. | |||||||||||
| 7.000% 03/01/14 (b) | 360,000 | 345,600 | |||||||||
| WMG Acquisition Corp. | |||||||||||
| 7.375% 04/15/14 | 460,000 | 411,700 | |||||||||
| 757,300 | |||||||||||
| Racetracks (0.8%) | |||||||||||
| Speedway Motorsports, Inc. | |||||||||||
| 6.750% 06/01/13 | 490,000 | 467,950 | |||||||||
| 1,225,250 | |||||||||||
| Home Builders (1.6%) | |||||||||||
| Building-Residential/Commercial (1.6%) | |||||||||||
| K. Hovnanian Enterprises, Inc. | |||||||||||
| 6.375% 12/15/14 | 665,000 | 512,050 | |||||||||
| KB Home | |||||||||||
| 5.875% 01/15/15 | 615,000 | 510,450 | |||||||||
| 1,022,500 | |||||||||||
| Home Furnishings (0.5%) | |||||||||||
| Sealy Mattress Co. | |||||||||||
| 8.250% 06/15/14 | 345,000 | 339,825 | |||||||||
| Leisure Time (1.0%) | |||||||||||
| Cruise Lines (0.7%) | |||||||||||
| Royal Caribbean Cruises Ltd. | |||||||||||
| 6.875% 12/01/13 | 465,000 | 443,722 | |||||||||
| Leisure & Recreational Products (0.3%) | |||||||||||
| K2, Inc. | |||||||||||
| 7.375% 07/01/14 | 175,000 | 183,750 | |||||||||
| 627,472 | |||||||||||
| Lodging (4.6%) | |||||||||||
| Casino Hotels (4.6%) | |||||||||||
| Galaxy Entertainment Finance Co., Ltd. | |||||||||||
| 9.875% 12/15/12 (b) | 485,000 | 518,344 | |||||||||
| Harrah's Operating Co., Inc. | |||||||||||
| 5.625% 06/01/15 | 590,000 | 427,750 | |||||||||
See Accompanying Notes to Financial Statements.
52
CMG HIGH YIELD FUND
A Portfolio of Columbia Funds Institutional Trust
SCHEDULE OF INVESTMENTS
| Par (a) | Value | ||||||||||
| Corporate Fixed-Income Bonds & Notes (continued) | |||||||||||
| Casino Hotels (continued) | |||||||||||
| Las Vegas Sands Corp. | |||||||||||
| 6.375% 02/15/15 | $ | 400,000 | $ | 368,000 | |||||||
| MGM Mirage | |||||||||||
| 7.500% 06/01/16 | 350,000 | 325,500 | |||||||||
| Mohegan Tribal Gaming Authority | |||||||||||
| 6.875% 02/15/15 | 110,000 | 102,438 | |||||||||
| Pinnacle Entertainment, Inc. | |||||||||||
| 7.500% 06/15/15 (b) | 285,000 | 262,200 | |||||||||
| Station Casinos, Inc. | |||||||||||
| 6.625% 03/15/18 | 250,000 | 200,000 | |||||||||
| 6.875% 03/01/16 | 440,000 | 370,700 | |||||||||
| Wynn Las Vegas LLC | |||||||||||
| 6.625% 12/01/14 | 275,000 | 255,062 | |||||||||
| 2,829,994 | |||||||||||
| Retail (1.5%) | |||||||||||
| Retail-Automobiles (0.7%) | |||||||||||
| AutoNation, Inc. | |||||||||||
| 7.000% 04/15/14 | 235,000 | 219,725 | |||||||||
| Group 1 Automotive, Inc. | |||||||||||
| 8.250% 08/15/13 | 225,000 | 226,125 | |||||||||
| 445,850 | |||||||||||
| Retail-Convenience Store (0.4%) | |||||||||||
| Couche-Tard US LP | |||||||||||
| 7.500% 12/15/13 | 255,000 | 251,175 | |||||||||
| Retail-Propane Distributors (0.4%) | |||||||||||
| AmeriGas Partners LP | |||||||||||
| 7.125% 05/20/16 | 245,000 | 226,772 | |||||||||
| 923,797 | |||||||||||
| Textiles (0.5%) | |||||||||||
| Textile-Products (0.5%) | |||||||||||
| INVISTA | |||||||||||
| 9.250% 05/01/12 (b) | 295,000 | 303,850 | |||||||||
| 8,971,880 | |||||||||||
| Consumer Non-Cyclical (11.8%) | |||||||||||
| Agriculture (0.5%) | |||||||||||
| Tobacco (0.5%) | |||||||||||
| Reynolds American, Inc. | |||||||||||
| 7.625% 06/01/16 | 305,000 | 314,841 | |||||||||
| Beverages (1.3%) | |||||||||||
| Beverages-Non-Alcoholic (0.8%) | |||||||||||
| Cott Beverages, Inc. | |||||||||||
| 8.000% 12/15/11 | 495,000 | 480,150 | |||||||||
| Beverages-Wine/Spirits (0.5%) | |||||||||||
| Constellation Brands, Inc. | |||||||||||
| 8.125% 01/15/12 | 335,000 | 336,675 | |||||||||
| 816,825 | |||||||||||
See Accompanying Notes to Financial Statements.
53
CMG HIGH YIELD FUND
A Portfolio of Columbia Funds Institutional Trust
SCHEDULE OF INVESTMENTS
| Par (a) | Value | ||||||||||
| Corporate Fixed-Income Bonds & Notes (continued) | |||||||||||
| Biotechnology (0.5%) | |||||||||||
| Medical-Biomedical/Gene (0.5%) | |||||||||||
| Bio-Rad Laboratories, Inc. | |||||||||||
| 7.500% 08/15/13 | $ | 295,000 | $ | 290,575 | |||||||
| Commercial Services (3.7%) | |||||||||||
| Commercial Services (0.5%) | |||||||||||
| Iron Mountain, Inc. | |||||||||||
| 7.750% 01/15/15 | 335,000 | 310,713 | |||||||||
| Funeral Services & Related Items (0.5%) | |||||||||||
| Service Corp. International | |||||||||||
| 6.750% 04/01/16 | 100,000 | 90,500 | |||||||||
| 7.375% 10/01/14 | 215,000 | 209,088 | |||||||||
| 299,588 | |||||||||||
| Printing-Commercial (0.5%) | |||||||||||
| Quebecor World Capital Corp. | |||||||||||
| 8.750% 03/15/16 (b) | 345,000 | 312,225 | |||||||||
| Private Corrections (0.9%) | |||||||||||
| Corrections Corp. of America | |||||||||||
| 6.250% 03/15/13 | 415,000 | 391,137 | |||||||||
| 7.500% 05/01/11 | 175,000 | 175,000 | |||||||||
| 566,137 | |||||||||||
| Rental Auto/Equipment (1.3%) | |||||||||||
| Ashtead Capital, Inc. | |||||||||||
| 9.000% 08/15/16 (b) | 355,000 | 356,775 | |||||||||
| United Rentals North America, Inc. | |||||||||||
| 7.750% 11/15/13 | 425,000 | 436,687 | |||||||||
| 793,462 | |||||||||||
| 2,282,125 | |||||||||||
| Food (1.4%) | |||||||||||
| Food-Dairy Products (0.8%) | |||||||||||
| Dean Foods Co. | |||||||||||
| 7.000% 06/01/16 | 535,000 | 492,200 | |||||||||
| Food-Meat Products (0.3%) | |||||||||||
| Smithfield Foods, Inc. | |||||||||||
| 7.750% 07/01/17 | 185,000 | 178,525 | |||||||||
| Food-Miscellaneous/Diversified (0.3%) | |||||||||||
| Del Monte Corp. | |||||||||||
| 6.750% 02/15/15 | 200,000 | 181,000 | |||||||||
| 851,725 | |||||||||||
| Healthcare Products (0.2%) | |||||||||||
| Optical Supplies (0.2%) | |||||||||||
| Advanced Medical Optics, Inc. | |||||||||||
| 7.500% 05/01/17 | 140,000 | 127,400 | |||||||||
See Accompanying Notes to Financial Statements.
54
CMG HIGH YIELD FUND
A Portfolio of Columbia Funds Institutional Trust
SCHEDULE OF INVESTMENTS
| Par (a) | Value | ||||||||||
| Corporate Fixed-Income Bonds & Notes (continued) | |||||||||||
| Healthcare Services (1.9%) | |||||||||||
| Medical-Hospitals (1.9%) | |||||||||||
| HCA, Inc. | |||||||||||
| 9.250% 11/15/16 (b) | $ | 315,000 | $ | 312,638 | |||||||
| PIK, | |||||||||||
| 9.625% 11/15/16 (b) | 880,000 | 873,400 | |||||||||
| 1,186,038 | |||||||||||
| Household Products/Wares (0.9%) | |||||||||||
| Consumer Products-Miscellaneous (0.9%) | |||||||||||
| American Greetings Corp. | |||||||||||
| 7.375% 06/01/16 | 280,000 | 264,600 | |||||||||
| Jarden Corp. | |||||||||||
| 7.500% 05/01/17 | 350,000 | 315,000 | |||||||||
| 579,600 | |||||||||||
| Pharmaceuticals (1.4%) | |||||||||||
| Medical-Drugs (0.5%) | |||||||||||
| Elan Finance PLC | |||||||||||
| 8.875% 12/01/13 | 330,000 | 325,050 | |||||||||
| Medical-Generic Drugs (0.4%) | |||||||||||
| Mylan Laboratories, Inc. | |||||||||||
| 6.375% 08/15/15 | 250,000 | 251,875 | |||||||||
| Pharmacy Services (0.5%) | |||||||||||
| Omnicare, Inc. | |||||||||||
| 6.750% 12/15/13 | 310,000 | 283,650 | |||||||||
| 860,575 | |||||||||||
| 7,309,704 | |||||||||||
| Energy (13.6%) | |||||||||||
| Coal (2.2%) | |||||||||||
| Arch Western Finance LLC | |||||||||||
| 6.750% 07/01/13 | 690,000 | 627,900 | |||||||||
| Massey Energy Co. | |||||||||||
| 6.875% 12/15/13 | 330,000 | 290,813 | |||||||||
| Peabody Energy Corp. | |||||||||||
| 6.875% 03/15/13 | 455,000 | 442,487 | |||||||||
| 1,361,200 | |||||||||||
| Oil & Gas (5.1%) | |||||||||||
| Oil & Gas Drilling (0.8%) | |||||||||||
| Pride International, Inc. | |||||||||||
| 7.375% 07/15/14 | 475,000 | 471,438 | |||||||||
| Oil Companies-Exploration & Production (3.9%) | |||||||||||
| Chesapeake Energy Corp. | |||||||||||
| 6.375% 06/15/15 | 1,060,000 | 995,075 | |||||||||
| Compton Petroleum Corp. | |||||||||||
| 7.625% 12/01/13 | 320,000 | 299,200 | |||||||||
See Accompanying Notes to Financial Statements.
55
CMG HIGH YIELD FUND
A Portfolio of Columbia Funds Institutional Trust
SCHEDULE OF INVESTMENTS
| Par (a) | Value | ||||||||||
| Corporate Fixed-Income Bonds & Notes (continued) | |||||||||||
| Oil Companies-Exploration & Production (continued) | |||||||||||
| Newfield Exploration Co. | |||||||||||
| 6.625% 09/01/14 | $ | 595,000 | $ | 568,225 | |||||||
| OPTI Canada, Inc. | |||||||||||
| 8.250% 12/15/14 (b) | 245,000 | 245,000 | |||||||||
| Quicksilver Resources, Inc. | |||||||||||
| 7.125% 04/01/16 | 320,000 | 296,800 | |||||||||
| 2,404,300 | |||||||||||
| Oil Refining & Marketing (0.4%) | |||||||||||
| Tesoro Corp. | |||||||||||
| 6.625% 11/01/15 | 295,000 | 283,200 | |||||||||
| 3,158,938 | |||||||||||
| Oil & Gas Services (1.6%) | |||||||||||
| Oil Field Machinery & Equipment (0.6%) | |||||||||||
| Grant Prideco, Inc. | |||||||||||
| 6.125% 08/15/15 | 400,000 | 372,000 | |||||||||
| Oil-Field Services (1.0%) | |||||||||||
| Universal Compression, Inc. | |||||||||||
| 7.250% 05/15/10 | 585,000 | 606,206 | |||||||||
| 978,206 | |||||||||||
| Pipelines (4.7%) | |||||||||||
| Atlas Pipeline Partners LP | |||||||||||
| 8.125% 12/15/15 | 315,000 | 310,275 | |||||||||
| Colorado Interstate Gas Co. | |||||||||||
| 6.800% 11/15/15 | 555,000 | 569,962 | |||||||||
| Dynegy Holdings, Inc. | |||||||||||
| 7.750% 06/01/19 (b) | 135,000 | 116,775 | |||||||||
| El Paso Corp. | |||||||||||
| 6.875% 06/15/14 | 135,000 | 131,595 | |||||||||
| El Paso Performance-Linked Trust | |||||||||||
| 7.750% 07/15/11 (b) | 180,000 | 184,950 | |||||||||
| MarkWest Energy Partners LP | |||||||||||
| 6.875% 11/01/14 | 715,000 | 664,950 | |||||||||
| Williams Companies, Inc. | |||||||||||
| 7.750% 06/15/31 | 705,000 | 711,169 | |||||||||
| 8.125% 03/15/12 | 230,000 | 238,050 | |||||||||
| 2,927,726 | |||||||||||
| 8,426,070 | |||||||||||
| Financials (6.5%) | |||||||||||
| Diversified Financial Services (4.0%) | |||||||||||
| Finance-Auto Loans (2.6%) | |||||||||||
| AmeriCredit Corp. | |||||||||||
| 8.500% 07/01/15 (b) | 140,000 | 134,400 | |||||||||
| GMAC LLC | |||||||||||
| 8.000% 11/01/31 | 1,590,000 | 1,493,139 | |||||||||
| 1,627,539 | |||||||||||
See Accompanying Notes to Financial Statements.
56
CMG HIGH YIELD FUND
A Portfolio of Columbia Funds Institutional Trust
SCHEDULE OF INVESTMENTS
| Par (a) | Value | ||||||||||
| Corporate Fixed-Income Bonds & Notes (continued) | |||||||||||
| Finance-Investment Banker/Broker (1.4%) | |||||||||||
| E*Trade Financial Corp. | |||||||||||
| 7.375% 09/15/13 | $ | 555,000 | $ | 557,775 | |||||||
| LaBranche & Co., Inc. | |||||||||||
| 11.000% 05/15/12 | 295,000 | 289,100 | |||||||||
| 846,875 | |||||||||||
| 2,474,414 | |||||||||||
| Insurance (0.5%) | |||||||||||
| Property/Casualty Insurance (0.5%) | |||||||||||
| Crum & Forster Holdings Corp. | |||||||||||
| 7.750% 05/01/17 (b) | 310,000 | 297,600 | |||||||||
| Real Estate Investment Trusts (REITs) (2.0%) | |||||||||||
| REITS-Hotels (1.1%) | |||||||||||
| Host Marriott LP | |||||||||||
| 6.375% 03/15/15 | 740,000 | 691,900 | |||||||||
| REITS-Regional Malls (0.9%) | |||||||||||
| Rouse Co. LP/TRC Co-Issuer, Inc. | |||||||||||
| 6.750% 05/01/13 (b) | 595,000 | 593,047 | |||||||||
| 1,284,947 | |||||||||||
| 4,056,961 | |||||||||||
| Industrials (16.2%) | |||||||||||
| Aerospace & Defense (2.1%) | |||||||||||
| Aerospace/Defense-Equipment (1.5%) | |||||||||||
| DRS Technologies, Inc. | |||||||||||
| 6.625% 02/01/16 | 420,000 | 399,000 | |||||||||
| Sequa Corp. | |||||||||||
| 9.000% 08/01/09 | 485,000 | 504,400 | |||||||||
| 903,400 | |||||||||||
| Electronics-Military (0.6%) | |||||||||||
| L-3 Communications Corp. | |||||||||||
| 6.375% 10/15/15 | 425,000 | 391,000 | |||||||||
| 1,294,400 | |||||||||||
| Electrical Components & Equipment (1.0%) | |||||||||||
| Wire & Cable Products (1.0%) | |||||||||||
| Belden CDT, Inc. | |||||||||||
| 7.000% 03/15/17 (b) | 355,000 | 335,475 | |||||||||
| General Cable Corp. | |||||||||||
| 7.125% 04/01/17 | 145,000 | 140,650 | |||||||||
| 7.735% 04/01/15 (c) | 145,000 | 141,375 | |||||||||
| 617,500 | |||||||||||
See Accompanying Notes to Financial Statements.
57
CMG HIGH YIELD FUND
A Portfolio of Columbia Funds Institutional Trust
SCHEDULE OF INVESTMENTS
| Par (a) | Value | ||||||||||
| Corporate Fixed-Income Bonds & Notes (continued) | |||||||||||
| Electronics (1.2%) | |||||||||||
| Electronic Components-Miscellaneous (1.2%) | |||||||||||
| Flextronics International Ltd. | |||||||||||
| 6.250% 11/15/14 | $ | 390,000 | $ | 351,000 | |||||||
| NXP BV/NXP Funding LLC | |||||||||||
| 7.875% 10/15/14 | 415,000 | 383,875 | |||||||||
| 734,875 | |||||||||||
| Environmental Control (1.6%) | |||||||||||
| Non-Hazardous Waste Disposal (1.6%) | |||||||||||
| Allied Waste North America, Inc. | |||||||||||
| 7.125% 05/15/16 | 1,050,000 | 997,500 | |||||||||
| Machinery-Construction & Mining (0.1%) | |||||||||||
| Terex Corp. | |||||||||||
| 7.375% 01/15/14 | 70,000 | 68,600 | |||||||||
| Machinery-Diversified (1.3%) | |||||||||||
| Machinery-General Industry (1.3%) | |||||||||||
| Manitowoc Co., Inc. | |||||||||||
| 7.125% 11/01/13 | 585,000 | 570,375 | |||||||||
| Westinghouse Air Brake Technologies Corp. | |||||||||||
| 6.875% 07/31/13 | 250,000 | 237,500 | |||||||||
| 807,875 | |||||||||||
| Miscellaneous Manufacturing (1.8%) | |||||||||||
| Diversified Manufacturing Operators (1.4%) | |||||||||||
| Bombardier, Inc. | |||||||||||
| 6.300% 05/01/14 (b) | 490,000 | 445,900 | |||||||||
| Trinity Industries, Inc. | |||||||||||
| 6.500% 03/15/14 | 470,000 | 446,500 | |||||||||
| 892,400 | |||||||||||
| Miscellaneous Manufacturing (0.4%) | |||||||||||
| American Railcar Industries, Inc. | |||||||||||
| 7.500% 03/01/14 | 265,000 | 258,375 | |||||||||
| 1,150,775 | |||||||||||
| Packaging & Containers (3.4%) | |||||||||||
| Containers-Metal/Glass (3.4%) | |||||||||||
| Ball Corp. | |||||||||||
| 6.875% 12/15/12 | 335,000 | 331,650 | |||||||||
| Crown Americas LLC & Crown Americas Capital Corp. | |||||||||||
| 7.750% 11/15/15 | 425,000 | 418,625 | |||||||||
| Owens-Illinois, Inc. | |||||||||||
| 7.500% 05/15/10 | 930,000 | 916,050 | |||||||||
| Silgan Holdings, Inc. | |||||||||||
| 6.750% 11/15/13 | 460,000 | 439,300 | |||||||||
| 2,105,625 | |||||||||||
See Accompanying Notes to Financial Statements.
58
CMG HIGH YIELD FUND
A Portfolio of Columbia Funds Institutional Trust
SCHEDULE OF INVESTMENTS
| Par (a) | Value | ||||||||||
| Corporate Fixed-Income Bonds & Notes (continued) | |||||||||||
| Transportation (3.7%) | |||||||||||
| Transportation-Marine (3.0%) | |||||||||||
| Overseas Shipholding Group | |||||||||||
| 8.250% 03/15/13 | $ | 635,000 | $ | 649,287 | |||||||
| Stena AB | |||||||||||
| 7.500% 11/01/13 | 660,000 | 656,700 | |||||||||
| Teekay Corp. | |||||||||||
| 8.875% 07/15/11 | 560,000 | 571,200 | |||||||||
| 1,877,187 | |||||||||||
| Transportation-Services (0.7%) | |||||||||||
| Bristow Group, Inc. | |||||||||||
| 7.500% 09/15/17 (b) | 400,000 | 396,000 | |||||||||
| 2,273,187 | |||||||||||
| 10,050,337 | |||||||||||
| Technology (0.9%) | |||||||||||
| Semiconductors (0.9%) | |||||||||||
| Electronic Components-Semiconductors (0.9%) | |||||||||||
| Freescale Semiconductor, Inc. | |||||||||||
| 10.125% 12/15/16 (b) | 295,000 | 259,600 | |||||||||
| PIK, | |||||||||||
| 9.125% 12/15/14 (b) | 355,000 | 313,288 | |||||||||
| 572,888 | |||||||||||
| Utilities (6.9%) | |||||||||||
| Electric (6.9%) | |||||||||||
| Electric-Generation (3.4%) | |||||||||||
| AES Corp. | |||||||||||
| 7.750% 03/01/14 | 1,015,000 | 987,087 | |||||||||
| Edison Mission Energy | |||||||||||
| 7.000% 05/15/17 (b) | 815,000 | 735,538 | |||||||||
| Intergen NV | |||||||||||
| 9.000% 06/30/17 (b) | 395,000 | 389,075 | |||||||||
| 2,111,700 | |||||||||||
| Electric-Integrated (0.7%) | |||||||||||
| CMS Energy Corp. | |||||||||||
| 6.875% 12/15/15 | 140,000 | 138,829 | |||||||||
| 8.500% 04/15/11 | 260,000 | 273,908 | |||||||||
| 412,737 | |||||||||||
| Independent Power Producer (2.8%) | |||||||||||
| Dynegy Holdings, Inc. | |||||||||||
| 7.125% 05/15/18 | 330,000 | 277,200 | |||||||||
| Mirant North America LLC | |||||||||||
| 7.375% 12/31/13 | 545,000 | 542,275 | |||||||||
See Accompanying Notes to Financial Statements.
59
CMG HIGH YIELD FUND
A Portfolio of Columbia Funds Institutional Trust
SCHEDULE OF INVESTMENTS
| Par (a) | Value | ||||||||||
| Corporate Fixed-Income Bonds & Notes (continued) | |||||||||||
| Independent Power Producer (continued) | |||||||||||
| NRG Energy, Inc. | |||||||||||
| 7.250% 02/01/14 | $ | 130,000 | $ | 125,450 | |||||||
| 7.375% 02/01/16 | 380,000 | 366,700 | |||||||||
| 7.375% 01/15/17 | 60,000 | 57,900 | |||||||||
| NSG Holdings LLC/NSG Holdings, Inc. | |||||||||||
| 7.750% 12/15/25 (b) | 415,000 | 408,775 | |||||||||
| 1,778,300 | |||||||||||
| 4,302,737 | |||||||||||
| Total Corporate Fixed-Income Bonds & Notes (Cost of $61,321,858) | 58,050,191 | ||||||||||
| Municipal Bond (0.4%) | |||||||||||
| Other (0.4%) | |||||||||||
| Tobacco (0.4%) | |||||||||||
| VA Tobacco Settlement Financing Corp. | |||||||||||
| Series 2007 A1, | |||||||||||
| 6.706% 06/01/46 | 275,000 | 262,463 | |||||||||
| Total Municipal Bond (Cost of $274,972) | 262,463 | ||||||||||
| Short-Term Obligation (4.4%) | |||||||||||
| Repurchase agreement with Fixed Income Clearing Corp., dated 07/31/07, due 08/01/07 at 5.030%, collateralized by U.S. Treasury Obligations maturing 11/30/11, market value of $2,822,038 (repurchase proceeds $2,766,386) | 2,766,000 | 2,766,000 | |||||||||
| Total Short-Term Obligation (Cost of $2,766,000) | 2,766,000 | ||||||||||
| Total Investments (98.2%) (Cost of $64,362,830) (d) | 61,078,654 | ||||||||||
| Other Assets & Liabilities, Net (1.8%) | 1,094,521 | ||||||||||
| Net Assets (100.0%) | $ | 62,173,175 | |||||||||
Notes to Schedule of Investments:
(a) Principal amount is stated in United States dollars unless otherwise noted.
(b) Security exempt from registration pursuant to Rule 144A under the Securities Act of 1933. These securities may be resold in transactions exempt from registration, normally to qualified institutional buyers. At July 31, 2007, these securities, which are not illiquid, amounted to $9,759,193, which represents 15.7% of net assets.
(c) The interest rate shown on floating rate or variable rate securities reflects the rate at July 31, 2007.
(d) Cost for federal income tax purposes is $64,699,256.
See Accompanying Notes to Financial Statements.
60
CMG HIGH YIELD FUND
A Portfolio of Columbia Funds Institutional Trust
SCHEDULE OF INVESTMENTS
At July 31, 2007, the asset allocation of the Fund was as follows:
Asset Allocation (Unaudited) | % of Net Assets | ||||||
| Industrials | 16.2 | ||||||
| Communications | 15.1 | ||||||
| Consumer Cyclical | 14.4 | ||||||
| Energy | 13.6 | ||||||
| Consumer Non-Cyclical | 11.8 | ||||||
| Basic Materials | 8.0 | ||||||
| Utilities | 6.9 | ||||||
| Financials | 6.5 | ||||||
| Technology | 0.9 | ||||||
| Municipal Bond | 0.4 | ||||||
| 93.8 | |||||||
| Short-Term Obligation | 4.4 | ||||||
| Other Assets & Liabilities, Net | 1.8 | ||||||
| 100.0 | |||||||
At July 31, 2007, the Fund had entered into the following foreign forward currency exchange contract:
| Forward Currency Contract to Sell | Value | Aggregate Face Value | Settlement Date | Unrealized Appreciation | |||||||||||||||
| EUR | $ | 225,909 | $ | 227,702 | Aug-07 | $ | 1,793 | ||||||||||||
| Acronym | Name | ||||||
| EUR | Euro | ||||||
| PIK | Payment-In-Kind | ||||||
See Accompanying Notes to Financial Statements.
61
STATEMENTS OF ASSETS AND LIABILITIES
July 31, 2007
| CMG Core Bond Fund | CMG Short Term Bond Fund | CMG Ultra Short Term Bond Fund | CMG High Yield Fund | ||||||||||||||||
| ASSETS: | |||||||||||||||||||
| Investments, at identified cost (including repurchase agreements) | $ | 77,893,739 | $ | 150,766,089 | $ | 159,774,285 | $ | 64,362,830 | |||||||||||
| Investments, at value (including securities on loan of 8,364,669, $10,407,541, $ $6,186,858 and $-) | $ | 77,004,488 | $ | 150,416,813 | $ | 158,804,509 | $ | 61,078,654 | |||||||||||
| Cash | 82 | 740 | - | 86,416 | |||||||||||||||
| Unrealized appreciation on foreign forward currency contracts | - | - | - | 1,793 | |||||||||||||||
| Receivable for: | |||||||||||||||||||
| Investments sold | - | - | - | 166,394 | |||||||||||||||
| Capital stock sold | - | 90,291 | 42,160 | 73,187 | |||||||||||||||
| Interest | 579,977 | 1,071,158 | 862,977 | 1,129,668 | |||||||||||||||
| Securities lending | 1,364 | 1,228 | 689 | - | |||||||||||||||
| Foreign tax reclaim | - | - | 4,838 | - | |||||||||||||||
| Expense reimbursement due from Investment Advisor | 11,678 | 12,669 | 11,565 | 7,580 | |||||||||||||||
| Deferred Trustees' compensation plan | 8,643 | 10,606 | 8,032 | 14,993 | |||||||||||||||
| Total Assets | 77,606,232 | 151,603,505 | 159,734,770 | 62,558,685 | |||||||||||||||
| LIABILITIES: | |||||||||||||||||||
| Collateral on securities loaned | 8,525,813 | 10,640,904 | 6,325,565 | - | |||||||||||||||
| Payable to custodian bank | - | - | 246 | - | |||||||||||||||
| Payable for: | |||||||||||||||||||
| Investments purchased | 1,070,217 | 1,131,739 | 49,948 | 86,040 | |||||||||||||||
| Investments purchased on a delayed delivery basis | - | 703,937 | - | - | |||||||||||||||
| Capital stock redeemed | 90,911 | 185,641 | - | - | |||||||||||||||
| Futures variation margin | - | 3,188 | - | - | |||||||||||||||
| Distributions | 174,143 | 416,948 | 486,533 | 210,343 | |||||||||||||||
| Investment advisory fee | 15,035 | 29,651 | 30,774 | 21,205 | |||||||||||||||
| Audit fee | 44,850 | 45,550 | 37,450 | 49,550 | |||||||||||||||
| Deferred Trustees' compensation plan | 8,643 | 10,606 | 8,032 | 14,993 | |||||||||||||||
| Other liabilities | 3,303 | 3,550 | 3,564 | 3,379 | |||||||||||||||
| Total liabilities | 9,932,915 | 13,171,714 | 6,942,112 | 385,510 | |||||||||||||||
| NET ASSETS | $ | 67,673,317 | $ | 138,431,791 | $ | 152,792,658 | $ | 62,173,175 | |||||||||||
| NET ASSETS CONSIST OF: | |||||||||||||||||||
| Paid-in capital | $ | 70,628,905 | $ | 144,188,547 | $ | 155,481,684 | $ | 79,751,232 | |||||||||||
| Undistributed (Overdistributed) net investment income | 19,688 | (65,836 | ) | (102,958 | ) | (334,330 | ) | ||||||||||||
| Accumulated net realized loss | (2,086,025 | ) | (5,330,390 | ) | (1,616,292 | ) | (13,961,377 | ) | |||||||||||
| Net unrealized appreciation (depreciation) on: | |||||||||||||||||||
| Investments | (889,251 | ) | (349,276 | ) | (969,776 | ) | (3,284,176 | ) | |||||||||||
| Futures contracts | - | (11,254 | ) | - | - | ||||||||||||||
| Foreign currency translations | - | - | - | 1,826 | |||||||||||||||
| NET ASSETS | $ | 67,673,317 | $ | 138,431,791 | $ | 152,792,658 | $ | 62,173,175 | |||||||||||
| Shares of capital stock outstanding | 6,750,021 | 11,950,183 | 15,925,999 | 8,315,730 | |||||||||||||||
| Net asset value, offering and redemption price per share | $ | 10.03 | $ | 11.58 | $ | 9.59 | $ | 7.48 | |||||||||||
See Accompanying Notes to Financial Statements.
62
STATEMENTS OF OPERATIONS
For the Year Ended July 31, 2007
| CMG Core Bond Fund | CMG Short Term Bond Fund | CMG Ultra Short Term Bond Fund | CMG High Yield Fund | ||||||||||||||||
| NET INVESTMENT INCOME: | |||||||||||||||||||
| Income: | |||||||||||||||||||
| Interest | $ | 2,967,929 | $ | 5,061,790 | $ | 5,884,242 | $ | 5,961,272 | |||||||||||
| Securities lending income | 6,193 | 6,510 | 4,096 | - | |||||||||||||||
| Foreign withholding tax | (295 | ) | - | - | - | ||||||||||||||
| Total investment income | 2,973,827 | 5,068,300 | 5,888,338 | 5,961,272 | |||||||||||||||
| Expenses: | |||||||||||||||||||
| Investment advisory fee | 139,651 | 246,761 | 286,549 | 336,310 | |||||||||||||||
| Trustees' fees | 12,775 | 13,959 | 14,336 | 15,487 | |||||||||||||||
| Audit fee | 45,400 | 45,900 | 37,900 | 50,100 | |||||||||||||||
| Other expenses | 11,795 | 13,989 | 14,627 | 11,369 | |||||||||||||||
| Total expenses | 209,621 | 320,609 | 353,412 | 413,266 | |||||||||||||||
| Expense reimbursement from Investment Advisor | (69,970 | ) | (73,848 | ) | (66,863 | ) | (76,956 | ) | |||||||||||
| Net expenses | 139,651 | 246,761 | 286,549 | 336,310 | |||||||||||||||
| Net investment income | 2,834,176 | 4,821,539 | 5,601,789 | 5,624,962 | |||||||||||||||
| NET REALIZED AND UNREALIZED GAIN (LOSS) ON INVESTMENTS, FOREIGN CURRENCY TRANSACTIONS AND FUTURES CONTRACTS: | |||||||||||||||||||
| Net realized gain (loss) on: | |||||||||||||||||||
| Investments | (370,838 | ) | (201,534 | ) | (105,723 | ) | (688,591 | ) | |||||||||||
| Foreign currency transactions | - | - | - | (10,976 | ) | ||||||||||||||
| Futures contracts | - | 11,179 | - | - | |||||||||||||||
| Net realized loss on disposal of investments purchased/sold in error (See Note 8) | - | - | - | - | |||||||||||||||
| Net realized gain (loss) | (370,838 | ) | (190,355 | ) | (105,723 | ) | (699,567 | ) | |||||||||||
| Net change in unrealized appreciation (depreciation) on: | |||||||||||||||||||
| Investments | 199,022 | 425,836 | (495,504 | ) | 426,055 | ||||||||||||||
| Foreign currency translations | - | - | - | 1,826 | |||||||||||||||
| Futures contracts | - | (11,254 | ) | - | - | ||||||||||||||
| Net change in unrealized appreciation (depreciation) | 199,022 | 414,582 | (495,504 | ) | 427,881 | ||||||||||||||
| Net gain (loss) | (171,816 | ) | 224,227 | (601,227 | ) | (271,686 | ) | ||||||||||||
| NET INCREASE IN NET ASSETS FROM OPERATIONS | $ | 2,662,360 | $ | 5,045,766 | $ | 5,000,562 | $ | 5,353,276 | |||||||||||
See Accompanying Notes to Financial Statements.
63
STATEMENTS OF CHANGES IN NET ASSETS
| CMG Core Bond Fund | CMG Short Term Bond Fund | ||||||||||||||||||
| Year Ended July 31, | Year Ended July 31, | ||||||||||||||||||
| 2007 | 2006 | 2007 | 2006 | ||||||||||||||||
| Operations: | |||||||||||||||||||
| Net investment income | $ | 2,834,176 | $ | 2,851,226 | $ | 4,821,539 | $ | 3,300,292 | |||||||||||
| Net realized loss on investments, foreign currency transactions and futures contracts | (370,838 | ) | (1,235,400 | ) | (190,355 | ) | (534,655 | ) | |||||||||||
| Net change in unrealized appreciation (depreciation) on investments and futures contracts | 199,022 | (857,311 | ) | 414,582 | (288,322 | ) | |||||||||||||
| Net increase from operations | 2,662,360 | 758,515 | 5,045,766 | 2,477,315 | |||||||||||||||
| Distributions declared to shareholders: | |||||||||||||||||||
| From net investment income | (2,884,251 | ) | (3,061,621 | ) | (5,163,909 | ) | (3,690,742 | ) | |||||||||||
| From net realized gains | - | (21,839 | ) | - | - | ||||||||||||||
| Total distributions declared to shareholders | (2,884,251 | ) | (3,083,460 | ) | (5,163,909 | ) | (3,690,742 | ) | |||||||||||
| Share transactions: | |||||||||||||||||||
| Subscriptions | 22,467,688 | 12,221,511 | 84,402,331 | 30,797,725 | |||||||||||||||
| Distributions reinvested | 1,175,961 | 750,818 | 2,006,462 | 1,914,965 | |||||||||||||||
| Redemptions | (11,929,545 | ) | (33,568,744 | ) | (31,843,019 | ) | (43,357,147 | ) | |||||||||||
| Net increase (decrease) in share transactions | 11,714,104 | (20,596,415 | ) | 54,565,774 | (10,644,457 | ) | |||||||||||||
| Net increase (decrease) in net assets | 11,492,213 | (22,921,360 | ) | 54,447,631 | (11,857,884 | ) | |||||||||||||
| NET ASSETS: | |||||||||||||||||||
| Beginning of period | 56,181,104 | 79,102,464 | 83,984,160 | 95,842,044 | |||||||||||||||
| End of period | $ | 67,673,317 | $ | 56,181,104 | $ | 138,431,791 | $ | 83,984,160 | |||||||||||
| Undistributed (Overdistributed) net investment income | $ | 19,688 | $ | (76,968 | ) | $ | (65,836 | ) | $ | (196,999 | ) | ||||||||
| Changes in shares: | |||||||||||||||||||
| Subscriptions | 2,216,484 | 1,194,394 | 7,273,049 | 2,641,344 | |||||||||||||||
| Issued for distributions reinvested | 115,624 | 73,922 | 172,759 | 164,066 | |||||||||||||||
| Redemptions | (1,172,762 | ) | (3,269,168 | ) | (2,741,444 | ) | (3,691,976 | ) | |||||||||||
| Net increase (decrease) | 1,159,346 | (2,000,852 | ) | 4,704,364 | (886,566 | ) | |||||||||||||
See Accompanying Notes to Financial Statements.
64
STATEMENTS OF CHANGES IN NET ASSETS
| CMG Ultra Short Term Bond Fund | CMG High Yield Fund | ||||||||||||||||||
| Year Ended July 31, | Year Ended July 31, | ||||||||||||||||||
| 2007 | 2006 | 2007 | 2006 | ||||||||||||||||
| Operations: | |||||||||||||||||||
| Net investment income | $ | 5,601,789 | $ | 3,330,426 | $ | 5,624,962 | $ | 12,038,958 | |||||||||||
| Net realized gain (loss) on investments and foreign currency transactions | (105,723 | ) | (181,990 | ) | (699,567 | ) | (1,263,762 | ) | |||||||||||
| Net change in unrealized appreciation (depreciation) on investments and foreign currency translations | (495,504 | ) | 60,266 | 427,881 | (7,431,304 | ) | |||||||||||||
| Net increase from operations | 5,000,562 | 3,208,702 | 5,353,276 | 3,343,892 | |||||||||||||||
| Distributions declared to shareholders: | |||||||||||||||||||
| From net investment income | (5,585,102 | ) | (3,636,758 | ) | (5,912,719 | ) | (12,800,444 | ) | |||||||||||
| Return of capital | - | (1,580 | ) | - | - | ||||||||||||||
| Total distributions declared to shareholders | (5,585,102 | ) | (3,638,338 | ) | (5,912,719 | ) | (12,800,444 | ) | |||||||||||
| Share transactions: | |||||||||||||||||||
| Subscriptions | 83,925,690 | 25,443,944 | 25,687,068 | 12,320,348 | |||||||||||||||
| Distributions reinvested | 1,714,428 | 1,242,616 | 3,327,328 | 8,511,776 | |||||||||||||||
| Redemptions | (22,126,272 | ) | (17,968,775 | ) | (62,401,951 | ) | (184,498,010 | ) | |||||||||||
| Net increase (decrease) in share transactions | 63,513,846 | 8,717,785 | (33,387,555 | ) | (163,665,886 | ) | |||||||||||||
| Net increase (decrease) in net assets | 62,929,306 | 8,288,149 | (33,946,998 | ) | (173,122,438 | ) | |||||||||||||
| NET ASSETS: | |||||||||||||||||||
| Beginning of period | 89,863,352 | 81,575,203 | 96,120,173 | 269,242,611 | |||||||||||||||
| End of period | $ | 152,792,658 | $ | 89,863,352 | $ | 62,173,175 | $ | 96,120,173 | |||||||||||
| Overdistributed net investment income | $ | (102,958 | ) | $ | (397,427 | ) | $ | (334,330 | ) | $ | (565,665 | ) | |||||||
| Changes in shares: | |||||||||||||||||||
| Subscriptions | 8,701,439 | 2,640,382 | 3,272,380 | 1,561,452 | |||||||||||||||
| Issued for distributions reinvested | 177,745 | 128,967 | 425,081 | 1,075,896 | |||||||||||||||
| Redemptions | (2,294,253 | ) | (1,863,156 | ) | (7,930,977 | ) | (23,417,941 | ) | |||||||||||
| Net increase (decrease) | 6,584,931 | 906,193 | (4,233,516 | ) | (20,780,593 | ) | |||||||||||||
See Accompanying Notes to Financial Statements.
65
NOTES TO FINANCIAL STATEMENTS
July 31, 2007
Note 1. Organization
Columbia Funds Institutional Trust (the "Trust") is a Massachusetts business trust registered under the Investment Company Act of 1940, as amended, as an open-end management investment company. Information presented in these financial statements pertains to the following diversified funds (individually referred to as a "Fund", collectively referred to as the "Funds"):
CMG Core Bond Fund
CMG Short Term Bond Fund
CMG Ultra Short Term Bond Fund
CMG High Yield Fund
Shares of the Funds are available for purchase by institutional buyers and certain advisory clients of Columbia Management Advisors, LLC ("Columbia"), the Funds' investment advisor, or its affiliates. Each Fund's minimum initial investment requirement for investors purchasing shares directly from Columbia is $3 million. The minimum initial investment requirement is $25,000 for advisory clients of Columbia or one of its affiliates with $1 million invested with Columbia and its affiliates. Please see the Funds' prospectus for further details.
Investment goals. CMG Core Bond Fund seeks to provide investors a high level of current income consistent with capital preservation. CMG Short Term Bond Fund seeks to provide investors a high level of current income consistent with a high degree of stability of principal. CMG Ultra Short Term Bond Fund seeks a high level of current income consistent with the maintenance of liquidity and the preservation of capital. CMG High Yield Fund seeks a high level of current income. Capital appreciation is a secondary objective when consistent with a high level of current income.
Fund shares. The Trust may issue an unlimited number of shares of beneficial interest which are offered continuously at net asset value.
Note 2. Significant accounting policies
The preparation of financial statements in accordance with accounting principles generally accepted in the United States of America ("GAAP") requires management to make certain estimates and assumptions that affect the reported amounts of assets and liabilities, the disclosure of contingent assets and liabilities at the date of the financial statements and the reported amounts of revenue and expenses during the reporting period. Actual results could differ from those estimates. The following is a summary of significant accounting policies consistently followed by the Funds in the preparation of their financial statements.
Security valuation. Debt securities generally are valued by pricing services approved by the Trust's Board of Trustees, based upon market transactions for normal, institutional-size trading units of similar securities. The services may use various pricing techniques which take into account appropriate factors such as yield, quality, coupon rate, maturity, type of issue, trading characteristics and other data, as well as broker quotes. Debt securities for which quotations are readily available are valued at an over-the-counter or exchange bid quotation. Certain debt securities, which tend to be more thinly traded and of lesser quality, are priced based on fundamental analysis of the financial condition of the issuer and the estimated value of any collateral. Valuations developed through pricing techniques may vary from the actual amounts realized upon sale of the securities, and the potential variation may be greater for those securities valued using fundamental analysis.
66
NOTES TO FINANCIAL STATEMENTS (continued)
July 31, 2007
Short-term debt obligations maturing within 60 days are valued at amortized cost, which approximates market value.
Futures contracts are valued at the settlement price established each day by the board of trade or exchange on which they are traded.
Forward currency exchange contracts are valued at the prevailing forward exchange rate of the underlying currencies.
Foreign securities are generally valued at the last sale price on the foreign exchange or market on which they trade. If any foreign share prices are not readily available as a result of limited share activity, the securities are valued at the last sale price of the local shares in the principal market in which such securities are normally traded.
Generally, trading in foreign securities is substantially completed each day at various times prior to the close of the New York Stock Exchange ("NYSE"). The values of such securities used in computing the net asset value of the Funds' shares are determined as of such times. Foreign currency exchange rates are generally determined at 4:00 p.m. Eastern (U.S.) time. Events affecting the values of such foreign securities and such exchange rates may occur between the times at which they are determined and the close of the customary trading session of the NYSE, which would not be reflected in the computation of the Funds' net asset value. If events materially affecting the values of such foreign securities occur and it is determined that market quotations are not reliable, then these foreign securities will be valued at their "fair value" using procedures approved by the Board of Trustees. The Funds may use a systematic fair valuatio n model provided by an independent third party to value securities principally traded in foreign markets in order to adjust for possible stale pricing that may occur between the close of the foreign exchanges and the time for valuation.
Investments for which market quotations are not readily available, or that have quotations which Columbia believes are not reliable, are valued at fair value as determined in good faith under consistently applied procedures established by and under the general supervision of the Board of Trustees.
In September 2006, Statement of Financial Accounting Standards No. 157, Fair Value Measurements ("SFAS 157"), was issued. SFAS 157 is effective for fiscal years beginning after November 15, 2007. SFAS 157 defines fair value, establishes a framework for measuring fair value and expands disclosures about fair value measurements. Management is evaluating the impact the application of SFAS 157 will have on the Funds' financial statement disclosures.
Security transactions. Security transactions are accounted for on the trade date. Cost is determined and gains (losses) are based upon the specific identification method for both financial statement and federal income tax purposes.
Futures contracts. Each Fund may invest in futures contracts to seek to enhance returns, to hedge some of the risks of its investments in fixed income securities or as a substitute for a position in the underlying assets. The use of futures contracts involves certain risks, which include: (1) imperfect correlation between the price movement of the instruments and the underlying securities, (2) inability to close out positions due to differing trading hours, or the temporary absence of a liquid market, for either the instruments or the underlying securities, or (3) an inaccurate prediction by Columbia, the Funds' investment advisor, of the future direction of interest rates. Any of these risks may involve amounts exceeding the variation margin recorded in the Funds' Statements of Assets and Liabilities at any given time.
Upon entering into a futures contract, a Fund deposits cash or securities with the broker in an amount sufficient to meet the initial margin requirement. Subsequent payments are made or received by a Fund equal to the daily change in the contract value and are recorded as variation margin receivable or payable and offset in unrealized gains or losses. A Fund recognizes a realized gain or loss when the contract is closed or expires.
67
NOTES TO FINANCIAL STATEMENTS (continued)
July 31, 2007
Forward foreign currency exchange contracts. Forward foreign currency exchange contracts are agreements to exchange one currency for another at a future date at a specified price. These contracts are used to minimize the exposure to foreign exchange rate fluctuations during the period between trade and settlement date of the contract. Certain Funds may utilize forward foreign currency exchange contracts in connection with the settlement of purchases and sales of securities. Certain Funds may also enter into these contracts to hedge certain other foreign currency denominated assets. Contracts to buy generally are used to acquire exposure to foreign currencies, while contracts to sell are used to hedge the Funds' investments against currency fluctuations. Forward foreign currency exchange contracts are valued daily at the current exchange rate of the underlyin g currency, resulting in unrealized gains (losses) which become realized at the time the forward foreign currency exchange contracts are closed or mature. Realized and unrealized gains (losses) arising from such transactions are included in net realized and unrealized gains (losses) on foreign currency transactions. The use of forward foreign currency exchange contracts does not eliminate fluctuations in the prices of the Funds' portfolio securities. While the maximum potential loss from such contracts is the aggregate face value in U.S. dollars at the time the contract was opened, exposure is typically limited to the change in value of the contract (in U.S. dollars) over the period it remains open. The Funds are also exposed to risk that counterparties of the contracts may be unable to fulfill the terms of the contracts.
Loan Participations and Commitments. CMG High Yield Fund may invest in loan participations. When the Fund purchases a loan participation, the Fund typically enters into a contractual relationship with the lender or third party selling such participation ("Selling Participant"), but not the Borrower. However, the Fund assumes the credit risk of the Borrower, Selling Participant and any other persons interpositioned between the Fund and the Borrower ("Intermediate Participants"). The Fund may not directly benefit from the collateral supporting the senior loan which it has purchased from the Selling Participant.
Repurchase agreements. Each Fund may engage in repurchase agreement transactions with institutions that Columbia, has determined are creditworthy. Each Fund, through its custodian, receives delivery of underlying securities collateralizing a repurchase agreement. Columbia is responsible for determining that collateral is at least equal, at all times, to the value of the repurchase obligation including interest. A repurchase agreement transaction involves certain risks in the event of default or insolvency of the counterparty. These risks include possible delays or restrictions upon each Fund's ability to dispose of the underlying securities and a possible decline in the value of the underlying securities during the period while the Funds seek to assert their rights.
Delayed delivery securities. The Funds may trade securities on other than normal settlement terms, including securities purchased or sold on a "when-issued" basis. This may increase the risk if the other party to the transaction fails to deliver and causes the Funds to subsequently invest at less advantageous prices. The Funds hold until the settlement date, in a segregated account, cash or liquid securities in an amount equal to the delayed delivery commitment.
Treasury inflation protected securities. The Funds may invest in treasury inflation-indexed securities ("TIPS"). The principal amount of TIPS is adjusted periodically for inflation based on a monthly published index. Interest payments are based on the inflation-adjusted principal at the time the interest is paid.
Stripped securities. Stripped mortgage-backed securities are derivative multi-class mortgage securities structured so that one class receives most, if not all, of the principal from the underlying mortgage assets, while the other class receives most, if not all, of the interest and the remainder of the principal. If the underlying mortgage assets experience greater than anticipated prepayments of principal, a Fund may fail to fully recoup its initial investment in an interest-only security. The market value of these securities can be extremely volatile in response to changes in interest rates. Credit risk reflects the risk that a Fund may not receive all or part of its principal because the issuer or credit enhancer has defaulted on its obligation.
68
NOTES TO FINANCIAL STATEMENTS (continued)
July 31, 2007
Mortgage dollar rolls. The Funds may enter into mortgage "dollar rolls" in which the Funds sell securities for delivery in the current month and simultaneously contract with the same counterparty to repurchase similar (same type, coupon and maturity) but not identical securities on a specified future date not exceeding 120 days. During the roll period, the Funds lose the right to receive principal and interest paid on the securities sold. However, the Funds would benefit to the extent of any difference between the price received for the securities sold and the lower forward price for the future purchase (often referred to as the "drop") or fee income plus the interest earned on the cash proceeds of the securities sold until the settlement date of the forward purchase. Unless such benefits exceed the income, capital appreciation and gain or loss due to mortga ge prepayments that would have been realized on the securities sold as part of the mortgage dollar roll, the use of this technique will diminish the investment performance of the Funds compared with what such performance would have been without the use of mortgage dollar rolls. All cash proceeds will be invested in instruments that are permissible investments for the Funds. The Funds will hold and maintain in segregated accounts until the settlement date, cash or liquid securities in an amount equal to the forward purchase prices.
The Funds' policy is to record the components of mortgage dollar rolls using "to be announced" mortgage-backed securities ("TBA Dollar Rolls"). For financial reporting and tax purposes, the Funds treat mortgage dollar rolls as two separate transactions, one involving the purchase of a security and a separate transaction involving a sale. The Funds do not currently enter into mortgage dollar rolls that are accounted for as financing.
Mortgage dollar rolls involve certain risks. If the broker-dealer to whom the Funds sell the securities becomes insolvent, the Funds' right to purchase or repurchase the mortgage-related securities may be restricted and the instruments which the Funds are required to repurchase may be worth less than instruments which the Funds originally held. Successful use of mortgage dollar rolls may depend upon the investment advisor's ability to predict correctly interest rates and mortgage prepayments. For these reasons, there is no assurance that mortgage dollar rolls can be successfully employed.
Foreign currency transactions. The values of all assets and liabilities quoted in foreign currencies are translated into U.S. dollars at that day's exchange rates. Net realized and unrealized gains (losses) on foreign currency transactions include gains (losses) arising from the fluctuation in exchange rates between trade and settlement dates on securities transactions, gains (losses) arising from the disposition of foreign currency and currency gains (losses) between the accrual and payment dates on dividends, interest income and foreign withholding taxes.
For financial statement purposes, the Funds do not distinguish that portion of gains (losses) on investments which is due to changes in foreign exchange rates from that which is due to changes in market prices of the investments. Such fluctuations are included with the net realized and unrealized gains (losses) on investments in the Statements of Operations.
Income recognition. Interest income is recorded on an accrual basis and includes accretion of discounts, amortization of premiums and paydown gains and losses, net of any non-reclaimable tax withholdings of foreign securities.
Expenses. General expenses of the Trust are allocated to the Funds and the other series of the Trust based upon their relative net assets or other expense allocation methodologies determined by the nature of the expense. Expenses directly attributable to the Funds are charged to such Funds.
Federal income tax status. Each Fund intends to qualify each year as a "regulated investment company" under Subchapter M of the Internal Revenue Code, as amended, and will distribute substantially all of its taxable income, if any, for its tax year, and as such will not be subject to federal income taxes. In addition, each Fund intends to distribute in each calendar year substantially all of its net investment income, capital gains and certain other amounts, if any, such that each Fund should not be subject to federal excise tax. Therefore, no federal income or excise tax provision is recorded.
Distributions to shareholders. Dividends from net investment income, if any, are generally declared daily and paid monthly. Net realized capital gains, if any, are distributed at least annually.
69
NOTES TO FINANCIAL STATEMENTS (continued)
July 31, 2007
Indemnification. In the normal course of business, each Fund enters into contracts that contain a variety of representations and warranties and which provide general indemnities. A Fund's maximum exposure under these arrangements is unknown because this would involve future claims against the Fund. Also, under the Trust's organizational documents and by contract, the trustees and officers of the Trust are indemnified against certain liabilities that may arise out of actions relating to their duties to the Trust. However, based on experience, the Funds expect the risk of loss due to these representations, warranties and indemnities to be minimal.
Note 3. Federal tax information
The timing and character of income and capital gain distributions are determined in accordance with income tax regulations, which may differ from GAAP. Reclassifications are made to the Funds' capital accounts for permanent tax differences to reflect income and gains available for distribution (or available capital loss carryforwards) under income tax regulations.
For the year ended July 31, 2007, permanent book and tax basis differences resulting primarily from differing treatments for distribution reclassifications, capital loss carryforwards, amortization/accretion adjustments and paydown gain/loss reclassifications were identified and reclassified among the components of the Funds' net assets as follows:
| Undistributed (Overdistributed) Net Investment Income | Accumulated Net Realized Loss | Paid-In Capital | |||||||||||||
| CMG Core Bond Fund | $ | 146,731 | $ | (146,732 | ) | $ | 1 | ||||||||
| CMG Short Term Bond Fund | 473,533 | (468,099 | ) | (5,434 | ) | ||||||||||
| CMG Ultra Short Term Bond Fund | 277,782 | (277,783 | ) | 1 | |||||||||||
| CMG High Yield Fund | 519,092 | 34,958,722 | (35,477,814 | ) | |||||||||||
Net investment income and net realized gains (losses), as disclosed on the Statements of Operations, and net assets were not affected by these reclassifications.
The tax character of distributions paid during the years ended July 31, 2007 and July 31, 2006 were as follows:
| July 31, 2007 | |||||||||||||||
| Ordinary Income* | Long-Term Capital Gains | Tax Return of Capital | |||||||||||||
| CMG Core Bond Fund | $ | 2,884,251 | $ | - | $ | - | |||||||||
| CMG Short Term Bond Fund | 5,163,909 | - | - | ||||||||||||
| CMG Ultra Short Term Bond Fund | 5,585,102 | - | - | ||||||||||||
| CMG High Yield Fund | 5,912,719 | - | - | ||||||||||||
| July 31, 2006 | |||||||||||||||
| Ordinary Income* | Long-Term Capital Gains | Tax Return of Capital | |||||||||||||
| CMG Core Bond Fund | $ | 3,064,202 | $ | 19,258 | $ | - | |||||||||
| CMG Short Term Bond Fund | 3,690,742 | - | - | ||||||||||||
| CMG Ultra Short Term Bond Fund | 3,636,758 | - | 1,580 | ||||||||||||
| CMG High Yield Fund | 12,800,444 | - | - | ||||||||||||
*For tax purposes short-term capital gain distributions, if any, are considered ordinary income distributions.
70
NOTES TO FINANCIAL STATEMENTS (continued)
July 31, 2007
As of July 31, 2007, the components of distributable earnings on a tax basis were as follows:
| Undistributed Ordinary Income | Undistributed Long-term Capital Gains | Net Unrealized Depreciation* | |||||||||||||
| CMG Core Bond Fund | $ | 222,848 | $ | - | $ | (932,713 | ) | ||||||||
| CMG Short Term Bond Fund | 486,561 | - | (485,335 | ) | |||||||||||
| CMG Ultra Short Term Bond Fund | 430,268 | - | (1,008,435 | ) | |||||||||||
| CMG High Yield Fund | 228,539 | - | (3,620,602 | ) | |||||||||||
*The differences between book-basis and tax-basis net unrealized appreciation/depreciation are primarily due to deferral of losses from wash sales and amortization/accretion adjustments.
Unrealized appreciation and depreciation at July 31, 2007, based on cost of investments for federal income tax purposes, excluding any unrealized appreciation and depreciation from changes in the value of other assets and liabilities resulting from changes in exchange rates, were:
| Unrealized Appreciation | Unrealized Depreciation | Net Unrealized Depreciation | |||||||||||||
| CMG Core Bond Fund | $ | 227,409 | $ | (1,160,122 | ) | $ | (932,713 | ) | |||||||
| CMG Short Term Bond Fund | 193,105 | (678,440 | ) | (485,335 | ) | ||||||||||
| CMG Ultra Short Term Bond Fund | 180,023 | (1,188,458 | ) | (1,008,435 | ) | ||||||||||
| CMG High Yield Fund | 247,191 | (3,867,793 | ) | (3,620,602 | ) | ||||||||||
The following capital loss carryforwards, determined as of July 31, 2007, may be available to reduce taxable income arising from future net realized gains on investments, if any, to the extent permitted by the Internal Revenue Code:
| 2008 | 2009 | 2010 | 2012 | 2013 | 2014 | 2015 | Total | ||||||||||||||||||||||||||||
| CMG Core Bond Fund | $ | - | $ | - | $ | - | $ | - | $ | - | $ | 304,526 | $ | 1,461,747 | $ | 1,766,273 | |||||||||||||||||||
| CMG Short Term Bond Fund | 537,548 | - | 2,365,257 | 19,156 | 25,391 | 989,127 | 899,128 | 4,835,607 | |||||||||||||||||||||||||||
| CMG Ultra Short Term Bond Fund | - | - | - | 29,640 | 47,961 | 627,248 | 685,751 | 1,390,600 | |||||||||||||||||||||||||||
| CMG High Yield Fund | - | 6,776,032 | 2,987,019 | - | - | - | 3,691,106 | 13,454,157 | |||||||||||||||||||||||||||
Capital loss carryforwards of $35,477,813 for CMG High Yield Fund were permanently lost due to provisions under the Internal Revenue Code during the year ended July 31, 2007. Permanently lost and expired capital loss carryforwards are recorded as a reduction of paid-in capital.
Utilization of these losses could be subject to limitations imposed by the Internal Revenue Code.
Under current tax rules, certain capital losses realized after October 31 may be deferred and treated as occurring on the first day of the following fiscal year. As of July 31, 2007, post-October capital losses attributed to security transactions were deferred to August 1, 2007, as follows:
| Capital Losses | |||||||
| CMG Core Bond Fund | $ | 296,771 | |||||
| CMG Short Term Bond Fund | 494,987 | ||||||
| CMG Ultra Short Term Bond Fund | 225,691 | ||||||
| CMG High Yield Fund | 506,620 | ||||||
71
NOTES TO FINANCIAL STATEMENTS (continued)
July 31, 2007
In June 2006, the Financial Accounting Standards Board ("FASB") issued FASB Interpretation No. 48, Accounting for Uncertainty in Income Taxes, an Interpretation of FASB Statement No. 109 (the "Interpretation"). This Interpretation is effective on the last business day of the semiannual reporting period for fiscal years beginning after December 15, 2006 and is to be applied to open tax positions upon initial adoption. This Interpretation prescribes a minimum recognition threshold and measurements method for the financial statement recognition of tax positions taken or expected to be taken in a tax return and also requires certain expanded disclosures. Management is evaluating the application of this Interpretation to the Funds and has not at this time quantified the impact, if any, resulting from the adoption of this Interpretation on the Funds' financial statements.
Note 4. Fees and compensation paid to affiliates
Investment advisory fee. Columbia, an indirect, wholly-owned subsidiary of Bank of America Corporation ("BOA"), is the investment advisor to the Funds. Each Fund's investment advisory fee is a unified fee. Columbia, out of the unified fee it receives from the Funds, pays all accounting fees, legal fees, transfer agent fees, custody fees, expenses of the Chief Compliance Officer, fees for Sarbanes-Oxley compliance, the commitment fee for the line of credit and miscellaneous expenses of the Funds. The unified fee does not include brokerage fees, taxes, Trustees' fees, Trustee legal counsel fees, audit fees, interest expenses associated with any borrowings by the Funds or extraordinary expenses, if any. The unified fees are paid monthly to Columbia based on each Fund's average daily net assets at the following annual rates:
| CMG Core Bond Fund | 0.25 | % | |||||
| CMG Short Term Bond Fund | 0.25 | % | |||||
| CMG Ultra Short Term Bond Fund | 0.25 | % | |||||
| CMG High Yield Fund | 0.40 | % | |||||
Pricing and bookkeeping fees. Effective December 15, 2006, the Funds entered into a Financial Reporting Services Agreement with State Street Bank & Trust Company ("State Street") and Columbia (the "Financial Reporting Services Agreement") pursuant to which State Street provides financial reporting services to the Funds. Also effective December 15, 2006, the Funds entered into an Accounting Services Agreement with State Street and Columbia (collectively with the Financial Reporting Services Agreement, the "State Street Agreements") pursuant to which State Street provides accounting services to the Funds.
Effective December 15, 2006, the Funds entered into a Pricing and Bookkeeping Oversight and Services Agreement (the "Services Agreement") with Columbia. Under the Services Agreement, Columbia provides services related to Fund expenses and the requirements of the Sarbanes-Oxley Act of 2002, and provides oversight of the accounting and financial reporting services provided by State Street.
The fees for financial reporting services, accounting services, and pricing and bookkeeping services for each Fund are payable by Columbia.
Prior to December 15, 2006, Columbia was responsible for providing pricing and bookkeeping services to the Funds under a pricing and bookkeeping agreement. Under separate agreements between Columbia and State Street, Columbia delegated certain functions to State Street. As a result of the delegation, the total fees payable under the pricing and bookkeeping agreement were paid to State Street. The pricing and bookkeeping fees for each Fund were payable by Columbia.
Transfer agent fee. Columbia Management Services, Inc. (the "Transfer Agent"), an affiliate of Columbia and an indirect, wholly-owned subsidiary of BOA, provides shareholder services to the Funds and has contracted with Boston Financial Data Services ("BFDS") to serve as sub-transfer agent. The transfer agent fees for the Funds are payable by
72
NOTES TO FINANCIAL STATEMENTS (continued)
July 31, 2007
Columbia. The Transfer Agent pays the fees of BFDS for services as sub-transfer agent and is not entitled to reimbursement for such fees from the Funds or Columbia.
The Transfer Agent may also retain, as additional compensation for its services, fees for wire, telephone and redemption orders, IRA trustee agent fees and account transcript fees due the Transfer Agent from shareholders of the Funds and credits (net of bank charges) earned with respect to balances in accounts the Transfer Agent maintains in connection with its services to the Funds.
Fee waivers. Columbia has contractually agreed to reimburse the Funds through March 1, 2009, for certain expenses so that the total fund expenses incurred by the Funds, including the investment advisory fees, will not exceed the following annual rates (exclusive of brokerage commissions, interest, taxes and extraordinary expenses, if any) based on each Fund's average daily net assets:
| CMG Core Bond Fund | 0.25 | % | |||||
| CMG Short Term Bond Fund | 0.25 | % | |||||
| CMG Ultra Short Term Bond Fund | 0.25 | % | |||||
| CMG High Yield Fund | 0.40 | % | |||||
Fees paid to officers and trustees. All officers of the Funds are employees of Columbia or its affiliates and, with the exception of the Funds' Chief Compliance Officer, receive no compensation from the Funds. The Board of Trustees has appointed a Chief Compliance Officer to the Funds in accordance with federal securities regulations. The Funds, along with other affiliated Funds, are charged their pro-rata share of the expenses associated with the Chief Compliance Officer. The expenses of the Chief Compliance Officer charged to each Fund are payable by Columbia.
The Funds' Trustees may participate in a deferred compensation plan which may be terminated at any time. Obligations of the plan will be paid solely out of the Funds' assets.
Note 5. Portfolio information
For the year ended July 31, 2007, the cost of purchases and proceeds from sales of securities, excluding short-term obligations, were as follows:
| U.S. Government Securities | Other Investment Securities | ||||||||||||||||||
| Purchases | Sales | Purchases | Sales | ||||||||||||||||
| CMG Core Bond Fund | $ | 45,023,947 | $ | 39,159,398 | $ | 17,952,309 | $ | 13,637,862 | |||||||||||
| CMG Short Term Bond Fund | 44,748,114 | 28,797,648 | 77,651,192 | 36,462,433 | |||||||||||||||
| CMG Ultra Short Term Bond Fund | 31,732,820 | 38,273,209 | 105,274,111 | 68,110,436 | |||||||||||||||
| CMG High Yield Fund | - | - | 44,588,805 | 75,360,376 | |||||||||||||||
Note 6. Line of credit
The Funds and other affiliated funds participate in a $350,000,000 committed unsecured revolving line of credit and a $150,000,000 uncommitted, unsecured line of credit, both provided by State Street. Borrowings are available for temporary or emergency purposes.
Interest on the committed line of credit is charged to each participating fund based on the fund's borrowings at a rate per annum equal to the Federal Funds Rate plus 0.50%. In addition, a commitment fee of 0.10% per annum is accrued and apportioned among the participating funds based on their pro-rata portion of the unutilized committed line of
73
NOTES TO FINANCIAL STATEMENTS (continued)
July 31, 2007
credit. Interest on the uncommitted line of credit is charged to each participating fund based on the fund's borrowings at a variable rate per annum equal to the Federal Funds Rate plus a spread, as determined and quoted by State Street at the time of the request for a loan. A one-time structuring fee of $30,000 is also accrued and apportioned to each fund participating in the uncommitted line of credit based on the average net assets of the participating funds. In addition, if the uncommitted line of credit is extended for an additional period, an annual administration fee of $15,000 will be charged and apportioned among each participating fund. The commitment fee and structuring fee are included in "Other expenses" in the Statements of Operations.
For the year ended July 31, 2007, the Funds did not borrow under these arrangements.
Note 7. Shares of beneficial interest
As of July 31, 2007, the Funds had shareholders whose shares were beneficially owned by participant accounts over which BOA and/or its affiliates had either sole or joint investment discretion. Subscription and redemption activity of these accounts may have a significant effect on the operations of the Funds. The numbers of accounts and the percentages of shares of beneficial interest outstanding held therein are as follows:
| Number of Shareholders | % of Shares Outstanding Held | ||||||||||
| CMG Core Bond Fund | 1 | 85.5 | |||||||||
| CMG Short Term Bond Fund | 1 | 92.9 | |||||||||
| CMG Ultra Short Term Bond Fund | 1 | 99.9 | |||||||||
| CMG High Yield Fund | 1 | 71.9 | |||||||||
As of July 31, 2007, two of the Funds had shareholders that held greater than 5% of the shares outstanding of a Fund and BOA and/or its affiliates did not have investment discretion. Subscription and redemption activity of these shareholders may have a material effect on the Funds. The numbers of accounts and the percentages of shares of beneficial interest outstanding held therein are as follows:
| Number of Shareholders | % of Shares Outstanding Held | ||||||||||
| CMG Core Bond Fund | 1 | 12.9 | |||||||||
| CMG High Yield Fund | 3 | 18.9 | |||||||||
Note 8. Other
During the year ended July 31, 2007 Columbia reimbursed the CMG Ultra Short Term Bond Fund $652 for a realized investment loss due to a trading error incurred.
Note 9. Securities lending
CMG Core Bond Fund, CMG Short Term Bond Fund and CMG Ultra Short Term Bond Fund commenced a securities lending program in August 2006 and may lend their securities to certain approved brokers, dealers and other financial institutions. Each loan is collateralized by cash, in an amount at least equal to the market value of the securities loaned plus accrued income from the investment of collateral. The market value of the loaned securities is
74
NOTES TO FINANCIAL STATEMENTS (continued)
July 31, 2007
determined at the close of business of the Funds and any additional required collateral is delivered to the Funds on the next business day. The collateral received is invested and the income generated by the investment of the collateral, net of any fees remitted to State Street as the lending agent and borrower rebates, is paid to the Funds. Generally, in the event of borrower default, the Funds have the right to use the collateral to offset any losses incurred. In the event the Funds are delayed or prevented from exercising their right to dispose of the collateral, there may be a potential loss to the Funds. The Funds bear the risk of loss with respect to the investment of collateral.
Note 10. Disclosure of significant risks and contingencies
Foreign securities. There are certain additional risks involved when investing in foreign securities that are not inherent with investments in domestic securities. These risks may involve foreign currency exchange rate fluctuations, adverse political and economic developments and the possible prevention of currency exchange or other foreign governmental laws or restrictions. In addition, the liquidity of foreign securities may be more limited than that of domestic securities.
Investments in emerging market countries are subject to additional risk. The risk of foreign investments is typically increased in less developed countries. These countries are also more likely to experience high levels of inflation, deflation or currency devaluation which could hurt their economies and securities markets.
High-yield securities. Investing in high-yield securities may involve greater credit risk and considerations not typically associated with investing in U.S. Government bonds and other higher quality fixed income securities. These securities are non-investment grade securities, often referred to as "junk" bonds. Economic downturns may disrupt the high-yield market and impair the ability of issuers to repay principal and interest. Also, an increase in interest rates would likely have an adverse impact on the value of such obligations. Moreover, high-yield securities may be less liquid to the extent that there is no established secondary market.
Sector focus. The Funds may focus their investments in certain sectors, subjecting them to greater risk than a fund that is more diversified.
Legal proceedings. On February 9, 2005, Columbia Management Advisors, Inc. (which has since merged into Banc of America Capital Management, LLC (now named Columbia Management Advisors, LLC)) ("Columbia") and Columbia Funds Distributor, Inc. (which has been renamed Columbia Management Distributors, Inc.) (the "Distributor") (collectively, the "Columbia Group") entered into an Assurance of Discontinuance with the New York Attorney General ("NYAG") (the "NYAG Settlement") and consented to the entry of a cease-and-desist order by the Securities and Exchange Commission ("SEC") (the "SEC Order") on matters relating to mutual fund trading.
Under the terms of the SEC Order, the Columbia Group agreed, among other things, to: pay $70 million in disgorgement and $70 million in civil money penalties; cease and desist from violations of the antifraud provisions and certain other provisions of the federal securities laws; maintain certain compliance and ethics oversight structures; retain an independent consultant to review the Columbia Group's applicable supervisory, compliance, control and other policies and procedures; and retain an independent distribution consultant (see below). The Columbia Funds have also voluntarily undertaken to implement certain governance measures designed to maintain the independence of their boards of trustees. The NYAG Settlement also, among other things, requires Columbia and its affiliates to reduce management fees for certain Columbia Funds (including the former Nations Funds) and other mutual funds collectively by $32 million per year f or five years, for a projected total of $160 million in management fee reductions.
75
NOTES TO FINANCIAL STATEMENTS (continued)
July 31, 2007
Pursuant to the procedures set forth in the SEC Order, the $140 million in settlement amounts described above is being distributed in accordance with a distribution plan that was developed by an independent distribution consultant and approved by the SEC on April 6, 2007. Distributions under the distribution plan began in late June 2007.
A copy of the SEC Order is available on the SEC website at http://www.sec.gov. A copy of the NYAG Settlement is available as part of the Bank of America Corporation Form 8-K filing on February 10, 2005.
In connection with the events described above, various parties have filed suit against certain funds, the Trustees of the Columbia Funds, FleetBoston Financial Corporation and its affiliated entities and/or Bank of America and its affiliated entities.
On February 20, 2004, the Judicial Panel on Multidistrict Litigation transferred these cases and cases against other mutual fund companies based on similar allegations to the United States District Court in Maryland for consolidated or coordinated pretrial proceedings (the "MDL"). Subsequently, additional related cases were transferred to the MDL. On September 29, 2004, the plaintiffs in the MDL filed amended and consolidated complaints. One of these amended complaints is a putative class action that includes claims under the federal securities laws and state common law, and that names Columbia, the Distributor, the Trustees of the Columbia Funds, Bank of America Corporation and others as defendants. Another of the amended complaints is a derivative action purportedly on behalf of the Columbia Funds that asserts claims under federal securities laws and state common law.
On February 25, 2005, Columbia and other defendants filed motions to dismiss the claims in the pending cases. On March 1, 2006, for reasons stated in the court's memoranda dated November 3, 2005, the U.S. District Court for the District of Maryland granted in part and denied in part the defendants' motions to dismiss. The court dismissed all of the class action claims pending against the Columbia Funds Trusts. As to Columbia and the Distributor, the claims under the Securities Act of 1933, the claims under Sections 34(b) and 36(a) of the Investment Company Act of 1940 ("ICA") and the state law claims were dismissed. The claims under Sections 10(b) and 20(a) of the Securities Exchange Act of 1934 and claims under Section 36(b) of the ICA were not dismissed.
On March 21, 2005, a purported class action was filed in Massachusetts state court alleging that certain conduct, including market timing, entitled Class B shareholders in certain Columbia funds to an exemption from contingent deferred sales charges upon early redemption ("the CDSC Lawsuit"). The CDSC Lawsuit was removed to federal court in Massachusetts and transferred to the MDL.
On September 14, 2007, the plaintiffs and the Columbia defendants named in the MDL, including the Columbia Funds, entered into a stipulation of settlement with respect to all Columbia-related claims in the MDL described above, including the CDSC Lawsuit. The settlement is subject to court approval.
In 2004, the Columbia Funds' adviser and distributor and certain affiliated entities and individuals were named as defendants in certain purported shareholder class and derivative actions making claims, including claims under the Investment Company and the Investment Advisers Acts of 1940 and state law. Certain Columbia Funds were named as nominal defendants. The suits allege, inter alia, that the fees and expenses paid by the funds are excessive and that the advisers and their affiliates inappropriately used fund assets to distribute the funds and for other improper purposes. On March 2, 2005, the actions were consolidated in the Massachusetts federal court as In re Columbia Entities Litigation. The plaintiffs filed a consolidated amended complaint on June 9, 2005. On November 30, 2005, the judge dismissed all claims by plaintiffs and entered final judgment in favor of the defendants. The plaintiffs appealed to the United States Court of Appeals for the First Circuit on December 30, 2005. A stipulation and settlement agreement dated January 19, 2007 was filed in the First Circuit on February 14, 2007, with a joint stipulation of dismissal and motion for
76
NOTES TO FINANCIAL STATEMENTS (continued)
July 31, 2007
remand to obtain district court approval of the settlement. That joint motion was granted and the appeal was dismissed. On March 6, 2007, the case was remanded to the District Court. On September 18, 2007, the District Court approved the settlement, to be effective following the expiration of the appeal period. The funds' adviser and/or its affiliates will be required, pursuant to the settlement, to make certain payments including plaintiffs' attorneys' fees and costs of notice to class members.
77
Report of Independent Registered Public Accounting Firm
To the Trustees of Columbia Funds Institutional Trust and the Shareholders of CMG Core Bond Fund, CMG Short Term Bond Fund, CMG Ultra Short Term Bond Fund and CMG High Yield Fund
In our opinion, the accompanying statements of assets and liabilities, including the schedules of investments, and the related statements of operations and of changes in net assets and the financial highlights present fairly, in all material respects, the financial position of CMG Core Bond Fund, CMG Short Term Bond Fund, CMG Ultra Short Term Bond Fund and CMG High Yield Fund (the "Funds") (each a series of Columbia Funds Institutional Trust) at July 31, 2007, the results of each of their operations for the year then ended, the changes in each of their net assets for each of the two years in the period then ended, and their financial highlights for each of the periods indicated, in conformity with accounting principles generally accepted in the United States of America. These financial statements and financial highlights (hereafter referred to as "financial statements") are the responsibility of the Funds' management. Our respon sibility is to express an opinion on these financial statements based on our audits. We conducted our audits of these financial statements in accordance with the standards of the Public Company Accounting Oversight Board (United States). Those standards require that we plan and perform the audits to obtain reasonable assurance about whether the financial statements are free of material misstatement. An audit includes examining, on a test basis, evidence supporting the amounts and disclosures in the financial statements, assessing the accounting principles used and significant estimates made by management, and evaluating the overall financial statement presentation. We believe that our audits, which included confirmation of securities at July 31, 2007 by correspondence with the custodian and brokers, provide a reasonable basis for our opinion.
PricewaterhouseCoopers LLP
Boston, Massachusetts
September 21, 2007
78
Fund Governance
Trustees
The Trustees serve terms of indefinite duration. The names, addresses and ages of the Trustees and officers of the Funds in Columbia Funds Institutional Trust, the year each was first elected or appointed to office, their principal business occupations during at least the last five years, the number of portfolios overseen by each Trustee and other directorships they hold are shown below. Each officer listed below serves as an officer of each Fund in the Columbia Funds Complex.
| Name, Address and Year of Birth, Position with Funds, Year First Elected or Appointed to Office1 | Principal Occupation(s) During Past Five Years, Number of Portfolios in Columbia Funds Complex Overseen by Trustee, Other Directorships Held | ||||||
| Independent Trustees | |||||||
| Douglas A. Hacker (Born 1955) c/o Columbia Management Advisors, LLC One Financial Center Boston, MA 02111 Trustee (since 1996) | Independent business executive since May, 2006; Executive Vice President–Strategy of United Airlines (airline) from December, 2002 to May, 2006; President of UAL Loyalty Services (airline marketing company) from September, 2001 to December, 2002; Executive Vice President and Chief Financial Officer of United Airlines from July, 1999 to September, 2001. Oversees 68, Nash Finch Company (food distributor); Aircastle Limited (aircraft leasing) | ||||||
| Janet Langford Kelly (Born 1957) c/o Columbia Management Advisors, LLC One Financial Center Boston, MA 02111 Trustee (since 1996) | Senior Vice President, General Counsel and Corporate Secretary, ConocoPhillips (integrated energy company) since September, 2007; Deputy General Counsel—Corporate Legal Services, ConocoPhillips from August, 2006 to August, 2007; Partner, Zelle, Hofmann, Voelbel, Mason & Gette LLP (law firm) from March, 2005 to July, 2006; Adjunct Professor of Law, Northwestern University, from September, 2004 to June, 2006, Director, UAL Corporation (airline) from February, 2006 to July, 2006; Chief Administrative Officer and Senior Vice President, Kmart Holding Corporation (consumer goods), from September, 2003 to March, 2004; Executive Vice President–Corporate Development and Administration, General Counsel and Secretary, Kellogg Company (food manufacturer), from September, 1999 to August, 2003. Oversees 68, None | ||||||
| Richard W. Lowry (Born 1936) c/o Columbia Management Advisors, LLC One Financial Center Boston, MA 02111 Trustee (since 1995) | Private Investor since August, 1987 (formerly Chairman and Chief Executive Officer, U.S. Plywood Corporation (building products manufacturer) until 1987).Oversees 68, Liberty All-Star Equity Fund and Liberty All-Star Growth Fund, Inc. (closed-end funds) | ||||||
| Charles R. Nelson (Born 1942) c/o Columbia Management Advisors, LLC One Financial Center Boston, MA 02111 Trustee (since 1981) | Professor of Economics, University of Washington, since January, 1976; Ford and Louisa Van Voorhis Professor of Political Economy, University of Washington, since September, 1993; Director, Institute for Economic Research, University of Washington from September, 2001 to June, 2003; Adjunct Professor of Statistics, University of Washington, since September, 1980; Associate Editor, Journal of Money Credit and Banking, since September, 1993; Consultant on econometric and statistical matters. Oversees 68, None | ||||||
| John J. Neuhauser (Born 1943) c/o Columbia Management Advisors, LLC One Financial Center Boston, MA 02111 Trustee (since 1985) | President, St. Michaels College, since August, 2007; University Professor, Boston College from November, 2005 to August, 2007; Academic Vice President and Dean of Faculties, Boston College from August, 1999 to October, 2005. Oversees 68, Liberty All-Star Equity Fund and Liberty All-Star Growth Fund, Inc. (closed-end funds) | ||||||
| Patrick J. Simpson (Born 1944) c/o Columbia Management Advisors, LLC One Financial Center Boston, MA 02111 Trustee (since 2000) | Partner, Perkins Coie LLP (law firm). Oversees 68, None | ||||||
79
Fund Governance (continued)
Trustees
| Name, Address and Year of Birth, Position with Funds, Year First Elected or Appointed to Office1 | Principal Occupation(s) During Past Five Years, Number of Portfolios in Columbia Funds Complex Overseen by Trustee, Other Directorships Held | ||||||
| Independent Trustees | |||||||
| Thomas E. Stitzel (Born 1936) c/o Columbia Management Advisors, LLC One Financial Center Boston, MA 02111 Trustee (since 1998) | Business Consultant since 1999; Chartered Financial Analyst. Oversees 68, None | ||||||
| Thomas C. Theobald (Born 1937) c/o Columbia Management Advisors, LLC One Financial Center Boston, MA 02111 Trustee and Chairman of the Board2 (since 1996) | Partner and Senior Advisor, Chicago Growth Partners (private equity investing) since September, 2004; Managing Director, William Blair Capital Partners (private equity investing) from September, 1994 to September, 2004. Oversees 68, Anixter International (network support equipment distributor); Ventas, Inc. (real estate investment trust); Jones Lang LaSalle (real estate management services); Ambac Financial Group (financial guaranty insurance) | ||||||
| Anne-Lee Verville (Born 1945) c/o Columbia Management Advisors, LLC One Financial Center Boston, MA 02111 Trustee (since 1998) | Retired since 1997 (formerly General Manager, Global Education Industry, IBM Corporation (computer and technology) from 1994 to 1997). Oversees 68, None | ||||||
| Interested Trustee | |||||||
| William E. Mayer (Born 1940) c/o Columbia Management Advisors, LLC One Financial Center Boston, MA 02111 Trustee3 (since 1994) | Partner, Park Avenue Equity Partners (private equity) since February, 1999; Dean and Professor, College of Business, University of Maryland, 1992 to 1997. Oversees 68, Lee Enterprises (print media), WR Hambrecht + Co. (financial service provider); Reader's Digest (publishing) | ||||||
(1) In December 2000, the boards of each of the former Liberty Funds and former Stein Roe Funds were combined into one board of trustees responsible for the oversight of both fund groups (collectively, the "Liberty Board"). In October 2003, the trustees on the Liberty Board were elected to the boards of the Columbia Funds (the "Columbia Board") and of the CMG Fund Trust (the "CMG Funds Board"); simultaneous with that election, Patrick J. Simpson who had been a director on the Columbia Board and trustee on the CMG Funds Board, was appointed to serve as trustee of the Liberty Board. The date shown is the earliest date on which a trustee/director was elected or appointed to the board of a Fund in the Columbia Funds Complex.
(2) Mr. Theobald was appointed as Chairman of the Board effective December 10, 2003.
(3) Mr. Mayer is an "interested person" (as defined in the Investment Company Act of 1940) by reason of his affiliation with WR Hambrecht + Co.
The Statement of Additional Information includes additional information about the Trustees of the Funds and is available, without charge, upon request by calling 1-800-774-2098.
80
Fund Governance
Officers
| Name, Address and Year of Birth, Position with Columbia Funds, Year First Elected or Appointed to Office | Principal Occupation(s) During Past Five Years | ||||||
| Christopher L. Wilson (Born 1957) One Financial Center Boston, MA 02111 President (since 2004) | President–Columbia Funds, since October 2004; Managing Director–Columbia Management Advisors, LLC, since September 2005; Senior Vice President–Columbia Management Distributors, Inc., since January 2005; Director–Columbia Management Services, Inc., since January 2005; Director–Bank of America Global Liquidity Funds, plc and Banc of America Capital Management (Ireland), Limited, since May 2005; Director–FIM Funding, Inc., since January 2005; President and Chief Executive Officer–CDC IXIS AM Services, Inc. (investment management), from September 1998 through August 2004; and a senior officer or director of various other Bank of America-affiliated entities, including other registered and unregistered funds. | ||||||
| James R. Bordewick, Jr. (Born 1959) One Financial Center Boston, MA 02111 Senior Vice President, Secretary and Chief Legal Officer (since 2006) | Associate General Counsel, Bank of America since April, 2005; Senior Vice President and Associate General Counsel, MFS Investment Management (investment management) prior to April, 2005. | ||||||
| J. Kevin Connaughton (Born 1964) One Financial Center Boston, MA 02111 Senior Vice President, Chief Financial Officer and Treasurer (since 2000) | Treasurer–Columbia Funds, since October 2003; Treasurer–the Liberty Funds, Stein Roe Funds and Liberty All-Star Funds, December 2000–December 2006; Vice President–Columbia Management Advisors, Inc., since April 2003; President–Columbia Funds, Liberty Funds and Stein Roe Funds, February 2004 to October 2004; Treasurer–Galaxy Funds, September 2002 to December 2005; Treasurer, December 2002 to December 2004, and President, February 2004 to December 2004–Columbia Management Multi-Strategy Hedge Fund, LLC; and a senior officer of various other Bank of America-affiliated entities, including other registered and unregistered funds. | ||||||
| Linda J. Wondrack (Born 1964) One Financial Center Boston, MA 02111 Senior Vice President, Chief Compliance Officer (since 2007) | Director (Columbia Management Group LLC and Investment Product Group Compliance), Bank of America since June 2005; Director of Corporate Compliance and Conflicts Officer, MFS Investment Management (investment management), August 2004 to May 2005; Managing Director, Deutsche Asset Management (investment management) prior to August 2004. | ||||||
| Michael G. Clarke (Born 1969) One Financial Center Boston, MA 02111 Chief Accounting Officer and Assistant Treasurer (since 2004) | Director of Fund Administration of the Advisor since January, 2006; Managing Director of the Advisor September, 2004 to December, 2005; Vice President Fund Administration of the Advisor June, 2002 to September, 2004. Vice President Product Strategy and Development of the Advisor from February, 2001 to June, 2002. | ||||||
| Jeffrey R. Coleman (Born 1969) One Financial Center Boston, MA 02111 Deputy Treasurer (since 2006) | Director of Fund Administration of the Advisor since January, 2006; Fund Controller of the Advisor from October 2004 to January 2006; Vice President of CDC IXIS Asset Management Services, Inc. (investment management) from August, 2000 to September, 2004. | ||||||
81
Fund Governance (continued)
Officers
| Name, Address and Year of Birth, Position with Columbia Funds, Year First Elected or Appointed to Office | Principal Occupation(s) During Past Five Years | ||||||
| Joseph F. DiMaria (Born 1968) One Financial Center Boston, MA 02111 Deputy Treasurer (since 2006) | Director of Fund Administration of the Advisor since January, 2006; Head of Tax/Compliance and Assistant Treasurer of the Advisor from November, 2004 to December, 2005; Director of Trustee Administration (Sarbanes-Oxley) of the Advisor from May, 2003 to October, 2004; Senior Audit Manager, PricewaterhouseCoopers (independent registered public accounting firm) from July, 2000 to April, 2003. | ||||||
| Marybeth C. Pilat (Born 1968) One Financial Center Boston, MA 02111 Deputy Treasurer (since 2006) | Vice President, Mutual Fund Valuation of the Advisor since January 2006; Vice President, Mutual Fund Accounting Oversight of the Advisor prior to January 2006. | ||||||
| Barry S. Vallan (Born 1969) One Financial Center Boston, MA 02111 Controller (since 2006) | Vice President–Fund Treasury of the Advisor since October, 2004; Vice President–Trustee Reporting of the Advisor from April, 2002 to October, 2004; Management Consultant, PricewaterhouseCoopers (independent registered public accounting firm) prior to October, 2002. | ||||||
82
COLUMBIA FUNDS INSTITUTIONAL TRUST
ONE FINANCIAL CENTER, BOSTON, MASSACHUSETTS, 02111-2621
- INVESTMENT ADVISOR -
COLUMBIA MANAGEMENT ADVISORS, LLC
100 FEDERAL STREET
BOSTON, MASSACHUSETTS 02110-2624
- LEGAL COUNSEL -
ROPES & GRAY LLP
ONE INTERNATIONAL PLACE
BOSTON, MASSACHUSETTS 02110-2624
- TRANSFER AGENT -
COLUMBIA MANAGEMENT SERVICES, INC.
P.O. BOX 8081
BOSTON, MASSACHUSETTS 02266-8081
SHC-42/134206-0707 (09/07) 07/42326
A description of the policies and procedures that the funds use to determine how to vote proxies and a copy of the funds' voting records are available (i) at www.columbiamanagement.com; (ii) on the Securities and Exchange Commission's website at www.sec.gov, and (iii) without charge, upon request, by calling 1-800-368-0346. Information regarding how the funds voted proxies relating to portfolio securities during the 12-month period ended June 30 is available from the SEC's website. Information regarding how the funds voted proxies relating to portfolio securities is also available from the funds' website.
Each fund files a complete schedule of portfolio holdings with the SEC for the first and third quarters of each fiscal year on Form N-Q. Each fund's Form N-Q is available on the SEC's website at www.sec.gov and may be reviewed and copied at the SEC's Public Reference Room in Washington, D.C. Information on the operation of the Public Reference Room may be obtained by calling 1-800-SEC-0330.
The funds are offered by prospectus through Columbia Management Distributors, Inc. Please consider the investment objectives, risks, charges and expenses of a mutual fund carefully before investing. Contact your Columbia Management representative or visit www.columbiamanagement.com for a prospectus, which contains this and other important information about the funds. Read it carefully before you invest.
The Funds are distributed by Columbia Management Distributors, Inc.
©2007 Columbia Management Distributors, Inc.
One Financial Center, Boston, MA 02111-2621
![]()
CMG ENHANCED S&P 500® INDEX FUND
CMG LARGE CAP GROWTH FUND
CMG LARGE CAP VALUE FUND
CMG MID CAP GROWTH FUND
CMG MID CAP VALUE FUND
CMG SMALL CAP GROWTH FUND
CMG SMALL CAP VALUE FUND
CMG SMALL/MID CAP FUND
CMG INTERNATIONAL STOCK FUND
PORTFOLIOS OF COLUMBIA FUNDS INSTITUTIONAL TRUST
Annual Report
July 31, 2007
NOT FDIC INSURED
May Lose Value
No Bank Guarantee
NOT BANK ISSUED
Columbia Management Group, LLC ("Columbia Management") is the investment management division of Bank of America Corporation. Columbia Management entities furnish investment management services and products for institutional and individual investors. The CMG Funds are distributed by Columbia Management Distributors, Inc., member of FINRA, SIPC, part of Columbia Management and an affiliate of Bank of America Corporation.
Columbia Management Advisors, LLC ("CMA") is an SEC-registered investment advisor and an indirect, wholly-owned subsidiary of Bank of America Corporation and is part of Columbia Management.
Table of Contents
| Management Discussion of Fund Performance | |||||||
| CMG Enhanced S&P 500® Index Fund | 1 | ||||||
| CMG Large Cap Growth Fund | 5 | ||||||
| CMG Large Cap Value Fund | 9 | ||||||
| CMG Mid Cap Growth Fund | 13 | ||||||
| CMG Mid Cap Value Fund | 17 | ||||||
| CMG Small Cap Growth Fund | 21 | ||||||
| CMG Small Cap Value Fund | 25 | ||||||
| CMG Small/Mid Cap Fund | 29 | ||||||
| CMG International Stock Fund | 33 | ||||||
| Financial Statements | |||||||
| Financial Highlights | 37 | ||||||
| Schedules of Investments | 46 | ||||||
| Statements of Assets and Liabilities | 114 | ||||||
| Statements of Operations | 116 | ||||||
| Statements of Changes in Net Assets | 118 | ||||||
| Notes to Financial Statements | 123 | ||||||
| Report of Independent Registered Public Accounting Firm | 135 | ||||||
| Unaudited Information | 136 | ||||||
| Fund Governance | 138 | ||||||
The views expressed in this report reflect the current views of the respective parties. These views are not guarantees of future performance and involve certain risks, uncertainties and assumptions that are difficult to predict so actual outcomes and results may differ significantly from the views expressed. These views are subject to change at any time based upon economic, market or other conditions and the respective parties disclaim any responsibility to update such views. These views may not be relied on as investment advice and, because investment decisions for a CMG Fund are based on numerous factors, may not be relied on as an indication of trading intent on behalf of any particular CMG Fund. References to specific securities should not be construed as a recommendation or investment advice.
Performance data quoted represents past performance, and current performance may be lower or higher. Past performance is no guarantee of future results. The investment return and principal value will fluctuate so that shares, when redeemed, may be worth more or less than the original cost. Please visit www.columbiamanagement.com for daily and most recent month-end performance updates.
CMG ENHANCED S&P 500® INDEX FUND
A Portfolio of Columbia Funds Institutional Trust
MANAGEMENT DISCUSSION OF FUND PERFORMANCE
CMG Enhanced S&P 500® Index Fund returned 15.87% for the 12-month period ended July 31, 2007. The fund's return was lower than the return of the S&P 500® Index,1 the fund's benchmark, which was 16.13% for the same period. The fund outperformed the 15.61% average return for its peer group, the Lipper Large Cap Core Funds Classification.2 The fund benefited from having more exposure than the index to selected energy stocks, while stock selection in health care hampered returns.
In the energy sector, Marathon Oil (1.5% of net assets) benefited from a favorable refining market and was a standout performer, with a return of 24%. The fund got an additional boost by owning more of the stock than its weight in the index. A below-index weight in Valero Energy (1.2% of net assets) also aided performance as its shares were flat for the period. Concerns over high energy prices powered interest in the solar business of Advanced Micro Devices which gained 12% during the period. We sold the stock. Elsewhere in the technology sector, shares of Cisco Systems (2.3% of net assets) soared 62% on the strength of rising sales. The fund had more exposure than the index to Cisco, which also benefited relative performance. Financial sector results were also good for the fund, as disappointing performance from Merrill Lynch & Co. and Bear Stearns Companies (1.4% and 0.8% of net assets, respectively) in the financial secto r was offset by the benefit of not owning shares of Columbia's parent company, Bank of America.3 In general, industry concerns over mortgage exposure weighed on the industry. Merrill Lynch significantly underperformed the index as its shares were hit by credit and mortgage concerns while exposure to lower-grade credits and write-downs sent Bear Stearns shares down 14%.
In the health care sector, a decision to overweight Forest Laboratories and Amgen (1.3% and 1.0% of net assets, respectively) turned out poorly for the fund. Forest Labs announced poor results for a key new product, diminishing the firm's growth prospects. Amgen fell sharply on slowing sales of its flagship anemia drug, Epogen. An overweight in Lexmark International (0.5% of net assets) in the technology sector also hampered the fund's return. The company's earnings slowed on higher operating expenses due to higher spending on new products, brand awareness and demand generation.
1 The S&P 500® Index tracks the performance of 500 widely held, large-capitalization US stocks. Indices are not investments, do not incur fees or expenses and are not professionally managed. It is not possible to invest directly in an index. Securities in the fund may not match those in an index.
2 Lipper Inc., a widely respected data provider in the industry, calculates an average total return (assuming reinvestment of distributions) for mutual funds with investment objectives similar to those of the fund. Lipper makes no adjustment for the effect of sales loads.
3 The fund is not permitted to own Bank of America stock. This has hampered the fund's performance during prior periods, but aided performance during this reporting period.
1
We appreciate your continued confidence in CMG Enhanced S&P 500® Index Fund.
Portfolio Management
Vikram Kuriyan has managed the fund since June 2005 and has been with the advisor or its predecessors or affiliate organizations since 2000.
The fund's top ten holdings (as a percentage of net assets) as of July 31, 2007 were:
| (%) | |||||||
| Exxon Mobil | 4.1 | ||||||
| Microsoft | 3.1 | ||||||
| Citigroup | 2.3 | ||||||
| Cisco Systems | 2.3 | ||||||
| JPMorgan Chase | 2.0 | ||||||
| Chevron | 1.9 | ||||||
| Goldman Sachs Group | 1.7 | ||||||
| Applied Materials | 1.6 | ||||||
| General Electric | 1.6 | ||||||
| Oracle | 1.6 | ||||||
Holdings are calculated as a percentage of net assets and are subject to change. Because the fund is actively managed, there is no guarantee the fund will continue to maintain the holdings breakdown listed. The fund's holdings and their weights within the portfolio may change as market conditions change.
Equity investments are affected by stock market fluctuations that occur in response to economic and business developments.
Unlike the S&P 500® Index, the fund incurs administrative expenses and transaction costs in trading stocks. The composition of the S&P 500® Index and the stocks held by the fund will diverge.
2
Performance data quoted represents past performance and current performance may be lower or higher. Past performance is no guarantee of future results. The investment return and principal value will fluctuate so that shares, when redeemed, may be worth more or less than the original cost. Please visit www.columbiamanagement.com for daily and most recent month-end performance updates.
Average annual total return as of July 31, 2007 (%)
| Inception | 1-year | Life | |||||||||||||
| CMG Enhanced S&P 500® Index Fund | 05/05/03 | 15.87 | 13.78 | ||||||||||||
| S&P 500® Index | 16.13 | 13.27 | |||||||||||||
Average annual total return as of June 30, 2007 (%)
| Inception | 1-year | Life | |||||||||||||
| CMG Enhanced S&P 500® Index Fund | 05/05/03 | 21.56 | 15.18 | ||||||||||||
| S&P 500® Index | 20.59 | 14.42 | |||||||||||||
Index performance is from May 5, 2003.
Performance results reflect any waivers or reimbursements of fund expenses by the investment advisor and/or any of its affiliates. Absent these waivers or reimbursement arrangements, performance results would have been lower. All results shown assume reinvestment of distributions.
The fund's annual operating expense ratios, with and without contractual waivers, as stated in the fund's prospectus that is current as of the date of this report, are 0.25% and 0.31%, respectively, of average annual net assets. Differences in expense ratios disclosed elsewhere in this report may result from including fee waivers and reimbursements as well as different time periods used in calculating the ratios. The contractual waiver expires 03/01/09.
Growth of a $3,000,000 investment, May 5, 2003 to July 31, 2007
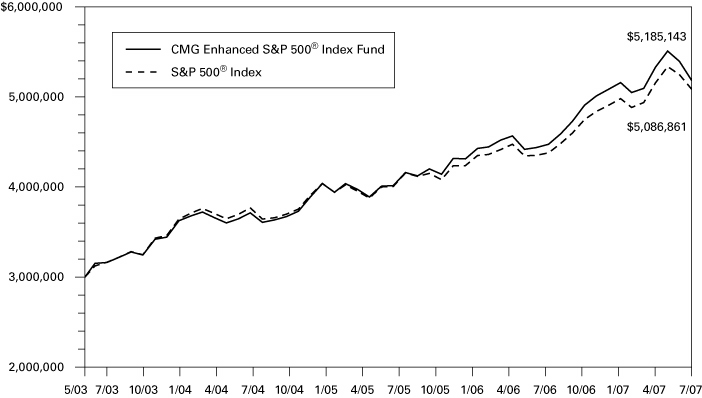
The chart above shows the growth in value of a hypothetical $3,000,000 investment in the fund compared to the index during the stated time period.
The table and chart do not reflect the deduction of taxes that a shareholder may pay on fund distributions or the redemption of fund shares.
The S&P 500® Index tracks the performance of 500 widely held, large-capitalization US stocks. Indices are not investments, do not incur fees or expenses and are not professionally managed. It is not possible to invest directly in an index. Securities in the fund may not match those in an index.
3
UNDERSTANDING YOUR EXPENSES – CMG Enhanced S&P 500® Index Fund
As a fund shareholder, you incur two types of costs. There are transaction costs and also ongoing costs, which generally include investment advisory fees and other fund expenses. The information on this page is intended to help you understand the ongoing costs of investing in the fund and to compare these costs with the ongoing costs of investing in other mutual funds.
Analyzing your fund's expenses
To illustrate these ongoing costs, we have provided an example and calculated the expenses paid by investors during the reporting period. The information in the following table is based on an initial investment of $1,000.00, which is invested at the beginning of the reporting period and held for the entire period. Expense information is calculated two ways and each method provides you with different information. The amount listed in the "actual" column is calculated using the fund's actual operating expenses and total return for the period. The amount listed in the "hypothetical" column assumes that the return each year is 5% before expenses and is calculated based on the fund's actual operating expenses. You should not use the hypothetical account values and expenses to estimate either your actual account balance at the end of the period or the expenses you paid during this reporting period.
Estimating your actual expenses
To estimate the expenses that you paid over the period, first you will need your account balance at the end of the period:
1. Divide your ending account balance by $1,000.00. For example, if an account balance was $8,600.00 at the end of the period, the result would be 8.6.
2. In the section of the table below titled "Expenses paid during the period," locate the amount under "actual." Multiply this number by the result from step 1. Your answer is an estimate of the expenses you paid on your account during the period.
February 1, 2007 – July 31, 2007
| Account value at the beginning of the period ($) | Account value at the end of the period ($) | Expenses paid during the period ($) | Fund's annualized expense ratio (%) | ||||||||||||||||||||||||
| Actual | Hypothetical | Actual | Hypothetical | Actual | Hypothetical | Actual | |||||||||||||||||||||
| 1,000.00 | 1,000.00 | 1,004.81 | 1,023.55 | 1.24 | 1.25 | 0.25 | |||||||||||||||||||||
Expenses paid during the period are equal to the fund's annualized expense ratio of 0.25%, multiplied by the average account value over the period, then multiplied by the number of days in the fund's most recent fiscal half-year and divided by 365.
Had the investment advisor and/or any of its affiliates not reimbursed a portion of expenses, account value at the end of the period would have been reduced.
It is important to note that the expense amounts shown in the table are meant to highlight only ongoing costs of investing in the fund. Therefore, the hypothetical examples provided may not help you determine the relative total costs of owning shares of different funds.
Compare with other funds
Since all mutual funds are required to include the same hypothetical calculations about expenses in shareholder reports, you can use this information to compare the ongoing costs of investing in the fund with other funds. To do so, compare the 5% hypothetical example with the 5% hypothetical examples that appear in the shareholder reports of other funds. As you compare hypothetical examples of other funds, it is important to note that hypothetical examples are meant to highlight the ongoing costs of investing in a fund.
4
Performance data quoted represents past performance, and current performance may be lower or higher. Past performance is no guarantee of future results. The investment return and principal value will fluctuate so that shares, when redeemed, may be worth more or less than the original cost. Please visit www.columbiamanagement.com for daily and most recent month-end performance updates.
CMG LARGE CAP GROWTH FUND
A Portfolio of Columbia Funds Institutional Trust
MANAGEMENT DISCUSSION OF FUND PERFORMANCE
For the 12-month period ended July 31, 2007, CMG Large Cap Growth Fund returned 19.77%. The fund beat the 19.47% return of its benchmark, the Russell 1000 Growth Index1 and the 18.02% average return of its peer group, the Morningstar Large Growth Category.2 Stock selection drove returns, with gains in the technology, industrials and consumer discretionary sectors helping the fund outpace the Russell index. The fund benefited from maintaining its focus on large-cap companies with above-average earnings growth prospects whose stocks were selling at attractive valuations. In particular, we looked for companies which we believe had strong competitive positions, high sustainable profits and good balance sheets. Large-cap growth stocks generally had a great year, buoyed by positive earnings growth, good cash flows and attractive valuations. A weak US dollar and exposure to strong growth in overseas economies also contributed to good results.
Technology stocks, which account for about 25% of the Russell index, had the biggest impact on performance. The fund leaned toward communications equipment and Internet-related stocks, while downplaying data processing and outsourcing companies. Winners included aQuantive, a digital media and advertising company that rallied sharply following a substantial buyout offer. Research In Motion, maker of the Blackberry wireless devices, also gained nicely, after resolving some pending litigation issues. In addition, CommScope, a fiber-optic and communications cabling company, soared, fueled by the growth of digital communications. We took profits, selling aQuantive, Research in Motion and CommScope.
Industrials, aerospace and defense investments did well, benefiting from increased spending on new and replacement equipment. Among the winners was Precision Castparts which supplies components to the aerospace industry. It received an added boost from a recent acquisition, leading us to sell the position. Within consumer discretionary, we steered away from stocks that seemed vulnerable to slower consumer spending, including broad-based, soft goods retailers and restaurants, and instead favored media, leisure and gaming stocks. Standouts included GameStop (1.1% of net assets), a large electronic games retailer with strong earning growth, and Las Vegas Sands (0.7% of net assets), a casino operator participating in the developing gaming center of Macau in the Far East.
The fund's health care stocks generated positive returns, but trailed the sector's return in the Russell index mainly because we did not own some of the year's strongest performers. In addition, the fund was hurt by an underweight relative to the Russell index in medical device
1 The Russell 1000 Growth Index measures the performance of those Russell 1000 Index companies with higher price-to-book ratios and higher forecasted growth values. Indices are not investments, do not incur fees or expenses and are not professionally managed. It is not possible to invest directly in an index. Securities in the fund may not match those in an index.
2 ©2007 by Morningstar, Inc. All rights reserved. The information contained herein is the proprietary information of Morningstar, Inc., may not be copied or redistributed for any purpose and may only be used for noncommercial, personal purposes. The information contained herein is not represented or warranted to be accurate, correct, complete or timely. Morningstar, Inc. shall not be responsible for investment decisions, damages or other losses resulting from the use of this information. Past performance is no guarantee of future performance. Morningstar, Inc. has not granted consent for it to be considered or deemed an "expert" under the Securities Act of 1933. Morningstar Categories compare the performance of funds with similar investment objectives and strategies.
5
companies when they did well early in the year and also by weak returns from the battered biotechnology industry. The biggest negative overall was Schering-Plough (1.6% of net assets), a pharmaceutical company, which underperformed following our initial purchase. Offsetting some of this underperformance was Thermo Fisher Scientific (1.4% of net assets), a laboratory testing and supplies company that did well following the merger between Thermo Electron and Fisher Scientific.
We believe the US stock market will remain choppy as the subprime mortgage situation continues to unravel and credit standards tighten. However, we believe large-cap growth stocks are well positioned with broad global exposure, which should help them benefit from potentially strong economic growth overseas. In addition, we believe large-cap growth stocks will continue to attract investors because they tend to offer more certain earnings growth outlooks than the more economically sensitive stocks found in value indices. While diversification does not ensure a profit or guarantee against loss, we believe our well-diversified portfolio is positioned to help minimize downside risk in a volatile market environment.
Thank you for investing in CMG Large Cap Growth Fund.
Portfolio Management
Paul J. Berlinguet, is the lead manager for CMG Large Cap Growth Fund and has managed or co-managed the fund since October 2003 and has been with the advisor or its predecessors or affiliate organizations since 2003.
Roger Sullivan has co-managed the fund since June 2005 and has been with the advisor or its predecessors or affiliate organizations since 2005.
John T. Wilson has co-managed the fund since August 2005 and has been with the advisor or its predecessors or affiliate organizations since 2005.
Edward Hickey has co-managed the fund since June 2005 and has been with the advisor or its predecessors or affiliate organizations since 1998.
Mary-Ann Ward has co-managed the fund since June 2005 and has been with the advisor or its predecessors or affiliate organizations since 1997.
The fund's top ten holdings (as a percentage of net assets) as of July 31, 2007 were:
| (%) | |||||||
| 3.2 | |||||||
| Cisco Systems | 3.1 | ||||||
| Microsoft | 2.8 | ||||||
| Intel | 2.2 | ||||||
| Merck & Co. | 2.0 | ||||||
| PepsiCo | 1.8 | ||||||
| Schering-Plough | 1.6 | ||||||
| 3M | 1.6 | ||||||
| International Business Machines | 1.6 | ||||||
| State Street | 1.5 | ||||||
Holdings are calculated as a percentage of net assets, and are subject to change. Because the fund is actively managed, there is no guarantee the fund will continue to maintain the holdings breakdown listed. The fund's holdings and their weights within the portfolio may change as market conditions change.
Equity investments are affected by stock market fluctuations that occur in response to economic and business developments.
Investing in growth stocks incurs the possibility of losses because their prices are sensitive to changes in current or expected earnings.
6
Performance data quoted represents past performance and current performance may be lower or higher. Past performance is no guarantee of future results. The investment return and principal value will fluctuate so that shares, when redeemed, may be worth more or less than the original cost. Please visit www.columbiamanagement.com for daily and most recent month-end performance updates.
Average annual total return as of July 31, 2007 (%)
| Inception | 1-year | Life | |||||||||||||
| CMG Large Cap Growth Fund | 09/10/03 | 19.77 | 9.62 | ||||||||||||
| Russell 1000 Growth Index | 19.47 | 8.84 | |||||||||||||
Average annual total return as of June 30, 2007 (%)
| Inception | 1-year | Life | |||||||||||||
| CMG Large Cap Growth Fund | 09/10/03 | 18.98 | 10.38 | ||||||||||||
| Russell 1000 Growth Index | 19.04 | 9.50 | |||||||||||||
Index performance is from September 10, 2003.
Performance results may reflect any waivers or reimbursements of fund expenses by the advisor and/or any of its affiliates. Absent these waivers or reimbursement arrangements, performance results would have been lower. All results shown assume reinvestment of distributions.
The fund's annual operating expense ratios, with and without contractual waivers, as stated in the fund's prospectus that is current as of the date of this report, are 0.50% and 0.63%, respectively, of average annual net assets. Differences in expense ratios disclosed elsewhere in this report may result from including fee waivers and reimbursements as well as different time periods used in calculating the ratios. The contractual waiver expires 03/01/09.
Growth of a $3,000,000 investment, September 10, 2003 to July 31, 2007
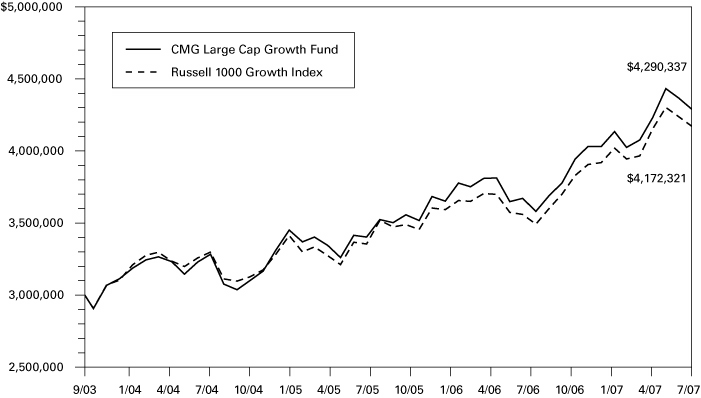
The chart above shows the growth in value of a hypothetical $3,000,000 investment in the fund compared to the index during the stated time period.
The table and chart do not reflect the deduction of taxes that a shareholder may pay on fund distributions or the redemption of fund shares.
The Russell 1000 Growth Index measures the performance of those Russell 1000 Index companies with higher price-to-book ratios and higher forecasted growth values. Indices are not investments, do not incur fees or expenses and are not professionally managed. It is not possible to invest directly in an index. Securities in the fund may not match those in an index.
7
UNDERSTANDING YOUR EXPENSES – CMG Large Cap Growth Fund
As a fund shareholder, you incur two types of costs. There are transaction costs and also ongoing costs, which generally include investment advisory fees and other fund expenses. The information on this page is intended to help you understand the ongoing costs of investing in the fund and to compare these costs with the ongoing costs of investing in other mutual funds.
Analyzing your fund's expenses
To illustrate these ongoing costs, we have provided an example and calculated the expenses paid by investors during the reporting period. The information in the following table is based on an initial investment of $1,000.00, which is invested at the beginning of the reporting period and held for the entire period. Expense information is calculated two ways and each method provides you with different information. The amount listed in the "actual" column is calculated using the fund's actual operating expenses and total return for the period. The amount listed in the "hypothetical" column assumes that the return each year is 5% before expenses and is calculated based on the fund's actual operating expenses. You should not use the hypothetical account values and expenses to estimate either your actual account balance at the end of the period or the expenses you paid during this reporting period.
Estimating your actual expenses
To estimate the expenses that you paid over the period, first you will need your account balance at the end of the period:
1. Divide your ending account balance by $1,000.00. For example, if an account balance was $8,600.00 at the end of the period, the result would be 8.6.
2. In the section of the table below titled "Expenses paid during the period," locate the amount under "actual." Multiply this number by the result from step 1. Your answer is an estimate of the expenses you paid on your account during the period.
February 1, 2007 – July 31, 2007
| Account value at the beginning of the period ($) | Account value at the end of the period ($) | Expenses paid during the period ($) | Fund's annualized expense ratio (%) | ||||||||||||||||||||||||
| Actual | Hypothetical | Actual | Hypothetical | Actual | Hypothetical | Actual | |||||||||||||||||||||
| 1,000.00 | 1,000.00 | 1,037.29 | 1,022.32 | 2.53 | 2.51 | 0.50 | |||||||||||||||||||||
Expenses paid during the period are equal to the fund's annualized expense ratio of 0.50%, multiplied by the average account value over the period, then multiplied by the number of days in the fund's most recent fiscal half-year and divided by 365.
Had the investment advisor and/or any of its affiliates not reimbursed a portion of expenses, account value at the end of the period would have been reduced.
It is important to note that the expense amounts shown in the table are meant to highlight only ongoing costs of investing in the fund. Therefore, the hypothetical examples provided may not help you determine the relative total costs of owning shares of different funds.
Compare with other funds
Since all mutual funds are required to include the same hypothetical calculations about expenses in shareholder reports, you can use this information to compare the ongoing costs of investing in the fund with other funds. To do so, compare the 5% hypothetical example with the 5% hypothetical examples that appear in the shareholder reports of other funds. As you compare hypothetical examples of other funds, it is important to note that hypothetical examples are meant to highlight the ongoing costs of investing in a fund.
8
Performance data quoted represents past performance, and current performance may be lower or higher. Past performance is no guarantee of future results. The investment return and principal value will fluctuate so that shares, when redeemed, may be worth more or less than the original cost. Please visit www.columbiamanagement.com for daily and most recent month-end performance updates.
CMG LARGE CAP VALUE FUND
A Portfolio of Columbia Funds Institutional Trust
MANAGEMENT DISCUSSION OF FUND PERFORMANCE
For the 12-month period ended July 31, 2007, CMG Large Cap Value Fund returned 13.69%. The fund came out slightly ahead of its benchmark, the Russell 1000 Value Index1, which returned 13.47%, and behind the 14.30% average return of the Morningstar Large Value Category peer group.2 The fund benefited from good stock selection, particularly in the utilities, technology and consumer staples sectors, but was hampered by consumer discretionary, energy and financials stock returns that lagged those in the index. As bottom-up stock pickers, we targeted companies with the ability to expand their profit margins by growing revenues and leveraging operations. In particular, we looked for companies with depressed stock valuations and compressed operating margins that had the potential for volume growth and pricing power.
Utilities, which had the biggest positive impact on relative performance, benefited as tight supply and growing demand helped push through rate increases. Winners included Public Service Enterprise Group (0.9% of net assets), an east coast electric utility with nuclear generation capacity, whose revenues benefited from stronger pricing as old contracts expired and new ones went into effect at higher rates. In addition, the stock gained from the sale of non-core assets and the shift toward more environmentally acceptable nuclear generation over coal-fired alternatives.
In the technology sector, the fund favored test and equipment companies, as well as semiconductors. NVIDIA (0.8% of net assets), a premier supplier of high-end graphic chips, gained as sales of its chips, which are used in Microsoft's new VISTA operating system, increased. In addition, Agilent Technologies (0.6% of net assets), a company that tests chips used in mobile phone handsets, climbed nicely, fueled by growing demand for cellular phones as well as the introduction of next generation (3G) technology.
Within consumer staples, the fund held a mix of names with an emphasis on tobacco and beverage companies over household products and food companies. Standouts included Loews Corp.-Carolina Group (1.8% of net assets), a tobacco company known for its Newport brand. The stock appreciated nicely, as growing volumes and better cost controls boosted profit margins.
Detractors in the consumer discretionary sector included homebuilders such as Lennar (0.4% of net assets), which were hurt by the housing downturn. We bought the stock in late 2006 when we thought its valuation and fundamentals were bottoming, but the housing market continued to deteriorate. In financials, the big disappointments were tied to the subprime mortgage debacle. Ambac Financial Group (1.8% of net assets), an insurer, declined as investors worried about mortgage exposure in the company's portfolio of collateralized debt obligations. Our
1 The Russell 1000 Value Index measures the performance of those Russell 1000 Index companies with lower price-to-book ratios and lower forecasted growth values. Indices are not investments, do not incur fees or expenses and are not professionally managed. It is not possible to invest directly in an index. Securities in the fund may not match those in an index.
2 ©2007 by Morningstar, Inc. All rights reserved. The information contained herein is the proprietary information of Morningstar, Inc., may not be copied or redistributed for any purpose and may only be used for noncommercial, personal purposes. The information contained herein is not represented or warranted to be accurate, correct, complete or timely. Morningstar, Inc. shall not be responsible for investment decisions, damages or other losses resulting from the use of this information. Past performance is no guarantee of future performance. Morningstar, Inc. has not granted consent for it to be considered or deemed an "expert" under the Securities Act of 1933. Morningstar Categories compare the performance of funds with similar investment objectives and strategies.
9
focus in energy was on equipment companies, which benefited as higher commodity prices boosted spending on exploration and production. However, EnCana, a Canadian gas and oil producer, hurt returns. It declined sharply after cutting back on production when energy commodity prices weakened in 2006. At period end, we no longer owned the position.
We expect market volatility to continue as long as credit and housing concerns linger. Large-cap stocks, however, can benefit from volatility when investors view them as safe havens. We're also encouraged because we continue to find stocks that meet our investment criteria. By period end, the fund was positioned to be less economically sensitive, with underweights in the industrials and consumer discretionary sectors. We also increased the fund's stake in the more defensive consumer staples sector, while taking advantage of buying opportunities in utilities, telecommunications and the beaten-down financials sector.
Thank you for investing in CMG Large Cap Value Fund.
Portfolio Management
Lori J. Ensinger is the lead manager for CMG Large Cap Value Fund and has managed the fund since August 2005. She has been with the advisor or its predecessors or affiliate organizations since 2001.
David I. Hoffman has co-managed the fund since August 2005 and has been with the advisor or its predecessors or affiliate organizations since 2001.
Noah J. Petrucci has co-managed the fund since August 2005 and has been with the advisor or its predecessors or affiliate organizations since 2002.
Diane L. Sobin has co-managed the fund since August 2005 and has been with the advisor or its predecessors or affiliate organizations since 2001.
The fund's top ten holdings (as a percentage of net assets) as of July 31, 2007 were:
| (%) | |||||||
| General Electric | 5.0 | ||||||
| Exxon Mobil | 4.8 | ||||||
| AT&T | 3.9 | ||||||
| Citigroup | 3.3 | ||||||
| JPMorgan Chase | 2.6 | ||||||
| Occidental Petroleum | 2.4 | ||||||
| Hewlett-Packard | 2.1 | ||||||
| ACE | 2.1 | ||||||
| Altria Group | 2.0 | ||||||
| Wells Fargo | 2.0 | ||||||
Holdings are calculated as a percentage of net assets, and are subject to change. Because the fund is actively managed, there is no guarantee the fund will continue to maintain the holdings breakdown listed. The fund's holdings and their weights within the portfolio may change as market conditions change.
Equity investments are affected by stock market fluctuations that occur in response to economic and business developments.
Value stocks are stocks of companies that may have experienced adverse business or industry developments or may be subject to special risks that have caused the stocks to be out of favor and, in the advisor's opinion, undervalued. If the advisor's assessment of a company's prospects is wrong, the price of the company's stock may not approach the value the advisor has placed on it.
10
Performance data quoted represents past performance and current performance may be lower or higher. Past performance is no guarantee of future results. The investment return and principal value will fluctuate so that shares, when redeemed, may be worth more or less than the original cost. Please visit www.columbiamanagement.com for daily and most recent month-end performance updates.
Average annual total return as of July 31, 2007 (%)
| Inception | 1-year | Life | |||||||||||||
| CMG Large Cap Value Fund | 09/10/03 | 13.69 | 12.87 | ||||||||||||
| Russell 1000 Value Index | 13.47 | 15.04 | |||||||||||||
Average annual total return as of June 30, 2007 (%)
| Inception | 1-year | Life | |||||||||||||
| CMG Large Cap Value Fund | 09/10/03 | 19.50 | 14.41 | ||||||||||||
| Russell 1000 Value Index | 21.87 | 16.84 | |||||||||||||
Index performance is from September 10, 2003.
Performance results may reflect any waivers or reimbursements of fund expenses by the advisor and/or any of its affiliates. Absent these waivers or reimbursement arrangements, performance results would have been lower. All results shown assume reinvestment of distributions.
The fund's annual operating expense ratios, with and without contractual waivers, as stated in the fund's prospectus that is current as of the date of this report, are 0.50% and 0.63%, respectively, of average annual net assets. Differences in expense ratios disclosed elsewhere in this report may result from including fee waivers and reimbursements as well as different time periods used in calculating the ratios. The contractual waiver expires 03/01/09.
Growth of a $3,000,000 investment, September 10, 2003 to July 31, 2007
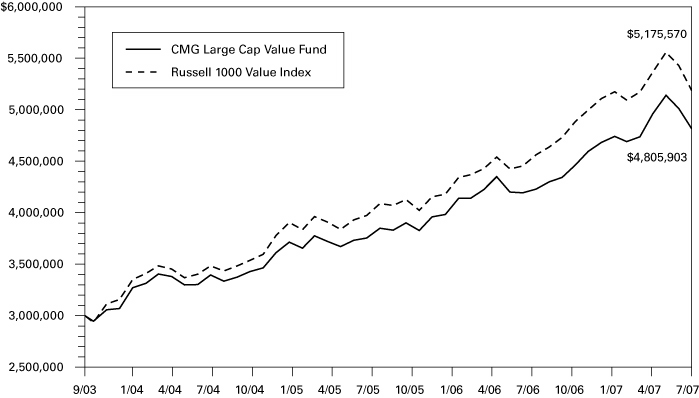
The chart above shows the growth in value of a hypothetical $3,000,000 investment in the fund compared to the index during the stated time period.
The table and chart do not reflect the deduction of taxes that a shareholder may pay on fund distributions or the redemption of fund shares.
The Russell 1000 Value Index measures the performance of those Russell 1000 Index companies with lower price-to-book ratios and lower forecasted growth values. Indices are not investments, do not incur fees or expenses and are not professionally managed. It is not possible to invest directly in an index. Securities in the fund may not match those in an index.
11
UNDERSTANDING YOUR EXPENSES – CMG Large Cap Value Fund
As a fund shareholder, you incur two types of costs. There are transaction costs and also ongoing costs, which generally include investment advisory fees and other fund expenses. The information on this page is intended to help you understand the ongoing costs of investing in the fund and to compare these costs with the ongoing costs of investing in other mutual funds.
Analyzing your fund's expenses
To illustrate these ongoing costs, we have provided an example and calculated the expenses paid by investors during the reporting period. The information in the following table is based on an initial investment of $1,000.00, which is invested at the beginning of the reporting period and held for the entire period. Expense information is calculated two ways and each method provides you with different information. The amount listed in the "actual" column is calculated using the fund's actual operating expenses and total return for the period. The amount listed in the "hypothetical" column assumes that the return each year is 5% before expenses and is calculated based on the fund's actual operating expenses. You should not use the hypothetical account values and expenses to estimate either your actual account balance at the end of the period or the expenses you paid during this reporting period.
Estimating your actual expenses
To estimate the expenses that you paid over the period, first you will need your account balance at the end of the period:
1. Divide your ending account balance by $1,000.00. For example, if an account balance was $8,600.00 at the end of the period, the result would be 8.6.
2. In the section of the table below titled "Expenses paid during the period," locate the amount under "actual." Multiply this number by the result from step 1. Your answer is an estimate of the expenses you paid on your account during the period.
February 1, 2007 – July 31, 2007
| Account value at the beginning of the period ($) | Account value at the end of the period ($) | Expenses paid during the period ($) | Fund's annualized expense ratio (%) | ||||||||||||||||||||||||
| Actual | Hypothetical | Actual | Hypothetical | Actual | Hypothetical | Actual | |||||||||||||||||||||
| 1,000.00 | 1,000.00 | 1,013.98 | 1,022.32 | 2.50 | 2.51 | 0.50 | |||||||||||||||||||||
Expenses paid during the period are equal to the fund's annualized expense ratio of 0.50%, multiplied by the average account value over the period, then multiplied by the number of days in the fund's most recent fiscal half-year and divided by 365.
Had the investment advisor and/or any of its affiliates not reimbursed a portion of expenses, account value at the end of the period would have been reduced.
It is important to note that the expense amounts shown in the table are meant to highlight only ongoing costs of investing in the fund. Therefore, the hypothetical examples provided may not help you determine the relative total costs of owning shares of different funds.
Compare with other funds
Since all mutual funds are required to include the same hypothetical calculations about expenses in shareholder reports, you can use this information to compare the ongoing costs of investing in the fund with other funds. To do so, compare the 5% hypothetical example with the 5% hypothetical examples that appear in the shareholder reports of other funds. As you compare hypothetical examples of other funds, it is important to note that hypothetical examples are meant to highlight the ongoing costs of investing in a fund.
12
Performance data quoted represents past performance, and current performance may be lower or higher. Past performance is no guarantee of future results. The investment return and principal value will fluctuate so that shares, when redeemed, may be worth more or less than the original cost. Please visit www.columbiamanagement.com for daily and most recent month-end performance updates.
CMG MID CAP GROWTH FUND
A Portfolio of Columbia Funds Institutional Trust
MANAGEMENT DISCUSSION OF FUND PERFORMANCE
For the 12-month period ended July 31, 2007, CMG Mid Cap Growth Fund returned 23.22%. The fund outpaced the 21.40% return of its benchmark, the Russell Midcap Growth Index1 and the 21.61% average return of its peer group, the Morningstar Mid Cap Growth Category for the same period.2 The fund benefited from strong stock selection across the board, led by holdings in the telecommunications and industrials sectors. An emphasis on energy stocks also aided returns.
Holdings in the telecommunications services sector were top contributors to the fund's return during the period. Leap Wireless (0.7% of net assets), a provider of affordable, basic phone and messaging services for the underserved mass market, saw positive results due to continued strong sales of its "Cricket" brand wireless service. Millicom International Cellular SA (0.8% of net assets), a prepaid cellular service provider in the emerging markets, and NII Holdings (1.3% of net assets), which provides mobile communications to Latin American businesses, were also standout performers. Both reported robust subscriber growth as a result of increasingly widespread use of cell phones and other wireless communications devices in the emerging markets.
The fund also benefited from an emphasis on the industrials sector, particularly from exposure to the aerospace and defense industries. Precision Castparts (1.0% of net assets), manufacturer of metal castings and components for industrial and aerospace applications, was a significant contributor to the fund's return. Orders for its jet engine components skyrocketed as demand grew for new aircraft in emerging markets, including China, and among airlines in developed markets which continued to replace older jets. In the information technology sector, one standout performer was polysilicon wafer maker MEMC (1.5% of net assets) which benefited from explosive growth in the solar energy market.
Energy and health care stocks provided an additional boost to the fund's performance. A higher-than-benchmark weight in the energy sector helped, as did an emphasis on holdings with oil exposure. Among top performers in the sector were FMC Technologies (0.6% of net assets), a provider of technology solutions to oil companies, and Denbury Resources (0.9% of net assets), which specializes in the recovery of depleted oil fields using carbon dioxide. Denbury is the dominant player in the Southeastern US. In the healthcare sector, Kyphon (0.5% of net assets) was a top contributor to the fund's return. The stock of the medical device manufacturer, which provides products used in surgical spine procedures, benefited when Medtronic announced it would acquire the firm, Thermo Fisher Scientific (0.5% of net assets), a test and measurement instrument provider, also experienced continued high demand for its products and services.
1 The Russell Midcap Growth Index measures the performance of those Russell Midcap Index companies with higher price-to-book ratios and higher forecasted growth values. Indices are not investments, do not incur fees or expenses and are not professionally managed. It is not possible to invest directly in an index. Securities in the fund may not match those in an index.
2 ©2007 by Morningstar, Inc. All rights reserved. The information contained herein is the proprietary information of Morningstar, Inc., may not be copied or redistributed for any purpose and may only be used for noncommercial, personal purposes. The information contained herein is not represented or warranted to be accurate, correct, complete or timely. Morningstar, Inc. shall not be responsible for investment decisions, damages or other losses resulting from the use of this information. Past performance is no guarantee of future performance. Morningstar, Inc. has not granted consent for it to be considered or deemed an "expert" under the Securities Act of 1933. Morningstar Categories compare the performance of funds with similar investment objectives and strategies.
13
A light position in the information technology sector detracted slightly from relative returns, as did a decision not to own several key stocks that outperformed during the period. We have since established a small position in one such company, MasterCard (0.4% of net assets). While a lighter-than-index weight in the financials sector helped when the sector fell out of favor, the fund also missed out by not owning several financial stocks that were rewarded when they were acquired by other firms during the period.
The markets have become very volatile as a result of credit concerns sparked by problems in the US subprime mortgage loan sector. By sticking to our core investment process, we hope to turn volatility to the fund's advantage by seeking investment opportunities created by panic selling with the goal of maximizing returns and minimizing risk. As international demand for goods and services continues to drive economic growth, we plan to focus on allocating capital to companies with international footprints that we believe have the potential to capture the power of this growth, particularly in emerging markets. We continue to screen the investment universe for growth companies we believe are attractively valued and that have strong business models, rising profit margins and improving returns on capital.
Thank you for investing in the CMG Mid Cap Growth Fund.
Portfolio Management
Wayne M. Collette has co-managed the fund since February 2006. Mr. Collette has been with the advisors or its predecessors or affiliate organizations since 2001.
George J. Myers has co-managed the fund since February 2006. Mr. Myers has been with the advisors or its predecessors or affiliate organizations since 2004.
The fund's top ten holdings (as a percentage of net assets) as of July 31, 2007 were:
| (%) | |||||||
| MEMC Electronic Materials | 1.5 | ||||||
| American Tower | 1.3 | ||||||
| NII Holdings | 1.3 | ||||||
| Starwood Hotels & Resorts Worldwide | 1.2 | ||||||
| GameStop | 1.1 | ||||||
| National-Oilwell Varco | 1.1 | ||||||
| CROCS | 1.1 | ||||||
| Lam Research | 1.1 | ||||||
| Coach | 1.0 | ||||||
| Allergan | 1.0 | ||||||
Holdings are calculated as a percentage of net assets, and are subject to change. Because the fund is actively managed, there is no guarantee the fund will continue to maintain the holdings breakdown listed. The fund's holdings and their weights within the portfolio may change as market conditions change.
Equity investments are affected by stock market fluctuations that occur in response to economic and business developments.
Investing in growth stocks incurs the possibility of losses because their prices are sensitive to changes in current or expected earnings.
Investing in mid-cap stocks may present special risks, including possible illiquidity and greater price volatility than stocks of larger, more established companies.
14
Performance data quoted represents past performance and current performance may be lower or higher. Past performance is no guarantee of future results. The investment return and principal value will fluctuate so that shares, when redeemed, may be worth more or less than the original cost. Please visit www.columbiamanagement.com for daily and most recent month-end performance updates.
Average annual total return as of July 31, 2007 (%)
| Inception | 1-year | Life | |||||||||||||
| CMG Mid Cap Growth Fund | 05/05/03 | 23.22 | 16.26 | ||||||||||||
| Russell Midcap Growth Index | 21.40 | 18.07 | |||||||||||||
Average annual total return as of June 30, 2007 (%)
| Inception | 1-year | Life | |||||||||||||
| CMG Mid Cap Growth Fund | 05/05/03 | 19.54 | 16.93 | ||||||||||||
| Russell Midcap Growth Index | 19.73 | 19.12 | |||||||||||||
Index performance is from May 5, 2003.
Performance results may reflect any waivers or reimbursements of fund expenses by the advisor and/or any of its affiliates. Absent these waivers or reimbursement arrangements, performance results would have been lower. All results shown assume reinvestment of distributions.
The fund's annual operating expense ratios, with and without contractual waivers, as stated in the fund's prospectus that is current as of the date of this report, are 0.70% and 0.90%, respectively, of average annual net assets. Differences in expense ratios disclosed elsewhere in this report may result from including fee waivers and reimbursements as well as different time periods used in calculating the ratios. The contractual waiver expires 03/01/09.
Growth of a $3,000,000 investment, May 5, 2003 to July 31, 2007
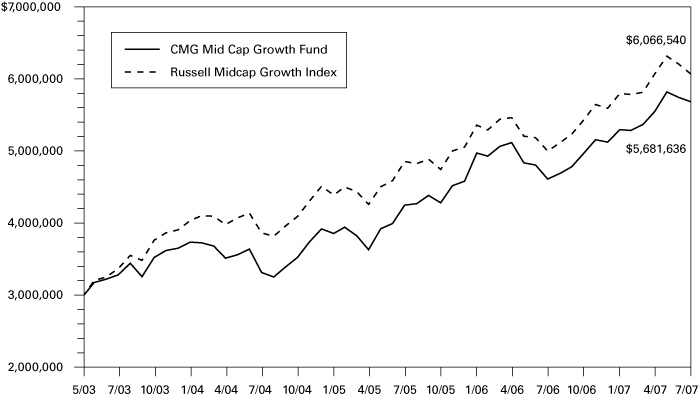
The chart above shows the growth in value of a hypothetical $3,000,000 investment in the fund compared to the index during the stated time period.
The table and chart do not reflect the deduction of taxes that a shareholder may pay on fund distributions or the redemption of fund shares.
The Russell Midcap Growth Index measures the performance of those Russell Midcap Index companies with higher price-to-book ratios and higher forecasted growth values. Indices are not investments, do not incur fees or expenses and are not professionally managed. It is not possible to invest directly in an index. Securities in the fund may not match those in an index.
15
UNDERSTANDING YOUR EXPENSES – CMG Mid Cap Growth Fund
As a fund shareholder, you incur two types of costs. There are transaction costs and also ongoing costs, which generally include investment advisory fees and other fund expenses. The information on this page is intended to help you understand the ongoing costs of investing in the fund and to compare these costs with the ongoing costs of investing in other mutual funds.
Analyzing your fund's expenses
To illustrate these ongoing costs, we have provided an example and calculated the expenses paid by investors during the reporting period. The information in the following table is based on an initial investment of $1,000.00, which is invested at the beginning of the reporting period and held for the entire period. Expense information is calculated two ways and each method provides you with different information. The amount listed in the "actual" column is calculated using the fund's actual operating expenses and total return for the period. The amount listed in the "hypothetical" column assumes that the return each year is 5% before expenses and is calculated based on the fund's actual operating expenses. You should not use the hypothetical account values and expenses to estimate either your actual account balance at the end of the period or the expenses you paid during this reporting period.
Estimating your actual expenses
To estimate the expenses that you paid over the period, first you will need your account balance at the end of the period:
1. Divide your ending account balance by $1,000.00. For example, if an account balance was $8,600.00 at the end of the period, the result would be 8.6.
2. In the section of the table below titled "Expenses paid during the period," locate the amount under "actual." Multiply this number by the result from step 1. Your answer is an estimate of the expenses you paid on your account during the period.
February 1, 2007 – July 31, 2007
| Account value at the beginning of the period ($) | Account value at the end of the period ($) | Expenses paid during the period ($) | Fund's annualized expense ratio (%) | ||||||||||||||||||||||||
| Actual | Hypothetical | Actual | Hypothetical | Actual | Hypothetical | Actual | |||||||||||||||||||||
| 1,000.00 | 1,000.00 | 1,072.90 | 1,021.32 | 3.60 | 3.51 | 0.70 | |||||||||||||||||||||
Expenses paid during the period are equal to the fund's annualized expense ratio of 0.70%, multiplied by the average account value over the period, then multiplied by the number of days in the fund's most recent fiscal half-year and divided by 365.
Had the investment advisor and/or any of its affiliates not reimbursed a portion of expenses, account value at the end of the period would have been reduced.
It is important to note that the expense amounts shown in the table are meant to highlight only ongoing costs of investing in the fund. Therefore, the hypothetical examples provided may not help you determine the relative total costs of owning shares of different funds.
Compare with other funds
Since all mutual funds are required to include the same hypothetical calculations about expenses in shareholder reports, you can use this information to compare the ongoing costs of investing in the fund with other funds. To do so, compare the 5% hypothetical example with the 5% hypothetical examples that appear in the shareholder reports of other funds. As you compare hypothetical examples of other funds, it is important to note that hypothetical examples are meant to highlight the ongoing costs of investing in a fund.
16
Performance data quoted represents past performance, and current performance may be lower or higher. Past performance is no guarantee of future results. The investment return and principal value will fluctuate so that shares, when redeemed, may be worth more or less than the original cost. Please visit www.columbiamanagement.com for daily and most recent month-end performance updates.
CMG MID CAP VALUE FUND
A Portfolio of Columbia Funds Institutional Trust
MANAGEMENT DISCUSSION OF FUND PERFORMANCE
For the 12-month period ended July 31, 2007, CMG Mid Cap Value Fund returned 19.50%. The fund beat the 15.94% return of its benchmark, the Russell Midcap Value Index,1 as well as the 16.30% average return of its peer group, the Morningstar Mid-Cap Value Category.2 Strong stock selection was the main driver of performance, aided by favorable sector allocation. As bottom-up stock pickers, we targeted companies with the potential to expand top-line growth—through volume and price increases—as well as profit margins. Investments in the industrials, energy, technology and utilities sectors made the most significant contributions to fund performance, while materials and health care were minor detractors relative to the index.
Industrials, where the fund was overweight versus the index, continued to post strong gains driven by positive economic growth. Machinery stocks rallied nicely, but industrial conglomerate and aerospace and defense stocks made the real difference to performance. Standouts included McDermott International and Barnes Group (1.1% and 1.2% of net assets, respectively). Industrial conglomerate McDermott benefited from strong business prospects, including revenue, earnings, cash flow and order growth across its three business lines. The company's marine construction business did particularly well, driven by growth in the Middle East and Asia Pacific. Barnes, which makes aerospace and automotive parts, climbed amid rising aircraft orders as governments and carriers worldwide replace and expand existing fleets.
In the energy sector, stock selection drove returns. We focused on energy equipment and service companies, which benefited as strong global demand and high commodity prices encouraged more spending on exploration and production. Among the winners were National-Oilwell Varco, an equipment company, and Tesoro, a refiner (0.9% and 0.5% of net assets, respectively). National-Oilwell's earnings climbed amid growing demand for its drilling rig systems. Tesoro acquired another refiner on the West Coast, adding capacity in a part of the country where tight supply is driving pricing higher.
Technology returns also benefited from strong stock selection with the biggest gains coming from semiconductors as well as electronic equipment and instrument companies. Standouts included NVIDIA (0.8% of net assets), which is a premier supplier of high-end graphic chips, including the one used in Microsoft's new VISTA operating system. Strong top-line growth related to the adoption of the new VISTA system drove returns. Stock selection was also positive in the utilities sector, which benefited as rising demand for electricity generation led to rate increases. Public Service Enterprise Group (0.9% of net assets), an East Coast electric utility with nuclear generation capacity, also rallied after selling non-core assets and seeing increased demand for environmentally acceptable generation.
1 The Russell Midcap Value Index measures the performance of those Russell Midcap Index companies with lower price-to-book ratios and lower forecasted growth values. The stocks are also members of the Russell 1000 Value index. Indices are not investments, do not incur fees or expenses and are not professionally managed. It is not possible to invest directly in an index. Securities in the fund may not match those in an index.
2 ©2007 by Morningstar, Inc. All rights reserved. The information contained herein is the proprietary information of Morningstar, Inc., may not be copied or redistributed for any purpose and may only be used for noncommercial, personal purposes. The information contained herein is not represented or warranted to be accurate, correct, complete or timely. Morningstar, Inc. shall not be responsible for investment decisions, damages or other losses resulting from the use of this information. Past performance is no guarantee of future performance. Morningstar, Inc. has not granted consent for it to be considered or deemed an "expert" under the Securities Act of 1933. Morningstar Categories compare the performance of funds with similar investment objectives and strategies.
17
Materials and health care stocks gained nicely, but trailed the average return for the sector. In materials, the fund lost ground from its underweight in chemicals as well as metals and mining, both of which were standouts. In health care, pharmaceutical companies pressured returns. Among the detractors was Mylan Laboratories, whose earnings came in below expectations, leading us to sell the position. Returns from financials were flat in the index and the fund, despite pressure on the sector from the housing downturn and credit weakness.
Going forward, we remain optimistic about the prospects for mid-cap value stocks. Despite strong gains this past year, mid-cap valuations remained attractive at period end. Fundamentals also continued to be strong with many companies reporting positive earnings surprises for the second quarter. At period end, the fund had overweights in industrials, energy and utilities, where fundamentals seemed particularly strong, but reduced stakes in consumer discretionary, financials and materials, where we believed prospects had weakened.
We appreciate your continued confidence in CMG Mid Cap Value Fund.
Portfolio Management
Diane L. Sobin has co-managed the fund since September 2004 and has been with the advisor or its predecessors or affiliate organizations since 2001.
David I. Hoffman has co-managed the fund since September 2004 and has been with the advisor or its predecessors or affiliate organizations since 2001.
Lori J. Ensinger has co-managed the fund since September 2004 and has been with the advisor or its predecessors or affiliate organizations since 2001.
Noah J. Petrucci has co-managed the fund since September 2004 and has been with the advisor or its predecessors or affiliate organizations since 2002.
The fund's top ten holdings (as a percentage of net assets) as of July 31, 2007 were:
| (%) | |||||||
| Air Products & Chemicals | 1.7 | ||||||
| PPL | 1.6 | ||||||
| American Electric Power | 1.6 | ||||||
| Plum Creek Timber | 1.5 | ||||||
| Entergy | 1.5 | ||||||
| PG&E | 1.4 | ||||||
| L-3 Communications Holdings | 1.4 | ||||||
| Hess | 1.4 | ||||||
| Ambac Financial Group | 1.3 | ||||||
| Edison International | 1.3 | ||||||
Holdings are calculated as a percentage of net assets, and are subject to change. Because the fund is actively managed, there is no guarantee the fund will continue to maintain the holdings breakdown listed. The fund's holdings and their weights within the portfolio may change as market conditions change.
Equity investments are affected by stock market fluctuations that occur in response to economic and business developments.
Investing in mid-cap stocks may present special risks, including possible illiquidity and greater price volatility than stocks of larger, more established companies.
Value stocks are stocks of companies that may have experienced adverse business or industry developments or may be subject to special risks that have caused the stocks to be out of favor and, in the advisor's opinion, undervalued. If the advisor's assessment of a company's prospects is wrong, the price of the company's stock may not approach the value the advisor has placed on it.
18
Performance data quoted represents past performance and current performance may be lower or higher. Past performance is no guarantee of future results. The investment return and principal value will fluctuate so that shares, when redeemed, may be worth more or less than the original cost. Please visit www.columbiamanagement.com for daily and most recent month-end performance updates.
Average annual total return as of July 31, 2007 (%)
| Inception | 1-year | Life | |||||||||||||
| CMG Mid Cap Value Fund | 05/05/03 | 19.50 | 17.92 | ||||||||||||
| Russell Midcap Value Index | 15.94 | 21.28 | |||||||||||||
Average annual total return as of June 30, 2007 (%)
| Inception | 1-year | Life | |||||||||||||
| CMG Mid Cap Value Fund | 05/05/03 | 24.81 | 19.72 | ||||||||||||
| Russell Midcap Value Index | 22.09 | 23.45 | |||||||||||||
Index performance is from May 5, 2003.
Performance results may reflect any waivers or reimbursements of fund expenses by the advisor and/or any of its affiliates. Absent these waivers or reimbursement arrangements, performance results would have been lower. All results shown assume reinvestment of distributions.
The fund's annual operating expense ratios, with and without contractual waivers, as stated in the fund's prospectus that is current as of the date of this report, are 0.70% and 0.95%, respectively, of average annual net assets. Differences in expense ratios disclosed elsewhere in this report may result from including fee waivers and reimbursements as well as different time periods used in calculating the ratios. The contractual waiver expires 03/01/09.
Growth of a $3,000,000 investment, May 5, 2003 to July 31, 2007
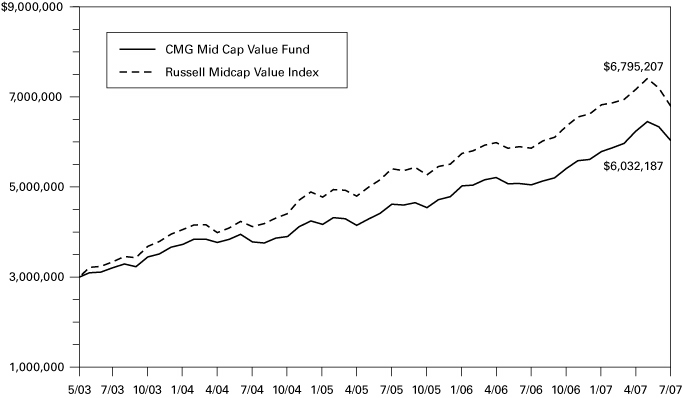
The chart above shows the growth in value of a hypothetical $3,000,000 investment in the fund compared to the index during the stated time period.
The table and chart do not reflect the deduction of taxes that a shareholder may pay on fund distributions or the redemption of fund shares.
The Russell Midcap Value Index measures the performance of those Russell Midcap Index companies with lower price-to-book ratios and lower forecasted growth values. The stocks are also members of the Russell 1000 Value Index. Indices are not investments, do not incur fees or expenses and are not professionally managed. It is not possible to invest directly in an index. Securities in the fund may not match those in an index.
19
UNDERSTANDING YOUR EXPENSES – CMG Mid Cap Value Fund
As a fund shareholder, you incur two types of costs. There are transaction costs and also ongoing costs, which generally include investment advisory fees and other fund expenses. The information on this page is intended to help you understand the ongoing costs of investing in the fund and to compare these costs with the ongoing costs of investing in other mutual funds.
Analyzing your fund's expenses
To illustrate these ongoing costs, we have provided an example and calculated the expenses paid by investors during the reporting period. The information in the following table is based on an initial investment of $1,000.00, which is invested at the beginning of the reporting period and held for the entire period. Expense information is calculated two ways and each method provides you with different information. The amount listed in the "actual" column is calculated using the fund's actual operating expenses and total return for the period. The amount listed in the "hypothetical" column assumes that the return each year is 5% before expenses and is calculated based on the fund's actual operating expenses. You should not use the hypothetical account values and expenses to estimate either your actual account balance at the end of the period or the expenses you paid during this reporting period.
Estimating your actual expenses
To estimate the expenses that you paid over the period, first you will need your account balance at the end of the period:
1. Divide your ending account balance by $1,000.00. For example, if an account balance was $8,600.00 at the end of the period, the result would be 8.6.
2. In the section of the table below titled "Expenses paid during the period," locate the amount under "actual." Multiply this number by the result from step 1. Your answer is an estimate of the expenses you paid on your account during the period.
February 1, 2007 – July 31, 2007
| Account value at the beginning of the period ($) | Account value at the end of the period ($) | Expenses paid during the period ($) | Fund's annualized expense ratio (%) | ||||||||||||||||||||||||
| Actual | Hypothetical | Actual | Hypothetical | Actual | Hypothetical | Actual | |||||||||||||||||||||
| 1,000.00 | 1,000.00 | 1,042.20 | 1,021.32 | 3.54 | 3.51 | 0.70 | |||||||||||||||||||||
Expenses paid during the period are equal to the fund's annualized expense ratio of 0.70%, multiplied by the average account value over the period, then multiplied by the number of days in the fund's most recent fiscal half-year and divided by 365.
Had the investment advisor and/or any of its affiliates not reimbursed a portion of expenses, account value at the end of the period would have been reduced.
It is important to note that the expense amounts shown in the table are meant to highlight only ongoing costs of investing in the fund. Therefore, the hypothetical examples provided may not help you determine the relative total costs of owning shares of different funds.
Compare with other funds
Since all mutual funds are required to include the same hypothetical calculations about expenses in shareholder reports, you can use this information to compare the ongoing costs of investing in the fund with other funds. To do so, compare the 5% hypothetical example with the 5% hypothetical examples that appear in the shareholder reports of other funds. As you compare hypothetical examples of other funds, it is important to note that hypothetical examples are meant to highlight the ongoing costs of investing in a fund.
20
Performance data quoted represents past performance, and current performance may be lower or higher. Past performance is no guarantee of future results. The investment return and principal value will fluctuate so that shares, when redeemed, may be worth more or less than the original cost. Please visit www.columbiamanagement.com for daily and most recent month-end performance updates.
CMG SMALL CAP GROWTH FUND
A Portfolio of Columbia Funds Institutional Trust
MANAGEMENT DISCUSSION OF FUND PERFORMANCE
For the 12-month period ended July 31, 2007, CMG Small Cap Growth Fund returned 22.69%. For the same period, the fund's benchmarks, the Russell 2000 Growth Index and the Russell 2000 Index, returned 16.83% and 12.12%, respectively.1 The average return of the fund's peer group, the Morningstar Small Growth Category2 was 17.66%. The fund's strong performance relative to its benchmarks and peer group was due to positive stock selection across the board and strong performance from the information technology, telecommunications, industrials and energy sectors.
Holdings in the semiconductor segment of the information technology sector provided the largest boost to returns during the period. Atheros Communications (1.1% of net assets), which makes chip sets for wireless local area network (LAN) devices, benefited from increased wireless networking in homes and businesses. The stock of semiconductor testing equipment manufacturer Verigy (1.2% of net assets) rose on strong sales of a new, more efficient testing process developed by the firm.
Telecommunications services holdings also helped the fund's performance, led by Millicom International Cellular SA (0.8% of net assets), a prepaid cellular service provider in the emerging markets, and SBA Communications (1.3% of net assets), a leading US wireless tower owner and operator. Millicom benefited from robust subscriber growth due to growing adoption of cell phone use in the emerging markets. Internet backbone provider Cogent Communications Group (0.9% of net assets) also saw strong growth during the period as the global use of Internet data continued to increase.
Several trends that drove worldwide demand for the products and services of holdings in the industrials and energy sectors also helped the fund's return. The continued build-out of Internet connectivity and electrical infrastructure worldwide helped General Cable (1.0% of net assets) turn in top-notch performance, on heightened demand for its copper and fiber optic wires. Growing demand for clean energy technology, including expanded use of solar power, was another trend that benefited the fund. The trend generated strong performance from SunPower (0.6% of net assets) and JA Solar Holdings (0.5% of net assets), which manufacture solar cells. Diana Shipping (0.8% of net assets) experienced high demand for its fleet of dry bulk cargo carriers due to a tight vessel market and growing demand from Asia. Holdings in the energy sector outperformed across the board, led by offshore driller Atwood Oceanics (1.0% of net assets) and Core
1 The Russell 2000 Growth Index measures the performance of those Russell 2000 Index companies with higher price-to-book ratios and higher forecasted growth values. The Russell 2000 Index tracks the performance of the 2,000 smallest of the 3,000 largest US companies based on market capitalization. Indices are not investments, do not incur fees or expenses and are not professionally managed. It is not possible to invest directly in an index. Securities in the fund may not match those in an index.
2 ©2007 by Morningstar, Inc. All rights reserved. The information contained herein is the proprietary information of Morningstar, Inc., may not be copied or redistributed for any purpose and may only be used for noncommercial, personal purposes. The information contained herein is not represented or warranted to be accurate, correct, complete or timely. Morningstar, Inc. shall not be responsible for investment decisions, damages or other losses resulting from the use of this information. Past performance is no guarantee of future performance. Morningstar, Inc. has not granted consent for it to be considered or deemed an "expert" under the Securities Act of 1933. Morningstar Categories compare the performance of funds with similar investment objectives and strategies.
21
Laboratories (0.8% of net assets), which specializes in helping exploration and production companies produce more oil and gas through its reservoir description and enhancement services.
The fund's performance suffered slightly due to its lack of exposure to one particular strong performer in the materials sector of the index. Returns were also dampened by poor performance from Bare Escentuals, a cosmetics company that sells mineral-based make-up products. The firm's business suffered when competition came on more quickly than it had anticipated. We subsequently sold the stock.
The global markets have experienced a dramatic increase in price volatility due to investors' heightened risk concerns sparked by problems in the US subprime mortgage loan sector. We intend to navigate this volatile period by sticking to our core investment process while taking advantage of attractive opportunities arising from panic selling with the goal of maximizing returns and minimizing risk. As international demand for goods and services continues to drive economic growth, we plan to expand our position in companies with international footprints that we believe have the potential to capture the power of this growth, particularly in emerging markets. We continue to screen the investment universe for growth companies we believe are attractively valued and that have strong business models, rising profit margins and improving returns on capital.
Thank you for investing in CMG Small Cap Growth Fund.
Portfolio Management
Wayne M. Collette has co-managed the fund since February 2006 and has been with the advisor or its predecessors or affiliate organizations since 2001.
George J. Myers has co-managed the fund since February 2006 and has been with the advisor or its predecessors or affiliate organizations since 2004.
The fund's top ten holdings (as a percentage of net assets) as of July 31, 2007 were:
| (%) | |||||||
| ICON PLC | 1.7 | ||||||
| SBA Communications | 1.3 | ||||||
| Verigy | 1.2 | ||||||
| BE Aerospace | 1.2 | ||||||
| CROCS | 1.2 | ||||||
| GameStop | 1.2 | ||||||
| Atheros Communications | 1.1 | ||||||
| Kyphon | 1.1 | ||||||
| Warnaco Group | 1.1 | ||||||
| Huron Consulting Group | 1.1 | ||||||
Holdings are calculated as a percentage of net assets, and are subject to change. Because the fund is actively managed, there is no guarantee the fund will continue to maintain the holdings breakdown listed. The fund's holdings and their weights within the portfolio may change as market conditions change.
Equity investments are affected by stock market fluctuations that occur in response to economic and business developments.
Investing in growth stocks incurs the possibility of losses because their prices are sensitive to changes in current or expected earnings.
Investments in small-cap stocks may be subject to greater volatility and price fluctuations because they may be thinly traded and less liquid than investments in larger companies.
22
Performance data quoted represents past performance and current performance may be lower or higher. Past performance is no guarantee of future results. The investment return and principal value will fluctuate so that shares, when redeemed, may be worth more or less than the original cost. Please visit www.columbiamanagement.com for daily and most recent month-end performance updates.
Average annual total return as of July 31, 2007 (%)
| Inception | 1-year | 5-year | 10-year | ||||||||||||||||
| CMG Small Cap Growth Fund | 08/30/89 | 22.69 | 19.26 | 10.17 | |||||||||||||||
| Russell 2000 Index | 12.12 | 16.02 | 7.80 | ||||||||||||||||
| Russell 2000 Growth Index | 16.83 | 15.68 | 4.20 | ||||||||||||||||
Average annual total return as of June 30, 2007 (%)
| Inception | 1-year | 5-year | 10-year | ||||||||||||||||
| CMG Small Cap Growth Fund | 08/30/89 | 18.85 | 16.37 | 11.32 | |||||||||||||||
| Russell 2000 Index | 16.43 | 13.88 | 9.06 | ||||||||||||||||
| Russell 2000 Growth Index | 16.83 | 13.08 | 5.28 | ||||||||||||||||
Performance results reflect any waivers or reimbursements of fund expenses by the investment advisor and/or any of its affiliates. Absent these waivers or reimbursement arrangements, performance results would have been lower. All results shown assume reinvestment of distributions.
The fund's annual operating expense ratios, with and without contractual waivers, as stated in the fund's prospectus that is current as of the date of this report, are 0.80% and 1.23%, respectively, of average annual net assets. Differences in expense ratios disclosed elsewhere in this report may result from including fee waivers and reimbursements as well as different time periods used in calculating the ratios. The contractual waiver expires 11/30/09.
Growth of a $3,000,000 investment, August 1, 1997 to July 31, 2007
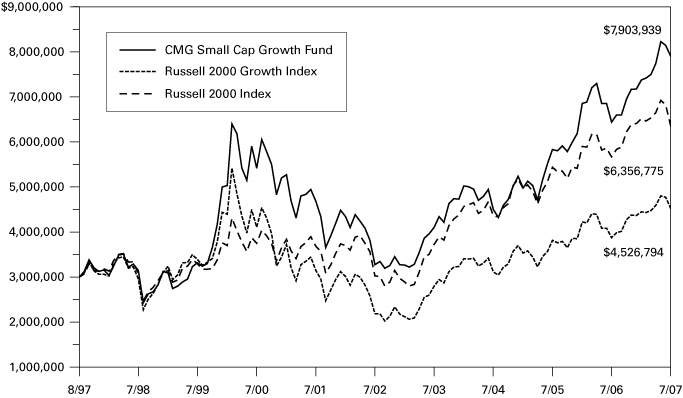
The chart above shows the growth in value of a hypothetical $3,000,000 investment in the fund compared to the indices during the period.
The table and chart do not reflect the deduction of taxes that a shareholder may pay on fund distributions or the redemption of fund shares.
The Russell 2000 Growth Index measures the performance of those Russell 2000 Index companies with higher price-to-book ratios and higher forecasted growth values. The Russell 2000 Index tracks the performance of the 2,000 smallest of the 3,000 largest US companies based on market capitalization. Indices are not investments, do not incur fees or expenses and are not professionally managed. It is not possible to invest directly in an index. Securities in the fund may not match those in an index.
23
UNDERSTANDING YOUR EXPENSES — CMG Small Cap Growth Fund
As a fund shareholder, you incur two types of costs. There are transaction costs and also ongoing costs, which generally include investment advisory fees and other fund expenses. The information on this page is intended to help you understand the ongoing costs of investing in the fund and to compare these costs with the ongoing costs of investing in other mutual funds.
Analyzing your fund's expenses
To illustrate these ongoing costs, we have provided an example and calculated the expenses paid by investors during the reporting period. The information in the following table is based on an initial investment of $1,000.00, which is invested at the beginning of the reporting period and held for the entire period. Expense information is calculated two ways and each method provides you with different information. The amount listed in the "actual" column is calculated using the fund's actual operating expenses and total return for the period. The amount listed in the "hypothetical" column assumes that the return each year is 5% before expenses and is calculated based on the fund's actual operating expenses. You should not use the hypothetical account values and expenses to estimate either your actual account balance at the end of the period or the expenses you paid during this reporting period.
Estimating your actual expenses
To estimate the expenses that you paid over the period, first you will need your account balance at the end of the period:
1. Divide your ending account balance by $1,000.00. For example, if an account balance was $8,600.00 at the end of the period, the result would be 8.6.
2. In the section of the table below titled "Expenses paid during the period," locate the amount under "actual." Multiply this number by the result from step 1. Your answer is an estimate of the expenses you paid on your account during the period.
February 1, 2007 – July 31, 2007
| Account value at the beginning of the period ($) | Account value at the end of the period ($) | Expenses paid during the period ($) | Fund's annualized expense ratio (%) | ||||||||||||||||||||||||
| Actual | Hypothetical | Actual | Hypothetical | Actual | Hypothetical | Actual | |||||||||||||||||||||
| 1,000.00 | 1,000.00 | 1,071.41 | 1,020.83 | 4.11 | 4.01 | 0.80 | |||||||||||||||||||||
Expenses paid during the period are equal to the fund's annualized expense ratio of 0.80%, multiplied by the average account value over the period, then multiplied by the number of days in the fund's most recent fiscal half-year and divided by 365.
Had the investment advisor and/or any of its affiliates not reimbursed a portion of expenses, account value at the end of the period would have been reduced.
It is important to note that the expense amounts shown in the table are meant to highlight only ongoing costs of investing in the fund. Therefore, the hypothetical examples provided may not help you determine the relative total costs of owning shares of different funds.
Compare with other funds
Since all mutual funds are required to include the same hypothetical calculations about expenses in shareholder reports, you can use this information to compare the ongoing costs of investing in the fund with other funds. To do so, compare the 5% hypothetical example with the 5% hypothetical examples that appear in the shareholder reports of other funds. As you compare hypothetical examples of other funds, it is important to note that hypothetical examples are meant to highlight the ongoing costs of investing in a fund.
24
Performance data quoted represents past performance, and current performance may be lower or higher. Past performance is no guarantee of future results. The investment return and principal value will fluctuate so that shares, when redeemed, may be worth more or less than the original cost. Please visit www.columbiamanagement.com for daily and most recent month-end performance updates.
CMG SMALL CAP VALUE FUND
A Portfolio of Columbia Funds Institutional Trust
MANAGEMENT DISCUSSION OF FUND PERFORMANCE
For the 12-month period ended July 31, 2007, CMG Small Cap Value Fund returned 12.82%. The fund outperformed its benchmarks, the Russell 2000 Value Index and the Russell 2000 Index, which returned 7.67% and 12.12%, respectively.1 Its return was higher than the average return of its peer group, the Morningstar Small Value Category, which was 11.29% over the same period.2 Favorable sector weights and strong stock selection in the industrials and financials sectors helped performance. We maintained our long-term focus on what we believe to be high quality companies with strong competitive and financial positions, good earnings growth prospects and reasonable valuations. Despite our avoidance of some of the lower quality companies that were star performers during the year, this strategy worked well for the fund.
Conditions were ripe for small-cap stocks throughout the period, as relatively low interest rates, a favorable credit environment and liquidity in the financial system fueled a pick-up in mergers and acquisitions, which drove significant gains. In addition, small-cap earnings growth remained strong and continued to attract investor attention. Within the sector, growth stocks significantly outperformed value stocks. Small-cap returns lagged mid- and large-cap gains by four to six percentage points.
Financials posted only modest gains, but had a positive impact on the fund's performance. An underweight in the sector overall, as well as in weaker-performing industries such as real estate investment trusts (REITs) and "thrifts," which include savings and loan organizations and savings banks, helped the fund outperform its benchmarks and the average for its peer group. In particular, we avoided REITs with exposure to the poorly performing subprime mortgage market and owned some REITs that were bought out at premium prices. Insurance stocks further boosted returns, led by a large investment in Navigators Group (0.9% of net assets). The company benefited from huge rate increases following Hurricane Katrina and benign weather conditions in the Gulf of Mexico this past year.
Industrials were strong performers in the index and even better performers in the fund, thanks to positive stock selection and overweights in aerospace and defense as well as construction and engineering. The aerospace industry, where the fund had a number of investments, did well as demand remained strong. Construction and engineering returns especially benefited from outsized gains posted by KHD Humboldt Wedag International (0.9% of net assets), a large holding that rallied on the back of strong Asian and European industrial growth.
1 The Russell 2000 Value Index tracks the performance of those Russell 2000 Index companies with lower price-to-book ratios and lower forecasted growth values. The Russell 2000 Index tracks the performance of the 2,000 smallest of the 3,000 largest US companies based on market capitalization. Indices are not investments, do not incur fees or expenses and are not professionally managed. It is not possible to invest directly in an index. Securities in the fund may not match those in an index.
2 ©2007 by Morningstar, Inc. All rights reserved. The information contained herein is the proprietary information of Morningstar, Inc., may not be copied or redistributed for any purpose and may only be used for noncommercial, personal purposes. The information contained herein is not represented or warranted to be accurate, correct, complete or timely. Morningstar, Inc. shall not be responsible for investment decisions, damages or other losses resulting from the use of this information. Past performance is no guarantee of future performance. Morningstar, Inc. has not granted consent for it to be considered or deemed an "expert" under the Securities Act of 1933. Morningstar Categories compare the performance of funds with similar investment objectives and strategies.
25
Overall, the fund's materials holdings generated a solid, double-digit return yet trailed the sector average largely because we did not own many of the lower quality, highly leveraged names that rallied sharply as commodity prices rose. Although the fund missed out on the significant gains generated by some of these lower quality stocks during this period, we believe that our focus on higher quality names is a more prudent strategy for the long term. A few of the fund's holdings declined, including Glatfelter (0.4% of net assets), a manufacturer of fine paper, which struggled with the integration of two recent acquisitions. Consumer discretionary and consumer staples returns modestly lagged the sectors' respective returns in the Russell 2000 Value Index, again because the fund did not own highly leveraged companies that did well. A sizable underweight in the consumer discretionary sector also worked against the fund during the p eriod, as many of the "old economy" industries that we avoided, including newspapers and auto parts, benefited from takeover activity.
We think small-cap stocks can continue their climb, especially if liquidity and credit trends remain positive, interest rates move up at a moderate pace and merger and acquisitions activity continues to be strong. The fund is positioned for the possibility of higher interest rates with a fairly aggressive underweight in financials and for increased market volatility with an overweight in health care. In addition, we believe that the higher quality companies we favor have the potential to hold their own when interest rates rise, because they tend to be less affected by higher borrowing costs and earn more on their cash positions.
Thank you for investing in CMG Small Cap Value Fund.
Portfolio Management
Stephen Barbaro has managed or co-managed the the fund since the fund's inception and has been with the advisor or its predecessors or affiliate organizations since 1976.
Jeremy Javidi has co-managed the fund since August 2005 and has been with the advisor or its predecessors or affiliate organizations since 2000.
The fund's top ten holdings (as a percentage of net assets) as of July 31, 2007 were:
| (%) | |||||||
| Harsco | 1.3 | ||||||
| Woodward Governor | 1.1 | ||||||
| Pediatrix Medical Group | 1.1 | ||||||
| Consolidated Graphics | 0.9 | ||||||
| Navigators Group | 0.9 | ||||||
| Cash America International | 0.9 | ||||||
| KHD Humboldt Wedag International | 0.9 | ||||||
| Anixter International | 0.8 | ||||||
| Range Resources | 0.8 | ||||||
| MPS Group | 0.8 | ||||||
Holdings are calculated as a percentage of net assets, and are subject to change. Because the fund is actively managed, there is no guarantee the fund will continue to maintain the holdings breakdown listed. The fund's holdings and their weights within the portfolio may change as market conditions change.
Equity investments are affected by stock market fluctuations that occur in response to economic and business developments.
Investments in small-cap stocks may be subject to greater volatility and price fluctuations because they may be thinly traded and less liquid than investments in larger companies.
Value stocks are stocks of companies that may have experienced adverse business or industry developments or may be subject to special risks that have caused the stocks to be out of favor and, in the advisor's opinion, undervalued. If the advisor's assessment of a company's prospects is wrong, the price of the company's stock may not approach the value the advisor has placed on it.
26
Performance data quoted represents past performance and current performance may be lower or higher. Past performance is no guarantee of future results. The investment return and principal value will fluctuate so that shares, when redeemed, may be worth more or less than the original cost. Please visit www.columbiamanagement.com for daily and most recent month-end performance updates.
Average annual total return as of July 31, 2007 (%)
| Inception | 1-year | Life | |||||||||||||
| CMG Small Cap Value Fund | 05/05/03 | 12.82 | 19.61 | ||||||||||||
| Russell 2000 Value Index | 7.67 | 18.59 | |||||||||||||
| Russell 2000 Index | 12.12 | 17.62 | |||||||||||||
Average annual total return as of June 30, 2007 (%)
| Inception | 1-year | Life | |||||||||||||
| CMG Small Cap Value Fund | 05/05/03 | 17.03 | 21.84 | ||||||||||||
| Russell 2000 Value Index | 16.05 | 21.58 | |||||||||||||
| Russell 2000 Index | 16.43 | 20.04 | |||||||||||||
Index performance is from May 5, 2003.
Performance results reflect any waivers or reimbursements of fund expenses by the investment advisor and/or any of its affiliates. Absent these waivers or reimbursement arrangements, performance results would have been lower. All results shown assume reinvestment of distributions.
The fund's annual operating expense ratios, with and without contractual waivers, as stated in the fund's prospectus that is current as of the date of this report, are 0.80% and 0.94%, respectively, of average annual net assets. Differences in expense ratios disclosed elsewhere in this report may result from including fee waivers and reimbursements as well as different time periods used in calculating the ratios. The contractual waiver expires 03/01/09.
Growth of a $3,000,000 investment, May 5, 2003 to July 31, 2007
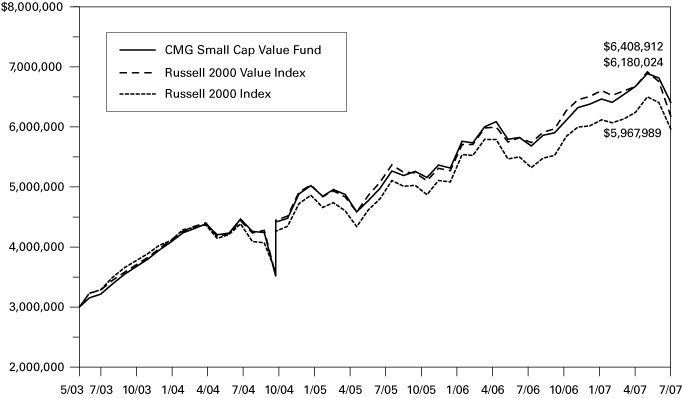
The chart above shows the growth in value of a hypothetical $3,000,000 investment in the fund compared to the indices during the stated time period.
The table and chart do not reflect the deduction of taxes that a shareholder may pay on fund distributions or the redemption of fund shares.
The Russell 2000 Value Index tracks the performance of those Russell 2000 Index companies with lower price-to-book ratios and lower forecasted growth values. The Russell 2000 Index tracks the performance of the 2,000 smallest of the 3,000 largest US companies based on market capitalization. Indices are not investments, do not incur fees or expenses and are not professionally managed. It is not possible to invest directly in an index. Securities in the fund may not match those in an index.
27
UNDERSTANDING YOUR EXPENSES — CMG Small Cap Value Fund
As a fund shareholder, you incur two types of costs. There are transaction costs and also ongoing costs, which generally include investment advisory fees and other fund expenses. The information on this page is intended to help you understand the ongoing costs of investing in the fund and to compare these costs with the ongoing costs of investing in other mutual funds.
Analyzing your fund's expenses
To illustrate these ongoing costs, we have provided an example and calculated the expenses paid by investors during the reporting period. The information in the following table is based on an initial investment of $1,000.00, which is invested at the beginning of the reporting period and held for the entire period. Expense information is calculated two ways and each method provides you with different information. The amount listed in the "actual" column is calculated using the fund's actual operating expenses and total return for the period. The amount listed in the "hypothetical" column assumes that the return each year is 5% before expenses and is calculated based on the fund's actual operating expenses. You should not use the hypothetical account values and expenses to estimate either your actual account balance at the end of the period or the expenses you paid during this reporting period.
Estimating your actual expenses
To estimate the expenses that you paid over the period, first you will need your account balance at the end of the period:
1. Divide your ending account balance by $1,000.00. For example, if an account balance was $8,600.00 at the end of the period, the result would be 8.6.
2. In the section of the table below titled "Expenses paid during the period," locate the amount under "actual." Multiply this number by the result from step 1. Your answer is an estimate of the expenses you paid on your account during the period.
February 1, 2007 – July 31, 2007
| Account value at the beginning of the period ($) | Account value at the end of the period ($) | Expenses paid during the period ($) | Fund's annualized expense ratio (%) | ||||||||||||||||||||||||
| Actual | Hypothetical | Actual | Hypothetical | Actual | Hypothetical | Actual | |||||||||||||||||||||
| 1,000.00 | 1,000.00 | 991.52 | 1,020.83 | 3.95 | 4.01 | 0.80 | |||||||||||||||||||||
Expenses paid during the period are equal to the fund's annualized expense ratio of 0.80%, multiplied by the average account value over the period, then multiplied by the number of days in the fund's most recent fiscal half-year and divided by 365.
Had the investment advisor and/or any of its affiliates not reimbursed a portion of expenses, account value at the end of the period would have been reduced.
It is important to note that the expense amounts shown in the table are meant to highlight only ongoing costs of investing in the fund. Therefore, the hypothetical examples provided may not help you determine the relative total costs of owning shares of different funds.
Compare with other funds
Since all mutual funds are required to include the same hypothetical calculations about expenses in shareholder reports, you can use this information to compare the ongoing costs of investing in the fund with other funds. To do so, compare the 5% hypothetical example with the 5% hypothetical examples that appear in the shareholder reports of other funds. As you compare hypothetical examples of other funds, it is important to note that hypothetical examples are meant to highlight the ongoing costs of investing in a fund.
28
Performance data quoted represents past performance, and current performance may be lower or higher. Past performance is no guarantee of future results. The investment return and principal value will fluctuate so that shares, when redeemed, may be worth more or less than the original cost. Please visit www.columbiamanagement.com for daily and most recent month-end performance updates.
CMG SMALL/MID CAP FUND
A Portfolio of Columbia Funds Institutional Trust
MANAGEMENT DISCUSSION OF FUND PERFORMANCE
For the 12-month period ended July 31, 2007, CMG Small/Mid Cap Fund returned 21.66%. The fund's return was higher than both its benchmarks, the Russell 2500 Growth Index and the Russell 2500 Index, which returned 19.88% and 15.55%, respectively.1 The fund performed in line with the 21.61% average return of its peer group, the Morningstar Mid Cap Growth Category2 for the same period. Stock selection drove the fund's strong performance during the period, with holdings in the industrials, materials and consumer discretionary sectors leading the way.
Several trends boosted the business results of holdings in the industrials and materials sectors. Increasing regulatory action, civil litigation and merger and acquisition activity, together with growing competition for federal research grants, drove demand for the services of Huron Consulting Group (0.7% of net assets), a specialist in business reorganization, email discovery and grant applications. New regulations prohibiting auditors from providing consulting services also aided Huron's growth. General Cable (1.0% of net assets) benefited from high demand for its copper and fiber optic wires due to the continued build-out of worldwide Internet connectivity and electrical infrastructure. In the materials sector, this trend also helped Freeport-McMoRan Copper & Gold (1.0% of net assets), a copper and gold mining firm. Increased demand for clean energy technologies, including solar power, benefited SunPower (0.7% of net asse ts), which manufactures solar cells. Potash Corp. of Saskatchewan (1.4% of net assets) saw heightened demand for its fertilizer chemicals due to a global farming trend.
Top contributors in the consumer discretionary sector were the beneficiaries of global expansion plans and rising brand-name popularity. CROCS (1.2% of net assets), maker of functional and fashionable foam shoes, significantly expanded its business with new products and more sales channels around the globe. Further expansion into the emerging markets helped boost the stock price of Coach (0.6% of net assets), which sells fine leather goods and other accessories. During the period, Coach established an on-the-ground business presence in China, a region where the firm has been accelerating store openings over the past several years.
The fund's return was dampened slightly by poor performance from Bare Escentuals, a cosmetics company selling mineral-based make-up products. The firm's business suffered when competition came on more quickly than it anticipated. We subsequently sold the stock. Several holdings in the health care and information technology sectors also performed poorly during the period. The stock of game software maker THQ (0.5% of net assets) declined due to
1 The Russell 2500 Growth Index measures the performance of those Russell 2500 Index companies with higher price-to-book ratios and higher forecasted growth values. The Russell 2500 Index tracks the performance of the 2,500 smallest companies of the Russell 3000 Index. Indices are not investments, do not incur fees or expenses and are not professionally managed. It is not possible to invest directly in an index. Securities in the fund may not match those in an index.
2 ©2007 by Morningstar, Inc. All rights reserved. The information contained herein is the proprietary information of Morningstar, Inc., may not be copied or redistributed for any purpose and may only be used for noncommercial, personal purposes. The information contained herein is not represented or warranted to be accurate, correct, complete or timely. Morningstar, Inc. shall not be responsible for investment decisions, damages or other losses resulting from the use of this information. Past performance is no guarantee of future performance. Morningstar, Inc. has not granted consent for it to be considered or deemed an "expert" under the Securities Act of 1933. Morningstar Categories compare the performance of funds with similar investment objectives and strategies.
29
investor concerns about a peak in the gaming cycle. We continue to hold the stock as we don't believe that cycle has peaked.
The markets have become very volatile as a result of credit concerns sparked by problems in the US subprime mortgage loan sector. By sticking to our core investment process, we intend to turn the volatility to the fund's advantage by seeking investment opportunities created by panic selling with the goal of maximizing returns and minimizing risk. As international demand for goods and services continues to drive economic growth, we are focused on allocating capital to companies with international footprints that we believe have the potential to capture the power of this growth, particularly in the emerging markets. We continue to screen the investment universe for growth companies that we believe are attractively valued and that have strong business models, rising profit margins and improving returns on capital.
We appreciate your continued confidence in the CMG Small/Mid Cap Fund.
Portfolio Management
Wayne M. Collette has co-managed the fund since February 2006 and has been with the advisor or its predecessors or affiliate organizations since 2001.
George J. Myers has co-managed the fund since February 2006 and has been with the advisor or its predecessors or affiliate organizations since 2004.
The fund's top ten holdings (as a percentage of net assets) as of July 31, 2007 were:
| (%) | |||||||
| Potash Corp. of Saskatchewan | 1.4 | ||||||
| NII Holdings | 1.3 | ||||||
| Verigy | 1.3 | ||||||
| CROCS | 1.2 | ||||||
| GameStop | 1.1 | ||||||
| Denbury Resources | 1.0 | ||||||
| MEMC Electronic Materials | 1.0 | ||||||
| FMC Technologies | 1.0 | ||||||
| Vocus | 1.0 | ||||||
| Affiliated Managers Group | 1.0 | ||||||
Holdings are calculated as a percentage of net assets and are subject to change. Because the fund is actively managed, there is no guarantee the fund will continue to maintain the holdings breakdown listed. The fund's holdings and their weights within the portfolio may change as market conditions change.
Equity investments are affected by stock market fluctuations that occur in response to economic and business developments.
Investing in growth stocks incurs the possibility of losses because their prices are sensitive to changes in current or expected earnings.
Investments in small- and mid-cap stocks may present special risks. They tend to be more volatile and may be less liquid than the stocks of larger companies. Small-cap stocks often have narrower markets, limited financial resources and tend to be more thinly traded than stocks of larger companies.
30
Performance data quoted represents past performance and current performance may be lower or higher. Past performance is no guarantee of future results. The investment return and principal value will fluctuate so that shares, when redeemed, may be worth more or less than the original cost. Please visit www.columbiamanagement.com for daily and most recent month-end performance updates.
Average annual total return as of July 31, 2007 (%)
| Inception | 1-year | 5-year | Life | ||||||||||||||||
| CMG Small/Mid Cap Fund | 12/01/00 | 21.66 | 16.60 | 6.55 | |||||||||||||||
| Russell 2500 Growth Index | 19.88 | 16.79 | 5.82 | ||||||||||||||||
| Russell 2500 Index | 15.55 | 16.87 | 10.97 | ||||||||||||||||
Average annual total return as of June 30, 2007 (%)
| Inception | 1-year | 5-year | Life | ||||||||||||||||
| CMG Small/Mid Cap Fund | 12/01/00 | 18.48 | 14.89 | 7.09 | |||||||||||||||
| Russell 2500 Growth Index | 19.03 | 14.71 | 6.59 | ||||||||||||||||
| Russell 2500 Index | 18.74 | 15.30 | 12.12 | ||||||||||||||||
Index performance is from December 1, 2000.
Performance results reflect any waivers or reimbursements of fund expenses by the investment advisor and/or any of its affiliates. Absent these reimbursement arrangements, performance results would have been lower. All results shown assume reinvestment of distributions.
The fund's annual operating expense ratios, with and without contractual waivers, as stated in the fund's prospectus that is current as of the date of this report, are 0.75% and 0.98%, respectively, of average annual net assets. Differences in expense ratios disclosed elsewhere in this report may result from including fee waivers and reimbursements as well as different time periods used in calculating the ratios. The contractual waiver expires 03/01/09.
Growth of a $3,000,000 investment, December 1, 2000 to July 31, 2007
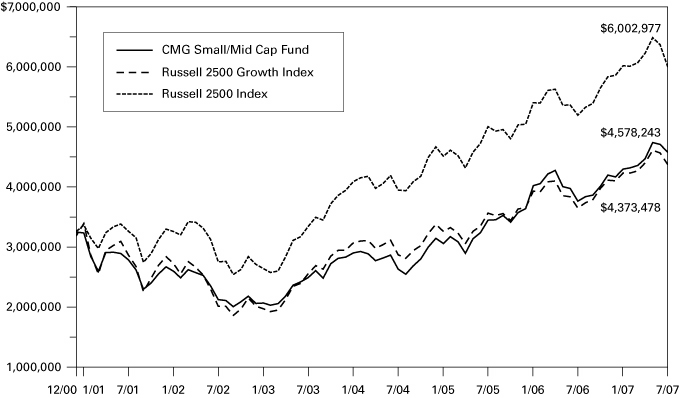
The chart above shows the growth in value of a hypothetical $3,000,000 investment in the fund compared to the indices during the stated time period.
The table and chart do not reflect the deduction of taxes that a shareholder may pay on fund distributions or the redemption of fund shares.
The Russell 2500 Growth Index measures the performance of those Russell 2500 Index companies with higher price-to-book ratios and higher forecasted growth values. The Russell 2500 Index tracks the performance of the 2,500 smallest companies of the Russell 3000 Index. Indices are not investments, do not incur fees or expenses and are not professionally managed. It is not possible to invest directly in an index. Securities in the fund may not match those in an index.
31
UNDERSTANDING YOUR EXPENSES — CMG Small/Mid Cap Fund
As a fund shareholder, you incur two types of costs. There are transaction costs and also ongoing costs, which generally include investment advisory fees and other fund expenses. The information on this page is intended to help you understand the ongoing costs of investing in the fund and to compare these costs with the ongoing costs of investing in other mutual funds.
Analyzing your fund's expenses
To illustrate these ongoing costs, we have provided an example and calculated the expenses paid by investors during the reporting period. The information in the following table is based on an initial investment of $1,000.00, which is invested at the beginning of the reporting period and held for the entire period. Expense information is calculated two ways and each method provides you with different information. The amount listed in the "actual" column is calculated using the fund's actual operating expenses and total return for the period. The amount listed in the "hypothetical" column assumes that the return each year is 5% before expenses and is calculated based on the fund's actual operating expenses. You should not use the hypothetical account values and expenses to estimate either your actual account balance at the end of the period or the expenses you paid during this reporting period.
Estimating your actual expenses
To estimate the expenses that you paid over the period, first you will need your account balance at the end of the period:
1. Divide your ending account balance by $1,000.00. For example, if an account balance was $8,600.00 at the end of the period, the result would be 8.6.
2. In the section of the table below titled "Expenses paid during the period," locate the amount under "actual." Multiply this number by the result from step 1. Your answer is an estimate of the expenses you paid on your account during the period.
February 1, 2007 – July 31, 2007
| Account value at the beginning of the period ($) | Account value at the end of the period ($) | Expenses paid during the period ($) | Fund's annualized expense ratio (%) | ||||||||||||||||||||||||
| Actual | Hypothetical | Actual | Hypothetical | Actual | Hypothetical | Actual | |||||||||||||||||||||
| 1,000.00 | 1,000.00 | 1,065.41 | 1,021.08 | 3.84 | 3.76 | 0.75 | |||||||||||||||||||||
Expenses paid during the period are equal to the fund's annualized expense ratio of 0.75%, multiplied by the average account value over the period, then multiplied by the number of days in the fund's most recent fiscal half-year and divided by 365.
Had the investment advisor and/or any of its affiliates not reimbursed a portion of expenses, account value at the end of the period would have been reduced.
It is important to note that the expense amounts shown in the table are meant to highlight only ongoing costs of investing in the fund. Therefore, the hypothetical examples provided may not help you determine the relative total costs of owning shares of different funds.
Compare with other funds
Since all mutual funds are required to include the same hypothetical calculations about expenses in shareholder reports, you can use this information to compare the ongoing costs of investing in the fund with other funds. To do so, compare the 5% hypothetical example with the 5% hypothetical examples that appear in the shareholder reports of other funds. As you compare hypothetical examples of other funds, it is important to note that hypothetical examples are meant to highlight the ongoing costs of investing in a fund.
32
Performance data quoted represents past performance, and current performance may be lower or higher. Past performance is no guarantee of future results. The investment return and principal value will fluctuate so that shares, when redeemed, may be worth more or less than the original cost. Please visit www.columbiamanagement.com for daily and most recent month-end performance updates.
CMG INTERNATIONAL STOCK FUND
A Portfolio of Columbia Funds Institutional Trust
MANAGEMENT DISCUSSION OF FUND PERFORMANCE
For the 12-month period ended July 31, 2007, CMG International Stock Fund returned 24.77%. The fund's return was higher than the return of one of its benchmark, the MSCI EAFE Index, which was 23.91%, and lower than the return of its other benchmark, the MSCI All Country World ex U.S. Index, which was 28.46%.1 The fund outperformed the average return of its peer group, the Morningstar Foreign Large Blend Category, which was 23.59%.2 The fund's exposure to China was a key contributor to performance. An underweight in Australia, a market that rose substantially because of the global demand for raw materials, detracted from results.
Over the period, we favored companies that we believed would benefit from global economic growth and the massive infrastructure development in the emerging markets. In China, two of the biggest contributors to performance were Yanzhou Coal Mining and China Mobile, the country's biggest telecommunications company (0.7% and 0.6% of net assets, respectively). The stocks of both companies rose because of robust demand for their products.
An emphasis on Germany, one of the best-performing markets, also contributed substantially to return. After implementing more market friendly policies over the past couple of years, Germany has become a leading global competitor, and many of its engineering and technology companies are at the heart of an infrastructure development and capital spending boom taking place throughout the world. Individual stocks in Europe that aided results included: Volvo AB (0.7% of net assets), a manufacturer of trucks and earth-moving equipment; Salzgitter AG (1.1% of net assets), a German steel company, which benefited from a run-up in steel prices and from the spin off of one of its subsidiaries; and JM AB (0.4% of net assets), a Swedish homebuilder that was buoyed by rising prices in a strong housing market.
Despite rising energy prices, the energy sector underperformed other sectors in the indices during the period and the fund lost ground relative to the indices because of its overweight in energy. However, the portfolio's individual energy stocks delivered solid returns. At a time when investors emphasized risky assets, health care, a more defensive industry, was disappointing. Individual stocks that detracted from performance included PartyGaming PLC, a UK-based on-line poker company. After the United States passed legislation that prohibits financial institutions from processing on-line gaming transactions, PartyGaming's revenues declined about 70%. We sold the stock. Randstad Holdings NV (0.9% of net assets), a temporary employment agency headquartered in the Netherlands, was also disappointing because of a slowdown in business in the United States and in Germany.
1 The Morgan Stanley Capital International (MSCI) Europe, Australasia, Far East (EAFE) Index is a free float-adjusted market capitalization index that is designed to measure developed market equity performance, excluding the US and Canada. The MSCI All Country World ex U.S. Index is an index of global stock market performance that includes developed and emerging markets but excludes the US. Indices are not investments, do not incur fees or expenses and are not professionally managed. It is not possible to invest directly in an index, Securities in the fund may not match those in an index.
2 ©2007 by Morningstar, Inc. All rights reserved. The information contained herein is the proprietary information of Morningstar, Inc., may not be copied or redistributed for any purpose and may only be used for noncommercial, personal purposes. The information contained herein is not represented or warranted to be accurate, correct, complete or timely. Morningstar, Inc. shall not be responsible for investment decisions, damages or other losses resulting from the use of this information. Past performance is no guarantee of future performance. Morningstar, Inc. has not granted consent for it to be considered or deemed an "expert" under the Securities Act of 1933. Morningstar Categories compare the performance of funds with similar investment objectives and strategies.
33
Looking ahead, we have a favorable opinion regarding the global backdrop for stocks. Interest rates, though rising, are relatively low and inflation appears contained, which bodes well for monetary policies. We believe that global growth has the potential to remain relatively strong. While this environment should favor equities, problems in the US subprime mortgage market have triggered a wave of volatility that is likely to continue for some time. We have used this volatility to invest in certain European banks that have declined substantially but that have limited exposure to subprime mortgages. We are carefully monitoring events in France. The new government was elected on a labor reform platform, and we believe that France could be a source of attractive opportunities should the government implement market friendly policies similar to those instituted in Germany. We also believe that the build-out of the infrastructure in th e emerging markets is likely to continue to be a theme in the portfolio.
We appreciate your continued confidence in the CMG International Stock Fund.
Portfolio Management
Fred Copper has managed or co-managed the fund since October 2005 and has been with the advisor or its predecessors or affiliate organizations since 2005.
Jasmine (Weili) Huang has co-managed the fund since May 2006 and has been with the advisor or its predecessors or affiliate organizations since 2003.
Timothy R. Anderson has co-managed the fund since May 2006 and has been with the advisor or its predecessors or affiliate organizations since 2006.
Paul J. DiGiacomo has co-managed the fund since May 2006 and has been with the advisor or its predecessors or affiliate organizations since 2006.
Daisuke Nomoto has co-managed the fund since May 2006 and has been with the advisor or its predecessors or affiliate organizations since 2005.
The fund's top ten holdings and countries (as a percentage of net assets) as of July 31, 2007 were:
| Holdings | (%) | Countries | (%) | ||||||||||||
| Total SA | 2.2 | Japan | 20.8 | ||||||||||||
| Novartis AG, Registered Shares | 1.9 | United Kingdom | 13.6 | ||||||||||||
| iShares MSCI EAFE Index Fund | 1.8 | Germany | 9.5 | ||||||||||||
| Nokia Oyj | 1.8 | France | 9.4 | ||||||||||||
| Banco Santander Central Hispano SA | 1.7 | Switzerland | 8.6 | ||||||||||||
| BASF AG | 1.7 | Sweden | 4.0 | ||||||||||||
| E.ON AG | 1.6 | Netherlands | 3.8 | ||||||||||||
| Banco Bilbao Vizcaya Argentaria SA | 1.6 | Spain | 3.4 | ||||||||||||
| Barclays PLC | 1.6 | United States | 2.5 | ||||||||||||
| BNP Paribas | 1.4 | Canada | 2.3 | ||||||||||||
Holdings and country breakdowns are disclosed as a percentage of net assets, and are subject to change. Because the fund is actively managed, there is no guarantee the fund will continue to maintain the holdings and country breakdown listed. The fund's holdings and their weights within the portfolio may change as market conditions change.
Equity investments are affected by stock market fluctuations that occur in response to economic and business developments.
International investing involves special risks, including foreign taxation, currency fluctuation, risks associated with possible differences in financial standards and other monetary political risks.
A concentration of investments in a specific sector, such as the technology sector, may cause the fund to experiences increased volatility.
34
Performance data quoted represents past performance and current performance may be lower or higher. Past performance is no guarantee of future results. The investment return and principal value will fluctuate so that shares, when redeemed, may be worth more or less than the original cost. Please visit www.columbiamanagement.com for daily and most recent month-end performance updates.
Average annual total return as of July 31, 2007 (%)
| Inception | 1-year | 5-year | 10-year | ||||||||||||||||
| CMG International Stock Fund | 02/01/94 | 24.77 | 17.22 | 7.49 | |||||||||||||||
| MSCI EAFE Index | 23.91 | 19.85 | 7.33 | ||||||||||||||||
| MSCI All Country World ex U.S. Index | 28.46 | 22.34 | 8.33 | ||||||||||||||||
Average annual total return as of June 30, 2007 (%)
| Inception | 1-year | 5-year | 10-year | ||||||||||||||||
| CMG International Stock Fund | 02/01/94 | 28.14 | 15.62 | 7.97 | |||||||||||||||
| MSCI EAFE Index | 27.00 | 17.73 | 7.66 | ||||||||||||||||
| MSCI All Country World ex U.S. Index | 30.15 | 19.93 | 8.58 | ||||||||||||||||
Performance results reflect any waivers or reimbursements of fund expenses by the investment advisor and/or any of its affiliates. Absent these waivers or reimbursement arrangements, performance results would have been lower. All results shown assume reinvestment of distributions.
The fund's annual operating expense ratios, with and without contractual waivers, as stated in the fund's prospectus that is current as of the date of this report, are 0.75% and 0.81%, respectively, of average annual net assets. Differences in expense ratios disclosed elsewhere in this report may result from including fee waivers and reimbursements as well as different time periods used in calculating the ratios. The contractual waiver expires 03/01/09.
Growth of a $3,000,000 investment, August 1, 1997 to July 31, 2007
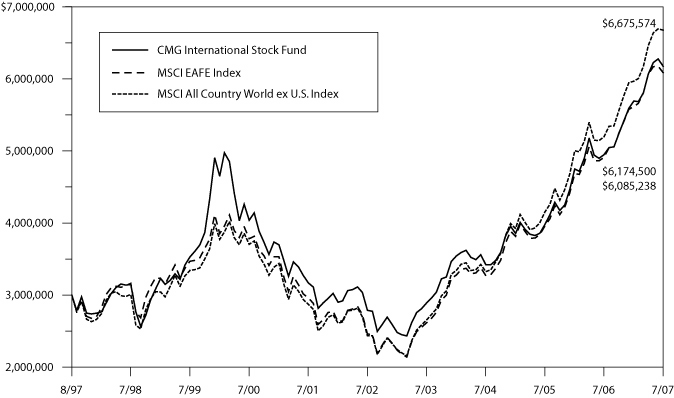
The chart above shows the growth in value of a hypothetical $3,000,000 investment in the fund compared to the indices during the stated time period.
The table and chart do not reflect the deduction of taxes that a shareholder may pay on fund distributions or the redemption of fund shares.
The Morgan Stanley Capital International (MSCI) Europe, Australasia, Far East (EAFE) Index is a free float-adjusted market capitalization index that is designed to measure developed market equity performance, excluding the US and Canada. The MSCI All Country World ex U.S. Index is an index of global stock market performance that includes developed and emerging markets but excludes the US. Indices are not investments, do not incur fees or expenses and are not professionally managed. It is not possible to invest directly in an index. Securities in the fund may not match those in an index.
35
UNDERSTANDING YOUR EXPENSES — CMG International Stock Fund
As a fund shareholder, you incur two types of costs. There are transaction costs and also ongoing costs, which generally include investment advisory fees and other fund expenses. The information on this page is intended to help you understand the ongoing costs of investing in the fund and to compare these costs with the ongoing costs of investing in other mutual funds.
Analyzing your fund's expenses
To illustrate these ongoing costs, we have provided an example and calculated the expenses paid by investors during the reporting period. The information in the following table is based on an initial investment of $1,000.00, which is invested at the beginning of the reporting period and held for the entire period. Expense information is calculated two ways and each method provides you with different information. The amount listed in the "actual" column is calculated using the fund's actual operating expenses and total return for the period. The amount listed in the "hypothetical" column assumes that the return each year is 5% before expenses and is calculated based on the fund's actual operating expenses. You should not use the hypothetical account values and expenses to estimate either your actual account balance at the end of the period or the expenses you paid during this reporting period.
Estimating your actual expenses
To estimate the expenses that you paid over the period, first you will need your account balance at the end of the period:
1. Divide your ending account balance by $1,000.00. For example, if an account balance was $8,600.00 at the end of the period, the result would be 8.6.
2. In the section of the table below titled "Expenses paid during the period," locate the amount under "actual." Multiply this number by the result from step 1. Your answer is an estimate of the expenses you paid on your account during the period.
February 1, 2007 – July 31, 2007
| Account value at the beginning of the period ($) | Account value at the end of the period ($) | Expenses paid during the period ($) | Fund's annualized expense ratio (%) | ||||||||||||||||||||||||
| Actual | Hypothetical | Actual | Hypothetical | Actual | Hypothetical | Actual | |||||||||||||||||||||
| 1,000.00 | 1,000.00 | 1,085.39 | 1,021.04 | 3.91 | 3.79 | 0.76 | |||||||||||||||||||||
Expenses paid during the period are equal to the fund's annualized expense ratio of 0.76%, multiplied by the average account value over the period, then multiplied by the number of days in the fund's most recent fiscal half-year and divided by 365.
Had the investment advisor and/or any of its affiliates not reimbursed a portion of expenses, account value at the end of the period would have been reduced.
It is important to note that the expense amounts shown in the table are meant to highlight only ongoing costs of investing in the fund. Therefore, the hypothetical examples provided may not help you determine the relative total costs of owning shares of different funds.
Compare with other funds
Since all mutual funds are required to include the same hypothetical calculations about expenses in shareholder reports, you can use this information to compare the ongoing costs of investing in the fund with other funds. To do so, compare the 5% hypothetical example with the 5% hypothetical examples that appear in the shareholder reports of other funds. As you compare hypothetical examples of other funds, it is important to note that hypothetical examples are meant to highlight the ongoing costs of investing in a fund.
36
CMG ENHANCED S&P 500® INDEX FUND
A Portfolio of Columbia Funds Institutional Trust
FINANCIAL HIGHLIGHTS
(For a Fund Share Outstanding Throughout Each Period)
Year Ended July 31, | Period Ended July 31, | ||||||||||||||||||||||
| 2007 | 2006 | 2005 | 2004 | 2003 (a) | |||||||||||||||||||
| Net asset value, beginning of period | $ | 13.52 | $ | 13.49 | $ | 11.97 | $ | 10.73 | $ | 10.00 | |||||||||||||
| Income from investment operations: | |||||||||||||||||||||||
| Net investment income (b) | 0.25 | 0.23 | 0.24 | (c) | 0.17 | 0.04 | |||||||||||||||||
| Net realized and unrealized gain on investments and futures contracts | 1.88 | 0.76 | 1.58 | 1.13 | 0.69 | ||||||||||||||||||
| Total from investment operations | 2.13 | 0.99 | 1.82 | 1.30 | 0.73 | ||||||||||||||||||
| Less distributions declared to shareholders: | |||||||||||||||||||||||
| From net investment income | (0.22 | ) | (0.25 | ) | (0.20 | ) | (0.05 | ) | - | ||||||||||||||
| From net realized gains | (0.90 | ) | (0.71 | ) | (0.10 | ) | (0.01 | ) | - | ||||||||||||||
| Total distributions declared to shareholders | (1.12 | ) | (0.96 | ) | (0.30 | ) | (0.06 | ) | - | ||||||||||||||
| Net asset value, end of period | $ | 14.53 | $ | 13.52 | $ | 13.49 | $ | 11.97 | $ | 10.73 | |||||||||||||
| Total return (d)(e) | 15.87 | % | 7.56 | % | 15.32 | % | 12.08 | % | 7.30 | %(f) | |||||||||||||
| Ratios/Supplemental data: | |||||||||||||||||||||||
| Net assets, end of period (000's).. | $ | 222,698 | $ | 100,973 | $ | 91,633 | $ | 98,247 | $ | 9,134 | |||||||||||||
| Ratio of net operating expenses to average net assets | 0.25 | % | 0.25 | % | 0.25 | % | 0.25 | % | 0.25 | %(g) | |||||||||||||
| Ratio of interest expense to average net assets | - | %(h) | - | %(h) | - | - | - | ||||||||||||||||
| Ratio of net expenses to average net assets | 0.25 | % | 0.25 | % | 0.25 | % | 0.25 | % | 0.25 | %(g) | |||||||||||||
| Ratio of net investment income to average net assets | 1.73 | % | 1.70 | % | 1.91 | % | 1.43 | % | 1.50 | %(g) | |||||||||||||
| Waiver/reimbursement . | 0.05 | % | 0.06 | % | 0.04 | % | 0.05 | % | 1.37 | %(g) | |||||||||||||
| Portfolio turnover rate | 45 | % | 66 | % | 49 | % | 60 | % | 2 | %(f) | |||||||||||||
(a) The Fund commenced investment operations on May 5, 2003. Per share data, total return and portfolio turnover rate reflect activity from that date.
(b) Per share data was calculated using the average shares outstanding during the period.
(c) Net investment income per share reflects a special dividend. The effect of this dividend amounted to $0.04 per share.
(d) Total return at net asset value assuming all distributions reinvested.
(e) Had the investment advisor and/or any of its affiliates not waived or reimbursed a portion of expenses, total return would have been reduced.
(f) Not annualized.
(g) Annualized.
(h) Rounds to less than 0.01%.
See Accompanying Notes to Financial Statements.
37
CMG LARGE CAP GROWTH FUND
A Portfolio of Columbia Funds Institutional Trust
FINANCIAL HIGHLIGHTS
(For a Fund Share Outstanding Throughout Each Period)
| Period Ended | |||||||||||||||||||
| Year Ended July 31, | July 31, | ||||||||||||||||||
| 2007 | 2006 | 2005 | 2004 (a) | ||||||||||||||||
| Net asset value, beginning of period | $ | 11.12 | $ | 11.65 | $ | 10.25 | $ | 10.00 | |||||||||||
| Income from investment operations: | |||||||||||||||||||
| Net investment income (b) | 0.08 | 0.07 | 0.12 | (c) | 0.03 | ||||||||||||||
| Net realized and unrealized gain on investments | 2.08 | 0.14 | 1.37 | 0.23 | |||||||||||||||
| Total from investment operations | 2.16 | 0.21 | 1.49 | 0.26 | |||||||||||||||
| Less distributions declared to shareholders: | |||||||||||||||||||
| From net investment income | (0.08 | ) | (0.08 | ) | (0.09 | ) | (0.01 | ) | |||||||||||
| From net realized gains | (0.69 | ) | (0.66 | ) | - | - | |||||||||||||
| Total distributions declared to shareholders | (0.77 | ) | (0.74 | ) | (0.09 | ) | (0.01 | ) | |||||||||||
| Net asset value, end of period | $ | 12.51 | $ | 11.12 | $ | 11.65 | $ | 10.25 | |||||||||||
| Total return (d)(e) | 19.77 | % | 1.63 | % | 14.55 | % | 2.57 | %(f) | |||||||||||
| Ratios/Supplemental data: | |||||||||||||||||||
| Net assets, end of period (000's) | $ | 58,978 | $ | 35,765 | $ | 40,312 | $ | 40,684 | |||||||||||
| Ratio of net operating expenses to average net assets | 0.50 | % | 0.50 | % | 0.50 | % | 0.50 | %(g) | |||||||||||
| Ratio of interest expense to average net assets | - | - | %(h) | - | - | ||||||||||||||
| Ratio of net expenses to average net assets | 0.50 | % | 0.50 | % | 0.50 | % | 0.50 | %(g) | |||||||||||
| Ratio of net investment income to average net assets | 0.63 | % | 0.62 | % | 1.07 | % | 0.31 | %(g) | |||||||||||
| Waiver/reimbursement | 0.16 | % | 0.13 | % | 0.07 | % | 0.14 | %(g) | |||||||||||
| Portfolio turnover rate | 179 | % | 180 | % | 120 | % | 114 | %(f) | |||||||||||
(a) The Fund commenced investment operations on September 10, 2003. Per share data, total return and portfolio turnover rate reflect activity from that date.
(b) Per share data was calculated using average shares outstanding during the period.
(c) Net investment income per share reflects a special dividend. The effect of this dividend amounted to $0.05 per share.
(d) Total return at net asset value assuming all distributions reinvested.
(e) Had the investment advisor and/or any of its affiliates not waived or reimbursed a portion of expenses, total return would have been reduced.
(f) Not annualized.
(g) Annualized.
(h) Rounds to less than 0.01%.
See Accompanying Notes to Financial Statements.
38
CMG LARGE CAP VALUE FUND
A Portfolio of Columbia Funds Institutional Trust
FINANCIAL HIGHLIGHTS
(For a Fund Share Outstanding Throughout Each Period)
| Period Ended | |||||||||||||||||||
| Year Ended July 31, | July 31, | ||||||||||||||||||
| 2007 | 2006 | 2005 | 2004 (a) | ||||||||||||||||
| Net asset value, beginning of period | $ | 11.89 | $ | 12.54 | $ | 11.09 | $ | 10.00 | |||||||||||
| Income from investment operations: | |||||||||||||||||||
| Net investment income (b) | 0.22 | 0.22 | 0.24 | 0.18 | |||||||||||||||
| Net realized and unrealized gain on investments | 1.38 | 0.92 | 1.46 | 0.93 | |||||||||||||||
| Total from investment operations | 1.60 | 1.14 | 1.70 | 1.11 | |||||||||||||||
| Less distributions declared to shareholders: | |||||||||||||||||||
| From net investment income | (0.22 | ) | (0.28 | ) | (0.22 | ) | (0.02 | ) | |||||||||||
| From net realized gains | (0.97 | ) | (1.51 | ) | (0.03 | ) | - | ||||||||||||
| Total distributions declared to shareholders | (1.19 | ) | (1.79 | ) | (0.25 | ) | (0.02 | ) | |||||||||||
| Net asset value, end of period | $ | 12.30 | $ | 11.89 | $ | 12.54 | $ | 11.09 | |||||||||||
| Total return (c)(d) | 13.69 | % | 9.85 | %(e) | 15.41 | %(f) | 11.15 | %(g) | |||||||||||
| Ratios/Supplemental data: | |||||||||||||||||||
| Net assets, end of period (000's) | $ | 44,830 | $ | 37,280 | $ | 38,731 | $ | 47,855 | |||||||||||
| Ratio of net expenses to average net assets | 0.50 | % | 0.50 | % | 0.50 | % | 0.50 | %(h) | |||||||||||
| Ratio of net investment income to average net assets | 1.78 | % | 1.78 | % | 1.99 | % | 1.86 | %(h) | |||||||||||
| Waiver/reimbursement | 0.18 | % | 0.13 | % | 0.07 | % | 0.14 | %(h) | |||||||||||
| Portfolio turnover rate | 92 | % | 97 | % | 45 | % | 46 | %(g) | |||||||||||
(a) The Fund commenced investment operations on September 10, 2003. Per share data, total return and portfolio turnover rate reflect activity from that date.
(b) Per share data was calculated using the average shares outstanding during the period.
(c) Total return at net asset value assuming all distributions reinvested.
(d) Had the investment advisor and/or any of its affiliates not waived or reimbursed a portion of expenses, total return would have been reduced.
(e) Total return includes a voluntary reimbursement by the investment advisor for a realized investment loss due to a trading error. This reimbursement had an impact of less than 0.01% on the Fund's total return.
(f) Total return includes a reimbursement of loss experienced by the Fund due to a compliance violation. The reimbursement had an impact of less than 0.01% on the Fund's total return.
(g) Not annualized.
(h) Annualized.
See Accompanying Notes to Financial Statements.
39
CMG MID CAP GROWTH FUND
A Portfolio of CMG Funds Institutional Trust
FINANCIAL HIGHLIGHTS
(For a Fund Share Outstanding Throughout Each Period)
Year Ended July 31, | Period Ended July 31, | ||||||||||||||||||||||
| 2007 | 2006 | 2005 | 2004 | 2003 (a) | |||||||||||||||||||
| Net asset value, beginning of period | $ | 14.98 | $ | 14.15 | $ | 11.04 | $ | 10.93 | $ | 10.00 | |||||||||||||
| Income from investment operations: | |||||||||||||||||||||||
| Net investment income (loss) (b) | 0.09 | 0.01 | (0.03 | ) | (0.05 | ) | (0.01 | ) | |||||||||||||||
| Net realized and unrealized gain on investments, written options and foreign currency transactions | 3.21 | 1.20 | 3.14 | 0.17 | 0.94 | ||||||||||||||||||
| Total from investment operations | 3.30 | 1.21 | 3.11 | 0.12 | 0.93 | ||||||||||||||||||
| Less distributions declared to shareholders: | |||||||||||||||||||||||
| From net investment income | (0.05 | ) | - | - | - | - | |||||||||||||||||
| From net realized gains | (1.75 | ) | (0.38 | ) | - | (0.01 | ) | - | |||||||||||||||
| Total distributions declared to shareholders | (1.80 | ) | (0.38 | ) | - | (0.01 | ) | - | |||||||||||||||
| Net asset value, end of period | $ | 16.48 | $ | 14.98 | $ | 14.15 | $ | 11.04 | $ | 10.93 | |||||||||||||
| Total return (c)(d) | 23.22 | % | 8.56 | % | 28.17 | % | 1.06 | % | 9.30 | %(e) | |||||||||||||
| Ratios/Supplemental data: | |||||||||||||||||||||||
| Net assets, end of period (000's) . | $ | 28,674 | $ | 23,636 | $ | 24,881 | $ | 19,284 | $ | 2,161 | |||||||||||||
| Ratio of net expenses to average net assets | 0.70 | % | 0.70 | % | 0.70 | % | 0.70 | % | 0.70 | %(f) | |||||||||||||
| Ratio of net investment income (loss) to average net assets | 0.54 | % | 0.08 | % | (0.21 | )% | (0.38 | )% | (0.44 | )%(f) | |||||||||||||
| Waiver/reimbursement | 0.25 | % | 0.20 | % | 0.21 | % | 0.22 | % | 3.85 | %(f) | |||||||||||||
| Portfolio turnover rate | 152 | % | 65 | % | 141 | % | 169 | % | 23 | %(e) | |||||||||||||
(a) The Fund commenced investment operations on May 5, 2003. Per share data, total return and portfolio turnover rate reflect activity from that date.
(b) Per share data was calculated using the average shares outstanding during the period.
(c) Total return at net asset value assuming all distributions reinvested.
(d) Had the investment advisor and/or any of its affiliates not waived or reimbursed a portion of expenses, total return would have been reduced.
(e) Not annualized.
(f) Annualized.
See Accompanying Notes to Financial Statements.
40
CMG MID CAP VALUE FUND
A Portfolio of Columbia Funds Institutional Trust
FINANCIAL HIGHLIGHTS
(For a Fund Share Outstanding Throughout Each Period)
Year Ended July 31, | Period Ended July 31, | ||||||||||||||||||||||
| 2007 | 2006 | 2005 | 2004 | 2003 (a) | |||||||||||||||||||
| Net asset value, beginning of period | $ | 14.02 | $ | 15.17 | $ | 12.58 | $ | 10.69 | $ | 10.00 | |||||||||||||
| Income from investment operations: | |||||||||||||||||||||||
| Net investment income (b) | 0.22 | 0.15 | 0.11 | 0.07 | 0.01 | ||||||||||||||||||
| Net realized and unrealized gain on investments, written options and foreign currency transactions | 2.34 | 1.14 | 2.66 | 1.84 | 0.68 | ||||||||||||||||||
| Total from investment operations | 2.56 | 1.29 | 2.77 | 1.91 | 0.69 | ||||||||||||||||||
| Less distributions declared to shareholders: | |||||||||||||||||||||||
| From net investment income . | (0.18 | ) | (0.16 | ) | (0.09 | ) | (0.02 | ) | - | ||||||||||||||
| From net realized gains | (2.31 | ) | (2.28 | ) | (0.09 | ) | - | (c) | - | ||||||||||||||
| Total distributions declared to shareholders | (2.49 | ) | (2.44 | ) | (0.18 | ) | (0.02 | ) | - | ||||||||||||||
| Net asset value, end of period | $ | 14.09 | $ | 14.02 | $ | 15.17 | $ | 12.58 | $ | 10.69 | |||||||||||||
| Total return (d)(e) | 19.50 | % | 9.30 | % | 22.14 | % | 17.91 | % | 6.90 | %(f) | |||||||||||||
| Ratios/Supplemental data: | |||||||||||||||||||||||
| Net assets, end of period (000's) | $ | 19,296 | $ | 17,762 | $ | 21,277 | $ | 21,994 | $ | 2,651 | |||||||||||||
| Ratio of net expenses to average net assets | 0.70 | % | 0.70 | % | 0.70 | % | 0.70 | % | 0.70 | %(g) | |||||||||||||
| Ratio of net investment income to average net assets ... | 1.49 | % | 1.02 | % | 0.78 | % | 0.54 | % | 0.49 | %(g) | |||||||||||||
| Waiver/reimbursement | 0.36 | % | 0.25 | % | 0.19 | % | 0.20 | % | 3.61 | %(g) | |||||||||||||
| Portfolio turnover rate . | 63 | % | 59 | % | 59 | % | 9 | % | 2 | %(f) | |||||||||||||
(a) The Fund commenced investment operations on May 5, 2003. Per share data, total return and portfolio turnover rate reflect activity from that date.
(b) Per share data was calculated using the average shares outstanding during the period.
(c) Rounds to less than $0.01 per share.
(d) Total return at net asset value assuming all distributions reinvested.
(e) Had the investment advisor and/or any of its affiliates not waived or reimbursed a portion of expenses, total return would have been reduced.
(f) Not annualized.
(g) Annualized.
See Accompanying Notes to Financial Statements.
41
CMG SMALL CAP GROWTH FUND
A Portfolio of Columbia Funds Institutional Trust
FINANCIAL HIGHLIGHTS
(For a Fund Share Outstanding Throughout Each Period)
Year Ended July 31, | Period Ended July 31, | Year Ended October 31, | |||||||||||||||||||||||||
| 2007 | 2006 | 2005 | 2004 | 2003 (a) | 2002 | ||||||||||||||||||||||
| Net asset value, beginning of period | $ | 2.03 | $ | 6.57 | $ | 5.07 | $ | 4.62 | $ | 3.67 | $ | 4.41 | |||||||||||||||
| Income from investment operations: | |||||||||||||||||||||||||||
| Net investment loss (b) | (0.01 | ) | (0.02 | ) | (0.03 | ) | (0.03 | ) | (0.02 | ) | (0.02 | ) | |||||||||||||||
| Net realized and unrealized gain (loss) on investments, written options and and foreign currency transactions | 0.42 | 0.53 | (c) | 1.53 | 0.48 | 0.97 | (0.72 | ) | |||||||||||||||||||
| Total from investment operations | 0.41 | 0.51 | 1.50 | 0.45 | 0.95 | (0.74 | ) | ||||||||||||||||||||
| Less distributions declared to shareholders: | |||||||||||||||||||||||||||
| From net realized gains | (0.49 | ) | (5.05 | )(d) | - | - | - | - | (e) | ||||||||||||||||||
| Net asset value, end of period | $ | 1.95 | $ | 2.03 | $ | 6.57 | $ | 5.07 | $ | 4.62 | $ | 3.67 | |||||||||||||||
| Total return (f) | 22.69 | %(g) | 10.46 | %(g) | 29.59 | % | 9.74 | % | 25.89 | %(h) | (16.76 | )% | |||||||||||||||
| Ratios/Supplemental data: | |||||||||||||||||||||||||||
| Net assets, end of period (000's) | $ | 39,899 | $ | 40,183 | $ | 30,317 | $ | 292,028 | $ | 293,924 | $ | 227,874 | |||||||||||||||
| Ratio of net operating expenses to average net assets (i) | 0.80 | % | 1.09 | % | 0.85 | % | 0.79 | % | 0.81 | %(j) | 0.79 | % | |||||||||||||||
| Ratio of interest expense to average net assets | - | %(k) | - | - | - | - | - | ||||||||||||||||||||
| Ratio of net expenses to average net assets (i) | 0.80 | % | 1.09 | % | 0.85 | % | 0.79 | % | 0.81 | %(j) | 0.79 | % | |||||||||||||||
| Ratio of net investment loss to average net assets (i) | (0.25 | )% | (0.88 | )% | (0.61 | )% | (0.62 | )% | (0.55 | )%(j) | (0.49 | )% | |||||||||||||||
| Waiver/reimbursement | 0.27 | % | 0.21 | % | - | - | - | - | |||||||||||||||||||
| Portfolio turnover rate | 158 | % | 112 | % | 119 | % | 123 | % | 89 | %(h) | 120 | % | |||||||||||||||
(a) The Fund changed its fiscal year end from October 31 to July 31.
(b) Per share data was calculated using the average shares outstanding during the period.
(c) The amount shown for a share outstanding does not correspond with the aggregate gain (loss) on investments for the period due to timing of sales and repurchases of Fund shares in relation to fluctuating market values of the investments of the Fund.
(d) Capital gain distributions were declared after significant shareholder redemptions reduced the size of the Fund.
(e) Rounds to less than $0.01 per share.
(f) Total return at net asset value assuming all distributions reinvested.
(g) Had the investment advisor and/or any of its affiliates not waived or reimbursed a portion of expenses, total return would have been reduced.
(h) Not annualized.
(i) The benefits derived from custody credits had an impact of less than 0.01%.
(j) Annualized.
(k) Rounds to less than 0.01%.
See Accompanying Notes to Financial Statements.
42
CMG SMALL CAP VALUE FUND
A Portfolio of Columbia Funds Institutional Trust
FINANCIAL HIGHLIGHTS
(For a Fund Share Outstanding Throughout Each Period)
Year Ended July 31, | Period Ended July 31, | ||||||||||||||||||||||
| 2007 | 2006 | 2005 | 2004 | 2003 (a) | |||||||||||||||||||
| Net asset value, beginning of period | $ | 15.31 | $ | 16.06 | $ | 13.91 | $ | 11.29 | $ | 10.00 | |||||||||||||
| Income from investment operations: | |||||||||||||||||||||||
| Net investment income (b) | 0.11 | 0.09 | 0.11 | 0.11 | 0.02 | ||||||||||||||||||
| Net realized and unrealized gain on investments | 1.82 | 1.06 | 3.11 | 2.79 | 1.27 | ||||||||||||||||||
| Total from investment operations | 1.93 | 1.15 | 3.22 | 2.90 | 1.29 | ||||||||||||||||||
| Less distributions declared to shareholders: | |||||||||||||||||||||||
| From net investment income | (0.12 | ) | (0.13 | ) | (0.10 | ) | (0.06 | ) | - | ||||||||||||||
| From net realized gains | (3.18 | ) | (1.77 | ) | (0.97 | ) | (0.22 | ) | - | ||||||||||||||
| Total distributions declared to shareholders | (3.30 | ) | (1.90 | ) | (1.07 | ) | (0.28 | ) | - | ||||||||||||||
| Net asset value, end of period | $ | 13.94 | $ | 15.31 | $ | 16.06 | $ | 13.91 | $ | 11.29 | |||||||||||||
| Total return (c)(d) . | 12.82 | % | 7.90 | %(e) | 23.57 | % | 25.79 | % | 12.90 | %(f) | |||||||||||||
| Ratios/Supplemental data: | |||||||||||||||||||||||
| Net assets, end of period (000's) | $ | 31,952 | $ | 33,439 | $ | 36,989 | $ | 40,356 | $ | 21,356 | |||||||||||||
| Ratio of net operating expenses to average net assets | 0.80 | % | 0.80 | % | 0.80 | % | 0.80 | % | 0.80 | %(g) | |||||||||||||
| Ratio of interest expense to average net assets | 0.01 | % | - | %(h) | - | - | - | ||||||||||||||||
| Ratio of net expenses to average net assets | 0.81 | % | 0.80 | % | 0.80 | % | 0.80 | % | 0.80 | %(g) | |||||||||||||
| Ratio of net investment income to average net assets | 0.75 | % | 0.60 | % | 0.77 | % | 0.82 | % | 0.66 | %(g) | |||||||||||||
| Waiver/Reimbursement | 0.22 | % | 0.14 | % | 0.12 | % | 0.09 | % | 0.36 | %(g) | |||||||||||||
| Portfolio turnover rate | 50 | % | 37 | % | 41 | % | 53 | % | 5 | %(f) | |||||||||||||
(a) The Fund commenced investment operations on May 5, 2003. Per share data, total return and portfolio turnover rate reflect activity from that date.
(b) Per share data was calculated using the average shares outstanding during the period.
(c) Total return at net asset value assuming all distributions reinvested.
(d) Had the investment advisor and/or any of its affiliates not waived or reimbursed a portion of expenses, total return would have been reduced.
(e) Total return includes a voluntary reimbursement by the investment advisor for a realized investment loss due to a trading error. This reimbursement had an impact of less than 0.01% on the Fund's total return.
(f) Not annualized.
(g) Annualized.
(h) Rounds to less than 0.01%.
See Accompanying Notes to Financial Statements.
43
CMG SMALL/MID CAP FUND
A Portfolio of Columbia Funds Institutional Trust
FINANCIAL HIGHLIGHTS
(For a Fund Share Outstanding Throughout Each Period)
Year Ended July 31, | Period Ended July 31, | Year Ended October 31, | |||||||||||||||||||||||||
| 2007 | 2006 | 2005 | 2004 | 2003 (a) | 2002 | ||||||||||||||||||||||
| Net asset value, beginning of period | $ | 11.24 | $ | 11.49 | $ | 8.77 | $ | 8.30 | $ | 6.96 | $ | 8.00 | |||||||||||||||
| Income from investment operations: | |||||||||||||||||||||||||||
| Net investment loss (b) | - | (c) | (0.05 | ) | (0.04 | ) | (0.05 | ) | (0.03 | ) | (0.04 | ) | |||||||||||||||
| Net realized and unrealized gain (loss) on investments, written options and foreign currency transactions . | 1.01 | 1.07 | 2.76 | 0.52 | 1.37 | (1.00 | ) | ||||||||||||||||||||
| Total from investment operations | 1.01 | 1.02 | 2.72 | 0.47 | 1.34 | (1.04 | ) | ||||||||||||||||||||
| Less distributions declared to shareholders: | |||||||||||||||||||||||||||
| From net realized gains | (7.69 | )(d) | (1.27 | ) | - | - | - | - | |||||||||||||||||||
| Net asset value, end of period | $ | 4.56 | $ | 11.24 | $ | 11.49 | $ | 8.77 | $ | 8.30 | $ | 6.96 | |||||||||||||||
| Total return (e)(f) | 21.66 | % | 9.17 | %(g) | 31.01 | % | 5.66 | % | 19.25 | %(h) | (13.00 | )% | |||||||||||||||
| Ratios/Supplemental data: | |||||||||||||||||||||||||||
| Net assets, end of period (000's) | $ | 12,516 | $ | 8,773 | $ | 38,755 | $ | 50,662 | $ | 73,926 | $ | 54,769 | |||||||||||||||
| Ratio of net expenses to average net assets | 0.75 | % | 0.75 | % | 0.75 | % | 0.75 | % | 0.78 | %(i)(j) | 0.80 | %(j) | |||||||||||||||
| Ratio of net investment loss to average net assets . | (0.01 | )% | (0.45 | )% | (0.37 | )% | (0.49 | )% | (0.50 | )%(i)(j) | (0.45 | )%(j) | |||||||||||||||
| Waiver/reimbursement | 0.57 | % | 0.23 | % | 0.09 | % | 0.06 | % | 0.06 | %(i) | 0.06 | % | |||||||||||||||
| Portfolio turnover rate | 158 | % | 109 | % | 170 | % | 91 | % | 84 | %(h) | 125 | % | |||||||||||||||
(a) The Fund changed its fiscal year end from October 31 to July 31.
(b) Per share data was calculated using the average shares outstanding during the period.
(c) Rounds to less than $0.01 per share.
(d) Capital gain distributions were declared in the current year after significant shareholder redemptions reduced the size of the Fund in the prior year.
(e) Total return at net asset value assuming all distributions reinvested.
(f) Had the investment advisor and/or any of its affiliates not waived or reimbursed a portion of expenses, total return would have been reduced.
(g) Total return includes a voluntary reimbursement by the investment advisor for a realized investment loss due to a trading error. This reimbursement had an impact of less than 0.01% on the Fund's total return.
(h) Not annualized.
(i) Annualized.
(j) The benefits derived from custody credits had an impact of less than 0.01%.
See Accompanying Notes to Financial Statements.
44
CMG INTERNATIONAL STOCK FUND
A Portfolio of Columbia Funds Institutional Trust
FINANCIAL HIGHLIGHTS
(For a Fund Share Outstanding Throughout Each Period)
Year Ended July 31, | Period Ended July 31, | Year Ended October 31, | |||||||||||||||||||||||||
| 2007 | 2006 | 2005 | 2004 | 2003 (a) | 2002 | ||||||||||||||||||||||
| Net asset value, beginning of period | $ | 14.63 | $ | 13.76 | $ | 12.17 | $ | 10.33 | $ | 9.32 | $ | 10.42 | |||||||||||||||
| Income from investment operations: | |||||||||||||||||||||||||||
| Net investment income (b) | 0.27 | 0.26 | 0.19 | 0.14 | 0.11 | 0.02 | |||||||||||||||||||||
| Net realized and unrealized gain (loss) on investments, foreign currency transactions and foreign capital gains tax | 2.98 | 2.85 | 1.79 | 1.76 | 0.95 | (1.09 | ) | ||||||||||||||||||||
| Total from investment operations | 3.25 | 3.11 | 1.98 | 1.90 | 1.06 | (1.07 | ) | ||||||||||||||||||||
| Less distributions declared to shareholders: | |||||||||||||||||||||||||||
| From net investment income | (0.36 | ) | (0.27 | ) | (0.10 | ) | (0.06 | ) | (0.05 | ) | (0.03 | ) | |||||||||||||||
| From net realized gains | (2.92 | ) | (1.97 | ) | (0.29 | ) | - | - | - | ||||||||||||||||||
| Total distributions declared to shareholders | (3.28 | ) | (2.24 | ) | (0.39 | ) | (0.06 | ) | (0.05 | ) | (0.03 | ) | |||||||||||||||
| Net asset value, end of period | $ | 14.60 | $ | 14.63 | $ | 13.76 | $ | 12.17 | $ | 10.33 | $ | 9.32 | |||||||||||||||
| Total return (c) | 24.77 | %(d)(e) | 24.31 | %(d) | 16.31 | %(d) | 18.40 | %(d) | 11.39 | %(d)(f) | (10.28 | )% | |||||||||||||||
| Ratios/Supplemental data: | |||||||||||||||||||||||||||
| Net assets, end of period (000's) | $ | 120,314 | $ | 105,738 | $ | 136,144 | $ | 152,251 | $ | 58,488 | $ | 20,616 | |||||||||||||||
| Ratio of net operating expenses to average net assets | 0.75 | % | 0.75 | % | 0.75 | % | 0.75 | % | 0.93 | %(g)(h) | 1.31 | %(h) | |||||||||||||||
| Ratio of interest expense to average net assets | 0.01 | % | 0.01 | % | - | - | - | - | |||||||||||||||||||
| Ratio of net expenses to average net assets | 0.76 | % | 0.76 | % | 0.75 | % | 0.75 | % | 0.93 | %(g)(h) | 1.31 | %(h) | |||||||||||||||
| Ratio of net investment income to average net assets | 1.87 | % | 1.84 | % | 1.47 | % | 1.16 | % | 1.50 | %(g)(h) | 0.21 | %(h) | |||||||||||||||
| Waiver/reimbursement | 0.07 | % | 0.06 | % | 0.03 | % | 0.05 | % | 0.06 | %(g) | - | ||||||||||||||||
| Portfolio turnover rate | 80 | % | 86 | % | 68 | % | 91 | % | 59 | %(f) | 111 | % | |||||||||||||||
(a) The Fund changed its fiscal year end from October 31 to July 31.
(b) Per share data was calculated using the average shares outstanding during the period.
(c) Total return at net asset value assuming all distributions reinvested.
(d) Had the investment advisor and/or any of its affiliates not waived or reimbursed a portion of expenses, total return would have been reduced.
(e) Total return includes a voluntary reimbursement by the investment advisor for a realized investment loss due to a trading error. This reimbursement had an impact of less than 0.01% on the Fund's total return.
(f) Not annualized.
(g) Annualized.
(h) The benefits derived from custody credits had an impact of less than 0.01%.
See Accompanying Notes to Financial Statements.
45
CMG ENHANCED S&P 500® INDEX FUND
A Portfolio of Columbia Funds Institutional Trust
SCHEDULE OF INVESTMENTS
July 31, 2007
| Shares | Value | ||||||||||
| Common Stocks (97.9%) | |||||||||||
| Consumer Discretionary (9.6%) | |||||||||||
| Automobiles (1.0%) | |||||||||||
| General Motors Corp. (a) | 50,300 | $ | 1,629,720 | ||||||||
| Harley-Davidson, Inc. (a) | 8,200 | 470,024 | |||||||||
| 2,099,744 | |||||||||||
| Diversified Consumer Services (0.2%) | |||||||||||
| Apollo Group, Inc., Class A (b) | 8,400 | 496,524 | |||||||||
| Hotels, Restaurants & Leisure (1.8%) | |||||||||||
| Darden Restaurants, Inc. | 16,200 | 689,634 | |||||||||
| Marriott International, Inc., Class A | 21,900 | 909,945 | |||||||||
| McDonald's Corp. | 20,200 | 966,974 | |||||||||
| Starbucks Corp. (b) | 4,600 | 122,728 | |||||||||
| Wyndham Worldwide Corp. (a)(b) | 17,700 | 595,605 | |||||||||
| Yum! Brands, Inc. | 21,000 | 672,840 | |||||||||
| 3,957,726 | |||||||||||
| Internet & Catalog Retail (0.1%) | |||||||||||
| Amazon.com, Inc. (a)(b) | 1,600 | 125,664 | |||||||||
| IAC/InterActiveCorp (b) | 5,400 | 155,196 | |||||||||
| 280,860 | |||||||||||
| Leisure Equipment & Products (0.4%) | |||||||||||
| Mattel, Inc. | 37,900 | 868,289 | |||||||||
| Media (3.1%) | |||||||||||
| CBS Corp., Class B | 19,300 | 612,196 | |||||||||
| DIRECTV Group, Inc. (b) | 111,700 | 2,503,197 | |||||||||
| Gannett Co., Inc. | 4,900 | 244,510 | |||||||||
| McGraw-Hill Companies, Inc. | 6,500 | 393,250 | |||||||||
| Time Warner, Inc. | 38,100 | 733,806 | |||||||||
| Viacom, Inc., Class B (b) | 27,500 | 1,053,250 | |||||||||
| Walt Disney Co. | 43,000 | 1,419,000 | |||||||||
| 6,959,209 | |||||||||||
| Multiline Retail (1.4%) | |||||||||||
| J.C. Penney Co., Inc. (a) | 17,400 | 1,183,896 | |||||||||
| Kohl's Corp. (b) | 21,100 | 1,282,880 | |||||||||
| Nordstrom, Inc. | 15,000 | 713,700 | |||||||||
| 3,180,476 | |||||||||||
| Specialty Retail (1.0%) | |||||||||||
| AutoNation, Inc. (a)(b) | 27,100 | 527,908 | |||||||||
| Autozone, Inc. (b) | 1,800 | 228,258 | |||||||||
| Home Depot, Inc. | 21,700 | 806,589 | |||||||||
| Lowe's Companies, Inc. | 100 | 2,801 | |||||||||
| RadioShack Corp. (a) | 18,500 | 464,905 | |||||||||
| Sherwin-Williams Co. | 1,700 | 118,473 | |||||||||
| 2,148,934 | |||||||||||
| Textiles, Apparel & Luxury Goods (0.6%) | |||||||||||
| Coach, Inc. (b) | 28,300 | 1,286,518 | |||||||||
| 21,278,280 | |||||||||||
See Accompanying Notes to Financial Statements.
46
CMG ENHANCED S&P 500® INDEX FUND
A Portfolio of Columbia Funds Institutional Trust
SCHEDULE OF INVESTMENTS
| Shares | Value | ||||||||||
| Common Stocks (continued) | |||||||||||
| Consumer Staples (9.3%) | |||||||||||
| Beverages (1.1%) | |||||||||||
| Coca-Cola Co. | 27,100 | $ | 1,412,181 | ||||||||
| PepsiCo, Inc. | 15,600 | 1,023,672 | |||||||||
| 2,435,853 | |||||||||||
| Food & Staples Retailing (2.3%) | |||||||||||
| CVS Caremark Corp. | 65,600 | 2,308,464 | |||||||||
| Kroger Co. | 33,800 | 877,448 | |||||||||
| Safeway, Inc. | 7,000 | 223,090 | |||||||||
| Sysco Corp. | 10,900 | 347,492 | |||||||||
| Wal-Mart Stores, Inc. | 28,400 | 1,304,980 | |||||||||
| 5,061,474 | |||||||||||
| Food Products (2.2%) | |||||||||||
| Campbell Soup Co. | 15,200 | 559,816 | |||||||||
| ConAgra Foods, Inc. | 18,400 | 466,440 | |||||||||
| Dean Foods Co. (a) | 16,800 | 483,336 | |||||||||
| General Mills, Inc. | 36,400 | 2,024,568 | |||||||||
| Sara Lee Corp. | 90,300 | 1,431,255 | |||||||||
| 4,965,415 | |||||||||||
| Household Products (1.7%) | |||||||||||
| Clorox Co. | 7,600 | 459,496 | |||||||||
| Colgate-Palmolive Co. | 11,000 | 726,000 | |||||||||
| Procter & Gamble Co. | 40,700 | 2,517,702 | |||||||||
| 3,703,198 | |||||||||||
| Personal Products (0.2%) | |||||||||||
| Estee Lauder Companies, Inc., Class A (a) | 9,800 | 441,196 | |||||||||
| Tobacco (1.8%) | |||||||||||
| Altria Group, Inc. | 34,600 | 2,299,862 | |||||||||
| Reynolds American, Inc. (a) | 28,700 | 1,755,579 | |||||||||
| 4,055,441 | |||||||||||
| 20,662,577 | |||||||||||
| Energy (11.0%) | |||||||||||
| Energy Equipment & Services (1.0%) | |||||||||||
| BJ Services Co. | 36,300 | 949,245 | |||||||||
| Halliburton Co. | 26,100 | 940,122 | |||||||||
| Schlumberger Ltd. | 4,500 | 426,240 | |||||||||
| 2,315,607 | |||||||||||
| Oil, Gas & Consumable Fuels (10.0%) | |||||||||||
| Chevron Corp. | 49,200 | 4,194,792 | |||||||||
| ConocoPhillips | 20,500 | 1,657,220 | |||||||||
| Exxon Mobil Corp. | 106,600 | 9,074,858 | |||||||||
| Hess Corp. | 500 | 30,600 | |||||||||
| Marathon Oil Corp. | 59,800 | 3,300,960 | |||||||||
| Occidental Petroleum Corp. | 8,300 | 470,776 | |||||||||
See Accompanying Notes to Financial Statements.
47
CMG ENHANCED S&P 500® INDEX FUND
A Portfolio of Columbia Funds Institutional Trust
SCHEDULE OF INVESTMENTS
| Shares | Value | ||||||||||
| Common Stocks (continued) | |||||||||||
| Oil, Gas & Consumable Fuels (continued) | |||||||||||
| Sunoco, Inc. | 13,700 | $ | 914,064 | ||||||||
| Valero Energy Corp. | 39,400 | 2,640,194 | |||||||||
| 22,283,464 | |||||||||||
| 24,599,071 | |||||||||||
| Financials (19.4%) | |||||||||||
| Capital Markets (6.2%) | |||||||||||
| Bear Stearns Companies, Inc. (a) | 15,500 | 1,878,910 | |||||||||
| Charles Schwab Corp. | 28,100 | 565,653 | |||||||||
| E*TRADE Financial Corp. (b) | 2,900 | 53,708 | |||||||||
| Goldman Sachs Group, Inc. (a) | 20,500 | 3,860,970 | |||||||||
| Lehman Brothers Holdings, Inc. | 34,500 | 2,139,000 | |||||||||
| Merrill Lynch & Co., Inc. | 42,300 | 3,138,660 | |||||||||
| Morgan Stanley | 33,700 | 2,152,419 | |||||||||
| Northern Trust Corp. | 500 | 31,230 | |||||||||
| 13,820,550 | |||||||||||
| Commercial Banks (1.9%) | |||||||||||
| BB&T Corp. | 4,900 | 183,358 | |||||||||
| Fifth Third Bancorp (a) | 10,700 | 394,723 | |||||||||
| Regions Financial Corp. | 2,500 | 75,175 | |||||||||
| SunTrust Banks, Inc. | 4,500 | 352,350 | |||||||||
| U.S. Bancorp | 24,700 | 739,765 | |||||||||
| Wachovia Corp. | 27,400 | 1,293,554 | |||||||||
| Wells Fargo & Co. | 34,600 | 1,168,442 | |||||||||
| 4,207,367 | |||||||||||
| Consumer Finance (0.3%) | |||||||||||
| American Express Co. | 9,800 | 573,692 | |||||||||
| Discover Financial Services (b) | 9,600 | 221,280 | |||||||||
| 794,972 | |||||||||||
| Diversified Financial Services (4.4%) | |||||||||||
| CIT Group, Inc. | 5,600 | 230,608 | |||||||||
| Citigroup, Inc. | 109,600 | 5,104,072 | |||||||||
| JPMorgan Chase & Co. | 102,400 | 4,506,624 | |||||||||
| 9,841,304 | |||||||||||
| Insurance (5.6%) | |||||||||||
| ACE Ltd. | 3,000 | 173,160 | |||||||||
| Allstate Corp. | 49,200 | 2,614,980 | |||||||||
| Ambac Financial Group, Inc. | 900 | 60,435 | |||||||||
| American International Group, Inc. | 53,400 | 3,427,212 | |||||||||
| Genworth Financial, Inc., Class A (a) | 1,300 | 39,676 | |||||||||
| Hartford Financial Services Group, Inc. | 1,400 | 128,618 | |||||||||
| Loews Corp. | 10,200 | 483,480 | |||||||||
| MBIA, Inc. (a) | 5,700 | 319,770 | |||||||||
| MetLife, Inc. | 15,500 | 933,410 | |||||||||
| Principal Financial Group, Inc. | 2,500 | 140,975 | |||||||||
| Prudential Financial, Inc. | 10,500 | 930,615 | |||||||||
| SAFECO Corp. | 15,900 | 929,673 | |||||||||
See Accompanying Notes to Financial Statements.
48
CMG ENHANCED S&P 500® INDEX FUND
A Portfolio of Columbia Funds Institutional Trust
SCHEDULE OF INVESTMENTS
| Shares | Value | ||||||||||
| Common Stocks (continued) | |||||||||||
| Insurance (continued) | |||||||||||
| Travelers Companies, Inc. | 30,900 | $ | 1,569,102 | ||||||||
| XL Capital Ltd., Class A | 8,700 | 677,382 | |||||||||
| 12,428,488 | |||||||||||
| Real Estate Investment Trusts (REITs) (0.2%) | |||||||||||
| Plum Creek Timber Co., Inc. (a) | 5,800 | 225,388 | |||||||||
| ProLogis | 2,600 | 147,940 | |||||||||
| 373,328 | |||||||||||
| Thrifts & Mortgage Finance (0.8%) | |||||||||||
| Countrywide Financial Corp. | 28,500 | 802,845 | |||||||||
| Fannie Mae | 5,400 | 323,136 | |||||||||
| Freddie Mac | 8,000 | 458,160 | |||||||||
| Hudson City Bancorp, Inc. (a) | 8,300 | 101,426 | |||||||||
| MGIC Investment Corp. (a) | 1,000 | 38,660 | |||||||||
| Washington Mutual, Inc. (a) | 3,300 | 123,849 | |||||||||
| 1,848,076 | |||||||||||
| 43,314,085 | |||||||||||
| Health Care (11.5%) | |||||||||||
| Biotechnology (1.6%) | |||||||||||
| Amgen, Inc. (b) | 40,300 | 2,165,722 | |||||||||
| Biogen Idec, Inc. (a)(b) | 3,200 | 180,928 | |||||||||
| Gilead Sciences, Inc. (b) | 34,800 | 1,295,604 | |||||||||
| 3,642,254 | |||||||||||
| Health Care Equipment & Supplies (0.8%) | |||||||||||
| Covidien Ltd. (b) | 6,700 | 274,365 | |||||||||
| Medtronic, Inc. | 23,400 | 1,185,678 | |||||||||
| Zimmer Holdings, Inc. (b) | 2,400 | 186,624 | |||||||||
| 1,646,667 | |||||||||||
| Health Care Providers & Services (3.9%) | |||||||||||
| Aetna, Inc. | 17,800 | 855,646 | |||||||||
| AmerisourceBergen Corp. | 35,600 | 1,677,116 | |||||||||
| CIGNA Corp. | 13,000 | 671,320 | |||||||||
| Coventry Health Care, Inc. (b) | 10,500 | 586,005 | |||||||||
| Express Scripts, Inc. (b) | 1,200 | 60,156 | |||||||||
| Humana, Inc. (b) | 23,400 | 1,499,706 | |||||||||
| McKesson Corp. | 3,800 | 219,488 | |||||||||
| Quest Diagnostics, Inc. (a) | 6,000 | 332,820 | |||||||||
| UnitedHealth Group, Inc. | 8,300 | 401,969 | |||||||||
| WellPoint, Inc. (b) | 32,600 | 2,448,912 | |||||||||
| 8,753,138 | |||||||||||
| Health Care Technology (0.0%) | |||||||||||
| IMS Health, Inc. | 1,700 | 47,821 | |||||||||
| Life Sciences Tools & Services (0.1%) | |||||||||||
| PerkinElmer, Inc. | 100 | 2,783 | |||||||||
| Waters Corp. (b) | 3,700 | 215,562 | |||||||||
| 218,345 | |||||||||||
See Accompanying Notes to Financial Statements.
49
CMG ENHANCED S&P 500® INDEX FUND
A Portfolio of Columbia Funds Institutional Trust
SCHEDULE OF INVESTMENTS
| Shares | Value | ||||||||||
| Common Stocks (continued) | |||||||||||
| Pharmaceuticals (5.1%) | |||||||||||
| Abbott Laboratories | 22,200 | $ | 1,125,318 | ||||||||
| Forest Laboratories, Inc. (b) | 70,400 | 2,830,080 | |||||||||
| Johnson & Johnson | 58,000 | 3,509,000 | |||||||||
| King Pharmaceuticals, Inc. (b) | 9,000 | 153,090 | |||||||||
| Merck & Co., Inc. | 18,600 | 923,490 | |||||||||
| Pfizer, Inc. | 113,900 | 2,677,789 | |||||||||
| 11,218,767 | |||||||||||
| 25,526,992 | |||||||||||
| Industrials (11.3%) | |||||||||||
| Aerospace & Defense (5.0%) | |||||||||||
| Boeing Co. | 12,100 | 1,251,503 | |||||||||
| General Dynamics Corp. | 6,200 | 487,072 | |||||||||
| Honeywell International, Inc. | 26,000 | 1,495,260 | |||||||||
| L-3 Communications Holdings, Inc. | 4,900 | 478,044 | |||||||||
| Lockheed Martin Corp. | 32,900 | 3,239,992 | |||||||||
| Northrop Grumman Corp. | 22,300 | 1,697,030 | |||||||||
| Raytheon Co. | 33,400 | 1,849,024 | |||||||||
| United Technologies Corp. | 10,500 | 766,185 | |||||||||
| 11,264,110 | |||||||||||
| Air Freight & Logistics (0.7%) | |||||||||||
| C.H. Robinson Worldwide, Inc. (a) | 800 | 38,920 | |||||||||
| FedEx Corp. | 1,400 | 155,036 | |||||||||
| United Parcel Service, Inc., Class B (a) | 17,600 | 1,332,672 | |||||||||
| 1,526,628 | |||||||||||
| Commercial Services & Supplies (0.0%) | |||||||||||
| Robert Half International, Inc. (a) | 700 | �� | 23,793 | ||||||||
| Electrical Equipment (0.6%) | |||||||||||
| Cooper Industries Ltd., Class A | 3,600 | 190,512 | |||||||||
| Emerson Electric Co. | 15,300 | 720,171 | |||||||||
| Rockwell Automation, Inc. (a) | 5,100 | 356,949 | |||||||||
| 1,267,632 | |||||||||||
| Industrial Conglomerates (3.3%) | |||||||||||
| 3M Co. | 38,500 | 3,423,420 | |||||||||
| General Electric Co. | 93,600 | 3,627,936 | |||||||||
| Tyco International Ltd. | 6,700 | 316,843 | |||||||||
| 7,368,199 | |||||||||||
| Machinery (1.1%) | |||||||||||
| Caterpillar, Inc. (a) | 700 | 55,160 | |||||||||
| Cummins, Inc. | 2,600 | 308,620 | |||||||||
| Danaher Corp. | 600 | 44,808 | |||||||||
| Illinois Tool Works, Inc. (a) | 4,700 | 258,735 | |||||||||
| Ingersoll-Rand Co., Ltd., Class A | 8,800 | 442,816 | |||||||||
| ITT Corp. | 8,800 | 553,344 | |||||||||
| Parker Hannifin Corp. | 1,200 | 118,416 | |||||||||
| Terex Corp. (b) | 6,700 | 577,875 | |||||||||
| 2,359,774 | |||||||||||
| Road & Rail (0.5%) | |||||||||||
| Ryder System, Inc. (a) | 20,600 | 1,120,022 | |||||||||
See Accompanying Notes to Financial Statements.
50
CMG ENHANCED S&P 500® INDEX FUND
A Portfolio of Columbia Funds Institutional Trust
SCHEDULE OF INVESTMENTS
| Shares | Value | ||||||||||
| Common Stocks (continued) | |||||||||||
| Trading Companies & Distributors (0.1%) | |||||||||||
| W.W. Grainger, Inc. | 1,600 | $ | 139,776 | ||||||||
| 25,069,934 | |||||||||||
| Information Technology (15.8%) | |||||||||||
| Communications Equipment (2.7%) | |||||||||||
| Cisco Systems, Inc. (b) | 173,700 | 5,021,667 | |||||||||
| Motorola, Inc. | 24,500 | 416,255 | |||||||||
| QUALCOMM, Inc. | 16,500 | 687,225 | |||||||||
| 6,125,147 | |||||||||||
| Computers & Peripherals (3.9%) | |||||||||||
| Apple Computer, Inc. (b) | 11,600 | 1,528,416 | |||||||||
| Dell, Inc. (b) | 38,400 | 1,074,048 | |||||||||
| Hewlett-Packard Co. | 43,100 | 1,983,893 | |||||||||
| International Business Machines Corp. | 29,200 | 3,230,980 | |||||||||
| Lexmark International, Inc., Class A (a)(b) | 25,100 | 992,454 | |||||||||
| 8,809,791 | |||||||||||
| Electronic Equipment & Instruments (0.1%) | |||||||||||
| Tyco Electronics Ltd. (b) | 6,200 | 222,084 | |||||||||
| Internet Software & Services (0.3%) | |||||||||||
| eBay, Inc. (b) | 18,600 | 602,640 | |||||||||
| IT Services (0.2%) | |||||||||||
| Fiserv, Inc. (b) | 4,700 | 232,274 | |||||||||
| Western Union Co. | 7,700 | 153,615 | |||||||||
| 385,889 | |||||||||||
| Semiconductors & Semiconductor Equipment (3.2%) | |||||||||||
| Applied Materials, Inc. (a) | 165,500 | 3,647,620 | |||||||||
| Intel Corp. | 61,100 | 1,443,182 | |||||||||
| MEMC Electronic Materials, Inc. (b) | 1,400 | 85,848 | |||||||||
| National Semiconductor Corp. | 200 | 5,198 | |||||||||
| Novellus Systems, Inc. (a)(b) | 4,200 | 119,784 | |||||||||
| Texas Instruments, Inc. | 49,200 | 1,731,348 | |||||||||
| 7,032,980 | |||||||||||
| Software (5.4%) | |||||||||||
| Autodesk, Inc. (b) | 25,700 | 1,088,909 | |||||||||
| Compuware Corp. (b) | 25,100 | 234,183 | |||||||||
| Microsoft Corp. (c) | 235,000 | 6,812,650 | |||||||||
| Oracle Corp. (b) | 184,100 | 3,519,992 | |||||||||
| Symantec Corp. (b) | 22,000 | 422,400 | |||||||||
| 12,078,134 | |||||||||||
| 35,256,665 | |||||||||||
| Materials (3.1%) | |||||||||||
| Chemicals (0.8%) | |||||||||||
| Dow Chemical Co. | 26,700 | 1,160,916 | |||||||||
| E.I. Du Pont de Nemours & Co. | 5,000 | 233,650 | |||||||||
| Ecolab, Inc. | 7,900 | 332,669 | |||||||||
| 1,727,235 | |||||||||||
See Accompanying Notes to Financial Statements.
51
CMG ENHANCED S&P 500® INDEX FUND
A Portfolio of Columbia Funds Institutional Trust
SCHEDULE OF INVESTMENTS
| Shares | Value | ||||||||||
| Common Stocks (continued) | |||||||||||
| Containers & Packaging (0.2%) | |||||||||||
| Pactiv Corp. (b) | 16,600 | $ | 524,726 | ||||||||
| Metals & Mining (1.2%) | |||||||||||
| Alcoa, Inc. | 13,000 | 496,600 | |||||||||
| Allegheny Technologies, Inc. | 1,400 | 146,902 | |||||||||
| Nucor Corp. | 28,900 | 1,450,780 | |||||||||
| United States Steel Corp. | 5,300 | 520,937 | |||||||||
| 2,615,219 | |||||||||||
| Paper & Forest Products (0.9%) | |||||||||||
| International Paper Co. (a) | 55,200 | 2,046,264 | |||||||||
| 6,913,444 | |||||||||||
| Telecommunication Services (3.6%) | |||||||||||
| Diversified Telecommunication Services (3.2%) | |||||||||||
| AT&T, Inc. | 72,900 | 2,854,764 | |||||||||
| CenturyTel, Inc. | 15,000 | 688,050 | |||||||||
| Embarq Corp. | 4,600 | 284,234 | |||||||||
| Qwest Communications International, Inc. (b) | 2,900 | 24,737 | |||||||||
| Verizon Communications, Inc. | 79,500 | 3,388,290 | |||||||||
| 7,240,075 | |||||||||||
| Wireless Telecommunication Services (0.4%) | |||||||||||
| Sprint Nextel Corp. | 38,800 | 796,564 | |||||||||
| 8,036,639 | |||||||||||
| Utilities (3.3%) | |||||||||||
| Electric Utilities (2.1%) | |||||||||||
| Edison International | 19,700 | 1,041,933 | |||||||||
| Exelon Corp. | 3,200 | 224,480 | |||||||||
| FirstEnergy Corp. | 38,400 | 2,332,800 | |||||||||
| FPL Group, Inc. | 19,600 | 1,131,508 | |||||||||
| Progress Energy, Inc. (a) | 600 | 26,196 | |||||||||
| 4,756,917 | |||||||||||
| Independent Power Producers & Energy Traders (0.5%) | |||||||||||
| Constellation Energy Group, Inc. | 13,700 | 1,148,060 | |||||||||
| Multi-Utilities (0.7%) | |||||||||||
| CenterPoint Energy, Inc. (a) | 38,500 | 634,480 | |||||||||
| NiSource, Inc. | 4,900 | 93,443 | |||||||||
| PG&E Corp. | 1,200 | 51,372 | |||||||||
| Public Service Enterprise Group, Inc. | 8,500 | 732,275 | |||||||||
| 1,511,570 | |||||||||||
| 7,416,547 | |||||||||||
| Total Common Stocks (Cost of $205,029,810) | 218,074,234 | ||||||||||
| Securities Lending Collateral (8.6%) | |||||||||||
| State Street Navigator Securities Lending Prime Portfolio (d) | |||||||||||
| (seven day yield of 5.27%) | 19,240,697 | 19,240,697 | |||||||||
| Total Securities Lending Collateral (Cost of $19,240,697) | 19,240,697 | ||||||||||
See Accompanying Notes to Financial Statements.
52
CMG ENHANCED S&P 500® INDEX FUND
A Portfolio of Columbia Funds Institutional Trust
SCHEDULE OF INVESTMENTS
| Par | Value | ||||||||||
| Short-Term Obligation (2.1%) | |||||||||||
| Repurchase agreement with Fixed Income Clearing Corp., dated 07/31/07, due 08/01/07 at 5.030%, collateralized by a U.S. Treasury Obligation maturing 11/30/11, market value of $4,606,488 (repurchase proceeds $4,513,631) | $ | 4,513,000 | $ | 4,513,000 | |||||||
| Total Short-Term Obligation (Cost of $4,513,000) | 4,513,000 | ||||||||||
| Total Investments (108.6%) (Cost of $228,783,507) (e) | 241,827,931 | ||||||||||
| Other Assets & Liabilities, Net (-8.6%) | (19,129,852 | ) | |||||||||
| Net Assets (100.0%) | $ | 222,698,079 | |||||||||
Notes to Schedule of Investments:
(a) All or a portion of this security was on loan at July 31, 2007. The total market value of securities on loan at July 31, 2007 was $18,527,372.
(b) Non-income producing security.
(c) The security or a portion of the security is pledged as collateral for open futures contracts. At July 31, 2007, the total market value of securities pledged amounted to $985,660.
(d) Investment made with cash collateral received from securities lending activity.
(e) Cost for federal income tax purposes is $229,128,000.
At July 31, 2007, the Fund held the following open long futures contracts:
| Type | Number of Contracts | Value | Aggregate Face Value | Expiration Date | Unrealized Depreciation | ||||||||||||||||||
| S&P 500® Index | 12 | $ | 4,385,700 | $ | 4,532,432 | Sep-2007 | $ | (146,732 | ) | ||||||||||||||
At July 31, 2007, the Fund held investments in the following sectors:
| Sector (Unaudited) | % of Net Assets | ||||||
| Financials | 19.4 | ||||||
| Information Technology | 15.8 | ||||||
| Health Care | 11.5 | ||||||
| Industrials | 11.3 | ||||||
| Energy | 11.0 | ||||||
| Consumer Discretionary | 9.6 | ||||||
| Consumer Staples | 9.3 | ||||||
| Telecommunication Services | 3.6 | ||||||
| Utilities | 3.3 | ||||||
| Materials | 3.1 | ||||||
| 97.9 | |||||||
| Securities Lending Collateral | 8.6 | ||||||
| Short-Term Obligation | 2.1 | ||||||
| Other Assets & Liabilities, Net | (8.6 | ) | |||||
| 100.0 | |||||||
See Accompanying Notes to Financial Statements.
53
CMG LARGE CAP GROWTH FUND
A Portfolio of Columbia Funds Institutional Trust
SCHEDULE OF INVESTMENTS
July 31, 2007
| Shares | Value | ||||||||||
| Common Stocks (97.4%) | |||||||||||
| Consumer Discretionary (12.0%) | |||||||||||
| Auto Components (0.7%) | |||||||||||
| Goodyear Tire & Rubber Co. (a) | 13,790 | $ | 396,049 | ||||||||
| Hotels, Restaurants & Leisure (1.9%) | |||||||||||
| Las Vegas Sands Corp. (a) | 5,058 | 441,311 | |||||||||
| Starwood Hotels & Resorts Worldwide, Inc. | 10,820 | 681,227 | |||||||||
| 1,122,538 | |||||||||||
| Household Durables (0.4%) | |||||||||||
| Sony Corp., ADR | 4,960 | 261,590 | |||||||||
| Internet & Catalog Retail (1.0%) | |||||||||||
| Amazon.com, Inc. (a) | 7,290 | 572,557 | |||||||||
| Media (2.5%) | |||||||||||
| Lamar Advertising Co., Class A | 6,210 | 369,681 | |||||||||
| Time Warner, Inc. | 23,730 | 457,040 | |||||||||
| Viacom, Inc., Class B (a) | 16,950 | 649,185 | |||||||||
| 1,475,906 | |||||||||||
| Multiline Retail (2.2%) | |||||||||||
| Nordstrom, Inc. | 12,580 | 598,556 | |||||||||
| Target Corp. | 11,740 | 711,092 | |||||||||
| 1,309,648 | |||||||||||
| Specialty Retail (1.8%) | |||||||||||
| GameStop Corp., Class A (a) | 16,640 | 671,424 | |||||||||
| Lowe's Companies, Inc. | 14,590 | 408,666 | |||||||||
| 1,080,090 | |||||||||||
| Textiles, Apparel & Luxury Goods (1.5%) | |||||||||||
| NIKE, Inc., Class B | 10,330 | 583,128 | |||||||||
| Polo Ralph Lauren Corp. | 3,340 | 298,429 | |||||||||
| 881,557 | |||||||||||
| 7,099,935 | |||||||||||
| Consumer Staples (10.0%) | |||||||||||
| Beverages (3.5%) | |||||||||||
| Coca-Cola Co. | 13,780 | 718,076 | |||||||||
| Fomento Economico Mexicano SAB de CV, ADR | 7,170 | 265,433 | |||||||||
| PepsiCo, Inc. | 16,070 | 1,054,513 | |||||||||
| 2,038,022 | |||||||||||
| Food & Staples Retailing (3.4%) | |||||||||||
| CVS Caremark Corp. | 23,410 | 823,798 | |||||||||
| Kroger Co. | 18,520 | 480,779 | |||||||||
| Wal-Mart Stores, Inc. | 15,710 | 721,875 | |||||||||
| 2,026,452 | |||||||||||
See Accompanying Notes to Financial Statements.
54
CMG LARGE CAP GROWTH FUND
A Portfolio of Columbia Funds Institutional Trust
SCHEDULE OF INVESTMENTS
| Shares | Value | ||||||||||
| Common Stocks (continued) | |||||||||||
| Household Products (1.1%) | |||||||||||
| Colgate-Palmolive Co. | 10,010 | $ | 660,660 | ||||||||
| Personal Products (0.9%) | |||||||||||
| Avon Products, Inc. | 14,700 | 529,347 | |||||||||
| Tobacco (1.1%) | |||||||||||
| Altria Group, Inc. | 9,930 | 660,047 | |||||||||
| 5,914,528 | |||||||||||
| Energy (7.7%) | |||||||||||
| Energy Equipment & Services (4.1%) | |||||||||||
| GlobalSantaFe Corp. | 6,180 | 443,168 | |||||||||
| Halliburton Co. | 19,710 | 709,954 | |||||||||
| Schlumberger Ltd. | 4,470 | 423,398 | |||||||||
| Transocean, Inc. (a) | 7,740 | 831,663 | |||||||||
| 2,408,183 | |||||||||||
| Oil, Gas & Consumable Fuels (3.6%) | |||||||||||
| Devon Energy Corp. | 5,750 | 429,008 | |||||||||
| Hess Corp. | 13,160 | 805,392 | |||||||||
| Southwestern Energy Co. (a) | 8,730 | 354,700 | |||||||||
| XTO Energy, Inc. | 9,410 | 513,127 | |||||||||
| 2,102,227 | |||||||||||
| 4,510,410 | |||||||||||
| Financials (6.7%) | |||||||||||
| Capital Markets (2.4%) | |||||||||||
| Goldman Sachs Group, Inc. | 2,890 | 544,303 | |||||||||
| State Street Corp. | 13,370 | 896,191 | |||||||||
| 1,440,494 | |||||||||||
| Consumer Finance (1.5%) | |||||||||||
| American Express Co. | 14,670 | 858,782 | |||||||||
| Diversified Financial Services (1.2%) | |||||||||||
| CME Group, Inc. | 1,230 | 679,575 | |||||||||
| Insurance (1.6%) | |||||||||||
| ACE Ltd. | 7,210 | 416,161 | |||||||||
| American International Group, Inc. | 8,450 | 542,321 | |||||||||
| 958,482 | |||||||||||
| 3,937,333 | |||||||||||
| Health Care (15.4%) | |||||||||||
| Biotechnology (2.9%) | |||||||||||
| BioMarin Pharmaceuticals, Inc. (a) | 17,260 | 311,716 | |||||||||
| Celgene Corp. (a) | 9,770 | 591,671 | |||||||||
| Genentech, Inc. (a) | 4,930 | 366,693 | |||||||||
| Gilead Sciences, Inc. (a) | 11,020 | 410,275 | |||||||||
| 1,680,355 | |||||||||||
See Accompanying Notes to Financial Statements.
55
CMG LARGE CAP GROWTH FUND
A Portfolio of Columbia Funds Institutional Trust
SCHEDULE OF INVESTMENTS
| Shares | Value | ||||||||||
| Common Stocks (continued) | |||||||||||
| Health Care Equipment & Supplies (2.6%) | |||||||||||
| C.R. Bard, Inc. | 7,130 | $ | 559,491 | ||||||||
| Cytyc Corp. (a) | 14,080 | 592,768 | |||||||||
| Zimmer Holdings, Inc. (a) | 5,010 | 389,578 | |||||||||
| 1,541,837 | |||||||||||
| Health Care Providers & Services (2.6%) | |||||||||||
| Express Scripts, Inc. (a) | 16,420 | 823,135 | |||||||||
| McKesson Corp. | 12,620 | 728,931 | |||||||||
| 1,552,066 | |||||||||||
| Life Sciences Tools & Services (1.4%) | |||||||||||
| Thermo Fisher Scientific, Inc. (a) | 15,960 | 833,271 | |||||||||
| Pharmaceuticals (5.9%) | |||||||||||
| Abbott Laboratories | 11,460 | 580,907 | |||||||||
| Johnson & Johnson | 13,370 | 808,885 | |||||||||
| Merck & Co., Inc. | 23,340 | 1,158,831 | |||||||||
| Schering-Plough Corp. | 32,550 | 928,977 | |||||||||
| 3,477,600 | |||||||||||
| 9,085,129 | |||||||||||
| Industrials (13.2%) | |||||||||||
| Aerospace & Defense (4.6%) | |||||||||||
| Boeing Co. | 6,240 | 645,403 | |||||||||
| Goodrich Corp. | 12,310 | 774,422 | |||||||||
| Honeywell International, Inc. | 7,260 | 417,523 | |||||||||
| United Technologies Corp. | 12,080 | 881,478 | |||||||||
| 2,718,826 | |||||||||||
| Commercial Services & Supplies (1.8%) | |||||||||||
| Equifax, Inc. | 11,600 | 469,336 | |||||||||
| Waste Management, Inc. | 15,440 | 587,183 | |||||||||
| 1,056,519 | |||||||||||
| Electrical Equipment (0.7%) | |||||||||||
| Suntech Power Holdings Co., Ltd., ADR (a) | 9,590 | 386,765 | |||||||||
| Industrial Conglomerates (2.6%) | |||||||||||
| 3M Co. | 10,430 | 927,435 | |||||||||
| General Electric Co. | 15,530 | 601,943 | |||||||||
| 1,529,378 | |||||||||||
| Machinery (2.8%) | |||||||||||
| Caterpillar, Inc. | 6,430 | 506,684 | |||||||||
| Eaton Corp. | 8,710 | 846,438 | |||||||||
| Parker Hannifin Corp. | 3,020 | 298,014 | |||||||||
| 1,651,136 | |||||||||||
| Trading Companies & Distributors (0.7%) | |||||||||||
| W.W. Grainger, Inc. | 4,790 | 418,454 | |||||||||
| 7,761,078 | |||||||||||
See Accompanying Notes to Financial Statements.
56
CMG LARGE CAP GROWTH FUND
A Portfolio of Columbia Funds Institutional Trust
SCHEDULE OF INVESTMENTS
| Shares | Value | ||||||||||
| Common Stocks (continued) | |||||||||||
| Information Technology (26.6%) | |||||||||||
| Communications Equipment (5.8%) | |||||||||||
| Cisco Systems, Inc. (a) | 63,640 | $ | 1,839,832 | ||||||||
| Corning, Inc. | 28,220 | 672,765 | |||||||||
| QUALCOMM, Inc. | 15,750 | 655,987 | |||||||||
| Riverbed Technology, Inc. (a) | 6,130 | 270,701 | |||||||||
| 3,439,285 | |||||||||||
| Computers & Peripherals (5.1%) | |||||||||||
| Apple, Inc. (a) | 3,240 | 426,902 | |||||||||
| Dell, Inc. (a) | 18,520 | 518,005 | |||||||||
| EMC Corp. | 21,920 | 405,739 | |||||||||
| Hewlett-Packard Co. | 16,100 | 741,083 | |||||||||
| International Business Machines Corp. | 8,260 | 913,969 | |||||||||
| 3,005,698 | |||||||||||
| Electronic Equipment & Instruments (0.8%) | |||||||||||
| Agilent Technologies, Inc. (a) | 12,890 | 491,754 | |||||||||
| Internet Software & Services (4.4%) | |||||||||||
| eBay, Inc. (a) | 21,760 | 705,024 | |||||||||
| Google, Inc., Class A (a) | 3,648 | 1,860,480 | |||||||||
| 2,565,504 | |||||||||||
| Semiconductors & Semiconductor Equipment (5.2%) | |||||||||||
| ASML Holding N.V., N.Y. Registered Shares (a) | 7,740 | 228,794 | |||||||||
| Intel Corp. | 54,180 | 1,279,732 | |||||||||
| MEMC Electronic Materials, Inc. (a) | 9,980 | 611,974 | |||||||||
| Tessera Technologies, Inc. (a) | 6,950 | 285,853 | |||||||||
| Texas Instruments, Inc. | 19,100 | 672,129 | |||||||||
| 3,078,482 | |||||||||||
| Software (5.3%) | |||||||||||
| Adobe Systems, Inc. (a) | 11,730 | 472,602 | |||||||||
| Citrix Systems, Inc. (a) | 6,630 | 239,807 | |||||||||
| Microsoft Corp. | 57,420 | 1,664,606 | |||||||||
| Oracle Corp. (a) | 39,120 | 747,974 | |||||||||
| 3,124,989 | |||||||||||
| 15,705,712 | |||||||||||
| Materials (2.6%) | |||||||||||
| Chemicals (1.5%) | |||||||||||
| E.I. Du Pont de Nemours & Co. | 9,630 | 450,010 | |||||||||
| Monsanto Co. | 6,548 | 422,019 | |||||||||
| 872,029 | |||||||||||
| Metals & Mining (1.1%) | |||||||||||
| Freeport-McMoRan Copper & Gold, Inc. | 6,780 | 637,184 | |||||||||
| 1,509,213 | |||||||||||
| Telecommunication Services (3.2%) | |||||||||||
| Diversified Telecommunication Services (0.5%) | |||||||||||
| Time Warner Telecom, Inc., Class A (a) | 14,128 | 276,202 | |||||||||
See Accompanying Notes to Financial Statements.
57
CMG LARGE CAP GROWTH FUND
A Portfolio of Columbia Funds Institutional Trust
SCHEDULE OF INVESTMENTS
| Shares | Value | ||||||||||
| Common Stocks (continued) | |||||||||||
| Wireless Telecommunication Services (2.7%) | |||||||||||
| American Tower Corp., Class A (a) | 12,270 | $ | 511,168 | ||||||||
| Clearwire Corp. (a) | 7,420 | 211,693 | |||||||||
| MetroPCS Communications, Inc. (a) | 7,460 | 273,185 | |||||||||
| NII Holdings, Inc. (a) | 7,540 | 633,511 | |||||||||
| 1,629,557 | |||||||||||
| 1,905,759 | |||||||||||
| Total Common Stocks (Cost of $53,615,891) | 57,429,097 | ||||||||||
| Par | |||||||||||
| Short-Term Obligation (1.9%) | |||||||||||
| Repurchase agreement with Fixed Income Clearing Corp., dated 07/31/07, due 08/01/07 at 5.030%, collateralized by a U.S. Treasury Obligation maturing 11/30/11, market value of $1,157,888 (repurchase proceeds $1,134,158) | $ | 1,134,000 | 1,134,000 | ||||||||
| Total Short-Term Obligation (Cost of $1,134,000) | 1,134,000 | ||||||||||
| Total Investments (99.3%) (Cost of $54,749,891) (b) | 58,563,097 | ||||||||||
| Other Assets & Liabilities, Net (0.7%) | 415,356 | ||||||||||
| Net Assets (100.0%) | $ | 58,978,453 | |||||||||
| Notes to Schedule of Investments: | |||||||||||
(a) Non-income producing security.
(b) Cost for federal income tax purposes is $54,915,314.
At July 31, 2007, the Fund held investments in the following sectors:
| Sector (Unaudited) | % of Net Assets | ||||||
| Information Technology | 26.6 | ||||||
| Health Care | 15.4 | ||||||
| Industrials | 13.2 | ||||||
| Consumer Discretionary | 12.0 | ||||||
| Consumer Staples | 10.0 | ||||||
| Energy | 7.7 | ||||||
| Financials | 6.7 | ||||||
| Telecommunication Services | 3.2 | ||||||
| Materials | 2.6 | ||||||
| 97.4 | |||||||
| Short-Term Obligation | 1.9 | ||||||
| Other Assets & Liabilities, Net | 0.7 | ||||||
| 100.0 | |||||||
| Acronym | Name | ||||||
| ADR | American Depositary Receipt | ||||||
See Accompanying Notes to Financial Statements.
58
CMG LARGE CAP VALUE FUND
A Portfolio of Columbia Funds Institutional Trust
SCHEDULE OF INVESTMENTS
July 31, 2007
| Shares | Value | ||||||||||
| Common Stocks (97.1%) | |||||||||||
| Consumer Discretionary (6.4%) | |||||||||||
| Hotels, Restaurants & Leisure (0.8%) | |||||||||||
| McDonald's Corp. | 7,066 | $ | 338,249 | ||||||||
| Household Durables (2.5%) | |||||||||||
| Lennar Corp., Class A | 5,100 | 156,366 | |||||||||
| Newell Rubbermaid, Inc. | 18,400 | 486,680 | |||||||||
| Sony Corp., ADR | 8,900 | 469,386 | |||||||||
| 1,112,432 | |||||||||||
| Media (0.3%) | |||||||||||
| Time Warner, Inc. | 7,800 | 150,228 | |||||||||
| Multiline Retail (1.9%) | |||||||||||
| J.C. Penney Co., Inc. | 8,300 | 564,732 | |||||||||
| Macy's, Inc. | 8,300 | 299,381 | |||||||||
| 864,113 | |||||||||||
| Specialty Retail (0.9%) | |||||||||||
| Home Depot, Inc. | 10,300 | 382,851 | |||||||||
| 2,847,873 | |||||||||||
| Consumer Staples (9.4%) | |||||||||||
| Beverages (1.0%) | |||||||||||
| Diageo PLC, ADR | 5,399 | 440,990 | |||||||||
| Food & Staples Retailing (1.2%) | |||||||||||
| Sysco Corp. | 10,300 | 328,364 | |||||||||
| Wal-Mart Stores, Inc. | 4,700 | 215,965 | |||||||||
| 544,329 | |||||||||||
| Food Products (2.0%) | |||||||||||
| ConAgra Foods, Inc. | 25,500 | 646,425 | |||||||||
| Tyson Foods, Inc., Class A | 11,800 | 251,340 | |||||||||
| 897,765 | |||||||||||
| Household Products (0.5%) | |||||||||||
| Colgate-Palmolive Co. | 3,400 | 224,400 | |||||||||
| Personal Products (0.8%) | |||||||||||
| Avon Products, Inc. | 10,500 | 378,105 | |||||||||
| Tobacco (3.9%) | |||||||||||
| Altria Group, Inc. | 13,729 | 912,567 | |||||||||
| Loews Corp.-Carolina Group | 10,800 | 818,532 | |||||||||
| 1,731,099 | |||||||||||
| 4,216,688 | |||||||||||
See Accompanying Notes to Financial Statements.
59
CMG LARGE CAP VALUE FUND
A Portfolio of Columbia Funds Institutional Trust
SCHEDULE OF INVESTMENTS
| Shares | Value | ||||||||||
| Common Stocks (continued) | |||||||||||
| Energy (13.5%) | |||||||||||
| Energy Equipment & Services (2.2%) | |||||||||||
| Halliburton Co. | 13,554 | $ | 488,215 | ||||||||
| National-Oilwell Varco, Inc. (a) | 1,800 | 216,198 | |||||||||
| Weatherford International Ltd. (a) | 5,300 | 293,249 | |||||||||
| 997,662 | |||||||||||
| Oil, Gas & Consumable Fuels (11.3%) | |||||||||||
| ConocoPhillips | 11,107 | 897,890 | |||||||||
| Exxon Mobil Corp. | 25,435 | 2,165,281 | |||||||||
| Hess Corp. | 10,900 | 667,080 | |||||||||
| Newfield Exploration Co. (a) | 5,200 | 249,860 | |||||||||
| Occidental Petroleum Corp. | 19,200 | 1,089,024 | |||||||||
| 5,069,135 | |||||||||||
| 6,066,797 | |||||||||||
| Financials (31.1%) | |||||||||||
| Capital Markets (3.1%) | |||||||||||
| Morgan Stanley | 7,900 | 504,573 | |||||||||
| State Street Corp. | 13,400 | 898,202 | |||||||||
| 1,402,775 | |||||||||||
| Commercial Banks (8.3%) | |||||||||||
| Barclays PLC, ADR | 7,900 | 442,321 | |||||||||
| Marshall & Ilsley Corp. | 10,220 | 421,166 | |||||||||
| PNC Financial Services Group, Inc. | 7,600 | 506,540 | |||||||||
| U.S. Bancorp | 29,746 | 890,893 | |||||||||
| Wachovia Corp. | 11,422 | 539,233 | |||||||||
| Wells Fargo & Co. | 26,756 | 903,550 | |||||||||
| 3,703,703 | |||||||||||
| Consumer Finance (0.2%) | |||||||||||
| Discover Financial Services (a) | 4,000 | 92,200 | |||||||||
| Diversified Financial Services (6.4%) | |||||||||||
| CIT Group, Inc. | 5,300 | 218,254 | |||||||||
| Citigroup, Inc. | 31,885 | 1,484,884 | |||||||||
| JPMorgan Chase & Co. | 26,200 | 1,153,062 | |||||||||
| 2,856,200 | |||||||||||
| Insurance (8.5%) | |||||||||||
| ACE Ltd. | 16,200 | 935,064 | |||||||||
| Ambac Financial Group, Inc. | 11,885 | 798,078 | |||||||||
| American International Group, Inc. | 4,651 | 298,501 | |||||||||
| Genworth Financial, Inc., Class A | 12,600 | 384,552 | |||||||||
| Hartford Financial Services Group, Inc. | 5,955 | 547,086 | |||||||||
| Loews Corp. | 8,900 | 421,860 | |||||||||
| Prudential Financial, Inc. | 4,900 | 434,287 | |||||||||
| 3,819,428 | |||||||||||
| Real Estate Investment Trusts (REITs) (2.4%) | |||||||||||
| General Growth Properties, Inc. | 6,400 | 307,072 | |||||||||
| Plum Creek Timber Co., Inc. | 10,900 | 423,574 | |||||||||
| ProLogis | 3,100 | 176,390 | |||||||||
| Rayonier, Inc. | 3,600 | 152,424 | |||||||||
| 1,059,460 | |||||||||||
See Accompanying Notes to Financial Statements.
60
CMG LARGE CAP VALUE FUND
A Portfolio of Columbia Funds Institutional Trust
SCHEDULE OF INVESTMENTS
| Shares | Value | ||||||||||
| Common Stocks (continued) | |||||||||||
| Thrifts & Mortgage Finance (2.2%) | |||||||||||
| Fannie Mae | 11,100 | $ | 664,224 | ||||||||
| Washington Mutual, Inc. | 9,300 | 349,029 | |||||||||
| 1,013,253 | |||||||||||
| 13,947,019 | |||||||||||
| Health Care (7.1%) | |||||||||||
| Health Care Providers & Services (2.5%) | |||||||||||
| Aetna, Inc. | 4,744 | 228,044 | |||||||||
| CIGNA Corp. | 6,331 | 326,933 | |||||||||
| McKesson Corp. | 6,000 | 346,560 | |||||||||
| Medco Health Solutions, Inc. (a) | 3,000 | 243,810 | |||||||||
| 1,145,347 | |||||||||||
| Life Sciences Tools & Services (0.8%) | |||||||||||
| Thermo Fisher Scientific, Inc. (a) | 6,600 | 344,586 | |||||||||
| Pharmaceuticals (3.8%) | |||||||||||
| Johnson & Johnson | 9,300 | 562,650 | |||||||||
| Merck & Co., Inc. | 14,300 | 709,995 | |||||||||
| Pfizer, Inc. | 17,762 | 417,585 | |||||||||
| 1,690,230 | |||||||||||
| 3,180,163 | |||||||||||
| Industrials (9.6%) | |||||||||||
| Aerospace & Defense (4.0%) | |||||||||||
| Goodrich Corp. | 7,300 | 459,243 | |||||||||
| L-3 Communications Holdings, Inc. | 6,000 | 585,360 | |||||||||
| United Technologies Corp. | 10,296 | 751,299 | |||||||||
| 1,795,902 | |||||||||||
| Electrical Equipment (0.6%) | |||||||||||
| ABB Ltd., ADR | 11,797 | 283,954 | |||||||||
| Industrial Conglomerates (5.0%) | |||||||||||
| General Electric Co. | 57,392 | 2,224,514 | |||||||||
| 4,304,370 | |||||||||||
| Information Technology (5.4%) | |||||||||||
| Computers & Peripherals (2.1%) | |||||||||||
| Hewlett-Packard Co. | 20,600 | 948,218 | |||||||||
| Electronic Equipment & Instruments (0.7%) | |||||||||||
| Agilent Technologies, Inc. (a) | 7,500 | 286,125 | |||||||||
| Semiconductors & Semiconductor Equipment (2.6%) | |||||||||||
| Fairchild Semiconductor International, Inc. (a) | 13,400 | 244,550 | |||||||||
| Intersil Corp., Class A | 7,300 | 213,525 | |||||||||
See Accompanying Notes to Financial Statements.
61
CMG LARGE CAP VALUE FUND
A Portfolio of Columbia Funds Institutional Trust
SCHEDULE OF INVESTMENTS
| Shares | Value | ||||||||||
| Common Stocks (continued) | |||||||||||
| Semiconductors & Semiconductor Equipment (continued) | |||||||||||
| NVIDIA Corp. (a) | 7,900 | $ | 361,504 | ||||||||
| Texas Instruments, Inc. | 9,900 | 348,381 | |||||||||
| 1,167,960 | |||||||||||
| 2,402,303 | |||||||||||
| Materials (2.7%) | |||||||||||
| Chemicals (1.1%) | |||||||||||
| Dow Chemical Co. | 11,600 | 504,368 | |||||||||
| Metals & Mining (1.0%) | |||||||||||
| Alcoa, Inc. | 12,000 | 458,400 | |||||||||
| Paper & Forest Products (0.6%) | |||||||||||
| Weyerhaeuser Co. | 3,700 | 263,588 | |||||||||
| 1,226,356 | |||||||||||
| Telecommunication Services (5.6%) | |||||||||||
| Diversified Telecommunication Services (5.6%) | |||||||||||
| AT&T, Inc. | 44,857 | 1,756,600 | |||||||||
| Qwest Communications International, Inc. (a) | 34,400 | 293,432 | |||||||||
| Verizon Communications, Inc. | 10,670 | 454,755 | |||||||||
| 2,504,787 | |||||||||||
| Utilities (6.3%) | |||||||||||
| Electric Utilities (3.7%) | |||||||||||
| Entergy Corp. | 2,373 | 237,205 | |||||||||
| Exelon Corp. | 3,000 | 210,450 | |||||||||
| FPL Group, Inc. | 10,000 | 577,300 | |||||||||
| PPL Corp. | 10,300 | 485,542 | |||||||||
| Reliant Energy, Inc. (a) | 6,100 | 156,648 | |||||||||
| 1,667,145 | |||||||||||
| Independent Power Producers & Energy Traders (1.0%) | |||||||||||
| Constellation Energy Group, Inc. | 2,800 | 234,640 | |||||||||
| Mirant Corp. (a) | 5,500 | 208,065 | |||||||||
| 442,705 | |||||||||||
| Multi-Utilities (1.6%) | |||||||||||
| PG&E Corp. | 7,533 | 322,488 | |||||||||
| Public Service Enterprise Group, Inc. | 4,793 | 412,917 | |||||||||
| 735,405 | |||||||||||
| 2,845,255 | |||||||||||
| Total Common Stocks (Cost of $39,804,793) | 43,541,611 | ||||||||||
See Accompanying Notes to Financial Statements.
62
CMG LARGE CAP VALUE FUND
A Portfolio of Columbia Funds Institutional Trust
SCHEDULE OF INVESTMENTS
| Par | Value | ||||||||||
| Convertible Bonds (1.3%) | |||||||||||
| Consumer Discretionary (1.3%) | |||||||||||
| Media (1.3%) | |||||||||||
| Liberty Media Corp. | |||||||||||
| 0.750% 03/30/23 | $ | 496,000 | $ | 557,380 | |||||||
| Total Convertible Bonds (Cost of $549,411) | 557,380 | ||||||||||
| Short-Term Obligation (1.8%) | |||||||||||
| Repurchase agreement with Fixed Income Clearing Corp., dated 07/31/07, due 08/01/07 at 5.030%, collateralized by a U.S. Treasury Obligation maturing 11/30/11, market value of $827,063 (repurchase proceeds $809,113) | 809,000 | 809,000 | |||||||||
| Total Short-Term Obligation (Cost of $809,000) | 809,000 | ||||||||||
| Total Investments (100.2%) (Cost of $41,163,204) (b) | 44,907,991 | ||||||||||
| Other Assets & Liabilities, Net (-0.2%) | (77,663 | ) | |||||||||
| Net Assets (100.0%) | $ | 44,830,328 | |||||||||
Notes to Schedule of Investments:
(a) Non-income producing security.
(b) Cost for federal income tax purposes is $41,199,500.
At July 31, 2007, the Fund held investments in the following sectors:
| Sector (Unaudited) | % of Net Assets | ||||||
| Financials | 31.1 | ||||||
| Energy | 13.5 | ||||||
| Industrials | 9.6 | ||||||
| Consumer Staples | 9.4 | ||||||
| Consumer Discretionary | 7.7 | ||||||
| Health Care | 7.1 | ||||||
| Utilities | 6.3 | ||||||
| Telecommunication Services | 5.6 | ||||||
| Information Technology | 5.4 | ||||||
| Materials | 2.7 | ||||||
| 98.4 | |||||||
| Short-Term Obligation | 1.8 | ||||||
| Other Assets & Liabilities, Net | (0.2 | ) | |||||
| 100.0 | |||||||
| Acronym | Name | ||||||
| ADR | American Depositary Receipt | ||||||
See Accompanying Notes to Financial Statements.
63
CMG MID CAP GROWTH FUND
A Portfolio of Columbia Funds Institutional Trust
SCHEDULE OF INVESTMENTS
July 31, 2007
| Shares | Value | ||||||||||
| Common Stocks (96.3%) | |||||||||||
| Consumer Discretionary (16.6%) | |||||||||||
| Auto Components (0.2%) | |||||||||||
| Goodyear Tire & Rubber Co. (a) | 2,440 | $ | 70,077 | ||||||||
| Automobiles (0.5%) | |||||||||||
| Harley-Davidson, Inc. | 2,540 | 145,593 | |||||||||
| Diversified Consumer Services (1.7%) | |||||||||||
| Apollo Group, Inc., Class A (a) | 2,380 | 140,682 | |||||||||
| DeVry, Inc. | 4,170 | 135,108 | |||||||||
| ITT Educational Services, Inc. (a) | 500 | 52,830 | |||||||||
| Sotheby's | 3,580 | 153,045 | |||||||||
| 481,665 | |||||||||||
| Hotels, Restaurants & Leisure (3.8%) | |||||||||||
| International Game Technology, Inc. | 4,100 | 144,812 | |||||||||
| Orient-Express Hotels Ltd., Class A | 3,006 | 139,629 | |||||||||
| Scientific Games Corp., Class A (a) | 3,440 | 118,026 | |||||||||
| Starwood Hotels & Resorts Worldwide, Inc. | 5,580 | 351,317 | |||||||||
| Wynn Resorts Ltd. | 1,180 | 113,941 | |||||||||
| Yum! Brands, Inc. | 7,040 | 225,561 | |||||||||
| 1,093,286 | |||||||||||
| Household Durables (0.9%) | |||||||||||
| Gafisa SA, ADR (a) | 4,680 | 147,186 | |||||||||
| Garmin Ltd. | 1,530 | 128,367 | |||||||||
| 275,553 | |||||||||||
| Internet & Catalog Retail (0.7%) | |||||||||||
| Priceline.com, Inc. (a) | 3,040 | 193,952 | |||||||||
| Media (1.7%) | |||||||||||
| EchoStar Communications Corp., Class A (a) | 2,890 | 122,218 | |||||||||
| Lamar Advertising Co., Class A (a) | 2,420 | 144,062 | |||||||||
| Liberty Global, Inc., Class A (a) | 2,820 | 118,243 | |||||||||
| Regal Entertainment Group, Class A | 4,900 | 104,811 | |||||||||
| 489,334 | |||||||||||
| Multiline Retail (1.8%) | |||||||||||
| J.C. Penney Co., Inc. | 3,340 | 227,254 | |||||||||
| Nordstrom, Inc. | 5,930 | 282,149 | |||||||||
| 509,403 | |||||||||||
| Specialty Retail (2.3%) | |||||||||||
| Abercrombie & Fitch Co., Class A | 1,620 | 113,238 | |||||||||
| Chico's FAS, Inc. (a) | 4,200 | 81,312 | |||||||||
| GameStop Corp., Class A (a) | 8,080 | 326,028 | |||||||||
| TJX Companies, Inc. | 4,620 | 128,205 | |||||||||
| 648,783 | |||||||||||
See Accompanying Notes to Financial Statements.
64
CMG MID CAP GROWTH FUND
A Portfolio of Columbia Funds Institutional Trust
SCHEDULE OF INVESTMENTS
| Shares | Value | ||||||||||
| Common Stocks (continued) | |||||||||||
| Textiles, Apparel & Luxury Goods (3.0%) | |||||||||||
| Coach, Inc. (a) | 6,620 | $ | 300,945 | ||||||||
| CROCS, Inc. (a) | 5,350 | 317,362 | |||||||||
| Polo Ralph Lauren Corp. | 2,780 | 248,393 | |||||||||
| 866,700 | |||||||||||
| 4,774,346 | |||||||||||
| Consumer Staples (3.9%) | |||||||||||
| Beverages (0.4%) | |||||||||||
| Pepsi Bottling Group, Inc. | 3,460 | 115,772 | |||||||||
| Food & Staples Retailing (0.4%) | |||||||||||
| Kroger Co. | 4,670 | 121,233 | |||||||||
| Food Products (1.4%) | |||||||||||
| H.J. Heinz Co. | 2,610 | 114,213 | |||||||||
| McCormick & Co., Inc. | 3,780 | 129,125 | |||||||||
| Wm. Wrigley Jr. Co. | 2,640 | 152,275 | |||||||||
| 395,613 | |||||||||||
| Household Products (0.3%) | |||||||||||
| Clorox Co. | 1,600 | 96,736 | |||||||||
| Personal Products (1.4%) | |||||||||||
| Avon Products, Inc. | 6,840 | 246,309 | |||||||||
| Estee Lauder Companies, Inc., Class A | 3,070 | 138,211 | |||||||||
| 384,520 | |||||||||||
| 1,113,874 | |||||||||||
| Energy (10.6%) | |||||||||||
| Energy Equipment & Services (6.2%) | |||||||||||
| Cameron International Corp. (a) | 2,870 | 223,860 | |||||||||
| Diamond Offshore Drilling, Inc. | 1,720 | 177,470 | |||||||||
| ENSCO International, Inc. | 1,590 | 97,101 | |||||||||
| FMC Technologies, Inc. (a) | 1,960 | 179,379 | |||||||||
| GlobalSantaFe Corp. | 1,530 | 109,716 | |||||||||
| Grant Prideco, Inc. (a) | 3,195 | 179,240 | |||||||||
| National-Oilwell Varco, Inc. (a) | 2,680 | 321,895 | |||||||||
| Noble Corp. | 1,820 | 186,477 | |||||||||
| Superior Energy Services, Inc. (a) | 1,860 | 74,995 | |||||||||
| Weatherford International Ltd. (a) | 4,310 | 238,473 | |||||||||
| 1,788,606 | |||||||||||
| Oil, Gas & Consumable Fuels (4.4%) | |||||||||||
| Chesapeake Energy Corp. | 5,060 | 172,242 | |||||||||
| Continental Resources, Inc. (a) | 10,174 | 160,037 | |||||||||
| Denbury Resources, Inc. (a) | 6,770 | 270,800 | |||||||||
| Frontier Oil Corp. | 2,310 | 89,466 | |||||||||
| Peabody Energy Corp. | 2,300 | 97,198 | |||||||||
See Accompanying Notes to Financial Statements.
65
CMG MID CAP GROWTH FUND
A Portfolio of Columbia Funds Institutional Trust
SCHEDULE OF INVESTMENTS
| Shares | Value | ||||||||||
| Common Stocks (continued) | |||||||||||
| Oil, Gas & Consumable Fuels (continued) | |||||||||||
| Range Resources Corp. | 3,080 | $ | 114,391 | ||||||||
| Southwestern Energy Co. (a) | 3,569 | 145,009 | |||||||||
| Sunoco, Inc. | 920 | 61,382 | |||||||||
| Williams Companies, Inc. | 4,590 | 148,028 | |||||||||
| 1,258,553 | |||||||||||
| 3,047,159 | |||||||||||
| Financials (7.4%) | |||||||||||
| Capital Markets (3.6%) | |||||||||||
| Affiliated Managers Group, Inc. (a) | 2,380 | 268,940 | |||||||||
| E*TRADE Financial Corp. (a) | 3,020 | 55,930 | |||||||||
| Janus Capital Group, Inc. | 2,008 | 60,360 | |||||||||
| Lazard Ltd., Class A | 4,090 | 151,453 | |||||||||
| Nuveen Investments, Inc., Class A | 1,420 | 86,819 | |||||||||
| T. Rowe Price Group, Inc. | 4,560 | 237,713 | |||||||||
| TD Ameritrade Holding Corp. (a) | 3,450 | 58,478 | |||||||||
| Waddell & Reed Financial, Inc., Class A | 4,480 | 112,941 | |||||||||
| 1,032,634 | |||||||||||
| Commercial Banks (0.4%) | |||||||||||
| Zions Bancorporation | 1,540 | 114,807 | |||||||||
| Diversified Financial Services (1.4%) | |||||||||||
| CME Group, Inc., Class A | 250 | 138,125 | |||||||||
| IntercontinentalExchange, Inc. (a) | 760 | 114,859 | |||||||||
| Nymex Holdings, Inc. | 1,173 | 146,038 | |||||||||
| 399,022 | |||||||||||
| Insurance (0.5%) | |||||||||||
| Ambac Financial Group, Inc. | 1,975 | 132,621 | |||||||||
| Real Estate Investment Trusts (REITs) (0.7%) | |||||||||||
| CapitalSource, Inc. | 4,130 | 78,470 | |||||||||
| Plum Creek Timber Co., Inc. | 3,550 | 137,953 | |||||||||
| 216,423 | |||||||||||
| Real Estate Management & Development (0.8%) | |||||||||||
| CB Richard Ellis Group, Inc., Class A (a) | 2,450 | 85,554 | |||||||||
| Jones Lang LaSalle, Inc. | 1,300 | 142,714 | |||||||||
| 228,268 | |||||||||||
| 2,123,775 | |||||||||||
| Health Care (14.7%) | |||||||||||
| Biotechnology (1.2%) | |||||||||||
| Alexion Pharmaceuticals, Inc. (a) | 1,250 | 72,700 | |||||||||
| Celgene Corp. (a) | 2,340 | 141,710 | |||||||||
| Cephalon, Inc. (a) | 1,870 | 140,512 | |||||||||
| 354,922 | |||||||||||
See Accompanying Notes to Financial Statements.
66
CMG MID CAP GROWTH FUND
A Portfolio of Columbia Funds Institutional Trust
SCHEDULE OF INVESTMENTS
| Shares | Value | ||||||||||
| Common Stocks (continued) | |||||||||||
| Health Care Equipment & Supplies (4.1%) | |||||||||||
| Beckman Coulter, Inc. | 1,667 | $ | 118,057 | ||||||||
| Cytyc Corp. (a) | 2,790 | 117,459 | |||||||||
| Dade Behring Holdings, Inc. | 2,250 | 168,412 | |||||||||
| Gen-Probe, Inc. (a) | 1,890 | 119,089 | |||||||||
| Hologic, Inc. (a) | 2,090 | 108,262 | |||||||||
| Intuitive Surgical, Inc. (a) | 127 | 27,001 | |||||||||
| Kyphon, Inc. (a) | 2,380 | 156,176 | |||||||||
| Mindray Medical International Ltd., ADR | 3,770 | 116,870 | |||||||||
| Sirona Dental Systems, Inc. (a) | 2,070 | 73,195 | |||||||||
| St. Jude Medical, Inc. (a) | 3,720 | 160,481 | |||||||||
| 1,165,002 | |||||||||||
| Health Care Providers & Services (5.0%) | |||||||||||
| Brookdale Senior Living, Inc. | 3,570 | 142,836 | |||||||||
| Coventry Health Care, Inc. (a) | 2,000 | 111,620 | |||||||||
| Express Scripts, Inc. (a) | 4,380 | 219,569 | |||||||||
| Laboratory Corp. of America Holdings (a) | 2,200 | 162,470 | |||||||||
| McKesson Corp. | 2,300 | 132,848 | |||||||||
| Medco Health Solutions, Inc. (a) | 2,030 | 164,978 | |||||||||
| Quest Diagnostics, Inc. | 3,819 | 211,840 | |||||||||
| Sunrise Senior Living, Inc. (a) | 3,900 | 155,064 | |||||||||
| VCA Antech, Inc. (a) | 3,163 | 124,433 | |||||||||
| 1,425,658 | |||||||||||
| Health Care Technology (0.8%) | |||||||||||
| Allscripts Healthcare Solutions, Inc. (a) | 4,980 | 113,295 | |||||||||
| IMS Health, Inc. | 4,300 | 120,959 | |||||||||
| 234,254 | |||||||||||
| Life Sciences Tools & Services (1.7%) | |||||||||||
| Covance, Inc. (a) | 1,700 | 119,969 | |||||||||
| Pharmaceutical Product Development, Inc. | 3,090 | 103,515 | |||||||||
| Thermo Fisher Scientific, Inc. (a) | 2,820 | 147,232 | |||||||||
| Waters Corp. (a) | 1,800 | 104,868 | |||||||||
| 475,584 | |||||||||||
| Pharmaceuticals (1.9%) | |||||||||||
| Allergan, Inc. | 5,120 | 297,626 | |||||||||
| Forest Laboratories, Inc. (a) | 2,740 | 110,148 | |||||||||
| Shire PLC, ADR | 2,010 | 148,318 | |||||||||
| 556,092 | |||||||||||
| 4,211,512 | |||||||||||
| Industrials (14.0%) | |||||||||||
| Aerospace & Defense (3.4%) | |||||||||||
| BE Aerospace, Inc. (a) | 2,710 | 109,918 | |||||||||
| Goodrich Corp. | 2,530 | 159,162 | |||||||||
| L-3 Communications Holdings, Inc. | 1,400 | 136,584 | |||||||||
| Precision Castparts Corp. | 2,160 | 296,049 | |||||||||
| Rockwell Collins, Inc. | 3,860 | 265,182 | |||||||||
| 966,895 | |||||||||||
See Accompanying Notes to Financial Statements.
67
CMG MID CAP GROWTH FUND
A Portfolio of Columbia Funds Institutional Trust
SCHEDULE OF INVESTMENTS
| Shares | Value | ||||||||||
| Common Stocks (continued) | |||||||||||
| Air Freight & Logistics (1.0%) | |||||||||||
| C.H. Robinson Worldwide, Inc. | 3,560 | $ | 173,194 | ||||||||
| Expeditors International Washington, Inc. | 2,590 | 115,721 | |||||||||
| 288,915 | |||||||||||
| Commercial Services & Supplies (2.3%) | |||||||||||
| Dun & Bradstreet Corp. | 1,260 | 123,178 | |||||||||
| Equifax, Inc. | 2,790 | 112,883 | |||||||||
| Monster Worldwide, Inc. (a) | 1,430 | 55,613 | |||||||||
| Resources Connection, Inc. (a) | 2,120 | 68,836 | |||||||||
| Robert Half International, Inc. | 3,560 | 121,005 | |||||||||
| Stericycle, Inc. (a) | 3,480 | 166,831 | |||||||||
| 648,346 | |||||||||||
| Construction & Engineering (0.8%) | |||||||||||
| Fluor Corp. | 1,020 | 117,820 | |||||||||
| Jacobs Engineering Group, Inc. (a) | 1,820 | 112,167 | |||||||||
| 229,987 | |||||||||||
| Electrical Equipment (2.2%) | |||||||||||
| General Cable Corp. (a) | 1,070 | 85,065 | |||||||||
| Roper Industries, Inc. | 3,190 | 191,336 | |||||||||
| SunPower Corp., Class A (a) | 1,370 | 96,626 | |||||||||
| Suntech Power Holdings Co., Ltd., ADR (a) | 4,340 | 175,032 | |||||||||
| Thomas & Betts Corp. (a) | 1,520 | 93,936 | |||||||||
| 641,995 | |||||||||||
| Industrial Conglomerates (0.7%) | |||||||||||
| McDermott International, Inc. (a) | 2,370 | 196,568 | |||||||||
| Machinery (3.3%) | |||||||||||
| Cummins, Inc. | 2,260 | 268,262 | |||||||||
| ITT Corp. | 1,680 | 105,638 | |||||||||
| Joy Global, Inc. | 3,555 | 175,937 | |||||||||
| Oshkosh Truck Corp. | 1,920 | 109,920 | |||||||||
| Parker Hannifin Corp. | 1,010 | 99,667 | |||||||||
| Terex Corp. (a) | 2,230 | 192,338 | |||||||||
| 951,762 | |||||||||||
| Marine (0.3%) | |||||||||||
| Dryships, Inc. | 1,480 | 84,834 | |||||||||
| 4,009,302 | |||||||||||
| Information Technology (15.6%) | |||||||||||
| Communications Equipment (1.8%) | |||||||||||
| Harris Corp. | 1,730 | 94,942 | |||||||||
| Research In Motion Ltd. (a) | 1,220 | 261,080 | |||||||||
| Riverbed Technology, Inc. (a) | 3,859 | 170,414 | |||||||||
| 526,436 | |||||||||||
| Computers & Peripherals (0.5%) | |||||||||||
| SanDisk Corp. (a) | 2,610 | 139,974 | |||||||||
See Accompanying Notes to Financial Statements.
68
CMG MID CAP GROWTH FUND
A Portfolio of Columbia Funds Institutional Trust
SCHEDULE OF INVESTMENTS
| Shares | Value | ||||||||||
| Common Stocks (continued) | |||||||||||
| Electronic Equipment & Instruments (0.4%) | |||||||||||
| Amphenol Corp., Class A | 3,240 | $ | 111,002 | ||||||||
| Internet Software & Services (0.5%) | |||||||||||
| Equinix, Inc. (a) | 1,710 | 148,616 | |||||||||
| IT Services (2.7%) | |||||||||||
| Cognizant Technology Solutions Corp., Class A (a) | 2,810 | 227,554 | |||||||||
| DST Systems, Inc. (a)(b) | 1,440 | 109,253 | |||||||||
| Fiserv, Inc. (a) | 1,610 | 79,566 | |||||||||
| Global Payments, Inc. | 2,290 | 85,646 | |||||||||
| Mastercard, Inc., Class A | 710 | 114,168 | |||||||||
| Paychex, Inc. | 3,870 | 160,141 | |||||||||
| 776,328 | |||||||||||
| Semiconductors & Semiconductor Equipment (5.7%) | |||||||||||
| Analog Devices, Inc. | 3,810 | 135,064 | |||||||||
| Atheros Communications, Inc. (a) | 2,791 | 77,813 | |||||||||
| KLA-Tencor Corp. | 2,620 | 148,790 | |||||||||
| Lam Research Corp. (a) | 5,370 | 310,601 | |||||||||
| Maxim Integrated Products, Inc. | 3,520 | 111,584 | |||||||||
| MEMC Electronic Materials, Inc. (a) | 7,063 | 433,103 | |||||||||
| National Semiconductor Corp. | 3,640 | 94,604 | |||||||||
| NVIDIA Corp. (a) | 5,740 | 262,662 | |||||||||
| Verigy Ltd. (a) | 2,460 | 60,172 | |||||||||
| 1,634,393 | |||||||||||
| Software (4.0%) | |||||||||||
| Activision, Inc. (a) | 6,340 | 108,478 | |||||||||
| Autodesk, Inc. (a) | 2,687 | 113,848 | |||||||||
| BEA Systems, Inc. (a) | 8,029 | 99,399 | |||||||||
| BMC Software, Inc. (a) | 3,370 | 96,786 | |||||||||
| Citrix Systems, Inc. (a) | 1,978 | 71,544 | |||||||||
| FactSet Research Systems, Inc. | 1,450 | 95,686 | |||||||||
| Intuit, Inc. (a) | 4,002 | 114,617 | |||||||||
| McAfee, Inc. (a) | 6,670 | 239,186 | |||||||||
| Salesforce.com, Inc. (a) | 1,510 | 58,679 | |||||||||
| THQ, Inc. (a) | 4,920 | 141,499 | |||||||||
| 1,139,722 | |||||||||||
| 4,476,471 | |||||||||||
| Materials (5.2%) | |||||||||||
| Chemicals (1.5%) | |||||||||||
| Potash Corp. of Saskatchewan, Inc. | 2,160 | 174,399 | |||||||||
| Wacker Chemie AG | 1,100 | 267,621 | |||||||||
| 442,020 | |||||||||||
See Accompanying Notes to Financial Statements.
69
CMG MID CAP GROWTH FUND
A Portfolio of Columbia Funds Institutional Trust
SCHEDULE OF INVESTMENTS
| Shares | Value | ||||||||||
| Common Stocks (continued) | |||||||||||
| Construction Materials (0.7%) | |||||||||||
| Eagle Materials, Inc. | 1,640 | $ | 71,717 | ||||||||
| Vulcan Materials Co. | 1,320 | 126,350 | |||||||||
| 198,067 | |||||||||||
| Containers & Packaging (0.7%) | |||||||||||
| Ball Corp. | 1,690 | 86,646 | |||||||||
| Crown Holdings, Inc. (a) | 4,205 | 103,275 | |||||||||
| 189,921 | |||||||||||
| Metals & Mining (2.3%) | |||||||||||
| Allegheny Technologies, Inc. | 1,840 | 193,071 | |||||||||
| Carpenter Technology Corp. | 1,516 | 179,934 | |||||||||
| Freeport-McMoRan Copper & Gold, Inc., Class B | 1,967 | 184,859 | |||||||||
| Steel Dynamics, Inc. | 2,540 | 106,502 | |||||||||
| 664,366 | |||||||||||
| 1,494,374 | |||||||||||
| Telecommunication Services (5.8%) | |||||||||||
| Diversified Telecommunication Services (0.5%) | |||||||||||
| Cogent Communications Group, Inc. (a) | 4,730 | 135,656 | |||||||||
| Wireless Telecommunication Services (5.3%) | |||||||||||
| American Tower Corp., Class A (a) | 8,956 | 373,107 | |||||||||
| Crown Castle International Corp. (a) | 6,380 | 231,275 | |||||||||
| Leap Wireless International, Inc. (a) | 2,360 | 208,624 | |||||||||
| Millicom International Cellular SA (a) | 2,700 | 216,810 | |||||||||
| NII Holdings, Inc. (a) | 4,310 | 362,126 | |||||||||
| Rogers Communications, Inc., Class B | 3,200 | 144,928 | |||||||||
| 1,536,870 | |||||||||||
| 1,672,526 | |||||||||||
| Utilities (2.5%) | |||||||||||
| Electric Utilities (1.2%) | |||||||||||
| Allegheny Energy, Inc. (a) | 1,730 | 90,358 | |||||||||
| PPL Corp. | 5,360 | 252,670 | |||||||||
| 343,028 | |||||||||||
| Gas Utilities (0.6%) | |||||||||||
| Questar Corp. | 3,260 | 167,858 | |||||||||
| Independent Power Producers & Energy Traders (0.7%) | |||||||||||
| Constellation Energy Group, Inc. | 2,350 | 196,930 | |||||||||
| 707,816 | |||||||||||
| Total Common Stocks (Cost of $22,677,459) | 27,631,155 | ||||||||||
See Accompanying Notes to Financial Statements.
70
CMG MID CAP GROWTH FUND
A Portfolio of Columbia Funds Institutional Trust
SCHEDULE OF INVESTMENTS
| Par | Value | ||||||||||
| Short-Term Obligation (4.9%) | |||||||||||
| Repurchase agreement with Fixed Income Clearing Corp., dated 07/31/07, due 08/01/07 at 5.030%, collateralized by a U.S. Treasury Obligation maturing 11/30/11, market value of $1,423,550 (repurchase proceeds $1,395,195) | $ | 1,395,000 | $ | 1,395,000 | |||||||
| Total Short-Term Obligation (Cost of $1,395,000) | 1,395,000 | ||||||||||
| Total Investments (101.2%) (Cost of $24,072,459) (b) | 29,026,155 | ||||||||||
| Other Assets & Liabilities, Net (-1.2)% | (352,557 | ) | |||||||||
| Net Assets (100.0%) | $ | 28,673,598 | |||||||||
Notes to Schedule of Investments:
(a) Non-income producing security.
(b) Cost for federal income tax purposes is $24,144,093.
See Accompanying Notes to Financial Statements.
71
CMG MID CAP GROWTH FUND
A Portfolio of Columbia Funds Institutional Trust
SCHEDULE OF INVESTMENTS
At July 31, 2007, the Fund held investments in the following sectors:
| Sector (Unaudited) | % of Net Assets | ||||||
| Consumer Discretionary | 16.6 | ||||||
| Information Technology | 15.6 | ||||||
| Health Care | 14.7 | ||||||
| Industrials | 14.0 | ||||||
| Energy | 10.6 | ||||||
| Financials | 7.4 | ||||||
| Telecommunication Services | 5.8 | ||||||
| Materials | 5.2 | ||||||
| Consumer Staples | 3.9 | ||||||
| Utilities | 2.5 | ||||||
| 96.3 | |||||||
| Short-Term Obligation | 4.9 | ||||||
| Other Assets & Liabilities, Net | (1.2 | ) | |||||
| 100.0 | |||||||
For the year ended July 31, 2007, transactions in written options were as follows:
| Number of contracts | Premium received | ||||||||||
| Options outstanding at July 31, 2006 | - | $ | - | ||||||||
| Options written | 32 | 5,289 | |||||||||
| Options terminated in closing purchase transactions | - | - | |||||||||
| Options exercised | (9 | ) | (1,810 | ) | |||||||
| Options expired | (23 | ) | (3,479 | ) | |||||||
| Options outstanding at July 31, 2007 | - | - | |||||||||
| Acronym | Name | ||||
| ADR | American Depositary Receipt | ||||
See Accompanying Notes to Financial Statements.
72
CMG MID CAP VALUE FUND
A Portfolio of Columbia Funds Institutional Trust
SCHEDULE OF INVESTMENTS
July 31, 2007
| Shares | Value | ||||||||||
| Common Stocks (97.0%) | |||||||||||
| Consumer Discretionary (6.9%) | |||||||||||
| Auto Components (1.7%) | |||||||||||
| BorgWarner, Inc. | 1,850 | $ | 159,933 | ||||||||
| Johnson Controls, Inc. | 1,550 | 175,382 | |||||||||
| 335,315 | |||||||||||
| Automobiles (0.5%) | |||||||||||
| Ford Motor Co. (a) | 11,800 | 100,418 | |||||||||
| Hotels, Restaurants & Leisure (0.9%) | |||||||||||
| Royal Caribbean Cruises Ltd. | 1,300 | 50,089 | |||||||||
| Starwood Hotels & Resorts Worldwide, Inc. | 2,025 | 127,494 | |||||||||
| 177,583 | |||||||||||
| Household Durables (0.4%) | |||||||||||
| Lennar Corp., Class A | 2,600 | 79,716 | |||||||||
| Leisure Equipment & Products (0.4%) | |||||||||||
| Hasbro, Inc. | 3,000 | 84,060 | |||||||||
| Media (0.6%) | |||||||||||
| Regal Entertainment Group, Class A | 5,100 | 109,089 | |||||||||
| Multiline Retail (1.7%) | |||||||||||
| Macy's, Inc. | 3,916 | 141,250 | |||||||||
| Saks, Inc. | 9,600 | 177,696 | |||||||||
| 318,946 | |||||||||||
| Textiles, Apparel & Luxury Goods (0.7%) | |||||||||||
| Polo Ralph Lauren Corp. | 1,500 | 134,025 | |||||||||
| 1,339,152 | |||||||||||
| Consumer Staples (8.4%) | |||||||||||
| Beverages (1.9%) | |||||||||||
| Fomento Economico Mexicano SAB de CV, ADR | 3,775 | 139,750 | |||||||||
| Pepsi Bottling Group, Inc. | 6,500 | 217,490 | |||||||||
| 357,240 | |||||||||||
| Food & Staples Retailing (0.9%) | |||||||||||
| Kroger Co. | 6,750 | 175,230 | |||||||||
| Food Products (2.9%) | |||||||||||
| Dean Foods Co. | 4,900 | 140,973 | |||||||||
| Hershey Co. | 5,300 | 244,330 | |||||||||
| Smithfield Foods, Inc. (a) | 2,900 | 90,074 | |||||||||
| Tyson Foods, Inc., Class A | 4,150 | 88,395 | |||||||||
| 563,772 | |||||||||||
| Household Products (1.1%) | |||||||||||
| Clorox Co. | 3,650 | 220,679 | |||||||||
See Accompanying Notes to Financial Statements.
73
CMG MID CAP VALUE FUND
A Portfolio of Columbia Funds Institutional Trust
SCHEDULE OF INVESTMENTS
| Shares | Value | ||||||||||
| Common Stocks (continued) | |||||||||||
| Personal Products (1.6%) | |||||||||||
| Avon Products, Inc. | 3,900 | $ | 140,439 | ||||||||
| Estee Lauder Companies, Inc., Class A | 3,600 | 162,072 | |||||||||
| 302,511 | |||||||||||
| 1,619,432 | |||||||||||
| Energy (6.8%) | |||||||||||
| Energy Equipment & Services (2.8%) | |||||||||||
| National-Oilwell Varco, Inc. (a) | 1,525 | 183,168 | |||||||||
| Rowan Companies, Inc. | 2,725 | 114,968 | |||||||||
| Technip SA, ADR | 1,725 | 140,587 | |||||||||
| Tidewater, Inc. | 1,600 | 109,472 | |||||||||
| 548,195 | |||||||||||
| Oil, Gas & Consumable Fuels (4.0%) | |||||||||||
| Hess Corp. | 4,275 | 261,630 | |||||||||
| Newfield Exploration Co. (a) | 2,900 | 139,345 | |||||||||
| Peabody Energy Corp. | 2,500 | 105,650 | |||||||||
| Tesoro Corp. | 2,000 | 99,600 | |||||||||
| Williams Companies, Inc. | 5,100 | 164,475 | |||||||||
| 770,700 | |||||||||||
| 1,318,895 | |||||||||||
| Financials (25.4%) | |||||||||||
| Commercial Banks (9.7%) | |||||||||||
| Bank of Hawaii Corp. | 4,700 | 225,694 | |||||||||
| City National Corp. | 3,100 | 219,449 | |||||||||
| Comerica, Inc. | 4,775 | 251,452 | |||||||||
| Cullen/Frost Bankers, Inc. | 3,925 | 194,955 | |||||||||
| KeyCorp | 6,200 | 215,078 | |||||||||
| Marshall & Ilsley Corp. | 4,125 | 169,991 | |||||||||
| SVB Financial Group (a) | 3,450 | 181,746 | |||||||||
| TCF Financial Corp. | 7,000 | 172,130 | |||||||||
| Zions Bancorporation | 3,175 | 236,696 | |||||||||
| 1,867,191 | |||||||||||
| Diversified Financial Services (1.0%) | |||||||||||
| CIT Group, Inc. | 4,675 | 192,516 | |||||||||
| Insurance (7.2%) | |||||||||||
| ACE Ltd. | 2,100 | 121,212 | |||||||||
| Ambac Financial Group, Inc. | 3,800 | 255,170 | |||||||||
| Assurant, Inc. | 2,800 | 142,016 | |||||||||
| Axis Capital Holdings Ltd. | 5,316 | 195,894 | |||||||||
| Genworth Financial, Inc., Class A | 5,800 | 177,016 | |||||||||
| Loews Corp. | 3,875 | 183,675 | |||||||||
| Old Republic International Corp. | 6,825 | 125,307 | |||||||||
| Platinum Underwriters Holdings Ltd. | 5,900 | 195,880 | |||||||||
| 1,396,170 | |||||||||||
See Accompanying Notes to Financial Statements.
74
CMG MID CAP VALUE FUND
A Portfolio of Columbia Funds Institutional Trust
SCHEDULE OF INVESTMENTS
| Shares | Value | ||||||||||
| Common Stocks (continued) | |||||||||||
| Real Estate Investment Trusts (REITs) (6.8%) | |||||||||||
| Alexandria Real Estate Equities, Inc. | 900 | $ | 77,517 | ||||||||
| Boston Properties, Inc. | 1,050 | 99,215 | |||||||||
| Equity Residential Property Trust | 2,600 | 103,506 | |||||||||
| General Growth Properties, Inc. | 4,375 | 209,912 | |||||||||
| iStar Financial, Inc. | 4,020 | 146,047 | |||||||||
| Plum Creek Timber Co., Inc. | 7,500 | 291,450 | |||||||||
| ProLogis | 3,100 | 176,390 | |||||||||
| Rayonier, Inc. | 4,900 | 207,466 | |||||||||
| 1,311,503 | |||||||||||
| Thrifts & Mortgage Finance (0.7%) | |||||||||||
| PMI Group, Inc. | 4,025 | 137,132 | |||||||||
| 4,904,512 | |||||||||||
| Health Care (6.1%) | |||||||||||
| Health Care Equipment & Supplies (2.0%) | |||||||||||
| Beckman Coulter, Inc. | 3,200 | 226,624 | |||||||||
| Hospira, Inc. (a) | 4,275 | 165,314 | |||||||||
| 391,938 | |||||||||||
| Health Care Providers & Services (2.5%) | |||||||||||
| CIGNA Corp. | 4,050 | 209,142 | |||||||||
| Community Health Systems, Inc. (a) | 4,475 | 174,077 | |||||||||
| Universal Health Services, Inc., Class B | 1,900 | 99,636 | |||||||||
| 482,855 | |||||||||||
| Life Sciences Tools & Services (1.6%) | |||||||||||
| Millipore Corp. (a) | 1,250 | 98,263 | |||||||||
| Varian, Inc. (a) | 3,400 | 204,476 | |||||||||
| 302,739 | |||||||||||
| 1,177,532 | |||||||||||
| Industrials (12.6%) | |||||||||||
| Aerospace & Defense (1.9%) | |||||||||||
| L-3 Communications Holdings, Inc. | 2,700 | 263,412 | |||||||||
| Spirit Aerosystems Holdings, Inc., Class A (a) | 2,907 | 105,524 | |||||||||
| 368,936 | |||||||||||
| Commercial Services & Supplies (0.8%) | |||||||||||
| Equifax, Inc. | 3,800 | 153,748 | |||||||||
| Construction & Engineering (0.7%) | |||||||||||
| Jacobs Engineering Group, Inc. (a) | 2,250 | 138,668 | |||||||||
| Electrical Equipment (0.9%) | |||||||||||
| Cooper Industries Ltd., Class A | 3,100 | 164,052 | |||||||||
| Industrial Conglomerates (2.2%) | |||||||||||
| McDermott International, Inc. (a) | 2,450 | 203,203 | |||||||||
| Textron, Inc. | 1,950 | 220,135 | |||||||||
| 423,338 | |||||||||||
See Accompanying Notes to Financial Statements.
75
CMG MID CAP VALUE FUND
A Portfolio of Columbia Funds Institutional Trust
SCHEDULE OF INVESTMENTS
| Shares | Value | ||||||||||
| Common Stocks (continued) | |||||||||||
| Machinery (4.3%) | |||||||||||
| Barnes Group, Inc. | 7,118 | $ | 222,082 | ||||||||
| Harsco Corp. | 2,350 | 123,751 | |||||||||
| Kennametal, Inc. | 3,075 | 235,729 | |||||||||
| Parker Hannifin Corp. | 2,500 | 246,700 | |||||||||
| 828,262 | |||||||||||
| Marine (0.8%) | |||||||||||
| Alexander & Baldwin, Inc. | 2,825 | 153,172 | |||||||||
| Road & Rail (1.0%) | |||||||||||
| Canadian Pacific Railway Ltd. | 2,600 | 192,218 | |||||||||
| 2,422,394 | |||||||||||
| Information Technology (9.6%) | |||||||||||
| Computers & Peripherals (1.0%) | |||||||||||
| Diebold, Inc. | 1,900 | 96,273 | |||||||||
| NCR Corp. (a) | 1,900 | 99,218 | |||||||||
| 195,491 | |||||||||||
| Electronic Equipment & Instruments (3.1%) | |||||||||||
| Agilent Technologies, Inc. (a) | 4,200 | 160,230 | |||||||||
| Arrow Electronics, Inc. (a) | 5,025 | 192,055 | |||||||||
| Mettler-Toledo International, Inc. (a) | 1,500 | 142,740 | |||||||||
| Tektronix, Inc. | 3,336 | 109,588 | |||||||||
| 604,613 | |||||||||||
| IT Services (0.3%) | |||||||||||
| SAIC, Inc. (a) | 2,827 | 47,381 | |||||||||
| Semiconductors & Semiconductor Equipment (3.3%) | |||||||||||
| Fairchild Semiconductor International, Inc. (a) | 5,175 | 94,444 | |||||||||
| Intersil Corp., Class A | 3,400 | 99,450 | |||||||||
| KLA-Tencor Corp. | 2,150 | 122,098 | |||||||||
| NVIDIA Corp. (a) | 3,300 | 151,008 | |||||||||
| Spansion, Inc., Class A (a) | 10,700 | 113,527 | |||||||||
| Verigy Ltd. (a) | 2,283 | 55,842 | |||||||||
| 636,369 | |||||||||||
| Software (1.9%) | |||||||||||
| Activision, Inc. (a) | 8,033 | 137,445 | |||||||||
| Cadence Design Systems, Inc. (a) | 4,575 | 97,905 | |||||||||
| Electronic Arts, Inc. (a) | 1,625 | 79,040 | |||||||||
| Synopsys, Inc. (a) | 2,450 | 59,927 | |||||||||
| 374,317 | |||||||||||
| 1,858,171 | |||||||||||
| Materials (6.9%) | |||||||||||
| Chemicals (3.0%) | |||||||||||
| Air Products & Chemicals, Inc. | 3,850 | 332,525 | |||||||||
| PPG Industries, Inc. | 3,200 | 244,064 | |||||||||
| 576,589 | |||||||||||
See Accompanying Notes to Financial Statements.
76
CMG MID CAP VALUE FUND
A Portfolio of Columbia Funds Institutional Trust
SCHEDULE OF INVESTMENTS
| Shares | Value | ||||||||||
| Common Stocks (continued) | |||||||||||
| Construction Materials (1.1%) | |||||||||||
| Martin Marietta Materials, Inc. | 825 | $ | 113,025 | ||||||||
| Vulcan Materials Co. | 1,000 | 95,720 | |||||||||
| 208,745 | |||||||||||
| Containers & Packaging (1.8%) | |||||||||||
| Crown Holdings, Inc. (a) | 6,100 | 149,816 | |||||||||
| Packaging Corp. of America | 7,900 | 201,608 | |||||||||
| 351,424 | |||||||||||
| Metals & Mining (0.4%) | |||||||||||
| Allegheny Technologies, Inc. | 700 | 73,451 | |||||||||
| Paper & Forest Products (0.6%) | |||||||||||
| Weyerhaeuser Co. | 1,800 | 128,232 | |||||||||
| 1,338,441 | |||||||||||
| Telecommunication Services (0.8%) | |||||||||||
| Diversified Telecommunication Services (0.8%) | |||||||||||
| Qwest Communications International, Inc. (a) | 17,000 | 145,010 | |||||||||
| Utilities (13.5%) | |||||||||||
| Electric Utilities (7.8%) | |||||||||||
| American Electric Power Co., Inc. | 6,900 | 300,081 | |||||||||
| Edison International | 4,775 | 252,550 | |||||||||
| Entergy Corp. | 2,900 | 289,884 | |||||||||
| FPL Group, Inc. | 3,575 | 206,385 | |||||||||
| PPL Corp. | 6,525 | 307,588 | |||||||||
| Reliant Energy, Inc. (a) | 5,400 | 138,672 | |||||||||
| 1,495,160 | |||||||||||
| Gas Utilities (0.7%) | |||||||||||
| AGL Resources, Inc. | 3,775 | 142,318 | |||||||||
| Independent Power Producers & Energy Traders (0.7%) | |||||||||||
| Mirant Corp. (a) | 3,400 | 128,622 | |||||||||
| Multi-Utilities (4.3%) | |||||||||||
| PG&E Corp. | 6,225 | 266,492 | |||||||||
| Public Service Enterprise Group, Inc. | 2,000 | 172,300 | |||||||||
| Sempra Energy | 4,175 | 220,106 | |||||||||
| Wisconsin Energy Corp. | 4,100 | 176,013 | |||||||||
| 834,911 | |||||||||||
| 2,601,011 | |||||||||||
| Total Common Stocks (Cost of $15,531,702) | 18,724,550 | ||||||||||
See Accompanying Notes to Financial Statements.
77
CMG MID CAP VALUE FUND
A Portfolio of Columbia Funds Institutional Trust
SCHEDULE OF INVESTMENTS
| Par | Value | ||||||||||
| Convertible Bond (0.2%) | |||||||||||
| Consumer Cyclical (0.2%) | |||||||||||
| Auto Manufacturers (0.2%) | |||||||||||
| Ford Motor Co. 4.250% 12/15/36 | $ | 38,000 | $ | 43,985 | |||||||
| Total Convertible Bond (Cost of $39,997) | 43,985 | ||||||||||
| Short-Term Obligation (2.5%) | |||||||||||
| Repurchase agreement with Fixed Income Clearing Corp., dated 07/31/07, due 08/01/07 at 5.030%, collateralized by a U.S. Treasury Obligation maturing 11/30/11, market value of $486,213 (repurchase proceeds $476,067) | 476,000 | 476,000 | |||||||||
| Total Short-Term Obligation (Cost of $476,000) | 476,000 | ||||||||||
| Total Investments (99.7%) (Cost of $16,047,699) (b) | 19,244,535 | ||||||||||
| Other Assets & Liabilities, Net (0.3%) | 51,915 | ||||||||||
| Net Assets (100.0%) | $ | 19,296,450 | |||||||||
Notes to Schedule of Investments:
(a) Non-income producing security.
(b) Cost for federal income tax purposes is $16,055,845.
See Accompanying Notes to Financial Statements.
78
CMG MID CAP VALUE FUND
A Portfolio of Columbia Funds Institutional Trust
SCHEDULE OF INVESTMENTS
At July 31, 2007, the Fund held investments in the following sectors:
| Sector (Unaudited) | % of Net Assets | ||||||
| Financials | 25.4 | ||||||
| Utilities | 13.5 | ||||||
| Industrials | 12.6 | ||||||
| Information Technology | 9.6 | ||||||
| Consumer Staples | 8.4 | ||||||
| Consumer Discretionary | 6.9 | ||||||
| Materials | 6.9 | ||||||
| Energy | 6.8 | ||||||
| Health Care | 6.1 | ||||||
| Telecommunication Services | 0.8 | ||||||
| Consumer Cyclical | 0.2 | ||||||
| 97.2 | |||||||
| Short-Term Obligation | 2.5 | ||||||
| Other Assets & Liabilities, Net | 0.3 | ||||||
| 100.0 | |||||||
For the year ended July 31, 2007, transactions in written options were as follows:
| Number of contracts | Premium received | ||||||||||
| Options outstanding at July 31, 2006 | - | $ | - | ||||||||
| Options written | 10 | 1,116 | |||||||||
| Options terminated in closing purchase transactions | - | - | |||||||||
| Options exercised | - | - | |||||||||
| Options expired | (10 | ) | (1,116 | ) | |||||||
| Options outstanding at July 31, 2007 | - | - | |||||||||
| Acronym | Name | ||||
| ADR | American Depositary Receipt | ||||
See Accompanying Notes to Financial Statements.
79
CMG SMALL CAP GROWTH FUND
A Portfolio of Columbia Funds Institutional Trust
SCHEDULE OF INVESTMENTS
July 31, 2007
| Shares | Value | ||||||||||
| Common Stocks (95.8%) | |||||||||||
| Consumer Discretionary (17.2%) | |||||||||||
| Auto Components (0.4%) | |||||||||||
| Spartan Motors, Inc. | 13,358 | $ | 163,095 | ||||||||
| Diversified Consumer Services (1.9%) | |||||||||||
| DeVry, Inc. | 3,520 | 114,048 | |||||||||
| New Oriental Education & Technology Group, ADR (a) | 4,320 | 223,646 | |||||||||
| Sotheby's | 6,230 | 266,333 | |||||||||
| Strayer Education, Inc. | 940 | 142,438 | |||||||||
| 746,465 | |||||||||||
| Hotels, Restaurants & Leisure (3.7%) | |||||||||||
| Bally Technologies, Inc. (a) | 5,400 | 132,840 | |||||||||
| Buffalo Wild Wings, Inc. (a) | 3,300 | 142,626 | |||||||||
| Chipotle Mexican Grill, Inc., Class A (a) | 1,290 | 113,959 | |||||||||
| Life Time Fitness, Inc. (a) | 3,990 | 205,166 | |||||||||
| Orient-Express Hotels Ltd., Class A | 4,960 | 230,392 | |||||||||
| Pinnacle Entertainment, Inc. (a) | 5,905 | 156,541 | |||||||||
| Ruby Tuesday, Inc. | 4,430 | 98,567 | |||||||||
| Scientific Games Corp., Class A (a) | 5,780 | 198,312 | |||||||||
| Texas Roadhouse, Inc., Class A (a) | 16,310 | 193,600 | |||||||||
| 1,472,003 | |||||||||||
| Household Durables (0.5%) | |||||||||||
| Gafisa SA, ADR (a) | 6,550 | 205,998 | |||||||||
| Internet & Catalog Retail (0.9%) | |||||||||||
| Priceline.com, Inc. (a) | 3,660 | 233,508 | |||||||||
| Shutterfly, Inc. (a) | 5,450 | 140,337 | |||||||||
| 373,845 | |||||||||||
| Leisure Equipment & Products (0.9%) | |||||||||||
| Smith & Wesson Holding Corp. (a) | 18,330 | 344,604 | |||||||||
| Media (1.5%) | |||||||||||
| Knology, Inc. (a) | 24,350 | 377,912 | |||||||||
| National CineMedia, Inc. (a) | 9,034 | 224,947 | |||||||||
| 602,859 | |||||||||||
| Specialty Retail (4.3%) | |||||||||||
| DSW, Inc., Class A (a) | 6,920 | 230,021 | |||||||||
| GameStop Corp., Class A (a) | 11,836 | 477,582 | |||||||||
| Hibbett Sports, Inc. (a) | 7,820 | 200,427 | |||||||||
| J Crew Group, Inc. (a) | 4,290 | 215,787 | |||||||||
| Men's Wearhouse, Inc. | 3,180 | 157,092 | |||||||||
| Monro Muffler Brake, Inc. | 5,840 | 195,523 | |||||||||
| Tween Brands, Inc. (a) | 2,300 | 87,998 | |||||||||
| Zumiez, Inc. (a) | 3,920 | 145,001 | |||||||||
| 1,709,431 | |||||||||||
See Accompanying Notes to Financial Statements.
80
CMG SMALL CAP GROWTH FUND
A Portfolio of Columbia Funds Institutional Trust
SCHEDULE OF INVESTMENTS
| Shares | Value | ||||||||||
| Common Stocks (continued) | |||||||||||
| Textiles, Apparel & Luxury Goods (3.1%) | |||||||||||
| Carter's, Inc. (a) | 4,600 | $ | 97,382 | ||||||||
| CROCS, Inc. (a) | 8,090 | 479,899 | |||||||||
| Volcom, Inc. (a) | 6,171 | 218,947 | |||||||||
| Warnaco Group, Inc. (a) | 12,140 | 438,375 | |||||||||
| 1,234,603 | |||||||||||
| 6,852,903 | |||||||||||
| Energy (6.7%) | |||||||||||
| Energy Equipment & Services (2.9%) | |||||||||||
| Atwood Oceanics, Inc. (a) | 5,750 | 394,450 | |||||||||
| Core Laboratories NV (a) | 2,930 | 315,356 | |||||||||
| Hornbeck Offshore Services, Inc. (a) | 3,710 | 159,715 | |||||||||
| Oil States International, Inc. (a) | 6,090 | 266,377 | |||||||||
| 1,135,898 | |||||||||||
| Oil, Gas & Consumable Fuels (3.8%) | |||||||||||
| Arena Resources, Inc. (a) | 3,800 | 206,378 | |||||||||
| Berry Petroleum Co., Class A | 8,500 | 316,285 | |||||||||
| Carrizo Oil & Gas, Inc. (a) | 6,710 | 245,385 | |||||||||
| Foundation Coal Holdings, Inc. | 5,310 | 185,053 | |||||||||
| Parallel Petroleum Corp. (a) | 12,346 | 251,488 | |||||||||
| PetroHawk Energy Corp. (a) | 13,960 | 209,260 | |||||||||
| Ship Finance International Ltd. | 4,290 | 119,906 | |||||||||
| 1,533,755 | |||||||||||
| 2,669,653 | |||||||||||
| Financials (6.6%) | |||||||||||
| Capital Markets (2.1%) | |||||||||||
| Affiliated Managers Group, Inc. (a) | 3,540 | 400,020 | |||||||||
| GFI Group, Inc. (a) | 2,750 | 204,930 | |||||||||
| Waddell & Reed Financial, Inc., Class A | 10,030 | 252,856 | |||||||||
| 857,806 | |||||||||||
| Commercial Banks (1.4%) | |||||||||||
| Signature Bank (a) | 6,520 | 201,403 | |||||||||
| Sterling Financial Corp. | 8,640 | 196,214 | |||||||||
| UCBH Holdings, Inc. | 9,490 | 156,016 | |||||||||
| 553,633 | |||||||||||
| Consumer Finance (0.5%) | |||||||||||
| First Cash Financial Services, Inc. (a) | 9,210 | 200,686 | |||||||||
| Diversified Financial Services (0.3%) | |||||||||||
| Genesis Lease Ltd. | 4,541 | 116,749 | |||||||||
| Insurance (0.8%) | |||||||||||
| ProAssurance Corp. (a) | 6,060 | 299,243 | |||||||||
See Accompanying Notes to Financial Statements.
81
CMG SMALL CAP GROWTH FUND
A Portfolio of Columbia Funds Institutional Trust
SCHEDULE OF INVESTMENTS
| Shares | Value | ||||||||||
| Common Stocks (continued) | |||||||||||
| Real Estate Investment Trusts (REITs) (1.5%) | |||||||||||
| Alexandria Real Estate Equities, Inc. | 2,420 | $ | 208,434 | ||||||||
| FelCor Lodging Trust, Inc. | 7,850 | 172,386 | |||||||||
| Redwood Trust, Inc. | 2,690 | 77,472 | |||||||||
| Supertel Hospitality, Inc. | 16,510 | 133,071 | |||||||||
| 591,363 | |||||||||||
| 2,619,480 | |||||||||||
| Health Care (20.6%) | |||||||||||
| Biotechnology (5.9%) | |||||||||||
| Alexion Pharmaceuticals, Inc. (a) | 3,500 | 203,560 | |||||||||
| Alkermes, Inc. (a) | 12,670 | 180,421 | |||||||||
| Allos Therapeutics, Inc. (a) | 37,920 | 164,952 | |||||||||
| Applera Corp. - Celera Group (a) | 7,620 | 91,592 | |||||||||
| Ariad Pharmaceuticals, Inc. (a) | 25,840 | 113,438 | |||||||||
| ArQule, Inc. (a) | 12,240 | 69,523 | |||||||||
| Array Biopharma, Inc. (a) | 15,320 | 153,966 | |||||||||
| BioMarin Pharmaceuticals, Inc. (a) | 13,740 | 248,144 | |||||||||
| Cubist Pharmaceuticals, Inc. (a) | 8,510 | 196,241 | |||||||||
| Myriad Genetics, Inc. (a) | 2,740 | 102,421 | |||||||||
| Onyx Pharmaceuticals, Inc. (a) | 10,160 | 282,550 | |||||||||
| OSI Pharmaceuticals, Inc. (a) | 5,460 | 176,030 | |||||||||
| Savient Pharmaceuticals, Inc. (a) | 7,460 | 88,326 | |||||||||
| Seattle Genetics, Inc. (a) | 10,350 | 98,636 | |||||||||
| United Therapeutics Corp. (a) | 2,770 | 192,127 | |||||||||
| 2,361,927 | |||||||||||
| Health Care Equipment & Supplies (5.6%) | |||||||||||
| Align Technology, Inc. (a) | 7,900 | 206,190 | |||||||||
| Gen-Probe, Inc. (a) | 2,110 | 132,951 | |||||||||
| Hologic, Inc. (a) | 6,553 | 339,445 | |||||||||
| Immucor, Inc. (a) | 6,710 | 209,084 | |||||||||
| Kyphon, Inc. (a) | 6,692 | 439,129 | |||||||||
| Micrus Endovascular Corp. (a) | 4,350 | 102,312 | |||||||||
| Mindray Medical International Ltd., ADR | 3,410 | 105,710 | |||||||||
| Northstar Neuroscience, Inc. (a) | 10,310 | 105,677 | |||||||||
| NuVasive, Inc. (a) | 13,600 | 390,048 | |||||||||
| Sirona Dental Systems, Inc. (a) | 3,030 | 107,141 | |||||||||
| Spectranetics Corp. (a) | 8,660 | 112,667 | |||||||||
| 2,250,354 | |||||||||||
| Health Care Providers & Services (2.9%) | |||||||||||
| HealthExtras, Inc. (a) | 12,615 | 338,461 | |||||||||
| Healthways, Inc. (a) | 2,050 | 89,585 | |||||||||
| Psychiatric Solutions, Inc. (a) | 7,460 | 254,311 | |||||||||
| Sunrise Senior Living, Inc. (a) | 7,660 | 304,562 | |||||||||
| VCA Antech, Inc. (a) | 4,407 | 173,371 | |||||||||
| 1,160,290 | |||||||||||
See Accompanying Notes to Financial Statements.
82
CMG SMALL CAP GROWTH FUND
A Portfolio of Columbia Funds Institutional Trust
SCHEDULE OF INVESTMENTS
| Shares | Value | ||||||||||
| Common Stocks (continued) | |||||||||||
| Health Care Technology (0.9%) | |||||||||||
| Allscripts Healthcare Solutions, Inc. (a) | 14,744 | $ | 335,426 | ||||||||
| Life Sciences Tools & Services (2.6%) | |||||||||||
| ICON PLC, ADR (a) | 14,920 | 697,808 | |||||||||
| Illumina, Inc. (a) | 7,300 | 332,661 | |||||||||
| 1,030,469 | |||||||||||
| Pharmaceuticals (2.7%) | |||||||||||
| BioMimetic Therapeutics, Inc. (a) | 5,543 | 79,985 | |||||||||
| Medicis Pharmaceutical Corp., Class A | 8,740 | 249,352 | |||||||||
| MGI Pharma, Inc. (a) | 8,460 | 211,754 | |||||||||
| Penwest Pharmaceuticals Co. (a) | 7,820 | 100,409 | |||||||||
| Pozen, Inc. (a) | 13,230 | 220,280 | |||||||||
| Viropharma, Inc. (a) | 4,480 | 57,568 | |||||||||
| XenoPort, Inc. (a) | 3,610 | 154,111 | |||||||||
| 1,073,459 | |||||||||||
| 8,211,925 | |||||||||||
| Industrials (15.6%) | |||||||||||
| Aerospace & Defense (2.0%) | |||||||||||
| BE Aerospace, Inc. (a) | 12,227 | 495,927 | |||||||||
| Ladish Co., Inc. (a) | 6,060 | 293,850 | |||||||||
| 789,777 | |||||||||||
| Commercial Services & Supplies (4.1%) | |||||||||||
| ACCO Brands Corp. (a) | 7,830 | 161,924 | |||||||||
| Advisory Board Co. (a) | 5,250 | 270,322 | |||||||||
| Huron Consulting Group, Inc. (a) | 6,305 | 428,299 | |||||||||
| Knoll, Inc. | 13,450 | 266,445 | |||||||||
| Resources Connection, Inc. (a) | 8,560 | 277,943 | |||||||||
| Waste Connections, Inc. (a) | 8,000 | 248,000 | |||||||||
| 1,652,933 | |||||||||||
| Construction & Engineering (0.8%) | |||||||||||
| Granite Construction, Inc. | 1,430 | 92,936 | |||||||||
| Perini Corp. (a) | 3,608 | 221,567 | |||||||||
| 314,503 | |||||||||||
| Electrical Equipment (2.7%) | |||||||||||
| Acuity Brands, Inc. | 2,590 | 153,069 | |||||||||
| Franklin Electric Co., Inc. | 1,407 | 65,538 | |||||||||
| General Cable Corp. (a) | 4,980 | 395,910 | |||||||||
| JA Solar Holdings Co., Ltd., ADR (a) | 5,659 | 207,346 | |||||||||
| SunPower Corp., Class A (a) | 3,590 | 253,202 | |||||||||
| 1,075,065 | |||||||||||
| Machinery (2.9%) | |||||||||||
| Actuant Corp., Class A | 2,570 | 156,719 | |||||||||
| Barnes Group, Inc. | 6,560 | 204,672 | |||||||||
| Bucyrus International, Inc., Class A | 5,370 | 341,317 | |||||||||
See Accompanying Notes to Financial Statements.
83
CMG SMALL CAP GROWTH FUND
A Portfolio of Columbia Funds Institutional Trust
SCHEDULE OF INVESTMENTS
| Shares | Value | ||||||||||
| Common Stocks (continued) | |||||||||||
| Machinery (continued) | |||||||||||
| Force Protection, Inc. (a) | 6,760 | $ | 106,132 | ||||||||
| Kaydon Corp. | 3,040 | 161,758 | |||||||||
| RBC Bearings, Inc. (a) | 4,761 | 181,918 | |||||||||
| 1,152,516 | |||||||||||
| Marine (2.0%) | |||||||||||
| Diana Shipping, Inc. | 12,067 | 338,479 | |||||||||
| Genco Shipping & Trading Ltd. | 4,680 | 263,625 | |||||||||
| Ultrapetrol Bahamas Ltd. (a) | 8,820 | 207,270 | |||||||||
| 809,374 | |||||||||||
| Road & Rail (0.4%) | |||||||||||
| Genesee & Wyoming, Inc., Class A (a) | 6,380 | 163,647 | |||||||||
| Trading Companies & Distributors (0.7%) | |||||||||||
| Houston Wire & Cable Co. | 10,708 | 275,945 | |||||||||
| 6,233,760 | |||||||||||
| Information Technology (21.9%) | |||||||||||
| Communications Equipment (3.9%) | |||||||||||
| CommScope, Inc. (a) | 2,090 | 113,759 | |||||||||
| Comtech Group, Inc. (a) | 7,120 | 101,246 | |||||||||
| F5 Networks, Inc. (a) | 2,080 | 180,315 | |||||||||
| NETGEAR, Inc. (a) | 12,300 | 340,218 | |||||||||
| Riverbed Technology, Inc. (a) | 5,380 | 237,581 | |||||||||
| ShoreTel, Inc. (a) | 10,713 | 139,483 | |||||||||
| Sierra Wireless, Inc. (a) | 7,810 | 176,897 | |||||||||
| Sirenza Microdevices, Inc. (a) | 12,000 | 136,320 | |||||||||
| Starent Networks Corp. (a) | 6,883 | 124,720 | |||||||||
| 1,550,539 | |||||||||||
| Electronic Equipment & Instruments (1.4%) | |||||||||||
| Anixter International, Inc. | 1,930 | 159,515 | |||||||||
| Cogent, Inc. (a) | 11,560 | 153,864 | |||||||||
| FLIR Systems, Inc. (a) | 5,530 | 241,384 | |||||||||
| 554,763 | |||||||||||
| Internet Software & Services (3.8%) | |||||||||||
| DealerTrack Holdings, Inc. (a) | 5,610 | 202,297 | |||||||||
| Digital River, Inc. (a) | 7,070 | 318,221 | |||||||||
| Equinix, Inc. (a) | 2,730 | 237,264 | |||||||||
| Keynote Systems, Inc. (a) | 11,290 | 169,237 | |||||||||
| Omniture, Inc. (a) | 7,618 | 174,071 | |||||||||
| Vocus, Inc. (a) | 14,600 | 410,114 | |||||||||
| 1,511,204 | |||||||||||
| IT Services (1.3%) | |||||||||||
| Acxiom Corp. | 8,530 | 214,615 | |||||||||
| Gartner, Inc. (a) | 8,250 | 172,672 | |||||||||
| RightNow Technologies, Inc. (a) | 10,350 | 136,620 | |||||||||
| 523,907 | |||||||||||
See Accompanying Notes to Financial Statements.
84
CMG SMALL CAP GROWTH FUND
A Portfolio of Columbia Funds Institutional Trust
SCHEDULE OF INVESTMENTS
| Shares | Value | ||||||||||
| Common Stocks (continued) | |||||||||||
| Semiconductors & Semiconductor Equipment (5.2%) | |||||||||||
| Atheros Communications, Inc. (a) | 15,953 | $ | 444,770 | ||||||||
| ATMI, Inc. (a) | 9,870 | 286,033 | |||||||||
| Hittite Microwave Corp. (a) | 2,940 | 118,247 | |||||||||
| MIPS Technologies, Inc. (a) | 10,870 | 96,199 | |||||||||
| Monolithic Power Systems, Inc. (a) | 7,410 | 123,895 | |||||||||
| MoSys, Inc. (a) | 14,300 | 120,263 | |||||||||
| PLX Technology, Inc. (a) | 7,520 | 83,021 | |||||||||
| Techwell, Inc. (a) | 2,983 | 37,228 | |||||||||
| Tessera Technologies, Inc. (a) | 6,599 | 271,417 | |||||||||
| Verigy Ltd. (a) | 20,310 | 496,782 | |||||||||
| 2,077,855 | |||||||||||
| Software (6.3%) | |||||||||||
| ACI Worldwide, Inc. (a) | 6,635 | 202,567 | |||||||||
| Activision, Inc. (a) | 9,070 | 155,188 | |||||||||
| Ansoft Corp. (a) | 4,750 | 120,127 | |||||||||
| ANSYS, Inc. (a) | 7,100 | 184,884 | |||||||||
| BladeLogic, Inc. (a) | 291 | 7,493 | |||||||||
| Concur Technologies, Inc. (a) | 9,430 | 225,000 | |||||||||
| Informatica Corp. (a) | 8,800 | 122,672 | |||||||||
| Macrovision Corp. (a) | 4,190 | 99,638 | |||||||||
| Magma Design Automation, Inc. (a) | 8,880 | 131,513 | |||||||||
| Micros Systems, Inc. (a) | 3,749 | 199,747 | |||||||||
| Nuance Communications, Inc. (a) | 12,196 | 200,990 | |||||||||
| Perfect World Co., Ltd., ADR (a) | 206 | 4,965 | |||||||||
| Taleo Corp., Class A (a) | 9,600 | 206,496 | |||||||||
| THQ, Inc. (a) | 7,030 | 202,183 | |||||||||
| Tyler Technologies, Inc. (a) | 13,380 | 160,961 | |||||||||
| Ultimate Software Group, Inc. (a) | 7,130 | 193,437 | |||||||||
| Verint Systems, Inc. (a) | 3,190 | 96,497 | |||||||||
| 2,514,358 | |||||||||||
| 8,732,626 | |||||||||||
| Materials (3.9%) | |||||||||||
| Chemicals (0.4%) | |||||||||||
| Terra Industries, Inc. (a) | 7,570 | 185,692 | |||||||||
| Metals & Mining (3.5%) | |||||||||||
| Carpenter Technology Corp. | 2,700 | 320,463 | |||||||||
| Century Aluminum Co. (a) | 3,073 | 158,383 | |||||||||
| Claymont Steel Holdings, Inc. (a) | 9,253 | 184,412 | |||||||||
| FNX Mining Co., Inc. (a) | 6,440 | 196,677 | |||||||||
| Lundin Mining Corp. (a) | 10,420 | 136,085 | |||||||||
| RTI International Metals, Inc. (a) | 2,320 | 183,837 | |||||||||
| Universal Stainless & Alloy (a) | 5,640 | 212,854 | |||||||||
| 1,392,711 | |||||||||||
| 1,578,403 | |||||||||||
See Accompanying Notes to Financial Statements.
85
CMG SMALL CAP GROWTH FUND
A Portfolio of Columbia Funds Institutional Trust
SCHEDULE OF INVESTMENTS
| Shares | Value | ||||||||||
| Common Stocks (continued) | |||||||||||
| Telecommunication Services (3.3%) | |||||||||||
| Diversified Telecommunication Services (0.9%) | |||||||||||
| Cogent Communications Group, Inc. (a) | 12,610 | $ | 361,655 | ||||||||
| Wireless Telecommunication Services (2.4%) | |||||||||||
| Centennial Communications Corp. (a) | 13,010 | 133,092 | |||||||||
| Millicom International Cellular SA (a) | 4,010 | 322,003 | |||||||||
| SBA Communications Corp., Class A (a) | 15,540 | 517,793 | |||||||||
| 972,888 | |||||||||||
| 1,334,543 | |||||||||||
| Total Common Stocks (Cost of $32,152,559) | 38,233,293 | ||||||||||
| Par | |||||||||||
| Short-Term Obligation (4.4%) | |||||||||||
| Repurchase agreement with Fixed Income Clearing Corp., dated 07/31/07, due 08/01/07 at 5.030%, collateralized by a U.S. Treasury Obligation maturing 11/30/11, market value $1,769,413 (repurchase proceeds $1,730,242) | $ | 1,730,000 | 1,730,000 | ||||||||
| Total Short-Term Obligation (Cost of $1,730,000) | 1,730,000 | ||||||||||
| Total Investments (100.2%) (Cost of $33,882,559)(b) | 39,963,293 | ||||||||||
| Other Assets & Liabilities, Net (-0.2%) | (64,043 | ) | |||||||||
| Net Assets (100.0%) | $ | 39,899,250 | |||||||||
Notes to Schedule of Investments:
(a) Non-income producing security.
(b) Cost for federal income tax purposes is $34,045,099.
See Accompanying Notes to Financial Statements.
86
CMG SMALL CAP GROWTH FUND
A Portfolio of Columbia Funds Institutional Trust
SCHEDULE OF INVESTMENTS
For the period ended July 31, 2007, transactions in written options were as follows:
| Number of contracts | Premium received | ||||||||||
| Options outstanding at July 31, 2006 | - | $ | - | ||||||||
| Options written | 17 | 1,853 | |||||||||
| Options terminated in closing purchase transactions | - | - | |||||||||
| Options exercised | - | - | |||||||||
| Options expired | (17 | ) | (1,853 | ) | |||||||
| Options outstanding at July 31, 2007 | - | - | |||||||||
At July 31, 2007, the Fund held investments in the following sectors:
| Sector (Unaudited) | % of Net Assets | ||||||
| Information Technology | 21.9 | ||||||
| Health Care | 20.6 | ||||||
| Consumer Discretionary | 17.2 | ||||||
| Industrials | 15.6 | ||||||
| Energy | 6.7 | ||||||
| Financials | 6.6 | ||||||
| Materials | 3.9 | ||||||
| Telecommunication Services | 3.3 | ||||||
| 95.8 | |||||||
| Short-Term Obligation | 4.4 | ||||||
| Other Assets & Liabilities, Net | (0.2 | ) | |||||
| 100.0 | |||||||
| Acronym | Name | ||||
| ADR | American Depositary Receipt | ||||
See Accompanying Notes to Financial Statements.
87
CMG SMALL CAP VALUE FUND
A Portfolio of Columbia Funds Institutional Trust
SCHEDULE OF INVESTMENTS
July 31, 2007
| Shares | Value | ||||||||||
| Common Stocks (99.9%) | |||||||||||
| Consumer Discretionary (10.6%) | |||||||||||
| Auto Components (1.1%) | |||||||||||
| American Axle & Manufacturing Holdings, Inc. | 2,470 | $ | 59,774 | ||||||||
| BorgWarner, Inc. | 2,010 | 173,764 | |||||||||
| Modine Manufacturing Co. | 4,610 | 118,016 | |||||||||
| 351,554 | |||||||||||
| Distributors (0.3%) | |||||||||||
| Building Materials Holding Corp. | 7,110 | 98,758 | |||||||||
| Diversified Consumer Services (0.5%) | |||||||||||
| Regis Corp. | 4,170 | 145,366 | |||||||||
| Hotels, Restaurants & Leisure (1.5%) | |||||||||||
| Bob Evans Farms, Inc. | 4,030 | 130,773 | |||||||||
| CEC Entertainment, Inc. (a) | 2,690 | 79,382 | |||||||||
| Landry's Restaurants, Inc. | 5,440 | 144,106 | |||||||||
| O'Charleys, Inc. | 4,250 | 75,352 | |||||||||
| Vail Resorts, Inc. (a) | 1,090 | 58,370 | |||||||||
| 487,983 | |||||||||||
| Household Durables (2.3%) | |||||||||||
| American Greetings Corp., Class A | 10,100 | 249,773 | |||||||||
| CSS Industries, Inc. | 2,930 | 105,304 | |||||||||
| Ethan Allen Interiors, Inc. | 3,160 | 107,946 | |||||||||
| Furniture Brands International, Inc. | 8,260 | 91,025 | |||||||||
| Kimball International, Inc., Class B | 6,660 | 87,046 | |||||||||
| Skyline Corp. | 3,870 | 108,167 | |||||||||
| 749,261 | |||||||||||
| Multiline Retail (0.2%) | |||||||||||
| 99 Cents Only Stores (a) | 5,670 | 69,004 | |||||||||
| Specialty Retail (2.9%) | |||||||||||
| America's Car-Mart, Inc. (a) | 11,507 | 149,706 | |||||||||
| GameStop Corp., Class A (a) | 5,110 | 206,189 | |||||||||
| Monro Muffler Brake, Inc. | 5,090 | 170,413 | |||||||||
| Payless Shoesource, Inc. (a) | 4,520 | 120,322 | |||||||||
| Rent-A-Center, Inc. (a) | 6,790 | 131,794 | |||||||||
| United Retail Group, Inc. (a) | 5,670 | 61,633 | |||||||||
| Zale Corp. (a) | 4,110 | 87,255 | |||||||||
| 927,312 | |||||||||||
| Textiles, Apparel & Luxury Goods (1.8%) | |||||||||||
| Delta Apparel, Inc. | 3,670 | 70,941 | |||||||||
| Hampshire Group Ltd. (a) | 6,692 | 130,494 | |||||||||
| Hartmarx Corp. (a) | 12,679 | 108,406 | |||||||||
| K-Swiss, Inc., Class A | 3,120 | 69,482 | |||||||||
| Wolverine World Wide, Inc. | 7,150 | 193,479 | |||||||||
| 572,802 | |||||||||||
| 3,402,040 | |||||||||||
See Accompanying Notes to Financial Statements.
88
CMG SMALL CAP VALUE FUND
A Portfolio of Columbia Funds Institutional Trust
SCHEDULE OF INVESTMENTS
| Shares | Value | ||||||||||
| Common Stocks (continued) | |||||||||||
| Consumer Staples (4.8%) | |||||||||||
| Beverages (0.4%) | |||||||||||
| MGP Ingredients, Inc. | 7,537 | $ | 122,476 | ||||||||
| Food & Staples Retailing (1.4%) | |||||||||||
| BJ's Wholesale Club, Inc. (a) | 3,740 | 127,011 | |||||||||
| Ruddick Corp. | 2,800 | 77,840 | |||||||||
| Weis Markets, Inc. | 5,930 | 233,049 | |||||||||
| 437,900 | |||||||||||
| Food Products (3.0%) | |||||||||||
| American Italian Pasta Co., Class A (a) | 6,430 | 52,405 | |||||||||
| Flowers Foods, Inc. | 6,638 | 136,079 | |||||||||
| Fresh Del Monte Produce, Inc. | 5,820 | 149,283 | |||||||||
| J&J Snack Foods Corp. | 3,260 | 112,307 | |||||||||
| Lancaster Colony Corp. | 3,510 | 135,907 | |||||||||
| Lance, Inc. | 4,760 | 119,904 | |||||||||
| Maui Land & Pineapple Co., Inc. (a) | 3,230 | 102,843 | |||||||||
| Ralcorp Holdings, Inc. (a) | 2,880 | 149,645 | |||||||||
| 958,373 | |||||||||||
| 1,518,749 | |||||||||||
| Energy (6.0%) | |||||||||||
| Energy Equipment & Services (2.1%) | |||||||||||
| Complete Production Services, Inc. (a) | 2,773 | 64,306 | |||||||||
| Grey Wolf, Inc. (a) | 18,580 | 137,678 | |||||||||
| Lufkin Industries, Inc. | 2,827 | 167,387 | |||||||||
| Oil States International, Inc. (a) | 2,340 | 102,351 | |||||||||
| Superior Well Services, Inc. (a) | 1,390 | 26,980 | |||||||||
| TriCo Marine Services, Inc. (a) | 4,693 | 166,367 | |||||||||
| 665,069 | |||||||||||
| Oil, Gas & Consumable Fuels (3.9%) | |||||||||||
| Alpha Natural Resources, Inc. (a) | 5,490 | 97,996 | |||||||||
| Aurora Oil & Gas Corp. (a) | 13,960 | 27,362 | |||||||||
| Bois d'Arc Energy, Inc. (a) | 4,398 | 71,511 | |||||||||
| Comstock Resources, Inc. (a) | 1,910 | 51,303 | |||||||||
| Harvest Natural Resources, Inc. (a) | 12,290 | 138,385 | |||||||||
| Nordic American Tanker Shipping Limited | 3,733 | 148,200 | |||||||||
| Peabody Energy Corp. | 2,660 | 112,412 | |||||||||
| Range Resources Corp. | 7,040 | 261,466 | |||||||||
| Stone Energy Corp. (a) | 2,580 | 83,850 | |||||||||
| Swift Energy Co. (a) | 1,750 | 74,795 | |||||||||
| Western Refining, Inc. | 3,413 | 189,421 | |||||||||
| 1,256,701 | |||||||||||
| 1,921,770 | |||||||||||
See Accompanying Notes to Financial Statements.
89
CMG SMALL CAP VALUE FUND
A Portfolio of Columbia Funds Institutional Trust
SCHEDULE OF INVESTMENTS
| Shares | Value | ||||||||||
| Common Stocks (continued) | |||||||||||
| Financials (26.1%) | |||||||||||
| Capital Markets (0.8%) | |||||||||||
| Piper Jaffray Companies, Inc. (a) | 3,520 | $ | 168,679 | ||||||||
| Thomas Weisel Partners Group, Inc. (a) | 5,839 | 81,162 | |||||||||
| 249,841 | |||||||||||
| Commercial Banks (8.9%) | |||||||||||
| BancFirst Corp. | 2,710 | 109,511 | |||||||||
| BancTrust Financial Group, Inc. | 5,492 | 96,000 | |||||||||
| Bank of Granite Corp. | 8,642 | 117,358 | |||||||||
| BankFinancial Corp. | 7,800 | 107,640 | |||||||||
| Bryn Mawr Bank Corp. | 5,246 | 117,720 | |||||||||
| Capitol Bancorp Ltd. | 5,446 | 122,317 | |||||||||
| Central Pacific Financial Corp. | 4,750 | 133,997 | |||||||||
| Chemical Financial Corp. | 7,065 | 153,876 | |||||||||
| City Holding Co. | 1,012 | 33,244 | |||||||||
| Columbia Banking System, Inc. | 4,580 | 116,332 | |||||||||
| Community Trust Bancorp, Inc. | 3,360 | 96,365 | |||||||||
| First Citizens BancShares, Inc., Class A | 704 | 126,495 | |||||||||
| First Financial Corp. | 4,920 | 115,522 | |||||||||
| First National Bank of Alaska | 37 | 80,660 | |||||||||
| Mass Financial Corp., Class A (a) | 13,010 | 58,545 | |||||||||
| Merchants Bancshares, Inc. | 4,967 | 115,085 | |||||||||
| Northrim BanCorp, Inc. | 4,503 | 134,640 | |||||||||
| S&T Bancorp, Inc. | 4,234 | 131,593 | |||||||||
| Sandy Spring Bancorp, Inc. | 2,650 | 71,391 | |||||||||
| South Financial Group, Inc. | 8,200 | 176,792 | |||||||||
| Sterling Bancorp NY | 7,930 | 115,382 | |||||||||
| Taylor Capital Group, Inc. | 4,500 | 122,130 | |||||||||
| UMB Financial Corp. | 5,670 | 211,718 | |||||||||
| Whitney Holding Corp. | 7,390 | 184,676 | |||||||||
| 2,848,989 | |||||||||||
| Consumer Finance (1.6%) | |||||||||||
| Advance America Cash Advance Centers, Inc. | 15,100 | 221,517 | |||||||||
| Cash America International, Inc. | 7,820 | 286,368 | |||||||||
| 507,885 | |||||||||||
| Diversified Financial Services (0.4%) | |||||||||||
| Medallion Financial Corp. | 12,223 | 140,442 | |||||||||
| Insurance (7.5%) | |||||||||||
| American Physicians Capital, Inc. (a) | 4,015 | 152,249 | |||||||||
| Baldwin & Lyons, Inc., Class B | 5,151 | 130,114 | |||||||||
| CNA Surety Corp. (a) | 8,660 | 146,354 | |||||||||
| Commerce Group, Inc. | 6,220 | 178,700 | |||||||||
| Delphi Financial Group, Inc., Class A | 5,610 | 225,354 | |||||||||
| EMC Insurance Group, Inc. | 4,230 | 104,185 | |||||||||
| Harleysville Group, Inc. | 3,235 | 90,612 | |||||||||
| Horace Mann Educators Corp. | 8,930 | 159,222 | |||||||||
| KMG America Corp. (a) | 22,050 | 103,194 | |||||||||
See Accompanying Notes to Financial Statements.
90
CMG SMALL CAP VALUE FUND
A Portfolio of Columbia Funds Institutional Trust
SCHEDULE OF INVESTMENTS
| Shares | Value | ||||||||||
| Common Stocks (continued) | |||||||||||
| Insurance (continued) | |||||||||||
| National Western Life Insurance Co., Class A | 444 | $ | 104,660 | ||||||||
| Navigators Group, Inc. (a) | 5,654 | 295,761 | |||||||||
| Phoenix Companies, Inc. | 12,420 | 171,272 | |||||||||
| ProCentury Corp. | 11,124 | 155,513 | |||||||||
| RLI Corp. | 3,102 | 179,916 | |||||||||
| United America Indemnity Ltd., Class A (a) | 8,640 | 185,587 | |||||||||
| 2,382,693 | |||||||||||
| Real Estate Investment Trusts (REITs) (4.5%) | |||||||||||
| Colonial Properties Trust | 3,650 | 126,254 | |||||||||
| Franklin Street Properties Corp. | 10,866 | 166,793 | |||||||||
| Getty Realty Corp. | 4,120 | 103,824 | |||||||||
| Healthcare Realty Trust, Inc. | 6,420 | 149,072 | |||||||||
| Lexington Corporate Properties Trust | 8,390 | 158,319 | |||||||||
| Potlatch Corp. | 4,610 | 201,411 | |||||||||
| Strategic Hotels & Resorts, Inc. | 5,322 | 113,252 | |||||||||
| Sun Communities, Inc. | 6,440 | 175,297 | |||||||||
| Universal Health Realty Income Trust | 3,890 | 113,783 | |||||||||
| Urstadt Biddle Properties, Inc., Class A | 7,840 | 118,384 | |||||||||
| 1,426,389 | |||||||||||
| Thrifts & Mortgage Finance (2.4%) | |||||||||||
| Bank Mutual Corp. | 10,400 | 109,200 | |||||||||
| Brookline Bancorp, Inc. | 12,500 | 128,375 | |||||||||
| Corus Bankshares, Inc. | 12,652 | 205,722 | |||||||||
| Flagstar BanCorp, Inc. | 12,650 | 135,355 | |||||||||
| TrustCo Bank Corp. NY | 10,490 | 97,347 | |||||||||
| Washington Federal, Inc. | 4,350 | 98,005 | |||||||||
| 774,004 | |||||||||||
| 8,330,243 | |||||||||||
| Health Care (9.1%) | |||||||||||
| Health Care Equipment & Supplies (1.8%) | |||||||||||
| Analogic Corp. | 1,740 | 115,519 | |||||||||
| Haemonetics Corp. (a) | 3,280 | 162,098 | |||||||||
| STERIS Corp. | 8,330 | 227,825 | |||||||||
| Vital Signs, Inc. | 1,400 | 72,814 | |||||||||
| 578,256 | |||||||||||
| Health Care Providers & Services (5.0%) | |||||||||||
| Amedisys, Inc. (a) | 2,580 | 97,653 | |||||||||
| AmSurg Corp. (a) | 4,100 | 103,074 | |||||||||
| Cross Country Healthcare, Inc. (a) | 7,800 | 127,686 | |||||||||
| Gentiva Health Services, Inc. (a) | 8,130 | 162,356 | |||||||||
| Kindred Healthcare, Inc. (a) | 7,150 | 191,477 | |||||||||
| NovaMed, Inc. (a) | 14,940 | 79,630 | |||||||||
| Owens & Minor, Inc. | 3,920 | 150,724 | |||||||||
| Pediatrix Medical Group, Inc. (a) | 6,250 | 337,250 | |||||||||
| RehabCare Group, Inc. (a) | 3,370 | 47,753 | |||||||||
| Res-Care, Inc. (a) | 8,030 | 156,023 | |||||||||
| U.S. Physical Therapy, Inc. (a) | 4,710 | 64,103 | |||||||||
| VistaCare, Inc. (a) | 6,900 | 62,238 | |||||||||
| 1,579,967 | |||||||||||
See Accompanying Notes to Financial Statements.
91
CMG SMALL CAP VALUE FUND
A Portfolio of Columbia Funds Institutional Trust
SCHEDULE OF INVESTMENTS
| Shares | Value | ||||||||||
| Common Stocks (continued) | |||||||||||
| Life Sciences Tools & Services (1.6%) | |||||||||||
| Bio-Rad Laboratories, Inc., Class A (a) | 2,180 | $ | 161,669 | ||||||||
| PAREXEL International Corp. (a) | 5,930 | 239,750 | |||||||||
| Varian, Inc. (a) | 1,800 | 108,252 | |||||||||
| 509,671 | |||||||||||
| Pharmaceuticals (0.7%) | |||||||||||
| Alpharma, Inc., Class A | 5,490 | 136,097 | |||||||||
| Sciele Pharma, Inc. (a) | 3,870 | 89,745 | |||||||||
| 225,842 | |||||||||||
| 2,893,736 | |||||||||||
| Industrials (18.5%) | |||||||||||
| Aerospace & Defense (1.8%) | |||||||||||
| AAR Corp. (a) | 6,998 | 208,751 | |||||||||
| Esterline Technologies Corp. (a) | 5,070 | 234,690 | |||||||||
| Limco-Piedmont, Inc. (a) | 3,268 | 39,706 | |||||||||
| Moog, Inc., Class A (a) | 2,540 | 108,763 | |||||||||
| 591,910 | |||||||||||
| Airlines (0.9%) | |||||||||||
| AirTran Holdings, Inc. (a) | 8,240 | 81,082 | |||||||||
| JetBlue Airways Corp. (a) | 9,455 | 93,132 | |||||||||
| Skywest, Inc. | 5,560 | 124,043 | |||||||||
| 298,257 | |||||||||||
| Building Products (1.8%) | |||||||||||
| Goodman Global, Inc. (a) | 4,734 | 114,184 | |||||||||
| Lennox International, Inc. | 3,480 | 133,284 | |||||||||
| NCI Building Systems, Inc. (a) | 4,620 | 223,423 | |||||||||
| Universal Forest Products, Inc. | 2,320 | 91,779 | |||||||||
| 562,670 | |||||||||||
| Commercial Services & Supplies (4.1%) | |||||||||||
| ABM Industries, Inc. | 4,010 | 100,892 | |||||||||
| Casella Waste Systems, Inc., Class A (a) | 7,860 | 87,482 | |||||||||
| CBIZ, Inc. (a) | 6,992 | 47,615 | |||||||||
| Consolidated Graphics, Inc. (a) | 4,490 | 295,936 | |||||||||
| Healthcare Services Group, Inc. | 6,549 | 181,538 | |||||||||
| IKON Office Solutions, Inc. | 8,530 | 118,226 | |||||||||
| Korn/Ferry International (a) | 5,370 | 126,893 | |||||||||
| Navigant Consulting, Inc. (a) | 6,890 | 108,517 | |||||||||
| TeleTech Holdings, Inc. (a) | 2,490 | 73,032 | |||||||||
| United Stationers, Inc. (a) | 2,450 | 156,163 | |||||||||
| 1,296,294 | |||||||||||
| Construction & Engineering (1.7%) | |||||||||||
| EMCOR Group, Inc. (a) | 6,960 | 249,864 | |||||||||
| KHD Humboldt Wedag International Ltd. (a) | 4,946 | 282,565 | |||||||||
| 532,429 | |||||||||||
| Electrical Equipment (2.3%) | |||||||||||
| Belden CDT, Inc. | 3,430 | 187,895 | |||||||||
| Genlyte Group, Inc. (a) | 3,120 | 217,059 | |||||||||
| Woodward Governor Co. | 5,860 | 338,415 | |||||||||
| 743,369 | |||||||||||
See Accompanying Notes to Financial Statements.
92
CMG SMALL CAP VALUE FUND
A Portfolio of Columbia Funds Institutional Trust
SCHEDULE OF INVESTMENTS
| Shares | Value | ||||||||||
| Common Stocks (continued) | |||||||||||
| Machinery (2.4%) | |||||||||||
| Briggs & Stratton Corp. | 2,320 | $ | 65,795 | ||||||||
| EnPro Industries, Inc. (a) | 5,560 | 218,953 | |||||||||
| Harsco Corp. | 8,040 | 423,386 | |||||||||
| Kadant, Inc. (a) | 2,443 | 65,839 | |||||||||
| 773,973 | |||||||||||
| Road & Rail (2.3%) | |||||||||||
| Amerco, Inc. (a) | 1,800 | 114,930 | |||||||||
| Dollar Thrifty Automotive Group, Inc. (a) | 2,640 | 97,469 | |||||||||
| Genesee & Wyoming, Inc., Class A (a) | 3,230 | 82,849 | |||||||||
| Heartland Express, Inc. | 6,100 | 90,951 | |||||||||
| Ryder System, Inc. | 2,380 | 129,401 | |||||||||
| Vitran Corp., Inc. (a) | 547 | 10,995 | |||||||||
| Werner Enterprises, Inc. | 11,100 | 215,784 | |||||||||
| 742,379 | |||||||||||
| Trading Companies & Distributors (1.2%) | |||||||||||
| Kaman Corp. | 5,020 | 168,120 | |||||||||
| Watsco, Inc. | 4,190 | 209,123 | |||||||||
| 377,243 | |||||||||||
| 5,918,524 | |||||||||||
| Information Technology (13.1%) | |||||||||||
| Communications Equipment (2.1%) | |||||||||||
| Anaren, Inc. (a) | 8,563 | 147,626 | |||||||||
| Bel Fuse, Inc., Class B | 2,100 | 63,504 | |||||||||
| Black Box Corp. | 3,181 | 128,035 | |||||||||
| Dycom Industries, Inc. (a) | 6,700 | 187,265 | |||||||||
| Polycom, Inc. (a) | 3,450 | 106,847 | |||||||||
| Tollgrade Communications, Inc. (a) | 5,660 | 58,411 | |||||||||
| 691,688 | |||||||||||
| Computers & Peripherals (1.5%) | |||||||||||
| Electronics for Imaging, Inc. (a) | 6,350 | 166,751 | |||||||||
| Emulex Corp. (a) | 6,050 | 119,790 | |||||||||
| Imation Corp. | 2,980 | 93,215 | |||||||||
| QLogic Corp. (a) | 5,160 | 68,576 | |||||||||
| Rackable Systems, Inc. (a) | 3,000 | 36,300 | |||||||||
| 484,632 | |||||||||||
| Electronic Equipment & Instruments (3.9%) | |||||||||||
| Agilysys, Inc. | 4,370 | 83,948 | |||||||||
| Anixter International, Inc. (a) | 3,230 | 266,959 | |||||||||
| Benchmark Electronics, Inc. (a) | 6,560 | 145,632 | |||||||||
| Brightpoint, Inc. (a) | 13,806 | 181,273 | |||||||||
| Coherent, Inc. (a) | 2,712 | 78,512 | |||||||||
| MTS Systems Corp. | 3,870 | 161,573 | |||||||||
| NAM TAI Electronics, Inc. | 10,610 | 136,763 | |||||||||
| Vishay Intertechnology, Inc. (a) | 11,820 | 183,328 | |||||||||
| 1,237,988 | |||||||||||
See Accompanying Notes to Financial Statements.
93
CMG SMALL CAP VALUE FUND
A Portfolio of Columbia Funds Institutional Trust
SCHEDULE OF INVESTMENTS
| Shares | Value | ||||||||||
| Common Stocks (continued) | |||||||||||
| IT Services (1.7%) | |||||||||||
| CACI International, Inc., Class A (a) | 1,930 | $ | 85,769 | ||||||||
| CSG Systems International, Inc. (a) | 4,088 | 102,282 | |||||||||
| MAXIMUS, Inc. | 2,390 | 99,878 | |||||||||
| MPS Group, Inc. (a) | 19,460 | 259,402 | |||||||||
| 547,331 | |||||||||||
| Semiconductors & Semiconductor Equipment (2.2%) | |||||||||||
| Actel Corp. (a) | 7,458 | 88,004 | |||||||||
| Advanced Energy Industries, Inc. (a) | 3,950 | 69,955 | |||||||||
| Asyst Technologies, Inc. (a) | 8,553 | 57,134 | |||||||||
| ATMI, Inc. (a) | 1,830 | 53,033 | |||||||||
| Cabot Microelectronics Corp. (a) | 1,630 | 69,487 | |||||||||
| Exar Corp. (a) | 6,660 | 94,106 | |||||||||
| Fairchild Semiconductor International, Inc. (a) | 5,230 | 95,447 | |||||||||
| Standard Microsystems Corp. (a) | 3,510 | 117,199 | |||||||||
| Varian Semiconductor Equipment Associates, Inc. (a) | 1,135 | 53,345 | |||||||||
| 697,710 | |||||||||||
| Software (1.7%) | |||||||||||
| ACI Worldwide, Inc. (a) | 4,660 | 142,270 | |||||||||
| Captaris, Inc. (a) | 13,710 | 70,332 | |||||||||
| Lawson Software, Inc. (a) | 5,490 | 52,320 | |||||||||
| MSC.Software Corp. (a) | 10,710 | 139,016 | |||||||||
| Sybase, Inc. (a) | 5,660 | 134,255 | |||||||||
| 538,193 | |||||||||||
| 4,197,542 | |||||||||||
| Materials (6.8%) | |||||||||||
| Chemicals (1.9%) | |||||||||||
| H.B. Fuller Co. | 9,240 | 255,301 | |||||||||
| Minerals Technologies, Inc. | 2,780 | 179,783 | |||||||||
| Sensient Technologies Corp. | 6,320 | 160,528 | |||||||||
| 595,612 | |||||||||||
| Construction Materials (0.6%) | |||||||||||
| Eagle Materials, Inc. | 4,410 | 192,849 | |||||||||
| Containers & Packaging (2.0%) | |||||||||||
| AptarGroup, Inc. | 6,560 | 238,784 | |||||||||
| Greif, Inc., Class A | 4,448 | 244,640 | |||||||||
| Greif, Inc., Class B | 3,223 | 165,630 | |||||||||
| 649,054 | |||||||||||
| Metals & Mining (1.6%) | |||||||||||
| Carpenter Technology Corp. | 1,280 | 151,923 | |||||||||
| Haynes International, Inc. (a) | 1,236 | 111,005 | |||||||||
| Metal Management, Inc. | 2,680 | 112,587 | |||||||||
| Worthington Industries, Inc. | 6,540 | 135,378 | |||||||||
| 510,893 | |||||||||||
| Paper & Forest Products (0.7%) | |||||||||||
| Glatfelter Co. | 9,180 | 123,288 | |||||||||
| Mercer International, Inc. (a) | 12,010 | 104,367 | |||||||||
| 227,655 | |||||||||||
| 2,176,063 | |||||||||||
See Accompanying Notes to Financial Statements.
94
CMG SMALL CAP VALUE FUND
A Portfolio of Columbia Funds Institutional Trust
SCHEDULE OF INVESTMENTS
| Shares | Value | ||||||||||
| Common Stocks (continued) | |||||||||||
| Telecommunication Services (0.4%) | |||||||||||
| Diversified Telecommunication Services (0.4%) | |||||||||||
| North Pittsburgh Systems, Inc. | 4,470 | $ | 104,106 | ||||||||
| Warwick Valley Telephone Co. | 722 | 9,603 | |||||||||
| 113,709 | |||||||||||
| Utilities (4.5%) | |||||||||||
| Electric Utilities (2.8%) | |||||||||||
| ALLETE, Inc. | 2,930 | 128,451 | |||||||||
| El Paso Electric Co. (a) | 7,160 | 166,613 | |||||||||
| Hawaiian Electric Industries, Inc. | 5,060 | 115,419 | |||||||||
| Maine & Maritimes Corp. (a) | 1,290 | 34,998 | |||||||||
| MGE Energy, Inc. | 4,240 | 127,242 | |||||||||
| Otter Tail Corp. | 4,460 | 131,391 | |||||||||
| Portland General Electric Co. | 2,167 | 58,314 | |||||||||
| UIL Holdings Corp. | 4,310 | 127,490 | |||||||||
| 889,918 | |||||||||||
| Gas Utilities (1.0%) | |||||||||||
| Northwest Natural Gas Co. | 3,680 | 153,346 | |||||||||
| WGL Holdings, Inc. | 5,450 | 163,173 | |||||||||
| 316,519 | |||||||||||
| Multi-Utilities (0.7%) | |||||||||||
| CH Energy Group, Inc. | 5,420 | 240,377 | |||||||||
| 1,446,814 | |||||||||||
| Total Common Stocks (Cost of $24,827,368) | 31,919,190 | ||||||||||
| Total Investments (99.9%) (Cost of $24,827,368) (b) | 31,919,190 | ||||||||||
| Other Assets & Liabilities, Net (0.1%) | 32,623 | ||||||||||
| Net Assets (100.0%) | $ | 31,951,813 | |||||||||
Notes to Schedule of Investments:
(a) Non-income producing security.
(b) Cost for federal income tax purposes is $24,910,630.
See Accompanying Notes to Financial Statements.
95
CMG SMALL CAP VALUE FUND
A Portfolio of Columbia Funds Institutional Trust
SCHEDULE OF INVESTMENTS
At July 31, 2007, the Fund held investments in the following sectors:
| Sector (Unaudited) | % of Net Assets | ||||||
| Financials | 26.1 | ||||||
| Industrials | 18.5 | ||||||
| Information Technology | 13.1 | ||||||
| Consumer Discretionary | 10.6 | ||||||
| Health Care | 9.1 | ||||||
| Materials | 6.8 | ||||||
| Energy | 6.0 | ||||||
| Consumer Staples | 4.8 | ||||||
| Utilities | 4.5 | ||||||
| Telecommunication Services | 0.4 | ||||||
| 99.9 | |||||||
| Other Assets & Liabilities, Net | 0.1 | ||||||
| 100.0 | |||||||
See Accompanying Notes to Financial Statements.
96
CMG SMALL/MID CAP FUND
A Portfolio of Columbia Funds Institutional Trust
SCHEDULE OF INVESTMENTS
July 31, 2007
| Shares | Value | ||||||||||
| Common Stocks (97.8%) | |||||||||||
| Consumer Discretionary (16.7%) | |||||||||||
| Auto Components (0.4%) | |||||||||||
| Goodyear Tire & Rubber Co. (a) | 1,540 | $ | 44,229 | ||||||||
| Diversified Consumer Services (2.3%) | |||||||||||
| ITT Educational Services, Inc. (a) | 560 | 59,170 | |||||||||
| New Oriental Education & Technology Group, ADR (a) | 1,130 | 58,500 | |||||||||
| Sotheby's | 1,940 | 82,935 | |||||||||
| Strayer Education, Inc. | 540 | 81,826 | |||||||||
| 282,431 | |||||||||||
| Hotels, Restaurants & Leisure (4.4%) | |||||||||||
| Bally Technologies, Inc. (a) | 1,700 | 41,820 | |||||||||
| Buffalo Wild Wings, Inc. (a) | 1,570 | 67,855 | |||||||||
| Chipotle Mexican Grill, Inc., Class A (a) | 400 | 35,336 | |||||||||
| Orient-Express Hotels Ltd., Class A | 1,795 | 83,378 | |||||||||
| Pinnacle Entertainment, Inc. (a) | 1,712 | 45,385 | |||||||||
| Scientific Games Corp., Class A (a) | 1,700 | 58,327 | |||||||||
| Starwood Hotels & Resorts Worldwide, Inc. | 1,790 | 112,699 | |||||||||
| Texas Roadhouse, Inc., Class A (a) | 5,030 | 59,706 | |||||||||
| Wynn Resorts Ltd. | 520 | 50,211 | |||||||||
| 554,717 | |||||||||||
| Household Durables (0.5%) | |||||||||||
| Gafisa SA, ADR (a) | 2,060 | 64,787 | |||||||||
| Internet & Catalog Retail (0.6%) | |||||||||||
| Priceline.com, Inc. (a) | 1,090 | 69,542 | |||||||||
| Leisure Equipment & Products (0.9%) | |||||||||||
| Smith & Wesson Holding Corp. (a) | 5,820 | 109,416 | |||||||||
| Media (1.7%) | |||||||||||
| Knology, Inc. (a) | 6,340 | 98,397 | |||||||||
| Lamar Advertising Co., Class A | 1,060 | 63,102 | |||||||||
| National CineMedia, Inc. (a) | 2,135 | 53,161 | |||||||||
| 214,660 | |||||||||||
| Specialty Retail (2.8%) | |||||||||||
| DSW, Inc., Class A (a) | 1,710 | 56,840 | |||||||||
| GameStop Corp., Class A (a) | 3,310 | 133,558 | |||||||||
| Hibbett Sporting Goods, Inc. (a) | 2,360 | 60,487 | |||||||||
| Men's Wearhouse, Inc. | 1,010 | 49,894 | |||||||||
| Zumiez, Inc. (a) | 1,450 | 53,636 | |||||||||
| 354,415 | |||||||||||
| Textiles, Apparel & Luxury Goods (3.1%) | |||||||||||
| Coach, Inc. (a) | 1,570 | 71,372 | |||||||||
| CROCS, Inc. (a) | 2,540 | 150,673 | |||||||||
| Volcom, Inc. (a) | 1,383 | 49,069 | |||||||||
| Warnaco Group, Inc. (a) | 3,320 | 119,885 | |||||||||
| 390,999 | |||||||||||
| 2,085,196 | |||||||||||
See Accompanying Notes to Financial Statements.
97
CMG SMALL/MID CAP FUND
A Portfolio of Columbia Funds Institutional Trust
SCHEDULE OF INVESTMENTS
| Shares | Value | ||||||||||
| Common Stocks (continued) | |||||||||||
| Consumer Staples (0.5%) | |||||||||||
| Food Products (0.5%) | |||||||||||
| McCormick & Co., Inc. | 1,770 | $ | 60,463 | ||||||||
| Energy (7.6%) | |||||||||||
| Energy Equipment & Services (3.2%) | |||||||||||
| Atwood Oceanics, Inc. (a) | 1,800 | 123,480 | |||||||||
| FMC Technologies, Inc. (a) | 1,410 | 129,043 | |||||||||
| Grant Prideco, Inc. (a) | 1,400 | 78,540 | |||||||||
| Oil States International, Inc. (a) | 1,510 | 66,048 | |||||||||
| 397,111 | |||||||||||
| Oil, Gas & Consumable Fuels (4.4%) | |||||||||||
| Continental Resources, Inc. (a) | 3,960 | 62,291 | |||||||||
| Denbury Resources, Inc. (a) | 3,250 | 130,000 | |||||||||
| Frontier Oil Corp. | 1,650 | 63,905 | |||||||||
| Parallel Petroleum Corp. (a) | 2,590 | 52,758 | |||||||||
| Peabody Energy Corp. | 1,330 | 56,206 | |||||||||
| Petrohawk Energy Corp. (a) | 3,410 | 51,116 | |||||||||
| Petroplus Holdings AG (a) | 407 | 38,976 | |||||||||
| Southwestern Energy Co. (a) | 2,350 | 95,480 | |||||||||
| 550,732 | |||||||||||
| 947,843 | |||||||||||
| Financials (7.5%) | |||||||||||
| Capital Markets (2.5%) | |||||||||||
| Affiliated Managers Group, Inc. (a) | 1,110 | 125,430 | |||||||||
| Janus Capital Group, Inc. | 1,149 | 34,539 | |||||||||
| Lazard Ltd., Class A | 2,080 | 77,022 | |||||||||
| Waddell & Reed Financial, Inc., Class A | 2,980 | 75,126 | |||||||||
| 312,117 | |||||||||||
| Commercial Banks (0.5%) | |||||||||||
| Signature Bank (a) | 2,040 | 63,016 | |||||||||
| Consumer Finance (0.5%) | |||||||||||
| First Cash Financial Services, Inc. (a) | 2,890 | 62,973 | |||||||||
| Diversified Financial Services (0.5%) | |||||||||||
| Genesis Lease Ltd. | 2,280 | 58,619 | |||||||||
| Insurance (0.9%) | |||||||||||
| Ambac Financial Group, Inc. | 870 | 58,420 | |||||||||
| ProAssurance Corp. (a) | 1,210 | 59,750 | |||||||||
| 118,170 | |||||||||||
| Real Estate Investment Trusts (REITs) (2.1%) | |||||||||||
| Alexandria Real Estate Equities, Inc. | 610 | 52,539 | |||||||||
| FelCor Lodging Trust, Inc. | 2,080 | 45,677 | |||||||||
| Plum Creek Timber Co., Inc. | 1,560 | 60,622 | |||||||||
| SL Green Realty Corp. | 420 | 50,996 | |||||||||
| Supertel Hospitality, Inc. | 7,310 | 58,919 | |||||||||
| 268,753 | |||||||||||
See Accompanying Notes to Financial Statements.
98
CMG SMALL/MID CAP FUND
A Portfolio of Columbia Funds Institutional Trust
SCHEDULE OF INVESTMENTS
| Shares | Value | ||||||||||
| Common Stocks (continued) | |||||||||||
| Real Estate Management & Development (0.5%) | |||||||||||
| Jones Lang LaSalle, Inc. | 550 | $ | 60,379 | ||||||||
| 944,027 | |||||||||||
| Health Care (19.3%) | |||||||||||
| Biotechnology (4.0%) | |||||||||||
| Alexion Pharmaceuticals, Inc. (a) | 880 | 51,181 | |||||||||
| Allos Therapeutics, Inc. (a) | 11,060 | 48,111 | |||||||||
| Applera Corp. - Celera Group (a) | 2,190 | 26,324 | |||||||||
| ArQule, Inc. (a) | 3,440 | 19,539 | |||||||||
| Array Biopharma, Inc. (a) | 3,200 | 32,160 | |||||||||
| BioMarin Pharmaceuticals, Inc. (a) | 1,610 | 29,077 | |||||||||
| Cephalon, Inc. (a) | 780 | 58,609 | |||||||||
| Cubist Pharmaceuticals, Inc. (a) | 2,410 | 55,575 | |||||||||
| Onyx Pharmaceuticals, Inc. (a) | 2,230 | 62,016 | |||||||||
| OSI Pharmaceuticals, Inc. (a) | 1,680 | 54,163 | |||||||||
| Savient Pharmaceuticals, Inc. (a) | 2,360 | 27,942 | |||||||||
| Seattle Genetics, Inc. / wa (a) | 3,070 | 29,257 | |||||||||
| 493,954 | |||||||||||
| Health Care Equipment & Supplies (5.4%) | |||||||||||
| Align Technology, Inc. (a) | 2,610 | 68,121 | |||||||||
| Beckman Coulter, Inc. | 734 | 51,982 | |||||||||
| Cytyc Corp. (a) | 1,530 | 64,413 | |||||||||
| Gen-Probe, Inc. (a) | 1,090 | 68,681 | |||||||||
| Hologic, Inc. (a) | 1,250 | 64,750 | |||||||||
| Immucor, Inc. (a) | 1,810 | 56,400 | |||||||||
| Intuitive Surgical, Inc. (a) | 74 | 15,733 | |||||||||
| Kyphon, Inc. (a) | 1,230 | 80,712 | |||||||||
| Mindray Medical International Ltd., ADR | 2,070 | 64,170 | |||||||||
| Northstar Neuroscience, Inc. (a) | 2,920 | 29,930 | |||||||||
| NuVasive, Inc. (a) | 2,561 | 73,449 | |||||||||
| Sirona Dental Systems, Inc. (a) | 930 | 32,885 | |||||||||
| 671,226 | |||||||||||
| Health Care Providers & Services (4.2%) | |||||||||||
| Brookdale Senior Living, Inc. | 1,720 | 68,817 | |||||||||
| HealthExtras, Inc. (a) | 2,355 | 63,185 | |||||||||
| Henry Schein, Inc. (a) | 1,200 | 65,208 | |||||||||
| Laboratory Corp. of America Holdings (a) | 830 | 61,296 | |||||||||
| Psychiatric Solutions, Inc. (a) | 1,920 | 65,453 | |||||||||
| Quest Diagnostics, Inc. | 1,230 | 68,228 | |||||||||
| Sunrise Senior Living, Inc. (a) | 1,720 | 68,387 | |||||||||
| VCA Antech, Inc. (a) | 1,760 | 69,238 | |||||||||
| 529,812 | |||||||||||
| Health Care Technology (0.5%) | |||||||||||
| Allscripts Healthcare Solutions, Inc. (a) | 2,775 | 63,131 | |||||||||
See Accompanying Notes to Financial Statements.
99
CMG SMALL/MID CAP FUND
A Portfolio of Columbia Funds Institutional Trust
SCHEDULE OF INVESTMENTS
| Shares | Value | ||||||||||
| Common Stocks (continued) | |||||||||||
| Life Sciences Tools & Services (3.2%) | |||||||||||
| Covance, Inc. (a) | 950 | $ | 67,042 | ||||||||
| ICON PLC, ADR (a) | 2,276 | 106,449 | |||||||||
| Illumina, Inc. (a) | 1,720 | 78,380 | |||||||||
| Pharmaceutical Product Development, Inc. | 1,700 | 56,950 | |||||||||
| Thermo Fisher Scientific, Inc. (a) | 1,850 | 96,588 | |||||||||
| 405,409 | |||||||||||
| Pharmaceuticals (2.0%) | |||||||||||
| Allergan, Inc. | 920 | 53,480 | |||||||||
| BioMimetic Therapeutics, Inc. (a) | 1,620 | 23,377 | |||||||||
| Medicis Pharmaceutical Corp., Class A | 1,670 | 47,645 | |||||||||
| Pozen, Inc. (a) | 3,720 | 61,938 | |||||||||
| Shire PLC, ADR | 880 | 64,935 | |||||||||
| 251,375 | |||||||||||
| 2,414,907 | |||||||||||
| Industrials (17.4%) | |||||||||||
| Aerospace & Defense (1.9%) | |||||||||||
| BE Aerospace, Inc. (a) | 2,220 | 90,043 | |||||||||
| Ladish Co., Inc. (a) | 1,550 | 75,160 | |||||||||
| Rockwell Collins, Inc. | 1,030 | 70,761 | |||||||||
| 235,964 | |||||||||||
| Air Freight & Logistics (0.6%) | |||||||||||
| Expeditors International Washington, Inc. | 1,810 | 80,871 | |||||||||
| Commercial Services & Supplies (4.4%) | |||||||||||
| ACCO Brands Corp. (a) | 2,630 | 54,388 | |||||||||
| Dun & Bradstreet Corp. | 620 | 60,611 | |||||||||
| Equifax, Inc. | 1,450 | 58,667 | |||||||||
| Huron Consulting Group, Inc. (a) | 1,245 | 84,573 | |||||||||
| Knoll, Inc. | 4,230 | 83,796 | |||||||||
| Resources Connection, Inc. (a) | 2,560 | 83,123 | |||||||||
| Robert Half International, Inc. | 1,750 | 59,483 | |||||||||
| Stericycle, Inc. (a) | 1,460 | 69,993 | |||||||||
| 554,634 | |||||||||||
| Construction & Engineering (1.1%) | |||||||||||
| Jacobs Engineering Group, Inc. (a) | 1,020 | 62,863 | |||||||||
| Perini Corp. (a) | 1,150 | 70,621 | |||||||||
| 133,484 | |||||||||||
| Electrical Equipment (2.7%) | |||||||||||
| Acuity Brands, Inc. | 640 | 37,824 | |||||||||
| General Cable Corp. (a) | 1,570 | 124,815 | |||||||||
| Roper Industries, Inc. | 1,390 | 83,372 | |||||||||
| SunPower Corp., Class A (a) | 1,260 | 88,868 | |||||||||
| 334,879 | |||||||||||
| Industrial Conglomerates (0.5%) | |||||||||||
| McDermott International, Inc. (a) | 710 | 58,887 | |||||||||
See Accompanying Notes to Financial Statements.
100
CMG SMALL/MID CAP FUND
A Portfolio of Columbia Funds Institutional Trust
SCHEDULE OF INVESTMENTS
| Shares | Value | ||||||||||
| Common Stocks (continued) | |||||||||||
| Machinery (3.5%) | |||||||||||
| Actuant Corp., Class A | 1,010 | $ | 61,590 | ||||||||
| Barnes Group, Inc. | 1,650 | 51,480 | |||||||||
| Bucyrus International, Inc., Class A | 910 | 57,840 | |||||||||
| Kaydon Corp. | 1,190 | 63,320 | |||||||||
| Oshkosh Truck Corp. | 1,210 | 69,272 | |||||||||
| Pall Corp. | 1,370 | 56,882 | |||||||||
| Terex Corp. (a) | 900 | 77,625 | |||||||||
| 438,009 | |||||||||||
| Marine (1.2%) | |||||||||||
| Genco Shipping & Trading Ltd. | 1,450 | 81,679 | |||||||||
| Ultrapetrol Bahamas Ltd. (a) | 2,750 | 64,625 | |||||||||
| 146,304 | |||||||||||
| Road & Rail (0.9%) | |||||||||||
| Genesee & Wyoming, Inc., Class A (a) | 2,170 | 55,661 | |||||||||
| Landstar System, Inc. | 1,340 | 60,916 | |||||||||
| 116,577 | |||||||||||
| Trading Companies & Distributors (0.6%) | |||||||||||
| Houston Wire & Cable Co. | 3,030 | 78,083 | |||||||||
| 2,177,692 | |||||||||||
| Information Technology (18.1%) | |||||||||||
| Communications Equipment (2.4%) | |||||||||||
| Harris Corp. | 1,180 | 64,758 | |||||||||
| NETGEAR, Inc. (a) | 3,640 | 100,683 | |||||||||
| Riverbed Technology, Inc. (a) | 1,689 | 74,586 | |||||||||
| Sierra Wireless, Inc. (a) | 2,450 | 55,493 | |||||||||
| 295,520 | |||||||||||
| Electronic Equipment & Instruments (0.7%) | |||||||||||
| Cogent, Inc. (a) | 2,220 | 29,548 | |||||||||
| Mettler-Toledo International, Inc. (a) | 670 | 63,757 | |||||||||
| 93,305 | |||||||||||
| Internet Software & Services (3.5%) | |||||||||||
| DealerTrack Holdings, Inc. (a) | 1,690 | 60,941 | |||||||||
| Digital River, Inc. (a) | 1,600 | 72,016 | |||||||||
| Equinix, Inc. (a) | 840 | 73,004 | |||||||||
| Keynote Systems, Inc. (a) | 2,220 | 33,278 | |||||||||
| Omniture, Inc. (a) | 2,946 | 67,316 | |||||||||
| Vocus, Inc. (a) | 4,507 | 126,602 | |||||||||
| 433,157 | |||||||||||
| IT Services (1.9%) | |||||||||||
| Cognizant Technology Solutions Corp., Class A (a) | 1,250 | 101,225 | |||||||||
| DST Systems, Inc. (a) | 800 | 60,696 | |||||||||
| Global Payments, Inc. | 1,010 | 37,774 | |||||||||
| RightNow Technologies, Inc. (a) | 3,250 | 42,900 | |||||||||
| 242,595 | |||||||||||
See Accompanying Notes to Financial Statements.
101
CMG SMALL/MID CAP FUND
A Portfolio of Columbia Funds Institutional Trust
SCHEDULE OF INVESTMENTS
| Shares | Value | ||||||||||
| Common Stocks (continued) | |||||||||||
| Semiconductors & Semiconductor Equipment (5.2%) | |||||||||||
| Atheros Communications, Inc. (a) | 4,395 | $ | 122,533 | ||||||||
| ATMI, Inc. (a) | 3,060 | 88,679 | |||||||||
| Hittite Microwave Corp. (a) | 925 | 37,203 | |||||||||
| MEMC Electronic Materials, Inc. (a) | 2,110 | 129,385 | |||||||||
| NVIDIA Corp. (a) | 2,510 | 114,858 | |||||||||
| Verigy Ltd. (a) | 6,510 | 159,234 | |||||||||
| 651,892 | |||||||||||
| Software (4.4%) | |||||||||||
| ACI Worldwide, Inc. (a) | 1,980 | 60,449 | |||||||||
| Activision, Inc. (a) | 3,510 | 60,056 | |||||||||
| BEA Systems, Inc. (a) | 5,010 | 62,024 | |||||||||
| BladeLogic, Inc. (a) | 91 | 2,343 | |||||||||
| Concur Technologies, Inc. (a) | 2,250 | 53,685 | |||||||||
| Informatica Corp. (a) | 2,560 | 35,686 | |||||||||
| McAfee, Inc. (a) | 2,380 | 85,347 | |||||||||
| Nuance Communications, Inc. (a) | 3,641 | 60,004 | |||||||||
| Perfect World Co. Ltd., ADR (a) | 65 | 1,567 | |||||||||
| Taleo Corp., Class A (a) | 2,813 | 60,508 | |||||||||
| THQ, Inc. (a) | 2,170 | 62,409 | |||||||||
| 544,078 | |||||||||||
| 2,260,547 | |||||||||||
| Materials (5.0%) | |||||||||||
| Chemicals (1.4%) | |||||||||||
| Potash Corp. of Saskatchewan, Inc. | 2,205 | 178,032 | |||||||||
| Construction Materials (0.6%) | |||||||||||
| Eagle Materials, Inc. | 720 | 31,486 | |||||||||
| Vulcan Materials Co. | 450 | 43,074 | |||||||||
| 74,560 | |||||||||||
| Containers & Packaging (0.5%) | |||||||||||
| Crown Holdings, Inc. (a) | 2,366 | 58,109 | |||||||||
| Metals & Mining (2.5%) | |||||||||||
| Allegheny Technologies, Inc. | 720 | 75,549 | |||||||||
| Carpenter Technology Corp. | 658 | 78,098 | |||||||||
| Freeport-McMoRan Copper & Gold, Inc. | 1,267 | 119,073 | |||||||||
| RTI International Metals, Inc. (a) | 580 | 45,959 | |||||||||
| 318,679 | |||||||||||
| 629,380 | |||||||||||
| Telecommunication Services (5.7%) | |||||||||||
| Diversified Telecommunication Services (0.9%) | |||||||||||
| Cogent Communications Group, Inc. (a) | 3,960 | 113,573 | |||||||||
See Accompanying Notes to Financial Statements.
102
CMG SMALL/MID CAP FUND
A Portfolio of Columbia Funds Institutional Trust
SCHEDULE OF INVESTMENTS
| Shares | Value | ||||||||||
| Common Stocks (continued) | |||||||||||
| Wireless Telecommunication Services (4.8%) | |||||||||||
| American Tower Corp., Class A (a) | 3,009 | $ | 125,355 | ||||||||
| Crown Castle International Corp. (a) | 3,430 | 124,337 | |||||||||
| Millicom International Cellular SA (a) | 1,420 | 114,026 | |||||||||
| NII Holdings, Inc. (a) | 1,920 | 161,318 | |||||||||
| SBA Communications Corp., Class A (a) | 2,390 | 79,635 | |||||||||
| 604,671 | |||||||||||
| 718,244 | |||||||||||
| Total Common Stocks (Cost of $10,546,860) | 12,238,299 | ||||||||||
| Par | |||||||||||
| Short-Term Obligation (3.8%) | |||||||||||
| Repurchase agreement with Fixed Income Clearing Corp., dated 07/31/07, due 08/01/07 at 5.030%, collateralized by a U.S. Treasury Obligation maturing 11/30/11, market value of $486,212 (repurchase proceeds $476,066) | $ | 476,000 | 476,000 | ||||||||
| Total Short-Term Obligation (Cost of $476,000) | 476,000 | ||||||||||
| Total Investments (101.6%) (Cost of $11,022,860) (b) | 12,714,299 | ||||||||||
| Other Assets & Liabilities, Net (-1.6%) | (198,126 | ) | |||||||||
| Net Assets (100.0%) | $ | 12,516,173 | |||||||||
Notes to Schedule of Investments:
(a) Non-income producing security.
(b) Cost for federal income tax purposes is $11,070,468.
See Accompanying Notes to Financial Statements.
103
CMG SMALL/MID CAP FUND
A Portfolio of Columbia Funds Institutional Trust
SCHEDULE OF INVESTMENTS
For the year ended July 31, 2007, transactions in written options were as follows:
| Number of contracts | Premium received | ||||||||||
| Options outstanding at July 31, 2006 | - | $ | - | ||||||||
| Options written | 8 | 1,241 | |||||||||
| Options terminated in closing purchase transactions | - | - | |||||||||
| Options exercised | (4 | ) | (805 | ) | |||||||
| Options expired | (4 | ) | (436 | ) | |||||||
| Options outstanding at July 31, 2007 | - | - | |||||||||
At July 31, 2007, the Fund held investments in the following sectors:
| Sector (Unaudited) | % of Net Assets | ||||||
| Health Care | 19.3 | ||||||
| Information Technology | 18.1 | ||||||
| Industrials | 17.4 | ||||||
| Consumer Discretionary | 16.7 | ||||||
| Energy | 7.6 | ||||||
| Financials | 7.5 | ||||||
| Telecommunication Services | 5.7 | ||||||
| Materials | 5.0 | ||||||
| Consumer Staples | 0.5 | ||||||
| 97.8 | |||||||
| Short-Term Obligation | 3.8 | ||||||
| Other Assets & Liabilities, Net | (1.6 | ) | |||||
| 100.0 | |||||||
| Acronym | Name | ||||||
| ADR | American Depositary Receipt | ||||||
See Accompanying Notes to Financial Statements.
104
CMG INTERNATIONAL STOCK FUND
A Portfolio of Columbia Funds Institutional Trust
SCHEDULE OF INVESTMENTS
July 31, 2007
| Shares | Value | ||||||||||
| Common Stocks (97.5%) | |||||||||||
| Consumer Discretionary (10.6%) | |||||||||||
| Auto Components (2.3%) | |||||||||||
| Continental AG | 6,604 | $ | 945,329 | ||||||||
| Denso Corp. | 27,200 | 1,023,899 | |||||||||
| Stanley Electric Co., Ltd. | 35,200 | 836,214 | |||||||||
| 2,805,442 | |||||||||||
| Automobiles (2.1%) | |||||||||||
| Peugeot SA | 16,380 | 1,372,704 | |||||||||
| Toyota Motor Corp. | 19,500 | 1,179,910 | |||||||||
| 2,552,614 | |||||||||||
| Hotels, Restaurants & Leisure (1.3%) | |||||||||||
| Genting Berhad | 264,800 | 606,224 | |||||||||
| Paddy Power PLC | 29,145 | 932,506 | |||||||||
| 1,538,730 | |||||||||||
| Household Durables (0.9%) | |||||||||||
| JM AB | 14,800 | 449,105 | |||||||||
| Matsushita Electric Industrial Co., Ltd. | 37,000 | 675,146 | |||||||||
| 1,124,251 | |||||||||||
| Leisure Equipment & Products (1.8%) | |||||||||||
| FUJIFILM Holdings Corp. | 30,600 | 1,333,498 | |||||||||
| Nikon Corp. | �� | 24,000 | 769,892 | ||||||||
| 2,103,390 | |||||||||||
| Media (1.3%) | |||||||||||
| Vivendi | 35,164 | 1,492,200 | |||||||||
| Textiles, Apparel & Luxury Goods (0.9%) | |||||||||||
| Nisshinbo Industries, Inc. | 91,000 | 1,124,838 | |||||||||
| 12,741,465 | |||||||||||
| Consumer Staples (7.2%) | |||||||||||
| Beverages (2.0%) | |||||||||||
| Fomento Economico Mexicano SAB de CV, ADR | 27,224 | 1,007,832 | |||||||||
| Heineken NV | 22,148 | 1,404,561 | |||||||||
| 2,412,393 | |||||||||||
| Food & Staples Retailing (1.7%) | |||||||||||
| Massmart Holdings Ltd. | 78,620 | 917,704 | |||||||||
| Metro, Inc., Class A | 30,874 | 1,099,749 | |||||||||
| 2,017,453 | |||||||||||
| Food Products (1.7%) | |||||||||||
| China Milk Products Group Ltd. | 524,000 | 419,888 | |||||||||
| Toyo Suisan Kaisha Ltd. | 36,000 | 594,751 | |||||||||
| Unilever PLC | 32,951 | 1,025,616 | |||||||||
| 2,040,255 | |||||||||||
| Tobacco (1.8%) | |||||||||||
| Imperial Tobacco Group PLC | 15,381 | 675,270 | |||||||||
| Japan Tobacco, Inc. | 287 | 1,468,451 | |||||||||
| 2,143,721 | |||||||||||
| 8,613,822 | |||||||||||
See Accompanying Notes to Financial Statements.
105
CMG INTERNATIONAL STOCK FUND
A Portfolio of Columbia Funds Institutional Trust
SCHEDULE OF INVESTMENTS
| Shares | Value | ||||||||||
| Common Stocks (continued) | |||||||||||
| Energy (7.7%) | |||||||||||
| Energy Equipment & Services (0.9%) | |||||||||||
| TGS Nopec Geophysical Co. ASA (a) | 56,600 | $ | 1,097,895 | ||||||||
| Oil, Gas & Consumable Fuels (6.8%) | |||||||||||
| BP PLC, ADR | 23,808 | 1,652,275 | |||||||||
| PetroChina Co., Ltd., Class H | 864,000 | 1,279,304 | |||||||||
| Royal Dutch Shell PLC, Class B | 22,033 | 871,070 | |||||||||
| Statoil ASA | 30,550 | 896,880 | |||||||||
| Total SA | 33,069 | 2,615,472 | |||||||||
| Yanzhou Coal Mining Co., Ltd., Class H | 462,000 | 833,436 | |||||||||
| 8,148,437 | |||||||||||
| 9,246,332 | |||||||||||
| Financials (27.7%) | |||||||||||
| Capital Markets (2.8%) | |||||||||||
| Credit Suisse Group, Registered Shares | 21,866 | 1,427,260 | |||||||||
| Deutsche Bank AG, Registered Shares | 10,921 | 1,480,949 | |||||||||
| UBS AG, Registered Shares | 8,381 | 464,946 | |||||||||
| 3,373,155 | |||||||||||
| Commercial Banks (16.8%) | |||||||||||
| ABN AMRO Holding NV | 15,859 | 760,817 | |||||||||
| Australia & New Zealand Banking Group Ltd. | 27,327 | 653,755 | |||||||||
| Banco Bilbao Vizcaya Argentaria SA | 79,898 | 1,952,238 | |||||||||
| Banco Santander Central Hispano SA | 111,963 | 2,098,981 | |||||||||
| Bank of Ireland | 49,598 | 946,961 | |||||||||
| Barclays PLC | 136,550 | 1,915,797 | |||||||||
| BNP Paribas | 15,546 | 1,708,173 | |||||||||
| Bumiputra-Commerce Holdings Berhad | 139,800 | 472,941 | |||||||||
| Depfa Bank PLC | 37,958 | 772,431 | |||||||||
| HBOS PLC | 41,153 | 806,179 | |||||||||
| HSBC Holdings PLC | 85,488 | 1,587,332 | |||||||||
| Industrial Bank of Korea | 30,350 | 695,469 | |||||||||
| Mizuho Financial Group, Inc. | 76 | 537,034 | |||||||||
| Societe Generale | 8,746 | 1,497,554 | |||||||||
| Sumitomo Mitsui Financial Group, Inc. | 63 | 572,000 | |||||||||
| Swedbank AB, Class A | 21,400 | 783,722 | |||||||||
| United Overseas Bank Ltd. | 99,000 | 1,449,622 | |||||||||
| Westpac Banking Corp. | 46,493 | 1,031,920 | |||||||||
| 20,242,926 | |||||||||||
| Consumer Finance (0.6%) | |||||||||||
| ORIX Corp. | 3,120 | 752,327 | |||||||||
| Diversified Financial Services (2.0%) | |||||||||||
| Fortis | 24,877 | 988,358 | |||||||||
| ING Groep NV | 32,877 | 1,390,637 | |||||||||
| 2,378,995 | |||||||||||
See Accompanying Notes to Financial Statements.
106
CMG INTERNATIONAL STOCK FUND
A Portfolio of Columbia Funds Institutional Trust
SCHEDULE OF INVESTMENTS
| Shares | Value | ||||||||||
| Common Stocks (continued) | |||||||||||
| Insurance (4.6%) | |||||||||||
| Aviva PLC | 55,491 | $ | 768,821 | ||||||||
| Axis Capital Holdings Ltd. (b) | 22,437 | 826,803 | |||||||||
| Baloise Holding AG, Registered Shares | 9,872 | 923,173 | |||||||||
| Brit Insurance Holdings PLC | 173,689 | 1,188,070 | |||||||||
| Milano Assicurazioni SpA | 82,144 | 632,576 | |||||||||
| Swiss Reinsurance, Registered Shares | 14,036 | 1,199,260 | |||||||||
| 5,538,703 | |||||||||||
| Real Estate Management & Development (0.9%) | |||||||||||
| Swire Pacific Ltd., Class A | 70,500 | 796,064 | |||||||||
| Yanlord Land Group Ltd. | 113,000 | 238,791 | |||||||||
| 1,034,855 | |||||||||||
| 33,320,961 | |||||||||||
| Health Care (7.6%) | |||||||||||
| Pharmaceuticals (7.6%) | |||||||||||
| AstraZeneca PLC | 32,290 | 1,672,792 | |||||||||
| Biovail Corp. | 54,687 | 1,043,975 | |||||||||
| Kyowa Hakko Kogyo Co., Ltd. | 51,000 | 513,596 | |||||||||
| Novartis AG, Registered Shares | 42,344 | 2,287,408 | |||||||||
| Novo-Nordisk A/S, Class B | 3,950 | 415,849 | |||||||||
| Ono Pharmaceutical Co., Ltd. | 13,000 | 679,499 | |||||||||
| Roche Holding AG, Genusschein Shares | 8,642 | 1,530,418 | |||||||||
| Takeda Pharmaceutical Co., Ltd. | 15,800 | 1,031,603 | |||||||||
| 9,175,140 | |||||||||||
| Industrials (11.6%) | |||||||||||
| Aerospace & Defense (1.6%) | |||||||||||
| MTU Aero Engines Holding AG | 12,052 | 820,451 | |||||||||
| Rolls-Royce Group PLC (a) | 112,713 | 1,152,416 | |||||||||
| 1,972,867 | |||||||||||
| Airlines (0.4%) | |||||||||||
| British Airways PLC (a) | 64,329 | 516,677 | |||||||||
| Building Products (1.0%) | |||||||||||
| Geberit AG, Registered Shares | 7,156 | 1,175,011 | |||||||||
| Commercial Services & Supplies (0.9%) | |||||||||||
| Randstad Holding NV | 15,872 | 1,028,046 | |||||||||
| Construction & Engineering (0.6%) | |||||||||||
| Peab AB | 24,300 | 738,496 | |||||||||
| Electrical Equipment (1.2%) | |||||||||||
| Schneider Electric SA | 10,815 | 1,448,537 | |||||||||
| Industrial Conglomerates (0.6%) | |||||||||||
| Keppel Corp. Ltd. | 80,000 | 698,360 | |||||||||
See Accompanying Notes to Financial Statements.
107
CMG INTERNATIONAL STOCK FUND
A Portfolio of Columbia Funds Institutional Trust
SCHEDULE OF INVESTMENTS
| Shares | Value | ||||||||||
| Common Stocks (continued) | |||||||||||
| Machinery (3.7%) | |||||||||||
| Georg Fischer AG, Registered Shares (a) | 1,257 | $ | 1,021,047 | ||||||||
| Komatsu Ltd. | 26,800 | 850,903 | |||||||||
| Mori Seiki Co., Ltd. | 14,800 | 484,901 | |||||||||
| SKF AB, Class B | 39,800 | 838,534 | |||||||||
| Sulzer AG, Registered Shares | 274 | 362,474 | |||||||||
| Volvo AB, Class B | 49,300 | 896,955 | |||||||||
| 4,454,814 | |||||||||||
| Trading Companies & Distributors (1.6%) | |||||||||||
| Hitachi High-Technologies Corp. | 19,600 | 477,190 | |||||||||
| Itochu Corp. | 112,000 | 1,405,943 | |||||||||
| 1,883,133 | |||||||||||
| 13,915,941 | |||||||||||
| Information Technology (6.8%) | |||||||||||
| Communications Equipment (1.8%) | |||||||||||
| Nokia Oyj | 75,844 | 2,169,458 | |||||||||
| Electronic Equipment & Instruments (0.6%) | |||||||||||
| Kyocera Corp. | 8,000 | 773,487 | |||||||||
| Internet Software & Services (0.9%) | |||||||||||
| United Internet AG, Registered Shares | 62,513 | 1,110,315 | |||||||||
| IT Services (1.0%) | |||||||||||
| CGI Group, Inc., Class A (a) | 65,300 | 670,261 | |||||||||
| Nomura Research Institute Ltd. | 17,300 | 551,720 | |||||||||
| 1,221,981 | |||||||||||
| Office Electronics (1.7%) | |||||||||||
| Brother Industries Ltd. | 82,000 | 1,179,322 | |||||||||
| Canon, Inc. | 16,800 | 892,617 | |||||||||
| 2,071,939 | |||||||||||
| Semiconductors & Semiconductor Equipment (0.8%) | |||||||||||
| Infineon Technologies AG (a) | 54,219 | 894,441 | |||||||||
| 8,241,621 | |||||||||||
| Materials (9.6%) | |||||||||||
| Chemicals (3.3%) | |||||||||||
| BASF AG | 15,503 | 1,993,336 | |||||||||
| Linde AG | 7,650 | 899,603 | |||||||||
| Shin-Etsu Chemical Co., Ltd. | 14,500 | 1,073,535 | |||||||||
| 3,966,474 | |||||||||||
| Construction Materials (1.0%) | |||||||||||
| Ciments Francais SA | 5,148 | 1,178,796 | |||||||||
See Accompanying Notes to Financial Statements.
108
CMG INTERNATIONAL STOCK FUND
A Portfolio of Columbia Funds Institutional Trust
SCHEDULE OF INVESTMENTS
| Shares | Value | ||||||||||
| Common Stocks (continued) | |||||||||||
| Metals & Mining (5.3%) | |||||||||||
| BHP Billiton PLC | 31,049 | $ | 915,170 | ||||||||
| JFE Holdings, Inc. | 16,000 | 1,098,500 | |||||||||
| Rio Tinto PLC | 10,259 | 740,398 | |||||||||
| Salzgitter AG | 6,740 | 1,364,432 | |||||||||
| SSAB Svenskt Stal AB, Series A | 29,300 | 1,047,598 | |||||||||
| Yamato Kogyo Co., Ltd. | 26,200 | 1,245,130 | |||||||||
| 6,411,228 | |||||||||||
| 11,556,498 | |||||||||||
| Telecommunication Services (4.8%) | |||||||||||
| Diversified Telecommunication Services (3.3%) | |||||||||||
| Bezeq Israeli Telecommunication Corp., Ltd. | 523,539 | 846,940 | |||||||||
| Chunghwa Telecom Co., Ltd., ADR | 41,512 | 688,266 | |||||||||
| Nippon Telegraph & Telephone Corp. | 135 | 589,202 | |||||||||
| Telefonica O2 Czech Republic AS | 40,399 | 1,151,560 | |||||||||
| Telekomunikacja Polska SA | 82,532 | 652,355 | |||||||||
| 3,928,323 | |||||||||||
| Wireless Telecommunication Services (1.5%) | |||||||||||
| China Mobile Ltd. | 60,500 | 696,926 | |||||||||
| KDDI Corp. | 97 | 645,337 | |||||||||
| Philippine Long Distance Telephone Co., ADR | 9,145 | 522,728 | |||||||||
| 1,864,991 | |||||||||||
| 5,793,314 | |||||||||||
| Utilities (3.9%) | |||||||||||
| Electric Utilities (3.3%) | |||||||||||
| British Energy Group PLC | 85,919 | 866,890 | |||||||||
| E.ON AG | 12,496 | 1,971,151 | |||||||||
| Tenaga Nasional Berhad | 360,500 | 1,135,809 | |||||||||
| 3,973,850 | |||||||||||
| Gas Utilities (0.6%) | |||||||||||
| Tokyo Gas Co., Ltd. | 159,000 | 688,699 | |||||||||
| 4,662,549 | |||||||||||
| Total Common Stocks (Cost of $91,378,167) | 117,267,643 | ||||||||||
| Investment Company (1.8%) | |||||||||||
| iShares MSCI EAFE Index Fund | 27,829 | 2,197,099 | |||||||||
| Total Investment Company (Cost of $2,245,972) | 2,197,099 | ||||||||||
See Accompanying Notes to Financial Statements.
109
CMG INTERNATIONAL STOCK FUND
A Portfolio of Columbia Funds Institutional Trust
SCHEDULE OF INVESTMENTS
| Units | Value | ||||||||||
| Rights (0.1%) | |||||||||||
| Materials (0.1%) | |||||||||||
| Metals & Mining (0.1%) | |||||||||||
| Ssab Svenskt Stal AB | |||||||||||
| Expires 08/23/07 (a)(c) | 29,300 | $ | 93,407 | ||||||||
| Total Rights (Cost of $-) | 93,407 | ||||||||||
| Par | |||||||||||
| Short-Term Obligation (2.0%) | |||||||||||
| Repurchase agreement with Fixed Income Clearing Corp., dated 07/31/07, due 08/01/07, at 5.030%, collateralized by a U.S. Treasury Obligation maturing 11/30/11, market value of $2,516,275 (repurchase proceeds $2,464,344) | $ | 2,464,000 | 2,464,000 | ||||||||
| Total Short-Term Obligation (Cost of $2,464,000) | 2,464,000 | ||||||||||
| Total Investments (101.4%) (Cost of $96,088,139) (d) | 122,022,149 | ||||||||||
| Other Assets & Liabilities, Net (-1.4%) | (1,707,744 | ) | |||||||||
| Net Assets (100.0%) | $ | 120,314,405 | |||||||||
Notes to Schedule of Investments:
(a) Non-income producing security.
(b) A portion of this security is pledged as collateral for written option contracts.
(c) Represents fair value as determined in good faith under procedures approved by the Board of Trustees.
(d) Cost for federal income tax purposes is $96,860,961.
See Accompanying Notes to Financial Statements.
110
CMG INTERNATIONAL STOCK FUND
A Portfolio of Columbia Funds Institutional Trust
SCHEDULE OF INVESTMENTS
The Fund is invested in the following countries at July 31, 2007:
| Country (Unaudited) | Value | % of Total Investments | |||||||||
| Japan | $ | 25,049,144 | 20.5 | ||||||||
| United Kingdom | 16,354,773 | 13.4 | |||||||||
| Germany | 11,480,007 | 9.4 | |||||||||
| France | 11,313,437 | 9.3 | |||||||||
| Switzerland | 10,390,996 | 8.5 | |||||||||
| United States* | 5,487,903 | 4.5 | |||||||||
| Sweden | 4,847,817 | 4.0 | |||||||||
| Netherlands | 4,584,061 | 3.8 | |||||||||
| Spain | 4,051,219 | 3.3 | |||||||||
| Canada | 2,813,985 | 2.3 | |||||||||
| Ireland | 2,651,897 | 2.2 | |||||||||
| China | 2,532,628 | 2.1 | |||||||||
| Singapore | 2,386,773 | 2.0 | |||||||||
| Malaysia | 2,214,974 | 1.8 | |||||||||
| Finland | 2,169,458 | 1.8 | |||||||||
| Norway | 1,994,775 | 1.6 | |||||||||
| Australia | 1,685,675 | 1.4 | |||||||||
| Hong Kong | 1,492,991 | 1.2 | |||||||||
| Czech Republic | 1,151,560 | 0.9 | |||||||||
| Mexico | 1,007,832 | 0.8 | |||||||||
| Belgium | 988,358 | 0.8 | |||||||||
| South Africa | 917,704 | 0.8 | |||||||||
| Israel | 846,939 | 0.7 | |||||||||
| South Korea | 695,469 | 0.6 | |||||||||
| Taiwan | 688,266 | 0.6 | |||||||||
| Poland | 652,355 | 0.5 | |||||||||
| Italy | 632,576 | 0.5 | |||||||||
| Philippines | 522,728 | 0.4 | |||||||||
| Denmark | 415,849 | 0.3 | |||||||||
| $ | 122,022,149 | 100.0 | |||||||||
*Includes short-term obligation and investment company.
Certain securities are listed by country of underlying exposure but may trade predominantly on other exchanges.
For the year ended July 31, 2007, transactions in written option contracts were as follows:
| Number of contracts | Premium received | ||||||||||
| Options outstanding at July 31, 2006 | - | - | |||||||||
| Options written | 112 | $ | 5,297 | ||||||||
| Options terminated in closing purchase transactions | - | - | |||||||||
| Options exercised | - | - | |||||||||
| Options expired | - | - | |||||||||
| Options outstanding at July 31, 2007 | 112 | $ | 5,297 | ||||||||
See Accompanying Notes to Financial Statements.
111
CMG INTERNATIONAL STOCK FUND
A Portfolio of Columbia Funds Institutional Trust
SCHEDULE OF INVESTMENTS
At July 31, 2007, the Fund held the following written call option contracts:
| Name of Issuer | Strike Price | Number of Contracts | Expiration Date | Premium | Value | ||||||||||||||||||
| Axis Capital Holdings Ltd. | $ | 40 | 112 | 09/22/07 | $ | 5,297 | $ | 3,360 | |||||||||||||||
| Total written call options (proceeds $5,297) | $ | 3,360 | |||||||||||||||||||||
At July 31, 2007, the Fund had entered into the following forward currency exchange contracts:
| Forward Currency Contracts to Buy | Value | Aggregate Face Value | Settlement Date | Unrealized Appreciation (Depreciation) | |||||||||||||||
| AUD | $ | 5,864,307 | $ | 5,817,137 | 09/20/07 | $ | 47,170 | ||||||||||||
| CAD | 182,988 | 187,541 | 09/20/07 | (4,553 | ) | ||||||||||||||
| CHF | 312,398 | 312,997 | 09/20/07 | (599 | ) | ||||||||||||||
| DKK | 503,443 | 493,867 | 09/20/07 | 9,576 | |||||||||||||||
| EUR | 5,285,773 | 5,180,645 | 09/20/07 | 105,128 | |||||||||||||||
| GBP | 11,203,319 | 10,990,320 | 09/20/07 | 212,999 | |||||||||||||||
| GBP | 505,367 | 500,552 | 09/20/07 | 4,815 | |||||||||||||||
| JPY | 512,348 | 492,671 | 09/20/07 | 19,677 | |||||||||||||||
| JPY | 387,513 | 374,611 | 09/20/07 | 12,902 | |||||||||||||||
| TWD | 300,545 | 302,464 | 09/20/07 | (1,919 | ) | ||||||||||||||
| TWD | 249,393 | 251,063 | 09/20/07 | (1,670 | ) | ||||||||||||||
| NZD | 116,078 | 122,308 | 09/20/07 | (6,230 | ) | ||||||||||||||
| SGD | 124,523 | 125,133 | 09/20/07 | (610 | ) | ||||||||||||||
| $ | 396,686 | ||||||||||||||||||
| Forward Currency Contracts to Sell | Value | Aggregate Face Value | Settlement Date | Unrealized Appreciation (Depreciation) | |||||||||||||||
| CAD | $ | 3,083,593 | $ | 3,069,364 | 09/20/07 | $ | (14,229 | ) | |||||||||||
| CHF | 3,167,417 | 3,073,357 | 09/20/07 | (94,060 | ) | ||||||||||||||
| CZK | 1,151,821 | 1,107,485 | 09/20/07 | (44,336 | ) | ||||||||||||||
| EUR | 879,820 | 875,078 | 09/20/07 | (4,742 | ) | ||||||||||||||
| EUR | 309,718 | 312,377 | 09/20/07 | 2,659 | |||||||||||||||
| GBP | 679,912 | 686,854 | 09/20/07 | 6,942 | |||||||||||||||
| ILS | 837,602 | 856,264 | 09/20/07 | 18,662 | |||||||||||||||
| JPY | 310,689 | 301,588 | 09/20/07 | (9,101 | ) | ||||||||||||||
| KRW | 746,181 | 738,947 | 09/20/07 | (7,234 | ) | ||||||||||||||
| MXN | 549,659 | 556,229 | 09/20/07 | 6,570 | |||||||||||||||
| MYR | 2,322,302 | 2,313,006 | 09/20/07 | (9,296 | ) | ||||||||||||||
| NOK | 760,528 | 743,226 | 09/20/07 | (17,302 | ) | ||||||||||||||
| PHP | 249,382 | 246,306 | 09/20/07 | (3,076 | ) | ||||||||||||||
| PLN | 629,387 | 616,446 | 09/20/07 | (12,941 | ) | ||||||||||||||
| SEK | 1,767,961 | 1,728,494 | 09/20/07 | (39,467 | ) | ||||||||||||||
| SGD | 1,310,139 | 1,294,079 | 09/20/07 | (16,060 | ) | ||||||||||||||
| TWD | 1,300,473 | 1,298,499 | 09/20/07 | (1,974 | ) | ||||||||||||||
| ZAR | 494,730 | 491,722 | 09/20/07 | (3,008 | ) | ||||||||||||||
| $ | (241,993 | ) | |||||||||||||||||
See Accompanying Notes to Financial Statements.
112
CMG INTERNATIONAL STOCK FUND
A Portfolio of Columbia Funds Institutional Trust
SCHEDULE OF INVESTMENTS
| Acronym | Name | ||||||
| ADR | American Depositary Receipt | ||||||
| AUD | Australian Dollar | ||||||
| CAD | Canadian Dollar | ||||||
| CHF | Swiss Franc | ||||||
| CZK | Czech Koruna | ||||||
| DKK | Danish Krone | ||||||
| EUR | Euro Currency | ||||||
| GBP | Pound Sterling | ||||||
| ILS | Israeli Shekel | ||||||
| JPY | Japanese Yen | ||||||
| KRW | South Korean Won | ||||||
| MXN | Mexican Peso | ||||||
| MYR | Malaysian Ringgit | ||||||
| NOK | Norwegian Krone | ||||||
| NZD | New Zealand Dollar | ||||||
| PHP | Philippine Peso | ||||||
| PLN | Polish Zloty | ||||||
| SEK | Swedish Krona | ||||||
| SGD | Singapore Dollar | ||||||
| TWD | Taiwan Dollar | ||||||
| ZAR | South African Rand | ||||||
See Accompanying Notes to Financial Statements.
113
STATEMENTS OF ASSETS AND LIABILITIES
July 31, 2007
| CMG Enhanced S&P 500® Index Fund | CMG Large Cap Growth Fund | CMG Large Cap Value Fund | CMG Mid Cap Growth Fund | CMG Mid Cap Value Fund | |||||||||||||||||||
| ASSETS: | |||||||||||||||||||||||
| Investments, at identified cost | $ | 228,783,507 | $ | 54,749,891 | $ | 41,163,204 | $ | 24,072,459 | $ | 16,047,699 | |||||||||||||
| Investments, at value (including securities on loan of $18,527,372, $-, $-, $- ,$- ,$- ,$- ,$- and $-, respectively) | $ | 241,827,931 | $ | 58,563,097 | $ | 44,907,991 | $ | 29,026,155 | $ | 19,244,535 | |||||||||||||
| Cash | 544 | 630 | 118 | 481 | 79 | ||||||||||||||||||
| Foreign currency (cost of $-, $-, $-, $-, $-, $-, $-, $-, and 26,499, $respectively) | - | - | - | - | - | ||||||||||||||||||
| Unrealized appreciation on foreign forward currency contracts | - | - | - | - | - | ||||||||||||||||||
| Receivable for: | |||||||||||||||||||||||
| Investments sold | - | 1,504,495 | - | 328,954 | 180,798 | ||||||||||||||||||
| Fund shares sold | 50,000 | - | - | 20,000 | - | ||||||||||||||||||
| Interest | 631 | 158 | 1,363 | 195 | 273 | ||||||||||||||||||
| Dividends | 187,440 | 18,067 | 39,821 | 5,753 | 6,651 | ||||||||||||||||||
| Premium for written options | - | - | - | - | - | ||||||||||||||||||
| Securities lending | 751 | - | - | - | - | ||||||||||||||||||
| Foreign tax reclaims | - | - | 672 | 152 | - | ||||||||||||||||||
| Expense reimbursement due from Investment Advisor | 10,660 | 8,000 | 7,848 | 6,832 | 7,171 | ||||||||||||||||||
| Deferred Trustees' compensation plan | 9,689 | 7,919 | 7,992 | 8,649 | 7,358 | ||||||||||||||||||
| Total Assets | 242,087,646 | 60,102,366 | 44,965,805 | 29,397,171 | 19,446,865 | ||||||||||||||||||
| LIABILITIES: | |||||||||||||||||||||||
| Payable to custodian bank | - | - | - | - | - | ||||||||||||||||||
| Collateral on securities loaned | 19,240,697 | - | - | - | - | ||||||||||||||||||
| Unrealized depreciation on foreign forward currency contracts | - | - | - | - | - | ||||||||||||||||||
| Written option at value (premium of $-, $-, $-, $-, $-, $-, $-, $- and $5,297, respectively) | - | - | - | - | - | ||||||||||||||||||
| Payable for: | |||||||||||||||||||||||
| Investments purchased | - | 1,056,904 | 72,408 | 659,712 | 93,540 | ||||||||||||||||||
| Fund shares repurchased | - | - | - | - | - | ||||||||||||||||||
| Futures variation margin | 56,400 | - | - | - | - | ||||||||||||||||||
| Investment advisory fee | 48,236 | 21,210 | 17,258 | 17,656 | 12,128 | ||||||||||||||||||
| Trustees' fees | 251 | 254 | 251 | 252 | 252 | ||||||||||||||||||
| Transfer agent fees | - | - | - | - | - | ||||||||||||||||||
| Pricing and bookkeeping fees | - | - | - | - | - | ||||||||||||||||||
| Merger costs | - | - | - | - | - | ||||||||||||||||||
| Custody fee | - | - | - | - | - | ||||||||||||||||||
| Audit fee | 28,850 | 33,851 | 33,851 | 33,850 | 33,850 | ||||||||||||||||||
| Interest expense | - | - | - | - | - | ||||||||||||||||||
| Deferred Trustees' compensation plan | 9,689 | 7,919 | 7,992 | 8,649 | 7,358 | ||||||||||||||||||
| Other liabilities | 5,444 | 3,775 | 3,717 | 3,454 | 3,287 | ||||||||||||||||||
| Total Liabilities | 19,389,567 | 1,123,913 | 135,477 | 723,573 | 150,415 | ||||||||||||||||||
| NET ASSETS | $ | 222,698,079 | $ | 58,978,453 | $ | 44,830,328 | $ | 28,673,598 | $ | 19,296,450 | |||||||||||||
| NET ASSETS CONSIST OF: | |||||||||||||||||||||||
| Paid-in-capital | $ | 201,449,817 | $ | 51,357,848 | $ | 36,707,028 | $ | 20,193,809 | $ | 14,421,712 | |||||||||||||
| Undistributed net investment income | 1,601,700 | 152,738 | 389,628 | 66,919 | 155,300 | ||||||||||||||||||
| Accumulated net investment loss | - | - | - | - | - | ||||||||||||||||||
| Accumulated net realized gain | 6,748,870 | 3,654,661 | 3,988,885 | 3,459,171 | 1,522,602 | ||||||||||||||||||
| Net unrealized appreciation (depreciation) on: | |||||||||||||||||||||||
| Investments | 13,044,424 | 3,813,206 | 3,744,787 | 4,953,696 | 3,196,836 | ||||||||||||||||||
| Foreign currency translations | - | - | - | 3 | - | ||||||||||||||||||
| Futures contracts | (146,732 | ) | - | - | - | - | |||||||||||||||||
| Written options | - | - | - | - | - | ||||||||||||||||||
| NET ASSETS | $ | 222,698,079 | $ | 58,978,453 | $ | 44,830,328 | $ | 28,673,598 | $ | 19,296,450 | |||||||||||||
| Shares of capital stock outstanding | 15,331,115 | 4,714,438 | 3,644,554 | 1,740,230 | 1,369,513 | ||||||||||||||||||
| Net asset value, offering and redemption price per share | $ | 14.53 | $ | 12.51 | $ | 12.30 | $ | 16.48 | $ | 14.09 | |||||||||||||
See Accompanying Notes to Financial Statements.
114
| CMG Small Cap Growth Fund | CMG Small Cap Value Fund | CMG Small/Mid Cap Fund | CMG International Stock Fund | ||||||||||||||||
| ASSETS: | |||||||||||||||||||
| Investments, at identified cost | $ | 33,882,559 | $ | 24,827,368 | $ | 11,022,860 | $ | 96,088,139 | |||||||||||
| Investments, at value (including securities on loan of $18,527,372, $-, $-, $- ,$- ,$- ,$- ,$- and $-, respectively) | $ | 39,963,293 | $ | 31,919,190 | $ | 12,714,299 | $ | 122,022,149 | |||||||||||
| Cash | 884 | 78,503 | 79 | - | |||||||||||||||
| Foreign currency (cost of $-, $-, $-, $-, $-, $-, $-, $-, and 26,499, $respectively) | - | - | - | 26,541 | |||||||||||||||
| Unrealized appreciation on foreign forward currency contracts | - | - | - | 396,686 | |||||||||||||||
| Receivable for: | |||||||||||||||||||
| Investments sold | 1,423,092 | 64,856 | 299,807 | 182,598 | |||||||||||||||
| Fund shares sold | - | - | - | - | |||||||||||||||
| Interest | 241 | - | 66 | 344 | |||||||||||||||
| Dividends | 3,576 | 34,627 | 1,232 | 59,133 | |||||||||||||||
| Premium for written options | - | - | - | 5,297 | |||||||||||||||
| Securities lending | - | - | - | - | |||||||||||||||
| Foreign tax reclaims | - | - | - | 90,816 | |||||||||||||||
| Expense reimbursement due from Investment Advisor | 9,856 | 6,871 | 10,377 | 9,964 | |||||||||||||||
| Deferred Trustees' compensation plan | 16,828 | 9,595 | 7,874 | 11,487 | |||||||||||||||
| Total Assets | 41,417,770 | 32,113,642 | 13,033,734 | 122,805,015 | |||||||||||||||
| LIABILITIES: | |||||||||||||||||||
| Payable to custodian bank | - | - | - | 4,391 | |||||||||||||||
| Collateral on securities loaned | - | - | - | - | |||||||||||||||
| Unrealized depreciation on foreign forward currency contracts | - | - | - | 241,993 | |||||||||||||||
| Written option at value (premium of $-, $-, $-, $-, $-, $-, $-, $- and $5,297, respectively) | - | - | - | 3,360 | |||||||||||||||
| Payable for: | |||||||||||||||||||
| Investments purchased | 1,401,721 | 91,554 | 460,590 | 2,000,679 | |||||||||||||||
| Fund shares repurchased | - | - | - | 107,995 | |||||||||||||||
| Futures variation margin | - | - | - | - | |||||||||||||||
| Investment advisory fee | 26,723 | 23,020 | 8,228 | 77,920 | |||||||||||||||
| Trustees' fees | - | 252 | - | - | |||||||||||||||
| Transfer agent fees | 1 | - | - | - | |||||||||||||||
| Pricing and bookkeeping fees | 791 | - | - | - | |||||||||||||||
| Merger costs | 19,195 | - | - | - | |||||||||||||||
| Custody fee | 2,368 | - | - | - | |||||||||||||||
| Audit fee | 36,750 | 33,850 | 37,800 | 39,100 | |||||||||||||||
| Interest expense | - | - | - | 161 | |||||||||||||||
| Deferred Trustees' compensation plan | 16,828 | 9,595 | 7,874 | 11,487 | |||||||||||||||
| Other liabilities | 14,143 | 3,558 | 3,069 | �� | 3,524 | ||||||||||||||
| Total Liabilities | 1,518,520 | 161,829 | 517,561 | 2,490,610 | |||||||||||||||
| NET ASSETS | $ | 39,899,250 | $ | 31,951,813 | $ | 12,516,173 | $ | 120,314,405 | |||||||||||
| NET ASSETS CONSIST OF: | |||||||||||||||||||
| Paid-in-capital | $ | 29,157,230 | $ | 21,284,881 | $ | 9,437,706 | $ | 80,893,325 | |||||||||||
| Undistributed net investment income | - | 136,218 | - | 1,825,095 | |||||||||||||||
| Accumulated net investment loss | (19,597 | ) | - | (5,768 | ) | - | |||||||||||||
| Accumulated net realized gain | 4,680,883 | 3,438,892 | 1,392,796 | 11,501,463 | |||||||||||||||
| Net unrealized appreciation (depreciation) on: | |||||||||||||||||||
| Investments | 6,080,734 | 7,091,822 | 1,691,439 | 25,934,010 | |||||||||||||||
| Foreign currency translations | - | - | - | 158,575 | |||||||||||||||
| Futures contracts | - | - | - | - | |||||||||||||||
| Written options | - | - | - | 1,937 | |||||||||||||||
| NET ASSETS | $ | 39,899,250 | $ | 31,951,813 | $ | 12,516,173 | $ | 120,314,405 | |||||||||||
| Shares of capital stock outstanding | 20,414,259 | 2,292,604 | 2,744,502 | 8,238,912 | |||||||||||||||
| Net asset value, offering and redemption price per share | $ | 1.95 | $ | 13.94 | $ | 4.56 | $ | 14.60 | |||||||||||
See Accompanying Notes to Financial Statements.
115
STATEMENTS OF OPERATIONS
For the Year Ended July 31, 2007
| CMG Enhanced S&P 500® Index Fund | CMG Large Cap Growth Fund | CMG Large Cap Value Fund | CMG Mid Cap Growth Fund | CMG Mid Cap Value Fund | |||||||||||||||||||
| NET INVESTMENT INCOME: | |||||||||||||||||||||||
| Income: | |||||||||||||||||||||||
| Dividends | $ | 2,585,056 | $ | 403,888 | $ | 830,613 | $ | 290,768 | $ | 372,772 | |||||||||||||
| Interest | 293,613 | 69,195 | 46,380 | 47,654 | 26,344 | ||||||||||||||||||
| Securities lending | 8,060 | - | 85 | - | - | ||||||||||||||||||
| Foreign withholding tax | - | (176 | ) | (4,184 | ) | (533 | ) | (1,123 | ) | ||||||||||||||
| Total income | 2,886,729 | 472,907 | 872,894 | 337,889 | 397,993 | ||||||||||||||||||
| Expenses: | |||||||||||||||||||||||
| Investment advisory fee | 365,134 | 208,912 | 191,204 | 191,470 | 127,031 | ||||||||||||||||||
| Transfer agent fee | - | - | - | - | - | ||||||||||||||||||
| Pricing and bookkeeping fees | - | - | - | - | - | ||||||||||||||||||
| Trustees' fees | 16,941 | 13,800 | 13,742 | 15,741 | 12,831 | ||||||||||||||||||
| Custody fee | - | - | - | - | - | ||||||||||||||||||
| Audit fee | 38,405 | 43,406 | 43,406 | 43,405 | 43,405 | ||||||||||||||||||
| Reports to shareholders | - | - | - | - | - | ||||||||||||||||||
| Chief compliance officer expenses | - | - | - | - | - | ||||||||||||||||||
| Other expenses | 15,791 | 10,658 | 10,525 | 9,855 | 9,308 | ||||||||||||||||||
| Total operating expenses | 436,271 | 276,776 | 258,877 | 260,471 | 192,575 | ||||||||||||||||||
| Interest expense | 389 | - | - | - | - | ||||||||||||||||||
| Total expenses | 436,660 | 276,776 | 258,877 | 260,471 | 192,575 | ||||||||||||||||||
| Expense reimbursement from Investment Advisor | (71,137 | ) | (67,864 | ) | (67,673 | ) | (69,001 | ) | (65,544 | ) | |||||||||||||
| Custody earnings credit | - | - | - | - | - | ||||||||||||||||||
| Net expenses | 365,523 | 208,912 | 191,204 | 191,470 | 127,031 | ||||||||||||||||||
| Net investment income (loss) | 2,521,206 | 263,995 | 681,690 | 146,419 | 270,962 | ||||||||||||||||||
| NET REALIZED AND UNREALIZED GAIN (LOSS) ON INVESTMENTS, WRITTEN OPTIONS, FOREIGN CURRENCY AND FUTURES CONTRACTS: | |||||||||||||||||||||||
| Net realized gain (loss) on: | |||||||||||||||||||||||
| Investments | 7,669,574 | 4,510,122 | 4,545,392 | 4,221,121 | 2,119,153 | ||||||||||||||||||
| Written options | - | - | - | 3,479 | 1,116 | ||||||||||||||||||
| Foreign currency transactions | - | - | - | (3,380 | ) | 7 | |||||||||||||||||
| Futures contracts | 58,602 | - | - | - | - | ||||||||||||||||||
| Net realized loss due to a trading error (See Note 8) | - | - | - | - | - | ||||||||||||||||||
| Net realized gain | 7,728,176 | 4,510,122 | 4,545,392 | 4,221,220 | 2,120,276 | ||||||||||||||||||
| Net change in unrealized appreciation (depreciation) on: | |||||||||||||||||||||||
| Investments | 4,005,122 | 1,786,112 | (715,525 | ) | 1,281,482 | 648,236 | |||||||||||||||||
| Written options | - | - | - | - | - | ||||||||||||||||||
| Foreign currency translations | - | - | - | 3 | - | ||||||||||||||||||
| Futures contracts | (185,479 | ) | - | - | - | - | |||||||||||||||||
| Net change in unrealized appreciation (depreciation) | 3,819,643 | 1,786,112 | (715,525 | ) | 1,281,485 | 648,236 | |||||||||||||||||
| Net gain | 11,547,819 | 6,296,234 | 3,829,867 | 5,502,705 | 2,768,512 | ||||||||||||||||||
| NET INCREASE IN NET ASSETS FROM OPERATIONS | $ | 14,069,025 | $ | 6,560,229 | $ | 4,511,557 | $ | 5,649,124 | $ | 3,039,474 | |||||||||||||
See Accompanying Notes to Financial Statements.
116
| CMG Small Cap Growth Fund | CMG Small Cap Value Fund | CMG Small/Mid Cap Fund | CMG International Stock Fund | ||||||||||||||||
| NET INVESTMENT INCOME: | |||||||||||||||||||
| Income: | |||||||||||||||||||
| Dividends | $ | 138,780 | $ | 490,490 | $ | 58,170 | $ | 3,250,325 | |||||||||||
| Interest | 81,427 | 7,828 | 22,356 | 45,797 | |||||||||||||||
| Securities lending | - | - | - | - | |||||||||||||||
| Foreign withholding tax | - | - | (106 | ) | (302,514 | ) | |||||||||||||
| Total income | 220,207 | 498,318 | 80,420 | 2,993,608 | |||||||||||||||
| Expenses: | |||||||||||||||||||
| Investment advisory fee | 301,899 | 255,568 | 81,631 | 855,644 | |||||||||||||||
| Transfer agent fee | 21 | - | - | - | |||||||||||||||
| Pricing and bookkeeping fees | 3,027 | - | - | - | |||||||||||||||
| Trustees' fees | 11,231 | 18,270 | 10,873 | 15,026 | |||||||||||||||
| Custody fee | 12,703 | - | - | - | |||||||||||||||
| Audit fee | 42,865 | 43,405 | 41,705 | 51,666 | |||||||||||||||
| Reports to shareholders | 23,897 | - | - | - | |||||||||||||||
| Chief compliance officer expenses | 2,155 | - | - | - | |||||||||||||||
| Other expenses | 33,445 | 10,086 | 9,558 | 14,411 | |||||||||||||||
| Total operating expenses | 431,243 | 327,329 | 143,767 | 936,747 | |||||||||||||||
| Interest expense | 160 | 2,396 | - | 7,981 | |||||||||||||||
| Total expenses | 431,403 | 329,725 | 143,767 | 944,728 | |||||||||||||||
| Expense reimbursement from Investment Advisor | (108,649 | ) | (71,761 | ) | (62,136 | ) | (81,102 | ) | |||||||||||
| Custody earnings credit | (569 | ) | - | - | - | ||||||||||||||
| Net expenses | 322,185 | 257,964 | 81,631 | 863,626 | |||||||||||||||
| Net investment income (loss) | (101,978 | ) | 240,354 | (1,211 | ) | 2,129,982 | |||||||||||||
| NET REALIZED AND UNREALIZED GAIN (LOSS) ON INVESTMENTS, WRITTEN OPTIONS, FOREIGN CURRENCY AND FUTURES CONTRACTS: | |||||||||||||||||||
| Net realized gain (loss) on: | |||||||||||||||||||
| Investments | 6,025,836 | 5,783,692 | 1,728,258 | 14,391,648 | |||||||||||||||
| Written options | 1,853 | - | 436 | - | |||||||||||||||
| Foreign currency transactions | (2,870 | ) | - | (847 | ) | 701,769 | |||||||||||||
| Futures contracts | - | - | - | - | |||||||||||||||
| Net realized loss due to a trading error (See Note 8) | - | - | - | - | |||||||||||||||
| Net realized gain | 6,024,819 | 5,783,692 | 1,727,847 | 15,093,417 | |||||||||||||||
| Net change in unrealized appreciation (depreciation) on: | |||||||||||||||||||
| Investments | 2,429,355 | (2,143,372 | ) | 343,875 | 7,856,172 | ||||||||||||||
| Written options | - | - | - | 1,937 | |||||||||||||||
| Foreign currency translations | - | - | - | 155,234 | |||||||||||||||
| Futures contracts | - | - | - | - | |||||||||||||||
| Net change in unrealized appreciation (depreciation) | 2,429,355 | (2,143,372 | ) | 343,875 | 8,013,343 | ||||||||||||||
| Net gain | 8,454,174 | 3,640,320 | 2,071,722 | 23,106,760 | |||||||||||||||
| NET INCREASE IN NET ASSETS FROM OPERATIONS | $ | 8,352,196 | $ | 3,880,674 | $ | 2,070,511 | $ | 25,236,742 | |||||||||||
See Accompanying Notes to Financial Statements.
117
STATEMENTS OF CHANGES IN NET ASSETS
| CMG Enhanced S&P 500® Index Fund | |||||||||||
| Year Ended July 31, | |||||||||||
| 2007 | 2006 | ||||||||||
| Operations: | |||||||||||
| Net investment income | $ | 2,521,206 | $ | 1,532,249 | |||||||
| Net realized gain on investments and futures contracts | 7,728,176 | 8,091,680 | |||||||||
| Net change in unrealized appreciation (depreciation) on investments and futures contracts | 3,819,643 | (3,021,580 | ) | ||||||||
| Net increase from operations | 14,069,025 | 6,602,349 | |||||||||
| Distributions declared to shareholders: | |||||||||||
| From net investment income | (1,720,935 | ) | (1,547,386 | ) | |||||||
| From net realized gains | (7,095,404 | ) | (4,395,562 | ) | |||||||
| Total distributions declared to shareholders | (8,816,339 | ) | (5,942,948 | ) | |||||||
| Share transactions: | |||||||||||
| Subscriptions | 124,166,877 | 25,772,014 | |||||||||
| Distributions reinvested | 3,163,765 | 1,192,965 | |||||||||
| Redemptions | (10,858,416 | ) | (18,284,280 | ) | |||||||
| Net increase in share transactions | 116,472,226 | 8,680,699 | |||||||||
| Net increase in net assets | 121,724,912 | 9,340,100 | |||||||||
| NET ASSETS: | |||||||||||
| Beginning of period | 100,973,167 | 91,633,067 | |||||||||
| End of period | $ | 222,698,079 | $ | 100,973,167 | |||||||
| Undistributed net investment income, at end of period | $ | 1,601,700 | $ | 802,166 | |||||||
| Change in shares: | |||||||||||
| Subscriptions | 8,393,109 | 1,932,072 | |||||||||
| Issued for distributions reinvested | 221,397 | 90,582 | |||||||||
| Redemptions | (749,508 | ) | (1,347,447 | ) | |||||||
| Net increase | 7,864,998 | 675,207 | |||||||||
See Accompanying Notes to Financial Statements.
118
STATEMENTS OF CHANGES IN NET ASSETS
| CMG Large Cap Growth Fund | CMG Large Cap Value Fund | ||||||||||||||||||
| Year Ended July 31, | Year Ended July 31, | ||||||||||||||||||
| 2007 | 2006 | 2007 | 2006 | ||||||||||||||||
| Operations: | |||||||||||||||||||
| Net investment income | $ | 263,995 | $ | 236,616 | $ | 681,690 | $ | 664,005 | |||||||||||
| Net realized gain on investments and foreign currency transactions | 4,510,122 | 2,208,271 | 4,545,392 | 3,683,361 | |||||||||||||||
| Net change in unrealized appreciation (depreciation) on investments | 1,786,112 | (1,726,056 | ) | (715,525 | ) | (884,539 | ) | ||||||||||||
| Net increase from operations | 6,560,229 | 718,831 | 4,511,557 | 3,462,827 | |||||||||||||||
| Distributions declared to shareholders: | |||||||||||||||||||
| From net investment income | (240,113 | ) | (244,682 | ) | (638,584 | ) | (786,000 | ) | |||||||||||
| From net realized gains | (2,140,830 | ) | (2,107,614 | ) | (2,775,916 | ) | (4,217,978 | ) | |||||||||||
| Total distributions declared to shareholders | (2,380,943 | ) | (2,352,296 | ) | (3,414,500 | ) | (5,003,978 | ) | |||||||||||
| Share transactions: | |||||||||||||||||||
| Subscriptions | 21,201,017 | 607,996 | 13,098,066 | 2,117,201 | |||||||||||||||
| Distributions reinvested | 1,159,364 | 1,081,858 | 1,648,088 | 2,230,353 | |||||||||||||||
| Redemptions | (3,326,396 | ) | (4,602,728 | ) | (8,293,069 | ) | (4,257,442 | ) | |||||||||||
| Net increase (decrease) in share transactions | 19,033,985 | (2,912,874 | ) | 6,453,085 | 90,112 | ||||||||||||||
| Net increase (decrease) in net assets | 23,213,271 | (4,546,339 | ) | 7,550,142 | (1,451,039 | ) | |||||||||||||
| NET ASSETS: | |||||||||||||||||||
| Beginning of period | 35,765,182 | 40,311,521 | 37,280,186 | 38,731,225 | |||||||||||||||
| End of period | $ | 58,978,453 | $ | 35,765,182 | $ | 44,830,328 | $ | 37,280,186 | |||||||||||
| Undistributed net investment income, at end of period | $ | 152,738 | $ | 128,856 | $ | 389,628 | $ | 349,092 | |||||||||||
| Change in shares: | |||||||||||||||||||
| Subscriptions | 1,682,234 | 51,129 | 1,042,361 | 186,275 | |||||||||||||||
| Issued for distributions reinvested | 97,754 | 94,075 | 137,341 | 197,376 | |||||||||||||||
| Redemptions | (281,641 | ) | (388,044 | ) | (671,337 | ) | (336,132 | ) | |||||||||||
| Net increase (decrease) | 1,498,347 | (242,840 | ) | 508,365 | 47,519 | ||||||||||||||
See Accompanying Notes to Financial Statements.
119
STATEMENTS OF CHANGES IN NET ASSETS
| CMG Mid Cap Growth Fund | CMG Mid Cap Value Fund | ||||||||||||||||||
| Year Ended July 31, | Year Ended July 31, | ||||||||||||||||||
| 2007 | 2006 | 2007 | 2006 | ||||||||||||||||
| Operations: | |||||||||||||||||||
| Net investment income | $ | 146,419 | $ | 20,930 | $ | 270,962 | $ | 194,099 | |||||||||||
| Net realized gain on investments, written options and foreign currency transactions | 4,221,220 | 2,629,036 | 2,120,276 | 2,848,500 | |||||||||||||||
| Net change in unrealized appreciation (depreciation) on investments and foreign currency translations | 1,281,485 | (433,276 | ) | 648,236 | (1,416,716 | ) | |||||||||||||
| Net increase from operations | 5,649,124 | 2,216,690 | 3,039,474 | 1,625,883 | |||||||||||||||
| Distributions declared to shareholders: | |||||||||||||||||||
| From net investment income | (93,030 | ) | - | (196,538 | ) | (193,534 | ) | ||||||||||||
| From net realized gains | (2,823,900 | ) | (596,195 | ) | (2,606,305 | ) | (2,793,995 | ) | |||||||||||
| Total distributions declared to shareholders | (2,916,930 | ) | (596,195 | ) | (2,802,843 | ) | (2,987,529 | ) | |||||||||||
| Share transactions: | |||||||||||||||||||
| Subscriptions | 5,926,804 | 2,478,025 | 5,217,552 | 989,569 | |||||||||||||||
| Distributions reinvested | 1,214,957 | 256,151 | 1,292,451 | 1,221,997 | |||||||||||||||
| Redemptions | (4,836,047 | ) | (5,599,689 | ) | (5,211,798 | ) | (4,365,601 | ) | |||||||||||
| Net increase (decrease) in share transactions | 2,305,714 | (2,865,513 | ) | 1,298,205 | (2,154,035 | ) | |||||||||||||
| Net increase (decrease) in net assets | 5,037,908 | (1,245,018 | ) | 1,534,836 | (3,515,681 | ) | |||||||||||||
| NET ASSETS: | |||||||||||||||||||
| Beginning of period | 23,635,690 | 24,880,708 | 17,761,614 | 21,277,295 | |||||||||||||||
| End of period | $ | 28,673,598 | $ | 23,635,690 | $ | 19,296,450 | $ | 17,761,614 | |||||||||||
| Undistributed net investment income, at end of period | $ | 66,919 | $ | 16,910 | $ | 155,300 | $ | 82,198 | |||||||||||
| Change in shares: | |||||||||||||||||||
| Subscriptions | 389,503 | 161,008 | 365,557 | 69,276 | |||||||||||||||
| Issued for distributions reinvested | 80,889 | 17,122 | 98,285 | 91,536 | |||||||||||||||
| Redemptions | (308,106 | ) | (358,183 | ) | (361,340 | ) | (295,964 | ) | |||||||||||
| Net increase (decrease) | 162,286 | (180,053 | ) | 102,502 | (135,152 | ) | |||||||||||||
See Accompanying Notes to Financial Statements.
120
STATEMENTS OF CHANGES IN NET ASSETS
| CMG Small Cap Growth Fund | CMG Small Cap Value Fund | ||||||||||||||||||
| Year Ended July 31, | Year Ended July 31, | ||||||||||||||||||
| 2007 | 2006 | 2007 | 2006 | ||||||||||||||||
| Operations: | |||||||||||||||||||
| Net investment income (loss) | $ | (101,978 | ) | $ | (241,357 | ) | $ | 240,354 | $ | 214,137 | |||||||||
| Net realized gain on investments, written options and foreign currency transactions | 6,024,819 | 9,398,939 | 5,783,692 | 4,366,840 | |||||||||||||||
| Net change in unrealized appreciation (depreciation) on investments | 2,429,355 | (11,061,310 | ) | (2,143,372 | ) | (1,837,919 | ) | ||||||||||||
| Net increase (decrease) from operations | 8,352,196 | (1,903,728 | ) | 3,880,674 | 2,743,058 | ||||||||||||||
| Distributions declared to shareholders: | |||||||||||||||||||
| From net investment income | - | - | (208,296 | ) | (279,581 | ) | |||||||||||||
| From net realized gains | (8,560,579 | ) | (8,639,807 | ) | (5,551,832 | ) | (3,938,120 | ) | |||||||||||
| Total distributions declared to shareholders | (8,560,579 | ) | (8,639,807 | ) | (5,760,128 | ) | (4,217,701 | ) | |||||||||||
| Share transactions: | |||||||||||||||||||
| Subscriptions | 4,449,121 | 5,297,768 | 5,437,309 | 2,488,587 | |||||||||||||||
| Proceeds received in connection with merger | - | 40,504,741 | - | - | |||||||||||||||
| Distributions reinvested | 6,665,647 | 5,234,864 | 4,751,572 | 2,926,706 | |||||||||||||||
| Redemptions | (11,190,327 | ) | (30,627,476 | ) | (9,796,788 | ) | (7,490,753 | ) | |||||||||||
| Net increase (decrease) in share transactions | (75,559 | ) | 20,409,897 | 392,093 | (2,075,460 | ) | |||||||||||||
| Net increase (decrease) in net assets | (283,942 | ) | 9,866,362 | (1,487,361 | ) | (3,550,103 | ) | ||||||||||||
| NET ASSETS: | |||||||||||||||||||
| Beginning of period | 40,183,192 | 30,316,830 | 33,439,174 | 36,989,277 | |||||||||||||||
| End of period | $ | 39,899,250 | $ | 40,183,192 | $ | 31,951,813 | $ | 33,439,174 | |||||||||||
| Undistributed net investment income, at end of period | $ | - | $ | - | $ | 136,218 | $ | 104,160 | |||||||||||
| Accumulated net investment loss, at end of period | $ | (19,597 | ) | $ | (15,114 | ) | $ | - | $ | - | |||||||||
| Change in shares: | |||||||||||||||||||
| Subscriptions | 2,240,488 | 2,641,989 | 370,997 | 160,463 | |||||||||||||||
| Issued in connection with merger | - | 18,087,654 | - | - | |||||||||||||||
| Issued for distributions reinvested | 3,765,902 | 2,670,849 | 344,567 | 203,243 | |||||||||||||||
| Redemptions | (5,394,303 | ) | (8,212,815 | ) | (607,276 | ) | (481,975 | ) | |||||||||||
| Net increase (decrease) | 612,087 | 15,187,677 | 108,288 | (118,269 | ) | ||||||||||||||
See Accompanying Notes to Financial Statements.
121
STATEMENTS OF CHANGES IN NET ASSETS
| CMG Small/Mid Cap Fund | CMG International Stock Fund | ||||||||||||||||||
| Year Ended July 31, | Year Ended July 31, | ||||||||||||||||||
| 2007 | 2006 | 2007 | 2006 | ||||||||||||||||
| Operations: | |||||||||||||||||||
| Net investment income (loss) | $ | (1,211 | ) | $ | (94,429 | ) | $ | 2,129,982 | $ | 2,145,229 | |||||||||
| Net realized gain on investments, written options and foreign currency transactions | 1,727,847 | 7,685,179 | 15,093,417 | 23,690,227 | |||||||||||||||
| Net change in unrealized appreciation (depreciation) on investments, written options and foreign currency translations | 343,875 | (4,880,243 | ) | 8,013,343 | 1,019,388 | ||||||||||||||
| Net increase from operations | 2,070,511 | 2,710,507 | 25,236,742 | 26,854,844 | |||||||||||||||
| Distributions declared to shareholders: | |||||||||||||||||||
| From net investment income | - | - | (2,513,869 | ) | (2,041,358 | ) | |||||||||||||
| From net realized gains | (6,782,938 | ) | (1,443,974 | ) | (20,428,853 | ) | (14,728,492 | ) | |||||||||||
| Total distributions declared to shareholders | (6,782,938 | ) | (1,443,974 | ) | (22,942,722 | ) | (16,769,850 | ) | |||||||||||
| Share transactions: | |||||||||||||||||||
| Subscriptions | 11,500,000 | - | 20,493,154 | 7,527,480 | |||||||||||||||
| Distributions reinvested | 6,782,938 | 1,443,974 | 14,502,772 | 10,430,452 | |||||||||||||||
| Redemptions | (9,827,294 | ) | (32,692,430 | ) | (22,713,180 | ) | (58,449,515 | ) | |||||||||||
| Net increase (decrease) in share transactions | 8,455,644 | (31,248,456 | ) | 12,282,746 | (40,491,583 | ) | |||||||||||||
| Net increase (decrease) in net assets | 3,743,217 | (29,981,923 | ) | 14,576,766 | (30,406,589 | ) | |||||||||||||
| NET ASSETS: | |||||||||||||||||||
| Beginning of period | 8,772,956 | 38,754,879 | 105,737,639 | 136,144,228 | |||||||||||||||
| End of period | $ | 12,516,173 | $ | 8,772,956 | $ | 120,314,405 | $ | 105,737,639 | |||||||||||
| Undistributed net investment income, at end of period | $ | - | $ | - | $ | 1,825,095 | $ | 1,450,664 | |||||||||||
| Accumulated net investment loss, at end of period | $ | (5,768 | ) | $ | (4,738 | ) | $ | - | $ | - | |||||||||
| Change in shares: | |||||||||||||||||||
| Subscriptions | 2,744,502 | - | 1,450,019 | 534,955 | |||||||||||||||
| Issued for distributions reinvested | 1,559,556 | 132,353 | 1,105,394 | 788,394 | |||||||||||||||
| Redemptions | (2,339,832 | ) | (2,724,333 | ) | (1,545,947 | ) | (3,989,516 | ) | |||||||||||
| Net increase (decrease) | 1,964,226 | (2,591,980 | ) | 1,009,466 | (2,666,167 | ) | |||||||||||||
See Accompanying Notes to Financial Statements.
122
NOTES TO FINANCIAL STATEMENTS
July 31, 2007
Note 1. Organization:
Columbia Funds Institutional Trust (the "Trust") is a Massachusetts business trust registered under the Investment Company Act of 1940, as amended, as an open-end management investment company. Information presented in these financial statements pertains to the following diversified funds (individually referred to as a "Fund", collectively referred to as the "Funds"):
CMG Enhanced S&P 500® Index Fund
CMG Large Cap Growth Fund
CMG Large Cap Value Fund
CMG Mid Cap Growth Fund
CMG Mid Cap Value Fund
CMG Small Cap Growth Fund
CMG Small Cap Value Fund
CMG Small/Mid Cap Fund
CMG International Stock Fund
Shares of the Funds are available for purchase by institutional buyers and certain advisory clients of Columbia Management Advisors, LLC ("Columbia"), the Funds' investment advisor, or its affiliates. Each Fund's minimum initial investment requirement for investors purchasing shares directly from Columbia is $3 million. The minimum initial investment requirement is $25,000 for advisory clients of Columbia or one of its affiliates with $1 million invested with Columbia and its affiliates. Please see the Funds' prospectuses for further details.
Investment goals. CMG Enhanced S&P 500® Index Fund seeks to outperform the total return, over the long term, of the Standard & Poor's 500® Composite Stock Price Index that measures the investment returns of stocks of large U.S. companies, while maintaining overall portfolio characteristics similar to those of the benchmark. CMG Large Cap Growth Fund and CMG Large Cap Value Fund seek long-term growth by investing primarily in large capitalization equities. CMG Mid Cap Growth Fund and CMG Mid Cap Value Fund seek long-term growth by investing in middle capitalization equities. CMG Small Cap Growth Fund seeks to provide investors with long-term capital appreciation. CMG Small Cap Value Fund seeks long-term growth by investing primarily in small capitalization equities. CMG Small/Mid Cap Fund seeks long-term capital appreciat ion by investing in small and middle capitalization equities. CMG International Stock Fund seeks long-term capital appreciation.
Fund shares. The Trust may issue an unlimited number of shares of beneficial interest which are offered continuously at net asset value.
Note 2. Significant accounting policies:
The preparation of financial statements in accordance with accounting principles generally accepted in the United States of America ("GAAP") requires management to make certain estimates and assumptions that affect the reported amounts of assets and liabilities, the disclosure of contingent assets and liabilities at the date of the financial statements and the reported amounts of revenue and expenses during the reporting period. Actual results could differ from those estimates. The following is a summary of significant accounting policies consistently followed by the Funds in the preparation of their financial statements.
Security valuation. Equity securities, exchange traded funds and securities of certain investment companies are valued at the last sale price on the principal exchange on which they trade, except for securities traded on the NASDAQ, which are valued at the NASDAQ official close price. Unlisted securities or listed securities for which there were no sales during the day are valued at the closing bid price on such exchanges or over-the-counter markets.
123
NOTES TO FINANCIAL STATEMENTS (continued)
July 31, 2007
Short-term debt obligations maturing within 60 days are valued at amortized cost, which approximates market value.
Investments in open-end investment companies are valued at net asset value.
Options are valued at the last reported sale price, or in the absence of a sale, the mean between the last quoted bid and ask price.
Futures contracts are valued at the settlement price established each day by the board of trade or exchange on which they are traded.
Forward currency exchange contracts are valued at the prevailing forward exchange rate of the underlying currencies.
Foreign securities are generally valued at the last sale price on the foreign exchange or market on which they trade. If any foreign share prices are not readily available as a result of limited share activity, the securities are valued at the last sale price of the local shares in the principal market in which such securities are normally traded.
Generally, trading in foreign securities is substantially completed each day at various times prior to the close of the New York Stock Exchange ("NYSE"). The values of such securities used in computing the net asset value of the Funds' shares are determined as of such times. Foreign currency exchange rates are generally determined at 4:00 p.m. Eastern (U.S.) time. Events affecting the values of such foreign securities and such exchange rates may occur between the times at which they are determined and the close of the customary trading session of the NYSE, which would not be reflected in the computation of the Funds' net asset value. If events materially affecting the values of such foreign securities occur and it is determined that market quotations are not reliable, then these foreign securities will be valued at their "fair value" using procedures approved by the Board of Trustees. The CMG International Stock Fund may use a s ystematic fair valuation model provided by an independent third party to value securities principally traded in foreign markets in order to adjust for possible stale pricing that may occur between the close of the foreign exchanges and the time for valuation. If a security is valued at fair value, such value is likely to be different from the last quoted market price for the security.
Investments for which market quotations are not readily available, or that have quotations which Columbia believes are not reliable, are valued at fair value as determined in good faith under consistently applied procedures established by and under the general supervision of the Board of Trustees. If a security is valued at fair value, such value is likely to be different from the last quoted market price for the security.
In September 2006, Statement of Financial Accounting Standards No. 157, Fair Value Measurements ("SFAS 157"), was issued. SFAS 157 is effective for fiscal years beginning after November 15, 2007. SFAS 157 defines fair value, establishes a framework for measuring fair value and expands disclosures about fair value measurements. Management is evaluating the impact the application of SFAS 157 will have on the Funds' financial statement disclosures.
Security transactions. Security transactions are accounted for on the trade date. Cost is determined and gains (losses) are based upon the specific identification method for both financial statement and federal income tax purposes.
Futures contracts. Each Fund may invest in futures contracts to hedge against the effects of changes in the value of portfolio securities due to anticipated changes in interest rates and/or market conditions, for duration management, or when the transactions are economically appropriate to the reduction of risk inherent in the management of the Fund and not for trading purposes. Futures contracts are financial instruments whose values depend on, or are derived from, the value of the underlying security, index or currency.
124
NOTES TO FINANCIAL STATEMENTS (continued)
July 31, 2007
The use of futures contracts involves certain risks, which include: (1) imperfect correlation between the price movement of the instruments and the underlying securities, (2) inability to close out positions due to differing trading hours, or the temporary absence of a liquid market, for either the instruments or the underlying securities, or (3) an inaccurate prediction by Columbia, of the future direction of interest rates. Any of these risks may involve amounts exceeding the variation margin recorded in the Funds' Statements of Assets and Liabilities at any given time.
Upon entering into a futures contract, a Fund pledges cash or securities with the broker in an amount sufficient to meet the initial margin requirement. Subsequent payments are made or received by a Fund equal to the daily change in the contract value and are recorded as variation margin receivable or payable and offset in unrealized gains or losses. A Fund recognizes a realized gain or loss when the contract is closed or expires.
Options. Each Fund may write call and put options on a security it owns or in which it may invest. Writing put options tends to increase the Fund's exposure to the underlying instrument. Writing call options tends to decrease the Fund's exposure to the underlying instrument. When the Fund writes a call or put option, an amount equal to the premium received is recorded as a liability and subsequently marked-to-market to reflect the current value of the option written. Premiums received from writing options which expire are treated as realized gains. Premiums received from writing options which are exercised or closed are added to the proceeds or offset against the amounts paid on the underlying future transaction to determine the realized gain or loss. Each Fund as a writer of an option has no control over whether the underlying security may be sold (call) or purchased (put) and as a result bears the market risk of an unfavorable change in the price of the security underlying the written option. There is the risk the Fund may not be able to enter into a closing transaction because of an illiquid market. Each Fund's custodian will set aside cash or liquid portfolio securities equal to the amount of the written options contract commitment in a separate account.
Forward foreign currency exchange contracts. Forward foreign currency exchange contracts are agreements to exchange one currency for another at a future date at a specified price. These contracts are used to minimize the exposure to foreign exchange rate fluctuations during the period between trade and settlement date of the contract. Certain Funds may utilize forward foreign currency exchange contracts in connection with the settlement of purchases and sales of securities. Certain Funds may also enter into these contracts to hedge certain other foreign currency denominated assets. Contracts to buy generally are used to acquire exposure to foreign currencies, while contracts to sell are used to hedge the Funds' investments against currency fluctuations. Forward foreign currency exchange contracts are valued daily at the current exchange rate of the underlyin g currency, resulting in unrealized gains (losses) which become realized at the time the forward foreign currency exchange contracts are closed or mature. Realized and unrealized gains (losses) arising from such transactions are included in net realized and unrealized gains (losses) on foreign currency transactions. The use of forward foreign currency exchange contracts does not eliminate fluctuations in the prices of the Funds' portfolio securities. While the maximum potential loss from such contracts is the aggregate face value in U.S. dollars at the time the contract was opened, exposure is typically limited to the change in value of the contract (in U.S. dollars) over the period it remains open. The Funds are also exposed to risk that counterparties of the contracts may be unable to fulfill the terms of the contracts.
Repurchase agreements. Each Fund may engage in repurchase agreement transactions with institutions that Columbia has determined are creditworthy. Each Fund, through its custodian, receives delivery of underlying securities collateralizing a repurchase agreement. Columbia is responsible for determining that collateral is at least equal, at all times, to the value of the repurchase obligation including interest. A repurchase agreement transaction involves certain risks in the event of default or insolvency of the counterparty. These risks include possible delays or restrictions upon each Fund's ability to dispose of the underlying securities and a possible decline in the value of the underlying securities during the period while the Funds seek to assert their rights.
Foreign currency transactions. The values of all assets and liabilities quoted in foreign currencies are translated into U.S. dollars at that day's exchange rates. Net realized and unrealized gains (losses) on foreign currency transactions
125
NOTES TO FINANCIAL STATEMENTS (continued)
July 31, 2007
include gains (losses) arising from the fluctuation in exchange rates between trade and settlement dates on securities transactions, gains (losses) arising from the disposition of foreign currency and currency gains (losses) between the accrual and payment dates on dividends, interest income and foreign withholding taxes.
For financial statement purposes, the Funds do not distinguish that portion of gains (losses) on investments which is due to changes in foreign exchange rates from that which is due to changes in market prices of the investments. Such fluctuations are included with the net realized and unrealized gains (losses) on investments in the Statements of Operations.
Income recognition. Interest income is recorded on an accrual basis. Corporate actions and dividend income are recorded on the ex-date, except for certain foreign securities which are recorded as soon after ex-date as the Funds become aware of such, net of non-reclaimable tax withholdings. Distributions received from real estate investment trusts (REITs) in excess of their income are recorded as a reduction of the cost of the related investments and/or realized gains as applicable. If the Funds no longer own the applicable securities, any distributions received in excess of income are recorded as realized gains.
Expenses. General expenses of the Trust are allocated to the Funds and the other series of the Trust based upon their relative net assets or other expense allocation methodologies determined by the nature of the expense. Expenses directly attributable to a Fund are charged to such Fund.
Federal income tax status. Each Fund intends to qualify each year as a "regulated investment company" under Subchapter M of the Internal Revenue Code, as amended, and will distribute substantially all of its taxable income, if any, for its tax year, and as such will not be subject to federal income taxes. In addition, each Fund intends to distribute in each calendar year substantially all of its net investment income, capital gains and certain other amounts, if any, such that each Fund should not be subject to federal excise tax. Therefore, no federal income or excise tax provision is recorded.
Distributions to shareholders. Distributions to shareholders are recorded on the ex-date. Dividends from net investment income, if any, are declared and distributed at least annually. Net realized capital gains, if any, are distributed at least annually.
Indemnification. In the normal course of business, each Fund enters into contracts that contain a variety of representations and warranties and which provide general indemnities. A Fund's maximum exposure under these arrangements is unknown because this would involve future claims against the Fund. Also, under the Trust's organizational documents and by contract, the Trustees and officers of the Trust are indemnified against certain liabilities that may arise out of actions relating to their duties to the Trust. However, based on experience, the Funds expect the risk of loss due to these representations, warranties and indemnities to be minimal.
Note 3. Federal tax information:
The timing and character of income and capital gain distributions are determined in accordance with income tax regulations, which may differ from GAAP. Reclassifications are made to the Funds' capital accounts for permanent tax differences to reflect income and gains available for distribution (or available capital loss carryforwards) under income tax regulations.
126
NOTES TO FINANCIAL STATEMENTS (continued)
July 31, 2007
For the year ended July 31, 2007, permanent book and tax basis differences resulting primarily from differing treatments for Section 988 foreign currency transactions, net operating losses, distribution reclassification and passive foreign investment companies (PFIC) adjustments were identified and reclassified among the components of the Funds' net assets as follows:
| Undistributed/ (Overdistributed) or Accumulated Net Investment Income (Loss) | Accumulated Net Realized Gain (Loss) | Paid-In Capital | |||||||||||||
| CMG Enhanced S&P 500® Index Fund | $ | (737 | ) | $ | 737 | $ | - | ||||||||
| CMG Large Cap Growth Fund | - | - | - | ||||||||||||
| CMG Large Cap Value Fund | (2,570 | ) | 2,568 | 2 | |||||||||||
| CMG Mid Cap Growth Fund | (3,380 | ) | 3,380 | - | |||||||||||
| CMG Mid Cap Value Fund | (1,322 | ) | 1,319 | 3 | |||||||||||
| CMG Small Cap Growth Fund | 97,495 | (97,494 | ) | (1 | ) | ||||||||||
| CMG Small Cap Value Fund | - | - | - | ||||||||||||
| CMG Small/Mid Cap Fund | 181 | 848 | (1,029 | ) | |||||||||||
| CMG International Stock Fund | 758,318 | (755,049 | ) | (3,269 | ) | ||||||||||
Net investment income and net realized gains (losses), as disclosed on the Statements of Operations, and net assets were not affected by these reclassifications.
The tax character of distributions paid during the years ended July 31, 2007 and July 31, 2006 was as follows:
| July 31, 2007 | |||||||||||
| Ordinary Income* | Long-Term Capital Gains | ||||||||||
| CMG Enhanced S&P 500® Index Fund | $ | 3,598,247 | $ | 5,218,092 | |||||||
| CMG Large Cap Growth Fund | 625,288 | 1,755,655 | |||||||||
| CMG Large Cap Value Fund | 1,060,188 | 2,354,312 | |||||||||
| CMG Mid Cap Growth Fund | 759,124 | 2,157,806 | |||||||||
| CMG Mid Cap Value Fund | 750,522 | 2,052,321 | |||||||||
| CMG Small Cap Growth Fund | 4,265,461 | 4,295,118 | |||||||||
| CMG Small Cap Value Fund | 722,222 | 5,037,906 | |||||||||
| CMG Small/Mid Cap Fund | 2,808,947 | 3,973,991 | |||||||||
| CMG International Stock Fund | 8,584,045 | 14,358,677 | |||||||||
| July 31, 2006 | |||||||||||
| Ordinary Income* | Long-Term Capital Gains | ||||||||||
| CMG Enhanced S&P 500® Index Fund | $ | 3,814,830 | $ | 2,128,118 | |||||||
| CMG Large Cap Growth Fund | 563,021 | 1,789,275 | |||||||||
| CMG Large Cap Value Fund | 1,661,382 | 3,342,596 | |||||||||
| CMG Mid Cap Growth Fund | 209,153 | 387,042 | |||||||||
| CMG Mid Cap Value Fund | 1,001,723 | 1,985,806 | |||||||||
| CMG Small Cap Growth Fund | 281,083 | 8,358,724 | |||||||||
| CMG Small Cap Value Fund | 1,247,123 | 2,970,578 | |||||||||
| CMG Small/Mid Cap Fund | 241,708 | 1,202,266 | |||||||||
| CMG International Stock Fund | 2,772,501 | 13,997,349 | |||||||||
* For tax purposes short-term capital gains distributions, if any, are considered ordinary income distributions.
127
NOTES TO FINANCIAL STATEMENTS (continued)
July 31, 2007
As of July 31, 2007, the components of distributable earnings on a tax basis were as follows:
| Undistributed Ordinary Income | Undistributed Long-term Capital Gains | Net Unrealized Appreciation* | |||||||||||||
| CMG Enhanced S&P 500® Index Fund | $ | 4,481,821 | $ | 4,074,932 | $ | 12,699,931 | |||||||||
| CMG Large Cap Growth Fund | 2,466,992 | 1,513,470 | 3,647,783 | ||||||||||||
| CMG Large Cap Value Fund | 1,287,208 | 3,135,471 | 3,708,491 | ||||||||||||
| CMG Mid Cap Growth Fund | 1,233,165 | 2,373,178 | 4,882,062 | ||||||||||||
| CMG Mid Cap Value Fund | 419,214 | 1,274,308 | 3,188,690 | ||||||||||||
| CMG Small Cap Growth Fund | 1,876,724 | 2,963,063 | 5,918,194 | ||||||||||||
| CMG Small Cap Value Fund | 572,748 | 3,094,851 | 7,008,560 | ||||||||||||
| CMG Small/Mid Cap Fund | 392,023 | 1,050,739 | 1,643,831 | ||||||||||||
| CMG International Stock Fund | 6,195,190 | 8,077,389 | 25,161,188 | ||||||||||||
* The differences between book-basis and tax-basis net unrealized appreciation are primarily due to deferral of losses from wash sales and mark to market of passive foreign investment companies.
Unrealized appreciation and depreciation at July 31, 2007, based on cost of investments for federal income tax purposes, excluding any unrealized appreciation and depreciation from changes in the value of other assets and liabilities resulting from changes in exchange rates, was:
| Unrealized Appreciation | Unrealized Depreciation | Net Unrealized Appreciation | |||||||||||||
| CMG Enhanced S&P 500® Index Fund | $ | 22,698,646 | $ | (9,998,715 | ) | $ | 12,699,931 | ||||||||
| CMG Large Cap Growth Fund | 4,962,070 | (1,314,287 | ) | 3,647,783 | |||||||||||
| CMG Large Cap Value Fund | 5,038,049 | (1,329,558 | ) | 3,708,491 | |||||||||||
| CMG Mid Cap Growth Fund | 5,496,745 | (614,683 | ) | 4,882,062 | |||||||||||
| CMG Mid Cap Value Fund | 3,742,643 | (553,953 | ) | 3,188,690 | |||||||||||
| CMG Small Cap Growth Fund | 7,278,018 | (1,359,824 | ) | 5,918,194 | |||||||||||
| CMG Small Cap Value Fund | 8,512,584 | (1,504,024 | ) | 7,008,560 | |||||||||||
| CMG Small/Mid Cap Fund | 2,101,667 | (457,836 | ) | 1,643,831 | |||||||||||
| CMG International Stock Fund | 27,075,375 | (1,914,187 | ) | 25,161,188 | |||||||||||
The following capital loss carryforwards, determined as of July 31, 2007, may be available to reduce taxable income arising from future net realized gains on investments, if any, to the extent permitted by the Internal Revenue Code:
| Year of Expiration | |||||||||||||||
| 2010 | 2011 | Total | |||||||||||||
| CMG International Stock Fund | $ | 1,072,288 | $ | 420,427 | $ | 1,492,715 | |||||||||
In June 2006, the Financial Accounting Standards Board ("FASB") issued FASB Interpretation No. 48, Accounting for Uncertainty in Income Taxes, an Interpretation of FASB Statement No. 109 (the "Interpretation"). This Interpretation is effective on the last business day of the semiannual reporting period for fiscal years beginning after December 15, 2006 and is to be applied to open tax positions upon initial adoption. This Interpretation prescribes a minimum recognition threshold and measurement method for the financial statement recognition of tax positions taken or expected to be taken in a tax return and also requires certain expanded disclosures. Management is evaluating the application of this
128
NOTES TO FINANCIAL STATEMENTS (continued)
July 31, 2007
Interpretation to the Funds and has not at this time quantified the impact, if any, resulting from the adoption of this Interpretation on the Funds' financial statements.
Note 4. Fees and compensation paid to affiliates:
Investment advisory fee. Columbia, an indirect, wholly-owned subsidiary of Bank of America Corporation ("BOA"), is the investment advisor to the Funds. With the exception of CMG Small Cap Growth Fund, each Fund's investment advisory fee is a unified fee. Columbia, out of the unified fee it receives from the Funds, pays all accounting fees, legal fees, transfer agent fees, custody fees, expenses of the Chief Compliance Officer, fees for Sarbanes-Oxley compliance, the commitment fee for the line of credit and miscellaneous expenses of the Funds. The unified fee does not include brokerage fees, taxes, Trustees' fees, Trustee legal counsel fees, audit fees, interest expenses associated with any borrowings by the Funds or extraordinary expenses, if any. The unified fees are paid monthly to Columbia based on each Fund's average daily net assets at the following an nual rates:
| CMG Enhanced S&P 500® Index Fund | 0.25 | % | |||||
| CMG Large Cap Growth Fund | 0.50 | % | |||||
| CMG Large Cap Value Fund | 0.50 | % | |||||
| CMG Mid Cap Growth Fund | 0.70 | % | |||||
| CMG Mid Cap Value Fund | 0.70 | % | |||||
| CMG Small Cap Value Fund | 0.80 | % | |||||
| CMG Small/Mid Cap Fund | 0.75 | % | |||||
| CMG International Stock Fund | 0.75 | % | |||||
Columbia receives a monthly investment advisory fee from CMG Small Cap Growth Fund at the annual rate of 0.75% of the Fund's average daily net assets.
Pricing & bookkeeping fees. Effective December 15, 2006, the Funds entered into a Financial Reporting Services Agreement with State Street Bank & Trust Company ("State Street") and Columbia (the "Financial Reporting Services Agreement") pursuant to which State Street provides financial reporting services to the Funds. Also effective December 15, 2006, the Funds entered into an Accounting Services Agreement with State Street and Columbia (collectively with the Financial Reporting Services Agreement, the "State Street Agreements") pursuant to which State Street provides accounting services to the Funds.
Effective December 15, 2006, the Funds entered into a Pricing and Bookkeeping Oversight and Services Agreement (the "Services Agreement") with Columbia. Under the Services Agreement, Columbia provides services related to Fund expenses and the requirements of the Sarbanes-Oxley Act of 2002, and provides oversight of the accounting and financial reporting services provided by State Street.
The fees for each Fund, with the exception of CMG Small Cap Growth Fund, are payable by Columbia. For CMG Small Cap Growth Fund, the fee for financial reporting services, accounting services, and pricing and bookkeeping services are payable by Columbia with the exception of the services related to the requirements of the Sarbanes-Oxley Act of 2002.
Prior to December 15, 2006, Columbia was responsible for providing pricing and bookkeeping services to the Funds under a pricing and bookkeeping agreement. Under separate agreements between Columbia and State Street, Columbia delegated certain functions to State Street. The pricing and bookkeeping fees for each Fund, with the exception of CMG Small Cap Growth Fund, were included in the unified fee and payable by Columbia. CMG Small Cap Growth Fund was not charged a fee for pricing and bookkeeping services.
129
NOTES TO FINANCIAL STATEMENTS (continued)
July 31, 2007
Transfer agent fee. Columbia Management Services, Inc. (the "Transfer Agent"), an affiliate of Columbia and an indirect, wholly owned subsidiary of BOA, provides shareholder services to the Funds and has contracted with Boston Financial Data Services ("BFDS") to serve as sub-transfer agent. The transfer agent fees for each Fund, with the exception of CMG Small Cap Growth Fund, are payable by Columbia.
The Transfer Agent is entitled to receive a fee from CMG Small Cap Growth Fund, paid monthly, at the annual rate of $17.00 per open account plus reimbursement of certain sub-transfer agent fees (exclusive of BFDS fees), calculated based on assets held in omnibus accounts subject to certain limitations and intended to recover the cost of payments to other parties (including affiliates of BOA) for services to those accounts.
The Transfer Agent may also retain, as additional compensation for its services, fees for wire, telephone and redemption orders, IRA trustee agent fees and account transcript fees due the Transfer Agent from shareholders of the Funds and credits (net of bank charges) earned with respect to balances in accounts the Transfer Agent maintains in connection with its services to the Funds.
For the year ended July 31, 2007, the annualized effective transfer agent fee rate for CMG Small Cap Growth Fund, inclusive of out-of-pocket expenses, was less than 0.01% of the Fund's average daily net assets.
Fee waivers. Columbia has contractually agreed to reimburse each Fund, with the exception of CMG Small Cap Growth Fund, through March 1, 2009 for certain expenses so that the expenses incurred by the Funds, including the investment advisory fees, will not exceed the following annual rates (exclusive of brokerage commissions, interest, taxes and extraordinary expenses, if any) based on each Fund's average daily net assets:
| CMG Enhanced S&P 500® Index Fund | 0.25 | % | |||||
| CMG Large Cap Growth Fund | 0.50 | % | |||||
| CMG Large Cap Value Fund | 0.50 | % | |||||
| CMG Mid Cap Growth Fund | 0.70 | % | |||||
| CMG Mid Cap Value Fund | 0.70 | % | |||||
| CMG Small Cap Value Fund | 0.80 | % | |||||
| CMG Small/Mid Cap Fund | 0.75 | % | |||||
| CMG International Stock Fund | 0.75 | % | |||||
There is no guarantee that this arrangement will continue after March 1, 2009.
Columbia and its affiliates have contractually agreed to waive fees and reimburse the CMG Small Cap Growth Fund until November 30, 2009, for certain expenses so that total expenses (exclusive of brokerage commissions, interest, taxes and extraordinary expenses, if any) will not exceed 0.80% annually of the Fund's average daily net assets. There is no guarantee that this arrangement will continue after November 30, 2009.
Custody credits. CMG Small Cap Growth Fund has an agreement with its custodian bank under which custody fees may be reduced by balance credits. These credits are recorded as a reduction of total expenses on the Statement of Operations. The Fund could have invested a portion of the assets utilized in connection with the expense offset arrangement in an income-producing asset if it had not entered into such an agreement.
Fees paid to officers and trustees. All officers of the Funds are employees of Columbia or its affiliates and, with the exception of the Funds' Chief Compliance Officer, receive no compensation from the Funds. The Board of Trustees has appointed a Chief Compliance Officer to the Funds in accordance with federal securities regulations. The expenses of the Chief Compliance Officer for each Fund, with the exception of CMG Small Cap Growth Fund, are payable by Columbia. CMG Small Cap Growth Fund, along with other affiliated funds, pays its pro-rata share of the expenses associated with the Chief Compliance Officer.
The Funds' Trustees may participate in a deferred compensation plan which may be terminated at any time. Obligations of the plan will be paid solely out of the Funds' assets.
130
NOTES TO FINANCIAL STATEMENTS (continued)
July 31, 2007
Note 5. Portfolio information:
For the year ended July 31, 2007, the cost of purchases and proceeds from sales of securities, excluding short-term obligations, were as follows:
| Purchases | Sales | ||||||||||
| CMG Enhanced S&P 500® Index Fund | $ | 173,590,433 | $ | 64,538,769 | |||||||
| CMG Large Cap Growth Fund | 90,280,673 | 74,246,489 | |||||||||
| CMG Large Cap Value Fund | 38,646,630 | 34,729,923 | |||||||||
| CMG Mid Cap Growth Fund | 40,527,996 | 39,801,535 | |||||||||
| CMG Mid Cap Value Fund | 11,088,441 | 12,602,326 | |||||||||
| CMG Small Cap Growth Fund | 60,987,662 | 69,437,103 | |||||||||
| CMG Small Cap Value Fund | 15,786,024 | 20,895,514 | |||||||||
| CMG Small/Mid Cap Fund | 18,441,945 | 16,761,309 | |||||||||
| CMG International Stock Fund | 89,700,161 | 97,299,419 | |||||||||
Note 6. Line of credit:
The Funds and other affiliated funds participate in a $350,000,000 committed unsecured revolving line of credit and a $150,000,000 uncommitted, unsecured line of credit, both provided by State Street. Borrowings are available for temporary or emergency purposes.
Interest on the committed line of credit is charged to each participating fund based on the fund's borrowings at a rate per annum equal to the Federal Funds Rate plus 0.50%. In addition, a commitment fee of 0.10% per annum is accrued and apportioned among the participating funds based on their pro-rata portion of the unutilized committed line of credit. Interest on the uncommitted line of credit is charged to each participating fund based on the fund's borrowings at a variable rate per annum equal to the Federal Funds Rate plus a spread, as determined and quoted by State Street at the time of the request for a loan. A one-time structuring fee of $30,000 is also accrued and apportioned to each fund participating in the uncommitted line of credit based on the average net assets of the participating funds. In addition, if the uncommitted line of credit is extended for an additional period, an annual administration fee of $15,000 wi ll be charged and apportioned among each participating fund. The commitment fee and structuring fee are included in the unified fee with the exception of those fees owed by CMG Small Cap Growth Fund.
For the year ended July 31, 2007, the average daily loan balance outstanding on days where borrowings existed and the weighted average interest rates for the Funds that participated in these arrangements are as follows:
| Average Borrowings | Weighted Average Interest Rates | ||||||||||
| CMG Enhanced S&P 500® Index Fund | $ | 4,000,000 | 3.50 | % | |||||||
| CMG Small Cap Growth Fund | 1,000,000 | 5.75 | |||||||||
| CMG Small Cap Value Fund | 5,000,000 | 5.75 | |||||||||
| CMG International Stock Fund | 4,363,636 | 5.77 | |||||||||
Note 7. Securities lending:
CMG Enhanced S&P 500® Index Fund and CMG Large Cap Value Fund commenced a securities lending program in August 2006 and may lend their securities to certain approved brokers, dealers and other financial institutions. Each
131
NOTES TO FINANCIAL STATEMENTS (continued)
July 31, 2007
loan is collateralized by cash, in an amount at least equal to the market value of the securities loaned plus accrued income from the investment of collateral. The market value of the loaned securities is determined at the close of business of the Funds and any additional required collateral is delivered to the Funds on the next business day. The collateral received is invested and the income generated by the investment of the collateral, net of any fees remitted to State Street as the lending agent and borrower rebates, is paid to the Funds. Generally, in the event of borrower default, the Funds have the right to use the collateral to offset any losses incurred. In the event the Funds are delayed or prevented from exercising their right to dispose of the collateral, there may be a potential loss to the Funds. The Funds bear the risk of loss with respect to the investment of collateral.
Note 8. Other:
During the year ended July 31, 2007, Columbia voluntarily reimbursed CMG International Stock Fund $8 for a realized investment loss due to a trading error.
Note 9. Shares of beneficial interest:
As of July 31, 2007, the Funds had shareholders whose shares were beneficially owned by participant accounts over which BOA and/or its affiliates had either sole or joint investment discretion. Subscription and redemption activity of these accounts may have a significant effect on the operations of the Funds. The percentage of shares of beneficial interest outstanding held therein are as follows:
| % of Shares Outstanding Held | |||||||
| CMG Enhanced S&P 500® Index Fund | 89.5 | ||||||
| CMG Large Cap Growth Fund | 100.0 | ||||||
| CMG Large Cap Value Fund | 100.0 | ||||||
| CMG Mid Cap Growth Fund | 99.9 | ||||||
| CMG Mid Cap Value Fund | 100.0 | ||||||
| CMG Small Cap Growth Fund | 100.0 | ||||||
| CMG Small Cap Value Fund | 97.2 | ||||||
| CMG Small/Mid Cap Fund | 100.0 | ||||||
| CMG International Stock Fund | 100.0 | ||||||
In addition, as of July 31, 2007, CMG Enhanced S&P 500® Index Fund had one shareholder, over which BOA and/or any of its affiliates did not have investment discretion, that held 10.5% of the shares outstanding. Subscription and redemption activity of this shareholder may have a material effect on the Fund.
Note 10. Disclosure of significant risks and contingencies:
Foreign securities. There are certain additional risks involved when investing in foreign securities that are not inherent with investments in domestic securities. These risks may involve foreign currency exchange rate fluctuations, adverse political and economic developments and the possible prevention of currency exchange or other foreign governmental laws or restrictions. In addition, the liquidity of foreign securities may be more limited than that of domestic securities.
Investments in emerging market countries are subject to additional risk. The risk of foreign investments is typically increased in less developed countries. These countries are also more likely to experience high levels of inflation, deflation or currency devaluation which could hurt their economies and securities markets.
132
NOTES TO FINANCIAL STATEMENTS (continued)
July 31, 2007
Sector focus. The Funds may focus their investments in certain sectors, subjecting them to greater risk than a fund that is more diversified.
Legal proceedings. On February 9, 2005, Columbia Management Advisors, Inc. (which has since merged into Banc of America Capital Management, LLC (now named Columbia Management Advisors, LLC)) ("Columbia") and Columbia Funds Distributor, Inc. (which has been renamed Columbia Management Distributors, Inc.) (the "Distributor") (collectively, the "Columbia Group") entered into an Assurance of Discontinuance with the New York Attorney General ("NYAG") (the "NYAG Settlement") and consented to the entry of a cease-and-desist order by the Securities and Exchange Commission ("SEC") (the "SEC Order") on matters relating to mutual fund trading.
Under the terms of the SEC Order, the Columbia Group agreed, among other things, to: pay $70 million in disgorgement and $70 million in civil money penalties; cease and desist from violations of the antifraud provisions and certain other provisions of the federal securities laws; maintain certain compliance and ethics oversight structures; retain an independent consultant to review the Columbia Group's applicable supervisory, compliance, control and other policies and procedures; and retain an independent distribution consultant (see below). The Columbia Funds have also voluntarily undertaken to implement certain governance measures designed to maintain the independence of their boards of trustees. The NYAG Settlement also, among other things, requires Columbia and its affiliates to reduce management fees for certain Columbia Funds (including the former Nations Funds) and other mutual funds collectively by $32 million per year f or five years, for a projected total of $160 million in management fee reductions.
Pursuant to the procedures set forth in the SEC Order, the $140 million in settlement amounts described above is being distributed in accordance with a distribution plan that was developed by an independent distribution consultant and approved by the SEC on April 6, 2007. Distributions under the distribution plan began in late June 2007.
A copy of the SEC Order is available on the SEC website at http://www.sec.gov. A copy of the NYAG Settlement is available as part of the Bank of America Corporation Form 8-K filing on February 10, 2005.
In connection with the events described above, various parties have filed suit against certain funds, the Trustees of the Columbia Funds, FleetBoston Financial Corporation and its affiliated entities and/or Bank of America and its affiliated entities.
On February 20, 2004, the Judicial Panel on Multidistrict Litigation transferred these cases and cases against other mutual fund companies based on similar allegations to the United States District Court in Maryland for consolidated or coordinated pretrial proceedings (the "MDL"). Subsequently, additional related cases were transferred to the MDL. On September 29, 2004, the plaintiffs in the MDL filed amended and consolidated complaints. One of these amended complaints is a putative class action that includes claims under the federal securities laws and state common law, and that names Columbia, the Distributor, the Trustees of the Columbia Funds, Bank of America Corporation and others as defendants. Another of the amended complaints is a derivative action purportedly on behalf of the Columbia Funds that asserts claims under federal securities laws and state common law.
On February 25, 2005, Columbia and other defendants filed motions to dismiss the claims in the pending cases. On March 1, 2006, for reasons stated in the court's memoranda dated November 3, 2005, the U.S. District Court for the District of Maryland granted in part and denied in part the defendants' motions to dismiss. The court dismissed all of the class action claims pending against the Columbia Funds Trusts. As to Columbia and the Distributor, the claims under the Securities Act of 1933, the claims under Sections 34(b) and 36(a) of the Investment Company Act of 1940 ("ICA") and the state law claims were dismissed. The claims under Sections 10(b) and 20(a) of the Securities Exchange Act of 1934 and claims under Section 36(b) of the ICA were not dismissed.
On March 21, 2005, a purported class action was filed in Massachusetts state court alleging that certain conduct, including market timing, entitled Class B shareholders in certain Columbia funds to an exemption from contingent
133
NOTES TO FINANCIAL STATEMENTS (continued)
July 31, 2007
deferred sales charges upon early redemption ("the CDSC Lawsuit"). The CDSC Lawsuit was removed to federal court in Massachusetts and transferred to the MDL.
On September 14, 2007, the plaintiffs and the Columbia defendants named in the MDL, including the Columbia Funds, entered into a stipulation of settlement with respect to all Columbia-related claims in the MDL described above, including the CDSC Lawsuit. The settlement is subject to court approval.
In 2004, the Columbia Funds' adviser and distributor and certain affiliated entities and individuals were named as defendants in certain purported shareholder class and derivative actions making claims, including claims under the Investment Company and the Investment Advisers Acts of 1940 and state law. Certain Columbia Funds were named as nominal defendants. The suits allege, inter alia, that the fees and expenses paid by the funds are excessive and that the advisers and their affiliates inappropriately used fund assets to distribute the funds and for other improper purposes. On March 2, 2005, the actions were consolidated in the Massachusetts federal court as In re Columbia Entities Litigation. The plaintiffs filed a consolidated amended complaint on June 9, 2005. On November 30, 2005, the judge dismissed all claims by plaintiffs and entered final judgment in favor of the defendants. The plaintiffs appealed to the United States Court of Appeals for the First Circuit on December 30, 2005. A stipulation and settlement agreement dated January 19, 2007 was filed in the First Circuit on February 14, 2007, with a joint stipulation of dismissal and motion for remand to obtain district court approval of the settlement. That joint motion was granted and the appeal was dismissed. On March 6, 2007, the case was remanded to the District Court. On September 18, 2007, the District Court approved the settlement, to be effective following the expiration of the appeal period. The funds' adviser and/or its affiliates will be required, pursuant to the settlement, to make certain payments including plaintiffs' attorneys' fees and costs of notice to clas s members.
Note 11. Business combinations and mergers:
Effective March 27, 2006, CMG Small Cap Growth Fund, a series of Columbia Funds Institutional Trust, merged into CMG Small Cap Fund. CMG Small Cap Fund was then renamed CMG Small Cap Growth Fund. CMG Small Cap Fund received a tax-free transfer of assets from CMG Small Cap Growth Fund as follows:
| Shares Issued | Net Assets Received | Unrealized Appreciation1 | |||||||||
| 18,087,654 | $ | 40,504,741 | $ | 8,060,601 | |||||||
| Net Assets of CMG Small Cap Fund Prior to Combination | Net Assets of CMG Small Cap Growth Fund Immediately Prior to Combination | Net Assets of CMG Small Cap Fund Immediately After Combination | |||||||||
| $ | 6,118,119 | $ | 40,504,741 | $ | 46,622,860 | ||||||
1 Unrealized appreciation is included in the Net Assets Received.
134
Report of Independent Registered Public Accounting Firm
To the Trustees of Columbia Funds Institutional Trust and Shareholders of CMG Enhanced S&P 500® Index Fund, CMG Large Cap Growth Fund, CMG Large Cap Value Fund, CMG Mid Cap Growth Fund, CMG Mid Cap Value Fund, CMG Small Cap Growth Fund, CMG Small Cap Value Fund, CMG Small/Mid Cap Fund and CMG International Stock Fund
In our opinion, the accompanying statements of assets and liabilities, including the schedules of investments, and the related statements of operations and of changes in net assets and the financial highlights present fairly, in all material respects, the financial position of CMG Enhanced S&P 500® Index Fund, CMG Large Cap Growth Fund, CMG Large Cap Value Fund, CMG Mid Cap Growth Fund, CMG Mid Cap Value Fund, CMG Small Cap Growth Fund, CMG Small Cap Value Fund, CMG Small/Mid Cap Fund and CMG International Stock Fund (the "Funds") (each a series of Columbia Funds Institutional Trust) at July 31, 2007, the results of each of their operations for the year then ended, the changes in each of their net assets for each of the two years in the period then ended and the financial highlights for each of the periods indicated, in conformity with accounting principles generally accepted in the United States of America. T hese financial statements and financial highlights (hereafter referred to as "financial statements") are the responsibility of the Funds' management. Our responsibility is to express an opinion on these financial statements based on our audits. We conducted our audits of these financial statements in accordance with the standards of the Public Company Accounting Oversight Board (United States). Those standards require that we plan and perform the audit to obtain reasonable assurance about whether the financial statements are free of material misstatement. An audit includes examining, on a test basis, evidence supporting the amounts and disclosures in the financial statements, assessing the accounting principles used and significant estimates made by management, and evaluating the overall financial statement presentation. We believe that our audits, which included confirmation of securities at July 31, 2007 by correspondence with the custodian and brokers, provide a reasonable basis for our opinion.
PricewaterhouseCoopers LLP
Boston, Massachusetts
September 21, 2007
135
Unaudited Information
Federal Income Tax Information
CMG Enhanced S&P 500® Index Fund
For the fiscal year ended July 31, 2007, the Fund designates long-term capital gains of $4,302,553.
47.39% of the ordinary income distributed by the Fund, for the year ended July 31, 2007, qualifies for the corporate dividends received deduction.
For non-corporate shareholders 47.40%, or the maximum amount allowable under the Jobs and Growth Tax Relief Reconciliation Act of 2003, of income earned by the Fund for the period August 1, 2006 to July 31, 2007 may represent qualified dividend income. Final information will be provided in your 2007 Form 1099-DIV.
CMG Large Cap Growth Fund
For the fiscal year ended July 31, 2007, the Fund designates long-term capital gains of $1,822,616.
25.51% of the ordinary income distributed by the Fund, for the year ended July 31, 2007, qualifies for the corporate dividends received deduction.
For non-corporate shareholders 26.59%, or the maximum amount allowable under the Jobs and Growth Tax Relief Reconciliation Act of 2003, of income earned by the Fund for the period August 1, 2006 to July 31, 2007 may represent qualified dividend income. Final information will be provided in your 2007 Form 1099-DIV.
CMG Large Cap Value Fund
For the fiscal year ended July 31, 2007, the Fund designates long-term capital gains of $3,581,184.
52.91% of the ordinary income distributed by the Fund, for the year ended July 31, 2007, qualifies for the corporate dividends received deduction.
For non-corporate shareholders 58.75%, or the maximum amount allowable under the Jobs and Growth Tax Relief Reconciliation Act of 2003, of income earned by the Fund for the period August 1, 2006 to July 31, 2007 may represent qualified dividend income. Final information will be provided in your 2007 Form 1099-DIV.
CMG Mid Cap Growth Fund
For the fiscal year ended July 31, 2007, the Fund designates long-term capital gains of $2,986,987.
15.90% of the ordinary income distributed by the Fund, for the year ended July 31, 2007, qualifies for the corporate dividends received deduction.
For non-corporate shareholders 17.04%, or the maximum amount allowable under the Jobs and Growth Tax Relief Reconciliation Act of 2003, of income earned by the Fund for the period August 1, 2006 to July 31, 2007 may represent qualified dividend income. Final information will be provided in your 2007 Form 1099-DIV.
136
Unaudited Information (continued)
CMG Mid Cap Value Fund
For the fiscal year ended July 31, 2007, the Fund designates long-term capital gains of $1,778,024.
35.46% of the ordinary income distributed by the Fund, for the year ended July 31, 2007, qualifies for the corporate dividends received deduction.
For non-corporate shareholders 36.99%, or the maximum amount allowable under the Jobs and Growth Tax Relief Reconciliation Act of 2003, of income earned by the Fund for the period August 1, 2006 to July 31, 2007 may represent qualified dividend income. Final information will be provided in your 2007 Form 1099-DIV.
CMG Small Cap Growth Fund
For the fiscal year ended July 31, 2007, the Fund designates long-term capital gains of $3,668,720.
CMG Small Cap Value Fund
For the fiscal year ended July 31, 2007, the Fund designates long-term capital gains of $5,155,648.
53.37% of the ordinary income distributed by the Fund, for the year ended July 31, 2007, qualifies for the corporate dividends received deduction.
For non-corporate shareholders 53.05%, or the maximum amount allowable under the Jobs and Growth Tax Relief Reconciliation Act of 2003, of income earned by the Fund for the period August 1, 2006 to July 31, 2007 may represent qualified dividend income. Final information will be provided in your 2007 Form 1099-DIV.
CMG Small/Mid Cap Fund
For the fiscal year ended July 31, 2007, the Fund designates long-term capital gains of $1,291,321.
1.34% of the ordinary income distributed by the Fund, for the year ended July 31, 2007, qualifies for the corporate dividends received deduction.
For non-corporate shareholders 1.47%, or the maximum amount allowable under the Jobs and Growth Tax Relief Reconciliation Act of 2003, of income earned by the Fund for the period August 1, 2006 to July 31, 2007 may represent qualified dividend income. Final information will be provided in your 2007 Form 1099-DIV.
CMG International Stock Fund
For the fiscal year ended July 31, 2007, the Fund designates long-term capital gains of $9,266,215.
Foreign taxes paid during the fiscal year ended July 31, 2007, amounting to $302,514 ($0.04 per share) are expected to be passed through to shareholders as 100% allowable foreign tax credits on Form 1099-DIV for the year ending December 31, 2007.
Gross income derived from sources within foreign countries amounted to $2,819,220 ($0.34 per share) for the fiscal year ended July 31, 2007.
For non-corporate shareholders 79.01%, or the maximum amount allowable under the Jobs and Growth Tax Relief Reconciliation Act of 2003, of income earned by the Fund for the period August 1, 2006 to July 31, 2007 may represent qualified dividend income. Final information will be provided in your 2007 Form 1099-DIV.
137
Fund Governance
Trustees
The Trustees serve terms of indefinite duration. The names, addresses and ages of the Trustees and officers of the Funds in Columbia Funds Institutional Trust, the year each was first elected or appointed to office, their principal business occupations during at least the last five years, the number of portfolios overseen by each Trustee and other directorships they hold are shown below. Each officer listed below serves as an officer of each Fund in the Columbia Funds Complex.
| Name, Address and Year of Birth, Position with Funds, Year First Elected or Appointed to Office1 | Principal Occupation(s) During Past Five Years, Number of Portfolios in Columbia Funds Complex Overseen by Trustee, Other Directorships Held | ||||||
| Independent Trustees | |||||||
| Douglas A. Hacker (Born 1955) c/o Columbia Management Advisors, LLC One Financial Center Boston, MA 02111 Trustee (since 1996) | Independent business executive since May, 2006; Executive Vice President–Strategy of United Airlines (airline) from December, 2002 to May, 2006; President of UAL Loyalty Services (airline marketing company) from September, 2001 to December, 2002; Executive Vice President and Chief Financial Officer of United Airlines from July, 1999 to September, 2001. Oversees 68, Nash Finch Company (food distributor); Aircastle Limited (aircraft leasing) | ||||||
| Janet Langford Kelly (Born 1957) c/o Columbia Management Advisors, LLC One Financial Center Boston, MA 02111 Trustee (since 1996) | Senior Vice President, General Counsel and Corporate Secretary, ConocoPhillips (integrated energy company) since September, 2007; Deputy General Counsel—Corporate Legal Services, ConocoPhillips from August, 2006 to August, 2007; Partner, Zelle, Hofmann, Voelbel, Mason & Gette LLP (law firm) from March, 2005 to July, 2006; Adjunct Professor of Law, Northwestern University, from September, 2004 to June, 2006, Director, UAL Corporation (airline) from February, 2006 to July, 2006; Chief Administrative Officer and Senior Vice President, Kmart Holding Corporation (consumer goods), from September, 2003 to March, 2004; Executive Vice President-Corporate Development and Administration, General Counsel and Secretary, Kellogg Company (food manufacturer), from September, 1999 to August, 2003. Oversees 68, None | ||||||
| Richard W. Lowry (Born 1936) c/o Columbia Management Advisors, LLC One Financial Center Boston, MA 02111 Trustee (since 1995) | Private Investor since August, 1987 (formerly Chairman and Chief Executive Officer, U.S. Plywood Corporation (building products manufacturer) until 1987). Oversees 68, Liberty All-Star Equity Fund and Liberty All-Star Growth Fund, Inc. (closed-end funds) | ||||||
| Charles R. Nelson (Born 1942) c/o Columbia Management Advisors, LLC One Financial Center Boston, MA 02111 Trustee (since 1981) | Professor of Economics, University of Washington, since January, 1976; Ford and Louisa Van Voorhis Professor of Political Economy, University of Washington, since September, 1993; Director, Institute for Economic Research, University of Washington from September, 2001 to June, 2003; Adjunct Professor of Statistics, University of Washington, since September, 1980; Associate Editor, Journal of Money Credit and Banking, since September, 1993; Consultant on econometric and statistical matters. Oversees 68, None | ||||||
| John J. Neuhauser (Born 1943) c/o Columbia Management Advisors, LLC One Financial Center Boston, MA 02111 Trustee (since 1985) | President, St. Michaels College, since August, 2007; University Professor, Boston College from November, 2005 to August, 2007; Academic Vice President and Dean of Faculties, Boston College from August, 1999 to October, 2005. Oversees 68, Liberty All-Star Equity Fund and Liberty All-Star Growth Fund, Inc. (closed-end funds) | ||||||
138
Fund Governance (Continued)
| Name, Address and Year of Birth, Position with Funds, Year First Elected or Appointed to Office1 | Principal Occupation(s) During Past Five Years, Number of Portfolios in Columbia Funds Complex Overseen by Trustee, Other Directorships Held | ||||||
| Independent Trustees | |||||||
| Patrick J. Simpson (Born 1944) c/o Columbia Management Advisors, LLC One Financial Center Boston, MA 02111 Trustee (since 2000) | Partner, Perkins Coie LLP (law firm). Oversees 68, None | ||||||
| Thomas E. Stitzel (Born 1936) c/o Columbia Management Advisors, LLC One Financial Center Boston, MA 02111 Trustee (since 1998) | Business Consultant since 1999; Chartered Financial Analyst. Oversees 68, None | ||||||
| Thomas C. Theobald (Born 1937) c/o Columbia Management Advisors, LLC One Financial Center Boston, MA 02111 Trustee and Chairman of the Board2 (since 1996) | Partner and Senior Advisor, Chicago Growth Partners (private equity investing) since September, 2004; Managing Director, William Blair Capital Partners (private equity investing) from September, 1994 to September, 2004. Oversees 68, Anixter International (network support equipment distributor); Ventas, Inc. (real estate investment trust); Jones Lang LaSalle (real estate management services); Ambac Financial Group (financial guaranty insurance) | ||||||
| Anne-Lee Verville (Born 1945) c/o Columbia Management Advisors, LLC One Financial Center Boston, MA 02111 Trustee (since 1998) | Retired since 1997 (formerly General Manager, Global Education Industry, IBM Corporation (computer and technology) from 1994 to 1997). Oversees 68, None | ||||||
| Interested Trustee | |||||||
| William E. Mayer (Born 1940) c/o Columbia Management Advisors, LLC One Financial Center Boston, MA 02111 Trustee3 (since 1994) | Partner, Park Avenue Equity Partners (private equity) since February, 1999; Dean and Professor, College of Business, University of Maryland, 1992 to 1997. Oversees 68, Lee Enterprises (print media), WR Hambrecht + Co. (financial service provider); Reader's Digest (publishing) | ||||||
1 In December 2000, the boards of each of the former Liberty Funds and former Stein Roe Funds were combined into one board of trustees responsible for the oversight of both fund groups (collectively, the "Liberty Board"). In October 2003, the trustees on the Liberty Board were elected to the boards of the Columbia Funds (the "Columbia Board") and of the CMG Fund Trust (the "CMG Funds Board"); simultaneous with that election, Patrick J. Simpson who had been a director on the Columbia Board and trustee on the CMG Funds Board, was appointed to serve as trustee of the Liberty Board. The date shown is the earliest date on which a trustee/director was elected or appointed to the board of a Fund in the Columbia Funds Complex.
2 Mr. Theobald was appointed as Chairman of the Board effective December 10, 2003.
3 Mr. Mayer is an "interested person" (as defined in the Investment Company Act of 1940) by reason of his affiliation with WR Hambrecht + Co.
The Statement of Additional Information includes additional information about the Trustees of the Funds and is available, without charge, upon request by calling 1-800-774-2098.
139
Fund Governance (Continued)
Officers
| Name, Address and Year of Birth, Position with Columbia Funds, Year First Elected or Appointed to Office | Principal Occupation(s) During Past Five Years | ||||||
| Christopher L. Wilson (Born 1957) One Financial Center Boston, MA 02111 President (since 2004) | President–Columbia Funds, since October 2004; Managing Director–Columbia Management Advisors, LLC, since September 2005; Senior Vice President–Columbia Management Distributors, Inc., since January 2005; Director–Columbia Management Services, Inc., since January 2005; Director–Bank of America Global Liquidity Funds, plc and Banc of America Capital Management (Ireland), Limited, since May 2005; Director–FIM Funding, Inc., since January 2005; President and Chief Executive Officer–CDC IXIS AM Services, Inc. (investment management), from September 1998 through August 2004; and a senior officer or director of various other Bank of America-affiliated entities, including other registered and unregistered funds. | ||||||
| James R. Bordewick, Jr. (Born 1959) One Financial Center Boston, MA 02111 Senior Vice President, Secretary and Chief Legal Officer (since 2006) | Associate General Counsel, Bank of America since April, 2005; Senior Vice President and Associate General Counsel, MFS Investment Management (investment management) prior to April, 2005. | ||||||
| J. Kevin Connaughton (Born 1964) One Financial Center Boston, MA 02111 Senior Vice President, Chief Financial Officer and Treasurer (since 2000) | Treasurer–Columbia Funds, since October 2003; Treasurer–the Liberty Funds, Stein Roe Funds and Liberty All-Star Funds, December 2000–December 2006; Vice President–Columbia Management Advisors, Inc., since April 2003; President–Columbia Funds, Liberty Funds and Stein Roe Funds, February 2004 to October 2004; Treasurer–Galaxy Funds, September 2002 to December 2005; Treasurer, December 2002 to December 2004, and President, February 2004 to December 2004–Columbia Management Multi-Strategy Hedge Fund, LLC; and a senior officer of various other Bank of America-affiliated entities, including other registered and unregistered funds. | ||||||
| Linda J. Wondrack (Born 1964) One Financial Center Boston, MA 02111 Senior Vice President, Chief Compliance Officer (since 2007) | Director (Columbia Management Group LLC and Investment Product Group Compliance), Bank of America since June 2005; Director of Corporate Compliance and Conflicts Officer, MFS Investment Management (investment management), August 2004 to May 2005; Managing Director, Deutsche Asset Management (investment management) prior to August 2004. | ||||||
| Michael G. Clarke (Born 1969) One Financial Center Boston, MA 02111 Chief Accounting Officer and Assistant Treasurer (since 2004) | Director of Fund Administration of the Advisor since January, 2006; Managing Director of the Advisor September, 2004 to December, 2005; Vice President Fund Administration of the Advisor June, 2002 to September, 2004. Vice President Product Strategy and Development of the Advisor from February, 2001 to June, 2002. | ||||||
| Jeffrey R. Coleman (Born 1969) One Financial Center Boston, MA 02111 Deputy Treasurer (since 2006) | Director of Fund Administration of the Advisor since January, 2006; Fund Controller of the Advisor from October 2004 to January 2006; Vice President of CDC IXIS Asset Management Services, Inc. (investment management) from August, 2000 to September, 2004. | ||||||
| Joseph F. DiMaria (Born 1968) One Financial Center Boston, MA 02111 Deputy Treasurer (since 2006) | Director of Fund Administration of the Advisor since January, 2006; Head of Tax/Compliance and Assistant Treasurer of the Advisor from November, 2004 to December, 2005; Director of Trustee Administration (Sarbanes-Oxley) of the Advisor from May, 2003 to October, 2004; Senior Audit Manager, PricewaterhouseCoopers (independent registered public accounting firm) from July, 2000 to April, 2003. | ||||||
140
Fund Governance (Continued)
Officers
| Name, Address and Year of Birth, Position with Columbia Funds, Year First Elected or Appointed to Office | Principal Occupation(s) During Past Five Years | ||||||
| Marybeth C. Pilat (Born 1968) One Financial Center Boston, MA 02111 Deputy Treasurer (since 2006) | Vice President, Mutual Fund Valuation of the Advisor since January 2006; Vice President, Mutual Fund Accounting Oversight of the Advisor prior to January 2006. | ||||||
| Barry S. Vallan (Born 1969) One Financial Center Boston, MA 02111 Controller (since 2006) | Vice President–Fund Treasury of the Advisor since October, 2004; Vice President–Trustee Reporting of the Advisor from April, 2002 to October, 2004; Management Consultant, PricewaterhouseCoopers (independent registered public accounting firm) prior to October, 2002. | ||||||
141
COLUMBIA FUNDS INSTITUTIONAL TRUST
ONE FINANCIAL CENTER BOSTON, MA 02111-2621
- INVESTMENT ADVISOR -
COLUMBIA MANAGEMENT ADVISORS, LLC
100 FEDERAL STREET
BOSTON, MASSACHUSETTS 02110-2624
- LEGAL COUNSEL -
ROPES & GRAY LLP
ONE INTERNATIONAL PLACE
BOSTON, MA 02110-2624
- TRANSFER AGENT -
COLUMBIA MANAGEMENT SERVICES, INC.
P.O. BOX 8081
BOSTON, MASSACHUSETTS 02266-8081
SHC-42/134205-0707 (09/07) 07/42222
A description of the funds' proxy voting policies and procedures is available (i) at www.columbiamanagement.com; (ii) on the Securities and Exchange Commission's website at www.sec.gov, and (iii) without charge, upon request, by calling 1-800-368-0346. Information regarding how the funds voted proxies relating to portfolio securities during the 12-month period ended June 30 is available from the SEC's website. Information regarding how the funds voted proxies relating to portfolio securities is also available from the funds' website.
Each fund files a complete schedule of portfolio holdings with the SEC for the first and third quarters of each fiscal year on Form N-Q. Each fund's Form N-Q is available on the SEC's website at www.sec.gov and may be reviewed and copied at the SEC's Public Reference Room in Washington, D.C. Information on the operation of the Public Reference Room may be obtained by calling 1-800-SEC-0330.
The funds are offered by prospectus through Columbia Management Distributors, Inc. Please consider the investment objectives, risks, charges and expenses of a mutual fund carefully before investing. Contact your Columbia Management representative or visit www.columbiamanagement.com for a prospectus, which contains this and other important information about the fund. Read it carefully before you invest.
Fund distributed by Columbia Management Distributors, Inc.
©2007 Columbia Management Distributors, Inc.
One Financial Center, Boston, MA 02111-2621
![]()
CMG STRATEGIC EQUITY FUND
A PORTFOLIO OF COLUMBIA FUNDS INSTITUTIONAL TRUST
Annual Report
July 31, 2007
NOT FDIC INSURED
May Lose Value
No Bank Guarantee
NOT BANK ISSUED
Columbia Management Group, LLC ("Columbia Management") is the investment management division of Bank of America Corporation. Columbia Management entities furnish investment management services and products for institutional and individual investors. The fund is distributed by Columbia Management Distributors, Inc., member of FINRA, SIPC, part of Columbia Management and an affiliate of Bank of America Corporation.
Columbia Management Advisors, LLC ("CMA") is an SEC-registered investment advisor and an indirect, wholly-owned subsidiary of Bank of America Corporation and is part of Columbia Management.
The views expressed in this report reflect the current views of the respective parties. These views are not guarantees of future performance and involve certain risks, uncertainties and assumptions that are difficult to predict so actual outcomes and results may differ significantly from the views expressed. These views are subject to change at any time based upon economic, market or other conditions and the respective parties disclaim any responsibility to update such views. These views may not be relied on as investment advice and, because investment decisions for the Fund are based on numerous factors, may not be relied on as an indication of trading intent on behalf of the Fund. References to specific securities should not be construed as a recommendation or investment advice.
Performance data quoted represents past performance, and current performance may be lower or higher. Past performance is no guarantee of future results. The investment return and principal value will fluctuate so that shares, when redeemed, may be worth more or less than the original cost. Please visit www.columbiamanagement.com for daily and most recent month-end performance updates.
CMG STRATEGIC EQUITY FUND
A Portfolio of Columbia Funds Institutional Trust
MANAGEMENT DISCUSSION OF FUND PERFORMANCE
For the 12-month period ended July 31, 2007, CMG Strategic Equity Fund returned 17.08%. The fund outperformed the 16.45% return of the Russell 1000 Index1, the 16.13% return of the S&P 500 Index1 and the 16.36% average return of the Lipper Multi-Cap Core Funds Classifications.2 The fund's performance advantage relative to its benchmark and peer group was primarily the result of stock selection. Beginning on February 23, 2007, the fund's benchmark was changed to the Russell 1000 Index1. The advisor believes that the Russell 1000 Index, because of its broader market representation, more accurately reflects the type of securities in which the fund invests.
The consumer discretionary sector was an area of relative strength for the fund for the reporting period. The fund benefited from its holdings in NIKE, Inc. (0.9% of net assets) and Expedia (sold from the portfolio). On the international front, the fund benefited from positions in Net Servicos de Comunicacao SA (0.7% of net assets) and Desarrolladora Homex SA de CV (0.2% of net assets). However, certain consumer discretionary names detracted from results. Among these disappointments were J.C. Penney Co., Inc. (0.6% of net assets), Starbucks Corp. (0.3% of net assets) and Office Depot, Inc. (sold from the fund).
The materials sector was also an area of relative strength for the fund. On the domestic front the fund benefited from its holdings in Lyondell Chemical Co. (0.5% of net assets) and Freeport-McMoRan Copper & Gold, Inc. (0.4% of net assets). On the international front, the fund benefited from its holdings in Arcelor Mittal (0.5% of net assets) and Companhia Vale do Rio Doce (0.3% of net assets). Although the materials sector enhanced performance, Bowater, Inc. (0.3% of net assets) and Newmont Mining Corp. (sold from the fund) were two disappointments during the reporting period.
The fund's most disappointing results came from the information technology sector, which was an area of significant relative weakness. The fund experienced several individual disappointments from selections such as Samsung Electronics Co., Ltd. (0.3% of net assets), Dell, Inc., Red Hat, Inc., The Knot, Inc. and CSR PLC. All of these stocks, except Samsung Electronics Co., Ltd. were sold from the portfolio during the period. Select industrial stocks also were disappointing.
Looking forward, we are concerned about the maturity of the U.S. economic cycle and the credit issues in the system. As a result we currently plan to maintain an underweight position in the financial sector. We feel more favorably towards the energy sector. Finally, we will continue to evaluate investment opportunities overseas, considering areas with potentially compelling growth trends.
1
We appreciate your continued confidence in CMG Strategic Equity Fund.
Emil A. Gjester has managed or co-managed the fund since January 2004 and has been with the advisor or its predecessors or affiliate organizations since 1996.
Jonas Patrikson has co-managed the fund since February 2006 and has been with the advisor or its predecessors or affiliate organizations since 2004.
Dara White has co-managed the fund since February 2006 and has been with the advisor since January 2006.
Michael T. Welter has co-managed the fund since July 2006 and has been with the advisor since July 2006.
1 The Russell 1000 Index tracks the performance of 1000 of the largest US Companies, based on market capitalization. The Standard & Poor's (S&P) 500 Index tracks the performance of 500 widely held, large-capitalization U.S. stocks. Indices are not investments, do not incur fees or expenses and are not professionally managed. It is not possible to invest directly in an index. Securities in the fund may not match those in an index.
2 Lipper Inc., a widely respected data provider in the industry, calculates an average total return (assuming reinvestment of distributions) for mutual funds with investment objectives similar to those of the fund. Lipper makes no adjustment for the effect of sales loads.
The fund's top ten holdings (as a percentage of net assets) as of July 31, 2007 were:
| (%) | |||||||
| Exxon Mobil Corp. | 2.8 | ||||||
| Citigroup, Inc. | 2.3 | ||||||
| Procter & Gamble Co. | 1.9 | ||||||
| Google, Inc. | 1.7 | ||||||
| JPMorgan Chase & Co. | 1.7 | ||||||
| Cisco Systems, Inc. | 1.6 | ||||||
| Hewlett-Packard Co. | 1.5 | ||||||
| General Electric Co. | 1.5 | ||||||
| AT&T, Inc. | 1.2 | ||||||
| Freddie Mac | 1.2 | ||||||
Holdings are calculated as a percentage of net assets and are subject to change. Because the fund is actively managed, there is no guarantee the fund will continue to maintain the holdings breakdown listed. The fund's holdings and their weights within the portfolio may change as market conditions change.
Equity investments are affected by stock market fluctuations that occur in response to economic and business developments.
International investing may involve certain risks, including foreign taxation, currency fluctuations, risks associated with possible differences in financial standards and other monetary and political risks.
2
Performance data quoted represents past performance and current performance may be lower or higher. Past performance is no guarantee of future results. The investment return and principal value will fluctuate so that shares, when redeemed, may be worth more or less than the original cost. Please visit www.columbiamanagement.com for daily and most recent month-end performance updates.
Average annual total return as of July 31, 2007 (%)
| Inception | 1-year | 5-year | Life | ||||||||||||||||
| CMG Strategic Equity Fund | 10/09/01 | 17.08 | 14.70 | 13.47 | |||||||||||||||
| Russell 1000 Index | 16.45 | 12.35 | 8.20 | ||||||||||||||||
| S&P 500 Index | 16.13 | 11.81 | 7.54 | ||||||||||||||||
Average annual total return as of June 30, 2007 (%)
| Inception | 1-year | 5-year | Life | ||||||||||||||||
| CMG Strategic Equity Fund | 10/09/01 | 20.75 | 13.64 | 14.20 | |||||||||||||||
| Russell 1000 Index | 20.43 | 11.33 | 8.93 | ||||||||||||||||
| S&P 500 Index | 20.59 | 10.71 | 8.25 | ||||||||||||||||
Index performance is from October 9, 2001.
Performance results reflect any waivers or reimbursements of fund expenses by the advisor and/or any of its affiliates. Absent these waivers or reimbursement arrangements, performance results would have been lower. All results shown assume reinvestment of distributions.
The fund's annual operating expense ratios, with and without contractual waivers, as stated in the fund's prospectus that is current as of the date of this report, are 0.40% and 0.47%, respectively, of average annual net assets. Differences in expense ratios disclosed elsewhere in this report may result from including fee waivers and reimbursements as well as different time periods used in calculating the ratios. The contractual waiver expires 11/30/2007.
Growth of a $5,000,000 investment, October 9, 2001 to July 31, 2007
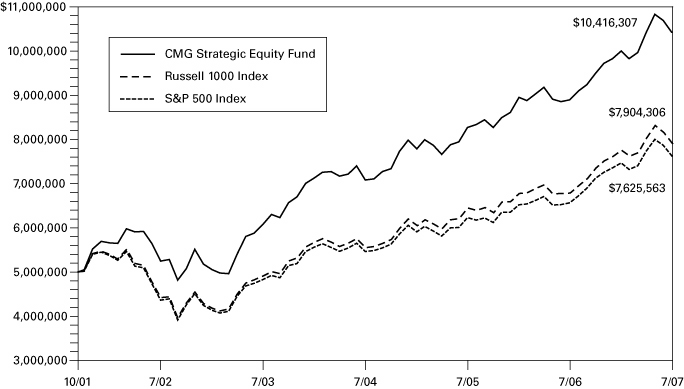
The chart above shows the growth in value of a hypothetical minimum initial $5,000,000 investment in the fund compared to the indices during the period.
The table and chart do not reflect the deduction of taxes that a shareholder may pay on fund distributions or the redemption of fund shares.
The Russell 1000 Index tracks the performance of 1000 of the largest US Companies, based on market capitalization. The Standard & Poor's (S&P) 500 Index tracks the performance of 500 widely held, large-capitalization US stocks. Indices are not investments, do not incur fees or expenses and are not professionally managed. It is not possible to invest directly in an index. Securities in the fund may not match those in an index.
3
UNDERSTANDING YOUR EXPENSES – CMG Strategic Equity Fund
As a fund shareholder, you incur two types of costs. There are transaction costs and also ongoing costs, which generally include investment advisory fees and other fund expenses. The information on this page is intended to help you understand the ongoing costs of investing in the fund and to compare these costs with the ongoing costs of investing in other mutual funds.
Analyzing your fund's expenses
To illustrate these ongoing costs, we have provided an example and calculated the expenses paid by investors during the reporting period. The information in the following table is based on an initial investment of $1,000.00, which is invested at the beginning of the reporting period and held for the entire period. Expense information is calculated two ways and each method provides you with different information. The amount listed in the "actual" column is calculated using the fund's actual operating expenses and total return for the period. The amount listed in the "hypothetical" column assumes that the return each year is 5% before expenses and is calculated based on the fund's actual operating expenses. You should not use the hypothetical account values and expenses to estimate either your actual account balance at the end of the period or the expenses you paid during this reporting period.
Estimating your actual expenses
To estimate the expenses that you paid over the period, first you will need your account balance at the end of the period:
1. Divide your ending account balance by $1,000.00. For example, if an account balance was $8,600.00 at the end of the period, the result would be 8.6.
2. In the section of the table below titled "Expenses paid during the period," locate the amount under "actual." Multiply this number by the result from step 1. Your answer is an estimate of the expenses you paid on your account during the period.
February 1, 2007 — July 31, 2007
| Account value at the beginning of the period ($) | Account value at the end of the period ($) | Expenses paid during the period ($) | Fund's annualized expense ratio (%) | ||||||||||||||||||||||||
| Actual | Hypothetical | Actual | Hypothetical | Actual | Hypothetical | Actual | |||||||||||||||||||||
| 1,000.00 | 1,000.00 | 1,041.51 | 1,022.81 | 2.02 | 2.01 | 0.40 | |||||||||||||||||||||
Expenses paid during the period are equal to the annualized expense ratio of 0.40%, multiplied by the average account value over the period, then multiplied by the number of days in the fund's most recent fiscal half-year and divided by 365.
Had the investment advisor and/or any of its affiliates not waived or reimbursed a portion of expenses, account value at end of the period would have been reduced.
It is important to note that the expense amounts shown in the table are meant to highlight only ongoing costs of investing in the fund and do not reflect any transaction costs. Therefore, the hypothetical examples provided may not help you determine the relative total costs of owning shares of different funds.
Compare with other funds
Since all mutual funds are required to include the same hypothetical calculations about expenses in shareholder reports, you can use this information to compare the ongoing costs of investing in the fund with other funds. To do so, compare the 5% hypothetical example with the 5% hypothetical examples that appear in the shareholder reports of other funds. As you compare hypothetical examples of other funds, it is important to note that hypothetical examples are meant to highlight the continuing costs of investing in a fund and do not reflect any transaction costs, such as sales charges, redemption fees or exchange fees.
4
CMG STRATEGIC EQUITY FUND
A Portfolio of Columbia Funds Institutional Trust
FINANCIAL HIGHLIGHTS
(For a Fund Share Outstanding Throughout Each Period)
| Year Ended July 31, | Period Ended July 31, | Year Ended October 31, | |||||||||||||||||||||||||
| 2007 | 2006 | 2005 | 2004 | 2003 (a) | 2002 | ||||||||||||||||||||||
| Net asset value, beginning of period | $ | 3.13 | $ | 15.22 | $ | 13.80 | $ | 12.06 | $ | 10.14 | $ | 10.10 | |||||||||||||||
| Income from investment operations: | |||||||||||||||||||||||||||
| Net investment income (b) | 0.04 | 0.14 | 0.19 | (c) | 0.12 | 0.10 | 0.11 | ||||||||||||||||||||
| Net realized and unrealized gain (loss) on investments and foreign currency | 0.46 | 0.82 | 2.09 | 1.87 | 1.88 | (0.05 | ) | ||||||||||||||||||||
| Total from investment operations | 0.50 | 0.96 | 2.28 | 1.99 | 1.98 | 0.06 | |||||||||||||||||||||
| Less distributions declared to shareholders: | |||||||||||||||||||||||||||
| From net investment income | (0.03 | ) | (0.57 | ) | (0.14 | ) | (0.09 | ) | (0.06 | ) | (0.02 | ) | |||||||||||||||
| From net realized gains | (0.59 | ) | (12.48 | )(d) | (0.72 | ) | (0.16 | ) | - | - | |||||||||||||||||
| Total distributions declared to shareholders | (0.62 | ) | (13.05 | ) | (0.86 | ) | (0.25 | ) | (0.06 | ) | (0.02 | ) | |||||||||||||||
| Net asset value, end of period | $ | 3.01 | $ | 3.13 | $ | 15.22 | $ | 13.80 | $ | 12.06 | $ | 10.14 | |||||||||||||||
| Total return (e)(f) | 17.08 | %(g) | 7.58 | %(h) | 16.77 | % | 16.58 | % | 19.66 | %(i) | 0.53 | % | |||||||||||||||
| Ratios/Supplemental data: | |||||||||||||||||||||||||||
| Net assets, end of period (000's) | $ | 46,106 | $ | 120,541 | $ | 755,860 | $ | 618,714 | $ | 370,620 | $ | 188,179 | |||||||||||||||
| Ratio of net expenses to average net assets (j) | 0.40 | % | 0.40 | % | 0.40 | % | 0.40 | % | 0.40 | %(k) | 0.40 | % | |||||||||||||||
| Ratio of interest expense to average net assets | - | %(l) | - | - | - | - | - | ||||||||||||||||||||
| Ratio of net investment income to average net assets (j) | 1.31 | % | 1.09 | % | 1.31 | % | 0.88 | % | 1.22 | %(k) | 1.01 | % | |||||||||||||||
| Waiver/reimbursement | 0.22 | % | 0.07 | % | 0.03 | % | 0.05 | % | 0.05 | %(k) | 0.07 | % | |||||||||||||||
| Portfolio turnover rate | 127 | % | 47 | % | 64 | % | 81 | % | 78 | %(i) | 172 | % | |||||||||||||||
(a) The Fund changed its fiscal year end from October 31 to July 31.
(b) Per share data was calculated using the average shares outstanding during the period.
(c) Net investment income per share reflects a special dividend. The effect of this dividend amount to $0.02 per share.
(d) Capital gain distributions were declared after significant shareholder redemptions reduced the size of the Fund.
(e) Total return at net asset value assuming all distributions reinvested.
(f) Had the investment advisor and/or any of its affiliates not waived or reimbursed a portion of expenses, total return would have been reduced.
(g) Includes a reimbursement by the investment advisor due to a compliance violation. This reimbursement increased total return and net asset value per share by less than 0.01% and $0.01, respectively.
(h) Includes a voluntary reimbursement by the investment advisor for a realized investment loss due to a trading error. This reimbursement increased total return and net asset value per share by less than 0.01% and less than $0.01, respectively.
(i) Not annualized.
(j) The benefits derived from custody credits had an impact of less than 0.01%.
(k) Annualized.
(l) Rounds to less than 0.01%.
See Accompanying Notes to Financial Statements.
5
CMG STRATEGIC EQUITY FUND
A Portfolio of Columbia Funds Institutional Trust
SCHEDULE OF INVESTMENTS
July 31, 2007
| Shares | Value | ||||||||||
| Common Stocks (98.9%) | |||||||||||
| Consumer Discretionary (10.0%) | |||||||||||
| Hotels, Restaurants & Leisure (1.3%) | |||||||||||
| Carnival Corp. | 2,340 | $ | 103,685 | ||||||||
| Las Vegas Sands Corp. (a) | 2,650 | 231,212 | |||||||||
| Starbucks Corp. (a) | 5,120 | 136,602 | |||||||||
| Starwood Hotels & Resorts Worldwide, Inc. | 2,160 | 135,994 | |||||||||
| 607,493 | |||||||||||
| Household Durables (0.9%) | |||||||||||
| Cyrela Brazil Realty SA | 14,780 | 173,047 | |||||||||
| Desarrolladora Homex SA de CV, ADR (a) | 1,510 | 85,345 | |||||||||
| Gafisa SA, ADR (a) | 5,100 | 160,395 | |||||||||
| 418,787 | |||||||||||
| Media (3.2%) | |||||||||||
| Comcast Corp., Class A (a) | 19,325 | 505,736 | |||||||||
| Net Servicos de Comunicacao SAB, ADR | 20,500 | 330,050 | |||||||||
| Time Warner Cable, Inc., Class A (a) | 5,210 | 199,126 | |||||||||
| Time Warner, Inc. | 21,524 | 414,552 | |||||||||
| 1,449,464 | |||||||||||
| Multiline Retail (2.5%) | |||||||||||
| J.C. Penney Co., Inc. | 4,180 | 284,407 | |||||||||
| Kohl's Corp. (a) | 3,630 | 220,704 | |||||||||
| Macy's, Inc. | 3,806 | 137,282 | |||||||||
| Nordstrom, Inc. | 3,810 | 181,280 | |||||||||
| Target Corp. | 5,640 | 341,615 | |||||||||
| 1,165,288 | |||||||||||
| Specialty Retail (0.9%) | |||||||||||
| Best Buy Co., Inc. | 3,290 | 146,701 | |||||||||
| GameStop Corp., Class A (a) | 6,290 | 253,801 | |||||||||
| 400,502 | |||||||||||
| Textiles, Apparel & Luxury Goods (1.2%) | |||||||||||
| LVMH Moet Hennessy Louis Vuitton SA | 1,210 | 135,213 | |||||||||
| NIKE, Inc., Class B | 7,720 | 435,794 | |||||||||
| 571,007 | |||||||||||
| 4,612,541 | |||||||||||
| Consumer Staples (9.0%) | |||||||||||
| Beverages (1.6%) | |||||||||||
| Coca-Cola Co. | 9,820 | 511,720 | |||||||||
| Fomento Economico Mexicano SAB de CV, ADR | 6,690 | 247,664 | |||||||||
| 759,384 | |||||||||||
| Food & Staples Retailing (2.4%) | |||||||||||
| CVS Caremark Corp. | 6,390 | 224,864 | |||||||||
| Kroger Co. | 7,680 | 199,373 | |||||||||
| Wal-Mart Stores, Inc. | 8,030 | 368,979 | |||||||||
| Walgreen Co. | 6,890 | 304,400 | |||||||||
| 1,097,616 | |||||||||||
See Accompanying Notes to Financial Statements.
6
CMG STRATEGIC EQUITY FUND
A Portfolio of Columbia Funds Institutional Trust
SCHEDULE OF INVESTMENTS
| Shares | Value | ||||||||||
| Common Stocks (continued) | |||||||||||
| Food Products (0.9%) | |||||||||||
| Nestle SA, Registered Shares | 660 | $ | 252,145 | ||||||||
| Wm. Wrigley Jr. Co. | 2,495 | 143,912 | |||||||||
| 396,057 | |||||||||||
| Household Products (2.8%) | |||||||||||
| Colgate-Palmolive Co. | 3,770 | 248,820 | |||||||||
| Kimberly-Clark Corp. | 2,780 | 187,010 | |||||||||
| Procter & Gamble Co. | 13,900 | 859,854 | |||||||||
| 1,295,684 | |||||||||||
| Personal Products (0.8%) | |||||||||||
| Avon Products, Inc. | 10,360 | 373,064 | |||||||||
| Tobacco (0.5%) | |||||||||||
| Altria Group, Inc. | 3,700 | 245,939 | |||||||||
| 4,167,744 | |||||||||||
| Energy (12.0%) | |||||||||||
| Energy Equipment & Services (4.3%) | |||||||||||
| Cameron International Corp. (a) | 4,020 | 313,560 | |||||||||
| Core Laboratories NV (a) | 1,830 | 196,963 | |||||||||
| Dresser-Rand Group, Inc. (a) | 2,830 | 104,993 | |||||||||
| GlobalSantaFe Corp. | 2,420 | 173,538 | |||||||||
| Hornbeck Offshore Services, Inc. (a) | 1,560 | 67,158 | |||||||||
| Noble Corp. | 1,740 | 178,281 | |||||||||
| Schlumberger Ltd. | 2,960 | 280,371 | |||||||||
| Transocean, Inc. (a) | 2,110 | 226,720 | |||||||||
| Weatherford International Ltd. (a) | 4,210 | 232,939 | |||||||||
| Wellstream Holdings PLC (a) | 16,950 | 187,021 | |||||||||
| 1,961,544 | |||||||||||
| Oil, Gas & Consumable Fuels (7.7%) | |||||||||||
| Cameco Corp. | 2,310 | 94,202 | |||||||||
| Chesapeake Energy Corp. | 3,470 | 118,119 | |||||||||
| Chevron Corp. | 1,570 | 133,858 | |||||||||
| ConocoPhillips | 6,360 | 514,142 | |||||||||
| Continental Resources, Inc. (a) | 12,218 | 192,189 | |||||||||
| Devon Energy Corp. | 3,040 | 226,814 | |||||||||
| Exxon Mobil Corp. | 15,380 | 1,309,300 | |||||||||
| Hess Corp. | 2,590 | 158,508 | |||||||||
| Peabody Energy Corp. | 5,310 | 224,401 | |||||||||
| Petroplus Holdings AG (a) | 969 | 92,796 | |||||||||
| Southwestern Energy Co. (a) | 6,110 | 248,249 | |||||||||
| Valero Energy Corp. | 1,920 | 128,659 | |||||||||
| XTO Energy, Inc. | 1,880 | 102,516 | |||||||||
| 3,543,753 | |||||||||||
| 5,505,297 | |||||||||||
See Accompanying Notes to Financial Statements.
7
CMG STRATEGIC EQUITY FUND
A Portfolio of Columbia Funds Institutional Trust
SCHEDULE OF INVESTMENTS
| Shares | Value | ||||||||||
| Common Stocks (continued) | |||||||||||
| Financials (17.0%) | |||||||||||
| Capital Markets (3.6%) | |||||||||||
| Aberdeen Asset Management PLC | 44,303 | $ | 169,179 | ||||||||
| Lazard Ltd., Class A | 4,470 | 165,524 | |||||||||
| Legg Mason, Inc. | 1,000 | 90,000 | |||||||||
| Lehman Brothers Holdings, Inc. | 5,170 | 320,540 | |||||||||
| Merrill Lynch & Co., Inc. | 5,680 | 421,456 | |||||||||
| Northern Trust Corp. | 3,750 | 234,225 | |||||||||
| State Street Corp. | 3,730 | 250,022 | |||||||||
| 1,650,946 | |||||||||||
| Commercial Banks (1.4%) | |||||||||||
| Allied Irish Banks PLC, ADR | 2,000 | 104,460 | |||||||||
| Wachovia Corp. | 11,420 | 539,138 | |||||||||
| 643,598 | |||||||||||
| Consumer Finance (0.5%) | |||||||||||
| Capital One Financial Corp. | 3,520 | 249,075 | |||||||||
| Diversified Financial Services (4.6%) | |||||||||||
| Citigroup, Inc. | 22,893 | 1,066,127 | |||||||||
| CME Group, Inc. | 450 | 248,625 | |||||||||
| JPMorgan Chase & Co. | 17,786 | 782,762 | |||||||||
| 2,097,514 | |||||||||||
| Insurance (4.7%) | |||||||||||
| ACE Ltd. | 5,780 | 333,622 | |||||||||
| American International Group, Inc. | 2,774 | 178,035 | |||||||||
| Aon Corp. | 6,410 | 256,656 | |||||||||
| Aspen Insurance Holdings Ltd. | 6,910 | 168,950 | |||||||||
| Castlepoint Holdings Ltd. | 9,807 | 122,097 | |||||||||
| Hartford Financial Services Group, Inc. | 1,580 | 145,155 | |||||||||
| National Financial Partners Corp. | 6,760 | 313,394 | |||||||||
| Platinum Underwriters Holdings Ltd. | 4,780 | 158,696 | |||||||||
| Prudential Financial, Inc. | 5,450 | 483,033 | |||||||||
| 2,159,638 | |||||||||||
| Real Estate Investment Trusts (REITs) (1.0%) | |||||||||||
| Alexandria Real Estate Equities, Inc. | 650 | 55,985 | |||||||||
| CapitalSource, Inc. | 8,950 | 170,050 | |||||||||
| Digital Realty Trust, Inc. | 7,390 | 244,978 | |||||||||
| 471,013 | |||||||||||
| Thrifts & Mortgage Finance (1.2%) | |||||||||||
| Freddie Mac | 9,790 | 560,673 | |||||||||
| 7,832,457 | |||||||||||
See Accompanying Notes to Financial Statements.
8
CMG STRATEGIC EQUITY FUND
A Portfolio of Columbia Funds Institutional Trust
SCHEDULE OF INVESTMENTS
| Shares | Value | ||||||||||
| Common Stocks (continued) | |||||||||||
| Health Care (13.0%) | |||||||||||
| Biotechnology (2.0%) | |||||||||||
| Applera Corp. - Celera Group (a) | 5,820 | $ | 69,956 | ||||||||
| BioMarin Pharmaceuticals, Inc. (a) | 2,560 | 46,234 | |||||||||
| Celgene Corp. (a) | 3,325 | 201,362 | |||||||||
| Genentech, Inc. (a) | 2,370 | 176,280 | |||||||||
| Gilead Sciences, Inc. (a) | 5,800 | 215,934 | |||||||||
| Grifols SA | 4,260 | 89,934 | |||||||||
| Onyx Pharmaceuticals, Inc. (a) | 3,770 | 104,844 | |||||||||
| 904,544 | |||||||||||
| Health Care Equipment & Supplies (3.1%) | |||||||||||
| Align Technology, Inc. (a) | 4,200 | 109,620 | |||||||||
| Baxter International, Inc. | 5,750 | 302,450 | |||||||||
| BioLase Technology, Inc. (a) | 6,090 | 42,935 | |||||||||
| Cytyc Corp. (a) | 2,750 | 115,775 | |||||||||
| Hologic, Inc. (a) | 1,750 | 90,650 | |||||||||
| Hospira, Inc. (a) | 2,590 | 100,155 | |||||||||
| Immucor, Inc. (a) | 2,280 | 71,045 | |||||||||
| Mindray Medical International Ltd., ADR | 5,485 | 170,035 | |||||||||
| Northstar Neuroscience, Inc. (a) | 2,512 | 25,748 | |||||||||
| Sirona Dental Systems, Inc. | 3,960 | 140,026 | |||||||||
| Zimmer Holdings, Inc. (a) | 3,190 | 248,054 | |||||||||
| 1,416,493 | |||||||||||
| Health Care Providers & Services (2.0%) | |||||||||||
| Express Scripts, Inc. (a) | 4,100 | 205,533 | |||||||||
| McKesson Corp. | 4,000 | 231,040 | |||||||||
| Medco Health Solutions, Inc. (a) | 4,480 | 364,089 | |||||||||
| VCA Antech, Inc. (a) | 3,670 | 144,378 | |||||||||
| 945,040 | |||||||||||
| Life Sciences Tools & Services (1.8%) | |||||||||||
| Covance, Inc. (a) | 2,250 | 158,783 | |||||||||
| Illumina, Inc. (a) | 3,030 | 138,077 | |||||||||
| Pharmaceutical Product Development, Inc. | 2,830 | 94,805 | |||||||||
| Thermo Fisher Scientific, Inc. (a) | 5,010 | 261,572 | |||||||||
| Waters Corp. (a) | 2,800 | 163,128 | |||||||||
| 816,365 | |||||||||||
| Pharmaceuticals (4.1%) | |||||||||||
| Abbott Laboratories | 6,810 | 345,199 | |||||||||
| Bristol-Myers Squibb Co. | 4,500 | 127,845 | |||||||||
| Johnson & Johnson | 5,820 | 352,110 | |||||||||
| Merck & Co., Inc. | 9,660 | 479,619 | |||||||||
| Novo-Nordisk A/S, Class B | 1,160 | 122,123 | |||||||||
| Schering-Plough Corp. | 6,060 | 172,952 | |||||||||
| Shire PLC, ADR | 1,970 | 145,366 | |||||||||
| Wyeth | 3,350 | 162,542 | |||||||||
| 1,907,756 | |||||||||||
| 5,990,198 | |||||||||||
See Accompanying Notes to Financial Statements.
9
CMG STRATEGIC EQUITY FUND
A Portfolio of Columbia Funds Institutional Trust
SCHEDULE OF INVESTMENTS
| Shares | Value | ||||||||||
| Common Stocks (continued) | |||||||||||
| Industrials (10.4%) | |||||||||||
| Aerospace & Defense (2.3%) | |||||||||||
| Boeing Co. | 1,880 | $ | 194,448 | ||||||||
| Goodrich Corp. | 4,290 | 269,884 | |||||||||
| Rockwell Collins, Inc. | 2,010 | 138,087 | |||||||||
| Spirit Aerosystems Holdings, Inc., Class A (a) | 4,200 | 152,460 | |||||||||
| United Technologies Corp. | 4,040 | 294,799 | |||||||||
| 1,049,678 | |||||||||||
| Air Freight & Logistics (1.1%) | |||||||||||
| FedEx Corp. | 1,280 | 141,747 | |||||||||
| United Parcel Service, Inc., Class B | 2,830 | 214,288 | |||||||||
| UTI Worldwide, Inc. | 5,410 | 135,953 | |||||||||
| 491,988 | |||||||||||
| Airlines (0.2%) | |||||||||||
| UAL Corp. (a) | 1,800 | 79,452 | |||||||||
| Commercial Services & Supplies (1.8%) | |||||||||||
| Equifax, Inc. | 6,730 | 272,296 | |||||||||
| Republic Services, Inc. | 5,750 | 183,713 | |||||||||
| Waste Management, Inc. | 10,450 | 397,413 | |||||||||
| 853,422 | |||||||||||
| Industrial Conglomerates (3.1%) | |||||||||||
| 3M Co. | 4,740 | 421,481 | |||||||||
| General Electric Co. | 17,540 | 679,850 | |||||||||
| McDermott International, Inc. (a) | 3,720 | 308,537 | |||||||||
| 1,409,868 | |||||||||||
| Machinery (1.7%) | |||||||||||
| Dover Corp. | 1,340 | 68,340 | |||||||||
| Illinois Tool Works, Inc. | 2,600 | 143,130 | |||||||||
| Joy Global, Inc. | 6,710 | 332,078 | |||||||||
| Paccar, Inc. | 1,370 | 112,093 | |||||||||
| Tata Motors Ltd., ADR | 7,990 | 137,029 | |||||||||
| 792,670 | |||||||||||
| Marine (0.2%) | |||||||||||
| Ultrapetrol Bahamas Ltd. (a) | 4,980 | 117,030 | |||||||||
| 4,794,108 | |||||||||||
| Information Technology (15.9%) | |||||||||||
| Communications Equipment (3.2%) | |||||||||||
| Cisco Systems, Inc. (a) | 26,160 | 756,286 | |||||||||
| Corning, Inc. | 10,480 | 249,843 | |||||||||
| Nokia Oyj, ADR | 13,350 | 382,344 | |||||||||
| QUALCOMM, Inc. | 2,250 | 93,712 | |||||||||
| 1,482,185 | |||||||||||
See Accompanying Notes to Financial Statements.
10
CMG STRATEGIC EQUITY FUND
A Portfolio of Columbia Funds Institutional Trust
SCHEDULE OF INVESTMENTS
| Shares | Value | ||||||||||
| Common Stocks (continued) | |||||||||||
| Computers & Peripherals (4.3%) | |||||||||||
| Apple, Inc. (a) | 2,780 | $ | 366,293 | ||||||||
| Brocade Communications Systems, Inc. (a) | 15,880 | 111,795 | |||||||||
| EMC Corp. (a) | 12,320 | 228,043 | |||||||||
| Hewlett-Packard Co. | 15,060 | 693,212 | |||||||||
| International Business Machines Corp. | 5,050 | 558,783 | |||||||||
| 1,958,126 | |||||||||||
| Internet Software & Services (2.2%) | |||||||||||
| eBay, Inc. (a) | 6,730 | 218,052 | |||||||||
| Google, Inc., Class A (a) | 1,570 | 800,700 | |||||||||
| 1,018,752 | |||||||||||
| IT Services (0.9%) | |||||||||||
| Cognizant Technology Solutions Corp., Class A (a) | 1,530 | 123,899 | |||||||||
| Global Payments, Inc. | 2,480 | 92,752 | |||||||||
| Redecard SA (a) | 11,360 | 194,833 | |||||||||
| 411,484 | |||||||||||
| Semiconductors & Semiconductor Equipment (2.8%) | |||||||||||
| ASML Holding N.V., N.Y. Registered Shares (a) | 2,640 | 78,039 | |||||||||
| Intel Corp. | 5,610 | 132,508 | |||||||||
| Intersil Corp., Class A | 3,900 | 114,075 | |||||||||
| Marvell Technology Group Ltd. (a) | 4,630 | 83,340 | |||||||||
| MEMC Electronic Materials, Inc. (a) | 2,326 | 142,630 | |||||||||
| NVIDIA Corp. (a) | 4,470 | 204,547 | |||||||||
| Samsung Electronics Co., Ltd., GDR (b) | 470 | 156,040 | |||||||||
| Texas Instruments, Inc. | 7,790 | 274,130 | |||||||||
| Verigy Ltd. (a) | 4,360 | 106,646 | |||||||||
| 1,291,955 | |||||||||||
| Software (2.5%) | |||||||||||
| ANSYS, Inc. (a) | 3,420 | 89,057 | |||||||||
| Microsoft Corp. | 19,100 | 553,709 | |||||||||
| Nintendo Co., Ltd. | 300 | 146,908 | |||||||||
| Oracle Corp. (a) | 12,460 | 238,235 | |||||||||
| UBISOFT Entertainment (a) | 1,930 | 126,452 | |||||||||
| 1,154,361 | |||||||||||
| 7,316,863 | |||||||||||
| Materials (3.6%) | |||||||||||
| Chemicals (1.3%) | |||||||||||
| Lyondell Chemical Co. | 5,030 | 225,847 | |||||||||
| Monsanto Co. | 5,630 | 362,853 | |||||||||
| 588,700 | |||||||||||
| Metals & Mining (1.6%) | |||||||||||
| Alcoa, Inc. | 4,160 | 158,912 | |||||||||
| Arcelor Mittal, Class A | 4,030 | 245,911 | |||||||||
| Companhia Vale do Rio Doce, ADR | 2,680 | 131,347 | |||||||||
| Freeport-McMoRan Copper & Gold, Inc. | 2,180 | 204,876 | |||||||||
| 741,046 | |||||||||||
See Accompanying Notes to Financial Statements.
11
CMG STRATEGIC EQUITY FUND
A Portfolio of Columbia Funds Institutional Trust
SCHEDULE OF INVESTMENTS
| Shares | Value | ||||||||||
| Common Stocks (continued) | |||||||||||
| Paper & Forest Products (0.7%) | |||||||||||
| Bowater, Inc. | 5,910 | $ | 115,954 | ||||||||
| Weyerhaeuser Co. | 3,120 | 222,269 | |||||||||
| 338,223 | |||||||||||
| 1,667,969 | |||||||||||
| Telecommunication Services (3.7%) | |||||||||||
| Diversified Telecommunication Services (2.4%) | |||||||||||
| AT&T, Inc. | 14,454 | 566,019 | |||||||||
| Qwest Communications International, Inc. (a) | 16,120 | 137,503 | |||||||||
| Tele2 AB, Class B | 9,660 | 168,741 | |||||||||
| Telekomunikasi Indonesia, ADR | 4,520 | 215,107 | |||||||||
| 1,087,370 | |||||||||||
| Wireless Telecommunication Services (1.3%) | |||||||||||
| American Tower Corp., Class A (a) | 2,630 | 109,566 | |||||||||
| China Mobile Ltd., ADR | 1,030 | 59,112 | |||||||||
| Millicom International Cellular SA (a) | 1,450 | 116,435 | |||||||||
| NII Holdings, Inc. (a) | 2,510 | 210,890 | |||||||||
| Philippine Long Distance Telephone Co., ADR | 1,800 | 102,888 | |||||||||
| 598,891 | |||||||||||
| 1,686,261 | |||||||||||
| Utilities (4.3%) | |||||||||||
| Electric Utilities (2.2%) | |||||||||||
| Entergy Corp. | 3,130 | 312,875 | |||||||||
| FPL Group, Inc. | 5,820 | 335,988 | |||||||||
| PPL Corp. | 7,470 | 352,136 | |||||||||
| 1,000,999 | |||||||||||
| Independent Power Producers & Energy Traders (1.3%) | |||||||||||
| Constellation Energy Group, Inc. | 4,080 | 341,904 | |||||||||
| NRG Energy, Inc. (a) | 7,350 | 283,343 | |||||||||
| 625,247 | |||||||||||
| Multi-Utilities (0.8%) | |||||||||||
| Public Service Enterprise Group, Inc. | 4,340 | 373,891 | |||||||||
| 2,000,137 | |||||||||||
| Total Common Stocks (Cost of $37,797,616) | 45,573,575 | ||||||||||
See Accompanying Notes to Financial Statements.
12
CMG STRATEGIC EQUITY FUND
A Portfolio of Columbia Funds Institutional Trust
SCHEDULE OF INVESTMENTS
| Par | Value | ||||||||||
| Short-Term Obligation (1.3%) | |||||||||||
| Repurchase agreement with Fixed Income Clearing Corp, dated 07/31/07, due 08/01/07 at 5.030%, collateralized by a U.S. Treasury Obligation maturing 11/30/11, market value $621,550 (repurchase proceeds $608,085) | $ | 608,000 | $ | 608,000 | |||||||
| Total Short-Term Obligation (Cost of $608,000) | 608,000 | ||||||||||
| Total Investments (100.2%) (Cost of $38,405,616) (c) | 46,181,575 | ||||||||||
| Other Assets & Liabilities, Net (-0.2%) | (75,783 | ) | |||||||||
| Net Assets (100.0%) | $ | 46,105,792 | |||||||||
Notes to Schedule of Investments:
(a) Non-income producing security.
(b) Security exempt from registration pursuant to Rule 144A under the Securities Act of 1933. This security may be resold in transactions exempt from registration, normally to qualified institutional buyers. At July 31, 2007, the value of this security, which is not illiquid, represents 0.3% of net assets.
(c) Cost for federal income tax purposes is $38,483,741.
At July 31, 2007, the Fund held investments in the following sectors:
| Sector (Unaudited) | % of Net Assets | ||||||
| Financials | 17.0 | ||||||
| Information Technology | 15.9 | ||||||
| Health Care | 13.0 | ||||||
| Energy | 12.0 | ||||||
| Industrials | 10.4 | ||||||
| Consumer Discretionary | 10.0 | ||||||
| Consumer Staples | 9.0 | ||||||
| Utilities | 4.3 | ||||||
| Telecommunication Services | 3.7 | ||||||
| Materials | 3.6 | ||||||
| 98.9 | |||||||
| Short-Term Obligation | 1.3 | ||||||
| Other Assets & Liabilities, Net | (0.2 | ) | |||||
| 100.0 | |||||||
| Acronym | Name | ||||||
| ADR | American Depositary Receipt | ||||||
| GDR | Global Depositary Receipt | ||||||
See Accompanying Notes to Financial Statements.
13
CMG STRATEGIC EQUITY FUND
A Portfolio of Columbia Funds Institutional Trust
STATEMENT OF ASSETS AND LIABILITIES
July 31, 2007
| ASSETS: | |||||||
| Investments, at identified cost | $ | 38,405,616 | |||||
| Investments, at value | $ | 46,181,575 | |||||
| Cash | 780 | ||||||
| Receivable for: | |||||||
| Investments sold | 1,318,738 | ||||||
| Interest | 85 | ||||||
| Dividends | 25,850 | ||||||
| Foreign tax reclaims | 1,580 | ||||||
| Expense reimbursement due from Investment Advisor | 9,914 | ||||||
| Deferred Trustees' compensation plan | 19,875 | ||||||
| Total Assets | 47,558,397 | ||||||
| LIABILITIES: | |||||||
| Payable for: | |||||||
| Investments purchased | 1,347,159 | ||||||
| Fund shares repurchased | 3,653 | ||||||
| Investment advisory fee | 17,425 | ||||||
| Transfer agent fee | 22 | ||||||
| Pricing and bookkeeping fees | 791 | ||||||
| Audit fee | 37,650 | ||||||
| Custody fee | 6,410 | ||||||
| Reports to shareholders | 13,200 | ||||||
| Deferred Trustees' compensation plan | 19,875 | ||||||
| Other liabilities | 6,420 | ||||||
| Total Liabilities | 1,452,605 | ||||||
| NET ASSETS | $ | 46,105,792 | |||||
| NET ASSETS consist of: | |||||||
| Paid-in capital | $ | 24,145,560 | |||||
| Undistributed net investment income | 378,288 | ||||||
| Accumulated net realized gain | 13,806,045 | ||||||
| Net unrealized appreciation (depreciation) on: | |||||||
| Investments | 7,775,959 | ||||||
| Foreign currency translations | (60 | ) | |||||
| NET ASSETS | $ | 46,105,792 | |||||
| Shares of capital stock outstanding | 15,295,360 | ||||||
| Net asset value, offering and redemption price per share | $ | 3.01 | |||||
See Accompanying Notes to Financial Statements.
14
CMG STRATEGIC EQUITY FUND
A Portfolio of Columbia Funds Institutional Trust
STATEMENT OF OPERATIONS
| For the Year Ended July 31, 2007 | |||||||
| NET INVESTMENT INCOME: | |||||||
| Income: | |||||||
| Dividends | $ | 1,215,748 | |||||
| Interest | 142,040 | ||||||
| Foreign withholding tax | (18,356 | ) | |||||
| Total Investment Income | 1,339,432 | ||||||
| Expenses: | |||||||
| Investment advisory fee | 314,931 | ||||||
| Transfer agent fee | 180 | ||||||
| Trustees' fees | 14,522 | ||||||
| Pricing and bookkeeping fees | 3,027 | ||||||
| Custody fee | 31,296 | ||||||
| Audit fee | 46,165 | ||||||
| Reports to shareholders | 30,090 | ||||||
| Chief compliance officer expenses | 2,399 | ||||||
| Other expenses | 41,765 | ||||||
| Total Operating Expenses | 484,375 | ||||||
| Interest expense | 1,453 | ||||||
| Total Expenses | 485,828 | ||||||
| Fees and expenses waived or reimbursed by Investment Advisor | (171,928 | ) | |||||
| Custody earnings credit | (155 | ) | |||||
| Net Expenses | 313,745 | ||||||
| Net Investment Income | 1,025,687 | ||||||
| NET REALIZED AND UNREALIZED GAIN (LOSS) ON INVESTMENTS AND FOREIGN CURRENCY: | |||||||
| Net realized gain (loss) on: | |||||||
| Investments | 27,314,246 | ||||||
| Foreign currency transactions | (22,410 | ) | |||||
| Net realized gain | 27,291,836 | ||||||
| Net change in unrealized depreciation on: | |||||||
| Investments | (15,029,982 | ) | |||||
| Foreign currency translations | (466 | ) | |||||
| Net change in unrealized depreciation | (15,030,448 | ) | |||||
| Net Gain | 12,261,388 | ||||||
| NET INCREASE IN NET ASSETS FROM OPERATIONS | $ | 13,287,075 | |||||
See Accompanying Notes to Financial Statements.
15
CMG STRATEGIC EQUITY FUND
A Portfolio of Columbia Funds Institutional Trust
STATEMENT OF CHANGES IN NET ASSETS
| Year Ended July 31, | |||||||||||
| Increase (Decrease) in Net Assets: | 2007 | 2006 | |||||||||
| Operations: | |||||||||||
| Net investment income | $ | 1,025,687 | $ | 3,502,391 | |||||||
| Net realized gain on investments and foreign currency transactions | 27,291,836 | 139,034,783 | |||||||||
| Net change in unrealized depreciation on investments and foreign currency translations | (15,030,448 | ) | (122,205,133 | ) | |||||||
| Net increase from operations | 13,287,075 | 20,332,041 | |||||||||
| Distributions declared to shareholders: | |||||||||||
| From net investment income | (611,244 | ) | (8,532,614 | ) | |||||||
| From net realized gains | (14,482,350 | ) | (165,009,285 | ) | |||||||
| Total distributions declared to shareholders | (15,093,594 | ) | (173,541,899 | ) | |||||||
| Share Transactions: | |||||||||||
| Subscriptions | 4,636,132 | 51,206,578 | |||||||||
| Distributions reinvested | 14,633,613 | 158,121,863 | |||||||||
| Redemptions | (91,898,054 | ) | (691,437,711 | ) | |||||||
| Net decrease from share transactions | (72,628,309 | ) | (482,109,270 | ) | |||||||
| Net decrease in net assets | (74,434,828 | ) | (635,319,128 | ) | |||||||
| NET ASSETS: | |||||||||||
| Beginning of period | 120,540,620 | 755,859,748 | |||||||||
| End of period | $ | 46,105,792 | $ | 120,540,620 | |||||||
| Undistributed (overdistributed) net investment income | $ | 378,288 | $ | (13,277 | ) | ||||||
| Changes in Shares: | |||||||||||
| Subscriptions | 1,499,855 | 5,650,804 | |||||||||
| Issued for distributions reinvested | 5,134,601 | 36,117,727 | |||||||||
| Redemptions | (29,820,686 | ) | (52,950,990 | ) | |||||||
| Net decrease | (23,186,230 | ) | (11,182,459 | ) | |||||||
See Accompanying Notes to Financial Statements.
16
CMG STRATEGIC EQUITY FUND
A Portfolio of Columbia Funds Institutional Trust
NOTES TO FINANCIAL STATEMENTS
July 31, 2007
Note 1. Organization
CMG Strategic Equity Fund (the "Fund"), a series of Columbia Funds Institutional Trust (the "Trust"), is a diversified portfolio. The Trust is a Massachusetts business trust registered under the Investment Company Act of 1940, as amended, as an open-end management investment company.
Shares of the Fund are available for purchase by institutional buyers and certain individual and institutional advisory clients of Columbia Management Advisors, LLC ("Columbia") or its affiliates. The Fund's minimum initial investment requirement is $5 million. Please see the Fund's prospectus for further details.
Investment goal. The Fund seeks to provide investors with long-term growth of capital and total returns greater than those of the market over time.
Fund shares. The Fund may issue an unlimited number of shares of beneficial interest which are offered continuously at net asset value.
Note 2. Significant accounting policies
The preparation of financial statements in accordance with accounting principles generally accepted in the United States of America ("GAAP") requires management to make certain estimates and assumptions that affect the reported amounts of assets and liabilities, the disclosure of contingent assets and liabilities at the date of the financial statements and the reported amounts of revenue and expenses during the reporting period. Actual results could differ from those estimates. The following is a summary of significant accounting policies consistently followed by the Fund in the preparation of its financial statements.
Security valuation. Equity securities, exchange traded funds and securities of certain investment companies are valued at the last sale price on the principal exchange on which they trade, except for securities traded on the NASDAQ, which are valued at the NASDAQ official close price. Unlisted securities or listed securities for which there were no sales during the day are valued at the closing bid price on such exchanges or over-the-counter markets.
Short-term debt obligations maturing within 60 days are valued at amortized cost, which approximates market value.
Foreign securities are generally valued at the last sale price on the foreign exchange or market on which they trade. If any foreign share prices are not readily available as a result of limited share activity, the securities are valued at the last sale price of the local shares in the principal market in which such securities are normally traded.
Generally, trading in foreign securities is substantially completed each day at various times prior to the close of the New York Stock Exchange ("NYSE"). The values of such securities used in computing the net asset value of the Fund's shares are determined as of such times. Foreign currency exchange rates are generally determined at 4:00 p.m. Eastern (U.S.) time. Occasionally, events affecting the values of such foreign securities and such exchange rates may occur between the times at which they are determined and the close of the customary trading session of the NYSE, which would not be reflected in the computation of the Fund's net asset value. If events materially affecting the values of such foreign securities occur and it is determined that market quotations are not reliable, then these foreign securities will be valued at their "fair value" using procedures approved by the Board of Trustees. The Fund may use a systematic fair valuation model provided by an independent third party to value securities principally traded in foreign markets in order to adjust for possible stale pricing that may occur between the close of the foreign exchanges and the time for valuation.
17
CMG STRATEGIC EQUITY FUND
A Portfolio of Columbia Funds Institutional Trust
NOTES TO FINANCIAL STATEMENTS
July 31, 2007
Investments for which market quotations are not readily available, or quotations which management believes are not appropriate, are valued at fair value as determined in good faith under consistently applied procedures established by and under the general supervision of the Board of Trustees. If a security is valued at fair value, such value is likely to be different from the last quoted market price for the security.
In September 2006, Statement of Financial Accounting Standards No. 157, Fair Value Measurements ("SFAS 157"), was issued. SFAS 157 is effective for fiscal years beginning after November 15, 2007. SFAS 157 defines fair value, establishes a framework for measuring fair value and expands disclosures about fair value measurements. Management is evaluating the impact the application of SFAS 157 will have on the Fund's financial statement disclosures.
Security transactions. Security transactions are accounted for on the trade date. Cost is determined and gains (losses) are based upon the specific identification method for both financial statement and federal income tax purposes.
Repurchase agreements. The Fund may engage in repurchase agreement transactions with institutions that Columbia has determined are creditworthy. The Fund, through its custodian, receives delivery of underlying securities collateralizing a repurchase agreement. Columbia is responsible for determining that collateral is at least equal, at all times, to the value of the repurchase obligation including interest. A repurchase agreement transaction involves certain risks in the event of default or insolvency of the counterparty. These risks include possible delays or restrictions upon the Fund's ability to dispose of the underlying securities and a possible decline in the value of the underlying securities during the period while the Fund seeks to assert its rights.
Income recognition. Interest income is recorded on the accrual basis. Corporate actions and dividend income are recorded on the ex-date, except for certain foreign securities which are recorded as soon after ex-date as the Fund becomes aware of such, net of non-reclaimable tax withholdings. Distributions received from real estate investment trusts (REITs) in excess of their income are recorded as a reduction of the cost of the related investments and/or realized gains as applicable. If the Fund no longer owns the applicable securities, any distributions received in excess of income are recorded as realized gains.
Expenses. General expenses of the Trust are allocated to the Fund and the other series of the Trust based upon their relative net assets or other expense allocation methodologies determined by the nature of the expense. Expenses directly attributable to the Fund are charged to the Fund.
Foreign currency transactions. The values of all assets and liabilities quoted in foreign currencies are translated into U.S. dollars at that day's exchange rates. Net realized and unrealized gains (losses) on foreign currency transactions include gains (losses) arising from the fluctuation in exchange rates between trade and settlement dates on securities transactions, gains (losses) arising from the disposition of foreign currency and currency gains (losses) between the accrual and payment dates on dividends, interest income and foreign withholding taxes.
For financial statement purposes, the Fund does not distinguish that portion of gains (losses) on investments which is due to changes in foreign exchange rates from that which is due to changes in market prices of the investments. Such fluctuations are included with the net realized and unrealized gains (losses) on investments in the Statement of Operations.
Federal income tax status. The Fund intends to qualify each year as a "regulated investment company" under Subchapter M of the Internal Revenue Code, as amended, and will distribute substantially all of its taxable income, if any, for its tax year, and as such will not be subject to federal income taxes. In addition, the Fund intends to distribute in each calendar
18
CMG STRATEGIC EQUITY FUND
A Portfolio of Columbia Funds Institutional Trust
NOTES TO FINANCIAL STATEMENTS
July 31, 2007
year substantially all of its net investment income, capital gains and certain other amounts, if any, such that the Fund should not be subject to federal excise tax. Therefore, no federal income or excise tax provision is recorded.
Distributions to shareholders. Distributions to shareholders are recorded on ex-date. Net realized capital gains, if any, are distributed at least annually.
Indemnification. In the normal course of business, the Fund enters into contracts that contain a variety of representations and warranties and which provide general indemnities. The Fund's maximum exposure under these arrangements is unknown because this would involve future claims against the Fund. Also, under the Trust's organizational documents and by contract, the trustees and officers of the Trust are indemnified against certain liabilities that may arise out of actions relating to their duties to the Trust. However, based on experience, the Fund expects the risk of loss due to these representations, warranties and indemnities to be minimal.
Note 3. Federal tax information
The timing and character of income and capital gain distributions are determined in accordance with income tax regulations, which may differ from GAAP. Reclassifications are made to the Fund's capital accounts for permanent tax differences to reflect income and gains available for distribution (or available capital loss carryforwards) under income tax regulations.
For the year ended July 31, 2007, permanent book and tax basis differences resulting primarily from differing treatments for Section 988 foreign currency transactions and redemption in-kind capital gain and related wash sale adjustments were identified and reclassified among the components of the Fund's net assets as follows:
| Undistributed Net Investment Income | Accumulated Net Realized Gain | Paid-In Capital | |||||||||
| $ | (22,878 | ) | $ | (3,155,934 | ) | $ | 3,178,812 | ||||
Net investment income and net realized gains (losses), as disclosed on the Statement of Operations, and net assets were not affected by this reclassification.
The tax character of distributions paid during the years ended July 31, 2007 and July 31, 2006 was as follows:
| July 31, 2007 | July 31, 2006 | ||||||||||
| Distributions paid from: | |||||||||||
| Ordinary Income* | $ | 1,412,437 | $ | 32,828,472 | |||||||
| Long-Term Capital Gains | 13,681,157 | 140,713,427 | |||||||||
*For tax purposes short-term capital gains distributions, if any, are considered ordinary income distributions.
As of July 31, 2007, the components of distributable earnings on a tax basis were as follows:
| Undistributed Ordinary Income | Undistributed Long-term Capital Gains | Net Unrealized Appreciation* | |||||||||
| $ | 3,000,432 | $ | 11,281,684 | $ | 7,697,834 | ||||||
*The differences between book-basis and tax-basis net unrealized appreciation are primarily due to deferral of losses from wash sales.
19
CMG STRATEGIC EQUITY FUND
A Portfolio of Columbia Funds Institutional Trust
NOTES TO FINANCIAL STATEMENTS
July 31, 2007
Unrealized appreciation and depreciation at July 31, 2007, based on cost of investments for federal income tax purposes was:
| Unrealized appreciation | $ | 8,755,097 | |||||
| Unrealized depreciation | (1,057,263 | ) | |||||
| Net unrealized appreciation | $ | 7,697,834 | |||||
In June 2006, the Financial Accounting Standards Board ("FASB") issued FASB Interpretation No. 48, Accounting for Uncertainty in Income Taxes, an Interpretation of FASB Statement No. 109 (the "Interpretation"). This Interpretation is effective on the last business day of the semiannual reporting period for fiscal years beginning after December 15, 2006 and is to be applied to open tax positions upon initial adoption. This Interpretation prescribes a minimum recognition threshold and measurement method for the financial statement recognition of tax positions taken or expected to be taken in a tax return and also requires certain expanded disclosures. Management is evaluating the application of this Interpretation to the Fund and has not at this time quantified the impact, if any, r esulting from the adoption of this Interpretation on the Fund's financial statements.
Note 4. Fees and compensation paid to affiliates
Investment advisory fee. Columbia, an indirect, wholly-owned subsidiary of Bank of America Corporation ("BOA"), is the investment advisor to the Fund and provides administrative and other services to the Fund. Columbia receives a monthly investment advisory fee at the annual rate of 0.40% of the Fund's average daily net assets.
In addition to the annual Fund operating expenses, each shareholder enters into a written administrative services agreement with Columbia or its affiliate. Pursuant to this Agreement, Columbia or its affiliate will provide the shareholder specialized reports regarding the Fund, performance of the shareholder's investments and market conditions and economic indicators. For such services, each shareholder (and not the Fund) will pay an annual fee calculated as a percentage of the shareholder's net assets in the Fund. The annual fee is 0.20% on the first $25 million of the shareholder's net assets in the Fund, and 0.00% on the shareholder's net assets in the Fund in excess of $25 million.
Pricing & bookkeeping fees. Effective December 15, 2006, the Fund entered into a Financial Reporting Services Agreement with State Street Bank & Trust Company ("State Street") and Columbia (the "Financial Reporting Services Agreement") pursuant to which State Street provides financial reporting services to the Fund. Also, effective December 15, 2006, the Fund entered into an Accounting Services Agreement with State Street and Columbia (collectively with the Financial Reporting Services Agreement, the "State Street Agreements") pursuant to which State Street provides accounting services to the Fund.
Effective December 15, 2006, the Fund entered into a Pricing and Bookkeeping Oversight and Services Agreement (the "Services Agreement") with Columbia. Under the Services Agreement, Columbia provides services related to Fund expenses and the requirements of the Sarbanes-Oxley Act of 2002, and provides oversight of the accounting and financial reporting services provided by State Street.
The fees for financial reporting services, accounting services, and pricing and bookkeeping services with the exception of the services related to the requirements of the Sarbanes-Oxley Act of 2002 are payable by Columbia.
20
CMG STRATEGIC EQUITY FUND
A Portfolio of Columbia Funds Institutional Trust
NOTES TO FINANCIAL STATEMENTS
July 31, 2007
Prior to December 15, 2006, Columbia was responsible for providing pricing and bookkeeping services to the Fund under a pricing and bookkeeping agreement. Under separate agreements between Columbia and State Street, Columbia delegated certain functions to State Street. As a result of the delegation the total fees payable under the pricing and bookkeeping agreement were paid to State Street. The Fund was not charged a fee for pricing and bookkeeping services.
Transfer agent fee. Columbia Management Services, Inc. (the "Transfer Agent"), an affiliate of Columbia and an indirect, wholly-owned subsidiary of BOA, provides shareholder services to the Fund and has contracted with Boston Financial Data Services ("BFDS") to serve as sub-transfer agent.
The Transfer Agent is entitled to receive a fee for its services, paid monthly, at the annual rate of $17.00 per open account plus reimbursement of certain sub-transfer agent fees paid by the Transfer Agent (exclusive of BFDS fees), calculated based on assets held in omnibus accounts and intended to recover the cost of payments to other parties (including affiliates of BOA) for services to those accounts. The Transfer Agent pays the fees of BFDS for services as sub-transfer agent and is not entitled to reimbursement for such fees from the Fund.
The Transfer Agent may also retain, as additional compensation for its services, fees for wire, telephone and redemption orders, IRA trustee agent fees and account transcript fees due the Transfer Agent from shareholders of the Fund and credits (net of bank charges) earned with respect to balances in accounts the Transfer Agent maintains in connection with its services to the Fund. The Transfer Agent also receives reimbursement for certain out-of-pocket expenses.
For year ended July 31, 2007, the Fund's effective transfer agent fee rate, inclusive of out-of-pocket expenses and sub-transfer agent fees, was less than 0.01% of the Fund's average daily net assets.
Fee waivers. Columbia has contractually agreed to reimburse the Fund through November 30, 2007, for certain expenses so that the expenses incurred by the Fund (exclusive of interest, taxes and extraordinary expenses, if any), will not exceed 0.40% of the Fund's average daily net assets.
Custody credits. The Fund has an agreement with its custodian bank under which custody fees may be reduced by balance credits. These credits are recorded as a reduction of total expenses on the Statement of Operations. The Fund could have invested a portion of the assets utilized in connection with the expense offset arrangement in an income-producing asset if it had not entered into such an agreement.
Fees paid to officers and trustees. All officers of the Fund are employees of Columbia or its affiliates and, with the exception of the Fund's Chief Compliance Officer, receive no compensation from the Fund. The Board of Trustees has appointed a Chief Compliance Officer to the Fund in accordance with federal securities regulations. The Fund, along with other affiliated funds, pays its pro-rata share of the expenses associated with the Chief Compliance Officer.
The Fund's Trustees may participate in a deferred compensation plan which may be terminated at any time. Obligations of the plan will be paid solely out of the Fund's assets.
Note 5. Portfolio information
For the year ended July 31, 2007, the cost of purchases and proceeds from sales of securities, excluding short-term obligations, were $95,253,476 and $148,887,289, respectively.
21
CMG STRATEGIC EQUITY FUND
A Portfolio of Columbia Funds Institutional Trust
NOTES TO FINANCIAL STATEMENTS
July 31, 2007
Note 6. Redemption in-Kind
Sales of securities for the Fund include the value of securities delivered through an in-kind redemption of certain Fund shares on April 4, 2007. Any realized gain on securities delivered through an in-kind redemption of Fund shares is not taxable to the Fund. The value of securities and realized gain on securities delivered through an in-kind redemption of Fund shares aggregated $23,996,209 and $3,300,859, respectively. Prior to the in-kind redemption, the shareholders owned 35.9% of the Fund.
Note 7. Line of credit
The Fund and other affiliated funds participate in a $350,000,000 committed unsecured revolving line of credit and a $150,000,000 uncommitted, unsecured line of credit, both provided by State Street. Borrowings are available for temporary or emergency purposes.
Interest on the committed line of credit is charged to each participating fund based on the fund's borrowings at a rate per annum equal to the Federal Funds Rate plus 0.50%. In addition, a commitment fee of 0.10% per annum is accrued and apportioned among the participating funds based on their pro-rata portion of the unutilized committed line of credit. Interest on the uncommitted line of credit is charged to each participating fund based on the fund's borrowings at a variable rate per annum equal to the Federal Funds Rate plus a spread, as determined and quoted by State Street at the time of the request for a loan. A one-time structuring fee of $30,000 is also accrued and apportioned to each fund participating in the uncommitted line of credit based on the average net assets of the participating funds. In addition, if the uncommitted line of credit is extended for an additional period, an annual administration fee of $15,000 wi ll be charged and apportioned among each participating fund. The commitment fee and structuring fee are included in "Other expenses" in the Statement of Operations.
For the year ended July 31, 2007, the average daily loan balance outstanding on days where borrowings existed was $4,500,000 at a weighted average interest rate of 5.81%.
Note 8. Shares of beneficial interest
As of July 31, 2007, the Fund had a shareholder that held 91.2% of the shares outstanding of the Fund whose shares were beneficially owned by participant accounts over which BOA and/or its affiliates had either sole or joint investment discretion. Subscription and redemption activity of this account may have a significant effect on the operations of the Fund.
As of July 31, 2007, the Fund also had a shareholder that held 5.6% of the shares outstanding of the Fund. Subscription and redemption activity of this account may have a significant effect on the operations of the Fund.
Note 9. Other
For the year ended July 31, 2007, Columbia reimbursed the Fund $2,641 for custody expenses incurred as a result of a compliance violation.
This reimbursement is included in "Fees and expenses waived or reimbursed by Investment Advisor" in the Statement of Operations.
22
CMG STRATEGIC EQUITY FUND
A Portfolio of Columbia Funds Institutional Trust
NOTES TO FINANCIAL STATEMENTS
July 31, 2007
Note 10. Disclosure of significant risks and contingencies
Sector Focus. Companies that are in different but closely related industries are sometimes described as being in the same sector. Although the Fund does not intend to focus on any particular sector, at times the Fund may have a large portion of its assets invested in a particular sector. During such times, the Fund will have a greater exposure to economic and market events affecting such sector than if it were broadly invested across multiple sectors.
Foreign securities. There are certain additional risks involved when investing in foreign securities that are not inherent with investments in domestic securities. These risks may involve foreign currency exchange rate fluctuations, adverse political and economic developments and the possible prevention of currency exchange or other foreign governmental laws or restrictions. In addition, the liquidity of foreign securities may be more limited than that of domestic securities.
Legal proceedings. On February 9, 2005, Columbia Management Advisors, Inc. (which has since merged into Banc of America Capital Management, LLC (now named Columbia Management Advisors, LLC)) ("Columbia") and Columbia Funds Distributor, Inc. (which has been renamed Columbia Management Distributors, Inc.) (the "Distributor") (collectively, the "Columbia Group") entered into an Assurance of Discontinuance with the New York Attorney General ("NYAG") (the "NYAG Settlement") and consented to the entry of a cease-and-desist order by the Securities and Exchange Commission ("SEC") (the "SEC Order") on matters relating to mutual fund trading.
Under the terms of the SEC Order, the Columbia Group agreed, among other things, to: pay $70 million in disgorgement and $70 million in civil money penalties; cease and desist from violations of the antifraud provisions and certain other provisions of the federal securities laws; maintain certain compliance and ethics oversight structures; retain an independent consultant to review the Columbia Group's applicable supervisory, compliance, control and other policies and procedures; and retain an independent distribution consultant (see below). The Columbia Funds have also voluntarily undertaken to implement certain governance measures designed to maintain the independence of their boards of trustees. The NYAG Settlement also, among other things, requires Columbia and its affiliates to reduce management fees for certain Columbia Funds (including the former Nations Funds) and other mutual funds collectively by $32 million per year f or five years, for a projected total of $160 million in management fee reductions.
Pursuant to the procedures set forth in the SEC Order, the $140 million in settlement amounts described above is being distributed in accordance with a distribution plan that was developed by an independent distribution consultant and approved by the SEC on April 6, 2007. Distributions under the distribution plan began in late June 2007.
A copy of the SEC Order is available on the SEC website at http://www.sec.gov. A copy of the NYAG Settlement is available as part of the Bank of America Corporation Form 8-K filing on February 10, 2005.
In connection with the events described above, various parties have filed suit against certain funds, the Trustees of the Columbia Funds, FleetBoston Financial Corporation and its affiliated entities and/or Bank of America and its affiliated entities.
On February 20, 2004, the Judicial Panel on Multidistrict Litigation transferred these cases and cases against other mutual fund companies based on similar allegations to the United States District Court in Maryland for consolidated or coordinated pretrial proceedings (the "MDL"). Subsequently, additional related cases were transferred to the MDL. On September 29, 2004, the plaintiffs in the MDL filed amended and consolidated complaints. One of these amended complaints is a putative class action that includes claims under the federal securities laws and state common law, and that names Columbia, the Distributor, the Trustees of the Columbia Funds, Bank of America Corporation and others
23
CMG STRATEGIC EQUITY FUND
A Portfolio of Columbia Funds Institutional Trust
NOTES TO FINANCIAL STATEMENTS
July 31, 2007
as defendants. Another of the amended complaints is a derivative action purportedly on behalf of the Columbia Funds that asserts claims under federal securities laws and state common law.
On February 25, 2005, Columbia and other defendants filed motions to dismiss the claims in the pending cases. On March 1, 2006, for reasons stated in the court's memoranda dated November 3, 2005, the U.S. District Court for the District of Maryland granted in part and denied in part the defendants' motions to dismiss. The court dismissed all of the class action claims pending against the Columbia Funds Trusts. As to Columbia and the Distributor, the claims under the Securities Act of 1933, the claims under Sections 34(b) and 36(a) of the Investment Company Act of 1940 ("ICA") and the state law claims were dismissed. The claims under Sections 10(b) and 20(a) of the Securities Exchange Act of 1934 and claims under Section 36(b) of the ICA were not dismissed.
On March 21, 2005, a purported class action was filed in Massachusetts state court alleging that certain conduct, including market timing, entitled Class B shareholders in certain Columbia funds to an exemption from contingent deferred sales charges upon early redemption ("the CDSC Lawsuit"). The CDSC Lawsuit was removed to federal court in Massachusetts and transferred to the MDL.
On September 14, 2007, the plaintiffs and the Columbia defendants named in the MDL, including the Columbia Funds, entered into a stipulation of settlement with respect to all Columbia-related claims in the MDL described above, including the CDSC Lawsuit. The settlement is subject to court approval.
In 2004, the Columbia Funds' adviser and distributor and certain affiliated entities and individuals were named as defendants in certain purported shareholder class and derivative actions making claims, including claims under the Investment Company and the Investment Advisers Acts of 1940 and state law. Certain Columbia Funds were named as nominal defendants. The suits allege, inter alia, that the fees and expenses paid by the funds are excessive and that the advisers and their affiliates inappropriately used fund assets to distribute the funds and for other improper purposes. On March 2, 2005, the actions were consolidated in the Massachusetts federal court as In re Columbia Entities Litigation. The plaintiffs filed a consolidated amended complaint on June 9, 2005. On November 30, 2005, the judge dismissed all claims by plaintiffs and entered final judgment in favor of the defendants. The plaintiffs appealed to the United States Court of Appeals for the First Circuit on December 30, 2005. A stipulation and settlement agreement dated January 19, 2007 was filed in the First Circuit on February 14, 2007, with a joint stipulation of dismissal and motion for remand to obtain district court approval of the settlement. That joint motion was granted and the appeal was dismissed. On March 6, 2007, the case was remanded to the District Court. On September 18, 2007, the District Court approved the settlement, to be effective following the expiration of the appeal period. The funds' adviser and/or its affiliates will be required, pursuant to the settlement, to make certain payments including plaintiffs' attorneys' fees and costs of notice to clas s members.
24
Report of Independent Registered Public Accounting Firm
To the Trustees of Columbia Funds Institutional Trust and Shareholders of CMG Strategic Equity Fund
In our opinion, the accompanying statement of assets and liabilities, including the schedule of investments, and the related statements of operations and of changes in net assets and the financial highlights present fairly, in all material respects, the financial position of CMG Strategic Equity Fund (the "Fund"), a portfolio of Columbia Funds Institutional Trust, at July 31, 2007, and the results of its operations, the changes in its net assets and the financial highlights for the periods indicated, in conformity with accounting principles generally accepted in the United States of America. These financial statements and financial highlights (hereafter referred to as "financial statements") are the responsibility of the Fund's management. Our responsibility is to express an opinion on these financial statements based on our audits. We conducted our audits of these financial statements in accordance with the standards of the Pub lic Company Accounting Oversight Board (United States). Those standards require that we plan and perform the audit to obtain reasonable assurance about whether the financial statements are free of material misstatement. An audit includes examining, on a test basis, evidence supporting the amounts and disclosures in the financial statements, assessing the accounting principles used and significant estimates made by management, and evaluating the overall financial statement presentation. We believe that our audits, which included confirmation of securities at July 31, 2007 by correspondence with the custodian and brokers, provide a reasonable basis for our opinion.
PricewaterhouseCoopers LLP
Boston, Massachusetts
September 21, 2007
25
Unaudited Information
Federal Income Tax Information
For the fiscal year ended July 31, 2007, the Fund designates long-term capital gains of $20,002,303.
21.99% of the ordinary income distributed by the Fund, for the year ended July 31, 2007, qualifies for the corporate dividends received deduction.
For non-corporate shareholders 23.92%, or the maximum amount allowable under the Jobs and Growth Tax Relief Reconciliation Act of 2003, of income earned by the Fund for the period August 1, 2006 to July 31, 2007 may represent qualified dividend income. Final information will be provided in your 2007 Form 1099-DIV.
26
Fund Governance
Trustees
The Trustees serve terms of indefinite duration. The names, addresses and ages of the Trustees and officers of the Funds in Columbia Funds Institutional Trust, the year each was first elected or appointed to office, their principal business occupations during at least the last five years, the number of portfolios overseen by each Trustee and other directorships they hold are shown below. Each officer listed below serves as an officer of each Fund in the Columbia Funds Complex.
| Name, Address and Year of Birth, Position with Funds, Year First Elected or Appointed to Office1 | Principal Occupation(s) During Past Five years, Number of Portfolios in Columbia Funds Complex Overseen by Trustee, Other Directorships Held | ||||||
| Independent Trustees | |||||||
| Douglas A. Hacker (Born 1955) c/o Columbia Management Advisors, LLC One Financial Center Boston, MA 02111 Trustee (since 1996) | Independent business executive since May, 2006; Executive Vice President–Strategy of United Airlines (airline) from December, 2002 to May, 2006; President of UAL Loyalty Services (airline marketing company) from September, 2001 to December, 2002; Executive Vice President and Chief Financial Officer of United Airlines from July, 1999 to September, 2001. Oversees 68, Nash Finch Company (food distributor); Aircastle Limited (aircraft leasing) | ||||||
| Janet Langford Kelly (Born 1957) c/o Columbia Management Advisors, LLC One Financial Center Boston, MA 02111 Trustee (since 1996) | Senior Vice President, General Counsel and Corporate Secretary, ConocoPhillips (integrated energy company) since September, 2007; Deputy General Counsel–Corporate Legal Services, ConocoPhillips from August, 2006 to August, 2007; Partner, Zelle, Hofmann, Voelbel, Mason & Gette LLP (law firm) from March, 2005 to July, 2006; Adjunct Professor of Law, Northwestern University, from September, 2004 to June, 2006, Director, UAL Corporation (airline) from February, 2006 to July, 2006; Chief Administrative Officer and Senior Vice President, Kmart Holding Corporation (consumer goods), from September, 2003 to March, 2004; Executive Vice President–Corporate Development and Administration, General Counsel and Secretary, Kellogg Company (food manufacturer), from September, 1999 to August, 2003. Oversees 68, None | ||||||
| Richard W. Lowry (Born 1936) c/o Columbia Management Advisors, LLC One Financial Center Boston, MA 02111 Trustee (since 1995) | Private Investor since August, 1987 (formerly Chairman and Chief Executive Officer, U.S. Plywood Corporation (building products manufacturer) until 1987). Oversees 68, Liberty All-Star Equity Fund and Liberty All-Star Growth Fund, Inc. (closed-end funds) | ||||||
| Charles R. Nelson (Born 1942) c/o Columbia Management Advisors, LLC One Financial Center Boston, MA 02111 Trustee (since 1981) | Professor of Economics, University of Washington, since January, 1976; Ford and Louisa Van Voorhis Professor of Political Economy, University of Washington, since September, 1993; Director, Institute for Economic Research, University of Washington from September, 2001 to June, 2003; Adjunct Professor of Statistics, University of Washington, since September, 1980; Associate Editor, Journal of Money Credit and Banking, since September, 1993; Consultant on econometric and statistical matters. Oversees 68, None | ||||||
| John J. Neuhauser (Born 1943) c/o Columbia Management Advisors, LLC One Financial Center Boston, MA 02111 Trustee (since 1985) | President, St. Michaels College, since August, 2007; University Professor, Boston College from November, 2005 to August, 2007; Academic Vice President and Dean of Faculties, Boston College from August, 1999 to October, 2005. Oversees 68, Liberty All-Star Equity Fund and Liberty All-Star Growth Fund, Inc. (closed-end funds) | ||||||
27
Fund Governance (Continued)
Trustees
| Name, Address and Year of Birth, Position with Funds, Year First Elected or Appointed to Office1 | Principal Occupation(s) During Past Five years, Number of Portfolios in Columbia Funds Complex Overseen by Trustee, Other Directorships Held | ||||||
| Independent Trustees | |||||||
| Patrick J. Simpson (Born 1944) c/o Columbia Management Advisors, LLC One Financial Center Boston, MA 02111 Trustee (since 2000) | Partner, Perkins Coie LLP (law firm). Oversees 68, None | ||||||
| Thomas E. Stitzel (Born 1936) c/o Columbia Management Advisors, LLC One Financial Center Boston, MA 02111 Trustee (since 1998) | Business Consultant since 1999; Chartered Financial Analyst. Oversees 68, None | ||||||
| Thomas C. Theobald (Born 1937) c/o Columbia Management Advisors, LLC One Financial Center Boston, MA 02111 Trustee and Chairman of the Board2 (since 1996) | Partner and Senior Advisor, Chicago Growth Partners (private equity investing) since September, 2004; Managing Director, William Blair Capital Partners (private equity investing) from September, 1994 to September, 2004. Oversees 68, Anixter International (network support equipment distributor); Ventas, Inc. (real estate investment trust); Jones Lang LaSalle (real estate management services); Ambac Financial Group (financial guaranty insurance) | ||||||
| Anne-Lee Verville (Born 1945) c/o Columbia Management Advisors, LLC One Financial Center Boston, MA 02111 Trustee (since 1998) | Retired since 1997 (formerly General Manager, Global Education Industry, IBM Corporation (computer and technology) from 1994 to 1997). Oversees 68, None | ||||||
| Interested Trustee | |||||||
| William E. Mayer (Born 1940) c/o Columbia Management Advisors, LLC One Financial Center Boston, MA 02111 Trustee3 (since 1994) | Partner, Park Avenue Equity Partners (private equity) since February, 1999; Dean and Professor, College of Business, University of Maryland, 1992 to 1997. Oversees 68, Lee Enterprises (print media), WR Hambrecht + Co. (financial service provider); Reader's Digest (publishing) | ||||||
(1) In December 2000, the boards of each of the former Liberty Funds and former Stein Roe Funds were combined into one board of trustees responsible for the oversight of both fund groups (collectively, the "Liberty Board"). In October 2003, the trustees on the Liberty Board were elected to the boards of the Columbia Funds (the "Columbia Board") and of the CMG Fund Trust (the "CMG Funds Board"); simultaneous with that election, Patrick J. Simpson who had been a director on the Columbia Board and trustee on the CMG Funds Board, was appointed to serve as trustee of the Liberty Board. The date shown is the earliest date on which a trustee/director was elected or appointed to the board of a Fund in the Columbia Funds Complex.
(2) Mr. Theobald was appointed as Chairman of the Board effective December 10, 2003.
(3) Mr. Mayer is an "interested person" (as defined in the Investment Company Act of 1940) by reason of his affiliation with WR Hambrecht + Co.
The Statement of Additional Information includes additional information about the Trustees of the Funds and is available, without charge, upon request by calling 1-800-774-2098.
28
Fund Governance (Continued)
Officers
| Name, Address and Year of Birth, Position with Columbia Funds, Year First Elected or Appointed to Office | Principal Occupation(s) During Past Five Years | ||||||
| Christopher L. Wilson (Born 1957) One Financial Center Boston, MA 02111 President (since 2004) | President–Columbia Funds, since October 2004; Managing Director–Columbia Management Advisors, LLC, since September 2005; Senior Vice President–Columbia Management Distributors, Inc., since January 2005; Director–Columbia Management Services, Inc., since January 2005; Director–Bank of America Global Liquidity Funds, plc and Banc of America Capital Management (Ireland), Limited, since May 2005; Director–FIM Funding, Inc., since January 2005; President and Chief Executive Officer–CDC IXIS AM Services, Inc. (investment management), from September 1998 through August 2004; and a senior officer or director of various other Bank of America-affiliated entities, including other registered and unregistered funds. | ||||||
| James R. Bordewick, Jr. (Born 1959) One Financial Center Boston, MA 02111 Senior Vice President, Secretary and Chief Legal Officer (since 2006) | Associate General Counsel, Bank of America since April, 2005; Senior Vice President and Associate General Counsel, MFS Investment Management (investment management) prior to April, 2005. | ||||||
| J. Kevin Connaughton (Born 1964) One Financial Center Boston, MA 02111 Senior Vice President, Chief Financial Officer and Treasurer (since 2000) | Treasurer–Columbia Funds, since October 2003; Treasurer–the Liberty Funds, Stein Roe Funds and Liberty All-Star Funds, December 2000–December 2006; Vice President–Columbia Management Advisors, Inc., since April 2003; President–Columbia Funds, Liberty Funds and Stein Roe Funds, February 2004 to October 2004; Treasurer–Galaxy Funds, September 2002 to December 2005; Treasurer, December 2002 to December 2004, and President, February 2004 to December 2004–Columbia Management Multi-Strategy Hedge Fund, LLC; and a senior officer of various other Bank of America-affiliated entities, including other registered and unregistered funds. | ||||||
| Linda J. Wondrack (Born 1964) One Financial Center Boston, MA 02111 Senior Vice President, Chief Compliance Officer (since 2007) | Director (Columbia Management Group LLC and Investment Product Group Compliance), Bank of America since June 2005; Director of Corporate Compliance and Conflicts Officer, MFS Investment Management (investment management), August 2004 to May 2005; Managing Director, Deutsche Asset Management (investment management) prior to August 2004. | ||||||
| Michael G. Clarke (Born 1969) One Financial Center Boston, MA 02111 Chief Accounting Officer and Assistant Treasurer (since 2004) | Director of Fund Administration of the Advisor since January, 2006; Managing Director of the Advisor September, 2004 to December, 2005; Vice President Fund Administration of the Advisor June, 2002 to September, 2004. Vice President Product Strategy and Development of the Advisor from February, 2001 to June, 2002. | ||||||
| Jeffrey R. Coleman (Born 1969) One Financial Center Boston, MA 02111 Deputy Treasurer (since 2006) | Director of Fund Administration of the Advisor since January, 2006; Fund Controller of the Advisor from October 2004 to January 2006; Vice President of CDC IXIS Asset Management Services, Inc. (investment management) from August, 2000 to September, 2004. | ||||||
29
Fund Governance (Continued)
Officers
| Name, Address and Year of Birth, Position with Columbia Funds, Year First Elected or Appointed to Office | Principal Occupation(s) During Past Five Years | ||||||
| Joseph F. DiMaria (Born 1968) One Financial Center Boston, MA 02111 Deputy Treasurer (since 2006) | Director of Fund Administration of the Advisor since January, 2006; Head of Tax/Compliance and Assistant Treasurer of the Advisor from November, 2004 to December, 2005; Director of Trustee Administration (Sarbanes-Oxley) of the Advisor from May, 2003 to October, 2004; Senior Audit Manager, PricewaterhouseCoopers (independent registered public accounting firm) from July, 2000 to April, 2003. | ||||||
| Marybeth C. Pilat (Born 1968) One Financial Center Boston, MA 02111 Deputy Treasurer (since 2006) | Vice President, Mutual Fund Valuation of the Advisor since January 2006; Vice President, Mutual Fund Accounting Oversight of the Advisor prior to January 2006. | ||||||
| Barry S. Vallan (Born 1969) One Financial Center Boston, MA 02111 Controller (since 2006) | Vice President–Fund Treasury of the Advisor since October, 2004; Vice President–Trustee Reporting of the Advisor from April, 2002 to October, 2004; Management Consultant, PricewaterhouseCoopers (independent registered public accounting firm) prior to October, 2002. | ||||||
30
COLUMBIA FUNDS INSTITUTIONAL TRUST
ONE FINANCIAL CENTER, BOSTON, MASSACHUSETTS 02111-2621
- INVESTMENT ADVISOR -
COLUMBIA MANAGEMENT ADVISORS, LLC
100 FEDERAL STREET
BOSTON, MASSACHUSETTS 02110-2624
- LEGAL COUNSEL -
ROPES & GRAY LLP
ONE INTERNATIONAL PLACE
BOSTON, MASSACHUSETTS 02110-2624
- TRANSFER AGENT -
COLUMBIA MANAGEMENT SERVICES, INC.
P.O. BOX 8081
BOSTON, MASSACHUSETTS 02266-8081
SHC-42/134207-0707 (09/07) 07/42327
A description of the fund's proxy voting policies and procedures is available (i) on the fund's website, www.columbiamanagement.com; (ii) on the Securities and Exchange Commission's website at www.sec.gov, and (iii) without charge, upon request, by calling 1-800-368-0346. Information regarding how the fund voted proxies relating to portfolio securities during the 12-month period ended June 30 is available from the SEC's website. Information regarding how the fund voted proxies relating to portfolio securities is also available from the fund's website.
The fund files a complete schedule of portfolio holdings with the SEC for the first and third quarters of each fiscal year on Form N-Q. The fund's Form N-Q is available on the SEC's website at www.sec.gov and may be reviewed and copied at the SEC's Public Reference Room in Washington, D.C. Information on the operation of the Public Reference Room may be obtained by calling 1-800-SEC-0330.
The fund is offered by prospectus through Columbia Management Distributors, Inc. Please consider the investment objectives, risks, charges and expenses of a mutual fund carefully before investing. Contact your Columbia Management representative or visit www.columbiamanagement.com for a prospectus, which contains this and other important information about the fund. Read it carefully before you invest.
Fund distributed by Columbia Management Distributors, Inc.
© 2007 Columbia Management Distributors, Inc.
One Financial Center, Boston, MA 02111-2621
Item 2. Code of Ethics.
(a) The registrant has, as of the end of the period covered by this report, adopted a code of ethics that applies to the registrant’s principal executive officer, principal financial officer, principal accounting officer or controller, or persons performing similar functions, regardless of whether these individuals are employed by the registrant or a third party.
(b) During the period covered by this report, there were not any amendments to a provision of the code of ethics adopted in 2(a) above.
(c) During the period covered by this report, there were no waivers, including any implicit waivers, from a provision of the code of ethics described in 2(a) above that relates to one or more of the items set forth in paragraph (b) of this item’s instructions.
Item 3. Audit Committee Financial Expert.
The registrant’s Board of Trustees has determined that Douglas A. Hacker, Thomas E. Stitzel and Anne-Lee Verville, each of whom are members of the registrant’s Board of Trustees and Audit Committee, each qualify as an audit committee financial expert. Mr. Hacker, Mr. Stitzel and Ms. Verville are each independent trustees, as defined in paragraph (a)(2) of this item’s instructions and collectively constitute the entire Audit Committee.
Item 4. Principal Accountant Fees and Services.
Fee information below is disclosed for the fourteen series of the registrant whose reports to stockholders are included in this annual filing.
(a) Audit Fees. Aggregate Audit Fees billed by the principal accountant for professional services rendered during the fiscal years ended July 31, 2007 and July 31, 2006 are approximately as follows:
2007 |
| 2006 |
| ||
$ | 435,300 |
| $ | 404,100 |
|
Audit Fees include amounts related to the audit of the registrant’s annual financial statements or services that are normally provided by the accountant in connection with statutory and regulatory filings or engagements for those fiscal years.
(b) Audit-Related Fees. Aggregate Audit-Related Fees billed to the registrant by the principal accountant for professional services rendered during the fiscal years ended July 31, 2007 and July 31, 2006 are approximately as follows:
2007 |
| 2006 |
| ||
$ | 57,400 |
| $ | 58,400 |
|
Audit-Related Fees include amounts for assurance and related services by the principal accountant that are reasonably related to the performance of the audit of the registrant’s financial statements and are not reported in Audit Fees above. In both fiscal years 2007 and 2006, Audit-Related Fees consist of agreed-upon procedures performed for semi-annual shareholder reports.
During the fiscal years ended July 31, 2007 and July 31, 2006, there were no Audit-Related Fees billed by the registrant’s principal accountant to the registrant’s investment adviser (not including any sub-adviser whose role is primarily portfolio management and is subcontracted with or overseen by another investment adviser) and any entity controlling, controlled by, or under common control with the adviser that provides ongoing services to the registrant for an engagement that related directly to the operations and financial reporting of the registrant.
(c) Tax Fees. Aggregate Tax Fees billed by the principal accountant to the registrant for professional services rendered during the fiscal years ended July 31, 2007 and July 31, 2006 are approximately as follows:
2007 |
| 2006 |
| ||
$ | 80,800 |
| $ | 71,800 |
|
Tax Fees include amounts for the review of annual tax returns, the review of required shareholder distribution calculations and typically include amounts for professional services by the principal accountant for tax compliance, tax advice and tax planning. Fiscal years 2007 and 2006 include Tax Fees for assistance with foreign tax filings. Fiscal year 2006 also includes Tax Fees for agreed-upon procedures related to a fund merger and the review of a final tax return.
During the fiscal years ended July 31, 2007 and July 31, 2006, there were no Tax Fees billed by the registrant’s principal accountant to the registrant’s investment adviser (not including any sub-adviser whose role is primarily portfolio management and is subcontracted with or overseen by another investment adviser) and any entity controlling, controlled by, or under common control with the adviser that provides ongoing services to the registrant for an engagement that related directly to the operations and financial reporting of the registrant.
(d) All Other Fees. Aggregate All Other Fees billed by the principal accountant to the registrant for professional services rendered during the fiscal years ended July 31, 2007 and July 31, 2006 are approximately as follows:
2007 |
| 2006 |
| ||
$ | 0 |
| $ | 2,600 |
|
All Other Fees include amounts for products and services provided by the principal accountant, other than the services reported in paragraphs (a) through (c) above. In fiscal year 2006, All Other Fees consist of fees billed for agreed-upon procedures related to the review of the registrant’s anti-money laundering program.
Aggregate All Other Fees billed by the registrant’s principal accountant to the registrant’s investment adviser (not including any sub-adviser whose role is primarily portfolio management and is subcontracted with or overseen by another investment adviser) and any entity controlling, controlled by, or under common control with the adviser that provides ongoing services to the registrant for an engagement that related directly to the operations and financial reporting of the registrant during the fiscal years ended July 31, 2007 and July 31, 2006 are approximately as follows:
2007 |
| 2006 |
| ||
$ | 849,100 |
| $ | 361,600 |
|
In both fiscal years 2007 and 2006, All Other Fees consist of fees billed for internal control examinations of the registrant’s transfer agent and investment advisor.
(e)(1) Audit Committee Pre-Approval Policies and Procedures
The registrant’s Audit Committee is required to pre-approve the engagement of the registrant’s independent accountants to provide audit and non-audit services to the registrant and non-audit services to its investment adviser (not including any sub-adviser whose role is primarily portfolio management and is subcontracted with or overseen by another investment adviser) or any entity controlling, controlled by or under common control with such investment adviser that provides ongoing services to the registrant (“Adviser Affiliates”), if the engagement relates directly to the operations and financial reporting of the registrant.
The Audit Committee has adop ted a Policy for Engagement of Independent Accountants for Audit and Non-Audit Services (“Policy”). The Policy sets forth the understanding of the Audit Committee regarding the engagement of the registrant’s independent accountants to provide (i) audit and permissible audit-related, tax and other services to the registrant (collectively “Fund Services”); (ii) non-audit services to the registrant’s investment adviser (not including any sub-adviser whose role is primarily portfolio management and is subcontracted with or overseen by another investment adviser) and Adviser Affiliates, if the engagement relates directly to the operations or
financial reporting of a Fund (collectively “Fund-related Adviser Services”); and (iii) certain other audit and non-audit services to the registrant’s investment adviser (not including any sub-adviser whose role is primarily portfolio management and is subcontracted with or overseen by another investment adviser) and Adviser Affiliates. Unless a type of service receives general pre-approval under the Policy, it requires specific pre-approval by the Audit Committee if it is to be provided by the independent accountants. Pre-approval of non-audit services to the registrant, the registrant’s investment adviser (not including any sub-adviser whose role is primarily portfolio management and is subcontracted with or overseen by another investment adviser) and A dviser Affiliates may be waived provided that the “de minimis” requirements set forth under paragraph (c)(7)(i)(C) of Rule 2-01 of Regulation S-X are met.
Under the Policy, the Audit Committee may delegate pre-approval authority to any pre-designated member or members who are Independent Trustees/Directors. The member(s) to whom such authority is delegated must report, for informational purposes only, any pre-approval decisions to the Audit Committee at its next regular meeting. The Audit Committee’s responsibilities with respect to the pre-approval of services performed by the independent accountants may not be delegated to management.
The Policy requires the Fund Treasurer and/or Director of Board Administration to submit to the Audit Committee, on an annual basis, a schedule of the types of services that are subject to general pre-approval. The schedule(s) provide a description of each type of service that is subject to general pre-approval and, where possible, will provide estimated fee caps for each instance of providing each service. The Audit Committees will review and approve the types of services and review the projected fees for the next fiscal year and may add to, or subtract from, the list of general pre-approved services from time to time based on subsequent determinations. That approval acknowledges that the Audit Committee is in agreement with the specific types of services that the independent accountants will be permitted to perform.
The Fund Treasurer and/or Director of Board Administration shall report to the Audit Committee at each of its regular meetings regarding all Fund Services or Fund-related Adviser Services initiated since the last such report was rendered, including a general description of the services, actual billed and projected fees, and the means by which such Fund Services or Fund-related Adviser Services were pre-approved by the Audit Committee.
*****
(e)(2) The percentage of services described in paragraphs (b) through (d) of this Item approved pursuant to the “de minimis” exception under paragraph (c)(7)(i)(C) of Rule 2-01 of Regulation S-X during both fiscal years ended July 31, 2007 and July 31, 2006 was zero.
(f) Not applicable.
(g) The aggregate non-audit fees billed by the registrant’s accountant for services rendered to the registrant, and rendered to the registrant’s investment adviser (not including any sub-adviser whose role is primarily portfolio management and is subcontracted with or overseen by another investment adviser), and any entity controlling, controlled by, or under common control with the adviser that provides ongoing services to the registrant for the fiscal years ended July 31, 2007 and July 31, 2006 are approximately as follows:
2007 |
| 2006 |
| ||
$ | 987,300 |
| $ | 494,400 |
|
(h) The registrant’s Audit Committee of the Board of Directors has considered whether the provision of non-audit services that were rendered to the registrant’s adviser (not including any sub-adviser whose role is primarily portfolio management and is subcontracted with or overseen by another investment adviser), and any entity controlling, controlled by, or under common control with the investment adviser that provides ongoing services to the registrant that were not pre-approved pursuant to paragraph (c)(7)(ii) of Rule 2-01 of Regulation S-X, is compatible with maintaining the principal accountant’s independence.
Item 5. Audit Committee of Listed Registrants.
Not applicable.
Item 6. Schedule of Investments
The registrant’s “Schedule I – Investments in securities of unaffiliated issuers” (as set forth in 17 CFR 210.12-12) is included in Item 1 of this Form N-CSR.
Item 7. Disclosure of Proxy Voting Policies and Procedures for Closed-End Management Investment Companies.
Not applicable.
Item 8. Portfolio Managers of Closed-End Management Investment Companies.
Not applicable.
Item 9. Purchases of Equity Securities by Closed-End Management Investment Company and Affiliated Purchasers.
Not applicable.
Item 10. Submission of Matters to a Vote of Security Holders.
There have not been any material changes to the procedures by which shareholders may recommend nominees to the registrant’s board of directors, since those procedures were last disclosed in response to requirements of Item 7(d)(2)(ii)(G) of Schedule 14A or this Item.
Item 11. Controls and Procedures.
(a) The registrant’s principal executive officer and principal financial officers, based on their evaluation of the registrant’s disclosure controls and procedures as of a date within 90 days of the filing of this report, have concluded that such controls and procedures are adequately designed to ensure that information required to be disclosed by the registrant in Form N-CSR is accumulated and communicated to the registrant’s management, including the principal executive officer and principal financial officer, or persons performing similar functions, as appropriate to allow timely decisions regarding required disclosure.
(b) There was no change in the registrant’s internal control over financial reporting that occurred during the registrant’s second fiscal quarter of the period covered by this report that has materially affected, or is reasonably likely to materially affect, the registrant’s internal control over financial reporting.
Item 12. Exhibits.
(a)(1) Code of ethics required to be disclosed under Item 2 of Form N-CSR attached hereto as Exhibit 99.CODE ETH.
(a)(2) Certifications pursuant to Rule 30a-2(a) under the Investment Company Act of 1940 (17 CFR 270.30a-2(a)) attached hereto as Exhibit 99.CERT.
(a)(3) Not applicable.
(b) Certification pursuant to Rule 30a-2(b) under the Investment Company Act of 1940 (17 CFR 270.30a-2(b)) attached hereto as Exhibit 99.906CERT.
SIGNATURES
Pursuant to the requirements of the Securities Exchange Act of 1934 and the Investment Company Act of 1940, the registrant has duly caused this report to be signed on its behalf by the undersigned, thereunto duly authorized.
(registrant) |
| Columbia Funds Institutional Trust |
| |||||
|
|
|
|
| ||||
|
|
| ||||||
By (Signature and Title) |
| /s/ Christopher L. Wilson |
| |||||
| Christopher L. Wilson, President |
|
| |||||
|
|
|
| |||||
|
|
|
| |||||
Date |
| September 24, 2007 |
| |||||
Pursuant to the requirements of the Securities Exchange Act of 1934 and the Investment Company Act of 1940, this report has been signed below by the following persons on behalf of the registrant and in the capacities and on the dates indicated.
By (Signature and Title) |
| /s/ Christopher L. Wilson |
| |||
| Christopher L. Wilson, President |
|
| |||
|
|
|
| |||
|
|
|
| |||
Date |
| September 24, 2007 |
| |||
|
|
|
| |||
|
|
|
| |||
By (Signature and Title) |
| /s/ J. Kevin Connaughton |
| |||
| J. Kevin Connaughton, Treasurer |
|
| |||
|
|
|
| |||
|
|
|
| |||
Date |
| September 24, 2007 |
| |||