UNITED STATES SECURITIES AND EXCHANGE COMMISSION
Washington, D.C. 20549
Form 10-Q
| þ | QUARTERLY REPORT PURSUANT TO SECTION 13 OR 15(d) OF THE SECURITIES EXCHANGE ACT OF 1934 |
For the Quarterly Period Ended September 30, 2015
OR
| ¨ | TRANSITION REPORT PURSUANT TO SECTION 13 OR 15(d) OF THE SECURITIES EXCHANGE ACT OF 1934 |
Commission File Number 1-10351
Potash Corporation of Saskatchewan Inc.
(Exact name of registrant as specified in its charter)
| | |
| Canada | | N/A |
(State or other jurisdiction of incorporation or organization) | | (I.R.S. Employer Identification No.) |
| |
122 — 1st Avenue South Saskatoon, Saskatchewan, Canada (Address of principal executive offices) | | S7K 7G3 (Zip Code) |
306-933-8500
(Registrant’s telephone number, including area code)
Indicate by check mark whether the registrant (1) has filed all reports required to be filed by Sections 13 or 15(d) of the Securities Exchange Act of 1934 during the preceding 12 months (or for such shorter period that the registrant was required to file such reports), and (2) has been subject to such filing requirements for the past 90 days.
Yes þ No ¨
Indicate by check mark whether the registrant has submitted electronically and posted on its corporate Web site, if any, every Interactive Data File required to be submitted and posted pursuant to Rule 405 of Regulation S-T during the preceding 12 months (or for such shorter period that the registrant was required to submit and post such files).
Yes ¨ No ¨
Indicate by check mark whether the registrant is a large accelerated filer, an accelerated filer, a non-accelerated filer, or a smaller reporting company. See the definitions of “large accelerated filer,” “accelerated filer” and “smaller reporting company” in Rule 12b-2 of the Exchange Act. (Check one):
| | | | | | |
Large accelerated filer þ | | Accelerated filer ¨ | | Non-accelerated filer ¨ | | Smaller reporting company ¨ |
| | | | (Do not check if a smaller reporting company) | | |
Indicate by check mark whether the registrant is a shell company (as defined in Exchange Act Rule 12b-2).
Yes ¨ No þ
As at September 30, 2015, Potash Corporation of Saskatchewan Inc. had 834,948,893 Common Shares outstanding.
Part I. Financial Information
Item 1. Financial Statements
Condensed Consolidated Statements of Income
Unaudited | In millions of US dollars except as otherwise noted |
| | | | | | | | | | | | | | | | |
| | | Three Months Ended September 30 | | | Nine Months Ended September 30 | |
| | | 2015 | | | 2014 | | | 2015 | | | 2014 | |
Sales (Note 2) | | $ | 1,529 | | | $ | 1,641 | | | $ | 4,925 | | | $ | 5,213 | |
Freight, transportation and distribution | | | (128 | ) | | | (141 | ) | | | (380 | ) | | | (465 | ) |
Cost of goods sold | | | (896 | ) | | | (911 | ) | | | (2,662 | ) | | | (2,847 | ) |
Gross Margin | | | 505 | | | | 589 | | | | 1,883 | | | | 1,901 | |
| | | | |
Selling and administrative expenses | | | (52 | ) | | | (49 | ) | | | (172 | ) | | | (172 | ) |
Provincial mining and other taxes | | | (79 | ) | | | (52 | ) | | | (264 | ) | | | (175 | ) |
Share of earnings of equity-accounted investees | | | 32 | | | | 20 | | | | 103 | | | | 85 | |
Dividend income | | | 7 | | | | 7 | | | | 38 | | | | 100 | |
Impairment of available-for-sale investment | | | – | | | | – | | | | – | | | | (38 | ) |
Other income (Note 3) | | | 8 | | | | 5 | | | | 11 | | | | 36 | |
Operating Income | | | 421 | | | | 520 | | | | 1,599 | | | | 1,737 | |
| | | | |
Finance costs | | | (49 | ) | | | (47 | ) | | | (148 | ) | | | (142 | ) |
Income Before Income Taxes | | | 372 | | | | 473 | | | | 1,451 | | | | 1,595 | |
| | | | |
Income taxes (Note 4) | | | (90 | ) | | | (156 | ) | | | (382 | ) | | | (466 | ) |
Net Income | | $ | 282 | | | $ | 317 | | | $ | 1,069 | | | $ | 1,129 | |
Net Income per Share | | | | | | | | | | | | | | | | |
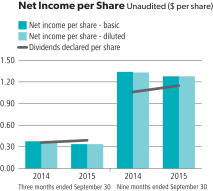
Basic | | $ | 0.34 | | | $ | 0.38 | | | $ | 1.28 | | | $ | 1.34 | |
Diluted | | $ | 0.34 | | | $ | 0.38 | | | $ | 1.28 | | | $ | 1.33 | |
Weighted Average Shares Outstanding | | | | | | | | | | | | | | | | |
Basic | | | 834,850,000 | | | | 829,506,000 | | | | 833,573,000 | | | | 840,837,000 | |
Diluted | | | 837,454,000 | | | | 835,835,000 | | | | 837,377,000 | | | | 847,429,000 | |
(See Notes to the Condensed Consolidated Financial Statements)
| | |
| 1 | | PotashCorp 2015 Third Quarter Quarterly Report on Form 10-Q |
Condensed Consolidated Statements of Comprehensive (Loss) Income
Unaudited | In millions of US dollars |
| | | | | | | | | | | | | | | | |
| | | Three Months Ended September 30 | | | Nine Months Ended September 30 | |
| (Net of related income taxes) | | 2015 | | | 2014 | | | 2015 | | | 2014 | |
Net Income | | $ | 282 | | | $ | 317 | | | $ | 1,069 | | | $ | 1,129 | |
Other comprehensive loss | | | | | | | | | | | | | | | | |
Items that have been or may be subsequently reclassified to net income: | | | | | | | | | | | | | | | | |
Available-for-sale investments (1) | | | | | | | | | | | | | | | | |
Net fair value loss during the period | | | (450 | ) | | | (229 | ) | | | (391 | ) | | | (194 | ) |
Cash flow hedges | | | | | | | | | | | | | | | | |
Net fair value loss during the period (2) | | | (21 | ) | | | (6 | ) | | | (42 | ) | | | (7 | ) |
Reclassification to income of net loss (3) | | | 13 | | | | 7 | | | | 39 | | | | 20 | |
Other | | | (3 | ) | | | (1 | ) | | | (7 | ) | | | 3 | |
Other Comprehensive Loss | | | (461 | ) | | | (229 | ) | | | (401 | ) | | | (178 | ) |
Comprehensive (Loss) Income | | $ | (179 | ) | | $ | 88 | | | $ | 668 | | | $ | 951 | |
| (1) | Available-for-sale investments are comprised of shares in Israel Chemicals Ltd., Sinofert Holdings Limited and other. |
| (2) | Cash flow hedges are comprised of natural gas derivative instruments and treasury lock derivatives and were net of income taxes of $11 (2014 – $3) for the three months ended September 30, 2015 and $23 (2014 – $4) for the nine months ended September 30, 2015. |
| (3) | Net of income taxes of $(7) (2014 – $(3)) for the three months ended September 30, 2015 and $(21) (2014 – $(11)) for the nine months ended September 30, 2015. |
(See Notes to the Condensed Consolidated Financial Statements)
| | |
| PotashCorp 2015 Third Quarter Quarterly Report on Form 10-Q | | 2 |
Condensed Consolidated Statements of Cash Flow
Unaudited | In millions of US dollars |
| | | | | | | | | | | | | | | | |
| | | Three Months Ended September 30 | | | Nine Months Ended September 30 | |
| | | 2015 | | | 2014 | | | 2015 | | | 2014 | |
Operating Activities | | | | | | | | | | | | | | | | |
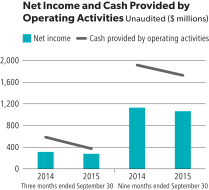
Net income | | $ | 282 | | | $ | 317 | | | $ | 1,069 | | | $ | 1,129 | |
Adjustments to reconcile net income to cash provided by operating activities (Note 5) | | | 223 | | | | 266 | | | | 652 | | | | 821 | |
Changes in non-cash operating working capital (Note 5) | | | (147 | ) | | | (9 | ) | | | (6 | ) | | | (49 | ) |
Cash provided by operating activities | | | 358 | | | | 574 | | | | 1,715 | | | | 1,901 | |
Investing Activities | | | | | | | | | | | | | | | | |
Additions to property, plant and equipment | | | (280 | ) | | | (303 | ) | | | (802 | ) | | | (726 | ) |
Other assets and intangible assets | | | (53 | ) | | | (2 | ) | | | (68 | ) | | | (12 | ) |
Cash used in investing activities | | | (333 | ) | | | (305 | ) | | | (870 | ) | | | (738 | ) |
Financing Activities | | | | | | | | | | | | | | | | |
Proceeds from long-term debt obligations | | | – | | | | – | | | | 494 | | | | 737 | |
Repayment of long-term debt obligations | | | (502 | ) | | | – | | | | (502 | ) | | | (500 | ) |
Proceeds from (repayment of) short-term debt obligations | | | 414 | | | | 55 | | | | (122 | ) | | | 14 | |
Dividends | | | (313 | ) | | | (281 | ) | | | (899 | ) | | | (857 | ) |
Repurchase of common shares | | | – | | | | – | | | | – | | | | (1,065 | ) |
Issuance of common shares | | | – | | | | 2 | | | | 42 | | | | 32 | |
Cash used in financing activities | | | (401 | ) | | | (224 | ) | | | (987 | ) | | | (1,639 | ) |
(Decrease) Increase in Cash and Cash Equivalents | | | (376 | ) | | | 45 | | | | (142 | ) | | | (476 | ) |
Cash and Cash Equivalents, Beginning of Period | | | 449 | | | | 107 | | | | 215 | | | | 628 | |
Cash and Cash Equivalents, End of Period | | $ | 73 | | | $ | 152 | | | $ | 73 | | | $ | 152 | |
Cash and cash equivalents comprised of: | | | | | | | | | | | | | | | | |
Cash | | $ | 39 | | | $ | 63 | | | $ | 39 | | | $ | 63 | |
Short-term investments | | | 34 | | | | 89 | | | | 34 | | | | 89 | |
| | | $ | 73 | | | $ | 152 | | | $ | 73 | | | $ | 152 | |
(See Notes to the Condensed Consolidated Financial Statements)
| | |
| 3 | | PotashCorp 2015 Third Quarter Quarterly Report on Form 10-Q |
Condensed Consolidated Statements of Changes in Equity
Unaudited | In millions of US dollars |
| | | | | | | | | | | | | | | | | | | | | | | | | | | | | | | | |
| | | | | | | | | Accumulated Other Comprehensive Income | | | | | | | |
| | | Share
Capital | | | Contributed
Surplus | | | Net
unrealized
gain on
available-for-
sale
investments | | | Net loss on
derivatives
designated as
cash flow
hedges | | | Other | | | Total
Accumulated
Other
Comprehensive
Income | | | Retained
Earnings | | | Total
Equity (1) | |
Balance – December 31, 2014 | | $ | 1,632 | | | $ | 234 | | | $ | 623 | | | $ | (119 | ) | | $ | (1 | ) | | $ | 503 | | | $ | 6,423 | | | $ | 8,792 | |
Net income | | | – | | | | – | | | | – | | | | – | | | | – | | | | – | | | | 1,069 | | | | 1,069 | |
Other comprehensive loss | | | – | | | | – | | | | (391 | ) | | | (3 | ) | | | (7 | ) | | | (401 | ) | | | – | | | | (401 | ) |
Dividends declared | | | – | | | | – | | | | – | | | | – | | | | – | | | | – | | | | (957 | ) | | | (957 | ) |
Effect of share-based compensation including issuance of common shares | | | 56 | | | | (2 | ) | | | – | | | | – | | | | – | | | | – | | | | – | | | | 54 | |
Shares issued for dividend reinvestment plan | | | 32 | | | | – | | | | – | | | | – | | | | – | | | | – | | | | – | | | | 32 | |
Balance – September 30, 2015 | | $ | 1,720 | | | $ | 232 | | | $ | 232 | | | $ | (122 | ) | | $ | (8 | ) | | $ | 102 | | | $ | 6,535 | | | $ | 8,589 | |
Balance – December 31, 2013 | | $ | 1,600 | | | $ | 219 | | | $ | 780 | | | $ | (105 | ) | | $ | (2 | ) | | $ | 673 | | | $ | 7,136 | | | $ | 9,628 | |
Net income | | | – | | | | – | | | | – | | | | – | | | | – | | | | – | | | | 1,129 | | | | 1,129 | |
Other comprehensive (loss) income | | | – | | | | – | | | | (194 | ) | | | 13 | | | | 3 | | | | (178 | ) | | | – | | | | (178 | ) |
Shares repurchased | | | (53 | ) | | | (2 | ) | | | – | | | | – | | | | – | | | | – | | | | (976 | ) | | | (1,031 | ) |
Dividends declared | | | – | | | | – | | | | – | | | | – | | | | – | | | | – | | | | (873 | ) | | | (873 | ) |
Effect of share-based compensation including issuance of common shares | | | 43 | | | | 12 | | | | – | | | | – | | | | – | | | | – | | | | – | | | | 55 | |
Shares issued for dividend reinvestment plan | | | 30 | | | | – | | | | – | | | | – | | | | – | | | | – | | | | – | | | | 30 | |
Balance – September 30, 2014 | | $ | 1,620 | | | $ | 229 | | | $ | 586 | | | $ | (92 | ) | | $ | 1 | | | $ | 495 | | | $ | 6,416 | | | $ | 8,760 | |
| (1) | All equity transactions were attributable to common shareholders. |
(See Notes to the Condensed Consolidated Financial Statements)
| | |
| PotashCorp 2015 Third Quarter Quarterly Report on Form 10-Q | | 4 |
Condensed Consolidated Statements of Financial Position
Unaudited | In millions of US dollars except as otherwise noted |
| | | | | | | | |
| As at | | September 30,
2015 | | | December 31,
2014 | |
Assets | | | | | | | | |
Current assets | | | | | | | | |
Cash and cash equivalents | | $ | 73 | | | $ | 215 | |
Receivables | | | 822 | | | | 1,029 | |
Inventories (Note6) | | | 725 | | | | 646 | |
Prepaid expenses and other current assets | | | 72 | | | | 48 | |
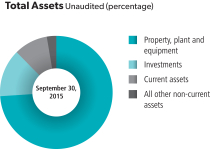
| | | 1,692 | | | | 1,938 | |
Non-current assets | | | | | | | | |
Property, plant and equipment | | | 12,907 | | | | 12,674 | |
Investments in equity-accounted investees | | | 1,252 | | | | 1,211 | |
Available-for-sale investments | | | 1,139 | | | | 1,527 | |
Other assets | | | 280 | | | | 232 | |
Intangible assets | | | 195 | | | | 142 | |
Total Assets | | $ | 17,465 | | | $ | 17,724 | |
Liabilities | | | | | | | | |
Current liabilities | | | | | | | | |
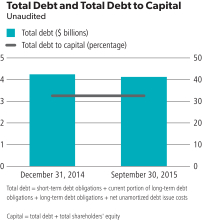
Short-term debt and current portion of long-term debt | | $ | 414 | | | $ | 1,032 | |
Payables and accrued charges | | | 1,000 | | | | 1,086 | |
Current portion of derivative instrument liabilities | | | 81 | | | | 80 | |
| | | 1,495 | | | | 2,198 | |
Non-current liabilities | | | | | | | | |
Long-term debt (Note 7) | | | 3,709 | | | | 3,213 | |
Derivative instrument liabilities | | | 119 | | | | 115 | |
Deferred income tax liabilities | | | 2,358 | | | | 2,201 | |
Pension and other post-retirement benefit liabilities | | | 524 | | | | 503 | |
Asset retirement obligations and accrued environmental costs | | | 568 | | | | 589 | |
Other non-current liabilities and deferred credits | | | 103 | | | | 113 | |
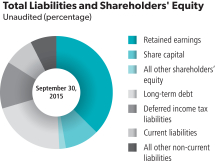
Total Liabilities | | | 8,876 | | | | 8,932 | |
Shareholders’ Equity | | | | | | | | |
Share capital (Note 8) | | | 1,720 | | | | 1,632 | |
Contributed surplus | | | 232 | | | | 234 | |
Accumulated other comprehensive income | | | 102 | | | | 503 | |
Retained earnings | | | 6,535 | | | | 6,423 | |
Total Shareholders’ Equity | | | 8,589 | | | | 8,792 | |
Total Liabilities and Shareholders’ Equity | | $ | 17,465 | | | $ | 17,724 | |
(See Notes to the Condensed Consolidated Financial Statements)
| | |
| 5 | | PotashCorp 2015 Third Quarter Quarterly Report on Form 10-Q |
Notes to the Condensed Consolidated Financial Statements
For the Three and Nine Months Ended September 30, 2015
Unaudited | In millions of US dollars except as otherwise noted |
1. Significant Accounting Policies
Basis of Presentation
With its subsidiaries, Potash Corporation of Saskatchewan Inc. (“PCS”) – together known as “PotashCorp” or “the company” except to the extent the context otherwise requires – forms an integrated fertilizer and related industrial and feed products company. These unaudited interim condensed consolidated financial statements are based on International Financial Reporting Standards as issued by the International Accounting Standards Board (“IFRS”), and have been prepared in accordance with International Accounting Standard (“IAS”) 34, “Interim Financial Reporting.” The accounting policies and methods of computation used in preparing these unaudited interim condensed consolidated financial statements are consistent with those used in the preparation of the company’s 2014 annual consolidated financial statements.
These unaudited interim condensed consolidated financial statements include the accounts of PCS and its subsidiaries; however, they do not include all disclosures normally provided in annual consolidated financial statements and should be read in conjunction with the company’s 2014 annual consolidated financial statements. In management’s opinion, the unaudited interim condensed consolidated financial statements include all adjustments necessary to fairly present such information. Interim results are not necessarily indicative of the results expected for the fiscal year.
These unaudited interim condensed consolidated financial statements were authorized by the audit committee of the Board of Directors for issue on November 3, 2015.
Standards, Amendments and Interpretations Not Yet Effective and Not Applied
The International Accounting Standards Board (“IASB”) and International Financial Reporting Interpretations Committee (“IFRIC”) have issued the following standards and amendments or interpretations to existing standards that were not yet effective and not applied as at September 30, 2015. The company does not anticipate early adoption of these standards at this time.
| | | | | | | | |
| Standard | | Description | | Impact | | | | Effective Date (1) |
Amendments to IAS 1, Presentation of Financial Statements | | Issued to improve the effectiveness of presentation and disclosure in financial reports, with the objective of reducing immaterial note disclosures. | | The company is reviewing the standard to determine the potential impact, if any. | | | | January 1, 2016, applied prospectively. |
| Amendments to IAS 16, Property, Plant and Equipment and IAS 38, Intangible Assets | | Issued to clarify acceptable methods of depreciation and amortization. | | The company is reviewing the standard to determine the potential impact, if any; however, no significant impact is anticipated. | | | | January 1, 2016, applied prospectively. |
| Amendments to IFRS 11, Joint Arrangements | | Issued to provide additional guidance on accounting for the acquisition of an interest in a joint operation. | | The company is reviewing the standard to determine the potential impact, if any; however, no significant impact is anticipated. | | | | January 1, 2016, applied prospectively. |
| IFRS 15, Revenue From Contracts With Customers | | Issued to provide guidance on the recognition of revenue from contracts with customers, including multiple-element arrangements and transactions not previously addressed comprehensively, and enhance disclosures about revenue. | | The company is reviewing the standard to determine the potential impact, if any. | | | | January 1, 2018, applied retrospectively with certain limitations. |
| IFRS 9, Financial Instruments | | Issued to replace IAS 39, providing guidance on the classification, measurement and disclosure of financial instruments and introducing a new hedge accounting model. | | The company is reviewing the standard to determine the potential impact, if any. | | | | January 1, 2018, applied retrospectively with certain exceptions. |
| (1) | Effective date for annual periods beginning on or after the stated date. |
| | |
| PotashCorp 2015 Third Quarter Quarterly Report on Form 10-Q | | 6 |
2. Segment Information
The company has three reportable operating segments: potash, nitrogen and phosphate. These segments are differentiated by the chemical nutrient contained in the products that each produces. The accounting policies of the segments are the same as those described in Note 1 and are measured in a manner consistent with that of the financial statements. Inter-segment sales are made under terms that approximate market value. The company’s operating segments have been determined based on reports reviewed by the Chief Executive Officer, assessed to be the company’s chief operating decision-maker, that are used to make strategic decisions.
| | | | | | | | | | | | | | | | | | | | |
| | | Three Months Ended September 30, 2015 | |
| | | Potash | | | Nitrogen | | | Phosphate | | | All Others | | | Consolidated | |
Sales – third party | | $ | 603 | | | $ | 460 | | | $ | 466 | | | $ | – | | | $ | 1,529 | |
Freight, transportation and distribution – third party | | | (55 | ) | | | (23 | ) | | | (50 | ) | | | – | | | | (128 | ) |
Net sales – third party | | | 548 | | | | 437 | | | | 416 | | | | – | | | | | |
Cost of goods sold – third party | | | (254 | ) | | | (292 | ) | | | (350 | ) | | | – | | | | (896 | ) |
Margin (cost) on inter-segment sales (1) | | | – | | | | 16 | | | | (16 | ) | | | – | | | | – | |
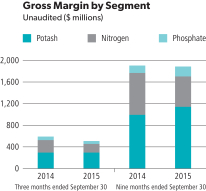
Gross margin | | | 294 | | | | 161 | | | | 50 | | | | – | | | | 505 | |
Depreciation and amortization | | | (52 | ) | | | (48 | ) | | | (56 | ) | | | (16 | ) | | | (172 | ) |
Assets | | | 9,678 | | | | 2,560 | | | | 2,369 | | | | 2,858 | | | | 17,465 | |
Cash outflows for additions to property, plant and equipment | | | 127 | | | | 102 | | | | 37 | | | | 14 | | | | 280 | |
(1) Inter-segment net sales were $25. | | | | | | | | | | | | | | | | | | | | |
| | | Three Months Ended September 30, 2014 | |
| | | Potash | | | Nitrogen | | | Phosphate | | | All Others | | | Consolidated | |
Sales – third party | | $ | 633 | | | $ | 562 | | | $ | 446 | | | $ | – | | | $ | 1,641 | |
Freight, transportation and distribution – third party | | | (64 | ) | | | (30 | ) | | | (47 | ) | | | – | | | | (141 | ) |
Net sales – third party | | | 569 | | | | 532 | | | | 399 | | | | – | | | | | |
Cost of goods sold – third party | | | (274 | ) | | | (314 | ) | | | (323 | ) | | | – | | | | (911 | ) |
Margin (cost) on inter-segment sales (1) | | | – | | | | 15 | | | | (15 | ) | | | – | | | | – | |
Gross margin | | | 295 | | | | 233 | | | | 61 | | | | – | | | | 589 | |
Depreciation and amortization | | | (48 | ) | | | (42 | ) | | | (66 | ) | | | (5 | ) | | | (161 | ) |
Assets | | | 9,452 | | | | 2,282 | | | | 2,403 | | | | 3,224 | | | | 17,361 | |
Cash outflows for additions to property, plant and equipment | | | 138 | | | | 94 | | | | 65 | | | | 6 | | | | 303 | |
(1) Inter-segment net sales were $25. | | | | | | | | | | | | | | | | | | | | |
| | | Nine Months Ended September 30, 2015 | |
| | | Potash | | | Nitrogen | | | Phosphate | | | All Others | | | Consolidated | |
Sales – third party | | $ | 2,089 | | | $ | 1,501 | | | $ | 1,335 | | | $ | – | | | $ | 4,925 | |
Freight, transportation and distribution – third party | | | (178 | ) | | | (73 | ) | | | (129 | ) | | | – | | | | (380 | ) |
Net sales – third party | | | 1,911 | | | | 1,428 | | | | 1,206 | | | | – | | | | | |
Cost of goods sold – third party | | | (772 | ) | | | (905 | ) | | | (985 | ) | | | – | | | | (2,662 | ) |
Margin (cost) on inter-segment sales (1) | | | – | | | | 41 | | | | (41 | ) | | | – | | | | – | |
Gross margin | | | 1,139 | | | | 564 | | | | 180 | | | | – | | | | 1,883 | |
Depreciation and amortization | | | (170 | ) | | | (141 | ) | | | (181 | ) | | | (25 | ) | | | (517 | ) |
Assets | | | 9,678 | | | | 2,560 | | | | 2,369 | | | | 2,858 | | | | 17,465 | |
Cash outflows for additions to property, plant and equipment | | | 341 | | | | 285 | | | | 127 | | | | 49 | | | | 802 | |
(1) Inter-segment net sales were $62. | | | | | | | | | | | | | | | | | | | | |
| | |
| 7 | | PotashCorp 2015 Third Quarter Quarterly Report on Form 10-Q |
| | | | | | | | | | | | | | | | | | | | |
| | | Nine Months Ended September 30, 2014 | |
| | | Potash | | | Nitrogen | | | Phosphate | | | All Others | | | Consolidated | |
Sales – third party | | $ | 2,051 | | | $ | 1,799 | | | $ | 1,363 | | | $ | – | | | $ | 5,213 | |
Freight, transportation and distribution – third party | | | (229 | ) | | | (89 | ) | | | (147 | ) | | | – | | | | (465 | ) |
Net sales – third party | | | 1,822 | | | | 1,710 | | | | 1,216 | | | | – | | | | | |
Cost of goods sold – third party | | | (832 | ) | | | (979 | ) | | | (1,036 | ) | | | – | | | | (2,847 | ) |
Margin (cost) on inter-segment sales (1) | | | – | | | | 45 | | | | (45 | ) | | | – | | | | – | |
Gross margin | | | 990 | | | | 776 | | | | 135 | | | | – | | | | 1,901 | |
Depreciation and amortization | | | (165 | ) | | | (128 | ) | | | (234 | ) | | | 8 | | | | (519 | ) |
Assets | | | 9,452 | | | | 2,282 | | | | 2,403 | | | | 3,224 | | | | 17,361 | |
Cash outflows for additions to property, plant and equipment | | | 365 | | | | 209 | | | | 141 | | | | 11 | | | | 726 | |
| (1) | Inter-segment net sales were $83. |
3. Other Income
| | | | | | | | | | | | | | | | |
| | | Three Months Ended September 30 | | | Nine Months Ended September 30 | |
| | | 2015 | | | 2014 | | | 2015 | | | 2014 | |
Foreign exchange gain | | $ | 24 | | | $ | 7 | | | $ | 36 | | | $ | – | |
Legal settlements | | | – | | | | – | | | | – | | | | 17 | |
Other (expenses) income | | | (16 | ) | | | (2 | ) | | | (25 | ) | | | 19 | |
| | | $ | 8 | | | $ | 5 | | | $ | 11 | | | $ | 36 | |
4. Income Taxes
A separate estimated average annual effective tax rate was determined for each taxing jurisdiction and applied individually to the interim period pre-tax income of each jurisdiction.
| | | | | | | | | | | | | | | | |
| | | Three Months Ended September 30 | | | Nine Months Ended September 30 | |
| | | 2015 | | | 2014 | | | 2015 | | | 2014 | |
Income tax expense | | $ | 90 | | | $ | 156 | | | $ | 382 | | | $ | 466 | |
Actual effective tax rate on ordinary earnings | | | 27% | | | | 28% | | | | 27% | | | | 27% | |
Actual effective tax rate including discrete items | | | 24% | | | | 33% | | | | 26% | | | | 29% | |
Discrete tax adjustments that impacted the tax rate | | $ | (11 | ) | | $ | 25 | | | $ | (5 | ) | | $ | 21 | |
Significant items to note include the following:
| • | | In third-quarter 2015, a current tax recovery of $17 was recorded upon the conclusion of a tax authority audit. |
| • | | In third-quarter 2014, a deferred tax expense of $11 was recorded as a result of a Chilean income tax rate increase. |
| • | | In first-quarter 2014, a $38 discrete non-tax deductible impairment of an available-for-sale investment was recorded. This increased the actual effective tax rate including discrete items for the nine months ended September 30, 2014 by 1 percentage point. |
Income tax balances within the condensed consolidated statements of financial position were comprised of the following:
| | | | | | | | | | |
| Income Tax Assets (Liabilities) | | Statements of Financial Position Location | | September 30,
2015 | | | December 31,
2014 | |
Current income tax assets | | | | | | | | | | |
Current | | Receivables | | $ | 85 | | | $ | 145 | |
Non-current | | Other assets | | | 72 | | | | 83 | |
Deferred income tax assets | | Other assets | | | 9 | | | | 10 | |
Total income tax assets | | | | $ | 166 | | | $ | 238 | |
Current income tax liabilities | | | | | | | | | | |
Current | | Payables and accrued charges | | $ | (17 | ) | | $ | (5 | ) |
Non-current | | Other non-current liabilities and deferred credits | | | (100 | ) | | | (109 | ) |
Deferred income tax liabilities | | Deferred income tax liabilities | | | (2,358 | ) | | | (2,201 | ) |
Total income tax liabilities | | | | $ | (2,475 | ) | | $ | (2,315 | ) |
| | |
| PotashCorp 2015 Third Quarter Quarterly Report on Form 10-Q | | 8 |
5. Consolidated Statements of Cash Flow
| | | | | | | | | | | | | | | | |
| | | Three Months Ended September 30 | | | Nine Months Ended September 30 | |
| | | 2015 | | | 2014 | | | 2015 | | | 2014 | |
Reconciliation of cash provided by operating activities | | | | | | | | | | | | | | | | |
Net income | | $ | 282 | | | $ | 317 | | | $ | 1,069 | | | $ | 1,129 | |
Adjustments to reconcile net income to cash provided by operating activities | | | | | | | | | | | | | | | | |
Depreciation and amortization | | | 172 | | | | 161 | | | | 517 | | | | 519 | |
Share-based compensation | | | 1 | | | | 3 | | | | 20 | | | | 22 | |
Net (undistributed) distributed earnings of equity-accounted investees | | | (31 | ) | | | 54 | | | | (47 | ) | | | 51 | |
Impairment of available-for-sale investment | | | – | | | | – | | | | – | | | | 38 | |
Provision for deferred income tax | | | 77 | | | | 32 | | | | 149 | | | | 142 | |
Pension and other post-retirement benefits | | | 11 | | | | 2 | | | | 27 | | | | 23 | |
Asset retirement obligations and accrued environmental costs | | | 5 | | | | 7 | | | | (19 | ) | | | 16 | |
Other long-term liabilities and miscellaneous | | | (12 | ) | | | 7 | | | | 5 | | | | 10 | |
Subtotal of adjustments | | | 223 | | | | 266 | | | | 652 | | | | 821 | |
Changes in non-cash operating working capital | | | | | | | | | | | | | | | | |
Receivables | | | 1 | | | | 24 | | | | 86 | | | | (80 | ) |
Inventories | | | (18 | ) | | | 7 | | | | (78 | ) | | | 24 | |
Prepaid expenses and other current assets | | | (19 | ) | | | (6 | ) | | | (16 | ) | | | 21 | |
Payables and accrued charges | | | (111 | ) | | | (34 | ) | | | 2 | | | | (14 | ) |
Subtotal of changes in non-cash operating working capital | | | (147 | ) | | | (9 | ) | | | (6 | ) | | | (49 | ) |
Cash provided by operating activities | | $ | 358 | | | $ | 574 | | | $ | 1,715 | | | $ | 1,901 | |
Supplemental cash flow disclosure | | | | | | | | | | | | | | | | |
Interest paid | | $ | 37 | | | $ | 40 | | | $ | 130 | | | $ | 132 | |
Income taxes paid | | $ | 85 | | | $ | 122 | | | $ | 150 | | | $ | 292 | |
6. Inventories
| | | | | | | | |
| | | September 30, 2015 | | | December 31, 2014 | |
Finished products | | $ | 278 | | | $ | 267 | |
Intermediate products | | | 119 | | | | 85 | |
Raw materials | | | 98 | | | | 78 | |
Materials and supplies | | | 230 | | | | 216 | |
| | | $ | 725 | | | $ | 646 | |
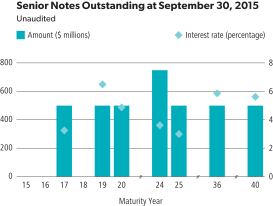
7. Long-Term Debt
On March 26, 2015, the company closed the issuance of $500 of 3.00 percent senior notes due April 1, 2025. The senior notes were issued under a US shelf registration statement. On September 30, 2015, the company fully repaid $500 of 3.75 percent senior notes at maturity.
8. Share Capital
Authorized
The company is authorized to issue an unlimited number of common shares without par value and an unlimited number of first preferred shares. The common shares are not redeemable or convertible. The first preferred shares may be issued in one or more series with rights and conditions to be determined by the Board of Directors. No first preferred shares have been issued.
Issued
| | | | | | | | |
| | | Number of
Common Shares | | | Consideration | |
Balance – December 31, 2014 | | | 830,242,574 | | | $ | 1,632 | |
Issued under option plans | | | 3,750,810 | | | | 56 | |
Issued for dividend reinvestment plan | | | 955,509 | | | | 32 | |
Balance – September 30, 2015 | | | 834,948,893 | | | $ | 1,720 | |
Dividends Declared
The company declared dividends per share of $0.38 (2014 – $0.35) during the three months ended September 30, 2015 and $1.14 (2014 – $1.05) during the nine months ended September 30, 2015.
| | |
| 9 | | PotashCorp 2015 Third Quarter Quarterly Report on Form 10-Q |
9. Share-Based Compensation
On May 12, 2015, the company’s shareholders approved the 2015 Performance Option Plan under which the company may, after February 20, 2015 and before January 1, 2016, grant options to acquire up to 3,500,000 common shares. Under the plan, the exercise price shall not be less than the quoted market closing price of the company’s common shares on the last trading day immediately preceding the date of the grant, and an option’s maximum term is 10 years. In general, options will vest, if at all, according to a schedule based on the three-year average excess of the company’s consolidated cash flow return on investment over weighted average cost of capital. As of September 30, 2015, options to purchase a total of 3,474,900 common shares had been granted under the plan. The weighted average fair value of options granted was $5.48 per share, estimated as of the date of grant using the Black-Scholes-Merton option-pricing model with the following weighted average assumptions:
| | | | |
Exercise price per option | | $ | 32.41 | |
Expected annual dividend per share | | $ | 1.52 | |
Expected volatility | | | 31% | |
Risk-free rate of return | | | 1.54% | |
Expected life of options | | | 5.5 years | |
10. Financial Instruments
Fair Value
Estimated fair values for financial instruments are designed to approximate amounts at which the instruments could be exchanged in a current arm’s-length transaction between knowledgeable, willing parties. The valuation policies and procedures for financial reporting purposes are determined by the company’s finance department.
Financial instruments included in the consolidated statements of financial position are measured either at fair value or amortized cost. The tables below explain the valuation methods used to determine the fair value of each financial instrument and its associated level in the fair value hierarchy.
| | |
| Financial Instruments Measured at Fair Value | | Fair Value Method |
| Cash and cash equivalents | | Assumed to approximate carrying value. |
| Available-for-sale investments | | Based on the closing bid price of the common shares (Level 1) as at the statements of financial position dates. |
| Foreign currency derivatives not traded in an active market | | Determined using quoted forward exchange rates (Level 2) as at the statements of financial position dates. |
| Natural gas swaps not traded in an active market | | Based on a discounted cash flow model. The inputs used in the model included contractual cash flows based on prices for natural gas futures contracts, fixed prices and notional volumes specified by the swap contracts, the time value of money, liquidity risk, the company’s own credit risk (related to instruments in a liability position) and counterparty credit risk (related to instruments in an asset position). Certain of the futures contract prices used as inputs in the model were supported by prices quoted in an active market (Level 2) and others were not based on observable market data (Level 3). For valuations that included both observable and unobservable data, if the unobservable input was determined to be significant to the overall inputs, the entire valuation was categorized in Level 3. |
| Natural gas futures | | Based on closing prices provided by the exchange (NYMEX) (Level 1) as at the statements of financial position dates. |
For natural gas swaps, the primary input into the valuation model was natural gas futures prices, which were based on delivery at the Henry Hub and were observable only for up to three years in the future. The unobservable futures price range as at September 30, 2015 was $2.95 to $4.08 per MMBtu (December 31, 2014 – $3.82 to $4.74 per MMBtu). A 10 percent increase in the unobservable natural gas futures prices that are not counterbalanced by offsetting derivative positions would result in a $7 (December 31, 2014 – $3) decrease in the fair value of the liability. A 10 percent decrease in the unobservable natural gas futures prices that are not counterbalanced by offsetting derivative positions would result in a $7 (December 31, 2014 – $3) increase in the fair value of the liability. Interest rates used to discount estimated cash flows as at September 30, 2015 were between 0.19 percent and 3.05 percent (December 31, 2014 – between 0.17 percent and 3.48 percent) depending on the settlement date.
| | |
| PotashCorp 2015 Third Quarter Quarterly Report on Form 10-Q | | 10 |
| | |
| Financial Instruments Measured at Amortized Cost | | Fair Value Method |
| Receivables, short-term debt and payables and accrued charges | | Assumed to approximate carrying value due to their short-term nature. |
| Long-term debt senior notes | | Quoted market prices (Level 1 or 2 depending on the market liquidity of the debt). |
| Other long-term debt instruments | | Assumed to approximate carrying value. |
Presented below is a comparison of the fair value of the company’s senior notes to their carrying values.
| | | | | | | | | | | | | | | | |
| | | September 30, 2015 | | | December 31, 2014 | |
| | | Carrying Amount of Liability | | | Fair Value of Liability | | | Carrying Amount of Liability | | | Fair Value of Liability | |
Long-term debt senior notes | | $ | 3,750 | | | $ | 3,942 | | | $ | 3,750 | | | $ | 4,182 | |
The following table presents the company’s fair value hierarchy for financial assets and financial liabilities carried at fair value on a recurring basis.
| | | | | | | | | | | | | | | | |
| | | | | | Fair Value Measurements as at Reporting Dates Using: | |
| | | Carrying Amount
of Asset
(Liability) | | | Quoted Prices in
Active Markets for
Identical Assets
(Level 1) (1) | | | Significant Other
Observable
Inputs (Level 2) (1,2) | | | Significant
Unobservable
Inputs (Level 3) (2) | |
September 30, 2015 | | | | | | | | | | | | | | | | |
Derivative instrument assets | | | | | | | | | | | | | | | | |
Natural gas derivatives | | $ | 9 | | | $ | – | | | $ | 1 | | | $ | 8 | |
Available-for-sale investments (3) | | | 1,139 | | | | 1,139 | | | | – | | | | – | |
Derivative instrument liabilities | | | | | | | | | | | | | | | | |
Natural gas derivatives | | | (199 | ) | | | – | | | | (150 | ) | | | (49 | ) |
Foreign currency derivatives | | | (1 | ) | | | – | | | | (1 | ) | | | – | |
December 31, 2014 | | | | | | | | | | | | | | | | |
Derivative instrument assets | | | | | | | | | | | | | | | | |
Natural gas derivatives | | $ | 7 | | | $ | – | | | $ | (13 | ) | | $ | 20 | |
Available-for-sale investments (3) | | | 1,527 | | | | 1,527 | | | | – | | | | – | |
Derivative instrument liabilities | | | | | | | | | | | | | | | | |
Natural gas derivatives | | | (193 | ) | | | (4 | ) | | | (58 | ) | | | (131 | ) |
Foreign currency derivatives | | | (2 | ) | | | – | | | | (2 | ) | | | – | |
| (1) | During the nine months ended September 30, 2015 and twelve months ended December 31, 2014, there were no transfers between Level 1 and Level 2. |
| (2) | During the nine months ended September 30, 2015, there were no transfers into Level 3 and $78 of losses was transferred out of Level 3 into Level 2 as (due to the passage of time) the terms of certain natural gas derivatives now matured in their entirety within 36 months. During the twelve months ended December 31, 2014, there were no transfers into Level 3 and $50 of losses was transferred out of Level 3 into Level 2 as (due to the passage of time) the terms of certain natural gas derivatives now matured in their entirety within 36 months. The company’s policy is to recognize transfers at the end of the reporting period. |
| (3) | Available-for-sale investments are comprised of shares in Israel Chemicals Ltd., Sinofert Holdings Limited and other. |
| | |
| 11 | | PotashCorp 2015 Third Quarter Quarterly Report on Form 10-Q |
The following table presents a reconciliation of the beginning and ending balances of the company’s fair value measurements using significant unobservable inputs (Level 3):
| | | | | | | | |
| | | Natural Gas Derivatives | |
| | | Nine Months Ended
September 30, 2015 | | | Twelve Months Ended
December 31, 2014 | |
Balance, beginning of period | | $ | (111 | ) | | $ | (141 | ) |
Total (losses) gains, realized and unrealized, before income taxes | | | | | | | | |
Included in net income, within cost of goods sold | | | (13 | ) | | | (19 | ) |
Included in other comprehensive income | | | (14 | ) | | | (30 | ) |
Purchases | | | – | | | | – | |
Sales | | | – | | | | – | |
Issues | | | – | | | | – | |
Settlements | | | 19 | | | | 29 | |
Transfers of losses out of Level 3 | | | 78 | | | | 50 | |
Balance, end of period | | $ | (41 | ) | | $ | (111 | ) |
Losses for the period included in net income, within cost of goods sold, were: | | | | | | | | |
Change in unrealized losses relating to instruments still held at the reporting date | | $ | – | | | $ | (1 | ) |
Total losses, realized and unrealized | | | (13 | ) | | | (19 | ) |
11. Seasonality
The company’s sales of fertilizer can be seasonal. Fertilizers are sold primarily for spring and fall application in both Northern and Southern Hemispheres. Typically, fertilizer sales are highest in the second quarter of the year, due to the North American spring planting season. However, planting conditions and the timing of customer purchases will vary each year and fertilizer sales can be expected to shift from one quarter to another. Feed and industrial sales are more evenly distributed throughout the year.
12. Contingencies and Other Matters
Canpotex
PCS is a shareholder in Canpotex Limited (“Canpotex”), a potash export, sales and marketing company owned in equal shares by the three potash producers in Saskatchewan, which markets Saskatchewan potash offshore. Should any operating losses or other liabilities be incurred by Canpotex, the shareholders have contractually agreed to reimburse it for such losses or liabilities in proportion to each shareholder’s productive capacity. Through September 30, 2015, there were no such operating losses or other liabilities.
Mining Risk
The risk of underground water inflows, as with other underground risks, is currently not insured.
Legal and Other Matters
The company is engaged in ongoing site assessment and/or remediation activities at a number of facilities and sites, and anticipated costs associated with these matters are added to accrued environmental costs in the manner previously described in Note 22 to the company’s 2014 annual consolidated financial statements. This includes matters related to investigation of potential brine migration at certain of the potash sites. The following environmental site assessment and/or remediation matters have uncertainties that may not be fully reflected in the amounts accrued for those matters:
Nitrogen and phosphate
| • | | The US Environmental Protection Agency (“USEPA”) has identified PCS Nitrogen, Inc. (“PCS Nitrogen”) as a potentially responsible party at the Planters Property or Columbia Nitrogen site in Charleston, South Carolina. PCS Nitrogen is subject to a final judgment by the US District Court for the District of South Carolina allocating 30 percent of the liability for response costs at the site to PCS Nitrogen, as well as a proportional share of any costs that cannot be recovered from another responsible party. In December 2013, the USEPA issued an order to PCS Nitrogen and four other respondents requiring them jointly and severally to conduct certain cleanup work at the site and reimburse the USEPA’s costs for overseeing that work. PCS Nitrogen is currently performing the work required by the USEPA order. The USEPA also has requested reimbursement of $4 of previously incurred response costs. The ultimate amount of liability for PCS Nitrogen depends upon the final outcome of litigation to impose liability on additional parties, the amount needed for remedial activities, the ability of other parties to pay and the availability of insurance. |
| • | | PCS Phosphate Company, Inc (“PCS Phosphate”) has agreed to participate, on a non-joint and several basis, with parties to an Administrative Settlement Agreement with the USEPA (“Settling Parties”) in a removal action and the payment of certain other costs associated with PCB soil contamination at the Ward Transformer Superfund Site in Raleigh, North Carolina (“Site”), including reimbursement of past USEPA costs. The removal activities commenced in August 2007 and are believed to be nearly complete. In September 2013, PCS Phosphate and other parties entered into an Administrative Order on Consent with the USEPA, pursuant to which a supplemental remedial investigation and focused feasibility study will be performed on the portion of the Site that was subject to the removal action. The completed and anticipated work on the Site is estimated to cost a total of $80. PCS Phosphate is a party to ongoing Comprehensive Environmental Response, Compensation and Liability Act (“CERCLA”) contribution and cost-recovery litigation for the recovery of costs of the removal activities. The USEPA |
| | |
| PotashCorp 2015 Third Quarter Quarterly Report on Form 10-Q | | 12 |
| | | has also issued an order to a number of entities requiring remediation downstream of the area subject to the removal action (“Operable Unit 1”). PCS Phosphate did not receive this order. At this time, the company is unable to evaluate the extent of any exposure that it may have for the matters addressed in the CERCLA litigation or for Operable Unit 1. |
| • | | In 1996, PCS Nitrogen Fertilizer, L.P. (“PCS Nitrogen Fertilizer”), then known as Arcadian Fertilizer, L.P., entered into a Consent Order (the “Order”) with the Georgia Environmental Protection Division (“GEPD”) in conjunction with PCS Nitrogen Fertilizer’s acquisition of real property in Augusta, Georgia. Under the Order, PCS Nitrogen Fertilizer is required to perform certain activities to investigate and, if necessary, implement corrective measures for substances in soil and groundwater. The investigation has proceeded and the results have been presented to GEPD. Two interim corrective measures for substances in groundwater have been proposed by PCS Nitrogen Fertilizer and approved by GEPD. PCS Nitrogen Fertilizer is implementing the approved interim corrective measures, which may be modified by PCS Nitrogen Fertilizer from time to time, but it is unable to estimate with reasonable certainty the total cost of its corrective action obligations under the Order at this time. |
Based on current information and except for the uncertainties described in the preceding paragraphs, the company does not believe that its future obligations with respect to these facilities and sites are reasonably likely to have a material adverse effect on its consolidated financial statements.
Other legal matters with significant uncertainties include the following:
Nitrogen and phosphate
| • | | The USEPA has an ongoing initiative to evaluate implementation within the phosphate industry of a particular exemption for mineral processing wastes under the hazardous waste program. In connection with this industry-wide initiative, the USEPA conducted inspections at numerous phosphate operations and notified the company of alleged violations of the US Resource Conservation and Recovery Act (“RCRA”) at its plants in Aurora, North Carolina; Geismar, Louisiana; and White Springs, Florida; and one alleged Clean Air Act (“CAA”) violation at its Geismar, Louisiana plant (which was separately addressed in a consent decree with the USEPA that was terminated by the US District Court for the Eastern District of Louisiana in October 2015 as having been resolved). The company has entered into RCRA 3013 Administrative Orders on Consent and has performed certain site assessment activities at all of these plants. At this time, the company does not know the scope of action, if any, that may be required. As to the alleged RCRA violations, the company continues to participate in settlement discussions with the USEPA but is uncertain if any resolution will be possible without litigation, or, if litigation occurs, what the outcome would be. |
| • | | The USEPA has pursued an initiative to evaluate compliance with the CAA at sulfuric acid and nitric acid plants. In connection with this industry-wide initiative, the company, without admitting liability, reached a global settlement with the USEPA |
| | | in September 2014, which covers the sulfuric acid plants at the Aurora, North Carolina; Geismar, Louisiana; and White Springs, Florida facilities. The consent decree to implement the settlement became effective in February 2015. The total estimated costs for complying with the consent decree are expected to be at least $51 over a compliance period that extends into 2020. |
General
| • | | The scope or timing of any final, effective requirements to control the company’s greenhouse gas emissions in the US or Canada is uncertain. Canada has withdrawn from participation in the Kyoto Protocol, and the Canadian government has announced its intention to coordinate greenhouse gas policies with the US. Although the US Congress has not passed any greenhouse gas emission control laws, the USEPA has adopted several rules to control such emissions using authority under existing environmental laws. Some Canadian provinces and US states are considering the adoption of greenhouse gas emission control requirements. In Saskatchewan, provincial regulations pursuant to the Management and Reduction of Greenhouse Gases Act, which impose a type of carbon tax to achieve a goal of a 20 percent reduction in greenhouse gas emissions by 2020, compared to 2006 levels, may become effective in 2016. None of these regulations has resulted in material limitations on greenhouse gas emissions at the company’s facilities. The company is monitoring these developments and their future effect on its operations cannot be determined with certainty at this time. |
| • | | In August 2015, the USEPA finalized hazardous air pollutant emission standards for phosphoric acid manufacturing and phosphate fertilizer production (“Final Rule”) based on the proposal discussed in our Annual Report onForm 10-K for the year ended December 31, 2014. Although the Final Rule includes a number of changes to the current standard, it does not include a requirement to install controls for mercury emissions on some production equipment at the Aurora, North Carolina facility. Nonetheless, the Final Rule includes certain new requirements for monitoring and emissions that are infeasible for the company to satisfy in a timely manner. As a result in October 2015, the company filed a petition for reconsideration of certain aspects of the Final Rule with the USEPA and a petition for review of the Final Rule with the U.S. Court of Appeals for the District of Columbia Circuit. |
In addition, various other claims and lawsuits are pending against the company in the ordinary course of business. While it is not possible to determine the ultimate outcome of such actions at this time, and inherent uncertainties exist in predicting such outcomes, it is the company’s belief that the ultimate resolution of such actions is not reasonably likely to have a material adverse effect on its consolidated financial statements.
The breadth of the company’s operations and the global complexity of tax regulations require assessments of uncertainties and judgments in estimating the taxes it will ultimately pay. The final taxes paid are dependent upon many factors, including negotiations with taxing authorities in various jurisdictions, outcomes of tax litigation and resolution of disputes arising from federal, provincial,
| | |
| 13 | | PotashCorp 2015 Third Quarter Quarterly Report on Form 10-Q |
state and local tax audits. The resolution of these uncertainties and the associated final taxes may result in adjustments to the company’s tax assets and tax liabilities.
The company owns facilities that have been either permanently or indefinitely shut down. It expects to incur nominal annual expenditures for site security and other maintenance costs at certain of these facilities. Should the facilities be dismantled, certain other shutdown-related costs may be incurred. Such costs are not expected to have a material adverse effect on the company’s consolidated financial position or results of operations and would be recognized and recorded in the period in which they are incurred.
13. Related Party Transactions
The company sells potash from its Saskatchewan mines for use outside Canada and the US exclusively to Canpotex. Sales are at prevailing market prices and are settled on normal trade terms. Sales to Canpotex for the three months ended September 30, 2015 were $316 (2014 – $268) and the nine months ended September 30, 2015 were $1,084 (2014 – $859). At September 30, 2015, $159 (December 31, 2014 – $216) was owing from Canpotex.
| | |
| PotashCorp 2015 Third Quarter Quarterly Report on Form 10-Q | | 14 |
Item 2. Management’s Discussion and Analysis of Financial Condition and Results of Operations
The following discussion and analysis is the responsibility of management and is as of November 3, 2015. The Board of Directors carries out its responsibility for review of this disclosure principally through its audit committee, comprised exclusively of independent directors. The audit committee reviews and, prior to its publication, approves this disclosure, pursuant to the authority delegated to it by the Board of Directors. The term “PCS” refers to Potash Corporation of Saskatchewan Inc. and the terms “we,” “us,” “our,” “PotashCorp” and “the company” refer to PCS and, as applicable, PCS and its direct and indirect subsidiaries as a group. Additional information relating to PotashCorp (which, except as otherwise noted, is not incorporated by reference herein), including our Annual Report on Form 10-K for the year ended December 31, 2014 (2014 Form 10-K), can be found on SEDAR at www.sedar.com and on EDGAR at www.sec.gov. The company is a foreign private issuer under the rules and regulations of the US Securities and Exchange Commission (the SEC); however, it currently files voluntarily on the SEC’s domestic forms.
PotashCorp and Our Business Environment
PotashCorp is an integrated producer of fertilizer, industrial and animal feed products. We are the world’s largest fertilizer company by capacity, producing the three primary crop nutrients: potash (K), nitrogen (N) and phosphate (P). As the world’s largest potash producer by capacity, we are responsible for nearly one-fifth of global capacity through our Canadian operations. To enhance our global footprint, we have investments in four potash-related businesses in South America, the Middle East and Asia. We complement our potash assets with focused positions in nitrogen and phosphate.
A detailed description of our markets and customers can be found on pages 45 and 46 (potash), 55 and 56 (nitrogen) and 63 and 64 (phosphate) in our 2014 Annual Integrated Report (2014 AIR).
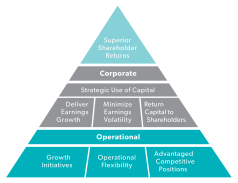
How We Create Value
Our Value Model, depicted below and outlined in further detail on pages 16 and 17 in our 2014 AIR, informs the goals and strategies we put in place to create value for all stakeholders.

We believe strong financial performance is the cornerstone of PotashCorp’s value creation. It rewards our shareholders while allowing us to fulfill our broader social and environmental responsibilities.
While we continually evolve our strategies to best position the company for long-term success, the key elements – as depicted below and described in further detail on pages 18 and 19 in our 2014 AIR – remain relevant.
| | |
| 15 | | PotashCorp 2015 Third Quarter Quarterly Report on Form 10-Q |
How We Approach Risk
In our 2014 AIR, we provide an overview of our approach to risk (page 21), explain how we use a risk management ranking methodology to assess the key risks specific to our company (page 22) and describe each key risk and our risk management approach (pages 23 to 25). Our business is subject to constant and significant change that can result in changes to our key risks.
No additional key risks were identified or removed during the third quarter and first nine months of 2015 compared to those outlined in our 2014 AIR. The following tables outline our risk ranking matrix and continuing key risks as of December 31, 2014 and September 30, 2015.
| | | | | | | | | | | | |
Risk Ranking Matrix1 | | Severity of Consequence |
| | Negligible | | Low | | Medium | | Major | | Extreme |

| | Probable | | C | | B | | B | | A | | A |
| | High | | D | | C | | B | | B | | A |
| | Medium | | D | | D | | C | | B | | B |
| | Low | | E | | D | | D | | C | | B |
| | Remote | | E | | E | | D | | D | | C |
1 Refer to page 22 in our 2014 AIR for further detail | | |
| | | | | | | | | | | | | | | | | | | | |
| Key Risks | | Residual Risk Level Sept 30/15 | | Residual Risk Level Dec 31/14 | | Status | | Link to Business Strategies1 | | | | Key Risks | | Residual Risk Level Sept 30/15 | | Residual Risk Level Dec 31/14 | | Status | | Link to Business Strategies1 |
| Global potash demand | | B | | B | | 

| |  | | | | Product transportation mishaps | | C | | C | | | |  |
| Competitive potash supply | | B | | B | |
| | | | | | Sustaining growth opportunities | | C | | C | | | |  |
| Offshore potash sales and distribution | | B | | B | | | | | | | | Transportation and distribution infrastructure | | C | | C | |
| | |
| Potash operating capability | | C | | C | |
| |  | | | | Trinidad natural gas supply | | C | | C | |
| | |
| Safety, health, environmental and security | | C | | C | |
| | | | | | Cyber security | | C | | C | |
| | |
International operations | | C | | C | | 2 | | 
| | | | No change to risk  Increased risk Increased risk
 Decreased risk Decreased risk
Risk has materialized in part in the current or previous periods |
| 1 | Darker sections of the triangle indicate the specific strategy (described in the triangle on page 15 of this 10-Q) impacted by the described risk in the table above. Faded sections of the triangle mean the specific strategy is not significantly impacted by the described risk. |
| 2 | While the relative residual ranking of this risk has not changed since December 31, 2014, consistent with the first half of 2015 we believe the risk level is trending higher due to external factors affecting the business and operating environment in the foreign jurisdictions in which we have equity investments. This risk is further described on page 20 of our 2014 Form 10-K. |
| | |
| PotashCorp 2015 Third Quarter Quarterly Report on Form 10-Q | | 16 |
Key Performance Drivers – Performance Compared to Targets
Through our integrated value model, we set, evaluate and refine our goals and priorities to drive improvements that benefit all those impacted by our business. We demonstrate our accountability by tracking and reporting our progress against targets related to each goal. Our long-term goals and 2015 targets are set out on pages 36 to 41 of our 2014 AIR. A summary of our progress towards selected goals and representative annual targets is set out below.
| | | | |
| Goal | | Representative 2015 Annual Target | | Performance to September 30, 2015 |
| Create superior long-term shareholder value. | | Exceed total shareholder return performance for our sector and the DAXglobal Agribusiness Index. | | PotashCorp’s total shareholder return was -40 percent in the first nine months of 2015 compared to our sector’s weighted average return (based on market capitalization) of 3 percent and the DAXglobal Agribusiness Index weighted average return (based on market capitalization) of -16 percent. |
| Attract, retain, develop and engage employees to achieve our long-term goals. | | Fill 75 percent of senior staff openings with qualified internal candidates. | | The percentage of senior staff positions filled internally in the first nine months of 2015 was 75 percent. |
| Achieve no harm to people. | | Achieve zero life-altering injuries at our sites. | | Sadly, a workplace accident resulted in the loss of an employee at our White Springs phosphate operation during the first quarter of 2015. |
| | | Reduce total site recordable injury rate to 0.95 (or lower) and total lost-time injury rate to 0.10 (or lower). | | During the first nine months of 2015, total site recordable injury rate was 1.02 and total lost-time injury rate was 0.09. |
| Achieve no damage to the environment. | | By 2018, reduce total reportable incidents (releases, permit excursions and spills) by 40 percent from 2014 levels. | | Annualized total reportable incidents were down 11 percent during the first nine months of 2015 compared to 2014 annual levels. Compared to the first nine months of 2014, total reportable incidents were down 16 percent. |
Performance Overview
This discussion and analysis are based on the company’s unaudited interim condensed consolidated financial statements included in Item 1 of this Quarterly Report on Form 10-Q (financial statements in this Form 10-Q) based on International Financial Reporting Standards as issued by the International Accounting Standards Board (IFRS), unless otherwise stated. All references to per-share amounts pertain to diluted net income per share.
For an understanding of trends, events, uncertainties and the effect of critical accounting estimates on our results and financial condition, this Form 10-Q should be read carefully, together with our 2014 AIR.
Earnings Guidance – Third Quarter 2015
| | | | | | |
| | | Company Guidance | | Actual Results | |
Earnings per share | | $0.35 – $0.45 | | $ | 0.34 | |
Overview of Actual Results
| | | | | | | | | | | | | | | | | | | | | | | | | | | | | | | | |
| | | Three Months Ended September 30 | | | Nine Months Ended September 30 | |
| Dollars (millions), except per-share amounts | | 2015 | | | 2014 | | | Change | | | % Change | | | 2015 | | | 2014 | | | Change | | | % Change | |
Sales | | $ | 1,529 | | | $ | 1,641 | | | $ | (112 | ) | | | (7 | ) | | $ | 4,925 | | | $ | 5,213 | | | $ | (288 | ) | | | (6 | ) |
Gross margin | | | 505 | | | | 589 | | | | (84 | ) | | | (14 | ) | | | 1,883 | | | | 1,901 | | | | (18 | ) | | | (1 | ) |
Operating income | | | 421 | | | | 520 | | | | (99 | ) | | | (19 | ) | | | 1,599 | | | | 1,737 | | | | (138 | ) | | | (8 | ) |
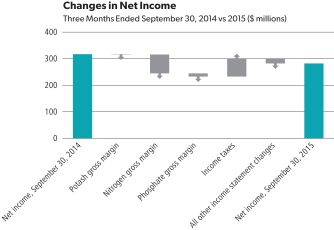
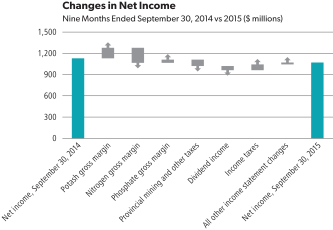
Net income | | | 282 | | | | 317 | | | | (35 | ) | | | (11 | ) | | | 1,069 | | | | 1,129 | | | | (60 | ) | | | (5 | ) |
Net income per share – diluted | | | 0.34 | | | | 0.38 | | | | (0.04 | ) | | | (11 | ) | | | 1.28 | | | | 1.33 | | | | (0.05 | ) | | | (4 | ) |
Other comprehensive loss | | | (461 | ) | | | (229 | ) | | | (232 | ) | | | 101 | | | | (401 | ) | | | (178 | ) | | | (223 | ) | | | 125 | |
| | |
| 17 | | PotashCorp 2015 Third Quarter Quarterly Report on Form 10-Q |
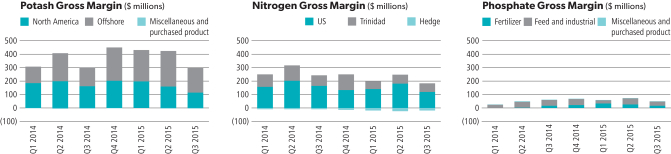
Earnings in the third quarter of 2015 were lower than the same period in 2014 primarily due to lower nitrogen gross margin partially offset by lower income taxes.
Year over year earnings were lower than the same period in 2014. Higher potash and phosphate gross margins combined with lower income taxes were more than offset by lower nitrogen gross margin, increased provincial mining and other taxes and lower dividend income from our investment in Israel Chemicals Ltd. (ICL) in 2015 (a special dividend was received in 2014).
Global potash demand remained strong during the quarter as higher volumes to Brazil, India and China helped offset slower purchasing in other markets. With many buyers moving cautiously amidst economic headwinds and significant currency volatility, prices declined in most key potash markets.
In nitrogen, prices for nearly all products were lower compared to third-quarter 2014 as market fundamentals weakened.
Rising global supply due in part to lower energy prices — combined with weaker shipments to Latin America — largely overshadowed strong demand from India compared to 2014.
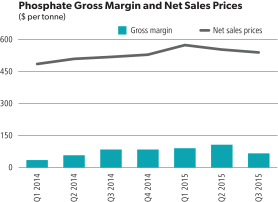
In phosphate, markets for solid fertilizer remained relatively stable. Increased Chinese exports and weaker demand in Latin America more than offset stronger Indian demand and resulted in relatively flat pricing. Other phosphate products were supported by strong demand in North America and India, driving prices for liquid fertilizers, feed and industrial products above those of 2014’s third quarter.
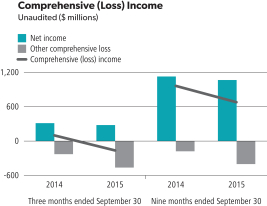
Other comprehensive loss for the third quarter of 2015 mainly resulted from a decrease in the fair value of our investments in ICL and Sinofert Holdings Limited (Sinofert). Other comprehensive loss for the first nine months of 2015 mainly resulted from a decrease in the fair value of our investment in ICL. Other comprehensive loss for the third quarter and first nine months of 2014 mainly resulted from a decrease in the fair value of our investment in ICL.
| | |
| PotashCorp 2015 Third Quarter Quarterly Report on Form 10-Q | | 18 |
Operating Segment Review
We report our results (including gross margin) in three business segments: potash, nitrogen and phosphate as described in Note 2 to the financial statements in this Form 10-Q. Our reporting structure reflects how we manage our business and how we classify our operations for planning and measuring performance. We include net sales in segment disclosures in the financial statements in this Form 10-Q pursuant to IFRS, which require segmentation based upon our internal organization and reporting of revenue and profit measures. As a component of gross margin, net sales (and the related per-tonne amounts) are the primary revenue measures we use and review in making decisions about operating matters on a business segment basis. These decisions include assessments about potash, nitrogen and phosphate performance and the resources to be allocated to these segments. We also use net sales (and the related per-tonne amounts) for business planning and monthly forecasting. Net sales are calculated as sales revenues less freight, transportation and distribution expenses. Realized prices refer to net sales prices.
Our discussion of segment operating performance is set out below and includes nutrient product and/or market performance results, where applicable, to give further insight into these results.
Potash Performance
Financial Performance
| | | | | | | | | | | | | | | | | | | | | | | | | | | | | | | | | | | | |
| | | Three Months Ended September 30 | |
| | | Dollars (millions) | | | Tonnes (thousands) | | | Average per Tonne (1) | |
| | | 2015 | | | 2014 | | | % Change | | | 2015 | | | 2014 | | | % Change | | | 2015 | | | 2014 | | | % Change | |
Manufactured product | | | | | | | | | | | | | | | | | | | | | | | | | | | | | | | | | | | | |
Net sales | | | | | | | | | | | | | | | | | | | | | | | | | | | | | | | | | | | | |
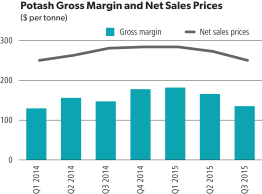
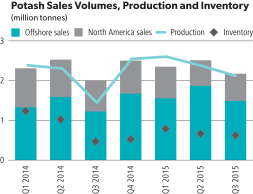
North America | | $ | 194 | | | $ | 272 | | | | (29 | ) | | | 684 | | | | 789 | | | | (13 | ) | | $ | 283 | | | $ | 344 | | | | (18 | ) |
Offshore | | | 351 | | | | 293 | | | | 20 | | | | 1,491 | | | | 1,221 | | | | 22 | | | $ | 235 | | | $ | 240 | | | �� | (2 | ) |
| | | 545 | | | | 565 | | | | (4 | ) | | | 2,175 | | | | 2,010 | | | | 8 | | | $ | 250 | | | $ | 281 | | | | (11 | ) |
Cost of goods sold | | | (246 | ) | | | (264 | ) | | | (7 | ) | | | | | | | | | | | | | | $ | (113 | ) | | $ | (131 | ) | | | (14 | ) |
Gross margin | | | 299 | | | | 301 | | | | (1 | ) | | | | | | | | | | | | | | $ | 137 | | | $ | 150 | | | | (9 | ) |
Other miscellaneous and purchased product gross margin (2) | | | (5 | ) | | | (6 | ) | | | (17 | ) | | | | | | | | | | | | | | | | | | | | | | | | |
Gross Margin | | $ | 294 | | | $ | 295 | | | | – | | | | | | | | | | | | | | | $ | 135 | | | $ | 147 | | | | (8 | ) |
| (1) | Rounding differences may occur due to the use of whole dollars in per-tonne calculations. |
| (2) | Comprised of net sales of $3 million (2014 — $4 million) less cost of goods sold of $8 million (2014 — $10 million). |
| | |
| 19 | | PotashCorp 2015 Third Quarter Quarterly Report on Form 10-Q |
| | | | | | | | | | | | | | | | | | | | | | | | | | | | | | | | | | | | |
| | | Nine Months Ended September 30 | |
| | | Dollars (millions) | | | Tonnes (thousands) | | | Average per Tonne (1) | |
| | | 2015 | | | 2014 | | | % Change | | | 2015 | | | 2014 | | | % Change | | | 2015 | | | 2014 | | | % Change | |
Manufactured product | | | | | | | | | | | | | | | | | | | | | | | | | | | | | | | | | | | | |
Net sales | | | | | | | | | | | | | | | | | | | | | | | | | | | | | | | | | | | | |
North America | | $ | 700 | | | $ | 866 | | | | (19 | ) | | | 2,132 | | | | 2,720 | | | | (22 | ) | | $ | 328 | | | $ | 318 | | | | 3 | |
Offshore | | | 1,199 | | | | 942 | | | | 27 | | | | 4,904 | | | | 4,126 | | | | 19 | | | $ | 244 | | | $ | 228 | | | | 7 | |
| | | 1,899 | | | | 1,808 | | | | 5 | | | | 7,036 | | | | 6,846 | | | | 3 | | | $ | 270 | | | $ | 264 | | | | 2 | |
Cost of goods sold | | | (748 | ) | | | (799 | ) | | | (6 | ) | | | | | | | | | | | | | | $ | (106 | ) | | $ | (117 | ) | | | (9 | ) |
Gross margin | | | 1,151 | | | | 1,009 | | | | 14 | | | | | | | | | | | | | | | $ | 164 | | | $ | 147 | | | | 12 | |
Other miscellaneous and purchased product gross margin (2) | | | (12 | ) | | | (19 | ) | | | (37 | ) | | | | | | | | | | | | | | | | | | | | | | | | |
Gross Margin | | $ | 1,139 | | | $ | 990 | | | | 15 | | | | | | | | | | | | | | | $ | 162 | | | $ | 145 | | | | 12 | |
| (1) | Rounding differences may occur due to the use of whole dollars in per-tonne calculations. |
| (2) | Comprised of net sales of $12 million (2014 — $14 million) less cost of goods sold of $24 million (2014 — $33 million). |
Potash gross margin variance was attributable to:
| | | | | | | | | | | | | | | | | | | | | | | | | | | | | | | | |
| | | Three Months Ended September 30
2015 vs 2014 | | | Nine Months Ended September 30
2015 vs 2014 | |
| | | | | | Change in
Prices/Costs | | | | | | | | | Change in
Prices/Costs | | | | |
| Dollars (millions) | | Change in Sales Volumes | | | Net Sales | | | Cost of Goods Sold | | | Total | | | Change in Sales Volumes | | | Net Sales | | | Cost of Goods Sold | | | Total | |
Manufactured product | | | | | | | | | | | | | | | | | | | | | | | | | | | | | | | | |
North America | | $ | (30 | ) | | $ | (39 | ) | | $ | 23 | | | $ | (46 | ) | | $ | (141 | ) | | $ | 21 | | | $ | 49 | | | $ | (71 | ) |
Offshore | | | 45 | | | | (7 | ) | | | 6 | | | | 44 | | | | 120 | | | | 79 | | | | 14 | | | | 213 | |
Change in market mix | | | 15 | | | | (17 | ) | | | 2 | | | | – | | | | 57 | | | | (59 | ) | | | 2 | | | | – | |
Total manufactured product | | $ | 30 | | | $ | (63 | ) | | $ | 31 | | | | (2 | ) | | $ | 36 | | | $ | 41 | | | $ | 65 | | | | 142 | |
Other miscellaneous and purchased product | | | | | | | | | | | | | | | 1 | | | | | | | | | | | | | | | | 7 | |
Total | | | | | | | | | | | | | | $ | (1 | ) | | | | | | | | | | | | | | $ | 149 | |
Sales to major offshore markets were as follows:
| | | | | | | | | | | | | | | | | | | | | | | | | | | | | | | | | | | | | | | | | | | | | | | | |
| | | Three Months Ended September 30 | | | Nine Months Ended September 30 | |
| | | By Canpotex (1) | | | From New Brunswick | | | By Canpotex (1) | | | From New Brunswick | |
| | | Percentage of
Sales Volumes | | | | | | Percentage of
Sales Volumes | | | | | | Percentage of
Sales Volumes | | | | | | Percentage of
Sales Volumes | | | | |
| | | 2015 | | | 2014 | | | % Change | | | 2015 | | | 2014 | | | % Change | | | 2015 | | | 2014 | | | % Change | | | 2015 | | | 2014 | | | % Change | |
Other Asian markets (2) | | | 29 | | | | 38 | | | | (24 | ) | | | – | | | | – | | | | – | | | | 35 | | | | 42 | | | | (17 | ) | | | – | | | | – | | | | – | |
Latin America | | | 40 | | | | 32 | | | | 25 | | | | 100 | | | | 100 | | | | – | | | | 33 | | | | 29 | | | | 14 | | | | 100 | | | | 100 | | | | – | |
China | | | 11 | | | | 9 | | | | 22 | | | | – | | | | – | | | | – | | | | 15 | | | | 13 | | | | 15 | | | | – | | | | – | | | | – | |
India | | | 15 | | | | 14 | | | | 7 | | | | – | | | | – | | | | – | | | | 11 | | | | 9 | | | | 22 | | | | – | | | | – | | | | – | |
Other markets | | | 5 | | | | 7 | | | | (29 | ) | | | – | | | | – | | | | – | | | | 6 | | | | 7 | | | | (14 | ) | | | – | | | | – | | | | – | |
| | | | 100 | | | | 100 | | | | | | | | 100 | | | | 100 | | | | | | | | 100 | | | | 100 | | | | | | | | 100 | | | | 100 | | | | | |
| (1) | Canpotex Limited (Canpotex). |
| (2) | All Asian markets except China and India. |
| | |
| PotashCorp 2015 Third Quarter Quarterly Report on Form 10-Q | | 20 |
The most significant contributors to the change in total gross margin were as follows (direction of arrows refers to impact on gross margin):
| | | | |
| | | Quarter over Quarter | | Year over Year |
| Net Sales Prices | | i Our average realized price was down due to declining prices in North America and a higher percentage of sales volumes to lower-netback offshore markets. | | h Realized prices in the first half of 2015, which benefitted from a recovery throughout 2014 driven by higher consumption, were partially offset by lower prices in the third quarter of 2015 due to a weak macroeconomic environment. |
| Sales Volumes | | h Offshore sales were up due to higher Canpotex contract volumes to China and India and strong Brazilian demand. | | i North American sales volumes declined due to lower fertilizer demand and higher offshore imports. h Shipments to offshore markets rose due to strong demand in 2015, increased Canpotex shipments to China, India and Latin America and rail constraints in the first half of 2014 not recurring in 2015. Further, sales volumes were constrained by limited product availability in the third quarter of 2014. |
| Cost of Goods Sold | | h The Canadian dollar weakened relative to the US dollar, reducing cost of goods sold. h Maintenance costs were lower at Rocanville, Lanigan and New Brunswick in 2015 as annual maintenance was deferred to the fourth quarter to accommodate increased production demand. i Costs were higher at New Brunswick in 2015 due to lower ore grade as initial mining begins at our Picadilly site. |
Year over year the change in market mix produced a favorable variance of $57 million related to sales volumes and an unfavorable variance of $59 million in sales prices due to more lower-priced standard product being sold to the offshore market and less higher-priced granular sales to North America in 2015.
Non-Financial Performance
| | | | | | | | | | | | | | | | | | | | | | | | | | |
| | | | | Three Months Ended September 30 | | | Nine Months Ended September 30 | |
| | | | | 2015 | | | 2014 | | | % Change | | | 2015 | | | 2014 | | | % Change | |
Production | | KCl tonnes produced (thousands) | | | 2,131 | | | | 1,453 | | | | 47 | | | | 7,130 | | | | 6,169 | | | | 16 | |
Safety | | Life-altering injuries | | | – | | | | – | | | | – | | | | – | | | | 1 | | | | (100 | ) |
| | Total site recordable injury rate | | | 2.26 | | | | 2.53 | | | | (11 | ) | | | 1.82 | | | | 1.96 | | | | (7 | ) |
| | Total lost-time injury rate | | | – | | | | 0.21 | | | | (100 | ) | | | 0.10 | | | | 0.18 | | | | (44 | ) |
Employee | | Percentage of senior staff positions filled internally | | | 100% | | | | 100% | | | | – | | | | 83% | | | | 100% | | | | (17 | ) |
Environmental | | Environmental incidents | | | 2 | | | | 3 | | | | (33 | ) | | | 4 | | | | 12 | | | | (67 | ) |
| | | Waste (million tonnes) | | | 4.6 | | | | 3.6 | | | | 28 | | | | 15.2 | | | | 12.9 | | | | 18 | |
| | |
| 21 | | PotashCorp 2015 Third Quarter Quarterly Report on Form 10-Q |
The most significant contributors to the changes in non-financial results were as follows:
| | | | |
| | | Quarter over Quarter | | Year over Year |
Production | | Potash production was up due to higher offshore demand. |
Safety | | There were no lost-time injuries in 2015 compared to two in 2014. | | There were three lost-time injuries in 2015 compared to five in 2014. Combined with more hours worked in 2015, the total lost-time injury rate declined. |
Employee | | New collective bargaining agreements at our Allan, Cory and Patience Lake sites were signed in October 2015 and extend to 2019. |
Environmental | | In the third quarter of 2015, we had two environmental incidents related to brine spills. Environmental incidents for the third quarter of 2014 included brine spills and a glycol surface leak. Waste, as defined in our 2014 AIR, increased due to increased mining activity. | | In 2015, environmental incidents included brine spills and a minor propane gas release. In 2014, environmental incidents primarily included brine and slurry pipeline failures resulting in brine spills. Waste increased due to increased mining activity. |
Nitrogen Performance
Financial Performance
| | | | | | | | | | | | | | | | | | | | | | | | | | | | | | | | | | | | |
| | | Three Months Ended September 30 | |
| | | Dollars (millions) | | | Tonnes (thousands) | | | Average per Tonne (1) | |
| | | 2015 | | | 2014 | | | % Change | | | 2015 | | | 2014 | | | % Change | | | 2015 | | | 2014 | | | % Change | |
Manufactured product (2) | | | | | | | | | | | | | | | | | | | | | | | | | | | | | | | | | | | | |
Net sales | | | | | | | | | | | | | | | | | | | | | | | | | | | | | | | | | | | | |
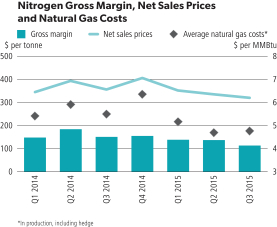
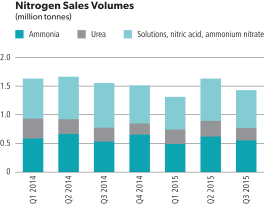
Ammonia | | $ | 240 | | | $ | 269 | | | | (11 | ) | | | 551 | | | | 528 | | | | 4 | | | $ | 434 | | | $ | 509 | | | | (15 | ) |
Urea | | | 76 | | | | 100 | | | | (24 | ) | | | 216 | | | | 248 | | | | (13 | ) | | $ | 352 | | | $ | 402 | | | | (12 | ) |
Solutions, nitric acid, ammonium nitrate | | | 140 | | | | 182 | | | | (23 | ) | | | 659 | | | | 773 | | | | (15 | ) | | $ | 212 | | | $ | 236 | | | | (10 | ) |
| | | 456 | | | | 551 | | | | (17 | ) | | | 1,426 | | | | 1,549 | | | | (8 | ) | | $ | 319 | | | $ | 356 | | | | (10 | ) |
Cost of goods sold | | | (299 | ) | | | (322 | ) | | | (7 | ) | | | | | | | | | | | | | | $ | (210 | ) | | $ | (209 | ) | | | – | |
Gross margin | | | 157 | | | | 229 | | | | (31 | ) | | | | | | | | | | | | | | $ | 109 | | | $ | 147 | | | | (26 | ) |
Other miscellaneous and purchased product gross margin (3) | | | 4 | | | | 4 | | | | – | | | | | | | | | | | | | | | | | | | | | | | | | |
Gross Margin | | $ | 161 | | | $ | 233 | | | | (31 | ) | | | | | | | | | | | | | | $ | 113 | | | $ | 150 | | | | (25 | ) |
| (1) | Rounding differences may occur due to the use of whole dollars in per-tonne calculations. |
| (2) | Includes inter-segment ammonia sales, comprised of: net sales $25 million, cost of goods sold $9 million and 43,000 sales tonnes (2014 — net sales $25 million, cost of goods sold $10 million and 41,000 sales tonnes). Inter-segment profits are eliminated on consolidation. |
| (3) | Comprised of third-party and inter-segment sales, including: third-party net sales $6 million less cost of goods sold $2 million (2014 — net sales $6 million less cost of goods sold $2 million) and inter-segment net sales $NIL less cost of goods sold $NIL (2014 — net sales $NIL less cost of goods sold $NIL). Inter-segment profits are eliminated on consolidation. |
| | | | | | | | | | | | | | | | | | | | | | | | | | | | | | | | | | | | |
| | | Nine Months Ended September 30 | |
| | | Dollars (millions) | | | Tonnes (thousands) | | | Average per Tonne (1) | |
| | | 2015 | | | 2014 | | | % Change | | | 2015 | | | 2014 | | | % Change | | | 2015 | | | 2014 | | | % Change | |
Manufactured product (2) | | | | | | | | | | | | | | | | | | | | | | | | | | | | | | | | | | | | |
Net sales | | | | | | | | | | | | | | | | | | | | | | | | | | | | | | | | | | | | |
Ammonia | | $ | 753 | | | $ | 875 | | | | (14 | ) | | | 1,661 | | | | 1,776 | | | | (6 | ) | | $ | 453 | | | $ | 493 | | | | (8 | ) |
Urea | | | 271 | | | | 364 | | | | (26 | ) | | | 740 | | | | 854 | | | | (13 | ) | | $ | 366 | | | $ | 426 | | | | (14 | ) |
Solutions, nitric acid, ammonium nitrate | | | 435 | | | | 526 | | | | (17 | ) | | | 1,966 | | | | 2,211 | | | | (11 | ) | | $ | 221 | | | $ | 238 | | | | (7 | ) |
| | | 1,459 | | | | 1,765 | | | | (17 | ) | | | 4,367 | | | | 4,841 | | | | (10 | ) | | $ | 334 | | | $ | 365 | | | | (8 | ) |
Cost of goods sold | | | (908 | ) | | | (1,001 | ) | | | (9 | ) | | | | | | | | | | | | | | $ | (208 | ) | | $ | (207 | ) | | | – | |
Gross margin | | | 551 | | | | 764 | | | | (28 | ) | | | | | | | | | | | | | | $ | 126 | | | $ | 158 | | | | (20 | ) |
Other miscellaneous and purchased product gross margin (3) | | | 13 | | | | 12 | | | | 8 | | | | | | | | | | | | | | | | | | | | | | | | | |
Gross Margin | | $ | 564 | | | $ | 776 | | | | (27 | ) | | | | | | | | | | | | | | $ | 129 | | | $ | 160 | | | | (19 | ) |
| (1) | Rounding differences may occur due to the use of whole dollars in per-tonne calculations. |
| (2) | Includes inter-segment ammonia sales, comprised of: net sales $61 million, cost of goods sold $21 million and 113,000 sales tonnes (2014 — net sales $81 million, cost of goods sold $36 million and 141,000 sales tonnes). Inter-segment profits are eliminated on consolidation. |
| (3) | Comprised of third-party and inter-segment sales, including: third-party net sales $30 million less cost of goods sold $18 million (2014 — net sales $26 million less cost of goods sold $14 million) and inter-segment net sales $1 million less cost of goods sold $NIL (2014 — net sales $2 million less cost of goods sold $2 million). Inter-segment profits are eliminated on consolidation. |
| | |
| PotashCorp 2015 Third Quarter Quarterly Report on Form 10-Q | | 22 |
Nitrogen gross margin variance was attributable to:
| | | | | | | | | | | | | | | | | | | | | | | | | | | | | | | | |
| | | Three Months Ended September 30
2015 vs 2014 | | | Nine Months Ended September 30
2015 vs 2014 | |
| | | | | | Change in
Prices/Costs | | | | | | | | | Change in
Prices/Costs | | | | |
| Dollars (millions) | | Change in Sales Volumes | | | Net Sales | | | Cost of Goods Sold | | | Total | | | Change in Sales Volumes | | | Net Sales | | | Cost of Goods Sold | | | Total | |
Manufactured product | | | | | | | | | | | | | | | | | | | | | | | | | | | | | | | | |
Ammonia | | $ | (5 | ) | | $ | (41 | ) | | $ | 26 | | | $ | (20 | ) | | $ | (35 | ) | | $ | (67 | ) | | $ | 29 | | | $ | (73 | ) |
Urea | | | (9 | ) | | | (10 | ) | | | 7 | | | | (12 | ) | | | (21 | ) | | | (45 | ) | | | 12 | | | | (54 | ) |
Solutions, nitric acid, ammonium nitrate | | | (18 | ) | | | (16 | ) | | | 6 | | | | (28 | ) | | | (33 | ) | | | (33 | ) | | | 13 | | | | (53 | ) |
Hedge | | | – | | | | – | | | | (12 | ) | | | (12 | ) | | | – | | | | – | | | | (33 | ) | | | (33 | ) |
Change in product mix | | | (16 | ) | | | 16 | | | | – | | | | – | | | | (12 | ) | | | 12 | | | | – | | | | – | |
Total manufactured product | | $ | (48 | ) | | $ | (51 | ) | | $ | 27 | | | | (72 | ) | | $ | (101 | ) | | $ | (133 | ) | | $ | 21 | | | | (213 | ) |
Other miscellaneous and purchased product | | | | | | | | | | | | | | | – | | | | | | | | | | | | | | | | 1 | |
Total | | | | | | | | | | | | | | $ | (72 | ) | | | | | | | | | | | | | | $ | (212 | ) |
| | | | | | | | | | | | | | | | | | | | | | | | | | | | | | | | |
| | | Three Months Ended September 30 | | | Nine Months Ended September 30 | |
| | | Sales Tonnes
(thousands) | | | Average Net Sales Price
per Tonne | | | Sales Tonnes
(thousands) | | | Average Net Sales Price
per Tonne | |
| | | 2015 | | | 2014 | | | 2015 | | | 2014 | | | 2015 | | | 2014 | | | 2015 | | | 2014 | |
Fertilizer | | | 479 | | | | 571 | | | $ | 314 | | | $ | 339 | | | | 1,450 | | | | 1,699 | | | $ | 336 | | | $ | 377 | |
Industrial and Feed | | | 947 | | | | 978 | | | $ | 322 | | | $ | 365 | | | | 2,917 | | | | 3,142 | | | $ | 333 | | | $ | 358 | |
| | | | 1,426 | | | | 1,549 | | | $ | 319 | | | $ | 356 | | | | 4,367 | | | | 4,841 | | | $ | 334 | | | $ | 365 | |
The most significant contributors to the change in total gross margin were as follows (direction of arrows refers to impact on gross margin):
| | | | |
| | | Quarter over Quarter | | Year over Year |
| Net Sales Prices | | i Our average realized price declined as lower energy prices and increased global supply weighed on benchmark prices and realizations for all our products. | | i Nitrogen prices fell on reduced demand in key markets and increased supply, including record Chinese urea exports. |
| Sales Volumes | | i Sales volumes were impacted by weaker fertilizer demand and limited product availability from our Lima facility due to a planned turnaround and mechanical challenges. |
| Cost of Goods Sold | | h Average costs, including our hedge position, for natural gas used as feedstock in production decreased 13 percent. Costs for natural gas used as feedstock in Trinidad production fell 19 percent (contract price indexed, in part, to Tampa ammonia prices) while our US spot costs for natural gas decreased 28 percent. Including losses on our hedge position, US gas prices fell 8 percent. i Costs were impacted by higher losses on natural gas hedging derivatives included in cost of goods sold. | | h Average costs, including our hedge position, for natural gas used as feedstock in production decreased 14 percent. Costs for natural gas used as feedstock in Trinidad production fell 10 percent (contract price indexed, in part, to Tampa ammonia prices) while our US spot costs for natural gas decreased 37 percent. Including losses on our hedge position, US gas prices fell 18 percent. i Costs were impacted by higher losses on natural gas hedging derivatives included in cost of goods sold. |
| | |
| 23 | | PotashCorp 2015 Third Quarter Quarterly Report on Form 10-Q |
Non-Financial Performance
| | | | | | | | | | | | | | | | | | | | | | | | | | |
| | | | | Three Months Ended September 30 | | | Nine Months Ended September 30 | |
| | | | | 2015 | | | 2014 | | | % Change | | | 2015 | | | 2014 | | | % Change | |
Production | | N tonnes produced (thousands) | | | 734 | | | | 787 | | | | (7 | ) | | | 2,279 | | | | 2,450 | | | | (7 | ) |
Safety | | Total site recordable injury rate | | | 0.79 | | | | 0.71 | | | | 11 | | | | 0.40 | | | | 0.51 | | | | (22 | ) |
| | Total lost-time injury rate | | | 0.10 | | | | – | | | | n/m | | | | 0.04 | | | | 0.05 | | | | (20 | ) |
Employee | | Percentage of senior staff positions filled internally | | | 80% | | | | n/a | | | | n/m | | | | 67% | | | | 100% | | | | (33 | ) |
Environmental | | Greenhouse gas emissions (CO2 equivalent tonnes/tonne of product) | | | 2.1 | | | | 2.3 | | | | (9 | ) | | | 2.0 | | | | 2.3 | | | | (13 | ) |
| | | Environmental incidents | | | 2 | | | | 3 | | | | (33 | ) | | | 5 | | | | 4 | | | | 25 | |
| n/a | = not applicable as there were no senior staff positions available to be filled during the period |
The most significant contributors to the changes in non-financial results were as follows:
| | | | |
| | | Quarter over Quarter | | Year over Year |
| Safety | | There was one lost-time injury in 2015 compared to none in 2014. | | The total site recordable injury rate and total lost-time injury rate decreased from 2014 due to more hours being worked in 2015 as the number of recordable and lost-time injuries were unchanged. |
| Employee | | There were no senior staff positions available to be filled in 2014. | | In 2015, four of six senior staff positions were filled internally while all three available senior staff positions were filled internally in 2014. |
Phosphate Performance
Financial Performance
| | | | | | | | | | | | | | | | | | | | | | | | | | | | | | | | | | | | |
| | | Three Months Ended September 30 | |
| | | Dollars (millions) | | | Tonnes (thousands) | | | Average per Tonne (1) | |
| | | 2015 | | | 2014 | | | % Change | | | 2015 | | | 2014 | | | % Change | | | 2015 | | | 2014 | | | % Change | |
Manufactured product | | | | | | | | | | | | | | | | | | | | | | | | | | | | | | | | | | | | |
Net sales | | | | | | | | | | | | | | | | | | | | | | | | | | | | | | | | | | | | |
Fertilizer | | $ | 230 | | | $ | 201 | | | | 14 | | | | 485 | | | | 445 | | | | 9 | | | $ | 475 | | | $ | 452 | | | | 5 | |
Feed and Industrial | | | 179 | | | | 174 | | | | 3 | | | | 277 | | | | 280 | | | | (1 | ) | | $ | 647 | | | $ | 621 | | | | 4 | |
| | | 409 | | | | 375 | | | | 9 | | | | 762 | | | | 725 | | | | 5 | | | $ | 538 | | | $ | 517 | | | | 4 | |
Cost of goods sold | | | (362 | ) | | | (317 | ) | | | 14 | | | | | | | | | | | | | | | $ | (475 | ) | | $ | (437 | ) | | | 9 | |
Gross margin | | | 47 | | | | 58 | | | | (19 | ) | | | | | | | | | | | | | | $ | 63 | | | $ | 80 | | | | (21 | ) |
Other miscellaneous and purchased product gross margin (2) | | | 3 | | | | 3 | | | | – | | | | | | | | | | | | | | | | | | | | | | | | | |
Gross Margin | | $ | 50 | | | $ | 61 | | | | (18 | ) | | | | | | | | | | | | | | $ | 66 | | | $ | 84 | | | | (21 | ) |
| (1) | Rounding differences may occur due to the use of whole dollars in per-tonne calculations. |
| (2) | Comprised of net sales of $7 million (2014 — $24 million) less cost of goods sold of $4 million (2014 — $21 million). |
| | |
| PotashCorp 2015 Third Quarter Quarterly Report on Form 10-Q | | 24 |
| | | | | | | | | | | | | | | | | | | | | | | | | | | | | | | | | | | | |
| | | Nine Months Ended September 30 | |
| | | Dollars (millions) | | | Tonnes (thousands) | | | Average per Tonne (1) | |
| | | 2015 | | | 2014 | | | % Change | | | 2015 | | | 2014 | | | % Change | | | 2015 | | | 2014 | | | % Change | |
Manufactured product | | | | | | | | | | | | | | | | | | | | | | | | | | | | | | | | | | | | |
Net sales | | | | | | | | | | | | | | | | | | | | | | | | | | | | | | | | | | | | |
Fertilizer | | $ | 608 | | | $ | 656 | | | | (7 | ) | | | 1,239 | | | | 1,486 | | | | (17 | ) | | $ | 491 | | | $ | 441 | | | | 11 | |
Feed and Industrial | | | 550 | | | | 526 | | | | 5 | | | | 853 | | | | 862 | | | | (1 | ) | | $ | 645 | | | $ | 610 | | | | 6 | |
| | | 1,158 | | | | 1,182 | | | | (2 | ) | | | 2,092 | | | | 2,348 | | | | (11 | ) | | $ | 554 | | | $ | 503 | | | | 10 | |
Cost of goods sold | | | (984 | ) | | | (1,055 | ) | | | (7 | ) | | | | | | | | | | | | | | $ | (471 | ) | | $ | (449 | ) | | | 5 | |
Gross margin | | | 174 | | | | 127 | | | | 37 | | | | | | | | | | | | | | | $ | 83 | | | $ | 54 | | | | 54 | |
Other miscellaneous and purchased product gross margin (2) | | | 6 | | | | 8 | | | | (25 | ) | | | | | | | | | | | | | | | | | | | | | | | | |
Gross Margin | | $ | 180 | | | $ | 135 | | | | 33 | | | | | | | | | | | | | | | $ | 86 | | | $ | 57 | | | | 51 | |
| (1) | Rounding differences may occur due to the use of whole dollars in per-tonne calculations. |
| (2) | Comprised of net sales of $48 million (2014 — $34 million) less cost of goods sold of $42 million (2014 — $26 million). |
Phosphate gross margin variance was attributable to:
| | | | | | | | | | | | | | | | | | | | | | | | | | | | | | | | |
| | | Three Months Ended September 30
2015 vs 2014 | | | Nine Months Ended September 30
2015 vs 2014 | |
| | | | | | Change in
Prices/Costs | | | | | | | | | Change in
Prices/Costs | | | | |
| Dollars (millions) | | Change in Sales Volumes | | | Net Sales | | | Cost of Goods Sold | | | Total | | | Change in Sales Volumes | | | Net Sales | | | Cost of Goods Sold | | | Total | |
Manufactured product | | | | | | | | | | | | | | | | | | | | | | | | | | | | | | | | |
Fertilizer | | $ | 2 | | | $ | 12 | | | $ | (14 | ) | | $ | – | | | $ | (23 | ) | | $ | 62 | | | $ | 18 | | | $ | 57 | |
Feed and Industrial | | | (1 | ) | | | 7 | | | | (17 | ) | | | (11 | ) | | | 1 | | | | 29 | | | | (40 | ) | | | (10 | ) |
Change in product mix | | | 1 | | | | (1 | ) | | | – | | | | – | | | | (14 | ) | | | 14 | | | | – | | | | – | |
Total manufactured product | | $ | 2 | | | $ | 18 | | | $ | (31 | ) | | | (11 | ) | | $ | (36 | ) | | $ | 105 | | | $ | (22 | ) | | | 47 | |
Other miscellaneous and purchased product | | | | | | | | | | | | | | | – | | | | | | | | | | | | | | | | (2 | ) |
Total | | | | | | | | | | | | | | $ | (11 | ) | | | | | | | | | | | | | | $ | 45 | |
The most significant contributors to the change in total gross margin were as follows (direction of arrows refers to impact on gross margin):
| | | | |
| | | Quarter over Quarter | | Year over Year |
Net Sales Prices | | h Our average realized price was up primarily reflecting higher netbacks for liquid fertilizer products. | | h Our average realized price was up mainly as a result of strong demand and supply constraints in the liquid phosphate market. |
Sales Volumes | | h Changes were not significant. | | i Sales volumes were down due to a reduction in capacity from the closure of our Suwannee River chemical plant in July 2014, partially offset by additional tonnes available for sale at our White Springs facility (mechanical challenges occurred in the third quarter of 2014). |
Cost of Goods Sold | | i Costs rose due to increased reliability maintenance costs at Aurora. | | h Depreciation was lower due to accelerated depreciation in the first half of 2014 related to fertilizer resulting from operations changes announced in late 2013. i Rock costs were higher as a result of certain mining conditions at White Springs. i Costs rose due to increased reliability maintenance costs at Aurora. i Sulfur costs were up 9 percent, increasing our cost of goods sold. |
| | |
| 25 | | PotashCorp 2015 Third Quarter Quarterly Report on Form 10-Q |
Non-Financial Performance
| | | | | | | | | | | | | | | | | | | | | | | | | | |
| | | | | Three Months Ended September 30 | | | Nine Months Ended September 30 | |
| | | | | 2015 | | | 2014 | | | % Change | | | 2015 | | | 2014 | | | % Change | |
Production | | P2 O5 tonnes produced (thousands) | | | 442 | | | | 431 | | | | 3 | | | | 1,187 | | | | 1,259 | | | | (6 | ) |
| | P2O5 operating rate percentage | | | 93% | | | | 83% | | | | 12 | | | | 83% | | | | 74% | | | | 12 | |
Safety | | Life-altering injuries | | | – | | | | – | | | | – | | | | 1 | | | | – | | | | n/m | |
| | Total site recordable injury rate | | | 0.77 | | | | 0.59 | | | | 31 | | | | 0.83 | | | | 1.12 | | | | (26 | ) |
| | Total lost-time injury rate | | | 0.38 | | | | – | | | | n/m | | | | 0.17 | | | | 0.11 | | | | 55 | |
Employee | | Percentage of senior staff positions filled internally | | | – | | | | 60% | | | | (100 | ) | | | 33% | | | | 81% | | | | (59 | ) |
Environmental | | Environmental incidents | | | 2 | | | | 2 | | | | – | | | | 7 | | | | 3 | | | | 133 | |
| | | Water usage (m3 per tonne of product) | | | 24 | | | | 25 | | | | (4 | ) | | | 26 | | | | 26 | | | | – | |
The most significant contributors to the changes in non-financial results were as follows:
| | | | |
| | | Quarter over Quarter | | Year over Year |
| Safety | | The total site recordable injury rate increased from 2014 mainly due to six recordable injuries occurring in 2015 compared to four in 2014. There were three lost-time injuries in 2015 compared to none in 2014. | | Sadly, a workplace accident resulted in the loss of an employee at our White Springs phosphate operation during the first quarter of 2015. There were 19 recordable injuries in 2015 compared to 21 in 2014. Combined with more hours worked in 2015, the total site recordable injury rate declined. The total lost-time injury rate increased from 2014 mainly due to four lost-time injuries occurring in 2015 compared to two in 2014. |
| Employee | | In 2015, the one available senior staff position was not filled internally while three of five senior staff positions were filled internally in 2014. | | In 2015, one of three senior staff positions were filled internally while 13 of 16 senior staff positions were filled internally in 2014. |
| Environmental | | There were no significant changes. | | Environmental incidents in 2015 primarily related to releases of solids and phosphorus in waste water and a phosphoric acid release. Environmental incidents in 2014 included releases of oil, phosphoric acid and sulfuric acid. |
Other Expenses and Income
| | | | | | | | | | | | | | | | | | | | | | | | | | | | | | | | |
| | | Three Months Ended September 30 | | | Nine Months Ended September 30 | |
| Dollars (millions), except percentage amounts | | 2015 | | | 2014 | | | Change | | | % Change | | | 2015 | | | 2014 | | | Change | | | % Change | |
Selling and administrative expenses | | $ | (52 | ) | | $ | (49 | ) | | $ | (3 | ) | | | 6 | | | $ | (172 | ) | | $ | (172 | ) | | $ | – | | | | – | |
Provincial mining and other taxes | | | (79 | ) | | | (52 | ) | | | (27 | ) | | | 52 | | | | (264 | ) | | | (175 | ) | | | (89 | ) | | | 51 | |
Share of earnings of equity-accounted investees | | | 32 | | | | 20 | | | | 12 | | | | 60 | | | | 103 | | | | 85 | | | | 18 | | | | 21 | |
Dividend income | | | 7 | | | | 7 | | | | – | | | | – | | | | 38 | | | | 100 | | | | (62 | ) | | | (62 | ) |
Impairment of available-for-sale investment | | | – | | | | – | | | | – | | | | – | | | | – | | | | (38 | ) | | | 38 | | | | (100 | ) |
Other income | | | 8 | | | | 5 | | | | 3 | | | | 60 | | | | 11 | | | | 36 | | | | (25 | ) | | | (69 | ) |
Finance costs | | | (49 | ) | | | (47 | ) | | | (2 | ) | | | 4 | | | | (148 | ) | | | (142 | ) | | | (6 | ) | | | 4 | |
Income taxes | | | (90 | ) | | | (156 | ) | | | 66 | | | | (42 | ) | | | (382 | ) | | | (466 | ) | | | 84 | | | | (18 | ) |
| | |
| PotashCorp 2015 Third Quarter Quarterly Report on Form 10-Q | | 26 |
The most significant contributors to the change in other expenses and income were as follows:
| | | | | | | | | | |
| | | Quarter over Quarter | | Year over Year |
Provincial Mining
and Other Taxes | | For the third quarter and first nine months of 2015, provincial mining and other taxes increased due to higher potash production tax in 2015 resulting from a weaker Canadian dollar and lower costs. Deductible costs decreased due to the first-quarter 2015 changes to potash taxation in the Province of Saskatchewan, which deferred the timing of the annual allowable deduction for capital expenditures. |
| Dividend Income | | There were no significant changes. | | Dividend income was down due to the company receiving a special dividend of $69 million from ICL in the first quarter of 2014. No special dividends were received in 2015. |
Impairment of
Available-for-Sale
Investment | | No impairment losses were recognized in the third quarter of 2015 or 2014. | | A non-tax deductible impairment loss of $38 million was recorded in net income on our investment in Sinofert during the first quarter of 2014. No such losses were recognized in 2015. |
| Finance Costs | | 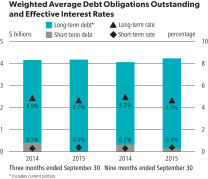 |
| Income Taxes | | For the third quarter and first nine months of 2015, income taxes decreased due to lower ordinary earnings before taxes and discrete tax adjustments. Significant items to note are described in Note 4 to the financial statements in this Form 10-Q. For the first nine months of 2015, 60 percent of the effective tax rate on the current year’s ordinary earnings pertained to current income taxes (2014 – 70 percent) and 40 percent related to deferred income taxes (2014 – 30 percent). The decrease in the current portion was largely due to lower ordinary earnings before taxes and increased tax depreciation. |
| | Effective Tax Rates and Discrete Items Dollars (millions), except percentage amounts |
| | | | Three Months Ended September 30 | | Nine Months Ended September 30 |
| | | | | 2015 | | 2014 | | 2015 | | 2014 |
| | Actual effective tax rate on ordinary earnings | | 27% | | 28% | | 27% | | 27% |
| | Actual effective tax rate including discrete items | | 24% | | 33% | | 26% | | 29% |
| | Discrete tax adjustments that impacted the rate | | $11 | | $(25) | | $5 | | $(21) |
Other Non-Financial Information
| | | | | | | | | | | | | | | | | | | | | | | | | | | | | | | | |
| | | Three Months Ended September 30 | | | Nine Months Ended September 30 | |
| Dollars (millions), except percentage amounts | | 2015 | | | 2014 | | | Change | | | % Change | | | 2015 | | | 2014 | | | Change | | | % Change | |
Taxes and royalties cost (1) | | $ | 119 | | | $ | 190 | | | | (71 | ) | | | (37 | ) | | $ | 576 | | | $ | 559 | | | | 17 | | | | 3 | |
| (1) | Includes tax and royalty amounts on an accrual basis calculated as: current income tax expense less investment tax credits and realized excess tax benefit related to share-based compensation plus potash production tax, resource surcharge, royalties, municipal taxes and other miscellaneous taxes. |
| | |
| 27 | | PotashCorp 2015 Third Quarter Quarterly Report on Form 10-Q |
The most significant contributors to the change in other non-financial information were as follows:
| | | | |
| | | Quarter over Quarter | | Year over Year |
| Taxes and Royalties | | Taxes and royalties decreased mainly due to a decrease in current income taxes partially offset by an increase in provincial mining and other taxes (described above). The decrease in current income taxes was primarily due to lower current income taxes in the United States and Canada as a result of decreased earnings in third-quarter 2015 compared to third-quarter 2014 and discrete tax adjustments. | | Taxes and royalties increased mainly due to increases in provincial mining and other taxes (described above) mostly offset by a decrease in current income taxes. The decrease in current income taxes was primarily due to lower current income taxes in the United States and Trinidad as a result of decreased earnings in 2015 compared to the same period in 2014 and discrete tax adjustments. This was partially offset by higher current income taxes in Canada due to increased potash earnings year over year. |
Financial Condition Review
Statement of Financial Position Analysis
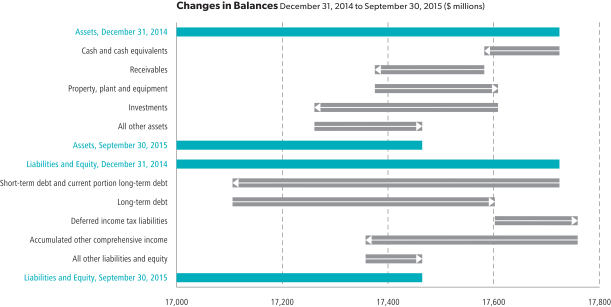
The most significant contributors to the changes in our statements of financial position were as follows (direction of arrows refers to increase or decrease):
| | |
| Assets | | Liabilities |
i Receivables decreased mainly due to lower trade accounts receivable and lower income taxes receivable. Income taxes receivable decreased due to income taxes accrued during the first nine months of 2015 being applied against the income tax receivable at December 31, 2014. In addition, income tax refunds accrued at December 31, 2014 were received in second-quarter 2015. h Property, plant and equipment increased largely as a result of our previously announced potash and nitrogen capacity expansions. i Investments were mainly impacted by the lower fair value of our available-for-sale investment in ICL. | | i Short-term debt and current portion of long-term debt declined due to a decrease in our outstanding commercial paper and the repayment of $500 million in senior notes in the third quarter of 2015. h Long-term debt was higher as a result of the issuance of $500 million in senior notes in the first quarter of 2015. |
|
| Equity |
i Equity was mainly impacted by higher net income (discussed in more detail in the overview of actual results above), more than offset by dividends declared and other comprehensive loss. |
As at September 30, 2015, $36 million (December 31, 2014 – $127 million) of our cash and cash equivalents was held in certain foreign subsidiaries. There are no current plans to repatriate the funds at September 30, 2015 in a manner that results in tax consequences. A repatriation of funds totaling $118 million was completed in July 2015 with no tax consequences.
| | |
| PotashCorp 2015 Third Quarter Quarterly Report on Form 10-Q | | 28 |
Liquidity and Capital Resources
Cash Requirements
Contractual Obligations and Other Commitments
Our contractual obligations and other commitments detailed on page 76 of our 2014 AIR summarize certain of our liquidity and capital resource requirements, excluding obligations that have original maturities of less than one year, planned (but not legally committed) capital expenditures or potential share repurchases. The issuance of $500 million of 3.00 percent senior notes due April 1, 2025 during the first quarter of 2015 increased our long-term debt obligations ($500 million) and total estimated interest payments on long-term debt obligations ($150 million) in the contractual obligations and other commitments table referenced above. On September 30, 2015, the company fully repaid $500 million of 3.75 percent 6-year senior notes at maturity.
Capital Expenditures
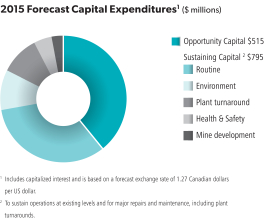
Page 51 of our 2014 AIR outlines key potash construction projects and their expected total cost, as well as the impact of these projects on capacity expansion/debottlenecking and any expected remaining spending on each project still in progress. The most significant of these potash projects(1) on which funds are expected to be spent in 2015, excluding capitalized interest, are outlined in the table below:
| | | | | | | | | | | | | | | | | | |
| CDN Dollars (billions) | | 2015 Forecast | | | Total Forecast (2) | | | Started | | | Construction Completion (3) (Description) | | Forecasted Remaining Spending (after 2015) (2) | |
New Brunswick(4) | | $ | 0.1 | | | $ | 2.2 | | | | 2007 | | | 2014 (mine shaft and mill completed) | | $ | 0.2 | |
Rocanville, Saskatchewan | | $ | 0.2 | | | $ | 3.1 | | | | 2008 | | | 2015 (mine shaft and mill) | | $ | 0.2 | |
| (1) | The expansion at each of these projects is discussed in the technical report for such project filed on SEDAR in accordance with National Instrument 43-101 Standards of Disclosure for Mineral Projects. |
| (2) | Amounts are based on the most recent forecasts approved by the Board of Directors, and are subject to change based on project timelines and costs. |
| (3) | Construction completion does not include ramp-up time. |
| (4) | Remaining expenditures at New Brunswick relate to port and other site infrastructure required for ramp-up. |
In 2013, we began a brownfield expansion at our Lima facility that is expected to add approximately 100,000 tonnes of ammonia capacity and approximately 73,000 tonnes of urea capacity by the fourth quarter of 2015 at an estimated cost of approximately $230 million. We expect to spend approximately $85 million in 2015 related to this expansion.
We anticipate that all capital spending will be financed by internally generated cash flows supplemented, if and as necessary, by borrowing from existing financing sources.
Sources and Uses of Cash
The company’s cash flows from operating, investing and financing activities are summarized in the following table:
| | | | | | | | | | | | | | | | | | | | | | | | | | | | | | | | |
| | | Three Months Ended September 30 | | | Nine Months Ended September 30 | |
| Dollars (millions), except percentage amounts | | 2015 | | | 2014 | | | Change | | | % Change | | | 2015 | | | 2014 | | | Change | | | % Change | |
Cash provided by operating activities | | $ | 358 | | | $ | 574 | | | $ | (216 | ) | | | (38 | ) | | $ | 1,715 | | | $ | 1,901 | | | $ | (186 | ) | | | (10 | ) |
Cash used in investing activities | | | (333 | ) | | | (305 | ) | | | (28 | ) | | | 9 | | | | (870 | ) | | | (738 | ) | | | (132 | ) | | | 18 | |
Cash used in financing activities | | | (401 | ) | | | (224 | ) | | | (177 | ) | | | 79 | | | | (987 | ) | | | (1,639 | ) | | | 652 | | | | (40 | ) |
(Decrease) increase in cash and cash equivalents | | $ | (376 | ) | | $ | 45 | | | $ | (421 | ) | | | n/m | | | $ | (142 | ) | | $ | (476 | ) | | $ | 334 | | | | (70 | ) |
| | |
| 29 | | PotashCorp 2015 Third Quarter Quarterly Report on Form 10-Q |
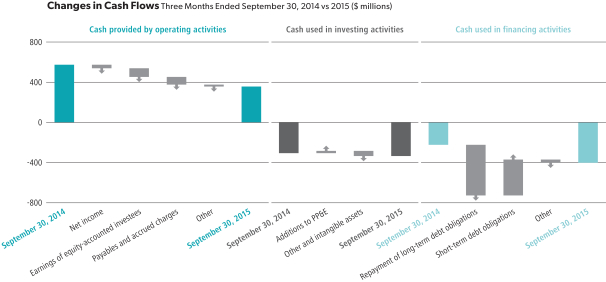
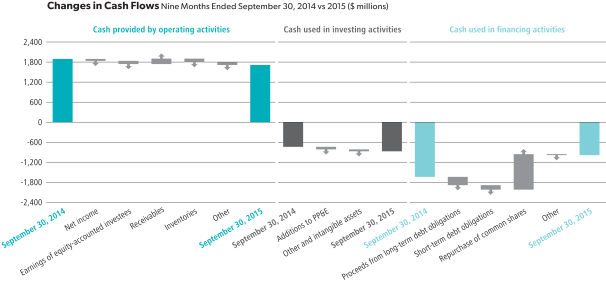
The most significant contributors to the changes in cash flows were as follows:
��
| | | | |
| | | Quarter over Quarter | | Year over Year |
Cash Provided by
Operating Activities | | Cash provided by operating activities was impacted by: • Lower net income in 2015; • Net undistributed earnings of equity-accounted investees in 2015 compared to net distributed earnings ofequity-accounted investees in 2014 when a special dividend was received from SQM; and • Higher cash outflows from payables and accrued charges in 2015. | | Cash provided by operating activities was impacted by: • Lower net income in 2015; • Net undistributed earnings of equity-accounted investees in 2015 compared to net distributed earnings ofequity-accounted investees in 2014 when a special dividend was received from SQM; • Cash inflows from receivables in 2015 compared to cash outflows in 2014; and • Cash outflows from inventories in 2015 compared to cash inflows in 2014. |
Cash Used in
Investing Activities | | Cash used in investing activities was primarily for additions to property, plant and equipment. |
Cash Used in
Financing Activities | | Cash used in financing activities increased mainly due to the repayment of senior notes at maturity in 2015, partially offset by higher commercial paper proceeds in 2015 as compared to 2014. | | Cash used in financing activities decreased due to share repurchases in the first half of 2014 not recurring in 2015 being partially offset by lower proceeds from senior notes and commercial paper repayments in 2015 compared to proceeds in 2014. |
| | |
| PotashCorp 2015 Third Quarter Quarterly Report on Form 10-Q | | 30 |
We believe that internally generated cash flow, supplemented if necessary by available borrowings under our existing financing sources, will be sufficient to meet our anticipated capital expenditures and other cash requirements for at least the next 12 months, exclusive of any possible acquisitions. At this time, we do not reasonably expect any presently known trend or uncertainty to affect our ability to access our historical sources of liquidity.
| | |
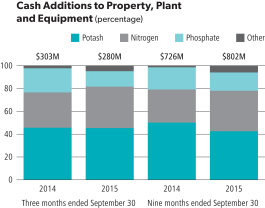 | | 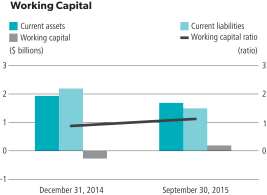 |
Capital Structure and Management
Principal Debt Instruments
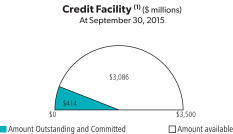
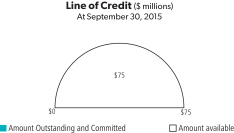
| (1) | The authorized aggregate amount under the company’s commercial paper programs in Canada and the US is $2,500 million. The amounts available under the commercial paper programs are limited to the availability of backup funds under the credit facility. Included in the amount outstanding and committed is $414 million of commercial paper. |
We use a combination of cash generated from operations and short-term and long-term debt to finance our operations. We typically pay floating rates of interest on our short-term debt and credit facility borrowings, and fixed rates on our senior notes.
During the third quarter of 2015, we extended the maturity on our $75 million short-term line of credit to August 2016 (from August 2015). There were no significant changes to the nature of our outstanding commercial paper, including interest rates, syndicated credit facility and uncommitted letter of credit facility described on page 79 in our 2014 AIR.
The line of credit and credit facility have financial tests and covenants, including consequences of non-compliance, referenced on page 79 of our 2014 AIR, with which we must comply at each quarter-end. We were in compliance with all covenants as at September 30, 2015 and at this time anticipate being in compliance with such covenants through 2015.
The accompanying table summarizes the limits and results of certain covenants:
| | | | | | | | |
| Debt covenants at September 30 | | | | | | |
| Dollars (millions), except ratio amounts | | Limit | | | 2015 | |
Debt-to-capital ratio (1) | | £ | 0.6 | | | | 0.3 | |
Long-term debt-to-EBITDA ratio (2) | | £ | 3.5 | | | | 1.1 | |
Debt of subsidiaries | | <$ | 1,000 | | | $ | 4 | |
The following non-IFRS financial measures are requirements of our debt covenants and should not be considered as substitutes for, nor superior to, measures of financial performance prepared in accordance with IFRS:
| (1) | Debt-to-capital ratio = debt (short-term debt and current portion of long-term debt + long-term debt) / (debt + shareholders’ equity). |
| (2) | Long-term debt-to-EBITDA ratio = long-term debt / EBITDA. EBITDA is calculated according to the definition in Note 17 to the 2014 audited annual consolidated financial statements for the trailing 12 months. As compared to net income according to IFRS, EBITDA is limited in that periodic costs of certain capitalized tangible and intangible assets used in generating revenues are excluded. Long-term debt to net income for the trailing 12 months was 2.5. |
Our ability to access reasonably priced debt in the capital markets is dependent, in part, on the quality of our credit ratings. We currently maintain investment-grade credit ratings for our long-term debt. A downgrade of the credit rating of our long-term debt would increase the interest rates applicable to borrowings under our credit facility and our line of credit.
Commercial paper markets are normally a source of same-day cash for the company. Our access to the Canadian and US commercial paper markets primarily depends on maintaining our current short-term credit ratings as well as general conditions in the money markets.
| | |
| 31 | | PotashCorp 2015 Third Quarter Quarterly Report on Form 10-Q |
| | | | | | | | |
| | | Long-Term Debt | | Short-Term Debt |
| | | Rating (Outlook) | | Rating |
| | | September 30,
2015 | | December 31,
2014 | | September 30,
2015 | | December 31,
2014 |
Moody’s | | A3 (negative) | | A3 (stable) | | P-2 | | P-2 |
Standard & Poor’s | | A- (stable) | | A-(stable) | | A-2 (1) | | A-2 (1) |
DBRS | | n/a | | n/a | | R-1 (low) | | R-1 (low) |
| (1) | S&P assigned a global commercial paper rating of A-2, but rated our commercial paper A-1 (low) on a Canadian scale. |
A security rating is not a recommendation to buy, sell or hold securities. Such rating may be subject to revision or withdrawal at any time by the respective credit rating agency and each rating should be evaluated independently of any other rating.
Our $3,750 million of outstanding senior notes were issued under US shelf registration statements.
For the first nine months of 2015, our weighted average cost of capital was 7.1 percent (2014 – 9.3 percent), of which 85 percent represented the cost of equity (2014 – 88 percent).
Outstanding Share Data
| | | | | | | | |
| | | September 30,
2015 | | | December 31,
2014 | |
Common shares issued and outstanding | | | 834,948,893 | | | | 830,242,574 | |
Options to purchase common shares outstanding | | | 20,282,075 | | | | 20,909,835 | |
Number of stock option plans | | | 10 | | | | 10 | |
Off-Balance Sheet Arrangements
Off-balance sheet arrangements are described on page 80 of our 2014 AIR. We do not reasonably expect any presently known trend or uncertainty to affect our ability to continue using these arrangements. Refer to Note 12 to the financial statements in this Form 10-Q for a contingency related to Canpotex. Refer to page 80 of our 2014 AIR for information pertaining to our guarantees and derivative instruments. See “Cash Requirements” above and our 2014 AIR for obligations related to operating leases and certain of our long-term raw materials agreements that contain fixed price and/or volume components.
Quarterly Highlights
| | | | | | | | | | | | | | | | | | | | | | | | | | | | | | | | |
Dollars (millions), except as otherwise noted | | September 30,
2015 | | | June 30,
2015 | | | March 31,
2015 | | | December 31,
2014 | | | September 30,
2014 | | | June 30,
2014 | | | March 31,
2014 | | | December 31,
2013 | |
Financial Performance | | | | | | | | | | | | | | | | | | | | | | | | | | | | | | | | |
Sales | | $ | 1,529 | | | $ | 1,731 | | | $ | 1,665 | | | $ | 1,902 | | | $ | 1,641 | | | $ | 1,892 | | | $ | 1,680 | | | $ | 1,541 | |
Gross margin | | | 505 | | | | 711 | | | | 667 | | | | 746 | | | | 589 | | | | 747 | | | | 565 | | | | 460 | |
Net income | | | 282 | | | | 417 | | | | 370 | | | | 407 | | | | 317 | | | | 472 | | | | 340 | | | | 230 | |
Net income per share – basic (1) | | | 0.34 | | | | 0.50 | | | | 0.45 | | | | 0.49 | | | | 0.38 | | | | 0.56 | | | | 0.40 | | | | 0.27 | |
Net income per share – diluted (1) | | | 0.34 | | | | 0.50 | | | | 0.44 | | | | 0.49 | | | | 0.38 | | | | 0.56 | | | | 0.40 | | | | 0.26 | |
Non-Financial Performance | | | | | | | | | | | | | | | | | | | | | | | | | | | | | | | | |
Total shareholder return percentage | | | (33 | ) | | | (3 | ) | | | (8 | ) | | | 3 | | | | (8 | ) | | | 6 | | | | 11 | | | | 6 | |
Percentage of senior staff positions filled internally | | | 71 | | | | 81 | | | | 74 | | | | 38 | | | | 73 | | | | 77 | | | | 100 | | | | 90 | |
Total site recordable injury rate | | | 1.29 | | | | 0.85 | | | | 0.92 | | | | 0.66 | | | | 1.32 | | | | 1.27 | | | | 1.06 | | | | 0.86 | |
Environmental incidents | | | 6 | | | | 5 | | | | 5 | | | | 5 | | | | 8 | | | | 6 | | | | 5 | | | | 4 | |
| (1) | Net income per share for each quarter has been computed based on the weighted average number of shares issued and outstanding during the respective quarter, including the dilutive number of shares assumed for the diluted earnings per share computation; therefore, as the number of shares varies each period, quarterly amounts may not add to the annual total. |
Refer to Note 11 to the financial statements in this Form 10-Q for information pertaining to sales that can be seasonal.
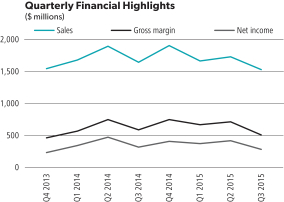
| | |
| PotashCorp 2015 Third Quarter Quarterly Report on Form 10-Q | | 32 |
Other Financial Information
Related Party Transactions
Refer to Note 13 to the financial statements in this Form 10-Q for information pertaining to transactions with related parties.
Critical Accounting Estimates
There have been no material changes to our critical accounting estimate policies in the first nine months of 2015.
We have discussed the development, selection and application of our key accounting policies, and the critical accounting estimates and assumptions they involve, with the audit committee of the Board of Directors, and the committee reviewed the disclosures described in this Form 10-Q.
Recent Accounting Changes
Refer to Note 1 to the financial statements in this Form 10-Q for information on issued accounting pronouncements that will be effective in future periods. There are no accounting changes effective in 2015.
Outlook
Market Outlook
Despite broad economic uncertainty, we continue to see strong underlying consumption trends across most key potash markets. We maintain our forecast for 2015 global shipments of 58 to 60 million tonnes, although we no longer expect they will reach the high end of this range.
In North America, cautious buying patterns in the third quarter are expected to keep total potash shipments for the year below 2014 levels. Although we anticipate healthy fall application demand will support fourth-quarter shipments, we now forecast total 2015 deliveries of 8.5-9.0 million tonnes.
In Latin America, while we expect potash shipments will remain at historically strong levels, credit challenges and currency volatility are likely to result in demand below last year’s record level. For the full year, we forecast shipments of 10.5-11.0 million tonnes.
In China, we anticipate that encouraging consumption trends for compound fertilizers and bulk blends will support healthy demand through the fourth quarter. We have slightly lowered our total potash shipment range for 2015 to 14.0-14.5 million tonnes to reflect modestly lower deliveries due to the recently implemented value-added tax on fertilizer sales.
In India, we remain encouraged by rising consumption trends for compound fertilizers, even in the absence of subsidy reform. Despite this trend, we have lowered our full-year potash shipment estimate to 4.2-4.5 million tonnes due to currency volatility and a weaker-than-normal monsoon.
In Other Asian markets (outside of China and India), we have slightly lowered our estimate for potash shipments to
8.3-8.7 million tonnes to reflect lower demand caused by weaker local currencies and adverse weather conditions affecting application requirements in certain regions.
Financial Outlook
In light of these market factors, we have revised full-year expectations for our potash business. We have lowered our sales volume guidance to a range of 9.0-9.2 million tonnes and now expect potash gross margin of $1.4-$1.5 billion, reflecting weaker volumes and pricing.
Consistent with our long-held strategy of matching supply to demand, we are accelerating the permanent closure date of our Penobsquis mine in New Brunswick to the end of November (annual operational capability of approximately 800,000 tonnes). While this will reduce available production levels until our new Picadilly mine is fully ramped up, it is expected to improve our cost profile and help manage inventories.
We are also preparing to take three-week inventory shutdowns at our Allan, Cory and Lanigan operations in Saskatchewan, beginning in mid-December. The combination of these shutdowns and the closure of Penobsquis is expected to reduce fourth-quarter production by nearly 500,000 tonnes and lead to slightly higher per-tonne cost of goods sold. We expect there will be no impact on our employment levels at these locations.
We have lowered the top end of our previous combined nitrogen and phosphate gross margin guidance range and now estimate we will generate between $1.0-$1.1 billion. In nitrogen, we expect total gross margin below last year’s record as increased global supply is expected to keep prices for most products below 2014 levels. Additionally, weaker North American demand, reduced production due to mechanical challenges and an expansion-related turnaround at Lima are expected to keep sales volumes below last year’s levels. In phosphate, supportive market fundamentals and our higher-netback product mix are expected to support gross margin above 2014 levels.
We have increased our estimate for provincial mining and other taxes to a range of 21-23 percent of potash gross margin due to a weaker Canadian dollar and lower deductible costs.
We have lowered our range for income from offshore equity investments to $165-$175 million due to a weaker-than-expected potash earnings environment and we have also slightly increased our estimate for selling and administrative expenses to a range of $245-$250 million.
Due to the continued strength of the US dollar, we have revised our full-year foreign exchange rate assumption to CDN$1.26 per US dollar.
As a result of the noted changes, we have revised our full-year 2015 earnings guidance to $1.55-$1.65 per share.
| | |
| 33 | | PotashCorp 2015 Third Quarter Quarterly Report on Form 10-Q |
| | |
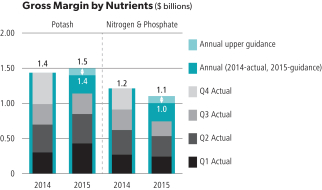 | | 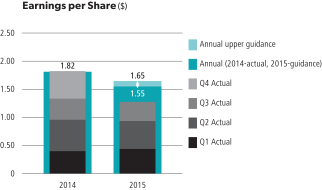 |
Forward-Looking Statements
Certain statements in this Quarterly Report on Form 10-Q, including those in the “Outlook” section of Management’s Discussion and Analysis of Financial Condition and Results of Operations, contain forward-looking statements or forward-looking information (“forward-looking statements”). These statements can be identified by expressions of belief, expectation or intention, as well as those statements that are not historical fact. These statements often contain words such as “should,” “could,” “expect,” “may,” “anticipate,” “believe,” “intend,” “estimates,” “plans” and similar expressions. These statements are based on certain factors and assumptions as set forth in this Form 10-Q, including with respect to: foreign exchange rates, expected growth, results of operations, performance, business prospects and opportunities, and effective tax rates. While the company considers these factors and assumptions to be reasonable based on information currently available, they may prove to be incorrect. Forward-looking statements are subject to risks and uncertainties that are difficult to predict. The results or events set forth in forward-looking statements may differ materially from actual results or events. Several factors could cause actual results or events to differ materially from those expressed in forward-looking statements including, but not limited to, the following: variations from our assumptions with respect to foreign exchange rates, expected growth, results of operations, performance, business prospects and opportunities, and effective tax rates; fluctuations in supply and demand in the fertilizer, sulfur, transportation and petrochemical markets; changes in competitive pressures, including pricing pressures; costs and availability of transportation and distribution of our raw materials and products, including railcars and ocean freight; risks and uncertainties related to operating and workforce changes made in response to our industry and the markets we serve; risks and uncertainties related
to our international operations and assets; failure to prevent or respond to a major safety incident; adverse or uncertain economic conditions and changes in credit and financial markets; the results of sales contract negotiations within major markets; economic and political uncertainty around the world; risks associated with natural gas and other hedging activities; changes in capital markets; unexpected or adverse weather conditions; catastrophic events or malicious acts, including terrorism; changes in currency and exchange rates; imprecision in reserve estimates; adverse developments in new and pending legal proceedings or government investigations; our prospects to reinvest capital in strategic opportunities and acquisitions; our ownership of noncontrolling equity interests in other companies; the impact of further technological innovation; increases in the price or reduced availability of the raw materials that we use; security risks related to our information technology systems; strikes or other forms of work stoppage or slowdowns; timing and impact of capital expenditures; rates of return on, and the risks associated with, our investments and capital expenditures; changes in, and the effects of, government policies and regulations; certain complications that may arise in our mining process, including water inflows; our ability to attract, retain, develop and engage skilled employees; risks related to reputational loss; and earnings and the decisions of taxing authorities, which could affect our effective tax rates. Additional risks and uncertainties can be found in our Form 10-K for the fiscal year ended December 31, 2014 under the captions “Forward-Looking Statements” and “Item 1A – Risk Factors” and in our filings with the US Securities and Exchange Commission and the Canadian provincial securities commissions. Forward-looking statements are given only as at the date of this report and the company disclaims any obligation to update or revise any forward-looking statements, whether as a result of new information, future events or otherwise, except as required by law.
| | |
| PotashCorp 2015 Third Quarter Quarterly Report on Form 10-Q | | 34 |
Item 3. Quantitative and Qualitative Disclosures About Market Risk
Market risk is the potential for loss from adverse changes in the market value of financial instruments. The level of market risk to which we are exposed varies depending on the composition of our derivative instrument portfolio, as well as current and expected market conditions. A discussion of enterprise-wide risk management can be found in our 2014 AIR, pages 21 to 25.
Price, foreign exchange and interest rate risks faced by the company and how we manage those risks are outlined in Notes 19 and 25 to the 2014 audited annual consolidated financial statements and there were no significant changes as at September 30, 2015.
Price Risk
There were no substantial changes to the price sensitivities related to our available-for-sale investments and natural gas derivatives reported in Note 25 to the 2014 audited annual consolidated financial statements. As at September 30, 2015, the company’s net exposure to natural gas derivatives in the form of swaps was a notional amount of 84 million MMBtu (December 31, 2014 – swaps and futures a notional amount of 101 million MMBtu) with maturities in 2015 through 2022.
Foreign Exchange Risk
There were no substantial changes to the foreign exchange sensitivities reported in Note 25 to the 2014 audited annual consolidated financial statements. As at September 30, 2015, the company had entered into foreign currency forward contracts to sell US dollars and receive Canadian dollars in the notional amount of $110 million (December 31, 2014 – $140 million) at an average exchange rate of 1.3244 (December 31, 2014 –1.1403) per US dollar with maturities in 2015.
Interest Rate Risk
As at September 30, 2015, the company had no significant exposure to interest rate risk.
Item 4. Controls and Procedures
As of September 30, 2015, we carried out an evaluation under the supervision and with the participation of our management, including our Chief Executive Officer and Chief Financial Officer, of the effectiveness of the design and operation of our disclosure controls and procedures. There are inherent limitations to the effectiveness of any system of disclosure controls and procedures, including the possibility of human error and the circumvention or overriding of the controls and procedures. Accordingly, even effective disclosure controls and procedures can only provide reasonable assurance of achieving their control objectives. Based upon that evaluation and as of September 30, 2015, the Chief Executive Officer and Chief Financial Officer concluded that the disclosure controls and procedures were effective to provide reasonable assurance that information required to be disclosed in the reports the company files and submits under the Securities Exchange Act of 1934 is recorded, processed, summarized and reported as and when required and that such information is accumulated and communicated to our management, including our Chief Executive Officer and Chief Financial Officer, as appropriate, to allow timely decisions regarding required disclosure.
There has been no change in our internal control over financial reporting during the quarter ended September 30, 2015 that has materially affected, or is reasonably likely to materially affect, our internal control over financial reporting.
| | |
| 35 | | PotashCorp 2015 Third Quarter Quarterly Report on Form 10-Q |
Part II. Other Information
Item 1. Legal Proceedings
For a description of certain other legal and environmental proceedings, see Note 12 to the unaudited interim condensed consolidated financial statements included in Part I of this Quarterly Report on Form 10-Q.
Item 4. Other Information
Mine Safety Disclosures
Safety is the company’s top priority, and we are committed to providing a healthy and safe work environment for our employees, contractors and all others at our sites to help meet our company-wide goal of achieving no harm to people.
The operations at the company’s Aurora, Weeping Water and White Springs facilities are subject to theFederal Mine Safety and Health Act of 1977, as amended by theMine Improvement and New Emergency Response Act of 2006, and the implementing regulations, which impose stringent health and safety standards on numerous aspects of mineral extraction and processing operations, including the training of personnel, operating
procedures, operating equipment and other matters. Our Senior Safety Leadership Team is responsible for managing compliance with applicable government regulations, as well as implementing and overseeing the elements of our safety program as outlined in our Safety, Health and Environment Manual.
Section 1503(a) of theDodd-Frank Wall Street Reform and Consumer Protection Act (Section 1503(a)) requires us to include certain safety information in the periodic reports we file with the United States Securities and Exchange Commission. The information concerning mine safety violations and other regulatory matters required by Section 1503(a) and Item 104 ofRegulation S-K is included in Exhibit 95 to this Quarterly Report on Form 10-Q.
Item 6. Exhibits
(a) Exhibits
| | | | | | | | | | | | |
| | | | | Incorporated By Reference (File No. 001-10351, unless otherwise indicated) | |
Exhibit
Number | | Description of Document | | Form | | Filing Date/Period
End Date | | | Exhibit Number
(if different) | |
| 3(a) | | Articles of Continuance of the registrant dated May 15, 2002. | | 10-Q | | | 6/30/2002 | | | | | |
| 3(b) | | General By-Law of the registrant, as amended, effective April 27, 2015. | | 8-K | | | 4/27/2015 | | | | 3 | (a) |
| 4(a) | | Indenture dated as of February 27, 2003, between the registrant and U.S. Bank National Association, as successor to The Bank of Nova Scotia Trust Company of New York. | | 10-K | | | 12/31/2002 | | | | 4 | (c) |
| 4(b) | | Form of Note relating to the registrant’s offering of $500,000,000 principal amount of 5.875% Notes due December 1, 2036. | | 8-K | | | 11/30/2006 | | | | 4 | (a) |
| 4(c) | | Form of Note relating to the registrant’s offering of $500,000,000 principal amount of 6.50% Notes due May 15, 2019. | | 8-K | | | 5/1/2009 | | | | 4 | (b) |
| 4(d) | | Form of Note relating to the registrant’s offering of $500,000,000 principal amount of 4.875% Notes due March 30, 2020. | | 8-K | | | 9/25/2009 | | | | 4 | (b) |
| 4(e) | | Form of Note relating to the registrant’s offering of $750,000,000 principal amount of 3.625% Notes due March 15, 2024. | | 8-K | | | 3/7/2014 | | | | 4 | (a) |
| 4(f) | | Form of Note relating to the registrant’s offering of $500,000,000 principal amount of 3.000% Notes due April 1, 2025. | | 8-K | | | 3/26/2015 | | | | 4 | (a) |
| 4(g) | | Revolving Term Credit Facility Agreement between the Bank of Nova Scotia and other financial institutions and the registrant dated December 11, 2009. | | 8-K | | | 12/15/2009 | | | | 4 | (a) |
| 4(h) | | Revolving Term Credit Facility First Amending Agreement between the Bank of Nova Scotia and other financial institutions and the registrant dated September 23, 2011. | | 8-K | | | 9/26/2011 | | | | 4 | (a) |
| 4(i) | | Revolving Term Credit Facility Second Amending Agreement between the Bank of Nova Scotia and other financial institutions and the registrant dated as of May 24, 2013. | | 8-K | | | 5/28/2013 | | | | 4 | (a) |
| | |
| PotashCorp 2015 Third Quarter Quarterly Report on Form 10-Q | | 36 |
| | | | | | | | | | | | |
| | | | | Incorporated By Reference (File No. 001-10351, unless otherwise indicated) | |
Exhibit
Number | | Description of Document | | Form | | Filing Date/Period
End Date | | | Exhibit Number
(if different) | |
| 4(j) | | Form of Note relating to the registrant’s offering of $500,000,000 principal amount of 3.25% Notes due December 1, 2017. | | 8-K | | | 11/29/2010 | | | | 4 | (a) |
| 4(k) | | Form of Note relating to the registrant’s offering of $500,000,000 principal amount of 5.625% Notes due December 1, 2040. | | 8-K | | | 11/29/2010 | | | | 4 | (b) |
| 4(l) | | Agreement of Resignation, Appointment and Acceptance, dated as of June 25, 2013, by and among the registrant, The Bank of Nova Scotia Trust Company of New York and U.S. Bank National Association. | | 8-K | | | 6/27/2013 | | | | 4 | (a) |
| 4(m) | | Revolving Term Credit Facility Third Amending Agreement between the Bank of Nova Scotia and other financial institutions and the registrant dated July 8, 2014. | | 10-Q | | | 07/29/2014 | | | | | |
The registrant hereby undertakes to file with the Securities and Exchange Commission, upon request, copies of any constituent instruments defining the rights of holders of long-term debt of the registrant or its subsidiaries that have not been filed herewith because the amounts represented thereby are less than 10% of the total assets of the registrant and its subsidiaries on a consolidated basis.
| | | | | | | | | | |
| | | | | Incorporated By Reference (File No. 001-10351, unless otherwise indicated) |
Exhibit
Number | | Description of Document | | Form | | Filing Date/Period
End Date | | | Exhibit Number
(if different) |
| 10(a) | | Consolidated, Restated and Amended Canpotex Shareholders’ Agreement, Eighth Memorandum of Agreement dated January 1, 2014 between Agrium Inc., Mosaic Canada Crop Nutrition, LP, by its general partner, 4379934 Canada Ltd., the registrant and Canpotex Limited. | | 10-K | | | 12/31/2013 | | | |
| 10(b) | | Consolidated, Restated and Amended Producer Agreement, Eighth Memorandum of Agreement dated January 1, 2014 between Canpotex Limited, Agrium Inc., Mosaic Canada Crop Nutrition, LP, by its general partner, 4379934 Canada Ltd. and the registrant. | | 10-K | | | 12/31/2013 | | | |
| 10(c) | | Short-Term Incentive Plan of the registrant effective January 1, 2000, as amended. | | 8-K | | | 3/13/2012 | | | 10(a) |
| 10(d) | | Resolution and Forms of Agreement for Supplemental Executive Retirement Income Plan, for officers and key employees of the registrant. | | 10-K | | | 12/31/1995 | | | 10(o) |
| 10(e) | | Amending Resolution and revised forms of agreement regarding Supplemental Retirement Income Plan of the registrant. | | 10-Q | | | 6/30/1996 | | | 10(x) |
| 10(f) | | Amended and restated Supplemental Executive Retirement Income Plan of the registrant and text of amendment to existing supplemental income plan agreements. | | 10-Q | | | 9/30/2000 | | | 10(mm) |
| 10(g) | | Amendment, dated February 23, 2009, to the amended and restated Supplemental Executive Retirement Income Plan. | | 10-K | | | 12/31/2008 | | | 10(r) |
| 10(h) | | Amendment, dated December 29, 2010, to the amended and restated Supplemental Executive Retirement Income Plan. | | 10-K | | | 12/31/2010 | | | 10(r) |
| 10(i) | | Form of Letter of amendment to existing supplemental income plan agreements of the registrant. | | 10-K | | | 12/31/2002 | | | 10(cc) |
| 10(j) | | Amended and restated agreement dated February 20, 2007, between the registrant and William J. Doyle concerning the Supplemental Executive Retirement Income Plan. | | 10-K | | | 12/31/2006 | | | 10(s) |
| 10(k) | | Amendment, dated December 24, 2008, to the amended and restated agreement, dated February 20, 2007, between the registrant and William J. Doyle concerning the Supplemental Executive Retirement Income Plan. | | 10-K | | | 12/31/2008 | | | 10(u) |
| 10(l) | | Amendment, dated February 23, 2009, to the amended and restated agreement, dated February 20, 2007, between the registrant and William J. Doyle concerning the Supplemental Executive Retirement Income Plan. | | 10-K | | | 12/31/2008 | | | 10(v) |
| 10(m) | | Amendment, dated February 23, 2009, to the amended and restated agreement, dated August 2, 1996, between the registrant and Wayne R. Brownlee concerning the Supplemental Executive Retirement Income Plan. | | 10-K | | | 12/31/2008 | | | 10(w) |
| | |
| 37 | | PotashCorp 2015 Third Quarter Quarterly Report on Form 10-Q |
| | | | | | | | | | |
| | | | | Incorporated By Reference (File No. 001-10351, unless otherwise indicated) |
Exhibit
Number | | Description of Document | | Form | | Filing Date/Period
End Date | | | Exhibit Number
(if different) |
| 10(n) | | Amendment, dated December 29, 2010, to the amended and restated agreement, dated February 20, 2007, between the registrant and William J. Doyle concerning the Supplemental Executive Retirement Income Plan. | | 10-K | | | 12/31/2010 | | | 10(y) |
| 10(o) | | Amendment, dated December 29, 2010, to the amended and restated agreement, dated August 2, 1996, between the registrant and Wayne R. Brownlee concerning the Supplemental Executive Retirement Income Plan. | | 10-K | | | 12/31/2010 | | | 10(z) |
| 10(p) | | Supplemental Retirement Agreement dated December 24, 2008, between the registrant and Stephen F. Dowdle. | | 10-K | | | 12/31/2011 | | | 10(bb) |
| 10(q) | | Supplemental Retirement Benefits Plan for U.S. Executives dated effective January 1, 1999. | | 10-Q | | | 6/30/2002 | | | 10(aa) |
| 10(r) | | Amendment No. 1, dated December 24, 2008, to the Supplemental Retirement Plan for U.S. Executives. | | 10-K | | | 12/31/2008 | | | 10(z) |
| 10(s) | | Amendment No. 2, dated February 23, 2009, to the Supplemental Retirement Plan for U.S. Executives. | | 10-K | | | 12/31/2008 | | | 10(aa) |
| 10(t) | | Amendment No. 3, dated December 2, 2013, to the Supplemental Retirement Plan for U.S. Executives. | | 10-K | | | 12/31/2013 | | | |
| 10(u) | | Amendment No. 4, dated February 25, 2014 to the Supplemental Retirement Plan for U.S. Executives. | | 10-K | | | 12/31/2013 | | | |
| 10(v) | | Forms of Agreement dated December 30, 1994, between the registrant and certain officers of the registrant. | | 10-K | | | 12/31/1995 | | | 10(p) |
| 10(w) | | Amendment, dated December 31, 2010, to the Agreement, dated December 30, 1994 between the registrant and William J. Doyle. | | 10-K | | | 12/31/2010 | | | 10(ff) |
| 10(x) | | Form of Agreement of Indemnification dated August 8, 1995, between the registrant and certain officers and directors of the registrant. | | 10-K | | | 12/31/1995 | | | 10(q) |
| 10(y) | | Resolution and Form of Agreement of Indemnification dated January 24, 2001. | | 10-K | | | 12/31/2000 | | | 10(ii) |
| 10(z) | | Resolution and Form of Agreement of Indemnification dated July 21, 2004. | | 10-Q | | | 6/30/2004 | | | 10(ii) |
| 10(aa) | | Chief Executive Officer Medical and Dental Benefits. | | 10-K | | | 12/31/2010 | | | 10(jj) |
| 10(bb) | | The Potash Corporation of Saskatchewan Inc. Deferred Share Unit Plan for Non-Employee Directors. | | 10-Q | | | 3/31/2012 | | | 10(ll) |
| 10(cc) | | Potash Corporation of Saskatchewan Inc. 2005 Performance Option Plan and Form of Option Agreement, as amended. | | 10-Q | | | 3/31/2005 | | | 10(nn) |
| 10(dd) | | Potash Corporation of Saskatchewan Inc. 2006 Performance Option Plan and Form of Option Agreement, as amended. | | 10-Q | | | 3/31/2006 | | | |
| 10(ee) | | Potash Corporation of Saskatchewan Inc. 2007 Performance Option Plan and Form of Option Agreement. | | 10-Q | | | 3/31/2007 | | | |
| 10(ff) | | Potash Corporation of Saskatchewan Inc. 2008 Performance Option Plan and Form of Option Agreement. | | 10-Q | | | 3/31/2008 | | | |
| 10(gg) | | Potash Corporation of Saskatchewan Inc. 2009 Performance Option Plan and Form of Option Agreement. | | 10-Q | | | 3/31/2009 | | | 10(mm) |
| 10(hh) | | Potash Corporation of Saskatchewan Inc. 2010 Performance Option Plan and Form of Option Agreement. | | 8-K | | | 5/7/2010 | | | 10.1 |
| 10(ii) | | Potash Corporation of Saskatchewan Inc. 2011 Performance Option Plan and Form of Option Agreement. | | 8-K | | | 5/13/2011 | | | 10(a) |
| 10(jj) | | Potash Corporation of Saskatchewan Inc. 2012 Performance Option Plan and Form of Option Agreement. | | 8-K | | | 5/18/2012 | | | 10(a) |
| 10(kk) | | Potash Corporation of Saskatchewan Inc. 2013 Performance Option Plan and Form of Option Agreement. | | 8-K | | | 5/17/2013 | | | 10(a) |
| 10(ll) | | Potash Corporation of Saskatchewan Inc. 2014 Performance Option Plan and Form of Option Agreement. | | 8-K | | | 5/16/2014 | | | 10(a) |
| 10(mm) | | Potash Corporation of Saskatchewan Inc. 2015 Performance Option Plan and Form of Option Agreement. | | 8-K | | | 5/13/2015 | | | 10(a) |
| | |
| PotashCorp 2015 Third Quarter Quarterly Report on Form 10-Q | | 38 |
| | | | | | | | | | |
| | | | | Incorporated By Reference (File No. 001-10351, unless otherwise indicated) |
Exhibit
Number | | Description of Document | | Form | | Filing Date/Period
End Date | | | Exhibit Number
(if different) |
| 10(nn) | | Medium-Term Incentive Plan of the registrant effective January 1, 2012. | | 10-K | | | 12/31/2011 | | | 10(uu) |
| 10(oo) | | Executive Employment Agreement, dated July 1, 2014, between the registrant and Jochen E. Tilk. | | 10-Q | | | 9/30/2014 | | | 10(nn) |
| 10(pp) | | PCS Supplemental Executive Retirement Plan for Canadian Executives. | | 10-K | | | 12/31/2014 | | | 10(oo) |
| 10(qq) | | CEO Multi-year Incentive Plan. | | 10-K | | | 12/31/2014 | | | 10(pp) |
| 31(a) | | Certification pursuant to Section 302 of the Sarbanes-Oxley Act of 2002. | | | | | | | | |
| 31(b) | | Certification pursuant to Section 302 of the Sarbanes-Oxley Act of 2002. | | | | | | | | |
| 32 | | Certification pursuant to Section 906 of the Sarbanes-Oxley Act of 2002. | | | | | | | | |
| 95 | | Information concerning mine safety violations or other regulatory matters required by Section 1503(a) of the Dodd-Frank Wall Street Reform and Consumer Protection Act. | | | | | | | | |
| | |
| 39 | | PotashCorp 2015 Third Quarter Quarterly Report on Form 10-Q |
Signatures
Pursuant to the requirements of the Securities Exchange Act of 1934, the registrant has duly caused this report to be signed on its behalf by the undersigned, thereunto duly authorized.
| | | | |
| | POTASH CORPORATION OF SASKATCHEWAN INC. |
| | |
| November 3, 2015 | | By: | | /s/ Joseph Podwika |
| | | | Joseph Podwika |
| | | | Senior Vice President, General Counsel and Secretary |
| | |
| November 3, 2015 | | By: | | /s/ Wayne R. Brownlee |
| | | | Wayne R. Brownlee |
| | | | Executive Vice President, Treasurer and Chief Financial Officer (Principal Financial and Accounting Officer) |
| | |
| PotashCorp 2015 Third Quarter Quarterly Report on Form 10-Q | | 40 |
EXHIBIT INDEX
| | | | | | | | | | | | |
| | | | | Incorporated By Reference (File No. 001-10351, unless otherwise indicated) | |
Exhibit
Number | | Description of Document | | Form | | Filing Date/Period
End Date | | | Exhibit Number
(if different) | |
| 3(a) | | Articles of Continuance of the registrant dated May 15, 2002. | | 10-Q | | | 6/30/2002 | | | | | |
| 3(b) | | General By-Law of the registrant, as amended, effective April 27, 2015. | | 8-K | | | 4/27/2015 | | | | 3 | (a) |
| 4(a) | | Indenture dated as of February 27, 2003, between the registrant and U.S. Bank National Association, as successor to The Bank of Nova Scotia Trust Company of New York. | | 10-K | | | 12/31/2002 | | | | 4 | (c) |
| 4(b) | | Form of Note relating to the registrant’s offering of $500,000,000 principal amount of 5.875% Notes due December 1, 2036. | | 8-K | | | 11/30/2006 | | | | 4 | (a) |
| 4(c) | | Form of Note relating to the registrant’s offering of $500,000,000 principal amount of 6.50% Notes due May 15, 2019. | | 8-K | | | 5/1/2009 | | | | 4 | (b) |
| 4(d) | | Form of Note relating to the registrant’s offering of $500,000,000 principal amount of 4.875% Notes due March 30, 2020. | | 8-K | | | 9/25/2009 | | | | 4 | (b) |
| 4(e) | | Form of Note relating to the registrant’s offering of $750,000,000 principal amount of 3.625% Notes due March 15, 2024. | | 8-K | | | 3/7/2014 | | | | 4 | (a) |
| 4(f) | | Form of Note relating to the registrant’s offering of $500,000,000 principal amount of 3.000% Notes due April 1, 2025. | | 8-K | | | 3/26/2015 | | | | 4 | (a) |
| 4(g) | | Revolving Term Credit Facility Agreement between the Bank of Nova Scotia and other financial institutions and the registrant dated December 11, 2009. | | 8-K | | | 12/15/2009 | | | | 4 | (a) |
| 4(h) | | Revolving Term Credit Facility First Amending Agreement between the Bank of Nova Scotia and other financial institutions and the registrant dated September 23, 2011. | | 8-K | | | 9/26/2011 | | | | 4 | (a) |
| 4(i) | | Revolving Term Credit Facility Second Amending Agreement between the Bank of Nova Scotia and other financial institutions and the registrant dated as of May 24, 2013. | | 8-K | | | 5/28/2013 | | | | 4 | (a) |
| 4(j) | | Form of Note relating to the registrant’s offering of $500,000,000 principal amount of 3.25% Notes due December 1, 2017. | | 8-K | | | 11/29/2010 | | | | 4 | (a) |
| 4(k) | | Form of Note relating to the registrant’s offering of $500,000,000 principal amount of 5.625% Notes due December 1, 2040. | | 8-K | | | 11/29/2010 | | | | 4 | (b) |
| 4(l) | | Agreement of Resignation, Appointment and Acceptance, dated as of June 25, 2013, by and among the registrant, The Bank of Nova Scotia Trust Company of New York and U.S. Bank National Association. | | 8-K | | | 6/27/2013 | | | | 4 | (a) |
| 4(m) | | Revolving Term Credit Facility Third Amending Agreement between the Bank of Nova Scotia and other financial institutions and the registrant dated July 8, 2014. | | 10-Q | | | 07/29/2014 | | | | | |
The registrant hereby undertakes to file with the Securities and Exchange Commission, upon request, copies of any constituent instruments defining the rights of holders of long-term debt of the registrant or its subsidiaries that have not been filed herewith because the amounts represented thereby are less than 10% of the total assets of the registrant and its subsidiaries on a consolidated basis.
| | | | | | | | | | |
| | | | | Incorporated By Reference (File No. 001-10351, unless otherwise indicated) |
Exhibit
Number | | Description of Document | | Form | | Filing Date/Period
End Date | | | Exhibit Number
(if different) |
| 10(a) | | Consolidated, Restated and Amended Canpotex Shareholders’ Agreement, Eighth Memorandum of Agreement dated January 1, 2014 between Agrium Inc., Mosaic Canada Crop Nutrition, LP, by its general partner, 4379934 Canada Ltd., the registrant and Canpotex Limited. | | 10-K | | | 12/31/2013 | | | |
| 10(b) | | Consolidated, Restated and Amended Producer Agreement, Eighth Memorandum of Agreement dated January 1, 2014 between Canpotex Limited, Agrium Inc., Mosaic Canada Crop Nutrition, LP, by its general partner, 4379934 Canada Ltd. and the registrant. | | 10-K | | | 12/31/2013 | | | |
| 10(c) | | Short-Term Incentive Plan of the registrant effective January 1, 2000, as amended. | | 8-K | | | 3/13/2012 | | | 10(a) |
| | |
| PotashCorp 2015 Third Quarter Quarterly Report on Form 10-Q | | 36 |
| | | | | | | | | | |
| | | | | Incorporated By Reference (File No. 001-10351, unless otherwise indicated) |
Exhibit
Number | | Description of Document | | Form | | Filing Date/Period
End Date | | | Exhibit Number
(if different) |
| 10(d) | | Resolution and Forms of Agreement for Supplemental Executive Retirement Income Plan, for officers and key employees of the registrant. | | 10-K | | | 12/31/1995 | | | 10(o) |
| 10(e) | | Amending Resolution and revised forms of agreement regarding Supplemental Retirement Income Plan of the registrant. | | 10-Q | | | 6/30/1996 | | | 10(x) |
| 10(f) | | Amended and restated Supplemental Executive Retirement Income Plan of the registrant and text of amendment to existing supplemental income plan agreements. | | 10-Q | | | 9/30/2000 | | | 10(mm) |
| 10(g) | | Amendment, dated February 23, 2009, to the amended and restated Supplemental Executive Retirement Income Plan. | | 10-K | �� | | 12/31/2008 | | | 10(r) |
| 10(h) | | Amendment, dated December 29, 2010, to the amended and restated Supplemental Executive Retirement Income Plan. | | 10-K | | | 12/31/2010 | | | 10(r) |
| 10(i) | | Form of Letter of amendment to existing supplemental income plan agreements of the registrant. | | 10-K | | | 12/31/2002 | | | 10(cc) |
| 10(j) | | Amended and restated agreement dated February 20, 2007, between the registrant and William J. Doyle concerning the Supplemental Executive Retirement Income Plan. | | 10-K | | | 12/31/2006 | | | 10(s) |
| 10(k) | | Amendment, dated December 24, 2008, to the amended and restated agreement, dated February 20, 2007, between the registrant and William J. Doyle concerning the Supplemental Executive Retirement Income Plan. | | 10-K | | | 12/31/2008 | | | 10(u) |
| 10(l) | | Amendment, dated February 23, 2009, to the amended and restated agreement, dated February 20, 2007, between the registrant and William J. Doyle concerning the Supplemental Executive Retirement Income Plan. | | 10-K | | | 12/31/2008 | | | 10(v) |
| 10(m) | | Amendment, dated February 23, 2009, to the amended and restated agreement, dated August 2, 1996, between the registrant and Wayne R. Brownlee concerning the Supplemental Executive Retirement Income Plan. | | 10-K | | | 12/31/2008 | | | 10(w) |
| 10(n) | | Amendment, dated December 29, 2010, to the amended and restated agreement, dated February 20, 2007, between the registrant and William J. Doyle concerning the Supplemental Executive Retirement Income Plan. | | 10-K | | | 12/31/2010 | | | 10(y) |
| 10(o) | | Amendment, dated December 29, 2010, to the amended and restated agreement, dated August 2, 1996, between the registrant and Wayne R. Brownlee concerning the Supplemental Executive Retirement Income Plan. | | 10-K | | | 12/31/2010 | | | 10(z) |
| 10(p) | | Supplemental Retirement Agreement dated December 24, 2008, between the registrant and Stephen F. Dowdle. | | 10-K | | | 12/31/2011 | | | 10(bb) |
| 10(q) | | Supplemental Retirement Benefits Plan for U.S. Executives dated effective January 1, 1999. | | 10-Q | | | 6/30/2002 | | | 10(aa) |
| 10(r) | | Amendment No. 1, dated December 24, 2008, to the Supplemental Retirement Plan for U.S. Executives. | | 10-K | | | 12/31/2008 | | | 10(z) |
| 10(s) | | Amendment No. 2, dated February 23, 2009, to the Supplemental Retirement Plan for U.S. Executives. | | 10-K | | | 12/31/2008 | | | 10(aa) |
| 10(t) | | Amendment No. 3, dated December 2, 2013, to the Supplemental Retirement Plan for U.S. Executives. | | 10-K | | | 12/31/2013 | | | |
| 10(u) | | Amendment No. 4, dated February 25, 2014 to the Supplemental Retirement Plan for U.S. Executives. | | 10-K | | | 12/31/2013 | | | |
| 10(v) | | Forms of Agreement dated December 30, 1994, between the registrant and certain officers of the registrant. | | 10-K | | | 12/31/1995 | | | 10(p) |
| 10(w) | | Amendment, dated December 31, 2010, to the Agreement, dated December 30, 1994 between the registrant and William J. Doyle. | | 10-K | | | 12/31/2010 | | | 10(ff) |
| 10(x) | | Form of Agreement of Indemnification dated August 8, 1995, between the registrant and certain officers and directors of the registrant. | | 10-K | | | 12/31/1995 | | | 10(q) |
| 10(y) | | Resolution and Form of Agreement of Indemnification dated January 24, 2001. | | 10-K | | | 12/31/2000 | | | 10(ii) |
| 10(z) | | Resolution and Form of Agreement of Indemnification dated July 21, 2004. | | 10-Q | | | 6/30/2004 | | | 10(ii) |
| 10(aa) | | Chief Executive Officer Medical and Dental Benefits. | | 10-K | | | 12/31/2010 | | | 10(jj) |
| | |
| 37 | | PotashCorp 2015 Third Quarter Quarterly Report on Form 10-Q |
| | | | | | | | | | |
| | | | | Incorporated By Reference (File No. 001-10351, unless otherwise indicated) |
Exhibit
Number | | Description of Document | | Form | | Filing Date/Period
End Date | | | Exhibit Number
(if different) |
| 10(bb) | | The Potash Corporation of Saskatchewan Inc. Deferred Share Unit Plan for Non-Employee Directors. | | 10-Q | | | 3/31/2012 | | | 10(ll) |
| 10(cc) | | Potash Corporation of Saskatchewan Inc. 2005 Performance Option Plan and Form of Option Agreement, as amended. | | 10-Q | | | 3/31/2005 | | | 10(nn) |
| 10(dd) | | Potash Corporation of Saskatchewan Inc. 2006 Performance Option Plan and Form of Option Agreement, as amended. | | 10-Q | | | 3/31/2006 | | | |
| 10(ee) | | Potash Corporation of Saskatchewan Inc. 2007 Performance Option Plan and Form of Option Agreement. | | 10-Q | | | 3/31/2007 | | | |
| 10(ff) | | Potash Corporation of Saskatchewan Inc. 2008 Performance Option Plan and Form of Option Agreement. | | 10-Q | | | 3/31/2008 | | | |
| 10(gg) | | Potash Corporation of Saskatchewan Inc. 2009 Performance Option Plan and Form of Option Agreement. | | 10-Q | | | 3/31/2009 | | | 10(mm) |
| 10(hh) | | Potash Corporation of Saskatchewan Inc. 2010 Performance Option Plan and Form of Option Agreement. | | 8-K | | | 5/7/2010 | | | 10.1 |
| 10(ii) | | Potash Corporation of Saskatchewan Inc. 2011 Performance Option Plan and Form of Option Agreement. | | 8-K | | | 5/13/2011 | | | 10(a) |
| 10(jj) | | Potash Corporation of Saskatchewan Inc. 2012 Performance Option Plan and Form of Option Agreement. | | 8-K | | | 5/18/2012 | | | 10(a) |
| 10(kk) | | Potash Corporation of Saskatchewan Inc. 2013 Performance Option Plan and Form of Option Agreement. | | 8-K | | | 5/17/2013 | | | 10(a) |
| 10(ll) | | Potash Corporation of Saskatchewan Inc. 2014 Performance Option Plan and Form of Option Agreement. | | 8-K | | | 5/16/2014 | | | 10(a) |
| 10(mm) | | Potash Corporation of Saskatchewan Inc. 2015 Performance Option Plan and Form of Option Agreement. | | 8-K | | | 5/13/2015 | | | 10(a) |
| 10(nn) | | Medium-Term Incentive Plan of the registrant effective January 1, 2012. | | 10-K | | | 12/31/2011 | | | 10(uu) |
| 10(oo) | | Executive Employment Agreement, dated July 1, 2014, between the registrant and Jochen E. Tilk. | | 10-Q | | | 9/30/2014 | | | 10(nn) |
| 10(pp) | | PCS Supplemental Executive Retirement Plan for Canadian Executives. | | 10-K | | | 12/31/2014 | | | 10(oo) |
| 10(qq) | | CEO Multi-year Incentive Plan. | | 10-K | | | 12/31/2014 | | | 10(pp) |
| 31(a) | | Certification pursuant to Section 302 of the Sarbanes-Oxley Act of 2002. | | | | | | | | |
| 31(b) | | Certification pursuant to Section 302 of the Sarbanes-Oxley Act of 2002. | | | | | | | | |
| 32 | | Certification pursuant to Section 906 of the Sarbanes-Oxley Act of 2002. | | | | | | | | |
| 95 | | Information concerning mine safety violations or other regulatory matters required by Section 1503(a) of the Dodd-Frank Wall Street Reform and Consumer Protection Act. | | | | | | | | |
| | |
| PotashCorp 2015 Third Quarter Quarterly Report on Form 10-Q | | 38 |