UNITED STATES SECURITIES AND EXCHANGE COMMISSION
Washington, D.C. 20549
Form 10-Q
| þ | QUARTERLY REPORT PURSUANT TO SECTION 13 OR 15(d) OF THE SECURITIES EXCHANGE ACT OF 1934 |
For the Quarterly Period Ended June 30, 2016
OR
| ¨ | TRANSITION REPORT PURSUANT TO SECTION 13 OR 15(d) OF THE SECURITIES EXCHANGE ACT OF 1934 |
Commission File Number 1-10351
Potash Corporation of Saskatchewan Inc.
(Exact name of registrant as specified in its charter)
| | |
| Canada | | N/A |
(State or other jurisdiction of incorporation or organization) | | (I.R.S. Employer Identification No.) |
| |
122 — 1st Avenue South Saskatoon, Saskatchewan, Canada (Address of principal executive offices) | | S7K 7G3 (Zip Code) |
306-933-8500
(Registrant’s telephone number, including area code)
Indicate by check mark whether the registrant (1) has filed all reports required to be filed by Sections 13 or 15(d) of the Securities Exchange Act of 1934 during the preceding 12 months (or for such shorter period that the registrant was required to file such reports), and (2) has been subject to such filing requirements for the past 90 days.
Yes þ No ¨
Indicate by check mark whether the registrant has submitted electronically and posted on its corporate Web site, if any, every Interactive Data File required to be submitted and posted pursuant to Rule 405 of Regulation S-T during the preceding 12 months (or for such shorter period that the registrant was required to submit and post such files).
Yes ¨ No ¨
Indicate by check mark whether the registrant is a large accelerated filer, an accelerated filer, a non-accelerated filer, or a smaller reporting company. See the definitions of “large accelerated filer,” “accelerated filer” and “smaller reporting company” in Rule 12b-2 of the Exchange Act. (Check one):
| | | | | | |
| Large accelerated filer þ | | Accelerated filer ¨ | | Non-accelerated filer ¨ | | Smaller reporting company ¨ |
| | | | (Do not check if a smaller reporting company) | | |
Indicate by check mark whether the registrant is a shell company (as defined in Exchange Act Rule 12b-2).
Yes ¨ No þ
As at June 30, 2016, Potash Corporation of Saskatchewan Inc. had 839,432,689 Common Shares outstanding.
Part I. Financial Information
Item 1. Financial Statements
Condensed Consolidated Statements of Income
| | | | | | | | | | | | | | | | | | | | | | | | | | | | | | | | |
Unaudited | | | | | | | | | | | | | | | | | In millions of US dollars except as otherwise noted | |
| | | | | | Three Months Ended June 30 | | | | | | Six Months Ended June 30 | |
| | | | | | 2016 | | | | | | 2015 | | | | | | 2016 | | | | | | 2015 | |
Sales(Note 2) | | | | | | $ | 1,053 | | | | | | | $ | 1,731 | | | | | | | $ | 2,262 | | | | | | | $ | 3,396 | |
Freight, transportation and distribution | | | | | | | (118 | ) | | | | | | | (124 | ) | | | | | | | (251 | ) | | | | | | | (252 | ) |
Cost of goods sold | | | | | | | (692 | ) | | | | | | | (896 | ) | | | | | | | (1,534 | ) | | | | | | | (1,766 | ) |
Gross Margin | | | | | | | 243 | | | | | | | | 711 | | | | | | | | 477 | | | | | | | | 1,378 | |
Selling and administrative expenses | | | | | | | (55 | ) | | | | | | | (60 | ) | | | | | | | (108 | ) | | | | | | | (120 | ) |
Provincial mining and other taxes | | | | | | | (26 | ) | | | | | | | (90 | ) | | | | | | | (57 | ) | | | | | | | (185 | ) |
Share of earnings of equity-accounted investees | | | | | | | 30 | | | | | | | | 35 | | | | | | | | 49 | | | | | | | | 71 | |
Dividend income | | | | | | | 16 | | | | | | | | 31 | | | | | | | | 16 | | | | | | | | 31 | |
Impairment of available-for-sale investment (Note 3) | | | | | | | (10 | ) | | | | | | | — | | | | | | | | (10 | ) | | | | | | | — | |
Other income (expenses) (Note 4) | | | | | | | 1 | | | | | | | | (8 | ) | | | | | | | (9 | ) | | | | | | | 3 | |
Operating Income | | | | | | | 199 | | | | | | | | 619 | | | | | | | | 358 | | | | | | | | 1,178 | |
Finance costs | | | | | | | (54 | ) | | | | | | | (50 | ) | | | | | | | (106 | ) | | | | | | | (99 | ) |
Income Before Income Taxes | | | | | | | 145 | | | | | | | | 569 | | | | | | | | 252 | | | | | | | | 1,079 | |
Income taxes (Note 5) | | | | | | | (24 | ) | | | | | | | (152 | ) | | | | | | | (56 | ) | | | | | | | (292 | ) |
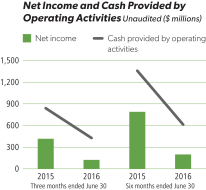
Net Income | | | | | | $ | 121 | | | | | | | $ | 417 | | | | | | | $ | 196 | | | | | | | $ | 787 | |
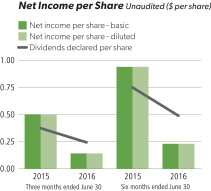
Net Income per Share | | | | | | | | | | | | | | | | | | | | | | | | | | | | | | | | |
Basic | | | | | | $ | 0.14 | | | | | | | $ | 0.50 | | | | | | | $ | 0.23 | | | | | | | $ | 0.94 | |
Diluted | | | | | | $ | 0.14 | | | | | | | $ | 0.50 | | | | | | | $ | 0.23 | | | | | | | $ | 0.94 | |
Weighted Average Shares Outstanding | | | | | | | | | | | | | | | | | | | | | | | | | | | | | | | | |
Basic | | | | | | | 839,285,000 | | | | | | | | 834,441,000 | | | | | | | | 838,202,000 | | | | | | | | 832,924,000 | |
Diluted | | | | | | | 839,786,000 | | | | | | | | 837,746,000 | | | | | | | | 839,028,000 | | | | | | | | 837,399,000 | |
(See Notes to the Condensed Consolidated Financial Statements)
| | |
| 1 | | PotashCorp 2016 Second Quarter Quarterly Report on Form 10-Q |
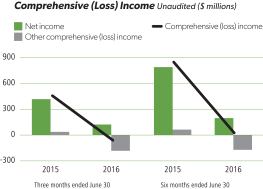
Condensed Consolidated Statements of Comprehensive (Loss) Income
| | | | | | | | | | | | | | | | | | | | | | | | |
Unaudited | | | | | | | | | | | | | | In millions of US dollars | |
| | | | | Three Months Ended June 30 | | | | | Six Months Ended June 30 | |
| (Net of related income taxes) | | | | 2016 | | | | | 2015 | | | | | 2016 | | | | | 2015 | |
Net Income | | | | $ | 121 | | | | | $ | 417 | | | | | $ | 196 | | | | | $ | 787 | |
Other comprehensive (loss) income | | | | | | | | | | | | | | | | | | | | | | | | |
Items that will not be reclassified to net income: | | | | | | | | | | | | | | | | | | | | | | | | |
Net actuarial loss on defined benefit plans(1) | | | | | (103 | ) | | | | | — | | | | | | (103 | ) | | | | | — | |
Items that have been or may be subsequently reclassified to net income: | | | | | | | | | | | | | | | | | | | | | | | | |
Available-for-sale investments (2) | | | | | | | | | | | | | | | | | | | | | | | | |
Net fair value (loss) gain during the period | | | | | (104 | ) | | | | | 21 | | | | | | (103 | ) | | | | | 59 | |
Cash flow hedges | | | | | | | | | | | | | | | | | | | | | | | | |
Net fair value gain (loss) during the period(3) | | | | | 9 | | | | | | 1 | | | | | | 3 | | | | | | (21 | ) |
Reclassification to income of net loss(4) | | | | | 13 | | | | | | 15 | | | | | | 28 | | | | | | 26 | |
Other | | | | | 1 | | | | | | — | | | | | | 2 | | | | | | (4 | ) |
Other Comprehensive (Loss) Income | | | | | (184 | ) | | | | | 37 | | | | | | (173 | ) | | | | | 60 | |
Comprehensive (Loss) Income | | | | $ | (63 | ) | | | | $ | 454 | | | | | $ | 23 | | | | | $ | 847 | |
| (1) | Net of income taxes of $60 (2015 — $NIL) for the three and six months ended June 30, 2016. |
| (2) | Available-for-sale investments are comprised of shares in Israel Chemicals Ltd., Sinofert Holdings Limited and other. |
| (3) | Cash flow hedges are comprised of natural gas derivative instruments and treasury lock derivatives and were net of income taxes of $(5) (2015 — $NIL) for the three months ended June 30, 2016 and $(2) (2015 — $12) for the six months ended June 30, 2016. |
| (4) | Net of income taxes of $(8) (2015 — $(8)) for the three months ended June 30, 2016 and $(16) (2015 — $(14)) for the six months ended June 30, 2016. |
(See Notes to the Condensed Consolidated Financial Statements)
| | |
| PotashCorp 2016 Second Quarter Quarterly Report on Form 10-Q | | 2 |
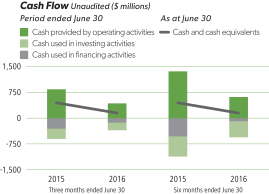
Condensed Consolidated Statements of Cash Flow
| | | | | | | | | | | | | | | | | | | | | | | | | | | | | | |
Unaudited | | | | | | | | | | In millions of US dollars | |
| | | | | | Three Months Ended June 30 | | | | | Six Months Ended June 30 | |
| | | | | | 2016 | | | | | | 2015 | | | | | 2016 | | | | | | 2015 | |
Operating Activities | | | | | | | | | | | | | | | | | | | | | | | | | | | | | | |
Net income | | | | | | $ | 121 | | | | | | | $ | 417 | | | | | $ | 196 | | | | | | | $ | 787 | |
Adjustments to reconcile net income to cash provided by operating activities (Note 6) | | | | | | | 259 | | | | | | | | 248 | | | | | | 465 | | | | | | | | 429 | |
Changes in non-cash operating working capital (Note 6) | | | | | | | 44 | | | | | | | | 171 | | | | | | (49 | ) | | | | | | | 141 | |
Cash provided by operating activities | | | | | | | 424 | | | | | | | | 836 | | | | | | 612 | | | | | | | | 1,357 | |
Investing Activities | | | | | | | | | | | | | | | | | | | | | | | | | | | | | | |
Additions to property, plant and equipment | | | | | | | (211 | ) | | | | | | | (294 | ) | | | | | (457 | ) | | | | | | | (522 | ) |
Other assets and intangible assets | | | | | | | (9 | ) | | | | | | | (10 | ) | | | | | (9 | ) | | | | | | | (15 | ) |
Cash used in investing activities | | | | | | | (220 | ) | | | | | | | (304 | ) | | | | | (466 | ) | | | | | | | (537 | ) |
Financing Activities | | | | | | | | | | | | | | | | | | | | | | | | | | | | | | |
Proceeds from long-term debt obligations | | | | | | | — | | | | | | | | — | | | | | | — | | | | | | | | 494 | |
Finance costs on long-term debt obligations | | | | | | | (2 | ) | | | | | | | — | | | | | | (4 | ) | | | | | | | — | |
Proceeds from (repayment of) short-term debt obligations | | | | | | | 68 | | | | | | | | — | | | | | | 404 | | | | | | | | (536 | ) |
Dividends | | | | | | | (206 | ) | | | | | | | (312 | ) | | | | | (519 | ) | | | | | | | (586 | ) |
Issuance of common shares | | | | | | | 5 | | | | | | | | 12 | | | | | | 25 | | | | | | | | 42 | |
Cash used in financing activities | | | | | | | (135 | ) | | | | | | | (300 | ) | | | | | (94 | ) | | | | | | | (586 | ) |
Increase in Cash and Cash Equivalents | | | | | | | 69 | | | | | | | | 232 | | | | | | 52 | | | | | | | | 234 | |
Cash and Cash Equivalents, Beginning of Period | | | | | | | 74 | | | | | | | | 217 | | | | | | 91 | | | | | | | | 215 | |
Cash and Cash Equivalents, End of Period | | | | | | $ | 143 | | | | | | | $ | 449 | | | | | $ | 143 | | | | | | | $ | 449 | |
Cash and cash equivalents comprised of: | | | | | | | | | | | | | | | | | | | | | | | | | | | | | | |
Cash | | | | | | $ | 31 | | | | | | | $ | 62 | | | | | $ | 31 | | | | | | | $ | 62 | |
Short-term investments | | | | | | | 112 | | | | | | | | 387 | | | | | | 112 | | | | | | | | 387 | |
| | | | | | | $ | 143 | | | | | | | $ | 449 | | | | | $ | 143 | | | | | | | $ | 449 | |
(See Notes to the Condensed Consolidated Financial Statements)
| | |
| 3 | | PotashCorp 2016 Second Quarter Quarterly Report on Form 10-Q |
Condensed Consolidated Statements of Changes in Equity
| | | | | | | | | | | | | | | | | | | | | | | | | | | | | | | | | | | | | | |
Unaudited | | | | In millions of US dollars | |
| | | | | | | | | | | Accumulated Other Comprehensive (Loss) Income | | | | | | | |
| | | | | Share
Capital | | | Contributed
Surplus | | | Net unrealized
gain (loss) on
available-for-
sale
investments | | | Net (loss)
gain on
derivatives
designated as
cash flow
hedges | | | Net
actuarial loss on defined
benefit
plans | | | Other | | | Total
Accumulated
Other
Comprehensive
(Loss) Income | | | Retained
Earnings | | | Total
Equity (1) | |
Balance — December 31, 2015 | | | | $ | 1,747 | | | $ | 230 | | | $ | 77 | | | $ | (117 | ) | | $ | — | (2) | | $ | (10 | ) | | $ | (50 | ) | | $ | 6,455 | | | $ | 8,382 | |
Net income | | | | | — | | | | — | | | | — | | | | — | | | | — | | | | — | | | | — | | | | 196 | | | | 196 | |
Other comprehensive (loss) income | | | | | — | | | | — | | | | (103 | ) | | | 31 | | | | (103 | ) | | | 2 | | | | (173 | ) | | | — | | | | (173 | ) |
Dividends declared | | | | | — | | | | — | | | | — | | | | — | | | | — | | | | — | | | | — | | | | (421 | ) | | | (421 | ) |
Effect of share-based compensation including issuance of common shares | | | | | 35 | | | | (5 | ) | | | — | | | | — | | | | — | | | | — | | | | — | | | | — | | | | 30 | |
Shares issued for dividend reinvestment plan | | | | | 10 | | | | — | | | | — | | | | — | | | | — | | | | — | | | | — | | | | — | | | | 10 | |
Transfer of net actuarial loss on defined benefit plans | | | | | — | | | | — | | | | — | | | | — | | | | 103 | | | | — | | | | 103 | | | | (103 | ) | | | — | |
Balance — June 30, 2016 | | | | $ | 1,792 | | | $ | 225 | | | $ | (26 | ) | | $ | (86 | ) | | $ | — | (2) | | $ | (8 | ) | | $ | (120 | ) | | $ | 6,127 | | | $ | 8,024 | |
Balance — December 31, 2014 | | | | $ | 1,632 | | | $ | 234 | | | $ | 623 | | | $ | (119 | ) | | $ | — | (2) | | $ | (1 | ) | | $ | 503 | | | $ | 6,423 | | | $ | 8,792 | |
Net income | | | | | — | | | | — | | | | — | | | | — | | | | — | | | | — | | | | — | | | | 787 | | | | 787 | |
Other comprehensive income (loss) | | | | | — | | | | — | | | | 59 | | | | 5 | | | | — | | | | (4 | ) | | | 60 | | | | — | | | | 60 | |
Dividends declared | | | | | — | | | | — | | | | — | | | | — | | | | — | | | | — | | | | — | | | | (635 | ) | | | (635 | ) |
Effect of share-based compensation including issuance of common shares | | | | | 56 | | | | 1 | | | | — | | | | — | | | | — | | | | — | | | | — | | | | — | | | | 57 | |
Shares issued for dividend reinvestment plan | | | | | 24 | | | | — | | | | — | | | | — | | | | — | | | | — | | | | — | | | | — | | | | 24 | |
Balance — June 30, 2015 | | | | $ | 1,712 | | | $ | 235 | | | $ | 682 | | | $ | (114 | ) | | $ | — | (2) | | $ | (5 | ) | | $ | 563 | | | $ | 6,575 | | | $ | 9,085 | |
| (1) | All equity transactions were attributable to common shareholders. |
| (2) | Any amounts incurred during a period are closed out to retained earnings at each period-end. Therefore, no balance exists at the beginning or end of period. |
(See Notes to the Condensed Consolidated Financial Statements)
| | |
| PotashCorp 2016 Second Quarter Quarterly Report on Form 10-Q | | 4 |
Condensed Consolidated Statements of Financial Position
| | | | | | | | | | | | | | |
| Unaudited | | | | In millions of US dollars except as otherwise noted | |
| | | | |
| As at | | | | June 30,
2016 | | | | | | December 31,
2015 | |
Assets | | | | | | | | | | | | | | |
Current assets | | | | | | | | | | | | | | |
Cash and cash equivalents | | | | $ | 143 | | | | | | | $ | 91 | |
Receivables | | | | | 534 | | | | | | | | 640 | |
Inventories (Note 7) | | | | | 805 | | | | | | | | 749 | |
Prepaid expenses and other current assets | | | | | 68 | | | | | | | | 73 | |
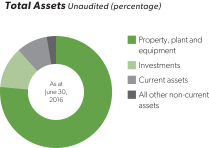
| | | | | 1,550 | | | | | | | | 1,553 | |
Non-current assets | | | | | | | | | | | | | | |
Property, plant and equipment | | | | | 13,245 | | | | | | | | 13,212 | |
Investments in equity-accounted investees | | | | | 1,199 | | | | | | | | 1,243 | |
Available-for-sale investments (Note 3) | | | | | 871 | | | | | | | | 984 | |
Other assets | | | | | 276 | | | | | | | | 285 | |
Intangible assets | | | | | 185 | | | | | | | | 192 | |
Total Assets | | | | $ | 17,326 | | | | | | | $ | 17,469 | |
Liabilities | | | | | | | | | | | | | | |
Current liabilities | | | | | | | | | | | | | | |
Short-term debt and current portion of long-term debt | | | | $ | 921 | | | | | | | $ | 517 | |
Payables and accrued charges | | | | | 819 | | | | | | | | 1,146 | |
Current portion of derivative instrument liabilities | | | | | 62 | | | | | | | | 84 | |
| | | | | 1,802 | | | | | | | | 1,747 | |
Non-current liabilities | | | | | | | | | | | | | | |
Long-term debt | | | | | 3,713 | | | | | | | | 3,710 | |
Derivative instrument liabilities | | | | | 77 | | | | | | | | 109 | |
Deferred income tax liabilities | | | | | 2,399 | | | | | | | | 2,438 | |
Pension and other post-retirement benefit liabilities (Note 8) | | | | | 613 | | | | | | | | 431 | |
Asset retirement obligations and accrued environmental costs | | | | | 623 | | | | | | | | 574 | |
Other non-current liabilities and deferred credits | | | | | 75 | | | | | | | | 78 | |
Total Liabilities | | | | | 9,302 | | | | | | | | 9,087 | |
Shareholders’ Equity | | | | | | | | | | | | | | |
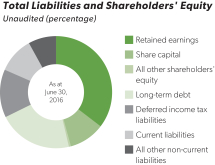
Share capital (Note 9) | | | | | 1,792 | | | | | | | | 1,747 | |
Contributed surplus | | | | | 225 | | | | | | | | 230 | |
Accumulated other comprehensive loss | | | | | (120 | ) | | | | | | | (50 | ) |
Retained earnings | | | | | 6,127 | | | | | | | | 6,455 | |
Total Shareholders’ Equity | | | | | 8,024 | | | | | | | | 8,382 | |
Total Liabilities and Shareholders’ Equity | | | | $ | 17,326 | | | | | | | $ | 17,469 | |
(See Notes to the Condensed Consolidated Financial Statements)
| | |
| 5 | | PotashCorp 2016 Second Quarter Quarterly Report on Form 10-Q |
Notes to the Condensed Consolidated Financial Statements
For the Three and Six Months Ended June 30, 2016
Unaudited | In millions of US dollars except as otherwise noted |
1. Significant Accounting Policies
Basis of Presentation
With its subsidiaries, Potash Corporation of Saskatchewan Inc. (“PCS”) — together known as “PotashCorp” or “the company” except to the extent the context otherwise requires — forms an integrated fertilizer and related industrial and feed products company. These unaudited interim condensed consolidated financial statements are based on International Financial Reporting Standards as issued by the International Accounting Standards Board (“IFRS”), and have been prepared in accordance with International Accounting Standard (“IAS”) 34, “Interim Financial Reporting.” The accounting policies and methods of computation used in preparing these unaudited interim condensed consolidated financial statements are consistent with those used in the preparation of the company’s 2015 annual consolidated financial statements.
These unaudited interim condensed consolidated financial statements include the accounts of PCS and its subsidiaries; however, they do not include all disclosures normally provided in annual consolidated financial statements and should be read in conjunction with the company’s 2015 annual consolidated financial statements. In management’s opinion, the unaudited interim condensed consolidated financial statements include all adjustments necessary to fairly present such information. Interim results are not necessarily indicative of the results expected for any other interim period or the fiscal year.
These unaudited interim condensed consolidated financial statements were authorized by the audit committee of the Board of Directors for issue on August 3, 2016.
Standards, Amendments and Interpretations Effective and Applied
The International Accounting Standards Board (“IASB”) and International Financial Reporting Interpretations Committee (“IFRIC”) have issued the following standards and amendments or interpretations to existing standards that were effective and applied by the company.
| | | | | | | | |
| Standard | | | | Description | | | | Impact |
| Amendments to IAS 1, Presentation of Financial Statements | | | | Issued to improve the effectiveness of presentation and disclosure in financial reports, with the objective of reducing immaterial note disclosures. | | | | Adopted prospectively effective January 1, 2016 with no change to the company’s interim condensed consolidated financial statements. Immaterial disclosures are expected to be removed from the company’s annual consolidated financial statements. |
| Amendments to IAS 16, Property, Plant and Equipment and IAS 38, Intangible Assets | | | | Issued to clarify acceptable methods of depreciation and amortization. | | | | Adopted prospectively effective January 1, 2016 with no change to the company’s consolidated financial statements. |
| Amendments to IFRS 11, Joint Arrangements | | | | Issued to provide additional guidance on accounting for the acquisition of an interest in a joint operation. | | | | Adopted prospectively effective January 1, 2016 with no change to the company’s consolidated financial statements. |
Standards, Amendments and Interpretations Not Yet Effective and Not Applied
The IASB and IFRIC have issued the following standards and amendments or interpretations to existing standards that were not yet effective and not applied as at June 30, 2016. The company does not anticipate early adoption of these standards at this time.
| | | | | | | | | | | | |
| Standard | | | | Description | | | | Expected Impact | | | | Effective Date (1) |
| Amendments to IAS 7, Statement of Cash Flows | | | | Issued to require a reconciliation of the opening and closing liabilities that form part of an entity’s financing activities, including both changes arising from cash flows and non-cash changes. | | | | The company is reviewing the standard to determine the potential impact. | | | | January 1, 2017, applied prospectively. |
| | |
| PotashCorp 2016 Second Quarter Quarterly Report on Form 10-Q | | 6 |
| | | | | | | | | | | | |
| Standard | | | | Description | | | | Expected Impact | | | | Effective Date (1) |
| Amendments to IAS 12, Income Taxes | | | | Issued to clarify the requirements on recognition of deferred tax assets for unrealized losses on debt instruments measured at fair value. | | | | The company is reviewing the standard to determine the potential impact, if any; however, no significant impact is anticipated. | | | | January 1, 2017, applied retrospectively with certain practical expedients available. |
| IFRS 15, Revenue From Contracts With Customers | | | | Issued to provide guidance on the recognition of revenue from contracts with customers, including multiple-element arrangements and transactions not previously addressed comprehensively, and to enhance disclosures about revenue. | | | | The company is reviewing the standard to determine the potential impact, if any. | | | | January 1, 2018, applied retrospectively with certain practical expedients available. |
| IFRS 9, Financial Instruments | | | | Issued to replace IAS 39, providing guidance on the classification, measurement and disclosure of financial instruments and introducing a new hedge accounting model. | | | | The company is reviewing the standard to determine the potential impact, if any. | | | | January 1, 2018, applied retrospectively with certain exceptions. |
| Amendments to IFRS 2, Share-based Payment | | | | Issued to provide clarification on the classification and measurement of share-based transactions. Specifically, accounting for cash-settled share-based transactions, share-based payment transactions with a net settlement feature and modifications of share-based payment transactions that change classification from cash-settled to equity settled. | | | | The company is reviewing the standard to determine the potential impact, if any. | | | | January 1, 2018, with the option of retrospective or prospective application. |
| IFRS 16, Leases | | | | Issued to supersede IAS 17, IFRIC 4, SIC-15 and SIC-27, providing the principles for the recognition, measurement, presentation and disclosure of leases. Lessees would be required to recognize assets and liabilities for the rights and obligations created by leases. Lessors would continue to classify leases using a similar approach to that of the superseded standards but with enhanced disclosure to improve information about a lessor’s risk exposure, particularly to residual value risk. | | | | The company is reviewing the standard to determine the potential impact. | | | | January 1, 2019, applied retrospectively with certain practical expedients available. |
| (1) | Effective date for annual periods beginning on or after the stated date. |
| | |
| 7 | | PotashCorp 2016 Second Quarter Quarterly Report on Form 10-Q |
2. Segment Information
The company has three reportable operating segments: potash, nitrogen and phosphate. These segments are differentiated by the chemical nutrient contained in the products that each produces. The accounting policies of the segments are the same as those described in Note 1 and are measured in a manner consistent with that of the financial statements. Inter-segment sales are made under terms that approximate market value. The company’s operating segments have been determined based on reports reviewed by the Chief Executive Officer, assessed to be the company’s chief operating decision-maker, that are used to make strategic decisions.
| | | | | | | | | | | | | | | | | | | | | | |
| | | | | Three Months Ended June 30, 2016 | |
| | | | | Potash | | | Nitrogen | | | Phosphate | | | All Others | | | Consolidated | |
Sales — third party | | | | $ | 393 | | | $ | 383 | | | $ | 277 | | | $ | — | | | $ | 1,053 | |
Freight, transportation and distribution — third party | | | | | (64 | ) | | | (27 | ) | | | (27 | ) | | | — | | | | (118 | ) |
Net sales — third party | | | | | 329 | | | | 356 | | | | 250 | | | | — | | | | | |
Cost of goods sold — third party | | | | | (206 | ) | | | (236 | ) | | | (250 | ) | | | — | | | | (692 | ) |
Margin (cost) on inter-segment sales (1) | | | | | — | | | | 10 | | | | (10 | ) | | | — | | | | — | |
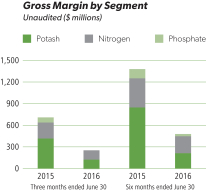
Gross margin | | | | | 123 | | | | 130 | | | | (10 | ) | | | — | | | | 243 | |
Depreciation and amortization | | | | | (52 | ) | | | (52 | ) | | | (55 | ) | | | (9 | ) | | | (168 | ) |
Share of Canpotex’s(2) Prince Rupert project exit costs | | | | | (33 | ) | | | — | | | | — | | | | — | | | | (33 | ) |
Assets | | | | | 9,780 | | | | 2,509 | | | | 2,323 | | | | 2,714 | | | | 17,326 | |
Cash outflows for additions to property, plant and equipment | | | | | 74 | | | | 65 | | | | 45 | | | | 27 | | | | 211 | |
| (1) | Inter-segment net sales were $17. |
| (2) | Canpotex Limited (“Canpotex”). |
| | | | | | | | | | | | | | | | | | | | | | |
| | | | | Three Months Ended June 30, 2015 | |
| | | | | Potash | | | Nitrogen | | | Phosphate | | | All Others | | | Consolidated | |
Sales — third party | | | | $ | 748 | | | $ | 559 | | | $ | 424 | | | $ | — | | | $ | 1,731 | |
Freight, transportation and distribution — third party | | | | | (59 | ) | | | (27 | ) | | | (38 | ) | | | — | | | | (124 | ) |
Net sales — third party | | | | | 689 | | | | 532 | | | | 386 | | | | — | | | | | |
Cost of goods sold — third party | | | | | (272 | ) | | | (323 | ) | | | (301 | ) | | | — | | | | (896 | ) |
Margin (cost) on inter-segment sales (1) | | | | | — | | | | 13 | | | | (13 | ) | | | — | | | | — | |
Gross margin | | | | | 417 | | | | 222 | | | | 72 | | | | — | | | | 711 | |
Depreciation and amortization | | | | | (60 | ) | | | (47 | ) | | | (61 | ) | | | (5 | ) | | | (173 | ) |
Assets | | | | | 9,621 | | | | 2,478 | | | | 2,353 | | | | 3,601 | | | | 18,053 | |
Cash outflows for additions to property, plant and equipment | | | | | 103 | | | | 123 | | | | 54 | | | | 14 | | | | 294 | |
(1) Inter-segment net sales were $19. | | | | | | | | | | | | | | | | | | | | | | |
| | | | | Six Months Ended June 30, 2016 | |
| | | | | Potash | | | Nitrogen | | | Phosphate | | | All Others | | | Consolidated | |
Sales — third party | | | | $ | 774 | | | $ | 811 | | | $ | 677 | | | $ | — | | | $ | 2,262 | |
Freight, transportation and distribution — third party | | | | | (123 | ) | | | (60 | ) | | | (68 | ) | | | — | | | | (251 | ) |
Net sales — third party | | | | | 651 | | | | 751 | | | | 609 | | | | — | | | | | |
Cost of goods sold — third party | | | | | (440 | ) | | | (534 | ) | | | (560 | ) | | | — | | | | (1,534 | ) |
Margin (cost) on inter-segment sales (1) | | | | | — | | | | 20 | | | | (20 | ) | | | — | | | | — | |
Gross margin | | | | | 211 | | | | 237 | | | | 29 | | | | — | | | | 477 | |
Depreciation and amortization | | | | | (100 | ) | | | (106 | ) | | | (112 | ) | | | (17 | ) | | | (335 | ) |
Share of Canpotex’s Prince Rupert project exit costs | | | | | (33 | ) | | | — | | | | — | | | | — | | | | (33 | ) |
Termination benefit costs | | | | | (32 | ) | | | — | | | | — | | | | — | | | | (32 | ) |
Impairment of property, plant and equipment | | | | | — | | | | — | | | | (27 | ) | | | — | | | | (27 | ) |
Assets | | | | | 9,780 | | | | 2,509 | | | | 2,323 | | | | 2,714 | | | | 17,326 | |
Cash outflows for additions to property, plant and equipment | | | | | 165 | | | | 134 | | | | 88 | | | | 70 | | | | 457 | |
| (1) | Inter-segment net sales were $34. |
| | |
| PotashCorp 2016 Second Quarter Quarterly Report on Form 10-Q | | 8 |
| | | | | | | | | | | | | | | | | | | | | | |
| | | | | Six Months Ended June 30, 2015 | |
| | | | | Potash | | | Nitrogen | | | Phosphate | | | All Others | | | Consolidated | |
Sales — third party | | | | $ | 1,486 | | | $ | 1,041 | | | $ | 869 | | | $ | — | | | $ | 3,396 | |
Freight, transportation and distribution — third party | | | | | (123 | ) | | | (50 | ) | | | (79 | ) | | | — | | | | (252 | ) |
Net sales — third party | | | | | 1,363 | | | | 991 | | | | 790 | | | | — | | | | | |
Cost of goods sold — third party | | | | | (518 | ) | | | (613 | ) | | | (635 | ) | | | — | | | | (1,766 | ) |
Margin (cost) on inter-segment sales (1) | | | | | — | | | | 25 | | | | (25 | ) | | | — | | | | — | |
Gross margin | | | | | 845 | | | | 403 | | | | 130 | | | | — | | | | 1,378 | |
Depreciation and amortization | | | | | (118 | ) | | | (93 | ) | | | (125 | ) | | | (9 | ) | | | (345 | ) |
Assets | | | | | 9,621 | | | | 2,478 | | | | 2,353 | | | | 3,601 | | | | 18,053 | |
Cash outflows for additions to property, plant and equipment | | | | | 214 | | | | 183 | | | | 90 | | | | 35 | | | | 522 | |
| (1) | Inter-segment net sales were $37. |
3. Available-for-sale Investments
The company assesses at the end of each reporting period whether there is objective evidence of impairment. A significant or prolonged decline in the fair value of the investment below its cost would be evidence that the asset is impaired. If objective evidence of impairment exists, the impaired amount (i.e., the unrealized loss) is recognized in net income; any subsequent reversals would be recognized in other comprehensive income (“OCI”) and would not flow back into net income. Any subsequent decline in fair value below the carrying amount at the impairment date would represent a further impairment to be recognized in net income.
At June 30, 2016, the company assessed whether there was objective evidence that its investment in Israel Chemicals Ltd. (“ICL”) was impaired. The fair value of the investment, recorded in the condensed consolidated statements of financial position, was $678 compared to the cost of $704. Factors considered in assessing impairment included the length of time and extent to which fair value had been below cost, and current financial and market conditions specific to ICL. The company concluded that objective evidence of impairment did not exist as at June 30, 2016 and, as a result, the unrealized holding loss of $26 was included in accumulated OCI. Impairment will be assessed again in future reporting periods if the fair value is below cost. The fair value was determined through the market value of ICL shares on the Tel Aviv Stock Exchange.
During 2012, the company concluded its investment in Sinofert Holdings Limited (“Sinofert”) was impaired due to the significance by which fair value was below cost. During 2014, the company concluded its investment in Sinofert was further impaired due to the fair value declining below the carrying amount of $238 at the previous impairment date. As a result, impairment losses of $341 and $38 were recognized in net income during 2012 and 2014, respectively. At June 30, 2016, the company concluded its investment in Sinofert was further impaired due to the fair value declining below the carrying amount of $200 at the previous impairment date. As a result, an impairment loss of $10 was recognized in net income during the three and six months ended June 30, 2016. The fair value was determined through the market value of Sinofert shares on the Hong Kong Stock Exchange.
Changes in fair value, and related accounting, for the company’s investment in Sinofert since December 31, 2014 were as follows:
| | | | | | | | | | | | | | | | | | | | | | |
| | | | | | | | | | | | | | | Impact of Unrealized Loss on: | |
| | | | | Fair Value | | | | | Unrealized Loss | | | | | OCI and AOCI | | | Net Income and Retained Earnings | |
Balance — December 31, 2014 | | | | $ | 252 | | | | | $ | (327 | ) | | | | $ | 52 | | | $ | (379) | |
Increase in fair value | | | | | 14 | | | | | | 14 | | | | | | 14 | | | | — | |
Balance — December 31, 2015 | | | | $ | 266 | | | | | $ | (313 | ) | | | | $ | 66 | | | $ | (379 | ) |
Decrease in fair value | | | | | (51 | ) | | | | | (51 | ) | | | | | (51 | ) | | | — | |
Balance — March 31, 2016 | | | | $ | 215 | | | | | $ | (364 | ) | | | | $ | 15 | | | $ | (379 | ) |
Decrease in fair value and recognition of impairment | | | | | (25 | ) | | | | | (25 | ) | | | | | (15 | ) | | | (10 | ) |
Balance — June 30, 2016 | | | | $ | 190 | | | | | $ | (389 | ) | | | | $ | — | | | $ | (389 | ) |
| | |
| 9 | | PotashCorp 2016 Second Quarter Quarterly Report on Form 10-Q |
4. Other Income (Expenses)
| | | | | | | | | | | | | | | | | | | | | | | | | | | | | | | | |
| | | | | | Three Months Ended June 30 | | | | | | Six Months Ended June 30 | |
| | | | | | 2016 | | | | | | 2015 | | | | | | 2016 | | | | | | 2015 | |
Foreign exchange (loss) gain | | | | | | $ | (2 | ) | | | | | | $ | (3 | ) | | | | | | $ | (19 | ) | | | | | | $ | 12 | |
Other income (expenses) | | | | | | | 3 | | | | | | | | (5 | ) | | | | | | | 10 | | | | | | | | (9 | ) |
| | | | | | | $ | 1 | | | | | | | $ | (8 | ) | | | | | | $ | (9 | ) | | | | | | $ | 3 | |
5. Income Taxes
A separate estimated average annual effective tax rate was determined for each taxing jurisdiction and applied individually to the interim period pre-tax income of each jurisdiction.
| | | | | | | | | | | | | | | | | | | | | | | | | | | | | | | | |
| | | | | | Three Months Ended
June 30 | | | | | | Six Months Ended
June 30 | |
| | | | | | 2016 | | | | | | 2015 | | | | | | 2016 | | | | | | 2015 | |
Income tax expense | | | | | | $ | 24 | | | | | | | $ | 152 | | | | | | | $ | 56 | | | | | | | $ | 292 | |
Actual effective tax rate on ordinary earnings | | | | | | | 17% | | | | | | | | 26% | | | | | | | | 21% | | | | | | | | 27% | |
Actual effective tax rate including discrete items | | | | | | | 16% | | | | | | | | 27% | | | | | | | | 22% | | | | | | | | 27% | |
Discrete tax adjustments that impacted the tax rate | | | | | | $ | (4 | ) | | | | | | $ | 3 | | | | | | | $ | — | | | | | | | $ | 6 | |
Significant items to note include the following:
| • | | The actual effective tax rate on ordinary earnings for the three and six months ended June 30, 2016 decreased compared to the same periods last year due to significantly lower earnings in higher tax jurisdictions. |
| • | | In second-quarter 2016, a $10 discrete non-tax deductible impairment of the company’s available-for-sale investment in Sinofert was recorded. This increased the actual effective tax rate including discrete items for the three and six months ended June 30, 2016 by one percentage point. |
Income tax balances within the condensed consolidated statements of financial position were comprised of the following:
| | | | | | | | | | | | | | | | | | | | |
| Income Tax Assets (Liabilities) | | | | Statements of Financial Position Location | | | | | June 30,
2016 | | | | | | December 31,
2015 | |
Current income tax assets | | | | | | | | | | | | | | | | | | | | |
Current | | | | Receivables | | | | | | $ | 45 | | | | | | | $ | 60 | |
Non-current | | | | Other assets | | | | | | | 66 | | | | | | | | 66 | |
Deferred income tax assets | | | | Other assets | | | | | | | 14 | | | | | | | | 10 | |
Total income tax assets | | | | | | | | | | $ | 125 | | | | | | | $ | 136 | |
Current income tax liabilities | | | | | | | | | | | | | | | | | | | | |
Current | | | | Payables and accrued charges | | | | | | $ | (4 | ) | | | | | | $ | (14 | ) |
Non-current | | | | Other non-current liabilities and deferred credits | | | | | | | (71 | ) | | | | | | | (74 | ) |
Deferred income tax liabilities | | | | Deferred income tax liabilities | | | | | | | (2,399 | ) | | | | | | | (2,438 | ) |
Total income tax liabilities | | | | | | | | | | $ | (2,474 | ) | | | | | | $ | (2,526 | ) |
| | |
| PotashCorp 2016 Second Quarter Quarterly Report on Form 10-Q | | 10 |
6. Consolidated Statements of Cash Flow
| | | | | | | | | | | | | | | | | | | | | | | | | | | | |
| | | | | Three Months Ended June 30 | | | | | Six Months Ended June 30 | |
| | | | | 2016 | | | | | | 2015 | | | | | 2016 | | | | | | 2015 | |
Reconciliation of cash provided by operating activities | | | | | | | | | | | | | | | | | | | | | | | | | | | | |
Net income | | | | $ | 121 | | | | | | | $ | 417 | | | | | $ | 196 | | | | | | | $ | 787 | |
Adjustments to reconcile net income to cash provided by operating activities | | | | | | | | | | | | | | | | | | | | | | | | | | | | |
Depreciation and amortization | | | | | 168 | | | | | | | | 173 | | | | | | 335 | | | | | | | | 345 | |
Impairment of property, plant and equipment | | | | | — | | | | | | | | — | | | | | | 27 | | | | | | | | — | |
Net distributed (undistributed) earnings of equity-accounted investees | | | | | 61 | | | | | | | | 19 | | | | | | 44 | | | | | | | | (16 | ) |
Impairment of available-for-sale investment (Note 3) | | | | | 10 | | | | | | | | — | | | | | | 10 | | | | | | | | — | |
Share-based compensation | | | | | 3 | | | | | | | | 4 | | | | | | 5 | | | | | | | | 19 | |
(Recovery of) provision for deferred income tax | | | | | (7 | ) | | | | | | | 47 | | | | | | (1 | ) | | | | | | | 72 | |
Pension and other post-retirement benefits | | | | | 13 | | | | | | | | 11 | | | | | | 28 | | | | | | | | 16 | |
Asset retirement obligations and accrued environmental costs | | | | | 9 | | | | | | | | (11 | ) | | | | | 25 | | | | | | | | (24 | ) |
Other long-term liabilities and miscellaneous | | | | | 2 | | | | | | | | 5 | | | | | | (8 | ) | | | | | | | 17 | |
Subtotal of adjustments | | | | | 259 | | | | | | | | 248 | | | | | | 465 | | | | | | | | 429 | |
Changes in non-cash operating working capital | | | | | | | | | | | | | | | | | | | | | | | | | | | | |
Receivables | | | | | 186 | | | | | | | | 29 | | | | | | 145 | | | | | | | | 85 | |
Inventories | | | | | (51 | ) | | | | | | | 2 | | | | | | (43 | ) | | | | | | | (60 | ) |
Prepaid expenses and other current assets | | | | | 5 | | | | | | | | 11 | | | | | | 3 | | | | | | | | 3 | |
Payables and accrued charges | | | | | (96 | ) | | | | | | | 129 | | | | | | (154 | ) | | | | | | | 113 | |
Subtotal of changes in non-cash operating working capital | | | | | 44 | | | | | | | | 171 | | | | | | (49 | ) | | | | | | | 141 | |
Cash provided by operating activities | | | | $ | 424 | | | | | | | $ | 836 | | | | | $ | 612 | | | | | | | $ | 1,357 | |
Supplemental cash flow disclosure | | | | | | | | | | | | | | | | | | | | | | | | | | | | |
Interest paid | | | | $ | 64 | | | | | | | $ | 55 | | | | | $ | 93 | | | | | | | $ | 93 | |
Income taxes paid | | | | $ | 35 | | | | | | | $ | 23 | | | | | $ | 46 | | | | | | | $ | 65 | |
7. Inventories
| | | | | | | | | | | | | | |
| | | | | June 30, 2016 | | | | | | December 31,
2015 | |
Finished products | | | | $ | 323 | | | | | | | $ | 302 | |
Intermediate products | | | | | 156 | | | | | | | | 125 | |
Raw materials | | | | | 87 | | | | | | | | 94 | |
Materials and supplies | | | | | 239 | | | | | | | | 228 | |
| | | | | $ | 805 | | | | | | | $ | 749 | |
The following items affected cost of goods sold:
| | | | | | | | | | | | | | | | | | | | | | | | | | | | |
| | | | | Three Months Ended
June 30 | | | | | Six Months Ended
June 30 | |
| | | | | 2016 | | | | | | 2015 | | | | | 2016 | | | | | | 2015 | |
Expensed inventories before the following items | | | | $ | 587 | | | | | | | $ | 858 | | | | | $ | 1,299 | | | | | | | $ | 1,703 | |
Reserves, reversals and writedowns of inventories | | | | | 20 | | | | | | | | (1 | ) | | | | | 19 | | | | | | | | 1 | |
| | | | | $ | 607 | | | | | | | $ | 857 | | | | | $ | 1,318 | | | | | | | $ | 1,704 | |
The carrying amount of inventory recorded at net realizable value was $81 as at June 30, 2016 (December 31, 2015 - $32), with the remaining inventory recorded at cost.
| | |
| 11 | | PotashCorp 2016 Second Quarter Quarterly Report on Form 10-Q |
8. Pension and Other Post-Retirement Benefits
A remeasurement of the defined benefit plan assets and liabilities was performed at June 30, 2016. Due to a change in the discount rate and actual return on plan assets, the company’s defined benefit pension and other post-retirement benefit obligations increased by $184, plan assets increased by $21 and deferred income taxes decreased by $60. As a result, the company recorded net actuarial losses on defined benefit plan obligations of $103 in OCI, which was recognized immediately in retained earnings at June 30, 2016.
The net impact on assets and liabilities within the condensed consolidated statements of financial position at June 30, 2016 was as follows:
| | | | | | |
| | | | | (Decrease) Increase | |
Non-current assets | | | | | | |
Other assets | | | | $ | (9 | ) |
Non-current liabilities | | | | | | |
Deferred income tax liabilities | | | | | (60 | ) |
Pension and other post-retirement benefit liabilities | | | | | 154 | |
The discount rate used to determine the benefit obligation for the company’s significant plans at June 30, 2016 was 3.65 percent (December 31, 2015 — 4.35 percent).
The benefit obligations and plan assets for the company’s pension and other post-retirement plans were as follows:
| | | | | | | | | | | | |
| | | | | June 30, 2016 | | | | | December 31, 2015 | |
Present value of defined benefit obligations | | | | $ | (1,848 | ) | | | | $ | (1,659 | ) |
Fair value of plan assets | | | | | 1,220 | | | | | | 1,197 | |
Funded status | | | | | (628 | ) | | | | | (462 | ) |
Balance comprised of: | | | | | | | | | | | | |
Non-current assets | | | | | | | | | | | | |
Other assets | | | | $ | 12 | | | | | $ | 21 | |
Current liabilities | | | | | | | | | | | | |
Payables and accrued charges | | | | | (27 | ) | | | | | (52 | ) |
Non-current liabilities | | | | | | | | | | | | |
Pension and other post-retirement benefit liabilities | | | | | (613 | ) | | | | | (431 | ) |
9. Share Capital
Authorized
The company is authorized to issue an unlimited number of common shares without par value and an unlimited number of first preferred shares. The common shares are not redeemable or convertible. The first preferred shares may be issued in one or more series with rights and conditions to be determined by the Board of Directors. No first preferred shares have been issued.
Issued
| | | | | | | | | | |
| | | | | Number of
Common Shares | | | Consideration | |
Balance — December 31, 2015 | | | | | 836,540,151 | | | $ | 1,747 | |
Issued under option plans | | | | | 2,294,950 | | | | 35 | |
Issued for dividend reinvestment plan | | | | | 597,588 | | | | 10 | |
Balance —
June 30, 2016 | | | | | 839,432,689 | | | $ | 1,792 | |
Dividends Declared
The company declared dividends per share of $0.25 (2015 — $0.38) during the three months ended June 30, 2016 and $0.50 (2015 — $0.76) during the six months ended June 30, 2016.
Subsequent to June 30, 2016, the company announced its intention to reduce its quarterly dividend from $0.25 per share to $0.10 per share beginning with the declaration of its next quarterly dividend in September 2016. The total estimated dividend to be paid in the fourth quarter of 2016 is $84.
| | |
| PotashCorp 2016 Second Quarter Quarterly Report on Form 10-Q | | 12 |
10. Share-based Compensation
During the second quarter of 2016, the company issued stock options and performance share units (“PSUs”) to eligible employees under the 2016 Long-Term Incentive Plan (“LTIP”). Information on stock options and PSUs is summarized below:
| | | | | | | | | | | | | | | | | | | | | | | | | | | | | | | | | | | | | | | | | | |
| | | | | 2016 LTIP | | | | | Expense for all share-based compensation plans | |
| | | | | Units
Granted | | | | | Units Outstanding as at June 30, 2016 | | | | | Grant Date Fair Value per Unit (Dollars) | | | | | Three Months Ended June 30 | | | | | Six Months Ended June 30 | |
| | | | | | | | | | | | | 2016 | | | | | 2015 | | | | | 2016 | | | | | 2015 | |
Stock options | | | | | 3,099,913 | | | | | | 3,099,913 | | | | | $ | 2.04 | | | | | $ | 5 | | | | | $ | 4 | | | | | $ | 6 | | | | | $ | 16 | |
Share-settled PSUs | | | | | 602,740 | | | | | | 602,740 | | | | | $ | 17.19 | | | | | | 2 | | | | | | — | | | | | | 2 | | | | | | — | |
Cash-settled PSUs | | | | | 1,008,638 | | | | | | 1,008,638 | | | | | $ | 17.19 | | | | | | 2 | | | | | | — | | | | | | 4 | | | | | | — | |
| | | | | | | | | | | | | | | | | | | | | | | $ | 9 | | | | | $ | 4 | | | | | $ | 12 | | | | | $ | 16 | |
Stock Options
Under the LTIP, stock options generally vest and become exercisable on the third anniversary of the grant date, subject to continuous employment or retirement, and have a maximum term of 10 years. The weighted average fair value of stock options granted was estimated as of the date of grant using the Black-Scholes-Merton option-pricing model with the following weighted average assumptions:
| | | | |
Exercise price per option | | $ | 16.20 | |
Expected annual dividend per share | | $ | 1.00 | |
Expected volatility | | | 30% | |
Risk-free interest rate | | | 1.06% | |
Expected life of options | | | 5.7 years | |
Performance Share Units
Currently, PSUs granted under the LTIP are comprised of three tranches, with each tranche vesting based on the achievement of performance metrics over separate performance periods ranging from one to three years, and will be settled in shares for grantees who are subject to the company’s share ownership guidelines and in cash for all other grantees. PSUs will vest based on performance metrics comprising the relative ranking of the company’s total shareholder return compared with a specified peer group and the company’s cash flow return on investment compared with its weighted average cost of capital. Compensation cost is measured based on the grant date fair value of the units, adjusted for the company’s best estimate of the outcome of non-market vesting conditions at the end of each period, forshare-settled PSUs, and on period-end fair value of the awards for cash-settled PSUs. The company uses a Monte Carlo simulation model to estimate the outcome of relative total shareholder return.
11. Financial Instruments
Fair Value
Estimated fair values for financial instruments are designed to approximate amounts for which the instruments could be exchanged in a current arm’s-length transaction between knowledgeable willing parties. The valuation policies and procedures for financial reporting purposes are determined by the company’s finance department.
| | |
| 13 | | PotashCorp 2016 Second Quarter Quarterly Report on Form 10-Q |
Financial instruments included in the unaudited interim condensed consolidated statements of financial position are measured either at fair value or amortized cost. The tables below explain the valuation methods used to determine the fair value of each financial instrument and its associated level in the fair value hierarchy.
| | | | |
| Financial Instruments Measured at Fair Value | | | | Fair Value Method |
| Cash and cash equivalents | | | | Assumed to approximate carrying value due to their short-term nature. |
| Available-for-sale investments | | | | Based on the closing bid price of the common shares (Level 1) as at the statements of financial position dates. |
| Foreign currency derivatives not traded in an active market | | | | Determined using quoted forward exchange rates (Level 2) as at the statements of financial position dates. |
| Natural gas swaps not traded in an active market | | | | Based on a discounted cash flow model. The inputs used in the model included contractual cash flows based on prices for natural gas futures contracts, fixed prices and notional volumes specified by the swap contracts, the time value of money, liquidity risk, the company’s own credit risk (related to instruments in a liability position) and counterparty credit risk (related to instruments in an asset position). Futures contract prices used as inputs in the model were supported by prices quoted in an active market and therefore categorized in Level 2. Prior to December 31, 2015, certain contract prices used as inputs in the model were not based on observable market data and therefore categorized in Level 3. |
| Natural gas futures | | | | Based on closing prices provided by the exchange (NYMEX) (Level 1) as at the statements of financial position dates. |
| | | | |
| Financial Instruments Measured at Amortized Cost | | | | Fair Value Method |
| Receivables, short-term debt and payables and accrued charges | | | | Assumed to approximate carrying value due to their short-term nature. |
| Long-term debt senior notes | | | | Quoted market prices (Level 1 or 2 depending on the market liquidity of the debt). |
| Other long-term debt instruments | | | | Assumed to approximate carrying value. |
Presented below is a comparison of the fair value of the company’s senior notes to their carrying values.
| | | | | | | | | | | | | | | | | | | | | | |
| | | | | June 30, 2016 | | | | | | December 31, 2015 | |
| | | | | Carrying Amount of Liability | | | Fair Value of Liability | | | | | | Carrying Amount of Liability | | | Fair Value of Liability | |
Long-term debt senior notes | | | | $ | 3,750 | | | $ | 4,112 | | | | | | | $ | 3,750 | | | $ | 3,912 | |
| | |
| PotashCorp 2016 Second Quarter Quarterly Report on Form 10-Q | | 14 |
The following table presents the company’s fair value hierarchy for financial assets and financial liabilities carried at fair value on a recurring basis.
| | | | | | | | | | | | | | | | | | | | | | | | |
| | | | | | | | | | | | Fair Value Measurements at Reporting Dates Using: | |
| | | | | | Carrying Amount of Asset (Liability) | | | | | | Quoted Prices in Active Markets for Identical Assets (Level 1) (1) | | | Significant Other Observable Inputs (Level 2) (1,2) | | | Significant Unobservable Inputs (Level 3) (2) | |
June 30, 2016 | | | | | | | | | | | | | | | | | | | | | | | | |
Derivative instrument assets | | | | | | | | | | | | | | | | | | | | | | | | |
Natural gas derivatives | | | | | | $ | 7 | | | | | | | $ | — | | | $ | 7 | | | $ | — | |
Available-for-sale investments (3) | | | | | | | 871 | | | | | | | | 871 | | | | — | | | | — | |
Derivative instrument liabilities | | | | | | | | | | | | | | | | | | | | | | | | |
Natural gas derivatives | | | | | | | (139 | ) | | | | | | | — | | | | (139 | ) | | | — | |
December 31, 2015 | | | | | | | | | | | | | | | | | | | | | | | | |
Derivative instrument assets | | | | | | | | | | | | | | | | | | | | | | | | |
Natural gas derivatives | | | | | | $ | 9 | | | | | | | $ | — | | | $ | 9 | | | $ | — | |
Available-for-sale investments (3) | | | | | | | 984 | | | | | | | | 984 | | | | — | | | | — | |
Derivative instrument liabilities | | | | | | | | | | | | | | | | | | | | | | | | |
Natural gas derivatives | | | | | | | (190 | ) | | | | | | | — | | | | (190 | ) | | | — | |
Foreign currency derivatives | | | | | | | (3 | ) | | | | | | | — | | | | (3 | ) | | | — | |
| (1) | During the six months ended June 30, 2016 and twelve months ended December 31, 2015, there were no transfers between Level 1 and Level 2. |
| (2) | During the six months ended June 30, 2016, there were no transfers into or out of Level 3. During the twelve months ended December 31, 2015, there were no transfers into Level 3 and $120 of losses was transferred out of Level 3 into Level 2 as the company’s valuation technique used a significant portion of observable inputs. The company’s policy is to recognize transfers at the end of the reporting period. |
| (3) | Available-for-sale investments are comprised of shares in ICL, Sinofert and other. |
12. Seasonality
The company’s sales of fertilizer can be seasonal. Typically, fertilizer sales are highest in the second quarter of the year, due to the Northern Hemisphere’s spring planting season. However, planting conditions and the timing of customer purchases will vary each year, and fertilizer sales can be expected to shift from one quarter to another. Feed and industrial sales are more evenly distributed throughout the year.
13. Contingencies and Other Matters
Canpotex
PCS is a shareholder in Canpotex, a potash export, sales and marketing company owned in equal shares by PCS and two other Canadian potash producers, which markets Canadian potash offshore. Should any operating losses or other liabilities be incurred by Canpotex, the shareholders have contractually agreed to reimburse it for such losses or liabilities in proportion to each shareholder’s productive capacity. Through June 30, 2016, there were no such operating losses or other liabilities.
Mining Risk
The risk of underground water inflows, as with most other underground risks, is currently not insured.
Legal and Other Matters
The company is engaged in ongoing site assessment and/or remediation activities at a number of facilities and sites, and anticipated costs associated with these matters are added to accrued environmental costs in the manner previously described in Note 22 to the company’s 2015 annual consolidated financial statements. This includes matters related to investigation of potential brine migration at certain of the potash sites. The following environmental site assessment and/or remediation matters have uncertainties that may not be fully reflected in the amounts accrued for those matters:
Nitrogen and phosphate
| • | | The US Environmental Protection Agency (“USEPA”) has identified PCS Nitrogen, Inc. (“PCS Nitrogen”) as a potentially responsible party at the Planters Property or Columbia Nitrogen site in Charleston, South Carolina. PCS Nitrogen is subject to a final judgment by the US District Court for the District of South Carolina allocating 30 percent of the liability for response costs at the site to PCS Nitrogen, as well as a proportional share of any costs that cannot be recovered from another responsible party. In December 2013, the USEPA issued an order to PCS Nitrogen and four other respondents requiring them jointly and severally to conduct certain cleanup work at the site and reimburse the USEPA’s costs for overseeing that work. PCS Nitrogen is currently performing the work required by the |
| | |
| 15 | | PotashCorp 2016 Second Quarter Quarterly Report on Form 10-Q |
| | | USEPA order. The USEPA also has requested reimbursement of $4 of previously incurred response costs. The ultimate amount of liability for PCS Nitrogen depends upon, among other factors, the final outcome of litigation to impose liability on additional parties, the amount needed for remedial activities, the ability of other parties to pay and the availability of insurance. |
| • | | PCS Phosphate Company, Inc. (“PCS Phosphate”) has agreed to participate, on a non-joint and several basis, with parties to an Administrative Settlement Agreement with the USEPA (“Settling Parties”) in a removal action and the payment of certain other costs associated with PCB soil contamination at the Ward Transformer Superfund Site in Raleigh, North Carolina (“Site”), including reimbursement of past USEPA costs. The removal activities commenced in August 2007. In September 2013, PCS Phosphate and other parties entered into an Administrative Order on Consent with the USEPA, pursuant to which a supplemental remedial investigation and focused feasibility study will be performed on the portion of the Site that was subject to the removal action. The response actions are nearly complete. The completed and anticipated remaining work on the Site is estimated to cost a total of $80. PCS Phosphate is a party to ongoing Comprehensive Environmental Response, Compensation and Liability Act (“CERCLA”) contribution and cost-recovery litigation for the recovery of costs of the removal activities. The USEPA has also issued an order to a number of entities requiring remediation downstream of the area subject to the removal action (“Operable Unit 1”). PCS Phosphate did not receive this order. At this time, the company is unable to evaluate the extent of any exposure that it may have for the matters addressed in the CERCLA litigation or for Operable Unit 1. |
| • | | In 1996, PCS Nitrogen Fertilizer, L.P. (“PCS Nitrogen Fertilizer”), then known as Arcadian Fertilizer, L.P., entered into a Consent Order (the “Order”) with the Georgia Environmental Protection Division (“GEPD”) in conjunction with PCS Nitrogen Fertilizer’s acquisition of real property in Augusta, Georgia. Under the Order, PCS Nitrogen Fertilizer is required to perform certain activities to investigate and, if necessary, implement corrective measures for substances in soil and groundwater. The investigation has proceeded and the results have been presented to GEPD. Two interim corrective measures for substances in groundwater have been proposed by PCS Nitrogen Fertilizer and approved by GEPD. PCS Nitrogen Fertilizer is implementing the approved interim corrective measures, which may be modified by PCS Nitrogen Fertilizer from time to time, but it is unable to estimate with reasonable certainty the total cost of its correction action obligations under the Order at this time. |
Based on current information and except for the uncertainties described in the preceding paragraphs, the company does not believe that its future obligations with respect to these facilities
and sites are reasonably likely to have a material adverse effect on its consolidated financial position or results of operations.
Other legal matters with significant uncertainties include the following:
Nitrogen and phosphate
| • | | The USEPA has an ongoing initiative to evaluate implementation within the phosphate industry of a particular exemption for mineral processing wastes under the hazardous waste program. In connection with this industry-wide initiative, the USEPA conducted inspections at numerous phosphate operations and notified the company of alleged violations of the US Resource Conservation and Recovery Act (“RCRA”) at its plants in Aurora, North Carolina; Geismar, Louisiana; and White Springs, Florida. The company has entered into RCRA 3013 Administrative Orders on Consent and has performed certain site assessment activities at all of these plants. At this time, the company does not know the scope of action, if any, that may be required. As to the alleged RCRA violations, the company continues to participate in settlement discussions with the USEPA but is uncertain if any resolution will be possible without litigation, or, if litigation occurs, what the outcome would be. The company routinely monitors public information about the impacts of the initiative on other industry members, and it regularly considers this information in establishing the appropriate asset retirement obligations and accruals. |
| • | | In August 2015, the USEPA finalized hazardous air pollutant emission standards for phosphoric acid manufacturing and phosphate fertilizer production (“Final Rule”). The Final Rule includes certain new requirements for monitoring and emissions that are infeasible for the company to satisfy in a timely manner. As a result, in October 2015, the company filed a petition for reconsideration of certain aspects of the Final Rule with the USEPA and a petition for review of the Final Rule with the US Court of Appeals for the District of Columbia Circuit. The USEPA granted the petition for reconsideration and the petition for review is being held in abeyance pending the outcome of the USEPA proceeding, for which there is not a definite time frame for resolution. The company is participating in discussions with the USEPA to resolve the petition but whether future revisions to the Final Rule will be made is uncertain. Required emissions testing at our Aurora facility in 2016 indicated some alleged exceedances of the mercury emission limits that were established by the Final Rule. The facility has communicated with the relevant agencies about this issue and is in the process of developing a compliance strategy, the costs of which cannot be estimated with any certainty at this time. The company has requested that USEPA revise the emission limit or make rule changes to provide for flexibility for representative operating scenarios for the facility. However, whether those changes will be made is uncertain. In the interim, the North Carolina |
| | |
| PotashCorp 2016 Second Quarter Quarterly Report on Form 10-Q | | 16 |
| | | Department of Environmental Quality (“NCDEQ”) has issued a Notice of Violation associated with the facility’s alleged exceedances of the new mercury limits, and the company is working with the NCDEQ to address these alleged violations via a negotiated settlement. |
General
| • | | The countries where we operate are parties to the Paris Agreement adopted in December 2015 pursuant to the United Nations Framework Convention on Climate Change. Each country that is a party to the Paris Agreement submitted an Intended Nationally Determined Contribution (“INDC”) toward the control of greenhouse gas emissions. The impacts of these INDCs on the company’s operations cannot be determined with any certainty at this time. Prior to the adoption of the Paris Agreement, the USEPA adopted several rules to control such emissions using authority under existing environmental laws. In Saskatchewan, provincial regulations pursuant to the Management and Reduction of Greenhouse Gases Act, which impose a type of carbon tax to achieve a goal of a 20 percent reduction in greenhouse gas emissions by 2020 compared to 2006 levels, may become effective in 2016. None of these regulations has resulted in material limitations on greenhouse gas emissions at the company’s facilities. The company is monitoring these developments and their future effect on its operations cannot be determined with certainty at this time. |
In addition, various other claims and lawsuits are pending against the company in the ordinary course of business. While it is not possible to determine the ultimate outcome of such actions at this time, and inherent uncertainties exist in predicting such outcomes,
it is the company’s belief that the ultimate resolution of such actions is not reasonably likely to have a material adverse effect on its consolidated financial statements.
The breadth of the company’s operations and the global complexity of tax regulations require assessments of uncertainties and judgments in estimating the taxes it will ultimately pay. The final taxes paid are dependent upon many factors, including negotiations with taxing authorities in various jurisdictions, outcomes of tax litigation and resolution of disputes arising from federal, provincial, state and local tax audits. The resolution of these uncertainties and the associated final taxes may result in adjustments to the company’s tax assets and tax liabilities.
The company owns facilities that have been either permanently or indefinitely shut down. It expects to incur nominal annual expenditures for site security and other maintenance costs at certain of these facilities. Should the facilities be dismantled, certain other shutdown-related costs may be incurred. Such costs are not expected to have a material adverse effect on the company’s consolidated financial statements and would be recognized and recorded in the period in which they are incurred.
14. Related Party Transactions
The company sells potash from its Saskatchewan mines for use outside Canada and the US exclusively to Canpotex. Sales are at prevailing market prices and are settled on normal trade terms. Sales to Canpotex for the three months ended June 30, 2016 were $159 (2015 — $413) and the six months ended June 30, 2016 were $338 (2015 — $768). At June 30, 2016, $123 (December 31, 2015 — $148) was owing from Canpotex.
| | |
| 17 | | PotashCorp 2016 Second Quarter Quarterly Report on Form 10-Q |
Item 2. Management’s Discussion and Analysis of Financial Condition and Results of Operations (in US dollars)
The following discussion and analysis is the responsibility of management and is as at August 3, 2016. The Board of Directors (Board) carries out its responsibility for review of this disclosure principally through its audit committee, comprised exclusively of independent directors. The audit committee reviews and, prior to its publication, approves this disclosure, pursuant to the authority delegated to it by the Board. The term “PCS” refers to Potash Corporation of Saskatchewan Inc. and the terms “we,” “us,” “our,” “PotashCorp” and “the company” refer to PCS and, as applicable, PCS and its direct and indirect subsidiaries as a group. Additional information relating to PotashCorp (which, except as otherwise noted, is not incorporated by reference herein), including our Annual Report on Form 10-K for the year ended December 31, 2015 (2015 Form 10-K), can be found on SEDAR at www.sedar.com and on EDGAR at www.sec.gov. The company is a foreign private issuer under the rules and regulations of the US Securities and Exchange Commission (the SEC); however, it currently files voluntarily on the SEC’s domestic forms.
PotashCorp and Our Business Environment
PotashCorp is an integrated producer of fertilizer, industrial and animal feed products. We are the world’s largest fertilizer company by capacity, producing the three primary crop nutrients: potash (K), nitrogen (N) and phosphate (P). Our Canadian potash operations – the primary focus and namesake of our company – represent one-fifth of global capacity. To enhance our global footprint, we also have investments in four potash-related businesses in South America, the Middle East and Asia. We complement our potash assets with focused positions in nitrogen and phosphate.
A detailed description of our markets and customers can be found on pages 51 and 52 (potash), 61 and 62 (nitrogen) and 69 and 70 (phosphate) in our 2015 Annual Integrated Report (2015 AIR).
How We Approach Governance
We believe strong governance creates the environment for a successful company, and effective governance begins at the top. Our Board provides guidance and oversight, while management defines and executes strategy and simultaneously manages risk.
Success at the Board and management level at PotashCorp involves setting the right program priorities, having the appropriate team members in place, evaluating ourselves, continuing our education and communicating with our stakeholders. Grounded by our objective of creating superior shareholder value, our Board and management team consider the interdependence between strategy and risk to inform how to best position the company to achieve sustainable growth.
There have been no significant changes to how we approach governance from that described in our 2015 AIR (see pages 14 to 19 in our 2015 AIR).
How We Approach Strategy
Our Value Model, outlined on page 9 in our 2015 AIR, informs the strategies we put in place to affect value creation over time.
We believe strong financial health and performance are the cornerstones of PotashCorp. They reward our shareholders while allowing us to fulfill our broader social and environmental responsibilities. Our long-term objective is to create superior shareholder value by: growing earnings and cash flow while minimizing volatility; protecting and enhancing a premium valuation multiple; and maintaining the trust and support of our stakeholders.
Our strategy is to prioritize earnings growth and investment opportunities in potash, while complementing our business with other best-in-class assets. Our strategic priorities, depicted below and described in further detail, along with key target metrics, on pages 23 to 25 in our 2015 AIR did not change during the second quarter of 2016.

| | |
| PotashCorp 2016 Second Quarter Quarterly Report on Form 10-Q | | 18 |
How We Approach Risk
In our 2015 AIR, we provide an overview of our approach to risk (page 27), explain how we use a risk management-ranking methodology to assess the key risks specific to our company (page 28) and provide a description of, management approach to and any significant developments for each key risk (pages 29 to 33).
Our risk-ranking matrix, in terms of residual severity of consequence and likelihood, is displayed below.
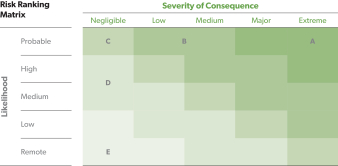
Key risks with rankings unchanged from our 2015 AIR were as follows:
Key risk with ranking that has changed since our 2015 AIR was as follows:
| | | | | | | | | | | | |
| Risk | | | | Risk Ranking | | | | Associated
Strategies (1) | | | | Developments |
| Operating capability | | | | D | | | |  | | | | The overall risk ranking has decreased from C to D. We have reduced the likelihood of this risk given the expected completion of our Rocanville capacity expansion later this year. |
| (1) | Brighter sections indicate the strategic priority (described on page 18 of this Form 10-Q) impacted by the risk. Faded sections mean the strategic priority is not significantly affected by the risk. |
| | |
| 19 | | PotashCorp 2016 Second Quarter Quarterly Report on Form 10-Q |
Key Performance Drivers — Performance Compared to Targets
Through our integrated value model, we set, evaluate and refine our targets to drive improvements that benefit all those impacted by our business. We demonstrate our accountability by tracking and reporting our performance against targets related to each strategic priority set out on pages 40 to 47 in our 2015 AIR. A summary of our progress against selected strategic priorities and representative annual targets is set out below.
| | | | | | | | |
| Strategic Priority | | | | Representative 2016 Annual Target | | | | Performance to June 30, 2016 |
| Portfolio & Return Optimization | | | | Exceed total shareholder return (TSR) performance for our sector and the DAXglobal Agribusiness Index. | | | | PotashCorp’s TSR was -1 percent in the first six months of 2016 compared to our sector’s weighted average return (based on market capitalization (1)) of -9 percent and the DAXglobal Agribusiness Index weighted average return (based on market capitalization) of 3 percent. |
| Operational Excellence | | | | Achieve 96 percent ammonia reliability rate (2) for all US nitrogen plants and 88 percent in Trinidad. | | | | Our ammonia reliability rate was 97 percent in the US and 92 percent in Trinidad for the first six months of 2016. |
| People Development | | | | Maintain an annual employee turnover rate of 5 percent or less (excluding retirements and workforce changes related to suspension of Picadilly potash operations). | | | | Employee turnover rate (excluding retirements and workforce changes related to Picadilly) on an annualized basis for the first six months of 2016 was 4 percent. |
| Safety & Health Excellence | | | | Achieve zero life-altering injuries at our sites. | | | | There were no life-altering injuries at our sites during the first six months of 2016. |
| | | | | Reduce total site recordable injury rate to 0.85 (or lower) and total lost-time injury rate to 0.09 (or lower). | | | | During the first six months of 2016, total site recordable injury rate was 0.91 and total lost-time injury rate was 0.12. |
| Environmental Excellence | | | | By 2018, reduce total reportable incidents (releases, permit excursions and spills) by 40 percent from 2014 levels. | | | | There was no change in the annualized total reportable incidents during the first six months of 2016 compared to 2014 annual levels. Compared to the first six months of 2015, total reportable incidents were up 20 percent. |
| (1) | TSRs are based on the currencies of the primary exchanges in which the relevant shares are traded. |
| (2) | Page 41 of our 2015 AIR initially described US and Trinidad operating rate percentages as our target. The company has clarified that the target refers to ammonia reliability rate, the company’s focus in the nitrogen segment. Operating rate is defined as actual production divided by capacity. Reliability rate is defined as actual production divided by capacity less non-reliability related downtime. |
Performance Overview
This discussion and analysis are based on the company’s unaudited interim condensed consolidated financial statements included in Item 1 of this Quarterly Report on Form 10-Q (financial statements in this Form 10-Q) based on International Financial Reporting Standards as issued by the International Accounting Standards Board (IFRS), unless otherwise stated. All references to per-share amounts pertain to diluted net income per share.
For an understanding of trends, events, uncertainties and the effect of critical accounting estimates on our results and financial condition, this Form 10-Q should be read carefully, together with our 2015 AIR.
Earnings Guidance — Second Quarter 2016
| | | | | | | | |
| | | | | Company Guidance | | Actual Results | |
Earnings per share | | | | $0.15 — $0.25 | | $ | 0.14 | |
| | |
| PotashCorp 2016 Second Quarter Quarterly Report on Form 10-Q | | 20 |
Overview of Actual Results
| | | | | | | | | | | | | | | | | | | | | | | | | | | | | | | | | | | | |
| | | | | Three Months Ended June 30 | | | | | Six Months Ended June 30 | |
| Dollars (millions), except per-share amounts | | | | 2016 | | | 2015 | | | Change | | | % Change | | | | | 2016 | | | 2015 | | | Change | | | % Change | |
Sales | | | | $ | 1,053 | | | $ | 1,731 | | | $ | (678 | ) | | | (39 | ) | | | | $ | 2,262 | | | $ | 3,396 | | | $ | (1,134 | ) | | | (33 | ) |
Gross margin | | | | | 243 | | | | 711 | | | | (468 | ) | | | (66 | ) | | | | | 477 | | | | 1,378 | | | | (901 | ) | | | (65 | ) |
Operating income | | | | | 199 | | | | 619 | | | | (420 | ) | | | (68 | ) | | | | | 358 | | | | 1,178 | | | | (820 | ) | | | (70 | ) |
Net income | | | | | 121 | | | | 417 | | | | (296 | ) | | | (71 | ) | | | | | 196 | | | | 787 | | | | (591 | ) | | | (75 | ) |
Net income per share — diluted | | | | | 0.14 | | | | 0.50 | | | | (0.36 | ) | | | (72 | ) | | | | | 0.23 | | | | 0.94 | | | | (0.71 | ) | | | (76 | ) |
Other comprehensive (loss) income | | | | | (184 | ) | | | 37 | | | | (221 | ) | | | n/m | | | | | | (173 | ) | | | 60 | | | | (233 | ) | | | n/m | |
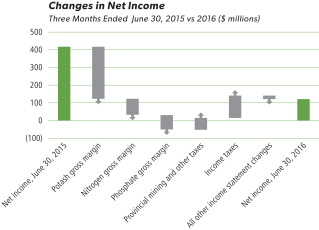
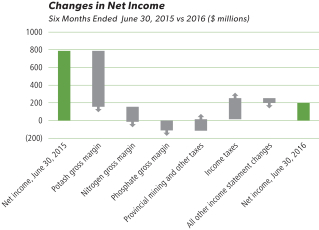
Earnings in the second quarter and first half of 2016 were lower than the same periods of 2015 due to lower gross margins in potash, nitrogen and phosphate more than offsetting decreased income taxes and provincial mining and other taxes.
Global potash markets were subdued in the second quarter. Despite healthy demand in North America and Latin America, delayed contracts in China and India, combined with cautious buying patterns in Other Asian markets, weighed on shipments. Spot prices declined from those in the first quarter, though they began to show signs of firming as market fundamentals improved at the end of the quarter.
Nitrogen and phosphate markets also experienced near-term headwinds. In nitrogen, lower energy costs and additional capacity pushed benchmark prices for most products to multi-year lows, despite reduced Chinese urea exports and relatively strong global
demand. In the US market, strong offshore imports and increased domestic supply put additional pressure on prices following the spring application season, especially for urea and UAN. Global phosphate prices also trended lower during the second quarter due to declining input costs, increased competitive supply and weaker Indian demand.
Other comprehensive loss for the second quarter and first half of 2016 was primarily impacted by decreases in the fair value of our investments in Israel Chemicals Ltd. (ICL) and Sinofert Holdings Limited (Sinofert), and a net actuarial loss resulting from a remeasurement of our defined benefit plans. Other comprehensive income for the second quarter and first half of 2015 mainly resulted from an increase in the fair value of our investment in Sinofert, partially offset by a decrease in the fair value of our investment in ICL.
| | |
| 21 | | PotashCorp 2016 Second Quarter Quarterly Report on Form 10-Q |
Operating Segment Review
We report our results (including gross margin) in three business segments: potash, nitrogen and phosphate as described in Note 2 to the financial statements in this Form 10-Q. Our reporting structure reflects how we manage our business and how we classify our operations for planning and measuring performance. We include net sales in segment disclosures in the financial statements in this Form 10-Q pursuant to IFRS, which require segmentation based upon our internal organization and reporting of revenue and profit measures. As a component of gross margin, net sales (and the related per-tonne amounts) are the primary revenue measures we use and review in making decisions about operating matters on a business segment basis. These decisions include assessments about potash, nitrogen and phosphate performance and the resources to be allocated to these segments. We also use net sales (and the related per-tonne amounts) for business planning and monthly forecasting. Net sales are calculated as sales revenues less freight, transportation and distribution expenses. Realized prices refer to net sales prices.
Our discussion of segment operating performance is set out below and includes nutrient product and/or market performance results, where applicable, to give further insight into these results.
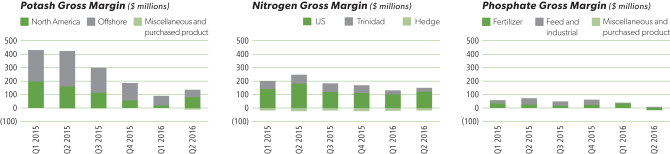
Potash Performance
Financial Performance
| | | | | | | | | | | | | | | | | | | | | | | | | | | | | | | | | | | | | | | | | | | | | | |
| | | | | Three Months Ended June 30 | |
| | | | | Dollars (millions) | | | | | | Tonnes (thousands) | | | | | | Average per Tonne (1) | |
| | | | | 2016 | | | 2015 | | | % Change | | | | | | 2016 | | | 2015 | | | % Change | | | | | | 2016 | | | 2015 | | | % Change | |
Manufactured product | | | | | | | | | | | | | | | | | | | | | | | | | | | | | | | | | | | | | | | | | | | | | | |
Net sales | | | | | | | | | | | | | | | | | | | | | | | | | | | | | | | | | | | | | | | | | | | | | | |
North America | | | | $ | 167 | | | $ | 227 | | | | (26 | ) | | | | | | | 850 | | | | 648 | | | | 31 | | | | | | | $ | 196 | | | $ | 349 | | | | (44 | ) |
Offshore | | | | | 160 | | | | 460 | | | | (65 | ) | | | | | | | 1,272 | | | | 1,864 | | | | (32 | ) | | | | | | $ | 125 | | | $ | 247 | | | | (49 | ) |
| | | | | 327 | | | | 687 | | | | (52 | ) | | | | | | | 2,122 | | | | 2,512 | | | | (16 | ) | | | | | | $ | 154 | | | $ | 273 | | | | (44 | ) |
Cost of goods sold | | | | | (192 | ) | | | (265 | ) | | | (28 | ) | | | | | | | | | | | | | | | | | | | | | | $ | (91 | ) | | $ | (105 | ) | | | (13 | ) |
Gross margin | | | | | 135 | | | | 422 | | | | (68 | ) | | | | | | | | | | | | | | | | | | | | | | $ | 63 | | | $ | 168 | | | | (63 | ) |
| Other miscellaneous and purchased product gross margin (2) | | | | | (12 | ) | | | (5 | ) | | | 140 | | | | | | | | | | | | | | | | | | | | | | | | | | | | | | | | | |
Gross Margin | | | | $ | 123 | | | $ | 417 | | | | (71 | ) | | | | | | | | | | | | | | | | | | | | | | $ | 58 | | | $ | 166 | | | | (65 | ) |
| (1) | Rounding differences may occur due to the use of whole dollars in per-tonne calculations. |
| (2) | Comprised of net sales of $2 million (2015 – $2 million) less cost of goods sold of $14 million (2015 – $7 million). |
| | |
| PotashCorp 2016 Second Quarter Quarterly Report on Form 10-Q | | 22 |
| | | | | | | | | | | | | | | | | | | | | | | | | | | | | | | | | | | | | | | | | | | | | | |
| | | | | Six Months Ended June 30 | |
| | | | | Dollars (millions) | | | | | | Tonnes (thousands) | | | | | | Average per Tonne (1) | |
| | | | | 2016 | | | 2015 | | | % Change | | | | | | 2016 | | | 2015 | | | % Change | | | | | | 2016 | | | 2015 | | | % Change | |
Manufactured product | | | | | | | | | | | | | | | | | | | | | | | | | | | | | | | | | | | | | | | | | | | | | | |
Net sales | | | | | | | | | | | | | | | | | | | | | | | | | | | | | | | | | | | | | | | | | | | | | | |
North America | | | | $ | 305 | | | $ | 506 | | | | (40 | ) | | | | | | | 1,628 | | | | 1,448 | | | | 12 | | | | | | | $ | 187 | | | $ | 349 | | | | (46 | ) |
Offshore | | | | | 340 | | | | 848 | | | | (60 | ) | | | | | | | 2,277 | | | | 3,413 | | | | (33 | ) | | | | | | $ | 149 | | | $ | 249 | | | | (40 | ) |
| | | | | 645 | | | | 1,354 | | | | (52 | ) | | | | | | | 3,905 | | | | 4,861 | | | | (20 | ) | | | | | | $ | 165 | | | $ | 278 | | | | (41 | ) |
Cost of goods sold | | | | | (421 | ) | | | (502 | ) | | | (16 | ) | | | | | | | | | | | | | | | | | | | | | | $ | (108 | ) | | $ | (103 | ) | | | 5 | |
Gross margin | | | | | 224 | | | | 852 | | | | (74 | ) | | | | | | | | | | | | | | | | | | | | | | $ | 57 | | | $ | 175 | | | | (67 | ) |
Other miscellaneous and purchased
product gross margin (2) | | | | | (13 | ) | | | (7 | ) | | | 86 | | | | | | | | | | | | | | | | | | | | | | | | | | | | | | | | | |
Gross Margin | | | | $ | 211 | | | $ | 845 | | | | (75 | ) | | | | | | | | | | | | | | | | | | | | | | $ | 54 | | | $ | 174 | | | | (69 | ) |
| (1) | Rounding differences may occur due to the use of whole dollars in per-tonne calculations. |
| (2) | Comprised of net sales of $6 million (2015 – $9 million) less cost of goods sold of $19 million (2015 – $16 million). |
Potash gross margin variance was attributable to:
| | | | | | | | | | | | | | | | | | | | | | | | | | | | | | | | | | | | |
| | | | | Three Months Ended June 30
2016 vs. 2015 | | | | | Six Months Ended June 30
2016 vs. 2015 | |
| | | | | | | | Change in
Prices/Costs | | | | | | | | | | | Change in
Prices/Costs | | | | |
| Dollars (millions) | | | | Change in Sales Volumes | | | Net Sales | | | Cost of Goods Sold | | | Total | | | | | Change in Sales Volumes | | | Net Sales | | | Cost of Goods Sold | | | Total | |
Manufactured product | | | | | | | | | | | | | | | | | | | | | | | | | | | | | | | | | | | | |
North America | | | | $ | 49 | | | $ | (131 | ) | | $ | 5 | | | $ | (77 | ) | | | | $ | 36 | | | $ | (264 | ) | | $ | (26 | ) | | $ | (254 | ) |
Offshore | | | | | (86 | ) | | | (154 | ) | | | 30 | | | | (210 | ) | | | | | (182 | ) | | | (226 | ) | | | 34 | | | | (374 | ) |
Change in market mix | | | | | (30 | ) | | | 30 | | | | — | | | | — | | | | | | (47 | ) | | | 47 | | | | — | | | | — | |
Total manufactured product | | | | $ | (67 | ) | | $ | (255 | ) | | $ | 35 | | | $ | (287 | ) | | | | $ | (193 | ) | | $ | (443 | ) | | $ | 8 | | | $ | (628 | ) |
Other miscellaneous and purchased product | | | | | | | | | | | | | | | | | (7 | ) | | | | | | | | | | | | | | | | | (6 | ) |
Total | | | | | | | | | | | | | | | | $ | (294 | ) | | | | | | | | | | | | | | | | $ | (634 | ) |
Sales to major offshore markets were as follows:
| | | | | | | | | | | | | | | | | | | | | | | | | | | | | | | | | | | | | | | | | | | | | | | | | | | | | | | | | | | | |
| | | | | Three Months Ended June 30 | | | | | Six Months Ended June 30 | |
| | | | | By Canpotex (1) | | | | | | From New Brunswick | | | | | By Canpotex (1) | | | | | | From New Brunswick | |
| | | | | Percentage of Sales Volumes | | | | | | | | | Percentage of Sales Volumes | | | | | | | | Percentage of Sales Volumes | | | | | | | | | Percentage of Sales Volumes | | | | |
| | | | | 2016 | | | 2015 | | | % Change | | | | | | 2016(3) | | | 2015 | | | % Change | | | | | 2016 | | | 2015 | | | % Change | | | | | | 2016(3) | | | 2015 | | | % Change | |
Other Asian
markets (2) | | | 37 | | | | 30 | | | | 23 | | | | | | | | | | | | — | | | | — | | | | | | 42 | | | | 38 | | | | 11 | | | | | | | | | | | | — | | | | — | |
Latin America | | | | | 47 | | | | 37 | | | | 27 | | | | | | | | | | | | 100 | | | | — | | | | | | 39 | | | | 30 | | | | 30 | | | | | | | | | | | | 100 | | | | — | |
China | | | | | 7 | | | | 20 | | | | (65 | ) | | | | | | | | | | | — | | | | — | | | | | | 8 | | | | 17 | | | | (53 | ) | | | | | | | | | | | — | | | | — | |
India | | | | | — | | | | 8 | | | | (100 | ) | | | | | | | | | | | — | | | | — | | | | | | 2 | | | | 9 | | | | (78 | ) | | | | | | | | | | | — | | | | — | |
Other markets | | | | | 9 | | | | 5 | | | | 80 | | | | | | | | | | | | — | | | | — | | | | | | 9 | | | | 6 | | | | 50 | | | | | | | | | | | | — | | | | — | |
| | | | | | 100 | | | | 100 | | | | | | | | | | | | | | | | 100 | | | | | | | | | | 100 | | | | 100 | | | | | | | | | | | | | | | | 100 | | | | | |
| (1) | Canpotex Limited (Canpotex). |
| (2) | All Asian markets except China and India. |
| (3) | Our international customers were served by New Brunswick through 2015, and have since been served through Canpotex. |
| | |
| 23 | | PotashCorp 2016 Second Quarter Quarterly Report on Form 10-Q |
The most significant contributors to the change in total gross margin were as follows (direction of arrows refers to impact on gross margin):
| | | | | | | | |
| | | | | Quarter over Quarter | | | | Year over Year |
Net Sales Prices | | | | i Our average realized potash price was down, driven by a weaker pricing environment. i Our average offshore realized price was also impacted by our share of Canpotex’s project exit costs following its decision not to proceed with development of an export terminal in Prince Rupert, British Columbia. | | | | i Spot prices continued to move lower due to weak offshore demand and increased competitive pressures. |
Sales Volumes | | | | h North American volumes were up due to healthy demand. | | | | i Offshore volumes were down largely due to the absence of contracts in China and India. |
| | | | | i A lack of engagement in key contract markets kept offshore volumes well below 2015 levels. | | | | h Stronger North America demand in the second quarter of 2016 was driven by increased planted acreage and strong potash affordability. This was partly offset by weaker buyer engagement in the first quarter of 2016. |
Cost of Goods Sold | | | | h The Canadian dollar weakened relative to the US dollar. h Royalty costs declined due to lower average North America listed sales prices per tonne. | | | | i North America cost of goods sold variance was negative due to the indefinite suspension of potash operations at Picadilly in the first quarter of 2016. h The Canadian dollar weakened relative to the US dollar. i Shutdown weeks were higher in 2016 (13 weeks) compared to 2015 (five weeks), largely as a result of our strategy to match production to market demand. h Royalty costs declined due to lower average North America listed sales prices per tonne. |
| | |
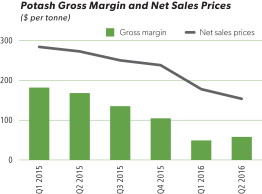
| | 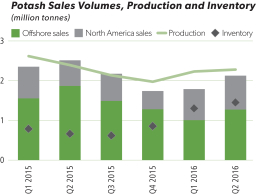 |
Non-Financial Performance
| | | | | | | | | | | | | | | | | | | | | | | | | | | | | | |
| | | | | | | Three Months Ended June 30 | | | | | Six Months Ended June 30 | |
| | | | | | | 2016 | | | 2015 | | | % Change | | | | | 2016 | | | 2015 | | | % Change | |
Production | | KCl tonnes produced (thousands) | | | | | 2,273 | | | | 2,387 | | | | (5 | ) | | | | | 4,503 | | | | 4,999 | | | | (10 | ) |
Safety | | Total site recordable injury rate | | | | | 1.08 | | | | 1.73 | | | | (38 | ) | | | | | 1.46 | | | | 1.57 | | | | (7 | ) |
| | Total lost-time injury rate | | | | | — | | | | 0.10 | | | | (100 | ) | | | | | 0.12 | | | | 0.15 | | | | (20 | ) |
Employee | | Employee turnover rate (annualized) | | | | | 4.2% | | | | 4.1% | | | | 2 | | | | | | 3.7% | | | | 3.9% | | | | (5 | ) |
Environmental | | Environmental incidents | | | | | 1 | | | | 1 | | | | — | | | | | | 4 | | | | 2 | | | | 100 | |
| | | Waste (million tonnes) | | | | | 5.1 | | | | 5.3 | | | | (4 | ) | | | | | 9.6 | | | | 10.6 | | | | (9 | ) |
| | |
| PotashCorp 2016 Second Quarter Quarterly Report on Form 10-Q | | 24 |
The most significant contributors to the change in non-financial results were as follows:
| | | | | | | | | | |
| | | | | Quarter over Quarter | | | | | Year over Year |
| Production | | | | Production was down due to the indefinite suspension of our Picadilly potash operations (no production in 2016). |
| Safety | | | | There were nine recordable injuries, with no lost-time injuries in 2016, compared to 18 recordable injuries, including one lost-time injury, in 2015. | | | | | | In 2016 there were 25 recordable injuries and two lost-time injuries and in 2015 there were 32 recordable injuries and three lost-time injuries. The decrease in injury rates between years was partially offset by fewer hours worked in 2016 compared to 2015. |
| Environmental | | | | Although environmental incidents were flat quarter over quarter, there was a higher number of them in the first half of 2016 as compared to the first half of 2015. In 2016 we experienced four incidents: two potash spills, one brine spill and one water release with high suspended solids. In the first half of 2015, we had two environmental incidents: related to one brine spill and a minor propane gas release. |
Nitrogen Performance
Financial Performance
| | | | | | | | | | | | | | | | | | | | | | | | | | | | | | | | | | | | | | | | | | | | | | |
| | | | | Three Months Ended June 30 | |
| | | | | Dollars (millions) | | | | | | Tonnes (thousands) | | | | | | Average per Tonne (1) | |
| | | | | 2016 | | | 2015 | | | % Change | | | | | | 2016 | | | 2015 | | | % Change | | | | | | 2016 | | | 2015 | | | % Change | |
Manufactured product (2) | | | | | | | | | | | | | | | | | | | | | | | | | | | | | | | | | | | | | | | | | | | | | | |
Net sales | | | | | | | | | | | | | | | | | | | | | | | | | | | | | | | | | | | | | | | | | | | | | | |
Ammonia | | | | $ | 177 | | | $ | 285 | | | | (38 | ) | | | | | | | 543 | | | | 621 | | | | (13 | ) | | | | | | $ | 325 | | | $ | 460 | | | | (29 | ) |
Urea | | | | | 71 | | | | 98 | | | | (28 | ) | | | | | | | 261 | | | | 272 | | | | (4 | ) | | | | | | $ | 274 | | | $ | 358 | | | | (23 | ) |
Solutions, nitric acid, ammonium nitrate | | | | | 119 | | | | 161 | | | | (26 | ) | | | | | | | 703 | | | | 739 | | | | (5 | ) | | | | | | $ | 169 | | | $ | 218 | | | | (22 | ) |
| | | | | 367 | | | | 544 | | | | (33 | ) | | | | | | | 1,507 | | | | 1,632 | | | | (8 | ) | | | | | | $ | 244 | | | $ | 334 | | | | (27 | ) |
Cost of goods sold | | | | | (242 | ) | | | (327 | ) | | | (26 | ) | | | | | | | | | | | | | | | | | | | | | | $ | (160 | ) | | $ | (201 | ) | | | (20 | ) |
Gross margin | | | | | 125 | | | | 217 | | | | (42 | ) | | | | | | | | | | | | | | | | | | | | | | $ | 84 | | | $ | 133 | | | | (37 | ) |
| Other miscellaneous and purchased product gross margin (3) | | | | | 5 | | | | 5 | | | | — | | | | | | | | | | | | | | | | | | | | | | | | | | | | | | | | | |
Gross Margin | | | | $ | 130 | | | $ | 222 | | | | (41 | ) | | | | | | | | | | | | | | | | | | | | | | $ | 86 | | | $ | 136 | | | | (37 | ) |
| (1) | Rounding differences may occur due to the use of whole dollars in per-tonne calculations. |
| (2) | Includes inter-segment ammonia sales, comprised of: net sales $17 million, cost of goods sold $7 million and 39,000 sales tonnes (2015 – net sales $18 million, cost of goods sold $6 million and 37,000 sales tonnes). Inter-segment profits are eliminated on consolidation. |
| (3) | Comprised of third-party and inter-segment sales, including: third-party net sales $6 million less cost of goods sold $1 million (2015 – net sales $6 million less cost of goods sold $2 million) and inter-segment net sales $NIL less cost of goods sold $NIL (2015 – net sales $1 less cost of goods sold $NIL). Inter-segment profits are eliminated on consolidation. |
| | |
| 25 | | PotashCorp 2016 Second Quarter Quarterly Report on Form 10-Q |
| | | | | | | | | | | | | | | | | | | | | | | | | | | | | | | | | | | | | | | | | | | | | | |
| | | | | Six Months Ended June 30 | |
| | | | | Dollars (millions) | | | | | | Tonnes (thousands) | | | | | | Average per Tonne (1) | |
| | | | | 2016 | | | 2015 | | | % Change | | | | | | 2016 | | | 2015 | | | % Change | | | | | | 2016 | | | 2015 | | | % Change | |
Manufactured product (2) | | | | | | | | | | | | | | | | | | | | | | | | | | | | | | | | | | | | | | | | | | | | | | |
Net sales | | | | | | | | | | | | | | | | | | | | | | | | | | | | | | | | | | | | | | | | | | | | | | |
Ammonia | | | | $ | 365 | | | $ | 513 | | | | (29 | ) | | | | | | | 1,144 | | | | 1,110 | | | | 3 | | | | | | | $ | 318 | | | $ | 463 | | | | (31 | ) |
Urea | | | | | 157 | | | | 195 | | | | (19 | ) | | | | | | | 567 | | | | 524 | | | | 8 | | | | | | | $ | 278 | | | $ | 372 | | | | (25 | ) |
Solutions, nitric acid, ammonium nitrate | | | | | 252 | | | | 295 | | | | (15 | ) | | | | | | | 1,460 | | | | 1,307 | | | | 12 | | | | | | | $ | 173 | | | $ | 226 | | | | (23 | ) |
| | | | | 774 | | | | 1,003 | | | | (23 | ) | | | | | | | 3,171 | | | | 2,941 | | | | 8 | | | | | | | $ | 244 | | | $ | 341 | | | | (28 | ) |
Cost of goods sold | | | | | (546 | ) | | | (609 | ) | | | (10 | ) | | | | | | | | | | | | | | | | | | | | | | $ | (172 | ) | | $ | (207 | ) | | | (17 | ) |
Gross margin | | | | | 228 | | | | 394 | | | | (42 | ) | | | | | | | | | | | | | | | | | | | | | | $ | 72 | | | $ | 134 | | | | (46 | ) |
| Other miscellaneous and purchased product gross margin (3) | | | | | 9 | | | | 9 | | | | — | | | | | | | | | | | | | | | | | | | | | | | | | | | | | | | | | |
Gross Margin | | | | $ | 237 | | | $ | 403 | | | | (41 | ) | | | | | | | | | | | | | | | | | | | | | | $ | 75 | | | $ | 137 | | | | (45 | ) |
| (1) | Rounding differences may occur due to the use of whole dollars in per-tonne calculations. |
| (2) | Includes inter-segment ammonia sales, comprised of: net sales $34 million, cost of goods sold $14 million and 79,000 sales tonnes (2015 – net sales $36 million, cost of goods sold $12 million and 70,000 sales tonnes). Inter-segment profits are eliminated on consolidation. |
| (3) | Comprised of third-party and inter-segment sales, including: third-party net sales $11 million less cost of goods sold $2 million (2015 – net sales $24 million less cost of goods sold $16 million) and inter-segment net sales $NIL less cost of goods sold $NIL (2015 – net sales $1 less cost of goods sold $NIL). Inter-segment profits are eliminated on consolidation. |
Nitrogen gross margin variance was attributable to:
| | | | | | | | | | | | | | | | | | | | | | | | | | | | | | | | | | | | |
| | | | | Three Months Ended June 30
2016 vs. 2015 | | | | | Six Months Ended June 30
2016 vs. 2015 | |
| | | | | | | | Change in
Prices/Costs | | | | | | | | | | Change in
Prices/Costs | | | | |
| Dollars (millions) | | | | Change in Sales Volumes | | | Net Sales | | | Cost of Goods Sold | | | Total | | | | Change in Sales Volumes | | | Net Sales | | | Cost of Goods Sold | | | Total | |
Manufactured product | | | | | | | | | | | | | | | | | | | | | | | | | | | | | | | | | | | | |
Ammonia | | | | $ | (14 | ) | | $ | (73 | ) | | $ | 37 | | | $ | (50 | ) | | | | $ | 7 | | | $ | (165 | ) | | $ | 72 | | | $ | (86 | ) |
Urea | | | | | (2 | ) | | | (22 | ) | | | 7 | | | | (17 | ) | | | | | 6 | | | | (54 | ) | | | 12 | | | | (36 | ) |
Solutions, nitric acid, ammonium nitrate | | | | | (8 | ) | | | (27 | ) | | | 6 | | | | (29 | ) | | | | | 15 | | | | (77 | ) | | | 18 | | | | (44 | ) |
Hedge | | | | | — | | | | — | | | | 4 | | | | 4 | | | | | | — | | | | — | | | | — | | | | — | |
Change in product mix | | | | | 5 | | | | (11 | ) | | | 6 | | | | — | | | | | | 7 | | | | (13 | ) | | | 6 | | | | — | |
Total manufactured product | | | | $ | (19 | ) | | $ | (133 | ) | | $ | 60 | | | $ | (92 | ) | | | | $ | 35 | | | $ | (309 | ) | | $ | 108 | | | $ | (166 | ) |
Other miscellaneous and purchased product | | | | | | | | | | | | | | | | | — | | | | | | | | | | | | | | | | | | — | |
Total | | | | | | | | | | | | | | | | $ | (92 | ) | | | | | | | | | | | | | | | | $ | (166 | ) |
| | | | | | | | | | | | | | | | | | | | | | | | | | | | | | | | | | | | | | | | | | | | |
| | | | | Three Months Ended June 30 | | | | | Six Months Ended June 30 | |
| | | | | Sales Tonnes
(thousands) | | | | | | Average Net Sales Price
per Tonne | | | | | Sales Tonnes
(thousands) | | | | | | Average Net Sales Price
per Tonne | |
| | | | | 2016 | | | 2015 | | | | | | 2016 | | | 2015 | | | | | 2016 | | | 2015 | | | | | | 2016 | | | 2015 | |
Fertilizer | | | | | 547 | | | | 583 | | | | | | | $ | 267 | | | $ | 350 | | | | | | 1,213 | | | | 971 | | | | | | | $ | 248 | | | $ | 347 | |
Industrial and Feed | | | | | 960 | | | | 1,049 | | | | | | | $ | 230 | | | $ | 324 | | | | | | 1,958 | | | | 1,970 | | | | | | | $ | 242 | | | $ | 338 | |
| | | | | | 1,507 | | | | 1,632 | | | | | | | $ | 244 | | | $ | 334 | | | | | | 3,171 | | | | 2,941 | | | | | | | $ | 244 | | | $ | 341 | |
| | |
| PotashCorp 2016 Second Quarter Quarterly Report on Form 10-Q | | 26 |
The most significant contributors to the change in total gross margin were as follows (direction of arrows refers to impact on gross margin):
| | | | | | | | |
| | | | | Quarter over Quarter | | | | Year over Year |
Net Sales Prices | | | | i Weaker benchmark pricing lowered our average realized price during the quarter. | | | | i Our average realized price declined as lower global energy costs and new nitrogen capacity pressured prices for all nitrogen products. |
Sales Volumes | | | | i Volumes decreased due to weaker North American industrial demand. | | | | h Strong sales volumes in the first quarter of 2016 (compared to 2015), driven by increased demand and additional production availability at our recently expanded Lima facility, were almost offset by lower volumes in the second quarter of 2016 (compared to 2015). |
Cost of Goods Sold | | | | h Average costs, including our hedge position, for natural gas used as feedstock in production decreased 31 percent. Costs for natural gas used as feedstock in Trinidad production fell 37 percent (contract price indexed primarily to Tampa ammonia prices) while our US spot costs for natural gas decreased 25 percent. Including losses on our hedge position, our US gas prices fell 22 percent. | | | | h Average costs, including our hedge position, for natural gas used as feedstock in production decreased 32 percent. Costs for natural gas used as feedstock in Trinidad production fell 38 percent (contract price indexed primarily to Tampa ammonia prices) while our US spot costs for natural gas decreased 26 percent. Including losses on our hedge position, our US gas prices fell 23 percent. |
| | |
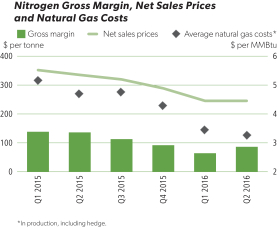 | | 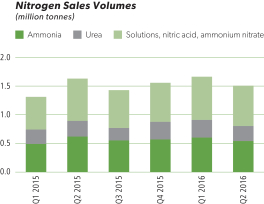 |
Non-Financial Performance
| | | | | | | | | | | | | | | | | | | | | | | | | | | | | | |
| | | | | | | Three Months Ended June 30 | | | | | Six Months Ended June 30 | |
| | | | | | | 2016 | | | 2015 | | | % Change | | | | | 2016 | | | 2015 | | | % Change | |
Production | | N tonnes produced (thousands) | | | | | 789 | | | | 753 | | | | 5 | | | | | | 1,560 | | | | 1,545 | | | | 1 | |
| | Ammonia operating rate | | | | | 89% | | | | 86% | | | | 3 | | | | | | 88% | | | | 89% | | | | (1 | ) |
Safety | | Total site recordable injury rate | | | | | — | | | | 0.19 | | | | (100 | ) | | | | | 0.43 | | | | 0.17 | | | | 153 | |
| | Total lost-time injury rate | | | | | — | | | | — | | | | — | | | | | | 0.14 | | | | — | | | | n/m | |
Employee | | Employee turnover rate (annualized) | | | | | 2.0% | | | | 5.0% | | | | (60 | ) | | | | | 1.7% | | | | 4.7% | | | | (64 | ) |
Environmental | | Greenhouse gas emissions (CO2 equivalent tonnes/tonne of product) | | | | | 2.0 | | | | 2.0 | | | | — | | | | | | 2.0 | | | | 2.1 | | | | (5 | ) |
| | | Environmental incidents | | | | | 1 | | | | 1 | | | | — | | | | | | 4 | | | | 3 | | | | 33 | |
| | |
| 27 | | PotashCorp 2016 Second Quarter Quarterly Report on Form 10-Q |
The most significant contributors to the change in non-financial results were as follows:
| | | | | | | | |
| | | | | Quarter over Quarter | | | | Year over Year |
Safety | | | | In 2016 there were no recordable injuries compared to two in 2015. | | | | There were six recordable injuries, including two lost-time injuries in 2016 compared to three recordable injuries and no lost-time injuries in 2015. |
Employee | | | | Employee turnover fell as departures decreased to four in 2016 compared to 10 in 2015. | | | | Employee turnover fell as departures decreased to seven in 2016 compared to 19 in 2015. |
Phosphate Performance
Financial Performance
| | | | | | | | | | | | | | | | | | | | | | | | | | | | | | | | | | | | | | | | | | |
| | | | | Three Months Ended June 30 | |
| | | | | Dollars (millions) | | | | | Tonnes (thousands) | | | | | Average per Tonne (1) | |
| | | | | 2016 | | | 2015 | | | % Change | | | | | 2016 | | | 2015 | | | % Change | | | | | 2016 | | | 2015 | | | % Change | |
Manufactured product | | | | | | | | | | | | | | | | | | | | | | | | | | | | | | | | | | | | | | | | | | |
Net sales | | | | | | | | | | | | | | | | | | | | | | | | | | | | | | | | | | | | | | | | | | |
Fertilizer | | | | $ | 108 | | | $ | 184 | | | | (41 | ) | | | | | 274 | | | | 383 | | | | (28 | ) | | | | $ | 397 | | | $ | 480 | | | | (17 | ) |
Feed and Industrial | | | | | 140 | | | | 192 | | | | (27 | ) | | | | | 238 | | | | 296 | | | | (20 | ) | | | | $ | 587 | | | $ | 647 | | | | (9 | ) |
| | | | | 248 | | | | 376 | | | | (34 | ) | | | | | 512 | | | | 679 | | | | (25 | ) | | | | $ | 485 | | | $ | 553 | | | | (12 | ) |
Cost of goods sold | | | | | (259 | ) | | | (305 | ) | | | (15 | ) | | | | | | | | | | | | | | | | | | $ | (506 | ) | | $ | (450 | ) | | | 12 | |
Gross margin | | | | | (11 | ) | | | 71 | | | | n/m | | | | | | | | | | | | | | | | | | | $ | (21 | ) | | $ | 103 | | | | n/m | |
| Other miscellaneous and purchased product gross margin (2) | | | | | 1 | | | | 1 | | | | — | | | | | | | | | | | | | | | | | | | | | | | | | | | | | |
Gross Margin | | | | $ | (10 | ) | | $ | 72 | | | | n/m | | | | | | | | | | | | | | | | | | | $ | (20 | ) | | $ | 106 | | | | n/m | |
| (1) | Rounding differences may occur due to the use of whole dollars in per-tonne calculations. |
| (2) | Comprised of net sales of $2 million (2015 – $10 million) less cost of goods sold of $1 million (2015 – $9 million). |
| | | | | | | | | | | | | | | | | | | | | | | | | | | | | | | | | | | | | | | | | | |
| | | | | Six Months Ended June 30 | |
| | | | | Dollars (millions) | | | | | Tonnes (thousands) | | | | | Average per Tonne (1) | |
| | | | | 2016 | | | 2015 | | | % Change | | | | | 2016 | | | 2015 | | | % Change | | | | | 2016 | | | 2015 | | | % Change | |
Manufactured product | | | | | | | | | | | | | | | | | | | | | | | | | | | | | | | | | | | | | | | | | | |
Net sales | | | | | | | | | | | | | | | | | | | | | | | | | | | | | | | | | | | | | | | | | | |
Fertilizer | | | | $ | 299 | | | $ | 378 | | | | (21 | ) | | | | | 711 | | | | 754 | | | | (6 | ) | | | | $ | 421 | | | $ | 501 | | | | (16 | ) |
Feed and Industrial | | | | | 307 | | | | 371 | | | | (17 | ) | | | | | 518 | | | | 576 | | | | (10 | ) | | | | $ | 592 | | | $ | 644 | | | | (8 | ) |
| | | | | 606 | | | | 749 | | | | (19 | ) | | | | | 1,229 | | | | 1,330 | | | | (8 | ) | | | | $ | 493 | | | $ | 563 | | | | (12 | ) |
Cost of goods sold | | | | | (579 | ) | | | (622 | ) | | | (7 | ) | | | | | | | | | | | | | | | | | | $ | (471 | ) | | $ | (468 | ) | | | 1 | |
Gross margin | | | | | 27 | | | | 127 | | | | (79 | ) | | | | | | | | | | | | | | | | | | $ | 22 | | | $ | 95 | | | | (77 | ) |
| Other miscellaneous and purchased product gross margin (2) | | | | | 2 | | | | 3 | | | | (33 | ) | | | | | | | | | | | | | | | | | | | | | | | | | | | | |
Gross Margin | | | | $ | 29 | | | $ | 130 | | | | (78 | ) | | | | | | | | | | | | | | | | | | $ | 24 | | | $ | 98 | | | | (76 | ) |
| (1) | Rounding differences may occur due to the use of whole dollars in per-tonne calculations. |
| (2) | Comprised of net sales of $3 million (2015 – $41 million) less cost of goods sold of $1 million (2015 – $38 million). |
| | |
| PotashCorp 2016 Second Quarter Quarterly Report on Form 10-Q | | 28 |
Phosphate gross margin variance was attributable to:
| | | | | | | | | | | | | | | | | | | | | | | | | | | | | | | | | | | | | | |
| | | | | Three Months Ended June 30
2016 vs. 2015 | | | | | | Six Months Ended June 30
2016 vs. 2015 | |
| | | | | | | | Change in
Prices/Costs | | | | | | | | | | | | Change in
Prices/Costs | | | | |
| Dollars (millions) | | | | Change in Sales Volumes | | | Net Sales | | | Cost of Goods Sold | | | Total | | | | | | Change in Sales Volumes | | | Net Sales | | | Cost of Goods Sold | | | Total | |
Manufactured product | | | | | | | | | | | | | | | | | | | | | | | | | | | | | | | | | | | | | | |
Fertilizer | | | | $ | (17 | ) | | $ | (19 | ) | | $ | (10 | ) | | $ | (46 | ) | | | | | | $ | (4 | ) | | $ | (57 | ) | | $ | 17 | | | $ | (44 | ) |
Feed and Industrial | | | | | (12 | ) | | | (16 | ) | | | (8 | ) | | | (36 | ) | | | | | | | (7 | ) | | | (31 | ) | | | (18 | ) | | | (56 | ) |
Change in product mix | | | | | — | | | | 3 | | | | (3 | ) | | | — | | | | | | | | — | | | | 2 | | | | (2 | ) | | | — | |
Total manufactured product | | | | $ | (29 | ) | | $ | (32 | ) | | $ | (21 | ) | | $ | (82 | ) | | | | | | $ | (11 | ) | | $ | (86 | ) | | $ | (3 | ) | | $ | (100 | ) |
Other miscellaneous and purchased product | | | | | | | | | | | | | | | | | — | | | | | | | | | | | | | | | | | | | | (1 | ) |
Total | | | | | | | | | | | | | | | | $ | (82 | ) | | | | | | | | | | | | | | | | | | $ | (101 | ) |
The most significant contributors to the change in total gross margin were as follows (direction of arrows refers to impact on gross margin):
| | | | | | | | |
| | | | | Quarter over Quarter | | | | Year over Year |
Net Sales Prices | | | | i Our average realized price was down as weaker demand weighed on prices for nearly all our products. | | | | i Our average realized price was down as weaker demand weighed on prices, most notably for fertilizers. |
Sales Volumes | | | | i Sales volumes were down due primarily to weaker North American demand. | | | | i Lower sales volumes for the second quarter of 2016 (compared to 2015)were partly offset by higher sales volumes in the first quarter of 2016 (compared to 2015) as a result of fewer production constraints. |
Cost of Goods Sold | | | | i A discount rate reduction resulted in an increase in provisions for asset retirement obligations. | | | | i A discount rate reduction resulted in an increase in provisions for asset retirement obligations. |
| | | | | | | | i An impairment of property, plant and equipment related to a product that the company will no longer produce resulted in a negative cost of goods sold variance in feed and industrial. |
| | | | | | | | | h Cost of goods sold were lower due to the initial realization of efficiency and procurement initiatives started in the second half of 2015; reduced ammonia costs (21 percent); and lower sulfur costs (33 percent). |
| | |
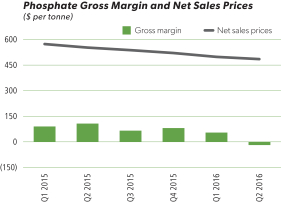 | | 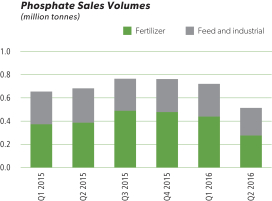 |
| | |
| 29 | | PotashCorp 2016 Second Quarter Quarterly Report on Form 10-Q |
Non-Financial Performance
| | | | | | | | | | | | | | | | | | | | | | | | | | | | | | | | |
| | | | | | | | | Three Months Ended June 30 | | | | | Six Months Ended June 30 | |
| | | | | | | | | 2016 | | | 2015 | | | % Change | | | | | 2016 | | | 2015 | | | % Change | |
Production | | | | P2O5 tonnes produced (thousands) | | | | | 297 | | | | 379 | | | | (22 | ) | | | | | 708 | | | | 745 | | | | (5 | ) |
| | | | P2O5 operating rate | | | | | 62% | | | | 80% | | | | (23 | ) | | | | | 74% | | | | 78% | | | | (5 | ) |
Safety | | | | Life-altering injuries | | | | | — | | | | — | | | | — | | | | | | — | | | | 1 | | | | (100 | ) |
| | | | Total site recordable injury rate | | | | | 0.96 | | | | 0.61 | | | | 57 | | | | | | 0.90 | | | | 0.86 | | | | 5 | |
| | | | Total lost-time injury rate | | | | | 0.12 | | | | — | | | | n/m | | | | | | 0.13 | | | | 0.07 | | | | 86 | |
Employee | | | | Employee turnover rate (annualized) | | | | | 3.0% | | | | 3.1% | | | | (3 | ) | | | | | 2.8% | | | | 3.4% | | | | (18 | ) |
Environmental | | | | Environmental incidents | | | | | 1 | | | | 3 | | | | (67 | ) | | | | | 3 | | | | 5 | | | | (40 | ) |
| | | | | Water consumption (m3 per tonne of product) | | | | | 33 | | | | 26 | | | | 27 | | | | | | 28 | | | | 27 | | | | 4 | |
The most significant contributors to the change in non-financial results were as follows:
| | | | | | | | |
| | | | | Quarter over Quarter | | | | Year over Year |
Production | | | | Production at Aurora and White Springs was curtailed in response to a lack of demand and limited storage capacity. | | | | Production decreased due to second-quarter 2016 curtailments exceeding a production increase in first-quarter 2015. |
Safety | | | | In 2016, there were eight recordable injuries, including one lost-time injury, compared to five recordable injuries and no lost-time injuries in 2015. | | | | Fewer recordable injuries in the first quarter of 2016 compared to the same period in 2015 was more than offset by higher recordable injuries in the second quarter of 2016 compared to the same period in 2015. There were two lost-time injuries in 2016 compared to one in 2015. |
Environmental | | | | In 2016 there was one ammonia-to-air release and in 2015 there were releases of higher suspended solids and phosphorus in waste water along with a phosphoric acid spill. | | | | In 2016, incidents were related to a release of higher suspended solids in waste water, a release of ammonia to air and one air permit exceedance for mercury. In 2015, there were releases of higher suspended solids and phosphorus in waste water and a phosphoric acid spill. |
| | | | | Water consumption rose as certain processes at our White Springs facility continue to need water even when product is not being manufactured. | | | | Water consumption rose as certain processes at our White Springs facility continue to need water even when product is not being manufactured. |
Other Expenses and Income
| | | | | | | | | | | | | | | | | | | | | | | | | | | | | | | | | | | | | | | | |
| | | | | | Three Months Ended June 30 | | | | | | Six Months Ended June 30 | |
| Dollars (millions), except percentage amounts | | | | | 2016 | | | 2015 | | | Change | | | % Change | | | | | | 2016 | | | 2015 | | | Change | | | % Change | |
Selling and administrative expenses | | | | | | $ | (55 | ) | | $ | (60 | ) | | $ | 5 | | | | (8 | ) | | | | | | $ | (108 | ) | | $ | (120 | ) | | $ | 12 | | | | (10 | ) |
Provincial mining and other taxes | | | | | | | (26 | ) | | | (90 | ) | | | 64 | | | | (71 | ) | | | | | | | (57 | ) | | | (185 | ) | | | 128 | | | | (69 | ) |
Share of earnings of equity-accounted investees | | | | | | | 30 | | | | 35 | | | | (5 | ) | | | (14 | ) | | | | | | | 49 | | | | 71 | | | | (22 | ) | | | (31 | ) |
Dividend income | | | | | | | 16 | | | | 31 | | | | (15 | ) | | | (48 | ) | | | | | | | 16 | | | | 31 | | | | (15 | ) | | | (48 | ) |
Impairment of available-for-sale investment | | | | | | | (10 | ) | | | — | | | | (10 | ) | | | n/m | | | | | | | | (10 | ) | | | — | | | | (10 | ) | | | n/m | |
Other income (expenses) | | | | | | | 1 | | | | (8 | ) | | | 9 | | | | n/m | | | | | | | | (9 | ) | | | 3 | | | | (12 | ) | | | n/m | |
Finance costs | | | | | | | (54 | ) | | | (50 | ) | | | (4 | ) | | | 8 | | | | | | | | (106 | ) | | | (99 | ) | | | (7 | ) | | | 7 | |
Income taxes | | | | | | | (24 | ) | | | (152 | ) | | | 128 | | | | (84 | ) | | | | | | | (56 | ) | | | (292 | ) | | | 236 | | | | (81 | ) |
| | |
| PotashCorp 2016 Second Quarter Quarterly Report on Form 10-Q | | 30 |
The most significant contributors to the change in other expenses and income were as follows:
| | | | | | | | | | | | | | | | | | | | | | | | | | | | | | | | | | |
| | | | | Quarter over Quarter | | | | | Year over Year | |
Provincial Mining and Other Taxes | | | | Provincial mining and other taxes decreased primarily due to weaker potash prices. | |
| Earnings of Equity-accounted Investees | | | | Share of earnings of equity-accounted investees pertains primarily to SQM and APC. Lower earnings were mainly due to lower earnings at APC. | |
Dividend Income | | | | Dividend income from ICL decreased. | |
| Impairment of Available-for-sale Investment | | | | As discussed in Note 3 to the financial statements in this Form 10-Q, a non-taxable impairment loss of $10 million was recorded in net income on our investment in Sinofert. | |
Finance Costs | | | | 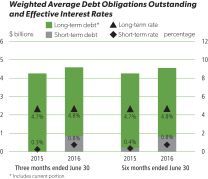 | |
Income Taxes | | | | For the second quarter and first six months of 2016, income taxes decreased due to lower income before taxes. For the first six months of 2016, 89 percent of the effective tax rate on the current year’s ordinary earnings pertained to current income taxes (2015 – 67 percent) and 11 percent related to deferred income taxes (2015 – 33 percent). The increase in the current portion was due to different income weightings between jurisdictions. | |
| | | | Effective Tax Rates and Discrete Items Dollars (millions), except percentage amounts | |
| | | | | | | | | Three Months Ended June 30 | | | | | | Six Months Ended June 30 | |
| | | | | | | | | 2016 | | | | | | 2015 | | | | | | 2016 | | | | | 2015 | |
| | | | Actual effective tax rate on ordinary earnings | | | | | 17% | | | | | | | | 26% | | | | | | | | 21% | | | | | | 27% | |
| | | | Actual effective tax rate including discrete items | | | | | 16% | | | | | | | | 27% | | | | | | | | 22% | | | | | | 27% | |
| | | | Discrete tax adjustments that impacted the rate | | | | $ | 4 | | | | | | | $ | (3) | | | | | | | $ | — | | | | | $ | (6) | |
Other Non-Financial Information
| | | | | | | | | | | | | | | | | | | | | | | | | | | | | | | | | | | | | | | | |
| | | | | | Three Months Ended June 30 | | | | | | Six Months Ended June 30 | |
| Dollars (millions), except percentage amounts | | | | | 2016 | | | 2015 | | | Change | | | % Change | | | | | | 2016 | | | 2015 | | | Change | | | % Change | |
Taxes and royalties (1) | | | | | | $ | 81 | | | $ | 215 | | | $ | (134 | ) | | | (62 | ) | | | | | | $ | 159 | | | $ | 457 | | | $ | 298 | | | | (65 | ) |
| (1) | Includes tax and royalty amounts on an accrual basis calculated as: current income tax expense less investment tax credits and realized excess tax benefit related to share-based compensation plus potash production tax, resource surcharge, royalties, municipal taxes and other miscellaneous taxes. |
The most significant contributors to the change in other non-financial information were as follows:
| | | | | | | | |
| | | | | Quarter over Quarter | | | | Year over Year |
Taxes and Royalties | | | | Taxes and royalties declined due to the decreases in provincial mining and other taxes (described above) and in current income taxes. The reduction in current income taxes was primarily due to significantly lower earnings in 2016 compared to the same periods in 2015. |
| | |
| 31 | | PotashCorp 2016 Second Quarter Quarterly Report on Form 10-Q |
Financial Condition Review
Statement of Financial Position Analysis
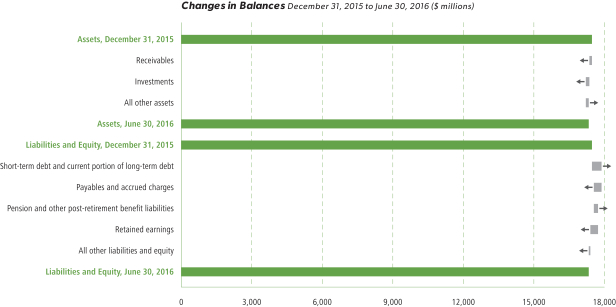
The most significant contributors to the changes in our statements of financial position were as follows (direction of arrows refers to increase or decrease):
| | | | |
| Assets | | | | Liabilities |
i Receivables decreased mainly due to lower trade accounts receivable. | | | | h Short-term debt and current portion of long-term debt grew due to an increase in our outstanding commercial paper. |
i Investments were largely impacted by the lower fair value of our available-for-sale investments in Sinofert and ICL. | | | | i Payables and accrued charges were lower mainly due to lower trade payables and a decrease in dividends payable. |
| | | | | h Pension and other post-retirement benefit liabilities were impacted by decreased discount rates. |
|
| Equity |
i Equity was mainly impacted by net income (discussed in more detail above) and dividends declared. |
As at June 30, 2016, $112 million (December 31, 2015 – $61 million) of our cash and cash equivalents was held in certain foreign subsidiaries. There are no current plans to repatriate the funds at June 30, 2016 in a manner that would result in tax consequences.
Liquidity and Capital Resources
Cash Requirements
Contractual Obligations and Other Commitments
Our contractual obligations and other commitments detailed on page 82 of our 2015 AIR summarize certain of our liquidity and capital resource requirements, excluding obligations that have original maturities of less than one year, planned (but not legally committed) capital expenditures or potential share repurchases. The signing of ammonia vessel agreements in the first quarter of 2016 increased our operating leases in the contractual obligations and other commitments table referenced above as follows to June 30: 2017 – $30 million, 2018 – $26 million, 2019 – $26 million, 2020 – $26 million, 2021 – $26 million and thereafter – $132 million.
| | |
| PotashCorp 2016 Second Quarter Quarterly Report on Form 10-Q | | 32 |
Capital Expenditures
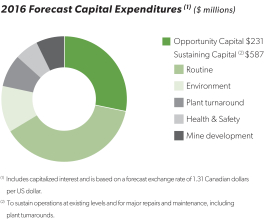
Page 57 of our 2015 AIR outlines key potash construction projects and their expected total cost, as well as the impact of these projects on capacity expansion/debottlenecking and any expected remaining spending on each project still in progress. There have been no significant changes to these projects since our March 31, 2016 Form 10-Q.
We anticipate that all capital spending will be financed by internally generated cash flows supplemented, if and as necessary, by borrowing from existing or other available financing sources.
Sources and Uses of Cash
The company’s cash flows from operating, investing and financing activities are summarized in the following table:
| | | | | | | | | | | | | | | | | | | | | | | | | | | | | | | | | | | | |
| | | | | Three Months Ended June 30 | | | | | Six Months Ended June 30 | |
| Dollars (millions), except percentage amounts | | | | 2016 | | | 2015 | | | Change | | | % Change | | | | | 2016 | | | 2015 | | | Change | | | % Change | |
Cash provided by operating activities | | | | $ | 424 | | | $ | 836 | | | $ | (412 | ) | | | (49 | ) | | | | $ | 612 | | | $ | 1,357 | | | $ | (745 | ) | | | (55 | ) |
Cash used in investing activities | | | | | (220 | ) | | | (304 | ) | | | 84 | | | | (28 | ) | | | | | (466 | ) | | | (537 | ) | | | 71 | | | | (13 | ) |
Cash used in financing activities | | | | | (135 | ) | | | (300 | ) | | | 165 | | | | (55 | ) | | | | | (94 | ) | | | (586 | ) | | | 492 | | | | (84 | ) |
Increase in cash and cash equivalents | | | | $ | 69 | | | $ | 232 | | | $ | (163 | ) | | | (70 | ) | | | | $ | 52 | | | $ | 234 | | | $ | (182 | ) | | | (78 | ) |
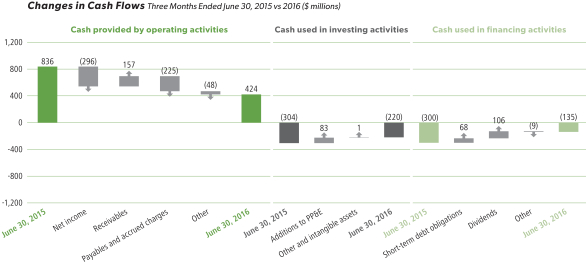
| | |
| 33 | | PotashCorp 2016 Second Quarter Quarterly Report on Form 10-Q |
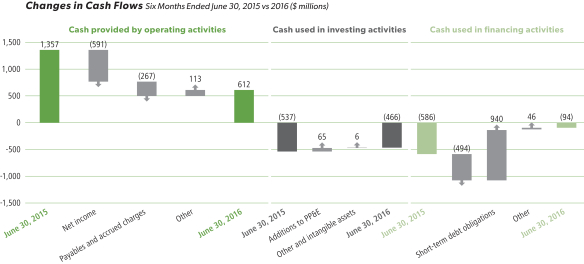
The most significant contributors to the changes in cash flows were as follows:
| | | | | | | | |
| | | | | Quarter over Quarter | | | | Year over Year |
| Cash Provided by Operating Activities | | | | Cash provided by operating activities was impacted by: • Lower net income in 2016; • Higher cash inflows from receivables in 2016 compared to 2015; and • Cash outflows from payables in 2016 compared to cash inflows in 2015. | | | | Cash provided by operating activities was impacted by: • Lower net income in 2016; • Cash outflows from payables in 2016 compared to cash inflows in 2015. |
| Cash Used in Investing Activities | | | | Cash used in investing activities was primarily for additions to property, plant and equipment. |
| Cash Used in Financing Activities | | | | Cash used in financing activities in 2016 was largely the result of dividends paid, more than offsetting proceeds from the issuance of commercial paper. Cash used in financing activities in 2015 was primarily due to dividends paid. | | | | Cash used in financing activities in 2016 was largely the result of dividends paid, more than offsetting proceeds from the issuance of commercial paper. Cash used in financing activities in 2015 was primarily due to dividends paid and repayment of commercial paper exceeding proceeds from senior notes. |
| | |
| PotashCorp 2016 Second Quarter Quarterly Report on Form 10-Q | | 34 |
We believe that internally generated cash flow, supplemented if and as necessary by available borrowings under our existing financing sources, will be sufficient to meet our anticipated capital expenditures and other cash requirements for at least the next 12 months, exclusive of any possible acquisitions. At this time, we do not reasonably expect any presently known trend or uncertainty to materially affect our ability to access our historical sources of liquidity.
| | |
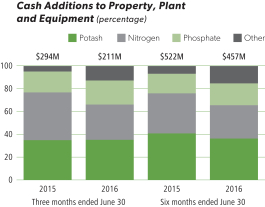
| | 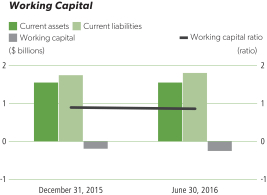 |
Capital Structure and Management
Principal Debt Instruments
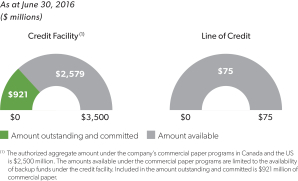
We use a combination of cash generated from operations and short-term and long-term debt to finance our operations. We typically pay floating rates of interest on our short-term debt and credit facility, and fixed rates on our senior notes.
During the first quarter of 2016, the company extended its entire $3,500 million credit facility to May 31, 2020 and in June 2016, $3,250 million was extended to May 31, 2021. There were no other significant changes to the nature of our outstanding commercial paper, credit facility, short-term line of credit and uncommitted letter of credit facility described on page 85 in our 2015 AIR. As at June 30, 2016, interest rates on outstanding commercial paper ranged from 0.8 percent to 1.0 percent. (December 31, 2015 – 0.5 percent to 0.8 percent).
The line of credit and credit facility have financial tests and covenants, including consequences of non-compliance, with which we must comply at each quarter-end. The covenants referenced on page 85 of our 2015 AIR remained consistent during the second quarter of 2016, with the exception of certain covenants for our credit facility. For our credit facility, the debt-to-
capital ratio covenant was increased from 0.60 to 0.65 and the long-term debt-to-EBITDA covenant was removed. We were in compliance with all covenants as at June 30, 2016 and at this time anticipate being in compliance with such covenants through 2016.
The accompanying table summarizes the limits and results of certain covenants:
| | | | | | | | | | | | | | |
| Debt covenants at June 30 | | | | | | | | | | | |
| Dollars (millions), except ratio amounts | | Limit | | | | | | 2016 | |
Debt-to-capital ratio (for credit facility) (1) | | | | | £ 0.65 | | | | | | | | 0.37 | |
Debt-to-capital ratio (for line of credit) (1) | | | | | £ 0.60 | | | | | | | | 0.37 | |
Long-term debt-to-EBITDA ratio (for line of credit) (2) | | | | | £ 3.5 | | | | | | | | 1.9 | |
Debt of subsidiaries | | | | | <$ 1,000 | | | | | | | $ | 4 | |
The following non-IFRS financial measures are requirements of our debt covenants and should not be considered as substitutes for, nor superior to, measures of financial performance prepared in accordance with IFRS:
| (1) | Debt-to-capital ratio = debt (short-term debt and current portion of long-term debt + long-term debt) / (debt + shareholders’ equity). |
| (2) | Long-term debt-to-EBITDA ratio = long-term debt / EBITDA. EBITDA is calculated according to the definition in Note 17 to the 2015 audited annual consolidated financial statements for the trailing 12 months. As compared to net income according to IFRS, EBITDA is limited in that periodic costs of certain capitalized tangible and intangible assets used in generating revenues are excluded. Long-term debt to net income for the trailing 12 months was 5.5. |
| | |
| 35 | | PotashCorp 2016 Second Quarter Quarterly Report on Form 10-Q |
Our ability to access reasonably priced debt in the capital markets is dependent, in part, on the quality of our credit ratings. We currently maintain investment-grade credit ratings for our long-term debt. A downgrade of the credit rating of our long-term debt would increase the interest rates applicable to borrowings under our credit facility and our line of credit.
Commercial paper markets are normally a source of same-day cash for the company. Our access to the US commercial paper market primarily depends on maintaining our current short-term credit ratings as well as general conditions in the money markets.
| | | | | | | | | | | | | | | | |
| | | | | Long-Term Debt | | | | Short-Term Debt |
| | | | | Rating (Outlook) | | | | Rating |
| | | | | June 30, 2016 | | | | December 31,
2015 | | | | June 30,
2016 | | | | December 31,
2015 |
Moody’s | | | | A3 (negative) | | | | A3 (negative) | | | | P-2 | | | | P-2 |
Standard & Poor’s | | | | BBB+ (stable) | | | | A- (stable) | | | | A-2 (1) | | | | A-2 (1) |
| (1) | S&P assigned a global commercial paper rating of A-2, but rated our commercial paper A-1 (low) on a Canadian scale. |
A security rating is not a recommendation to buy, sell or hold securities. Such rating may be subject to revision or withdrawal at any time by the respective credit rating agency and each rating should be evaluated independently of any other rating.
Our $3,750 million of senior notes were issued under US shelf registration statements.
For the first six months of 2016, our weighted average cost of capital was 7.4 percent (2015 – 6.9 percent), of which 75 percent represented the cost of equity (2015 – 86 percent).
Outstanding Share Data
| | | | | | | | | | | | | | |
| | | | | June 30,
2016 | | | | | | December 31,
2015 | |
Common shares issued and outstanding | | | | �� | 839,432,689 | | | | | | | | 836,540,151 | |
Options to purchase common shares outstanding | | | | | 19,777,413 | | | | | | | | 19,153,275 | |
Share-settled performance share units | | | | | 602,740 | | | | | | | | — | |
Number of share-settled compensation plans | | | | | 10 | | | | | | | | 10 | |
Off-Balance Sheet Arrangements
Off-balance sheet arrangements are described on page 86 of our 2015 AIR. We do not reasonably expect any presently known trend or uncertainty to affect our ability to continue using these arrangements. Refer to Note 13 to the financial statements in this Form 10-Q for a contingency related to Canpotex. Refer to page 86 of our 2015 AIR for information pertaining to our guarantees and derivative instruments. See “Cash Requirements” above and our 2015 AIR for obligations related to operating leases and certain of our long-term raw materials agreements which contain fixed price and/or volume components.
Quarterly Financial Highlights
| | | | | | | | | | | | | | | | | | | | | | | | | | | | | | | | | | | | |
Dollars (millions), except per-share amounts | | | | June 30,
2016 | | | | | March 31,
2016 | | | December 31,
2015 | | | September 30,
2015 | | | June 30,
2015 | | | March 31,
2015 | | | December 31,
2014 | | | September 30,
2014 | |
Financial Performance | | | | | | | | | | | | | | | | | | | | | | | | | | | | | | | | | | | | |
Sales | | | | $ | 1,053 | | | | | $ | 1,209 | | | $ | 1,354 | | | $ | 1,529 | | | $ | 1,731 | | | $ | 1,665 | | | $ | 1,902 | | | $ | 1,641 | |
Gross margin | | | | | 243 | | | | | | 234 | | | | 386 | | | | 505 | | | | 711 | | | | 667 | | | | 746 | | | | 589 | |
Net income | | | | | 121 | | | | | | 75 | | | | 201 | | | | 282 | | | | 417 | | | | 370 | | | | 407 | | | | 317 | |
Net income per share – basic (1) | | | | | 0.14 | | | | | | 0.09 | | | | 0.24 | | | | 0.34 | | | | 0.50 | | | | 0.45 | | | | 0.49 | | | | 0.38 | |
Net income per share – diluted (1) | | | | | 0.14 | | | | | | 0.09 | | | | 0.24 | | | | 0.34 | | | | 0.50 | | | | 0.44 | | | | 0.49 | | | | 0.38 | |
Non-Financial Performance | | | | | | | | | | | | | | | | | | | | | | | | | | | | | | | | | | | | |
Total shareholder return percentage | | | | | (3 | ) | | | | | 2 | | | | (15 | ) | | | (33 | ) | | | (3 | ) | | | (8 | ) | | | 3 | | | | (8 | ) |
Employee turnover percentage (annualized) | | | | | 4 | | | | | | 3 | | | | 3 | | | | 4 | | | | 4 | | | | 4 | | | | 3 | | | | 8 | |
Total site recordable injury rate | | | | | 0.69 | | | | | | 1.15 | | | | 0.97 | | | | 1.29 | | | | 0.85 | | | | 0.92 | | | | 0.66 | | | | 1.32 | |
Environmental incidents | | | | | 3 | | | | | | 9 | | | | 8 | | | | 6 | | | | 5 | | | | 5 | | | | 5 | | | | 8 | |
| (1) | Net income per share for each quarter has been computed based on the weighted average number of shares issued and outstanding during the respective quarter, including the dilutive number of shares assumed for the diluted earnings per share computation; therefore, as the number of shares varies each period, quarterly amounts may not add to the annual total. |
| | Refer to Note 12 to the financial statements in this Form 10-Q for information pertaining to sales that can be seasonal. |
| | |
| PotashCorp 2016 Second Quarter Quarterly Report on Form 10-Q | | 36 |
| | |
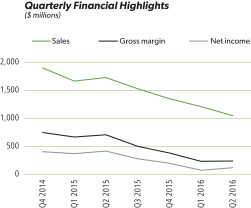
| | 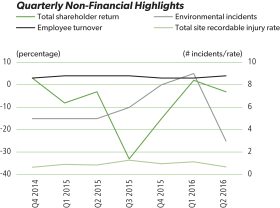 |
Other Financial Information
Related Party Transactions
Refer to Note 14 to the financial statements in this Form 10-Q for information pertaining to transactions with related parties.
Critical Accounting Estimates
There have been no material changes to our critical accounting estimate policies in the first six months of 2016.
We have discussed the development, selection and application of our key accounting policies, and the critical accounting estimates and assumptions they involve, with the audit committee of the Board, and the committee reviewed the disclosures described in this Form 10-Q.
Recent Accounting Changes
Refer to Note 1 to the financial statements in this Form 10-Q for information on issued accounting pronouncements that will be effective in future periods and were effective in 2016.
Outlook
Potash Market Outlook
Following a prolonged period of market uncertainty and weakening fundamentals, we believe potash markets have reached their low point. Recently settled contracts in China and India and a reduction in inventory throughout the supply chain over the last six months are expected to support a more constructive environment. Much like recoveries seen after previous periods of delayed contracts, we anticipate stronger buyer engagement to support demand through the second half of 2016 with full-year estimates of 58-61 million tonnes.
In North America, we anticipate improved affordability will help support deliveries for the rest of 2016. We expect shipments for the full year in the range of 9.2-9.7 million tonnes, up from the prior quarter’s estimate and above 2015’s total.
In Latin America, favorable crop economics and agronomic need are expected to push 2016 shipments to 10.8-11.3 million tonnes — slightly above 2015 totals and in line with our previous guidance range.
In China, we expect recently settled contracts and strong underlying consumption to support 2016 shipments in the range of 13.5-14.5 million tonnes, consistent with our previous estimates, but below 2015’s record levels. While contract negotiations are ongoing, Canpotex expects to deliver tonnage to its Chinese customers in the second half of 2016.
In India, we anticipate that an improved monsoon and lower farm retail prices will support improved potash consumption for the rest of the year, but due to weaker first-half deliveries, we have lowered our 2016 shipment estimate to a range of 3.7-4.2 million tonnes. Canpotex has reached agreements with its customers in India for shipments over the next three months with deliveries expected to begin in the weeks ahead.
In Other Asian markets, adverse weather conditions and cautious buying patterns during the first half are expected to result in demand of 8.3-8.7 million tonnes for the full year, below our previous expectations and 2015’s total as well.
| | |
| 37 | | PotashCorp 2016 Second Quarter Quarterly Report on Form 10-Q |
Financial Outlook
While markets have stabilized in recent weeks and we continue to forecast our 2016 potash sales volumes in the range of8.3-8.8 million tonnes, lower prices earlier in the year are expected to weigh on our results for the remainder of 2016. We now expect potash gross margin to be in the range of$400-$600 million.
Similarly, we anticipate a weaker price environment to negatively impact our nitrogen and phosphate segments through the rest of 2016. We have lowered our combined nitrogen and phosphate gross margin guidance for the year to a range of$400-$550 million.
Lower earnings have reduced our expected provincial mining and other taxes for 2016, now forecast in the range of 23-26 percent of potash gross margin (excluding $32 million of New Brunswick severance costs). Additionally, our effective income tax rate is expected to fall to a range of 16-18 percent given reduced earnings and a greater proportion of income from lower-tax jurisdictions.
Anticipated selling and administrative expenses for the year have been lowered to a range of $220-$230 million. Due to the recent strength of the Canadian dollar, we have revised our full-year foreign exchange rate assumption to CDN$1.32 per US dollar.
As a result of the noted changes, we have lowered our full-year 2016 earnings guidance to $0.40-$0.55 per share, including notable charges through the first-half of $0.11 per share. For the third quarter, we forecast a range of $0.05-$0.10 per share. We also intend to reduce our quarterly dividend from $0.25 per share to $0.10 per share commencing with the declaration of our next dividend in September.
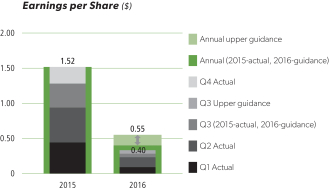
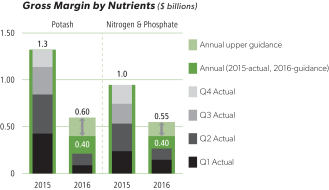
| | |
| PotashCorp 2016 Second Quarter Quarterly Report on Form 10-Q | | 38 |
Forward-Looking Statements
Certain statements in this Quarterly Report on Form 10-Q, including, but not limited to, those in the “Outlook” section of “Management’s Discussion and Analysis of Financial Condition and Results of Operations”, contain “forward-looking statements” (within the meaning of the US Private Securities Litigation Reform Act of 1995 and other US federal securities laws) or “forward-looking information” (within the meaning of applicable Canadian securities legislation) that relates to future events or our future financial performance. These statements can be identified by expressions of belief, expectation or intention, as well as those statements that are not historical fact. These statements often contain words such as “should,” “could,” “expect,” “may,” “anticipate,” “forecast,” “believe,” “intend,” “estimates,” “plans” and similar expressions. These statements are based on certain factors and assumptions as set forth in this Quarterly Report on Form 10-Q, including with respect to: foreign exchange rates, expected growth, results of operations, performance, business prospects and opportunities and effective tax rates. While the company considers these factors and assumptions to be reasonable based on information currently available, they may prove to be incorrect. Forward-looking statements are subject to risks and uncertainties that are difficult to predict. The results or events set forth in forward-looking statements may differ materially from actual results or events. Several factors could cause actual results or events to differ materially from those expressed in forward-looking statements including, but not limited to, unexpected developments with respect to any of the following: variations from our assumptions with respect to foreign exchange rates, expected growth, results of operations, performance, business prospects and opportunities, and effective tax rates; fluctuations in supply and demand in the fertilizer, sulfur and petrochemical markets; changes in competitive pressures, including pricing pressures; risks and uncertainties related to any operating and workforce changes made in response to our industry and the markets we serve, including mine and inventory shutdowns; adverse or uncertain economic conditions and changes in credit and financial markets; economic and political uncertainty around the world; changes in capital markets; the results of sales contract negotiations; unexpected or adverse
weather conditions; changes in currency and exchange rates; risks related to reputational loss; the occurrence of a major safety incident; inadequate insurance coverage for a significant liability; inability to obtain relevant permits for our operations; catastrophic events or malicious acts, including terrorism; certain complications that may arise in our mining process, including water inflows; risks and uncertainties related to our international operations and assets; our ownership of non-controlling equity interests in other companies; our prospects to reinvest capital in strategic opportunities and acquisitions; risks associated with natural gas and other hedging activities; security risks related to our information technology systems; imprecision in reserve estimates; costs and availability of transportation and distribution for our raw materials and products, including railcars and ocean freight; changes in, and the effects of, government policies and regulations; earnings and the decisions of taxing authorities which could affect our effective tax rates; increases in the price or reduced availability of the raw materials that we use; our ability to attract, develop, engage and retain skilled employees; strikes or other forms of work stoppage or slowdowns; rates of return on, and the risks associated with, our investments and capital expenditures; timing and impact of capital expenditures; the impact of further innovation; adverse developments in new and pending legal proceedings or government investigations; and violations of our governance and compliance policies. Additional risks and uncertainties can be found in our Form 10-K for the fiscal year ended December 31, 2015 under the captions “Forward-Looking Statements” and “Item 1A — Risk Factors” and in our filings with the US Securities and Exchange Commission and the Canadian provincial securities commissions. As a result of these and other factors, there is no assurance that any of the events, circumstances or results anticipated by forward-looking statements included or incorporated by reference into this Quarterly Report on Form 10-Q will occur or, if they do, of what impact they will have on our business, our performance, the results of our operations and our financial condition. Forward-looking statements are given only as at the date of this report and the company disclaims any obligation to update or revise any forward-looking statements, whether as a result of new information, future events or otherwise, except as required by law.
| | |
| 39 | | PotashCorp 2016 Second Quarter Quarterly Report on Form 10-Q |
Item 3. Quantitative and Qualitative Disclosures About Market Risk
Market risk is the potential for loss from adverse changes in the market value of financial instruments. The level of market risk to which we are exposed varies depending on the composition of our derivative instrument portfolio, as well as current and expected market conditions. A discussion of enterprise-wide risk management can be found in our 2015 AIR, pages 27 to 33.
Price, foreign exchange and interest rate risks faced by the company and how we manage those risks are outlined in Notes 19 and 25 to the 2015 audited annual consolidated financial statements and there were no significant changes as at June 30, 2016.
Price Risk
The carrying amount of our investments in ICL and Sinofert was $868 million at June 30, 2016 (December 31, 2015 – $982 million). A 10 percent increase in the prices of these investments would increase other comprehensive income by $87 million, while a 10 percent decrease would reduce other comprehensive income by $68 million and an impairment of $19 million for our investment in Sinofert would be recognized in net income. At June 30, 2016, this analysis assumed that price decreases related to the company’s investment in ICL would not represent an impairment, price decreases related to the company’s investment in Sinofert below the carrying amount at the impairment date of June 30, 2016 ($190 million) would represent an impairment and all other variables remain constant.
There were no substantial changes to the price sensitivities related to our natural gas derivatives reported in Note 25 to the 2015 audited annual consolidated financial statements.
As at June 30, 2016, the company’s net exposure to natural gas derivatives in the form of swaps was a notional amount of 54 million MMBtu (December 31, 2015 — swaps was a notional amount of 65 million MMBtu) with maturities in 2016 through 2022.
Foreign Exchange Risk
As at June 30, 2016, the company had entered into foreign currency forward contracts to sell US dollars and receive Canadian dollars in the notional amount of $64 million (December 31, 2015 — $134 million) at an average exchange rate of 1.2881 (December 31, 2015 — 1.3553) per US dollar with maturities in 2016. There were no substantial changes to the foreign exchange sensitivities reported in Note 25 to the 2015 audited annual consolidated financial statements.
Interest Rate Risk
As at June 30, 2016, the company had no significant exposure to interest rate risk.
Item 4. Controls and Procedures
As of June 30, 2016, we carried out an evaluation under the supervision and with the participation of our management, including our Chief Executive Officer and Chief Financial Officer, of the effectiveness of the design and operation of our disclosure controls and procedures. There are inherent limitations to the effectiveness of any system of disclosure controls and procedures, including the possibility of human error and the circumvention or overriding of the controls and procedures. Accordingly, even effective disclosure controls and procedures can only provide reasonable assurance of achieving their control objectives. Based upon that evaluation and as of June 30, 2016, the Chief Executive Officer and Chief Financial Officer concluded that the disclosure controls and procedures were effective to provide reasonable assurance that information required to be disclosed in the reports the company files and submits under the Securities Exchange Act of 1934 is recorded, processed, summarized and reported as and when required and that such information is accumulated and communicated to our management, including our Chief Executive Officer and Chief Financial Officer, as appropriate to allow timely decisions regarding required disclosure.
There has been no change in our internal control over financial reporting during the quarter ended June 30, 2016 that has materially affected, or is reasonably likely to materially affect, our internal control over financial reporting.
| | |
| PotashCorp 2016 Second Quarter Quarterly Report on Form 10-Q | | 40 |
Part II. Other Information
Item 1. Legal Proceedings
For a description of certain other legal and environmental proceedings, see Note 10 to the unaudited interim condensed consolidated financial statements included in Part I of this Quarterly Report on Form 10-Q.
Item 4. Other Information
Mine Safety Disclosures
Safety is the company’s top priority, and we are committed to providing a healthy and safe work environment for our employees, contractors and all others at our sites to help meet ourcompany-wide goal of achieving no harm to people.
The operations at the company’s Aurora, Weeping Water and White Springs facilities are subject to theFederal Mine Safety and Health Act of 1977, as amended by theMine Improvement and New Emergency Response Act of 2006, and the implementing regulations, which impose stringent health and safety standards on numerous aspects of mineral extraction and processing operations, including the training of personnel, operating procedures, operating equipment and other matters. Our Senior
Safety Leadership Team is responsible for managing compliance with applicable government regulations, as well as implementing and overseeing the elements of our safety program as outlined in our Safety, Health and Environment Manual.
Section 1503(a) of theDodd-Frank Wall Street Reform and Consumer Protection Act(Section 1503(a)) requires us to include certain safety information in the periodic reports we file with the United States Securities and Exchange Commission. The information concerning mine safety violations and other regulatory matters required by Section 1503(a) and Item 104 ofRegulation S-K is included in Exhibit 95 to this Quarterly Report on Form 10-Q.
Item 6. Exhibits
(a) Exhibits
| | | | | | | | | | |
| | | | | Incorporated By Reference (File No. 001-10351, unless otherwise indicated) |
Exhibit
Number | | Description of Document | | Form | | Filing Date/Period
End Date | | | Exhibit Number
(if different) |
| 3(a) | | Articles of Continuance of the registrant dated May 15, 2002. | | 10-Q | | | 6/30/2002 | | | |
| 3(b) | | General By-Law of the registrant, as amended through April 27, 2015. | | 8-K | | | 4/27/2015 | | | 3(a) |
| 4(a) | | Indenture dated as of February 27, 2003, between the registrant and U.S. Bank National Association, as successor to The Bank of Nova Scotia Trust Company of New York. | | 10-K | | | 12/31/2002 | | | 4(c) |
| 4(b) | | Form of Note relating to the registrant’s $500,000,000 principal amount of 5.875% Notes due December 1, 2036. | | 8-K | | | 11/30/2006 | | | 4(a) |
| 4(c) | | Form of Note relating to the registrant’s $500,000,000 principal amount of 6.50% Notes due May 15, 2019. | | 8-K | | | 5/1/2009 | | | 4(b) |
| 4(d) | | Form of Note relating to the registrant’s $500,000,000 principal amount of 4.875% Notes due March 30, 2020. | | 8-K | | | 9/25/2009 | | | 4(b) |
| 4(e) | | Form of Note relating to the registrant’s $750,000,000 principal amount of 3.625% Notes due March 15, 2024. | | 8-K | | | 3/7/2014 | | | 4(a) |
| 4(f) | | Form of Note relating to the registrant’s $500,000,000 principal amount of 3.000% Notes due April 1, 2025. | | 8-K | | | 3/26/2015 | | | 4(a) |
| 4(g) | | Revolving Term Credit Facility Agreement between The Bank of Nova Scotia and other financial institutions and the registrant dated December 11, 2009. | | 8-K | | | 12/15/2009 | | | 4(a) |
| 4(h) | | Revolving Term Credit Facility First Amending Agreement between The Bank of Nova Scotia and other financial institutions and the registrant dated September 23, 2011. | | 8-K | | | 9/26/2011 | | | 4(a) |
| 4(i) | | Revolving Term Credit Facility Second Amending Agreement between The Bank of Nova Scotia and other financial institutions and the registrant dated as of May 24, 2013. | | 8-K | | | 5/28/2013 | | | 4(a) |
| 4(j) | | Form of Note relating to the registrant’s $500,000,000 principal amount of 3.25% Notes due December 1, 2017. | | 8-K | | | 11/29/2010 | | | 4(a) |
| | |
| 41 | | PotashCorp 2016 Second Quarter Quarterly Report on Form 10-Q |
| | | | | | | | | | |
| | | | | Incorporated By Reference (File No. 001-10351, unless otherwise indicated) |
Exhibit
Number | | Description of Document | | Form | | Filing Date/Period
End Date | | | Exhibit Number
(if different) |
| 4(k) | | Form of Note relating to the registrant’s $500,000,000 principal amount of 5.625% Notes due December 1, 2040. | | 8-K | �� | | 11/29/2010 | | | 4(b) |
| 4(l) | | Agreement of Resignation, Appointment and Acceptance, dated as of June 25, 2013, by and among the registrant, The Bank of Nova Scotia Trust Company of New York and U.S. Bank National Association. | | 8-K | | | 6/27/2013 | | | 4(a) |
| 4(m) | | Revolving Term Credit Facility Third Amending Agreement between The Bank of Nova Scotia and other financial institutions and the registrant dated July 8, 2014. | | 10-Q | | | 7/29/2014 | | | |
| 4(n) | | Revolving Term Credit Facility Fourth Amending Agreement between The Bank of Nova Scotia and other financial institutions and the registrant dated January 25, 2016. | | 8-K | | | 1/29/2016 | | | 4(a) |
| 4(o) | | Extension Agreement between The Bank of Nova Scotia and other financial institutions and the registrant dated June 27, 2016. | | | | | | | | |
The registrant hereby undertakes to file with the Securities and Exchange Commission, upon request, copies of any constituent instruments defining the rights of holders of long-term debt of the registrant or its subsidiaries that have not been filed herewith because the amounts represented thereby are less than 10% of the total assets of the registrant and its subsidiaries on a consolidated basis.
| | | | | | | | | | |
| | | | | Incorporated By Reference (File No. 001-10351, unless otherwise indicated) |
Exhibit
Number | | Description of Document | | Form | | Filing Date/Period
End Date | | | Exhibit Number
(if different) |
| 10(a) | | Consolidated, Restated and Amended Canpotex Shareholders’ Agreement, Eighth Memorandum of Agreement dated January 1, 2014 between Agrium Inc., Mosaic Canada Crop Nutrition, LP, by its general partner, 4379934 Canada Ltd., the registrant and Canpotex Limited. | | 10-K | | | 12/31/2013 | | | |
| 10(b) | | Consolidated, Restated and Amended Producer Agreement, Eighth Memorandum of Agreement dated January 1, 2014 between Canpotex Limited, Agrium Inc., Mosaic Canada Crop Nutrition, LP, by its general partner, 4379934 Canada Ltd. and the registrant. | | 10-K | | | 12/31/2013 | | | |
| 10(c) | | Short-Term Incentive Plan of the registrant effective January 1, 2000, as amended. | | 8-K | | | 3/13/2012 | | | 10(a) |
| 10(d) | | Resolution and Forms of Agreement for Supplemental Executive Retirement Income Plan, for officers and key employees of the registrant. | | 10-K | | | 12/31/1995 | | | 10(o) |
| 10(e) | | Amending Resolution and revised forms of agreement regarding Supplemental Retirement Income Plan of the registrant. | | 10-Q | | | 6/30/1996 | | | 10(x) |
| 10(f) | | Amended and restated Supplemental Executive Retirement Income Plan of the registrant and text of amendment to existing supplemental income plan agreements. | | 10-Q | | | 9/30/2000 | | | 10(mm) |
| 10(g) | | Amendment, dated February 23, 2009, to the amended and restated Supplemental Executive Retirement Income Plan. | | 10-K | | | 12/31/2008 | | | 10(r) |
| 10(h) | | Amendment, dated December 29, 2010, to the amended and restated Supplemental Executive Retirement Income Plan. | | 10-K | | | 12/31/2010 | | | 10(r) |
| 10(i) | | Amended and restated Supplemental Executive Retirement Income Plan of the registrant, dated February 22, 2016. | | 10-K | | | 12/31/2015 | | | |
| 10(j) | | Form of Letter of amendment to existing supplemental income plan agreements of the registrant. | | 10-K | | | 12/31/2002 | | | 10(cc) |
| 10(k) | | Amendment, dated February 23, 2009, to the amended and restated agreement, dated August 2, 1996, between the registrant and Wayne R. Brownlee concerning the Supplemental Executive Retirement Income Plan. | | 10-K | | | 12/31/2008 | | | 10(w) |
| 10(l) | | Amendment, dated December 29, 2010, to the amended and restated agreement, dated August 2, 1996, between the registrant and Wayne R. Brownlee concerning the Supplemental Executive Retirement Income Plan. | | 10-K | | | 12/31/2010 | | | 10(z) |
| | |
| PotashCorp 2016 Second Quarter Quarterly Report on Form 10-Q | | 42 |
| | | | | | | | | | |
| | | | | Incorporated By Reference (File No. 001-10351, unless otherwise indicated) |
Exhibit
Number | | Description of Document | | Form | | Filing Date/Period
End Date | | | Exhibit Number
(if different) |
| 10(m) | | Supplemental Retirement Agreement dated December 24, 2008, between the registrant and Stephen F. Dowdle. | | 10-K | | | 12/31/2011 | | | 10(bb) |
| 10(n) | | PCS Supplemental Retirement Plan for U.S Executives (As Amended and Restated and in Effect as of January 1, 2016) | | 10-K | | | 12/31/2015 | | | |
| 10(o) | | Forms of Agreement dated December 30, 1994, between the registrant and certain officers of the registrant. | | 10-K | | | 12/31/1995 | | | 10(p) |
| 10(p) | | Form of Agreement of Indemnification dated August 8, 1995, between the registrant and certain officers and directors of the registrant. | | 10-K | | | 12/31/1995 | | | 10(q) |
| 10(q) | | Resolution and Form of Agreement of Indemnification dated January 24, 2001. | | 10-K | | | 12/31/2000 | | | 10(ii) |
| 10(r) | | Resolution and Form of Agreement of Indemnification dated July 21, 2004. | | 10-Q | | | 6/30/2004 | | | 10(ii) |
| 10(s) | | Potash Corporation of Saskatchewan Inc. Deferred Share Unit Plan for Non-Employee Directors. | | 10-Q | | | 3/31/2012 | | | 10(ll) |
| 10(t) | | Potash Corporation of Saskatchewan Inc. 2006 Performance Option Plan and Form of Option Agreement, as amended. | | 10-Q | | | 3/31/2006 | | | 10(dd) |
| 10(u) | | Potash Corporation of Saskatchewan Inc. 2007 Performance Option Plan and Form of Option Agreement. | | 10-Q | | | 3/31/2007 | | | 10(ee) |
| 10(v) | | Potash Corporation of Saskatchewan Inc. 2008 Performance Option Plan and Form of Option Agreement. | | 10-Q | | | 3/31/2008 | | | 10(ff) |
| 10(w) | | Potash Corporation of Saskatchewan Inc. 2009 Performance Option Plan and Form of Option Agreement. | | 10-Q | | | 3/31/2009 | | | 10(mm) |
| 10(x) | | Potash Corporation of Saskatchewan Inc. 2010 Performance Option Plan and Form of Option Agreement. | | 8-K | | | 5/7/2010 | | | 10.1 |
| 10(y) | | Potash Corporation of Saskatchewan Inc. 2011 Performance Option Plan and Form of Option Agreement. | | 8-K | | | 5/13/2011 | | | 10(a) |
| 10(z) | | Potash Corporation of Saskatchewan Inc. 2012 Performance Option Plan and Form of Option Agreement. | | 8-K | | | 5/18/2012 | | | 10(a) |
| 10(aa) | | Potash Corporation of Saskatchewan Inc. 2013 Performance Option Plan and Form of Option Agreement. | | 8-K | | | 5/17/2013 | | | 10(a) |
| 10(bb) | | Potash Corporation of Saskatchewan Inc. 2014 Performance Option Plan and Form of Option Agreement. | | 8-K | | | 5/16/2014 | | | 10(a) |
| 10(cc) | | Potash Corporation of Saskatchewan Inc. 2015 Performance Option Plan and Form of Option Agreement. | | 8-K | | | 5/13/2015 | | | 10(a) |
| 10(dd) | | Executive Employment Agreement, dated July 1, 2014, between registrant and Jochen E. Tilk. | | 10-K | | | 9/30/2014 | | | 10(nn) |
| 10(ee) | | PCS Supplemental Executive Retirement Plan for Canadian Executives. | | 10-K | | | 12/31/2014 | | | 10(oo) |
| 10(ff) | | CEO Multi-Year Incentive Plan. | | 10-K | | | 12/31/2014 | | | 10(pp) |
| 10(gg) | | Letter Agreement, dated January 13, 2016 and revised February 2, 2016, between registrant and G. David Delaney. | | 10-K | | | 12/31/2015 | | | |
| 10(hh) | | Short-Term Incentive Plan, dated February 22, 2016. | | 10-K | | | 12/31/2015 | | | |
| 31(a) | | Certification Pursuant to Section 302 of the Sarbanes-Oxley Act of 2002. | | | | | | | | |
| 31(b) | | Certification Pursuant to Section 302 of the Sarbanes-Oxley Act of 2002. | | | | | | | | |
| 32 | | Certification Pursuant to Section 906 of the Sarbanes-Oxley Act of 2002. | | | | | | | | |
| 95 | | Information concerning mine safety violations or other regulatory matters required by Section 1503(a) of the Dodd-Frank Wall Street Reform and Consumer Protection Act. | | | | | | | | |
| | |
| 43 | | PotashCorp 2016 Second Quarter Quarterly Report on Form 10-Q |
Signatures
Pursuant to the requirements of the Securities Exchange Act of 1934, the registrant has duly caused this report to be signed on its behalf by the undersigned, thereunto duly authorized.
| | | | |
| | POTASH CORPORATION OF SASKATCHEWAN INC. |
| | |
| August 3, 2016 | | By: | | /s/ Joseph Podwika |
| | | | Joseph Podwika |
| | | | Senior Vice President, General Counsel and Secretary |
| | |
| August 3, 2016 | | By: | | /s/ Wayne R. Brownlee |
| | | | Wayne R. Brownlee |
| | | | Executive Vice President, Treasurer and Chief Financial Officer (Principal Financial and Accounting Officer) |
| | |
| PotashCorp 2016 Second Quarter Quarterly Report on Form 10-Q | | 44 |
EXHIBIT INDEX
| | | | | | | | | | |
| | | | | Incorporated By Reference (File No. 001-10351, unless otherwise indicated) |
Exhibit
Number | | Description of Document | | Form | | Filing Date/Period
End Date | | | Exhibit Number
(if different) |
| 3(a) | | Articles of Continuance of the registrant dated May 15, 2002. | | 10-Q | | | 6/30/2002 | | | |
| 3(b) | | General By-Law of the registrant, as amended through April 27, 2015. | | 8-K | | | 4/27/2015 | | | 3(a) |
| 4(a) | | Indenture dated as of February 27, 2003, between the registrant and U.S. Bank National Association, as successor to The Bank of Nova Scotia Trust Company of New York. | | 10-K | | | 12/31/2002 | | | 4(c) |
| 4(b) | | Form of Note relating to the registrant’s $500,000,000 principal amount of 5.875% Notes due December 1, 2036. | | 8-K | | | 11/30/2006 | | | 4(a) |
| 4(c) | | Form of Note relating to the registrant’s $500,000,000 principal amount of 6.50% Notes due May 15, 2019. | | 8-K | | | 5/1/2009 | | | 4(b) |
| 4(d) | | Form of Note relating to the registrant’s $500,000,000 principal amount of 4.875% Notes due March 30, 2020. | | 8-K | | | 9/25/2009 | | | 4(b) |
| 4(e) | | Form of Note relating to the registrant’s $750,000,000 principal amount of 3.625% Notes due March 15, 2024. | | 8-K | | | 3/7/2014 | | | 4(a) |
| 4(f) | | Form of Note relating to the registrant’s $500,000,000 principal amount of 3.000% Notes due April 1, 2025. | | 8-K | | | 3/26/2015 | | | 4(a) |
| 4(g) | | Revolving Term Credit Facility Agreement between The Bank of Nova Scotia and other financial institutions and the registrant dated December 11, 2009. | | 8-K | | | 12/15/2009 | | | 4(a) |
| 4(h) | | Revolving Term Credit Facility First Amending Agreement between The Bank of Nova Scotia and other financial institutions and the registrant dated September 23, 2011. | | 8-K | | | 9/26/2011 | | | 4(a) |
| 4(i) | | Revolving Term Credit Facility Second Amending Agreement between The Bank of Nova Scotia and other financial institutions and the registrant dated as of May 24, 2013. | | 8-K | | | 5/28/2013 | | | 4(a) |
| 4(j) | | Form of Note relating to the registrant’s $500,000,000 principal amount of 3.25% Notes due December 1, 2017. | | 8-K | | | 11/29/2010 | | | 4(a) |
| 4(k) | | Form of Note relating to the registrant’s $500,000,000 principal amount of 5.625% Notes due December 1, 2040. | | 8-K | | | 11/29/2010 | | | 4(b) |
| 4(l) | | Agreement of Resignation, Appointment and Acceptance, dated as of June 25, 2013, by and among the registrant, The Bank of Nova Scotia Trust Company of New York and U.S. Bank National Association. | | 8-K | | | 6/27/2013 | | | 4(a) |
| 4(m) | | Revolving Term Credit Facility Third Amending Agreement between The Bank of Nova Scotia and other financial institutions and the registrant dated July 8, 2014. | | 10-Q | | | 7/29/2014 | | | |
| 4(n) | | Revolving Term Credit Facility Fourth Amending Agreement between The Bank of Nova Scotia and other financial institutions and the registrant dated January 25, 2016. | | 8-K | | | 1/29/2016 | | | 4(a) |
| 4(o) | | Extension Agreement between The Bank of Nova Scotia and other financial institutions and the registrant dated June 27, 2016. | | | | | | | | |
The registrant hereby undertakes to file with the Securities and Exchange Commission, upon request, copies of any constituent instruments defining the rights of holders of long-term debt of the registrant or its subsidiaries that have not been filed herewith because the amounts represented thereby are less than 10% of the total assets of the registrant and its subsidiaries on a consolidated basis.
| | | | | | | | | | |
| | | | | Incorporated By Reference (File No. 001-10351, unless otherwise indicated) |
Exhibit
Number | | Description of Document | | Form | | Filing Date/Period
End Date | | | Exhibit Number
(if different) |
| 10(a) | | Consolidated, Restated and Amended Canpotex Shareholders’ Agreement, Eighth Memorandum of Agreement dated January 1, 2014 between Agrium Inc., Mosaic Canada Crop Nutrition, LP, by its general partner, 4379934 Canada Ltd., the registrant and Canpotex Limited. | | 10-K | | | 12/31/2013 | | | |
| 10(b) | | Consolidated, Restated and Amended Producer Agreement, Eighth Memorandum of Agreement dated January 1, 2014 between Canpotex Limited, Agrium Inc., Mosaic Canada Crop Nutrition, LP, by its general partner, 4379934 Canada Ltd. and the registrant. | | 10-K | | | 12/31/2013 | | | |
| 10(c) | | Short-Term Incentive Plan of the registrant effective January 1, 2000, as amended. | | 8-K | | | 3/13/2012 | | | 10(a) |
| 10(d) | | Resolution and Forms of Agreement for Supplemental Executive Retirement Income Plan, for officers and key employees of the registrant. | | 10-K | | | 12/31/1995 | | | 10(o) |
| 10(e) | | Amending Resolution and revised forms of agreement regarding Supplemental Retirement Income Plan of the registrant. | | 10-Q | | | 6/30/1996 | | | 10(x) |
| 10(f) | | Amended and restated Supplemental Executive Retirement Income Plan of the registrant and text of amendment to existing supplemental income plan agreements. | | 10-Q | | | 9/30/2000 | | | 10(mm) |
| 10(g) | | Amendment, dated February 23, 2009, to the amended and restated Supplemental Executive Retirement Income Plan. | | 10-K | | | 12/31/2008 | | | 10(r) |
| 10(h) | | Amendment, dated December 29, 2010, to the amended and restated Supplemental Executive Retirement Income Plan. | | 10-K | | | 12/31/2010 | | | 10(r) |
| 10(i) | | Amended and restated Supplemental Executive Retirement Income Plan of the registrant, dated February 22, 2016. | | 10-K | | | 12/31/2015 | | | |
| 10(j) | | Form of Letter of amendment to existing supplemental income plan agreements of the registrant. | | 10-K | | | 12/31/2002 | | | 10(cc) |
| 10(k) | | Amendment, dated February 23, 2009, to the amended and restated agreement, dated August 2, 1996, between the registrant and Wayne R. Brownlee concerning the Supplemental Executive Retirement Income Plan. | | 10-K | | | 12/31/2008 | | | 10(w) |
| 10(l) | | Amendment, dated December 29, 2010, to the amended and restated agreement, dated August 2, 1996, between the registrant and Wayne R. Brownlee concerning the Supplemental Executive Retirement Income Plan. | | 10-K | | | 12/31/2010 | | | 10(z) |
| 10(m) | | Supplemental Retirement Agreement dated December 24, 2008, between the registrant and Stephen F. Dowdle. | | 10-K | | | 12/31/2011 | | | 10(bb) |
| 10(n) | | PCS Supplemental Retirement Plan for U.S Executives (As Amended and Restated and in Effect as of January 1, 2016) | | 10-K | | | 12/31/2015 | | | |
| 10(o) | | Forms of Agreement dated December 30, 1994, between the registrant and certain officers of the registrant. | | 10-K | | | 12/31/1995 | | | 10(p) |
| 10(p) | | Form of Agreement of Indemnification dated August 8, 1995, between the registrant and certain officers and directors of the registrant. | | 10-K | | | 12/31/1995 | | | 10(q) |
| 10(q) | | Resolution and Form of Agreement of Indemnification dated January 24, 2001. | | 10-K | | | 12/31/2000 | | | 10(ii) |
| 10(r) | | Resolution and Form of Agreement of Indemnification dated July 21, 2004. | | 10-Q | | | 6/30/2004 | | | 10(ii) |
| 10(s) | | Potash Corporation of Saskatchewan Inc. Deferred Share Unit Plan for Non-Employee Directors. | | 10-Q | | | 3/31/2012 | | | 10(ll) |
| 10(t) | | Potash Corporation of Saskatchewan Inc. 2006 Performance Option Plan and Form of Option Agreement, as amended. | | 10-Q | | | 3/31/2006 | | | 10(dd) |
| 10(u) | | Potash Corporation of Saskatchewan Inc. 2007 Performance Option Plan and Form of Option Agreement. | | 10-Q | | | 3/31/2007 | | | 10(ee) |
| 10(v) | | Potash Corporation of Saskatchewan Inc. 2008 Performance Option Plan and Form of Option Agreement. | | 10-Q | | | 3/31/2008 | | | 10(ff) |
| 10(w) | | Potash Corporation of Saskatchewan Inc. 2009 Performance Option Plan and Form of Option Agreement. | | 10-Q | | | 3/31/2009 | | | 10(mm) |
| | | | | | | | | | |
| | | | | Incorporated By Reference (File No. 001-10351, unless otherwise indicated) |
Exhibit
Number | | Description of Document | | Form | | Filing Date/Period
End Date | | | Exhibit Number
(if different) |
| 10(x) | | Potash Corporation of Saskatchewan Inc. 2010 Performance Option Plan and Form of Option Agreement. | | 8-K | | | 5/7/2010 | | | 10.1 |
| 10(y) | | Potash Corporation of Saskatchewan Inc. 2011 Performance Option Plan and Form of Option Agreement. | | 8-K | | | 5/13/2011 | | | 10(a) |
| 10(z) | | Potash Corporation of Saskatchewan Inc. 2012 Performance Option Plan and Form of Option Agreement. | | 8-K | | | 5/18/2012 | | | 10(a) |
| 10(aa) | | Potash Corporation of Saskatchewan Inc. 2013 Performance Option Plan and Form of Option Agreement. | | 8-K | | | 5/17/2013 | | | 10(a) |
| 10(bb) | | Potash Corporation of Saskatchewan Inc. 2014 Performance Option Plan and Form of Option Agreement. | | 8-K | | | 5/16/2014 | | | 10(a) |
| 10(cc) | | Potash Corporation of Saskatchewan Inc. 2015 Performance Option Plan and Form of Option Agreement. | | 8-K | | | 5/13/2015 | | | 10(a) |
| 10(dd) | | Executive Employment Agreement, dated July 1, 2014, between registrant and Jochen E. Tilk. | | 10-K | | | 9/30/2014 | | | 10(nn) |
| 10(ee) | | PCS Supplemental Executive Retirement Plan for Canadian Executives. | | 10-K | | | 12/31/2014 | | | 10(oo) |
| 10(ff) | | CEO Multi-Year Incentive Plan. | | 10-K | | | 12/31/2014 | | | 10(pp) |
| 10(gg) | | Letter Agreement, dated January 13, 2016 and revised February 2, 2016, between registrant and G. David Delaney. | | 10-K | | | 12/31/2015 | | | |
| 10(hh) | | Short-Term Incentive Plan, dated February 22, 2016. | | 10-K | | | 12/31/2015 | | | |
| 31(a) | | Certification Pursuant to Section 302 of the Sarbanes-Oxley Act of 2002. | | | | | | | | |
| 31(b) | | Certification Pursuant to Section 302 of the Sarbanes-Oxley Act of 2002. | | | | | | | | |
| 32 | | Certification Pursuant to Section 906 of the Sarbanes-Oxley Act of 2002. | | | | | | | | |
| 95 | | Information concerning mine safety violations or other regulatory matters required by Section 1503(a) of the Dodd-Frank Wall Street Reform and Consumer Protection Act. | | | | | | | | |