 Presentation to the Board of Directors September 7, 2008 Exhibit (c)(4) |
 Prepared for Project GIANT |
 Project GIANT Presentation to the Board of Directors Process and Transaction Overview 1 GIANT Financial and Market Data 2 GIANT Valuation Analysis 3 Table of Contents 1 |
 Process and Transaction Overview |
 Project GIANT Baird’s Role and Process Overview GIANT (“Target” or the “Company”) has retained Baird to provide financial advisory services and to render an opinion with respect to the fairness, from a financial point of view, of the consideration to be received by the holders of the Company’s common stock (other than Parent, Purchaser and their affiliates) in the Offer and the Merger (together the “Transaction”) For purposes of our opinion, we have assumed consideration of $30.00 per share in cash (the “Consideration”), representing an enterprise value of $449.9 million and an equity value of $377.0 million based on 12,135,737 total shares outstanding upon change of control and net debt at closing of approximately $72.9 million Baird conducted due diligence with the Company’s senior management with respect to the Company’s: — History — Strategies and goals — Business, products, services and operations — Industry and market conditions — Historical, current and projected financial performance and financial condition 2 |
 Project GIANT Baird’s Role and Process Overview In conducting our investigation and analyses and in arriving at our opinion herein, we have reviewed such information and have taken into account such financial and economic factors, investment banking procedures and considerations as we have deemed relevant under the circumstances We have, among other things: Reviewed certain audited consolidated financial statements of the Company and internal information, primarily financial in nature, including financial forecasts (the “Forecasts”), concerning the business and operations of the Company furnished to us for purposes of our analysis Reviewed publicly available information including, but not limited to, the Company’s recent filings with the Securities and Exchange Commission and equity analyst research reports covering the Company prepared by various investment banking firms including our firm Reviewed the draft Agreement and Plan of Merger dated September 3, 2008 (the “Agreement”) in the form presented to the Board of Directors Reviewed current and historical market prices of GIANT’s Common Stock …Continued 3 |
 Project GIANT Baird’s Role and Process Overview Reviewed publicly available financial and stock market data with respect to certain other companies we believe to be generally relevant Compared the financial position and operational results of the Company with those of other publicly traded companies we deemed relevant and considered the market trading multiples of such companies Compared the transaction multiples implied by the Consideration with the corresponding acquisition transaction multiples in certain business combinations we deemed relevant Considered the present values of the forecasted cash flows of the Company Held discussions with members of the Company’s senior management concerning the Company’s historical and current financial condition and operating results, as well as the future prospects of the Company …Continued 4 |
 Project GIANT Key Assumptions Underlying Baird’s Analysis Baird’s analyses are based on several assumptions upon which it relied with your consent including, but not limited to, the following: All of the financial and other information that was publicly available or provided to us by or on behalf of the Company was complete and accurate; and Baird has not been engaged to independently verify, and has not assumed any responsibility to verify, any such information and has assumed that the Company is not aware of any information prepared by it or its advisors that might be material to Baird’s opinion that has not been provided All material assets and liabilities (contingent or otherwise, known or unknown) of the Company are as set forth in the Company’s financial statements The financial statements of the Company provided to Baird present fairly the results of operations, cash flows and financial condition of the Company for the periods indicated and were prepared in conformity with U.S. generally accepted accounting principles consistently applied The Forecasts were reasonably prepared on bases reflecting the best available estimates and good faith judgments of the Company’s senior management as to the future performance of the Company The Transaction will be consummated in accordance with the terms and conditions of the Agreement without any amendment thereto and without waiver by any party of any of the conditions to their respective obligations thereunder 5 |
 Project GIANT Key Assumptions Underlying Baird’s Analysis The representations and warranties contained in the Agreement are true and correct and that each party will perform all of the covenants and agreements required to be performed by it under the Agreement All material corporate, governmental, regulatory or other consents and approvals required to consummate the Transaction have been or will be obtained Baird did not consider any strategic, operating or cost benefits that might result from the Transaction or any expenses relating to the Transaction Baird’s opinion does not address the relative merits of: (i) the Transaction, the Agreement or any other agreements or other matters provided for or contemplated by the Agreement; (ii) any other transactions that may be or might have been available as an alternative to the Transaction; or (iii) the Transaction compared to any other potential alternative transactions or business strategies considered by the Company’s Board of Directors Baird’s opinion necessarily is based upon economic, monetary and market conditions as they exist and can be evaluated on the date of such opinion and does not predict or take into account any changes which may occur, or information which may become available, after such date Baird expresses no opinion as to the price or trading range at which any of the Company’s securities (including the Company’s common stock) will trade following the date of our opinion …Continued 6 |
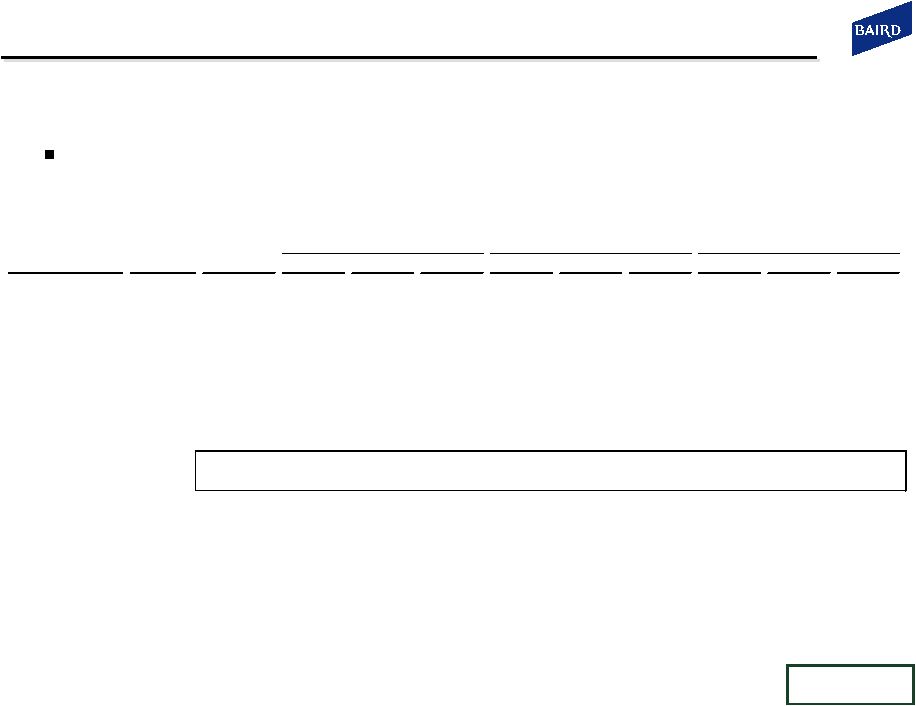
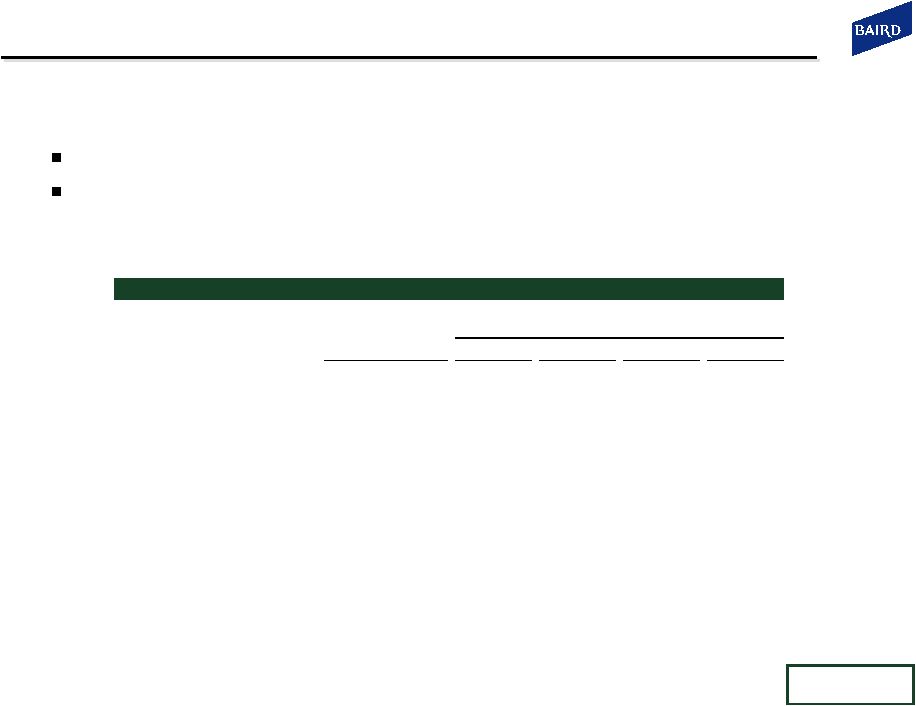
 Project GIANT Implied Valuation and Transaction Multiples _____________________ Note: Historical financial information based on GIANT SEC filings. Estimates and projections based on GIANT management estimates. (1) Per M-Co information statement dated September 2, 2008. Excludes the full exercise of options to purchase 12,000 shares held by a M-Co representative and GIANT director. (2) Per GIANT outstanding share data as of August 31, 2008. (3) Based on 707,104 outstanding stock options as of August 31, 2008, and a $30.00 per share purchase price. (4) Based on 278,141 shares underlying stock appreciation rights outstanding as of August 31, 2008 and a $30.00 per share purchase price. (5) Per GIANT Form 10-Q for the period ended June 30, 2008. Includes $49.1 million of short term commercial paper, $0.2 million of the current portion of long-term debt obligations, $28.2 million of borrowings under a revolving credit facility and $0.3 million of other long-term debt obligations. (6) LTM information based on 10-Q and 10-K filings. 2008E and 2009P based on GIANT management estimates. (in millions, except per share amounts) Purchase Price GIANT Shares Outstanding: Equity Purchase Price: Total Purchase Price: M-Co Aggregate Share Ownership (1) 1.736 Share Price $30.00 Equity Purchase Price $377.0 Plus: Non M-Co Share Ownership 10.400 x Total Basic Shares Outstanding 12.136 Plus: Total Debt (5) 77.9 Total Basic Shares Outstanding (2) 12.136 Equity Purchase Price (Before Options) $364.1 Less: Cash 5.0 Plus: Net Purchase Price of GIANT Options (3) 10.8 Total Purchase Price $449.9 Plus: Net Purchase Price of GIANT SARs (4) 2.2 Total Equity Purchase Price $377.0 Implied Transaction Multiples Last Twelve Months ("LTM") 6/30/08 (6) 2008E (6) 2009P (6) GIANT Implied GIANT Implied GIANT Implied Statistic Multiple Statistic Multiple Statistic Multiple EBITDA $33.5 13.4 x $25.7 17.5 x $36.9 12.2 x EBIT 29.1 15.5 20.9 21.5 27.4 16.4 Net Income 14.1 26.8 10.8 34.8 15.5 24.3 7 |
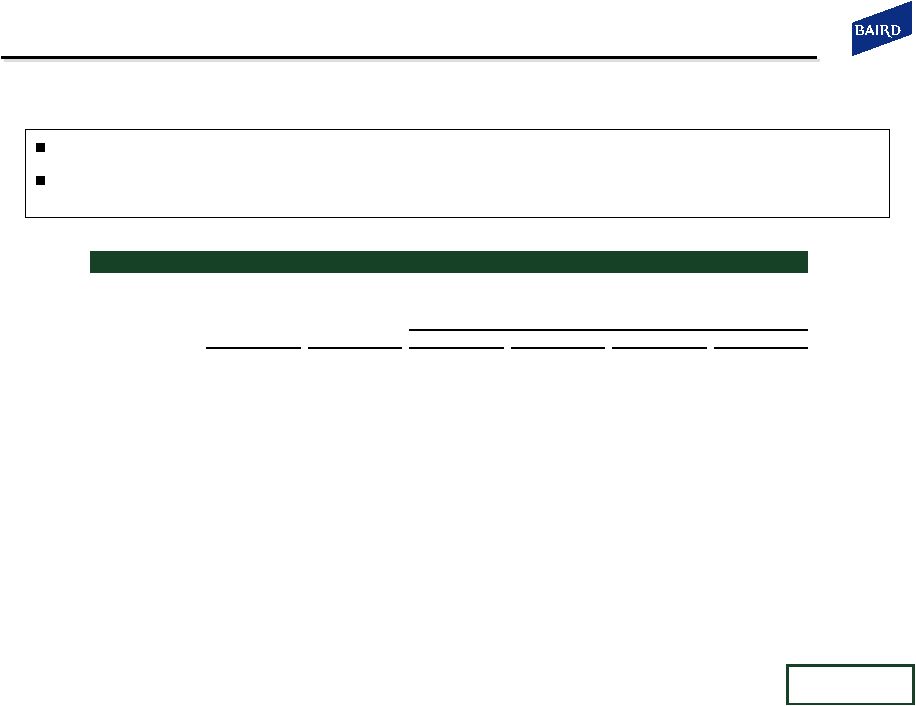
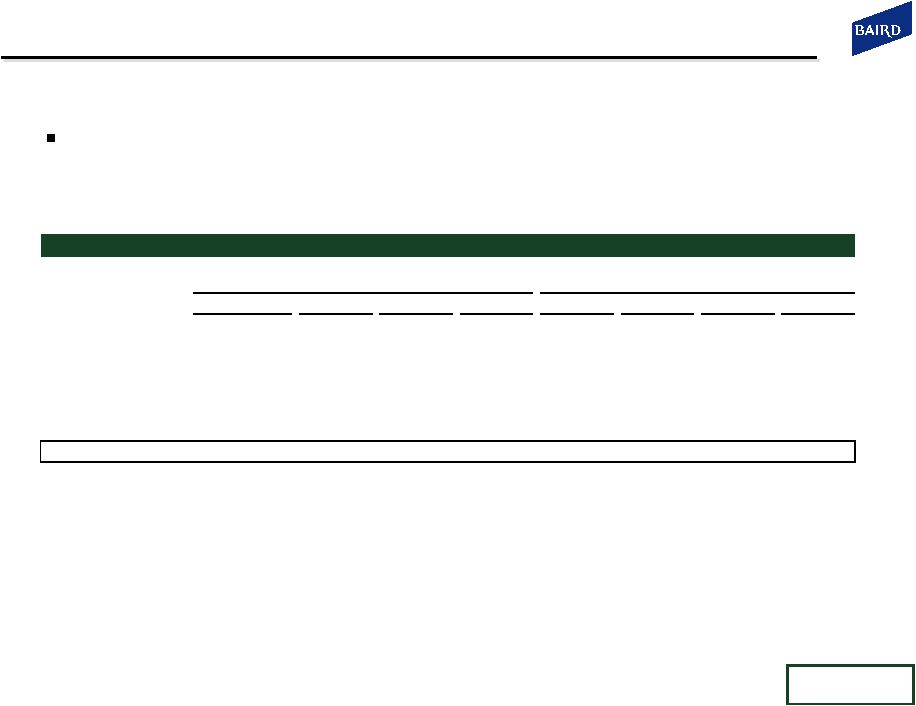
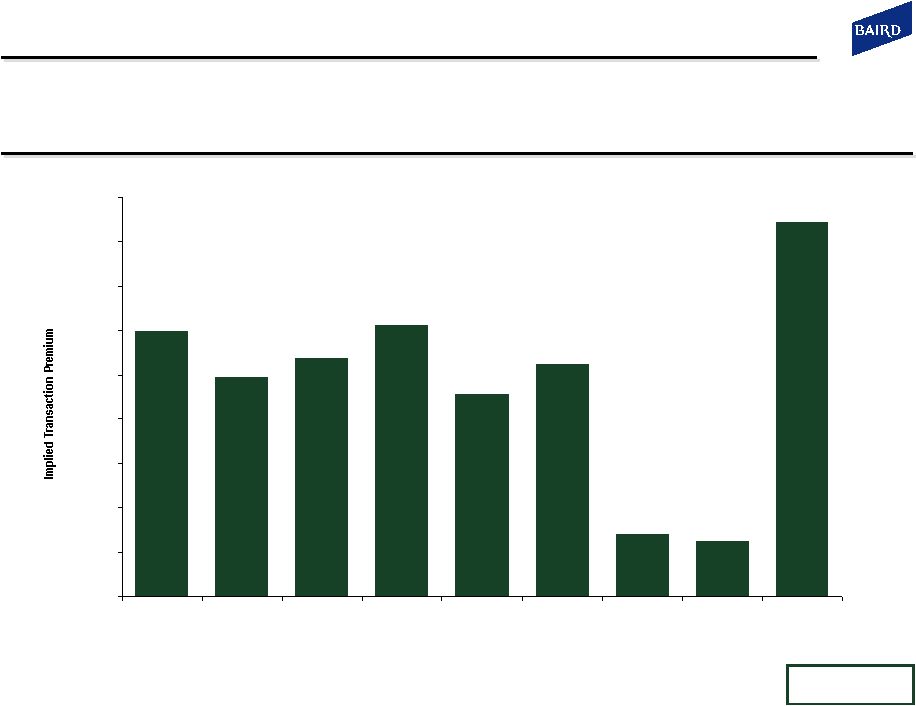 Project GIANT Implied Transaction Premiums Implied Transaction Premiums (1 ) _____________________ (1) Premiums calculated based upon $30.00 per share acquisition price utilizing GIANT’s stock price reference date of September 5, 2008 per Capital IQ. 119.6% 99.1% 107.6% 122.4% 91.6% 104.9% 28.4% 25.4% 168.6% 0.0% 20.0% 40.0% 60.0% 80.0% 100.0% 120.0% 140.0% 160.0% 180.0% 1-Day 7-Days 30-Days 60-Days 90-Days 180-Days 1-Year LTM High LTM Low 8 |
 GIANT Financial and Market Data |
 Project GIANT GIANT Historical / Projected Financial Data _____________________ (1) Historical data per GIANT SEC Filings. (2) LTM June 30, 2008 results per GIANT Form 10-Q for the period ending June 30, 2008 and GIANT Form 10-K for the period ending December 31, 2007. (3) Projected financial data is based on management estimates. (in millions, except per share amounts) 9 Summary Financial Data Fiscal Year Ending December 31, Historical (1) LTM (2) Projected (3) 2005 2006 2007 6/30/2008 2008 2009 2010 2011 2012 2013 Net Sales $447.0 $486.2 $457.6 $400.3 $394.0 $469.8 $558.5 $656.5 $729.9 $731.9 Net Sales Growth 37.4% 8.8% (5.9%) (16.5%) (13.9%) 19.2% 18.9% 17.5% 11.2% 0.3% Gross Profit $92.3 $104.4 $103.2 $89.1 $82.0 $97.7 $124.2 $150.5 $170.8 $171.3 Margin 20.6% 21.5% 22.6% 22.2% 20.8% 20.8% 22.2% 22.9% 23.4% 23.4% EBITDA $43.8 $50.7 $48.2 $33.5 $25.7 $36.9 $58.4 $78.1 $92.0 $89.2 Margin 9.8% 10.4% 10.5% 8.4% 6.5% 7.9% 10.5% 11.9% 12.6% 12.2% EBIT $38.8 $46.1 $43.6 $29.1 $20.9 $27.4 $46.4 $65.0 $77.8 $73.8 Margin 8.7% 9.5% 9.5% 7.3% 5.3% 5.8% 8.3% 9.9% 10.7% 10.1% Net Income $22.2 $28.1 $24.9 $14.1 $10.8 $15.5 $26.5 $38.3 $47.0 $45.9 Margin 5.0% 5.8% 5.5% 3.5% 2.8% 3.3% 4.7% 5.8% 6.4% 6.3% EPS $2.00 $2.26 $2.00 $1.13 $0.89 $1.30 $2.21 $3.19 $3.92 $3.83 Shares Outstanding 11.1 12.4 12.5 12.4 12.3 12.0 12.0 12.0 12.0 12.0 Capital Expenditures $7.6 $6.4 $6.4 $9.2 $21.6 $25.1 $8.4 $8.7 $8.9 $9.2 % of Net Sales 1.7% 1.3% 1.4% 2.3% 5.5% 5.3% 1.5% 1.3% 1.2% 1.3% |
 Project GIANT GIANT Balance Sheet _____________________ Source: Per GIANT Form 10-Q for the period ending June 30, 2008. (1) Based on 12,135,737 total shares outstanding as of August 31, 2008. ($ in millions, except per share amounts) 10 As of As of 6/30/2008 6/30/2008 Assets Liabilities Cash $5.0 Current portion of long-term debt obligations $0.2 Accounts receivable 190.6 Short-term borrowing 49.1 Finance contracts - current 6.1 Accounts payable 48.6 Inventories 72.4 Accrued wages and salaries 2.2 Prepaid expenses and other 3.2 Accrued expenses and other 7.3 Retained interest - current 55.2 Warranty and product liability 7.6 Deferred tax asset 9.7 Accrued income taxes 1.2 Current assets $342.2 Current liabilities $116.4 Property, plant and equipment - net $38.8 Long-term debt obligations $28.2 Finance contracts - non current 3.0 Other long-term obligations 0.3 Retained interest - non current 24.6 Other long-term liabilities 17.5 Goodwill 11.7 Total liabilities $162.4 Other assets 9.7 Total shareholders' equity 267.6 Total Assets $430.0 Total Liabilities and Shareholders' Equity $430.0 Book Value per Share (1) $22.05 |
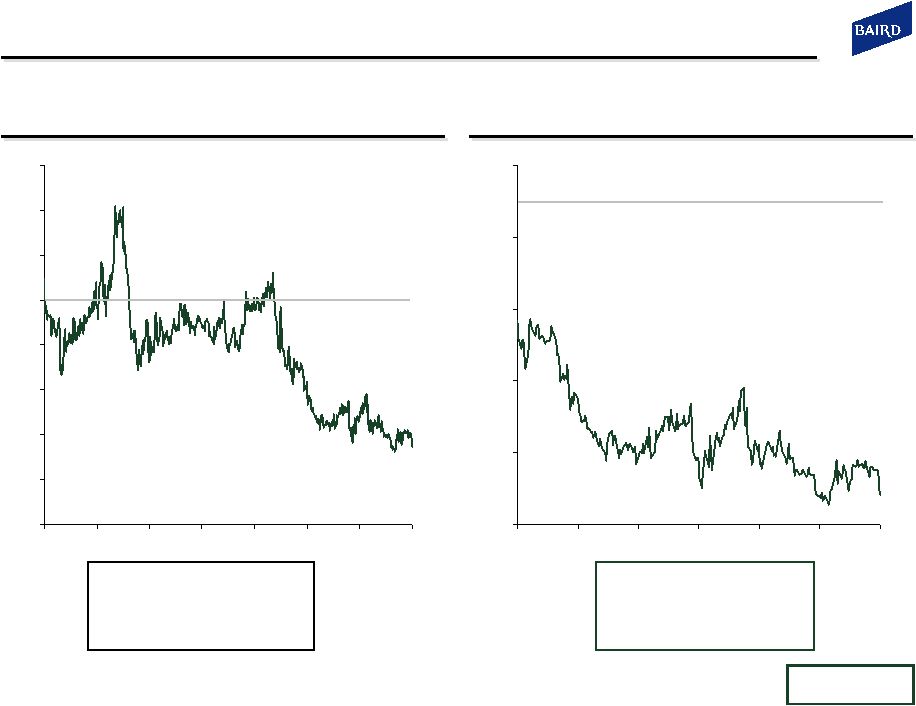 Project GIANT Last Three Years GIANT Stock Price Performance Current: $13.66 Low: $13.10 High: $40.39 Average: $24.28 Current: $13.66 Low: $13.10 High: $23.46 Average: $17.07 $5 $10 $15 $20 $25 $30 $35 $40 $45 9/05 2/06 7/06 12/06 5/07 10/07 4/08 9/08 $12 $16 $20 $24 $28 $32 9/6/07 11/5/07 1/5/08 3/6/08 5/6/08 7/6/08 9/5/08 Last Twelve Months $30.00 $30.00 $13.66 $13.66 _____________________ Source: FactSet Data Systems, Inc. _____________________ Source: FactSet Data Systems, Inc. 11 |
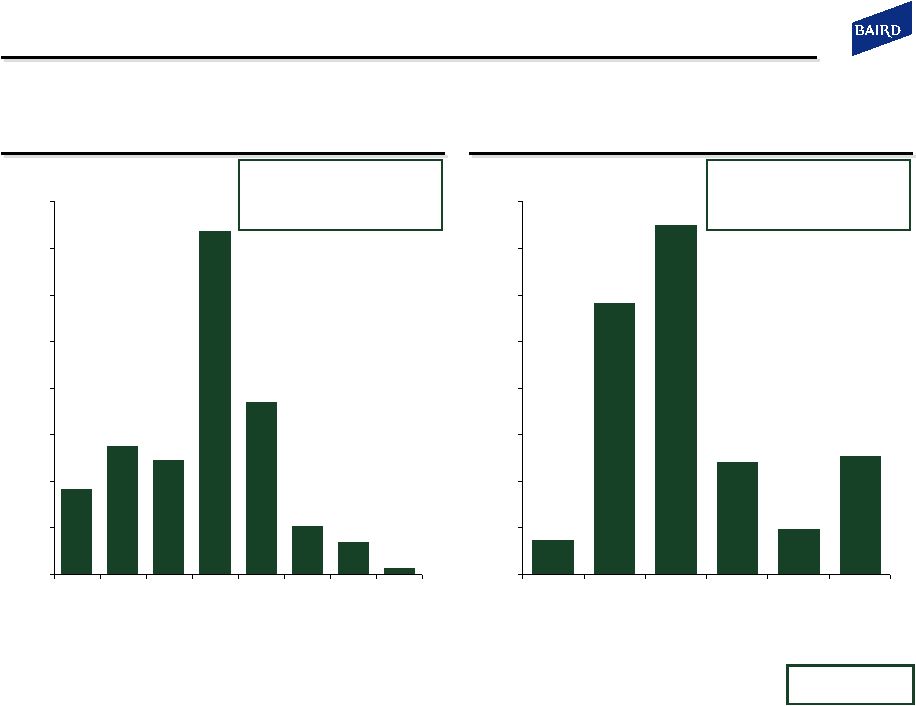 Project GIANT 9.2% 13.8% 12.3% 36.7% 18.5% 5.2% 3.5% 0.7% 0.0% 5.0% 10.0% 15.0% 20.0% 25.0% 30.0% 35.0% 40.0% $12.00 - $16.00 $16.00 - $20.00 $20.00 - $24.00 $24.00 - $28.00 $28.00 - $32.00 $32.00 - $36.00 $36.00 - $40.00 $40.00 - $44.00 3.8% 29.0% 37.4% 12.0% 4.9% 12.8% 0.0% 5.0% 10.0% 15.0% 20.0% 25.0% 30.0% 35.0% 40.0% $12.00 - $14.00 $14.00 - $16.00 $16.00 - $18.00 $18.00 - $20.00 $20.00 - $22.00 $22.00 - $24.00 GIANT Stock Price / Volume Histogram _____________________ Source: FactSet Data Systems, Inc. Volume Weighted Average Price per Xignite Historical VWAPs. Note: 88,921,112 shares traded during this period. _____________________ Source: FactSet Data Systems, Inc. Volume Weighted Average Price per Xignite Historical VWAPs. Note: 24,795,432 shares traded during this period. Volume-Weighted Average Price: $25.09 Current: $13.66 Low: $13.10 High: $40.39 Volume-Weighted Average Price: $17.41 Current: $13.66 Low: $13.10 High: $23.46 Last Three Years Last Twelve Months 12 |
 Project GIANT GIANT Selected Company Index M-Co Relative Stock Price Performance _____________________ Source: Capital IQ. Selected Company Index includes: ASTE, CAT, CNH, DE and TEX. _____________________ Source: Capital IQ. Selected Company Index includes: ASTE, CAT, CNH, DE and TEX. 20% 60% 100% 140% 180% 220% 260% 9/05 2/06 7/06 12/06 5/07 10/07 4/08 9/08 30% 40% 50% 60% 70% 80% 90% 100% 110% 120% 9/6/2007 11/5/2007 1/5/2008 3/6/2008 5/6/2008 7/6/2008 9/5/2008 Last Three Years Last Twelve Months (50%) +42% (58%) (57%) (32%) (42%) GIANT Selected Company Index M-Co 13 |
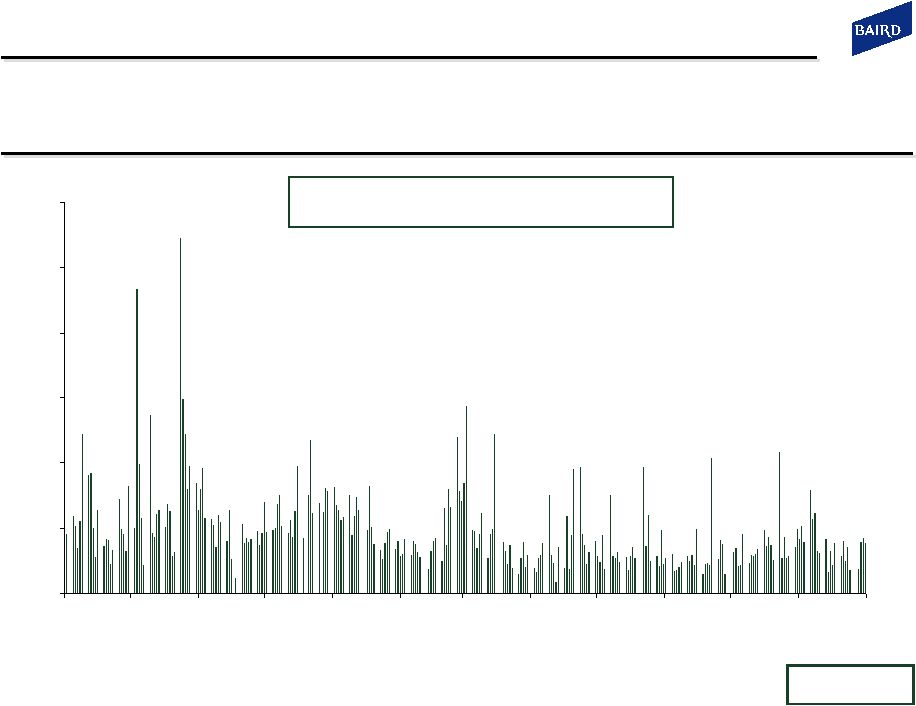 Project GIANT 0 100 200 300 400 500 600 9/6/07 10/6/07 11/6/07 12/6/07 1/6/08 2/6/08 3/6/08 4/6/08 5/6/08 6/6/08 7/6/08 8/6/08 Average Daily Trading Volume (in thousands) GIANT Trading Volume Summary _____________________ Source: FactSet Data Systems, Inc. Last Twelve Months Average Daily Trading Volume: 98.006 Last 90-Days Average Daily Trading Volume: 70.385 9/5/08 14 |
 Project GIANT GIANT Share Ownership 15 Ownership Summary Number of Shares % of Total Manitou BF (1) 1,736,046 14.3% Institutional Holders Tontine Partners 1,193,422 9.8% Dimensional Fund Advisors, Inc. 1,035,074 8.5% Royce & Associates LLC 889,274 7.3% Wellington Management Co. LLP 849,444 7.0% Barclays Global Investors NA (California) 448,805 3.7% Capital World Investors 436,477 3.6% Voyageur Asset Management, Inc. 403,745 3.3% Towle & Co. 384,500 3.2% Fidelity Management & Research 364,487 3.0% Thomson, Horstmann & Bryant, Inc. 311,900 2.6% Other Institutional Holders 3,133,685 25.8% Total Insitutional Holders 9,450,813 77.9% Insiders 245,773 2.0% Other Holders 703,105 5.8% Total Shares Outstanding 12,135,737 100.0% _____________________ Source: FactSet DataSystems as of September 5, 2008 and GIANT outstanding share data as of August 31, 2008. (1) Per M-Co information statement dated September 2, 2008. Excludes the full exercise of options to purchase 12,000 shares held by a M-Co representative and GIANT director. |
 GIANT Valuation Analysis |
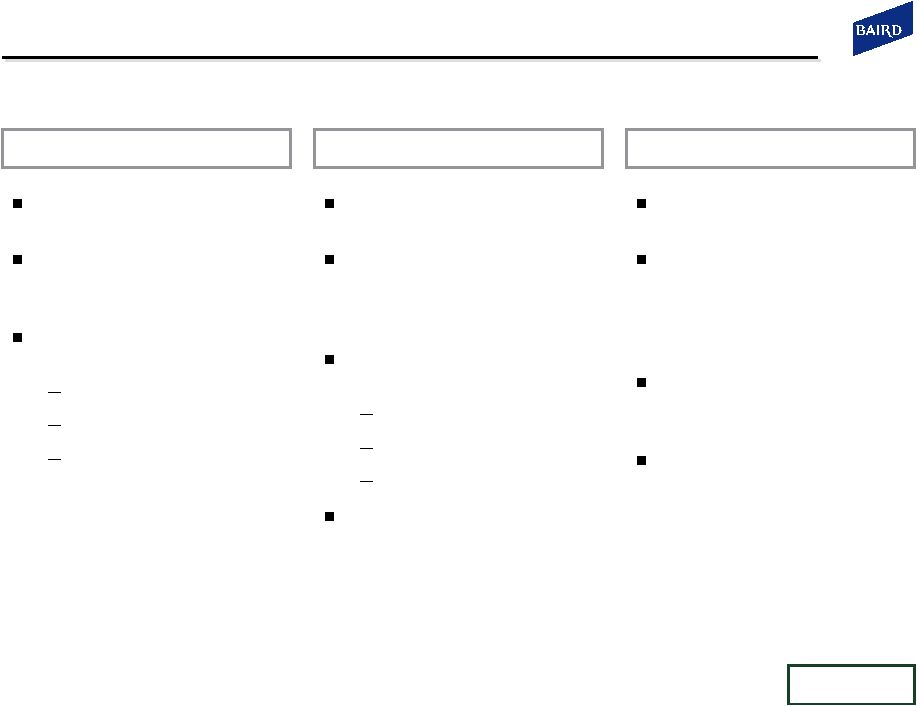 Project GIANT Valuation Methodologies Value based on comparisons with “similar” publicly-traded companies Selected publicly-traded companies with similar business, industry and financial characteristics Valuation benchmarks include multiples of: EBITDA EBIT Net Income Selected Company Analysis Selected Acquisition Analysis Discounted Cash Flow Analysis Value based on comparisons with “similar” acquisition transactions Selected acquisition transactions involving companies with similar business and industry characteristics Valuation benchmarks include multiples of EBITDA EBIT Net Income Valuation benchmarks also include acquisition premiums paid Valuation based on the present value of future free cash flows Free cash flow = unlevered net income + non-cash adjustments – change in working capital – capital expenditures +/- changes in other cash flow items Discount rate = weighted-average cost of capital based on business and financial risk Terminal values based on multiples of EBITDA and growth rates of free cash flow 16 |
 Project GIANT Selected Company Analysis Baird selected a group of publicly-traded companies that were deemed relevant valuation benchmarks _____________________ Sources: Based on publicly available documents as of September 5, 2008. Finance divisions are excluded for CAT, CNH and DE for actual and projected statistics. ASTE and TEX projections per Capital IQ consensus estimates. CAT projections per Morgan Stanley equity research report dated July 22, 2008. CNH projections per JP Morgan equity research report dated July 24, 2008. DE projections per Goldman Sachs equity research report dated August 13, 2008. ($ in millions) Enterprise EBITDA Multiples EBIT Multiples P/E Multiples Company Ticker Value LTM 2008 2009 LTM 2008 2009 LTM 2008 2009 GIANT GEHL $240.4 7.2 x 9.4 x 6.5 x 8.3 x 11.5 x 8.8 x 11.9 x 15.4 x 10.8 x Astec Industries Inc. ASTE $672.9 6.1 x 5.7 x 5.4 x 7.1 x 6.8 x 6.2 x 11.6 x 11.2 x 10.7 x Caterpillar Inc. CAT 44,327.3 7.2 7.5 7.5 8.9 9.4 9.4 9.9 11.0 11.2 CNH Global NV CNH 10,534.0 6.2 5.5 5.2 7.4 6.8 6.4 10.2 8.9 6.7 Deere & Co. DE 27,104.3 8.5 7.6 6.3 10.0 8.8 7.2 13.1 12.5 10.5 Terex Corp. TEX 4,520.2 3.8 3.6 3.5 4.0 3.9 3.9 5.4 5.4 5.2 Mean 6.3 x 6.0 x 5.6 x 7.5 x 7.2 x 6.6 x 10.1 x 9.8 x 8.9 x Median 6.2 5.7 5.4 7.4 6.8 6.4 10.2 11.0 10.5 17 |
 Project GIANT _____________________ Sources: Based on publicly available documents as of September 5, 2008. Finance divisions are excluded for CAT, CNH and DE for actual and projected statistics. ASTE and TEX projections per Capital IQ consensus estimates. CAT projections per Morgan Stanley equity research report dated July 22, 2008. CNH projections per JP Morgan equity research report dated July 24, 2008. DE projections per Goldman Sachs equity research report dated August 13, 2008. (1) Selected companies include Astec Industries, Caterpillar, CNH Global, Deere & Co. and Terex Corporation. Prices as of September 5, 2008. Selected Company Analysis Baird selected a group of publicly-traded companies that were deemed relevant valuation benchmarks A summary of the multiples implied in the Transaction and the trading multiples of the group of selected companies is presented below 18 Summary Selected Company Analysis (1) Implied GIANT Transaction Current Trading Selected Company Trading Multiples Multiples Multiples Low Average Median High EBITDA LTM 13.4 x 7.2 x 3.8 x 6.3 x 6.2 x 8.5 x 2008E 17.5 9.4 3.6 6.0 5.7 7.6 2009P 12.2 6.5 3.5 5.6 5.4 7.5 EBIT LTM 15.5 x 8.3 x 4.0 x 7.5 x 7.4 x 10.0 x 2008E 21.5 11.5 3.9 7.2 6.8 9.4 2009P 16.4 8.8 3.9 6.6 6.4 9.4 Net Income LTM 26.8 x 11.9 x 5.4 x 10.1 x 10.2 x 13.1 x 2008E 34.8 15.4 5.4 9.8 11.0 12.5 2009P 24.3 10.8 5.2 8.9 10.5 11.2 |
 Project GIANT Selected Company Analysis A summary of the implied valuations of the Company based on the trading multiples of the group of selected companies is presented below _____________________ (1) Based on Capital IQ and publicly available documents. (2) Represents the average for each respective column. ($ in millions, except per share amounts) 19 Summary Selected Company Analysis (1) Implied GIANT Total Value Implied GIANT Equity Value / Share Low Average Median High Low Average Median High EBITDA LTM $125.5 $212.3 $207.5 $284.0 $4.34 $11.42 $11.03 $17.12 2008E 93.3 154.2 146.8 195.2 1.68 6.69 6.09 10.04 2009P 128.7 205.3 198.2 276.0 4.60 10.86 10.28 16.49 EBIT LTM $117.6 $218.1 $216.8 $290.1 $3.69 $11.88 $11.78 $17.60 2008E 82.4 150.0 143.1 196.8 0.79 6.36 5.79 10.18 2009P 106.1 181.7 175.3 258.7 2.74 8.95 8.43 15.11 Net Income LTM $149.5 $214.4 $216.5 $257.5 $6.31 $11.59 $11.76 $15.02 2008E 131.7 179.1 191.7 208.3 4.85 8.74 9.76 11.09 2009P 153.0 210.8 236.3 247.4 6.60 11.29 13.33 14.22 REFERENCE VALUE (2) $120.9 $191.8 $192.5 $246.0 $3.96 $9.75 $9.81 $14.10 |
 Project GIANT Selected Acquisition Analysis Baird selected a group of M&A transactions that were deemed relevant valuation benchmarks _____________________ Sources: Based on publicly available documents, press releases and Capital IQ. (1) JLG enterprise value and financial statistics adjusted to exclude financing operations. ($ in millions) 20 Enterprise / Equity Value Date Enterprise as a Multiple of LTM 1 - Day Announced Acquiror Target Target Business Description Value EBITDA EBIT NI Premium 01/14/08 Terex Corporation A.S.V. Inc. Manufacture rubber track machines and related accessories and attachments $445.0 23.6 x 28.5 x 43.8 x 46.5% 07/30/07 Doosan Infracore Co. Ingersoll-Rand (Bobcat Division) Manufacture and sell compact equipment 4,900.0 12.2 13.2 N/A N/A 02/27/07 Volvo Construction Equipment Ingersoll-Rand (Road Development) Manufacture asphalt paving, compaction and material handling equipment. 1,300.0 11.5 12.9 N/A N/A 02/05/07 Atlas Copco Group Dynapac AB Manufacture compaction and paving equipments 902.0 N/A 12.1 N/A N/A 11/06/06 KKR / Goldman Sachs KION Group (Linde AG forklift division) Manufacture forklift trucks 5,084.6 6.8 15.2 N/A N/A 10/16/06 Oshkosh Truck Corporation JLG Industries Inc. (1) Manufacture aerial work platforms, telehandlers, and trailers 2,940.2 10.9 12.2 20.6 34.9% 04/28/06 Singapore Technologies B.R. Lee Industries, Inc. Manufacture commercial asphalt pavers 129.0 7.3 13.2 N/A N/A 04/28/05 Coates Hire Limited Allied Equipment Pty Ltd. Specialist in the mining, construction, material handling and associated equipment fields 94.6 4.7 6.9 N/A N/A 10/29/04 Fayat S.A. Bomag GmbH Develop and manufacture compaction equipment 446.0 8.1 9.9 11.8 N/A 09/10/03 AGCO Corp. Valtra Inc. Develop, manufacture, market and service tractors 660.0 8.3 10.2 N/A N/A 07/19/02 Terex Corporation Genie Holdings Manufacture lifts, booms and work platforms for the construction industry 270.0 7.4 N/M N/A N/A 03/18/02 Manitowoc Co. Inc. Grove Worldwide, Inc. Manufacture mobile cranes and work platforms cranes and aerial work platforms 284.0 6.9 N/M N/M N/A 06/28/01 Terex Corporation CMI Corporation Manufacture equipment for the road builidng and heavy construction industry 158.4 9.7 15.1 N/M 31.5% 03/05/01 Manitowoc Co. Inc. Potain SA Manufacture tower cranes primarily for the construction industry 309.5 7.5 11.4 18.8 N/A 08/23/99 Textron Inc. JLG OmniQuip International, Inc. Manufacture telescopic material handlers and aerial work platforms 491.4 8.1 9.6 15.3 N/A 05/11/99 JLG Industries Inc. Gradall Industries, Inc. Manufacture hydraulic excavators and rough-terrain variable reach material handlers 203.8 7.2 8.1 13.5 14.3% All transactions Low 4.7 x 6.9 x 11.8 x Mean 9.3 12.7 20.6 Median 8.1 12.2 17.1 High 23.6 28.5 43.8 Excluding Terex Corporation acquisition of A.S.V. Inc. Low 4.7 x 6.9 x 11.8 x Mean 8.3 11.5 16.0 Median 7.8 12.1 15.3 High 12.2 15.2 20.6 |
 Project GIANT Source: Publicly available documents, press releases and Capital IQ. (1) Selected transactions include A.S.V. Inc. / Terex Corporation; Ingersoll-Rand (Bobcat Division) / Doosan Infracore Co; Ingersoll-Rand (Road Development) / Volvo AB; Dynapac AB / Atlas Copco Group; KION Group (Linde AG forklift division) / KKR and Goldman Sachs; JLG Industries Inc. / Oshkosh Truck Corporation (JLG enterprise value and financial statistics adjusted to exclude financing operations); B.R. Lee Industries, Inc. / Singapore Technologies; Allied Equipment Pty Ltd. / Coates Hire Limited; Bomag GmbH / Fayat S.A.; Valtra Inc. / AGCO Corp.; Genie Holdings / Terex Corporation; Grove Worldwide, Inc. / Manitowoc Co. Inc.; CMI Corporation / Terex Corporation; Potain SA / Manitowoc Co. Inc.; JLG OmniQuip International, Inc. / Textron Inc.; Gradall Industries, Inc. / JLG Industries Inc. (2) Includes Terex Corporation acquisition of A.S.V. Inc. Excluding this transaction, “High” EBITDA, EBIT and Net Income Selected Acquisition Multiples are reduced to 12.2x, 15.2x and 20.6x, respectively. Selected Acquisition Analysis Baird selected a group of M&A transactions that were deemed relevant valuation benchmarks A summary of multiples implied in the Transaction and the multiples of the group of selected M&A transactions is presented below 21 Summary Selected Acquisition Analysis (1) Implied Transaction Multiples Low Average Median High (2) EBITDA 13.4 x 4.7 x 9.3 x 8.1 x 23.6 x EBIT 15.5 6.9 12.7 12.2 28.5 Net Income 26.8 11.8 20.6 17.1 43.8 Selected Acquisition Multiples |
 Project GIANT Selected Acquisition Analysis ($ in millions, except per share amounts) 22 Summary Selected Acquisition Analysis (1) Implied GIANT Equity Value / Share Low Average Median High (2) Low Average Median High (2) EBITDA (LTM) $158.0 $312.6 $270.3 $789.7 $7.01 $19.37 $16.04 $56.67 EBIT (LTM) 200.8 370.9 354.6 829.5 10.50 23.96 22.67 59.77 Net Income (LTM) 238.6 363.3 313.3 689.2 13.51 23.36 19.43 48.84 REFERENCE VALUE (3) $199.1 $348.9 $312.7 $769.5 $10.34 $22.23 $19.38 $55.09 Implied GIANT Total Value _____________________ (1) Based on publicly available documents, press releases and Capital IQ. (2) Includes Terex Corporation acquisition of A.S.V. Inc. Excluding this transaction, the “High” Implied GIANT Total Value based on EBITDA, EBIT and Net Income is reduced to $406.9 million, $441.0 million and $362.9 million, respectively. Implied GIANT Equity Value / Share is reduced to $26.79, $29.47 and $23.33, respectively. (3) Represents average of each respective column. Excluding Terex Corporation acquisition of A.S.V. Inc., the “High” Reference Value for Implied GIANT Total Value is $403.6 million and the “High” Implied GIANT Equity Value / Share is $26.53. A summary of the implied valuations of the Company based on the transaction multiples of the group of selected M&A transactions is presented below |
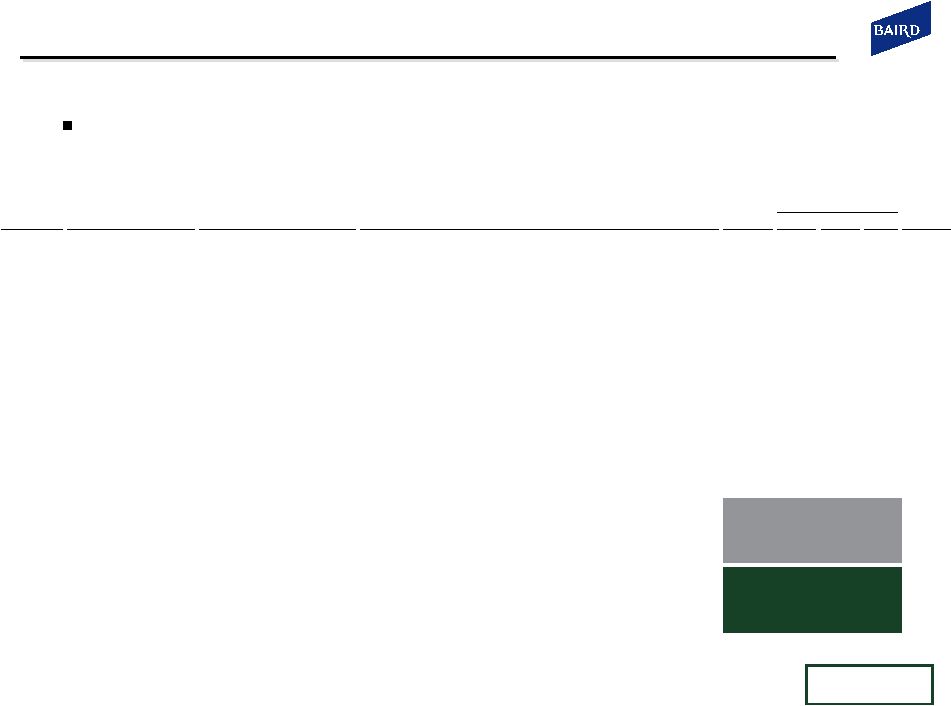
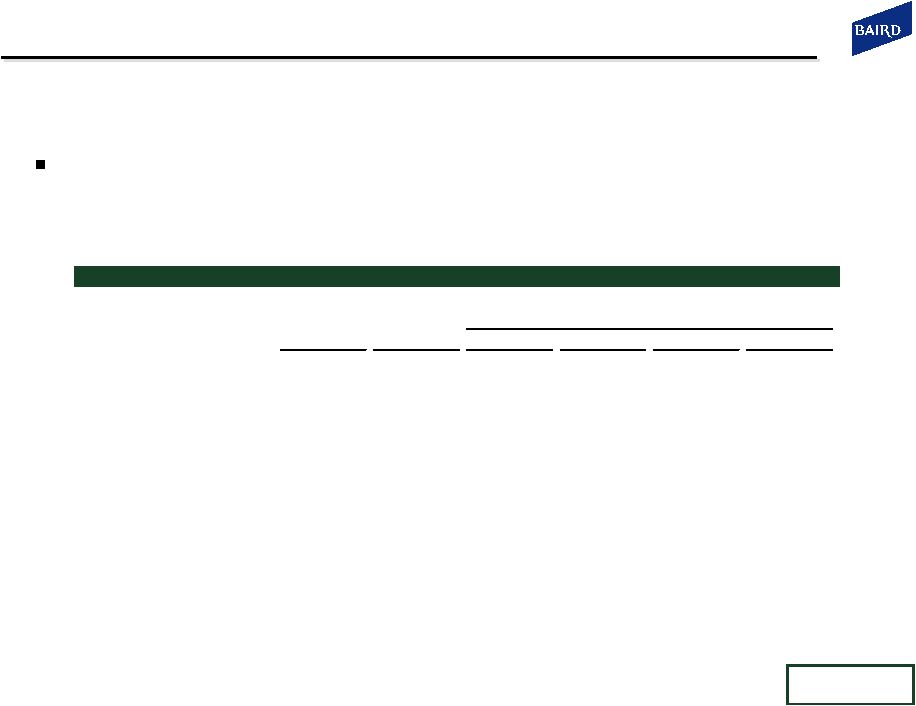 Project GIANT Selected Acquisition Analysis A summary of the premiums implied in the Transaction and the premiums of 107 public target announced transactions with an enterprise value greater than $100 million since January 1, 2008 is presented below _____________________ Sources: Based on publicly available documents, press releases and Capital IQ. (1) As of September 5, 2008. 23 Summary Selected Acquisition Analysis - Transaction Premiums Implied Stock Transaction Selected Acquisition Premiums Price (1) Premium (1) Low Average Median High 1-Day Prior to Announcement $13.66 119.6% (93.3%) 33.3% 30.5% 143.9% 7-Days Prior to Announcement 15.07 99.1% (97.1%) 35.5% 33.8% 200.5% 30-Days Prior to Announcement 14.45 107.6% (97.6%) 39.3% 33.9% 245.6% 90-Days Prior to Announcement 15.66 91.6% (97.9%) 37.6% 33.0% 209.2% 180-Days Prior to Announcement 14.64 104.9% (98.3%) 30.2% 24.1% 439.2% |
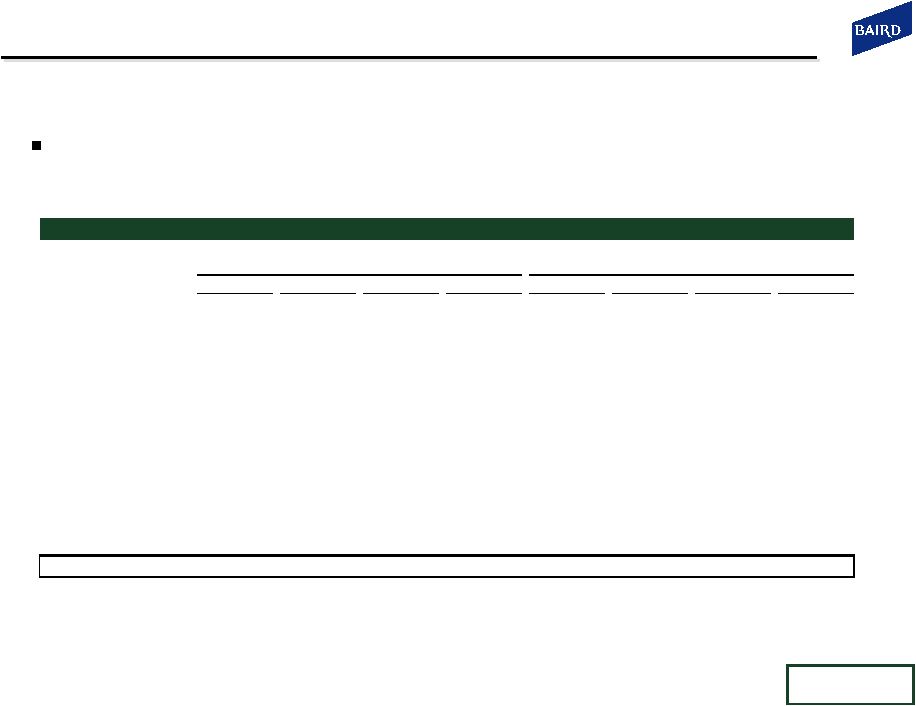
 Project GIANT Discounted Cash Flow Analysis The Company’s implied valuation derived from discounting its projected free cash flows and terminal values is summarized below _____________________ (1) Discounted to June 30, 2008. (2) The assumed weighted average cost of capital for GIANT. (3) Based on 7.1x multiple at LTM EBITDA peak in Q3 2006 and average multiple from September 30, 2002 (LTM EBITDA trough) through August 13, 2008 of 8.5x. (4) Implied free cash flow growth rate is equal to (TV x Discount Rate - FCF 2013 ) / (TV + FCF 2013 ), where TV= EBITDA 2013 x EBITDA Terminal Multiple. (5) Per GIANT Form 10-Q for the period ended June 30, 2008. (6) Assumes cash proceeds are received from the exercise of “in the money” options outstanding as of August 31, 2008. ($ in millions, except per share amounts) Discounted Cash Flow Valuation (1) EBITDA Present Value Less: Discount Terminal Implied FCF Cash Terminal Enterprise Net Plus: Option Equity Equity Value Rate (2) Multiple (3) Growth Rate (4) Flows Value Value Debt (5) Proceeds (6) Value Per Share 7.10 x 4.9% $72.1 $308.0 $380.2 $6.6 $313.9 $24.69 14.0% 7.80 5.6% 72.1 338.4 410.5 $72.9 6.6 344.2 27.08 8.50 6.3% 72.1 368.8 440.9 6.6 374.6 29.47 7.10 x 4.0% $73.9 $323.3 $397.2 $6.6 $331.0 $26.03 13.0% 7.80 4.7% 73.9 355.2 429.1 $72.9 6.6 362.8 28.54 8.50 5.3% 73.9 387.1 461.0 7.2 395.4 31.05 7.10 x 3.0% $75.8 $339.5 $415.3 $6.6 $349.0 $27.45 12.0% 7.80 3.8% 75.8 373.0 448.8 $72.9 7.2 383.2 30.09 8.50 4.4% 75.8 406.5 482.3 7.2 416.6 32.72 24 |
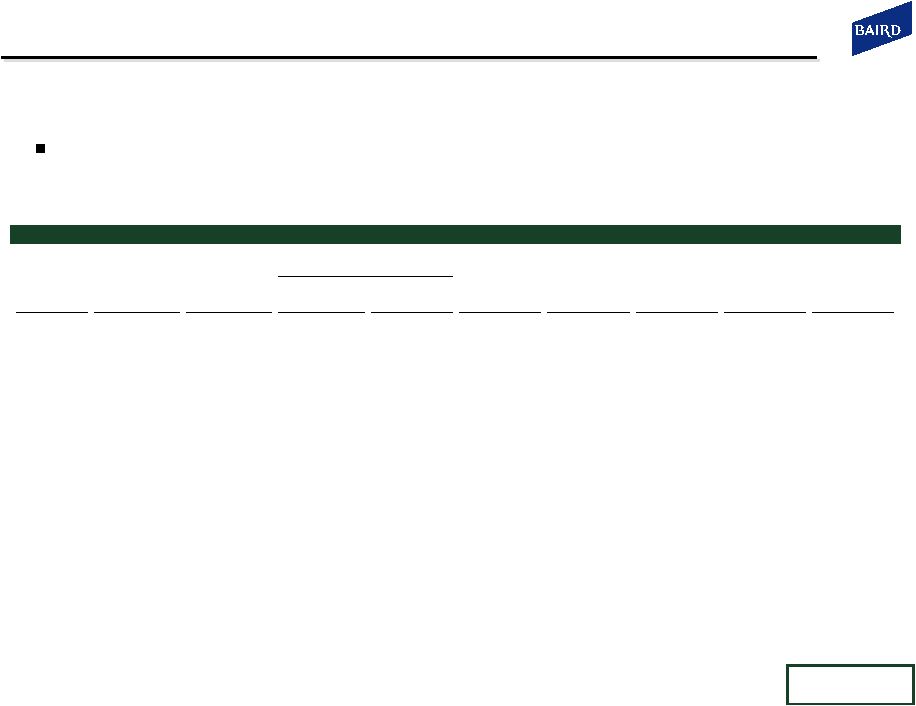
 Project GIANT _____________________ (1) Includes Terex Corporation acquisition of A.S.V. Inc. Excluding this transaction, the “High” Selected Acquisition Analysis Summary Total Enterprise Value is $403.6 million, reducing the “High” Reference Total Enterprise Value to $377.3 million. Likewise, the “High” Selected Acquisition Analysis Summary Equity Value / Share would be $26.53, reducing the “High” Reference Equity Value / Share to $24.45. (2) Represents average of each respective valuation method. Valuation Summary ($ in millions, except per share amounts) Summary Total Enterprise Value Low Average Median High (1) Selected Company Analysis $120.9 $191.8 $192.5 $246.0 Selected Acquisition Analysis 199.1 348.9 312.7 769.5 Discounted Cash Flow Analysis 380.2 429.5 429.1 482.3 Reference Total Enterprise Value (2) $233.4 $323.4 $311.4 $499.2 Summary Equity Value / Share Low Average Median High (1) Selected Company Analysis $3.96 $9.75 $9.81 $14.10 Selected Acquisition Analysis 10.34 22.23 19.38 55.09 Discounted Cash Flow Analysis 24.69 28.57 28.54 32.72 Reference Equity Value / Share (2) $12.99 $20.18 $19.24 $33.97 25 |
 Robert W. Baird Ltd. and Baird Capital Partners Europe are authorized and regulated in the UK by the Financial Services Authority. |