 Project Giant Fair Value of the Common Stock of Giant Presentation to the Board of Directors of Giant September 7, 2008 The information contained herein is of a confidential nature and is intended for the exclusive use of the persons or firm to whom it is furnished by us. Reproduction, publication, or dissemination of portions hereof may not be made without prior approval of Duff & Phelps, LLC. Exhibit (C)(5) |
 2 The following pages contain material provided to the Board of Directors (the “Board”) of Gehl Company (“Gehl” or the “Company”). It is Duff & Phelps’ understanding that the materials provided will be used by the Board for the purpose of complying with the requirements of section DFI-Sec 6.05 of the regulations of the Wisconsin Department of Financial Institutions in connection with the contemplated Proposed Transaction, as herein defined. The accompanying material was compiled or prepared on a confidential basis for the sole use of the Board, and not with a view toward public disclosure. The information utilized in preparing this presentation was obtained from the Company and public sources. Any estimates and projections contained herein involve numerous and significant subjective determinations, which may or may not prove to be correct. No representation or warranty, expressed or implied, is made as to the accuracy or completeness of such information and nothing contained herein is, or shall be relied upon as, a representation, whether as to the past or the future. Duff & Phelps, LLC (“Duff & Phelps”) did not attempt to independently verify such information. Because this material was prepared for use in the context of an oral presentation to the Board, which is familiar with the business and affairs of the Company, neither the Company nor Duff & Phelps, nor any of their respective legal or financial advisors or accountants, take any responsibility for the accuracy or completeness of any of the material if used by persons other than the Board. These materials are not intended to represent an opinion but rather to serve as discussion materials for the Board to review and as a basis upon which Duff & Phelps may render an opinion. Disclaimer |
 I. Introduction and Background II. Valuation Analysis - Discounted Cash Flow Analysis - Selected Public Company / M&A Transaction Analysis III. Conclusion Table of Contents |
 I. Introduction and Background |
 5 Introduction and Background Duff & Phelps Corporation (NYSE: DUF) is a leading provider of independent financial advisory and investment banking services, supporting client needs principally in the areas of valuation, transactions, financial restructurings and disputes. Our professionals bring practical experience, responsiveness and a collaborative approach to satisfy our clients’ needs with the rigor and independence that the market demands. When our clients can’t afford to get their analysis wrong, they look to Duff & Phelps to get it right. With over 1,100 employees serving clients worldwide through offices in the United States, Europe and Asia, Duff & Phelps is committed to delivering insightful advice and service of exceptional quality, integrity and objectivity. Services Offered M&A Advisory Financial Restructurings Tax Valuations and Transfer Pricing Transaction Due Diligence Dispute Consulting Commercial Reasonable Opinions on Related-Party Debt Securities Independent Business Valuations Fairness Opinions Solvency Opinions Real Estate Advisory Financial Reporting Valuations Portfolio Valuations |
 6 Introduction and Background The Engagement Duff & Phelps was retained by the Board of Directors of Gehl Company as an independent financial advisor to provide an opinion (the “Opinion”) as of the date hereof as to the fair value of the common stock of the Company. It is Duff & Phelps’ understanding that the Opinion will be used by the Board of Directors for the purpose of complying with the requirements of section DFI-Sec 6.05 of the regulations of the Wisconsin Department of Financial Institutions in connection with the contemplated transaction described below (the “Proposed Transaction”). The Proposed Transaction involves the acquisition of the common stock of the Company by Manitou BF S.A. pursuant to a cash tender offer and second step merger. As used in the Opinion, the term "fair value" means the value of the shares of common stock of the Company, excluding any appreciation or depreciation in anticipation of the Proposed Transaction, with no minority discount or lack-of-marketability discount; it is intended to reflect the value of a shareholder's proportionate interest in the Company without any such discounts. |
 7 Introduction and Background Scope of Analysis Duff & Phelps’ procedures, investigations, and financial analysis with respect to the preparation of its Opinion included, but were not limited to, the items summarized below: – Discussed the operations, financial condition, future prospects, and projected performance of the Company with the management of the Company; – Reviewed certain audited financial statements and other business and financial information of the Company; – Reviewed certain internal financial statements and other financial and operating data concerning the Company, which the Company has respectively identified as being the most current financial statements available; – Reviewed certain financial forecasts prepared by the management of the Company; – Reviewed the historical trading price and trading volume of the common stock of the Company, and publicly traded securities of certain other companies that it deemed relevant; – Compared the financial performance of the Company with the performance of certain other publicly traded companies that it deemed relevant; and – Conducted such other analyses as it deemed appropriate and considered such other factors as it deemed relevant. |
 8 Introduction and Background In performing its analyses and rendering its Opinion with respect to the Proposed Transaction, Duff & Phelps: Relied upon the accuracy, completeness, and fair presentation of all information, data, advice, opinions and representations obtained from public sources or provided to it from private sources, including Company management, and did not independently verify such information; and Assumed, management of the Company having so advised us, that any estimates, evaluations, forecasts and projections furnished to Duff & Phelps by or on behalf of the Company were reasonably prepared and based upon the best currently available information and good faith judgment of the person furnishing the same. |
 II. Valuation Analysis |
 10 Valuation Analysis Valuation Methodologies Duff & Phelps’ opinion of the fair value of the common stock of the Company is based on our independent valuation analysis. Our independent valuation analysis uses the following generally accepted valuation methodologies. The results of each methodology were considered in conjunction with all of the methodologies. Discounted Cash Flow (“DCF”) Methodology – The DCF Analysis determines value by discounting the projected free cash flows of the Company by a market related discount rate which incorporates the inherent risks of the Company. Selected Public Company Methodology – The Selected Public Company analysis derives value from the public market based on pricing multiples of selected companies. Mergers & Acquisition (“M&A”) Methodology – The M&A Analysis derives value from the implied pricing multiples of companies that have been acquired within the Company’s industry. |
 11 Valuation Analysis Discounted Cash Flow Analysis As part of its valuation analysis, Duff & Phelps performed a DCF analysis for the fiscal years 2008 through 2017 (the “projection period”). Duff & Phelps discounted the projected free cash flows of the Company at a market-related discount rate which reflects the inherent risks of the Company. – Free cash flow is defined as cash that is available to either reinvest or distribute to security holders. – The projected free cash flows are discounted to the present at a rate which reflects the relative risk associated with these cash flows, as well as the rates of return which security holders could expect to realize on alternative investment opportunities. Our analysis is based upon Management’s forecasted performance for the Company through 2013. Net sales are expected to decline 13.9% to $394.0 million in 2008, rebound 19.2% to $469.8 million in 2009 (2.7% higher than 2007 net sales), and grow 18.9%, 17.5%, and 11.2%, respectively for each of 2010, 2011, and 2012. The Company’s net sales growth is expected to be approximately flat in 2013. Following 2013, Duff & Phelps estimated net sales growth of 2.0% in 2014, and 3.0% thereafter, representing a long-term growth rate for the business. EBITDA margin is expected to increase to 12.2% by 2013, from 10.5% in 2007, as the Company introduces higher-margin product lines and begins to bring additional manufacturing in-house. EBITDA margin is expected to remain at 12.2% for the remainder of the projection period. |
 12 Valuation Analysis Discounted Cash Flow Analysis (continued) Capital expenditures are expected to be $21.6 million in 2008 and $25.1 million in 2009, representing 5.5% and 5.3% of net sales, respectively. Capital expenditures in 2008 and 2009 are higher than historical levels, as the Company completes its new R&D facility and new corporate headquarters, and builds or acquires a new manufacturing facility. Capital expenditures are estimated to return to a normal level of 1.3% of net sales by 2013, and remain at that level for the remainder of the projection period. Working capital investment and the investment in finance contracts receivable and retained interest in sold finance contracts receivable were based on Management’s estimates through 2013. As of June 30, 2008, the Company’s working capital balance exceeded normal levels, and the Company expects to reduce working capital significantly by the end of 2008. Duff & Phelps’ DCF analysis excludes the value of the excess working capital. Duff & Phelps discounted the free cash flows and terminal value using a selected range of the weighted average cost of capital (“WACC”) of 10.75% to 11.75%. Beyond the projection period, we estimated the “continuing value” of the Company by utilizing a commonly accepted perpetuity formula. This continuing value is equivalent to the present value of all cash flows after the projection period. Our “continuing value” calculation is based on a terminal growth rate of 3.0%. |
 13 Discounted Cash Flow Analysis (continued) A summary of our discounted cash flow analysis is shown below: Valuation Analysis Gehl Company Discounted Cash Flow Analysis ($ in thousands) 2007 2008 2009 2010 2011 2012 2013 2014 2015 2016 2017 10-yr CAGR Net sales 457,612 $ 394,012 $ 469,812 $ 558,491 $ 656,496 $ 729,889 $ 731,855 $ 746,492 $ 768,887 $ 791,953 $ 815,712 $ 6.0% Growth -5.9% -13.9% 19.2% 18.9% 17.5% 11.2% 0.3% 2.0% 3.0% 3.0% 3.0% EBITDA 48,186 $ 25,650 $ 36,917 $ 58,446 $ 78,116 $ 92,011 $ 89,186 $ 90,970 $ 93,699 $ 96,510 $ 99,405 $ 7.5% EBITDA Margin 10.5% 6.5% 7.9% 10.5% 11.9% 12.6% 12.2% 12.2% 12.2% 12.2% 12.2% Free Cash Flow 6/08 - 12/08 2009 2010 2011 2012 2013 2014 2015 2016 2017 Earnings Before Interest and Taxes 10,669 $ 27,104 $ 45,791 $ 65,735 $ 80,101 $ 77,873 $ 79,829 $ 82,667 $ 85,535 $ 88,420 $ Pro forma taxes at 39.5% (4,214) (10,706) (18,088) (25,965) (31,640) (30,760) (31,532) (32,653) (33,786) (34,926) Net Operating Profit After Tax 6,455 16,398 27,704 39,770 48,461 47,113 48,297 50,014 51,748 53,494 Depreciation & Amortization 2,356 9,418 11,914 11,301 10,839 10,501 10,266 10,104 10,020 10,000 (Increase) Decrease in Working Capital 43,552 (13,701) (27,572) (30,246) (25,348) (678) (5,065) (7,750) (7,982) (8,222) Investment in Finance Assets 5,286 (13,088) (18,992) (21,557) (17,178) (2,780) (3,264) (4,994) (5,143) (5,298) Capital Expenditures (15,201) (25,108) (8,408) (8,658) (8,908) (9,158) (9,341) (9,621) (9,910) (10,207) Free Cash Flow 42,448 $ (26,081) $ (15,354) $ (9,390) $ 7,866 $ 44,998 $ 40,892 $ 37,753 $ 38,732 $ 39,768 $ Weighted Average Cost of Capital 11.75% 11.25% 10.75% Enterprise Value 1 240,000 $ 260,000 $ 280,000 $ Gehl Performance Implied Enterprise Valuation Multiples LTM EBITDA 33,462 $ 7.2x 7.8x 8.4x Projected 2008 EBITDA 25,650 9.4x 10.1x 10.9x Projected 2009 EBITDA 36,917 6.5x 7.0x 7.6x 5-yr. Avg. EBITDA 36,589 6.6x 7.1x 7.7x LTM Net sales 400,289 0.60x 0.65x 0.70x 1 Enterprise Value reflects an adjustment to exclude approximately $37 million of excess working capital as of June 30, 2008. |
 14 Selected Public Company Analysis Duff & Phelps reviewed the current trading multiples of twelve publicly traded construction and agricultural equipment manufacturers that Duff & Phelps determined to be relevant to its analysis. Duff & Phelps analyzed the historical and projected financial performance (where earnings estimates were available) for each of the publicly traded companies. Duff & Phelps then analyzed the peer group’s trading multiples of enterprise value (“EV”) to their respective historical and projected EBITDA. We selected the following twelve companies: Bell Equipment, Ltd., Cascade Corp., Caterpillar, Inc., CNH Global NV, Deere & Co., Doosan Infracore Co. Ltd., Hitachi Construction Machinery Co. Ltd., Kubota Corp., Manitou BF S.A., Oshkosh Corporation, Terex Corp., and Wacker Construction Equipment, AG. Selected M&A Transaction Analysis Duff & Phelps selected 17 merger and acquisition transactions involving target companies that Duff & Phelps determined to be relevant to its analysis. Duff & Phelps computed the LTM EBITDA and LTM revenue for each of the target companies as of the transaction announcement date (where publicly disclosed). Duff & Phelps then calculated the implied enterprise value for each transaction, and the resulting enterprise value multiples. None of the companies utilized for comparative purposes in the following analysis are, of course, identical to the Company. Accordingly, a complete valuation analysis cannot be limited to a quantitative review of the selected companies and involves complex considerations and judgments concerning differences in financial and operating characteristics of such companies, as well as other factors that could affect their value relative to that of the Company. Valuation Analysis |
 15 Selected Public Company Analysis (continued) Valuation Analysis Gehl Company SELECTED PUBLIC COMPANY ANALYSIS COMPANY INFORMATION Company Name Stock Price as of 9/2/2008 % of 52-Week High LTM Revenue Enterprise Value LTM Revenue Growth LTM EBITDA Growth 3-Yr. EBITDA CAGR 2008 EBITDA Growth 2009 EBITDA Growth LTM EBITDA Margin 3-Yr. Avg. EBITDA Margin 2008 EBITDA Margin 2009 EBITDA Margin EV / LTM EBITDA EV / 2008 EBITDA EV / 2009 EBITDA EV / LTM Revenue Bell Equipment Ltd. $4.12 57.1% $687 $486 31.4% 27.9% 120.6% NA% NA% 13.2% 8.7% NA % NA% 5.3x NAx NAx 0.71x Cascade Corp. 50.69 66.8 572 657 15.3 1.7 16.1 -3.9% 7.4% 16.1 17.6 15.1% 15.7% 7.1 7.1x 6.7x 1.15 Caterpillar Inc. 69.08 81.0 49,006 73,260 14.3 15.6 18.1 1.2 8.4 14.9 15.1 14.3 14.4 10.1 10.8 9.9 1.49 CNH Global NV 37.04 53.8 18,084 19,303 29.8 26.4 18.9 -4.5 9.7 13.8 12.9 11.5 11.5 7.7 8.9 8.2 1.07 Deere & Co. 68.71 72.6 27,177 49,517 17.9 17.8 11.4 35.1 16.1 19.0 17.8 13.9 14.9 9.6 13.2 11.4 1.82 Doosan Infracore Co. Ltd. 1,2 14.33 36.8 3,822 2,681 15.4 21.6 NA% 17.0 8.4 10.2 10.0 12.6 12.0 6.9 5.6 5.1 0.70 Hitachi Construction Machinery Co. Ltd. 23.15 50.6 8,888 6,431 22.5 27.3 36.5 9.9 5.8 14.6 13.5 13.5 13.9 4.9 5.0 4.7 0.72 Kubota Corp. 6.97 77.2 10,539 11,863 0.4 3.5 11.5 -5.4 6.1 14.4 14.3 13.4 14.2 7.8 8.2 7.8 1.13 Manitou BF S.A. 25.77 42.8 1,832 834 11.7 -1.6 13.9 -4.2 -1.9 11.6 12.3 10.4 10.3 3.9 4.1 4.2 0.46 Oshkosh Corporation 16.12 25.8 7,034 4,093 13.4 NM% NM% -1.0 -3.4 11.2 8.9 10.1 9.8 5.2 5.8 6.0 0.58 Terex Corp. 49.54 55.0 10,081 5,628 21.6 29.6 52.0 19.8 4.3 11.8 9.6 11.7 11.9 4.7 4.5 4.3 0.56 Wacker Construction Equipment AG 2 10.87 31.4 1,614 842 10.9 10.3 NM% -39.6 -3.5 NM% 15.5 11.0 11.0 NMx 6.1 6.3 NMx Mean 54.2% $11,611 $14,633 17.0% 16.4% 33.2% 2.2% 5.2% 13.7% 13.0% 12.5% 12.7% 6.7x 7.2x 6.8x 0.94x Median 54.4% $7,961 $4,861 15.3% 17.8% 18.1% -1.0% 6.1% 13.8% 13.2% 12.6% 12.0% 6.9x 6.1x 6.3x 0.72x Gehl Company $15.03 60.6% $400 $255 -15.8% -32.0% 22.2% -46.8% 43.9% 8.4% 10.2% 6.5% 7.9% 7.6x 10.0x 6.9x 0.64x Gehl Company - Analyst Projections -41.9% 15.0% 7.1% 7.8% 9.1x 7.9x 1 LTM Sales, EBITDA, Debt,and Shareholder's Equity reflect June 30, 2008 balances,while cash and investment balances reflect December 31, 2007. 2 LTM Revenue and EBITDA growth is based on FYE 2007 data. $ in USD millions except per share data. LTM = Latest Twelve Months. EBITDA = Earnings Before Interest, Taxes, Depreciation and Amortization Source: Bloomberg, Capital IQ, SEC filings. MARKET / FINANCIAL DATA GROWTH ANALYSIS MARGIN ANALYSIS VALUATION MULTIPLES 2 |
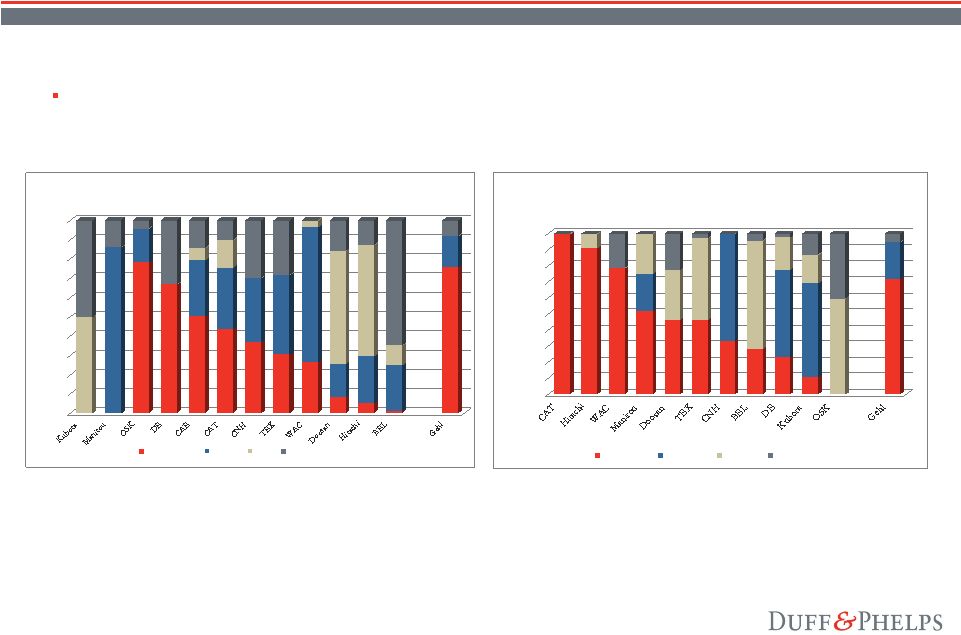 16 Selected Public Company Analysis (continued) – Comparison of Geographic Markets Served and End-User Markets Served Gehl is generally less geographically diverse, and similarly diverse in terms of end-user markets, relative to the selected public companies. Valuation Analysis Notes: 1 Percentages were calculated before financing revenue. 2 Gehl “International” revenue classified as “Construction.” 3 Caterpillar “Machinery” and “Engines” revenue classified as “Construction.” 4 Doosan “Machine Tools and Engines” revenue classified as “Industrial.” 0% 10% 20% 30% 40% 50% 60% 70% 80% 90% 100% Selected Public Company Geographic Diversity - by Revenue North America Europe Asia Other 0% 10% 20% 30% 40% 50% 60% 70% 80% 90% 100% Selected Public Company End-User Markets - by Revenue Construction Agricultural Industrial Other |
 17 Selected Public Company Analysis (continued) The following observations were made concerning the financial comparisons of Gehl to the selected public companies in our selection of valuation multiples: – Size – As measured by revenues, Gehl is smaller than all of the selected public companies. Generally, smaller companies have higher required rates of return than larger companies which, all else equal, results in lower valuation multiples. – Growth – While Gehl’s LTM revenues have declined, revenue for most of the selected public companies grew in the LTM period. Gehl is projecting a decline in revenue in 2008, while most of the selected public companies are expecting to grow revenues. However, over a three-fiscal-year period, Gehl’s EBITDA growth is similar to the EBITDA growth of the selected public companies. In addition, Gehl is projecting higher EBITDA growth than the selected public companies in 2009. – Profitability – Gehl is less profitable than the selected public companies, as measured by EBITDA margin. Typically, companies that are more profitable have higher revenue multiples. – Gehl’s business is less diversified geographically than the most of the selected public companies, but similarly diverse relative to most of the selected public companies in terms of its end-user markets. The previously discussed factors led Duff & Phelps to select EV / LTM EBITDA multiples and EV / Projected EBITDA multiples that were near the medians of the selected public companies, and EV / revenue multiples that were below the median of the selected public companies. Valuation Analysis |
 18 Selected M&A Transaction Analysis Valuation Analysis GehlCompany Selected M&A Transaction Analysis (in millions of reported currency) Date Announced Acquirer Name Target Business Description Target Name Enterprise Value LTM Revenue LTM EBITDA LTM EBITDA Growth 1 Year Projected EBITDA Growth¹ Target EBITDA Margin LTM Revenue LTM EBITDA 1 Year Projected EBITDA 1 07/22/08 Segulah Advisor AB Engages in the development, manufacture, and marketing of chain and lifting components. Gunnebo Industrier AB SEK 2,338.8 SEK 2,140.6 SEK 278.4 5.7% 4.5% 13.0% 1.09x 8.4x 8.1x 01/13/08 Terex Corp. Engages in the design, manufacture, and sale of rubber track machines and related accessories. A.S.V. Inc. $452.8 $199.9 $18.9 -56.8% NM 9.5% 2.27x 24.0x 19.6x 07/29/07 Doosan Infracore Co. Ltd. Provides compact construction equipment and attachments. Bobcat Company $4,900.0 $2,600.0 NA NA NA NA 1.88x NA NA 07/27/07 Volvo Construction Equipment Corporation Manufactures asphalt paving equipment, compaction equipment, and construction-related material handling equipment. Ingersoll-Rand Co., Ltd., Road Development Division $1,300.0 $864.0 NA NA NA NA 1.50x NA NA 07/24/07 OAO Rostselmash Engages in the design, manufacture, and distribution of agricultural equipment. Buhler Industries Inc. CAD 218.2 CAD 159.6 CAD 17.3 -28.5% -21.1% 10.8% 1.37x 12.6x 11.9x 05/15/07 H&E Equipment Services Inc. Sells construction equipment such as wheel loaders, excavators, dozers, and handlers. J.W. Burress, Inc. $122.0 $169.4 $29.7 NA NA 17.6% 0.72x 4.1x NA 03/30/07 Wacker Construction Equipment AG Engages in the development, manufacture, and marketing of compact construction machines in Europe. Neuson Kramer Baumaschinen AG € 627.6 € 260.0 NA NA NA NA 2.41x NA NA 02/05/07 Atlas Copco Group Manufactures and supplies compaction and paving equipment. Dynapac AB SEK 6,300.0 SEK 4,600.0 NA NA NA NA 1.37x NA NA 12/21/06 Odyssey Investment Partners, LLC Designs, develops, manufactures, assembles, markets, and distributes waste handling equipment in North America. Wastequip, Inc. $616.0 $400.0 NA NA NA NA 1.54x NA NA 11/05/06 Goldman Sachs Group & KKR Manufactures and sells material handling products. Kion Group GmbH € 4,000.0 € 3,627.0 NA NA NA NA 1.10x NA NA 10/19/06 Manitex International, Inc. Designs and manufactures rough terrain forklifts and other material handling equipment. Liftking Industries, Inc. CAD 10.8 CAD 20.5 NA NA NA NA 0.53x NA NA 10/15/06 Oshkosh Corporation Engages in the design, manufacture, and sale of aerial work platforms, telehandlers, and trailers. JLG Industries Inc. $2,963.9 $2,289.4 $277.0 85.7% 30.7% 12.1% 1.29x 10.7x 8.2x 09/27/06 Volvo Construction Equipment Corporation Manufactures wheel loaders, excavators, road rollers, backhoe loaders, and pumps. Shandong Lingong Construction Machinery Co., Ltd. $59.2 $253.1 NA NA NA NA 0.23x NA NA 07/27/06 KBC Private Equity NV Manufactures heavy-duty off and on road vehicles. TATRA, a.s. CZK 726.6 CZK 1,800.0 NA NA NA NA 0.40x NA NA 02/17/06 Cardo AB Develops, manufactures, and supplies loading and unloading solutions. Grupo Combursa SEK 320.0 SEK 275.0 NA NA NA NA 1.16x NA NA 02/14/06 Lavendon Group Plc Offers boom lifts, scissor lifts, truck mounts, and underbridge equipment for sale, as well as for hire. Panther Work Platforms Limited £20.4 £8.7 NA NA NA NA 2.34x NA NA 06/27/05 Sentinel Capital Partners, L.L.C. Engages in engineering, manufacturing, and selling heavy equipment for the logging industry. Madill Equipment CAD 80.0 CAD 62.4 NA NA NA NA 0.78x NA NA Mean 1.5% 4.7% 12.6% 1.29x 12.0x 12.0x Median -11.4% 4.5% 12.1% 1.29x 10.7x 10.1x 1 Projections are provided by Reuters Estimates at the announcement date of the transaction. Sources: Capital IQ, Bloomberg LP and Company Filings Transaction Details Financial Performance Enterprise Value Multiples |
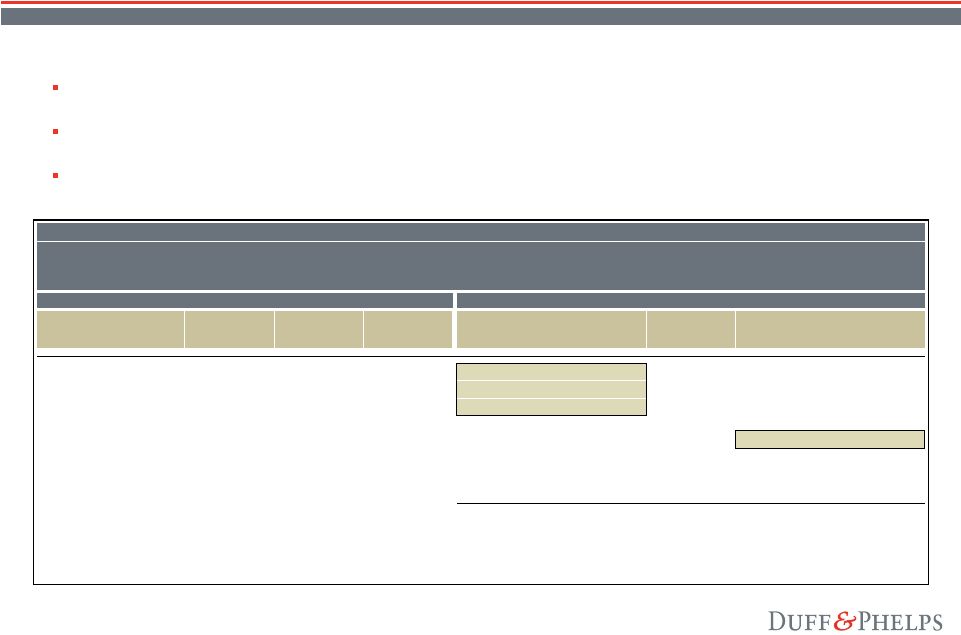 19 Selected Public Company / M&A Transaction Analysis Summary We performed our valuation analysis using the selected public companies and the selected M&A transactions under the “fair value” standard set forth on page 5 of this presentation. In selecting valuation multiples for the Company, we took into consideration a variety of factors, as previously discussed, including: size, profitability, growth and business model. In our selection of multiples, we also took into consideration (i) that public company stock prices reflect minority interest values, and (ii) that M&A Transaction prices may include additional premiums for synergies and other factors specific to each transaction. Valuation Analysis Gehl Company Selected Public Company / M&A Transaction Analysis Summary As of September 7, 2008 ($ in thousands) Enterprise Valuation Multiples Valuation Summary Metric Public Company Range Public Company Median Transaction Median Selected Multiple Range Gehl Performance Enterprise Value Range LTM EBITDA 3.9x - 10.1x 6.9x 10.7x 7.0x - 8.0x $33,462 $234,000 - $268,000 2009 Projected EBITDA 4.2x - 11.4x 6.3x NA 6.5x - 7.5x $36,917 $240,000 - $277,000 LTM Net sales 0.46x - 1.82x 0.72x 1.29x 0.55x - 0.65x $400,289 $220,000 - $260,000 Estimated Enterprise Value $230,000 - $270,000 Gehl Implied Enterprise Performance Measure Performance Valuation Multiple LTM EBITDA $33,462 6.9x 8.1x 2008 Projected EBITDA 25,650 9.0x 10.5x 2009 Projected EBITDA 36,917 6.2x 7.3x LTM Net sales 400,289 0.57x 0.67x |
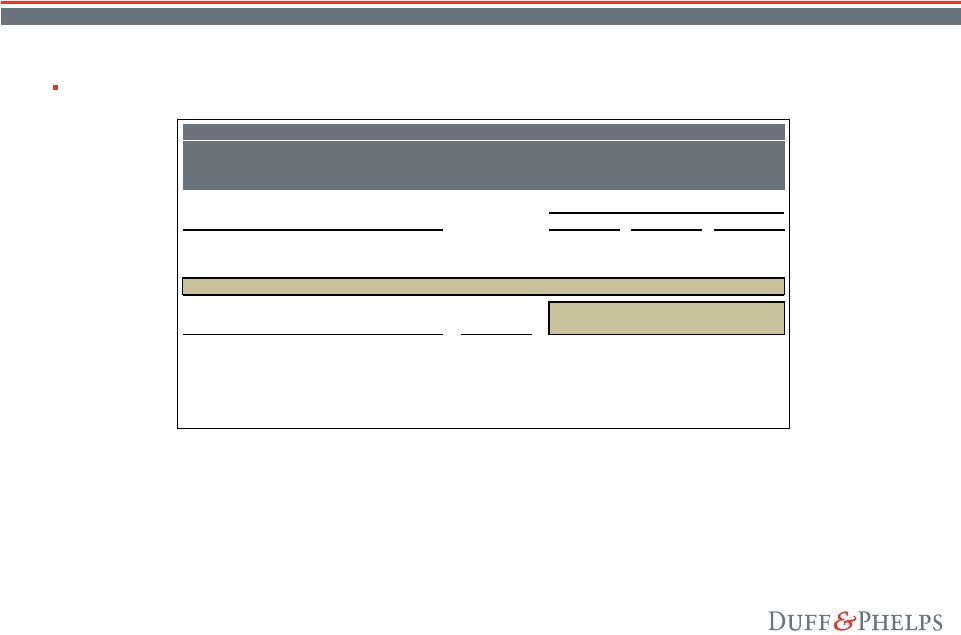 20 Enterprise Value As shown in the table below, Duff & Phelps calculated an enterprise value for the Company between $235 million and $275 million. Valuation Analysis Gehl Company Enterprise Valuation Summary As of September 7, 2008 ($ in thousands) Enterprise Value Conclusions Methodologies Low Mid High Discounted Cash Flow Analysis 240,000 $ 260,000 $ 280,000 $ Selected Public Company / M&A Transaction Analysis 230,000 250,000 270,000 Enterprise Value 235,000 $ 255,000 $ 275,000 $ Gehl Implied Enterprise Performance Measure Performance Valuation Multiples LTM EBITDA 33,462 $ 7.0x 7.6x 8.2x 2008 Projected EBITDA (Management estimate) 25,650 9.2x 9.9x 10.7x 2009 Projected EBITDA (Management estimate) 36,917 6.4x 6.9x 7.4x 2009 Projected EBITDA (Analyst conensus) 32,200 7.3x 7.9x 8.5x LTM Net sales 400,289 0.59x 0.64x 0.69x 1 Represents consensus equity analyst estimate, as provided by Reuters. 1 |
 III. Conclusion |
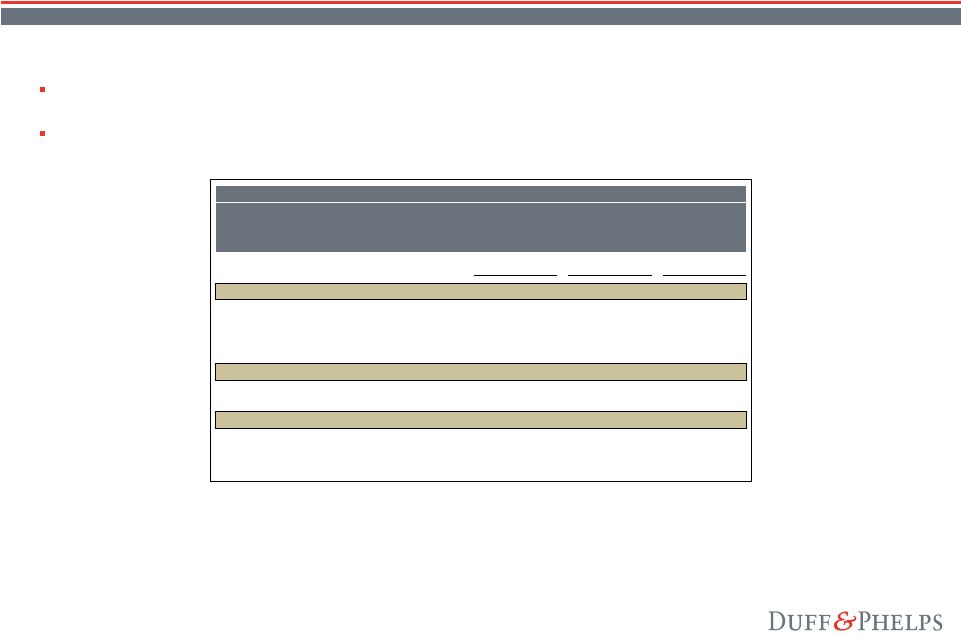 22 Equity Value We concluded an enterprise value range of $235 million to $275 million, and calculated a fair value per common share ranging from $16.05 to $19.20, with a mid-point of $17.65. Based upon and subject to the foregoing, Duff & Phelps is of the opinion that, as of the date hereof, the fair value of the common stock of the Company is $17.65 per share. Conclusion Gehl Company Equity Valuation Summary As of September 7, 2008 ($ in thousands, except per share amounts) Low Mid High Enterprise Value 235,000 $ 255,000 $ 275,000 $ Less: Debt (77,855) (77,855) (77,855) Plus: Cash 4,984 4,984 4,984 Plus: Excess working capital 2 37,000 37,000 37,000 Aggregate Equity Value 199,129 $ 219,129 $ 239,129 $ Less: After-tax cost of management options 3 (4,087) (5,127) (6,241) Equity Value 195,042 $ 214,002 $ 232,888 $ Common Shares Outstanding 12,136 12,136 12,136 Fair value per common share (rounded) 16.05 $ 17.65 $ 19.20 $ 1 Balance as of June 30, 2008. 2 Working capital balance as of June 30, 2008 in excess of normalized level of working capital. 3 After-tax dilution impact of 985,252 options and SARS outstanding determined using a Black-Scholes option-pricing model. 1 1 |