UNITED STATES
SECURITIES AND EXCHANGE COMMISSION
Washington, D.C. 20549
FORM N-CSR
CERTIFIED SHAREHOLDER REPORT OF REGISTERED
MANAGEMENT INVESTMENT COMPANIES
Investment Company Act file number 811- 5979
John Hancock California Tax-Free Income Fund
(Exact name of registrant as specified in charter)
601 Congress Street, Boston, Massachusetts 02210
(Address of principal executive offices) (Zip code)
Alfred P. Ouellette
Senior Attorney and Assistant Secretary
601 Congress Street
Boston, Massachusetts 02210
(Name and address of agent for service)
Registrant's telephone number, including area code: 617-663-4324
| Date of fiscal year end: | August 31 |
| | |
| Date of reporting period: | February 28, 2006 |
ITEM 1. REPORT TO SHAREHOLDERS.

| Table of contents |
|
| Your fund at a glance |
| page 1 |
|
| Managers’ report |
| page 2 |
|
| A look at performance |
| page 6 |
|
| Growth of $10,000 |
| page 7 |
|
| Your expenses |
| page 8 |
|
| Fund’s investments |
| page 10 |
|
| Financial statements |
| page 18 |
|
| For more information |
| page 33 |
|
To Our Shareholders,
The mutual fund industry has seen enormous growth over the last several decades. A good half of all American households are now invested in at least one mutual fund and the industry has grown to more than $8 trillion invested in some 7,000–8,000 mutual funds. With this growth, investors and their financial professionals have had access to an increasing array of investment choices — and greater challenges as they try to find the best-performing funds to fit their investment objectives.
Morningstar, Inc., a major independent analyst of the mutual fund industry, has provided investors and their advisors with an important evaluation tool since 1985, when it launched its “star” rating. Based on certain measurements, the Morningstar Rating for funds reflects each fund’s risk-adjusted return compared to a peer group, designating the results with a certain number of stars, from five stars for the best down to one star. The star ranking system has become the gold standard, with 4- and 5-star funds accounting for the bulk of fund sales.
As good, and important, as this ranking measurement has been, we have long taken issue with part of the process that adjusts performance on broker-sold Class A shares for “loads” — or up-front commissions. We have argued that this often does not accurately reflect an A-share investor’s experience, since they increasingly are purchasing A shares in retirement plans and fee-based platforms that waive the up-front fee.
We are pleased to report that Morningstar has acknowledged this trend and has added a new rating for Class A shares on a no-load basis, called the “Load-Waived A Share” rating, that captures the experience of an investor who is not paying a front-end load. This new rating will better assist our plan sponsors, 401(k) plan participants and clients of financial professionals who invest via fee-based platforms or commit to invest more than a certain dollar amount, in evaluating their choice of mutual funds.
Since being implemented in early December 2005, the impact on our funds has been terrific. Under the new load-waived rating, 11 of our 43 open-end retail mutual funds now have 4- or 5-star rankings on their load-waived A shares, as of February 28, 2006.
We commend Morningstar for its move and urge our shareholders to consider this another tool at your disposal as you and your financial professional are evaluating investment choices.
Sincerely,

Keith F. Hartstein,
President and Chief Executive Officer
|
This commentary reflects the CEO’s views as of February 28, 2006. They are subject to change at any time.
YOUR FUND
AT A GLANCE
The Fund seeks a
high level of current
income, consistent
with preservation of
capital, that is
exempt from federal
and California per-
sonal income taxes.
In pursuing this
goal, the fund nor-
mally invests at least
80% of its assets in
securities of any
maturity exempt
from federal and
California personal
income tax.
|
| | Over the last six months |
| |
| * | Municipal bonds posted modest gains and outpaced the broad |
| | taxable bond market. |
| |
| * | The Fund’s performance surpassed the returns of its benchmark index |
| | and peer group average. |
| |
| * | Top-performing sectors included special tax, education and health |
| | care bonds. |

Total returns for the Fund are at net asset value with all distributions reinvested. These returns do not reflect the deduction of the maximum sales charge, which would reduce the performance shown above.
| Top 10 holdings |
4.5% | Foothill/Eastern Transportation Corridor Agency, 1-1-34, 6.00% |
| 3.7% | Santa Ana Financing Auth, 7-1-24, 6.250% |
| 3.7% | Sacramento Power Auth, 7-1-22, 6.000% |
| 2.9% | San Bernardino, County of, 8-1-17, 5.500% |
| 2.7% | Puerto Rico Aqueduct & Sewer Auth, 7-1-11, 8.095% |
| 2.2% | California, State of, 3-1-16, 7.338% |
| 2.1% | Puerto Rico, Commonwealth of, 7-1-15, 6.500% |
| 1.9% | Santa Clara County Financing Auth, 5-15-17, 5.500% |
| 1.8% | California, State of, 4-1-29, 4.750% |
| 1.8% | New Haven Unified School District, 8-1-22, Zero |
As a percentage of net assets on February 28, 2006. |
1
BY DIANNE SALES, CFA, AND FRANK A. LUCIBELLA, PORTFOLIO MANAGERS,
SOVEREIGN ASSET MANAGEMENT LLC
|
JOHN HANCOCK
California Tax-Free
Income Fund
|
Municipal bonds edged higher during the six months ended February 28, 2006, and outperformed taxable bonds. The Lehman Brothers Municipal Bond Index returned 0.99%, while the Lehman Brothers U.S. Aggregate Index — a broad measure of the taxable bond market — returned –0.11% ..
The bond market’s muted performance reflected the resiliency of the U.S. economy, which grew at a healthy rate despite the dampening impact of higher energy prices and the devastating 2005 hurricane season. To keep the economy on an even keel, the Federal Reserve extended its series of short-term interest rate increases, raising the federal funds rate four times during the six-month period (for a total of 14 rate hikes since June 2004). By the end of the period, the federal funds rate stood at 4.5%, its highest level in nearly five years. Short-term municipal bond yields rose along with the federal funds rate, though to a lesser degree, while longer-term municipal yields held steady as inflation remained benign.
“Municipal bonds edged higher
during the six months ended
February 28, 2006, and
outperformed taxable bonds.”
|
Demand for yield continued to drive performance in the municipal bond market. Investors seeking the highest yields available flocked to lower-rated issues, which outperformed higher-quality bonds during the six-month period. Consequently, the yields of high-quality and lower-quality bonds converged further, nearing historically narrow levels.
Credit quality in California continued to improve thanks to the persistent strength of the economy. Better-than-expected revenue growth allowed the state to rebuild financial reserves and pay off outstanding debt earlier than anticipated. The state aggressively pursued bond buybacks and refinancing to lower its debt load

and restore financial flexibility. Although it still faces future budget challenges, California has outperformed market expectations. Improved fiscal health at the state level led to similar improvements at the local level as the state began to repay the funds borrowed from both local governments and the state educational system during the last downturn. Taken together, these steps translate into more solidly positioned credits across California.
Fund performance
For the six months ended February 28, 2006, John Hancock California Tax-Free Income Fund’s Class A, Class B and Class C shares posted total returns of 1.13%, 0.70% and 0.70%, respectively, at net asset value. This performance outpaced the 0.98% average return of Morningstar’s Muni California Long fund category1 and the 0.99% return of the Lehman Brothers Municipal Bond Index. Keep in mind that your net asset value return will be different from the Fund’s performance if you were not invested in the Fund for the entire period and did not reinvest all distributions. See pages six and seven for historical performance information.
Individual security selection remained a key contributing factor to the Fund’s performance. Our emphasis on thorough credit research helped us build a portfolio of bonds with an attractive balance of credit quality, yield and total return potential.
“Reflecting the strong demand
for yield, the portfolio's best
performers were lower-rated
revenue bonds with relatively
high yields...”
|
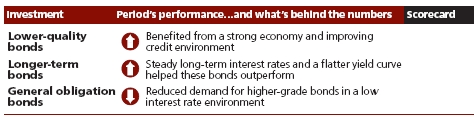
Lower-quality bonds produced best returns
Reflecting the strong demand for yield, the portfolio’s best performers were lower-rated revenue bonds with relatively high yields, which outperformed as the yield spreads between higher- and lower-quality bonds narrowed. Non-rated bonds were the stars in the period, followed closely by bonds rated BBB and BB. Although the tighter yield spreads were favorable for performance, they also presented reinvestment challenges in the current low-yield environment. We had to be very opportunistic in identifying undervalued investment opportunities with the necessary credit characteristics and performance potential.
3
| Sector | |
| distribution2 | |
|
| General | |
| obligation | 16% |
|
| Revenue bonds |
|
| Transportation | 15% |
|
| Special tax | 9% |
|
| Correctional | |
| facilities | 8% |
|
| Health | 7% |
|
| Water & sewer | 6% |
|
| Tobacco | 6% |
|
| Electric | 5% |
|
| Education | 5% |
|
| Tax allocation | 5% |
|
| Leasing | |
| contracts | 4% |
|
| Other revenue | 4% |
|
| Pollution | 2% |
|
| Housing | 2% |
|
| Economic | |
| development | 2% |
|
| All others | 3% |
Looking at sector performance, special tax bonds posted the best results as continued economic strength bolstered real estate demand. However, the Fed’s continued rate hikes increased our selectivity in this area. Higher short-term rates translate into higher mortgage rates, which can have a negative impact on the housing market. Our heightened focus on demographics and local employment growth should stand us in good stead going forward.
Education bonds also performed well, reflecting the improved funding environment at the state level and steady student demand. Other leading sectors included health care and tax allocation bonds, which benefited from the robust economy and improving credit quality.
GOs, essential services lagged
Higher-quality bonds — such as general obligation (GO) bonds and securities backed by revenues from essential services like water and sewer — trailed the broader municipal bond market, though returns were generally positive. After several years of solid gains that reflected the state’s credit-rating recuperation, California GO bonds produced subdued returns over the past six months. Essential service bonds also underperformed as their broadly stable revenue bases are not as sensitive to economic activity.

Outlook
The U.S. economy has held up well despite higher short-term interest rates, rising energy prices and catastrophic hurricanes. In fact, rebuilding in hurricane-damaged areas may provide an additional boost to economic growth in the coming months.
4
Current expectations suggest that the Fed is likely to raise short-term interest rates at least one or two more times in the next few months. What occurs after mid-year, however, is less clear — evidence of slowing economic activity could convince the Fed to adopt a “wait-and-see” approach during the second half of the year.
“In the municipal bond market,
issuance is expected to be down
substantially from record levels
in 2005.”
|
In the municipal bond market, issuance is expected to be down substantially from record levels in 2005. Overall estimates are for a 20%-30% decline in 2006, and California should be in line with these expectations; issuance in the first two months of 2006 was down 27% from the previous year. Although reduced issuance bodes well for market performance, we expect to see pockets of oversupply that will provide opportunities for us to pick our spots. Given the tight yield spreads between higher- and lower-quality bonds, we have adopted a more conservative approach to credit analysis because there is little reward for taking on additional credit risk.This commentary reflects the views of the portfolio managers through the end of the Fund’s period discussed in this report. The managers’ statements reflect their own opinions. As such, they are in no way guarantees of future events and are not intended to be used as investment advice or a recommendation regarding any specific security. They are also subject to change at any time as market and other conditions warrant.
1 Figures from Morningstar, Inc. include reinvested dividends and do not take into account sales charges. Actual load-adjusted performance is lower.
2 As a percentage of net assets on February 28, 2006.
5
A LOOK AT
PERFORMANCE
For the period ended
February 28, 2006
|
| | | Class A | Class B | Class C |
| Inception date | | 12-29-89 | 12-31-91 | 4-1-99 |
|
| Average annual returns with maximum sales charge (POP) | |
| One year | | –0.42% | –1.57% | 2.41% |
|
| Five years | | 3.98 | 3.73 | 4.05 |
|
| Ten years | | 5.02 | 4.85 | — |
|
| Since inception | | — | — | 3.82 |
|
| Cumulative total returns with maximum sales charge (POP) | |
| Six months | | –3.40 | –4.24 | –0.28 |
|
| One year | | –0.42 | –1.57 | 2.41 |
|
| Five years | | 21.56 | 20.07 | 21.97 |
|
| Ten years | | 63.16 | 60.61 | — |
|
| Since inception | | — | — | 29.61 |
|
| SEC 30-day yield as of February 28, 2006 | | |
| | | 4.00 | 3.34 | 3.34 |
|
Performance figures assume all distributions are reinvested. Returns with maximum sales charge reflect a sales charge on Class A shares of 4.5%, and the applicable contingent deferred sales charge (CDSC) on Class B and Class C shares. The returns for Class C shares have been adjusted to reflect the elimination of the front-end sales charge effective July 15, 2004. The Class B shares’ CDSC declines annually between years 1–6 according to the following schedule: 5, 4, 3, 3, 2, 1%. No sales charge will be assessed after the sixth year. Class C shares held for less than one year are subject to a 1% CDSC.
The returns reflect past results and should not be considered indicative of future performance. The return and principal value of an investment will fluctuate so that shares, when redeemed, may be worth more or less than their original cost. Due to market volatility, the Fund’s current performance may be higher or lower than the performance shown. For performance data current to the most recent month-end, please call 1-800-225-5291 or visit the Fund’s Web site at www.jhfunds.com.
The performance table above and the chart on the next page do not reflect the deduction of taxes that a shareholder would pay on fund distributions or the redemption of fund shares. Please note that a portion of the Fund’s income may be subject to taxes, and some investors may be subject to the Alternative Minimum Tax (AMT). Also note that capital gains are taxable.
The Fund’s performance results reflect any applicable expense reductions, without which the expenses would increase and results would have been less favorable.
6
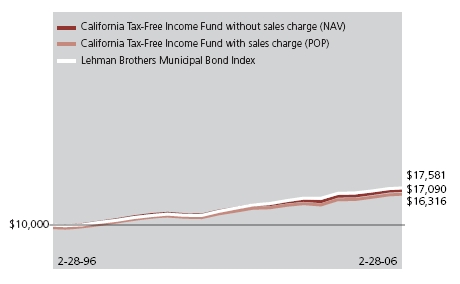
This chart shows what happened to a hypothetical $10,000 investment in Class A shares for the period indicated. For comparison, we’ve shown the same investment in the Lehman Brothers Municipal Bond Index.
| | Class B1 | Class C1 |
| Period beginning | 2-28-96 | 4-1-99 |
|
| California Tax-Free Income Fund | $16,061 | $12,961 |
|
| Index | 17,581 | 14,364 |
|
Assuming all distributions were reinvested for the period indicated, the table above shows the value of a $10,000 investment in the Fund’s Class B and Class C shares, respectively, as of February 28, 2006. The Class C shares investment with maximum sales charge has been adjusted to reflect the elimination of the front-end sales charge effective July 15, 2004. Performance of the classes will vary based on the difference in sales charges paid by shareholders investing in the different classes and the fee structure of those classes.
Lehman Brothers Municipal Bond Index is an unmanaged index that includes municipal bonds and is commonly used as a measure of bond performance. It is not possible to invest directly in an index. Index figures do not reflect sales charges and would be lower if they did.
1 No contingent deferred sales charge applicable.
7
These examples are intended to help you understand your ongoing
operating expenses.
Understanding fund expenses
As a shareholder of the Fund, you incur two types of costs:| * Transaction costs which include sales charges (loads) on |
| purchases or redemptions (varies by share class), minimum |
| account fee charge, etc. |
* Ongoing operating expenses including management |
| fees, distribution and service fees (if applicable) and other |
| fund expenses. |
We are going to present only your ongoing operating expenses here.
Actual expenses/actual returns
This example is intended to provide information about your fund’s actual ongoing operating expenses, and is based on your fund’s actual return. It assumes an account value of $1,000.00 on August 31, 2005, with the same investment held until February 28, 2006.
| Account value | | Expenses paid |
| $1,000.00 | Ending value | during period |
| on 8-31-05 | on 2-28-06 | ended 2-28-061 |
|
| Class A | $1,011.30 | $4.22 |
| Class B | 1,007.00 | 8.43 |
| Class C | 1,007.00 | 8.43 |
Together with the value of your account, you may use this information to estimate the operating expenses that you paid over the period. Simply divide your account value at February 28, 2006 by $1,000.00, then multiply it by the “expenses paid” for your share class from the table above. For example, for an account value of $8,600.00, the operating expenses should be calculated as follows:
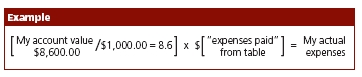
8
Hypothetical example for comparison purposes
This table allows you to compare your fund’s ongoing operating expenses with those of any other fund. It provides an example of the Fund’s hypothetical account values and hypothetical expenses based on each class’s actual expense ratio and an assumed 5% annual return before expenses (which is not your fund’s actual return). It assumes an account value of $1,000.00 on August 31, 2005, with the same investment held until February 28, 2006. Look in any other fund shareholder report to find its hypothetical example and you will be able to compare these expenses.
| Account value | | Expenses paid |
| $1,000.00 | Ending value | during period |
| on 8-31-05 | on 2-28-06 | ended 2-28-061 |
|
| Class A | $1,020.60 | $4.24 |
| Class B | 1,016.40 | 8.47 |
| Class C | 1,016.40 | 8.47 |
Remember, these examples do not include any transaction costs, such as sales charges; therefore, these examples will not help you to determine the relative total costs of owning different funds. If transaction costs were included, your expenses would have been higher. See the prospectus for details regarding transaction costs.
1 Expenses are equal to the Fund’s annualized expense ratio of 0.85%, 1.70% and 1.70% for Class A, Class B and Class C, respectively, multiplied by the average account value over the period, multiplied by number of days in most recent fiscal half-year/365 or 366 (to reflect the one-half year period).
9
F I N A N C I A L S TAT E M E N T S
FUND’S
INVESTMENTS
Securities owned
by the Fund on
February 28, 2006
(unaudited)
|
This schedule is divided into two main categories: tax-exempt long-term bonds and short-term investments. Tax-exempt long-term bonds are broken down by state or territory. Under each state or territory is a list of securities owned by the Fund. Short-term investments, which represent the Fund’s cash position, are listed last.
| | Interest | Maturity | Credit | Par value | |
| State, issuer, description | rate | date | rating (A) | (000) | Value |
|
| |
| Tax-exempt long-term bonds 98.55% | | | | | $331,402,575 |
| |
| (Cost $302,794,404) | | | | | |
| California 87.75% | | | | | 295,082,622 |
|
| ABAG Finance Authority for Nonprofit Corps, | | | | |
| Rev Cert of Part Nat’l Ctr for Int’l | | | | | |
| Schools Proj (G) | 7.375% | 05-01-18 | BB+ | $4,300 | 4,407,629 |
| Rev San Diego Hosp Assn Ser 2001A | 6.125 | 08-15-20 | BBB+ | 2,000 | 2,174,000 |
|
| Anaheim Public Financing Auth, | | | | | |
| Rev Lease Cap Apprec Sub Pub Imp Proj | | | | | |
| Ser 1997C | Zero | 09-01-18 | AAA | 3,000 | 1,760,940 |
|
| Anaheim, City of, | | | | | |
| Rev Ref Cert of Part Reg | | | | | |
| Convention Ctr (P) | 9.420 | 07-16-23 | AAA | 2,000 | 2,231,200 |
|
| Antioch Public Financing Auth, | | | | | |
| Rev Ref Reassessment Sub Ser 1998B (G) | 5.850 | 09-02-15 | BB+ | 1,375 | 1,445,785 |
|
| Belmont Community Facilities District, | | | | | |
| Rev Spec Tax Dist No. 2000 1 library | | | | | |
| Proj Ser 2004A | 5.750 | 08-01-24 | Aaa | 1,000 | 1,201,740 |
|
| California County Tobacco | | | | | |
| Securitization Agency, | | | | | |
| Rev Asset Backed Bond Fresno County | | | | | |
| Fdg Corp | 6.000 | 06-01-35 | BBB | 1,765 | 1,849,226 |
| Rev Asset Backed Bond Kern County | | | | | |
| Corp Ser 2002A | 6.125 | 06-01-43 | BBB | 5,000 | 5,272,550 |
| Rev Asset Backed Bond Los Angeles | | | | | |
| County (Step Coupon 5.250%, | | | | | |
| 12-01-10) (O) | Zero | 06-01-21 | Baa3 | 5,000 | 3,950,950 |
| Rev Asset Backed Bond Stanislaus Fdg | | | | | |
| Ser 2002A | 5.500 | 06-01-33 | Baa3 | 1,000 | 1,024,340 |
|
| California Department of Water Resources, | | | | | |
| Rev Pwr Supply Ser 2002A | 5.375 | 05-01-21 | A– | 4,000 | 4,428,200 |
See notes to
financial statements.
|
10
F I N A N C I A L S TAT E M E N T S
| | Interest | Maturity | Credit | Par value | |
| State, issuer, description | rate | date | rating (A) | (000) | Value |
| California (continued) | | | | | |
|
| California Educational Facilities Auth, | | | | | |
| Rev Ref Pooled College & Univ Financing | | | | | |
| Ser 1993B | 6.125% | 06-01-09 | Baa2 | $20 | $20,017 |
| Rev Ref Woodbury Univ | 5.000 | 01-01-30 | BBB– | 2,000 | 2,018,360 |
| Rev Univ of San Diego Ser 2002A | 5.500 | 10-01-32 | A2 | 1,435 | 1,541,219 |
|
| California Health Facilities Financing Auth, | | | | | |
| Rev Catholic Healthcare West | | | | | |
| Ser 2004G | 5.250 | 07-01-23 | A– | 1,000 | 1,058,750 |
| Rev Ref Catholic Healthcare Ser 1995A | 5.750 | 07-01-15 | AAA | 245 | 250,346 |
| Rev Ref Cedars Sinai Med Ctr | 5.000 | 11-15-34 | A3 | 2,000 | 2,041,520 |
| Rev Ref Insd Hlth Facil-Small Facil | | | | | |
| Ser 1994B | 7.500 | 04-01-22 | A | 550 | 562,743 |
|
| California Infrastructure & Economic | | | | | |
| Development Bank , | | | | | |
| Rev J David Gladstone Inst Proj | 5.250 | 10-01-34 | A– | 1,000 | 1,032,710 |
| Rev Kaiser Hosp Asst I LLC Ser 2001A | 5.550 | 08-01-31 | A+ | 3,000 | 3,192,180 |
|
| California Pollution Control Financing Auth, | | | | | |
| Rev Poll Control Pacific Gas & Electric | | | | | |
| Ser 1996A | 5.350 | 12-01-16 | AAA | 1,000 | 1,071,230 |
| Rev Poll Control Southern Calif Edison Co | | | | | |
| Ser 1985A | 2.000 | 03-01-08 | BBB+ | 1,500 | 1,499,790 |
| Rev Solid Waste Disposal Keller Canyon | | | | | |
| Landfill Co Proj | 6.875 | 11-01-27 | BB– | 2,000 | 2,006,560 |
| Rev Chemical Waste Mgmt Inc Proj | | | | | |
| Ser 2005C | 5.125 | 11-01-23 | BBB | 2,000 | 2,063,400 |
|
| California Rural Home Mortgage Finance Auth, | | | | |
| Rev Single Family Mtg Backed Sec’s Prog | | | | | |
| Ser 1996A | 7.750 | 05-01-27 | AAA | 10 | 10,055 |
| Rev Single Family Mtg Backed Sec’s Prog | | | | | |
| Ser 1996A | 7.550 | 11-01-26 | AAA | 15 | 15,078 |
|
| California State Economic Recovery Auth, | | | | | |
| Gen Oblig Unltd Ser 2004B | 5.000 | 07-01-23 | AA– | 2,000 | 2,068,620 |
|
| California State Public Works Board, | | | | | |
| Rev Lease Dept of Corrections Ser 2003C | 5.500 | 06-01-18 | A– | 5,000 | 5,537,850 |
| Rev Ref Lease Dept of Corrections State | | | | | |
| Prisons Ser 1993A | 5.000 | 12-01-19 | AAA | 5,000 | 5,404,600 |
| Rev Ref Lease Various Univ of Calif Projs | | | | | |
| Ser 1993A | 5.500 | 06-01-21 | AA– | 1,250 | 1,251,187 |
|
| California Statewide Communities | | | | | |
| Develop Auth, | | | | | |
| Rev Ref Cert of Part Univ Corp Calif | | | | | |
| State Univ | 6.000 | 04-01-26 | AAA | 1,620 | 1,639,715 |
See notes to
financial statements.
|
11
F I N A N C I A L S TAT E M E N T S
| | Interest | Maturity | Credit | Par value | |
| State, issuer, description | rate | date | rating (A) | (000) | Value |
| California (continued) | | | | | |
|
| California Statewide Financing Auth, | | | | | |
| Rev Tobacco Settlement Asset Backed | | | | | |
| Bond 2002A | 6.000% | 05-01-37 | Baa3 | $2,500 | $2,618,375 |
| Rev Tobacco Settlement Asset Backed | | | | | |
| Bond 2002B | 6.000 | 05-01-37 | Baa3 | 4,000 | 4,189,400 |
|
| California, State of, | | | | | |
| Gen Oblig Unltd | 5.125 | 04-01-23 | A | 2,000 | 2,128,540 |
| Gen Oblig Unltd | 5.125 | 11-01-24 | A | 3,500 | 3,705,625 |
| Gen Oblig Unltd Ref (P) | 7.338 | 03-01-16 | AAA | 6,255 | 7,296,958 |
| Gen Oblig Unltd Ref | 4.750 | 04-01-29 | AAA | 6,000 | 6,077,640 |
|
| Capistrano Unified School District, | | | | | |
| Rev Spec Tax Cmty Facil Dist | | | | | |
| No. 90 2 (G) | 6.000 | 09-01-33 | BB | 750 | 793,583 |
| Rev Spec Tax Cmty Facil Dist | | | | | |
| No. 90 2 (G) | 5.875 | 09-01-23 | BB | 500 | 533,225 |
| Rev Spec Tax Cmty Facil Dist | | | | | |
| No. 92 1 (G) | 7.100 | 09-01-21 | AA | 2,025 | 2,157,941 |
| Rev Spec Tax Cmty Facil Dist | | | | | |
| No. 98 2 (G) | 5.750 | 09-01-29 | AA | 2,470 | 2,704,057 |
|
| Carson, City of, | | | | | |
| Rev Spec Assessment Imp Bond | | | | | |
| Act of 1915 Dist No. 2001 1 (G) | 6.375 | 09-02-31 | BB+ | 1,375 | 1,431,911 |
|
| Center Unified School District, | | | | | |
| Gen Oblig Unltd Ref Cap Apprec | | | | | |
| Ser 1997C | Zero | 09-01-16 | AAA | 2,145 | 1,388,201 |
|
| Chico Redevelopment Agency, | | | | | |
| Rev Tax Alloc Amended & Merged Redev | 5.000 | 04-01-30 | AAA | 2,000 | 2,106,860 |
|
| Chula Vista Industrial Development Agency, | | | | | |
| Rev San Diego Gas Ser 2005D | 5.000 | 12-01-27 | A+ | 1,500 | 1,548,405 |
|
| Contra Costa County Public Financing Auth, | | | | | |
| Rev Ref Lease Various Cap | | | | | |
| Facil Ser 1999 A | 5.000 | 06-01-28 | AAA | 3,000 | 3,088,200 |
|
| Corona Community Facilities District, | | | | | |
| Rev Spec Tax Escrow 97 2 (G) | 5.875 | 09-01-23 | BB+ | 1,345 | 1,402,337 |
|
| Costa Mesa Public Financing Auth, | | | | | |
| Rev Local Agency Ser 1991A (G) | 7.100 | 08-01-21 | BBB | 200 | 202,240 |
|
| Del Mar Race Track Auth, | | | | | |
| Rev Ref Ser 1996 (G) | 6.200 | 08-15-11 | AA | 1,865 | 1,925,090 |
| Rev Ref Ser 1996 (G) | 6.000 | 08-15-06 | AA | 500 | 505,825 |
| Rev Ref Ser 2005 | 5.000 | 08-15-25 | BBB– | 1,000 | 1,026,530 |
|
| Eastern Municipal Water District, | | | | | |
| Rev Cert of Part Wtr & Swr Ser 2006A | 5.000 | 07-01-32 | AAA | 2,965 | 3,132,819 |
See notes to
financial statements.
|
12
F I N A N C I A L S TAT E M E N T S
| | Interest | Maturity | Credit | Par value | |
| State, issuer, description | rate | date | rating (A) | (000) | Value |
| California (continued) | | | | | |
|
| Foothill/Eastern Transportation | | | | | |
| Corridor Agency, | | | | | |
| Rev Ref Toll Rd Cap Apprec | Zero | 01-15-25 | BBB– | $6,615 | $2,280,587 |
| Rev Ref Toll Rd Cap Apprec | Zero | 01-15-36 | BBB– | 30,000 | 5,258,700 |
| Rev Ref Toll Rd Sr Lien Ser 1995A | 6.500% | 01-01-32 | AAA | 1,665 | 1,709,189 |
| Rev Ref Toll Rd Sr Lien Ser 1995A | 6.000 | 01-01-34 | AAA | 14,775 | 15,107,585 |
|
| Fresno Joint Powers Financing Auth, | | | | | |
| Rev Ref Ser 1994A | 6.550 | 09-02-12 | BBB+ | 1,100 | 1,113,508 |
|
| Fresno, City of, | | | | | |
| Rev Swr Ser A 1 | 5.250 | 09-01-19 | AAA | 1,000 | 1,126,130 |
|
| Fullerton Community Facilities District, | | | | | |
| Rev Spec Tax Amerige Heights | | | | | |
| Dist No. 1 (G) | 6.200 | 09-01-32 | BB | 1,000 | 1,061,630 |
|
| Golden State Tobacco Securitization Corp, | | | | | |
| Rev Asset Backed Bond Ser 2003A | 6.250 | 06-01-33 | BBB | 3,000 | 3,282,900 |
| Rev Asset Backed Bond Ser 2003B | 5.375 | 06-01-28 | AAA | 1,500 | 1,608,015 |
|
| Irvine, City of, | | | | | |
| Rev Meadows Mobile Home Park | | | | | |
| Ser 1998A (G) | 5.700 | 03-01-28 | BBB– | 3,975 | 4,119,253 |
|
| Irwindale Community Redevelopment Agency, | | | | |
| Rev Ref Tax Alloc Sub Lien | | | | | |
| Ind’l Dev Proj (G) | 7.050 | 06-01-26 | BBB | 2,750 | 2,859,450 |
|
| Laguna Salada Union School District, | | | | | |
| Gen Oblig Unltd Ser 2000C | Zero | 08-01-26 | AAA | 1,000 | 409,440 |
|
| Lancaster School District, | | | | | |
| Rev Ref Cert of Part Cap Apprec | Zero | 04-01-19 | AAA | 1,730 | 971,066 |
| Rev Ref Cert of Part Cap Apprec | Zero | 04-01-22 | AAA | 1,380 | 671,163 |
|
| Lee Lake Water District, | | | | | |
| Rev Spec Tax Cmty Facil Dist No. 2 | | | | | |
| Montecito Ranch (G) | 6.125 | 09-01-27 | BB | 1,200 | 1,269,768 |
|
| Long Beach, City of, | | | | | |
| Rev Ref Harbor Ser 1998A | 6.000 | 05-15-18 | AAA | 2,660 | 3,083,233 |
| Rev Spec Tax Cmty Facil | | | | | |
| Dist No. 6 Pike (G) | 6.250 | 10-01-26 | BB– | 2,500 | 2,646,200 |
|
| Los Angeles Community Facilities District, | | | | | |
| Rev Spec Tax No. 3 Cascades Business | | | | | |
| Park Proj (G) | 6.400 | 09-01-22 | BB+ | 1,000 | 1,041,210 |
|
| Los Angeles Community Redevelopment | | | | | |
| Financing Auth, | | | | | |
| Rev MultiFamily Grand Central Square | | | | | |
| Ser 1993A | 5.850 | 12-01-26 | BBB– | 2,000 | 2,001,440 |
|
| Los Angeles Dept of Water & Power, | | | | | |
| Rev Wtr Works Sys-Subser 2006A-2 | 5.000 | 07-01-31 | AAA | 2,300 | 2,443,014 |
See notes to
financial statements.
|
13
F I N A N C I A L S TAT E M E N T S
|
| | Interest | Maturity | Credit | Par value | |
| State, issuer, description | rate | date | rating (A) | (000) | Value |
| California (continued) | | | | | |
|
| Los Angeles Unified School District, | | | | | |
| Gen Oblig Unltd Election of 1997 | | | | | |
| Ser 2002E | 5.500% | 07-01-17 | AAA | $1,500 | $1,662,030 |
|
| Millbrae, City of, | | | | | |
| Rev Magnolia of Milbrae | | | | | |
| Proj Ser 1997A (G) | 7.375 | 09-01-27 | BB | 2,500 | 2,609,725 |
|
| New Haven Unified School District, | | | | | |
| Gen Oblig Unltd Cap Apprec Ser 1998B | Zero | 08-01-22 | AAA | 14,200 | 6,017,250 |
|
| Northern California Transmission Agency, | | | | | |
| Rev Ref Calif-Oregon Transm Proj | | | | | |
| Ser 1990A | 7.000 | 05-01-13 | AAA | 100 | 117,491 |
|
| Northstar Community Services District, | | | | | |
| Rev Spec Tax District No. 1 (G) | 5.550 | 09-01-36 | BB– | 3,000 | 3,059,220 |
|
| Orange Cove Irrigation District, | | | | | |
| Rev Ref Cert of Part Rehab Proj | 5.000 | 02-01-17 | AAA | 2,045 | 2,088,436 |
|
| Orange, County of, | | | | | |
| Rev Spec Assessment Imp Bond Act 1915 | | | | | |
| Ltd Oblig (G) | 5.750 | 09-02-33 | BB+ | 1,570 | 1,597,742 |
| Rev Spec Tax Cmty Facil Dist No. 1 Ladera | | | | | |
| Ranch Ser 2000A (G) | 6.250 | 08-15-30 | AA | 1,000 | 1,067,170 |
|
| Oxnard, City of, | | | | | |
| Rev Spec Tax District No. 3 — | | | | | |
| Seabridge (G) | 5.000 | 09-01-35 | BB | 1,500 | 1,503,090 |
|
| Paramount Unified School District, | | | | | |
| Gen Oblig Unltd Cap Apprec Bonds | | | | | |
| Ser 2001B | Zero | 09-01-25 | AAA | 4,735 | 1,982,876 |
|
| Pasadena, City of, | | | | | |
| Rev Cert of Part Ref Old Pasadena | | | | | |
| Parking Facil Proj | 6.250 | 01-01-18 | AA– | 1,045 | 1,195,020 |
|
| Poway, City of, | | | | | |
| Rev Ref Cmty Facil Dist | | | | | |
| No. 88 1 Pkwy Business Ctr (G) | 6.750 | 08-15-15 | BB | 1,000 | 1,077,860 |
|
| Rancho Santa Fe Community | | | | | |
| Services District, | | | | | |
| Rev Spec Tax Cmty Facil Dist No. 1 (G) | 6.700 | 09-01-30 | BB | 1,000 | 1,065,040 |
|
| Redondo Beach Public Financing Auth, | | | | | |
| Rev South Bay Center Redevel Proj (G) | 7.000 | 07-01-16 | BBB+ | 950 | 976,049 |
|
| Riverside County Asset Leasing Corp, | | | | | |
| Rev Leasehold Linked Ctfs Riverside | | | | | |
| County Ser 1993A | 6.500 | 06-01-12 | A+ | 1,000 | 1,135,820 |
|
| Sacramento City Financing Auth, | | | | | |
| Rev Convention Ctr Hotel Sr | | | | | |
| Ser 1999A (G) | 6.250 | 01-01-30 | BB+ | 5,000 | 5,202,250 |
| |
| |
| See notes to | | | | | |
| financial statements. | | | | | |
14
F I N A N C I A L S TAT E M E N T S
| | Interest | Maturity | Credit | Par value | |
| State, issuer, description | rate | date | rating (A) | (000) | Value |
| California (continued) | | | | | |
|
| Sacramento Municipal Utility District, | | | | | |
| Rev Ref Electric Ser 2001P | 5.250% | 08-15-21 | AAA | $1,000 | $1,072,200 |
|
| Sacramento Power Auth, | | | | | |
| Rev Cogeneration Proj | 6.000 | 07-01-22 | BBB | 12,000 | 12,348,480 |
|
| San Bernardino, County of, | | | | | |
| Rev Cert of Part Cap Facil Proj Ser 1992B | 6.875 | 08-01-24 | AAA | 350 | 460,415 |
| Rev Ref Cert of Part Med Ctr Fin Proj | 5.500 | 08-01-17 | AAA | 8,750 | 9,688,350 |
|
| San Bruno Park School District, | | | | | |
| Gen Oblig Unltd Cap Apprec Ser 2000B | Zero | 08-01-21 | AAA | 1,015 | 514,788 |
| Gen Oblig Unltd Cap Apprec Ser 2000B | Zero | 08-01-23 | AAA | 1,080 | 496,832 |
|
| San Diego County Water Auth, | | | | | |
| Rev Ref Cert of Part Inverse Floater (P) | 8.244 | 04-23-08 | AAA | 1,000 | 1,094,640 |
| Rev Ref Cert of Part Inverse Floater (P) | 8.244 | 04-22-09 | AAA | 400 | 453,520 |
|
| San Diego Redevelopment Agency, | | | | | |
| Rev Ref Tax Alloc Cap Apprec | | | | | |
| Ser 1999B (G) | Zero | 09-01-17 | BB | 1,600 | 872,416 |
| Rev Ref Tax Alloc Cap Apprec | | | | | |
| Ser 1999B (G) | Zero | 09-01-18 | BB | 1,700 | 868,700 |
| Rev Ref Tax Alloc City Heights Proj | | | | | |
| Ser 1999A (G) | 5.800 | 09-01-28 | BB | 1,395 | 1,432,721 |
| Rev Tax Alloc City Heights Proj | | | | | |
| Ser 1999A (G) | 5.750 | 09-01-23 | BB | 1,000 | 1,023,530 |
|
| San Diego Unified School District, | | | | | |
| Gen Oblig Unltd Cap Apprec Ser 1999A | Zero | 07-01-21 | AAA | 2,500 | 1,274,525 |
| Gen Oblig Unltd Election of 1998 | | | | | |
| Ser 2000B | 5.000 | 07-01-25 | AAA | 2,450 | 2,588,621 |
|
| San Francisco City & County | | | | | |
| Redevelopment Agency, | | | | | |
| Rev Cmty Facil Dist No. 6 | | | | | |
| Mission Ser 2001A (G) | 6.000 | 08-01-25 | BB | 2,500 | 2,627,175 |
| Rev Spec Tax Cmnty Facil Dist No. 6 | | | | | |
| Ser 2005A (G) | 5.150 | 08-01-35 | BB | 1,250 | 1,251,425 |
|
| San Francisco State Building Auth, | | | | | |
| Rev Ref Lease Dept of Gen Serv | | | | | |
| Ser 1993A | 5.000 | 10-01-13 | A– | 2,145 | 2,296,501 |
|
| San Joaquin Hills Transportation | | | | | |
| Corridor Agency, | | | | | |
| Rev Ref Toll Rd Conv Cap Apprec | | | | | |
| Ser 1997A Step Coupon | | | | | |
| (5.750%, 01-15-07) (O) | Zero | 01-15-21 | B | 5,000 | 4,812,600 |
| Rev Toll Rd Sr Lien | Zero | 01-01-14 | AAA | 5,000 | 3,673,600 |
| Rev Toll Rd Sr Lien | Zero | 01-01-22 | AAA | 6,500 | 3,231,735 |
See notes to
financial statements.
|
15
F I N A N C I A L S TAT E M E N T S
| | Interest | Maturity | Credit | Par value | |
| State, issuer, description | rate | date | rating (A) | (000) | Value |
| California (continued) | | | | | |
|
| San Marcos Public Facilities Auth, | | | | | |
| Rev Sub Tax Increment Proj Area 3 | | | | | |
| Ser 1999A (G) | 6.000% | 08-01-31 | AA | $1,305 | $1,424,721 |
|
| San Mateo County Joint Power Auth, | | | | | |
| Rev Ref Lease Cap Proj Prog | 5.000 | 07-01-21 | AAA | 1,815 | 1,995,193 |
|
| Santa Ana Financing Auth, | | | | | |
| Rev Lease Police Admin & Hldg Facil | | | | | |
| Ser 1994A | 6.250 | 07-01-19 | AAA | 1,790 | 2,167,923 |
| Rev Lease Police Admin & Hldg Facil | | | | | |
| Ser 1994A | 6.250 | 07-01-24 | AAA | 10,000 | 12,473,100 |
| Rev Ref Mainplace Proj Ser 1998D (G) | 5.600 | 09-01-19 | BBB– | 1,000 | 1,079,880 |
|
| Santa Clara County Financing Auth, | | | | | |
| Rev Ref Lease Multiple Facil Projs | | | | | |
| Ser 2000B | 5.500 | 05-15-17 | AAA | 6,000 | 6,496,500 |
|
| Santa Margarita Water District, | | | | | |
| Rev Spec Tax Cmty Facil | | | | | |
| Dist No. 99 1 (G) | 6.000 | 09-01-30 | BB+ | 500 | 530,015 |
|
| Santaluz Community Facilities District, | | | | | |
| Rev Spec Tax Dist No. 2 | | | | | |
| Imp Area No. 1 (G) | 6.375 | 09-01-30 | BB | 1,495 | 1,545,307 |
|
| Southern California Public Power Auth, | | | | | |
| Rev Ref Southern Transm Proj | Zero | 07-01-13 | AAA | 4,400 | 3,301,672 |
|
| Tobacco Securitization Authority of | | | | | |
| Northern California, | | | | | |
| Rev Asset Backed Bond Ser 2001A | 5.375 | 06-01-41 | BBB | 1,000 | 1,085,930 |
|
| Torrance, City of, | | | | | |
| Rev Ref Hosp Torrance | | | | | |
| Mem Med Ctr Ser 2001A | 5.500 | 06-01-31 | A+ | 2,000 | 2,104,540 |
|
| Tustin Unified School District, | | | | | |
| Rev Spec Tax Cmty Facil Dist No. 97 1 | 6.375 | 09-01-35 | AAA | 1,000 | 1,086,370 |
|
| University of California, | | | | | |
| Rev Ltd Proj Ser 2005B | 5.000 | 05-15-33 | AAA | 1,000 | 1,047,950 |
|
| Vallejo Sanitation and Flood Control District, | | | | | |
| Rev Ref Cert of Part | 5.000 | 07-01-19 | AAA | 2,500 | 2,742,825 |
|
| West Covina Redevelopment Agency, | | | | | |
| Rev Ref Cmty Facil Dist Fashion Plaza Proj | 6.000 | 09-01-22 | AA | 3,000 | 3,501,120 |
| Puerto Rico 10.80% | | | | | 36,319,953 |
|
| Puerto Rico Aqueduct & Sewer Auth, | | | | | |
| Rev Ref Inverse Floater (Gtd) (P) | 8.095 | 07-01-11 | AAA | 7,500 | 9,149,850 |
|
| Puerto Rico Highway & Transportation Auth, | | | | | |
| Rev Ref Ser 1996Z | 6.250 | 07-01-14 | AAA | 3,250 | 3,814,493 |
| Rev Ref Ser 1998A | 5.000 | 07-01-38 | AAA | 5,000 | 5,175,350 |
| Rev Ref Ser 2005K | 5.000 | 07-01-30 | BBB+ | 2,000 | 2,069,300 |
See notes to
financial statements.
|
16
F I N A N C I A L S TAT E M E N T S
| | Interest | Maturity | Credit | Par value | |
| State, issuer, description | rate | date | rating (A) | (000) | Value |
| Puerto Rico (continued) | | | | | |
|
| Puerto Rico Ind’l, Tourist, Ed’l, | | | | | |
| Med & Environmental Control Facilities | | | | | |
| Financing Auth, | | | | | |
| Rev Hosp de La Concepcion | | | | | |
| Ser 2000A | 6.500% | 11-15-20 | AA | $500 | $558,930 |
|
| Puerto Rico Public Finance Corp, | | | | | |
| Rev Commonwealth Approp Ser 2002E | 5.700 | 08-01-25 | BBB– | 2,500 | 2,699,700 |
|
| Puerto Rico, Commonwealth of, | | | | | |
| Gen Oblig Unltd | 6.500 | 07-01-15 | BBB | 6,000 | 7,072,080 |
| Gen Oblig Unltd Ser 975 (P) | 6.580 | 07-01-18 | Aaa | 5,000 | 5,780,250 |
|
| | | | Interest | Par value | |
| Issuer, description, maturity date | | | rate | (000) | Value |
|
| |
| Short-term investments 0.13% | | | | | $450,000 |
| |
| (Cost $450,000) | | | | | |
| Joint Repurchase Agreement 0.13% | | | | | 450,000 |
|
| Investment in a joint repurchase agreement | | | | | |
| transaction with Bank of America — | | | | | |
| Dated 2-28-06 due 3-1-06 (secured | | | | | |
| by U.S. Treasury Inflation Indexed | | | | | |
| Bonds 1.125% due 1-15-15 and 2.375% | | | | | |
| due 1-15-25, U.S. Treasury Inflation Indexed | | | | |
| Note 3.875% due 4-15-29 and U.S. STRIPS | | | | |
| due 11-15-21) | | | 4.520% | $450 | 450,000 |
|
| |
| Total investments 98.68% | | | | | $331,852,575 |
|
| |
| Other assets and liabilities, net 1.32% | | | | | $4,427,999 |
|
| |
| Total net assets 100.00% | | | | | $336,280,574 |
(A) Credit ratings are unaudited and are rated by Moody’s Investors Service or Fitch where Standard & Poor’s ratings are not available, unless indicated otherwise.
(G) Security rated internally by John Hancock Advisers, LLC.
(O) Cash interest will be paid on this obligation at the stated rate beginning on the stated date.
(P) Represents rate in effect on February 28, 2006.
The percentage shown for each investment category is the total value of that category as a percentage of the net assets of the Fund.
See notes to
financial statements.
|
17
F I N A N C I A L S TAT E M E N T S
ASSETS AND
LIABILITIES
February 28, 2006
(unaudited)
|
This Statement
of Assets and
Liabilities is the
Fund’s balance
sheet. It shows
the value of
what the Fund
owns, is due
and owes. You’ll
also find the net
asset value and
the maximum
offering price
per share.
|
| Assets | |
| Investments at value (cost $303,244,404) | $331,852,575 |
| Cash | 985 |
| Receivable for shares sold | 1,293,514 |
| Interest receivable | 3,922,393 |
| Other assets | 94,666 |
| Total assets | 337,164,133 |
|
| Liabilities | |
| Payable for shares repurchased | 498,339 |
| Dividends payable | 40,073 |
| Payable to affiliates | |
| Management fees | 141,278 |
| Distribution and service fees | 8,046 |
| Other | 40,146 |
| Other payables and accrued expenses | 155,677 |
| Total liabilities | 883,559 |
|
| Net assets | |
| Capital paid-in | 310,338,242 |
| Accumulated net realized loss on investments | (2,780,388) |
| Net unrealized appreciation of investments | 28,608,171 |
| Accumulated net investment income | 114,549 |
| Net assets | $336,280,574 |
|
| Net asset value per share | |
| Based on net asset values and shares outstanding — | |
| the Fund has an unlimited number of shares | |
| authorized with no par value | |
| Class A ($300,451,855 ÷ 27,421,014 shares) | $10.96 |
| Class B ($28,673,335 ÷ 2,616,810 shares) | $10.96 |
| Class C ($7,155,384 ÷ 653,048 shares) | $10.96 |
|
| Maximum offering price per share | |
| Class A1 ($10.96 ÷ 95.5%) | $11.48 |
1 On single retail sales of less than $100,000. On sales of $100,000 or more and on group sales the offering price is reduced.
See notes to
financial statements.
|
18
F I N A N C I A L S TAT E M E N T S
OPERATIONS
For the period ended
February 28, 2006
(unaudited)1
This Statement
of Operations
summarizes the
Fund’s investment
income earned and
expenses incurred
in operating the
Fund. It also shows
net gains (losses)
for the period
stated.
|
| Investment income | |
| Interest | $8,931,152 |
| Total investment income | 8,931,152 |
|
| Expenses | |
| Investment management fees | 916,096 |
| Class A distribution and service fees | 222,106 |
| Class B distribution and service fees | 150,744 |
| Class C distribution and service fees | 34,175 |
| Transfer agent fees | 84,968 |
| Custodian fees | 49,411 |
| Accounting and legal services fees | 41,641 |
| Professional fees | 25,589 |
| Printing | 22,766 |
| Trustees’ fees | 15,174 |
| Compliance fees | 7,360 |
| Registration and filing fees | 5,915 |
| Interest | 447 |
| Miscellaneous | 120 |
| Total expenses | 1,576,512 |
| Less expense reductions | (319) |
| Net expenses | 1,576,193 |
| Net investment income | 7,354,959 |
|
| Realized and unrealized gain (loss) | |
| Net realized gain on investments | 1,779,689 |
| Change in net unrealized appreciation (depreciation) | |
| of investments | (5,800,327) |
| Net realized and unrealized loss | (4,020,638) |
| Increase in net assets from operations | $3,334,321 |
1 Semiannual period from 9-1-05 through 2-28-06.
See notes to
financial statements.
|
19
F I N A N C I A L S TAT E M E N T S
CHANGES IN
NET ASSETS
These Statements
of Changes in Net
Assets show how
the value of the
Fund’s net assets
has changed
during the last
two periods. The
difference reflects
earnings less
expenses, any
investment
gains and losses,
distributions, if
any, paid to
shareholders and
the net of Fund
share transactions.
|
| | Year | Period |
| | ended | ended |
| | 8-31-05 | 2-28-061 |
|
| Increase (decrease) in net assets | | |
| From operations | | |
| Net investment income | $15,744,752 | $7,354,959 |
| Net realized gain (loss) | (604,637) | 1,779,689 |
| Change in net unrealized | | |
| appreciation (depreciation) | 6,043,149 | (5,800,327) |
| Increase in net assets resulting | | |
| from operations | 21,183,264 | 3,334,321 |
| Distributions to shareholders | | |
| From net investment income | | |
| Class A | (13,877,944) | (6,610,925) |
| Class B | (1,376,242) | (545,001) |
| Class C | (256,995) | (123,363) |
| | (15,511,181) | (7,279,289) |
| From Fund share transactions | (17,981,803) | (5,402,085) |
|
| Net assets | | |
| Beginning of period | 357,937,347 | 345,627,627 |
| End of period2 | $345,627,627 | $336,280,574 |
1 Semiannual period from 9-1-05 through 2-28-06. Unaudited.
2 Includes accumulated net investment income of $38,879 and $114,549, respectively.
See notes to
financial statements.
|
20
F I N A N C I A L H I G H L I G H T S
CLASS A SHARESThe Financial Highlights show how the Fund’s net asset value for a share has changed since the end of the previous period.
| Period ended | 8-31-011 | 8-31-021,2 | 8-31-03 | 8-31-04 | 8-31-05 | 2-28-063 |
|
| Per share operating performance | | | | | | |
| Net asset value, | | | | | | |
| beginning of period | $10.69 | $11.11 | $11.06 | $10.60 | $10.91 | $11.08 |
| Net investment income4 | 0.54 | 0.54 | 0.53 | 0.52 | 0.51 | 0.24 |
| Net realized and unrealized | | | | | | |
| gain (loss) on investments | 0.42 | (0.06) | (0.47) | 0.30 | 0.16 | (0.12) |
| Total from investment operations | 0.96 | 0.48 | 0.06 | 0.82 | 0.67 | 0.12 |
| Less distributions | | | | | | |
| From net investment income | (0.54) | (0.53) | (0.52) | (0.51) | (0.50) | (0.24) |
| Net asset value, end of period | $11.11 | $11.06 | $10.60 | $10.91 | $11.08 | $10.96 |
| Total return5 (%) | 9.266 | 4.526 | 0.48 | 7.84 | 6.24 | 1.137 |
|
| Ratios and supplemental data | | | | | | |
| Net assets, end of period | | | | | | |
| (in millions) | $331 | $347 | $308 | $308 | $306 | $300 |
| Ratio of expenses | | | | | | |
| to average net assets (%) | 0.80 | 0.84 | 0.84 | 0.83 | 0.86 | 0.858 |
| Ratio of adjusted expenses | | | | | | |
| to average net assets9 (%) | 0.82 | 0.84 | — | — | — | — |
| Ratio of net investment income | | | | | | |
| to average net assets (%) | 5.01 | 4.95 | 4.79 | 4.72 | 4.59 | 4.518 |
| Portfolio turnover (%) | 14 | 15 | 18 | 21 | 13 | 17 |
See notes to
financial statements.
|
21
F I N A N C I A L H I G H L I G H T S
CLASS B SHARES
| Period ended | 8-31-011 | 8-31-021,2 | 8-31-03 | 8-31-04 | 8-31-05 | 2-28-063 |
|
| Per share operating performance | | | | | | |
| Net asset value, | | | | | | |
| beginning of period | $10.69 | $11.11 | $11.06 | $10.60 | $10.91 | $11.08 |
| Net investment income4 | 0.46 | 0.45 | 0.44 | 0.42 | 0.41 | 0.20 |
| Net realized and unrealized | | | | | | |
| gain (loss) on investments | 0.42 | (0.06) | (0.47) | 0.31 | 0.16 | (0.12) |
| Total from | | | | | | |
| investment operations | 0.88 | 0.39 | (0.03) | 0.73 | 0.57 | 0.08 |
| Less distributions | | | | | | |
| From net investment income | (0.46) | (0.44) | (0.43) | (0.42) | (0.40) | (0.20) |
| Net asset value, end of period | $11.11 | $11.06 | $10.60 | $10.91 | $11.08 | $10.96 |
| Total return5 (%) | 8.456 | 3.676 | (0.37) | 6.93 | 5.35 | 0.707 |
|
| Ratios and supplemental data | | | | | | |
| Net assets, end of period | | | | | | |
| (in millions) | $80 | $65 | $55 | $43 | $32 | $29 |
| Ratio of expenses | | | | | | |
| to average net assets (%) | 1.55 | 1.65 | 1.69 | 1.69 | 1.71 | 1.708 |
| Ratio of adjusted expenses | | | | | | |
| to average net assets9 (%) | 1.67 | 1.69 | — | — | — | — |
| Ratio of net investment income | | | | | | |
| to average net assets (%) | 4.26 | 4.14 | 3.95 | 3.87 | 3.75 | 3.678 |
| Portfolio turnover (%) | 14 | 15 | 18 | 21 | 13 | 17 |
See notes to
financial statements.
|
22
F I N A N C I A L H I G H L I G H T S
CLASS C SHARES
| Period ended | 8-31-011 | 8-31-021,2 | 8-31-03 | 8-31-04 | 8-31-05 | 2-28-063 |
|
| Per share operating performance | | | | | | |
| Net asset value, | | | | | | |
| beginning of period | $10.69 | $11.11 | $11.06 | $10.60 | $10.91 | $11.08 |
| Net investment income4 | 0.45 | 0.45 | 0.43 | 0.42 | 0.41 | 0.20 |
| Net realized and unrealized | | | | | | |
| gain (loss) on investments | 0.42 | (0.06) | (0.47) | 0.31 | 0.16 | (0.12) |
| Total from | | | | | | |
| investment operations | 0.87 | 0.39 | (0.04) | 0.73 | 0.57 | 0.08 |
| Less distributions | | | | | | |
| From net investment income | (0.45) | (0.44) | (0.42) | (0.42) | (0.40) | (0.20) |
| Net asset value, end of period | $11.11 | $11.06 | $10.60 | $10.91 | $11.08 | $10.96 |
| Total return5 (%) | 8.346 | 3.646 | (0.37) | 6.93 | 5.35 | 0.707 |
|
| Ratios and supplemental data | | | | | | |
| Net assets, end of period | | | | | | |
| (in millions) | $4 | $8 | $9 | $7 | $7 | $7 |
| Ratio of expenses | | | | | | |
| to average net assets (%) | 1.65 | 1.69 | 1.69 | 1.69 | 1.71 | 1.708 |
| Ratio of adjusted expenses | | | | | | |
| to average net assets9 (%) | 1.67 | 1.69 | — | — | — | — |
| Ratio of net investment income | | | | | | |
| to average net assets (%) | 4.16 | 4.10 | 3.93 | 3.87 | 3.74 | 3.668 |
| Portfolio turnover (%) | 14 | 15 | 18 | 21 | 13 | 17 |
1 Audited by previous auditor.
2 As required, effective 9-1-01 the Fund adopted the provisions of the AICPA Audit and Accounting Guide for Investment Companies, as revised, relating to the amortization of premiums and accretion of discounts on debt securities. The effect of this change on per share amounts for the year ended 8-31-02 was to increase net investment income per share by $0.01, increase net realized and unrealized losses per share by $0.01 and, had the Fund not made these changes to amortization and accretion, the ratio of net investment income to average net assets would have been 4.88%, 4.07% and 4.03%, for Class A, Class B and Class C shares, respectively. Per share ratios and supplemental data for periods prior to 9-1-01, have not been restated to reflect this change in presentation.
3 Semiannual period from 9-1-05 through 2-28-06. Unaudited.
4 Based on the average of the shares outstanding.
5 Assumes dividend reinvestment and does not reflect the effect of sales charges.
6 Total returns would have been lower had certain expenses not been reduced during the periods shown.
7 Not annualized.
8 Annualized.
9 Does not take into consideration expense reductions during the periods shown.
See notes to
financial statements.
|
23
Unaudited
Note A
Accounting policies
|
John Hancock California Tax-Free Income Fund (the “Fund”) is a non-diversified open-end management investment company registered under the Investment Company Act of 1940. The Fund seeks a high level of current income, consistent with the preservation of capital, that is exempt from federal and California personal income taxes. Since the Fund invests primarily in California issuers, the Fund may be affected by political, economic or regulatory developments in the state of California.
The Trustees have authorized the issuance of multiple classes of shares of the Fund, designated as Class A, Class B and Class C shares. The shares of each class represent an interest in the same portfolio of investments of the Fund and have equal rights as to voting, redemptions, dividends and liquidation, except that certain expenses, subject to the approval of the Trustees, may be applied differently to each class of shares in accordance with current regulations of the Securities and Exchange Commission and the Internal Revenue Service. Shareholders of a class that bears distribution and service expenses under the terms of a distribution plan have exclusive voting rights to that distribution plan.
Significant accounting policies
of the Fund are as follows:
|
Valuation of investments
Securities in the Fund’s portfolio are valued on the basis of market quotations, valuations provided by independent pricing services or at fair value as determined in good faith in accordance with procedures approved by the Trustees. Short-term debt investments which have a remaining maturity of 60 days or less may be valued at amortized cost, which approximates market value.
Joint repurchase agreement
Pursuant to an exemptive order issued by the Securities and Exchange Commission, the Fund, along with other registered investment companies having a management contract with John Hancock Advisers, LLC (the “Adviser”), a wholly owned subsidiary of John Hancock Financial Services, Inc., a subsidiary of Manulife Financial Corporation (“MFC”), may participate in a joint repurchase agreement transaction. Aggregate cash balances are invested in one or more large repurchase agreements, whose underlying securities are obligations of the U.S. government and/or its agencies. The Fund’s custodian bank receives delivery of the underlying securities for the joint account on the Fund’s behalf. The Adviser is responsible for ensuring that the agreement is fully collateralized at all times.
24
Investment transactions
Investment transactions are recorded as of the date of purchase, sale or maturity. Net realized gains and losses on sales of investments are determined on the identified cost basis.
Discount and premium on securities
The Fund accretes discount and amortizes premium from par value on securities from either the date of issue or the date of purchase over the life of the security.
Class allocations
Income, common expenses and realized and unrealized gains (losses) are determined at the fund level and allocated daily to each class of shares based on the appropriate net asset value of the respective classes. Distribution and service fees, if any, are calculated daily at the class level based on the appropriate net asset value of each class and the specific expense
rate(s) applicable to each class.
Expenses
The majority of expenses are directly identifiable to an individual fund. Expenses that are not readily identifi-able to a specific fund are allocated in such a manner as deemed equitable, taking into consideration, among other things, the nature and type of expense and the relative sizes of the funds.
Bank borrowings
The Fund is permitted to have bank borrowings for temporary or emergency purposes, including the meeting of redemption requests that otherwise might require the untimely disposition of securities. The Fund has entered into a syndicated line of credit agreement with various banks. This agreement enables the Fund to participate with other funds managed by the Adviser, in an unsecured line of credit with banks, which permits borrowings of up to $250 million, collectively. Interest is charged to each fund based on its borrowing. In addition, a commitment fee is charged to each fund based on the average daily unused portion of the line of credit, and is allocated among the participating funds. The Fund had no borrowing activity under the line of credit during the period ended February 28, 2006.
Federal income taxes
The Fund qualifies as a “regulated investment company” by complying with the applicable provisions of the Internal Revenue Code and will not be subject to federal income tax on taxable income that is distributed to shareholders. Therefore, no federal income tax provision is required. For federal income tax purposes, the Fund has $3,168,360 of a capital loss carryforward available, to the extent provided by regulations, to offset future net realized capital gains. To the extent that such carryforward is used by the Fund, no capital gains distributions will be made. The loss carryforward expires as follows: August 31, 2006 — $339,297, August 31, 2008 — $968,588, August 31, 2011 —$1,269,779 and August 31, 2012 — $590,696.
Interest and distributions
Interest income on investment securities is recorded on the accrual basis.
The Fund records distributions to shareholders from net investment income and net realized gains, if any, on the ex-dividend date. The Fund’s net investment income is declared daily as dividends to shareholders of record as of the close of business on the preceding day, and distributed monthly. During the year ended August 31, 2005, the tax character of distributions paid was as follows: ordinary income $22,959 and exempt income $15,488,222. Distributions paid by the Fund with respect to each class of shares are calculated in the same manner, at the same time and are in the same amount, except for the effect of expenses that may be applied differently to each class.
25
Such distributions, on a tax basis, are determined in conformity with income tax regulations, which may differ from accounting principles generally accepted in the United States of America. Distributions in excess of tax basis earnings and profits, if any, are reported in the Fund’s financial statements as a return of capital.
Use of estimates
The preparation of these financial statements, in accordance with accounting principles generally accepted in the United States of America, incorporates estimates made by management in determining the reported amount of assets, liabilities, revenues and expenses of the Fund. Actual results could differ from these estimates.
Note B
Management fee and
transactions with
affiliates and others
The Fund has an investment management contract with the Adviser. Under the investment management contract, the Fund pays a monthly management fee to the Adviser equivalent, on an annual basis, to the sum of: (a) 0.55% of the first $500,000,000 of the Fund’s average daily net asset value and (b) 0.50% of the Fund’s average daily net asset value in excess of $500,000,000.
Effective December 31, 2005, the investment management teams of the Adviser were reorganized into Sovereign Asset Management LLC (“Sovereign”), a wholly owned indirect subsidiary of John Hancock Life Insurance Company (“JHLICo”), a subsidiary of MFC. The Adviser remains the principal advisor on the Fund and Sovereign acts as subadviser under the supervision of the Adviser. The restructuring did not have an impact on the Fund, which continues to be managed using the same investment philosophy and process. The Fund is not responsible for payment of the subadvisory fees.
The Fund has an agreement with its custodian bank, under which custody fees are reduced by balance credits applied during the period. Accordingly, the expense reductions related to custody fee offsets amounted to $319 which had no impact on the Fund’s ratio of expenses to average net assets, for the period ended February 28, 2006. If the Fund had not entered into this agreement, the assets not invested, on which these balance credits were earned, could have produced taxable income.
The Fund has Distribution Plans with John Hancock Funds, LLC (“JH Funds”), a wholly owned subsidiary of the Adviser. The Fund has adopted Distribution Plans with respect to Class A, Class B and Class C, pursuant to Rule 12b-1 under the Investment Company Act of 1940, to reimburse
JH Funds for the services it provides as distributor of shares of the Fund. Accordingly, the Fund makes monthly payments to JH Funds at an annual rate not to exceed 0.15% of Class A average daily net asset value and 1.00% of Class B and Class C average daily net asset value. A maximum of 0.25% of such payments may be service fees, as defined by the Conduct Rules of the National Association of Securities Dealers. Under the Conduct Rules, curtailment of a portion of the Fund’s 12b-1 payments could occur under certain circumstances.
Class A shares are assessed up-front sales charges. During the period ended February 28, 2006, JH Funds received net up-front sales charges of $126,108 with regard to sales of Class A shares. Of this amount, $16,679 was retained and used for printing prospectuses, advertising, sales literature and other purposes, $106,405 was paid as sales commissions to unrelated broker-dealers and $3,024 was paid as sales commissions to sales personnel of Signator Investors, Inc. (“Signator Investors”), a related broker-dealer. The Adviser’s indirect parent JHLICo, is the indirect sole shareholder of Signator Investors.
Class B shares that are redeemed within six years of purchase are subject to a
26
contingent deferred sales charge (“CDSC”) at declining rates, beginning at 5.00% of the lesser of the current market value at the time of redemption or the original purchase cost of the shares being redeemed. Class C shares that are redeemed within one year of purchase are subject to a CDSC at a rate of 1.00% of the lesser of the current market value at the time of redemption or the original purchase cost of the shares being redeemed. Proceeds from the CDSCs are paid to JH Funds and are used, in whole or in part, to defray its expenses for providing distribution-related services to the Fund in connection with the sale of Class B and Class C shares. During the period ended February 28, 2006, CDSCs received by JH Funds amounted to $16,952 for Class B shares and $630 for Class C shares.
The Fund has a transfer agent agreement with John Hancock Signature Services, Inc. (“Signature Services”), an indirect subsidiary of JHLICo. The Fund pays a monthly transfer agent fee at an annual rate of 0.01% of each class’s average daily net asset values, plus a fee based on the number of shareholder accounts and reimbursement for certain out-of-pocket expenses, aggregated and allocated to each class on the basis of its relative net asset value. Signature Services agreed to voluntarily reduce the Fund’s asset-based portion of the transfer agent fee if the total transfer agent fee exceeds the Lipper, Inc. median transfer agency fee for comparable mutual funds by greater than 0.05% . There were no transfer agent fee reductions during the period ended February 28, 2006. Signature Services reserves the right to terminate this limitation at any time.
The Fund has an agreement with the Adviser to perform necessary tax, accounting and legal services for the Fund. The compensation for the period amounted to $41,641. The Fund also paid the Adviser the amount of $235 for certain publishing services, included in the printing fees. The Fund also reimbursed JHLICo for certain compliance costs, included in the Fund’s Statement of Operations.
Mr. James R. Boyle is Chairman of the Adviser, as well as affiliated Trustee of the Fund, and is compensated by the Adviser and/or its affiliates. The compensation of unaffiliated Trustees is borne by the Fund. The unaffiliated Trustees may elect to defer, for tax purposes, their receipt of this compensation under the John Hancock Group of Funds Deferred Compensation Plan. The Fund makes investments into other John Hancock funds, as applicable, to cover its liability for the deferred compensation. Investments to cover the Fund’s deferred compensation liability are recorded on the Fund’s books as an other asset. The deferred compensation liability and the related other asset are always equal and are marked to market on a periodic basis to reflect any income earned by the investments, as well as any unrealized gains or losses. The Deferred Compensation Plan investments had no impact on the operations of the Fund.
27
Note C
Fund share transactions
This listing illustrates the number of Fund shares sold, reinvested and repurchased during the last two periods, along with the corresponding dollar value.
| | Year ended 8-31-05 | Period ended 2-28-061 |
| | Shares | Amount | Shares | Amount |
|
| Class A shares | | | | |
| Sold | 1,835,453 | $20,153,842 | 847,817 | $9,253,306 |
| Distributions reinvested | 689,490 | 7,582,188 | 333,663 | 3,640,664 |
| Repurchased | (3,151,735) | (34,610,300) | (1,394,310) | (15,231,463) |
| Net decrease | (626,792) | ($6,874,270) | (212,830) | ($2,337,493) |
|
| |
| Class B shares | | | | |
| Sold | 85,824 | $944,688 | 102,635 | $1,121,582 |
| Distributions reinvested | 64,621 | 710,249 | 26,372 | 287,749 |
| Repurchased | (1,131,286) | (12,430,218) | (440,250) | (4,807,567) |
| Net decrease | (980,841) | ($10,775,281) | (311,243) | ($3,398,236) |
|
| |
| Class C shares | | | | |
| Sold | 129,415 | $1,420,917 | 81,144 | $887,199 |
| Distributions reinvested | 12,434 | 136,593 | 5,460 | 59,582 |
| Repurchased | (171,648) | (1,889,762) | (56,272) | (613,137) |
| Net increase (decrease) | (29,799) | ($332,252) | 30,332 | $333,644 |
|
| |
| Net decrease | (1,637,432) | ($17,981,803) | (493,741) | ($5,402,085) |
1 Semiannual period from 9-1-05 through 2-28-06. Unaudited.
Note D
Investment
transactions
Purchases and proceeds from sales or maturities of securities, other than short-term securities and obligations of the U.S. government, during the period ended February 28, 2006, aggregated $58,278,759 and $65,766,780, respectively.
The cost of investments owned on February 28, 2006, including short-term investments, for federal income tax purposes, was $301,826,586. Gross unrealized appreciation and depreciation of investments aggregated $30,097,974 and $71,985, respectively, resulting in net unrealized appreciation of $30,025,989. The difference between book basis and tax basis net unrealized appreciation of investments is attributable primarily to the accretion of discounts on debt securities.
28
Board Consideration
of Sovereign Asset
Management LLC
as Subadviser to
John Hancock
California Tax-Free
Income Fund
At a meeting held on December 6, 2005, the Board reviewed a Subadvisory Agreement among the Fund, the Adviser and Sovereign Asset Management LLC, an affiliate of the Adviser (the “Subadviser”). At that meeting, the Adviser proposed, and the Board accepted, a reorganization of the Adviser’s operations and the transfer to the Subadviser of all of the Adviser’s investment personnel. As a result of this restructuring, the Adviser remains the principal adviser to the Fund, and the Subadviser acts as subadviser under the supervision of the Adviser. In evaluating the Subadviser Agreement, the Board relied upon the review that it conducted at its May and June 2005 meetings, its familiarity with the operations and personnel transferred to Sovereign and representations by the Adviser that the reorganization would not result in a change in the quality of services provided under the Subadvisory Agreement or the personnel responsible for the day-today management of the Fund. The Board also reviewed an analysis of the fee paid by the Adviser to the Subadviser under the Subadvisory Agreement relative to subadvisory fees paid by the Adviser and its affiliates to third party subadvisers and fees paid by a peer group of unaffiliated investment companies. After considering the above-described factors and based on its deliberations and its evaluation of the information described above, the Board concluded that approval of the Subadvisory Agreement was in the best interest of the Fund and its shareholders. Accordingly, the Board unanimously approved the Subadvisory Agreement, which became effective on December 31, 2005.
29
| Equity | Balanced Fund |
| | Classic Value Fund |
| | Core Equity Fund |
| | Focused Equity Fund |
| | Growth Trends Fund |
| | Large Cap Equity Fund |
| | Large Cap Select Fund |
| | Mid Cap Equity Fund |
| | Mid Cap Growth Fund |
| | Multi Cap Growth Fund |
| | Small Cap Fund |
| | Small Cap Equity Fund |
| | Small Cap Intrinsic Value Fund |
| | Sovereign Investors Fund |
| | U.S. Global Leaders Growth Fund |
|
| |
| Asset Allocation and | Allocation Growth + Value Portfolio |
| Lifestyle Portfolios | Allocation Core Portfolio |
| | Lifestyle Aggressive Portfolio |
| | Lifestyle Growth Portfolio |
| | Lifestyle Balanced Portfolio |
| | Lifestyle Moderate Portfolio |
| | Lifestyle Conservative Portfolio |
|
| |
| Sector | Financial Industries Fund |
| | Health Sciences Fund |
| | Real Estate Fund |
| | Regional Bank Fund |
| | Technology Fund |
| | Technology Leaders Fund |
|
| |
| International | Greater China Opportunities Fund |
| | International Fund |
| | International Classic Value Fund |
|
| |
| Income | Bond Fund |
| | Government Income Fund |
| | High Yield Fund |
| | Investment Grade Bond Fund |
| | Strategic Income Fund |
|
| |
| Tax-Free Income | California Tax-Free Income Fund |
| | High Yield Municipal Bond Fund |
| | Massachusetts Tax-Free Income Fund |
| | New York Tax-Free Income Fund |
| | Tax-Free Bond Fund |
|
| |
| Money Market | Money Market Fund |
| | U.S. Government Cash Reserve |
|
For more complete information on any John Hancock Fund and a prospectus, which includes charges and expenses, call your financial professional, or John Hancock Funds at 1-800-225-5291. Please read the prospectus carefully before investing or sending money.
30
ELECTRONIC
DELIVERY
Now available from
John Hancock Funds
|
Instead of sending annual and semiannual reports and prospectuses through the U.S. mail, we’ll notify you by e-mail when these documents are available for online viewing.
How does electronic delivery benefit you?
| * | No more waiting for the mail to arrive; you’ll receive an |
| | e-mail notification as soon as the document is ready for |
| | online viewing. |
| |
| * | Reduces the amount of paper mail you receive from |
| | John Hancock Funds. |
| |
| * | Reduces costs associated with printing and mailing. |
Sign up for electronic delivery today at
www.jhfunds.com/edelivery
|
31
OUR WEB SITE
A wealth of information —
www.jhfunds.com
|
| View the latest information for your account. |
|
| Transfer money from one account to another. |
|
| Get current quotes for major market indexes. |
|
Use our online calculators to help you with your
financial goals. |
|
Get up-to-date commentary from John Hancock
Funds investment experts. |
|
|
| Access forms, applications and tax information. |
32
For more information
The Fund’s proxy voting policies, procedures and records are available without charge, upon request:
| By phone | On the Fund’s Web site | On the SEC’s Web site |
| 1-800-225-5291 | www.jhfunds.com/proxy | www.sec.gov |
|
| Trustees | Francis V. Knox, Jr. | Custodian |
| Ronald R. Dion, Chairman | Vice President and | The Bank of New York |
| James R. Boyle† | Chief Compliance Officer | One Wall Street |
| James F. Carlin | John G. Vrysen | New York, NY 10286 |
| Richard P. Chapman, Jr.* | Executive Vice President and | |
| William H. Cunningham | Chief Financial Officer | Transfer agent |
| Charles L. Ladner* | | John Hancock Signature |
| Dr. John A. Moore* | Investment adviser | Services, Inc. |
| Patti McGill Peterson* | John Hancock Advisers, LLC | 1 John Hancock Way, |
| Steven R. Pruchansky | 601 Congress Street | Suite 1000 |
| Boston, MA 02210-2805 | Boston, MA 02217-1000 |
| *Members of the Audit Committee | | |
| †Non-Independent Trustee | Subadviser | Legal counsel |
| | Sovereign Asset | Wilmer Cutler Pickering |
| Officers | Management LLC | Hale and Dorr LLP |
| Keith F. Hartstein | 101 Huntington Avenue | 60 State Street |
| President and | Boston, MA 02199 | Boston, MA 02109-1803 |
| Chief Executive Officer | | |
| William H. King | Principal distributor | |
| Vice President and Treasurer | John Hancock Funds, LLC | |
| 601 Congress Street | |
| | Boston, MA 02210-2805 | |
The Fund’s investment objective, risks, charges and expenses are included in the prospectus and should be considered carefully before investing. For a prospectus, call your financial professional, call John Hancock Funds at 1-800-225-5291, or visit the Fund’s Web site at www.jhfunds.com. Please read the prospectus carefully before investing or sending money.
| How to contact us | |
|
| |
| Internet | www.jhfunds.com | |
|
| |
| Mail | Regular mail: | Express mail: |
| | John Hancock | John Hancock |
| | Signature Services, Inc. | Signature Services, Inc. |
| | 1 John Hancock Way, Suite 1000 | Mutual Fund Image Operations |
| | Boston, MA 02217-1000 | 380 Stuart Street |
| | | Boston, MA 02116 |
|
| |
| Phone | Customer service representatives | 1-800-225-5291 |
| | 24-hour automated information | 1-800-338-8080 |
| | TDD line | 1-800-554-6713 |
A listing of month-end portfolio holdings is available on our Web site, www.jhfunds.com. A more detailed portfolio holdings summary is available on a quarterly basis 60 days after the fiscal quarter on our Web site or upon request by calling 1-800-225-5291, or on the Securities and Exchange Commission’s Web site, www.sec.gov.
33

1-800-225-5291
1-800-554-6713 (TDD)
1-800-338-8080 EASI-Line
www.jhfunds. com
|
Now available: electronic delivery www.jhfunds. com/edelivery
This report is for the information of
the shareholders of John Hancock
California Tax-Free Income Fund.
ITEM 2. CODE OF ETHICS.
As of the end of the period, February 28, 2006, the registrant has adopted a code of ethics, as defined in Item 2 of Form N-CSR, that applies to its Chief Executive Officer, Chief Financial Officer and Treasurer (respectively, the principal executive officer, the principal financial officer and the principal accounting officer, the “Senior Financial Officers”). A copy of the code of ethics is filed as an exhibit to this Form N-CSR.
The code of ethics was amended effective May 1, 2005 to address new Rule 204A-1 under the Investment Advisers Act of 1940 and to make other related changes.
The most significant amendments were:
(a) Broadening of the General Principles of the code to cover compliance with all federal securities laws.
(b) Eliminating the interim requirements (since the first quarter of 2004) for access persons to preclear their personal trades of John Hancock mutual funds. This was replaced by post-trade reporting and a 30 day hold requirement for all employees.
(c) A new requirement for “heightened preclearance” with investment supervisors by any access person trading in a personal position worth $100,000 or more.
ITEM 3. AUDIT COMMITTEE FINANCIAL EXPERT.
Not applicable at this time.
ITEM 4. PRINCIPAL ACCOUNTANT FEES AND SERVICES.
Not applicable at this time.
ITEM 5. AUDIT COMMITTEE OF LISTED REGISTRANTS.
Not applicable at this time.
ITEM 6. SCHEDULE OF INVESTMENTS.
Not applicable.
ITEM 7. DISCLOSURE OF PROXY VOTING POLICIES AND PROCEDURES FOR CLOSED-END MANAGEMENT INVESTMENT COMPANIES.
Not applicable.
ITEM 8. PORTFOLIO MANAGERS OF CLOSED-END MANAGEMENT INVESTMENT COMPANIES.
Not applicable.
ITEM 9. PURCHASES OF EQUITY SECURITIES BY CLOSED-END MANAGEMENT INVESTMENT COMPANY AND AFFILIATED PURCHASERS.
Not applicable.
ITEM 10. SUBMISSION OF MATTERS TO A VOTE OF SECURITY HOLDERS.
There were no material changes to previously disclosed John Hancock Funds – Administration Committee Charter and John Hancock Funds – Governance Committee Charter.
ITEM 11. CONTROLS AND PROCEDURES.
|
(a) Based upon their evaluation of the registrant's disclosure controls and procedures as conducted within 90 days of the filing date of this Form N-CSR, the registrant's principal executive officer and principal financial officer have concluded that those disclosure controls and procedures provide reasonable assurance that the material information required to be disclosed by the registrant on this report is recorded, processed, summarized and reported within the time periods specified in the Securities and Exchange Commission's rules and forms.
(b) There were no changes in the registrant's internal control over financial reporting that occurred during the registrant's most recent fiscal half-year (the registrant's second fiscal half-year in the case of an annual report) that have materially affected, or are reasonably likely to materially affect, the registrant's internal control over financial reporting.
(a)(1) Code of Ethics for Senior Financial Officers is attached.
(a)(2) Separate certifications for the registrant's principal executive officer and principal financial officer, as required by Section 302 of the Sarbanes-Oxley Act of 2002 and Rule 30a-2(a) under the Investment Company Act of 1940, are attached.
(b) Separate certifications for the registrant's principal executive officer and principal financial officer, as required by 18 U.S.C. Section 1350, as adopted pursuant to Section 906 of the Sarbanes-Oxley Act of 2002, and Rule 30a-2(b) under the Investment Company Act of 1940, are attached. The certifications furnished pursuant to this paragraph are not deemed to be "filed" for purposes of Section 18 of the Securities Exchange Act of 1934, or otherwise subject to the liability of that section. Such certifications are not deemed to be incorporated by reference into any filing under the Securities Act of 1933 or the Securities Exchange Act of 1934, except to the extent that the Registrant specifically incorporates them by reference.
(c) Contact person at the registrant.
|
Pursuant to the requirements of the Securities Exchange Act of 1934 and the Investment Company Act of 1940, the registrant has duly caused this report to be signed on its behalf by the undersigned, thereunto duly authorized.
John Hancock California Tax-Free Income Fund
|
By: /s/ Keith F. Hartstein
-------------------------------------
Keith F. Hartstein
President and Chief Executive Officer
Date: April 24,2006
|
Pursuant to the requirements of the Securities Exchange Act of 1934 and the Investment Company Act of 1940, this report has been signed below by the following persons on behalf of the registrant and in the capacities and on the dates indicated.
By: /s/ Keith F. Hartstein
-------------------------------------
Keith F. Hartstein
President and Chief Executive Officer
Date: April 24,2006
|
By: /s/ John G. Vrysen
-------------------------------------
John G. Vrysen
Executive Vice President and Chief Financial Officer