UNITED STATES
SECURITIES AND EXCHANGE COMMISSION
Washington, D.C. 20549
FORM N-CSR
CERTIFIED SHAREHOLDER REPORT OF REGISTERED
MANAGEMENT INVESTMENT COMPANIES
Investment Company Act file number 811- 5979
John Hancock California Tax-Free Income Fund
(Exact name of registrant as specified in charter)
601 Congress Street, Boston, Massachusetts 02210
(Address of principal executive offices) (Zip code)
Alfred P. Ouellette
Senior Attorney and Assistant Secretary
601 Congress Street
Boston, Massachusetts 02210
(Name and address of agent for service)
Registrant's telephone number, including area code: 617-663-4324
| Date of fiscal year end: | August 31 |
| Date of reporting period: | August 31, 2006 |
ITEM 1. REPORT TO SHAREHOLDERS.

CEO corner
| TABLE OF CONTENTS |
|
| |
| Managers' report |
| page 2 |
|
| |
| A look at performance |
| page 6 |
|
| |
| Your expenses |
| page 8 |
|
| |
| Fund’s investments |
| page 1 0 |
|
| |
| Financial statements |
| page 18 |
|
| |
| Trustees & officers |
| page 34 |
|
| |
| For more information |
| page 40 |
|
To Our Shareholders,
The future has arrived at John Hancock Funds.
We have always been firm believers in the powerful role the Internet can play in providing fund information to our shareholders and prospective investors. Recently, we launched a redesigned, completely overhauled Web site that is more visually pleasing, easier to navigate and, most importantly, provides more fund information and learning tools without overwhelming the user.
Not long after we embarked on this major project, a study was released by the Investment Company Institute, the mutual fund industry’s main trade group, which found that an overwhelming majority of shareholders consider the Internet the “wave of the future” for accessing fund information.
Our new site sports fresher and faster ways to access account information. New innovations allow investors to view funds by risk level, track the performance of the John Hancock funds of their choice or sort funds by Morningstar, Inc.’s star ratings. Investors who own a John Hancock fund through a qualified retirement plan and don’t pay sales charges when making a purchase have the option of sorting by a “Load Waived” Morningstar Rating, thereby creating an apples-to-apples comparison with no-load funds that may also be available in their retirement plan.
The new site also has more educational tools and interactive modules to educate and assist investors with their financial goals, from college savings to retirement planning. A new “I want to…” feature allows investors to check performance, invest more money, update personal information or download prospectuses and forms quickly and easily.
In another of our ongoing efforts to provide our shareholders with top-notch service, we also redesigned our shareholder reports, as you may have noticed with this report. We hope the larger size, more colorful cover and redesigned presentation of the commentary and data tables will draw you in and make them easier to read.
After you’ve read your shareholder report, we encourage you to visit our new Web site — www.jhfunds.com — and take a tour. It’s easy, fast and fun and allows you to be in control of what you see and do. In short, it’s the wave of the future!
Sincerely,

Keith F. Hartstein,
President and Chief Executive Officer
This commentary reflects the CEO’s views as of August 31, 2006. They are subject to change at any time.
Your fund at a glance
The Fund seeks a high level of current income, consistent with preservation of capital, that is exempt from federal and California personal income taxes. In pursuing this goal, the Fund normally invests at least 80% of its assets in securities of any maturity exempt from federal and California personal income tax.
Over the last twelve months
* Municipal bonds gained ground and surpassed the performance of the broad taxable bond market.
* The Fund’s return outpaced its benchmark index.
* Special tax and health care bonds were the best performers in the portfolio, while higher-quality bonds lagged.
| Top 10 holdings | |
| Foothill/Eastern Transportation Corridor Agency, 1-1-34, 6.000% | 4.5% |
|
| Santa Ana Financing Auth, 7-1-24, 6.250% | 3.8% |
|
| San Bernardino, County of, 8-1-17, 5.500% | 2.9% |
|
| Puerto Rico Aqueduct & Sewer Auth, 7-1-11, 7.720% | 2.7% |
|
| California, State of, 3-1-16, 5.754% | 2.2% |
|
| Puerto Rico, Commonwealth of, 7-1-15, 6.500% | 2.2% |
|
| Santa Clara County Financing Auth, 5-15-17, 5.500% | 2.0% |
|
| New Haven Unified School District, 8-1-22, Zero | 1.9% |
|
| California, State of, 4-1-29, 4.750% | 1.9% |
|
| Puerto Rico, Commonwealth of, 7-1-18, 6.360% | 1.7% |
|
| As a percentage of net assets on August 31, 2006. | |
1
Managers’ report
John Hancock
California Tax-Free Income Fund
Continuing a three-year trend, municipal bonds posted positive results for the 12 months ended August 31, 2006, and outperformed the taxable bond market. The Lehman Brothers Municipal Bond Index returned 3.03%, compared with the 1.71% return of the Lehman Brothers U.S. Aggregate Bond Index, a broad measure of the taxable bond market.
In an ongoing effort to keep the economy and inflation from overheating, the Federal Reserve raised short-term interest rates seven times over the past 12 months, for a total of 17 rate hikes since June 2004. The Fed’s efforts boosted the federal funds rate to 5.25%, its highest level in more than five years. The Fed rate hikes, along with solid economic growth and inflation concerns driven largely by record-high energy and commodity prices, pushed interest rates higher across the board.
Although short-term municipal bond yields also rose during the period, long-term municipal yields held firm. As a result, the municipal yield curve flattened as short-term yields approached long-term yields. However, the convergence was less dramatic than in the U.S. Treasury bond market, where the yield curve “inverted” (shorter-term yields surpassed long-term yields).
Through the first eight months of 2006, new municipal bond issuance was down 20% compared with the same period in 2005. This reduction
SCORECARD
| INVESTMENT | | PERIOD’S PERFORMANCE AND WHAT’S BEHIND THE NUMBERS |
| Special tax bonds | ▲ | Benefited from outperformance of lower-quality credits |
| Education revenue bonds p | ▲ | Demand for yield lifts these high-coupon securities |
| Short-term bonds | ▼ | Prices declined as the Fed continued to raise short-term interest rates |
2

Portfolio Managers, MFC Global Investment Management (U.S.) LLC
Dianne Sales, CFA, and Frank A. Lucibella, CFA
in supply contributed positively to municipal bond performance and it also dampened volatility in the municipal market compared with taxable bonds.
“Credit quality in California
remained healthy thanks to
favorable economic conditions.”
Credit environment in California
Credit quality in California remained healthy thanks to favorable economic conditions. Tax revenues continued to improve, allowing the state to make further progress on reducing its debt load and rebuilding its emergency fund. County and local governments, which saw some of their state funding disappear during the recession earlier in the decade, are now benefiting as the state’s fiscal health allows it to meet promised repayments to local governments. Although California still faces some future fiscal challenges, the state has made considerable strides toward closing its budget shortfall. Recognizing the state’s improved fiscal discipline and financial strength, all three major credit rating agencies upgraded California during the past year.
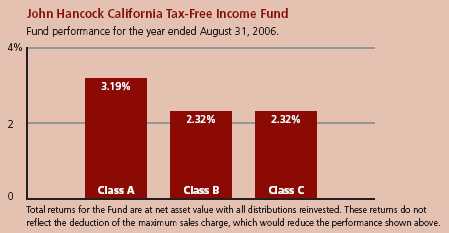
Fund performance
For the year ended August 31, 2006, John Hancock California Tax-Free Income Fund’s Class A, Class B and Class C shares posted total returns of 3.19%, 2.32% and 2.32%, respectively, at net asset value. This performance compared with the 2.80% average return of Morningstar’s Muni California Long fund category1 and the 3.03% return of the Lehman Brothers Municipal Bond Index. Keep in mind that your net asset value return will be different from the Fund’s performance if you were not invested in the Fund for the entire period and did not reinvest all distributions. See pages six and seven for historical performance information.
3 California Tax-Free Income Fund
Lower-rated, higher-yielding bonds outperformed
The primary reason for the Fund’s good performance versus its peer group average and benchmark index was a greater emphasis on lower-quality bonds, which typically offer the highest yields. Municipal bond yields remained relatively low by historical standards and, as a result, demand for yield continued to have a significant impact on municipal bond performance.
Special tax bonds, a significant weighting in the portfolio, posted the best returns during the one-year period. “Special tax” is a broad category, but it is primarily comprised of bonds backed by land development deals and other projects that are funded by a specific tax. Many of these bonds tend to be lower-rated credits. Rising mortgage rates and a weaker housing market have led us to be more cautious on new issues in this sector, but our seasoned holdings are already well built out. Our ongoing focus on strong demographic trends and proximity to employment centers should help us avoid potential land mines in this area.
Other strong performers included health care and education-related bonds, particularly those in the lower credit quality tier. The portfolio also benefited from its exposure to tobacco-related securities, which have relatively high yields. Tobacco bonds are backed by the proceeds from a legal settlement between the major tobacco companies and California (as well as 45 other states).
| SECTOR DISTRIBUTION2 |
| General obligation | |
| bonds | 18% |
| Revenue bonds | |
| Transportation | 15% |
| Special tax | 9% |
| Correctional facilities | 8% |
| Health | 7% |
| Water & sewer | 6% |
| Tobacco | 6% |
| Leasing contracts | 4% |
| Tax allocation | 4% |
| Education | 3% |
| Housing | 2% |
| Economic | |
| development | 2% |
| Pollution | 2% |
| All other | |
| revenue bonds | 13% |
Focus on longer-term bonds
Although rising yields put downward pressure on bonds across all maturities, long-term municipal securities held up better than shorter-term bonds overall. As a result, our positioning at the long end of the maturity spectrum boosted performance relative to our peers. However, we began to trim our exposure to longer-maturity bonds in recent months as the risk premium for these securities narrowed.
High-quality securities lagged
With investor demand focused on the lower end of the credit quality spectrum, higher-rated securities were left behind, producing the weakest returns. General obligation bonds,
44 California Tax-Free Income Fund
which tend to have greater interest rate sensitivity than other municipal securities, were held in check by rising interest rates. Other higher-quality bonds, such as those backed by essential services such as water and sewer, have less sensitivity to the economic environment and therefore did not benefit significantly from the healthy economy.
“The primary reason for the Fund's
good performance versus its peer
group average and benchmark
index was a greater emphasis
on lower-quality bonds...”

Outlook
Although the economy has continued to grow at a solid rate, we have seen evidence of a modest, gradual slowing in economic activity. In addition, despite a few flare-ups, inflation has remained generally under control. As a result, the Fed chose not to raise short-term interest rates at its most recent interest rate policy meeting in August. The Fed’s decision not to act — for the first time in more than two years — provided a lift to the bond market over the past month, but it also sparked speculation about when the Fed’s rate-raising activity will come to an end. Economic data in coming months will determine whether the Fed is done or merely pausing before enacting further rate hikes.
In the municipal market, we expect new issuance to pick up during the remainder of 2006, though it will likely fall short of last year’s levels overall. Yield spreads between short- and long-term bonds, as well as between higher- and lower-quality securities, remain near historically narrow levels. We expect this to change going forward and have positioned the portfolio accordingly.
This commentary reflects the views of the portfolio managers through the end of the Fund’s period discussed in this report. The managers’ statements reflect their own opinions. As such, they are in no way guarantees of future events and are not intended to be used as investment advice or a recommendation regarding any specific security. They are also subject to change at any time as market and other conditions warrant.
1 Figures from Morningstar, Inc. include reinvested dividends and do not take into account sales charges. Actual load-adjusted performance is lower.
2 As a percentage of net assets on August 31, 2006.
5 California Tax-Free Income Fund
A look at performance
For the periods ending August 31, 2006
| | | Average annual returns | | Cumulative total returns | | | SEC 30- |
| | | with maximum sales charge (POP) | with maximum sales charge (POP) | | day yield |
| | Inception | | | | Since | | | | Since | as of |
| Class | date | 1-year | 5-year | 10-year | inception | 1-year | 5-year | 10-year | inception | 8-31-06 |
|
| A | 12-29-89 | –1.43% | 3.47% | 5.12% | — | –1.43% | 18.62% | 64.73% | — | 4.02% |
|
| B | 12-31-91 | –2.61 | 3.21 | 4.95 | — | –2.61 | 17.10 | 62.05 | — | 3.37 |
|
| C | 4-1-99 | 1.34 | 3.54 | — | 3.78% | 1.34 | 19.02 | — | 31.69% | 3.37 |
|
Performance figures assume all distributions are reinvested. Returns with maximum sales charge reflect a sales charge on Class A shares of 4.5% and the applicable contingent deferred sales charge (CDSC) on Class B and Class C shares. The returns for Class C shares have been adjusted to reflect the elimination of the front-end sales charge effective July 15, 2004. The Class B shares’ CDSC declines annually between years 1–6 according to the following schedule: 5, 4, 3, 3, 2, 1%. No sales charge will be assessed after the sixth year. Class C shares held for less than one year are subject to a 1% CDSC.
The returns reflect past results and should not be considered indicative of future performance. The return and principal value of an investment will fluctuate so that shares, when redeemed, may be worth more or less than their original cost. Due to market volatility, the Fund’s current performance may be higher or lower than the performance shown. For performance data current to the most recent month-end, please call 1-800-225-5291 or visit the Fund’s Web site at www.jhfunds.com.
The performance table above and the chart on the next page do not reflect the deduction of taxes that a shareholder would pay on fund distributions or the redemption of fund shares. Please note that a portion of the Fund’s income may be subject to taxes, and some investors may be subject to the Alternative Minimum Tax (AMT). Also note that capital gains are taxable.
The Fund’s performance results reflect any applicable expense reductions, without which the expenses would increase and results would have been less favorable.
6 California Tax-Free Income Fund
Growth of $10,000
This chart shows what happened to a hypothetical $10,000 investment in Class A shares for the period indicated. For comparison, we’ve shown the same investment in the Lehman Brothers Municipal Bond Index.
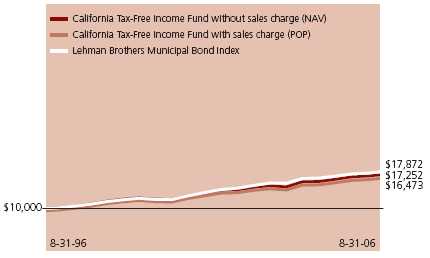
| Class | Period beginning | Without sales charge | With maximum sales charge | Index |
|
| B1 | 8-31-96 | $16,205 | $16,205 | $17,872 |
|
| C1 | 4-1-99 | 13,169 | 13,169 | 14,653 |
|
Assuming all distributions were reinvested for the period indicated, the table above shows the value of a $10,000 investment in the Fund’s Class B and Class C shares, respectively, as of August 31, 2006. The Class C shares investment with maximum sales charge has been adjusted to reflect the elimination of the front-end sales charge effective July 15, 2004. Performance of the classes will vary based on the difference in sales charges paid by shareholders investing in the different classes and the fee structure of those classes.
Lehman Brothers Municipal Bond Index is an unmanaged index that includes municipal bonds and is commonly used as a measure of bond performance. It is not possible to invest directly in an index. Index figures do not reflect sales charges and which would have resulted in lower values if they did.
1 No contingent deferred sales charge applicable.
7 California Tax-Free Income Fund
Your expenses
These examples are intended to help you understand your ongoing operating expenses.
Understanding fund expenses
As a shareholder of the Fund, you incur two types of costs:
■ Transaction costs which include sales charges (loads) on purchases or redemptions (varies by share class), minimum account fee charge, etc.
■ Ongoing operating expenses including management fees, distribution and service fees (if applicable) and other fund expenses.
We are going to present only your ongoing operating expenses here.
Actual expenses/actual returns
This example is intended to provide information about your fund’s actual ongoing operating expenses and is based on your fund’s actual return. It assumes an account value of $1,000.00 on March 1, 2006, with the same investment held until August 31, 2006.
| | Account value | Ending value | Expenses paid during period |
| | on 3-1-06 | on 8-31-06 | ended 8-31-061 |
|
| Class A | $1,000.00 | $1,020.40 | $4.04 |
|
| Class B | 1,000.00 | 1,016.10 | 8.37 |
|
| Class C | 1,000.00 | 1,016.10 | 8.37 |
|
Together with the value of your account, you may use this information to estimate the operating expenses that you paid over the period. Simply divide your account value at August 31, 2006 by $1,000.00, then multiply it by the “expenses paid” for your share class from the table above. For example, for an account value of $8,600.00, the operating expenses should be calculated as follows:
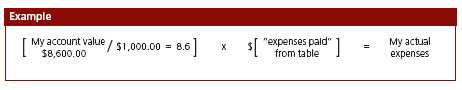
8 California Tax-Free Income Fund
Hypothetical example for comparison purposes
This table allows you to compare your fund’s ongoing operating expenses with those of any other fund. It provides an example of the Fund’s hypothetical account values and hypothetical expenses based on each class’s actual expense ratio and an assumed 5% annual return before expenses (which is not your fund’s actual return). It assumes an account value of $1,000.00 on March 1, 2006, with the same investment held until August 31, 2006. Look in any other fund shareholder report to find its hypothetical example and you will be able to compare these expenses.
| | Account value | Ending value | Expenses paid during period |
| | on 3-1-06 | on 8-31-06 | ended 8-31-061 |
|
| Class A | $1,000.00 | $1,021.20 | $4.04 |
|
| Class B | 1,000.00 | 1,016.90 | 8.37 |
|
| Class C | 1,000.00 | 1,016.90 | 8.37 |
|
Remember, these examples do not include any transaction costs, such as sales charges; therefore, these examples will not help you to determine the relative total costs of owning different funds. If transaction costs were included, your expenses would have been higher. See the prospectus for details regarding transaction costs.
1 Expenses are equal to the Fund's annualized expense ratio of 0.80%, 1.64% and 1.64% for Class A, Class B and Class C, respectively, multiplied by the average account value over the period, multiplied by number of days in most recent fiscal half-year/365 or 366 (to reflect the one-half year period).
9 California Tax-Free Income Fund
F I N A N C I A L S T A T E M E N T S
Fund’s investments
Securities owned by the Fund on 8-31-06
This schedule is divided into two main categories: tax-exempt long-term bonds and short-term investments. Tax-exempt long-term bonds are broken down by state or territory. Under each state or territory is a list of securities owned by the Fund. Short-term investments, which represent the Fund’s cash position, are listed last.
| Interest | Maturity | Credit | Par value | |
| State, issuer, description | rate | date | rating (A) | (000) | Value |
|
| Tax-exempt long-term bonds 99.17% | | | | | $325,158,441 |
| (Cost $298,634,079) | | | | | |
| California 88.82% | | | | | 291,235,878 |
|
| ABAG Finance Authority for Nonprofit Corps, | | | | |
| Rev San Diego Hosp Assn Ser 2001A | 6.125% | 08-15-20 | BBB+ | $2,000 | 2,177,920 |
|
| Anaheim Public Financing Auth, | | | | | |
| Rev Lease Cap Apprec Sub Pub Imp | | | | | |
| Proj Ser 1997C | Zero | 09-01-18 | AAA | 3,000 | 1,800,540 |
|
| Anaheim, City of, | | | | | |
| Rev Ref Cert of Part Reg | | | | | |
| Convention Ctr (P) | 8.515 | 07-16-23 | AAA | 2,000 | 2,172,080 |
|
| Antioch Public Financing Auth, | | | | | |
| Rev Ref Reassessment Sub | | | | | |
| Ser 1998B (G) | 5.850 | 09-02-15 | BB+ | 1,375 | 1,443,118 |
|
| Belmont Community Facilities District, | | | | | |
| Rev Special Tax Dist No. 2000 1 | | | | | |
| Library Proj Ser 2004A | 5.750 | 08-01-24 | Aaa | 1,000 | 1,192,350 |
|
| California County Tobacco | | | | | |
| Securitization Agency, | | | | | |
| Rev Asset Backed Bond | | | | | |
| Fresno County Fdg Corp | 6.000 | 06-01-35 | BBB | 1,765 | 1,856,321 |
| Rev Asset Backed Bond Kern County | | | | | |
| Corp Ser 2002A | 6.125 | 06-01-43 | BBB | 5,000 | 5,290,400 |
| Rev Asset Backed Bond Los Angeles | | | | | |
| County (Step Coupon 5.250%, | | | | | |
| 12-01-10) (O) | Zero | 06-01-21 | Baa3 | 5,000 | 4,176,900 |
| Rev Asset Backed Bond Stanislaus | | | | | |
| Fdg Ser 2002A | 5.500 | 06-01-33 | Baa3 | 1,000 | 1,026,390 |
|
| California Department of Water Resources, | | | | | |
| Rev Pwr Supply Ser 2002A | 5.375 | 05-01-21 | A– | 4,000 | 4,404,320 |
|
| California Educational Facilities Auth, | | | | | |
| Rev Ref Pooled College & Univ | | | | | |
| Financing Ser 1993B | 6.125 | 06-01-09 | Baa2 | 15 | 15,038 |
| Rev Ref Woodbury Univ | 5.000 | 01-01-30 | BBB– | 2,000 | 2,018,860 |
| Rev Univ of San Diego Ser 2002A | 5.500 | 10-01-32 | A2 | 1,435 | 1,531,403 |
See notes to financial statements
10 California Tax-Free Income Fund
F I N A N C I A L S T A T E M E N T S
| | Interest | Maturity | Credit | Par value | |
| State, issuer, description | rate | date | rating (A) | (000) | Value |
| California (continued) | | | | | |
|
| California Health Facilities Financing Auth, | | | | | |
| Rev Catholic Healthcare West | | | | | |
| Ser 2004G | 5.250% | 07-01-23 | A– | $1,000 | $1,054,390 |
| Rev Kaiser Permanente Ser 2006A | 5.250 | 04-01-39 | A+ | 2,500 | 2,628,450 |
| Rev Ref Cedars Sinai Med Ctr | 5.000 | 11-15-34 | A3 | 2,000 | 2,047,440 |
| Rev Ref Insd Hlth Facil-Small Facil | | | | | |
| Ser 1994B | 7.500 | 04-01-22 | A+ | 550 | 557,034 |
|
| California Infrastructure & Economic | | | | | |
| Development Bank, | | | | | |
| Rev J David Gladstone Inst Proj | 5.250 | 10-01-34 | A– | 1,000 | 1,037,060 |
| Rev Kaiser Hosp Asst I LLC Ser 2001A | 5.550 | 08-01-31 | A+ | 3,000 | 3,173,640 |
|
| California Municipal Finance Auth, | | | | | |
| Rev Ref American Heritage | | | | | |
| Education Foundation Proj Ser 2006A | 5.250 | 06-01-26 | BBB– | 1,000 | 1,025,240 |
|
| California Pollution Control Financing Auth, | | | | |
| Rev Poll Control Pacific Gas & Electric | | | | | |
| Ser 1996A | 5.350 | 12-01-16 | AAA | 1,000 | 1,069,660 |
| Rev Solid Waste Disposal Keller | | | | | |
| Canyon Landfill Co Proj | 6.875 | 11-01-27 | BB– | 2,000 | 2,013,620 |
| Rev Chemical Waste Mgmt Inc | | | | | |
| Proj Ser 2005C | 5.125 | 11-01-23 | BBB | 2,000 | 2,074,820 |
|
| California Rural Home Mortgage | | | | | |
| Finance Auth, | | | | | |
| Rev Single Family Mtg Backed Sec’s | | | | | |
| Prog Ser 1996A | 7.750 | 05-01-27 | AAA | 10 | 10,206 |
| Rev Single Family Mtg Backed Sec’s | | | | | |
| Prog Ser 1996A | 7.550 | 11-01-26 | AAA | 10 | 10,195 |
|
| California State Economic Recovery Auth, | | | | | |
| Gen Oblig Unltd Ser 2004B | 5.000 | 07-01-23 | AA– | 2,000 | 2,054,880 |
| Rev Ser 2004C-12 (P) | 3.260 | 07-01-23 | AAA | 900 | 900,000 |
|
| California State Public Works Board, | | | | | |
| Rev Lease Dept of Corrections | | | | | |
| Ser 2003C | 5.500 | 06-01-18 | A | 5,000 | 5,515,950 |
| Rev Ref Lease Dept of Corrections | | | | | |
| State Prisons Ser 1993A | 5.000 | 12-01-19 | AAA | 5,000 | 5,372,150 |
| Rev Ref Lease Various Univ of Calif | | | | | |
| Projs Ser 1993A | 5.500 | 06-01-21 | AA– | 1,250 | 1,251,037 |
|
| California State University, | | | | | |
| Rev Ref Systemwide Ser 2005C | 5.000 | 11-01-38 | AAA | 5,000 | 5,235,550 |
|
| California Statewide Communities | | | | | |
| Development Auth, | | | | | |
| Rev Ref Cert of Part Univ Corp | | | | | |
| Calif State Univ | 6.000 | 04-01-26 | AAA | 1,620 | 1,639,116 |
|
| California Statewide Financing Auth, | | | | | |
| Rev Tobacco Settlement Asset | | | | | |
| Backed Bond 2002A | 6.000 | 05-01-37 | Baa3 | 2,500 | 2,628,125 |
| Rev Tobacco Settlement Asset | | | | | |
| Backed Bond 2002B | 6.000 | 05-01-37 | Baa3 | 4,000 | 4,205,000 |
See notes to financial statements
11 California Tax-Free Income Fund
F I N A N C I A L S T A T E M E N T S
| Interest | Maturity | Credit | Par value | |
| State, issuer, description | rate | date | rating (A) | (000) | Value |
| California (continued) | | | | | |
|
| California, State of, | | | | | |
| Gen Oblig Unltd | 5.125% | 04-01-23 | A+ | $2,000 | $2,131,040 |
| Gen Oblig Unltd | 5.125 | 11-01-24 | A+ | 3,500 | 3,711,715 |
| Gen Oblig Unltd Ref (P) | 5.754 | 03-01-16 | AAA | 6,255 | 7,270,562 |
| Gen Oblig Unltd Ref | 5.000 | 06-01-34 | A+ | 2,000 | 2,069,820 |
| Gen Oblig Unltd Ref | 4.750 | 04-01-29 | AAA | 6,000 | 6,064,740 |
|
| Capistrano Unified School District, | | | | | |
| Rev Spec Tax Cmty Facil Dist No. 90 2 (G) | 6.000 | 09-01-33 | BB | 750 | 792,938 |
| Rev Spec Tax Cmty Facil Dist No. 90 2 (G) | 5.875 | 09-01-23 | BB | 500 | 532,250 |
| Rev Spec Tax Cmty Facil Dist No. 92 1 (G) | 7.100 | 09-01-21 | AA | 2,025 | 2,123,698 |
| Rev Spec Tax Cmty Facil Dist No. 98 2 (G) | 5.750 | 09-01-29 | AA | 2,470 | 2,671,256 |
|
| Carson, City of, | | | | | |
| Rev Spec Assessment Imp Bond Act | | | | | |
| of 1915 Dist No. 2001 1 (G) | 6.375 | 09-02-31 | BB+ | 1,375 | 1,431,182 |
|
| Center Unified School District, | | | | | |
| Gen Oblig Unltd Ref Cap Apprec | | | | | |
| Ser 1997C | Zero | 09-01-16 | AAA | 2,145 | 1,424,838 |
|
| Chula Vista Industrial Development Agency, | | | | | |
| Rev San Diego Gas Ser 2005D | 5.000 | 12-01-27 | A+ | 1,500 | 1,552,125 |
| Rev Ref Tax Alloc Bayfront Ser | | | | | |
| 2006B (G) | 5.250 | 10-01-27 | BB+ | 1,250 | 1,263,887 |
|
| Contra Costa County Public Financing Auth, | | | | | |
| Rev Ref Lease Various Cap Facil | | | | | |
| Ser 1999A | 5.000 | 06-01-28 | AAA | 3,000 | 3,082,770 |
|
| Corona Community Facilities District, | | | | | |
| Rev Special Tax Escrow 97 2 (G) | 5.875 | 09-01-23 | BB+ | 1,345 | 1,397,253 |
|
| Eastern Municipal Water District, | | | | | |
| Rev Cert of Part Wtr & Swr Ser 2006A | 5.000 | 07-01-32 | AAA | 2,965 | 3,112,835 |
|
| Foothill/Eastern Transportation | | | | | |
| Corridor Agency, | | | | | |
| Rev Ref Toll Rd Cap Apprec | Zero | 01-15-25 | BBB– | 6,615 | 2,341,710 |
| Rev Ref Toll Rd Cap Apprec | Zero | 01-15-36 | BBB– | 30,000 | 5,386,200 |
| Rev Ref Toll Rd Sr Lien Ser 1995A | 6.500 | 01-01-32 | AAA | 1,665 | 1,681,750 |
| Rev Ref Toll Rd Sr Lien Ser 1995A | 6.000 | 01-01-34 | AAA | 14,775 | 14,899,406 |
|
| Fresno Joint Powers Financing Auth, | | | | | |
| Rev Ref Ser 1994A | 6.550 | 09-02-12 | BBB+ | 1,100 | 1,102,288 |
|
| Fresno, City of, | | | | | |
| Rev Swr Ser A 1 | 5.250 | 09-01-19 | AAA | 1,000 | 1,122,510 |
|
| Fullerton Community Facilities District, | | | | | |
| Rev Spec Tax Amerige Heights�� | | | | | |
| Dist No. 1 (G) | 6.200 | 09-01-32 | BB | 1,000 | 1,062,290 |
|
| Golden State Tobacco Securitization Corp, | | | | | |
| Rev Asset Backed Bond Ser 2003A | 6.250 | 06-01-33 | BBB | 3,000 | 3,290,550 |
|
| Irvine, City of, | | | | | |
| Rev Meadows Mobile Home Park | | | | | |
| Ser 1998A (G) | 5.700 | 03-01-28 | BBB– | 3,975 | 4,115,715 |
See notes to financial statements
12 California Tax-Free Income Fund
F I N A N C I A L S T A T E M E N T S
| | Interest | Maturity | Credit | Par value | |
| State, issuer, description | rate | date | rating (A) | (000) | Value |
| California (continued) | | | | | |
|
| Irwindale Community Redevelopment Agency, | | | | |
| Rev Ref Tax Alloc Sub Lien | | | | | |
| Ind’l Dev Proj (G) | 7.050% | 06-01-26 | BBB | $2,750 | $2,832,143 |
|
| Laguna Salada Union School District, | | | | | |
| Gen Oblig Unltd Ser 2000C | Zero | 08-01-26 | AAA | 1,000 | 420,280 |
|
| Lancaster School District, | | | | | |
| Rev Ref Cert of Part Cap Apprec | Zero | 04-01-19 | AAA | 1,730 | 1,001,687 |
| Rev Ref Cert of Part Cap Apprec | Zero | 04-01-22 | AAA | 1,380 | 686,633 |
|
| Lee Lake Water District, | | | | | |
| Rev Spec Tax Cmty Facil Dist No. 2 | | | | | |
| Montecito Ranch (G) | 6.125 | 09-01-27 | BB | 1,200 | 1,275,948 |
|
| Long Beach, City of, | | | | | |
| Rev Ref Harbor Ser 1998A | 6.000 | 05-15-18 | AAA | 2,660 | 3,107,040 |
| Rev Spec Tax Cmty Facil | | | | | |
| Dist No. 6 Pike (G) | 6.250 | 10-01-26 | BB– | 2,500 | 2,667,450 |
|
| Los Angeles Community Facilities District, | | | | | |
| Rev Spec Tax No. 3 Cascades | | | | | |
| Business Park Proj (G) | 6.400 | 09-01-22 | BB+ | 1,000 | 1,034,440 |
|
| Los Angeles Community Redevelopment | | | | | |
| Financing Auth, | | | | | |
| Rev MultiFamily Grand Central | | | | | |
| Square Ser 1993A | 5.850 | 12-01-26 | BBB– | 2,000 | 2,001,660 |
|
| Los Angeles Unified School District, | | | | | |
| Gen Oblig Unltd Election of 1997 | | | | | |
| Ser 2002E | 5.500 | 07-01-17 | AAA | 1,500 | 1,652,820 |
|
| Millbrae, City of, | | | | | |
| Rev Magnolia of Millbrae Proj | | | | | |
| Ser 1997A (G) | 7.375 | 09-01-27 | BB | 2,500 | 2,607,350 |
|
| Modesto, City of, | | | | | |
| Rev Spec Tax Cmnty Facs | | | | | |
| Dist No. 04-1 2 (G) | 5.100 | 09-01-26 | BB | 2,000 | 2,029,740 |
|
| New Haven Unified School District, | | | | | |
| Gen Oblig Unltd Cap Apprec | | | | | |
| Ser 1998B | Zero | 08-01-22 | AAA | 14,200 | 6,156,836 |
|
| Northern California Transmission Agency, | | | | | |
| Rev Ref Calif-Oregon Transm Proj | | | | | |
| Ser 1990A | 7.000 | 05-01-13 | AAA | 100 | 116,193 |
|
| Northstar Community Services District, | | | | | |
| Rev Special Tax District No. 1 (G) | 5.550 | 09-01-36 | BB– | 3,000 | 3,081,240 |
|
| Orange Cove Irrigation District, | | | | | |
| Rev Ref Cert of Part Rehab Proj | 5.000 | 02-01-17 | AAA | 2,045 | 2,079,090 |
|
| Orange, County of, | | | | | |
| Rev Ref Spec Assessment Imp Bond | | | | | |
| Act 1915 Ltd Oblig Dist No. 01-1 (G) | 5.000 | 09-02-26 | BB | 500 | 507,475 |
| Rev Spec Assessment Imp Bond Act | | | | | |
| 1915 Ltd Oblig (G) | 5.750 | 09-02-33 | BB | 1,570 | 1,595,293 |
| Rev Spec Tax Cmty Facil Dist No. 1 | | | | | |
| Ladera Ranch Ser 2000A (G) | 6.250 | 08-15-30 | AA | 1,000 | 1,052,490 |
See notes to financial statements
13 California Tax-Free Income Fund
F I N A N C I A L S T A T E M E N T S
| Interest | Maturity | Credit | Par value | |
| State, issuer, description | rate | date | rating (A) | (000) | Value |
| California (continued) | | | | | |
|
| Oxnard, City of, | | | | | |
| Rev Special Tax District No. 3 — | | | | | |
| Seabridge (G) | 5.000% | 09-01-35 | BB | $1,500 | $1,486,395 |
|
| Panama-Buena Vista Union School District, | | | | | |
| Rev Cert of Part School Construction Proj | 5.000 | 09-01-30 | AAA | 3,540 | 3,707,442 |
|
| Paramount Unified School District, | | | | | |
| Gen Oblig Unltd Cap Apprec Bonds | | | | | |
| Ser 2001B | Zero | 09-01-25 | AAA | 4,735 | 2,006,646 |
|
| Pasadena, City of, | | | | | |
| Cert of Part Ref Old Pasadena | | | | | |
| Parking Facil Proj | 6.250 | 01-01-18 | AA– | 1,045 | 1,182,752 |
|
| Poway, City of, | | | | | |
| Rev Ref Cmty Facil Dist No. 88 1 | | | | | |
| Pkwy Business Ctr (G) | 6.750 | 08-15-15 | BB | 1,000 | 1,066,000 |
|
| Rancho Santa Fe Community | | | | | |
| Services District, | | | | | |
| Rev Spec Tax Cmty Facil Dist No. 1 (G) | 6.700 | 09-01-30 | BB | 1,000 | 1,062,510 |
|
| Redondo Beach Public Financing Auth, | | | | | |
| Rev South Bay Center Redevel Proj (G) | 7.000 | 07-01-16 | BBB+ | 950 | 970,700 |
|
| Riverside County Asset Leasing Corp, | | | | | |
| Rev Leasehold Linked Ctfs Riverside | | | | | |
| County Ser 1993A | 6.500 | 06-01-12 | A+ | 1,000 | 1,126,220 |
|
| Sacramento City Financing Auth, | | | | | |
| Rev Convention Ctr Hotel Sr | | | | | |
| Ser 1999A (G) | 6.250 | 01-01-30 | BB+ | 5,000 | 5,247,000 |
|
| Sacramento Municipal Utility District, | | | | | |
| Rev Ref Electric Ser 2001P | 5.250 | 08-15-21 | AAA | 1,000 | 1,060,740 |
|
| San Bernardino, County of, | | | | | |
| Rev Cert of Part Cap Facil Proj | | | | | |
| Ser 1992B | 6.875 | 08-01-24 | AAA | 350 | 456,106 |
| Rev Ref Cert of Part Med Ctr Fin Proj | 5.500 | 08-01-17 | AAA | 8,750 | 9,624,562 |
|
| San Bruno Park School District, | | | | | |
| Gen Oblig Unltd Cap Apprec Ser 2000B | Zero | 08-01-21 | AAA | 1,015 | 525,669 |
| Gen Oblig Unltd Cap Apprec Ser 2000B | Zero | 08-01-23 | AAA | 1,080 | 507,038 |
|
| San Diego County Water Auth, | | | | | |
| Rev Ref Cert of Part Inverse Floater (P) | 5.945 | 04-23-08 | AAA | 1,000 | 1,067,420 |
| Rev Ref Cert of Part Inverse Floater (P) | 5.945 | 04-22-09 | AAA | 400 | 442,400 |
|
| San Diego Redevelopment Agency, | | | | | |
| Rev Ref Tax Alloc Cap Apprec | | | | | |
| Ser 1999B (G) | Zero | 09-01-17 | BB | 1,600 | 907,712 |
| Rev Ref Tax Alloc Cap Apprec | | | | | |
| Ser 1999B (G) | Zero | 09-01-18 | BB | 1,700 | 902,989 |
| Rev Ref Tax Alloc City Heights Proj | | | | | |
| Ser 1999A (G) | 5.800 | 09-01-28 | BB | 1,395 | 1,440,617 |
| Rev Tax Alloc City Heights Proj | | | | | |
| Ser 1999A (G) | 5.750 | 09-01-23 | BB | 1,000 | 1,028,670 |
See notes to financial statements
14 California Tax-Free Income Fund
F I N A N C I A L S T A T E M E N T S
| | Interest | Maturity | Credit | Par value | |
| State, issuer, description | rate | date | rating (A) | (000) | Value |
| California (continued) | | | | | |
|
| San Diego Unified School District, | | | | | |
| Gen Oblig Unltd Cap Apprec Ser 1999A | Zero | 07-01-21 | AAA | $2,500 | $1,299,525 |
| Gen Oblig Unltd Election of 1998 | | | | | |
| Ser 2000B | 5.000% | 07-01-25 | AAA | 2,450 | 2,567,208 |
|
| San Francisco Bay Area Rapid Transit District, | | | | |
| Rev Sales Tax | 5.000 | 07-01-31 | AAA | 3,000 | 3,140,280 |
|
| San Francisco City & County | | | | | |
| Redevelopment Agency, | | | | | |
| Rev Cmty Facil Dist No. 6 Mission | | | | | |
| Ser 2001A (G) | 6.000 | 08-01-25 | BB | 2,500 | 2,619,275 |
| Rev Spec Tax Cmnty Facil Dist No. 6 | | | | | |
| Ser 2005A (G) | 5.150 | 08-01-35 | BB | 1,250 | 1,257,937 |
|
| San Francisco State Building Auth, | | | | | |
| Rev Ref Lease Dept of Gen Serv | | | | | |
| Ser 1993A | 5.000 | 10-01-13 | A | 2,145 | 2,300,706 |
|
| San Joaquin Hills Transportation | | | | | |
| Corridor Agency, | | | | | |
| Rev Ref Toll Rd Conv Cap Apprec | | | | | |
| Ser 1997A Step Coupon (5.750%, | | | | | |
| 01-15-07) (O) | Zero | 01-15-21 | B | 5,000 | 4,923,950 |
| Rev Toll Rd Sr Lien | Zero | 01-01-14 | AAA | 5,000 | 3,755,850 |
| Rev Toll Rd Sr Lien | Zero | 01-01-22 | AAA | 6,500 | 3,315,000 |
|
| San Marcos Public Facilities Auth, | | | | | |
| Rev Sub Tax Increment Proj Area 3 | | | | | |
| Ser 1999A (G) | 6.000 | 08-01-31 | AA | 1,305 | 1,406,633 |
|
| San Mateo County Joint Power Auth, | | | | | |
| Rev Ref Lease Cap Proj Prog | 5.000 | 07-01-21 | AAA | 1,815 | 1,982,397 |
|
| Santa Ana Financing Auth, | | | | | |
| Rev Lease Police Admin & Hldg Facil | | | | | |
| Ser 1994A | 6.250 | 07-01-19 | AAA | 1,790 | 2,158,991 |
| Rev Lease Police Admin & Hldg Facil | | | | | |
| Ser 1994A | 6.250 | 07-01-24 | AAA | 10,000 | 12,300,000 |
| Rev Ref Mainplace Proj Ser 1998D (G) | 5.600 | 09-01-19 | BBB– | 1,000 | 1,079,520 |
|
| Santa Clara County Financing Auth, | | | | | |
| Rev Ref Lease Multiple Facil Projs | | | | | |
| Ser 2000B | 5.500 | 05-15-17 | AAA | 6,000 | 6,432,060 |
|
| Santa Clara, County Of, | | | | | |
| General Obligation Unltd | 5.250 | 09-01-24 | AAA | 2,500 | 2,829,225 |
|
| Santa Margarita Water District, | | | | | |
| Rev Spec Tax Cmty Facil | | | | | |
| Dist No. 99 1 (G) | 6.000 | 09-01-30 | BB+ | 500 | 528,625 |
|
| Santaluz Community Facilities District, | | | | | |
| Rev Spec Tax Dist No. 2 Imp | | | | | |
| Area No. 1 (G) | 6.375 | 09-01-30 | BB | 1,495 | 1,526,485 |
|
| Southern California Public Power Auth, | | | | | |
| Rev Ref Southern Transm Proj | Zero | 07-01-13 | AAA | 4,400 | 3,377,044 |
See notes to financial statements
15 California Tax-Free Income Fund
F I N A N C I A L S T A T E M E N T S
| | Interest | Maturity | Credit | Par value | |
| State, issuer, description | rate | date | rating (A) | (000) | Value |
| California (continued) | | | | | |
|
| Tobacco Securitization Authority of | | | | | |
| Northern California, | | | | | |
| Rev Asset Backed Bond Ser 2001A | 5.375% | 06-01-41 | AAA | $1,000 | $1,079,070 |
|
| Torrance, City of, | | | | | |
| Rev Ref Hosp Torrance Mem Med | | | | | |
| Ctr Ser 2001A | 5.500 | 06-01-31 | A+ | 2,000 | 2,099,160 |
|
| Tustin Unified School District, | | | | | |
| Rev Spec Tax Cmty Facil Dist No. 97 1 | 6.375 | 09-01-35 | AAA | 1,000 | 1,075,550 |
|
| Vallejo Sanitation and Flood Control District, | | | | |
| Rev Ref Cert of Part | 5.000 | 07-01-19 | AAA | 2,500 | 2,735,750 |
|
| West Covina Redevelopment Agency, | | | | | |
| Rev Ref Cmty Facil Dist Fashion | | | | | |
| Plaza Proj | 6.000 | 09-01-22 | AA | 3,000 | 3,475,710 |
| Puerto Rico 10.35% | | | | | 33,922,563 |
|
| Puerto Rico Aqueduct & Sewer Auth, | | | | | |
| Rev Ref Inverse Floater (Gtd)(P) | 7.720 | 07-01-11 | AAA | 7,500 | 8,992,350 |
|
| Puerto Rico Highway & Transportation Auth, | | | | |
| Rev Ref Ser 1996Z | 6.250 | 07-01-14 | AAA | 3,250 | 3,794,473 |
| Rev Ref Ser 1998A | 5.000 | 07-01-38 | AAA | 5,000 | 5,137,350 |
|
| Puerto Rico Ind’l, Tourist, Ed’l, | | | | | |
| Med & Environmental Control Facilities | | | | | |
| Financing Auth, | | | | | |
| Rev Hosp de La Concepcion | | | | | |
| Ser 2000A | 6.500 | 11-15-20 | AA | 500 | 554,600 |
|
| Puerto Rico Public Finance Corp, | | | | | |
| Rev Commonwealth Approp | | | | | |
| Ser 2002E | 5.700 | 08-01-25 | Aaa | 2,500 | 2,668,100 |
|
| Puerto Rico, Commonwealth of, | | | | | |
| Gen Oblig Unltd | 6.500 | 07-01-15 | BBB | 6,000 | 7,057,740 |
| Gen Oblig Unltd Ser 975 (P) | 6.360 | 07-01-18 | Aaa | 5,000 | 5,717,950 |
See notes to financial statements
16 California Tax-Free Income Fund
F I N A N C I A L S T A T E M E N T S
| | Interest | Par value | |
| Issuer, description, maturity date | rate | (000) | Value |
|
| Short-term investments 0.04% | | | $132,000 |
| (Cost $132,000) | | | |
| Joint Repurchase Agreement 0.04% | | | 132,000 |
|
| Investment in a joint repurchase agreement | | | |
| transaction with Barclays Capital, Inc. — | | | |
| Dated 8-31-06 due 9-1-06 (secured | | | |
| by U.S. Treasury Inflation Indexed | | | |
| Note 2.000% due 1-15-16) | 5.240% | $132 | 132,000 |
|
| |
| Total investments (cost $298,766,079) 99.21% | | | $325,290,441 |
|
| |
| Other assets and liabilities, net 0.79% | | | $2,583,994 |
|
| Total net assets 100.00% | | | $327,874,435 |
(A) Credit ratings are unaudited and are rated by Moody's Investors Service or Fitch where Standard & Poor's ratings are not available unless indicated otherwise.
(G) Security rated internally by John Hancock Advisers, LLC.
(O) Cash interest will be paid on this obligation at the stated rate beginning on the stated date.
(P) Represents rate in effect on August 31, 2006.
The percentage shown for each investment category is the total value of that category as a percentage of the net assets of the Fund.
See notes to financial statements
17 California Tax-Free Income Fund
F I N A N C I A L S T A T E M E N T S
Financial statements
Statement of assets and liabilities 8-31-06
This Statement of Assets and Liabilities is the Fund’s balance sheet. It shows the value of what the Fund owns, is due and owes. You’ll also find the net asset value and the maximum offering price per share.
| Assets | |
|
| Investments at value (cost $298,766,079) | $325,290,441 |
| Cash | 12 |
| Receivable for shares sold | 92,453 |
| Interest receivable | 3,978,417 |
| Other assets | 94,666 |
| Total assets | 329,455,989 |
|
| Liabilities | |
|
| Payable for shares repurchased | 1,201,906 |
| Dividends payable | 38,849 |
| Payable to affiliates | |
| Management fees | 157,964 |
| Distribution and service fees | 12,464 |
| Other | 12,207 |
| Other payables and accrued expenses | 158,164 |
| Total liabilities | 1,581,554 |
|
| Net assets | |
|
| Capital paid-in | 302,825,405 |
| Accumulated net realized loss on investments | (1,514,211) |
| Net unrealized appreciation of investments | 26,524,362 |
| Accumulated net investment income | 38,879 |
| Net assets | $327,874,435 |
|
| Net asset value per share | |
|
| Based on net asset values and shares outstanding — the Fund has an | |
| unlimited number of shares authorized with no par value | |
| Class A ($296,480,511 ÷ 27,124,708 shares) | $10.93 |
| Class B ($23,783,869 ÷ 2,175,916 shares) | $10.93 |
| Class C ($7,610,055 ÷ 696,271 shares) | $10.93 |
|
| Maximum offering price per share | |
|
| Class A1 ($10.93 ÷ 95.5%) | $11.45 |
1 On single retail sales of less than $100,000. On sales of $100,000 or more and on group sales the offering price is reduced.
See notes to financial statements
18 California Tax-Free Income Fund
F I N A N C I A L S T A T E M E N T S
Statement of operations For the year ended 8-31-06.
This Statement of Operations summarizes the Fund’s investment income earned and expenses incurred in operating the Fund. It also shows net gains (losses) for the period stated.
| Investment income | |
|
| Interest | $17,802,436 |
| Total investment income | 17,802,436 |
|
| Expenses | |
|
| Investment management fees | 1,827,595 |
| Class A distribution and service fees | 445,562 |
| Class B distribution and service fees | 282,021 |
| Class C distribution and service fees | 70,462 |
| Transfer agent fees | 139,457 |
| Accounting and legal services fees | 67,102 |
| Trustees’ fees | 17,451 |
| Compliance fees | 12,684 |
| Custodian fees | 81,392 |
| Professional fees | 40,933 |
| Printing | 30,371 |
| Registration and filing fees | 13,194 |
| Interest | 384 |
| Miscellaneous | 9,741 |
| Total expenses | 3,038,349 |
| Less expense reductions | (2,153) |
| Net expenses | 3,036,196 |
| Net investment income | 14,766,240 |
|
| Realized and unrealized gain (loss) | |
|
| Net realized gain on investments | 2,994,563 |
| Change in net unrealized appreciation (depreciation) of investments | (7,884,136) |
| Net realized and unrealized loss | (4,889,573) |
| Increase in net assets from operations | $9,876,667 |
See notes to financial statements
19 California Tax-Free Income Fund
F I N A N C I A L S T A T E M E N T S
Statement of changes in net assets
These Statements of Changes in Net Assets show how the value of the Fund’s net assets has changed during the last two periods. The difference reflects earnings less expenses, any investment gains and losses, distributions, if any, paid to shareholders and the net of Fund share transactions.
| | Year | Year |
| | ended | ended |
| | 8-31-051 | 8-31-06 |
|
| Increase (decrease) in net assets | | |
|
| From operations | | |
| Net investment income | $15,744,752 | $14,766,240 |
| Net realized gain (loss) | (604,637) | 2,994,563 |
| Change in net unrealized appreciation (depreciation) | 6,043,149 | (7,884,136) |
| Increase in net assets resulting from operations | 21,183,264 | 9,876,667 |
| Distributions to shareholders | | |
| From net investment income | | |
| Class A | (13,877,944) | (13,401,500) |
| Class B | (1,376,242) | (1,031,238) |
| Class C | (256,995) | (257,800) |
| | (15,511,181) | (14,690,538) |
| From Fund share transactions | (17,981,803) | (12,939,321) |
| Net assets | | |
|
| Beginning of period | 357,937,347 | 345,627,627 |
| End of period2 | $345,627,627 | $327,874,435 |
1 Audited by previous auditor.
2 Includes accumulated net investment income of $38,879 and $38,879, respectively.
See notes to financial statements
20 California Tax-Free Income Fund
F I N A N C I A L S T A T E M E N T S
Financial highlights
The Financial highlights show how the Fund’s net asset value for a share has changed since the end of the previous period.
| CLASS A SHARES | | | | | |
| |
| Period ended | 8-31-021,2 | 8-31-031 | 8-31-041 | 8-31-051 | 8-31-06 |
|
| Per share operating performance | | | | | |
|
| Net asset value, beginning of period | $11.11 | $11.06 | $10.60 | $10.91 | $11.08 |
| Net investment income3 | 0.54 | 0.53 | 0.52 | 0.51 | 0.49 |
| Net realized and unrealized | | | | | |
| gain (loss) on investments | (0.06) | (0.47) | 0.30 | 0.16 | (0.15) |
| Total from investment operations | 0.48 | 0.06 | 0.82 | 0.67 | 0.34 |
| Less distributions | | | | | |
| From net investment income | (0.53) | (0.52) | (0.51) | (0.50) | (0.49) |
| Net asset value, end of period | $11.06 | $10.60 | $10.91 | $11.08 | $10.93 |
| Total return4 (%) | 4.525 | 0.48 | 7.84 | 6.24 | 3.19 |
|
| Ratios and supplemental data | | | | | |
| Net assets, end of period | | | | | |
| (in millions) | $347 | $308 | $308 | $306 | $296 |
| Ratio of net expenses to average | | | | | |
| net assets (%) | 0.84 | 0.84 | 0.83 | 0.86 | 0.82 |
| Ratio of gross expenses to average | | | | | |
| net assets (%) | 0.846 | 0.84 | 0.83 | 0.86 | 0.826 |
| Ratio of net investment income | | | | | |
| to average net assets (%) | 4.95 | 4.79 | 4.72 | 4.59 | 4.53 |
| Portfolio turnover (%) | 15 | 18 | 21 | 13 | 33 |
See notes to financial statements
21 California Tax-Free Income Fund
F I N A N C I A L S T A T E M E N T S
Financial highlights
| CLASS B SHARES | | | | | |
| |
| Period ended | 8-31-021,2 | 8-31-031 | 8-31-041 | 8-31-051 | 8-31-06 |
|
| Per share operating performance | | | | | |
|
| Net asset value, beginning of period | $11.11 | $11.06 | $10.60 | $10.91 | $11.08 |
| Net investment income3 | 0.45 | 0.44 | 0.42 | 0.41 | 0.40 |
| Net realized and unrealized | | | | | |
| gain (loss) on investments | (0.06) | (0.47) | 0.31 | 0.16 | (0.15) |
| Total from investment operations | 0.39 | (0.03) | 0.73 | 0.57 | 0.25 |
| Less distributions | | | | | |
| From net investment income | (0.44) | (0.43) | (0.42) | (0.40) | (0.40) |
| Net asset value, end of period | $11.06 | $10.60 | $10.91 | $11.08 | $10.93 |
| Total return4 (%) | 3.675 | (0.37) | 6.93 | 5.35 | 2.32 |
|
| Ratios and supplemental data | | | | | |
|
| Net assets, end of period | | | | | |
| (in millions) | $65 | $55 | $43 | $32 | $24 |
| Ratio of net expenses to average | | | | | |
| net assets (%) | 1.65 | 1.69 | 1.69 | 1.71 | 1.67 |
| Ratio of gross expenses to average | | | | | |
| net assets (%) | 1.696 | 1.69 | 1.69 | 1.71 | 1.676 |
| Ratio of net investment income | | | | | |
| to average net assets (%) | 4.14 | 3.95 | 3.87 | 3.75 | 3.68 |
| Portfolio turnover (%) | 15 | 18 | 21 | 13 | 33 |
See notes to financial statements
22 California Tax-Free Income Fund
F I N A N C I A L S T A T E M E N T S
Financial highlights
| CLASS C SHARES | | | | | |
| |
| Period ended | 8-31-021,2 | 8-31-031 | 8-31-041 | 8-31-051 | 8-31-06 |
|
| Per share operating performance | | | | | |
|
| Net asset value, beginning of period | $11.11 | $11.06 | $10.60 | $10.91 | $11.08 |
| Net investment income3 | 0.45 | 0.43 | 0.42 | 0.41 | 0.40 |
| Net realized and unrealized | | | | | |
| gain (loss) on investments | (0.06) | (0.47) | 0.31 | 0.16 | (0.15) |
| Total from investment operations | 0.39 | (0.04) | 0.73 | 0.57 | 0.25 |
| Less distributions | | | | | |
| From net investment income | (0.44) | (0.42) | (0.42) | (0.40) | (0.40) |
| Net asset value, end of period | $11.06 | $10.60 | $10.91 | $11.08 | $10.93 |
| Total return4 (%) | 3.645 | (0.37) | 6.93 | 5.35 | 2.32 |
|
| Ratios and supplemental data | | | | | |
|
| Net assets, end of period | | | | | |
| (in millions) | $8 | $9 | $7 | $7 | $8 |
| Ratio of net expenses to average | | | | | |
| net assets (%) | 1.69 | 1.69 | 1.69 | 1.71 | 1.67 |
| Ratio of gross expenses to average | | | | | |
| net assets (%) | 1.696 | 1.69 | 1.69 | 1.71 | 1.676 |
| Ratio of net investment income | | | | | |
| to average net assets (%) | 4.10 | 3.93 | 3.87 | 3.74 | 3.68 |
| Portfolio turnover (%) | 15 | 18 | 21 | 13 | 33 |
1 Audited by previous auditor.
2 As required, effective 9-1-01, the Fund adopted the provisions of the AICPA Audit and Accounting Guide for Investment Companies, as revised, relating to the amortization of premiums and accretion of discounts on debt securities. The effect of this change on per share amounts for the year ended 8-31-02 was to increase net investment income per share by $0.01, increase net realized and unrealized losses per share by $0.01 and, had the Fund not made these changes to amortization and accretion, the ratio of net investment income to average net assets would have been 4.88%, 4.07% and 4.03%, for Class A, Class B and Class C shares, respectively. Per share ratios and supplemental data for periods prior to 9-1-01 have not been restated to reflect this change in presentation.
3 Based on the average of the shares outstanding.
4 Assumes dividend reinvestment and does not reflect the effect of sales charges.
5 Total returns would have been lower had certain expenses not been reduced during the periods shown.
6 Does not take into consideration expense reductions during the period shown.
See notes to financial statements
23 California Tax-Free Income Fund
Notes to financial statements
Note A Accounting policies
John Hancock California Tax-Free Income Fund (the “Fund”) is a non-diversified open-end management investment company registered under the Investment Company Act of 1940, as amended. The Fund seeks a high level of current income, consistent with the preservation of capital, that is exempt from federal and California personal income taxes. Since the Fund invests primarily in California issuers, the Fund may be affected by political, economic or regulatory developments in the state of California.
The Trustees have authorized the issuance of multiple classes of shares of the Fund, designated as Class A, Class B and Class C shares. The shares of each class represent an interest in the same portfolio of investments of the Fund and have equal rights as to voting, redemptions, dividends and liquidation, except that certain expenses, subject to the approval of the Trustees, may be applied differently to each class of shares in accordance with current regulations of the Securities and Exchange Commission and the Internal Revenue Service. Shareholders of a class that bears distribution and service expenses under the terms of a distribution plan have exclusive voting rights to that distribution plan.
Significant accounting policies of the Fund are as follows: Valuation of investments
Securities in the Fund’s portfolio are valued on the basis of market quotations, valuations provided by independent pricing services or at fair value as determined in good faith in accordance with procedures approved by the Trustees. Short-term debt investments which have a remaining maturity of 60 days or less may be valued at amortized cost, which approximates market value.
Joint repurchase agreement
Pursuant to an exemptive order issued by the Securities and Exchange Commission, the Fund, along with other registered investment companies having a management contract with John Hancock Advisers, LLC (the “Adviser”), a wholly owned subsidiary of John Hancock Financial Services, Inc., a subsidiary of Manulife Financial Corporation (“MFC”), may participate in a joint repurchase agreement transaction. Aggregate cash balances are invested in one or more large repurchase agreements, whose underlying securities are obligations of the U.S. government and/or its agencies. The Fund’s custodian bank receives delivery of the underlying securities for the joint account on the Fund’s behalf. The Adviser is responsible for ensuring that the agreement is fully collateralized at all times.
Investment transactions
Investment transactions are accounted for on a trade date plus one basis for daily net asset value calculations. However, for financial reporting purposes, investment transactions are reported on trade date. Net realized gains and losses on sales of investments are determined on the identified cost basis.
Discount and premium on securities
The Fund accretes discount and amortizes premium from par value on securities from either the date of issue or the date of purchase over the life of the security.
Class allocations
Income, common expenses and realized and unrealized gains (losses) are determined at the fund level and allocated daily to each class of shares based on the appropriate net asset value of the respective classes. Distribution and service fees, if any, are calculated daily at the class level based on the appropriate net asset value of each class and the specific expense rate(s) applicable to each class.
24 California Tax-Free Income Fund
Expenses
The majority of expenses are directly identifi-able to an individual fund. Expenses that are not readily identifiable to a specific fund are allocated in such a manner as deemed equitable, taking into consideration, among other things, the nature and type of expense and the relative sizes of the funds.
Bank borrowings
The Fund is permitted to have bank borrowings for temporary or emergency purposes, including the meeting of redemption requests that otherwise might require the untimely disposition of securities. The Fund has entered into a syndicated line of credit agreement with various banks. This agreement enables the Fund to participate with other funds managed by the Adviser, in an unsecured line of credit with banks, which permits borrowings of up to $150 million, collectively. Interest is charged to each fund based on its borrowing. In addition, a commitment fee is charged to each fund based on the average daily unused portion of the line of credit and is allocated among the participating funds. The Fund had no borrowing activity under the line of credit during the year ended August 31, 2006.
Federal income taxes
The Fund qualifies as a “regulated investment company” by complying with the applicable provisions of the Internal Revenue Code and will not be subject to federal income tax on taxable income that is distributed to shareholders. Therefore, no federal income tax provision is required. For federal income tax purposes, the Fund has $1,072,410 of a capital loss car-ryforward available, to the extent provided by regulations, to offset future net realized capital gains. To the extent that such carryforward is used by the Fund, no capital gains distributions will be made. The loss carryforward expires as follows: August 31, 2011 — $481,714 and August 31, 2012 — $590,696.
New accounting pronouncements
In June 2006, Financial Accounting Standards Board (FASB) Interpretation No. 48, Accounting for Uncertainty in Income Taxes (the “Interpretation”) was issued, and is effective for fiscal years beginning after December 15, 2006, and is to be applied to all open tax years as of the effective date. The Interpretation prescribes a minimum threshold for financial statement recognition of the benefit of a tax position taken, or expected to be taken, in a tax return and requires certain expanded disclosures. Management is currently evaluating the application of the Interpretation to the Fund and has not at this time quantified the impact, if any, resulting from the adoption of the Interpretation on the Fund’s financial statements.
In September 2006, FASB Standard No. 157, Fair Value Measurements (the “FAS 157”) was issued, and is effective for fiscal years beginning after November 15, 2007. FAS 157 defines fair value, establishing a framework for measuring fair value and expands disclosure about fair value measurements. Management is currently evaluating the application of FAS 157 to the Fund, and its impact, if any, resulting from the adoption of FAS 157 on the Fund’s financial statements.
Interest and distributions
Interest income on investment securities is recorded on the accrual basis.
The Fund records distributions to shareholders from net investment income and net realized gains, if any, on the ex-dividend date. The Fund’s net investment income is declared daily as dividends to shareholders of record as of the close of business on the preceding day and distributed monthly. During the year ended August 31, 2005, the tax character of distributions paid was as follows: ordinary income $22,959 and exempt income $15,488,222. During the year ended August 31, 2006, the tax character of distributions paid was as follows: ordinary income $94,280 and exempt income $14,596,258. Distributions paid by the Fund with respect to each class of shares are calculated in the same manner, at the same time and are in the same amount, except for the effect of expenses that may be applied differently to each class.
As of August 31, 2006, the components of distributable earnings on a tax basis included $145,175 of undistributed exempt income.
25 California Tax-Free Income Fund
Such distributions and distributable earnings, on a tax basis, are determined in conformity with income tax regulations, which may differ from accounting principles generally accepted in the United States of America. Distributions in excess of tax basis earnings and profits, if any, are reported in the Fund’s financial statements as a return of capital.
Use of estimates
The preparation of these financial statements, in accordance with accounting principles generally accepted in the United States of America, incorporates estimates made by management in determining the reported amount of assets, liabilities, revenues and expenses of the Fund. Actual results could differ from these estimates.
Note B
Management fee and transactions with affiliates and others
The Fund has an investment management contract with the Adviser. Under the investment management contract, the Fund pays a monthly management fee to the Adviser equivalent, on an annual basis, to the sum of: (a) 0.55% of the first $500,000,000 of the Fund's average daily net asset value and (b) 0.50% of the Fund's average daily net asset value in excess of $500,000,000.
Effective December 31, 2005, the investment management teams of the Adviser were reorganized into Sovereign Asset Management LLC (“Sovereign”), a wholly owned indirect subsidiary of John Hancock Life Insurance Company (“JHLICO”), a subsidiary of MFC. The Adviser remains the principal advisor on the Fund and Sovereign acts as subadviser under the supervision of the Adviser. The restructuring did not have an impact on the Fund, which continues to be managed using the same investment philosophy and process. The Fund is not responsible for payment of the subadvisory fees.
Effective October 1, 2006, Sovereign changed its name to MFC Global Investment Management (U.S.), LLC.
The Fund has an agreement with its custodian bank, under which custody fees are reduced by balance credits applied during the period. Accordingly, the expense reductions related to custody fee offsets amounted to $2,153, which had no impact on the Fund’s ratio of expenses to average net assets, for the year ended August 31, 2006. If the Fund had not entered into this agreement, the assets not invested, on which these balance credits were earned, could have produced taxable income.
The Fund has a Distribution Agreement with John Hancock Funds, LLC (“JH Funds”), a wholly owned subsidiary of the Adviser. The Fund has adopted Distribution Plans with respect to Class A, Class B and Class C, pursuant to Rule 12b-1 under the Investment Company Act of 1940, as amended, to reimburse JH Funds for the services it provides as distributor of shares of the Fund. Accordingly, the Fund makes monthly payments to JH Funds at an annual rate not to exceed 0.15% of Class A average daily net asset value and 1.00% of Class B and Class C average daily net asset value. A maximum of 0.25% of such payments may be service fees, as defined by the Conduct Rules of the National Association of Securities Dealers. Under the Conduct Rules, curtailment of a portion of the Fund’s 12b-1 payments could occur under certain circumstances.
Class A shares are assessed up-front sales charges. During the year ended August 31, 2006, JH Funds received net up-front sales charges of $236,269 with regard to sales of Class A shares. Of this amount, $31,219 was retained and used for printing prospectuses, advertising, sales literature and other purposes; $201,217 was paid as sales commissions to unrelated broker-dealers and $3,833 was paid as sales commissions to sales personnel of Signator Investors, Inc. (“Signator Investors”), a related broker-dealer. The Adviser’s indirect parent, JHLICO, is the indirect sole shareholder of Signator Investors.
Class B shares that are redeemed within six years of purchase are subject to a contingent deferred sales charge (“CDSC”) at declining rates, beginning at 5.00% of the lesser of the current market value at the time of redemption or the original purchase cost of the shares being redeemed. Class C shares that are redeemed within one year of purchase are subject to a CDSC at a rate of 1.00% of the
26 California Tax-Free Income Fund
lesser of the current market value at the time of redemption or the original purchase cost of the shares being redeemed. Proceeds from the CDSCs are paid to JH Funds and are used, in whole or in part, to defray its expenses for providing distribution-related services to the Fund in connection with the sale of Class B and Class C shares. During the period ended August 31, 2006, CDSCs received by JH Funds amounted to $34,240 for Class B shares and $631 for Class C shares.
The Fund has a transfer agent agreement with John Hancock Signature Services, Inc. (“Signature Services”), an indirect subsidiary of JHLICO. The Fund pays a monthly transfer agent fee at an annual rate of 0.01% of each class’s average daily net asset values, plus a fee based on the number of shareholder accounts and reimbursement for certain out-of-pocket expenses, aggregated and allocated to each class on the basis of its relative net asset value. Signature Services agreed to voluntarily reduce the Fund’s asset-based portion of the transfer agent fee if the total transfer agent fee exceeded the median transfer agency fee for comparable mutual funds by greater than 0.05% . There were no transfer agent fee reductions during the year ended August 31, 2006. Signature Services terminated this agreement June 30, 2006.
The Fund has an agreement with the Adviser and affiliates to perform necessary tax, accounting and legal services for the Fund. The compensation for the year amounted to $67,102. The Fund also paid the Adviser the amount of $1,518 for certain publishing services, included in the printing fees. The Fund reimbursed JHLICO for certain compliance costs, included in the Fund’s Statement of Operations.
Mr. James R. Boyle is Chairman of the Adviser, as well as affiliated Trustee of the Fund, and is compensated by the Adviser and/or its affiliates. The compensation of unaffiliated Trustees is borne by the Fund. The unaf-filiated Trustees may elect to defer, for tax purposes, their receipt of this compensation under the John Hancock Group of Funds Deferred Compensation Plan. The Fund makes investments into other John Hancock funds, as applicable, to cover its liability for the deferred compensation. Investments to cover the Fund’s deferred compensation liability are recorded on the Fund’s books as an other asset. The deferred compensation liability and the related other asset are always equal and are marked to market on a periodic basis to reflect any income earned by the investments, as well as any unrealized gains or losses. The Deferred Compensation Plan investments had no impact on the operations of the Fund.
27 California Tax-Free Income Fund
Note C
Fund share transactions
This listing illustrates the number of Fund shares sold, reinvested and repurchased during the last two periods, along with the corresponding dollar value.
| | | Year ended 8-31-051 | | Year ended 8-31-06 |
| | Shares | Amount | Shares | Amount |
|
| Class A shares | | | | |
|
| Sold | 1,835,453 | $20,153,842 | 2,004,815 | $21,719,304 |
| Distributions reinvested | 689,490 | 7,582,188 | 679,611 | 7,377,136 |
| Repurchased | (3,151,735) | (34,610,300) | (3,193,562) | (34,676,276) |
| Net decrease | (626,792) | ($6,874,270) | (509,136) | ($5,579,836) |
|
| Class B shares | | | | |
|
| Sold | 85,824 | $944,688 | 145,122 | $1,582,348 |
| Distributions reinvested | 64,621 | 710,249 | 50,615 | 549,557 |
| Repurchased | (1,131,286) | (12,430,218) | (947,874) | (10,292,087) |
| Net decrease | (980,841) | ($10,775,281) | (752,137) | ($8,160,182) |
|
| Class C shares | | | | |
|
| Sold | 129,415 | $1,420,917 | 156,607 | $1,702,088 |
| Distributions reinvested | 12,434 | 136,593 | 12,137 | 131,707 |
| Repurchased | (171,648) | (1,889,762) | (95,189) | (1,033,098) |
| Net increase (decrease) | (29,799) | ($332,252) | 73,555 | $800,697 |
|
| Net decrease | (1,637,432) | ($17,981,803) | (1,187,718) | ($12,939,321)) |
1Audited by previous auditor.
Note D
Investment transactions
Purchases and proceeds from sales or maturities of securities, other than short-term securities and obligations of the U.S. government, during the year ended August 31, 2006, aggregated $109,726,698 and $123,624,432, respectively.
The cost of investments owned on August 31, 2006, including short-term investments, for federal income tax purposes was $297,399,663. Gross unrealized appreciation and depreciation of investments aggregated $27,914,444 and $23,666, respectively, resulting in net unrealized appreciation of $27,890,778. The difference between book basis and tax basis net unrealized appreciation of investments is attributable primarily to amortization of premiums and accretion of discounts on debt securities.
Note E
Reclassification of accounts
During the year ended August 31, 2006, the Fund reclassified amounts to reflect a decrease in accumulated net realized loss on investments of $51,303, a decrease in accumulated net investment income of $75,702 and an increase in capital paid-in of $24,399. This represents the amounts necessary to report these balances on a tax basis, excluding certain temporary differences, as of August 31, 2006. Additional adjustments may be needed in subsequent reporting periods. These reclassifications, which have no impact on the net asset value of the Fund, are primarily attributable to certain differences in the computation of distributable income and capital gains under federal tax rules versus accounting principles generally accepted in the United States of America, book and tax differences in accounting for amortization of premium on debt securities. The calculation of net investment income per share in the Fund’s Financial Highlights excludes these adjustments.
28 California Tax-Free Income Fund
Auditors’ report
Report of Independent Registered Public Accounting Firm
To the Board of Trustees and Shareholders of John Hancock California Tax-Free Income Fund,
In our opinion, the accompanying statement of assets and liabilities, including the schedule of investments, and the related statements of operations and of changes in net assets and the financial highlights present fairly, in all material respects, the financial position of John Hancock California Tax-Free Income Fund (the “Fund”) as of August 31, 2006, the results of its operations, the changes in its net assets and the financial highlights for the year then ended, in conformity with accounting principles generally accepted in the United States of America. These financial statements and financial highlights (hereafter referred to as “financial statements”) are the responsibility of the Fund’s management; our responsibility is to express an opinion on these financial statements based on our audit. We conducted our audit of these financial statements in accordance with the standards of the Public Company Accounting Oversight Board (United States). Those standards require that we plan and perform the audit to obtain reasonable assurance about whether the financial statements are free of material misstatement. An audit includes examining, on a test basis, evidence supporting the amounts and disclosures in the financial statements, assessing the accounting principles used and significant estimates made by management, and evaluating the overall financial statement presentation. We believe that our audit, which included confirmation of securities as of August 31, 2006 by correspondence with the custodian and brokers, provide a reasonable basis for our opinion. The statement of changes in net assets of the Fund for the year ended August, 31 2005 and the financial highlights for each of the period ended on or before August 31, 2005 were audited by another independent registered public accounting firm, whose report dated October 7, 2005 expressed an unqualified opinion thereon.
PricewaterhouseCoopers LLP
Boston, Massachusetts
October 18, 2006
29
Tax information
Unaudited
For federal income tax purposes, the following information is furnished with respect to the distributions of the Fund, if any, paid during its taxable year ended August 31, 2006.
None of the 2006 income dividends qualify for the corporate dividends-received deduction. Shareholders who are not subject to the alternative minimum tax received income dividends that are 99.36% tax-exempt. The percentage of income dividends from the Fund subject to the alternative minimum tax is 4.41% . None of the income dividends were derived from U.S. Treasury Bills.
For specific information on exception provisions in your state, consult your local state tax officer or your tax adviser. Shareholders will be mailed a 2006 U.S. Treasury Department Form 1099-DIV in January 2007. This will reflect the total of all distributions that are taxable for calendar year 2006.
30
Board Consideration of and Continuation of Investment Advisory Agreement and Sub-Advisory Agreement: John Hancock California Tax-Free Income Fund
The Investment Company Act of 1940 (the “1940 Act”) requires the Board of Trustees (the “Board”) of John Hancock California Tax-Free Income Fund (the “Trust”), including a majority of the Trustees who have no direct or indirect interest in the investment advisory agreement and are not “interested persons” of the Trust, as defined in the 1940 Act (the “Independent Trustees”), annually to review and consider the continuation of: (i) the investment advisory agreement (the “Advisory Agreement”) with John Hancock Advisers, LLC (the “Adviser”) and (ii) the investment sub-advisory agreement (the “Sub-Advisory Agreement”) with Sovereign Asset Management LLC (the “Sub-Adviser”) for the John Hancock California Tax-Free Income Fund (the “Fund”). The Advisory Agreement and the Sub-Advisory Agreement are collectively referred to as the “Advisory Agreements.”
At meetings held on May 1-2 and June 5-6,1 2006, the Board considered the factors and reached the conclusions described below relating to the selection of the Adviser and Sub-Adviser and the continuation of the Advisory Agreements. During such meetings, the Board’s Contracts/Operations Committee and the Independent Trustees also met in executive sessions with their independent legal counsel.
In evaluating the Advisory Agreements, the Board, including the Contracts/Operations Committee and the Independent Trustees, reviewed a broad range of information requested for this purpose by the Independent Trustees, including: (i) the investment performance of the Fund relative to a category of relevant funds (the “Category”) and a peer group of comparable funds (the “Peer Group”) each selected by Morningstar Inc. (“Morningstar”), an independent provider of investment company data, for a range of periods ended December 31, 2005; (ii) advisory and other fees incurred by, and the expense ratios of, the Fund relative to a Category and a Peer Group; (iii) the advisory fees of comparable portfolios of other clients of the Adviser and the Sub-Adviser; (iv) the Adviser’s financial results and condition, including its, and certain of its affiliates’, profitability from services performed for the Fund ; (v) breakpoints in the Fund’s and the Peer Group’s fees and information about economies of scale; (vi) the Adviser’s and Sub-Adviser’s record of compliance with applicable laws and regulations with the Fund’s investment policies and restrictions and with the applicable Code of Ethics, and the structure and responsibilities of the Adviser’s and Sub-Adviser’s compliance department; (vii) the background and experience of senior management and investment professionals and (viii) the nature, cost and character of advisory and non-investment management services provided by the Adviser and its affiliates and by the Sub-Adviser.
The Board’s review and conclusions were based on a comprehensive consideration of all information presented to the Board and not the result of any single controlling factor. It was based on performance and other information as of December 31, 2005; facts may have changed between that date and the date of this shareholders report. The key factors considered by the Board and the conclusions reached are described below.
Nature, extent and quality of services
The Board considered the ability of the Adviser and the Sub-Adviser, based on their resources, reputation and other attributes, to attract and retain qualified investment professionals, including research, advisory and supervisory personnel. The Board further considered the compliance programs and compliance records of the Adviser and Sub-Adviser. In addition, the Board took into account the administrative services provided to the Fund by the Adviser and its affiliates.
Based on the above factors, together with those referenced below, the Board concluded that, within the context of its full deliberations, the nature, extent and quality of the investment advisory services provided to the Fund by the Adviser and Sub-Adviser were sufficient to support renewal of the Advisory Agreements.
31
Fund performance
The Board considered the performance results for the Fund over various time periods ended December 31, 2005. The Board also considered these results in comparison to the performance of the Category, as well as the Fund’s benchmark index. Morningstar determined the Category and Peer Group for the Fund. The Board reviewed with a representative of Morningstar the methodology used by Morningstar to select the funds in the Category and the Peer Group.
The Board noted that the Fund’s performance during the periods under review was generally competitive with the performance of the Peer Group and Category medians, and its benchmark index, the Lehman Brothers Municipal CA Index. The Board noted that, for the 3-, 5- and 10-year periods under review, the Fund’s performance was equal to or not appreciably lower than the performance of the Peer Group median, and was lower than the performance of the Category median and benchmark index. The Board viewed favorably that the more recent performance of the Fund for the 1-year period ended December 31, 2005 was higher than the performance of the Peer Group and Category medians and not appreciably lower than the benchmark index.
Investment advisory fee and sub-advisory fee rates and expenses
The Board reviewed and considered the contractual investment advisory fee rate payable by the Fund to the Adviser for investment advisory services (the “Advisory Agreement Rate”). The Board received and considered information comparing the Advisory Agreement Rate with the advisory fees for the Peer Group and Category. The Board noted that the Advisory Agreement Rate was not appreciably higher than the median rate of the Peer Group and Category.
The Board received and considered expense information regarding the Fund’s various components, including advisory fees, distribution and fees other than advisory and distribution fees, including transfer agent fees, custodian fees, and other miscellaneous fees (e.g., fees for accounting and legal services). The Board considered comparisons of these expenses to the Peer Group median. The Board also received and considered expense information regarding the Fund’s total operating expense ratio (“Expense Ratio”). The Board received and considered information comparing the Expense Ratio of the Fund to that of the Category and Peer Group medians. The Board noted that the Fund’s Expense Ratio was equal to or not appreciably higher than the Category and Peer Group medians.
The Adviser also discussed the Morningstar data and rankings, and other relevant information, for the Fund. Based on the above-referenced considerations and other factors, the Board concluded that the Fund’s overall expense results and performance supported the re-approval of the Advisory Agreements.
The Board also received information about the investment sub-advisory fee rate (the “Sub-Advisory Agreement Rate”) payable by the Adviser to the Sub-Adviser for investment sub-advisory services. The Board concluded that the Sub-Advisory Agreement Rate was fair and equitable, based on its consideration of the factors described here.
Profitability
The Board received and considered a detailed profitability analysis of the Adviser based on the Advisory Agreements, as well as on other relationships between the Fund and the Adviser and its affiliates, including the Sub-Adviser. The Board concluded that, in light of the costs of providing investment management and other services to the Fund, the profits and other ancillary benefits reported by the Adviser were not unreasonable.
Economies of scale
The Board received and considered general information regarding economies of scale with respect to the management of the Fund, including the Fund’s ability to appropriately benefit from economies of scale under the Fund’s fee structure. The Board recognized the inherent limitations of any analysis of economies of scale, stemming largely from the Board’s understanding that most of the Adviser’s costs are not specific to individual Funds, but rather are incurred across a variety of products and services.
32
To the extent the Board and the Adviser were able to identify actual or potential economies of scale from Fund-specific or allocated expenses, in order to ensure that any such economies continue to be reasonably shared with the Fund as its assets increase, the Adviser and the Board agreed to continue the existing breakpoints to the Advisory Agreement Rate.
Information about services to other clients
The Board also received information about the nature, extent and quality of services and fee rates offered by the Adviser and Sub-Adviser to their other clients, including other registered investment companies, institutional investors and separate accounts. The Board concluded that the Advisory Agreement Rate and the Sub-Advisory Agreement Rate were not unreasonable, taking into account fee rates offered to others by the Adviser and Sub-Adviser, respectively, after giving effect to differences in services.
Other benefits to the Adviser
The Board received information regarding potential “fall-out” or ancillary benefits received by the Adviser and its affiliates as a result of the Adviser’s relationship with the Fund. Such benefits could include, among others, benefits directly attributable to the relationship of the Adviser with the Fund and benefits potentially derived from an increase in the business of the Adviser as a result of its relationship with the Fund (such as the ability to market to shareholders other financial products offered by the Adviser and its affiliates).
The Board also considered the effectiveness of the Adviser’s, Sub-Adviser’s and Fund’s policies and procedures for complying with the requirements of the federal securities laws, including those relating to best execution of portfolio transactions and brokerage allocation.
Other factors and broader review
As discussed above, the Board reviewed detailed materials received from the Adviser and Sub-Adviser as part of the annual re-approval process. The Board also regularly reviews and assesses the quality of the services that the Fund receives throughout the year. In this regard, the Board reviews reports of the Adviser at least quarterly, which include, among other things, a detailed portfolio review, detailed fund performance reports and compliance reports. In addition, the Board meets with portfolio managers and senior investment officers at various times throughout the year.
After considering the above-described factors and based on its deliberations and its evaluation of the information described above, the Board concluded that approval of the continuation of the Advisory Agreements for the Fund was in the best interest of the Fund and its shareholders. Accordingly, the Board unanimously approved the continuation of the Advisory Agreements.
1 The Board previously considered information about the Sub-Advisory Agreement at the September and December 2005 Board meetings in connection with the Adviser’s reorganization.
33
Trustees and Officers
This chart provides information about the Trustees and Officers who oversee your John Hancock fund. Officers elected by the Trustees manage the day-to-day operations of the Fund and execute policies formulated by the Trustees.
| Independent Trustees | | |
| |
| Name, age | | Number of |
| Position(s) held with Fund | Trustee | John Hancock |
| Principal occupation(s) and other | of Fund | funds overseen |
| directorships during past 5 years | since1 | by Trustee |
|
| Ronald R. Dion , Born: 1946 | 1998 | 53 |
|
| Independent Chairman (since 2005); Chairman and Chief Executive Officer, | | |
| R.M. Bradley & Co., Inc.; Director, The New England Council and Massachusetts | |
| Roundtable; Trustee, North Shore Medical Center; Director, Boston Stock | | |
| Exchange; Director, BJ’s Wholesale Club, Inc. and a corporator of the Eastern | | |
| Bank; Trustee, Emmanuel College; Director, Boston Municipal Research Bureau; | |
| Member of the Advisory Board, Carroll Graduate School of Management at | | |
| Boston College. | | |
|
| |
| James F. Carlin, Born: 1940 | 1994 | 53 |
|
| Director and Treasurer, Alpha Analytical Laboratories Inc. (chemical analysis) | | |
| (since 1985); Part Owner and Treasurer, Lawrence Carlin Insurance Agency, | | |
| Inc. (since 1995); Part Owner and Vice President, Mone Lawrence Carlin | | |
| Insurance Agency, Inc. (until 2005); Director and Treasurer, Rizzo Associates | | |
| (engineering) (until 2000); Chairman and CEO, Carlin Consolidated, Inc. | | |
| (management/investments) (since 1987); Director and Partner, Proctor Carlin | | |
| & Co., Inc. (until 1999); Trustee, Massachusetts Health and Education Tax | | |
| Exempt Trust (since 1993); Director of the following: Uno Restaurant Corp. | | |
| (until 2001), Arbella Mutual (insurance) (until 2000), HealthPlan Services, Inc. | | |
| (until 1999), Flagship Healthcare, Inc. (until 1999), Carlin Insurance Agency, Inc. | |
| (until 1999); Chairman, Massachusetts Board of Higher Education (until 1999). | |
|
| |
| Richard P. Chapman, Jr.,2 Born: 1935 | 2005 | 53 |
|
| President and Chief Executive Officer, Brookline Bancorp, Inc. (lending) (since | | |
| 1972); Chairman and Director, Lumber Insurance Co. (insurance) (until 2000); | | |
| Chairman and Director, Northeast Retirement Services, Inc. (retirement | | |
| administration) (since 1998); Vice Chairman, Northeastern University Board | | |
| of Trustees (since 2004). | | |
|
| |
| William H. Cunningham, Born: 1944 | 1989 | 160 |
|
| Former Chancellor, University of Texas System and former President of the | | |
| University of Texas, Austin, Texas; Chairman and CEO, IBT Technologies (until | | |
| 2001); Director of the following: Hire.com (until 2004), STC Broadcasting, Inc. | | |
| and Sunrise Television Corp. (until 2001), Symtx, Inc. (electronic manufacturing) | |
| (since 2001), Adorno/Rogers Technology, Inc. (until 2004), Pinnacle Foods | | |
| Corporation (until 2003), rateGenius (until 2003), Lincoln National Corporation | |
| (insurance) (since 2006), Jefferson-Pilot Corporation (diversified life insurance | | |
| company) (until 2006), New Century Equity Holdings (formerly Billing Concepts) | |
34
| Independent Trustees (continued) | | |
| |
| Name, age | | Number of |
| Position(s) held with Fund | Trustee | John Hancock |
| Principal occupation(s) and other | of Fund | funds overseen |
| directorships during past 5 years | since1 | by Trustee |
|
| William H. Cunningham, Born: 1944 (continued) | 1989 | 160 |
|
| (until 2001), eCertain (until 2001), ClassMap.com (until 2001), Agile Ventures | | |
| (until 2001), AskRed.com (until 2001), Southwest Airlines, Introgen and | | |
| Viasystems Group, Inc. (electronic manufacturer) (until 2003); Advisory | | |
| Director, Interactive Bridge, Inc. (college fundraising) (until 2001); Advisory | | |
| Director, Q Investments (until 2003); Advisory Director, JPMorgan Chase Bank | | |
| (formerly Texas Commerce Bank – Austin), LIN Television (since 2002), WilTel | | |
| Communications (until 2003) and Hayes Lemmerz International, Inc. | | |
| (diversified automotive parts supply company) (since 2003). | | |
|
| |
| Charles L. Ladner,2 Born: 1938 | 1994 | 160 |
|
| Chairman and Trustee, Dunwoody Village, Inc. (retirement services) (until 2003); | |
| Senior Vice President and Chief Financial Officer, UGI Corporation (public utility | |
| holding company) (retired 1998); Vice President and Director for AmeriGas, Inc. | |
| (retired 1998); Director of AmeriGas Partners, L.P. (gas distribution) (until 1997); | |
| Director, EnergyNorth, Inc. (until 1995); Director, Parks and History Association | |
| (until 2007). | | |
|
| |
| John A. Moore,2 Born: 1939 | 2005 | 53 |
|
| President and Chief Executive Officer, Institute for Evaluating Health Risks, | | |
| (nonprofit institution) (until 2001); Senior Scientist, Sciences International | | |
| (health research) (until 2003); Former Assistant Administrator and Deputy | | |
| Administrator, Environmental Protection Agency; Principal, Hollyhouse | | |
| (consulting) (since 2000); Director, CIIT Center for Health Science Research | | |
| (nonprofit research) (since 2002). | | |
|
| |
| Patti McGill Peterson,2 Born: 1943 | 2005 | 53 |
|
| Executive Director, Council for International Exchange of Scholars and Vice | | |
| President, Institute of International Education (since 1998); Senior Fellow, Cornell | |
| Institute of Public Affairs, Cornell University (until 1998); Former President of | | |
| Wells College and St. Lawrence University; Director, Niagara Mohawk Power | | |
| Corporation (until 2003); Director, Ford Foundation, International Fellowships | | |
| Program (since 2002); Director, Lois Roth Endowment (since 2002); Director, | | |
| Council for International Educational Exchange (since 2003). | | |
|
| |
| Steven R. Pruchansky, Born: 1944 | 1994 | 53�� |
|
| Chairman and Chief Executive Officer, Greenscapes of Southwest Florida, Inc. | | |
| (since 2000); Director and President, Greenscapes of Southwest Florida, Inc. | | |
| (until 2000); Managing Director, JonJames, LLC (real estate) (since 2001); | | |
| Director, First Signature Bank & Trust Company (until 1991); Director, Mast | | |
| Realty Trust (until 1994); President, Maxwell Building Corp. (until 1991). | | |
35
| Non-Independent Trustee3 | | |
| |
| Name, age | | Number of |
| Position(s) held with Fund | Trustee | John Hancock |
| Principal occupation(s) and other | of Fund | funds overseen |
| directorships during past 5 years | since1 | by Trustee |
|
| James R. Boyle, Born: 1959 | 2005 | 262 |
|
| President, John Hancock Annuities; Executive Vice President, John Hancock | | |
| Life Insurance Company (since June, 2004); Chairman and Director, John | | |
| Hancock Advisers, LLC (the “Adviser”), John Hancock Funds, LLC and The | | |
| Berkeley Financial Group, LLC (“The Berkeley Group”) (holding company) (since | |
| 2005); President, U.S. Annuities; Senior Vice President, The Manufacturers | | |
| Life Insurance Company (U.S.A.) (until 2004). | | |
| |
| Principal officers who are not Trustees | | |
| |
| Name, age | | |
| Position(s) held with Fund | | Officer |
| Principal occupation(s) and | | of Fund |
| directorships during past 5 years | | since |
|
| Keith F. Hartstein, Born: 1956 | | 2005 |
|
| President and Chief Executive Officer | | |
| Senior Vice President, Manulife Financial Corporation (since 2004); Director, | | |
| President and Chief Executive Officer, the Adviser, The Berkeley Group, John | | |
| Hancock Funds, LLC (since 2005); Director, MFC Global Investment Management | |
| (U.S.), LLC (“MFC Global (U.S.)”) (since 2005); Director, John Hancock Signature | |
| Services, Inc. (since 2005); President and Chief Executive Officer, John Hancock | |
| Investment Management Services, LLC (since 2006); President and Chief Executive | |
| Officer, John Hancock Funds II, John Hancock Funds III and John Hancock Trust; | |
| Director, Chairman and President, NM Capital Management, Inc. (since 2005); | | |
| Chairman, Investment Company Institute Sales Force Marketing Committee | | |
| (since 2003); Director, President and Chief Executive Officer, MFC Global (U.S.) | |
| (2005–2006); Executive Vice President, John Hancock Funds, LLC (until 2005). | | |
|
| |
| Thomas M. Kinzler, Born: 1955 | | 2006 |
|
| Secretary and Chief Legal Officer | | |
| Vice President and Counsel, John Hancock Life Insurance Company (U.S.A.) | | |
| (since 2006); Secretary and Chief Legal Officer, John Hancock Funds, John | | |
| Hancock Funds II, John Hancock Funds III and John Hancock Trust (since 2006); | |
| Vice President and Associate General Counsel, Massachusetts Mutual Life | | |
| Insurance Company (1999–2006); Secretary and Chief Legal Counsel, MML | | |
| Series Investment Fund (2000–2006); Secretary and Chief Legal Counsel, | | |
| MassMutual Institutional Funds (2000–2004); Secretary and Chief Legal Counsel, | |
| MassMutual Select Funds and MassMutual Premier Funds (2004–2006). | | |
|
| |
| Francis V. Knox, Jr., Born: 1947 | | 2005 |
|
| Chief Compliance Officer | | |
| Vice President and Chief Compliance Officer, John Hancock Investment | | |
| Management Services, LLC, the Adviser and MFC Global (U.S.) | | |
| (since 2005); Vice President and Chief Compliance Officer, John Hancock | | |
| Funds II, John Hancock Funds III and John Hancock Trust (since 2005); Vice | | |
| President and Assistant Treasurer, Fidelity Group of Funds (until 2004); Vice | | |
| President and Ethics & Compliance Officer, Fidelity Investments (until 2001). | | |
36
| Principal officers who are not Trustees (continued) | |
| |
| Name, age | |
| Position(s) held with Fund | Officer |
| Principal occupation(s) and | of Fund |
| directorships during past 5 years | since |
|
| Gordon M. Shone, Born: 1956 | 2006 |
|
| Treasurer | |
| Treasurer, John Hancock Funds (since 2006), John Hancock Funds II, John | |
| Hancock Funds III and John Hancock Trust (since 2005); Vice President and | |
| Chief Financial Officer, John Hancock Trust (2003–2005); Senior Vice President, | |
| John Hancock Life Insurance Company (U.S.A.) (since 2001); Vice President, | |
| John Hancock Investment Management Services, Inc., John Hancock Advisers, | |
| LLC (since 2006) and The Manufacturers Life Insurance Company (U.S.A.) | |
| (1998–2000). | |
|
| |
| John G. Vrysen, Born: 1955 | 2005 |
|
| Chief Financial Officer | |
| Director, Executive Vice President and Chief Financial Officer, the Adviser, The | |
| Berkeley Group and John Hancock Funds, LLC (since 2005); Executive Vice | |
| President and Chief Financial Officer, John Hancock Investment Management | |
| Services, LLC (since 2005); Vice President and Chief Financial Officer, MFC Global | |
| (U.S.) (since 2005); Director, John Hancock Signature Services, Inc. (since 2005); | |
| Chief Financial Officer, John Hancock Funds II, John Hancock Funds III and John | |
| Hancock Trust (since 2005); Vice President and General Manager, Fixed Annuities, | |
| U.S. Wealth Management (until 2005); Vice President, Operations, Manulife | |
| Wood Logan (2000–2004). | |
The business address for all Trustees and Officers is 601 Congress Street, Boston, Massachusetts 02210-2805. The Statement of Additional Information of the Fund includes additional information about members of the Board of Trustees of the Fund and is available, without charge, upon request, by calling 1-800-225-5291.
1Each Trustee serves until resignation, retirement age or until his or her successor is elected.
2Member of Audit Committee.
3Non-Independent Trustee holds positions with the Fund’s investment adviser, underwriter and certain other affiliates.
37
For more information
The Fund’s proxy voting policies, procedures and records are available without charge, upon request:
| By phone | On the Fund’s Web site | On the SEC’s Web site |
| 1-800-225-5291 | www.jhfunds.com/proxy | www.sec.gov |
|
| |
| Investment adviser | Custodian | Legal counsel |
| John Hancock Advisers, LLC | The Bank of New York | Kirkpatrick & Lockhart |
| 601 Congress Street | One Wall Street | Nicholson Graham LLP |
| Boston, MA 02210-2805 | New York, NY 10286 | 1 Lincoln Street |
| | | Boston, MA 02111-2950 |
| Subadviser | Transfer agent | |
| MFC Global Investment | John Hancock Signature | Independent registered |
| Management (U.S.), LLC | Services, Inc. | public accounting firm |
| 101 Huntington Avenue | 1 John Hancock Way, | PricewaterhouseCoopers LLP |
| Boston, MA 02199 | Suite 1000 | 125 High Street |
| Boston, MA 02217-1000 | Boston, MA 02110 |
| Principal distributor | | |
| John Hancock Funds, LLC | | |
| 601 Congress Street | | |
| Boston, MA 02210-2805 | | |
The Fund’s investment objective, risks, charges and expenses are included in the prospectus and should considered carefully before investing. For a prospectus, call your financial professional, call John Hancock Funds at 1-800-225-5291 or visit the Fund’s Web site at www.jhfunds.com. Please read the prospectus carefully before investing or sending money.
| How to contact us | |
|
| |
| Internet | www.jhfunds.com | |
|
| |
| Mail | Regular mail: | Express mail: |
| | John Hancock | John Hancock |
| | Signature Services, Inc. | Signature Services, Inc. |
| | 1 John Hancock Way, Suite 1000 | Mutual Fund Image Operations |
| | Boston, MA 02217-1000 | 380 Stuart Street |
| | | Boston, MA 02116 |
|
| |
| Phone | Customer service representatives | 1-800-225-5291 |
| | 24-hour automated information | 1-800-338-8080 |
| | TDD line | 1-800-554-6713 |
A listing of month-end portfolio holdings is available on our Web site, www.jhfunds.com. A more detailed portfolio holdings summary is available on a quarterly basis 60 days after the fiscal quarter on our Web site or upon request by calling 1-800-225-5291, or on the Securities and Exchange Commission’s Web site, www.sec.gov.
40
J O H N H A N C O C K F A M I L Y O F F U N D S
| EQUITY | INTERNATIONAL |
| Balanced Fund | Greater China Opportunities Fund |
| Classic Value Fund | International Classic Value Fund |
| Classic Value Fund II | International Core Fund |
| Core Equity Fund | International Fund |
| Focused Equity Fund | International Growth Fund |
| Growth Fund | |
| Growth Opportunities Fund | INCOME |
| Growth Trends Fund | Bond Fund |
| Intrinsic Value Fund | Government Income Fund |
| Large Cap Equity Fund | High Yield Fund |
| Large Cap Select Fund | Investment Grade Bond Fund |
| Mid Cap Equity Fund | Strategic Income Fund |
| Mid Cap Growth Fund | |
| Multi Cap Growth Fund | TAX-FREE INCOME |
| Small Cap Equity Fund | California Tax-Free Income Fund |
| Small Cap Fund | High Yield Municipal Bond Fund |
| Small Cap Intrinsic Value Fund | Massachusetts Tax-Free Income Fund |
| Sovereign Investors Fund | New York Tax-Free Income Fund |
| U.S. Core Fund | Tax-Free Bond Fund |
| U.S. Global Leaders Growth Fund | |
| Value Opportunities Fund | MONEY MARKET |
| | Money Market Fund |
| ASSET ALLOCATION & LIFESTYLE | U.S. Government Cash Reserve |
| Allocation Core Portfolio | |
| Allocation Growth + Value Portfolio | CLOSED-END |
| Lifestyle Aggressive Portfolio | Bank & Thrift Opportunity |
| Lifestyle Balanced Portfolio | Financial Trends |
| Lifestyle Conservative Portfolio | Income Securities |
| Lifestyle Growth Portfolio | Investors Trust |
| Lifestyle Moderate Portfolio | Patriot Global Dividend |
| | Patriot Preferred Dividend |
| SECTOR | Patriot Premium Dividend I |
| Financial Industries Fund | Patriot Premium Dividend II |
| Health Sciences Fund | Patriot Select Dividend |
| Real Estate Fund | Preferred Income |
| Regional Bank Fund | Preferred Income II |
| Technology Fund | Preferred Income III |
| Technology Leaders Fund | Tax-Advantaged Dividend |
For more complete information on any John Hancock Fund and a prospectus, which includes charges and expenses, call your financial professional, or John Hancock Funds at 1-800-225-5291. Please read the prospectus carefully before investing or sending money.

1-800-225-5291
1-800-554-6713 (TDD)
1-800-338-8080 EASI-Line
www.jhfunds.com
Now available: electronic delivery
www.jhfunds.com/edelivery
This report is for the information of the shareholders of John Hancock California Tax-Free Income Fund.
5300A 8/06
10/06
ITEM 2. CODE OF ETHICS.
As of the end of the period, August 31, 2006, the registrant has adopted a code of ethics, as defined in Item 2 of Form N-CSR, that applies to its Chief Executive Officer, Chief Financial Officer and Treasurer (respectively, the principal executive officer, the principal financial officer and the principal accounting officer, the “Senior Financial Officers”). A copy of the code of ethics is filed as an exhibit to this Form N-CSR.
ITEM 3. AUDIT COMMITTEE FINANCIAL EXPERT.
Charles L. Ladner is the audit committee financial expert and is “independent”, pursuant to general instructions on Form N-CSR Item 3.
ITEM 4. PRINCIPAL ACCOUNTANT FEES AND SERVICES.
(a) Audit Fees
The aggregate fees billed for professional services rendered by the principal accountant(s) for the audit of the registrant’s annual financial statements or services that are normally provided by the accountant(s) in connection with statutory and regulatory filings or engagements amounted to $35,000 for the fiscal year ended August 31, 2005 and $26,850 for the fiscal year ended August 31, 2006. These fees were billed to the registrant and were approved by the registrant’s audit committee.
(b) Audit-Related Services
There were no audit-related fees during the fiscal year ended August 31, 2005 and fiscal year ended August 31, 2006 billed to the registrant or to the registrant's investment adviser (not including any sub-adviser whose role is primarily portfolio management and is subcontracted with or overseen by another investment adviser), and any entity controlling, controlled by, or under common control with the adviser that provides ongoing services to the registrant ("control affiliates").
(c) Tax Fees
The aggregate fees billed for professional services rendered by the principal accountant(s) for the tax compliance, tax advice and tax planning (“tax fees”) amounted to $2,400 for the fiscal year ended August 31, 2005 and $3,400 for the fiscal year ended August 31, 2006. The nature of the services comprising the tax fees was the review of the registrant’s income tax returns and tax distribution requirements. These fees were billed to the registrant and were approved by the registrant’s audit committee. There were no tax fees billed to the control affiliates.
(d) All Other Fees
There were no other fees during the fiscal year ended August 31, 2005 and fiscal year ended August 31, 2006 billed to the registrant or to the control affiliates.
(e)(1) See attachment "Approval of Audit, Audit-related, Tax and Other Services", with the audit committee pre-approval policies and procedures.
(e)(2) There were no fees that were approved by the audit committee pursuant to the de minimis exception for the fiscal years ended August 31, 2005 and August 31, 2006 on behalf of the registrant or on behalf of the control affiliates that relate directly to the operations and financial reporting of the registrant.
(f) According to the registrant’s principal accountant, for the fiscal year ended August 31, 2006, the percentage of hours spent on the audit of the registrant's financial statements for the most
recent fiscal year that were attributed to work performed by persons who were not full-time, permanent employees of principal accountant was less than 50%.
(g) The aggregate non-audit fees billed by the registrant's accountant(s) for services rendered to the registrant and rendered to the registrant's control affiliates for each of the last two fiscal years of the registrant were $67,400 for the fiscal year ended August 31, 2005, and $438,491 for the fiscal year ended August 31, 2006.
(h) The audit committee of the registrant has considered the non-audit services provided by the registrant’s principal accountant(s) to the control affiliates and has determined that the services that were not pre-approved are compatible with maintaining the principal accountant(s)' independence.
ITEM 5. AUDIT COMMITTEE OF LISTED REGISTRANTS.
The registrant has a separately-designated standing audit committee comprised of independent trustees. The members of the audit committee are as follows:
Charles L. Ladner - Chairman
Richard P. Chapman, Jr.
Dr. John A. Moore
Patti McGill Peterson
ITEM 6. SCHEDULE OF INVESTMENTS.
Not applicable.
ITEM 7. DISCLOSURE OF PROXY VOTING POLICIES AND PROCEDURES FOR CLOSED-END MANAGEMENT INVESTMENT COMPANIES.
Not applicable.
ITEM 8. PORTFOLIO MANAGERS OF CLOSED-END MANAGEMENT INVESTMENT COMPANIES.
Not applicable.
ITEM 9. PURCHASES OF EQUITY SECURITIES BY CLOSED-END MANAGEMENT INVESTMENT COMPANY AND AFFILIATED PURCHASERS.
Not applicable.
ITEM 10. SUBMISSION OF MATTERS TO A VOTE OF SECURITY HOLDERS.
The registrant has adopted procedures by which shareholders August recommend nominees to the registrant's Board of Trustees. A copy of the procedures is filed as an exhibit to this Form N-CSR. See attached “John Hancock Funds – Governance Committee Charter”.
ITEM 11. CONTROLS AND PROCEDURES.
(a) Based upon their evaluation of the registrant's disclosure controls and procedures as conducted within 90 days of the filing date of this Form N-CSR, the registrant's principal executive officer and principal financial officer have concluded that those disclosure controls and procedures provide reasonable assurance that the material information required to be disclosed
by the registrant on this report is recorded, processed, summarized and reported within the time periods specified in the Securities and Exchange Commission's rules and forms.
(b) There were no changes in the registrant's internal control over financial reporting that occurred during the registrant's most recent fiscal half-year (the registrant's second fiscal half-year in the case of an annual report) that have materially affected, or are reasonably likely to materially affect, the registrant's internal control over financial reporting.
ITEM 12. EXHIBITS.
(a)(1) Code of Ethics for Senior Financial Officers is attached.
(a)(2) Separate certifications for the registrant's principal executive officer and principal financial officer, as required by Section 302 of the Sarbanes-Oxley Act of 2002 and Rule 30a-2(a) under the Investment Company Act of 1940, are attached.
(b) Separate certifications for the registrant's principal executive officer and principal financial officer, as required by 18 U.S.C. Section 1350, as adopted pursuant to Section 906 of the Sarbanes-Oxley Act of 2002, and Rule 30a-2(b) under the Investment Company Act of 1940, are attached. The certifications furnished pursuant to this paragraph are not deemed to be "filed" for purposes of Section 18 of the Securities Exchange Act of 1934, or otherwise subject to the liability of that section. Such certifications are not deemed to be incorporated by reference into any filing under the Securities Act of 1933 or the Securities Exchange Act of 1934, except to the extent that the Registrant specifically incorporates them by reference.
(c)(1) Approval of Audit, Audit-related, Tax and Other Services is attached.
(c)(2) Submission of Matters to a Vote of Security Holders is attached. See attached “John Hancock Funds – Governance Committee Charter”.
(c)(3) Proxy Voting Policies and Procedures are attached.
(c)(4) Contact person at the registrant.
SIGNATURES
Pursuant to the requirements of the Securities Exchange Act of 1934 and the Investment Company Act of 1940, the registrant has duly caused this report to be signed on its behalf by the undersigned, thereunto duly authorized.
John Hancock California Tax-Free Income Fund
By: /s/ Keith F. Hartstein
-------------------------------------
Keith F. Hartstein
President and Chief Executive Officer
Date: October 27, 2006
Pursuant to the requirements of the Securities Exchange Act of 1934 and the Investment Company Act of 1940, this report has been signed below by the following persons on behalf of the registrant and in the capacities and on the dates indicated.
By: /s/ Keith F. Hartstein
-------------------------------------
Keith F. Hartstein
President and Chief Executive Officer
Date: October 27, 2006
By: /s/ John G. Vrysen
-------------------------------------
John G. Vrysen
Executive Vice President and Chief Financial Officer
Date: October 27, 2006