| |
| UNITED STATES |
| SECURITIES AND EXCHANGE COMMISSION |
| Washington, D.C. 20549 |
| |
| FORM N-CSR |
|
| CERTIFIED SHAREHOLDER REPORT OF REGISTERED |
| |
| MANAGEMENT INVESTMENT COMPANIES |
|
| Investment Company Act file number 811- 5979 |
|
| John Hancock California Tax-Free Income Fund |
| (Exact name of registrant as specified in charter) |
|
| 601 Congress Street, Boston, Massachusetts 02210 |
| (Address of principal executive offices) (Zip code) |
|
| Michael J. Leary |
| Treasurer |
| |
| 601 Congress Street |
| |
| Boston, Massachusetts 02210 |
| |
| (Name and address of agent for service) |
| |
| Registrant's telephone number, including area code: 617-663-4490 |
| |
| Date of fiscal year end: | May 31 |
| |
| |
| Date of reporting period: | May 31, 2010 |
Item 1. Schedule of Investments

Management’s discussion of
Fund performance
By MFC Global Investment Management (U.S.), LLC
Municipal bonds posted solid gains for the year ended May 31, 2010, as signs of economic recovery helped tax-exempt securities rebound from a steep decline in late 2008 and early 2009. Supply and demand factors also contributed to the municipal bond market’s advance — demand increased as the economic environment improved, while supply was curtailed by the federal Build America Bonds program. The state of California continued to struggle with a severe budget shortfall that now stands at approximately $19 billion for the current and upcoming fiscal years. The state government must find some combination of additional revenues and spending cuts roughly equal to 20% of California’s overall budget in order to eliminate the deficit.
For the year ended May 31, 2010, John Hancock California Tax-Free Income Fund’s Class A shares posted a total return of 11.69% at net asset value. By comparison, Morningstar, Inc.’s muni California long fund category produced an average return of 10.86%, while the Barclays Capital Municipal Bond Index, the Fund’s benchmark, returned 8.52%. The Fund’s greater interest rate sensitivity, driven by its notable position in longer-term California municipal securities, along with its exposure to lower-rated bonds, were contributing factors to the Fund’s outperformance of the broad municipal bond index and its Morningstar peer group.
The best performers in the Fund were generally lower-rated securities, including special tax and tax allocation bonds. Transportation bonds also fared well thanks to their attractive yields and stable revenues. We remained selective in the health care sector, but seasoned securities in the Fund produced solid returns despite uncertainty about the impact of federal health care legislation. Education bonds, one of the larger sector weightings in the Fund, benefited from improved endowment returns at higher educational facilities, but local school districts lagged, limiting overall returns in this sector.
This commentary reflects the views of the portfolio managers through the end of the Fund’s period discussed in this report. The managers’ statements reflect their own opinions. As such, they are in no way guarantees of future events and are not intended to be used as investment advice or a recommendation regarding any specific security. They are also subject to change at any time as market and other conditions warrant.
Past performance is no guarantee of future results.
The Fund is non-diversified, which generally means that it may invest a greater percentage of its total assets in the securities of fewer issuers than a diversified fund. As a result, credit, market and other risks associated with the Fund’s investment strategies or techniques may be more pronounced for the Fund than for funds that are diversified.
The major risk factors in this Fund’s performance are interest rate and credit risk. When interest rates rise, bond prices usually fall. Generally, an increase in the Fund’s average maturity will make it more sensitive to interest-rate risk.
Investments focused on one sector may fluctuate more widely than investments diversified across sectors. Because the Fund may focus on particular sectors, its performance may depend on the performance of those sectors.
| |
| 6 | California Tax-Free Income Fund | Annual report |
A look at performance
For the period ended May 31, 2010
| | | | | | | | | |
| | Average annual returns (%) | | | Cumulative total returns (%) | | | SEC 30-day |
| | with maximum sales charge (POP) | | with maximum sales charge (POP) | | yield (%) |
| |
| |
|
| | | | | | | | | | as of |
| | 1-year | 5-year | 10-year | | 1-year | 5-year | 10-year | | 5-31-10 |
| Class A | 6.64 | 2.37 | 4.44 | | 6.64 | 12.44 | 54.37 | | 4.32 |
| Class B | 5.75 | 2.10 | 4.22 | | 5.75 | 10.97 | 51.24 | | 3.67 |
| Class C | 9.76 | 2.44 | 4.03 | | 9.76 | 12.83 | 48.46 | | 3.65 |
Performance figures assume all distributions are reinvested. Public offering price (POP) figures reflect maximum sales charges on Class A shares of 4.5% and the applicable contingent deferred sales charge (CDSC) on Class B shares and Class C shares. The returns for Class C shares have been adjusted to reflect the elimination of the front-end sales charge effective 7-15-04. The Class B shares’ CDSC declines annually between years 1 to 6 according to the following schedule: 5, 4, 3, 3, 2, 1%. No sales charge will be assessed after the sixth year. Class C shares held for less than one year are subject to a 1% CDSC.
The expense ratios of the Fund, both net (including any fee waivers or expense limitations) and gross (excluding any fee waivers or expense limitations), are set forth according to the most recent publicly available prospectus for the Fund and may differ from the expense ratios disclosed in the Financial Highlights tables in this report. The net expenses equal the gross expenses and are as follows: Class A — 0.87%, Class B — 1.72% and Class C — 1.72%.
The returns reflect past results and should not be considered indicative of future performance. The return and principal value of an investment will fluctuate so that shares, when redeemed, may be worth more or less than their original cost. Due to market volatility, the Fund’s current performance may be higher or lower than the performance shown. For current to the most recent month end performance data, please call 1–800–225–5291 or visit the Fund’s Web site at www.jhfunds.com.
The performance table above and the chart on the next page do not reflect the deduction of taxes that a shareholder may pay on fund distributions or on the redemption of fund shares. Please note that a portion of the Fund’s income may be subject to taxes, and some investors may be subject to the Alternative Minimum Tax (AMT). Also note that capital gains are taxable.
The Fund’s performance results reflect any applicable fee waivers or expense reductions, without which the expenses would increase and results would have been less favorable.
| |
| Annual report | California Tax-Free Income Fund | 7 |
A look at performance
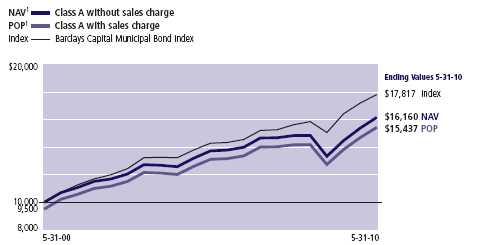
Growth of $10,000
This chart shows what happened to a hypothetical $10,000 investment in John Hancock California Tax-Free Income Fund Class A shares for the period indicated. For comparison, we’ve shown the same investment in the Barclays Capital Municipal Bond Index.
| | | | |
| | Period | Without | With maximum | |
| | beginning | sales charge | sales charge | Index |
|
| Class B2 | 5-31-00 | $15,124 | $15,124 | $17,817 |
|
| Class C2 | 5-31-00 | 14,846 | 14,846 | 17,817 |
|
Assuming all distributions were reinvested for the period indicated, the table above shows the value of a $10,000 investment in the Fund’s Class B and Class C shares, respectively, as of 5-31-10. The Class C shares investment with maximum sales charge has been adjusted to reflect the elimination of the front-end sales charge effective 7-15-04. Performance of the classes will vary based on the difference in sales charges paid by shareholders investing in the different classes and the fee structure of those classes.
Barclays Capital Municipal Bond Index is an unmanaged index representative of the tax-exempt bond market.
It is not possible to invest directly in an index. Index figures do not reflect sales charges or direct expenses, which would have resulted in lower values if they did.
1 NAV represents net asset value and POP represents public offering price.
2 No contingent deferred sales charge applicable.
| |
| 8 | California Tax-Free Income Fund | Annual report |
Your expenses
These examples are intended to help you understand your ongoing operating expenses.
Understanding fund expenses
As a shareholder of the Fund, you incur two types of costs:
▪ Transaction costs which include sales charges (loads) on purchases or redemptions (varies by share class), minimum account fee charge, etc.
▪ Ongoing operating expenses including management fees, distribution and service fees (if applicable), and other fund expenses.
We are going to present only your ongoing operating expenses here.
Actual expenses/actual returns
This example is intended to provide information about your fund’s actual ongoing operating expenses, and is based on your fund’s actual return. It assumes an account value of $1,000.00 on December 1, 2009 with the same investment held until May 31, 2010.
| | | |
| | Account value | Ending value | Expenses paid during |
| | on 12-1-09 | on 5-31-10 | period ended 5-31-101 |
|
| Class A | $1,000.00 | $1,051.00 | $4.24 |
|
| Class B | 1,000.00 | 1,046.60 | 8.57 |
|
| Class C | 1,000.00 | 1,046.50 | 8.62 |
|
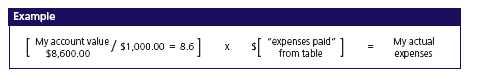
Together with the value of your account, you may use this information to estimate the operating expenses that you paid over the period. Simply divide your account value at May 31, 2010, by $1,000.00, then multiply it by the “expenses paid” for your share class from the table above. For example, for an account value of $8,600.00, the operating expenses should be calculated as follows:
| |
| Annual report | California Tax-Free Income Fund | 9 |
Your expenses
Hypothetical example for comparison purposes
This table allows you to compare your fund’s ongoing operating expenses with those of any other fund. It provides an example of the Fund’s hypothetical account values and hypothetical expenses based on each class’s actual expense ratio and an assumed 5% annualized return before expenses (which is not your fund’s actual return). It assumes an account value of $1,000.00 on December 1, 2009, with the same investment held until May 31, 2010. Look in any other fund shareholder report to find its hypothetical example and you will be able to compare these expenses.
| | | |
| | Account value | Ending value | Expenses paid during |
| | on 12-1-09 | on 5-31-10 | period ended 5-31-101 |
|
| Class A | $1,000.00 | $1,020.80 | $4.18 |
|
| Class B | 1,000.00 | 1,016.60 | 8.45 |
|
| Class C | 1,000.00 | 1,016.50 | 8.50 |
|
Remember, these examples do not include any transaction costs, therefore, these examples will not help you to determine the relative total costs of owning different funds. If transaction costs were included, your expenses would have been higher. See the prospectus for details regarding transaction costs.
1 Expenses are equal to the Fund’s annualized expense ratio of 0.83%, 1.68% and 1.69% for Class A, Class B, and Class C shares, respectively, multiplied by the average account value over the period, multiplied by 182/365 (to reflect the one-half year period).
| |
| 10 | California Tax-Free Income Fund | Annual report |
Portfolio summary
| | | | |
| Top 10 Holdings1 | | | | |
|
| Santa Ana Financing Authority, | | | Commonwealth of Puerto Rico, | |
| 7-1-24, 6.250% | 3.9% | | 7-1-15, 6.500% | 2.4% |
| |
|
| Golden State Tobacco Securitization | | | State of California, 4-1-29, 4.750% | 2.1% |
| Corp., 6-1-35, 5.000% | 3.3% | |
|
| | State of California, 4-1-33, 6.500% | 2.0% |
| San Bernardino County, | 3.2% | |
|
| 8-1-17, 5.500% | | | Inglewood Unified School District, | |
| | 10-15-26, 5.250% | 1.9% |
| Puerto Rico Aqueduct & Sewer | 3.0% | |
|
| Authority, 7-1-11, 11.364% | | California State Public Works Board, | |
| | 6-1-18, 5.500% | 1.9% |
| New Haven Unified School District, | 2.6% | |
|
| 8-1-22, Zero | | | |
| | | |
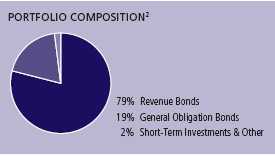
| Sector Composition2,3 | | | | |
|
| General Obligation Bonds | 19% | | Education | 7% |
| |
|
| Revenue Bonds | | | Tobacco | 4% |
| |
|
| Facilities | 10% | | Utilities | 4% |
| |
|
| Transportation | 10% | | Other Revenue | 29% |
| |
|
| Special Tax | 8% | | Short-Term Investments & Other | 2% |
| |
|
| Health Care | 7% | | | |
| | |
| | | | | |
| Quality Composition2,4 | | | | |
|
| AAA | 4% | | BBB | 21% |
| |
|
| AA | 19% | | BB | 15% |
| |
|
| A | 39% | | Short-Term Investments & Other | 2% |
| |
|
1 As a percentage of net assets on 5-31-10. Excludes cash and cash equivalents.
2 As a percentage of net assets on 5-31-10.
3 Investments focused on one sector may fluctuate more widely than investments diversified across sectors. Because the Fund may focus on particular sectors, its performance may depend on the performance of those sectors.
4 Ratings are from Moody’s Investors Services, Inc. If not available, we have used S&P ratings. In the absence of ratings from these agencies, we have used Fitch, Inc ratings. “Not Rated” securities are those with no ratings available. They may have internal ratings similar to those shown. All are as of 5-31-10 and do not reflect subsequent downgrades.
| |
| Annual report | California Tax-Free Income Fund | 11 |
Fund’s investments
As of 5-31-10
| | | | | |
| | | | Maturity | | |
| | Rate | | date | Par value | Value |
|
| Municipal Bonds 98.12% | | | | | $273,316,440 |
|
| (Cost $268,379,289) | | | | | |
| | | | | | |
| California 87.29% | | | | | 243,142,128 |
|
| ABAG Finance Authority for Nonprofit Corps., | | | | | |
| Sharp Healthcare | 6.250% | | 08-01-39 | $1,000,000 | 1,094,075 |
|
| ABAG Finance Authority for Nonprofit Corps., | | | | | |
| Institute on Aging | 5.650 | | 08-15-38 | 1,000,000 | 979,190 |
|
| ABAG Finance Authority for Nonprofit Corps., | | | | | |
| San Diego Hospital Association, Series A | 6.125 | | 08-15-20 | 2,000,000 | 2,037,540 |
|
| Anaheim Certificates of Participation, | | | | | |
| Convention Center (D) (P) | 11.227 | | 07-16-23 | 2,000,000 | 2,016,360 |
|
| Anaheim Public Financing Authority, Public | | | | | |
| Improvement Project, Series C (D) | Zero | | 09-01-18 | 3,000,000 | 2,097,630 |
|
| Antioch Public Financing Authority, Series B | 5.850 | | 09-02-15 | 1,365,000 | 1,385,734 |
|
| Belmont Community Facilities, Library Project, | | | | | |
| Series A (D) | 5.750 | | 08-01-24 | 1,000,000 | 1,096,800 |
|
| California County Tobacco Securitization | | | | | |
| Agency, Fresno County Funding Corp. | 6.000 | | 06-01-35 | 1,765,000 | 1,483,571 |
|
| California County Tobacco Securitization | | | | | |
| Agency, Public Improvements | Zero | | 06-01-21 | 5,000,000 | 4,313,350 |
|
| California County Tobacco Securitization | | | | | |
| Agency, Kern County Corp., Series A | 6.125 | | 06-01-43 | 5,000,000 | 4,138,000 |
|
| California County Tobacco Securitization | | | | | |
| Agency, Stanislaus Funding, Series A | 5.500 | | 06-01-33 | 975,000 | 833,635 |
|
| California Educational Facilities Authority, | | | | | |
| Woodbury University | 5.000 | | 01-01-25 | 1,800,000 | 1,676,196 |
|
| California Educational Facilities Authority, | | | | | |
| College & University Financing Project | 5.000 | | 02-01-26 | 4,525,000 | 3,645,521 |
|
| California Educational Facilities Authority, | | | | | |
| Woodbury University | 5.000 | | 01-01-30 | 2,000,000 | 1,767,040 |
|
| California Health Facilities Financing Authority, | | | | | |
| Kaiser Permanente, Series A | 5.250 | | 04-01-39 | 2,500,000 | 2,488,775 |
|
| California Health Facilities Financing Authority, | | | | | |
| Scripps Health, Series A | 5.000 | | 11-15-36 | 1,000,000 | 998,520 |
|
| California Health Facilities Financing Authority, | | | | | |
| Providence Health & Services, Series C | 6.500 | | 10-01-33 | 1,000,000 | 1,138,490 |
|
| California Health Facilities Financing Authority, | | | | | |
| Catholic Healthcare West, Series G | 5.250 | | 07-01-23 | 1,000,000 | 1,029,960 |
|
| California Infrastructure & Economic | | | | | |
| Development Bank, J. David Gladstone | | | | | |
| Institute Project | 5.250 | | 10-01-34 | 1,000,000 | 975,770 |
| | |
| See notes to financial statements | |
| | |
| 12 | California Tax-Free Income Fund | Annual report | |
| | | | | |
| | | | Maturity | | |
| | Rate | | date | Par value | Value |
| California (continued) | | | | | |
|
| California Infrastructure & Economic | | | | | |
| Development Bank, Performing Arts Center | 5.000% | | 12-01-27 | $500,000 | $506,240 |
|
| California Infrastructure & Economic | | | | | |
| Development Bank, California Independent | | | | | |
| System Operator, Series A | 6.250 | | 02-01-39 | 2,000,000 | 2,120,000 |
|
| California Infrastructure & Economic | | | | | |
| Development Bank, Kaiser Hospital | | | | | |
| Association, Series A | 5.550 | | 08-01-31 | 3,000,000 | 3,033,630 |
|
| California Pollution Control Financing | | | | | |
| Authority, Waste Management Inc., Series C, | | | | | |
| AMT (P) | 5.125 | | 11-01-23 | 2,000,000 | 2,000,660 |
|
| California State Public Works Board, | | | | | |
| Department of Corrections, Series A (D) | 5.000 | | 12-01-19 | 5,000,000 | 5,091,000 |
|
| California State Public Works Board, | | | | | |
| Department of Corrections, Series C | 5.500 | | 06-01-18 | 5,000,000 | 5,237,550 |
|
| California State Public Works Board, Trustees of | | | | | |
| California State University, Series D | 6.250 | | 04-01-34 | 2,000,000 | 2,105,160 |
|
| California State University Revenue, College & | | | | | |
| University Revenue, Series A | 5.250 | | 11-01-34 | 1,000,000 | 1,049,340 |
|
| California Statewide Communities | | | | | |
| Development Authority, Senior Living of | | | | | |
| Southern California | 7.250 | | 11-15-41 | 1,700,000 | 1,849,141 |
|
| California Statewide Communities | | | | | |
| Development Authority, American Baptist | | | | | |
| Homes West | 6.250 | | 10-01-39 | 2,000,000 | 1,999,800 |
|
| California Statewide Communities | | | | | |
| Development Authority, University of | | | | | |
| California – Irvine | 5.750 | | 05-15-32 | 1,230,000 | 1,253,555 |
|
| California Statewide Communities | | | | | |
| Development Authority, Thomas Jefferson | | | | | |
| School of Law, Series A | 7.250 | | 10-01-38 | 2,000,000 | 2,067,240 |
|
| California Statewide Financing Authority, | | | | | |
| Tobacco Settlement, Series A | 6.000 | | 05-01-37 | 2,500,000 | 2,081,150 |
|
| California Statewide Financing Authority, | | | | | |
| Tobacco Settlement, Series B | 6.000 | | 05-01-37 | 4,000,000 | 3,329,840 |
|
| Capistrano Unified School District, | | | | | |
| No. 90-2 Talega | 6.000 | | 09-01-33 | 750,000 | 731,565 |
|
| Capistrano Unified School District, | | | | | |
| No. 90-2 Talega | 5.875 | | 09-01-23 | 500,000 | 504,585 |
|
| Center Unified School District, Series C (D) | Zero | | 09-01-16 | 2,145,000 | 1,679,256 |
|
| Chula Vista Redevelopment Agency, Series B | 5.250 | | 10-01-27 | 1,250,000 | 1,087,613 |
|
| Cloverdale Community Development Agency | 5.500 | | 09-01-38 | 3,000,000 | 2,423,880 |
|
| Contra Costa County Public Financing | | | | | |
| Authority, Series A (D) | 5.000 | | 06-01-28 | 1,230,000 | 1,231,784 |
|
| Corona Community Facilities District No. 97-2 | 5.875 | | 09-01-23 | 1,150,000 | 1,149,920 |
|
| East Side Union High School District-Santa | | | | | |
| Clara County (D) | 5.250 | | 09-01-24 | 2,500,000 | 2,782,150 |
|
| Folsom Public Financing Authority, Series B | 5.125 | | 09-01-26 | 1,000,000 | 864,030 |
|
| Foothill Eastern Transportation | | | | | |
| Corridor Agency, Highway Revenue Tolls | Zero | | 01-15-25 | 6,615,000 | 2,407,199 |
|
| Foothill Eastern Transportation | | | | | |
| Corridor Agency, Highway Revenue Tolls | Zero | | 01-15-36 | 30,000,000 | 5,080,200 |
|
| Fresno Sewer Revenue, Series A–1 (D) | 5.250 | | 09-01-19 | 1,000,000 | 1,118,160 |
| See notes to financial statements | | |
| | |
| Annual report | California Tax-Free Income Fund | 13 |
| | | | | |
| | | | Maturity | | |
| | Rate | | date | Par value | Value |
| California (continued) | | | | | |
|
| Fullerton Community Facilities District No: 1 | 6.200% | | 09-01-32 | $1,000,000 | $1,000,300 |
|
| Golden State Tobacco Securitization Corp., | | | | | |
| Escrowed to Maturity, Series 2003 A–1 | 6.250 | | 06-01-33 | 2,490,000 | 2,773,362 |
|
| Golden State Tobacco Securitization Corp., | | | | | |
| Series A (D) | 5.000 | | 06-01-35 | 10,000,000 | 9,312,100 |
|
| Inglewood Unified School District, School | | | | | |
| District (D) | 5.250 | | 10-15-26 | 5,000,000 | 5,418,000 |
|
| Irvine Mobile Home Park Revenue, Meadow | | | | | |
| Mobile Home Park, Series A | 5.700 | | 03-01-28 | 3,975,000 | 3,742,025 |
|
| Kern County, Capital Improvements Project, | | | | | |
| Series A (D) | 5.750 | | 08-01-35 | 1,000,000 | 1,063,040 |
|
| Laguna-Salada Union School District, | | | | | |
| Series C (D) | Zero | | 08-01-26 | 1,000,000 | 387,980 |
|
| Lancaster School District, School Improvements (D) | Zero | | 04-01-19 | 1,730,000 | 1,175,154 |
|
| Lancaster School District, School Improvements (D) | Zero | | 04-01-22 | 1,380,000 | 740,646 |
|
| Lee Lake Water District Community Facilities | | | | | |
| District No: 2, Montecito Ranch | 6.125 | | 09-01-27 | 1,200,000 | 1,175,484 |
|
| Long Beach Harbor Revenue, Series A, AMT (D) | 6.000 | | 05-15-18 | 2,660,000 | 3,073,470 |
|
| Long Beach Special Tax Community, | | | | | |
| Community Facilities, District 6 | 6.250 | | 10-01-26 | 2,500,000 | 2,462,075 |
|
| Los Angeles Community College District, 2008 | | | | | |
| Election, Series A | 6.000 | | 08-01-33 | 4,000,000 | 4,507,560 |
|
| Los Angeles Community Facilities District No: 3, | | | | | |
| No. 3 Cascades Business Park | 6.400 | | 09-01-22 | 655,000 | 654,967 |
|
| Los Angeles Department of Water & Power, | | | | | |
| Electric Power & Light Revenues, Series A–1 | 5.250 | | 07-01-38 | 2,000,000 | 2,113,200 |
|
| M-S-R Energy Authority, Natural Gas Revenue, | | | | | |
| Series B | 6.500 | | 11-01-39 | 2,500,000 | 2,760,625 |
|
| Millbrae Residential Facility Revenue, Magnolia | | | | | |
| of Millbrae Project, Series A, AMT | 7.375 | | 09-01-27 | 2,475,000 | 2,433,173 |
|
| Modesto Community Facilities District No: 4-1 | 5.100 | | 09-01-26 | 3,000,000 | 2,471,700 |
|
| New Haven Unified School District, Series B (D) | Zero | | 08-01-22 | 14,200,000 | 7,272,672 |
|
| Northern California Power Agency, California – | | | | | |
| Oregon Transportation Project, Series A (D) | 7.000 | | 05-01-13 | 100,000 | 107,896 |
|
| Orange County Improvement Bond Act 1915, | | | | | |
| Series B | 5.750 | | 09-02-33 | 1,570,000 | 1,515,238 |
|
| Oxnard Community Facilities District: | | | | | |
| No. 3, Seabridge | 5.000 | | 09-01-35 | 1,495,000 | 1,190,364 |
|
| Paramount Unified School District, Series B (D) | Zero | | 09-01-25 | 4,735,000 | 2,005,604 |
|
| Pasadena Certificates of Participation, Pasadena | | | | | |
| Packing Facility | 6.250 | | 01-01-18 | 775,000 | 898,946 |
|
| Rancho Santa Fe Community Services District | | | | | |
| No: 01 | 6.700 | | 09-01-30 | 1,000,000 | 1,000,650 |
|
| Ripon Redevelopment Agency, Ripon | | | | | |
| Community Redevelopment Project (D) | 4.750 | | 11-01-36 | 1,690,000 | 1,417,538 |
|
| Riverside County Asset Leasing Corp., Health, | | | | | |
| Hospital & Nursing Home Improvements, Series A | 6.500 | | 06-01-12 | 1,000,000 | 1,035,470 |
|
| San Bernardino County, Capital Facilities | | | | | |
| Project, Escrowed to Maturity, Series B | 6.875 | | 08-01-24 | 350,000 | 466,141 |
|
| San Bernardino County, Medical Center | | | | | |
| Financial Project, Series B (D) | 5.500 | | 08-01-17 | 8,750,000 | 9,025,538 |
|
| San Bruno Park School District, School | | | | | |
| Improvements, Series B (D) | Zero | | 08-01-21 | 1,015,000 | 570,532 |
| | |
| See notes to financial statements | |
| | |
| 14 | California Tax-Free Income Fund | Annual report | |
| | | | | |
| | | | Maturity | | |
| | Rate | | date | Par value | Value |
| California (continued) | | | | | |
|
| San Bruno Park School District, School | | | | | |
| Improvements, Series B (D) | Zero | | 08-01-23 | $1,080,000 | $533,725 |
|
| San Diego Public Facilities Financing Authority, | | | | | |
| Lease Revenue | 5.250% | | 03-01-40 | 1,000,000 | 983,640 |
|
| San Diego Redevelopment Agency, City | | | | | |
| Heights, Series A | 5.800 | | 09-01-28 | 1,395,000 | 1,325,599 |
|
| San Diego Redevelopment Agency, City | | | | | |
| Heights, Series A | 5.750 | | 09-01-23 | 1,000,000 | 974,580 |
|
| San Diego Redevelopment Agency, Public | | | | | |
| Improvements, Series B | Zero | | 09-01-17 | 1,600,000 | 1,036,624 |
|
| San Diego Redevelopment Agency, Public | | | | | |
| Improvements, Series B | Zero | | 09-01-18 | 1,700,000 | 1,020,187 |
|
| San Diego Unified School District, Election of | | | | | |
| 1998, Series A (D) | Zero | | 07-01-21 | 2,500,000 | 1,556,175 |
|
| San Francisco City & County Redevelopment | | | | | |
| Agency, Community Facilities, District No. 6, | | | | | |
| Series A | 6.000 | | 08-01-25 | 2,500,000 | 2,505,650 |
|
| San Francisco City & County Redevelopment | | | | | |
| Agency, Department of General Services | | | | | |
| Lease, No. 6, Mission Bay South, Series A | 5.150 | | 08-01-35 | 1,250,000 | 1,044,838 |
|
| San Francisco City & County Redevelopment | | | | | |
| Financing Authority, San Francisco | | | | | |
| Redevelopment Projects, Series B | 6.625 | | 08-01-39 | 700,000 | 752,633 |
|
| San Francisco City & County Redevelopment | | | | | |
| Financing Authority, Mission Bay South | | | | | |
| Redevelopment, Series D | 6.625 | | 08-01-39 | 1,000,000 | 1,067,780 |
|
| San Francisco State Building Authority, Series A | 5.000 | | 10-01-13 | 1,755,000 | 1,826,411 |
|
| San Joaquin County, County Administration | | | | | |
| Building (D) | 5.000 | | 11-15-29 | 2,965,000 | 2,932,207 |
|
| San Joaquin Hills Transportation Corridor | | | | | |
| Agency, Highway Revenue Tolls, Escrowed | | | | | |
| to Maturity | Zero | | 01-01-14 | 5,000,000 | 4,723,550 |
|
| San Joaquin Hills Transportation Corridor | | | | | |
| Agency, Highway Revenue Tolls, Escrowed | | | | | |
| to Maturity | Zero | | 01-01-22 | 6,500,000 | 4,220,710 |
|
| San Joaquin Hills Transportation Corridor | | | | | |
| Agency, Highway Revenue Tolls, Series A | 5.750 | | 01-15-21 | 5,000,000 | 4,678,500 |
|
| San Mateo County Joint Power Authority (D) | 5.000 | | 07-01-21 | 1,815,000 | 1,921,958 |
|
| Santa Ana Financing Authority, Police | | | | | |
| Administration & Holdings Facility, | | | | | |
| Series A (D) | 6.250 | | 07-01-19 | 1,790,000 | 2,031,543 |
|
| Santa Ana Financing Authority, Police | | | | | |
| Administration & Holdings Facility, | | | | | |
| Series A (D) | 6.250 | | 07-01-24 | 10,000,000 | 10,850,000 |
|
| Santa Ana Financing Authority, Main Place | | | | | |
| Project, Series D | 5.600 | | 09-01-19 | 1,000,000 | 971,660 |
|
| Santa Fe Springs Community Development | | | | | |
| Commission, Construction Redevelopment | | | | | |
| Project, Series A (D) | Zero | | 09-01-20 | 1,275,000 | 732,016 |
|
| Santa Margarita Water District No: 99-1, | | | | | |
| Prerefunded until 9-1-13 | 6.000 | | 09-01-30 | 500,000 | 579,745 |
|
| Santaluz Community Facilities District No: 2, | | | | | |
| I mprovement Area No. 1 | 6.375 | | 09-01-30 | 1,485,000 | 1,485,757 |
| See notes to financial statements | | |
| | |
| Annual report | California Tax-Free Income Fund | 15 |
| | | | | |
| | | | Maturity | | |
| | Rate | | date | Par value | Value |
| California (continued) | | | | | |
|
| Southern California Public Power Authority, | | | | | |
| Natural Gas Revenue, Series A | 5.250% | | 11-01-26 | $2,000,000 | $1,961,120 |
|
| State of California, Recreation Facilities and | | | | | |
| School Improvements | 6.500 | | 04-01-33 | 5,000,000 | 5,649,250 |
|
| State of California, Water, Utility and Highway | | | | | |
| Improvements | 5.250 | | 03-01-30 | 2,000,000 | 2,042,720 |
|
| State of California, Public Improvements | 5.125 | | 04-01-23 | 2,000,000 | 2,073,300 |
|
| State of California, Housing | 5.125 | | 11-01-24 | 1,000,000 | 1,029,310 |
|
| State of California, Correctional Facility | | | | | |
| Improvements | 5.000 | | 10-01-29 | 2,000,000 | 2,019,200 |
|
| State of California (D) | 4.750 | | 04-01-29 | 6,000,000 | 5,948,040 |
|
| Torrance Hospital Revenue, Torrance Memorial | | | | | |
| Medical Center, Series A | 5.500 | | 06-01-31 | 2,000,000 | 2,017,740 |
|
| Tuolumne Wind Project Authority, Tuolumne | | | | | |
| County Project, Series A | 5.625 | | 01-01-29 | 1,000,000 | 1,079,390 |
|
| Vallejo Sanitation & Flood Control District (D) | 5.000 | | 07-01-19 | 2,324,000 | 2,409,825 |
|
| West Covina Redevelopment Agency, | | | | | |
| Fashion Plaza | 6.000 | | 09-01-22 | 3,000,000 | 3,404,490 |
| | | | | | |
| Puerto Rico 10.83% | | | | | 30,174,312 |
|
| Commonwealth of Puerto Rico | 6.500 | | 07-01-15 | 6,000,000 | 6,823,920 |
|
| Commonwealth of Puerto Rico, Series A | 5.375 | | 07-01-33 | 1,250,000 | 1,274,988 |
|
| Commonwealth of Puerto Rico, Series A | 5.000 | | 07-01-23 | 5,000,000 | 5,086,300 |
|
| Puerto Rico Aqueduct & Sewer Authority, | | | | | |
| Water Revenue (D)(P) | 11.364 | | 07-01-11 | 7,500,000 | 8,419,200 |
|
| Puerto Rico Aqueduct & Sewer Authority, | | | | | |
| Water Revenue, Series A | | | | | |
| (Zero Steps up to 6.125% on 7-1-11) | Zero | | 07-01-24 | 1,750,000 | 1,764,018 |
|
| Puerto Rico Highway & Transportation | | | | | |
| Authority, Fuel Sales Tax Revenue, | | | | | |
| Series A (D) | 5.000 | | 07-01-38 | 190,000 | 188,011 |
|
| Puerto Rico Highway & Transportation | | | | | |
| Authority, Fuel Sales Tax Revenue, | | | | | |
| Series Z (D) | 6.250 | | 07-01-14 | 3,250,000 | 3,664,570 |
|
| Puerto Rico Industrial Tourist Education | | | | | |
| Medical & Environment Authority, | | | | | |
| Hospital de la Concepcion | 6.500 | | 11-15-20 | 500,000 | 513,345 |
|
| Puerto Rico Sales Tax Financing Authority, Sales | | | | | |
| Tax Revenue, Series A | Zero | | 08-01-32 | 3,000,000 | 2,439,960 |
| | |
| See notes to financial statements | |
| | |
| 16 | California Tax-Free Income Fund | Annual report | |
| | |
| | Par value | Value |
|
| Short-Term Investments 0.67% | | $1,863,000 |
|
| (Cost $1,863,000) | | |
| | | |
| Repurchase Agreement 0.67% | | |
|
| Repurchase Agreement with State Street Corp. dated 5-28-10 at 0.010% | | |
| to be repurchased at $1,863,002 on 6-1-10, collateralized by $1,905,000 | | |
| Federal Home Loan Bank, 1.375% due 5-14-12 (valued at $1,905,000) | $1,863,000 | 1,863,000 |
| |
| Total investments (Cost $270,242,289)† 98.79% | | $275,179,440 |
|
| Other assets and liabilities, net 1.21% | | $3,377,705 |
|
| Total net assets 100.00% | | $278,557,145 |
|
The percentage shown for each investment category is the total value of that category as a percentage of the net assets of the Fund.
AMT Interest earned from these securities may be considered a tax preference item for purpose of the Federal Alternative Minimum Tax.
(D) Bond is insured by one of these companies:
| | | |
| Insurance coverage | As a % of total investments | |
| |
| Ambac Financial Group, Inc. | | 2.66% | |
| Assured Guaranty Corp. | | 0.39% | |
| Assured Guaranty Municipal Corp. | | 7.33% | |
| Financial Guaranty Insurance Corp. | | 3.38% | |
| National Public Finance Guarantee Insurance Corp. | | 22.54% | |
(P) Variable rate obligation. The coupon rate shown represents the rate at period end.
† At 5-31-10, the aggregate cost of investment securities for federal income tax purposes was $268,718,652. Net unrealized appreciation aggregated $6,460,788, of which $15,134,756 related to appreciated investment securities and $8,673,968 related to depreciated investment securities.
The Fund had the following sector composition as of 5-31-10 (as a percentage of total net assets):
| | | |
| General Obligation Bonds | 19% | | |
| Revenue Bonds | | | |
| Facilities | 10% | | |
| Transportation | 10% | | |
| Special Tax | 8% | | |
| Health Care | 7% | | |
| Education | 7% | | |
| Tobacco | 4% | | |
| Utilities | 4% | | |
| Other Revenue | 29% | | |
| Short-Term Investments & Other | 2% | | |
| See notes to financial statements | | |
| | |
| Annual report | California Tax-Free Income Fund | 17 |
F I N A N C I A L S T A T E M E N T S
Financial statements
Statement of assets and liabilities 5-31-10
This Statement of Assets and Liabilities is the Fund’s balance sheet. It shows the value of what the Fund owns, is due and owes. You’ll also find the net asset value and the maximum offering price per share.
| |
| Assets | |
|
| Investments, at value (Cost $270,242,289) | 275,179,440 |
| Cash | 352 |
| Receivable for fund shares sold | 378,951 |
| Interest receivable | 4,007,908 |
| Other receivables and prepaid assets | 44,273 |
| | |
| Total assets | 279,610,924 |
| |
| Liabilities | |
|
| Payable for fund shares repurchased | 299,426 |
| Distributions payable | 493,950 |
| Payable to affiliates | |
| Accounting and legal services fees | 3,775 |
| Transfer agent fees | 4,274 |
| Distribution and service fees | 31,818 |
| Trustees’ fees | 27,008 |
| Management fees | 129,700 |
| Other liabilities and accrued expenses | 63,828 |
| | |
| Total liabilities | 1,053,779 |
| |
| Net assets | |
|
| Capital paid-in | $273,904,526 |
| Undistributed net investment income | 140,687 |
| Accumulated net realized loss on investments | (425,219) |
| Net unrealized appreciation (depreciation) on investments | 4,937,151 |
| | |
| Net assets | $278,557,145 |
| |
| Net asset value per share | |
|
| Based on net asset values and shares outstanding — the Fund has an | |
| unlimited number of shares authorized with no par value | |
| Class A ($250,080,381 ÷ 24,234,823 shares) | $10.32 |
| Class B ($3,909,006 ÷ 378,763 shares)1 | $10.32 |
| Class C ($24,567,758 ÷ 2,380,767 shares)1 | $10.32 |
| |
| Maximum offering price per share | |
|
| Class A (net asset value per share ÷ 95.5%)2 | $10.81 |
1 Redemption price is equal to net asset value less any applicable contingent deferred sales charge.
2 On single retail sales of less than $100,000. On sales of $100,000 or more and on group sales the offering price is reduced.
| | |
| See notes to financial statements |
| |
| 18 | California Tax-Free Income Fund | Annual report |
F I N A N C I A L S T A T E M E N T S
Statement of operations
For the year ended 5-31-10This Statement of Operations summarizes the Fund’s investment income earned and expenses incurred in operating the Fund. It also shows net gains (losses) for the period stated.
| |
| Investment income | |
|
| Interest | $16,056,748 |
| |
| Expenses | |
|
| Investment management fees (Note 4) | 1,522,739 |
| Distribution and service fees (Note 4) | 628,727 |
| Accounting and legal services fees (Note 4) | 47,140 |
| Transfer agent fees (Note 4) | 137,093 |
| Trustees’ fees (Note 4) | 19,088 |
| State registration fees | 6,100 |
| Printing and postage fees | 8,782 |
| Professional fees | 90,790 |
| Custodian fees | 58,773 |
| Registration and filing fees | 30,376 |
| Other | 13,340 |
| | |
| Total expenses | 2,562,948 |
| Less expense reductions (Note 4) | (2,268) |
| | |
| Net expenses | 2,560,680 |
| | |
| Net investment income | 13,496,068 |
| |
| Realized and unrealized gain (loss) | |
|
| Net realized gain on Investments | 246,587 |
| Change in net unrealized appreciation (depreciation) of Investments | 16,429,620 |
| | |
| Net realized and unrealized gain | 16,676,207 |
| | |
| Increase in net assets from operations | $30,172,275 |
| | |
| See notes to financial statements | | |
| | |
| Annual report | California Tax-Free Income Fund | 19 |
F I N A N C I A L S T A T E M E N T S
Statements of changes in net assets
These Statements of Changes in Net Assets show how the value of the Fund’s net assets has changed during the last three periods. The difference reflects earnings less expenses, any investment gains and losses, distributions, if any, paid to shareholders and the net of Fund share transactions.
| | | | |
| | | Year | Period | Year |
| | | ended | ended | ended |
| | | 5-31-10 | 5-31-091 | 8-31-08 |
| Increase (decrease) in net assets | | | | |
|
| From operations | | | | |
| Net investment income | | $13,496,068 | $10,192,825 | $14,264,926 |
| Net realized gain (loss) | | 246,587 | (2,017,380) | 219,561 |
| Change in net unrealized | | | | |
| appreciation (depreciation) | | 16,429,620 | (18,907,753) | (7,654,523) |
| | | | |
| Increase (decrease) in net assets resulting | | | | |
| from operations | | 30,172,275 | (10,732,308) | 6,829,964 |
| | | | |
| Distributions to shareholders | | | | |
| From net investment income | | | | |
| Class A | | (12,251,295) | (9,586,599) | (13,221,127) |
| Class B | | (200,255) | (251,259) | (437,796) |
| Class C | | (816,895) | (379,274) | (443,676) |
| From net realized gain | | | | |
| Class A | | — | (170,182) | (374,572) |
| Class B | | — | (5,509) | (16,486) |
| Class C | | — | (7,541) | (14,767) |
| | | | |
| Total distributions | | (13,268,445) | (10,400,364) | (14,508,424) |
| | | | |
| From Fund share transactions (Note 5) | | (9,468,814) | (25,258,109) | (3,483,468) |
| | | | |
| Total increase (decrease) | | 7,435,016 | (46,390,781) | (11,161,928) |
| |
| Net assets | | | | |
|
| Beginning of year | | 271,122,129 | 317,512,910 | 328,674,838 |
| | | | |
| End of year | | $278,557,145 | $271,122,129 | $317,512,910 |
| | | | |
| Undistributed net investment income | | $140,687 | $7,703 | $38,879 |
1 For the nine-month period ended 5-31-09. The Fund changed its fiscal year end from August 31 to May 31.
| | |
| See notes to financial statements | |
| | |
| 20 | California Tax-Free Income Fund | Annual report | |
Financial highlights
The Financial Highlights show how the Fund’s net asset value for a share has changed since the end of the previous period.
| | | | | | |
| CLASS A SHARES Period ended | 5-31-10 | 5-31-091 | 8-31-08 | 8-31-07 | 8-31-06 | 8-31-052 |
| |
| Per share operating performance | | | | | | |
|
| Net asset value, beginning of year | $9.70 | $10.36 | $10.61 | $10.93 | $11.08 | $10.91 |
| Net investment income3 | 0.50 | 0.36 | 0.47 | 0.47 | 0.49 | 0.51 |
| Net realized and unrealized gain (loss) | | | | | | |
| on investments | 0.61 | (0.65) | (0.25) | (0.32) | (0.15) | 0.16 |
| Total from investment operations | 1.11 | (0.29) | 0.22 | 0.15 | 0.34 | 0.67 |
| Less distributions | | | | | | |
| From net investment income | (0.49) | (0.36) | (0.46) | (0.47) | (0.49) | (0.50) |
| From net realized gain | — | (0.01) | (0.01) | — | — | — |
| Total distributions | (0.49) | (0.37) | (0.47) | (0.47) | (0.49) | (0.50) |
| Net asset value, end of year | $10.32 | $9.70 | $10.36 | $10.61 | $10.93 | $11.08 |
| Total return (%)4 | 11.695 | (2.63)5,6 | 2.185 | 1.345 | 3.195 | 6.24 |
| |
| Ratios and supplemental data | | | | | | |
|
| Net assets, end of year (in millions) | $250 | $248 | $294 | $304 | $296 | $306 |
| Ratios (as a percentage of average net | | | | | | |
| assets): | | | | | | |
| Expenses before reductions | 0.85 | 0.917,8 | 0.81 | 0.81 | 0.82 | 0.86 |
| Expenses net of fee waivers | 0.85 | 0.917,8 | 0.81 | 0.81 | 0.82 | 0.86 |
| Net investment income | 4.97 | 5.107 | 4.45 | 4.33 | 4.53 | 4.59 |
| Portfolio turnover (%) | 9 | 26 | 22 | 41 | 33 | 13 |
| |
1 For the nine-month period ended 5-31-09. The Fund changed its fiscal year end from August 31 to May 31.
2 Audited by previous independent registered public accounting firm.
3 Based on the average daily shares outstanding.
4 Assumes dividend reinvestment (if applicable).
5 Total return would have been lower had certain expenses not been reduced during the period.
6 Not annualized.
7 Annualized.
8 Includes proxy fees. The impact of this expense to the gross and net expense ratios was 0.04%.
| See notes to financial statements | | |
| | |
| Annual report | California Tax-Free Income Fund | 21 |
| | | | | | |
| CLASS B SHARES Period ended | 5-31-10 | 5-31-091 | 8-31-08 | 8-31-07 | 8-31-06 | 8-31-052 |
| |
| Per share operating performance | | | | | | |
|
| Net asset value, beginning of year | $9.70 | $10.36 | $10.61 | $10.93 | $11.08 | $10.91 |
| Net investment income3 | 0.41 | 0.30 | 0.38 | 0.38 | 0.40 | 0.41 |
| Net realized and unrealized gain (loss) | | | | | | |
| on investments | 0.61 | (0.65) | (0.25) | (0.32) | (0.15) | 0.16 |
| Total from investment operations | 1.02 | (0.35) | 0.13 | 0.06 | 0.25 | 0.57 |
| Less distributions | | | | | | |
| From net investment income | (0.40) | (0.30) | (0.37) | (0.38) | (0.40) | (0.40) |
| From net realized gain | — | (0.01) | (0.01) | — | — | — |
| Total distributions | (0.40) | (0.31) | (0.38) | (0.38) | (0.40) | (0.40) |
| Net asset value, end of year | $10.32 | $9.70 | $10.36 | $10.61 | $10.93 | $11.08 |
| Total return (%)4 | 10.755 | (3.25)5,6 | 1.315 | 0.485 | 2.325 | 5.35 |
| |
| Ratios and supplemental data | | | | | | |
|
| Net assets, end of year (in millions) | $4 | $7 | $10 | $15 | $24 | $32 |
| Ratios (as a percentage of average net | | | | | | |
| assets): | | | | | | |
| Expenses before reductions | 1.70 | 1.767,8 | 1.66 | 1.66 | 1.67 | 1.71 |
| Expenses net of fee waivers | 1.70 | 1.767,8 | 1.66 | 1.66 | 1.67 | 1.71 |
| Net investment income | 4.12 | 4.257 | 3.59 | 3.47 | 3.68 | 3.75 |
| Portfolio turnover (%) | 9 | 26 | 22 | 41 | 33 | 13 |
| |
1 For the nine-month period ended 5-31-09. The Fund changed its fiscal year end from August 31 to May 31.
2 Audited by previous independent registered public accounting firm.
3 Based on the average daily shares outstanding.
4 Assumes dividend reinvestment (if applicable).
5 Total return would have been lower had certain expenses not been reduced during the period.
6 Not annualized.
7 Annualized.
8 Includes proxy fees. The impact of this expense to the gross and net expense ratios was 0.04%.
| | | | | | |
| CLASS C SHARES Period ended | 5-31-10 | 5-31-091 | 8-31-08 | 8-31-07 | 8-31-06 | 8-31-052 |
| |
| Per share operating performance | | | | | | |
|
| Net asset value, beginning of year | $9.70 | $10.36 | $10.61 | $10.93 | $11.08 | $10.91 |
| Net investment income3 | 0.41 | 0.30 | 0.38 | 0.37 | 0.40 | 0.41 |
| Net realized and unrealized gain (loss) | | | | | | |
| on investments | 0.61 | (0.65) | (0.25) | (0.31) | (0.15) | 0.16 |
| Total from investment operations | 1.02 | (0.35) | 0.13 | 0.06 | 0.25 | 0.57 |
| Less distributions | | | | | | |
| From net investment income | (0.40) | (0.30) | (0.37) | (0.38) | (0.40) | (0.40) |
| From net realized gain | — | (0.01) | (0.01) | — | — | — |
| Total distributions | (0.40) | (0.31) | (0.38) | (0.38) | (0.40) | (0.40) |
| Net asset value, end of year | $10.32 | $9.70 | $10.36 | $10.61 | $10.93 | $11.08 |
| Total return (%)4 | 10.765 | (3.25)5,6 | 1.315 | 0.485 | 2.325 | 5.35 |
| |
| Ratios and supplemental data | | | | | | |
|
| Net assets, end of year (in millions) | $25 | $17 | $14 | $10 | $8 | $7 |
| Ratios (as a percentage of average net | | | | | | |
| assets): | | | | | | |
| Expenses before reductions | 1.70 | 1.767,8 | 1.66 | 1.66 | 1.67 | 1.71 |
| Expenses net of fee waivers | 1.70 | 1.767,8 | 1.66 | 1.66 | 1.67 | 1.71 |
| Net investment income | 4.11 | 4.227 | 3.60 | 3.47 | 3.68 | 3.74 |
| Portfolio turnover (%) | 9 | 26 | 22 | 41 | 33 | 13 |
| |
1 For the nine-month period ended 5-31-09. The Fund changed its fiscal year end from August 31 to May 31.
2 Audited by previous independent registered public accounting firm.
3 Based on the average daily shares outstanding.
4 Assumes dividend reinvestment (if applicable).
5 Total return would have been lower had certain expenses not been reduced during the period.
6 Not annualized.
7 Annualized.
8 Includes proxy fees. The impact of this expense to the gross and net expense ratios was 0.04%.
| | |
| See notes to financial statements | |
| | |
| 22 | California Tax-Free Income Fund | Annual report | |
Notes to financial statements
Note 1 — Organization
John Hancock California Tax-Free Income Fund (the Fund) is a non-diversified open-end management investment company organized as a Massachusetts business trust and registered under the Investment Company Act of 1940, as amended (the 1940 Act). The investment objective of the Fund is to seek a high level of current income, consistent with preservation of capital, that is exempt from federal and California personal income taxes.
The Fund may offer multiple classes of shares. The shares currently offered are detailed in the Statement of Assets and Liabilities. Class A, Class B and Class C shares are offered to all investors. Shareholders of each class have exclusive voting rights to matters that affect that class. The distribution and service fees and transfer agent fees for each class may differ. Class B shares convert to Class A shares eight years after purchase.
Note 2 — Significant accounting policies
The financial statements have been prepared in conformity with accounting principles generally accepted in the United States of America, which require management to make certain estimates and assumptions at the date of the financial statements. Actual results could differ from those estimates. Events or transactions occurring after the end of the fiscal period through the date that the financial statements were issued have been evaluated in the preparation of the financial statements. The following summarizes the significant accounting policies of the Fund:
Security valuation. Investments are stated at value as of the close of regular trading on the New York Stock Exchange (NYSE), normally at 4:00 P.M., Eastern Time. The Fund uses a three-tier hierarchy to prioritize the pricing assumptions, referred to as inputs, used in valuation techniques to measure fair value. Level 1 includes quoted prices in active markets for identical securities. Level 2 includes significant observable inputs. Observable inputs may include quoted prices for similar securities, interest rates, prepayment speeds and credit risk. Prices for securities valued using these techniques are received from independent pricing vendors and brokers and are based on an evaluation of the inputs described. Level 3 includes significant unobservable inpu ts when market prices are not readily available or reliable, including the Fund’s own assumptions in determining the fair value of investments. The inputs or methodology used for valuing securities are not necessarily an indication of the risk associated with investing in those securities.
As of May 31, 2010, all investments are categorized as Level 2 under the hierarchy described above. During the year ended May 31, 2010, there were no significant transfers in or out of Level 2 assets.
In order to value the securities, the Fund uses the following valuation techniques. Debt obligations are valued based on the evaluated prices provided by an independent pricing service, which utilizes both dealer-supplied and electronic data processing techniques, which take into account factors such as institutional-size trading in similar groups of securities, yield, quality, coupon rate, maturity, type of issue, trading characteristics and other market data. Certain securities traded only in the over-the-counter market are valued at the last bid price quoted by brokers making markets in the securities at the close of trading. Certain short-term securities are valued at amortized cost. Other portfolio securities and assets, where market quotations are not readily available, are valued at fair value, as determined in good faith by the Fund’s Pricing Committee, following procedures established by the Board of Trustees.
Repurchase agreements. The Fund may enter into repurchase agreements. When a Fund enters into a repurchase agreement, it receives collateral which is held in a segregated account by the
| |
| Annual report | California Tax-Free Income Fund | 23 |
Fund’s custodian. The collateral amount is marked-to-market and monitored on a daily basis to ensure that the collateral held is in an amount not less than the principal amount of the repurchase agreement plus any accrued interest. In the event of a default by the counterparty, realization of the collateral proceeds could be delayed, during which time the collateral value may decline.
Security transactions and related investment income. Investment security transactions are accounted for on a trade date plus one basis for daily net asset value calculations. However, for financial reporting purposes, investment transactions are reported on trade date. Interest income is accrued as earned. Gains and losses on securities sold are determined on the basis of identified cost and may include proceeds from litigation. Interest income includes coupon interest and amortization/accretion of premiums/discounts on debt securities. Debt obligations may be placed in a non-accrual status and related interest income may be reduced by stopping current accruals and writing off interest receivables when the collection of all or a portion of interest has become doubtful.
Line of credit. The Fund may borrow from banks for temporary or emergency purposes, including meeting redemption requests that otherwise might require the untimely sale of securities. Pursuant to the custodian agreement, the custodian may loan money to a Fund to make properly authorized payments. The Fund is obligated to repay the custodian for any overdraft, including any related costs or expenses. The custodian has a lien, security interest or security entitlement in any Fund property that is not segregated, to the maximum extent permitted by law for any overdraft.
In addition, the Fund and other affiliated funds have entered into an agreement with the custodian which enables them to participate in a $100 million unsecured committed line of credit. Prior to March 31, 2010, the amount of the line of credit was $150 million. A commitment fee, payable at the end of each calendar quarter, based on the average daily unused portion of the line of credit, is charged to each participating fund on a pro rata basis based on their relative average net assets. For the year ended May 31, 2010, the Fund had no significant borrowings under the line of credit.
Expenses. The majority of expenses are directly attributable to an individual fund. Expenses that are not readily attributable to a specific fund are allocated among all funds in an equitable manner, taking into consideration, among other things, the nature and type of expense and the fund’s relative net assets. Expense estimates are accrued in the period to which they relate and adjustments are made when actual amounts are known.
Class allocations. Income, common expenses, and realized and unrealized gains (losses) are determined at the Fund level and allocated daily to each class of shares based on the net asset value of the class. Class-specific expenses, such as distribution and service fees, if any, and transfer agent fees, for all classes are calculated daily at the class level based on the appropriate net asset value of each class and the specific expense rates applicable to each class.
Federal income taxes. The Fund intends to qualify as a regulated investment company by complying with the applicable provisions of the Internal Revenue Code and will not be subject to federal income tax on taxable income that is distributed to shareholders. Therefore, no federal income tax provision is required.
For federal income tax purposes, the Fund has a capital loss carryforward of $1,891,068 available to offset future net realized capital gains. The loss carryforward expires as follows: May 31, 2017 — $1,684,651 and May 31, 2018 — $206,417.
As of May 31, 2010, the Fund had no uncertain tax positions that would require financial statement recognition, de-recognition or disclosure. The Fund’s federal tax return is subject to examination by the Internal Revenue Service for a period of three years.
| |
| 24 | California Tax-Free Income Fund | Annual report |
Distribution of income and gains. Distributions to shareholders from net investment income and net realized gains, if any, are recorded on the ex-dividend date. The Fund generally declares dividends daily and pays them monthly. Capital gain distributions, if any, are paid annually. The tax character of distributions for the year ended May 31, 2010, the nine-month period ended May 31, 2009 and the year ended August 31, 2008 were as follows:
| | | | |
| | MAY 31,2010 | MAY 31,2009 | AUGUST 31,2008 | |
| |
| Ordinary Income | $85,330 | $34,062 | $20,361 | |
| |
| Exempt Income | $13,183,115 | $10,183,131 | $14,082,238 | |
| |
| Long-Term Capital Gain | $— | $183,171 | $405,825 | |
Distributions paid by the Fund with respect to each class of shares are calculated in the same manner, at the same time and are in the same amount, except for the effect of expenses that may be applied differently to each class. As of May 31, 2010, the components of distributable earnings on a tax basis included $655,548 of undistributed exempt interest.
Such distributions and distributable earnings, on a tax basis, are determined in conformity with income tax regulations, which may differ from accounting principles generally accepted in the United States of America. Material distributions in excess of tax basis earnings and profits, if any, are reported in the Fund’s financial statements as a return of capital.
Capital accounts within financial statements are adjusted for permanent book-tax differences. These adjustments have no impact on net assets or the results of operations. Temporary book-tax differences will reverse in a subsequent period. Permanent book-tax differences are primarily attributable to amortization and accretion on debt securities.
Note 3 — Guarantees and indemnifications
Under the Fund’s organizational documents, its Officers and Trustees are indemnified against certain liabilities arising out of the performance of their duties to the Fund. Additionally, in the normal course of business, the Fund enters into contracts with service providers that contain general indemnification clauses. The Fund’s maximum exposure under these arrangements is unknown, as this would involve future claims that may be made against the Fund that have not yet occurred. The risk of material loss from such claims is considered remote.
Note 4 — Fees and transactions with affiliates
John Hancock Advisers, LLC (the Adviser) serves as investment adviser for the Fund. John Hancock Funds, LLC (the Distributor), an affiliate of the Adviser, serves as principal underwriter of the Fund. The Adviser and the Distributor are indirect wholly owned subsidiaries of Manulife Financial Corporation (MFC).
Management fee. The Fund has an investment management contract with the Adviser under which the Fund pays a monthly management fee to the Adviser equivalent, on an annual basis, to the sum of: (a) 0.55% of the first $500,000,000 of the Fund’s average daily net asset value, (b) 0.50% of the next $500,000,000, (c) 0.475% of the next $1,000,000,000 and (d) 0.45% of the Fund’s average daily net asset value in excess of $2,000,000,000. Prior to October 1, 2009, the Fund paid this fee monthly, equivalent, on an annual basis, to the sum of: (a) 0.55% of the first $500,000,000 of the Fund’s average daily net asset value and (b) 0.50% of the Fund’s average daily net asset value in excess of $500,000,000. The Adviser has a subadvisory agreement with MFC Global Investment Management (U.S.), LLC, an indirect owned subsidiary of MFC and an affiliate of the Adviser. The Fund is not responsible for paymen t of the subadvisory fees.
The investment management fees incurred for the year ended May 31, 2010 were equivalent to an annual effective rate of 0.55% of the Fund’s average daily net assets.
| |
| Annual report | California Tax-Free Income Fund | 25 |
The Adviser has voluntarily waived certain other expenses. Accordingly, these expense reductions amounted to $586, $11 and $49 for Class A, Class B and Class C shares, respectively, for the year ended May 31, 2010.
Accounting and legal services. Pursuant to the Accounting and Legal Services Agreement, the Fund reimburses the Adviser for all expenses associated with providing the administrative, financial, legal, accounting and recordkeeping services of the Fund, including the preparation of all tax returns, periodic reports to shareholders and regulatory reports, among other services. These expenses are allocated to each share class based on its relative net assets at the time the expense was incurred. The accounting and legal services fees incurred for the year ended May 31, 2010, amounted to an annual rate of 0.02% of the Fund’s average daily net assets.
Distribution and service plans. The Fund has a distribution agreement with the Distributor. The Fund has adopted distribution and service plans with respect to Class A, Class B and Class C shares pursuant to Rule 12b-1 under the 1940 Act, to pay the Distributor for services provided as the distributor of shares of the Fund. The Fund may pay up to the following contractual rates of distribution and service fees under this arrangement, expressed as an annual percentage of average daily net assets for each class of the Fund’s shares.
| | | | | |
| Class | 12b-1 Fee | | | | |
| | | | |
| Class A | 0.15% | | | | |
| Class B | 1.00% | | | | |
| Class C | 1.00% | | | | |
Sales charges. Class A shares are assessed up-front sales charges, which resulted in payments to the Distributor amounting to $294,356 for the year ended May 31, 2010. Of this amount, $39,450 was retained and used for printing prospectuses, advertising, sales literature and other purposes, $253,800 was paid as sales commissions to broker-dealers and $1,106 was paid as sales commissions to sales personnel of Signator Investors, Inc. (Signator Investors), a broker-dealer affiliate of the Adviser.
Class B and Class C shares are subject to contingent deferred sales charges (CDSC). Class B shares that are redeemed within six years of purchase are subject to CDSC, at declining rates, beginning at 5.00% of the lesser of the current market value at the time of redemption or the original purchase cost of the shares being redeemed. Class C shares that are redeemed within one year of purchase are subject to a 1.00% CDSC on the lesser of the current market value at the time of redemption or the original purchase cost of the shares being redeemed. Proceeds from CDSCs are used to compensate the Distributor for providing distribution-related services in connection with the sale of these shares. During the year ended May 31, 2010, CDSCs received by the Distributor amounted to $6,785 and $1,616 for Class B and Class C shares, respectively.
Transfer agent fees. The Fund has a transfer agent agreement with John Hancock Signature Services, Inc. (Signature Services or Transfer Agent), an affiliate of the Adviser. The transfer agent fees are made up of three components:
• The Fund pays a monthly transfer agent fee at an annual rate of 0.01% for all classes, based on each class’s average daily net assets.
• The Fund pays a monthly fee based on an annual rate of $17.50 per shareholder account for all classes.
• In addition, Signature Services is reimbursed for certain out-of-pocket expenses.
Effective July 1, 2010, the transfer agent fees paid to Signature Services are determined based on the cost to Signature Services (Signature Services Cost). The Signature Services Cost is comprised
| |
| 26 | California Tax-Free Income Fund | Annual report |
of a component of allocated John Hancock corporate overhead for providing transfer agent services to the Fund and to all other John Hancock affiliated funds. It also includes out-of-pocket expenses that are comprised of payments made to third-parties for services provided to their clients who invest in one or more John Hancock funds. Signature Services Cost is calculated monthly and allocated to four categories of share classes: Institutional Share Classes, Retirement Share Classes, Municipal Bond Classes and all other Retail Share Classes. Within each of these categories, Signature Services Cost is allocated to the affected John Hancock affiliated funds and/or classes, based on the relative average daily net assets.
Certain investor accounts that maintain small balances are charged an annual small accounts fee by Signature Services. The amounts related to these fees are credited by Signature Services to the Fund. For the year ended May 31, 2010, these fees amounted to $1,481, $32 and $109 for Class A, Class B and Class C shares, respectively.
Class level expenses for the year ended May 31, 2010 were:
| | | | |
| | Distribution and | Transfer | | |
| Share class | service fees | agent fees | | |
| | |
| Class A | $376,084 | $124,851 | | |
| Class B | 49,658 | 2,538 | | |
| Class C | 202,985 | 9,704 | | |
| Total | $628,727 | $137,093 | | |
Trustee expenses. The Trust compensates each Trustee who is not an employee of the Adviser or its affiliates. The Trustees may, for tax purposes, elect to defer receipt of this compensation under the John Hancock Group of Funds Deferred Compensation Plan. Deferred amounts are invested in various John Hancock funds and remain in the funds until distributed in accordance with the Plan. The investment of deferred amounts and the offsetting liability are included in the accompanying Statement of Assets and Liabilities.
Note 5 — Fund share transactions
Transactions in Fund shares for the year ended May 31, 2010, the nine-month period ended May 31, 2009 and the year ended August 31, 2008, were as follows:
| | | | | | |
| | Year ended 5-31-10 | Period ended 5-31-091 | Year ended 8-31-08 |
| | Shares | Amount | Shares | Amount | Shares | Amount |
| Class A shares | | | | | | |
|
| Sold | 2,230,303 | $22,224,630 | 1,934,331 | $18,765,416 | 4,992,318 | $52,426,707 |
| Distributions | | | | | | |
| reinvested | 626,781 | 6,291,925 | 562,381 | 5,269,999 | 734,057 | 7,695,093 |
| Repurchased | (4,171,072) | (41,741,415) | (5,280,492) | (50,068,901) | (6,016,558) | |
| (1,313,988) | ($13,224,860) | (2,783,780) | ($26,033,486) | (290,183) | (63,195,548) |
| Net decrease | | | ($3,073,748) |
| | | | | | | |
| Class B shares | | | | | | |
|
| Sold | 52,185 | $527,171 | 28,461 | $269,239 | 51,446 | $549,219 |
| Distributions | | | | | | |
| reinvested | 8,978 | 89,842 | 14,704 | 137,553 | 24,616 | 258,404 |
| Repurchased | (357,512) | (3,554,587) | (369,962) | (3,477,887) | (459,249) | (4,853,916) |
| | | | | | | |
| Net decrease | (296,349) | ($2,937,574) | (326,797) | ($3,071,095) | (383,187) | ($4,046,293) |
| |
| Annual report | California Tax-Free Income Fund | 27 |
| | | | | | |
| | Year ended 5-31-10 | Period ended 5-31-091 | Year ended 8-31-08 |
| | Shares | Amount | Shares | Amount | Shares | Amount |
| Class C shares | | | | | | |
|
| Sold | 944,672 | $9,509,157 | 730,370 | $6,917,625 | 546,964 | $5,771,432 |
| Distributions | | | | | | |
| reinvested | 33,195 | 333,896 | 24,365 | 228,155 | 23,635 | 247,277 |
| Repurchased | (314,838) | (3,149,433) | (346,845) | (3,299,308) | (227,092) | (2,382,136) |
| | | | | | |
| Net increase | 663,029 | $6,693,620 | 407,890 | $3,846,472 | 343,507 | $3,636,573 |
| | | | | | |
| Net decrease | (947,308) | ($9,468,814) | (2,702,687) | ($25,258,109) | (329,863) | ($3,483,468) |
|
1 For the nine-month period ended May 31, 2009. The Fund changed its fiscal year end from August 31 to May 31.
Note 6 — Purchase and sale of securities
Purchases and sales of securities, other than short-term securities, aggregated $29,177,920 and $42,291,384, respectively for the year ended May 31, 2010. These amounts include purchases and sales of variable rate demand notes, which amounted to $3,650,000 and $6,350,000, respectively. Other short-term securities are excluded from these amounts.
| |
| 28 | California Tax-Free Income Fund | Annual report |
Auditors’ report
Report of Independent Registered Public Accounting Firm
To the Board of Trustees and Shareholders of John Hancock California Tax-Free Income Fund:
In our opinion, the accompanying statement of assets and liabilities, including the schedule of investments, and the related statements of operations and of changes in net assets and the financial highlights present fairly, in all material respects, the financial position of John Hancock California Tax-Free Income Fund (the “Fund”) at May 31, 2010, and the results of its operations, the changes in its net assets and the financial highlights for each of the periods indicated, in conformity with accounting principles generally accepted in the United States of America. These financial statements and financial highlights (hereafter referred to as “financial statements”) are the responsibility of the Fund’s management; our responsibility is to express an opinion on these financial statements based on our audits. We conducted our audits of these financial statements in accordance with the standards of the Public Company Accounting Oversight Board (United States). Those standards require that we plan and perform the audits to obtain reasonable assurance about whether the financial statements are free of material misstatement. An audit includes examining, on a test basis, evidence supporting the amounts and disclosures in the financial statements, assessing the accounting principles used and significant estimates made by management, and evaluating the overall financial statement presentation. We believe that our audits, which included confirmation of securities at May 31, 2010 by correspondence with the custodian, provide a reasonable basis for our opinion. The financial highlights for the period ended on August 31, 2005 was audited by other auditors whose report expressed an unqualified opinion.
PricewaterhouseCoopers LLP
Boston, Massachusetts
July 16, 2010
| |
| Annual report | California Tax-Free Income Fund | 29 |
Tax information
Unaudited
For federal income tax purposes, the following information is furnished with respect to the distributions of the Fund, if any, paid during its taxable period ended May 31, 2010.
The Fund designates 99.39% of dividends from net investment income as exempt-interest dividends. The percentage of dividends subject to the alternative minimum tax is 2.96%.
For specific information on exception provisions in your state, consult your local state tax office or your tax adviser. Shareholders will be mailed a 2010 U.S. Treasury Department Form 1099-DIV in January 2011. This will reflect the total of all distributions that are taxable for calendar year 2010.
| |
| 30 | California Tax-Free Income Fund | Annual report |
Trustees and Officers
This chart provides information about the Trustees and Officers who oversee your John Hancock fund. Officers elected by the Trustees manage the day-to-day operations of the Fund and execute policies formulated by the Trustees.
| | |
| Independent Trustees | | |
| | | |
| Name, Year of Birth | Trustee | Number of John |
| Position(s) held with Fund | of the | Hancock funds |
| Principal occupation(s) and other | Trust | overseen by |
| directorships during past 5 years | since1 | Trustee |
| |
| Patti McGill Peterson, Born: 1943 | 2006 | 47 |
|
| Chairperson (since December 2008); Principal, PMP Globalinc (consulting) (since 2007); Senior |
| Associate, Institute for Higher Education Policy (since 2007); Executive Director, CIES (international |
| education agency) (until 2007); Vice President, Institute of International Education (until 2007); Senior |
| Fellow, Cornell University Institute of Public Affairs, Cornell University (1997–1998); Former President |
| Wells College, St. Lawrence University and the Association of Colleges and Universities of the State |
| of New York. Director of the following: Niagara Mohawk Power Corporation (until 2003); Security |
| Mutual Life (insurance) (until 1997); ONBANK (until 1993). Trustee of the following: Board of Visitors, |
| The University of Wisconsin, Madison (since 2007); Ford Foundation, International Fellowships Program |
| (until 2007); UNCF, International Development Partnerships (until 2005); Roth Endowment (since 2002); |
| Council for International Educational Exchange (since 2003). | | |
| |
| James F. Carlin, Born: 1940 | 2006 | 47 |
|
| Chief Executive Officer, Director and Treasurer, Alpha Analytical Laboratories (environmental, |
| chemical and pharmaceutical analysis) (since 1985); Part Owner and Treasurer, Lawrence Carlin |
| Insurance Agency, Inc. (since 1995); Chairman and Chief Executive Officer, Carlin Consolidated, Inc. |
| (management/investments) (since 1987). | | |
| |
| William H. Cunningham, Born: 1944 | 2006 | 47 |
|
| Professor, University of Texas, Austin, Texas (since 1971); former Chancellor, University of Texas System |
| and former President of the University of Texas, Austin, Texas; Director of the following: LIN Television |
| (since 2009); Lincoln National Corporation (insurance) (Chairman since 2009 and Director since 2006); |
| Resolute Energy Corporation (since 2009); Nanomedical Systems, Inc. (biotechnology company) |
| (Chairman since 2008); Yorktown Technologies, LP (tropical fish) (Chairman since 2007); Greater Austin |
| Crime Commission (since 2001); Southwest Airlines (since 2000); former Director of the following: |
| Introgen (manufacturer of biopharmaceuticals) (until 2008); Hicks Acquisition Company I, Inc. (until |
| 2007); Jefferson-Pilot Corporation (diversified life insurance company) (until 2006); and former Advisory |
| Director, JP Morgan Chase Bank (formerly Texas Commerce Bank–Austin) (until 2009). | |
| |
| Deborah C. Jackson,2 Born: 1952 | 2008 | 47 |
|
| Chief Executive Officer, American Red Cross of Massachusetts Bay (since 2002); Board of Directors |
| of Eastern Bank Corporation (since 2001); Board of Directors of Eastern Bank Charitable Foundation |
| (since 2001); Board of Directors of American Student Association Corp. (since 1996); Board of Directors |
| of Boston Stock Exchange (2002–2008); Board of Directors of Harvard Pilgrim Healthcare (health |
| benefits company) (since 2007). | | |
| |
| Annual report | California Tax-Free Income Fund | 31 |
| | |
| Independent Trustees (continued) | | |
| |
| Name, Year of Birth | Trustee | Number of John |
| Position(s) held with Fund | of the | Hancock funds |
| Principal occupation(s) and other | Trust | overseen by |
| directorships during past 5 years | since1 | Trustee |
| |
| Charles L. Ladner, Born: 1938 | 2006 | 47 |
|
| Chairman and Trustee, Dunwoody Village, Inc. (retirement services) (since 2008); Director, Philadelphia |
| Archdiocesan Educational Fund (since 2009); Senior Vice President and Chief Financial Officer, UGI |
| Corporation (public utility holding company) (retired 1998); Vice President and Director for AmeriGas, |
| Inc. (retired 1998); Director of AmeriGas Partners, L.P. (gas distribution) (until 1997); Director, |
| EnergyNorth, Inc. (until 1995); Director, Parks and History Association (Cooperating Association, |
| National Park Service) (until 2005). | | |
| |
| Stanley Martin,2 Born: 1947 | 2008 | 47 |
|
| Senior Vice President/Audit Executive, Federal Home Loan Mortgage Corporation (2004–2006); |
| Executive Vice President/Consultant, HSBC Bank USA (2000–2003); Chief Financial Officer/Executive |
| Vice President, Republic New York Corporation & Republic National Bank of New York (1998–2000); |
| Partner, KPMG LLP (1971–1998). | | |
| |
| Dr. John A. Moore, Born: 1939 | 2006 | 47 |
|
| President and Chief Executive Officer, Institute for Evaluating Health Risks, (nonprofit institution) |
| (until 2001); Senior Scientist, Sciences International (health research) (until 2003); Former | |
| Assistant Administrator & Deputy Administrator, Environmental Protection Agency; Principal, |
| Hollyhouse (consulting) (since 2000); Director, CIIT Center for Health Science Research (nonprofit |
| research) (until 2007). | | |
| |
| Steven R. Pruchansky,2 Born: 1944 | 2006 | 47 |
|
| Chairman and Chief Executive Officer, Greenscapes of Southwest Florida, Inc. (since 2000); Director |
| and President, Greenscapes of Southwest Florida, Inc. (until 2000); Member, Board of Advisors, First |
| American Bank (since 2008); Managing Director, Jon James, LLC (real estate) (since 2000); Director, |
| First Signature Bank & Trust Company (until 1991); Director, Mast Realty Trust (until 1994); President, |
| Maxwell Building Corp. (until 1991). | | |
| |
| Gregory A. Russo, Born: 1949 | 2008 | 47 |
|
| Vice Chairman, Risk & Regulatory Matters, KPMG LLP (“KPMG”) (2002–2006); Vice Chairman, Industrial |
| Markets, KPMG (1998–2002). | | |
| |
| Non-Independent Trustees3 | | |
| | | |
| Name, Year of Birth | Trustee | Number of John |
| Position(s) held with Fund | of the | Hancock funds |
| Principal occupation(s) and other | Trust | overseen by |
| directorships during past 5 years | since1 | Trustee |
| |
| James R. Boyle, Born: 1959 | 2005 | 244 |
|
| Senior Executive Vice President, U.S. Division, Manulife Financial Corporation (since 2009), Executive |
| Vice President (1999–2009); President, John Hancock Financial Services; Chairman and Director, |
| John Hancock Advisers, LLC and John Hancock Funds, LLC (2005–2010) and Chairman and Director, |
| John Hancock Investment Management Services, LLC (2006–2010); Trustee of John Hancock Trust |
| (since 2005), John Hancock Funds II (since 2005), and the John Hancock retail funds (since 2005). |
| |
| 32 | California Tax-Free Income Fund | Annual report |
| | |
| Non-Independent Trustees3 (continued) | | |
| |
| Name, Year of Birth | Trustee | Number of John |
| Position(s) held with Fund | of the | Hancock funds |
| Principal occupation(s) and other | Trust | overseen by |
| directorships during past 5 years | since1 | Trustee |
| |
| John G. Vrysen, Born: 1955 | 2009 | 47 |
|
| Senior Vice President, Strategic Initiatives, Manulife Financial Corporation (since 2006), Vice |
| President (until 2006), Manulife Financial Corporation; Director, Executive Vice President and Chief |
| Operating Officer, John Hancock Advisers, LLC, John Hancock Investment Management Services, |
| LLC and John Hancock Funds, LLC (since 2005, including other positions); Chief Operating Officer, |
| John Hancock Funds II and John Hancock Trust (since 2007); Chief Operating Officer, John Hancock |
| retail funds (2007–2009). | | |
| |
| Principal officers who are not Trustees | | |
| | | |
| Name, Year of Birth | | Officer |
| Position(s) held with Fund | | of the |
| Principal occupation(s) and other | | Trust |
| directorships during past 5 years | | since |
| |
| Keith F. Hartstein, Born: 1956 | | 2005 |
|
| President and Chief Executive Officer | | |
| Senior Vice President, Manulife Financial Corporation (since 2004); Director, President and Chief |
| Executive Officer, John Hancock Advisers, LLC and John Hancock Funds, LLC (since 2005); Director, |
| MFC Global Investment Management (U.S.), LLC (since 2005); Director, John Hancock Investment |
| Management Services, LLC (since 2006); Director, Chairman and President and Chief Executive Officer, |
| John Hancock retail funds (since 2005); President, NM Capital Management, Inc. (since 2005); Member |
| and former Chairman, Investment Company Institute Sales Force Marketing Committee (since 2003). |
| |
| Andrew G. Arnott, Born: 1971 | | 2009 |
|
| Chief Operating Officer | | |
| Senior Vice President, Manulife Financial Corporation (since 2009); Executive Vice President, |
| John Hancock Advisers, LLC (since 2005, including prior positions); Executive Vice President, |
| John Hancock Investment Management Services, LLC (since 2006, including prior positions); Executive |
| Vice President, John Hancock Funds, LLC (since 2004, including prior positions); Chief Operating Officer, |
| John Hancock retail funds (since 2009) and Vice President (2007–2009); Vice President, John Hancock |
| Funds II and John Hancock Trust (since 2006); Senior Vice President, Product Management and |
| Development for John Hancock Funds, LLC (2005–2009); Vice President and Director, Marketing and |
| Product Management, John Hancock Funds, LLC (1998–2005). | | |
| |
| Thomas M. Kinzler, Born: 1955 | | 2006 |
|
| Secretary and Chief Legal Officer | | |
| Secretary and Chief Legal Officer, John Hancock retail funds, John Hancock Funds II, and John Hancock |
| Trust (since 2006); Secretary and Chief Legal Counsel, John Hancock Advisers, LLC, John Hancock |
| Investment Management Services, LLC and John Hancock Funds, LLC (since 2007, including prior |
| positions); Vice President and Associate General Counsel, Massachusetts Mutual Life Insurance |
| Company (1999–2006); Secretary and Chief Legal Counsel, MML Series Investment Fund | |
| (2000–2006); Secretary and Chief Legal Counsel, MassMutual Select Funds and MassMutual |
| Premier Funds (2004–2006). | | |
| |
| Annual report | California Tax-Free Income Fund | 33 |
| |
| Principal officers who are not Trustees (continued) | |
| |
| Name, Year of Birth | Officer |
| Position(s) held with Fund | of the |
| Principal occupation(s) and other | Trust |
| directorships during past 5 years | since |
| |
| Francis V. Knox, Jr., Born: 1947 | 2005 |
|
| Chief Compliance Officer | |
| Chief Compliance Officer (since 2008), Vice President and Chief Compliance Officer (2005–2008), | |
| John Hancock retail funds, John Hancock Funds II, and John Hancock Trust; Chief Compliance Officer, |
| John Hancock Advisers, LLC and John Hancock Investment Management Services, LLC (since 2008); |
| Vice President and Chief Compliance Officer, John Hancock Advisers, LLC, John Hancock Investment |
| Management Services, LLC and MFC Global Investment Management (U.S.), LLC (2005–2008). | |
| |
| Charles A. Rizzo, Born: 1957 | 2007 |
|
| Chief Financial Officer | |
| Senior Vice President, John Hancock Advisers, LLC and John Hancock Investment Management | |
| Services, LLC (since 2008); Chief Financial Officer, John Hancock retail funds, John Hancock Funds II and |
| John Hancock Trust (since 2007); Assistant Treasurer, Goldman Sachs Mutual Fund Complex (registered |
| investment companies) (2005–2007); Vice President, Goldman Sachs (2005–2007); Managing Director |
| and Treasurer of Scudder Funds, Deutsche Asset Management (2003–2005). | |
| |
| Michael J. Leary, Born: 1965 | 2007 |
|
| Treasurer | |
| Treasurer for John Hancock retail funds, John Hancock Funds II and John Hancock Trust (since 2009); |
| Vice President, John Hancock Advisers, LLC and John Hancock Investment Management Services, LLC |
| (since 2007); Assistant Treasurer, John Hancock retail funds, John Hancock Funds II and John Hancock |
| Trust (2007–2009); Vice President and Director of Fund Administration, JP Morgan (2004–2007). | |
The business address for all Trustees and Officers is 601 Congress Street, Boston, Massachusetts 02210-2805.
The Statement of Additional Information of the Fund includes additional information about members of the Board of Trustees of the Fund and is available without charge, upon request, by calling 1-800-225-5291 or by visiting our Web site www.jhfunds.com.
1 Each Trustee serves until resignation, retirement age or until his or her successor is elected.
2 Member of Audit Committee.
3 Non-Independent Trustees hold positions with the Fund’s investment adviser, underwriter and certain other affiliates.
| |
| 34 | California Tax-Free Income Fund | Annual report |
More information
| | |
| |
| Trustees | Investment adviser |
| Patti McGill Peterson, Chairperson | John Hancock Advisers, LLC |
| James R. Boyle† | |
| James F. Carlin | Subadviser |
| William H. Cunningham | MFC Global Investment |
| Deborah C. Jackson* | Management (U.S.), LLC |
| Charles L. Ladner | |
| Stanley Martin* | Principal distributor |
| Dr. John A. Moore | John Hancock Funds, LLC |
| Steven R. Pruchansky* | |
| Gregory A. Russo | Custodian |
| John G. Vrysen† | State Street Bank and Trust Company |
| |
| Officers | Transfer agent |
| Keith F. Hartstein | John Hancock Signature Services, Inc. |
| President and Chief Executive Officer | |
| Legal counsel |
| Andrew G. Arnott | K&L Gates LLP |
| Chief Operating Officer |
| Independent registered |
| Thomas M. Kinzler | public accounting firm |
| Secretary and Chief Legal Officer | PricewaterhouseCoopers LLP |
| |
| Francis V. Knox, Jr. | The report is certified under the Sarbanes-Oxley | |
| Chief Compliance Officer | Act, which requires mutual funds and other public |
| companies to affirm that, to the best of their |
| Charles A. Rizzo | knowledge, the information in their financial reports |
| Chief Financial Officer | is fairly and accurately stated in all material respects. | |
| |
| Michael J. Leary | |
| Treasurer | |
| |
| *Member of the Audit Committee | |
| †Non-Independent Trustee | |
The Fund’s proxy voting policies and procedures, as well as the Fund’s proxy voting record for the most recent twelve-month period ended June 30, are available free of charge on the Securities and Exchange Commission (SEC) Web site at www.sec.gov or on our Web site.
The Fund’s complete list of portfolio holdings, for the first and third fiscal quarters, is filed with the SEC on Form N-Q. The Fund’s Form N-Q is available on our Web site and the SEC’s Web site, www.sec.gov, and can be reviewed and copied (for a fee) at the SEC’s Public Reference Room in Washington, DC. Call 1-800-SEC-0330 to receive information on the operation of the SEC’s Public Reference Room.
We make this information on your fund, as well as monthly portfolio holdings, and other fund details available on our Web site www.jhfunds.com or by calling 1-800-225-5291.
| | |
| You can also contact us: | | |
| 1-800-225-5291 | Regular mail: | Express mail: |
| jhfunds.com | John Hancock Signature Services, Inc. | John Hancock Signature Services, Inc. |
| | P.O. Box 55913 | Mutual Fund Image Operations |
| | Boston, MA 02205-5913 | 30 Dan Road |
| | | Canton, MA 02021 |
| |
| Annual report | California Tax-Free Income Fund | 35 |

1-800-225-5291
1-800-554-6713 TDD
1-800-338-8080 EASI-Line
www.jhfunds.com
Now available: electronic delivery
www.jhfunds.com/edelivery
| |
| This report is for the information of the shareholders of John Hancock California Tax-Free Income Fund. | 5300A 5/10 |
| It is not authorized for distribution to prospective investors unless preceded or accompanied by a prospectus. | 7/10 |
ITEM 2. CODE OF ETHICS.
As of the end of the period, May 31, 2010, the registrant has adopted a code of ethics, as defined in Item 2 of Form N-CSR, that applies to its Chief Executive Officer, Chief Financial Officer and Treasurer (respectively, the principal executive officer, the principal financial officer and the principal accounting officer, the “Senior Financial Officers”). A copy of the code of ethics is filed as an exhibit to this Form N-CSR.
ITEM 3. AUDIT COMMITTEE FINANCIAL EXPERT.
Stanley Martin is the audit committee financial expert and is “independent”, pursuant to general instructions on Form N-CSR Item 3.
ITEM 4. PRINCIPAL ACCOUNTANT FEES AND SERVICES.
(a) Audit Fees
The aggregate fees billed for professional services rendered by the principal accountant(s) for the audit of the registrant’s annual financial statements or services that are normally provided by the accountant(s) in connection with statutory and regulatory filings or engagements amounted to $27,584 for the fiscal year ended May 31, 2010 and $35,470 for the fiscal year ended May 31, 2009. These fees were billed to the registrant and were approved by the registrant’s audit committee.
(b) Audit-Related Services
Audit-related services fees amounted to $1,184 for the fiscal year ended May 31, 2010 and there were no audit-related fees during the fiscal year ended May 31, 2009 billed to the registrant or to the registrant's investment adviser (not including any sub-adviser whose role is primarily portfolio management and is subcontracted with or overseen by another investment adviser), and any entity controlling, controlled by, or under common control with the adviser that provides ongoing services to the registrant ("control affiliates").
(c) Tax Fees
The aggregate fees billed for professional services rendered by the principal accountant(s) for the tax compliance, tax advice and tax planning (“tax fees”) amounted to $2,236 for the fiscal year ended May 31, 2010 and $3,222 for the fiscal year ended May 31, 2009. The nature of the services comprising the tax fees was the review of the registrant’s income tax returns and tax distribution requirements. These fees were billed to the registrant and were approved by the registrant’s audit committee. There were no tax fees billed to the control affiliates.
(d) All Other Fees
All other fees amounted to $75 for the fiscal year ended May 31, 2010 and there were no other fees during the fiscal year ended May 31, 2009 billed to the registrant or to the control affiliates.
(e)(1) Audit Committee Pre-Approval Policies and Procedures:
The trust’s Audit Committee must pre-approve all audit and non-audit services provided by the independent registered public accounting firm (the “Auditor”) relating to the operations or financial reporting of the funds. Prior to the commencement of any audit or non-audit services to a fund, the Audit Committee reviews the services to determine whether they are appropriate and permissible under applicable law.
The trust’s Audit Committee has adopted policies and procedures to, among other purposes, provide a framework for the Committee’s consideration of audit-related and non-audit services by the Auditor. The policies and procedures require that any audit-related and non-audit service provided by the Auditor and any non-audit service provided by the Auditor to a fund service
provider that relates directly to the operations and financial reporting of a fund are subject to approval by the Audit Committee before such service is provided. Audit-related services provided by the Auditor that are expected to exceed $25,000 per instance/per fund are subject to specific pre-approval by the Audit Committee. Tax services provided by the Auditor that are expected to exceed $30,000 per instance/per fund are subject to specific pre-approval by the Audit Committee.
All audit services, as well as the audit-related and non-audit services that are expected to exceed the amounts stated above, must be approved in advance of provision of the service by formal resolution of the Audit Committee. At the regularly scheduled Audit Committee meetings, the Committee reviews a report summarizing the services, including fees, provided by the Auditor.
(e)(2) Services approved pursuant to paragraph (c)(7)(i)(C) of Rule 2-01 of Regulation S-X:
Audit-Related Fees, Tax Fees and All Other Fees:
There were no amounts that were approved by the Audit Committee pursuant to the de minimis exception under Rule 2-01 of Regulation S-X.
(f) According to the registrant’s principal accountant, for the fiscal year ended May 31, 2010, the percentage of hours spent on the audit of the registrant's financial statements for the most recent fiscal year that were attributed to work performed by persons who were not full-time, permanent employees of principal accountant was less than 50%.
(g) The aggregate non-audit fees billed by the registrant's accountant(s) for services rendered to the registrant and rendered to the registrant's control affiliates for each of the last two fiscal years of the registrant were $5,213,443 for the fiscal year ended May 31, 2010 and $8,868,967 for the fiscal year ended May 31, 2009.
(h) The audit committee of the registrant has considered the non-audit services provided by the registrant’s principal accountant(s) to the control affiliates and has determined that the services that were not pre-approved are compatible with maintaining the principal accountant(s)' independence.
ITEM 5. AUDIT COMMITTEE OF LISTED REGISTRANTS.
The registrant has a separately-designated standing audit committee comprised of independent trustees. The members of the audit committee are as follows:
Stanley Martin - Chairman
Steven R. Pruchansky
Deborah C. Jackson
ITEM 6. SCHEDULE OF INVESTMENTS.
| (a) | Not applicable. |
| (b) | Not applicable. |
ITEM 7. DISCLOSURE OF PROXY VOTING POLICIES AND PROCEDURES FOR CLOSED-END MANAGEMENT INVESTMENT COMPANIES.
Not applicable.
|
| ITEM 8. PORTFOLIO MANAGERS OF CLOSED-END MANAGEMENT INVESTMENT COMPANIES. |
|
Not applicable.
ITEM 9. PURCHASES OF EQUITY SECURITIES BY CLOSED-END MANAGEMENT INVESTMENT COMPANY AND AFFILIATED PURCHASERS.
Not applicable.
ITEM 10. SUBMISSION OF MATTERS TO A VOTE OF SECURITY HOLDERS.
Not applicable.
ITEM 11. CONTROLS AND PROCEDURES.
(a) Based upon their evaluation of the registrant's disclosure controls and procedures as conducted within 90 days of the filing date of this Form N-CSR, the registrant's principal executive officer and principal financial officer have concluded that those disclosure controls and procedures provide reasonable assurance that the material information required to be disclosed by the registrant on this report is recorded, processed, summarized and reported within the time periods specified in the Securities and Exchange Commission's rules and forms.
(b) There were no changes in the registrant's internal control over financial reporting that occurred during the registrant's most recent fiscal half-year (the registrant's second fiscal half-year in the case of an annual report) that have materially affected, or are reasonably likely to materially affect, the registrant's internal control over financial reporting.
ITEM 12. EXHIBITS.
(a)(1) Code of Ethics for Senior Financial Officers is attached.
(a)(2) Separate certifications for the registrant's principal executive officer and principal financial officer, as required by Section 302 of the Sarbanes-Oxley Act of 2002 and Rule 30a-2(a) under the Investment Company Act of 1940, are attached.
(b) Separate certifications for the registrant's principal executive officer and principal financial officer, as required by 18 U.S.C. Section 1350, as adopted pursuant to Section 906 of the Sarbanes-Oxley Act of 2002, and Rule 30a-2(b) under the Investment Company Act of 1940, are attached. The certifications furnished pursuant to this paragraph are not deemed to be "filed" for purposes of Section 18 of the Securities Exchange Act of 1934, or otherwise subject to the liability of that section. Such certifications are not deemed to be incorporated by reference into any filing under the Securities Act of 1933 or the Securities Exchange Act of 1934, except to the extent that the Registrant specifically incorporates them by reference.
(c) Contact person at the registrant.
Pursuant to the requirements of the Securities Exchange Act of 1934 and the Investment Company Act of 1940, the registrant has duly caused this report to be signed on its behalf by the undersigned, thereunto duly authorized.
| |
| John Hancock California Tax-Free Income Fund |
| |
| |
| By: | /s/ Keith F. Hartstein |
| Keith F. Hartstein |
| President and Chief Executive Officer |
| |
| |
| Date: July 23, 2010 |
Pursuant to the requirements of the Securities Exchange Act of 1934 and the Investment Company Act of 1940, this report has been signed below by the following persons on behalf of the registrant and in the capacities and on the dates indicated.
| |
| By: | /s/ Keith F. Hartstein |
| Keith F. Hartstein |
| President and |
| | Chief Executive Officer |
| |
| |
| Date: | July 23, 2010 |
| |
| |
| By: | /s/ Charles A. Rizzo |
| Charles A. Rizzo |
| | Chief Financial Officer |
| |
| |
| Date: | July 23, 2010 |