Washington, D.C. 20549
Nuveen Municipal Advantage Fund, Inc.
Kevin J. McCarthy
Form N-CSR is to be used by management investment companies to file reports with the Commission not later than 10 days after the transmission to stockholders of any report that is required to be transmitted to stockholders under Rule 30e-1 under the Investment Company Act of 1940 (17 CFR 270.30e-1). The Commission may use the information provided on Form N-CSR in its regulatory, disclosure review, inspection, and policymaking roles.
A registrant is required to disclose the information specified by Form N-CSR, and the Commission will make this information public. A registrant is not required to respond to the collection of information contained in Form N-CSR unless the Form displays a currently valid Office of Management and Budget ("OMB") control number. Please direct comments concerning the accuracy of the information collection burden estimate and any suggestions for reducing the burden to Secretary, Securities and Exchange Commission, 450 Fifth Street, NW, Washington, DC 20549-0609. The OMB has reviewed this collection of information under the clearance requirements of 44 U.S.C. ss. 3507.
ITEM 1. REPORTS TO STOCKHOLDERS.
NUVEEN INVESTMENTS ANNOUNCES STRATEGIC COMBINATION WITH FAF ADVISORS
On July 29, 2010, Nuveen Investments announced that U.S. Bancorp will receive a 9.5% stake in Nuveen Investments and cash consideration in exchange for the long-term asset business of U.S. Bancorp’s FAF Advisors. Nuveen Investments is the parent of Nuveen Asset Management (NAM), the investment adviser for the Funds included in this report.
FAF Advisors, which currently manages about $25 billion of long-term assets and serves as the advisor of the First American Funds, will be combined with NAM, which currently manages about $75 billion in municipal fixed income assets. Upon completion of the transaction, Nuveen Investments, which currently manages about $160 billion of assets across several high-quality affiliates, will manage a combined total of about $185 billion in institutional and retail assets.
This combination will not affect the investment objectives, strategies or policies of the Funds in this report. Over time, Nuveen Investments expects that the combination will provide even more ways to meet the needs of investors who work with financial advisors and consultants by enhancing the multi-boutique model of Nuveen Investments, which also includes highly respected investment teams at Hyde Park, NWQ Investment Management, Santa Barbara Asset Management, Symphony Asset Management, Tradewinds Global Investors and Winslow Capital.
The transaction is expected to close late in 2010, subject to customary conditions.
Chairman’s
Letter to Shareholders
Dear Shareholder,
Recent months have revealed the fragility and disparity of the global economic recovery. In the U.S., the rate of economic growth has slowed as various stimulus programs wind down, exposing weakness in the underlying economy. In contrast, many emerging market countries are experiencing a return to comparatively high rates of growth. Confidence in global financial markets has been undermined by concerns about high sovereign debt levels in Europe and the U.S. Until these countries can begin credible programs to reduce their budgetary deficits, market unease and hesitation will remain. On a more encouraging note, while the global recovery is expanding existing trade imbalances, policy makers in the leading economies are making a sustained effort to create a global framework through which various countries can take complimentary actions that should red uce those imbalances over time.
The U.S. economy is subject to unusually high levels of uncertainty as it struggles to recover from a devastating financial crisis. Unemployment remains stubbornly high, due to what appears to be both cyclical and structural forces. Federal Reserve policy makers are implementing another round of quantitative easing, a novel approach to provide support to the economy. However, the high levels of debt owed both by U.S. consumers and the U.S. government limit the Fed’s ability to engineer a stronger economic recovery.
The U.S. financial markets reflect the crosscurrents now impacting the U.S. economy. Today’s historically low interest rates reflect the Fed’s intervention in the financial markets and the demand for U.S. government debt by U.S. and overseas investors looking for a safe haven for investment. The continued corporate earnings recovery and recent electoral results are giving a boost to equity markets. Encouragingly, financial institutions are rebuilding their balance sheets and the financial reform legislation enacted last summer has the potential to address many of the most significant contributors to the financial crisis, although the details still have to be worked out.
In this difficult environment your Nuveen investment team continues to seek sustainable investment opportunities and, at the same time, remains alert for potential risks that may result from a recovery still facing many headwinds. As your representative, the Nuveen Fund Board monitors the activities of each investment team to assure that all maintain their investment disciplines. As always, I encourage you to contact your financial consultant if you have any questions about your investment in a Nuveen Fund.
On behalf of the other members of your Fund Board, we look forward to continuing to earn your trust in the months and years ahead.
Sincerely,
Robert P. Bremner
Chairman of the Board
December 22, 2010
Nuveen Investments 1
Portfolio Managers’ Comments
Nuveen Performance Plus Municipal Fund, Inc. (NPP)
Nuveen Municipal Advantage Fund, Inc. (NMA)
Nuveen Municipal Market Opportunity Fund, Inc. (NMO)
Nuveen Dividend Advantage Municipal Fund (NAD)
Nuveen Dividend Advantage Municipal Fund 2 (NXZ)
Nuveen Dividend Advantage Municipal Fund 3 (NZF)
Portfolio managers Tom Spalding and Paul Brennan discuss U.S. economic and municipal market conditions, key investment strategies, and the twelve-month performance of these six national Funds. A 34-year veteran of Nuveen, Tom has managed NXZ since its inception in 2001 and NPP, NMA, NMO and NAD since 2003. With 20 years of industry experience, including 12 years at Nuveen, Paul assumed portfolio management responsibility for NZF in 2006.
What factors affected the U.S. economy and municipal market during the twelve-month reporting period ended October 31, 2010?
During this reporting period, the U.S. economy remained under considerable stress, and both the Federal Reserve (Fed) and the federal government continued their efforts to improve the overall economic environment. For its part, the Fed held the benchmark fed funds rate in a target range of zero to 0.25% since cutting it to this record low level in December 2008. At its November 2010 meeting (shortly after the end of this reporting period), the central bank renewed its commitment to keeping the fed funds rate at “exceptionally low levels” for an “extended period.” The Fed also announced a second round of quantitative easing, in which it plans to purchase $600 billion in U.S. Treasury bonds by June 30, 2011. The goal of this plan is to lower long-term interest rates and thereby stimulate economic activity and create jobs. The federal government continued to focus on implementing the economic stimulus package passed in early 2009 and aimed at providing job creation, tax relief, fiscal assistance to state and local governments, and expansion of unemployment benefits and other federal social welfare programs.
These and other measures to ease the economic recession produced some signs of economic improvement. In the third quarter of 2010, the U.S. economy, as measured by the U.S. gross domestic product (GDP), grew at an annualized rate of 2.5%, marking the first time the economy had strung together five consecutive quarters of growth since 2007-2008. Inflation remained relatively tame, as the Consumer Price Index (CPI) rose just 1.2% year-over-year as of October 2010. The core CPI (which excludes food and energy) rose 0.6% over this period, the smallest twelve-month increase in the 53-year history of this index. Housing prices also continued to recover from their April 2009 lows, although growth rates moderated from previous periods. For the twelve months ended September
Certain statements in this report are forward-looking statements. Discussions of specific investments are for illustration only and are not intended as recommendations of individual investments. The forward-looking statements and other views expressed herein are those of the portfolio managers as of the date of this report. Actual future results or occurrences may differ significantly from those anticipated in any forward-looking statements, and the views expressed herein are subject to change at any time, due to numerous market and other factors. The Funds disclaim any obligation to update publicly or revise any forward-looking statements or views expressed herein.
Any reference to credit ratings for portfolio holdings denotes the highest rating assigned by a Nationally Recognized Statistical Rating Organization (NRSRO) such as Standard & Poor’s, Moody’s or Fitch. AAA, AA, A, and BBB ratings are investment grade; BB, B, CCC, CC, C and D ratings are below investment grade. Holdings and ratings may change over time.
2 Nuveen Investments
2010 (the latest information available at the time this report was prepared), the average home price in the Standard & Poor’s/Case-Shiller Index rose 0.6%. Unemployment remained persistently high, with the jobless rate hovering at or above 9.5% over the past 15 months. As of October 31, 2010, national unemployment stood at 9.6% for the third consecutive month, down from its 26-year high of 10.1% in October 2009.
Municipal bond prices generally rose during this period, as the combination of strong demand and tight supply of new tax-exempt issuance created favorable conditions. One reason for the decrease in new tax-exempt supply was the heavy issuance of taxable municipal debt under the Build America Bond program. Build America Bonds, which were created as part of the February 2009 economic stimulus package, currently offer municipal issuers a federal subsidy equal to 35% of a bond’s interest payments, providing issuers with an alternative to traditional tax-exempt debt that often proves to be lower in cost. For the twelve months ended October 31, 2010, taxable Build America Bonds issuance totaled $100.3 billion, accounting for 24% of new bonds issued in the municipal market.
Over the twelve months ended October 31, 2010, municipal bond issuance nationwide—both tax-exempt and taxable—totaled $418.0 billion, an increase of 9% compared with the twelve-month period ended October 31, 2009. However, if taxable Build America Bond issuance were removed from the equation, the supply of tax-exempt bonds alone actually fell 15%. Since interest payments from Build America Bonds represent taxable income, we do not view these bonds as good investment opportunities for the tax-exempt Nuveen municipal closed-end funds.
What key strategies were used to manage these Funds during this reporting period?
As previously mentioned, the supply of tax-exempt municipal bonds declined nationally during this period, due in part to the issuance of taxable municipal bonds under the Build America Bond program. In this environment of constrained issuance of tax-exempt municipal bonds, we continued to take a bottom-up approach to discovering undervalued sectors and individual credits with the potential to perform well over the long term. In NPP, NMA, NMO, NAD and NXZ, we worked to increase our health care exposure, evaluating each opportunity in this sector on the basis of its individual merits. In general, our criteria focused on determining the top hospitals in their service areas with good management and reasonable debt levels. In NZF, we found value in several areas of the market, including health care, tax-supported sectors and other essential services suc h as toll roads and airports.
Some of this investment activity resulted from opportunities created by the provisions of the Build America Bond program. For example, tax-exempt supply was more plentiful in the health care sector because, as 501(c)(3) (non-profit) organizations, hospitals generally do not qualify for the Build America Bond program and must continue to issue bonds in the tax-exempt municipal market. Supply in the health care sector was also boosted in the early part of the period by hospitals issuing fixed rate bonds in order to refinance and retire outstanding debt that had initially been issued as variable rate debt. Bonds with proceeds earmarked for refundings, working capital and private activities also are not
Nuveen Investments 3
covered by the Build America Bond program, and this resulted in attractive opportunities in various other sectors of the market.
The impact of the Build America Bond program also was evident in the area of longer-term issuance, as municipal issuers sought to take full advantage of the attractive financing terms offered by these bonds. Approximately 70% of Build America Bonds were issued with maturities of at least 30 years. Even though this significantly reduced the availability of tax-exempt credits with longer maturities and made locating appropriate longer bonds more challenging, we continued to find good opportunities to purchase attractive longer-term bonds for these Funds.
Cash for new purchases during this period was generated primarily by the proceeds from called and maturing bonds, which we worked to redeploy to keep the Funds fully invested. On the whole, active selling was minimal, as the bonds in our portfolios generally offered higher yields than those available in the current marketplace.
As of October 31, 2010, all six of these Funds continued to use inverse floating rate securities.1 We employ inverse floaters as a form of leverage for a variety of reasons, including duration management, income enhancement and total return enhancement.
How did the Funds perform?
Individual results for these Funds, as well as relevant index and peer group information, are presented in the accompanying table.
Average Annual Total Returns on Common Share Net Asset Value
For periods ended 10/31/10
| 1-Year | 5-Year | 10-Year |
| NPP | 12.07% | 5.35% | 6.60% |
| NMA | 12.90% | 5.02% | 6.68% |
| NMO | 11.71% | 4.56% | 5.93% |
| NAD | 12.60% | 5.19% | 7.14% |
| NXZ | 9.12% | 4.97% | N/A |
| NZF | 11.41% | 5.45% | N/A |
| | | | |
Standard & Poor’s (S&P) National Municipal Bond Index2 | 8.06% | 4.98% | 5.58% |
| | | | |
Lipper General Leveraged Municipal Debt Funds Average3 | 13.81% | 4.87% | 6.36% |
For the twelve months ended October 31, 2010, the total returns on common share net asset value (NAV) for all six of these Nuveen Funds exceeded the return for the Standard & Poor’s (S&P) National Municipal Bond Index. For this same period, all six Funds lagged the average return for the Lipper General Leveraged Municipal Debt Funds Average.
Key management factors that influenced the Funds’ returns during this period included duration and yield curve positioning, credit exposure and sector allocation. In addition, the use of structural leverage was an important positive factor affecting the Funds’ performances over this period. The impact of structural leverage is discussed in more detail on page six.
| | Past performance is not predictive of future results. Current performance may be higher or lower than the data shown. Returns do not reflect the deduction of taxes that shareholders may have to pay on Fund distributions or upon the sale of Fund shares. |
| | For additional information, see the individual Performance Overview for your Fund in this report. |
| 1 | An inverse floating rate security, also known as an inverse floater, is a financial instrument designed to pay long-term interest at a rate that varies inversely with a short-term interest rate index. For the Nuveen Funds, the index typically used is the Securities Industry and Financial Markets Association (SIFMA) Municipal Swap Index, (previously referred to as the Bond Market Association Index or BMA). Inverse floaters, including those inverse floating rate securities in which the Funds invested during this reporting period, are further defined within the Notes to Financial Statements and Glossary of Terms Used in this Report sections of this report. |
| 2 | The Standard & Poor’s (S&P) National Municipal Bond Index is an unleveraged, market value-weighted index designed to measure the performance of the tax-exempt, investment-grade U.S. municipal bond market. This index does not reflect any initial or ongoing expenses and is not available for direct investment. |
| 3 | The Lipper General Leveraged Municipal Debt Funds Average is calculated using the returns of all leveraged closed-end funds in this category for each period as follows: 1-year, 46 funds; 5-year, 44 funds; and 10-year, 30 funds. Lipper returns account for the effects of management fees and assume reinvestment of dividends, but do not reflect any applicable sales charges. The Lipper average is not available for direct investment. |
4 Nuveen Investments
During this period, municipal bonds with longer maturities generally outperformed those with shorter maturities, with bonds at the longest end of the municipal yield curve posting the strongest returns. The outperformance of longer term bonds was due in part to the decline in interest rates, particularly in the intermediate and longer segments of the curve. The scarcity of tax-exempt bonds with longer maturities also drove up the prices of these bonds. In general, the greater a Fund’s exposure to the outperforming longer part of the yield curve, the greater the positive impact on the Fund’s return. During this period, NPP, NMA, NMO and NAD all benefited from their longer durations. On the other hand, NXZ and NZF, both of which were introduced in 2001, faced the increased bond calls typically associated with a Fund’s ten-year anniv ersary. These Funds’ higher exposure to bonds with short call dates was reflected in their shorter durations, which detracted from their performance during this period.
Credit exposure also played a role in performance. The demand for municipal bonds increased during this period driven by a variety of factors, including concerns about potential tax increases, the need to rebalance portfolio allocations, and a growing appetite for higher yields and additional risk. At the same time, the supply of new tax-exempt municipal paper declined, due largely to Build America Bond issuance. As investors bid up municipal bond prices, bonds rated BBB or below generally outperformed those rated AAA. All of these Funds, especially NMA, benefited from their allocations to lower-rated bonds.
Holdings that generally contributed positively to the Funds’ returns during this period included industrial development revenue and health care bonds. In general, all of these Funds, particularly NMA and NAD, had strong weightings in health care, which added to their performance. Revenue bonds as a whole performed well, with transportation, housing, leasing, and special tax credits among the other sectors that outperformed the general municipal market. Zero coupon bonds and credits backed by the 1998 master tobacco settlement agreement also were among the strongest performers. As of October 31, 2010, these Funds held approximately 4% to 7% of their portfolios in lower-rated tobacco bonds.
In contrast, pre-refunded bonds, which are often backed by U.S. Treasury securities trailed the general municipal market during this period. While these securities continued to provide attractive tax-free income, their muted investment performance was attributed primarily to their shorter effective maturities and higher credit quality. Although allocations of pre-refunded bonds fell in most of these Funds due to bond calls during the period, NXZ continued to hold the heaviest weighting of pre-refunded bonds, which detracted from its performance. NAD held the fewest pre-refunded bonds. Among the revenue sectors, resource recovery trailed the overall municipal market by the widest margin, and water and sewer bonds turned in a relatively weaker performance. General obligation and other tax-supported bonds also struggled to keep pace with the overall m unicipal market return during these twelve months.
Nuveen Investments 5
IMPACT OF THE FUNDS’ LEVERAGE STRATEGIES ON PERFORMANCE
One important factor impacting the returns of most of these Funds relative to the comparative indexes was the Funds’ use of financial leverage. The Funds use leverage because their managers believe that, over time, leveraging provides opportunities for additional income and total return for common shareholders. However, use of leverage also can expose common shareholders to additional volatility. For example, as the prices of securities held by a Fund decline, the negative impact of these valuation changes on common share net asset value and common shareholder total return is magnified by the use of leverage. Conversely, leverage may enhance common share returns during periods when the prices of securities held by a Fund generally are rising. Leverage made a positive contribution to the performance of each of these Funds over this reporting p eriod.
RECENT DEVELOPMENTS REGARDING THE FUNDS’ LEVERAGED CAPITAL STRUCTURE
Shortly after their inceptions, each of the Funds issued auction rate preferred shares (ARPS) to create financial leverage. As noted in past shareholder reports, the ARPS issued by many closed-end funds, including these Funds, have been hampered by a lack of liquidity since February 2008. Since that time, more ARPS have been submitted for sale in each of their regularly scheduled auctions than there have been offers to buy. In fact, offers to buy have been almost completely non-existent since late February 2008. This means that these auctions have “failed to clear,” and that many, or all, of the ARPS shareholders who wanted to sell their shares in these auctions were unable to do so. This lack of liquidity in ARPS did not lower the credit quality of these shares, and ARPS shareholders unable to sell their shares continued to receive dis tributions at the “maximum rate” applicable to failed auctions, as calculated in accordance with the pre-established terms of the ARPS. In the recent market, with short-term rates at multi-generational lows, those maximum rates also have been low.
One continuing implication for common shareholders from the auction failures is that each Fund’s cost of leverage likely has been incrementally higher at times than it otherwise might have been had the auctions continued to be successful. As a result, each Fund’s common share earnings likely have been incrementally lower at times than they otherwise might have been.
As noted in past shareholder reports, the Nuveen funds’ Board of Directors/Trustees authorized several methods that can be used separately or in combination to refinance a portion of the Nuveen funds’ outstanding ARPS. Some funds have utilized tender option bonds (TOBs), also known as inverse floating rate securities, for leverage purposes. The amount of TOBs that a fund may use varies according to the composition of each fund’s portfolio. Some funds have a greater ability to use TOBs than others. Some funds have issued Variable Rate Demand Preferred (VRDP) Shares, a floating rate form of preferred stock. Some funds have issued MuniFund Term Preferred (MTP) Shares, a fixed rate form of preferred stock with a mandatory redemption period of five years.
6 Nuveen Investments
While all these efforts have reduced the total amount of outstanding ARPS issued by the Nuveen funds, the funds cannot provide any assurance on when the remaining outstanding ARPS might be redeemed.
During 2010, and as of the time this report was prepared, 36 Nuveen leveraged closed-end funds (including NAD, NXZ and NZF), received a demand letter from a law firm on behalf of purported holders of common shares of each such fund, alleging that Nuveen and the funds’ officers and Board of Directors/Trustees breached their fiduciary duties related to the redemption at par of the funds’ ARPS. In response, the Board established an ad hoc Demand Committee consisting of certain of its disinterested and independent Board members to investigate the claims. The Demand Committee retained independent counsel to assist it in conducting an extensive investigation. Based upon its investigation, the Demand Committee found that it was not in the best interests of each fund or its shareholders to take the actions suggested in the demand letters, and r ecommended that the full Board reject the demands made in the demand letters. After reviewing the findings and recommendation of the Demand Committee, the full Board of each fund unanimously adopted the Demand Committee’s recommendation.
Subsequently, 26 of the funds that received demand letters (including NAD, NXZ, and NZF) were named as nominal defendants in a putative shareholder derivative action complaint captioned Safier and Smith v. Nuveen Asset Management, et al. that was filed in the Circuit Court of Cook County, Illinois, Chancery Division (the “Cook County Chancery Court”) on July 27, 2010. Three additional funds were named as nominal defendants in a similar complaint captioned Curbow v. Nuveen Asset Management, et al. filed in the Cook County Chancery Court on August 12, 2010, and three additional funds were named as nominal defendants in a similar complaint captioned Beidler v. Nuveen Asset Manag ement, et al. filed in the Cook County Chancery Court on September 21, 2010 (collectively, the “Complaints”). The Complaints, filed on behalf of purported holders of each fund’s common shares, also name Nuveen Asset Management as a defendant, together with current and former Officers and interested Director/Trustees of each of the funds (together with the nominal defendants, collectively, the “Defendants”). The Complaints contain the same basic allegations contained in the demand letters. The suits seek a declaration that the Defendants have breached their fiduciary duties, an order directing the Defendants not to redeem any ARPS at their liquidation value using fund assets, indeterminate monetary damages in favor of the funds and an award of plaintiffs’ costs and disbursements in pursuing the action. Nuveen Asset Management believes that the Complaints are without merit, and intends to defend vigorously against these charges.
Nuveen Investments 7
As of October 31, 2010, the amounts of ARPS redeemed by the Funds are as shown in the accompanying table.
| Fund | | Auction Rate Preferred Shares | | | % of Original Auction Rate | |
| NPP | | $ | 59,100,000 | | | | 12.3 | % |
| NMA | | $ | 358,000,000 | | | | 100.0 | % |
| NMO | | $ | 380,000,000 | | | | 100.0 | % |
| NAD | | $ | 174,925,000 | | | | 59.3 | % |
| NXZ | | $ | 222,000,000 | | | | 100.0 | % |
| NZF | | $ | 75,050,000 | | | | 24.1 | % |
MTP
During the current reporting period, NAD completed the issuance of $144.3 million of 2.70% Series 2015 MTP. The net proceeds from this offering was used to refinance a portion of the Fund’s outstanding ARPS at par. The newly-issued MTP shares trade on the New York Stock Exchange (NYSE) under the symbols “NAD Pr C.” MTP is a fixed-rate form of preferred stock with a mandatory redemption period, in this case, of five years. By issuing MTP, the Fund seeks to take advantage of the current historically low interest rate environment to lock in an attractive federally tax-exempt cost of leverage for a period as long as the term of the MTP. The Fund’s managers believe that issuing MTP may help the Fund mitigate the risk of a significant increase in its cost of leverage should short term interest rates rise sharply in the coming year s.
Subsequent to the reporting period, NZF completed the issuance of $65 million of 2.80%, Series 2016 MTP. The net proceeds from this offering were used to refinance a portion of the Fund’s outstanding ARPS at par. The newly-issued MTP shares trade on the NYSE under the symbol “NZF Pr C”. Immediately following its MTP issuance, NZF noticed for redemption at par $63.625 million of its outstanding ARPS using the MTP proceeds.
VRDP
As noted in previous shareholder reports, and as of October 31, 2010, NXZ has issued and outstanding $196.0 million of VRDP.
During the current reporting period, NMA and NMO issued $296.8 and $350.9 million, respectively, of VRDP to redeem at par their remaining outstanding ARPS. As noted previously, VRDP is a newly-developed instrument that essentially replaces all or a portion of the ARPS used as leverage and potentially could be used to refinance all or a portion of the ARPS of other funds. VRDP shares include a liquidity feature that allows holders of VRDP to have their shares purchased by a liquidity provider in the event that sell orders have not been matched with purchase orders and successfully settled in a remarketing. VRDP is offered only to qualified institutional buyers, defined pursuant to Rule 144A under the Securities Act of 1933. VRDPs offer interest rates that are reset frequently on a regular schedule and generally reflect current short-term municipal m arket interest rates.
Refer to Notes to Financial Statements, Footnote 1 – General Information and Significant Accounting Policies and Footnote 4 – Fund Shares for further details on MTP and VRDP Shares.
As of October 31, 2010, 83 out of the 84 Nuveen closed-end municipal funds that had issued ARPS have redeemed at par all or a portion of these shares. These redemptions bring the total amount of Nuveen’s municipal closed-end funds’ ARPS redemptions to approximately $5.7 billion of the approximately $11.0 billion outstanding.
For up-to-date information, please visit the Nuveen CEF Auction Rate Preferred Resource Center at: http://www.nuveen.com/arps.
8 Nuveen Investments
Common Share Dividend
and Share Price Information
During the twelve-month reporting period ended October 31, 2010, NPP, NMA, NMO and NZF each had two monthly dividend increases and NAD and NXZ each had one monthly dividend increase.
Due to normal portfolio activity, common shareholders of the following Funds received capital gains and/or net ordinary income distributions at the end of December 2009 as follows:
| Fund | | Long-Term Capital Gains (per share) | | | Short-Term Capital Gains and/or Ordinary Income | |
| NPP | | $ | 0.0136 | | | $ | 0.0004 | |
| NMA | | $ | 0.0654 | | | $ | 0.0014 | |
| NXZ | | | — | | | $ | 0.0139 | |
| NZF | | $ | 0.0449 | | | $ | 0.0196 | |
All of the Funds in this report seek to pay stable dividends at rates that reflect each Fund’s past results and projected future performance. During certain periods, each Fund may pay dividends at a rate that may be more or less than the amount of net investment income actually earned by the Fund during the period. If a Fund has cumulatively earned more than it has paid in dividends, it holds the excess in reserve as undistributed net investment income (UNII) as part of the Fund’s NAV. Conversely, if a Fund has cumulatively paid dividends in excess of its earnings, the excess constitutes negative UNII that is likewise reflected in the Fund’s NAV. Each Fund will, over time, pay all of its net investment income as dividends to shareholders. As of October 31, 2010, all of the Funds in this report had positive UNII balances for both t ax and financial reporting purposes.
COMMON SHARE REPURCHASES AND SHARE PRICE INFORMATION
Since the inception of the Funds’ repurchase program, the Funds have not repurchased any of their outstanding common shares.
As of October 31, 2010, the Funds’ common share prices were trading at (+) premiums and (-) discounts to their common share NAVs as shown in the accompanying table.
| Fund | 10/31/10 (+)Premium/(-)Discount | | 12-Month Average (+)Premium/(-)Discount |
| NPP | -1.90% | | -3.05% |
| NMA | +0.88% | | +0.64% |
| NMO | +2.68% | | +1.06% |
| NAD | -1.91% | | -2.35% |
| NXZ | -0.61% | | -0.68% |
| NZF | -1.09% | | -2.11% |
Nuveen Investments 9
| NPP | Nuveen Performance |
| Performance | Plus Municipal |
| Fund, Inc. |
| | as of October 31, 2010 |
| Fund Snapshot | | | |
| Common Share Price | | $ | 15.00 | |
Common Share Net Asset Value (NAV) | | $ | 15.29 | |
| Premium/(Discount) to NAV | | | -1.90 | % |
| Market Yield | | | 6.28 | % |
Taxable-Equivalent Yield1 | | | 8.72 | % |
Net Assets Applicable to Common Shares ($000) | | $ | 916,152 | |
| Average Effective Maturity on Securities (Years) | | | 16.70 | |
| Leverage-Adjusted Duration | | | 9.62 | |
Average Annual Total Return (Inception 6/22/89) | | | | | | |
| | | On Share Price | | | On NAV | |
| 1-Year | | | 18.65 | % | | | 12.07 | % |
| 5-Year | | | 6.83 | % | | | 5.35 | % |
| 10-Year | | | 8.56 | % | | | 6.60 | % |
States4 (as a % of total investments) | | | |
| Illinois | | | 17.3 | % |
| California | | | 12.1 | % |
| Colorado | | | 6.4 | % |
| Texas | | | 4.8 | % |
| Florida | | | 4.7 | % |
| New Jersey | | | 4.4 | % |
| Ohio | | | 4.1 | % |
| Nevada | | | 3.5 | % |
| Washington | | | 3.3 | % |
| Michigan | | | 3.1 | % |
| New York | | | 2.9 | % |
| Massachusetts | | | 2.9 | % |
| Indiana | | | 2.5 | % |
| Pennsylvania | | | 2.3 | % |
| Puerto Rico | | | 2.1 | % |
| Louisiana | | | 2.1 | % |
| South Carolina | | | 1.8 | % |
| Minnesota | | | 1.8 | % |
| Iowa | | | 1.7 | % |
| Arizona | | | 1.5 | % |
| Other | | | 14.7 | % |
Portfolio Composition4 (as a % of total investments) | | | |
| Tax Obligation/Limited | | | 17.3 | % |
| Transportation | | | 16.5 | % |
| U.S. Guaranteed | | | 14.8 | % |
| Health Care | | | 13.5 | % |
| Tax Obligation/General | | | 13.4 | % |
| Utilities | | | 8.0 | % |
| Consumer Staples | | | 6.4 | % |
| Other | | | 10.1 | % |
| | Refer to the Glossary of Terms Used in this Report for further definition of the terms used within this Fund’s Performance Overview page. |
| 1 | Taxable-Equivalent Yield represents the yield that must be earned on a fully taxable investment in order to equal the yield of the Fund on an after-tax basis. It is based on a federal income tax rate of 28%. When comparing this Fund to investments that generate qualified dividend income, the Taxable-Equivalent Yield is lower. |
| 2 | The Fund paid shareholders a capital gain and net ordinary income distribution in December 2009 of $0.0140 per share. |
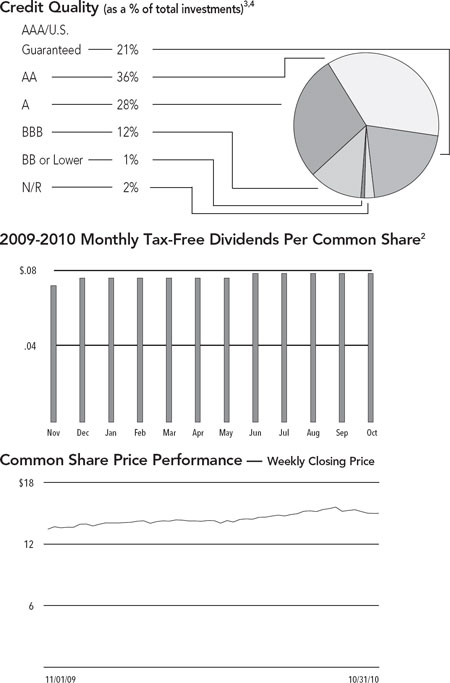
| 3 | Ratings shown are the highest of Standard & Poor’s Group, Moody’s Investor Service, Inc. or Fitch, Inc. AAA includes bonds with an implied AAA rating since they are backed by U.S. Government or agency securities. AAA, AA, A and BBB ratings are investment grade; BB, B, CCC, CC, C and D ratings are below-investment grade. Holdings designated N/R are not rated by any of these national rating agencies. |
| 4 | Holdings are subject to change. |
10 Nuveen Investments
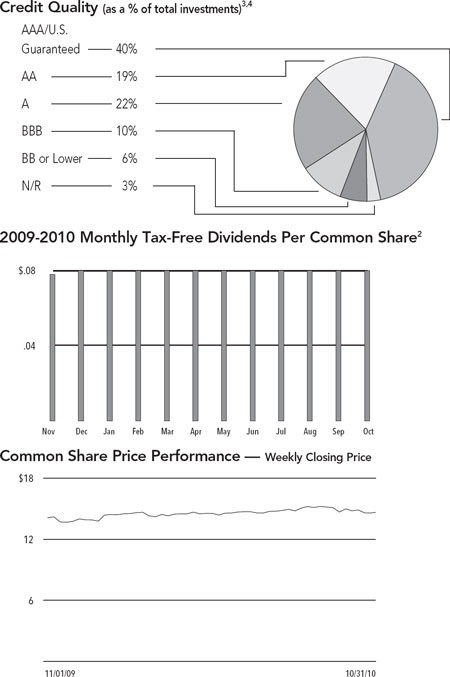
| NMA | Nuveen Municipal |
| Performance | Advantage |
| Fund, Inc. |
| | as of October 31, 2010 |
| Fund Snapshot | | | |
| Common Share Price | | $ | 14.92 | |
Common Share Net Asset Value (NAV) | | $ | 14.79 | |
| Premium/(Discount) to NAV | | | 0.88 | % |
| Market Yield | | | 6.64 | % |
Taxable-Equivalent Yield1 | | | 9.22 | % |
Net Assets Applicable to Common Shares ($000) | | $ | 642,364 | |
| Average Effective Maturity on Securities (Years) | | | 18.96 | |
| Leverage-Adjusted Duration | | | 9.17 | |
Average Annual Total Return (Inception 12/19/89) | | | | | | |
| | | On Share Price | | | On NAV | |
| 1-Year | | | 19.58 | % | | | 12.90 | % |
| 5-Year | | | 6.06 | % | | | 5.02 | % |
| 10-Year | | | 8.34 | % | | | 6.68 | % |
States4(as a % of total investments) | | | |
| California | | | 12.9 | % |
| Illinois | | | 10.8 | % |
| Texas | | | 10.0 | % |
| Louisiana | | | 8.7 | % |
| Colorado | | | 6.3 | % |
| Washington | | | 6.2 | % |
| Puerto Rico | | | 4.7 | % |
| Ohio | | | 4.0 | % |
| Pennsylvania | | | 3.0 | % |
| Florida | | | 2.9 | % |
| New York | | | 2.5 | % |
| Tennessee | | | 2.5 | % |
| Nevada | | | 2.4 | % |
| New Jersey | | | 2.1 | % |
| South Carolina | | | 2.0 | % |
| North Carolina | | | 1.8 | % |
| Michigan | | | 1.6 | % |
| Oklahoma | | | 1.6 | % |
| Other | | | 14.0 | % |
Portfolio Composition4 (as a % of total investments) | | | |
| Health Care | | | 20.9 | % |
| Utilities | | | 14.7 | % |
| Tax Obligation/Limited | | | 14.1 | % |
| U.S. Guaranteed | | | 12.4 | % |
| Tax Obligation/General | | | 12.1 | % |
| Transportation | | | 10.2 | % |
| Consumer Staples | | | 6.1 | % |
| Other | | | 9.5 | % |
| | Refer to the Glossary of Terms Used in this Report for further definition of the terms used within this Fund’s Performance Overview page. |
| 1 | Taxable-Equivalent Yield represents the yield that must be earned on a fully taxable investment in order to equal the yield of the Fund on an after-tax basis. It is based on a federal income tax rate of 28%. When comparing this Fund to investments that generate qualified dividend income, the Taxable-Equivalent Yield is lower. |
| 2 | The Fund paid shareholders a capital gain and net ordinary income distribution in December 2009 of $0.0668 per share. |
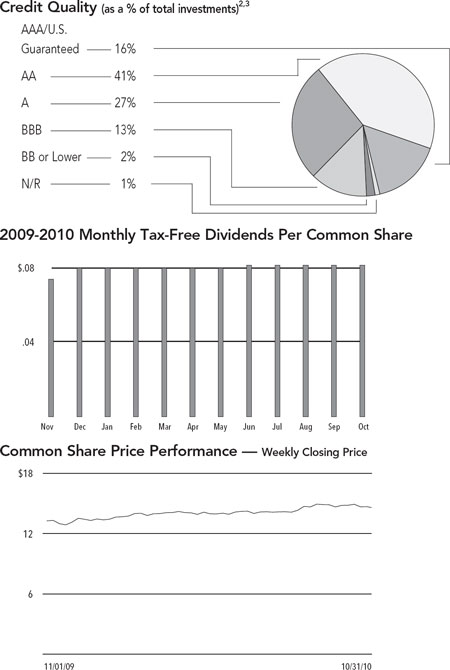
| 3 | Ratings shown are the highest of Standard & Poor’s Group, Moody’s Investor Service, Inc. or Fitch, Inc. AAA includes bonds with an implied AAA rating since they are backed by U.S. Government or agency securities. AAA, AA, A and BBB ratings are investment grade; BB, B, CCC, CC, C and D ratings are below-investment grade. Holdings designated N/R are not rated by any of these national rating agencies. |
| 4 | Holdings are subject to change. |
Nuveen Investments 11
| NMO | Nuveen Municipal |
| Performance | Market Opportunity |
| Fund, Inc. |
| | as of October 31, 2010 |
| Fund Snapshot | | | |
| Common Share Price | | $ | 14.55 | |
Common Share Net Asset Value (NAV) | | $ | 14.17 | |
| Premium/(Discount) to NAV | | | 2.68 | % |
| Market Yield | | | 6.72 | % |
Taxable-Equivalent Yield1 | | | 9.33 | % |
Net Assets Applicable to Common Shares ($000) | | $ | 648,017 | |
| Average Effective Maturity on Securities (Years) | | | 19.81 | |
| Leverage-Adjusted Duration | | | 10.90 | |
Average Annual Total Return (Inception 3/21/90) | | | | | | |
| | | On Share Price | | | On NAV | |
| 1-Year | | | 17.03 | % | | | 11.71 | % |
| 5-Year | | | 6.76 | % | | | 4.56 | % |
| 10-Year | | | 7.66 | % | | | 5.93 | % |
States3 (as a % of total investments) | | | |
| California | | | 13.6 | % |
| Illinois | | | 10.0 | % |
| Texas | | | 6.5 | % |
| Washington | | | 5.9 | % |
| Colorado | | | 5.5 | % |
| Ohio | | | 5.3 | % |
| Puerto Rico | | | 5.0 | % |
| Pennsylvania | | | 4.7 | % |
| South Carolina | �� | | 4.0 | % |
| Nevada | | | 3.8 | % |
| North Carolina | | | 3.8 | % |
| New York | | | 3.2 | % |
| New Jersey | | | 2.7 | % |
| North Dakota | | | 2.4 | % |
| Louisiana | | | 2.1 | % |
| Alaska | | | 1.9 | % |
| Michigan | | | 1.9 | % |
| Indiana | | | 1.8 | % |
| Virginia | | | 1.7 | % |
| Other | | | 14.2 | % |
Portfolio Composition3 (as a % of total investments) | | | |
| Health Care | | | 18.2 | % |
| Transportation | | | 17.3 | % |
| Tax Obligation/General | | | 15.5 | % |
| Tax Obligation/Limited | | | 13.6 | % |
| Utilities | | | 7.8 | % |
| U.S. Guaranteed | | | 7.6 | % |
| Consumer Staples | | | 7.3 | % |
| Other | | | 12.7 | % |
| | Refer to the Glossary of Terms Used in this Report for further definition of the terms used within this Fund’s Performance Overview page. |
| 1 | Taxable-Equivalent Yield represents the yield that must be earned on a fully taxable investment in order to equal the yield of the Fund on an after-tax basis. It is based on a federal income tax rate of 28%. When comparing this Fund to investments that generate qualified dividend income, the Taxable-Equivalent Yield is lower. |
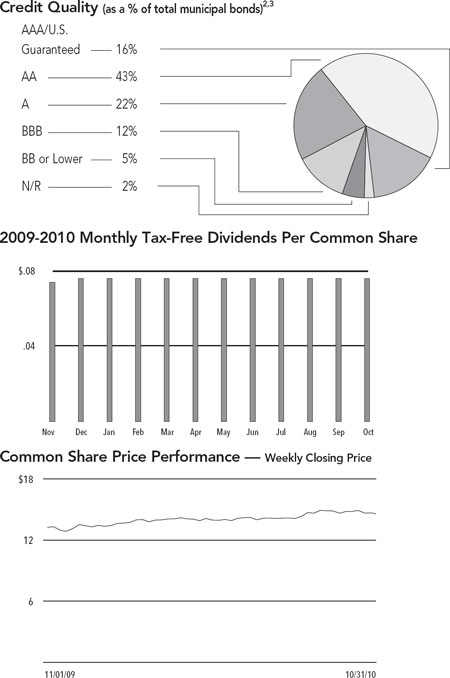
| 2 | Ratings shown are the highest of Standard & Poor’s Group, Moody’s Investor Service, Inc. or Fitch, Inc. AAA includes bonds with an implied AAA rating since they are backed by U.S. Government or agency securities. AAA, AA, A and BBB ratings are investment grade; BB, B, CCC, CC, C and D ratings are below-investment grade. Holdings designated N/R are not rated by any of these national rating agencies. |
| 3 | Holdings are subject to change. |
12 Nuveen Investments
| NAD | Nuveen Dividend |
| Performance | Advantage |
| Municipal Fund |
| | as of October 31, 2010 |
| Fund Snapshot | | | |
| Common Share Price | | $ | 14.40 | |
Common Share Net Asset Value (NAV) | | $ | 14.68 | |
| Premium/(Discount) to NAV | | | -1.91 | % |
| Market Yield | | | 6.33 | % |
Taxable-Equivalent Yield1 | | | 8.79 | % |
Net Assets Applicable to Common Shares ($000) | | $ | 576,895 | |
| Average Effective Maturity on Securities (Years) | | | 17.56 | |
| Leverage-Adjusted Duration | | | 9.97 | |
Average Annual Total Return (Inception 5/26/99) | | | | | | |
| | | On Share Price | | | On NAV | |
| 1-Year | | | 19.17 | % | | | 12.60 | % |
| 5-Year | | | 6.05 | % | | | 5.19 | % |
| 10-Year | | | 7.90 | % | | | 7.14 | % |
States3 (as a % of total municipal bonds) | | | |
| Illinois | | | 21.4 | % |
| Washington | | | 7.5 | % |
| Florida | | | 7.2 | % |
| New York | | | 5.3 | % |
| California | | | 5.1 | % |
| Wisconsin | | | 5.0 | % |
| Louisiana | | | 4.7 | % |
| New Jersey | | | 4.5 | % |
| Texas | | | 4.2 | % |
| Puerto Rico | | | 3.9 | % |
| Colorado | | | 3.8 | % |
| Nevada | | | 3.4 | % |
| Michigan | | | 3.0 | % |
| Indiana | | | 2.9 | % |
| Ohio | | | 2.8 | % |
| Pennsylvania | | | 2.3 | % |
| Other | | | 13.0 | % |
Portfolio Composition3 (as a % of total investments) | | | |
| Health Care | | | 21.5 | % |
| Tax Obligation/Limited | | | 20.8 | % |
| Tax Obligation/General | | | 16.0 | % |
| Transportation | | | 13.0 | % |
| Consumer Staples | | | 6.0 | % |
| Education and Civic Organizations | | | 4.8 | % |
| U.S. Guaranteed | | | 4.6 | % |
| Investment Companies | | | 0.1 | % |
| Other | | | 13.2 | % |
| | Refer to the Glossary of Terms Used in this Report for further definition of the terms used within this Fund’s Performance Overview page. |
| 1 | Taxable-Equivalent Yield represents the yield that must be earned on a fully taxable investment in order to equal the yield of the Fund on an after-tax basis. It is based on a federal income tax rate of 28%. When comparing this Fund to investments that generate qualified dividend income, the Taxable-Equivalent Yield is lower. |
| 2 | Ratings shown are the highest of Standard & Poor’s Group, Moody’s Investor Service, Inc. or Fitch, Inc. AAA includes bonds with an implied AAA rating since they are backed by U.S. Government or agency securities. AAA, AA, A and BBB ratings are investment grade; BB, B, CCC, CC, C and D ratings are below-investment grade. Holdings designated N/R are not rated by any of these national rating agencies. |
| 3 | Holdings are subject to change. |
Nuveen Investments 13
| NXZ | Nuveen Dividend |
| Performance | Advantage |
| Municipal Fund 2 |
| | as of October 31, 2010 |
| Fund Snapshot | | | |
| Common Share Price | | $ | 14.67 | |
Common Share Net Asset Value (NAV) | | $ | 14.76 | |
| Premium/(Discount) to NAV | | | -0.61 | % |
| Market Yield | | | 6.54 | % |
Taxable-Equivalent Yield1 | | | 9.08 | % |
Net Assets Applicable to Common Shares ($000) | | $ | 434,764 | |
| Average Effective Maturity on Securities (Years) | | | 15.42 | |
| Leverage-Adjusted Duration | | | 6.69 | |
Average Annual Total Return (Inception 3/27/01) | | | | | | |
| | | On Share Price | | | On NAV | |
| 1-Year | | | 10.89 | % | | | 9.12 | % |
| 5-Year | | | 5.07 | % | | | 4.97 | % |
| Since Inception | | | 6.33 | % | | | 6.82 | % |
States4 | | | |
| (as a % of total investments) | | | |
| Texas | | | 17.9 | % |
| Illinois | | | 11.2 | % |
| California | | | 8.9 | % |
| Michigan | | | 8.5 | % |
| Colorado | | | 6.2 | % |
| New York | | | 5.9 | % |
| New Mexico | | | 3.7 | % |
| Louisiana | | | 3.6 | % |
| Minnesota | | | 3.1 | % |
| Alabama | | | 3.0 | % |
| Florida | | | 2.9 | % |
| Washington | | | 2.8 | % |
| Kansas | | | 2.7 | % |
| Pennsylvania | | | 2.1 | % |
| Oregon | | | 2.1 | % |
| Indiana | | | 1.7 | % |
| Other | | | 13.7 | % |
Portfolio Composition4 | | | |
| (as a % of total investments) | | | |
| U.S. Guaranteed | | | 31.5 | % |
| Tax Obligation/Limited | | | 20.6 | % |
| Health Care | | | 14.0 | % |
| Transportation | | | 10.7 | % |
| Consumer Staples | | | 7.2 | % |
| Tax Obligation/General | | | 4.5 | % |
| Other | | | 11.5 | % |
| | Refer to the Glossary of Terms Used in this Report for further definition of the terms used within this Fund’s Performance Overview page. |
| 1 | Taxable-Equivalent Yield represents the yield that must be earned on a fully taxable investment in order to equal the yield of the Fund on an after-tax basis. It is based on a federal income tax rate of 28%. When comparing this Fund to investments that generate qualified dividend income, the Taxable-Equivalent Yield is lower. |
| 2 | The Fund paid shareholders a net ordinary income distribution in December 2009 of $0.0139 per share. |
| 3 | Ratings shown are the highest of Standard & Poor’s Group, Moody’s Investor Service, Inc. or Fitch, Inc. AAA includes bonds with an implied AAA rating since they are backed by U.S. Government or agency securities. AAA, AA, A and BBB ratings are investment grade; BB, B, CCC, CC, C and D ratings are below-investment grade. Holdings designated N/R are not rated by any of these national rating agencies. |
| 4 | Holdings are subject to change. |
14 Nuveen Investments
| NZF | Nuveen Dividend |
| Performance | Advantage |
| Municipal Fund 3 |
| | as of October 31, 2010 |
| Fund Snapshot | | | |
| Common Share Price | | $ | 14.58 | |
Common Share Net Asset Value (NAV) | | $ | 14.74 | |
| Premium/(Discount) to NAV | | | -1.09 | % |
| Market Yield | | | 6.75 | % |
Taxable-Equivalent Yield1 | | | 9.38 | % |
Net Assets Applicable to Common Shares ($000) | | $ | 595,413 | |
| Average Effective Maturity on Securities (Years) | | | 14.96 | |
| Leverage-Adjusted Duration | | | 5.93 | |
Average Annual Total Return (Inception 9/25/01) | | | | | | |
| | | On Share Price | | | On NAV | |
| 1-Year | | | 17.04 | % | | | 11.41 | % |
| 5-Year | | | 6.79 | % | | | 5.45 | % |
| Since Inception | | | 6.26 | % | | | 6.63 | % |
States4 (as a % of total municipal bonds) | | | |
| Texas | | | 14.7 | % |
| Illinois | | | 12.0 | % |
| Washington | | | 10.5 | % |
| California | | | 7.3 | % |
| Michigan | | | 6.4 | % |
| Colorado | | | 4.1 | % |
| Indiana | | | 3.9 | % |
| Iowa | | | 3.6 | % |
| New Jersey | | | 3.2 | % |
| Louisiana | | | 3.1 | % |
| New York | | | 3.1 | % |
| Wisconsin | | | 3.0 | % |
| Kentucky | | | 2.3 | % |
| Massachusetts | | | 2.0 | % |
| Missouri | | | 2.0 | % |
| Nevada | | | 1.8 | % |
| Maryland | | | 1.7 | % |
| Georgia | | | 1.5 | % |
| Other | | | 13.8 | % |
Portfolio Composition4 (as a % of total investments) | | | |
| U.S. Guaranteed | | | 23.7 | % |
| Transportation | | | 17.8 | % |
| Health Care | | | 15.8 | % |
| Tax Obligation/General | | | 8.2 | % |
| Tax Obligation/Limited | | | 8.0 | % |
| Utilities | | | 4.8 | % |
| Water and Sewer | | | 4.6 | % |
| Consumer Staples | | | 4.1 | % |
| Investment Companies | | | 0.4 | % |
| Other | | | 12.6 | % |
| | Refer to the Glossary of Terms Used in this Report for further definition of the terms used within this Fund’s Performance Overview page. |
| 1 | Taxable-Equivalent Yield represents the yield that must be earned on a fully taxable investment in order to equal the yield of the Fund on an after-tax basis. It is based on a federal income tax rate of 28%. When comparing this Fund to investments that generate qualified dividend income, the Taxable-Equivalent Yield is lower. |
| 2 | The Fund paid shareholders a capital gain and net ordinary income distribution in December 2009 of $0.0645 per share. |
| 3 | Ratings shown are the highest of Standard & Poor’s Group, Moody’s Investor Service, Inc. or Fitch, Inc. AAA includes bonds with an implied AAA rating since they are backed by U.S. Government or agency securities. AAA, AA, A and BBB ratings are investment grade; BB, B, CCC, CC, C and D ratings are below-investment grade. Holdings designated N/R are not rated by any of these national rating agencies. |
| 4 | Holdings are subject to change. |
Nuveen Investments 15
| NPP | | Shareholder Meeting Report |
NMA NMO | | The annual meeting of shareholders was held on July 27, 2010 in the Lobby Conference Room, 333 West Wacker Drive, Chicago, IL 60606; at this meeting the shareholders were asked to vote on the election of Board Members, the elimination of Fundamental Investment Policies and the approval of new Fundamental Investment Policies. The meeting for NPP was subsequently adjourned to September 9, 2010. |
| | | | NPP | | | | NMA | | | | NMO | |
| | | Common and Preferred shares voting together as a class | | Preferred shares voting together as a class | | Common and Preferred shares voting together as a class | | Preferred shares voting together as a class | | Common and Preferred shares voting together as a class | | Preferred shares voting together as a class |
| To approve the elimination of the Fund’s fundamental policy relating to investments in municipal securities and below investment grade securities. | | | | | | | | | | | | |
| For | | 28,384,032 | | 1,716 | | — | | — | | 21,192,999 | | 2,764 |
| Against | | 1,588,179 | | 1,176 | | — | | — | | 1,339,168 | | — |
| Abstain | | 830,467 | | 17 | | — | | — | | 617,855 | | — |
| Broker Non-Votes | | 7,606,326 | | 4,947 | | — | | — | | 7,967,266 | | — |
| Total | | 38,409,004 | | 7,856 | | — | | — | | 31,117,288 | | 2,764 |
| To approve the new fundamental policy relating to investments in municipal securities for the Fund. | | | | | | | | | | | | |
| For | | 28,527,693 | | 1,720 | | — | | — | | 21,280,072 | | 2,764 |
| Against | | 1,370,126 | | 1,160 | | — | | — | | 1,189,246 | | — |
| Abstain | | 904,859 | | 29 | | — | | — | | 680,706 | | — |
| Broker Non-Votes | | 7,606,326 | | 4,947 | | — | | — | | 7,967,264 | | — |
| Total | | 38,409,004 | | 7,856 | | — | | — | | 31,117,288 | | 2,764 |
| To approve the elimination of the fundamental policy relating to investing in other investment companies. | | | | | | | | | | | | |
| For | | 28,255,942 | | 1,711 | | — | | — | | 21,148,091 | | 2,764 |
| Against | | 1,571,658 | | 1,169 | | — | | — | | 1,289,569 | | — |
| Abstain | | 975,078 | | 29 | | — | | — | | 712,365 | | — |
| Broker Non-Votes | | 7,606,326 | | 4,947 | | — | | — | | 7,967,263 | | — |
| Total | | 38,409,004 | | 7,856 | | — | | — | | 31,117,288 | | 2,764 |
| To approve the elimination of the fundamental policy relating to derivatives and short sales. | | | | | | | | | | | | |
| For | | 28,143,153 | | 1,711 | | — | | — | | 21,125,070 | | 2,764 |
| Against | | 1,729,919 | | 1,177 | | — | | — | | 1,399,712 | | — |
| Abstain | | 929,606 | | 21 | | — | | — | | 625,241 | | — |
| Broker Non-Votes | | 7,606,326 | | 4,947 | | — | | — | | 7,967,265 | | — |
| Total | | 38,409,004 | | 7,856 | | — | | — | | 31,117,288 | | 2,764 |
| To approve the elimination of the fundamental policy relating to commodities. | | | | | | | | | | | | |
| For | | 28,151,297 | | 1,711 | | — | | — | | 21,120,466 | | 2,764 |
| Against | | 1,686,090 | | 1,166 | | — | | — | | 1,307,098 | | — |
| Abstain | | 965,291 | | 32 | | — | | — | | 722,461 | | — |
| Broker Non-Votes | | 7,606,326 | | 4,947 | | — | | — | | 7,967,263 | | — |
| Total | | 38,409,004 | | 7,856 | | — | | — | | 31,117,288 | | 2,764 |
| To approve the new fundamental policy relating to commodities. | | | | | | | | | | | | |
| For | | 28,177,145 | | 1,714 | | — | | — | | 21,089,983 | | 2,764 |
| Against | | 1,632,444 | | 1,163 | | — | | — | | 1,325,419 | | — |
| Abstain | | 993,089 | | 32 | | — | | — | | 734,623 | | — |
| Broker Non-Votes | | 7,606,326 | | 4,947 | | — | | — | | 7,967,263 | | — |
| Total | | 38,409,004 | | 7,856 | | — | | — | | 31,117,288 | | 2,764 |
16 Nuveen Investments
| | | NPP | | NMA | | NMO |
| | | Common and Preferred shares voting together as a class | | Preferred shares voting together as a class | | Common and Preferred shares voting together as a class | | Preferred shares voting together as a class | | Common and Preferred shares voting together as a class | | Preferred shares voting together as a class |
| Approval of the Board Members was reached as follows: | | | | | | | | | | | | |
| John Amboian | | | | | | | | | | | | |
| For | | 37,295,583 | | — | | 31,707,829 | | — | | 30,007,058 | | — |
| Withhold | | 1,113,421 | | — | | 686,750 | | — | | 1,110,230 | | — |
| Total | | 38,409,004 | | — | | 32,394,579 | | — | | 31,117,288 | | — |
| Robert P. Bremner | | | | | | | | | | | | |
| For | | 37,297,224 | | — | | 31,588,697 | | — | | 29,986,898 | | — |
| Withhold | | 1,111,780 | | — | | 805,882 | | — | | 1,130,390 | | — |
| Total | | 38,409,004 | | — | | 32,394,579 | | — | | 31,117,288 | | — |
| Jack B. Evans | | | | | | | | | | | | |
| For | | 37,327,664 | | — | | 31,573,835 | | — | | 30,016,956 | | — |
| Withhold | | 1,081,340 | | — | | 820,744 | | — | | 1,100,332 | | — |
| Total | | 38,409,004 | | — | | 32,394,579 | | — | | 31,117,288 | | — |
| William C. Hunter | | | | | | | | | | | | |
| For | | — | | 5,593 | | — | | 2,018 | | — | | 2,464 |
| Withhold | | — | | 2,263 | | — | | 200 | | — | | 300 |
| Total | | — | | 7,856 | | — | | 2,218 | | — | | 2,764 |
| David J. Kundert | | | | | | | | | | | | |
| For | | 37,306,638 | | — | | 31,581,694 | | — | | 29,978,064 | | — |
| Withhold | | 1,102,366 | | — | | 812,885 | | — | | 1,139,224 | | — |
| Total | | 38,409,004 | | — | | 32,394,579 | | — | | 31,117,288 | | — |
| William J. Schneider | | | | | | | | | | | | |
| For | | — | | 5,593 | | — | | 2,018 | | — | | 2,464 |
| Withhold | | — | | 2,263 | | — | | 200 | | — | | 300 |
| Total | | — | | 7,856 | | — | | 2,218 | | — | | 2,764 |
| Judith M. Stockdale | | | | | | | | | | | | |
| For | | 37,239,033 | | — | | 31,503,609 | | — | | 29,994,859 | | — |
| Withhold | | 1,169,971 | | — | | 890,970 | | — | | 1,122,429 | | — |
| Total | | 38,409,004 | | — | | 32,394,579 | | — | | 31,117,288 | | — |
| Carole E. Stone | | | | | | | | | | | | |
| For | | 37,277,344 | | — | | 31,558,979 | | — | | 30,004,299 | | — |
| Withhold | | 1,131,660 | | — | | 835,600 | | — | | 1,112,989 | | — |
| Total | | 38,409,004 | | — | | 32,394,579 | | — | | 31,117,288 | | — |
| Terence J. Toth | | | | | | | | | | | | |
| For | | 37,300,708 | | — | | 31,680,928 | | — | | 30,024,683 | | — |
| Withhold | | 1,108,296 | | — | | 713,651 | | — | | 1,092,605 | | — |
| Total | | 38,409,004 | | — | | 32,394,579 | | — | | 31,117,288 | | — |
Nuveen Investments 17
| NAD | Shareholder Meeting Report (continued) |
| NXZ | |
| NZF | |
| | | NAD | | NXZ | | NZF |
| | | Common and Preferred shares voting together as a class | | Preferred shares voting together as a class | | Common and Preferred shares voting together as a class | | Preferred shares voting together as a class | | Common and Preferred shares voting together as a class | | Preferred shares voting together as a class |
| To approve the elimination of the Fund’s fundamental policy relating to investments in municipal securities and below investment grade securities. | | | | | | | | | | | | |
| For | | — | | — | | — | | — | | — | | — |
| Against | | — | | — | | — | | — | | — | | — |
| Abstain | | — | | — | | — | | — | | — | | — |
| Broker Non-Votes | | — | | — | | — | | — | | — | | — |
| Total | | — | | — | | — | | — | | — | | — |
| To approve the new fundamental policy relating to investments in municipal securities for the Fund. | | | | | | | | | | | | |
| For | | — | | — | | — | | — | | — | | — |
| Against | | — | | — | | — | | — | | — | | — |
| Abstain | | — | | — | | — | | — | | — | | — |
| Broker Non-Votes | | — | | — | | — | | — | | — | | — |
| Total | | — | | — | | — | | — | | — | | — |
| To approve the elimination of the fundamental policy relating to investing in other investment companies. | | | | | | | | | | | | |
| For | | — | | — | | — | | — | | — | | — |
| Against | | — | | — | | — | | — | | — | | — |
| Abstain | | — | | — | | — | | — | | — | | — |
| Broker Non-Votes | | — | | — | | — | | — | | — | | — |
| Total | | — | | — | | — | | — | | — | | — |
| To approve the elimination of the fundamental policy relating to derivatives and short sales. | | | | | | | | | | | | |
| For | | — | | — | | — | | — | | — | | — |
| Against | | — | | — | | — | | — | | — | | — |
| Abstain | | — | | — | | — | | — | | — | | — |
| Broker Non-Votes | | — | | — | | — | | — | | — | | — |
| Total | | — | | — | | — | | — | | — | | — |
| To approve the elimination of the fundamental policy relating to commodities. | | | | | | | | | | | | |
| For | | — | | — | | — | | — | | — | | — |
| Against | | — | | — | | — | | — | | — | | — |
| Abstain | | — | | — | | — | | — | | — | | — |
| Broker Non-Votes | | — | | — | | — | | — | | — | | — |
| Total | | — | | — | | — | | — | | — | | — |
| To approve the new fundamental policy relating to commodities. | | | | | | | | | | | | |
| For | | — | | — | | — | | — | | — | | — |
| Against | | — | | — | | — | | — | | — | | — |
| Abstain | | — | | — | | — | | — | | — | | — |
| Broker Non-Votes | | — | | — | | — | | — | | — | | — |
| Total | | — | | — | | — | | — | | — | | — |
18 Nuveen Investments
| | | | NAD | | | | NXZ | | | | NZF | |
| | | Common and Preferred shares voting together as a class | | Preferred shares voting together as a class | | Common and Preferred shares voting together as a class | | Preferred shares voting together as a class | | Common and Preferred shares voting together as a class | | Preferred shares voting together as a class |
| Approval of the Board Members was | | | | | | | | | | | | |
| reached as follows: | | | | | | | | | | | | |
| John Amboian | | | | | | | | | | | | |
| For | | — | | — | | — | | — | | — | | — |
| Withhold | | — | | — | | — | | — | | — | | — |
| Total | | — | | — | | — | | — | | — | | — |
| Robert P. Bremner | | | | | | | | | | | | |
| For | | — | | — | | — | | — | | — | | — |
| Withhold | | — | | — | | — | | — | | — | | — |
| Total | | — | | — | | — | | — | | — | | — |
| Jack B. Evans | | | | | | | | | | | | |
| For | | — | | — | | — | | — | | — | | — |
| Withhold | | — | | — | | — | | — | | — | | — |
| Total | | — | | — | | — | | — | | — | | — |
| William C. Hunter | | | | | | | | | | | | |
| For | | — | | 9,340,366 | | — | | 980 | | — | | 4,264 |
| Withhold | | — | | 2,427,527 | | — | | 890 | | — | | 1,486 |
| Total | | — | | 11,767,893 | | — | | 1,870 | | — | | 5,750 |
| David J. Kundert | | | | | | | | | | | | |
| For | | — | | — | | — | | — | | — | | — |
| Withhold | | — | | — | | — | | — | | — | | — |
| Total | | — | | — | | — | | — | | — | | — |
| William J. Schneider | | | | | | | | | | | | |
| For | | — | | 9,340,366 | | — | | 980 | | — | | 4,264 |
| Withhold | | — | | 2,427,527 | | — | | 890 | | — | | 1,486 |
| Total | | — | | 11,767,893 | | — | | 1,870 | | — | | 5,750 |
| Judith M. Stockdale | | | | | | | | | | | | |
| For | | 43,921,868 | | — | | 26,365,545 | | — | | 34,915,348 | | — |
| Withhold | | 3,305,705 | | — | | 569,455 | | — | | 782,960 | | — |
| Total | | 47,227,573 | | — | | 26,935,000 | | — | | 35,698,308 | | — |
| Carole E. Stone | | | | | | | | | | | | |
| For | | 43,983,468 | | — | | 26,368,565 | | — | | 34,946,092 | | — |
| Withhold | | 3,244,105 | | — | | 566,435 | | — | | 752,216 | | — |
| Total | | 47,227,573 | | — | | 26,935,000 | | — | | 35,698,308 | | — |
| Terence J. Toth | | | | | | | | | | | | |
| For | | — | | — | | — | | — | | — | | — |
| Withhold | | — | | — | | — | | — | | — | | — |
| Total | | — | | — | | — | | — | | — | | — |
Nuveen Investments 19
Report of Independent
Registered Public Accounting Firm
The Board of Directors/Trustees and Shareholders
Nuveen Performance Plus Municipal Fund, Inc.
Nuveen Municipal Advantage Fund, Inc.
Nuveen Municipal Market Opportunity Fund, Inc.
Nuveen Dividend Advantage Municipal Fund
Nuveen Dividend Advantage Municipal Fund 2
Nuveen Dividend Advantage Municipal Fund 3
We have audited the accompanying statements of assets and liabilities, including the portfolios of investments, of Nuveen Performance Plus Municipal Fund, Inc., Nuveen Municipal Advantage Fund, Inc., Nuveen Municipal Market Opportunity Fund, Inc., Nuveen Dividend Advantage Municipal Fund, Nuveen Dividend Advantage Municipal Fund 2 and Nuveen Dividend Advantage Municipal Fund 3 (the “Funds”) as of October 31, 2010, and the related statements of operations and cash flows (Nuveen Municipal Advantage Fund, Inc., Nuveen Municipal Market Opportunity Fund, Inc., Nuveen Dividend Advantage Municipal Fund, Nuveen Dividend Advantage Municipal Fund 2 and Nuveen Dividend Advantage Municipal Fund 3 only) for the year then ended, the statements of changes in net assets for each of the two years in the period then ended and the financial highlights fo r each of the five years in the period then ended. These financial statements and financial highlights are the responsibility of the Funds’ management. Our responsibility is to express an opinion on these financial statements and financial highlights based on our audits.
We conducted our audits in accordance with the standards of the Public Company Accounting Oversight Board (United States). Those standards require that we plan and perform the audits to obtain reasonable assurance about whether the financial statements and financial highlights are free of material misstatement. We were not engaged to perform an audit of the Funds’ internal control over financial reporting. Our audits included consideration of internal control over financial reporting as a basis for designing audit procedures that are appropriate in the circumstances, but not for the purpose of expressing an opinion on the effectiveness of the Funds’ internal control over financial reporting. Accordingly, we express no such opinion. An audit also includes examining, on a test basis, evidence supporting the amounts and disclosures in the financial statements and financial highlights, assessing the accounting principles used and significant estimates made by management and evaluating the overall financial statement presentation. Our procedures included confirmation of securities owned as of October 31, 2010, by correspondence with the custodian and brokers or by other appropriate auditing procedures where replies from brokers were not received. We believe that our audits provide a reasonable basis for our opinion.
In our opinion, the financial statements and financial highlights referred to above present fairly, in all material respects, the financial positions of Nuveen Performance Plus Municipal Fund, Inc., Nuveen Municipal Advantage Fund, Inc., Nuveen Municipal Market Opportunity Fund, Inc., Nuveen Dividend Advantage Municipal Fund, Nuveen Dividend Advantage Municipal Fund 2 and Nuveen Dividend Advantage Municipal Fund 3 at October 31, 2010, the results of their operations and cash flows (Nuveen Municipal Advantage Fund, Inc., Nuveen Municipal Market Opportunity Fund, Inc., Nuveen Dividend Advantage Municipal Fund, Nuveen Dividend Advantage Municipal Fund 2 and Nuveen Dividend Advantage Municipal Fund 3 only) for the year then ended, the changes in their net assets for each of the two years in the period then ended and the financial highlights for each o f the five years in the period then ended in conformity with U.S. generally accepted accounting principles.
Chicago, Illinois
December 28, 2010
20 Nuveen Investments
| | | Nuveen Performance Plus Municipal Fund, Inc. |
NPP | | Portfolio of Investments |
October 31, 2010
| | Principal | | | Optional Call | | | | |
| | Amount (000) | | Description (1) | Provisions (2) | Ratings (3) | | Value | |
| | | | Alabama – 0.1% (0.1% of Total Investments) | | | | | |
| | | | Jefferson County, Alabama, Sewer Revenue Refunding Warrants, Series 1997A: | | | | | |
| $ | 1,435 | | 5.625%, 2/01/22 – FGIC Insured | 12/10 at 100.00 | Caa3 | $ | 592,712 | |
| | 1,505 | | 5.375%, 2/01/27 – FGIC Insured | 12/10 at 100.00 | Caa3 | | 605,206 | |
| | 2,940 | | Total Alabama | | | | 1,197,918 | |
| | | | Alaska – 0.2% (0.1% of Total Investments) | | | | | |
| | 2,465 | | Northern Tobacco Securitization Corporation, Alaska, Tobacco Settlement Asset-Backed Bonds, Series 2006A, 5.000%, 6/01/46 | 6/14 at 100.00 | Baa3 | | 1,732,476 | |
| | | | Arizona – 2.2% (1.5% of Total Investments) | | | | | |
| | 1,000 | | Arizona State Transportation Board, Highway Revenue Bonds, Series 2002B, 5.250%, 7/01/22 (Pre-refunded 7/01/12) | 7/12 at 100.00 | AAA | | 1,080,830 | |
| | 7,780 | | Phoenix Civic Improvement Corporation, Arizona, Junior Lien Airport Revenue Bonds, Series 2010A, 5.000%, 7/01/40 | No Opt. Call | A+ | | 7,971,388 | |
| | | | Phoenix, Arizona, Civic Improvement Corporation, Senior Lien Airport Revenue Bonds, Series 2002B: | | | | | |
| | 5,365 | | 5.750%, 7/01/15 – FGIC Insured (Alternative Minimum Tax) | 7/12 at 100.00 | AA– | | 5,665,386 | |
| | 5,055 | | 5.750%, 7/01/16 – FGIC Insured (Alternative Minimum Tax) | 7/12 at 100.00 | AA– | | 5,305,627 | |
| | 19,200 | | Total Arizona | | | | 20,023,231 | |
| | | | Arkansas – 0.5% (0.4% of Total Investments) | | | | | |
| | 5,080 | | Independence County, Arkansas, Hydroelectric Power Revenue Bonds, Series 2003, 5.350%, 5/01/28 – ACA Insured | 5/13 at 100.00 | N/R | | 3,846,881 | |
| | 1,000 | | Washington County, Arkansas, Hospital Revenue Bonds, Washington Regional Medical Center, Series 2005A, 5.000%, 2/01/35 | 2/15 at 100.00 | Baa1 | | 1,003,720 | |
| | 6,080 | | Total Arkansas | | | | 4,850,601 | |
| | | | California – 18.0% (12.1% of Total Investments) | | | | | |
| | 3,500 | | Alameda Corridor Transportation Authority, California, Subordinate Lien Revenue Bonds, Series 2004A, 0.000%, 10/01/25 – AMBAC Insured | 10/17 at 100.00 | A– | | 2,935,170 | |
| | 11,000 | | Anaheim Public Finance Authority, California, Subordinate Lease Revenue Bonds, Public Improvement Project, Series 1997C, 0.000%, 9/01/20 – AGM Insured | No Opt. Call | AA+ | | 6,969,160 | |
| | | | California Department of Water Resources, Power Supply Revenue Bonds, Series 2002A: | | | | | |
| | 4,000 | | 6.000%, 5/01/15 (Pre-refunded 5/01/12) | 5/12 at 101.00 | Aaa | | 4,375,160 | |
| | 3,175 | | 5.375%, 5/01/22 (Pre-refunded 5/01/12) | 5/12 at 101.00 | Aaa | | 3,443,002 | |
| | 3,365 | | California Health Facilities Financing Authority, Health Facility Revenue Bonds, Adventist Health System/West, Series 2003A, 5.000%, 3/01/33 | 3/13 at 100.00 | A | | 3,320,212 | |
| | | | California Health Facilities Financing Authority, Revenue Bonds, Kaiser Permanante System, Series 2006: | | | | | |
| | 5,000 | | 5.000%, 4/01/37 | 4/16 at 100.00 | A+ | | 4,963,550 | |
| | 7,000 | | 5.250%, 4/01/39 | 4/16 at 100.00 | A+ | | 7,068,670 | |
| | 2,380 | | California Infrastructure Economic Development Bank, Revenue Bonds, J. David Gladstone Institutes, Series 2001, 5.250%, 10/01/34 | 10/11 at 101.00 | A– | | 2,363,864 | |
| | 2,330 | | California Municipal Finance Authority, Revenue Bonds, Eisenhower Medical Center, Series 2010A, 5.750%, 7/01/40 | 7/20 at 100.00 | Baa1 | | 2,367,793 | |
| | 3,700 | | California Pollution Control Financing Authority, Revenue Bonds, Pacific Gas and Electric Company, Series 2004C, 4.750%, 12/01/23 – FGIC Insured (Alternative Minimum Tax) | 6/17 at 100.00 | A3 | | 3,707,733 | |
| | 5,000 | | California, General Obligation Bonds, Series 2005, 5.000%, 3/01/31 | 3/16 at 100.00 | A1 | | 5,070,950 | |
| | 6,435 | | California, General Obligation Refunding Bonds, Series 2002, 6.000%,
4/01/16 – AMBAC Insured | No Opt. Call | A1 | | 7,656,556 | |
| | 16,000 | | California, Various Purpose General Obligation Bonds, Series 2007, 5.000%, 6/01/37 | 6/17 at 100.00 | A1 | | 16,057,120 | |
| | 5,000 | | Coast Community College District, Orange County, California, General Obligation Bonds, Series 2006C, 0.000%, 8/01/32 – AGM Insured | 8/18 at 100.00 | AA+ | | 4,349,450 | |
| | 7,240 | | Desert Community College District, Riverside County, California, General Obligation Bonds, Election 2004 Series 2007C, 0.000%, 8/01/28 – AGM Insured | 8/17 at 56.01 | AA+ | | 2,614,292 | |
Nuveen Investments 21
| | | Nuveen Performance Plus Municipal Fund, Inc. (continued) |
| NPP | | Portfolio of Investments October 31, 2010 |
| | Principal | | | Optional Call | | | | |
| | Amount (000) | | Description (1) | Provisions (2) | Ratings (3) | | Value | |
| | | | California (continued) | | | | | |
| $ | 10,000 | | Golden State Tobacco Securitization Corporation, California, Tobacco Settlement Asset-Backed Bonds, Series 2003A-1, 6.750%, 6/01/39 (Pre-refunded 6/01/13) | 6/13 at 100.00 | AAA | $ | 11,551,900 | |
| | 1,500 | | Golden State Tobacco Securitization Corporation, California, Tobacco Settlement Asset-Backed Bonds, Series 2007A-1, 5.125%, 6/01/47 | 6/17 at 100.00 | BBB | | 1,081,065 | |
| | 10,000 | | Golden State Tobacco Securitization Corporation, California, Tobacco Settlement Asset-Backed Bonds, Series 2007A-2, 0.000%, 6/01/37 | 6/22 at 100.00 | Baa3 | | 6,602,300 | |
| | 5,000 | | Los Angeles Community College District, California, General Obligation Bonds, Series 2007C, 5.000%, 8/01/32 – FGIC Insured | 8/17 at 100.00 | Aa1 | | 5,246,350 | |
| | 5,500 | | Los Angeles Department of Water and Power, California, Waterworks Revenue Bonds, Series 2003A, 5.125%, 7/01/40 – FGIC Insured | 7/12 at 100.00 | AA | | 5,583,380 | |
| | 3,300 | | M-S-R Energy Authority, California, Gas Revenue Bonds, Citigroup Prepay Contracts, Series 2009B, 6.500%, 11/01/39 | No Opt. Call | A | | 3,872,319 | |
| | 1,000 | | Mt. Diablo Hospital District, California, Insured Hospital Revenue Bonds, Series 1993A, 5.125%, 12/01/23 – AMBAC Insured (ETM) | 12/10 at 100.00 | N/R (4) | | 1,135,280 | |
| | 13,450 | | Ontario Redevelopment Financing Authority, San Bernardino County, California, Revenue Refunding Bonds, Redevelopment Project 1, Series 1995, 7.200%, 8/01/17 – NPFG Insured | No Opt. Call | A | | 15,464,676 | |
| | 2,325 | | Palmdale Community Redevelopment Agency, California, Restructured Single Family Mortgage Revenue Bonds, Series 1986D, 8.000%, 4/01/16 (Alternative Minimum Tax) (ETM) | No Opt. Call | AAA | | 2,999,645 | |
| | 4,795 | | Palomar Pomerado Health, California, General Obligation Bonds, Election of 2004, Series 2007A, 5.000%, 8/01/32 – NPFG Insured | No Opt. Call | A+ | | 4,866,014 | |
| | 1,830 | | San Diego Public Facilities Financing Authority, California, Water Utility Revenue Bonds, Tender Option Bond Trust 3504, 19.188%, 2/01/33 (IF) | 8/19 at 100.00 | Aa2 | | 2,501,024 | |
| | 2,000 | | San Francisco Airports Commission, California, Revenue Refunding Bonds, San Francisco International Airport, Second Series 2001, Issue 27B, 5.125%, 5/01/26 – FGIC Insured | 5/11 at 100.00 | A1 | | 2,012,540 | |
| | | | San Joaquin Hills Transportation Corridor Agency, Orange County, California, Toll Road Revenue Refunding Bonds, Series 1997A: | | | | | |
| | 7,210 | | 0.000%, 1/15/23 – NPFG Insured | No Opt. Call | A | | 2,964,247 | |
| | 3,000 | | 0.000%, 1/15/35 – NPFG Insured | No Opt. Call | A | | 469,410 | |
| | 2,875 | | Tobacco Securitization Authority of Northern California, Tobacco Settlement Asset-Backed Bonds, Series 2005A-1, 4.750%, 6/01/23 | 6/15 at 100.00 | BBB | | 2,715,783 | |
| | 5,245 | | Vacaville Unified School District, California, General Obligation Bonds, Series 2005, 5.000%, 8/01/30 – NPFG Insured | 8/15 at 100.00 | A+ | | 5,373,817 | |
| | 12,380 | | Walnut Valley Unified School District, Los Angeles County, California, General Obligation Refunding Bonds, Series 1997A, 7.200%, 2/01/16 – NPFG Insured | 8/11 at 103.00 | AA– | | 13,346,383 | |
| | 176,535 | | Total California | | | | 165,048,815 | |
| | | | Colorado – 9.5% (6.4% of Total Investments) | | | | | |
| | 5,240 | | Adams 12 Five Star Schools, Adams County, Colorado, General Obligation Bonds, Series 2005, 5.000%, 12/15/24 – AGM Insured | 12/15 at 100.00 | AA+ | | 5,679,007 | |
| | 3,000 | | Colorado Educational and Cultural Facilities Authority, Charter School Revenue Bonds, Peak-to-Peak Charter School, Series 2004, 5.250%, 8/15/34 – SYNCORA GTY Insured | 8/14 at 100.00 | A | | 3,019,740 | |
| | 10,000 | | Colorado Health Facilities Authority, Health Facilities Revenue Bonds, Sisters of Charity of Leavenworth Health Services Corporation, Series 2010A, 5.000%, 1/01/40 | No Opt. Call | AA | | 10,220,800 | |
| | 7,660 | | Colorado Health Facilities Authority, Revenue Refunding and Improvement Bonds, Boulder Community Hospital, Series 1994B, 5.875%, 10/01/23 – NPFG Insured | 12/10 at 100.00 | A2 | | 7,667,507 | |
| | 5,860 | | Colorado Health Facilities Authority, Revenue Refunding Bonds, Catholic Health Initiatives, Series 2001, 5.250%, 9/01/21 (Pre-refunded 9/01/11) | 9/11 at 100.00 | Aa2 (4) | | 6,099,147 | |
| | 4,500 | | Denver City and County, Colorado, Airport System Revenue Refunding Bonds, Series 2001A, 5.500%, 11/15/16 – FGIC Insured (Alternative Minimum Tax) | 11/11 at 100.00 | A+ | | 4,684,995 | |
| | 20,000 | | Denver Convention Center Hotel Authority, Colorado, Senior Revenue Bonds, Convention Center Hotel, Series 2003A, 5.000%, 12/01/33 (Pre-refunded 12/01/13) – SYNCORA GTY Insured | 12/13 at 100.00 | N/R (4) | | 22,322,200 | |
| | 13,055 | | E-470 Public Highway Authority, Colorado, Senior Revenue Bonds, Series 1997B, 0.000%,9/01/21 – NPFG Insured | No Opt. Call | A | | 7,071,632 | |
| | Principal | | | Optional Call | | | | |
| | Amount (000) | | Description (1) | Provisions (2) | Ratings (3) | | Value | |
| | | | Colorado (continued) | | | | | |
| | | | E-470 Public Highway Authority, Colorado, Senior Revenue Bonds, Series 2000B: | | | | | |
| $ | 16,200 | | 0.000%, 9/01/32 – NPFG Insured | No Opt. Call | A | $ | 3,857,382 | |
| | 33,120 | | 0.000%, 9/01/33 – NPFG Insured | No Opt. Call | A | | 7,319,851 | |
| | 18,500 | | E-470 Public Highway Authority, Colorado, Toll Revenue Bonds, Series 2004A, 0.000%, 3/01/36 – NPFG Insured | No Opt. Call | A | | 3,349,055 | |
| | 755 | | Jefferson County School District R1, Colorado, General Obligation Bonds, Series 2004, 5.000%, 12/15/22 (Pre-refunded 12/15/14) – AGM Insured (UB) | 12/14 at 100.00 | AA+ (4) | | 877,348 | |
| | 3,750 | | Regional Transportation District, Colorado, Denver Transit Partners Eagle P3 Project Private Activity Bonds, Series 2010, 6.000%, 1/15/41 | 7/20 at 100.00 | Baa3 | | 3,967,350 | |
| | 1,330 | | University of Colorado Hospital Authority, Revenue Bonds, Series 1999A, 5.000%, 11/15/29 – AMBAC Insured | 11/10 at 100.00 | A3 | | 1,327,540 | |
| | 142,970 | | Total Colorado | | | | 87,463,554 | |
| | | | District of Columbia – 1.0% (0.7% of Total Investments) | | | | | |
| | 4,545 | | District of Columbia Tobacco Settlement Corporation, Tobacco Settlement Asset-Backed Bonds, Series 2001, 6.250%, 5/15/24 | 5/11 at 101.00 | BBB | | 4,563,362 | |
| | 5,000 | | Washington Convention Center Authority, District of Columbia, Senior Lien Dedicated Tax Revenue Bonds, Series 2007A, 4.500%, 10/01/30 – AMBAC Insured | 10/16 at 100.00 | A1 | | 5,000,350 | |
| | 9,545 | | Total District of Columbia | | | | 9,563,712 | |
| | | | Florida – 7.0% (4.7% of Total Investments) | | | | | |
| | 1,700 | | Beacon Tradeport Community Development District, Miami-Dade County, Florida, Special Assessment Bonds, Commercial Project, Series 2002A, 5.625%, 5/01/32 – RAAI Insured | 5/12 at 102.00 | N/R | | 1,704,012 | |
| | | | Broward County Housing Finance Authority, Florida, Multifamily Housing Revenue Bonds, Venice Homes Apartments, Series 2001A: | | | | | |
| | 1,545 | | 5.700%, 1/01/32 – AGM Insured (Alternative Minimum Tax) | 7/11 at 100.00 | AA+ | | 1,552,138 | |
| | 1,805 | | 5.800%, 1/01/36 – AGM Insured (Alternative Minimum Tax) | 7/11 at 100.00 | AA+ | | 1,813,682 | |
| | 5,300 | | Escambia County Health Facilities Authority, Florida, Revenue Bonds, Ascension Health Credit Group, Series 2003A, 5.250%, 11/15/14 | No Opt. Call | Aa1 | | 6,077,086 | |
| | 1,995 | | Florida Housing Finance Corporation, Homeowner Mortgage Revenue Bonds, Series 2000-11, 5.850%, 1/01/22 – AGM Insured (Alternative Minimum Tax) | 1/11 at 100.00 | AA+ | | 1,997,574 | |
| | 4,170 | | Florida Housing Finance Corporation, Homeowner Mortgage Revenue Bonds, Series 2006-2, 4.950%, 7/01/37 (Alternative Minimum Tax) | 1/16 at 100.00 | AA+ | | 4,230,507 | |
| | 7,000 | | Hillsborough County Aviation Authority, Florida, Revenue Bonds, Tampa International Airport, Series 2003A, 5.250%, 10/01/17 – NPFG Insured (Alternative Minimum Tax) | 10/13 at 100.00 | Aa3 | | 7,520,660 | |
| | 10,000 | | JEA, Florida, Electric System Revenue Bonds, Series 2006-3A, 5.000%, 10/01/41 – AGM Insured (UB) | 4/15 at 100.00 | AA+ | | 10,236,400 | |
| | 10,750 | | Martin County Industrial Development Authority, Florida, Industrial Development Revenue Bonds, Indiantown Cogeneration LP, Series 1994A, 7.875%, 12/15/25 (Alternative Minimum Tax) | 12/10 at 100.00 | BB+ | | 10,965,000 | |
| | 2,570 | | Miami-Dade County Housing Finance Authority, Florida, Multifamily Mortgage Revenue Bonds, Country Club Villas II Project, Series 2001-1A, 5.850%, 1/01/37 – AGM Insured (Alternative Minimum Tax) | 6/11 at 100.00 | AA+ | | 2,586,936 | |
| | 3,500 | | Miami-Dade County, Florida, Aviation Revenue Bonds, Miami International Airport, Series 2005A, 5.000%, 10/01/37 – SYNCORA GTY Insured (Alternative Minimum Tax) | 10/15 at 100.00 | A2 | | 3,367,175 | |
| | 5,000 | | Miami-Dade County, Florida, Aviation Revenue Bonds, Miami International Airport, Series 2010A-1, 5.375%, 10/01/41 | 10/20 at 100.00 | A2 | | 5,174,700 | |
| | 2,500 | | Miami-Dade County, Florida, Aviation Revenue Bonds, Miami International Airport, Series 2010B, 5.000%, 10/01/27 | 10/20 at 100.00 | A2 | | 2,606,175 | |
| | 4,700 | | Port Saint Lucie, Florida, Special Assessment Revenue Bonds, Southwest Annexation District 1B, Series 2007, 5.000%, 7/01/40 – NPFG Insured | 7/17 at 100.00 | A | | 4,561,773 | |
| | 62,535 | | Total Florida | | | | 64,393,818 | |
Nuveen Investments 23
| | Nuveen Performance Plus Municipal Fund, Inc. (continued) |
| | Portfolio of Investments October 31, 2010 |
| | Principal | | | Optional Call | | | | |
| | Amount (000) | | Description (1) | Provisions (2) | Ratings (3) | | Value | |
| | | | Georgia – 0.8% (0.6% of Total Investments) | | | | | |
| $ | 5,000 | | Atlanta, Georgia, Water and Wastewater Revenue Bonds, Series 1999A, 5.500%, 11/01/22 – FGIC Insured | No Opt. Call | A1 | $ | 5,721,350 | |
| | 2,000 | | George L. Smith II World Congress Center Authority, Atlanta, Georgia, Revenue Refunding Bonds, Domed Stadium Project, Series 2000, 5.500%, 7/01/20 – NPFG Insured (Alternative Minimum Tax) | 1/11 at 101.00 | A | | 2,022,760 | |
| | 7,000 | | Total Georgia | | | | 7,744,110 | |
| | | | Idaho – 0.1% (0.0% of Total Investments) | | | | | |
| | 260 | | Idaho Housing and Finance Association, Single Family Mortgage Bonds, Series 2000D, 6.200%, 7/01/14 (Alternative Minimum Tax) | 1/11 at 100.00 | Aa3 | | 265,195 | |
| | 275 | | Idaho Housing and Finance Association, Single Family Mortgage Bonds, Series 2000G-2, 5.950%, 7/01/25 (Alternative Minimum Tax) | 1/11 at 100.00 | Aa2 | | 289,000 | |
| | 535 | | Total Idaho | | | | 554,195 | |
| | | | Illinois – 25.8% (17.3% of Total Investments) | | | | | |
| | 10,000 | | Chicago Board of Education, Illinois, Unlimited Tax General Obligation Bonds, Dedicated Tax Revenues, Series 1998B-1, 0.000%, 12/01/19 – FGIC Insured | No Opt. Call | Aa2 | | 6,914,500 | |
| | 10,000 | | Chicago Board of Education, Illinois, Unlimited Tax General Obligation Bonds, Dedicated Tax Revenues, Series 1999A, 0.000%, 12/01/20 – FGIC Insured | No Opt. Call | Aa2 | | 6,521,100 | |
| | | | Chicago, Illinois, General Obligation Bonds, City Colleges, Series 1999: | | | | | |
| | 32,170 | | 0.000%, 1/01/21 – FGIC Insured | No Opt. Call | Aa3 | | 20,315,677 | |
| | 32,670 | | 0.000%, 1/01/22 – FGIC Insured | No Opt. Call | Aa3 | | 19,463,153 | |
| | 9,240 | | Chicago, Illinois, Revenue Bonds, Midway Airport, Series 1996A, 5.500%, 1/01/29 – NPFG Insured | 1/11 at 100.00 | A | | 9,248,316 | |
| | 1,665 | | Chicago, Illinois, Third Lien General Airport Revenue Bonds, O’Hare International Airport, Series 2005A, 5.000%, 1/01/33 – FGIC Insured | 1/16 at 100.00 | A1 | | 1,678,470 | |
| | 5,325 | | Cook County, Illinois, General Obligation Bonds, Refunding Series 2010A, 5.250%, 11/15/33 DuPage County Forest Preserve District, Illinois, General Obligation Bonds, Series 2000: | 11/20 at 100.00 | AA | | 5,707,069 | |
| | 8,000 | | 0.000%, 11/01/18 | No Opt. Call | AAA | | 6,353,120 | |
| | 15,285 | | 0.000%, 11/01/19 | No Opt. Call | AAA | | 11,543,385 | |
| | 5,000 | | Illinois Educational Facilities Authority, Revenue Bonds, University of Chicago, Refunding Series 2003A, 5.000%, 7/01/33 | 7/13 at 100.00 | Aa1 | | 5,140,700 | |
| | 1,500 | | Illinois Finance Authority, Revenue Bonds, Central DuPage Health, Series 2009B, 5.500%, 11/01/39 | 11/19 at 100.00 | AA | | 1,597,485 | |
| | 2,000 | | Illinois Finance Authority, Revenue Bonds, Children’s Memorial Hospital, Series 2008A, 5.250%, 8/15/47 – AGC Insured (UB) | 8/18 at 100.00 | AA+ | | 2,036,580 | |
| | 5,245 | | Illinois Finance Authority, Revenue Bonds, Loyola University of Chicago, Tender Option Bond Trust 1137, 9.032%, 7/01/15 (IF) | No Opt. Call | Aa1 | | 5,607,325 | |
| | 3,000 | | Illinois Finance Authority, Revenue Bonds, Memorial Health System, Series 2009, 5.500%, 4/01/34 | No Opt. Call | A+ | | 3,062,670 | |
| | 1,000 | | Illinois Finance Authority, Revenue Bonds, University of Chicago, Series 2004A, 5.000%, 7/01/34 | 7/14 at 100.00 | Aa1 | | 1,039,190 | |
| | 2,000 | | Illinois Finance Authority, Revenue Refunding Bonds, Silver Cross Hospital and Medical Centers, Series 2008A, 6.000%, 8/15/23 | 8/18 at 100.00 | BBB | | 2,191,940 | |
| | 4,590 | | Illinois Health Facilities Authority, FHA-Insured Mortgage Revenue Refunding Bonds, Sinai Health System, Series 2003, 5.150%, 2/15/37 | 8/13 at 100.00 | Aa2 | | 4,664,450 | |
| | 1,180 | | Illinois Health Facilities Authority, Revenue Bonds, Lake Forest Hospital, Series 2002A, 5.750%, 7/01/29 | 7/12 at 100.00 | AA+ | | 1,213,205 | |
| | 3,610 | | Illinois Health Facilities Authority, Revenue Bonds, Lake Forest Hospital, Series 2003, 6.000%, 7/01/33 | 7/13 at 100.00 | AA+ | | 3,735,917 | |
| | 4,580 | | Illinois Health Facilities Authority, Revenue Bonds, Midwest Care Center IX Inc., Series 2000, 6.250%, 8/20/35 | 2/11 at 102.00 | Aaa | | 4,693,034 | |
| | 1,895 | | Illinois Health Facilities Authority, Revenue Bonds, Silver Cross Hospital and Medical Centers, Series 1999, 5.250%, 8/15/15 (Mandatory put 8/15/11) | 2/11 at 100.50 | BBB | | 1,907,583 | |
| | 7,250 | | Kane, Kendall, LaSalle, and Will Counties, Illinois, Community College District 516, General Obligation Bonds, Series 2005E, 0.000%, 12/15/24 – FGIC Insured | 12/13 at 57.71 | AA+ | | 3,622,753 | |
| | Principal | | | Optional Call | | | | |
| | Amount (000) | | Description (1) | Provisions (2) | Ratings (3) | | Value | |
| | | | Illinois (continued) | | | | | |
| $ | 6,000 | | McHenry County Conservation District, Illinois, General Obligation Bonds, Series 2001A, 5.625%, 2/01/21 (Pre-refunded 2/01/11) – FGIC Insured | 2/11 at 100.00 | Aaa | $ | 6,082,680 | |
| | 5,000 | | Metropolitan Pier and Exposition Authority, Illinois, Revenue Bonds, McCormick Place Expansion Project, Series 2002A, 5.250%, 6/15/42 – NPFG Insured | 6/12 at 101.00 | AAA | | 5,050,350 | |
| | 10,650 | | Metropolitan Pier and Exposition Authority, Illinois, Revenue Bonds, McCormick Place Hospitality Facility, Series 1996A, 7.000%, 7/01/26 (ETM) | No Opt. Call | AAA | | 14,563,343 | |
| | | | Metropolitan Pier and Exposition Authority, Illinois, Revenue Refunding Bonds, McCormick Place Expansion Project, Series 1996A: | | | | | |
| | 9,400 | | 0.000%, 12/15/18 – NPFG Insured | No Opt. Call | A | | 6,707,840 | |
| | 16,570 | | 0.000%, 12/15/20 – NPFG Insured | No Opt. Call | A | | 10,324,601 | |
| | 23,550 | | 0.000%, 12/15/22 – NPFG Insured | No Opt. Call | A | | 12,789,299 | |
| | 13,000 | | 0.000%, 12/15/24 – NPFG Insured | No Opt. Call | A | | 6,225,700 | |
| | 5,100 | | Metropolitan Pier and Exposition Authority, Illinois, Revenue Refunding Bonds, McCormick Place Expansion Project, Series 1998A, 5.500%, 12/15/23 – FGIC Insured | No Opt. Call | AAA | | 5,698,995 | |
| | 5,180 | | Metropolitan Pier and Exposition Authority, Illinois, Revenue Refunding Bonds, McCormick Place Expansion Project, Series 1998A, 5.500%, 12/15/23 – FGIC Insured (ETM) | No Opt. Call | A (4) | | 6,276,761 | |
| | 3,000 | | Metropolitan Pier and Exposition Authority, Illinois, Revenue Refunding Bonds, McCormick Place Expansion Project, Series 2002B, 5.750%, 6/15/23 – NPFG Insured | 6/12 at 101.00 | AAA | | 3,216,300 | |
| | 2,685 | | Midlothian, Illinois, General Obligation Bonds, Series 2010A, 5.000%, 2/01/30 – AGM Insured | 2/20 at 100.00 | AA+ | | 2,704,574 | |
| | 17,865 | | Regional Transportation Authority, Cook, DuPage, Kane, Lake, McHenry and Will Counties, Illinois, General Obligation Bonds, Series 1999, 5.750%, 6/01/23 – AGM Insured | No Opt. Call | AA+ | | 21,194,143 | |
| | 340 | | Sherman, Illinois, GNMA Mortgage Revenue Refunding Bonds, Villa Vianney, Series 1999A, 6.450%, 10/01/29 | 4/11 at 101.00 | AAA | | 343,941 | |
| | 10,000 | | Will County Community High School District 210 Lincoln-Way, Illinois, General Obligation Bonds, Series 2006, 0.000%, 1/01/23 – AGM Insured | No Opt. Call | Aa2 | | 5,701,200 | |
| | 295,545 | | Total Illinois | | | | 235,137,349 | |
| | | | Indiana – 3.8% (2.5% of Total Investments) | | | | | |
| | 2,465 | | Danville Multi-School Building Corporation, Indiana, First Mortgage Refunding Bonds, Series 2001, 5.250%, 7/15/18 – AMBAC Insured | 7/11 at 100.00 | A | | 2,524,012 | |
| | 3,000 | | Hospital Authority of Delaware County, Indiana, Hospital Revenue Bonds, Cardinal Health System, Series 2006, 5.250%, 8/01/36 | 8/16 at 100.00 | Baa3 | | 2,780,490 | |
| | 750 | | Indiana Health Facility Financing Authority, Hospital Revenue Bonds, Clarian Health Obligation Group, Series 2006B, 5.000%, 2/15/23 | 2/16 at 100.00 | A+ | | 768,540 | |
| | 1,900 | | Indiana Health Facility Financing Authority, Hospital Revenue Refunding Bonds, Columbus Regional Hospital, Series 1993, 7.000%, 8/15/15 – AGM Insured | No Opt. Call | AA+ | | 2,169,686 | |
| | 4,320 | | Indiana Health Facility Financing Authority, Revenue Bonds, Ancilla Systems Inc. Obligated Group, Series 1997, 5.250%, 7/01/22 – NPFG Insured (ETM) | 1/11 at 100.00 | A (4) | | 4,334,904 | |
| | 3,000 | | Indiana Health Facility Financing Authority, Revenue Bonds, Community Foundation of Northwest Indiana, Series 2007, 5.500%, 3/01/37 | 3/17 at 100.00 | BBB | | 3,023,700 | |
| | 2,000 | | Indiana Health Facility Financing Authority, Revenue Bonds, Community Hospitals of Indiana, Series 2005A, 5.000%, 5/01/35 – AMBAC Insured | 5/15 at 100.00 | A | | 1,961,220 | |
| | | | Indiana Transportation Finance Authority, Highway Revenue Bonds, Series 2000: | | | | | |
| | 1,285 | | 5.375%, 12/01/25 (Pre-refunded 12/01/10) | 12/10 at 100.00 | AA+ (4) | | 1,290,872 | |
| | 6,715 | | 5.375%, 12/01/25 (Pre-refunded 12/01/10) | 12/10 at 100.00 | AA+ (4) | | 6,745,688 | |
| | 3,105 | | Indiana University, Student Fee Revenue Bonds, Series 2003O, 5.250%, 8/01/20 – FGIC Insured | 8/13 at 100.00 | Aaa | | 3,413,668 | |
| | 1,000 | | Marion County Convention and Recreational Facilities Authority, Indiana, Excise Taxes Lease Rental Revenue Refunding Senior Bonds, Series 2001A, 5.000%, 6/01/21 – NPFG Insured | 6/11 at 100.00 | A | | 1,009,130 | |
| | 2,395 | | Shelbyville Central Renovation School Building Corporation, Indiana, First Mortgage Bonds, Series 2005, 4.375%, 7/15/26 – NPFG Insured | 7/15 at 100.00 | AA+ | | 2,454,300 | |
| | 1,800 | | Sunman Dearborn High School Building Corporation, Indiana, First Mortgage Bonds, Series 2005, 5.000%, 7/15/25 – NPFG Insured | 1/15 at 100.00 | AA+ | | 1,905,138 | |
| | 33,735 | | Total Indiana | | | | 34,381,348 | |
Nuveen Investments 25
| | | Nuveen Performance Plus Municipal Fund, Inc. (continued) |
| NPP | | Portfolio of Investments October 31, 2010 |
| | Principal | | | Optional Call | | | | |
| | Amount (000) | | Description (1) | Provisions (2) | Ratings (3) | | Value | |
| | | | Iowa – 2.5% (1.7% of Total Investments) | | | | | |
| $ | 1,500 | | Iowa Finance Authority, Health Facility Revenue Bonds, Care Initiatives Project, Series 2006A, 5.500%, 7/01/21 | 7/16 at 100.00 | BB+ | $ | 1,385,685 | |
| | | | Iowa Tobacco Settlement Authority, Asset Backed Settlement Revenue Bonds, Series 2005C: | | | | | |
| | 5,000 | | 5.375%, 6/01/38 | 6/15 at 100.00 | BBB | | 4,138,900 | |
| | 4,440 | | 5.500%, 6/01/42 | 6/15 at 100.00 | BBB | | 3,471,991 | |
| | 5,400 | | 5.625%, 6/01/46 | 6/15 at 100.00 | BBB | | 4,223,826 | |
| | 4,500 | | Iowa Tobacco Settlement Authority, Tobacco Asset-Backed Revenue Bonds, Series 2005B, 5.600%, 6/01/34 | 6/17 at 100.00 | BBB | | 4,034,340 | |
| | 5,000 | | Iowa Tobacco Settlement Authority, Tobacco Settlement Asset-Backed Revenue Bonds, Series 2001B, 5.600%, 6/01/35 (Pre-refunded 6/01/11) | 6/11 at 101.00 | AAA | | 5,203,800 | |
| | 25,840 | | Total Iowa | | | | 22,458,542 | |
| | | | Kansas – 1.0% (0.7% of Total Investments) | | | | | |
| | 3,790 | | Kansas Department of Transportation, Highway Revenue Bonds, Series 2004A, 5.000%, 3/01/23 (UB) | 3/14 at 100.00 | AAA | | 4,181,204 | |
| | 3,200 | | Wyandotte County Unified School District 500, Kansas, General Obligation Bonds, Series 2001, 4.000%, 9/01/21 – AGM Insured | 9/11 at 100.00 | AA+ | | 3,299,872 | |
| | 3,730 | | Wyandotte County-Kansas City Unified Government, Kansas, Sales Tax Special Obligation Capital Appreciation Revenue Bonds Redevelopment Project Area B – Major Multi-Sport Athletic Complex Project, Subordinate Lien Series 2010B, 0.000%, 6/01/21 | No Opt. Call | N/R | | 2,097,939 | |
| | 10,720 | | Total Kansas | | | | 9,579,015 | |
| | | | Louisiana – 3.1% (2.1% of Total Investments) | | | | | |
| | 470 | | East Baton Rouge Mortgage Finance Authority, Louisiana, GNMA/FNMA Mortgage-Backed Securities Program Single Family Mortgage Revenue Refunding Bonds, Series 1997B-1, 5.750%, 10/01/26 | 4/11 at 100.50 | Aaa | | 470,597 | |
| | 4,000 | | Lafayette City and Parish, Louisiana, Utilities Revenue Bonds, Series 2004, 5.250%, 11/01/25 – NPFG Insured | 11/14 at 100.00 | A+ | | 4,361,440 | |
| | 4,750 | | Louisiana Public Facilities Authority, Revenue Bonds, Baton Rouge General Hospital, Series 2004, 5.250%, 7/01/33 – NPFG Insured | 7/14 at 100.00 | A | | 4,830,465 | |
| | | | Tobacco Settlement Financing Corporation, Louisiana, Tobacco Settlement Asset-Backed Bonds, Series 2001B: | | | | | |
| | 9,100 | | 5.500%, 5/15/30 | 5/11 at 101.00 | BBB | | 9,204,013 | |
| | 9,485 | | 5.875%, 5/15/39 | 5/11 at 101.00 | BBB | | 9,575,771 | |
| | 27,805 | | Total Louisiana | | | | 28,442,286 | |
| | | | Maine – 0.6% (0.4% of Total Investments) | | | | | |
| | 5,680 | | Portland, Maine, Airport Revenue Bonds, Series 2003A, 5.000%, 7/01/32 – AGM Insured | 7/13 at 100.00 | AA+ | | 5,797,462 | |
| | | | Maryland – 1.5% (1.0% of Total Investments) | | | | | |
| | 2,550 | | Maryland Health and Higher Educational Facilities Authority, Revenue Bonds, Washington County Hospital, Series 2008, 6.000%, 1/01/28 | No Opt. Call | BBB– | | 2,678,393 | |
| | 7,720 | | Maryland Transportation Authority, Airport Parking Revenue Bonds, Baltimore-Washington International Airport Passenger Facility, Series 2002B, 5.125%, 3/01/20 – AMBAC Insured (Alternative Minimum Tax) | 3/12 at 101.00 | A2 | | 7,947,740 | |
| | 3,010 | | Takoma Park, Maryland, Hospital Facilities Revenue Refunding and Improvement Bonds, Washington Adventist Hospital, Series 1995, 6.500%, 9/01/12 – AGM Insured (ETM) | No Opt. Call | AA+ (4) | | 3,231,536 | |
| | 13,280 | | Total Maryland | | | | 13,857,669 | |
| | | | Massachusetts – 4.3% (2.9% of Total Investments) | | | | | |
| | 6,250 | | Massachusetts Department of Transportation, Metropolitan Highway System Revenue Bonds, Senior Lien Series 2010B, 5.000%, 1/01/37 | 1/20 at 100.00 | A | | 6,530,125 | |
| | | | Massachusetts Development Finance Authority, Revenue Bonds, 100 Cambridge Street Redevelopment, M/SRBC Project, Series 2002A: | | | | | |
| | 4,000 | | 5.125%, 8/01/28 – NPFG Insured | 2/12 at 100.00 | A | | 4,020,440 | |
| | 5,625 | | 5.125%, 2/01/34 – NPFG Insured | 2/12 at 100.00 | A | | 5,629,275 | |
| | Principal | | | Optional Call | | | | |
| | Amount (000) | | Description (1) | Provisions (2) | Ratings (3) | | Value | |
| | | | Massachusetts (continued) | | | | | |
| $ | 8,730 | | Massachusetts Health and Educational Facilities Authority, Revenue Bonds, Berkshire Health System, Series 2005F, 5.000%, 10/01/19 – AGC Insured | 10/15 at 100.00 | AA+ | $ | 9,289,942 | |
| | 500 | | Massachusetts Health and Educational Facilities Authority, Revenue Bonds, CareGroup Inc., Series 2008E-1 &2, 5.125%, 7/01/38 | 7/18 at 100.00 | A3 | | 498,860 | |
| | 1,530 | | Massachusetts Health and Educational Facilities Authority, Revenue Bonds, Southcoast Health System Obligated Group, Series 1998A, 4.750%, 7/01/27 – NPFG Insured | 1/11 at 100.00 | A2 | | 1,447,227 | |
| | 5,745 | | Massachusetts Industrial Finance Agency, Resource Recovery Revenue Refunding Bonds, Ogden Haverhill Project, Series 1998A, 5.600%, 12/01/19 (Alternative Minimum Tax) | 12/10 at 100.00 | BBB | | 5,762,005 | |
| | 890 | | Massachusetts, General Obligation Bonds, Consolidated Loan, Series 2002C, 5.250%, 11/01/30 (Pre-refunded 11/01/12) | 11/12 at 100.00 | Aa1 (4) | | 973,651 | |
| | | | Massachusetts, General Obligation Bonds, Consolidated Loan, Series 2002E: | | | | | |
| | 1,255 | | 5.250%, 1/01/22 (Pre-refunded 1/01/13) – FGIC Insured | 1/13 at 100.00 | Aa1 (4) | | 1,380,600 | |
| | 3,745 | | 5.250%, 1/01/22 (Pre-refunded 1/01/13) – FGIC Insured | 1/13 at 100.00 | Aa1 (4) | | 4,119,800 | |
| | 38,270 | | Total Massachusetts | | | | 39,651,925 | |
| | | | Michigan – 4.6% (3.1% of Total Investments) | | | | | |
| | 5,000 | | Detroit, Michigan, Second Lien Sewerage Disposal System Revenue Bonds, Series 2005A, 5.000%, 7/01/35 – NPFG Insured | 7/15 at 100.00 | A1 | | 4,936,800 | |
| | 1,430 | | Michigan State Building Authority, Revenue Bonds, Facilities Program, Series 2001I, 5.000%, 10/15/24 | 10/11 at 100.00 | Aa3 | | 1,448,447 | |
| | 70 | | Michigan State Building Authority, Revenue Bonds, Facilities Program, Series 2001I, 5.000%, 10/15/24 (Pre-refunded 10/15/11) | 10/11 at 100.00 | A+ (4) | | 73,148 | |
| | 6,250 | | Michigan State Building Authority, Revenue Bonds, Refunding Series 2006IA, 0.000%, 10/15/30 – FGIC Insured | 10/16 at 50.02 | Aa3 | | 2,039,813 | |
| | 5,000 | | Michigan State Building Authority, Revenue Refunding Bonds, Facilities Program, Series 2003II, 5.000%, 10/15/29 – NPFG Insured | 10/13 at 100.00 | Aa3 | | 5,082,350 | |
| | 7,115 | | Michigan State Hospital Finance Authority, Hospital Revenue Refunding Bonds, Henry Ford Health System, Series 2003A, 5.500%, 3/01/16 (Pre-refunded 3/01/13) | 3/13 at 100.00 | A1 (4) | | 7,901,421 | |
| | 3,070 | | Michigan Strategic Fund, Collateralized Limited Obligation Pollution Control Revenue Refunding Bonds, Detroit Edison Company, Series 1999A, 5.550%, 9/01/29 – NPFG Insured (Alternative Minimum Tax) | 3/11 at 101.00 | A | | 3,079,609 | |
| | 3,050 | | Michigan Tobacco Settlement Finance Authority, Tobacco Settlement Asset-Backed Revenue Bonds, Series 2008A, 6.875%, 6/01/42 | 6/18 at 100.00 | Baa3 | | 3,070,313 | |
| | 2,500 | | Royal Oak Hospital Finance Authority, Michigan, Hospital Revenue and Refunding Bonds, William Beaumont Hospital Obligated Group, Series 2009W, 6.375%, 8/01/29 | 8/19 at 100.00 | A1 | | 2,706,075 | |
| | 1,150 | | Royal Oak Hospital Finance Authority, Michigan, Hospital Revenue Bonds, William Beaumont Hospital, Refunding Series 2009V, 8.250%, 9/01/39 | 9/18 at 100.00 | A1 | | 1,386,498 | |
| | 10,000 | | Wayne County, Michigan, Airport Revenue Bonds, Detroit Metropolitan Wayne County Airport, Series 1998A, 5.375%, 12/01/16 – NPFG Insured (Alternative Minimum Tax) | 12/10 at 100.00 | A | | 10,018,300 | |
| | 44,635 | | Total Michigan | | | | 41,742,774 | |
| | | | Minnesota – 2.6% (1.8% of Total Investments) | | | | | |
| | 3,000 | | Minneapolis-St. Paul Metropolitan Airports Commission, Minnesota, Subordinate Airport Revenue Bonds, Series 2001C, 5.250%, 1/01/26 (Pre-refunded 1/01/11) – FGIC Insured | 1/11 at 100.00 | A (4) | | 3,025,920 | |
| | 17,280 | | St. Paul Housing and Redevelopment Authority, Minnesota, Sales Tax Revenue Refunding Bonds, Civic Center Project, Series 1996, 7.100%, 11/01/23 – AGM Insured | 11/15 at 103.00 | AA+ | | 21,245,933 | |
| | 20,280 | | Total Minnesota | | | | 24,271,853 | |
| | | | Mississippi – 1.3% (0.9% of Total Investments) | | | | | |
| | 9,750 | | Mississippi Business Finance Corporation, Pollution Control Revenue Refunding Bonds, System Energy Resources Inc. Project, Series 1998, 5.875%, 4/01/22 | 4/11 at 100.00 | BBB | | 9,798,750 | |
| | 2,475 | | Mississippi Hospital Equipment and Facilities Authority, Revenue Bonds, Baptist Memorial Healthcare, Series 2004B-1, 5.000%, 9/01/24 (UB) | 9/14 at 100.00 | AA | | 2,569,273 | |
| | 12,225 | | Total Mississippi | | | | 12,368,023 | |
Nuveen Investments 27
| | | Nuveen Performance Plus Municipal Fund, Inc. (continued) |
| NPP | | Portfolio of Investments October 31, 2010 |
| | Principal | | | Optional Call | | | | |
| | Amount (000) | | Description (1) | Provisions (2) | Ratings (3) | | Value | |
| | | | Missouri – 1.6% (1.1% of Total Investments) | | | | | |
| $ | 2,000 | | Bi-State Development Agency of the Missouri-Illinois Metropolitan District, Mass Transit Sales Tax Appropriation Bonds, Metrolink Cross County Extension Project, Series 2002B, 5.000%, 10/01/32 – AGM Insured | 10/13 at 100.00 | AA+ | $ | 2,032,220 | |
| | 6,350 | | Kansas City, Missouri, Airport Revenue Bonds, General Improvement Projects, Series 2003B, 5.250%, 9/01/17 – FGIC Insured | 9/12 at 100.00 | A+ | | 6,739,573 | |
| | 1,845 | | Missouri Health and Educational Facilities Authority, Revenue Bonds, BJC Health System, Series 2003, 5.250%, 5/15/18 | 5/13 at 100.00 | AA | | 1,984,537 | |
| | 3,815 | | Missouri Health and Educational Facilities Authority, Revenue Bonds, SSM Healthcare System, Series 2001A, 5.250%, 6/01/28 (Pre-refunded 6/01/11) – AMBAC Insured | 6/11 at 101.00 | AA– (4) | | 3,961,725 | |
| | 14,010 | | Total Missouri | | | | 14,718,055 | |
| | | | Montana – 0.6% (0.4% of Total Investments) | | | | | |
| | 335 | | Montana Board of Housing, Single Family Mortgage Bonds, Series 2000A-2, 6.450%, 6/01/29 (Alternative Minimum Tax) | 12/10 at 100.00 | AA+ | | 340,869 | |
| | 4,795 | | Montana Higher Education Student Assistance Corporation, Student Loan Revenue Bonds, Subordinate Series 1998B, 5.500%, 12/01/31 (Alternative Minimum Tax) | 12/10 at 100.00 | A2 | | 4,699,244 | |
| | 5,130 | | Total Montana | | | | 5,040,113 | |
| | | | Nebraska – 0.1% (0.1% of Total Investments) | | | | | |
| | 675 | | Nebraska Investment Finance Authority, Single Family Housing Revenue Bonds, Series 2000E, 5.850%, 9/01/20 (Alternative Minimum Tax) | 3/11 at 100.00 | AAA | | 704,498 | |
| | | | Nevada – 5.1% (3.5% of Total Investments) | | | | | |
| | 10,900 | | Clark County School District, Nevada, General Obligation Bonds, Series 2002C, 5.500%, 6/15/19 (Pre-refunded 6/15/12) – NPFG Insured | 6/12 at 100.00 | AA (4) | | 11,803,174 | |
| | 24,195 | | Clark County, Nevada, Passenger Facility Charge Revenue Bonds, Las Vegas-McCarran International Airport, Series 2010A, 5.250%, 7/01/42 | 1/20 at 100.00 | Aa3 | | 25,084,408 | |
| | | | Director of Nevada State Department of Business and Industry, Revenue Bonds, Las Vegas Monorail Project, First Tier, Series 2000: | | | | | |
| | 3,500 | | 0.000%, 1/01/21 – AMBAC Insured | No Opt. Call | N/R | | 412,230 | |
| | 2,780 | | 0.000%, 1/01/28 – AMBAC Insured | No Opt. Call | N/R | | 214,449 | |
| | 6,980 | | 5.375%, 1/01/40 – AMBAC Insured (5) | 1/11 at 100.00 | N/R | | 1,466,707 | |
| | 5,000 | | Reno, Nevada, Health Facilities Revenue Bonds, Catholic Healthcare West, Series 2007A, 5.250%, 7/01/31 | 7/17 at 100.00 | A | | 5,144,050 | |
| | 2,500 | | Reno, Nevada, Health Facility Revenue Bonds, Catholic Healthcare West, Trust 2634, 18.114%, 7/01/31 – BHAC Insured (IF) | 7/17 at 100.00 | AA+ | | 2,983,300 | |
| | 55,855 | | Total Nevada | | | | 47,108,318 | |
| | | | New Hampshire – 1.7% (1.2% of Total Investments) | | | | | |
| | 5,000 | | New Hampshire Business Finance Authority, Revenue Bonds, Elliot Hospital Obligated Group Issue, Series 2009A, 6.125%, 10/01/39 | 10/19 at 100.00 | BBB+ | | 5,182,100 | |
| | | | New Hampshire Housing Finance Authority, FHLMC Multifamily Housing Remarketed Revenue Bonds, Countryside LP, Series 1994: | | | | | |
| | 3,725 | | 6.000%, 7/01/18 (Alternative Minimum Tax) | 1/11 at 101.00 | Aaa | | 3,768,098 | |
| | 6,945 | | 6.100%, 7/01/24 (Alternative Minimum Tax) | 1/11 at 101.00 | Aaa | | 7,022,923 | |
| | 15,670 | | Total New Hampshire | | | | 15,973,121 | |
| | | | New Jersey – 6.5% (4.4% of Total Investments) | | | | | |
| | 2,110 | | New Jersey Higher Education Assistance Authority, Student Loan Revenue Bonds, Series 2000A, 6.000%, 6/01/13 – NPFG Insured (Alternative Minimum Tax) | 12/10 at 101.00 | Aaa | | 2,137,768 | |
| | 4,500 | | New Jersey Transportation Trust Fund Authority, Transportation System Bonds, Series 2001C, 5.500%, 12/15/18 – AGM Insured | No Opt. Call | AA+ | | 5,386,995 | |
| | 9,250 | | New Jersey Transportation Trust Fund Authority, Transportation System Bonds, Series 2003C, 5.500%, 6/15/23 (Pre-refunded 6/15/13) | 6/13 at 100.00 | AAA | | 10,421,883 | |
| | | | New Jersey Transportation Trust Fund Authority, Transportation System Bonds, Series 2006C: | | | | | |
| | 35,000 | | 0.000%, 12/15/29 – AGM Insured | No Opt. Call | AA+ | | 12,873,350 | |
| | 10,000 | | 0.000%, 12/15/30 – FGIC Insured | No Opt. Call | AA– | | 3,297,900 | |
| | Principal | | | Optional Call | | | | |
| | Amount (000) | | Description (1) | Provisions (2) | Ratings (3) | | Value | |
| | | | New Jersey (continued) | | | | | |
| $ | 10,000 | | New Jersey Turnpike Authority, Revenue Bonds, Series 2003A, 5.000%, 1/01/20 – AGM Insured (UB) | 7/13 at 100.00 | AA+ | $ | 10,820,100 | |
| | 8,920 | | Tobacco Settlement Financing Corporation, New Jersey, Tobacco Settlement Asset-Backed Bonds, Series 2002, 5.750%, 6/01/32 (Pre-refunded 6/01/12) | 6/12 at 100.00 | AAA | | 9,479,552 | |
| | 4,450 | | Tobacco Settlement Financing Corporation, New Jersey, Tobacco Settlement Asset-Backed Bonds, Series 2003, 6.750%, 6/01/39 (Pre-refunded 6/01/13) | 6/13 at 100.00 | AAA | | 5,144,734 | |
| | 84,230 | | Total New Jersey | | | | 59,562,282 | |
| | | | New York – 4.3% (2.9% of Total Investments) | | | | | |
| | 5,500 | | Dormitory Authority of the State of New York, FHA-Insured Mortgage Revenue Bonds, Kaleida Health, Series 2004, 5.050%, 2/15/25 | 2/14 at 100.00 | AAA | | 5,785,395 | |
| | 1,740 | | Dormitory Authority of the State of New York, Insured Revenue Bonds, 853 Schools Program, Gateway-Longview Inc., Series 1998A, 5.500%, 7/01/18 – AMBAC Insured | 1/11 at 100.00 | N/R | | 1,742,279 | |
| | 1,500 | | Dormitory Authority of the State of New York, Revenue Bonds, St. Barnabas Hospital, Series 1997, 5.450%, 8/01/35 – AMBAC Insured | 2/11 at 100.00 | N/R | | 1,506,090 | |
| | 13,220 | | Metropolitan Transportation Authority, New York, Dedicated Tax Fund Bonds, Series 2002A, 5.500%, 11/15/26 – AGM Insured | 11/12 at 100.00 | AA+ | | 14,106,269 | |
| | 13,600 | | Metropolitan Transportation Authority, New York, Transportation Revenue Bonds, Series 2006B, 4.500%, 11/15/32 – AGM Insured (UB) | 11/16 at 100.00 | AA+ | | 13,685,544 | |
| | 3,000 | | New York State Energy Research and Development Authority, Pollution Control Revenue Bonds, Rochester Gas and Electric Corporation, Series 1998A, 5.950%, 9/01/33 – NPFG Insured (Alternative Minimum Tax) | 3/11 at 100.00 | A | | 3,001,530 | |
| | 38,560 | | Total New York | | | | 39,827,107 | |
| | | | North Carolina – 1.6% (1.1% of Total Investments) | | | | | |
| | 5,500 | | Charlotte-Mecklenberg Hospital Authority, North Carolina, Carolinas HealthCare System Revenue Bonds, Series 2008A, 5.000%, 1/15/39 | 1/18 at 100.00 | AA– | | 5,681,060 | |
| | 4,900 | | Charlotte-Mecklenburg Hospital Authority, North Carolina, Healthcare System Revenue Bonds, DBA Carolinas Healthcare System, Series 2005A, 5.000%, 1/15/45 (Pre-refunded 1/15/15) | 1/15 at 100.00 | AAA | | 5,682,432 | |
| | 3,500 | | North Carolina Medical Care Commission, Healthcare Facilities Revenue Bonds, Duke University Health System, Series 2009A, 5.000%, 6/01/42 | 6/19 at 100.00 | AA | | 3,653,825 | |
| | 13,900 | | Total North Carolina | | | | 15,017,317 | |
| | | | Ohio – 6.1% (4.1% of Total Investments) | | | | | |
| | 10,000 | | American Municipal Power Ohio Inc., General Revenue Bonds, Prairie State Energy Campus Project Series 2008A, 5.250%, 2/15/43 | 2/18 at 100.00 | A1 | | 10,379,400 | |
| | | | Buckeye Tobacco Settlement Financing Authority, Ohio, Tobacco Settlement Asset-Backed Revenue Bonds, Senior Lien, Series 2007A-2: | | | | | |
| | 5,660 | | 5.125%, 6/01/24 | 6/17 at 100.00 | BBB | | 4,945,821 | |
| | 5,640 | | 5.875%, 6/01/30 | 6/17 at 100.00 | BBB | | 4,752,151 | |
| | 4,875 | | 5.750%, 6/01/34 | 6/17 at 100.00 | BBB | | 3,887,715 | |
| | 3,045 | | 6.000%, 6/01/42 | 6/17 at 100.00 | BBB | | 2,395,958 | |
| | 14,830 | | 5.875%, 6/01/47 | 6/17 at 100.00 | BBB | | 11,348,806 | |
| | 5,300 | | Buckeye Tobacco Settlement Financing Authority, Ohio, Tobacco Settlement Asset-Backed Revenue Bonds, Senior Lien, Series 2007A-3, 0.000%, 6/01/37 | 6/22 at 100.00 | Baa3 | | 3,678,677 | |
| | 6,720 | | Cleveland, Ohio, Airport System Revenue Bonds, Series 2001A, 5.000%, 1/01/31 – AGM Insured | 1/11 at 100.00 | AA+ | | 6,722,957 | |
| | 3,650 | | Montgomery County, Ohio, Revenue Bonds, Catholic Health Initiatives, Series 2004A, 5.000%, 5/01/30 | 5/14 at 100.00 | AA | | 3,774,319 | |
| | 3,425 | | Ohio Municipal Electric Generation Agency, Beneficial Interest Certificates, Belleville Hydroelectric Project – Joint Venture 5, Series 2004, 5.000%, 2/15/19 – AMBAC Insured | 2/14 at 100.00 | A1 | | 3,659,304 | |
| | 63,145 | | Total Ohio | | | | 55,545,108 | |
Nuveen Investments 29
| | | Nuveen Performance Plus Municipal Fund, Inc. (continued) |
| NPP | | Portfolio of Investments October 31, 2010 |
| | Principal | | | Optional Call | | | | |
| | Amount (000) | | Description (1) | Provisions (2) | Ratings (3) | | Value | |
| | | | Pennsylvania – 3.5% (2.3% of Total Investments) | | | | | |
| $ | 1,250 | | Allegheny County Hospital Development Authority, Pennsylvania, University of Pittsburgh Medical Center Revenue Bonds, Series 2009A, 5.500%, 8/15/34 | No Opt. Call | Aa3 | $ | 1,306,600 | |
| | | | Bethlehem Authority, Northampton and Lehigh Counties, Pennsylvania, Guaranteed Water Revenue Bonds, Series 1998: | | | | | |
| | 3,125 | | 0.000%, 5/15/22 – AGM Insured | No Opt. Call | AA+ | | 2,037,844 | |
| | 3,125 | | 0.000%, 5/15/23 – AGM Insured | No Opt. Call | AA+ | | 1,939,000 | |
| | 3,135 | | 0.000%, 5/15/24 – AGM Insured | No Opt. Call | AA+ | | 1,853,036 | |
| | 3,155 | | 0.000%, 5/15/26 – AGM Insured | No Opt. Call | AA+ | | 1,673,759 | |
| | 4,145 | | 0.000%, 11/15/26 – AGM Insured | No Opt. Call | AA+ | | 2,154,571 | |
| | 2,800 | | 0.000%, 5/15/28 – AGM Insured | No Opt. Call | AA+ | | 1,329,664 | |
| | 3,000 | | 0.000%, 11/15/28 – AGM Insured | No Opt. Call | AA+ | | 1,394,730 | |
| | 2,800 | | Pennsylvania Economic Development Financing Authority, Senior Lien Resource Recovery Revenue Bonds, Northampton Generating Project, Series 1994A, 6.500%, 1/01/13 (Alternative Minimum Tax) | 1/11 at 100.00 | CC | | 1,745,968 | |
| | 100 | | Pennsylvania Economic Development Financing Authority, Subordinate Resource Recovery Revenue Bonds, Northampton Generating Project, Series 1994C, 6.875%, 1/01/11 (Alternative Minimum Tax) (5) | No Opt. Call | N/R | | 27,250 | |
| | 5,000 | | Pennsylvania Turnpike Commission, Turnpike Subordinate Revenue Bonds, Series 2009C, 0.000%, 6/01/33 – AGM Insured | 6/26 at 100.00 | AA+ | | 4,093,800 | |
| | 11,890 | | Philadelphia Hospitals and Higher Education Facilities Authority, Pennsylvania, Health System Revenue Bonds, Jefferson Health System, Series 2010B, 5.000%, 5/15/40 | 5/20 at 100.00 | AA | | 12,263,108 | |
| | 43,525 | | Total Pennsylvania | | | | 31,819,330 | |
| | | | Puerto Rico – 3.2% (2.1% of Total Investments) | | | | | |
| | 13,125 | | Puerto Rico Sales Tax Financing Corporation, Sales Tax Revenue Bonds, First Subordinate Series 2010A, 0.000%, 8/01/33 | 8/29 at 100.00 | A+ | | 9,022,781 | |
| | 8,625 | | Puerto Rico Sales Tax Financing Corporation, Sales Tax Revenue Bonds, First Subordinate Series 2010C, 5.250%, 8/01/41 | 8/20 at 100.00 | A+ | | 9,019,680 | |
| | | | Puerto Rico Sales Tax Financing Corporation, Sales Tax Revenue Bonds, Series 2007A: | | | | | |
| | 25,000 | | 0.000%, 8/01/47 – AMBAC Insured | No Opt. Call | Aa2 | | 2,735,750 | |
| | 64,335 | | 0.000%, 8/01/54 – AMBAC Insured | No Opt. Call | Aa2 | | 4,131,594 | |
| | 3,750 | | Puerto Rico Sales Tax Financing Corporation, Sales Tax Revenue Bonds, Tender Option Bonds Trust 3101, 17.962%, 8/01/57 (IF) | 8/17 at 100.00 | Aa2 | | 4,414,950 | |
| | 114,835 | | Total Puerto Rico | | | | 29,324,755 | |
| | | | Rhode Island – 0.7% (0.4% of Total Investments) | | | | | |
| | 2,000 | | Kent County Water Authority, Rhode Island, General Revenue Bonds, Series 2002A, 5.000%, 7/15/23 – NPFG Insured | 7/12 at 100.00 | A | | 2,098,880 | |
| | | | Rhode Island Health and Educational Building Corporation, Revenue Refunding Bonds, Salve Regina University, Series 2002: | | | | | |
| | 1,260 | | 5.250%, 3/15/17 – RAAI Insured | 3/12 at 101.00 | N/R | | 1,300,333 | |
| | 1,080 | | 5.250%, 3/15/18 – RAAI Insured | 3/12 at 101.00 | N/R | | 1,110,974 | |
| | 1,600 | | Rhode Island Tobacco Settlement Financing Corporation, Tobacco Settlement Asset-Backed Bonds, Series 2002A, 6.125%, 6/01/32 | 6/12 at 100.00 | BBB | | 1,609,856 | |
| | 5,940 | | Total Rhode Island | | | | 6,120,043 | |
| | | | South Carolina – 2.8% (1.8% of Total Investments) | | | | | |
| | 2,625 | | Medical University Hospital Authority, South Carolina, FHA-Insured Mortgage Revenue Bonds, Series 2004A, 5.250%, 2/15/25 – NPFG Insured | 8/14 at 100.00 | A | | 2,771,081 | |
| | | | Piedmont Municipal Power Agency, South Carolina, Electric Revenue Bonds, Series 2004A-2: | | | | | |
| | 26,955 | | 0.000%, 1/01/31 – AMBAC Insured | No Opt. Call | A– | | 9,129,119 | |
| | 14,700 | | 0.000%, 1/01/32 – AMBAC Insured | No Opt. Call | A– | | 4,689,300 | |
| | 8,330 | | Tobacco Settlement Revenue Management Authority, South Carolina, Tobacco Settlement Asset-Backed Bonds, Series 2001B, 6.000%, 5/15/22 (Pre-refunded 5/15/11) | 5/11 at 101.00 | BBB (4) | | 8,580,483 | |
| | 52,610 | | Total South Carolina | | | | 25,169,983 | |
| | Principal | | | Optional Call | | | | |
| | Amount (000) | | Description (1) | Provisions (2) | Ratings (3) | | Value | |
| | | | Tennessee – 1.3% (0.9% of Total Investments) | | | | | |
| $ | 2,860 | | Johnson City Health and Educational Facilities Board, Tennessee, Hospital Revenue Refunding and Improvement Bonds, Johnson City Medical Center, Series 1998C, 5.125%, 7/01/25 (Pre-refunded 7/01/23) – NPFG Insured | 7/23 at 100.00 | A (4) | $ | 2,881,650 | |
| | 600 | | Memphis-Shelby County Airport Authority, Tennessee, Airport Revenue Bonds, Series 1999D, 6.000%, 3/01/24 – AMBAC Insured (Alternative Minimum Tax) | 3/11 at 100.00 | A2 | | 604,308 | |
| | 6,000 | | Metropolitan Government of Nashville-Davidson County Health and Educational Facilities Board, Tennessee, Revenue Refunding and Improvement Bonds, Meharry Medical College, Series 1996, 6.000%, 12/01/19 – AMBAC Insured | 12/17 at 100.00 | N/R | | 6,942,780 | |
| | 2,000 | | Sullivan County Health Educational and Housing Facilities Board, Tennessee, Revenue Bonds, Wellmont Health System, Refunding Series 2006A, 5.440%, 9/01/32 | 3/13 at 100.00 | N/R | | 1,924,980 | |
| | 11,460 | | Total Tennessee | | | | 12,353,718 | |
| | | | Texas – 7.2% (4.8% of Total Investments) | | | | | |
| | 5,000 | | Bexar Metropolitan Water District, Texas, Waterworks System Revenue Bonds, Series 2006, 5.000%, 5/01/35 – NPFG Insured | 5/16 at 100.00 | A1 | | 5,070,800 | |
| | 2,500 | | Capital Area Cultural Education Facilities Finance Corporation, Texas, Revenue Bonds, The Roman Catholic Diocese of Austin, Series 2005B. Remarketed, 6.125%, 4/01/45 | 4/20 at 100.00 | Baa2 | | 2,569,150 | |
| | | | Central Texas Regional Mobility Authority, Travis and Williamson Counties, Toll Road Revenue Bonds, Series 2005: | | | | | |
| | 4,000 | | 5.000%, 1/01/35 – FGIC Insured | 1/15 at 100.00 | A | | 3,847,760 | |
| | 13,000 | | 5.000%, 1/01/45 – FGIC Insured | 1/15 at 100.00 | A | | 12,249,770 | |
| | 1,275 | | Harris County-Houston Sports Authority, Texas, Junior Lien Revenue Refunding Bonds, Series 2001B, 5.250%, 11/15/40 – NPFG Insured | 11/11 at 100.00 | A | | 1,245,025 | |
| | 4,000 | | Houston Community College System, Texas, Limited Tax General Obligation Bonds, Series 2003, 5.000%, 2/15/27 – AMBAC Insured (UB) | 2/13 at 100.00 | AA+ | | 4,113,600 | |
| | 3,885 | | Houston Independent School District, Public Facility Corporation, Harris County, Texas, Lease Revenue Bonds, Cesar E. Chavez High School, Series 1998A, 0.000%, 9/15/19 – AMBAC Insured | No Opt. Call | AA | | 2,898,249 | |
| | 1,600 | | Houston, Texas, Senior Lien Airport System Revenue Bonds, Refunding Series 2009A, 5.500%, 7/01/39 | 7/18 at 100.00 | AA– | | 1,732,400 | |
| | 33,855 | | Leander Independent School District, Williamson and Travis Counties, Texas, General Obligation Bonds, Series 2006, 0.000%, 8/15/40 | 8/14 at 23.67 | AAA | | 6,643,028 | |
| | 19,300 | | Leander Independent School District, Williamson and Travis Counties, Texas, General Obligation Bonds, Series 2008, 0.000%, 8/15/41 | 8/17 at 24.20 | AAA | | 3,306,090 | |
| | | | Leander Independent School District, Williamson and Travis Counties, Texas, Unlimited Tax School Building and Refunding Bonds, Series 1998: | | | | | |
| | 4,930 | | 0.000%, 8/15/20 | 2/11 at 59.45 | AAA | | 2,894,157 | |
| | 3,705 | | 0.000%, 8/15/22 | 2/11 at 52.98 | AAA | | 1,934,529 | |
| | 3,480 | | Pearland, Texas, General Obligation Bonds, Series 2002, 5.000%, 3/01/27 (Pre-refunded 3/01/12) – FGIC Insured | 3/12 at 100.00 | Aaa | | 3,692,454 | |
| | 6,000 | | Spring Branch Independent School District, Harris County, Texas, Limited Tax Schoolhouse and Refunding Bonds, Series 2001, 5.125%, 2/01/26 (Pre-refunded 2/01/11) | 2/11 at 100.00 | AAA | | 6,075,060 | |
| | 2,890 | | Tarrant County Cultural Education Facilities Finance Corporation, Texas, Hospital Revenue Bonds, Scott & White HealthCare Project, Series 2010, 5.500%, 8/15/45 | 8/20 at 100.00 | A1 | | 2,940,113 | |
| | 4,000 | | Tarrant Regional Water District, Texas, Water Revenue Refunding and Improvement Bonds, Series 1999, 5.000%, 3/01/22 – AGM Insured | 3/13 at 100.00 | AAA | | 4,303,920 | |
| | 113,420 | | Total Texas | | | | 65,516,105 | |
| | | | Utah – 1.2% (0.8% of Total Investments) | | | | | |
| | 3,000 | | Riverton, Utah, Hospital Revenue Bonds, IHC Health Services, Inc., Series 2009, 5.000%, 8/15/41 | 8/19 at 100.00 | AA+ | | 3,127,680 | |
| | 1,645 | | Utah Housing Corporation, Single Family Mortgage Bonds, Series 2002A-1, 5.300%, 7/01/18 (Alternative Minimum Tax) | 1/12 at 100.00 | AA– | | 1,685,122 | |
| | 440 | | Utah Housing Finance Agency, Single Family Mortgage Bonds, Series 2000D-1, 6.050%, 7/01/14 (Alternative Minimum Tax) | 1/11 at 100.00 | AA– | | 448,488 | |
Nuveen Investments 31
| | | Nuveen Performance Plus Municipal Fund, Inc. (continued) |
| NPP | | Portfolio of Investments October 31, 2010 |
| | Principal | | | Optional Call | | | | |
| | Amount (000) | | Description (1) | Provisions (2) | Ratings (3) | | Value | |
| | | | Utah (continued) | | | | | |
| $ | 500 | | Utah Housing Finance Agency, Single Family Mortgage Bonds, Series 2000E-1, Class II, 6.150%, 1/01/27 (Alternative Minimum Tax) | 1/11 at 100.00 | AA | $ | 500,560 | |
| | 540 | | Utah Housing Finance Agency, Single Family Mortgage Bonds, Series 2000E-1, Class III, 6.000%, 1/01/15 (Alternative Minimum Tax) | 1/11 at 100.00 | AA– | | 550,286 | |
| | 680 | | Utah Housing Finance Agency, Single Family Mortgage Bonds, Series 2001A-2, 5.650%, 7/01/27 (Alternative Minimum Tax) | 7/11 at 100.00 | AA | | 684,710 | |
| | 500 | | Utah Housing Finance Agency, Single Family Mortgage Bonds, Series 2001B-1, 5.750%, 7/01/19 (Alternative Minimum Tax) | 1/11 at 100.00 | Aaa | | 520,615 | |
| | 3,000 | | Utah Water Finance Agency, Revenue Bonds, Pooled Loan Financing Program, Series 2002C, 5.250%, 10/01/28 (Pre-refunded 10/01/12) – AMBAC Insured | 10/12 at 100.00 | N/R (4) | | 3,268,320 | |
| | 10,305 | | Total Utah | | | | 10,785,781 | |
| | | | Virgin Islands – 0.8% (0.5% of Total Investments) | | | | | |
| | 4,700 | | Virgin Islands Public Finance Authority, Gross Receipts Taxes Loan Note, Series 2003, 5.000%, 10/01/33 – RAAI Insured | 10/14 at 100.00 | BBB+ | | 4,716,402 | |
| | 2,500 | | Virgin Islands Public Finance Authority, Revenue Bonds, Refinery Project – Hovensa LLC, Series 2003, 6.125%, 7/01/22 (Alternative Minimum Tax) | 1/14 at 100.00 | Baa3 | | 2,535,974 | |
| | 7,200 | | Total Virgin Islands | | | | 7,252,376 | |
| | | | Virginia – 2.2% (1.5% of Total Investments) | | | | | |
| | 10,500 | | Metropolitan Washington DC Airports Authority, Virginia, Dulles Toll Road Revenue Bonds, Series 2009C, 0.000%, 10/01/41 – AGC Insured | 10/26 at 100.00 | AA+ | | 8,129,520 | |
| | 18,000 | | Metropolitan Washington DC Airports Authority, Virginia, Dulles Toll Road Revenue Bonds, Dulles Metrorail Capital Appreciation, Series 2010B, 0.000%, 10/01/44 | 10/28 at 100.00 | BBB+ | | 11,625,120 | |
| | 28,500 | | Total Virginia | | | | 19,754,640 | |
| | | | Washington – 4.9% (3.3% of Total Investments) | | | | | |
| | 12,235 | | Chelan County Public Utility District 1, Washington, Columbia River-Rock Island Hydro-Electric System Revenue Refunding Bonds, Series 1997A, 0.000%, 6/01/26 – NPFG Insured | No Opt. Call | AA | | 5,984,872 | |
| | | | Cowlitz County Public Utilities District 1, Washington, Electric Production Revenue Bonds, Series 2004: | | | | | |
| | 465 | | 5.000%, 9/01/22 – FGIC Insured | 9/14 at 100.00 | A1 | | 487,784 | |
| | 3,100 | | 5.000%, 9/01/28 – FGIC Insured | 9/14 at 100.00 | A1 | | 3,189,124 | |
| | 5,000 | | Energy Northwest, Washington, Electric Revenue Refunding Bonds, Nuclear Project 1, Series 2003A, 5.500%, 7/01/16 (UB) | 7/13 at 100.00 | AAA | | 5,574,850 | |
| | 2,000 | | Washington State Health Care Facilities Authority, Revenue Bonds, Fred Hutchinson Cancer Research Center, Series 2009A, 6.000%, 1/01/33 | 7/19 at 100.00 | A | | 2,104,680 | |
| | 10,000 | | Washington State Healthcare Facilities Authority, Revenue Bonds, Providence Health Care Services, Series 2006A, 4.625%, 10/01/34 – FGIC Insured (UB) | 10/16 at 100.00 | AA | | 10,079,500 | |
| | 5,000 | | Washington State Housing Finance Commission, Non-Profit Housing Revenue Bonds, Kline Galland Center, Series 1999, 6.000%, 7/01/29 – RAAI Insured | 1/11 at 100.50 | N/R | | 5,011,900 | |
| | 12,000 | | Washington, Motor Vehicle Fuel Tax General Obligation Bonds, Series 2001D, 5.250%, 1/01/26 (Pre-refunded 1/01/11) | 1/11 at 100.00 | AA+ (4) | | 12,103,680 | |
| | 49,800 | | Total Washington | | | | 44,536,390 | |
| | | | West Virginia – 0.6% (0.4% of Total Investments) | | | | | |
| | 5,000 | | Mason County, West Virginia, Pollution Control Revenue Bonds, Appalachian Power Company, Series 2003L, 5.500%, 10/01/22 | 10/11 at 100.00 | BBB | | 5,063,900 | |
32 Nuveen Investments
| | Principal | | | Optional Call | | | | |
| | Amount (000) | | Description (1) | Provisions (2) | Ratings (3) | | Value | |
| | | | Wisconsin – 2.1% (1.4% of Total Investments) | | | | | |
| $ | 11,620 | | Wisconsin Health and Educational Facilities Authority, Revenue Bonds, Marshfield Clinic, Series 1999, 6.250%, 2/15/29 – RAAI Insured | 2/11 at 100.00 | BBB+ | $ | 11,638,824 | |
| | 7,850 | | Wisconsin Housing and Economic Development Authority, Home Ownership Revenue Bonds, Series 2005C, 4.875%, 3/01/36 (Alternative Minimum Tax) (UB) | 9/14 at 100.00 | AA | | 7,867,191 | |
| | 19,470 | | Total Wisconsin | | | | 19,506,015 | |
| $ | 1,711,060 | | Total Investments (cost $1,299,836,945) – 148.6% | | | | 1,360,959,631 | |
| | | | Floating Rate Obligations – (4.6)% | | | | (42,325,000) | |
| | | | Other Assets Less Liabilities –1.8% | | | | 17,416,998 | |
| | | | Auction Rate Preferred Shares, at Liquidation Value – (45.8)% (6) | | | | (419,900,000) | |
| | | | Net Assets Applicable to Common Shares – 100% | | | $ | 916,151,629 | |
| (1) | | All percentages shown in the Portfolio of Investments are based on net assets applicable to Common shares unless otherwise noted. |
| (2) | | Optional Call Provisions (not covered by the report of independent registered public accounting firm): Dates (month and year) and prices of the earliest optional call or redemption. There may be other call provisions at varying prices at later dates. Certain mortgage-backed securities may be subject to periodic principal paydowns. |
| (3) | | Ratings (not covered by the report of independent registered public accounting firm): Using the highest of Standard & Poor’s Group (“Standard & Poor’s”), Moody’s Investor Service, Inc. (“Moody’s”) or Fitch, Inc. (“Fitch”) rating. Ratings below BBB by Standard & Poor’s, Baa by Moody’s or BBB by Fitch are considered to be below investment grade. Holdings designated N/R are not rated by any of these national rating agencies. |
| (4) | | Backed by an escrow or trust containing sufficient U.S. Government or U.S. Government agency securities, which ensure the timely payment of principal and interest. Such investments are normally considered to be equivalent to AAA rated securities. |
| (5) | | The Fund’s Adviser has concluded this issue is not likely to meet its future interest payment obligations and has directed the Fund’s custodian to cease accruing additional income on the Fund’s records. |
| (6) | | Auction Rate Preferred Shares, at Liquidation Value as a percentage of Total Investments is 30.9%. |
| N/R | | Not rated. |
| (ETM) | | Escrowed to maturity. |
| (IF) | | Inverse floating rate investment. |
| (UB) | | Underlying bond of an inverse floating rate trust reflected as a financing transaction. See Notes to Financial Statements, Footnote 1 – General Information and Significant Accounting Policies, Inverse Floating Rate Securities for more information. |
See accompanying notes to financial statements.
Nuveen Investments 33
| | | Nuveen Municipal Advantage Fund, Inc. |
| NMA | | Portfolio of Investments |
October 31, 2010
| | Principal | | | Optional Call | | | | |
| | Amount (000) | | Description (1) | Provisions (2) | Ratings (3) | | Value | |
| | | | Alabama – 0.8% (0.5% of Total Investments) | | | | | |
| $ | 5,155 | | Phenix City Industrial Development Board, Alabama, Environmental Improvement Revenue Bonds, MeadWestvaco Corporation, Series 2002A, 6.350%, 5/15/35 (Alternative Minimum Tax) | 5/12 at 100.00 | BBB | $ | 5,084,222 | |
| | | | Alaska – 0.9% (0.6% of Total Investments) | | | | | |
| | | | Alaska Housing Finance Corporation, General Housing Purpose Bonds, Series 2005A: | | | | | |
| | 1,125 | | 5.250%, 12/01/34 – FGIC Insured (UB) | 12/14 at 100.00 | AA | | 1,163,363 | |
| | 1,280 | | 5.250%, 12/01/41 – FGIC Insured (UB) | 12/14 at 100.00 | AA | | 1,318,323 | |
| | | | Northern Tobacco Securitization Corporation, Alaska, Tobacco Settlement Asset-Backed Bonds, Series 2006A: | | | | | |
| | 850 | | 4.625%, 6/01/23 | 6/14 at 100.00 | Baa3 | | 834,462 | |
| | 3,250 | | 5.000%, 6/01/46 | 6/14 at 100.00 | Baa3 | | 2,284,198 | |
| | 6,505 | | Total Alaska | | | | 5,600,346 | |
| | | | Arizona – 1.8% (1.1% of Total Investments) | | | | | |
| | 3,465 | | Arizona Board of Regents, Certificates of Participation, Arizona State University, Refunding Series 2006, 5.000%, 7/01/25 – NPFG Insured | No Opt. Call | AA– | | 3,695,215 | |
| | 4,905 | | Maricopa County Industrial Development Authority, Arizona, Health Facility Revenue Bonds, Catholic Healthcare West, Series 2007A, 5.250%, 7/01/32 | 7/17 at 100.00 | A | | 5,040,672 | |
| | 2,500 | | Phoenix, Arizona, Civic Improvement Corporation, Senior Lien Airport Revenue Bonds, Series 2008A, 5.000%, 7/01/38 | 7/18 at 100.00 | AA– | | 2,575,275 | |
| | 10,870 | | Total Arizona | | | | 11,311,162 | |
| | | | California – 19.7% (12.9% of Total Investments) | | | | | |
| | 3,500 | | Alameda Corridor Transportation Authority, California, Subordinate Lien Revenue Bonds, Series 2004A, 0.000%, 10/01/25 – AMBAC Insured | 10/17 at 100.00 | A– | | 2,935,170 | |
| | | | Calexico Unified School District, Imperial County, California, General Obligation Bonds, Series 2005B: | | | | | |
| | 4,070 | | 0.000%, 8/01/32 – FGIC Insured | No Opt. Call | A1 | | 1,023,686 | |
| | 6,410 | | 0.000%, 8/01/34 – FGIC Insured | No Opt. Call | A1 | | 1,394,239 | |
| | 3,000 | | California Health Facilities Financing Authority, Health Facility Revenue Bonds, Adventist Health System/West, Series 2003A, 5.000%, 3/01/33 | 3/13 at 100.00 | A | | 2,960,070 | |
| | 7,500 | | California State Public Works Board, Lease Revenue Bonds, Department of Mental Health, Coalinga State Hospital, Series 2004A, 5.125%, 6/01/29 | 6/14 at 100.00 | A2 | | 7,514,250 | |
| | 2,750 | | California Statewide Community Development Authority, Revenue Bonds, Methodist Hospital Project, Series 2009, 6.750%, 2/01/38 | 8/19 at 100.00 | Aa2 | | 3,184,830 | |
| | 11,200 | | California, General Obligation Bonds, Series 2003, 5.250%, 2/01/28 | 8/13 at 100.00 | A1 | | 11,502,848 | |
| | 16,000 | | California, Various Purpose General Obligation Bonds, Series 2007, 5.000%, 6/01/37 | 6/17 at 100.00 | A1 | | 16,057,120 | |
| | 9,955 | | Capistrano Unified School District, Orange County, California, Special Tax Bonds, Community Facilities District, Series 2005, 0.000%, 9/01/31 – FGIC Insured | No Opt. Call | A | | 2,589,296 | |
| | | | Colton Joint Unified School District, San Bernardino County, California, General Obligation Bonds, Series 2006C: | | | | | |
| | 3,800 | | 0.000%, 2/01/33 – FGIC Insured | 2/15 at 38.73 | Aa3 | | 922,336 | |
| | 3,795 | | 0.000%, 2/01/37 – FGIC Insured | No Opt. Call | Aa3 | | 708,564 | |
| | 7,170 | | Contra Costa County, California, GNMA Mortgage-Backed Securities Program Home Mortgage Revenue Bonds, Series 1989, 7.750%, 5/01/22 (Alternative Minimum Tax) (ETM) | No Opt. Call | AAA | | 9,334,049 | |
| | 8,145 | | Cupertino Union School District, Santa Clara County, California, General Obligation Bonds, Series 2003B, 0.000%, 8/01/25 – FGIC Insured | 8/13 at 55.54 | Aa1 | | 3,748,003 | |
| | 2,510 | | Folsom Cordova Unified School District, Sacramento County, California, General Obligation Bonds, School Facilities Improvement District 1, Series 2004B, 0.000%, 10/01/28 – NPFG Insured | No Opt. Call | Aa3 | | 897,727 | |
| | 3,360 | | Folsom Cordova Unified School District, Sacramento County, California, General Obligation Bonds, School Facilities Improvement District 2, Series 2002A, 0.000%, 7/01/27 – NPFG Insured | No Opt. Call | Aa2 | | 1,284,797 | |
| | 2,315 | | Gateway Unified School District, California, General Obligation Bonds, Series 2004B, 0.000%, 8/01/32 – FGIC Insured | No Opt. Call | A1 | | 592,918 | |
| | 3,000 | | Golden State Tobacco Securitization Corporation, California, Enhanced Tobacco Settlement Asset-Backed Revenue Bonds, Series 2005A, 0.000%, 6/01/26 – AGM Insured | No Opt. Call | AA+ | | 1,287,630 | |
| | Principal | | | Optional Call | | | | |
| | Amount (000) | | Description (1) | Provisions (2) | Ratings (3) | | Value | |
| | | | California (continued) | | | | | |
| $ | 1,000 | | Golden State Tobacco Securitization Corporation, California, Tobacco Settlement Asset-Backed Bonds, Series 2007A-1, 5.125%, 6/01/47 | 6/17 at 100.00 | BBB | $ | 720,710 | |
| | 5,000 | | Los Angeles Department of Water and Power, California, Waterworks Revenue Bonds, Series 2003A, 5.125%, 7/01/40 – FGIC Insured | 7/12 at 100.00 | AA | | 5,075,800 | |
| | 1,275 | | Madera Unified School District, Madera County, California, General Obligation Bonds, Series 2002, 5.250%, 8/01/23 – AGM Insured | 8/12 at 100.00 | AA+ | | 1,351,322 | |
| | 2,200 | | M-S-R Energy Authority, California, Gas Revenue Bonds, Citigroup Prepay Contracts, Series 2009C, 6.500%, 11/01/39 | No Opt. Call | A | | 2,581,546 | |
| | | | North Orange County Community College District, California, General Obligation Bonds, Series 2003B: | | | | | |
| | 7,735 | | 0.000%, 8/01/25 – FGIC Insured | No Opt. Call | Aa1 | | 3,610,930 | |
| | 4,000 | | 0.000%, 8/01/26 – FGIC Insured | No Opt. Call | Aa1 | | 1,751,720 | |
| | 5,000 | | Palmdale Community Redevelopment Agency, California, Residential Mortgage Revenue Refunding Bonds, Series 1991B, 7.375%, 2/01/12 (ETM) | No Opt. Call | AAA | | 5,244,400 | |
| | 5,000 | | Palmdale Community Redevelopment Agency, California, Single Family Restructured Mortgage Revenue Bonds, Series 1986A, 8.000%, 3/01/16 (Alternative Minimum Tax) (ETM) | No Opt. Call | AAA | | 6,434,100 | |
| | 9,315 | | Perris, California, GNMA Mortgage-Backed Securities Program Single Family Mortgage Revenue Bonds, Series 1989A, 7.600%, 1/01/23 (Alternative Minimum Tax) (ETM) | No Opt. Call | AAA | | 11,985,704 | |
| | 3,205 | | San Diego Community College District, California, General Obligation Bonds, Series 2005, 5.000%, 5/01/25 – AGM Insured | 5/15 at 100.00 | AA+ | | 3,511,334 | |
| | 1,830 | | San Diego Public Facilities Financing Authority, California, Water Utility Revenue Bonds, Tender Option Bond Trust 3504, 19.188%, 2/01/33 (IF) | 8/19 at 100.00 | Aa2 | | 2,501,024 | |
| | 7,660 | | San Joaquin Hills Transportation Corridor Agency, Orange County, California, Senior Lien Toll Road Revenue Bonds, Series 1993, 0.000%, 1/01/24 (ETM) | No Opt. Call | AAA | | 4,977,238 | |
| | | | San Joaquin Hills Transportation Corridor Agency, Orange County, California, Toll Road Revenue Refunding Bonds, Series 1997A: | | | | | |
| | 7,205 | | 0.000%, 1/15/23 – NPFG Insured | No Opt. Call | A | | 2,962,192 | |
| | 23,000 | | 0.000%, 1/15/35 – NPFG Insured | No Opt. Call | A | | 3,598,810 | |
| | 7,250 | | San Jose-Evergreen Community College District, Santa Clara County, California, General Obligation Bonds, Series 2005A, 0.000%, 9/01/29 – NPFG Insured | 9/15 at 47.82 | Aa1 | | 2,405,405 | |
| | 189,155 | | Total California | | | | 126,649,768 | |
| | | | Colorado – 9.7% (6.3% of Total Investments) | | | | | |
| | 1,600 | | Arkansas River Power Authority, Colorado, Power Revenue Bonds, Series 2006, 5.250%, 10/01/40 – SYNCORA GTY Insured | 10/16 at 100.00 | BBB | | 1,551,808 | |
| | 9,440 | | Colorado Health Facilities Authority, Colorado, Revenue Bonds, Catholic Health Initiatives, Series 2006A, 4.500%, 9/01/38 | 9/16 at 100.00 | AA | | 9,176,530 | |
| | 3,335 | | Colorado Health Facilities Authority, Colorado, Revenue Bonds, Catholic Health Initiatives, Series 2009A, 5.500%, 7/01/34 | 7/19 at 100.00 | AA | | 3,601,900 | |
| | 7,500 | | Colorado Health Facilities Authority, Health Facilities Revenue Bonds, Sisters of Charity of Leavenworth Health Services Corporation, Series 2010A, 5.000%, 1/01/40 | No Opt. Call | AA | | 7,665,600 | |
| | 1,150 | | Colorado Health Facilities Authority, Revenue Bonds, Poudre Valley Health System, Series 2005C, 5.250%, 3/01/40 – AGM Insured | 9/18 at 102.00 | AA+ | | 1,186,662 | |
| | 3,300 | | Denver City and County, Colorado, Airport Revenue Bonds, Series 2006, 5.000%, 11/15/24 – FGIC Insured | 11/16 at 100.00 | A+ | | 3,528,558 | |
| | | | Denver City and County, Colorado, Airport Revenue Bonds, Series 2006: | | | | | |
| | 5,365 | | 5.000%, 11/15/23 – FGIC Insured (UB) | 11/16 at 100.00 | A+ | | 5,762,117 | |
| | 4,335 | | 5.000%, 11/15/25 – FGIC Insured (UB) | 11/16 at 100.00 | A+ | | 4,613,524 | |
| | 2,000 | | Denver Convention Center Hotel Authority, Colorado, Senior Revenue Bonds, Convention Center Hotel, Series 2006, 4.750%, 12/01/35 – SYNCORA GTY Insured | 11/16 at 100.00 | BBB– | | 1,717,020 | |
| | | | E-470 Public Highway Authority, Colorado, Senior Revenue Bonds, Series 1997B: | | | | | |
| | 2,650 | | 0.000%, 9/01/16 – NPFG Insured | No Opt. Call | A | | 2,038,963 | |
| | 8,645 | | 0.000%, 9/01/26 – NPFG Insured | No Opt. Call | A | | 3,246,543 | |
| | | | E-470 Public Highway Authority, Colorado, Senior Revenue Bonds, Series 2000B: | | | | | |
| | 7,500 | | 0.000%, 9/01/29 – NPFG Insured | No Opt. Call | A | | 2,227,200 | |
| | 10,000 | | 0.000%, 9/01/31 – NPFG Insured | No Opt. Call | A | | 2,563,500 | |
| | 10,000 | | 0.000%, 9/01/32 – NPFG Insured | No Opt. Call | A | | 2,381,100 | |
Nuveen Investments 35
| | | Nuveen Municipal Advantage Fund, Inc. (continued) |
| NMA | | Portfolio of Investments October 31, 2010 |
| | Principal | | | Optional Call | | | | |
| | Amount (000) | | Description (1) | Provisions (2) | Ratings (3) | | Value | |
| | | | Colorado (continued) | | | | | |
| | | | Platte River Power Authority, Colorado, Power Revenue Refunding Bonds, Series 2002EE: | | | | | |
| $ | 1,030 | | 5.375%, 6/01/17 (Pre-refunded 6/01/12) | 6/12 at 100.00 | AA (4) | $ | 1,111,504 | |
| | 4,890 | | 5.375%, 6/01/18 (Pre-refunded 6/01/12) | 6/12 at 100.00 | AA (4) | | 5,276,946 | |
| | | | Platte River Power Authority, Colorado, Power Revenue Refunding Bonds, Series 2002EE: | | | | | |
| | 970 | | 5.375%, 6/01/17 | 6/12 at 100.00 | AA | | 1,032,953 | |
| | 110 | | 5.375%, 6/01/18 | 6/12 at 100.00 | AA | | 116,546 | |
| | 3,110 | | Regional Transportation District, Colorado, Denver Transit Partners Eagle P3 Project Private Activity Bonds, Series 2010, 6.000%, 1/15/34 | 7/20 at 100.00 | Baa3 | | 3,299,990 | |
| | 86,930 | | Total Colorado | | | | 62,098,964 | |
| | | | District of Columbia – 0.2% (0.2% of Total Investments) | | | | | |
| | 1,200 | | District of Columbia Housing Finance Agency, GNMA/FNMA Single Family Mortgage Revenue Bonds, Series 1997B, 5.900%, 12/01/28 (Alternative Minimum Tax) | 12/10 at 100.00 | AAA | | 1,254,036 | |
| | | | Florida – 4.4% (2.9% of Total Investments) | | | | | |
| | 2,770 | | Florida Housing Finance Corporation, Housing Revenue Bonds, Stratford Point Apartments, Series 2000O-1, 5.850%, 12/01/31 – AGM Insured (Alternative Minimum Tax) | 12/10 at 100.00 | AA+ | | 2,772,493 | |
| | 14,730 | | South Miami Health Facilities Authority, Florida, Hospital Revenue, Baptist Health System Obligation Group, Series 2007, 5.000%, 8/15/42 (UB) | 8/17 at 100.00 | AA | | 14,906,613 | |
| | 10,130 | | Tampa, Florida, Healthcare System Revenue Bonds, Allegany Health
System – St. Mary’s Hospital, Series 1993, 5.125%,
12/01/23 – NPFG Insured (ETM) | 12/10 at 100.00 | Aaa | | 10,277,088 | |
| | 27,630 | | Total Florida | | | | 27,956,194 | |
| | | | Georgia – 1.3% (0.8% of Total Investments) | | | | | |
| | 4,000 | | Augusta, Georgia, Water and Sewerage Revenue Bonds, Series 2004, 5.250%, 10/01/39 – AGM Insured | 10/14 at 100.00 | AA+ | | 4,181,920 | |
| | 2,900 | | Coffee County Hospital Authority, Georgia, Revenue Bonds, Coffee County Regional Medical Center, Series 2004, 5.000%, 12/01/26 | 12/14 at 100.00 | BBB– | | 2,776,489 | |
| | 1,250 | | DeKalb County Hospital Authority, Georgia, Anticipation Certificates Revenue Bonds, DeKalb Medical Center, Inc. Project, Series 2010, 6.000%, 9/01/30 | 9/20 at 100.00 | N/R | | 1,311,425 | |
| | 8,150 | | Total Georgia | | | | 8,269,834 | |
| | | | Hawaii – 0.0% (0.0% of Total Investments) | | | | | |
| | 270 | | Hawaii Housing Finance and Development Corporation, Single Family Mortgage Purchase Revenue Bonds, Series 1997A, 5.750%, 7/01/30 (Alternative Minimum Tax) | 1/11 at 100.00 | AAA | | 273,480 | |
| | | | Illinois – 16.5% (10.8% of Total Investments) | | | | | |
| | 4,345 | | Chicago Board of Education, Illinois, Unlimited Tax General Obligation Bonds, Dedicated Tax Revenues, Series 1998B-1, 0.000%, 12/01/28 – FGIC Insured | No Opt. Call | Aa2 | | 1,626,942 | |
| | 4,260 | | Chicago Board of Education, Illinois, Unlimited Tax General Obligation Bonds, Dedicated Tax Revenues, Series 1999A, 0.000%, 12/01/31 – FGIC Insured | No Opt. Call | Aa2 | | 1,272,079 | |
| | 5,000 | | Chicago, Illinois, Second Lien Passenger Facility Charge Revenue Bonds, O’Hare International Airport, Series 2001A, 5.375%, 1/01/32 – AMBAC Insured (Alternative Minimum Tax) | 1/11 at 101.00 | A2 | | 5,033,450 | |
| | 7,100 | | Cook County, Illinois, General Obligation Bonds, Refunding Series 2010A, 5.250%, 11/15/33 | 11/20 at 100.00 | AA | | 7,609,425 | |
| | 1,500 | | Illinois Finance Authority, Revenue Bonds, Central DuPage Health, Series 2009B, 5.500%, 11/01/39 | 11/19 at 100.00 | AA | | 1,597,485 | |
| | 2,000 | | Illinois Finance Authority, Revenue Bonds, Children’s Memorial Hospital, Series 2008A, 5.250%, 8/15/47 – AGC Insured (UB) | 8/18 at 100.00 | AA+ | | 2,036,580 | |
| | 8,395 | | Illinois Finance Authority, Revenue Bonds, Loyola University of Chicago, Tender Option Bond Trust 1137, 9.032%, 7/01/15 (IF) | No Opt. Call | Aa1 | | 8,974,927 | |
| | 2,500 | | Illinois Finance Authority, Revenue Bonds, Silver Cross Hospital and Medical Centers, Series 2009, 6.875%, 8/15/38 | 8/19 at 100.00 | BBB | | 2,788,550 | |
| | 4,000 | | Illinois Finance Authority, Revenue Refunding Bonds, Silver Cross Hospital and Medical Centers, Series 2008A, 6.000%, 8/15/23 | 8/18 at 100.00 | BBB | | 4,383,880 | |
| | 6,000 | | Illinois Health Facilities Authority, Revenue Bonds, Condell Medical Center, Series 2002, 5.750%, 5/15/22 (Pre-refunded 5/15/12) | 5/12 at 100.00 | Aaa | | 6,468,120 | |
| | Principal | | | Optional Call | | | | |
| | Amount (000) | | Description (1) | Provisions (2) | Ratings (3) | | Value | |
| | | | Illinois (continued) | | | | | |
| $ | 6,165 | | Illinois Health Facilities Authority, Revenue Bonds, Sarah Bush Lincoln Health Center, Series 1996B, 5.750%, 2/15/22 | 2/11 at 100.00 | A+ | $ | 6,169,809 | |
| | 10,740 | | Lake and McHenry Counties Community Unit School District 118, Wauconda, Illinois, General Obligation Bonds, Series 2005B, 0.000%, 1/01/23 – AGM Insured | 1/15 at 66.94 | Aa3 | | 6,005,593 | |
| | 1,090 | | Metropolitan Pier and Exposition Authority, Illinois, Revenue Bonds, McCormick Place Expansion Project, Series 1993A, 0.000%, 6/15/21 – FGIC Insured | No Opt. Call | A2 | | 651,275 | |
| | | | Metropolitan Pier and Exposition Authority, Illinois, Revenue Bonds, McCormick Place Expansion Project, Series 1999A: | | | | | |
| | 13,455 | | 5.500%, 12/15/24 – FGIC Insured | 12/10 at 100.50 | AAA | | 13,641,217 | |
| | 10,430 | | 5.250%, 12/15/28 – FGIC Insured | 12/10 at 100.50 | AAA | | 10,548,589 | |
| | 3,175 | | Metropolitan Pier and Exposition Authority, Illinois, Revenue Bonds, McCormick Place Expansion Project, Series 2002A, 0.000%, 6/15/41 – NPFG Insured | No Opt. Call | AAA | | 496,634 | |
| | 6,000 | | Metropolitan Pier and Exposition Authority, Illinois, Revenue Refunding Bonds, McCormick Place Expansion Project, Series 1996A, 0.000%, 6/15/24 – NPFG Insured | No Opt. Call | A | | 2,949,240 | |
| | 4,600 | | Regional Transportation Authority, Cook, DuPage, Kane, Lake, McHenry and Will Counties, Illinois, General Obligation Bonds, Series 1990A, 7.200%, 11/01/20 – AMBAC Insured | No Opt. Call | Aa3 | | 5,706,438 | |
| | 1,940 | | University of Illinois, Auxiliary Facilities Systems Revenue Bonds, Series 2003A, 5.000%, 4/01/23 – AMBAC Insured | 4/13 at 100.00 | Aa2 | | 2,007,202 | |
| | 7,500 | | Valley View Public Schools, Community Unit School District 365U of Will County, Illinois, General Obligation Bonds, Series 2005, 0.000%, 11/01/25 – NPFG Insured | No Opt. Call | AA | | 3,852,075 | |
| | 23,125 | | Will County Community High School District 210 Lincoln-Way, Illinois, General Obligation Bonds, Series 2006, 0.000%, 1/01/24 – AGM Insured | No Opt. Call | Aa2 | | 12,444,256 | |
| | 133,320 | | Total Illinois | | | | 106,263,766 | |
| | | | Indiana – 2.3% (1.5% of Total Investments) | | | | | |
| | 1,570 | | Hospital Authority of Delaware County, Indiana, Hospital Revenue Refunding Bonds, Cardinal Health System, Series 1997, 5.000%, 8/01/16 – AMBAC Insured | 2/11 at 100.00 | N/R | | 1,547,157 | |
| | 4,030 | | Indiana Finance Authority Health System Revenue Bonds, Sisters of St. Francis Health Services, Inc. Obligated Group, Series 2009, 5.250%, 11/01/39 | 11/19 at 100.00 | Aa3 | | 4,209,254 | |
| | 6,000 | | Indiana Finance Authority, Revenue Bonds, Trinity Health Care Group, Refunding Series 2009A, 5.250%, 12/01/38 | 12/19 at 100.00 | AA | | 6,350,760 | |
| | 2,435 | | Indiana Health Facility Financing Authority, Revenue Bonds, Community Foundation of Northwest Indiana, Series 2007, 5.500%, 3/01/37 | 3/17 at 100.00 | BBB | | 2,454,237 | |
| | 1,005 | | St. Joseph County Hospital Authority, Indiana, Revenue Bonds, Madison Center Inc., Series 1999, 5.450%, 2/15/12 (5), (7) | 2/11 at 100.00 | CCC | | 384,413 | |
| | 15,040 | | Total Indiana | | | | 14,945,821 | |
| | | | Iowa – 0.8% (0.6% of Total Investments) | | | | | |
| | 6,300 | | Iowa Tobacco Settlement Authority, Asset Backed Settlement Revenue Bonds, Series 2005C, 5.375%, 6/01/38 | 6/15 at 100.00 | BBB | | 5,215,014 | |
| | 250 | | Iowa Tobacco Settlement Authority, Tobacco Asset-Backed Revenue Bonds, Series 2005B, 5.600%, 6/01/34 | 6/17 at 100.00 | BBB | | 224,130 | |
| | 6,550 | | Total Iowa | | | | 5,439,144 | |
| | | | Kansas – 1.2% (0.8% of Total Investments) | | | | | |
| | 3,715 | | Overland Park Development Corporation, Kansas, First Tier Revenue Bonds, Overland Park Convention Center, Series 2007A, 5.125%, 1/01/22 – AMBAC Insured | 1/17 at 100.00 | Baa3 | | 3,677,999 | |
| | 1,750 | | Wamego, Kansas, Pollution Control Revenue Bonds, Kansas Gas and Electric Company, Series 2004, 5.300%, 6/01/31 – NPFG Insured | 6/14 at 100.00 | A | | 1,793,803 | |
| | 3,730 | | Wyandotte County-Kansas City Unified Government, Kansas, Sales Tax Special Obligation Capital Appreciation Revenue Bonds Redevelopment Project Area B – Major Multi-Sport Athletic Complex Project, Subordinate Lien Series 2010B, 0.000%, 6/01/21 | No Opt. Call | N/R | | 2,097,939 | |
| | 9,195 | | Total Kansas | | | | 7,569,741 | |
| | | | Kentucky – 1.4% (0.9% of Total Investments) | | | | | |
| | 6,015 | | Kentucky Economic Development Finance Authority, Hospital Facilities Revenue Bonds, Owensboro Medical Health System, Series 2010B, 6.375%, 3/01/40 | 6/20 at 100.00 | Baa2 | | 6,411,990 | |
Nuveen Investments 37
| | | Nuveen Municipal Advantage Fund, Inc. (continued) |
| NMA | | Portfolio of Investments October 31, 2010 |
| | Principal | | | Optional Call | | | | |
| | Amount (000) | | Description (1) | Provisions (2) | Ratings (3) | | Value | |
| | | | Kentucky (continued) | | | | | |
| $ | 1,500 | | Kentucky Economic Development Finance Authority, Hospital Revenue Bonds, Baptist Healthcare System, Series 2009A, 5.375%, 8/15/24 | 8/19 at 100.00 | Aa3 | $ | 1,657,995 | |
| | 1,000 | | Kentucky Economic Development Finance Authority, Louisville Arena Project Revenue Bonds, Louisville Arena Authority, Inc., Series 2008-A1, 6.000%, 12/01/33 – AGC Insured | 6/18 at 100.00 | AA+ | | 1,089,780 | |
| | 8,515 | | Total Kentucky | | | | 9,159,765 | |
| | | | Louisiana – 13.4% (8.7% of Total Investments) | | | | | |
| | 13,500 | | DeSoto Parish, Louisiana, Pollution Control Revenue Refunding Bonds, Cleco Utility Group Inc. Project, Series 1999, 5.875%, 9/01/29 – AMBAC Insured | 3/11 at 101.00 | BBB | | 13,566,690 | |
| | | | Louisiana Public Facilities Authority, Extended Care Facilities Revenue Bonds, Comm-Care Corporation Project, Series 1994: | | | | | |
| | 520 | | 11.000%, 2/01/14 (ETM) | No Opt. Call | N/R (4) | | 607,885 | |
| | 4,745 | | 11.000%, 2/01/14 (ETM) | No Opt. Call | N/R (4) | | 5,546,952 | |
| | 6,650 | | Louisiana Public Facilities Authority, Revenue Bonds, Baton Rouge General Hospital, Series 2004, 5.250%, 7/01/33 – NPFG Insured | 7/14 at 100.00 | A | | 6,762,651 | |
| | 9,000 | | Louisiana Public Facilities Authority, Revenue Bonds, Ochsner Clinic Foundation Project, Series 2007A, 5.500%, 5/15/47 | 5/17 at 100.00 | Baa1 | | 8,911,530 | |
| | 28 | | Louisiana State, Gasoline Tax Revenue Bonds, Series 2006, Residuals 660-1, 15.415%, 5/01/34 FGIC Insured (IF) | 5/16 at 100.00 | Aa1 | | 28,415 | |
| | | | Louisiana State, Gasoline Tax Revenue Bonds, Series 2006A: | | | | | |
| | 20,690 | | 4.500%, 5/01/41 – FGIC Insured (UB) | 5/16 at 100.00 | Aa1 | | 20,704,897 | |
| | 10,000 | | 5.000%, 5/01/41 – FGIC Insured (UB) | 5/16 at 100.00 | Aa1 | | 10,322,600 | |
| | | | Tobacco Settlement Financing Corporation, Louisiana, Tobacco Settlement Asset-Backed Bonds, Series 2001B: | | | | | |
| | 7,505 | | 5.500%, 5/15/30 | 5/11 at 101.00 | BBB | | 7,590,782 | |
| | 11,855 | | 5.875%, 5/15/39 | 5/11 at 101.00 | BBB | | 11,968,452 | |
| | 84,493 | | Total Louisiana | | | | 86,010,854 | |
| | | | Massachusetts – 2.2% (1.4% of Total Investments) | | | | | |
| | 8,825 | | Massachusetts Department of Transportation, Metropolitan Highway System Revenue Bonds, Senior Lien Series 2010B, 5.000%, 1/01/32 | 1/20 at 100.00 | A | | 9,302,344 | |
| | 620 | | Massachusetts Health and Educational Facilities Authority, Revenue Bonds, CareGroup Inc., Series 2008E-1 & 2, 5.125%, 7/01/33 | 7/18 at 100.00 | A3 | | 622,492 | |
| | 1,750 | | Massachusetts Health and Educational Facilities Authority, Revenue Bonds, UMass Memorial Healthcare, Series 1998A, 5.000%, 7/01/28 – AMBAC Insured | 1/11 at 100.00 | BBB+ | | 1,713,688 | |
| | 2,300 | | Massachusetts Health and Educational Facilities Authority, Revenue Refunding Bonds, Suffolk University Issue, Series 2009A, 5.750%, 7/01/39 | 7/19 at 100.00 | BBB | | 2,439,104 | |
| | 13,495 | | Total Massachusetts | | | | 14,077,628 | |
| | | | Michigan – 2.5% (1.6% of Total Investments) | | | | | |
| | 6,250 | | Michigan State Building Authority, Revenue Bonds, Refunding Series 2006IA, 0.000%, 10/15/30 – FGIC Insured | 10/16 at 50.02 | Aa3 | | 2,039,813 | |
| | | | Michigan State Hospital Finance Authority, Hospital Revenue Bonds, Detroit Medical Center Obligated Group, Series 1998A: | | | | | |
| | 4,995 | | 5.250%, 8/15/23 | 2/11 at 100.00 | Ba3 | | 4,881,813 | |
| | 3,000 | | 5.250%, 8/15/28 | 2/11 at 100.00 | BB– | | 2,805,780 | |
| | 3,275 | | Michigan State Hospital Finance Authority, Revenue Refunding Bonds, Detroit Medical Center Obligated Group, Series 1993A, 6.500%, 8/15/18 | 2/11 at 100.00 | BB– | | 3,274,902 | |
| | 3,050 | | Michigan Tobacco Settlement Finance Authority, Tobacco Settlement Asset-Backed Revenue Bonds, Series 2008A, 6.875%, 6/01/42 | 6/18 at 100.00 | Baa3 | | 3,070,313 | |
| | 20,570 | | Total Michigan | | | | 16,072,621 | |
| | | | Minnesota – 0.8% (0.5% of Total Investments) | | | | | |
| | 5,000 | | Minneapolis-St. Paul Metropolitan Airports Commission, Minnesota, Subordinate Airport Revenue Bonds, Series 2001C, 5.250%, 1/01/32 (Pre-refunded 1/01/11) – FGIC Insured | 1/11 at 100.00 | A (4) | | 5,043,200 | |
| | Principal | | | Optional Call | | | | |
| | Amount (000) | | Description (1) | Provisions (2) | Ratings (3) | | Value | |
| | | | Missouri – 1.0% (0.6% of Total Investments) | | | | | |
| $ | 1,500 | | Bi-State Development Agency of the Missouri-Illinois Metropolitan District, Mass Transit Sales Tax Appropriation Bonds, Metrolink Cross County Extension Project, Series 2002B, 5.000%, 10/01/32 – AGM Insured | 10/13 at 100.00 | AA+ | $ | 1,524,165 | |
| | 12,005 | | Kansas City Municipal Assistance Corporation, Missouri, Leasehold Revenue Bonds, Series 2004B-1, 0.000%, 4/15/29 – AMBAC Insured | No Opt. Call | AA– | | 4,547,494 | |
| | 70 | | Missouri Housing Development Commission, Single Family Mortgage Revenue Bonds, Homeownership Loan Program, Series 2000A-1, 7.500%, 3/01/31 (Alternative Minimum Tax) | 3/11 at 101.00 | AAA | | 73,793 | |
| | 13,575 | | Total Missouri | | | | 6,145,452 | |
| | | | Nevada – 3.6% (2.4% of Total Investments) | | | | | |
| | 15,000 | | Clark County, Nevada, Airport Revenue Bonds, Subordinate Lien Series 2010B, 5.750%, 7/01/42 | 1/20 at 100.00 | Aa3 | | 16,149,900 | |
| | | | Director of Nevada State Department of Business and Industry, Revenue Bonds, Las Vegas Monorail Project, First Tier, Series 2000: | | | | | |
| | 3,025 | | 0.000%, 1/01/16 – AMBAC Insured | No Opt. Call | N/R | | 486,360 | |
| | 7,910 | | 5.375%, 1/01/40 – AMBAC Insured (6) | 1/11 at 100.00 | N/R | | 1,662,128 | |
| | 3,750 | | Henderson, Nevada, Healthcare Facility Revenue Refunding Bonds, Catholic Healthcare West, Series 2007B, Trust 2633, 18.387%, 7/01/31 – BHAC Insured (IF) | 7/17 at 100.00 | AA+ | | 4,617,000 | |
| | 185 | | Nevada Housing Division, Single Family Mortgage Bonds, Senior Series 1997C-2, 5.750%, 4/01/29 (Alternative Minimum Tax) | 4/11 at 100.00 | Aaa | | 191,534 | |
| | 29,870 | | Total Nevada | | | | 23,106,922 | |
| | | | New Hampshire – 0.2% (0.2% of Total Investments) | | | | | |
| | 1,500 | | New Hampshire Business Finance Authority, Revenue Bonds, Elliot Hospital Obligated Group Issue, Series 2009A, 6.125%, 10/01/39 | 10/19 at 100.00 | BBB+ | | 1,554,630 | |
| | | | New Jersey – 3.2% (2.1% of Total Investments) | | | | | |
| | 15,000 | | New Jersey Transportation Trust Fund Authority, Transportation System Bonds, Series 2006C, 0.000%, 12/15/30 – FGIC Insured | No Opt. Call | AA– | | 4,946,850 | |
| | | | Tobacco Settlement Financing Corporation, New Jersey, Tobacco Settlement Asset-Backed Bonds, Series 2002: | | | | | |
| | 9,735 | | 5.750%, 6/01/32 (Pre-refunded 6/01/12) | 6/12 at 100.00 | AAA | | 10,345,677 | |
| | 5,050 | | 6.125%, 6/01/42 (Pre-refunded 6/01/12) | 6/12 at 100.00 | AAA | | 5,506,419 | |
| | 29,785 | | Total New Jersey | | | | 20,798,946 | |
| | | | New York – 3.9% (2.5% of Total Investments) | | | | | |
| | 7,000 | | Metropolitan Transportation Authority, New York, State Service Contract Refunding Bonds, Series 2002A, 5.125%, 1/01/29 | 7/12 at 100.00 | AA– | | 7,225,120 | |
| | 4,975 | | New York City Industrial Development Agency, New York, Special Facilities Revenue Bonds, British Airways PLC, Series 1998, 5.250%, 12/01/32 (Alternative Minimum Tax) | 12/10 at 100.00 | BB– | | 4,159,150 | |
| | 3,000 | | New York City Industrial Development Agency, New York, Special Facilities Revenue Bonds, British Airways PLC, Series 2002, 7.625%, 12/01/32 (Alternative Minimum Tax) | 12/12 at 101.00 | BB– | | 3,077,670 | |
| | 10,000 | | New York City Municipal Water Finance Authority, New York, Water and Sewerage System Revenue Bonds, Series 2004B, 5.000%, 6/15/36 – AGM Insured (UB) | 12/14 at 100.00 | AAA | | 10,470,800 | |
| | 24,975 | | Total New York | | | | 24,932,740 | |
| | | | North Carolina – 2.7% (1.8% of Total Investments) | | | | | |
| | 3,000 | | North Carolina Eastern Municipal Power Agency, Power System Revenue Bonds, Series 2005, 5.250%, 1/01/20 – AMBAC Insured | 1/16 at 100.00 | A– | | 3,358,410 | |
| | 1,000 | | North Carolina Housing Finance Agency, Home Ownership Revenue Bonds, 1998 Trust Agreement, Series 10A, 5.400%, 7/01/32 – AMBAC Insured (Alternative Minimum Tax) | 1/11 at 100.00 | AA | | 1,000,470 | |
| | 3,800 | | North Carolina Housing Finance Agency, Home Ownership Revenue Bonds, 1998 Trust Agreement, Series 7A, 6.250%, 1/01/29 (Alternative Minimum Tax) | 1/11 at 100.00 | AA | | 3,804,712 | |
| | 3,595 | | North Carolina Housing Finance Agency, Home Ownership Revenue Bonds, 1998 Trust Agreement, Series 9A, 5.875%, 7/01/31 (Alternative Minimum Tax) | 1/11 at 100.00 | AA | | 3,598,200 | |
| | 3,500 | | North Carolina Medical Care Commission, Healthcare Facilities Revenue Bonds, Duke University Health System, Series 2009A, 5.000%, 6/01/42 | 6/19 at 100.00 | AA | | 3,653,825 | |
Nuveen Investments 39
| | | Nuveen Municipal Advantage Fund, Inc. (continued) |
| NMA | | Portfolio of Investments October 31, 2010 |
| | Principal | | | Optional Call | | | | |
| | Amount (000) | | Description (1) | Provisions (2) | Ratings (3) | | Value | |
| | | | North Carolina (continued) | | | | | |
| $ | 1,900 | | North Carolina Turnpike Authority, Triangle Expressway System Revenue Bonds, Series 2009A, 5.750%, 1/01/39 – AGC Insured | 1/19 at 100.00 | AA+ | $ | 2,061,443 | |
| | 16,795 | | Total North Carolina | | | | 17,477,060 | |
| | | | North Dakota – 0.4% (0.2% of Total Investments) | | | | | |
| | 2,250 | | Ward County Health Care, North Dakota, Revenue Bonds, Trinity Obligated Group, Series 2006, 5.125%, 7/01/25 | 7/16 at 100.00 | BBB+ | | 2,264,693 | |
| | | | Ohio – 6.2% (4.0% of Total Investments) | | | | | |
| | 4,220 | | Akron, Bath and Copley Joint Township Hospital District, Ohio, Hospital Facilities Revenue Bonds, Summa Health System, Series 1998A, 5.375%, 11/15/18 | 11/10 at 100.00 | Baa1 | | 4,223,123 | |
| | 10,000 | | American Municipal Power Ohio Inc., General Revenue Bonds, Prairie State Energy Campus Project Series 2008A, 5.250%, 2/15/43 | 2/18 at 100.00 | A1 | | 10,379,400 | |
| | | | Buckeye Tobacco Settlement Financing Authority, Ohio, Tobacco Settlement Asset-Backed Revenue Bonds, Senior Lien, Series 2007A-2: | | | | | |
| | 1,600 | | 5.125%, 6/01/24 | 6/17 at 100.00 | BBB | | 1,398,112 | |
| | 2,700 | | 5.875%, 6/01/30 | 6/17 at 100.00 | BBB | | 2,274,966 | |
| | 9,135 | | 5.750%, 6/01/34 | 6/17 at 100.00 | BBB | | 7,284,980 | |
| | 3,920 | | 6.000%, 6/01/42 | 6/17 at 100.00 | BBB | | 3,084,452 | |
| | 5,895 | | 5.875%, 6/01/47 | 6/17 at 100.00 | BBB | | 4,511,208 | |
| | 5,150 | | Buckeye Tobacco Settlement Financing Authority, Ohio, Tobacco Settlement Asset-Backed Revenue Bonds, Senior Lien, Series 2007A-3, 0.000%, 6/01/37 | 6/22 at 100.00 | Baa3 | | 3,574,564 | |
| | 2,650 | | Ohio, General Obligation Bonds, Higher Education, Series 2003A, 5.000%, 5/01/22 | 5/13 at 100.00 | AA+ | | 2,855,004 | |
| | 45,270 | | Total Ohio | | | | 39,585,809 | |
| | | | Oklahoma – 2.5% (1.6% of Total Investments) | | | | | |
| | 1,675 | | Oklahoma Development Finance Authority, Health System Revenue Bonds, Integris Baptist Medical Center, Series 2008B, 5.250%, 8/15/38 | 8/18 at 100.00 | AA– | | 1,781,614 | |
| | 12,000 | | Oklahoma Development Finance Authority, Revenue Bonds, Saint John Health System, Series 2007, 5.000%, 2/15/42 | 2/17 at 100.00 | A | | 12,005,520 | |
| | 2,000 | | Oklahoma Municipal Power Authority, Power Supply System Revenue Bonds, Series 2007, 4.500%, 1/01/47 – FGIC Insured | 1/17 at 100.00 | A | | 1,982,920 | |
| | 15,675 | | Total Oklahoma | | | | 15,770,054 | |
| | | | Oregon – 0.5% (0.3% of Total Investments) | | | | | |
| | 3,000 | | Oregon State Facilities Authority, Revenue Bonds, Willamette University, Series 2007A, 5.000%, 10/01/36 | 10/17 at 100.00 | A | | 2,999,880 | |
| | | | Pennsylvania – 4.5% (3.0% of Total Investments) | | | | | |
| | 5,000 | | Allegheny County Hospital Development Authority, Pennsylvania, University of Pittsburgh Medical Center Revenue Bonds, Series 2009A, 5.625%, 8/15/39 | No Opt. Call | Aa3 | | 5,241,500 | |
| | 1,250 | | Erie Water Authority, Pennsylvania, Water Revenue Bonds, Series 2008, 5.000%, 12/01/43 – AGM Insured | 12/18 at 100.00 | AA+ | | 1,294,938 | |
| | 7,100 | | Montgomery County Industrial Development Authority, Pennsylvania, FHA Insured Mortgage Revenue Bonds, New Regional Medical Center Project, Series 2010, 5.750%, 8/01/30 | 8/15 at 100.00 | AA | | 7,544,247 | |
| | 1,500 | | Pennsylvania Housing Finance Agency, Single Family Mortgage Revenue Bonds, Series 2006A, 4.650%, 10/01/31 (Alternative Minimum Tax) (UB) | 10/16 at 100.00 | AA+ | | 1,486,080 | |
| | 2,600 | | Pennsylvania Turnpike Commission, Turnpike Revenue Bonds, Series 2004A, 5.500%, 12/01/31 – AMBAC Insured | 12/14 at 100.00 | Aa3 | | 2,810,210 | |
| | 10,000 | | Philadelphia Hospitals and Higher Education Facilities Authority, Pennsylvania, Health System Revenue Bonds, Jefferson Health System, Series 2010B, 5.250%, 5/15/30 | 5/20 at 100.00 | AA | | 10,704,700 | |
| | 27,450 | | Total Pennsylvania | | | | 29,081,675 | |
| | | | Puerto Rico – 7.2% (4.7% of Total Investments) | | | | | |
| | 5,000 | | Puerto Rico Electric Power Authority, Power Revenue Bonds, Series 2005RR, 5.000%, 7/01/26 – SYNCORA GTY Insured | 7/15 at 100.00 | A3 | | 5,142,150 | |
| | 10,000 | | Puerto Rico Electric Power Authority, Power Revenue Bonds, Series 2010XX, 5.750%, 7/01/36 | 7/20 at 100.00 | A3 | | 10,921,600 | |
| | Principal | | | Optional Call | | | | |
| | Amount (000) | | Description (1) | Provisions (2) | Ratings (3) | | Value | |
| | | | Puerto Rico (continued) | | | | | |
| $ | 10,070 | | Puerto Rico Highway and Transportation Authority, Highway Revenue Bonds, Series 2007N, 5.250%, 7/01/39 – FGIC Insured | No Opt. Call | A3 | $ | 10,419,328 | |
| | 10,000 | | Puerto Rico Sales Tax Financing Corporation, Sales Tax Revenue Bonds, First Subordinate Series 2009A, 6.000%, 8/01/42 | 8/19 at 100.00 | A+ | | 11,182,300 | |
| | 4,310 | | Puerto Rico Sales Tax Financing Corporation, Sales Tax Revenue Bonds, First Subordinate Series 2010C, 5.250%, 8/01/41 | 8/20 at 100.00 | A+ | | 4,507,226 | |
| | 4,000 | | Puerto Rico, General Obligation Bonds, Series 2000B, 5.625%, 7/01/19 – NPFG Insured | 1/11 at 100.00 | A | | 4,004,960 | |
| | 43,380 | | Total Puerto Rico | | | | 46,177,564 | |
| | | | Rhode Island – 1.3% (0.8% of Total Investments) | | | | | |
| | 1,235 | | Rhode Island Health and Educational Building Corporation, Hospital Financing Revenue Bonds, Lifespan Obligated Group, Series 1996, 5.500%, 5/15/16 – NPFG Insured | 11/10 at 100.00 | A | | 1,237,482 | |
| | 7,000 | | Rhode Island Housing and Mortgage Finance Corporation, Homeownership Opportunity Bond Program, Series 50A, 4.650%, 10/01/34 | 10/14 at 100.00 | AA+ | | 7,003,710 | |
| | 8,235 | | Total Rhode Island | | | | 8,241,192 | |
| | | | South Carolina – 3.1% (2.0% of Total Investments) | | | | | |
| | 10,000 | | Greenville County School District, South Carolina, Installment Purchase Revenue Bonds, Series 2002, 6.000%, 12/01/20 (Pre-refunded 12/01/12) | 12/12 at 101.00 | AA (4) | | 11,225,800 | |
| | 2,500 | | Lexington County Health Service District, South Carolina, Hospital Revenue Refunding and Improvement Bonds, Series 2003, 5.750%, 11/01/28 (Pre-refunded 11/01/13) | 11/13 at 100.00 | A+ (4) | | 2,866,050 | |
| | 3,000 | | Myrtle Beach, South Carolina, Hospitality and Accommodation Fee Revenue Bonds, Series 2004A, 5.000%, 6/01/36 – FGIC Insured | 6/14 at 100.00 | A+ | | 3,016,980 | |
| | 1,220 | | Piedmont Municipal Power Agency, South Carolina, Electric Revenue Bonds, Series 2004A-2, 0.000%, 1/01/23 – FGIC Insured | No Opt. Call | A | | 680,821 | |
| | 2,125 | | South Carolina Public Service Authority, Revenue Refunding Bonds, Santee Cooper Electric System, Series 2003A, 5.000%, 1/01/21 – AMBAC Insured | 7/13 at 100.00 | Aa2 | | 2,314,975 | |
| | 18,845 | | Total South Carolina | | | | 20,104,626 | |
| | | | South Dakota – 0.5% (0.3% of Total Investments) | | | | | |
| | 2,945 | | South Dakota Health and Educational Facilities Authority, Revenue Bonds, Sanford Health, Series 2007, 5.000%, 11/01/40 | 5/17 at 100.00 | AA– | | 2,961,227 | |
| | | | Tennessee – 3.8% (2.5% of Total Investments) | | | | | |
| | 6,000 | | Knox County Health, Educational and Housing Facilities Board, Tennessee, Hospital Revenue Bonds, Baptist Health System of East Tennessee Inc., Series 2002, 6.500%, 4/15/31 | 4/12 at 101.00 | A1 | | 6,393,720 | |
| | 20,415 | | Knox County Health, Educational and Housing Facilities Board, Tennessee, Hospital Revenue Refunding Bonds, Covenant Health, Series 2002A, 0.000%, 1/01/18 – AGM Insured | 1/13 at 75.87 | AA+ | | 14,425,647 | |
| | 1,750 | | Metropolitan Government of Nashville-Davidson County, Tennessee, Electric System Revenue Bonds, Series 2001A, 5.125%, 5/15/26 | 5/11 at 100.00 | AA+ | | 1,777,055 | |
| | 2,000 | | Sullivan County Health Educational and Housing Facilities Board, Tennessee, Revenue Bonds, Wellmont Health System, Refunding Series 2006A, 5.440%, 9/01/32 | 3/13 at 100.00 | N/R | | 1,924,980 | |
| | 188 | | Sumner County Health, Educational, and Housing Facilities Board, Tennessee, Revenue Refunding Bonds, Sumner Regional Health System Inc., Series 2007, 5.500%, 11/01/46 (5) (6) | 11/17 at 100.00 | N/R | | 78,062 | |
| | 30,353 | | Total Tennessee | | | | 24,599,464 | |
| | | | Texas – 15.3% (10.0% of Total Investments) | | | | | |
| | 2,000 | | Abilene Higher Education Authority, Inc., Texas, Student Loan Revenue Bonds, Subordinate Series 1998B, 5.050%, 7/01/13 (Alternative Minimum Tax) | 11/10 at 100.00 | Aa3 | | 2,004,240 | |
| | 11,810 | | Brazos River Authority, Texas, Pollution Control Revenue Refunding Bonds, TXU Electric Company, Series 2001C, 5.750%, 5/01/36 (Mandatory put 11/01/11) (Alternative Minimum Tax) | No Opt. Call | CCC | | 11,224,815 | |
| | 6,000 | | Brazos River Authority, Texas, Revenue Refunding Bonds, Houston Lighting and Power Company, Series 1998, 5.050%, 11/01/18 – AMBAC Insured (Alternative Minimum Tax) | No Opt. Call | A3 | | 5,916,600 | |
| | 2,000 | | Capital Area Cultural Education Facilities Finance Corporation, Texas, Revenue Bonds, The Roman Catholic Diocese of Austin, Series 2005B. Remarketed, 6.125%, 4/01/45 | 4/20 at 100.00 | Baa2 | | 2,055,320 | |
| | 4,250 | | Ennis Independent School District, Ellis County, Texas, General Obligation Bonds, Series 2006, 0.000%, 8/15/26 | 8/16 at 60.73 | Aaa | | 2,066,988 | |
Nuveen Investments 41
| | | Nuveen Municipal Advantage Fund, Inc. (continued) |
| NMA | | Portfolio of Investments October 31, 2010 |
| | Principal | | | Optional Call | | | | |
| | Amount (000) | | Description (1) | Provisions (2) | Ratings (3) | | Value | |
| | | | Texas (continued) | | | | | |
| $ | 8,400 | | Gulf Coast Waste Disposal Authority, Texas, Waste Disposal Revenue Bonds, Valero Energy Corporation, Series 1999, 5.700%, 4/01/32 (Alternative Minimum Tax) | 4/11 at 100.00 | BBB | $ | 8,394,372 | |
| | 7,500 | | Harris County Health Facilities Development Corporation, Texas, Thermal Utility Revenue Bonds, TECO Project, Series 2003, 5.000%, 11/15/30 – NPFG Insured | 11/13 at 100.00 | AA | | 7,661,025 | |
| | 1,540 | | Houston Community College System, Texas, Limited Tax General Obligation Bonds, Series 2003, 5.000%, 2/15/28 – AMBAC Insured (UB) | 2/13 at 100.00 | AA+ | | 1,580,671 | |
| | 3,460 | | Houston Community College System, Texas, Limited Tax General Obligation Bonds, Series 2003, 5.000%, 2/15/28 (Pre-refunded 2/15/13) – AMBAC Insured | 2/13 at 100.00 | AA+ (4) | | 3,802,194 | |
| | | | Houston, Texas, Water Conveyance System Contract, Certificates of Participation, Series 1993A-J: | | | | | |
| | 5,490 | | 6.800%, 12/15/10 – AMBAC Insured | No Opt. Call | N/R | | 5,526,673 | |
| | 2,000 | | 6.800%, 12/15/11 – AMBAC Insured | No Opt. Call | N/R | | 2,111,640 | |
| | 6,080 | | Laredo Independent School District, Webb County, Texas, General Obligation Bonds, Series 2006, 5.000%, 8/01/29 | 8/16 at 100.00 | AAA | | 6,582,694 | |
| | 9,150 | | Leander Independent School District, Williamson and Travis Counties, Texas, General Obligation Bonds, Series 2004, 0.000%, 8/15/31 | 8/12 at 33.31 | AAA | | 2,808,684 | |
| | 9,345 | | Leander Independent School District, Williamson and Travis Counties, Texas, General Obligation Bonds, Series 2005, 0.000%, 8/15/34 – FGIC Insured | 8/15 at 35.34 | AA– | | 2,615,759 | |
| | 16,305 | | Matagorda County Navigation District 1, Texas, Revenue Bonds, Reliant Energy Inc., Series 1999B, 5.950%, 5/01/30 (Alternative Minimum Tax) | 11/10 at 100.50 | BBB– | | 16,324,400 | |
| | | | North Texas Thruway Authority, First Tier System Revenue Refunding Bonds, Capital Appreciation Series 2008I: | | | | | |
| | 2,555 | | 0.000%, 1/01/42 – AGC Insured | 1/25 at 100.00 | AA+ | | 2,160,942 | |
| | 7,000 | | 0.000%, 1/01/43 | 1/25 at 100.00 | A2 | | 5,745,390 | |
| | 3,425 | | Sabine River Authority, Texas, Pollution Control Revenue Refunding Bonds, TXU Electric Company, Series 2001A, 5.500%, 5/01/22 (Mandatory put 11/01/11) | No Opt. Call | CCC | | 3,259,264 | |
| | 4,700 | | Sam Rayburn Municipal Power Agency, Texas, Power Supply System Revenue Refunding Bonds, Series 2002A, 6.000%, 10/01/21 | 10/12 at 100.00 | Baa2 | | 4,839,590 | |
| | 3,000 | | Wylie Independent School District, Collin County, Texas, General Obligation Bonds, Series 2005, 0.000%, 8/15/21 | 8/15 at 74.57 | AAA | | 1,917,420 | |
| | 116,010 | | Total Texas | | | | 98,598,681 | |
| | | | Utah – 0.5% (0.3% of Total Investments) | | | | | |
| | 3,000 | | Riverton, Utah, Hospital Revenue Bonds, IHC Health Services, Inc., Series 2009, 5.000%, 8/15/41 | 8/19 at 100.00 | AA+ | | 3,127,680 | |
| | | | Virgin Islands – 0.3% (0.2% of Total Investments) | | | | | |
| | 1,480 | | Virgin Islands Public Finance Authority, Matching Fund Revenue Loan Note – Diageo Project, Series 2009A, 6.750%, 10/01/37 | 10/19 at 100.00 | BBB | | 1,668,833 | |
| | | | Virginia – 0.4% (0.3% of Total Investments) | | | | | |
| | 2,855 | | Tobacco Settlement Financing Corporation of Virginia, Tobacco Settlement Asset-Backed Bonds, Series 2007B2, 0.000%, 6/01/46 | 6/17 at 100.00 | Baa3 | | 1,816,522 | |
| | 940 | | Virginia Port Authority, Port Facilities Revenue Refunding Bonds Series 2010, 5.000%, 7/01/40 | 7/19 at 100.00 | Aa3 | | 987,160 | |
| | 3,795 | | Total Virginia | | | | 2,803,682 | |
| | | | Washington – 9.4% (6.2% of Total Investments) | | | | | |
| | 1,260 | | Central Puget Sound Regional Transit Authority, Washington, Sales Tax and Motor Vehicle Excise Tax Bonds, Series 1999, 4.750%, 2/01/28 – FGIC Insured | 2/11 at 100.00 | AAA | | 1,260,869 | |
| | 5,665 | | Chelan County Public Utility District 1, Washington, Hydro Consolidated System Revenue Bonds, Series 2002B, 5.250%, 7/01/37 (Mandatory put 7/01/12) – AMBAC Insured (Alternative Minimum Tax) | 7/12 at 100.00 | AA | | 5,652,480 | |
| | | | Chelan County Public Utility District 1, Washington, Hydro Consolidated System Revenue Bonds, Series 2001: | | | | | |
| | 10,730 | | 5.650%, 7/01/32 – NPFG Insured (Alternative Minimum Tax) (UB) | 7/11 at 101.00 | AA | | 10,845,669 | |
| | 8,810 | | 5.600%, 1/01/36 – NPFG Insured (Alternative Minimum Tax) (UB) | 7/11 at 101.00 | AA | | 8,872,727 | |
| | 2,485 | | Grant County Public Utility District 2, Washington, Revenue Bonds, Wanapum Hydroelectric Development, Series 2006B, 5.000%, 1/01/32 – NPFG Insured | No Opt. Call | AA– | | 2,584,425 | |
| | 10,730 | | Pierce County School District 320, Sumner, Washington, Unlimited Tax General Obligation Bonds, Series 2000, 6.250%, 12/01/17 (Pre-refunded 12/01/10) – AGM Insured | 12/10 at 100.00 | Aa1 (4) | | 10,787,406 | |
| | Principal | | | Optional Call | | | | |
| | Amount (000) | | Description (1) | Provisions (2) | Ratings (3) | | Value | |
| | | | Washington (continued) | | | | | |
| $ | 10,550 | | Port of Seattle, Washington, Limited Tax General Obligation Bonds, Series 2000B, 5.750%, 12/01/25 (Alternative Minimum Tax) (UB) | 1/11 at 100.00 | AAA | $ | 10,562,871 | |
| | 5,000 | | Port of Seattle, Washington, Special Facility Revenue Bonds, Terminal 18, Series 1999B, 6.000%, 9/01/20 – NPFG Insured (Alternative Minimum Tax) | 3/11 at 100.00 | A | | 5,025,350 | |
| | 2,000 | | Washington State Health Care Facilities Authority, Revenue Bonds, Fred Hutchinson Cancer Research Center, Series 2009A, 6.000%, 1/01/33 | 7/19 at 100.00 | A | | 2,104,680 | |
| | 2,315 | | Washington State Tobacco Settlement Authority, Tobacco Settlement Asset-Backed Revenue Bonds, Series 2002, 6.625%, 6/01/32 | 6/13 at 100.00 | BBB | | 2,351,276 | |
| | 1,270 | | Washington State, Motor Vehicle Fuel Tax General Obligation Bonds, Series 2003F, 0.000%, 12/01/24 – NPFG Insured | No Opt. Call | AA+ | | 742,111 | |
| | 60,815 | | Total Washington | | | | 60,789,864 | |
| | | | West Virginia – 0.8% (0.5% of Total Investments) | | | | | |
| | 5,000 | | Mason County, West Virginia, Pollution Control Revenue Bonds, Appalachian Power Company, Series 2003L, 5.500%, 10/01/22 | 10/11 at 100.00 | BBB | | 5,063,900 | |
| | | | Wisconsin – 2.2% (1.4% of Total Investments) | | | | | |
| | 535 | | Badger Tobacco Asset Securitization Corporation, Wisconsin, Tobacco Settlement Asset-Backed Bonds, Series 2002, 5.750%, 6/01/12 (ETM) | No Opt. Call | AAA | | 579,372 | |
| | 4,005 | | Badger Tobacco Asset Securitization Corporation, Wisconsin, Tobacco Settlement Asset-Backed Bonds, Series 2002, 6.125%, 6/01/27 (Pre-refunded 6/01/12) | 6/12 at 100.00 | AAA | | 4,266,565 | |
| | 565 | | Green Bay, Wisconsin, Water System Revenue Bonds, Series 2004, 5.000%, 11/01/29 – AGM Insured | 11/14 at 100.00 | Aa2 | | 587,520 | |
| | 5,000 | | Madison, Wisconsin, Industrial Development Revenue Refunding Bonds, Madison Gas and Electric Company Projects, Series 2002A, 5.875%, 10/01/34 (Alternative Minimum Tax) | 4/12 at 100.00 | AA– | | 5,060,150 | |
| | 3,000 | | Southeast Wisconsin Professional Baseball Park District, Sales Tax Revenue Refunding Bonds, Series 1998A, 5.500%, 12/15/19 – NPFG Insured | No Opt. Call | AA– | | 3,675,450 | |
| | 13,105 | | Total Wisconsin | | | | 14,169,057 | |
| $ | 1,149,151 | | Total Investments (cost $958,307,804) – 153.4% | | | | 985,104,177 | |
| | | | Floating Rate Obligations – (10.5)% | | | | (67,694,983 | ) |
| | | | Other Assets Less Liabilities – 3.3% | | | | 21,754,765 | |
| | | | Variable Rate Demand Preferred Shares, at Liquidation Value – (46.2)% (8) | | | | (296,800,000 | ) |
| | | | Net Assets Applicable to Common Shares – 100% | | | $ | 642,363,959 | |
| (1) | | All percentages shown in the Portfolio of Investments are based on net assets applicable to Common shares unless otherwise noted. |
| (2) | | Optional Call Provisions (not covered by the report of independent registered public accounting firm): Dates (month and year) and prices of the earliest optional call or redemption. There may be other call provisions at varying prices at later dates. Certain mortgage-backed securities may be subject to periodic principal paydowns. |
| (3) | | Ratings (not covered by the report of independent registered public accounting firm): Using the highest of Standard & Poor’s Group (“Standard & Poor’s”), Moody’s Investor Service, Inc. (“Moody’s”) or Fitch, Inc. (“Fitch”) rating. Ratings below BBB by Standard & Poor’s, Baa by Moody’s or BBB by Fitch are considered to be below investment grade. Holdings designated N/R are not rated by any of these national rating agencies. |
| (4) | | Backed by an escrow or trust containing sufficient U.S. Government or U.S. Government agency securities, which ensure the timely payment of principal and interest. Such investments are normally considered to be equivalent to AAA rated securities. |
| (5) | | For fair value measurement disclosure purposes, investment categorized as Level 3. See Notes to Financial Statements, Footnote 1 – General Information and Significant Accounting Policies, Investment Valuation for more information. |
| (6) | | The Fund’s Adviser has concluded this issue is not likely to meet its future interest payment obligations and has directed the Fund’s custodian to cease accruing additional income on the Fund’s records. |
| (7) | | Subsequent to the reporting period, the Fund’s Adviser has concluded this issue is not likely to meet its future payment obligations and has directed the Fund’s custodian to cease accruing additional income on the Fund’s records. |
| (8) | | Variable Rate Demand Preferred Shares, at Liquidation Value as a percentage of Total Investments is 30.1%. |
| N/R | | Not rated. |
| (ETM) | | Escrowed to maturity. |
| (IF) | | Inverse floating rate investment. |
| (UB) | | Underlying bond of an inverse floating rate trust reflected as a financing transaction. See Notes to Financial Statements, Footnote 1 – General Information and Significant Accounting Policies, Inverse Floating Rate Securities for more information. |
See accompanying notes to financial statements.
Nuveen Investments 43
| | | Nuveen Municipal Market Opportunity Fund, Inc. |
| NMO | | Portfolio of Investments |
October 31, 2010
| | Principal | | | Optional Call | | | | |
| | Amount (000) | | Description (1) | Provisions (2) | Ratings (3) | | Value | |
| | | | Alabama – 0.6% (0.4% of Total Investments) | | | | | |
| | | | Henry County Water Authority, Alabama, Water Revenue Bonds, Series 2006: | | | | | |
| $ | 1,935 | | 5.000%, 1/01/36 – RAAI Insured | 1/16 at 100.00 | N/R | $ | 1,701,078 | |
| | 2,485 | | 5.000%, 1/01/41 – RAAI Insured | 1/16 at 100.00 | N/R | | 2,131,012 | |
| | 4,420 | | Total Alabama | | | | 3,832,090 | |
| | | | Alaska – 2.9% (1.9% of Total Investments) | | | | | |
| | | | Alaska Housing Finance Corporation, General Housing Purpose Bonds, Series 2005A: | | | | | |
| | 1,125 | | 5.250%, 12/01/34 – FGIC Insured (UB) | 12/14 at 100.00 | AA | | 1,163,363 | |
| | 1,275 | | 5.250%, 12/01/41 – FGIC Insured (UB) | 12/14 at 100.00 | AA | | 1,313,174 | |
| | 7,000 | | Alaska Housing Finance Corporation, General Housing Purpose Bonds, Series 2005B-2, 5.250%, 12/01/30 – NPFG Insured | 6/15 at 100.00 | AA | | 7,238,630 | |
| | 13,025 | | Northern Tobacco Securitization Corporation, Alaska, Tobacco Settlement Asset-Backed Bonds, Series 2006A, 5.000%, 6/01/46 | 6/14 at 100.00 | Baa3 | | 9,154,360 | |
| | 22,425 | | Total Alaska | | | | 18,869,527 | |
| | | | California – 20.7% (13.6% of Total Investments) | | | | | |
| | 12,500 | | Anaheim Public Finance Authority, California, Subordinate Lease Revenue Bonds, Public Improvement Project, Series 1997C, 0.000%, 9/01/35 – AGM Insured | No Opt. Call | AA+ | | 2,601,625 | |
| | 1,350 | | Antelope Valley Union High School District, Los Angeles County, California, General Obligation Bonds, Series 2004B, 0.000%, 8/01/29 – NPFG Insured | No Opt. Call | Aa2 | | 441,410 | |
| | | | Bay Area Toll Authority, California, San Francisco Bay Area Toll Bridge Revenue Bonds, Series 2009-F1: | | | | | |
| | 2,500 | | 5.125%, 4/01/39 | 4/19 at 100.00 | AA | | 2,651,075 | |
| | 2,500 | | 5.625%, 4/01/44 | 4/19 at 100.00 | AA | | 2,779,475 | |
| | 8,000 | | Beverly Hills Unified School District, Los Angeles County, California, General Obligation Bonds, Series 2009, 0.000%, 8/01/33 | No Opt. Call | Aa1 | | 2,487,520 | |
| | 7,800 | | California County Tobacco Securitization Agency, Tobacco Settlement Asset-Backed Bonds, Los Angeles County Securitization Corporation, Series 2006A, 0.000%, 6/01/36 | 12/18 at 100.00 | Baa3 | | 6,235,164 | |
| | 5,000 | | California Department of Water Resources Central Valley Project Water System Revenue Bonds, Series 2009-AF, 5.000%, 12/01/29 | No Opt. Call | AAA | | 5,507,600 | |
| | 1,350 | | California Educational Facilities Authority, Revenue Refunding Bonds, Loyola Marymount University, Series 2001A, 0.000%, 10/01/39 – NPFG Insured | No Opt. Call | A2 | | 208,724 | |
| | 4,295 | | California Health Facilities Financing Authority, Health Facility Revenue Bonds, Adventist Health System/West, Series 2003A, 5.000%, 3/01/33 | 3/13 at 100.00 | A | | 4,237,834 | |
| | 9,000 | | California Health Facilities Financing Authority, Revenue Bonds, Kaiser Permanante System, Series 2006, 5.250%, 3/01/45 | 3/16 at 100.00 | A+ | | 9,049,230 | |
| | 7,000 | | California State, General Obligation Bonds, Various Purpose Series 2010, 5.250%, 3/01/30 | 3/20 at 100.00 | A1 | | 7,366,240 | |
| | 1,550 | | California Statewide Community Development Authority, Revenue Bonds, St. Joseph Health System, Series 2007A, 5.750%, 7/01/47 – FGIC Insured | 7/18 at 100.00 | AA– | | 1,618,789 | |
| | 25,000 | | California, Various Purpose General Obligation Bonds, Series 2005, 4.750%, 3/01/35 – NPFG Insured (UB) | 3/16 at 100.00 | A1 | | 24,073,000 | |
| | 10,445 | | Castaic Lake Water Agency, California, Certificates of Participation, Water System Improvement Project, Series 1999, 0.000%, 8/01/29 – AMBAC Insured | No Opt. Call | AA | | 3,653,348 | |
| | 8,365 | | Cupertino Union School District, Santa Clara County, California, General Obligation Bonds, Series 2003B, 0.000%, 8/01/26 – FGIC Insured | 8/13 at 52.66 | Aa1 | | 3,618,532 | |
| | 5,000 | | Golden State Tobacco Securitization Corporation, California, Enhanced Tobacco Settlement Asset-Backed Bonds, Series 2003B, 5.000%, 6/01/38 (Pre-refunded 6/01/13) – AMBAC Insured | 6/13 at 100.00 | AAA | | 5,551,850 | |
| | | | Golden State Tobacco Securitization Corporation, California, Enhanced Tobacco Settlement Asset-Backed Revenue Bonds, Series 2005A: | | | | | |
| | 3,500 | | 0.000%, 6/01/26 – AGM Insured | No Opt. Call | AA+ | | 1,502,235 | |
| | 3,000 | | 5.000%, 6/01/45 | 6/15 at 100.00 | A2 | | 2,848,770 | |
| | 1,000 | | Golden State Tobacco Securitization Corporation, California, Tobacco Settlement Asset-Backed Bonds, Series 2007A-1, 5.125%, 6/01/47 | 6/17 at 100.00 | BBB | | 720,710 | |
| | Principal | | | Optional Call | | | | |
| | Amount (000) | | Description (1) | Provisions (2) | Ratings (3) | | Value | |
| | | | California (continued) | | | | | |
| $ | 1,500 | | Lincoln Unified School District, Placer County, California, Community Facilities District 1, Special Tax Bonds, Series 2005, 0.000%, 9/01/26 – AMBAC Insured | No Opt. Call | N/R | $ | 545,445 | |
| | 490 | | Los Angeles Department of Water and Power, California, Electric Plant Revenue Bonds, Second Series 1993, 4.750%, 10/15/20 (ETM) | 4/11 at 100.00 | AA– (4) | | 491,401 | |
| | 995 | | Los Angeles Department of Water and Power, California, Electric Plant Revenue Bonds, Series 1994, 5.375%, 2/15/34 (ETM) | 2/11 at 100.00 | AA– (4) | | 998,512 | |
| | 5,000 | | Los Angeles Department of Water and Power, California, Waterworks Revenue Bonds, Series 2003A, 5.125%, 7/01/40 – FGIC Insured | 7/12 at 100.00 | AA | | 5,075,800 | |
| | 2,200 | | M-S-R Energy Authority, California, Gas Revenue Bonds, Citigroup Prepay Contracts, Series 2009B, 6.500%, 11/01/39 | No Opt. Call | A | | 2,581,546 | |
| | 14,000 | | New Haven Unified School District, California, General Obligation Bonds, Refunding Series 2009, 0.000%, 8/01/34 – AGC Insured | No Opt. Call | AA+ | | 3,358,880 | |
| | 1,000 | | Pajaro Valley Unified School District, Santa Cruz County, California, General Obligation Bonds, Series 2005B, 0.000%, 8/01/29 – AGM Insured | No Opt. Call | AA+ | | 341,210 | |
| | 4,795 | | Palomar Pomerado Health, California, General Obligation Bonds, Election of 2004, Series 2007A, 5.000%, 8/01/32 – NPFG Insured | No Opt. Call | A+ | | 4,866,014 | |
| | 8,040 | | Placentia-Yorba Linda Unified School District, Orange County, California, Certificates of Participation, Series 2006, 0.000%, 10/01/34 – FGIC Insured | No Opt. Call | A+ | | 1,792,196 | |
| | 3,205 | | San Diego Community College District, California, General Obligation Bonds, Series 2005, 5.000%, 5/01/25 – AGM Insured | 5/15 at 100.00 | AA+ | | 3,511,334 | |
| | | | San Joaquin Hills Transportation Corridor Agency, Orange County, California, Toll Road Revenue Refunding Bonds, Series 1997A: | | | | | |
| | 5,000 | | 5.650%, 1/15/17 – NPFG Insured | 1/14 at 102.00 | A | | 4,863,250 | |
| | 26,000 | | 0.000%, 1/15/35 – NPFG Insured | No Opt. Call | A | | 4,068,220 | |
| | 5,000 | | San Jose-Evergreen Community College District, Santa Clara County, California, General Obligation Bonds, Series 2005A, 0.000%, 9/01/28 – NPFG Insured | 9/15 at 50.47 | Aa1 | | 1,796,850 | |
| | 7,345 | | Sanger Unified School District, Fresno County, California, General Obligation Bonds, Series 2006A, 5.000%, 8/01/27 – AGM Insured | 8/16 at 102.00 | AA+ | | 7,857,387 | |
| | 4,825 | | Santa Monica Community College District, Los Angeles County, California, General Obligation Bonds, Series 2005C, 0.000%, 8/01/25 – NPFG Insured | No Opt. Call | Aa1 | | 2,220,272 | |
| | 2,550 | | Vista Unified School District, San Diego County, California, General Obligation Bonds, Series 2004B, 5.000%, 8/01/28 – FGIC Insured | 8/13 at 100.00 | Aa2 | | 2,649,501 | |
| | 211,100 | | Total California | | | | 134,170,949 | |
| | | | Colorado – 8.3% (5.5% of Total Investments) | | | | | |
| | 1,085 | | Arkansas River Power Authority, Colorado, Power Revenue Bonds, Series 2006, 5.250%, 10/01/40 – SYNCORA GTY Insured | 10/16 at 100.00 | BBB | | 1,052,320 | |
| | 3,000 | | Broomfield, Colorado, Master Facilities Lease Purchase Agreement, Certificates of Participation, Series 1999, 5.750%, 12/01/24 – AMBAC Insured | 12/10 at 100.00 | Aa3 | | 3,010,650 | |
| | 6,385 | | Broomfield, Colorado, Sales and Use Tax Revenue Refunding and Improvement Bonds, Series 2002A, 5.500%, 12/01/22 – AMBAC Insured | 12/12 at 100.00 | Aa3 | | 6,850,722 | |
| | 6,830 | | Colorado Health Facilities Authority, Health Facilities Revenue Bonds, Sisters of Charity of Leavenworth Health Services Corporation, Series 2010A, 5.000%, 1/01/40 | No Opt. Call | AA | | 6,980,806 | |
| | 7,955 | | Denver City and County, Colorado, Airport System Revenue Refunding Bonds, Series 2000A, 6.000%, 11/15/18 – AMBAC Insured (Alternative Minimum Tax) | 11/10 at 100.00 | A+ | | 7,984,513 | |
| | | | E-470 Public Highway Authority, Colorado, Senior Revenue Bonds, Series 2000B: | | | | | |
| | 6,200 | | 0.000%, 9/01/22 – NPFG Insured | No Opt. Call | A | | 3,149,724 | |
| | 9,450 | | 0.000%, 9/01/30 – NPFG Insured | No Opt. Call | A | | 2,605,932 | |
| | 15,960 | | 0.000%, 9/01/33 – NPFG Insured | No Opt. Call | A | | 3,527,320 | |
| | | | E-470 Public Highway Authority, Colorado, Toll Revenue Bonds, Series 2004B: | | | | | |
| | 3,800 | | 0.000%, 9/01/27 – NPFG Insured | 9/20 at 67.94 | A | | 1,313,318 | |
| | 13,300 | | 0.000%, 9/01/31 – NPFG Insured | 9/20 at 53.77 | A | | 3,281,243 | |
| | 6,250 | | 0.000%, 9/01/32 – NPFG Insured | 9/20 at 50.83 | A | | 1,411,688 | |
| | 10,000 | | 0.000%, 3/01/36 – NPFG Insured | 9/20 at 41.72 | A | | 1,695,700 | |
Nuveen Investments 45
| | | Nuveen Municipal Market Opportunity Fund, Inc. (continued) |
| NMO | | Portfolio of Investments October 31, 2010 |
| | Principal | | | Optional Call | | | | |
| | Amount (000) | | Description (1) | Provisions (2) | Ratings (3) | | Value | |
| | | | Colorado (continued) | | | | | |
| $ | 10,000 | | Regional Transportation District, Colorado, Denver Transit Partners Eagle P3 Project Private Activity Bonds, Series 2010, 6.500%, 1/15/30 | 7/20 at 100.00 | Baa3 | $ | 11,068,900 | |
| | 100,215 | | Total Colorado | | | | 53,932,836 | |
| | | | District of Columbia – 1.5% (1.0% of Total Investments) | | | | | |
| | 10,000 | | Washington Convention Center Authority, District of Columbia, Senior Lien Dedicated Tax Revenue Bonds, Series 2007A, 4.500%, 10/01/30 – AMBAC Insured | 10/16 at 100.00 | A1 | | 10,000,700 | |
| | | | Florida – 2.4% (1.6% of Total Investments) | | | | | |
| | 5,592 | | Florida Housing Finance Corporation, Homeowner Mortgage Revenue Bonds, Series 2008, Trust 1191, 8.565%, 1/01/27 (Alternative Minimum Tax) (IF) | 1/17 at 100.00 | AA+ | | 5,531,606 | |
| | 2,500 | | Miami-Dade County, Florida, Aviation Revenue Bonds, Miami International Airport, Series 2010A-1, 5.375%, 10/01/41 | 10/20 at 100.00 | A2 | | 2,587,350 | |
| | 3,000 | | Miami-Dade County, Florida, Aviation Revenue Bonds, Miami International Airport, Series 2010B, 5.000%, 10/01/26 | 10/20 at 100.00 | A2 | | 3,164,340 | |
| | 4,000 | | Orlando, Florida, Tourist Development Tax Revenue Bonds, Senior Lien 6th Cent Contract Payments, Series 2008A, 5.250%, 11/01/23 – AGC Insured | 11/17 at 100.00 | AA+ | | 4,082,640 | |
| | 15,092 | | Total Florida | | | | 15,365,936 | |
| | | | Georgia – 1.7% (1.1% of Total Investments) | | | | | |
| | 10,000 | | Gainesville and Hall County Hospital Authority, Georgia, Revenue Anticipation Certificates, Northeast Georgia Health Services Inc., Series 2010B, 5.250%, 2/15/45 | 2/41 at 100.00 | A+ | | 10,161,000 | |
| | 1,245 | | Royston Hospital Authority, Georgia, Revenue Anticipation Certificates, Ty Cobb Healthcare System Inc., Series 1999, 6.500%, 7/01/27 | 1/11 at 101.00 | N/R | | 1,171,346 | |
| | 11,245 | | Total Georgia | | | | 11,332,346 | |
| | | | Illinois – 15.3% (10.0% of Total Investments) | | | | | |
| | 4,595 | | Bolingbrook, Illinois, General Obligation Refunding Bonds, Series 2002B, 0.000%, 1/01/32 – FGIC Insured | No Opt. Call | Aa3 | | 1,330,620 | |
| | 4,600 | | Chicago Board of Education, Illinois, Unlimited Tax General Obligation Bonds, Dedicated Tax Revenues, Series 1999A, 0.000%, 12/01/20 – FGIC Insured | No Opt. Call | Aa2 | | 2,999,706 | |
| | 4,000 | | Chicago, Illinois, Motor Fuel Tax Revenue Bonds, Series 2003A, 5.000%, 1/01/33 – AMBAC Insured | 7/13 at 100.00 | AA+ | | 4,062,160 | |
| | 5,000 | | Chicago, Illinois, Motor Fuel Tax Revenue Bonds, Series 2008A, 5.000%, 1/01/38 – AGC Insured | 1/18 at 100.00 | AA+ | | 5,156,150 | |
| | 1,885 | | Chicago, Illinois, Motor Fuel Tax Revenue Refunding Bonds, Series 1993, 5.375%, 1/01/14 – AMBAC Insured | No Opt. Call | AA+ | | 2,010,522 | |
| | 5,250 | | Chicago, Illinois, Revenue Bonds, Midway Airport, Series 1998B, 5.000%, 1/01/28 – NPFG Insured | 1/11 at 100.00 | A | | 5,255,355 | |
| | 2,000 | | Chicago, Illinois, Third Lien General Airport Revenue Bonds, O’Hare International Airport, Series 2003C-2, 5.250%, 1/01/30 – AGM Insured (Alternative Minimum Tax) | 1/14 at 100.00 | AA+ | | 2,035,180 | |
| | 7,100 | | Cook County, Illinois, General Obligation Bonds, Refunding Series 2010A, 5.250%, 11/15/33 | 11/20 at 100.00 | AA | | 7,609,425 | |
| | 1,780 | | Illinois Educational Facilities Authority, Revenue Bonds, University of Chicago, Refunding Series 2003A, 5.000%, 7/01/33 | 7/13 at 100.00 | Aa1 | | 1,830,089 | |
| | 10,000 | | Illinois Finance Authority, Illinois, Northwestern University, Revenue Bonds, Series 2006, 5.000%, 12/01/42 (UB) | 12/15 at 100.00 | AAA | | 10,332,700 | |
| | 3,000 | | Illinois Finance Authority, Revenue Bonds, Memorial Health System, Series 2009, 5.500%, 4/01/34 | No Opt. Call | A+ | | 3,062,670 | |
| | 5,000 | | Illinois Finance Authority, Revenue Bonds, OSF Healthcare System, Refunding Series 2010A, 6.000%, 5/15/39 | 5/20 at 100.00 | A | | 5,293,950 | |
| | 5,500 | | Illinois Finance Authority, Revenue Refunding Bonds, Silver Cross Hospital and Medical Centers, Series 2008A, 5.500%, 8/15/30 | 8/18 at 100.00 | BBB | | 5,657,410 | |
| | 2,060 | | Illinois Health Facilities Authority, Revenue Bonds, Sherman Health Systems, Series 1997, 5.250%, 8/01/17 – AMBAC Insured | 12/10 at 100.00 | BBB | | 2,060,845 | |
| | | | Lake and McHenry Counties Community Unit School District 118, Wauconda, Illinois, General Obligation Bonds, Series 2005B: | | | | | |
| | 10,230 | | 0.000%, 1/01/22 – AGM Insured | 1/15 at 70.63 | Aa3 | | 6,084,702 | |
| | 6,780 | | 0.000%, 1/01/24 – AGM Insured | 1/15 at 63.44 | Aa3 | | 3,563,839 | |
| | Principal | | | Optional Call | | | | |
| | Amount (000) | | Description (1) | Provisions (2) | Ratings (3) | | Value | |
| | | | Illinois (continued) | | | | | |
| $ | 1,975 | | Lake County Community High School District 127, Grayslake, Illinois, General Obligation Bonds, Series 2002A, 9.000%, 2/01/13 – FGIC Insured | No Opt. Call | AAA | $ | 2,329,690 | |
| | 2,330 | | Metropolitan Pier and Exposition Authority, Illinois, Revenue Bonds, McCormick Place Expansion Project, Refunding Series 2010B-2, 5.000%, 6/15/50 | No Opt. Call | AAA | | 2,306,048 | |
| | | | Metropolitan Pier and Exposition Authority, Illinois, Revenue Bonds, McCormick Place Expansion Project, Series 2002A: | | | | | |
| | 6,500 | | 0.000%, 6/15/25 – NPFG Insured | 6/22 at 101.00 | AAA | | 5,048,810 | |
| | 3,270 | | 5.000%, 12/15/28 – NPFG Insured | 6/12 at 101.00 | AAA | | 3,331,443 | |
| | 3,700 | | 0.000%, 6/15/30 – NPFG Insured | No Opt. Call | AAA | | 1,209,160 | |
| | 3,280 | | 0.000%, 6/15/37 – NPFG Insured | No Opt. Call | AAA | | 662,199 | |
| | 11,715 | | 0.000%, 12/15/38 – NPFG Insured | No Opt. Call | AAA | | 2,161,300 | |
| | 9,170 | | 0.000%, 6/15/39 – NPFG Insured | No Opt. Call | AAA | | 1,637,120 | |
| | 6,500 | | Metropolitan Pier and Exposition Authority, Illinois, Revenue Refunding Bonds, McCormick Place Expansion Project, Series 2002B, 5.750%, 6/15/23 – NPFG Insured | 6/12 at 101.00 | AAA | | 6,968,650 | |
| | 2,080 | | Midlothian, Illinois, General Obligation Bonds, Series 2010A, 5.250%, 2/01/34 | 2/20 at 100.00 | AA+ | | 2,110,285 | |
| | 2,685 | | Sterling, Whiteside County, Illinois, General Obligation Bonds, Recovery Zone Facility Series 2010A, 5.250%, 5/01/31 – AGM Insured | 5/20 at 100.00 | AA+ | | 2,820,270 | |
| | 131,985 | | Total Illinois | | | | 98,930,298 | |
| | | | Indiana – 2.7% (1.8% of Total Investments) | | | | | |
| | 4,695 | | Indiana Educational Facilities Authority, Revenue Bonds, Butler University, Series 2001, 5.500%, 2/01/26 – NPFG Insured | 2/11 at 100.00 | A | | 4,731,715 | |
| | 4,030 | | Indiana Finance Authority Health System Revenue Bonds, Sisters of St. Francis Health Services, Inc. Obligated Group, Series 2009, 5.250%, 11/01/39 | 11/19 at 100.00 | Aa3 | | 4,209,254 | |
| | 6,000 | | Indiana Finance Authority, Revenue Bonds, Trinity Health Care Group, Refunding Series 2009A, 5.250%, 12/01/38 | 12/19 at 100.00 | AA | | 6,350,760 | |
| | 2,000 | | Petersburg, Indiana, Pollution Control Revenue Refunding Bonds, Indianapolis Power and Light Company, Series 1991, 5.750%, 8/01/21 | 8/11 at 102.00 | A3 | | 2,051,080 | |
| | 16,725 | | Total Indiana | | | | 17,342,809 | |
| | | | Iowa – 0.8% (0.5% of Total Investments) | | | | | |
| | 970 | | Iowa Finance Authority, Health Facility Revenue Bonds, Care Initiatives Project, Series 2006A, 5.000%, 7/01/19 | 7/16 at 100.00 | BB+ | | 886,638 | |
| | 5,000 | | Iowa Tobacco Settlement Authority, Tobacco Asset-Backed Revenue Bonds, Series 2005B, 5.600%, 6/01/34 | 6/17 at 100.00 | BBB | | 4,482,600 | |
| | 5,970 | | Total Iowa | | | | 5,369,238 | |
| | | | Kansas – 1.1% (0.7% of Total Investments) | | | | | |
| | 2,500 | | Kansas Development Finance Authority, Water Pollution Control Revolving Fund Leveraged Bonds, Series 2002-II, 5.500%, 11/01/21 | 11/12 at 100.00 | AAA | | 2,692,100 | |
| | 3,715 | | Overland Park Development Corporation, Kansas, First Tier Revenue Bonds, Overland Park Convention Center, Series 2007A, 5.125%, 1/01/22 – AMBAC Insured | 1/17 at 100.00 | Baa3 | | 3,677,999 | |
| | 500 | | Salina, Kansas, Hospital Revenue Bonds, Salina Regional Medical Center, Series 2006, 4.625%, 10/01/31 | 4/16 at 100.00 | A1 | | 500,840 | |
| | 6,715 | | Total Kansas | | | | 6,870,939 | |
| | | | Kentucky – 0.2% (0.1% of Total Investments) | | | | | |
| | 1,000 | | Kentucky Economic Development Finance Authority, Louisville Arena Project Revenue Bonds, Louisville Arena Authority, Inc., Series 2008-A1, 6.000%, 12/01/38 – AGC Insured | 6/18 at 100.00 | AA+ | | 1,081,800 | |
| | | | Louisiana – 3.2% (2.1% of Total Investments) | | | | | |
| | 7,415 | | Louisiana Local Government Environmental Facilities and Community Development Authority, Revenue Bonds, Baton Rouge Community College Facilities Corporation, Series 2002, 5.000%, 12/01/32 – NPFG Insured | 12/12 at 100.00 | A | | 7,474,617 | |
Nuveen Investments 47
| | | Nuveen Municipal Market Opportunity Fund, Inc. (continued) |
| NMO | | Portfolio of Investments October 31, 2010 |
| | Principal | | | Optional Call | | | | |
| | Amount (000) | | Description (1) | Provisions (2) | Ratings (3) | | Value | |
| | | | Louisiana (continued) | | | | | |
| | | | Louisiana Public Facilities Authority, Revenue Bonds, Baton Rouge General Hospital, Series 2004: | | | | | |
| $ | 1,765 | | 5.250%, 7/01/24 – NPFG Insured | 7/14 at 100.00 | A | $ | 1,824,922 | |
| | 3,350 | | 5.250%, 7/01/33 – NPFG Insured | 7/14 at 100.00 | A | | 3,406,749 | |
| | 7,850 | | Tobacco Settlement Financing Corporation, Louisiana, Tobacco Settlement Asset-Backed Bonds, Series 2001B, 5.875%, 5/15/39 | 5/11 at 101.00 | BBB | | 7,925,125 | |
| | 20,380 | | Total Louisiana | | | | 20,631,413 | |
| | | | Maryland – 1.1% (0.8% of Total Investments) | | | | | |
| | 4,410 | | Maryland Community Development Administration, Department of Housing and Community Development, Residential Revenue Bonds, Series 2007D, 4.900%, 9/01/42 (Alternative Minimum Tax) | 3/17 at 100.00 | Aa2 | | 4,421,642 | |
| | 2,500 | | Maryland Department of Transportation, Consolidated Transportation Revenue Bonds, Series 2002, 5.500%, 2/01/16 | No Opt. Call | AAA | | 3,011,925 | |
| | 6,910 | | Total Maryland | | | | 7,433,567 | |
| | | | Michigan – 2.9% (1.9% of Total Investments) | | | | | |
| | 5,000 | | Detroit Water Supply System, Michigan, Water Supply System Revenue Bonds, Series 2006D, 4.625%, 7/01/32 – AGM Insured | 7/16 at 100.00 | AA+ | | 4,935,650 | |
| | 5,000 | | Michigan State Hospital Finance Authority, Hospital Revenue Bonds, Henry Ford Health System, Refunding Series 2009, 5.750%, 11/15/39 | 11/19 at 100.00 | A1 | | 5,188,950 | |
| | 3,050 | | Michigan Tobacco Settlement Finance Authority, Tobacco Settlement Asset-Backed Revenue Bonds, Series 2008A, 6.875%, 6/01/42 | 6/18 at 100.00 | Baa3 | | 3,070,313 | |
| | 1,150 | | Royal Oak Hospital Finance Authority, Michigan, Hospital Revenue Bonds, William Beaumont Hospital, Refunding Series 2009V, 8.250%, 9/01/39 | 9/18 at 100.00 | A1 | | 1,386,498 | |
| | 3,795 | | Utica Community Schools, Macomb County, Michigan, General Obligation Bonds, Series 2004, 5.000%, 5/01/19 | 11/13 at 100.00 | AA | | 4,162,773 | |
| | 17,995 | | Total Michigan | | | | 18,744,184 | |
| | | | Minnesota – 0.9% (0.6% of Total Investments) | | | | | |
| | 930 | | Minnesota Agricultural and Economic Development Board, Healthcare System Revenue Bonds, Fairview Hospital and Healthcare Services, Series 2000A, 6.375%, 11/15/29 | 11/10 at 101.00 | A | | 940,128 | |
| | 1,520 | | Minnesota Housing Finance Agency, Single Family Remarketed Mortgage Bonds, Series 1998H-2, 6.050%, 7/01/31 (Alternative Minimum Tax) | 1/11 at 101.00 | AA+ | | 1,567,226 | |
| | 2,685 | | St. Paul Housing and Redevelopment Authority, Minnesota, Sales Tax Revenue Refunding Bonds, Civic Center Project, Series 1996, 7.100%, 11/01/23 – AGM Insured | 11/15 at 103.00 | AA+ | | 3,301,234 | |
| | 5,135 | | Total Minnesota | | | | 5,808,588 | |
| | | | Mississippi – 0.9% (0.6% of Total Investments) | | | | | |
| | 5,900 | | Mississippi Business Finance Corporation, Pollution Control Revenue Refunding Bonds, System Energy Resources Inc. Project, Series 1998, 5.875%, 4/01/22 | 4/11 at 100.00 | BBB | | 5,929,500 | |
| | | | Missouri – 0.8% (0.5% of Total Investments) | | | | | |
| | | | Kansas City Municipal Assistance Corporation, Missouri, Leasehold Revenue Bonds, Series 2004B-1: | | | | | |
| | 8,000 | | 0.000%, 4/15/27 – AMBAC Insured | No Opt. Call | AA– | | 3,464,000 | |
| | 5,000 | | 0.000%, 4/15/31 – AMBAC Insured | No Opt. Call | AA– | | 1,664,650 | |
| | 13,000 | | Total Missouri | | | | 5,128,650 | |
| | | | Nebraska – 1.8% (1.2% of Total Investments) | | | | | |
| | 11,690 | | Omaha Convention Hotel Corporation, Nebraska, Convention Center Revenue Bonds, Series 2007, 5.000%, 2/01/35 – AMBAC Insured | 2/17 at 100.00 | Aa3 | | 11,969,625 | |
| | | | Nevada – 5.8% (3.8% of Total Investments) | | | | | |
| | 15,000 | | Clark County, Nevada, Airport Revenue Bonds, Subordinate Lien Series 2010B, 5.750%, 7/01/42 | 1/20 at 100.00 | Aa3 | | 16,149,900 | |
| | 11,615 | | Clark County, Nevada, Passenger Facility Charge Revenue Bonds, Las Vegas-McCarran International Airport, Series 2010A, 5.250%, 7/01/42 | 1/20 at 100.00 | Aa3 | | 12,041,967 | |
| | Principal | | | Optional Call | | | | |
| | Amount (000) | | Description (1) | Provisions (2) | Ratings (3) | | Value | |
| | | | Nevada (continued) | | | | | |
| | | | Director of Nevada State Department of Business and Industry, Revenue Bonds, Las Vegas Monorail Project, First Tier, Series 2000: | | | | | |
| $ | 6,125 | | 0.000%, 1/01/17 – AMBAC Insured | No Opt. Call | N/R | $ | 925,243 | |
| | 8,500 | | 0.000%, 1/01/26 – AMBAC Insured | No Opt. Call | N/R | | 739,840 | |
| | 7,860 | | 0.000%, 1/01/27 – AMBAC Insured | No Opt. Call | N/R | | 643,262 | |
| | 19,300 | | 5.375%, 1/01/40 – AMBAC Insured (5) | 1/11 at 100.00 | N/R | | 4,055,509 | |
| | 2,135 | | Reno, Nevada, Capital Improvement Revenue Bonds, Series 2005B, 0.000%, 6/01/37 – FGIC Insured | 6/15 at 33.61 | A | | 348,112 | |
| | 2,500 | | Reno, Nevada, Health Facilities Revenue Bonds, Catholic Healthcare West, Trust 2634, 18.114% 7/01/31 – BHAC Insured (IF) | 7/17 at 100.00 | AA+ | | 2,983,300 | |
| | 73,035 | | Total Nevada | | | | 37,887,133 | |
| | | | New Hampshire – 0.5% (0.3% of Total Investments) | | | | | |
| | 3,000 | | New Hampshire Business Finance Authority, Revenue Bonds, Elliot Hospital Obligated Group Issue, Series 2009A, 6.125%, 10/01/39 | 10/19 at 100.00 | BBB+ | | 3,109,260 | |
| | | | New Jersey – 4.1% (2.7% of Total Investments) | | | | | |
| | 18,400 | | New Jersey Health Care Facilities Financing Authority, Revenue Bonds, Saint Barnabas Health Care System, Series 2006A, 0.000%, 7/01/37 | 1/17 at 35.47 | BBB– | | 2,642,424 | |
| | 35,000 | | New Jersey Transportation Trust Fund Authority, Transportation System Bonds, Series 2006C, 0.000%, 12/15/34 – AGM Insured | No Opt. Call | AA+ | | 9,159,500 | |
| | 5,000 | | New Jersey Turnpike Authority, Revenue Bonds, Growth and Income Securities, Series 2004B, 5.150%, 1/01/35 – AMBAC Insured | 1/17 at 100.00 | A+ | | 4,163,950 | |
| | 3,000 | | Rahway Valley Sewerage Authority, New Jersey, Sewer Revenue Bonds, Series 2005A, 0.000%, 9/01/25 – NPFG Insured | No Opt. Call | Aa2 | | 1,477,590 | |
| | 3,525 | | Tobacco Settlement Financing Corporation, New Jersey, Tobacco Settlement Asset-Backed Bonds, Series 2002, 6.125%, 6/01/42 (Pre-refunded 6/01/12) | 6/12 at 100.00 | AAA | | 3,843,590 | |
| | 2,100 | | Tobacco Settlement Financing Corporation, New Jersey, Tobacco Settlement Asset-Backed Bonds, Series 2003, 6.375%, 6/01/32 (Pre-refunded 6/01/13) | 6/13 at 100.00 | AAA | | 2,359,371 | |
| | 4,000 | | Tobacco Settlement Financing Corporation, New Jersey, Tobacco Settlement Asset-Backed Bonds, Series 2007-1A, 5.000%, 6/01/41 | 6/17 at 100.00 | BBB | | 2,883,800 | |
| | 71,025 | | Total New Jersey | | | | 26,530,225 | |
| | | | New Mexico – 1.4% (0.9% of Total Investments) | | | | | |
| | 5,925 | | New Mexico Hospital Equipment Loan Council, Hospital Revenue Bonds, Presbyterian Healthcare Services, Series 2001A, 5.500%, 8/01/21 (Pre-refunded 8/01/11) | 8/11 at 101.00 | AA– (4) | | 6,213,251 | |
| | 2,475 | | University of New Mexico, Revenue Refunding Bonds, Series 1992A, 6.250%, 6/01/12 | No Opt. Call | AA | | 2,597,117 | |
| | 8,400 | | Total New Mexico | | | | 8,810,368 | |
| | | | New York – 4.8% (3.2% of Total Investments) | | | | | |
| | 7,000 | | Brooklyn Areba Local Development Corporation, New York, Payment in Lieu of Taxes Revenue Bonds, Barclays Center Project, Series 2009, 0.000%, 7/15/45 | No Opt. Call | BBB– | | 812,910 | |
| | 3,000 | | Long Island Power Authority, New York, Electric System General Revenue Bonds, Series 2006B, 5.000%, 12/01/35 | 6/16 at 100.00 | A– | | 3,098,730 | |
| | 3,500 | | Monroe County Industrial Development Corporation, New York, FHA Insured Mortgage Revenue Bonds, Unity Hospital of Rochester Project, Series 2010, 5.750%, 8/15/30 (WI/DD, Settling 11/05/10) | 2/21 at 100.00 | Aa2 | | 3,924,515 | |
| | 5 | | New York City, New York, General Obligation Bonds, Fiscal Series 1997H, 6.125%, 8/01/25 | 12/10 at 100.00 | AA | | 5,021 | |
| | 4,865 | | New York City, New York, General Obligation Bonds, Fiscal Series 2002A, 5.750%, 8/01/16 | 8/12 at 100.00 | AA | | 5,252,449 | |
| | 135 | | New York City, New York, General Obligation Bonds, Fiscal Series 2002A, 5.750%, 8/01/16 (Pre-refunded 8/01/12) | 8/12 at 100.00 | Aa2 (4) | | 147,601 | |
| | | | New York City, New York, General Obligation Bonds, Fiscal Series 2002G: | | | | | |
| | 1,000 | | 5.000%, 8/01/17 | 8/12 at 100.00 | AA | | 1,066,360 | |
| | 5,410 | | 5.750%, 8/01/18 | 8/12 at 100.00 | AA | | 5,835,334 | |
Nuveen Investments 49
| | | Nuveen Municipal Market Opportunity Fund, Inc. (continued) |
| NMO | | Portfolio of Investments October 31, 2010 |
| | Principal | | | Optional Call | | | | |
| | Amount (000) | | Description (1) | Provisions (2) | Ratings (3) | | Value | |
| | | | New York (continued) | | | | | |
| $ | 1,120 | | New York City, New York, General Obligation Bonds, Fiscal Series 2002G, 5.750%, 8/01/18 (Pre-refunded 8/01/12) | 8/12 at 100.00 | AA (4) | $ | 1,224,541 | |
| | 10,000 | | Port Authority of New York and New Jersey, Special Project Bonds, JFK International Air Terminal LLC, Sixth Series 1997, 5.750%, 12/01/22 – NPFG Insured (Alternative Minimum Tax) | 12/10 at 100.00 | A | | 10,021,400 | |
| | 36,035 | | Total New York | | | | 31,388,861 | |
| | | | North Carolina – 5.8% (3.8% of Total Investments) | | | | | |
| | 1,900 | | Charlotte-Mecklenburg Hospital Authority, North Carolina, Healthcare System Revenue Bonds, DBA Carolinas Healthcare System, Series 2005A, 5.000%, 1/15/45 (Pre-refunded 1/15/15) | 1/15 at 100.00 | AAA | | 2,203,392 | |
| | 17,000 | | North Carolina Capital Facilities Financing Agency, Revenue Bonds, Duke University, Series 2005A, 5.000%, 10/01/41 | 10/15 at 100.00 | AA+ | | 17,864,620 | |
| | 3,000 | | North Carolina Eastern Municipal Power Agency, Power System Revenue Bonds, Series 2005, 5.250%, 1/01/20 – AMBAC Insured | 1/16 at 100.00 | A– | | 3,358,410 | |
| | 4,000 | | North Carolina Medical Care Commission, Health System Revenue Bonds, Mission St. Joseph’s Health System, Series 2007, 4.500%, 10/01/31 (UB) | 10/17 at 100.00 | AA | | 3,983,760 | |
| | 7,500 | | North Carolina Municipal Power Agency 1, Catawba Electric Revenue Bonds, Series 2003A, 5.250%, 1/01/19 – NPFG Insured | 1/13 at 100.00 | A | | 8,066,925 | |
| | 1,900 | | North Carolina Turnpike Authority, Triangle Expressway System Revenue Bonds, Series 2009A, 5.750%, 1/01/39 – AGC Insured | 1/19 at 100.00 | AA+ | | 2,061,443 | |
| | 35,300 | | Total North Carolina | | | | 37,538,550 | |
| | | | North Dakota – 3.6% (2.4% of Total Investments) | | | | | |
| | 23,035 | | Fargo, North Dakota, Health System Revenue Bonds, MeritCare Obligated Group, Series 2000A, 5.625%, 6/01/31 – AGM Insured | 12/10 at 101.00 | AA+ | | 23,194,172 | |
| | | | Ohio – 8.1% (5.3% of Total Investments) | | | | | |
| | | | Buckeye Tobacco Settlement Financing Authority, Ohio, Tobacco Settlement Asset-Backed Revenue Bonds, Senior Lien, Series 2007A-2: | | | | | |
| | 4,420 | | 5.375%, 6/01/24 | 6/17 at 100.00 | BBB | | 3,953,425 | |
| | 110 | | 5.125%, 6/01/24 | 6/17 at 100.00 | BBB | | 96,120 | |
| | 1,250 | | 5.875%, 6/01/30 | 6/17 at 100.00 | BBB | | 1,053,225 | |
| | 6,215 | | 5.750%, 6/01/34 | 6/17 at 100.00 | BBB | | 4,956,338 | |
| | 4,300 | | 6.000%, 6/01/42 | 6/17 at 100.00 | BBB | | 3,383,455 | |
| | 4,750 | | 5.875%, 6/01/47 | 6/17 at 100.00 | BBB | | 3,634,985 | |
| | 6,000 | | Butler County, Ohio, Hospital Facilities Revenue Bonds, UC Health, Series 2010, 5.250%, 11/01/29 (WI/DD, Settling 11/04/10) | 11/20 at 100.00 | BBB+ | | 5,893,860 | |
| | 10,000 | | Columbus City School District, Franklin County, Ohio, General Obligation Bonds, Series 2006, 4.250%, 12/01/32 – AGM Insured (UB) | 12/16 at 100.00 | AA+ | | 10,039,600 | |
| | 11,080 | | Montgomery County, Ohio, Hospital Facilities Revenue Bonds, Kettering Medical Center, Series 1999, 6.300%, 4/01/12 | No Opt. Call | A | | 11,598,655 | |
| | 7,500 | | Ohio State, Hospital Facility Revenue Refunding Bonds, Cleveland Clinic Health System Obligated Group, Series 2009A, 5.500%, 1/01/39 | 1/19 at 100.00 | Aa2 | | 8,098,050 | |
| | 55,625 | | Total Ohio | | | | 52,707,713 | |
| | | | Oklahoma – 0.3% (0.2% of Total Investments) | | | | | |
| | 1,675 | | Oklahoma Development Finance Authority, Health System Revenue Bonds, Integris Baptist Medical Center, Series 2008B, 5.250%, 8/15/38 | 8/18 at 100.00 | AA– | | 1,781,614 | |
| | | | Oregon – 0.8% (0.5% of Total Investments) | | | | | |
| | 5,000 | | Oregon Health Sciences University, Revenue Bonds, Series 2002A, 5.250%, 7/01/22 – NPFG Insured | 1/13 at 100.00 | A1 | | 5,112,800 | |
| | | | Pennsylvania – 7.1% (4.7% of Total Investments) | | | | | |
| | 3,000 | | Allegheny County Hospital Development Authority, Pennsylvania, University of Pittsburgh Medical Center Revenue Bonds, Series 2009A, 5.625%, 8/15/39 | No Opt. Call | Aa3 | | 3,144,900 | |
| | 5,000 | | Delaware County Industrial Development Authority, Pennsylvania, Resource Recovery Revenue Refunding Bonds, Series 1997A, 6.200%, 7/01/19 | 1/11 at 100.00 | BB+ | | 5,000,150 | |
| | Principal | | | Optional Call | | | | |
| | Amount (000) | | Description (1) | Provisions (2) | Ratings (3) | | Value | |
| | | | Pennsylvania (continued) | | | | | |
| $ | 5,000 | | Pennsylvania Higher Education Assistance Agency, Capital Acquisition Revenue Bonds, Series 2000, 5.875%, 12/15/30 (Pre-refunded 12/15/10) – NPFG Insured | 12/10 at 100.00 | N/R (4) | $ | 5,033,700 | |
| | 5,975 | | Pennsylvania Turnpike Commission, Turnpike Revenue Bonds, Motor License Special Fund, Subordinate Series 2010A, 0.000%, 12/01/34 | No Opt. Call | Aa3 | | 4,710,929 | |
| | 10,000 | | Pennsylvania Turnpike Commission, Turnpike Subordinate Revenue Bonds, Series 2009C, 0.000%, 6/01/33 – AGM Insured | 12/20 at 100.00 | AA+ | | 8,187,600 | |
| | 7,550 | | Pennsylvania, General Obligation Bonds, Second Series 2001, 5.000%, 9/15/14 (Pre-refunded 9/15/11) | 9/11 at 101.00 | Aa1 (4) | | 7,940,033 | |
| | 11,890 | | Philadelphia Hospitals and Higher Education Facilities Authority, Pennsylvania, Health System Revenue Bonds, Jefferson Health System, Series 2010B, 5.000%, 5/15/40 | 5/20 at 100.00 | AA | | 12,263,108 | |
| | 48,415 | | Total Pennsylvania | | | | 46,280,420 | |
| | | | Puerto Rico – 7.6% (5.0% of Total Investments) | | | | | |
| | 3,330 | | Puerto Rico Aqueduct and Sewerage Authority, Revenue Bonds, Senior Lien Series 2008A, 6.000%, 7/01/44 | 7/18 at 100.00 | Baa1 | | 3,559,437 | |
| | 8,000 | | Puerto Rico Electric Power Authority, Power Revenue Bonds, Series 2010XX, 5.750%, 7/01/36 | 7/20 at 100.00 | A3 | | 8,737,280 | |
| | | | Puerto Rico Housing Finance Authority, Capital Fund Program Revenue Bonds, Series 2003: | | | | | |
| | 8,200 | | 4.500%, 12/01/23 (Pre-refunded 12/01/13) (UB) | 12/13 at 100.00 | AAA | | 9,115,284 | |
| | 4,300 | | 4.500%, 12/01/23 (UB) | 12/13 at 100.00 | AA+ | | 4,384,663 | |
| | 10,000 | | Puerto Rico Sales Tax Financing Corporation, Sales Tax Revenue Bonds, First Subordinate Series 2009A, 6.000%, 8/01/42 | 8/19 at 100.00 | A+ | | 11,182,300 | |
| | 4,310 | | Puerto Rico Sales Tax Financing Corporation, Sales Tax Revenue Bonds, First Subordinate Series 2010C, 5.250%, 8/01/41 | 8/20 at 100.00 | A+ | | 4,507,226 | |
| | 7,000 | | Puerto Rico Sales Tax Financing Corporation, Sales Tax Revenue Bonds, Series 2007A, 0.000%, 8/01/40 – NPFG Insured | No Opt. Call | Aa2 | | 1,212,400 | |
| | 6,390 | | Puerto Rico, The Children’s Trust Fund, Tobacco Settlement Asset-Backed Refunding Bonds, Series 2002, 5.375%, 5/15/33 | 5/12 at 100.00 | BBB | | 6,408,084 | |
| | 51,530 | | Total Puerto Rico | | | | 49,106,674 | |
| | | | Rhode Island – 0.5% (0.3% of Total Investments) | | | | | |
| | 3,310 | | Rhode Island Tobacco Settlement Financing Corporation, Tobacco Settlement Asset-Backed Bonds, Series 2002A, 6.250%, 6/01/42 | 6/12 at 100.00 | BBB | | 3,313,707 | |
| | | | South Carolina – 6.0% (4.0% of Total Investments) | | | | | |
| | 24,730 | | Greenville County School District, South Carolina, Installment Purchase Revenue Bonds, Series 2002, 5.500%, 12/01/22 (Pre-refunded 12/01/12) | 12/12 at 101.00 | Aaa | | 27,571,230 | |
| | 21,570 | | Piedmont Municipal Power Agency, South Carolina, Electric Revenue Bonds, Series 2004A-2, 0.000%, 1/01/30 – AMBAC Insured | No Opt. Call | A– | | 7,765,847 | |
| | 3,560 | | South Carolina Public Service Authority, Revenue Refunding Bonds, Santee Cooper Electric System, Series 2003A, 5.000%, 1/01/20 – AMBAC Insured | 7/13 at 100.00 | Aa2 | | 3,883,141 | |
| | 49,860 | | Total South Carolina | | | | 39,220,218 | |
| | | | Tennessee – 0.8% (0.5% of Total Investments) | | | | | |
| | 5,000 | | Knox County Health, Educational and Housing Facilities Board, Tennessee, Hospital Revenue Bonds, East Tennessee Children’s Hospital, Series 2003A, 5.000%, 7/01/23 – RAAI Insured | 7/13 at 100.00 | BBB+ | | 4,909,950 | |
| | | | Texas – 9.9% (6.5% of Total Investments) | | | | | |
| | 2,500 | | Alliance Airport Authority, Texas, Special Facilities Revenue Bonds, American Airlines Inc., Series 2007, 5.250%, 12/01/29 (Alternative Minimum Tax) | 12/12 at 100.00 | CCC+ | | 1,923,300 | |
| | 11,255 | | Brazos River Authority, Texas, Pollution Control Revenue Refunding Bonds, TXU Electric Company, Series 2001C, 5.750%, 5/01/36 (Mandatory put 11/01/11) (Alternative Minimum Tax) | No Opt. Call | CCC | | 10,697,315 | |
| | 1,000 | | Cedar Hill Independent School District, Dallas County, Texas, General Obligation Bonds, Series 2002, 0.000%, 8/15/32 – FGIC Insured | No Opt. Call | AA– | | 330,150 | |
Nuveen Investments 51
| | | Nuveen Municipal Market Opportunity Fund, Inc. (continued) |
| NMO | | Portfolio of Investments October 31, 2010 |
| | Principal | | | Optional Call | | | | |
| | Amount (000) | | Description (1) | Provisions (2) | Ratings (3) | | Value | |
| | | | Texas (continued) | | | | | |
| $ | 15,000 | | Central Texas Regional Mobility Authority, Travis and Williamson Counties, Toll Road Revenue Bonds, Series 2005, 5.000%, 1/01/45 – FGIC Insured | 1/15 at 100.00 | A | $ | 14,134,350 | |
| | 2,500 | | Comal Independent School District, Comal, Bexar, Guadalupe, Hays, and Kendall Counties, Texas, General Obligation Bonds, Series 2005A, 0.000%, 2/01/23 | No Opt. Call | Aaa | | 1,621,700 | |
| | 6,000 | | Dallas-Ft. Worth International Airport Facility Improvement Corporation, Texas, Revenue Bonds, American Airlines Inc., Series 1999, 6.375%, 5/01/35 (Alternative Minimum Tax) | 11/10 at 100.50 | CCC+ | | 5,234,880 | |
| | | | Ennis Independent School District, Ellis County, Texas, General Obligation Bonds, Series 2006: | | | | | |
| | 3,950 | | 0.000%, 8/15/30 | 8/16 at 49.21 | Aaa | | 1,519,921 | |
| | 4,000 | | 0.000%, 8/15/31 | 8/16 at 46.64 | Aaa | | 1,451,040 | |
| | 1,715 | | Houston, Texas, Hotel Occupancy Tax and Special Revenue Bonds, Convention and Entertainment Project, Series 2001B, 0.000%, 9/01/32 – AMBAC Insured | No Opt. Call | A2 | | 478,639 | |
| | 1,250 | | Houston, Texas, Junior Lien Water and Sewerage System Revenue Refunding Bonds, Series 2001A, 5.000%, 12/01/20 – AGM Insured | 12/11 at 100.00 | AA+ | | 1,303,113 | |
| | 2,400 | | Houston, Texas, Senior Lien Airport System Revenue Bonds, Refunding Series 2009A, 5.500%, 7/01/39 | 7/18 at 100.00 | AA– | | 2,598,600 | |
| | 9,350 | | Leander Independent School District, Williamson and Travis Counties, Texas, General Obligation Bonds, Series 2005, 0.000%, 8/15/32 – FGIC Insured | 8/15 at 39.50 | AA– | | 2,948,523 | |
| | 6,000 | | Leander Independent School District, Williamson and Travis Counties, Texas, General Obligation Bonds, Series 2006, 0.000%, 8/15/33 | 8/14 at 35.28 | AAA | | 1,774,140 | |
| | 4,000 | | North Texas Thruway Authority, First Tier System Revenue Refunding Bonds, Capital Appreciation Series 2008I, 0.000%, 1/01/43 | 1/25 at 100.00 | A2 | | 3,283,080 | |
| | 3,295 | | Tarrant County, Texas, Cultural & Educational Facilities Financing Corporation, Texas, Revenue Bonds, Series 2007, Residuals 1760-3, 16.624%, 2/15/36 (IF) | 2/17 at 100.00 | AA– | | 3,364,722 | |
| | 2,890 | | Tarrant County Cultural Education Facilities Finance Corporation, Texas, Hospital Revenue Bonds, Scott & White HealthCare Project, Series 2010, 5.500%, 8/15/45 | 8/20 at 100.00 | A1 | | 2,940,113 | |
| | 5,000 | | White Settlement Independent School District, Tarrant County, Texas, General Obligation Bonds, Series 2005, 0.000%, 8/15/34 | 8/15 at 36.81 | AAA | | 1,472,350 | |
| | 3,970 | | Wichita Falls, Wichita County, Texas, Priority Lien Water and Sewerage System Revenue Bonds, Series 2001, 5.000%, 8/01/21 (Pre-refunded 8/01/11) – AMBAC Insured | 8/11 at 100.00 | AA– (4) | | 4,110,776 | |
| | | | Wylie Independent School District, Collin County, Texas, General Obligation Bonds, Series 2005: | | | | | |
| | 3,000 | | 0.000%, 8/15/23 | 8/15 at 67.10 | AAA | | 1,707,810 | |
| | 2,000 | | 0.000%, 8/15/24 | 8/15 at 63.56 | AAA | | 1,074,800 | |
| | 91,075 | | Total Texas | | | | 63,969,322 | |
| | | | Utah – 0.5% (0.3% of Total Investments) | | | | | |
| | 3,000 | | Riverton, Utah, Hospital Revenue Bonds, IHC Health Services, Inc., Series 2009, 5.000%, 8/15/41 | 8/19 at 100.00 | AA+ | | 3,127,680 | |
| | | | Virginia – 2.6% (1.7% of Total Investments) | | | | | |
| | 21,500 | | Metropolitan Washington DC Airports Authority, Virginia, Dulles Toll Road Revenue Bonds, Series 2009C, 0.000%, 10/01/41 – AGC Insured | 10/26 at 100.00 | AA+ | | 16,646,160 | |
| | | | Washington – 9.0% (5.9% of Total Investments) | | | | | |
| | 2,755 | | Cowlitz County, Washington, Special Sewerage Revenue Refunding Bonds, CSOB Wastewater Treatment Facilities, Series 2002, 5.500%, 11/01/16 – FGIC Insured | No Opt. Call | A1 | | 3,104,802 | |
| | 10,000 | | Energy Northwest, Washington, Electric Revenue Refunding Bonds, Nuclear Project 3, Series 2001A, 5.500%, 7/01/17 – AGM Insured | 7/11 at 101.00 | Aaa | | 10,412,400 | |
| | 820 | | King County, Washington, Sewer Revenue Bonds, Series 2001, 5.000%, 1/01/23 (Pre-refunded 1/01/12) – FGIC Insured | 1/12 at 100.00 | Aa2 (4) | | 863,911 | |
| | 1,680 | | King County, Washington, Sewer Revenue Bonds, Series 2001, 5.000%, 1/01/23 – FGIC Insured | 1/12 at 100.00 | AA+ | | 1,749,838 | |
| | 2,150 | | Seattle, Washington, General Obligation Refunding and Improvement Bonds, Series 2002, 4.500%, 12/01/20 | 12/12 at 100.00 | AAA | | 2,228,583 | |
| | 3,000 | | Spokane County School District 81, Spokane, Washington, General Obligation Bonds, Series 2005, 5.000%, 6/01/24 – NPFG Insured | 6/15 at 100.00 | Aa1 | | 3,205,290 | |
| | 3,520 | | Washington State Health Care Facilities Authority, Revenue Bonds, Children’s Hospital and Regional Medical Center, Series 2001, 5.000%, 10/01/21 (Pre-refunded 10/01/11) – AMBAC Insured | 10/11 at 100.00 | Aa3 (4) | | 3,668,403 | |
52 Nuveen Investments
| | Principal | | | Optional Call | | | | |
| | Amount (000) | | Description (1) | Provisions (2) | Ratings (3) | | Value | |
| | | | Washington (continued) | | | | | |
| $ | 8,000 | | Washington State Health Care Facilities Authority, Revenue Bonds, MultiCare Health System, Series 2008A, 5.250%, 8/15/34 – AGM Insured | 5/18 at 100.00 | AA+ | $ | 8,350,160 | |
| | 10,485 | | Washington State Tobacco Settlement Authority, Tobacco Settlement Asset-Backed Revenue Bonds, Series 2002, 6.500%, 6/01/26 | 6/13 at 100.00 | BBB | | 10,859,315 | |
| | 9,000 | | Washington State, Motor Vehicle Fuel Tax General Obligation Bonds, Series 2003C, 0.000%, 6/01/28 – FGIC Insured | No Opt. Call | AA+ | | 4,265,820 | |
| | 9,000 | | Washington, Motor Vehicle Fuel Tax General Obligation Bonds, Series 2002C, 5.000%, 1/01/21 – AGM Insured | 1/12 at 100.00 | AA+ | | 9,481,950 | |
| | 60,410 | | Total Washington | | | | 58,190,472 | |
| | | | Wisconsin – 2.5% (1.6% of Total Investments) | | | | | |
| | 2,280 | | Badger Tobacco Asset Securitization Corporation, Wisconsin, Tobacco Settlement Asset-Backed Bonds, Series 2002, 6.125%, 6/01/27 (Pre-refunded 6/01/12) | 6/12 at 100.00 | AAA | | 2,428,906 | |
| | 1,755 | | Wisconsin Health and Educational Facilities Authority, Revenue Bonds, Divine Savior Healthcare, Series 2006, 4.750%, 5/01/25 | 5/16 at 100.00 | BBB | | 1,562,125 | |
| | 1,250 | | Wisconsin Health and Educational Facilities Authority, Revenue Bonds, United Lutheran Program for the Aging Inc., Series 1998, 5.700%, 3/01/28 | 3/11 at 100.00 | N/R | | 1,103,212 | |
| | 9,920 | | Wisconsin State, General Fund Annual Appropriation Revenue Bonds, Refunding Series 2009A, 5.750%, 5/01/33 | 5/19 at 100.00 | AA– | | 11,096,710 | |
| | 15,205 | | Total Wisconsin | | | | 16,190,953 | |
| | | | Wyoming – 0.7% (0.5% of Total Investments) | | | | | |
| | 4,080 | | Campbell County, Wyoming Solid Waste Facilities Revenue Bonds, Basin Electric Power Cooperative – Dry Fork Station Facilities, Series 2009A, 5.750%, 7/15/39 | 7/19 at 100.00 | A+ | | 4,510,440 | |
| $ | 1,283,417 | | Total Investments (cost $981,606,506) – 152.2% | | | | 986,271,687 | |
| | | | Floating Rate Obligations – (6.7)% | | | | (43,530,000 | ) |
| | | | Other Assets Less Liabilities – 8.6% | | | | 56,174,899 | |
| | | | Variable Rate Demand Preferred Shares, at Liquidation Value – (54.1)% (6) | | | | (350,900,000 | ) |
| | | | Net Assets Applicable to Common Shares – 100% | | | $ | 648,016,586 | |
| (1) | | All percentages shown in the Portfolio of Investments are based on net assets applicable to Common shares unless otherwise noted. |
| (2) | | Optional Call Provisions (not covered by the report of independent registered public accounting firm): Dates (month and year) and prices of the earliest optional call or redemption. There may be other call provisions at varying prices at later dates. Certain mortgage-backed securities may be subject to periodic principal paydowns. |
| (3) | | Ratings (not covered by the report of independent registered public accounting firm): Using the highest of Standard & Poor’s Group (“Standard & Poor’s”), Moody’s Investor Service, Inc. (“Moody’s”) or Fitch, Inc. (“Fitch”) rating. Ratings below BBB by Standard & Poor’s, Baa by Moody’s or BBB by Fitch are considered to be below investment grade. Holdings designated N/R are not rated by any of these national rating agencies. |
| (4) | | Backed by an escrow or trust containing sufficient U.S. Government or U.S. Government agency securities, which ensure the timely payment of principal and interest. Such investments are normally considered to be equivalent to AAA rated securities. |
| (5) | | The Fund’s Adviser has concluded this issue is not likely to meet its future interest payment obligations and has directed the Fund’s custodian to cease accruing additional income on the Fund’s records. |
| (6) | | Variable Rate Demand Preferred Shares, at Liquidation Value as a percentage of Total Investments is 35.6%. |
| N/R | | Not rated. |
| WI/DD | | Purchased on a when-issued or delayed delivery basis. |
| (ETM) | | Escrowed to maturity. |
| (IF) | | Inverse floating rate investment. |
| (UB) | | Underlying bond of an inverse floating rate trust reflected as a financing transaction. See Notes to Financial Statements, Footnote 1 – General Information and Significant Accounting Policies, Inverse Floating Rate Securities for more information. |
See accompanying notes to financial statements.
Nuveen Investments 53
| | | Nuveen Dividend Advantage Municipal Fund |
| NAD | | Portfolio of Investments |
| | | October 31, 2010 |
| | Principal | | | Optional Call | | | | |
| | Amount (000) | | Description (1) | Provisions (2) | Ratings (3) | | Value | |
| | | | Municipal Bonds – 150.6% (99.9% of Total Investments) | | | | | |
| | | | Alabama – 0.3% (0.2% of Total Investments) | | | | | |
| $ | 1,600 | | Alabama 21st Century Authority, Tobacco Settlement Revenue Bonds, Series 2000, 5.750%, 12/01/20 | 12/10 at 102.00 | A– | $ | 1,622,912 | |
| | | | Alaska – 0.1% (0.1% of Total Investments) | | | | | |
| | 750 | | Alaska Housing Finance Corporation, General Housing Purpose Bonds, Series 2005A, 5.250%, 12/01/34 – FGIC Insured (UB) | 12/14 at 100.00 | AA | | 775,575 | |
| | | | Arizona – 1.2% (0.8% of Total Investments) | | | | | |
| | 2,350 | | Phoenix, Arizona, Civic Improvement Corporation, Senior Lien Airport Revenue Bonds, Series 2008A, 5.000%, 7/01/33 | 7/18 at 100.00 | AA– | | 2,428,467 | |
| | 5,000 | | Salt Verde Financial Corporation, Arizona, Senior Gas Revenue Bonds, Citigroup Energy Inc Prepay Contract Obligations, Series 2007, 5.000%, 12/01/37 | No Opt. Call | A | | 4,723,650 | |
| | 7,350 | | Total Arizona | | | | 7,152,117 | |
| | | | California – 7.6% (5.1% of Total Investments) | | | | | |
| | 1,535 | | Alameda Corridor Transportation Authority, California, Senior Lien Revenue Bonds, Series 1999A, 0.000%, 10/01/37 – NPFG Insured | No Opt. Call | A | | 262,132 | |
| | 6,000 | | Anaheim Public Finance Authority, California, Subordinate Lease Revenue Bonds, Public Improvement Project, Series 1997C, 0.000%, 9/01/28 – AGM Insured | No Opt. Call | AA+ | | 2,079,180 | |
| | 6,750 | | California Statewide Community Development Authority, Revenue Bonds, Methodist Hospital Project, Series 2009, 6.750%, 2/01/38 | 8/19 at 100.00 | Aa2 | | 7,817,310 | |
| | 65 | | California, General Obligation Bonds, Series 1997, 5.000%, 10/01/18 – AMBAC Insured | 1/11 at 100.00 | A1 | | 65,172 | |
| | 5,000 | | California, General Obligation Bonds, Series 2005, 5.000%, 3/01/31 | 3/16 at 100.00 | A1 | | 5,070,950 | |
| | 5,000 | | Corona-Norco Unified School District, Riverside County, California, General Obligation Bonds, Election 2006 Series 2007A, 5.000%, 8/01/31 – AGM Insured | No Opt. Call | AA+ | | 5,216,400 | |
| | | | Golden State Tobacco Securitization Corporation, California, Enhanced Tobacco Settlement Asset-Backed Revenue Bonds, Series 2005A: | | | | | |
| | 3,500 | | 0.000%, 6/01/26 – AGM Insured | No Opt. Call | AA+ | | 1,502,235 | |
| | 9,925 | | 5.000%, 6/01/45 – AGC Insured | 6/15 at 100.00 | AA+ | | 9,811,756 | |
| | | | Golden State Tobacco Securitization Corporation, California, Tobacco Settlement Asset-Backed Bonds, Series 2007A-1: | | | | | |
| | 5,750 | | 5.000%, 6/01/33 | 6/17 at 100.00 | BBB | | 4,759,218 | |
| | 1,000 | | 5.125%, 6/01/47 | 6/17 at 100.00 | BBB | | 720,710 | |
| | 2,200 | | M-S-R Energy Authority, California, Gas Revenue Bonds, Citigroup Prepay Contracts, Series 2009C, 6.500%, 11/01/39 | No Opt. Call | A | | 2,581,546 | |
| | 1,495 | | Palmdale Civic Authority, California, Revenue Refinancing Bonds, Civic Center Project, Series 1997A, 5.375%, 7/01/12 – NPFG Insured | 1/11 at 100.00 | A | | 1,499,844 | |
| | 17,000 | | San Joaquin Hills Transportation Corridor Agency, Orange County, California, Toll Road Revenue Refunding Bonds, Series 1997A, 0.000%, 1/15/35 – NPFG Insured | No Opt. Call | A | | 2,659,990 | |
| | 65,220 | | Total California | | | | 44,046,443 | |
| | | | Colorado – 5.8% (3.8% of Total Investments) | | | | | |
| | 1,125 | | Antelope Heights Metropolitan District, Colorado, Limited Tax General Obligation Bonds, Series 2007, 5.000%, 12/01/37 – RAAI Insured | 12/17 at 100.00 | N/R | | 897,986 | |
| | 3,330 | | Colorado Health Facilities Authority, Colorado, Revenue Bonds, Catholic Health Initiatives, Series 2009A, 5.500%, 7/01/34 | 7/19 at 100.00 | AA | | 3,596,500 | |
| | | | Denver City and County, Colorado, Airport Special Facilities Revenue Bonds, Rental Car Projects, Series 1999A: | | | | | |
| | 2,170 | | 6.000%, 1/01/12 – NPFG Insured (Alternative Minimum Tax) | 1/11 at 100.00 | A | | 2,187,555 | |
| | 675 | | 6.000%, 1/01/13 – NPFG Insured (Alternative Minimum Tax) | 1/11 at 100.00 | A | | 679,975 | |
| | 1,475 | | Denver, Colorado, FHA-Insured Multifamily Housing Revenue Bonds, Boston Lofts Project, Series 1997A, 5.750%, 10/01/27 (Alternative Minimum Tax) | 4/11 at 100.00 | BB+ | | 1,474,926 | |
54 Nuveen Investments
| | Principal | | | Optional Call | | | | |
| | Amount (000) | | Description (1) | Provisions (2) | Ratings (3) | | Value | |
| | | | Colorado (continued) | | | | | |
| $ | 8,515 | | E-470 Public Highway Authority, Colorado, Senior Revenue Bonds, Series 1997B, 0.000%, 9/01/25 – NPFG Insured | No Opt. Call | A | $ | 3,446,021 | |
| | 25,000 | | E-470 Public Highway Authority, Colorado, Senior Revenue Bonds, Series 2000B, 0.000%, 9/01/31 – NPFG Insured | No Opt. Call | A | | 6,408,750 | |
| | 60,000 | | E-470 Public Highway Authority, Colorado, Toll Revenue Bonds, Series 2004A, 0.000%, 3/01/36 – NPFG Insured | No Opt. Call | A | | 10,861,800 | |
| | 12,500 | | E-470 Public Highway Authority, Colorado, Toll Revenue Bonds, Series 2006A, 0.000%, 9/01/38 – NPFG Insured | 9/26 at 54.77 | A | | 1,696,625 | |
| | 2,000 | | Metropolitan Football Stadium District, Colorado, Sales Tax Revenue Bonds, Series 1999A, 0.000%, 1/01/12 – NPFG Insured | No Opt. Call | A | | 1,969,160 | |
| | 116,790 | | Total Colorado | | | | 33,219,298 | |
| | | | Connecticut – 0.3% (0.2% of Total Investments) | | | | | |
| | 4,335 | | Mashantucket Western Pequot Tribe, Connecticut, Subordinate Special Revenue Bonds, Series 2007A, 5.750%, 9/01/34 | 11/17 at 100.00 | N/R | | 1,996,571 | |
| | | | Florida – 10.8% (7.2% of Total Investments) | | | | | |
| | 1,325 | | Florida Housing Finance Agency, Housing Revenue Bonds, Mar Lago Village Apartments, Series 1997F, 5.800%, 12/01/17 – AMBAC Insured (Alternative Minimum Tax) | 12/10 at 100.00 | N/R | | 1,325,954 | |
| | 15,000 | | Florida State Board of Education, Public Education Capital Outlay Bonds, Series 2005E, 4.500%, 6/01/35 (UB) | 6/15 at 101.00 | AAA | | 15,047,250 | |
| | 2,500 | | Marion County Hospital District, Florida, Revenue Bonds, Munroe Regional Medical Center, Series 2007, 5.000%, 10/01/34 | 10/17 at 100.00 | A3 | | 2,438,575 | |
| | 13,625 | | Martin County Industrial Development Authority, Florida, Industrial Development Revenue Bonds, Indiantown Cogeneration LP, Series 1994A, 7.875%, 12/15/25 (Alternative Minimum Tax) | 12/10 at 100.00 | BB+ | | 13,897,500 | |
| | | | South Miami Health Facilities Authority, Florida, Hospital Revenue, Baptist Health System Obligation Group, Series 2007: | | | | | |
| | 22,000 | | 5.000%, 8/15/37 (UB) | 8/17 at 100.00 | AA | | 22,352,880 | |
| | 7,370 | | 5.000%, 8/15/42 (UB) | 8/17 at 100.00 | AA | | 7,458,366 | |
| | 61,820 | | Total Florida | | | | 62,520,525 | |
| | | | Georgia – 0.8% (0.5% of Total Investments) | | | | | |
| | 5,000 | | Cobb County Development Authority, Georgia, Student Housing Revenue Bonds, KSU Village II Real Estate Foundation LLC Project, Series 2007A, 5.250%, 7/15/38 – AMBAC Insured | 7/17 at 100.00 | Baa2 | | 4,638,850 | |
| | | | Idaho – 0.1% (0.1% of Total Investments) | | | | | |
| | 110 | | Idaho Housing and Finance Association, Single Family Mortgage Bonds, Series 1999E, 5.750%, 1/01/21 (Alternative Minimum Tax) | 1/11 at 100.50 | Aa2 | | 114,703 | |
| | 140 | | Idaho Housing and Finance Association, Single Family Mortgage Bonds, Series 2000D, 6.350%, 7/01/22 (Alternative Minimum Tax) | 1/11 at 100.00 | Aa2 | | 142,895 | |
| | 195 | | Idaho Housing and Finance Association, Single Family Mortgage Bonds, Series 2000E, 5.950%, 7/01/20 (Alternative Minimum Tax) | 1/11 at 100.00 | Aaa | | 204,011 | |
| | 445 | | Total Idaho | | | | 461,609 | |
| | | | Illinois – 32.3% (21.4% of Total Investments) | | | | | |
| | 1,560 | | Channahon, Illinois, Revenue Refunding Bonds, Morris Hospital, Series 1999, 5.750%, 12/01/12 | 12/10 at 101.00 | BBB+ | | 1,594,741 | |
| | 2,205 | | Chicago Board of Education, Illinois, Unlimited Tax General Obligation Bonds, Dedicated Tax Revenues, Series 1998B-1, 0.000%, 12/01/29 – FGIC Insured | No Opt. Call | Aa2 | | 770,890 | |
| | 7,250 | | Chicago Board of Education, Illinois, Unlimited Tax General Obligation Bonds, Dedicated Tax Revenues, Series 1999A, 5.500%, 12/01/26 – FGIC Insured | No Opt. Call | Aa2 | | 8,408,768 | |
| | | | Chicago, Illinois, FHA/GNMA Multifamily Housing Revenue Bonds, Archer Court Apartments, Series 1999A: | | | | | |
| | 655 | | 5.500%, 12/20/19 (Alternative Minimum Tax) | 4/11 at 101.00 | AA– | | 662,395 | |
| | 1,210 | | 5.600%, 12/20/29 (Alternative Minimum Tax) | 4/11 at 101.00 | AA– | | 1,221,834 | |
| | 1,925 | | 5.650%, 12/20/40 (Alternative Minimum Tax) | 4/11 at 101.00 | AA– | | 1,940,747 | |
Nuveen Investments 55
| | | Nuveen Dividend Advantage Municipal Fund (continued) |
| NAD | | Portfolio of Investments October 31, 2010 |
| | Principal | | | Optional Call | | | | |
| | Amount (000) | | Description (1) | Provisions (2) | Ratings (3) | | Value | |
| | | | Illinois (continued) | | | | | |
| $ | 22,750 | | Chicago, Illinois, General Obligation Refunding Bonds, Emergency Telephone System, Series 1999, 5.500%, 1/01/23 – FGIC Insured | No Opt. Call | AA– | $ | 26,559,943 | |
| | 2,150 | | Chicago, Illinois, Motor Fuel Tax Revenue Refunding Bonds, Series 1993, 5.375%, 1/01/14 – AMBAC Insured | No Opt. Call | AA+ | | 2,293,169 | |
| | 3,340 | | Chicago, Illinois, Third Lien General Airport Revenue Bonds, O’Hare International Airport, Series 2005A, 5.000%, 1/01/33 – FGIC Insured | 1/16 at 100.00 | A1 | | 3,367,021 | |
| | 190 | | DuPage County Community School District 200, Wheaton, Illinois, General Obligation Bonds, Series 2003B, 5.250%, 11/01/20 – AGM Insured | 11/13 at 100.00 | Aa2 | | 209,447 | |
| | 810 | | DuPage County Community School District 200, Wheaton, Illinois, General Obligation Bonds, Series 2003B, 5.250%, 11/01/20 (Pre-refunded 11/01/13) – AGM Insured | 11/13 at 100.00 | Aa2 (4) | | 917,892 | |
| | 500 | | Hoffman Estates Park District, Cook County, Illinois, General Obligation Bonds, Series 1999, 5.375%, 12/01/29 – NPFG Insured | 12/11 at 100.00 | AA+ | | 506,570 | |
| | 3,935 | | Illinois Development Finance Authority, Local Government Program Revenue Bonds, Lake County School District 116 – Round Lake, Series 1999, 0.000%, 1/01/15 – NPFG Insured | No Opt. Call | Baa1 | | 3,512,656 | |
| | 5,000 | | Illinois Educational Facilities Authority, Revenue Bonds, University of Chicago, Refunding Series 2003A, 5.000%, 7/01/33 | 7/13 at 100.00 | Aa1 | | 5,140,700 | |
| | 1,500 | | Illinois Finance Authority, Revenue Bonds, Central DuPage Health, Series 2009B, 5.500%, 11/01/39 | 11/19 at 100.00 | AA | | 1,597,485 | |
| | 2,000 | | Illinois Finance Authority, Revenue Bonds, Children’s Memorial Hospital, Series 2008A, 5.250%, 8/15/47 – AGC Insured (UB) | 8/18 at 100.00 | AA+ | | 2,036,580 | |
| | 1,000 | | Illinois Finance Authority, Revenue Bonds, Edward Health Services Corporation, Series 2008A, 5.500%, 2/01/40 – AMBAC Insured | 2/18 at 100.00 | A+ | | 1,016,040 | |
| | 5,570 | | Illinois Finance Authority, Revenue Bonds, University of Chicago, Series 2004A, 5.000%, 7/01/34 | 7/14 at 100.00 | Aa1 | | 5,788,288 | |
| | 4,000 | | Illinois Finance Authority, Revenue Refunding Bonds, Silver Cross Hospital and Medical Centers, Series 2008A, 6.000%, 8/15/23 | 8/18 at 100.00 | BBB | | 4,383,880 | |
| | 9,800 | | Illinois Health Facilities Authority, Remarketed Revenue Bonds, University of Chicago Project, Series 1985A, 5.500%, 8/01/20 | 8/11 at 103.00 | Aa1 | | 10,210,620 | |
| | 5,595 | | Illinois Health Facilities Authority, Revenue Bonds, Loyola University Health System, Series 1997A, 5.000%, 7/01/24 – NPFG Insured | 1/11 at 100.00 | A | | 5,416,911 | |
| | 5,490 | | Illinois Health Facilities Authority, Revenue Bonds, Sarah Bush Lincoln Health Center, Series 1996B, 5.500%, 2/15/16 | 2/11 at 100.00 | A+ | | 5,498,015 | |
| | 1,500 | | Illinois Housing Development Authority, Housing Finance Bonds, Series 2005E, 4.800%, 1/01/36 – FGIC Insured | 1/15 at 100.00 | A+ | | 1,488,210 | |
| | 2,000 | | Kane & DeKalb Counties, Illinois, Community United School District 301, General Obligation Bonds, Series 2006, 0.000%, 12/01/21 – NPFG Insured | No Opt. Call | A1 | | 1,229,780 | |
| | 11,345 | | Lake and McHenry Counties Community Unit School District 118, Wauconda, Illinois, General Obligation Bonds, Series 2005B, 0.000%, 1/01/25 – AGM Insured | 1/15 at 60.14 | Aa3 | | 5,632,225 | |
| | 3,000 | | Lombard Public Facilities Corporation, Illinois, First Tier Conference Center and Hotel Revenue Bonds, Series 2005A-1, 7.125%, 1/01/36 | 1/16 at 100.00 | N/R | | 2,196,450 | |
| | 22,500 | | Metropolitan Pier and Exposition Authority, Illinois, Revenue Bonds, McCormick Place Expansion Project, Series 1999A, 5.500%, 12/15/24 – FGIC Insured | 12/10 at 100.50 | AAA | | 22,811,400 | |
| | | | Metropolitan Pier and Exposition Authority, Illinois, Revenue Refunding Bonds, McCormick Place Expansion Project, Series 1996A: | | | | | |
| | 12,250 | | 0.000%, 12/15/22 – NPFG Insured | No Opt. Call | A | | 6,652,608 | |
| | 13,000 | | 0.000%, 12/15/23 – NPFG Insured | No Opt. Call | A | | 6,635,460 | |
| | 3,000 | | Metropolitan Pier and Exposition Authority, Illinois, Revenue Refunding Bonds, McCormick Place Expansion Project, Series 2002B, 5.750%, 6/15/23 – NPFG Insured | 6/12 at 101.00 | AAA | | 3,216,300 | |
| | 1,840 | | Oak Park, Illinois, General Obligation Bonds, Series 2005B, 0.000%,
11/01/27 – SYNCORA GTY Insured | 11/15 at 54.14 | Aa2 | | 783,270 | |
| | | | Regional Transportation Authority, Cook, DuPage, Kane, Lake, McHenry and Will Counties, Illinois, General Obligation Bonds, Series 1999: | | | | | |
| | 22,650 | | 5.750%, 6/01/19 – AGM Insured | No Opt. Call | AA+ | | 27,319,524 | |
| | 3,500 | | 5.750%, 6/01/23 – AGM Insured | No Opt. Call | AA+ | | 4,152,225 | |
| | Principal | | | Optional Call | | | | |
| | Amount (000) | | Description (1) | Provisions (2) | Ratings (3) | | Value | |
| | | | Illinois (continued) | | | | | |
| $ | 1,300 | | Schaumburg, Illinois, General Obligation Bonds, Series 2004B, 5.250%, 12/01/34 – FGIC Insured | 12/14 at 100.00 | Aaa | $ | 1,407,874 | |
| | 10,000 | | Will County Community High School District 210 Lincoln-Way, Illinois, General Obligation Bonds, Series 2006, 0.000%, 1/01/23 – AGM Insured | No Opt. Call | Aa2 | | 5,701,200 | |
| | 4,500 | | Will County School District 122, New Lenox, Illinois, General Obligation Bonds, Series 2000B, 0.000%, 11/01/18 – AGM Insured | No Opt. Call | Aa3 | | 3,368,655 | |
| | 200,820 | | Total Illinois | | | | 185,649,773 | |
| | | | Indiana – 4.4% (2.9% of Total Investments) | | | | | |
| | 1,630 | | Hospital Authority of Delaware County, Indiana, Hospital Revenue Refunding Bonds, Cardinal Health System, Series 1997, 5.000%, 8/01/16 – AMBAC Insured | 2/11 at 100.00 | N/R | | 1,606,284 | |
| | 4,000 | | Indiana Finance Authority, Revenue Bonds, Trinity Health Care Group, Refunding Series 2009A, 5.250%, 12/01/38 | 12/19 at 100.00 | AA | | 4,233,840 | |
| | 2,000 | | Indiana Health Facility Financing Authority, Revenue Bonds, Community Foundation of Northwest Indiana, Series 2007, 5.500%, 3/01/37 | 3/17 at 100.00 | BBB | | 2,015,800 | |
| | 6,400 | | Indiana Housing and Community Development Authority, Single Family Mortgage Revenue Bonds, Series 2007A, Drivers 1847, 7.699%, 1/01/25 (Alternative Minimum Tax) (IF) | 1/17 at 100.00 | Aaa | | 6,545,920 | |
| | 6,675 | | Indiana Municipal Power Agency, Power Supply Revenue Bonds, Series 2007A, 5.000%, 1/01/42 – NPFG Insured | 1/17 at 100.00 | A+ | | 6,813,039 | |
| | 3,965 | | Marion County Convention and Recreational Facilities Authority, Indiana, Excise Taxes Lease Rental Revenue Subordinate Bonds, Series 1997A, 5.000%, 6/01/22 – NPFG Insured | 12/10 at 100.00 | A | | 3,975,745 | |
| | 24,670 | | Total Indiana | | | | 25,190,628 | |
| | | | Iowa – 0.9% (0.6% of Total Investments) | | | | | |
| | 7,000 | | Iowa Tobacco Settlement Authority, Asset Backed Settlement Revenue Bonds, Series 2005C, 5.625%, 6/01/46 | 6/15 at 100.00 | BBB | | 5,475,330 | |
| | | | Kansas – 1.6% (1.0% of Total Investments) | | | | | |
| | 3,825 | | Wichita, Kansas, Water and Sewerage Utility Revenue Bonds, Series 1999, 4.000%, 10/01/18 – FGIC Insured | 4/11 at 100.00 | Aa2 | | 3,830,164 | |
| | 3,000 | | Wyandotte County-Kansas City Unified Government, Kansas, Sales Tax Special Obligation Bonds, Redevelopment Project Area B, Series 2005, 5.000%, 12/01/20 | 12/15 at 100.00 | N/R | | 3,132,570 | |
| | 3,730 | | Wyandotte County-Kansas City Unified Government, Kansas, Sales Tax Special Obligation Capital Appreciation Revenue Bonds Redevelopment Project Area B – Major Multi-Sport Athletic Complex Project, Subordinate Lien Series 2010B, 0.000%, 6/01/21 | No Opt. Call | N/R | | 2,097,939 | |
| | 10,555 | | Total Kansas | | | | 9,060,673 | |
| | | | Kentucky – 1.1% (0.7% of Total Investments) | | | | | |
| | | | Kentucky Economic Development Finance Authority, Hospital System Revenue Refunding and Improvement Bonds, Appalachian Regional Healthcare Inc., Series 1997: | | | | | |
| | 1,850 | | 5.850%, 10/01/17 | 4/11 at 100.00 | BB– | | 1,816,034 | |
| | 5,000 | | 5.875%, 10/01/22 | 4/11 at 100.00 | BB– | | 4,560,100 | |
| | 6,850 | | Total Kentucky | | | | 6,376,134 | |
| | | | Louisiana – 7.1% (4.7% of Total Investments) | | | | | |
| | 1,750 | | Louisiana Local Government Environmental Facilities and Community Development Authority, GNMA Collateralized Mortgage Revenue Refunding Bonds, Sharlo Apartments, Series 2002A, 6.500%, 6/20/37 | 6/12 at 105.00 | Aaa | | 1,876,228 | |
| | 5,350 | | Louisiana Public Facilities Authority, Revenue Bonds, Baton Rouge General Hospital, Series 2004, 5.250%, 7/01/33 – NPFG Insured | 7/14 at 100.00 | A | | 5,440,629 | |
| | 9,000 | | Louisiana Public Facilities Authority, Revenue Bonds, Ochsner Clinic Foundation Project, Series 2007A, 5.500%, 5/15/47 | 5/17 at 100.00 | Baa1 | | 8,911,530 | |
| | 5,445 | | Louisiana State, Gasoline and Fuels Tax Revenue Bonds, Series 2006A, 4.500%, 5/01/41 – FGIC Insured (UB) | 5/16 at 100.00 | Aa1 | | 5,448,920 | |
| | 13,570 | | Louisiana Transportation Authority, Senior Lien Toll Road Revenue Bonds, Series 2005B, 0.000%, 12/01/28 – AMBAC Insured | 12/10 at 38.89 | Aa3 | | 5,076,673 | |
Nuveen Investments 57
| | | Nuveen Dividend Advantage Municipal Fund (continued) |
| NAD | | Portfolio of Investments October 31, 2010 |
| | Principal | | | Optional Call | | | | |
| | Amount (000) | | Description (1) | Provisions (2) | Ratings (3) | | Value | |
| | | | Louisiana (continued) | | | | | |
| | | | Tobacco Settlement Financing Corporation, Louisiana, Tobacco Settlement Asset-Backed Bonds, Series 2001B: | | | | | |
| $ | 8,870 | | 5.500%, 5/15/30 | 5/11 at 101.00 | BBB | $ | 8,971,384 | |
| | 5,000 | | 5.875%, 5/15/39 | 5/11 at 101.00 | BBB | | 5,047,850 | |
| | 48,985 | | Total Louisiana | | | | 40,773,214 | |
| | | | Massachusetts – 2.2% (1.5% of Total Investments) | | | | | |
| | 1,440 | | Boston Industrial Development Financing Authority, Massachusetts, Subordinate Revenue Bonds, Crosstown Center Project, Series 2002, 8.000%, 9/01/35 (Alternative Minimum Tax) | 9/12 at 102.00 | N/R | | 690,725 | |
| | 4,365 | | Massachusetts Health and Educational Facilities Authority, Revenue Bonds, Berkshire Health System, Series 2005F, 5.000%, 10/01/19 – AGC Insured | 10/15 at 100.00 | AA+ | | 4,644,971 | |
| | 620 | | Massachusetts Health and Educational Facilities Authority, Revenue Bonds, CareGroup Inc., Series 2008E-1 &2, 5.125%, 7/01/33 | 7/18 at 100.00 | A3 | | 622,492 | |
| | 2,300 | | Massachusetts Health and Educational Facilities Authority, Revenue Refunding Bonds, Suffolk University Issue, Series 2009A, 5.750%, 7/01/39 | 7/19 at 100.00 | BBB | | 2,439,104 | |
| | 2,950 | | Massachusetts Housing Finance Agency, Housing Bonds, Series 2009F, 5.700%, 6/01/40 | 12/18 at 100.00 | AA– | | 3,050,182 | |
| | 785 | | Massachusetts Port Authority, Special Facilities Revenue Bonds, US Airways Group Inc., Series 1996A, 5.875%, 9/01/23 – NPFG Insured (Alternative Minimum Tax) | 3/11 at 100.00 | A | | 747,296 | |
| | 1,000 | | Massachusetts Turnpike Authority, Metropolitan Highway System Revenue Bonds, Senior Series 1997A, 0.000%, 1/01/24 – NPFG Insured | No Opt. Call | A | | 521,780 | |
| | 13,460 | | Total Massachusetts | | | | 12,716,550 | |
| | | | Michigan – 4.4% (2.9% of Total Investments) | | | | | |
| | 6,000 | | Detroit, Michigan, Second Lien Sewerage Disposal System Revenue Bonds, Series 2005A, 5.000%, 7/01/35 – NPFG Insured | 7/15 at 100.00 | A1 | | 5,924,160 | |
| | 15,255 | | Michigan State Hospital Finance Authority, Hospital Revenue Bonds, Detroit Medical Center Obligated Group, Series 1998A, 5.250%, 8/15/28 | 2/11 at 100.00 | BB– | | 14,267,391 | |
| | 1,150 | | Royal Oak Hospital Finance Authority, Michigan, Hospital Revenue Bonds, William Beaumont Hospital, Refunding Series 2009V, 8.250%, 9/01/39 | 9/18 at 100.00 | A1 | | 1,386,498 | |
| | 4,000 | | Wayne County, Michigan, Airport Revenue Bonds, Detroit Metropolitan Wayne County Airport, Series 1998A, 5.375%, 12/01/16 – NPFG Insured (Alternative Minimum Tax) | 12/10 at 100.00 | A | | 4,007,320 | |
| | 26,405 | | Total Michigan | | | | 25,585,369 | |
| | | | Minnesota – 1.4% (0.9% of Total Investments) | | | | | |
| | 6,375 | | Minneapolis Health Care System, Minnesota, Revenue Bonds, Fairview Hospital and Healthcare Services, Series 2008A, 6.625%, 11/15/28 | 11/18 at 100.00 | A | | 7,299,184 | |
| | 530 | | Minnesota Housing Finance Agency, Single Family Mortgage Bonds, Series 1998H-1, 5.650%, 7/01/31 (Alternative Minimum Tax) | 1/11 at 100.00 | AA+ | | 552,419 | |
| | 6,905 | | Total Minnesota | | | | 7,851,603 | |
| | | | Missouri – 2.3% (1.5% of Total Investments) | | | | | |
| | | | Kansas City Municipal Assistance Corporation, Missouri, Leasehold Revenue Bonds, Series 2004B-1: | | | | | |
| | 7,000 | | 0.000%, 4/15/27 – AMBAC Insured | No Opt. Call | AA– | | 3,031,000 | |
| | 5,000 | | 0.000%, 4/15/29 – AMBAC Insured | No Opt. Call | AA– | | 1,894,000 | |
| | 1,885 | | Missouri Health and Educational Facilities Authority, Revenue Bonds, SSM Healthcare System, Series 2001A, 5.250%, 6/01/21 – AMBAC Insured | 6/11 at 101.00 | AA– | | 1,958,421 | |
| | | | Missouri Health and Educational Facilities Authority, Revenue Bonds, SSM Healthcare System, Series 2001A: | | | | | |
| | 300 | | 5.250%, 6/01/21 (Pre-refunded 6/01/11) – AMBAC Insured | 6/11 at 101.00 | AA– (4) | | 311,538 | |
| | 2,185 | | 5.250%, 6/01/21 (Pre-refunded 6/01/11) – AMBAC Insured | 6/11 at 101.00 | AA– (4) | | 2,269,035 | |
| | 3,670 | | 5.250%, 6/01/28 (Pre-refunded 6/01/11) – AMBAC Insured | 6/11 at 101.00 | AA– (4) | | 3,811,148 | |
| | 20,040 | | Total Missouri | | | | 13,275,142 | |
| | | | Montana – 0.3% (0.2% of Total Investments) | | | | | |
| | 460 | | Montana Board of Housing, Single Family Mortgage Bonds, Series 2000A-2, 6.450%, 6/01/29 (Alternative Minimum Tax) | 12/10 at 100.00 | AA+ | | 468,059 | |
| | Principal | | | Optional Call | | | | |
| | Amount (000) | | Description (1) | Provisions (2) | Ratings (3) | | Value | |
| | | | Montana (continued) | | | | | |
| $ | 1,000 | | Montana Higher Education Student Assistance Corporation, Student Loan Revenue Bonds, Subordinate Series 1999B, 6.400%, 12/01/32 (Alternative Minimum Tax) | 12/10 at 100.00 | A2 | $ | 989,670 | |
| | 1,460 | | Total Montana | | | | 1,457,729 | |
| | | | Nevada – 5.2% (3.4% of Total Investments) | | | | | |
| | 10,000 | | Clark County, Nevada, Airport Revenue Bonds, Subordinate Lien Series 2010B, 5.750%, 7/01/42 | 1/20 at 100.00 | Aa3 | | 10,766,600 | |
| | 9,675 | | Clark County, Nevada, Passenger Facility Charge Revenue Bonds, Las Vegas-McCarran International Airport, Series 2010A, 5.250%, 7/01/42 | 1/20 at 100.00 | Aa3 | | 10,030,653 | |
| | | | Director of Nevada State Department of Business and Industry, Revenue Bonds, Las Vegas Monorail Project, First Tier, Series 2000: | | | | | |
| | 8,000 | | 0.000%, 1/01/19 – AMBAC Insured | No Opt. Call | N/R | | 1,066,560 | |
| | 4,000 | | 5.625%, 1/01/32 – AMBAC Insured (6) | 1/12 at 100.00 | N/R | | 840,760 | |
| | 3,000 | | 5.375%, 1/01/40 – AMBAC Insured (6) | 1/11 at 100.00 | N/R | | 630,390 | |
| | 3,750 | | Henderson, Nevada, Healthcare Facility Revenue Refunding Bonds, Catholic Healthcare West, Trust 2634, 18.387%, 7/01/31 – BHAC Insured (IF) | 7/17 at 100.00 | AA+ | | 4,617,000 | |
| | 1,500 | | Las Vegas Redevelopment Agency, Nevada, Tax Increment Revenue Bonds, Series 2009A, 8.000%, 6/15/30 | 6/19 at 100.00 | A | | 1,778,535 | |
| | 39,925 | | Total Nevada | | | | 29,730,498 | |
| | | | New Jersey – 6.7% (4.5% of Total Investments) | | | | | |
| | 6,850 | | New Jersey Educational Facilities Authority, Revenue Refunding Bonds, University of Medicine and Dentistry of New Jersey, Series 2009B, 5.750%, 12/01/15 | No Opt. Call | Baa1 | | 7,703,784 | |
| | 1,830 | | New Jersey Higher Education Assistance Authority, Student Loan Revenue Bonds, Series 2000A, 6.000%, 6/01/13 – NPFG Insured (Alternative Minimum Tax) | 12/10 at 101.00 | Aaa | | 1,854,083 | |
| | 4,130 | | New Jersey Transit Corporation, Certificates of Participation, Federal Transit Administration Grants, Series 2002A, 5.500%, 9/15/13 – AMBAC Insured | No Opt. Call | Aa3 | | 4,532,179 | |
| | 4,000 | | New Jersey Transportation Trust Fund Authority, Transportation System Bonds, Series 1999A, 5.750%, 6/15/18 | No Opt. Call | AA– | | 4,807,400 | |
| | 20,000 | | New Jersey Transportation Trust Fund Authority, Transportation System Bonds, Series 2006C, 0.000%, 12/15/28 – AMBAC Insured | No Opt. Call | AA– | | 7,626,200 | |
| | | | Tobacco Settlement Financing Corporation, New Jersey, Tobacco Settlement Asset-Backed Bonds, Series 2002: | | | | | |
| | 6,940 | | 5.750%, 6/01/32 (Pre-refunded 6/01/12) | 6/12 at 100.00 | AAA | | 7,375,346 | |
| | 3,165 | | 6.125%, 6/01/42 (Pre-refunded 6/01/12) | 6/12 at 100.00 | AAA | | 3,451,053 | |
| | 1,365 | | Tobacco Settlement Financing Corporation, New Jersey, Tobacco Settlement Asset-Backed Bonds, Series 2003, 6.750%, 6/01/39 (Pre-refunded 6/01/13) | 6/13 at 100.00 | AAA | | 1,578,104 | |
| | 48,280 | | Total New Jersey | | | | 38,928,149 | |
| | | | New Mexico – 0.7% (0.4% of Total Investments) | | | | | |
| | 3,730 | | University of New Mexico, FHA-Insured Mortgage Hospital Revenue Bonds, Series 2004, 5.000%, 7/01/32 – AGM Insured | 7/14 at 100.00 | AA+ | | 3,834,813 | |
| | | | New York – 8.0% (5.3% of Total Investments) | | | | | |
| | 2,170 | | Dormitory Authority of the State of New York, Insured Revenue Bonds, Franciscan Health Partnership Obligated Group – Frances Shervier Home and Hospital, Series 1997, 5.500%, 7/01/17 – RAAI Insured | 1/11 at 100.00 | A3 | | 2,172,105 | |
| | 7,500 | | Dormitory Authority of the State of New York, Secured Hospital Revenue Refunding Bonds, Wyckoff Heights Medical Center, Series 1998H, 5.300%, 8/15/21 – NPFG Insured | 2/11 at 100.00 | AA– | | 7,510,350 | |
| | 6,000 | | New York City Industrial Development Agency, New York, American Airlines-JFK International Airport Special Facility Revenue Bonds, Series 2005, 7.750%, 8/01/31 (Alternative Minimum Tax) | 8/16 at 101.00 | B– | | 6,381,120 | |
| | 4,755 | | New York City Industrial Development Agency, New York, Revenue Bonds, Yankee Stadium Project PILOT, Series 2009A, 7.000%, 3/01/49 – AGC Insured | 3/19 at 100.00 | AA+ | | 5,568,533 | |
| | 5,000 | | New York City Municipal Water Finance Authority, New York, Water and Sewerage System Revenue Bonds, Series 2004B, 5.000%, 6/15/36 – AGM Insured (UB) | 12/14 at 100.00 | AAA | | 5,235,400 | |
| | 8,800 | | New York City Sales Tax Asset Receivable Corporation, New York, Dedicated Revenue Bonds, Local Government Assistance Corporation, Series 2004A, 5.000%, 10/15/32 – AMBAC Insured (UB) | 10/14 at 100.00 | AAA | | 9,381,416 | |
Nuveen Investments 59
| | | Nuveen Dividend Advantage Municipal Fund (continued) |
| NAD | | Portfolio of Investments October 31, 2010 |
| | Principal | | | Optional Call | | | | |
| | Amount (000) | | Description (1) | Provisions (2) | Ratings (3) | | Value | |
| | | | New York (continued) | | | | | |
| $ | 10,000 | | Port Authority of New York and New Jersey, Special Project Bonds, JFK International Air Terminal LLC, Sixth Series 1997, 5.900%, 12/01/17 – NPFG Insured (Alternative Minimum Tax) | 12/10 at 100.00 | A | $ | 10,056,100 | |
| | 44,225 | | Total New York | | | | 46,305,024 | |
| | | | North Carolina – 1.1% (0.7% of Total Investments) | | | | | |
| | 1,500 | | Charlotte-Mecklenberg Hospital Authority, North Carolina, Carolinas HealthCare System Revenue Bonds, Series 2008A, 5.250%, 1/15/24 – AGC Insured | 1/18 at 100.00 | AA– | | 1,628,100 | |
| | 3,830 | | Charlotte-Mecklenburg Hospital Authority, North Carolina, Healthcare System Revenue Bonds, DBA Carolinas Healthcare System, Series 2005A, 5.000%, 1/15/45 (Pre-refunded 1/15/15) | 1/15 at 100.00 | AAA | | 4,441,574 | |
| | 5,330 | | Total North Carolina | | | | 6,069,674 | |
| | | | Ohio – 4.1% (2.7% of Total Investments) | | | | | |
| | 2,300 | | Amherst Exempted Village School District, Ohio, Unlimited Tax General Obligation School Improvement Bonds, Series 2001, 5.125%, 12/01/21 (Pre-refunded 12/01/11) – FGIC Insured | 12/11 at 100.00 | Aa2 (4) | | 2,420,865 | |
| | | | Buckeye Tobacco Settlement Financing Authority, Ohio, Tobacco Settlement Asset-Backed Revenue Bonds, Senior Lien, Series 2007A-2: | | | | | |
| | 1,275 | | 5.375%, 6/01/24 | 6/17 at 100.00 | BBB | | 1,140,411 | |
| | 160 | | 5.125%, 6/01/24 | 6/17 at 100.00 | BBB | | 139,811 | |
| | 1,800 | | 5.875%, 6/01/30 | 6/17 at 100.00 | BBB | | 1,516,644 | |
| | 1,740 | | 5.750%, 6/01/34 | 6/17 at 100.00 | BBB | | 1,387,615 | |
| | 3,930 | | 5.875%, 6/01/47 | 6/17 at 100.00 | BBB | | 3,007,472 | |
| | 6,000 | | Butler County, Ohio, Hospital Facilities Revenue Bonds, UC Health, Series 2010, 5.250%, 11/01/29 (WI/DD, Settling 11/04/10) | 11/20 at 100.00 | BBB+ | | 5,893,860 | |
| | 3,635 | | Franklin County, Ohio, FHA-Insured Multifamily Housing Mortgage Revenue Bonds, Hamilton Creek Apartments Project, Series 1994A, 5.550%, 7/01/24 (Alternative Minimum Tax) | 1/11 at 100.00 | Aa2 | | 3,637,908 | |
| | 3,650 | | Montgomery County, Ohio, Revenue Bonds, Catholic Health Initiatives, Series 2004A, 5.000%, 5/01/30 | 5/14 at 100.00 | AA | | 3,774,319 | |
| | 840 | | Warren County, Ohio, Limited Tax General Obligations, Series 1997, 5.500%, 12/01/17 | 12/10 at 100.00 | Aa1 | | 843,352 | |
| | 25,330 | | Total Ohio | | | | 23,762,257 | |
| | | | Oregon – 0.4% (0.3% of Total Investments) | | | | | |
| | 2,355 | | Portland, Oregon, Downtown Waterfront Urban Renewal and Redevelopment Revenue Bonds, Series 2000A, 5.500%, 6/15/20 – AMBAC Insured | 12/10 at 101.00 | Aa3 | | 2,410,931 | |
| | | | Pennsylvania – 3.5% (2.3% of Total Investments) | | | | | |
| | 3,480 | | Allegheny County Hospital Development Authority, Pennsylvania, Revenue Bonds, West Penn Allegheny Health System, Series 2000B, 9.250%, 11/15/22 (Pre-refunded 11/15/10) | 11/10 at 102.00 | AAA | | 3,563,416 | |
| | 1,250 | | Erie Water Authority, Pennsylvania, Water Revenue Bonds, Series 2008, 5.000%, 12/01/43 – AGM Insured | 12/18 at 100.00 | AA+ | | 1,294,938 | |
| | 1,500 | | Pennsylvania Housing Finance Agency, Single Family Mortgage Revenue Bonds, Series 2006A, 4.650%, 10/01/31 (Alternative Minimum Tax) (UB) | 10/16 at 100.00 | AA+ | | 1,486,080 | |
| | 8,200 | | Pennsylvania Turnpike Commission, Turnpike Revenue Bonds, Capital Appreciation Series 2009E, 0.000%, 12/01/38 | 12/27 at 100.00 | A– | | 6,143,932 | |
| | 5,000 | | Pennsylvania Turnpike Commission, Turnpike Subordinate Revenue Bonds, Series 2009C, 0.000%, 6/01/33 – AGM Insured | 6/26 at 100.00 | AA+ | | 4,093,800 | |
| | 3,205 | | Philadelphia School District, Pennsylvania, General Obligation Bonds, Series 2002B, 5.625%,8/01/16 (Pre-refunded 8/01/12) – FGIC Insured | 8/12 at 100.00 | Aa2 (4) | | 3,495,149 | |
| | 22,635 | | Total Pennsylvania | | | | 20,077,315 | |
| | | | Puerto Rico – 5.8% (3.9% of Total Investments) | | | | | |
| | 2,500 | | Puerto Rico Aqueduct and Sewerage Authority, Revenue Bonds, Senior Lien Series 2008A, 6.000%, 7/01/44 | 7/18 at 100.00 | Baa1 | | 2,672,250 | |
| | | | Puerto Rico Housing Finance Authority, Capital Fund Program Revenue Bonds, Series 2003: | | | | | |
| | 8,200 | | 4.500%, 12/01/23 (Pre-refunded 12/01/13) (UB) | 12/13 at 100.00 | AAA | | 9,115,284 | |
| | 4,300 | | 4.500%, 12/01/23 (UB) | 12/13 at 100.00 | AA+ | | 4,384,667 | |
| | Principal | | | Optional Call | | | | |
| | Amount (000) | | Description (1) | Provisions (2) | Ratings (3) | | Value | |
| | | | Puerto Rico (continued) | | | | | |
| $ | 12,845 | | Puerto Rico Infrastructure Financing Authority, Special Tax Revenue Bonds, Series 2005A, 0.000%, 7/01/42 – FGIC Insured | No Opt. Call | A3 | $ | 1,645,188 | |
| | 10,000 | | Puerto Rico Sales Tax Financing Corporation, Sales Tax Revenue Bonds, First Subordinate Series 2009A, 6.000%, 8/01/42 | 8/19 at 100.00 | A+ | | 11,182,300 | |
| | 4,310 | | Puerto Rico Sales Tax Financing Corporation, Sales Tax Revenue Bonds, First Subordinate Series 2010C, 5.250%, 8/01/41 | 8/20 at 100.00 | A+ | | 4,507,226 | |
| | 42,155 | | Total Puerto Rico | | | | 33,506,915 | |
| | | | Rhode Island – 2.9% (2.0% of Total Investments) | | | | | |
| | 2,015 | | Central Falls, Rhode Island, General Obligation School Bonds, Series 1999, 6.250%, 5/15/20 – RAAI Insured | 11/10 at 101.00 | B3 | | 1,674,667 | |
| | | | Rhode Island Housing & Mortgage Finance Corporation, Homeownership Opportunity 57-B Bond Program, Series 2008, Trust 1177: | | | | | |
| | 1,500 | | 9.564%, 4/01/23 (Alternative Minimum Tax) (IF) | 4/17 at 100.00 | AA+ | | 1,614,000 | |
| | 1,000 | | 9.664%, 4/01/23 (Alternative Minimum Tax) (IF) | 4/17 at 100.00 | AA+ | | 1,061,320 | |
| | 12,500 | | Rhode Island Tobacco Settlement Financing Corporation, Tobacco Settlement Asset-Backed Bonds, Series 2002A, 6.125%, 6/01/32 | 6/12 at 100.00 | BBB | | 12,577,000 | |
| | 17,015 | | Total Rhode Island | | | | 16,926,987 | |
| | | | South Carolina – 0.3% (0.2% of Total Investments) | | | | | |
| | 1,500 | | Greenville, South Carolina, Hospital Facilities Revenue Bonds, Series 2001, 5.000%, 5/01/31 – AMBAC Insured | 5/11 at 101.00 | AA– | | 1,511,670 | |
| | | | Tennessee – 1.2% (0.8% of Total Investments) | | | | | |
| | 2,250 | | Memphis-Shelby County Airport Authority, Tennessee, Airport Revenue Bonds, Series 1999D, 6.000%, 3/01/24 – AMBAC Insured (Alternative Minimum Tax) | 3/11 at 100.00 | A2 | | 2,266,155 | |
| | 2,425 | | Memphis-Shelby County Airport Authority, Tennessee, Airport Revenue Bonds, Series 2001B, 5.125%, 3/01/26 – AGM Insured | 3/11 at 100.00 | AA+ | | 2,436,204 | |
| | 2,310 | | Sullivan County Health Educational and Housing Facilities Board, Tennessee, Revenue Bonds, Wellmont Health System, Series 2006C, 5.250%, 9/01/36 | 9/16 at 100.00 | BBB+ | | 2,271,331 | |
| | 188 | | Sumner County Health, Educational, and Housing Facilities Board, Tennessee, Revenue Refunding Bonds, Sumner Regional Health System Inc., Series 2007, 5.500%, 11/01/46 (5) (6) | 11/17 at 100.00 | N/R | | 78,062 | |
| | 7,173 | | Total Tennessee | | | | 7,051,752 | |
| | | | Texas – 6.3% (4.2% of Total Investments) | | | | | |
| | 2,560 | | Brazos River Authority, Texas, Pollution Control Revenue Refunding Bonds, TXU Electric Company, Series 1999C, 7.700%, 3/01/32 (Alternative Minimum Tax) | 4/13 at 101.00 | Ca | | 949,581 | |
| | 2,000 | | Capital Area Cultural Education Facilities Finance Corporation, Texas, Revenue Bonds, The Roman Catholic Diocese of Austin, Series 2005B. Remarketed, 6.125%, 4/01/45 | 4/20 at 100.00 | Baa2 | | 2,055,320 | |
| | 2,820 | | Central Texas Regional Mobility Authority, Travis and Williamson Counties, Toll Road Revenue Bonds, Series 2005, 5.000%, 1/01/45 – FGIC Insured | 1/15 at 100.00 | A | | 2,657,258 | |
| | 820 | | Dallas Area Rapid Transit, Texas, Senior Lien Sales Tax Revenue Bonds, Series 2001, 5.000%, 12/01/31 (Pre-refunded 12/01/11) – AMBAC Insured | 12/11 at 100.00 | AA+ (4) | | 861,976 | |
| | 2,305 | | Harris County-Houston Sports Authority, Texas, Senior Lien Revenue Refunding Bonds, Series 2001A, 0.000%, 11/15/20 – NPFG Insured | No Opt. Call | A | | 1,158,239 | |
| | 3,130 | | Houston, Texas, Hotel Occupancy Tax and Special Revenue Bonds, Convention and Entertainment Project, Series 2001B, 0.000%, 9/01/30 – AMBAC Insured | No Opt. Call | A2 | | 995,184 | |
| | 30,095 | | Leander Independent School District, Williamson and Travis Counties, Texas, General Obligation Bonds, Series 2004, 0.000%, 8/15/34 | 8/12 at 27.94 | AAA | | 7,731,706 | |
| | 9,345 | | Leander Independent School District, Williamson and Travis Counties, Texas, General Obligation Bonds, Series 2005, 0.000%, 8/15/33 – FGIC Insured | 8/15 at 37.33 | AA– | | 2,779,296 | |
| | 33,160 | | Leander Independent School District, Williamson and Travis Counties, Texas, General Obligation Bonds, Series 2006, 0.000%, 8/15/38 | 8/14 at 26.50 | AAA | | 7,305,148 | |
| | 1,000 | | San Antonio, Texas, Water System Revenue Bonds, Series 2005, 4.750%, 5/15/37 – NPFG Insured | 5/15 at 100.00 | Aa1 | | 1,018,580 | |
| | 3,295 | | Tarrant County, Texas, Cultural & Educational Facilities Financing Corporation, Revenue Bonds, Series 2007, Residuals 1760-3, 16.624%, 2/15/36 (IF) | 2/17 at 100.00 | AA– | | 3,364,722 | |
Nuveen Investments 61
| | | Nuveen Dividend Advantage Municipal Fund (continued) |
| NAD | | Portfolio of Investments October 31, 2010 |
| | Principal | | | Optional Call | | | | |
| | Amount (000) | | Description (1) | Provisions (2) | Ratings (3) | | Value | |
| | | | Texas (continued) | | | | | |
| $ | 7,000 | | White Settlement Independent School District, Tarrant County, Texas, General Obligation Bonds, Series 2005, 0.000%, 8/15/35 | 8/15 at 34.92 | AAA | $ | 1,954,260 | |
| | | | Wylie Independent School District, Collin County, Texas, General Obligation Bonds, Series 2005: | | | | | |
| | 3,000 | | 0.000%, 8/15/20 | 8/15 at 78.46 | AAA | | 2,034,000 | |
| | 3,000 | | 0.000%, 8/15/22 | 8/15 at 70.77 | AAA | | 1,809,600 | |
| | 103,530 | | Total Texas | | | | 36,674,870 | |
| | | | Utah – 0.1% (0.1% of Total Investments) | | | | | |
| | | | Utah Housing Finance Agency, Single Family Mortgage Bonds, Series 1999C-2, Class II: | | | | | |
| | 135 | | 5.700%, 7/01/19 (Alternative Minimum Tax) | 1/11 at 100.75 | Aaa | | 140,393 | |
| | 40 | | 5.750%, 7/01/21 (Alternative Minimum Tax) | 1/11 at 100.75 | Aa2 | | 40,341 | |
| | 310 | | Utah Housing Finance Agency, Single Family Mortgage Bonds, Series 2000F-2, Class III, 6.000%, 1/01/15 (Alternative Minimum Tax) | 1/11 at 100.00 | AA– | | 310,471 | |
| | 485 | | Total Utah | | | | 491,205 | |
| | | | Virginia – 0.5% (0.3% of Total Investments) | | | | | |
| | 3,000 | | Fairfax County Economic Development Authority, Virginia, Residential Care Facilities Mortgage Revenue Bonds, Goodwin House, Inc., Series 2007A, 5.125%, 10/01/42 | 10/17 at 100.00 | N/R | | 2,978,880 | |
| | | | Washington – 11.2% (7.5% of Total Investments) | | | | | |
| | 4,000 | | Energy Northwest, Washington, Electric Revenue Refunding Bonds, Nuclear Project 3, Series 2003A, 5.500%, 7/01/17 – SYNCORA GTY Insured | 7/13 at 100.00 | Aaa | | 4,459,880 | |
| | | | Port of Seattle, Washington, Special Facility Revenue Bonds, Terminal 18, Series 1999B: | | | | | |
| | 1,755 | | 6.000%, 9/01/15 – NPFG Insured (Alternative Minimum Tax) | 3/11 at 100.00 | A | | 1,771,164 | |
| | 2,590 | | 6.000%, 9/01/16 – NPFG Insured (Alternative Minimum Tax) | 3/11 at 100.00 | A | | 2,611,523 | |
| | | | Port of Seattle, Washington, Special Facility Revenue Bonds, Terminal 18, Series 1999C: | | | | | |
| | 875 | | 6.000%, 9/01/15 – NPFG Insured (Alternative Minimum Tax) | 3/11 at 100.00 | A | | 883,059 | |
| | 1,260 | | 6.000%, 9/01/16 – NPFG Insured (Alternative Minimum Tax) | 3/11 at 100.00 | A | | 1,270,471 | |
| | 3,595 | | Seattle, Washington, Municipal Light and Power Revenue Refunding and Improvement Bonds, Series 2001, 5.500%, 3/01/19 (Pre-refunded 3/01/11) – AGM Insured | 3/11 at 100.00 | AA+ (4) | | 3,659,207 | |
| | 1,225 | | Seattle, Washington, Municipal Light and Power Revenue Refunding and Improvement Bonds, Series 2001, 5.500%, 3/01/19 – AGM Insured | 3/11 at 100.00 | AA+ | | 1,242,897 | |
| | 2,000 | | Washington State Health Care Facilities Authority, Revenue Bonds, Fred Hutchinson Cancer Research Center, Series 2009A, 6.000%, 1/01/33 | 7/19 at 100.00 | A | | 2,104,680 | |
| | 5,960 | | Washington State Tobacco Settlement Authority, Tobacco Settlement Asset-Backed Revenue Bonds, Series 2002, 6.500%, 6/01/26 | 6/13 at 100.00 | BBB | | 6,172,772 | |
| | 11,605 | | Washington, Certificates of Participation, Washington Convention and Trade Center, Series 1999, 5.250%, 7/01/16 – NPFG Insured | 1/11 at 100.00 | AA | | 11,644,805 | |
| | 3,350 | | Washington, General Obligation Compound Interest Bonds, Series 1999S-2, 0.000%, 1/01/18 – AGM Insured | No Opt. Call | AA+ | | 2,757,921 | |
| | | | Washington, General Obligation Compound Interest Bonds, Series 1999S-3: | | | | | |
| | 17,650 | | 0.000%, 1/01/20 | No Opt. Call | AA+ | | 13,203,083 | |
| | 18,470 | | 0.000%, 1/01/21 | No Opt. Call | AA+ | | 13,134,017 | |
| | 74,335 | | Total Washington | | | | 64,915,479 | |
| | | | Wisconsin – 7.6% (5.0% of Total Investments) | | | | | |
| | 1,690 | | Green Bay, Wisconsin, Water System Revenue Bonds, Series 2004, 5.000%, 11/01/29 (Pre-refunded 11/01/14) – AGM Insured | 11/14 at 100.00 | Aa2 (4) | | 1,963,020 | |
| | 560 | | Green Bay, Wisconsin, Water System Revenue Bonds, Series 2004, 5.000%, 11/01/29 – AGM Insured | 11/14 at 100.00 | Aa2 | | 582,322 | |
| | 3,810 | | La Crosse, Wisconsin, Industrial Development Revenue Refunding Bonds, Dairyland Power Cooperative, Series 1997C, 5.550%, 2/01/15 – AMBAC Insured | 12/10 at 100.00 | A3 | | 3,830,917 | |
| | 7,410 | | Wisconsin Health and Educational Facilities Authority, Revenue Bonds, Ascension Health, Series 2006A, 5.000%, 11/15/36 | 11/16 at 100.00 | Aa1 | | 7,635,635 | |
| | 4,330 | | Wisconsin Health and Educational Facilities Authority, Revenue Bonds, Childrens Hospital of Wisconsin Inc., Series 2008B, 5.500%, 8/15/29 | 2/20 at 100.00 | AA– | | 4,731,304 | |
| | 4,380 | | Wisconsin Health and Educational Facilities Authority, Revenue Bonds, Kenosha Hospital and Medical Center Inc., Series 1999, 5.625%, 5/15/29 | 11/10 at 100.00 | A | | 4,382,146 | |
| | Principal | | | Optional Call | | | | |
| | Amount (000) | | Description (1) | Provisions (2) | Ratings (3) | | Value | |
| | | | Wisconsin (continued) | | | | | |
| $ | 12,700 | | Wisconsin Health and Educational Facilities Authority, Revenue Bonds, Mercy Health System Corporation, Series 1999, 5.500%, 8/15/25 – AMBAC Insured | 2/11 at 100.50 | A2 | $ | 12,763,368 | |
| | 2,200 | | Wisconsin Health and Educational Facilities Authority, Revenue Bonds, Wheaton Franciscan Services Inc., Series 2003A, 5.125%, 8/15/33 | 8/13 at 100.00 | BBB+ | | 2,058,140 | |
| | 5,000 | | Wisconsin State, General Fund Annual Appropriation Revenue Bonds, Refunding Series 2009A, 6.000%, 5/01/36 | 5/19 at 100.00 | AA– | | 5,697,550 | |
| | 42,080 | | Total Wisconsin | | | | 43,644,402 | |
| $ | 1,113,543 | | Total Municipal Bonds (cost $848,536,754) | | | | 868,666,866 | |
| | | | | | | | | |
| | Shares | | Description (1) | | | | Value | |
| | | | Investment Companies – 0.1% (0.1% of Total Investments) | | | | | |
| | 8,812 | | BlackRock MuniHoldings Fund Inc. | | | $ | 146,984 | |
| | 32,332 | | Invesco Van Kampen Quality Municipal Income Trust | | | | 431,956 | |
| | | | Total Investment Companies (cost $528,388) | | | | 578,940 | |
| | | | Total Investments (cost $849,065,142) – 150.7% | | | | 869,245,806 | |
| | | | Floating Rate Obligations – (8.9)% | | | | (51,605,000 | ) |
| | | | MuniFund Term Preferred Shares, at Liquidation Value – (25.0)% (7) | | | | (144,300,000) | |
| | | | Other Assets Less Liabilities – 4.0% | | | | 23,628,962 | |
| | | | Auction Rate Preferred Shares, at Liquidation Value – (20.8)% (7) | | | | (120,075,000 | ) |
| | | | Net Assets Applicable to Common Shares – 100% | | | $ | 576,894,768 | |
| (1) | | All percentages shown in the Portfolio of Investments are based on net assets applicable to Common shares unless otherwise noted. |
| (2) | | Optional Call Provisions (not covered by the report of independent registered public accounting firm): Dates (month and year) and prices of the earliest optional call or redemption. There may be other call provisions at varying prices at later dates. Certain mortgage-backed securities may be subject to periodic principal paydowns. |
| (3) | | Ratings (not covered by the report of independent registered public accounting firm): Using the highest of Standard & Poor’s Group (“Standard & Poor’s”), Moody’s Investor Service, Inc. (“Moody’s”) or Fitch, Inc. (“Fitch”) rating. Ratings below BBB by Standard & Poor’s, Baa by Moody’s or BBB by Fitch are considered to be below investment grade. Holdings designated N/R are not rated by any of these national rating agencies. |
| (4) | | Backed by an escrow or trust containing sufficient U.S. Government or U.S. Government agency securities, which ensure the timely payment of principal and interest. Such investments are normally considered to be equivalent to AAA rated securities. |
| (5) | | For fair value measurement disclosure purposes, investment categorized as Level 3. See Notes to Financial Statements, Footnote 1 – General Information and Significant Accounting Policies, Investment Valuation for more information. |
| (6) | | The Fund’s Adviser has concluded this issue is not likely to meet its future interest payment obligations and has directed the Fund’s custodian to cease accruing additional income on the Fund’s records. |
| (7) | | MuniFund Term Preferred Shares and Auction Rate Preferred Shares, at Liquidation Value as a percentage of Total Investments are 16.6% and 13.8%, respectively. |
| N/R | | Not rated. |
| WI/DD | | Purchased on a when-issued or delayed delivery basis. |
| (IF) | | Inverse floating rate investment. |
| (UB) | | Underlying bond of an inverse floating rate trust reflected as a financing transaction. See Notes to Financial Statements, Footnote 1 – General Information and Significant Accounting Policies, Inverse Floating Rate Securities for more information. |
See accompanying notes to financial statements.
Nuveen Investments 63
| | | Nuveen Dividend Advantage Municipal Fund 2 |
| NXZ | | Portfolio of Investments |
| | | October 31, 2010 |
| | Principal | | | Optional Call | | | | |
| | Amount (000) | | Description (1) | Provisions (2) | Ratings (3) | | Value | |
| | | | Alabama – 4.4% (3.0% of Total Investments) | | | | | |
| $ | 18,500 | | Huntsville Healthcare Authority, Alabama, Revenue Bonds, Series 2001A, 5.750%, 6/01/31 (Pre-refunded 6/01/11) | 6/11 at 101.00 | A1 (4) | $ | 19,285,140 | |
| | | | Alaska – 0.4% (0.2% of Total Investments) | | | | | |
| | 2,200 | | Northern Tobacco Securitization Corporation, Alaska, Tobacco Settlement Asset-Backed Bonds, Series 2006A, 5.000%, 6/01/46 | 6/14 at 100.00 | Baa3 | | 1,546,226 | |
| | | | Arizona – 0.7% (0.5% of Total Investments) | | | | | |
| | 3,120 | | Phoenix, Arizona, Civic Improvement Corporation, Senior Lien Airport Revenue Bonds, Series 2002B, 5.250%, 7/01/32 – FGIC Insured (Alternative Minimum Tax) | 7/12 at 100.00 | AA– | | 3,136,349 | |
| | | | Arkansas – 0.2% (0.1% of Total Investments) | | | | | |
| | 925 | | Arkansas Development Finance Authority, Single Family Mortgage Revenue Bonds, GNMA Mortgage-Backed Securities Program, Series 2002C, 5.400%, 1/01/34 (Alternative Minimum Tax) | 1/12 at 100.00 | AAA | | 932,132 | |
| | | | California – 13.0% (8.9% of Total Investments) | | | | | |
| | 9,000 | | California County Tobacco Securitization Agency, Tobacco Settlement Asset-Backed Bonds, Los Angeles County Securitization Corporation, Series 2006A, 0.000%, 6/01/36 | 12/18 at 100.00 | Baa3 | | 7,194,420 | |
| | 6,000 | | California Educational Facilities Authority, Revenue Bonds, Stanford University, Series 2001Q, 5.250%, 12/01/32 | 6/11 at 101.00 | AAA | | 6,188,280 | |
| | 4,080 | | California Health Facilities Financing Authority, Revenue Bonds, Kaiser Permanante System, Series 2006, 5.000%, 4/01/37 – BHAC Insured | 4/16 at 100.00 | AA+ | | 4,187,916 | |
| | 20,000 | | Golden State Tobacco Securitization Corporation, California, Enhanced Tobacco Settlement Asset-Backed Revenue Bonds, Series 2005A, 5.000%, 6/01/45 – FGIC Insured | 6/15 at 100.00 | A2 | | 18,991,800 | |
| | 5,000 | | Golden State Tobacco Securitization Corporation, California, Tobacco Settlement Asset-Backed Bonds, Series 2003A-1, 6.750%, 6/01/39 (Pre-refunded 6/01/13) | 6/13 at 100.00 | AAA | | 5,775,950 | |
| | | | Golden State Tobacco Securitization Corporation, California, Tobacco Settlement Asset-Backed Bonds, Series 2007A-1: | | | | | |
| | 1,400 | | 5.000%, 6/01/33 | 6/17 at 100.00 | BBB | | 1,158,766 | |
| | 1,000 | | 5.125%, 6/01/47 | 6/17 at 100.00 | BBB | | 720,710 | |
| | 6,000 | | Los Angeles Regional Airports Improvement Corporation, California, Sublease Revenue Bonds, Los Angeles International Airport, American Airlines Inc. Terminal 4 Project, Series 2002C, 7.500%, 12/01/24 (Alternative Minimum Tax) | 12/12 at 102.00 | B– | | 6,108,780 | |
| | 3,000 | | San Joaquin Delta Community College District, California, General Obligation Bonds, Election 2004 Series 2008B, 0.000%, 8/01/29 – AGM Insured | 8/18 at 53.32 | AA+ | | 980,910 | |
| | 5,000 | | San Jose, California, Airport Revenue Bonds, Series 2007A, 6.000%, 3/01/47 – AMBAC Insured (Alternative Minimum Tax) | 3/17 at 100.00 | A | | 5,276,450 | |
| | 60 | | Yuba County Water Agency, California, Yuba River Development Revenue Bonds, Pacific Gas and Electric Company, Series 1966A, 4.000%, 3/01/16 | 3/11 at 100.00 | Baa1 | | 58,791 | |
| | 60,540 | | Total California | | | | 56,642,773 | |
| | | | Colorado – 9.1% (6.2% of Total Investments) | | | | | |
| | 2,245 | | Colorado Educational and Cultural Facilities Authority, Charter School Revenue Bonds, Peak-to-Peak Charter School, Series 2001, 7.500%, 8/15/21 (Pre-refunded 8/15/11) | 8/11 at 100.00 | AAA | | 2,366,904 | |
| | 3,300 | | Denver City and County, Colorado, Airport Revenue Bonds, Series 2006, 5.000%, 11/15/24 – FGIC Insured | 11/16 at 100.00 | A+ | | 3,528,558 | |
| | | | Denver City and County, Colorado, Airport Revenue Bonds, Series 2006: | | | | | |
| | 5,365 | | 5.000%, 11/15/23 – FGIC Insured (UB) | 11/16 at 100.00 | A+ | | 5,762,117 | |
| | 4,335 | | 5.000%, 11/15/25 – FGIC Insured (UB) | 11/16 at 100.00 | A+ | | 4,613,524 | |
| | 1,390 | | Denver City and County, Colorado, Airport System Revenue Refunding Bonds, Series 2000A, 6.000%, 11/15/18 – AMBAC Insured (Alternative Minimum Tax) | 11/10 at 100.00 | A+ | | 1,395,157 | |
| | 1,280 | | Eagle County Air Terminal Corporation, Colorado, Airport Terminal Revenue Bonds, Series 2001, 7.125%, 5/01/31 (Alternative Minimum Tax) | 5/11 at 101.00 | N/R | | 1,244,326 | |
| | 755 | | Jefferson County School District R1, Colorado, General Obligation Bonds, Series 2004, 5.000%, 12/15/22 (Pre-refunded 12/15/14) – AGM Insured (UB) | 12/14 at 100.00 | AA+ (4) | | 877,348 | |
| | Principal | | | Optional Call | | | | |
| | Amount (000) | | Description (1) | Provisions (2) | Ratings (3) | | Value | |
| | | | Colorado (continued) | | | | | |
| $ | 5,000 | | Northwest Parkway Public Highway Authority, Colorado, Revenue Bonds, Senior Series 2001A, 5.250%, 6/15/41 (Pre-refunded 6/15/11) – AGM Insured | 6/11 at 102.00 | AA+ (4) | $ | 5,240,050 | |
| | | | Northwest Parkway Public Highway Authority, Colorado, Senior Lien Revenue Bonds, Series 2001B: | | | | | |
| | 22,000 | | 0.000%, 6/15/28 (Pre-refunded 6/15/11) – AGM Insured | 6/11 at 35.65 | AA+ (4) | | 7,783,160 | |
| | 17,650 | | 0.000%, 6/15/29 (Pre-refunded 6/15/11) – AMBAC Insured | 6/11 at 33.46 | N/R (4) | | 5,859,271 | |
| | 1,000 | | Plaza Metropolitan District 1, Lakewood, Colorado, Tax Increment Revenue Bonds, Series 2003, 8.000%, 12/01/25 | 6/14 at 101.00 | N/R | | 1,046,390 | |
| | 64,320 | | Total Colorado | | | | 39,716,805 | |
| | | | District of Columbia – 1.3% (0.9% of Total Investments) | | | | | |
| | 835 | | District of Columbia Tobacco Settlement Corporation, Tobacco Settlement Asset-Backed Bonds, Series 2001, 6.250%, 5/15/24 | 5/11 at 101.00 | BBB | | 838,373 | |
| | 5,000 | | Washington Convention Center Authority, District of Columbia, Senior Lien Dedicated Tax Revenue Bonds, Series 2007A, 4.500%, 10/01/30 – AMBAC Insured | 10/16 at 100.00 | A1 | | 5,000,350 | |
| | 5,835 | | Total District of Columbia | | | | 5,838,723 | |
| | | | Florida – 4.2% (2.9% of Total Investments) | | | | | |
| | 15,000 | | Jacksonville, Florida, Transportation Revenue Bonds, Series 2001, 5.250%, 10/01/29 – NPFG Insured | 10/11 at 100.00 | Aa2 | | 15,430,500 | |
| | 3,000 | | Miami-Dade County, Florida, Aviation Revenue Bonds, Miami International Airport, Series 2002, 5.375%, 10/01/32 – FGIC Insured (Alternative Minimum Tax) | 10/12 at 100.00 | A | | 3,017,250 | |
| | 18,000 | | Total Florida | | | | 18,447,750 | |
| | | | Hawaii – 2.3% (1.6% of Total Investments) | | | | | |
| | | | Honolulu Board of Water Supply, Hawaii, Water System Revenue Bonds, Series 2001: | | | | | |
| | 3,000 | | 5.250%, 7/01/26 (Pre-refunded 7/01/11) – AGM Insured | 7/11 at 100.00 | AA+ (4) | | 3,100,980 | |
| | 6,725 | | 5.250%, 7/01/31 (Pre-refunded 7/01/11) – AGM Insured | 7/11 at 100.00 | AA+ (4) | | 6,951,364 | |
| | 9,725 | | Total Hawaii | | | | 10,052,344 | |
| | | | Illinois – 16.4% (11.2% of Total Investments) | | | | | |
| | 3,525 | | Chicago, Illinois, FHA/GNMA Collateralized Multifamily Housing Revenue Bonds, Stone Terrace Apartments, Series 2001A, 5.750%, 12/20/42 (Alternative Minimum Tax) | 12/11 at 100.00 | AAA | | 3,564,656 | |
| | 570 | | Chicago, Illinois, FNMA/GNMA Collateralized Single Family Mortgage Revenue Bonds, Series 2001A, 6.250%, 10/01/32 (Alternative Minimum Tax) | 4/11 at 105.00 | AAA | | 599,555 | |
| | 5,000 | | Chicago, Illinois, General Obligation Bonds, City Colleges, Series 1999, 0.000%, 1/01/34 – FGIC Insured | No Opt. Call | Aa3 | | 1,344,250 | |
| | 3,985 | | Chicago, Illinois, General Obligation Bonds, Series 2001A, 5.250%, 1/01/33 – NPFG Insured | 1/11 at 101.00 | AA– | | 4,044,855 | |
| | 5,285 | | Chicago, Illinois, General Obligation Bonds, Series 2001A, 5.250%, 1/01/33 (Pre-refunded 1/01/11) – NPFG Insured | 1/11 at 101.00 | AA– (4) | | 5,383,248 | |
| | 7,100 | | Cook County, Illinois, General Obligation Bonds, Refunding Series 2010A, 5.250%, 11/15/33 | 11/20 at 100.00 | AA | | 7,609,425 | |
| | 3,180 | | Illinois Development Finance Authority, Revenue Bonds, Chicago Charter School Foundation, Series 2002A, 6.250%, 12/01/32 (Pre-refunded 12/01/12) | 12/12 at 100.00 | N/R (4) | | 3,534,824 | |
| | 910 | | Illinois Development Finance Authority, Revenue Bonds, Illinois Wesleyan University, Series 2001, 5.500%, 9/01/32 – AMBAC Insured | 9/11 at 100.00 | BBB+ | | 912,657 | |
| | 4,090 | | Illinois Development Finance Authority, Revenue Bonds, Illinois Wesleyan University, Series 2001, 5.500%, 9/01/32 (Pre-refunded 9/01/11) – AMBAC Insured | 9/11 at 100.00 | BBB+ (4) | | 4,256,995 | |
| | 3,100 | | Illinois Development Finance Authority, Revenue Bonds, Midwestern University, Series 2001B, 6.000%, 5/15/31 (Pre-refunded 5/15/11) | 5/11 at 101.00 | AAA | | 3,221,737 | |
| | 9,500 | | Illinois Finance Authority, Revenue Bonds, Palos Community Hospital, Series 2007A, 5.000%, 5/15/32 – NPFG Insured | 5/17 at 100.00 | A | | 9,594,810 | |
| | 2,500 | | Illinois Finance Authority, Revenue Bonds, Silver Cross Hospital and Medical Centers, Series 2009, 6.875%, 8/15/38 | 8/19 at 100.00 | BBB | | 2,788,550 | |
| | 5,000 | | Illinois Health Facilities Authority, Revenue Bonds, Edward Hospital Obligated Group, Series 2001B, 5.250%, 2/15/34 (Pre-refunded 2/15/11) – AGM Insured | 2/11 at 101.00 | AA+ (4) | | 5,123,400 | |
Nuveen Investments 65
| | | Nuveen Dividend Advantage Municipal Fund 2 (continued) |
| NXZ | | Portfolio of Investments October 31, 2010 |
| | Principal | | | Optional Call | | | | |
| | Amount (000) | | Description (1) | Provisions (2) | Ratings (3) | | Value | |
| | | | Illinois (continued) | | | | | |
| $ | 2,500 | | Illinois Housing Development Authority, Homeowner Mortgage Revenue Bonds, Series 2006C2, 5.050%, 8/01/27 (Alternative Minimum Tax) | 2/16 at 100.00 | AA | $ | 2,556,500 | |
| | 2,275 | | Illinois, Sales Tax Revenue Bonds, Series 2001, 5.500%, 6/15/16 | 6/11 at 100.00 | AAA | | 2,332,603 | |
| | 2,500 | | Kane & DeKalb Counties, Illinois, Community United School District 301, General Obligation Bonds, Series 2006, 0.000%, 12/01/23 – NPFG Insured | No Opt. Call | A1 | | 1,378,900 | |
| | | | Metropolitan Pier and Exposition Authority, Illinois, Revenue Bonds, McCormick Place Expansion Project, Series 2002A: | | | | | |
| | 7,500 | | 0.000%, 12/15/30 – NPFG Insured | No Opt. Call | AAA | | 2,382,150 | |
| | 10,000 | | 0.000%, 12/15/36 – NPFG Insured | No Opt. Call | AAA | | 2,085,800 | |
| | 5,120 | | Metropolitan Pier and Exposition Authority, Illinois, Revenue Refunding Bonds, McCormick Place Expansion Project, Series 1996A, 5.250%, 6/15/27 (Pre-refunded 11/18/10) – AMBAC Insured | 11/10 at 100.00 | A2 (4) | | 5,133,466 | |
| | 1,738 | | Montgomery, Illinois, Lakewood Creek Project Special Assessment Bonds, Series 2007, 4.700%, 3/01/30 – RAAI Insured | 3/16 at 100.00 | N/R | | 1,554,554 | |
| | 3,360 | | Northfield Township High School District 225, Cook County, Illinois, Glenbrook, General Obligation School Bonds, Series 2007B, 0.000%, 12/01/24 | 12/16 at 69.01 | AAA | | 1,836,173 | |
| | 88,738 | | Total Illinois | | | | 71,239,108 | |
| | | | Indiana – 2.5% (1.7% of Total Investments) | | | | | |
| | 2,135 | | Indiana Health Facility Financing Authority, Hospital Revenue Bonds, Methodist Hospitals Inc., Series 2001, 5.500%, 9/15/31 | 9/11 at 100.00 | BBB | | 1,944,900 | |
| | 1,900 | | Indiana Health Facility Financing Authority, Hospital Revenue Refunding Bonds, Columbus Regional Hospital, Series 1993, 7.000%, 8/15/15 – AGM Insured | No Opt. Call | AA+ | | 2,169,686 | |
| | 4,000 | | Indiana Transportation Finance Authority, Highway Revenue Bonds, Series 2003A, 5.000%, 6/01/23 – AGM Insured | 6/13 at 100.00 | AA+ | | 4,435,240 | |
| | 6,100 | | St. Joseph County Hospital Authority, Indiana, Revenue Bonds, Madison Center Inc., Series 1999, 5.800%, 2/15/24 (5), (7) | 2/11 at 100.00 | CCC | | 2,333,250 | |
| | 14,135 | | Total Indiana | | | | 10,883,076 | |
| | | | Iowa – 1.6% (1.1% of Total Investments) | | | | | |
| | 1,000 | | Iowa Higher Education Loan Authority, Private College Facility Revenue Bonds, Wartburg College, Series 2002, 5.500%, 10/01/28 (Pre-refunded 10/01/12) – ACA Insured | 10/12 at 100.00 | N/R (4) | | 1,094,210 | |
| | 6,340 | | Iowa Tobacco Settlement Authority, Tobacco Asset-Backed Revenue Bonds, Series 2005B, 5.600%, 6/01/34 | 6/17 at 100.00 | BBB | | 5,683,937 | |
| | 7,340 | | Total Iowa | | | | 6,778,147 | |
| | | | Kansas – 4.0% (2.7% of Total Investments) | | | | | |
| | 17,000 | | Wichita, Kansas, Hospital Facilities Revenue Refunding and Improvement Bonds, Via Christi Health System Inc., Series 2001-III, 5.625%, 11/15/31 | 11/11 at 101.00 | A+ | | 17,279,480 | |
| | | | Kentucky – 0.2% (0.2% of Total Investments) | | | | | |
| | 1,000 | | Kentucky Economic Development Finance Authority, Louisville Arena Project Revenue Bonds, Louisville Arena Authority, Inc., Series 2008-A1, 6.000%, 12/01/38 – AGC Insured | 6/18 at 100.00 | AA+ | | 1,081,800 | |
| | | | Louisiana – 5.3% (3.6% of Total Investments) | | | | | |
| | 3,960 | | Louisiana State, Gasoline and Fuels Tax Revenue Bonds, Series 2006A, 4.500%, 5/01/41 – FGIC Insured (UB) | 5/16 at 100.00 | Aa1 | | 3,962,851 | |
| | 18,825 | | Tobacco Settlement Financing Corporation, Louisiana, Tobacco Settlement Asset-Backed Bonds, Series 2001B, 5.875%, 5/15/39 | 5/11 at 101.00 | BBB | | 19,005,155 | |
| | 22,785 | | Total Louisiana | | | | 22,968,006 | |
| | | | Michigan – 12.5% (8.5% of Total Investments) | | | | | |
| | 5,865 | | Detroit, Michigan, Senior Lien Sewerage Disposal System Revenue Bonds, Series 2003A, 5.000%, 7/01/32 – AGM Insured | 7/13 at 100.00 | AA+ | | 5,887,874 | |
| | | | Detroit, Michigan, Senior Lien Water Supply System Revenue Bonds, Series 2001A: | | | | | |
| | 20,000 | | 5.500%, 7/01/33 (Pre-refunded 7/01/11) – FGIC Insured | 7/11 at 101.00 | A1 (4) | | 20,902,200 | |
| | 15,390 | | 5.250%, 7/01/33 (Pre-refunded 7/01/11) – FGIC Insured | 7/11 at 100.00 | Aa3 (4) | | 15,860,165 | |
| | Principal | | | Optional Call | | | | |
| | Amount (000) | | Description (1) | Provisions (2) | Ratings (3) | | Value | |
| | | | Michigan (continued) | | | | | |
| $ | 4,000 | | Michigan Municipal Bond Authority, Public School Academy Revenue Bonds, Detroit Academy of Arts and Sciences Charter School, Series 2001A, 8.000%, 10/01/31 | 4/11 at 102.00 | B1 | $ | 3,991,520 | |
| | 2,000 | | Michigan State Hospital Finance Authority, Hospital Revenue Bonds, Detroit Medical Center Obligated Group, Series 1998A, 5.125%, 8/15/18 | 2/11 at 100.00 | BB– | | 1,984,640 | |
| | | | Michigan State Hospital Finance Authority, Revenue Refunding Bonds, Detroit Medical Center Obligated Group, Series 1993A: | | | | | |
| | 1,630 | | 6.250%, 8/15/13 | 2/11 at 100.00 | BB– | | 1,630,603 | |
| | 4,035 | | 6.500%, 8/15/18 | 2/11 at 100.00 | BB– | | 4,034,879 | |
| | 52,920 | | Total Michigan | | | | 54,291,881 | |
| | | | Minnesota – 4.6% (3.1% of Total Investments) | | | | | |
| | 5,000 | | Minneapolis, Minnesota, Health Care System Revenue Bonds,S Fairview Health Services, Series 2008B, 6.500%, 11/15/38 – AGC Insured | 11/18 at 100.00 | AA+ | | 5,706,600 | |
| | 14,000 | | Minneapolis-St. Paul Metropolitan Airports Commission, Minnesota, Airport Revenue Bonds, Series 2001A, 5.250%, 1/01/32 (Pre-refunded 1/01/11) – FGIC Insured | 1/11 at 100.00 | AAA | | 14,120,960 | |
| | 19,000 | | Total Minnesota | | | | 19,827,560 | |
| | | | Montana – 0.4% (0.3% of Total Investments) | | | | | |
| | 1,865 | | Montana Board of Housing, Single Family Program Bonds, Series 2001A-2, 5.700%, 6/01/32 (Alternative Minimum Tax) | 12/10 at 100.00 | AA+ | | 1,866,399 | |
| | | | Nevada – 1.6% (1.1% of Total Investments) | | | | | |
| | 12,275 | | Director of Nevada State Department of Business and Industry, Revenue Bonds, Las Vegas Monorail Project, First Tier, Series 2000, 5.375%, 1/01/40 – AMBAC Insured (6) | 1/11 at 100.00 | N/R | | 2,579,346 | |
| | 3,500 | | Director of Nevada State Department of Business and Industry, Revenue Bonds, Las Vegas Monorail Project, Second Tier, Series 2000, 7.375%, 1/01/40 (6) | 1/12 at 100.00 | N/R | | 8,050 | |
| | 2,000 | | Henderson, Nevada, Healthcare Facility Revenue Refunding Bonds, Catholic Healthcare West, Series 2007B, Trust 2633, 18.387%, 7/01/31 – BHAC Insured (IF) | 7/17 at 100.00 | AA+ | | 2,462,400 | |
| | 1,750 | | Reno, Nevada, Health Facilities Revenue Bonds, Catholic Healthcare West, Trust 2634, 18.114%, 7/01/31 – BHAC Insured (IF) | 7/17 at 100.00 | AA+ | | 2,088,310 | |
| | 19,525 | | Total Nevada | | | | 7,138,106 | |
| | | | New Hampshire – 2.1% (1.4% of Total Investments) | | | | | |
| | 8,000 | | New Hampshire Business Finance Authority, Pollution Control Remarketed Revenue Refunding Bonds, Connecticut Light and Power Company, Series 1992A, 5.850%, 12/01/22 | 4/11 at 101.00 | Baa1 | | 8,160,000 | |
| | 1,070 | | New Hampshire Housing Finance Authority, Single Family Mortgage Acquisition Bonds, Series 2001A, 5.700%, 1/01/31 (Alternative Minimum Tax) | 5/11 at 100.00 | Aa2 | | 1,075,543 | |
| | 9,070 | | Total New Hampshire | | | | 9,235,543 | |
| | | | New Jersey – 2.5% (1.7% of Total Investments) | | | | | |
| | 3,995 | | New Jersey Economic Development Authority, Special Facilities Revenue Bonds, Continental Airlines Inc., Series 2000, 7.000%, 11/15/30 (Alternative Minimum Tax) | 11/10 at 101.00 | B | | 4,021,487 | |
| | 310 | | Tobacco Settlement Financing Corporation, New Jersey, Tobacco Settlement Asset-Backed Bonds, Series 2002, 5.750%, 6/01/32 (Pre-refunded 6/01/12) | 6/12 at 100.00 | AAA | | 329,446 | |
| | | | Tobacco Settlement Financing Corporation, New Jersey, Tobacco Settlement Asset-Backed Bonds, Series 2003: | | | | | |
| | 2,200 | | 6.375%, 6/01/32 (Pre-refunded 6/01/13) | 6/13 at 100.00 | AAA | | 2,471,722 | |
| | 425 | | 6.750%, 6/01/39 (Pre-refunded 6/01/13) | 6/13 at 100.00 | AAA | | 491,351 | |
| | 3,085 | | 6.250%, 6/01/43 (Pre-refunded 6/01/13) | 6/13 at 100.00 | AAA | | 3,527,081 | |
| | 10,015 | | Total New Jersey | | | | 10,841,087 | |
| | | | New Mexico – 5.5% (3.7% of Total Investments) | | | | | |
| | | | New Mexico Hospital Equipment Loan Council, Hospital Revenue Bonds, Presbyterian Healthcare Services, Series 2001A: | | | | | |
| | 12,000 | | 5.500%, 8/01/25 (Pre-refunded 8/01/11) | 8/11 at 101.00 | AA– (4) | | 12,583,800 | |
| | 10,800 | | 5.500%, 8/01/30 (Pre-refunded 8/01/11) | 8/11 at 101.00 | AA– (4) | | 11,325,420 | |
| | 22,800 | | Total New Mexico | | | | 23,909,220 | |
Nuveen Investments 67
| | | Nuveen Dividend Advantage Municipal Fund 2 (continued) |
| NXZ | | Portfolio of Investments October 31, 2010 |
| | Principal | | | Optional Call | | | | |
| | Amount (000) | | Description (1) | Provisions (2) | Ratings (3) | | Value | |
| | | | New York – 8.7% (5.9% of Total Investments) | | | | | |
| $ | 12,020 | | Brooklyn Areba Local Development Corporation, New York, Payment in Lieu of Taxes Revenue Bonds, Barclays Center Project, Series 2009, 0.000%, 7/15/46 | No Opt. Call | BBB– | $ | 1,267,269 | |
| | 6,000 | | Long Island Power Authority, New York, Electric System General Revenue Bonds, Series 2001L, 5.375%, 5/01/33 (Pre-refunded 5/01/11) | 5/11 at 100.00 | AAA | | 6,155,100 | |
| | 12,800 | | Metropolitan Transportation Authority, New York, Transportation Revenue Bonds, Series 2006B, 4.500%, 11/15/32 – AGM Insured (UB) | 11/16 at 100.00 | AA+ | | 12,880,512 | |
| | 5,000 | | New York City Industrial Development Agency, New York, Special Facilities Revenue Bonds, JFK Airport – American Airlines Inc., Series 2002B, 8.500%, 8/01/28 (Alternative Minimum Tax) | 8/12 at 101.00 | B– | | 5,203,050 | |
| | 12,000 | | New York City Municipal Water Finance Authority, New York, Water and Sewerage System Revenue Bonds, Fiscal Series 2001C, 5.125%, 6/15/33 (UB) | 6/11 at 101.00 | AAA | | 12,354,120 | |
| | 47,820 | | Total New York | | | | 37,860,051 | |
| | | | North Carolina – 0.7% (0.5% of Total Investments) | | | | | |
| | 2,950 | | North Carolina Capital Facilities Financing Agency, Revenue Bonds, Johnson and Wales University, Series 2003A, 5.000%, 4/01/33 – SYNCORA GTY Insured | 4/13 at 100.00 | N/R | | 2,916,547 | |
| | | | North Dakota – 0.3% (0.2% of Total Investments) | | | | | |
| | 1,235 | | North Dakota Housing Finance Agency, Home Mortgage Finance Program Refunding Bonds, Series 2001A, 5.550%, 1/01/32 (Alternative Minimum Tax) | 1/11 at 100.00 | Aa1 | | 1,263,887 | |
| | | | Ohio – 2.0% (1.4% of Total Investments) | | | | | |
| | | | Buckeye Tobacco Settlement Financing Authority, Ohio, Tobacco Settlement Asset-Backed Revenue Bonds, Senior Lien, Series 2007A-2: | | | | | |
| | 10,000 | | 5.750%, 6/01/34 | 6/17 at 100.00 | BBB | | 7,974,800 | |
| | 1,000 | | 5.875%, 6/01/47 | 6/17 at 100.00 | BBB | | 765,260 | |
| | 11,000 | | Total Ohio | | | | 8,740,060 | |
| | | | Oregon – 3.0% (2.1% of Total Investments) | | | | | |
| | 8,000 | | Clackamas County Hospital Facility Authority, Oregon, Revenue Refunding Bonds, Legacy Health System, Series 2001, 5.250%, 5/01/21 | 5/11 at 101.00 | A+ | | 8,155,840 | |
| | 5,000 | | Oregon Department of Administrative Services, Certificates of Participation, Series 2001D, 5.000%, 5/01/26 – AMBAC Insured | 5/11 at 101.00 | Aa2 | | 5,082,700 | |
| | 13,000 | | Total Oregon | | | | 13,238,540 | |
| | | | Pennsylvania – 3.1% (2.1% of Total Investments) | | | | | |
| | 5,000 | | Allegheny County Hospital Development Authority, Pennsylvania, Revenue Bonds, West Penn Allegheny Health System, Series 2000B, 9.250%, 11/15/30 (Pre-refunded 11/15/10) | 11/10 at 102.00 | AAA | | 5,119,850 | |
| | 8,000 | | Pennsylvania Higher Educational Facilities Authority, Revenue Bonds, UPMC Health System, Series 2001A, 6.000%, 1/15/31 (Pre-refunded 1/15/11) | 1/11 at 101.00 | Aa3 (4) | | 8,177,680 | |
| | 13,000 | | Total Pennsylvania | | | | 13,297,530 | |
| | | | Puerto Rico – 2.2% (1.5% of Total Investments) | | | | | |
| | 2,500 | | Puerto Rico Sales Tax Financing Corporation, Sales Tax Revenue Bonds, First Subordinate Series 2009A, 6.000%, 8/01/42 | 8/19 at 100.00 | A+ | | 2,795,575 | |
| | 4,310 | | Puerto Rico Sales Tax Financing Corporation, Sales Tax Revenue Bonds, First Subordinate Series 2010C, 5.250%, 8/01/41 | 8/20 at 100.00 | A+ | | 4,507,226 | |
| | | | Puerto Rico Sales Tax Financing Corporation, Sales Tax Revenue Bonds, Series 2007A: | | | | | |
| | 30,000 | | 0.000%, 8/01/54 – AMBAC Insured | No Opt. Call | Aa2 | | 1,926,600 | |
| | 6,150 | | 0.000%, 8/01/56 | No Opt. Call | Aa2 | | 351,165 | |
| | 42,960 | | Total Puerto Rico | | | | 9,580,566 | |
| | Principal | | | Optional Call | | | | |
| | Amount (000) | | Description (1) | Provisions (2) | Ratings (3) | | Value | |
| | | | Texas – 26.3% (17.9% of Total Investments) | | | | | |
| $ | 10,000 | | Central Texas Regional Mobility Authority, Travis and Williamson Counties, Toll Road Revenue Bonds, Series 2005, 5.000%, 1/01/45 – FGIC Insured | 1/15 at 100.00 | A | $ | 9,422,900 | |
| | | | Dallas-Fort Worth International Airport Public Facility Corporation, Texas, Airport Hotel Revenue Bonds, Series 2001: | | | | | |
| | 15,000 | | 5.250%, 1/15/26 – AGM Insured | 1/11 at 100.00 | AA+ | | 15,015,000 | |
| | 1,750 | | 5.200%, 1/15/31 – AGM Insured | 1/11 at 100.00 | AA+ | | 1,751,120 | |
| | 6,000 | | Decatur Hospital Authority, Texas, Revenue Bonds, Wise Regional Health System, Series 2004A, 7.125%, 9/01/34 | 9/14 at 100.00 | N/R | | 6,070,800 | |
| | 10,000 | | Gulf Coast Industrial Development Authority, Texas, Solid Waste Disposal Revenue Bonds, Citgo Petroleum Corporation Project, Series 1998, 8.000%, 4/01/28 (Alternative Minimum Tax) | 4/12 at 100.00 | Ba2 | | 10,208,900 | |
| | 1,500 | | Harris County-Houston Sports Authority, Texas, Junior Lien Revenue Bonds, Series 2001H, 0.000%, 11/15/37 – NPFG Insured | 11/31 at 69.08 | A | | 206,400 | |
| | 31,170 | | Harris County-Houston Sports Authority, Texas, Junior Lien Revenue Refunding Bonds, Series 2001B, 5.250%, 11/15/40 – NPFG Insured | 11/11 at 100.00 | A | | 30,437,193 | |
| | 40,000 | | Harris County-Houston Sports Authority, Texas, Senior Lien Revenue Refunding Bonds, Series 2001A, 0.000%, 11/15/40 – NPFG Insured | 11/30 at 54.04 | A | | 4,960,000 | |
| | 3,965 | | Harris County-Houston Sports Authority, Texas, Third Lien Revenue Bonds, Series 2004-A3., 0.000%, 11/15/35 – NPFG Insured | 11/24 at 52.47 | A | | 616,716 | |
| | | | Hays Consolidated Independent School District, Hays County, Texas, General Obligation School Building Bonds, Series 2001: | | | | | |
| | 10,715 | | 0.000%, 8/15/25 (Pre-refunded 8/15/11) | 8/11 at 43.18 | AAA | | 4,608,200 | |
| | 12,940 | | 0.000%, 8/15/26 (Pre-refunded 8/15/11) | 8/11 at 40.60 | AAA | | 5,233,454 | |
| | | | Houston, Texas, Hotel Occupancy Tax and Special Revenue Bonds, Convention and Entertainment Project, Series 2001B: | | | | | |
| | 5,000 | | 0.000%, 9/01/30 – AMBAC Insured | No Opt. Call | A2 | | 1,589,750 | |
| | 5,540 | | 0.000%, 9/01/31 – AMBAC Insured | No Opt. Call | A2 | | 1,652,527 | |
| | 5,000 | | Metro Health Facilities Development Corporation, Texas, Hospital Revenue Bonds, Wilson N. Jones Memorial Hospital, Series 2001, 7.250%, 1/01/31 | 1/11 at 100.00 | Aaa | | 5,053,850 | |
| | 3,295 | | Tarrant County, Texas, Cultural & Educational Facilities Financing Corporation, Revenue Bonds, Series 2007, Residuals 1760-3, 16.624%, 2/15/36 (IF) | 2/17 at 100.00 | AA– | | 3,364,722 | |
| | 2,890 | | Tarrant County Cultural Education Facilities Finance Corporation, Texas, Hospital Revenue Bonds, Scott & White HealthCare Project, Series 2010, 5.500%, 8/15/45 | 8/20 at 100.00 | A1 | | 2,940,113 | |
| | 1,000 | | Texas Turnpike Authority, Central Texas Turnpike System Revenue Bonds, First Tier Series 2002A, 0.000%, 8/15/28 – AMBAC Insured | 8/12 at 39.43 | BBB+ | | 341,500 | |
| | 10,500 | | Texas, General Obligation Bonds, Water Financial Assistance Program, Series 2001, 5.250%, 8/01/35 | 8/11 at 100.00 | Aaa | | 10,767,120 | |
| | 176,265 | | Total Texas | | | | 114,240,265 | |
| | | | Washington – 4.2% (2.8% of Total Investments) | | | | | |
| | 5,405 | | Seattle, Washington, Municipal Light and Power Revenue Refunding and Improvement Bonds, Series 2001, 5.125%, 3/01/26 (Pre-refunded 3/01/11) – AGM Insured | 3/11 at 100.00 | AA+ (4) | | 5,494,669 | |
| | 1,845 | | Seattle, Washington, Municipal Light and Power Revenue Refunding and Improvement Bonds, Series 2001, 5.125%, 3/01/26 – AGM Insured | 3/11 at 100.00 | AA+ | | 1,869,095 | |
| | 7,500 | | Washington State Health Care Facilities Authority, Revenue Bonds, Sisters of Providence Health System, Series 2001A, 5.250%, 10/01/21 – NPFG Insured | 10/11 at 100.00 | AA | | 7,715,924 | |
| | 810 | | Washington State Tobacco Settlement Authority, Tobacco Settlement Asset-Backed Revenue Bonds, Series 2002, 6.500%, 6/01/26 | 6/13 at 100.00 | BBB | | 838,915 | |
| | 2,100 | | Washington, Certificates of Participation, Washington Convention and Trade Center, Series 1999, 5.125%, 7/01/13 – NPFG Insured | 1/11 at 100.00 | AA | | 2,106,970 | |
| | 17,660 | | Total Washington | | | | 18,025,573 | |
Nuveen Investments 69
| | | Nuveen Dividend Advantage Municipal Fund 2 (continued) |
| NXZ | | Portfolio of Investments October 31, 2010 |
| | Principal | | | Optional Call | | | | |
| | Amount (000) | | Description (1) | Provisions (2) | Ratings (3) | | Value | |
| | | | West Virginia – 1.2% (0.8% of Total Investments) | | | | | |
| $ | 5,000 | | Mason County, West Virginia, Pollution Control Revenue Bonds, Appalachian Power Company, Series 2003L, 5.500%, 10/01/22 | 10/11 at 100.00 | BBB | $ | 5,063,900 | |
| | | | Wisconsin – 0.3% (0.2% of Total Investments) | | | | | |
| | 1,000 | | Wisconsin Health and Educational Facilities Authority, Revenue Bonds, Divine Savior Healthcare, Series 2002A, 7.375%, 5/01/26 (Pre-refunded 5/01/12) | 5/12 at 100.00 | N/R (4) | | 1,101,260 | |
| $ | 801,248 | | Total Investments (cost $622,761,126) – 146.8% | | | | 638,265,834 | |
| | | | Floating Rate Obligations – (6.1)% | | | | (26,661,650 | ) |
| | | | Variable Rate Demand Preferred Shares, at Liquidation Value – (45.1)% (8) | | | | (196,000,000 | ) |
| | | | Other Assets Less Liabilities – 4.4% | | | | 19,160,231 | |
| | | | Net Assets Applicable to Common Shares – 100% | | | $ | 434,764,415 | |
| (1) | | All percentages shown in the Portfolio of Investments are based on net assets applicable to Common shares unless otherwise noted. |
| (2) | | Optional Call Provisions (not covered by the report of independent registered public accounting firm): Dates (month and year) and prices of the earliest optional call or redemption. There may be other call provisions at varying prices at later dates. Certain mortgage-backed securities may be subject to periodic principal paydowns. |
| (3) | | Ratings (not covered by the report of independent registered public accounting firm): Using the highest of Standard & Poor’s Group (“Standard & Poor’s”), Moody’s Investor Service, Inc. (“Moody’s”) or Fitch, Inc. (“Fitch”) rating. Ratings below BBB by Standard & Poor’s, Baa by Moody’s or BBB by Fitch are considered to be below investment grade. Holdings designated N/R are not rated by any of these national rating agencies. |
| (4) | | Backed by an escrow or trust containing sufficient U.S. Government or U.S. Government agency securities, which ensure the timely payment of principal and interest. Such investments are normally considered to be equivalent to AAA rated securities. |
| (5) | | For fair value measurement disclosure purposes, investment categorized as Level 3. See Notes to Financial Statements, Footnote 1 – General Information and Significant Accounting Policies, Investment Valuation for more information. |
| (6) | | The Fund’s Adviser has concluded this issue is not likely to meet its future interest payment obligations and has directed the Fund’s custodian to cease accruing additional income on the Fund’s records. |
| (7) | | Subsequent to the reporting period, the Fund’s Adviser has concluded this issue is not likely to meet its future payment obligations and has directed the Fund’s custodian to cease accruing additional income on the Fund’s records. |
| (8) | | Variable Rate Demand Preferred Shares, at Liquidation Value as a percentage of Total Investments is 30.7%. |
| N/R | | Not rated. |
| (IF) | | Inverse floating rate investment. |
| (UB) | | Underlying bond of an inverse floating rate trust reflected as a financing transaction. See Notes to Financial Statements, Footnote 1 – General Information and Significant Accounting Policies, Inverse Floating Rate Securities for more information. |
See accompanying notes to financial statements.
| | Nuveen Dividend Advantage Municipal Fund 3 |
| NZF | | Portfolio of Investments |
| | | October 31, 2010 |
| | Principal | | | Optional Call | | | | |
| | Amount (000) | | Description (1) | Provisions (2) | Ratings (3) | | Value | |
| | | | Municipal Bonds – 148.1% (99.6% of Total Investments) | | | | | |
| | | | Alabama – 1.6% (1.1% of Total Investments) | | | | | |
| $ | 3,500 | | Alabama Special Care Facilities Financing Authority, Revenue Bonds, Ascension Health, Series 2006C-2, 5.000%, 11/15/36 (UB) | 11/16 at 100.00 | Aa1 | $ | 3,607,520 | |
| | 5,655 | | Alabama State Port Authority, Revenue Bonds, State Docks Department Facilities, Series 2001, 5.250%, 10/01/26 (Pre-refunded 10/01/11) – AMBAC Insured (Alternative Minimum Tax) | 10/11 at 100.00 | A (4) | | 5,887,590 | |
| | 9,155 | | Total Alabama | | | | 9,495,110 | |
| | | | Alaska – 0.1% (0.1% of Total Investments) | | | | | |
| | 1,000 | | Northern Tobacco Securitization Corporation, Alaska, Tobacco Settlement Asset-Backed Bonds, Series 2006A, 5.000%, 6/01/46 | 6/14 at 100.00 | Baa3 | | 702,830 | |
| | | | Arizona – 1.0% (0.7% of Total Investments) | | | | | |
| | 3,390 | | Arizona State Transportation Board, Highway Revenue Bonds, Series 2006, Trust 3151, 13.143%, 7/01/16 (IF) | No Opt. Call | AAA | | 4,123,121 | |
| | 2,200 | | Salt Verde Financial Corporation, Arizona, Senior Gas Revenue Bonds, Citigroup Energy Inc Prepay Contract Obligations, Series 2007, 5.000%, 12/01/37 | No Opt. Call | A | | 2,078,406 | |
| | 5,590 | | Total Arizona | | | | 6,201,527 | |
| | | | Arkansas – 0.7% (0.4% of Total Investments) | | | | | |
| | | | Sebastian County Health Facilities Board, Arkansas, Hospital Revenue Improvement Bonds, Sparks Regional Medical Center, Series 2001A: | | | | | |
| | 1,805 | | 5.500%, 11/01/13 | 11/11 at 101.00 | N/R | | 1,914,654 | |
| | 1,900 | | 5.500%, 11/01/14 | 11/11 at 101.00 | N/R | | 2,015,425 | |
| | 3,705 | | Total Arkansas | | | | 3,930,079 | |
| | | | California – 10.9% (7.3% of Total Investments) | | | | | |
| | | | California Health Facilities Financing Authority, Health Facility Revenue Bonds, Adventist Health System/West, Series 2003A: | | | | | |
| | 2,065 | | 5.000%, 3/01/28 | 3/13 at 100.00 | A | | 2,068,015 | |
| | 140 | | 5.000%, 3/01/33 | 3/13 at 100.00 | A | | 138,137 | |
| | 3,400 | | California Health Facilities Financing Authority, Revenue Bonds, Providence Health & Services, Series 2009B, 5.500%, 10/01/39 | 10/19 at 100.00 | AA | | 3,644,868 | |
| | 2,900 | | California Health Facilities Financing Authority, Revenue Bonds, Sutter Health, Series 2007A, 5.000%, 11/15/42 (UB) | 11/16 at 100.00 | Aa3 | | 2,863,402 | |
| | 5,000 | | California Infrastructure Economic Development Bank, Revenue Bonds, Kaiser Hospital Assistance LLC, Series 2001A, 5.550%, 8/01/31 | 8/11 at 102.00 | A+ | | 5,130,350 | |
| | 5,355 | | California Statewide Community Development Authority, Revenue Bonds, Sutter Health, Tender Option Bond Trust 3175, 13.358%, 5/15/14 (IF) | No Opt. Call | Aa3 | | 6,479,819 | |
| | 2,575 | | California, General Obligation Veterans Welfare Bonds, Series 2001BZ, 5.350%, 12/01/21 – NPFG Insured (Alternative Minimum Tax) | 12/10 at 100.00 | AA | | 2,576,596 | |
| | | | Ceres Unified School District, Stanislaus County, California, General Obligation Bonds, Series 2002B: | | | | | |
| | 2,180 | | 0.000%, 8/01/31 – FGIC Insured | 8/12 at 32.87 | A+ | | 570,986 | |
| | 3,300 | | 0.000%, 8/01/32 – FGIC Insured | 8/12 at 30.97 | A+ | | 805,200 | |
| | 11,865 | | Golden State Tobacco Securitization Corporation, California, Tobacco Settlement Asset-Backed Bonds, Series 2007A-1, 5.125%, 6/01/47 | 6/17 at 100.00 | BBB | | 8,551,224 | |
| | | | Los Angeles Regional Airports Improvement Corporation, California, Lease Revenue Refunding Bonds, LAXFUEL Corporation at Los Angeles International Airport, Series 2001: | | | | | |
| | 12,280 | | 5.750%, 1/01/16 – AMBAC Insured (Alternative Minimum Tax) | 1/12 at 100.00 | A– | | 12,708,081 | |
| | 5,000 | | 5.375%, 1/01/21 – AMBAC Insured (Alternative Minimum Tax) | 1/12 at 100.00 | A– | | 5,069,350 | |
| | 1,500 | | 5.250%, 1/01/23 – AMBAC Insured (Alternative Minimum Tax) | 1/12 at 100.00 | A– | | 1,514,400 | |
| | 10,000 | | 5.500%, 1/01/32 – AMBAC Insured (Alternative Minimum Tax) | 1/12 at 100.00 | A– | | 10,049,300 | |
| | 10,000 | | San Joaquin Hills Transportation Corridor Agency, Orange County, California, Toll Road Revenue Refunding Bonds, Series 1997A, 0.000%, 1/15/35 – NPFG Insured | No Opt. Call | A | | 1,564,700 | |
Nuveen Investments 71
| | | Nuveen Dividend Advantage Municipal Fund 3 (continued) |
| NZF | | Portfolio of Investments October 31, 2010 |
| | Principal | | | Optional Call | | | | |
| | Amount (000) | | Description (1) | Provisions (2) | Ratings (3) | | Value | |
| | | | California (continued) | | | | | |
| $ | 3,000 | | San Mateo County Community College District, California, General Obligation Bonds, Series 2006C, 0.000%, 9/01/30 – NPFG Insured | No Opt. Call | Aaa | $ | 1,049,670 | |
| | 80,560 | | Total California | | | | 64,784,098 | |
| | | | Colorado – 6.1% (4.1% of Total Investments) | | | | | |
| | 2,250 | | Canterberry Crossing Metropolitan District II, Parker, Colorado, Limited Tax General Obligation Bonds, Series 2002, 7.375%, 12/01/32 (Pre-refunded 12/01/12) | 12/12 at 100.00 | N/R (4) | | 2,519,213 | |
| | 1,565 | | Colorado Educational and Cultural Facilities Authority, Charter School Revenue Bonds, Belle Creek Education Center, Series 2002A, 7.625%, 3/15/32 (Pre-refunded 3/15/13) | 3/13 at 100.00 | N/R (4) | | 1,780,109 | |
| | 1,775 | | Colorado Educational and Cultural Facilities Authority, Charter School Revenue Bonds, Weld County School District 6 – Frontier Academy, Series 2001, 7.375%, 6/01/31 (Pre-refunded 6/01/11) | 6/11 at 100.00 | N/R (4) | | 1,847,509 | |
| | 3,220 | | Colorado Educational and Cultural Facilities Authority, Revenue Bonds, Montessori Peaks Academy, Series 2006A, 5.400%, 5/01/26 | 5/16 at 102.00 | N/R | | 2,903,377 | |
| | 3,380 | | Colorado Housing Finance Authority, Multifamily Project Bonds, Class I, Series 2001A-1, 5.500%, 4/01/31 (Alternative Minimum Tax) | 10/11 at 100.00 | AAA | | 3,403,390 | |
| | 5,000 | | Compark Business Campus Metropolitan District, Colorado, General Obligation Limited Tax Bonds, Series 2007, 5.600%, 12/01/34 – RAAI Insured | 12/17 at 100.00 | N/R | | 4,110,350 | |
| | 3,300 | | Denver City and County, Colorado, Airport Revenue Bonds, Series 2006, 5.000%, 11/15/24 – FGIC Insured | 11/16 at 100.00 | A+ | | 3,528,558 | |
| | | | Denver, Colorado, Airport Revenue Bonds, Series 2006: | | | | | |
| | 5,365 | | 5.000%, 11/15/23 – FGIC Insured (UB) | 11/16 at 100.00 | A+ | | 5,762,117 | |
| | 4,335 | | 5.000%, 11/15/25 – FGIC Insured (UB) | 11/16 at 100.00 | A+ | | 4,613,524 | |
| | 2,000 | | Denver City and County, Colorado, Airport System Revenue Refunding Bonds, Series 2001A, 5.500%, 11/15/16 – FGIC Insured (Alternative Minimum Tax) | 11/11 at 100.00 | A+ | | 2,082,220 | |
| | | | Maher Ranch Metropolitan District 4, Colorado, General Obligation Limited Tax Bonds, Series 2007: | | | | | |
| | 950 | | 5.125%, 12/01/27 – RAAI Insured | 12/17 at 100.00 | N/R | | 865,640 | |
| | 2,000 | | 5.250%, 12/01/36 – RAAI Insured | 12/17 at 100.00 | N/R | | 1,748,300 | |
| | 1,000 | | Plaza Metropolitan District 1, Lakewood, Colorado, Tax Increment Revenue Bonds, Series 2003, 8.000%, 12/01/25 | 6/14 at 101.00 | N/R | | 1,046,390 | |
| | 36,140 | | Total Colorado | | | | 36,210,697 | |
| | | | Delaware – 0.2% (0.1% of Total Investments) | | | | | |
| | 1,055 | | Delaware State Housing Authority, Multifamily Mortgage Revenue Bonds, Series 2001A, 5.400%, 7/01/24 | 7/12 at 100.00 | Aa3 | | 1,089,889 | |
| | | | District of Columbia – 0.8% (0.5% of Total Investments) | | | | | |
| | 1,335 | | Washington Convention Center Authority, District of Columbia, Senior Lien Dedicated Tax Revenue Bonds, Series 2007, Residuals 1606, 11.401%, 10/01/30 – AMBAC Insured (IF) | 10/16 at 100.00 | AA+ | | 1,392,071 | |
| | 3,335 | | Washington DC Convention Center Authority, Dedicated Tax Revenue Bonds, Residuals Series 1730, 1731, 1736, 11.377%, 10/01/30 – AMBAC Insured (IF) | 10/16 at 100.00 | AA+ | | 3,477,571 | |
| | 4,670 | | Total District of Columbia | | | | 4,869,642 | |
| | | | Florida – 2.1% (1.4% of Total Investments) | | | | | |
| | | | Orange County Housing Finance Authority, Florida, Multifamily Housing Revenue Bonds, Oak Glen Apartments, Series 2001G: | | | | | |
| | 1,105 | | 5.400%, 12/01/32 – AGM Insured | 12/11 at 100.00 | AA+ | | 1,112,602 | |
| | 2,195 | | 5.450%, 12/01/41 – AGM Insured | 12/11 at 100.00 | AA+ | | 2,208,016 | |
| | 2,775 | | Pace Property Finance Authority Inc., Florida, Utility System Improvement and Revenue Refunding Bonds, Series 1997, 5.250%, 9/01/17 – AMBAC Insured | 3/11 at 100.00 | N/R | | 2,777,775 | |
| | 5,455 | | South Miami Health Facilities Authority, Florida, Hospital Revenue, Baptist Health System Obligation Group, Series 2007, 5.000%, 8/15/42 (UB) | 8/17 at 100.00 | AA | | 5,520,405 | |
| | 1,000 | | Tolomato Community Development District, Florida, Special Assessment Bonds, Series 2007, 6.650%, 5/01/40 | 5/18 at 100.00 | N/R | | 739,190 | |
| | 12,530 | | Total Florida | | | | 12,357,988 | |
| | Principal | | | Optional Call | | | | |
| | Amount (000) | | Description (1) | Provisions (2) | Ratings (3) | | Value | |
| | | | Georgia – 2.3% (1.5% of Total Investments) | | | | | |
| $ | 5,000 | | Atlanta, Georgia, Airport General Revenue Bonds, Series 2000B, 5.625%, 1/01/30 – FGIC Insured (Alternative Minimum Tax) | 1/11 at 100.50 | A+ | $ | 5,035,550 | |
| | 2,700 | | Atlanta, Georgia, Tax Allocation Bonds, Atlantic Station Project, Series 2001, 7.900%, 12/01/24 (Pre-refunded 12/01/11) | 12/11 at 101.00 | AAA | | 2,949,993 | |
| | 2,000 | | Fulton County Residential Care Facilities Authority, Georgia, Revenue Bonds, Elderly Care, Lenbrook Square Project, Series 2006A, 5.125%, 7/01/42 | 7/17 at 100.00 | N/R | | 1,324,600 | |
| | 3,740 | | Gainesville and Hall County Hospital Authority, Georgia, Revenue Anticipation Certificates, Northeast Georgia Health Services Inc., Series 2001, 5.500%, 5/15/31 (Pre-refunded 5/15/11) | 5/11 at 100.00 | N/R (4) | | 3,845,917 | |
| | 500 | | Gainesville Redevelopment Authority, Georgia, Educational Facilities Revenue Bonds, Riverside Military Academy Project, Series 2007, 5.125%, 3/01/37 | 3/17 at 100.00 | N/R | | 370,280 | |
| | 13,940 | | Total Georgia | | | | 13,526,340 | |
| | | | Illinois – 17.8% (12.0% of Total Investments) | | | | | |
| | 8,375 | | Chicago, Illinois, Revenue Bonds, Midway Airport, Series 2001A, 5.500%, 1/01/19 – AGM Insured (Alternative Minimum Tax) | 1/11 at 101.00 | AA+ | | 8,485,466 | |
| | 4,950 | | Chicago, Illinois, Second Lien Passenger Facility Charge Revenue Bonds, O’Hare International Airport, Series 2001A, 5.375%, 1/01/32 – AMBAC Insured (Alternative Minimum Tax) | 1/11 at 101.00 | A2 | | 4,983,116 | |
| | 2,220 | | Chicago, Illinois, Second Lien Wastewater Transmission Revenue Bonds, Series 2001A, 5.500%, 1/01/16 – NPFG Insured | No Opt. Call | Aa3 | | 2,583,303 | |
| | 10,000 | | Chicago, Illinois, Senior Lien Water Revenue Bonds, Series 2001, 5.000%, 11/01/26 (Pre-refunded 11/01/11) – AMBAC Insured | 11/11 at 100.00 | Aa2 (4) | | 10,470,000 | |
| | 1,165 | | Chicago, Illinois, Third Lien General Airport Revenue Bonds, O’Hare International Airport, Series 2005A, 5.000%, 1/01/33 – FGIC Insured | 1/16 at 100.00 | A1 | | 1,174,425 | |
| | 8,875 | | Cook County, Illinois, General Obligation Bonds, Refunding Series 2010A, 5.250%, 11/15/33 | 11/20 at 100.00 | AA | | 9,511,781 | |
| | 2,415 | | Illinois Finance Authority, General Obligation Debt Certificates, Local Government Program – Kankakee County, Series 2005B, 5.000%, 1 2/01/24 – AMBAC Insured | 12/14 at 100.00 | A1 | | 2,483,151 | |
| | 3,385 | | Illinois Finance Authority, Revenue Bonds, Sherman Health Systems, Series 2007A, 5.500%, 8/01/37 | 8/17 at 100.00 | BBB | | 3,269,775 | |
| | 9,000 | | Illinois Health Facilities Authority, Revenue Bonds, Covenant Retirement Communities Inc., Series 2001, 5.875%, 12/01/31 | 12/11 at 101.00 | BBB– | | 9,010,710 | |
| | 15,000 | | Illinois Health Facilities Authority, Revenue Bonds, Loyola University Health System, Series 2001A, 6.125%, 7/01/31 (Pre-refunded 7/01/11) | 7/11 at 100.00 | Baa3 (4) | | 15,564,900 | |
| | 5,000 | | Lake County School District 38, Big Hallow, Illinois, General Obligation Bonds, Series 2005, 0.000%, 2/01/22 – AMBAC Insured | No Opt. Call | N/R | | 2,628,900 | |
| | 7,000 | | Lombard Public Facilities Corporation, Illinois, First Tier Conference Center and Hotel Revenue Bonds, Series 2005A-1, 7.125%, 1/01/36 | 1/16 at 100.00 | N/R | | 5,125,050 | |
| | 10,000 | | Metropolitan Pier and Exposition Authority, Illinois, McCormick Place Expansion Project Refunding Bonds, Series 2010A, 5.500%, 6/15/50 | 6/20 at 100.00 | AAA | | 10,565,600 | |
| | 16,900 | | Metropolitan Pier and Exposition Authority, Illinois, Revenue Bonds, McCormick Place Expansion Project, Series 1999A, 5.250%, 12/15/28 – FGIC Insured | 12/10 at 100.50 | AAA | | 17,092,153 | |
| | 2,765 | | Metropolitan Pier and Exposition Authority, Illinois, Revenue Refunding Bonds, McCormick Place Expansion Project, Series 1998A, 5.500%, 6/15/29 – FGIC Insured | No Opt. Call | AAA | | 3,073,933 | |
| | 107,050 | | Total Illinois | | | | 106,022,263 | |
| | | | Indiana – 5.8% (3.9% of Total Investments) | | | | | |
| | | | Clark-Pleasant Community School Building Corporation, Indiana, First Mortgage Bonds, Series 2001: | | | | | |
| | 1,255 | | 5.000%, 7/15/21 (Pre-refunded 1/15/12) – AMBAC Insured | 1/12 at 100.00 | AA+ (4) | | 1,325,506 | |
| | 1,000 | | 5.000%, 1/15/26 (Pre-refunded 1/15/12) – AMBAC Insured | 1/12 at 100.00 | AA+ (4) | | 1,056,180 | |
| | | | Evansville Vanderburgh Public Library Lease Corporation, Indiana, First Mortgage Bonds, Series 2001: | | | | | |
| | 2,000 | | 5.750%, 7/15/18 (Pre-refunded 1/15/12) – NPFG Insured | 1/12 at 100.00 | A+ (4) | | 2,130,480 | |
| | 2,750 | | 5.125%, 1/15/24 (Pre-refunded 1/15/12) – NPFG Insured | 1/12 at 100.00 | A+ (4) | | 2,908,648 | |
Nuveen Investments 73
| | | Nuveen Dividend Advantage Municipal Fund 3 (continued) |
| NZF | | Portfolio of Investments October 31, 2010 |
| | Principal | | | Optional Call | | | | |
| | Amount (000) | | Description (1) | Provisions (2) | Ratings (3) | | Value | |
| | | | Indiana (continued) | | | | | |
| $ | 1,250 | | Hamilton Southeastern Cumberland Campus School Building Corporation, Indiana, First Mortgage Bonds, Series 2001, 5.125%, 1/15/23 (Pre-refunded 1/15/12) – AMBAC Insured | 1/12 at 100.00 | A (4) | $ | 1,322,113 | |
| | 9,500 | | Indiana Educational Facilities Authority, Revenue Bonds, Butler University, Series 2001, 5.500%, 2/01/26 – NPFG Insured | 2/11 at 100.00 | A | | 9,574,290 | |
| | 4,230 | | Indiana Finance Authority, Educational Facilities Revenue Bonds, Tudor Park Foundation, Series 2005B, 5.000%, 6/01/24 | 6/15 at 100.00 | Aa3 | | 4,461,254 | |
| | 2,600 | | Indiana Health Facility Financing Authority, Revenue Bonds, Community Hospitals of Indiana, Series 2005A, 5.000%, 5/01/35 – AMBAC Insured | 5/15 at 100.00 | A | | 2,549,586 | |
| | 3,500 | | University of Southern Indiana, Student Fee Bonds, Series 2001H, 5.000%, 10/01/21 – AMBAC Insured | 10/11 at 100.00 | A1 | | 3,551,765 | |
| | | | Vigo County, Indiana, Hospital Authority, Union Hospital, Revenue Bonds, Series 2007: | | | | | |
| | 2,500 | | 5.750%, 9/01/42 | 9/17 at 100.00 | N/R | | 2,357,475 | |
| | 2,500 | | 5.800%, 9/01/47 | 9/17 at 100.00 | N/R | | 2,348,625 | |
| | 1,090 | | Wayne County Jail Holding Corporation, Indiana, First Mortgage Bonds, Series 2001, 5.500%, 7/15/22 (Pre-refunded 1/15/13) – AMBAC Insured | 1/13 at 101.00 | A1 (4) | | 1,217,377 | |
| | 34,175 | | Total Indiana | | | | 34,803,299 | |
| | | | Iowa – 5.3% (3.6% of Total Investments) | | | | | |
| | 2,000 | | Iowa Finance Authority, Healthcare Revenue Bonds, Great River Medical Center, Series 2001, 5.250%, 5/15/31 – AGM Insured | 5/11 at 100.00 | Aa3 | | 2,005,960 | |
| | 1,000 | | Iowa Tobacco Settlement Authority, Asset Backed Settlement Revenue Bonds, Series 2005C, 5.625%, 6/01/46 | 6/15 at 100.00 | BBB | | 782,190 | |
| | | | Iowa Tobacco Settlement Authority, Tobacco Settlement Asset-Backed Revenue Bonds, Series 2001B: | | | | | |
| | 23,665 | | 5.300%, 6/01/25 (Pre-refunded 6/01/11) | 6/11 at 101.00 | AAA | | 24,505,817 | |
| | 3,950 | | 5.600%, 6/01/35 (Pre-refunded 6/01/11) | 6/11 at 101.00 | AAA | | 4,111,002 | |
| | 30,615 | | Total Iowa | | | | 31,404,969 | |
| | | | Kansas – 0.3% (0.2% of Total Investments) | | | | | |
| | | | Manhattan Health Care Facility Revenue Bonds, Kansas, Meadowlarks Hills Retirement, Series 2007B: | | | | | |
| | 1,000 | | 5.125%, 5/15/37 | 5/14 at 103.00 | N/R | | 834,840 | |
| | 1,000 | | 5.125%, 5/15/42 | 5/14 at 103.00 | N/R | | 824,350 | |
| | 2,000 | | Total Kansas | | | | 1,659,190 | |
| | | | Kentucky – 3.4% (2.3% of Total Investments) | | | | | |
| | 1,000 | | Kentucky Economic Development Finance Authority, Louisville Arena Project Revenue Bonds, Louisville Arena Authority, Inc., Series 2008-A1, 6.000%, 12/01/42 – AGC Insured | 6/18 at 100.00 | AA+ | | 1,078,550 | |
| | 18,500 | | Louisville and Jefferson County Metropolitan Sewer District, Kentucky, Sewer and Drainage System Revenue Bonds, Series 2001A, 5.125%, 5/15/27 – NPFG Insured | 11/11 at 101.00 | AA– | | 18,931,975 | |
| | 19,500 | | Total Kentucky | | | | 20,010,525 | |
| | | | Louisiana – 4.5% (3.0% of Total Investments) | | | | | |
| | 3,000 | | Louisiana Local Government Environmental Facilities & Community Development Authority, Revenue Bonds, Westlake Chemical Corporation Project, Series 2007, 6.750%, 11/01/32 | 11/17 at 100.00 | BB+ | | 3,191,760 | |
| | 3,700 | | Louisiana Public Facilities Authority, Revenue Bonds, Ochsner Clinic Foundation Project, Series 2007A, 5.500%, 5/15/47 | 5/17 at 100.00 | Baa1 | | 3,663,629 | |
| | 19,890 | | Tobacco Settlement Financing Corporation, Louisiana, Tobacco Settlement Asset-Backed Bonds, Series 2001B, 5.875%, 5/15/39 | 5/11 at 101.00 | BBB | | 20,080,347 | |
| | 26,590 | | Total Louisiana | | | | 26,935,736 | |
| | | | Maine – 1.0% (0.7% of Total Investments) | | | | | |
| | | | Maine State Housing Authority, Single Family Mortgage Purchase Bonds, Series 2001B: | | | | | |
| | 4,610 | | 5.400%, 11/15/21 (Alternative Minimum Tax) | 11/10 at 100.00 | AA+ | | 4,614,380 | |
| | 1,610 | | 5.500%, 11/15/32 (Alternative Minimum Tax) | 11/10 at 100.00 | AA+ | | 1,610,869 | |
| | 6,220 | | Total Maine | | | | 6,225,249 | |
| | Principal | | | Optional Call | | | | |
| | Amount (000) | | Description (1) | Provisions (2) | Ratings (3) | | Value | |
| | | | Maryland – 2.5% (1.7% of Total Investments) | | | | | |
| $ | 1,000 | | Howard County, Maryland, Retirement Community Revenue Bonds, Vantage House, Series 2007B, 5.250%, 4/01/37 | 4/17 at 100.00 | N/R | $ | 779,640 | |
| | 1,570 | | Maryland Community Development Administration, Insured Multifamily Housing Mortgage Loan Revenue Bonds, Series 2001B, 5.250%, 7/01/21 (Alternative Minimum Tax) | 7/11 at 100.00 | Aa2 | | 1,582,011 | |
| | 2,000 | | Maryland Economic Development Corporation, Revenue Bonds, Chesapeake Bay Hyatt Conference Center, Series 2006A, 5.000%, 12/01/31 | 12/16 at 100.00 | N/R | | 1,392,500 | |
| | 10,600 | | Maryland Energy Financing Administration, Revenue Bonds, AES Warrior Run Project, Series 1995, 7.400%, 9/01/19 (Alternative Minimum Tax) | 3/11 at 100.00 | N/R | | 10,606,148 | |
| | 555 | | Maryland Health and Higher Educational Facilities Authority, Revenue Bonds, Mercy Ridge Retirement Community, Series 2007, 4.750%, 7/01/34 | 7/17 at 100.00 | A– | | 544,899 | |
| | 15,725 | | Total Maryland | | | | 14,905,198 | |
| | | | Massachusetts – 2.9% (2.0% of Total Investments) | | | | | |
| | 1,375 | | Massachusetts Development Finance Agency, Revenue Bonds, Orchard Cove, Series 2007, 5.250%, 10/01/26 | 10/12 at 102.00 | N/R | | 1,191,245 | |
| | 1,000 | | Massachusetts Health and Educational Facilities Authority, Revenue Bonds, Milton Hospital Project, Series 2005D, 5.250%, 7/01/30 | 7/15 at 100.00 | BB– | | 791,110 | |
| | 1,600 | | Massachusetts Health and Educational Facilities Authority, Revenue Refunding Bonds, Suffolk University Issue, Series 2009A, 5.750%, 7/01/39 | 7/19 at 100.00 | BBB | | 1,696,768 | |
| | 4,860 | | Massachusetts Housing Finance Agency, Single Family Housing Revenue Bonds, Series 2008, Trust 3145, 15.134%, 6/01/16 (IF) | No Opt. Call | AA | | 5,580,107 | |
| | 5,000 | | Massachusetts Port Authority, Special Facilities Revenue Bonds, Delta Air Lines Inc., Series 2001A, 5.500%, 1/01/18 – AMBAC Insured (Alternative Minimum Tax) | 1/11 at 101.00 | N/R | | 4,727,400 | |
| | 3,465 | | Massachusetts Water Resources Authority, General Revenue Bonds, Series 2007A, 4.500%, 8/01/46 – AGM Insured (UB) | 2/17 at 100.00 | AA+ | | 3,485,998 | |
| | 17,300 | | Total Massachusetts | | | | 17,472,628 | |
| | | | Michigan – 9.5% (6.4% of Total Investments) | | | | | |
| | 15,000 | | Detroit City School District, Wayne County, Michigan, Unlimited Tax School Building and Site Improvement Bonds, Series 2001A, 6.000%, 5/01/29 – AGM Insured (UB) | No Opt. Call | AA+ | | 17,010,300 | |
| | 2,000 | | Garden City Hospital Finance Authority, Michigan, Revenue Bonds, Garden City Hospital Obligated Group, Series 2007A, 5.000%, 8/15/38 | 8/17 at 100.00 | N/R | | 1,413,920 | |
| | 11,000 | | Kent Hospital Finance Authority, Michigan, Revenue Bonds, Spectrum Health, Series 2001A, 5.500%, 1/15/31 (Pre-refunded 7/15/11) | 7/11 at 101.00 | AA (4) | | 11,510,290 | |
| | 1,165 | | Michigan State Building Authority, Revenue Bonds, Facilities Program, Series 2001I, 5.500%, 10/15/18 | 10/11 at 100.00 | Aa3 | | 1,206,602 | |
| | 70 | | Michigan State Building Authority, Revenue Bonds, Facilities Program, Series 2001I, 5.500%, 10/15/18 (Pre-refunded 10/15/11) | 10/11 at 100.00 | A+ (4) | | 73,484 | |
| | 1,355 | | Michigan State Hospital Finance Authority, Hospital Revenue Bonds, Detroit Medical Center Obligated Group, Series 1998A, 5.250%, 8/15/23 | 2/11 at 100.00 | Ba3 | | 1,324,296 | |
| | 3,210 | | Michigan State Hospital Finance Authority, Hospital Revenue Refunding Bonds, Sisters of Mercy Health Corporation, Series 1993P, 5.375%, 8/15/14 – NPFG Insured (ETM) | No Opt. Call | A (4) | | 3,476,205 | |
| | | | Michigan State Hospital Finance Authority, Hospital Revenue Refunding Bonds, Sparrow Obligated Group, Series 2001: | | | | | |
| | 1,400 | | 5.500%, 11/15/21 (Pre-refunded 11/15/11) | 11/11 at 101.00 | A+ (4) | | 1,487,668 | |
| | 2,500 | | 5.625%, 11/15/31 (Pre-refunded 11/15/11) | 11/11 at 101.00 | A+ (4) | | 2,659,800 | |
| | 3,500 | | Michigan State Hospital Finance Authority, Revenue Bonds, Trinity Health Care Group, Series 2006A, 5.000%, 12/01/31 (UB) | 12/16 at 100.00 | AA | | 3,609,095 | |
| | 12,640 | | Royal Oak Hospital Finance Authority, Michigan, Hospital Revenue Bonds, William Beaumont Hospital, Series 2001M, 5.250%, 11/15/31 – NPFG Insured | 11/11 at 100.00 | A1 | | 12,642,149 | |
| | 53,840 | | Total Michigan | | | | 56,413,809 | |
Nuveen Investments 75
| | | Nuveen Dividend Advantage Municipal Fund 3 (continued) |
| NZF | | Portfolio of Investments October 31, 2010 |
| | Principal | | | Optional Call | | | | |
| | Amount (000) | | Description (1) | Provisions (2) | Ratings (3) | | Value | |
| | | | Minnesota – 1.2% (0.8% of Total Investments) | | | | | |
| $ | 2,215 | | Dakota County Community Development Agency, Minnesota, GNMA Collateralized Multifamily Housing Revenue Bonds, Rose Apartments Project, Series 2001, 6.350%, 10/20/37 (Alternative Minimum Tax) | 10/11 at 105.00 | Aaa | $ | 2,335,053 | |
| | 3,000 | | Minnesota State, General Obligation Bonds, Various Purpose, Refunding Series 2010D, 5.000%, 8/01/18 | No Opt. Call | AAA | | 3,632,220 | |
| | 1,375 | | Saint Paul Port Authority, Minnesota, Lease Revenue Bonds, Regions Hospital Parking Ramp Project, Series 2007-1, 5.000%, 8/01/36 | 8/16 at 100.00 | N/R | | 1,245,723 | |
| | 6,590 | | Total Minnesota | | | | 7,212,996 | |
| | | | Mississippi – 0.9% (0.6% of Total Investments) | | | | | |
| | 2,155 | | Mississippi Business Finance Corporation, GNMA Collateralized Retirement Facility Mortgage Revenue Refunding Bonds, Aldersgate Retirement Community Inc. Project, Series 1999A, 5.450%, 5/20/34 | 11/10 at 102.00 | AAA | | 2,181,700 | |
| | 3,000 | | Mississippi Hospital Equipment and Facilities Authority, Revenue Bonds, Baptist Memorial Healthcare, Series 2004B-1, 5.000%, 9/01/24 (UB) | 9/14 at 100.00 | AA | | 3,114,270 | |
| | 5,155 | | Total Mississippi | | | | 5,295,970 | |
| | | | Missouri – 2.9% (2.0% of Total Investments) | | | | | |
| | 1,495 | | Cape Girardeau County Industrial Development Authority, Missouri, Health Facilities Revenue Bonds, Southeast Missouri Hospital Association, Series 2007, 5.000%, 6/01/36 | 6/17 at 100.00 | N/R | | 1,383,279 | |
| | 1,000 | | Clinton County Industrial Development Authority, Missouri, Revenue Bonds, Cameron Regional Medical Center, Series 2007, 5.000%, 12/01/32 | 12/17 at 100.00 | N/R | | 774,870 | |
| | 1,825 | | Fenton, Missouri, Tax Increment Refunding and Improvement Revenue Bonds, Gravois Bluffs Redevelopment Project, Series 2002, 6.125%, 10/01/21 (Pre-refunded 10/01/12) | 10/12 at 100.00 | N/R (4) | | 2,006,478 | |
| | | | Missouri Development Finance Board, Cultural Facilities Revenue Bonds, Nelson Gallery Foundation, Series 2001A: | | | | | |
| | 3,335 | | 5.250%, 12/01/19 (Pre-refunded 12/01/11) – NPFG Insured | 12/11 at 100.00 | AA– (4) | | 3,513,389 | |
| | 3,510 | | 5.250%, 12/01/20 (Pre-refunded 12/01/11) – NPFG Insured | 12/11 at 100.00 | AA– (4) | | 3,697,750 | |
| | 3,695 | | 5.250%, 12/01/21 (Pre-refunded 12/01/11) – NPFG Insured | 12/11 at 100.00 | AA– (4) | | 3,892,646 | |
| | 2,040 | | 5.250%, 12/01/22 (Pre-refunded 12/01/11) – NPFG Insured | 12/11 at 100.00 | AA– (4) | | 2,149,120 | |
| | 16,900 | | Total Missouri | | | | 17,417,532 | |
| | | | Montana – 0.8% (0.5% of Total Investments) | | | | | |
| | 5,000 | | Montana Board of Investments, Exempt Facility Revenue Bonds, Stillwater Mining Company, Series 2000, 8.000%, 7/01/20 (Alternative Minimum Tax) | 7/11 at 100.50 | B | | 4,687,900 | |
| | | | Nebraska – 0.7% (0.5% of Total Investments) | | | | | |
| | | | Nebraska Investment Finance Authority, Single Family Housing Revenue Bonds, Series 2001D: | | | | | |
| | 1,000 | | 5.250%, 9/01/21 (Alternative Minimum Tax) | 9/11 at 100.00 | AAA | | 1,022,550 | |
| | 1,315 | | 5.375%, 9/01/32 (Alternative Minimum Tax) | 9/11 at 100.00 | AAA | | 1,359,789 | |
| | 1,005 | | Omaha Public Power District, Nebraska, Separate Electric System Revenue Bonds, Nebraska City 2, Series 2006A, 19.418%, 8/01/40 – AMBAC Insured (IF) | 2/17 at 100.00 | AA+ | | 1,624,191 | |
| | 3,320 | | Total Nebraska | | | | 4,006,530 | |
| | | | Nevada – 2.7% (1.8% of Total Investments) | | | | | |
| | 10,000 | | Clark County, Nevada, Airport Revenue Bonds, Subordinate Lien Series 2010B, 5.750%, 7/01/42 | 1/20 at 100.00 | Aa3 | | 10,766,600 | |
| | 2,000 | | Director of Nevada State Department of Business and Industry, Revenue Bonds, Las Vegas Monorail Project, First Tier, Series 2000, 5.375%, 1/01/40 – AMBAC Insured (5) | 1/11 at 100.00 | N/R | | 420,260 | |
| | 4,000 | | Director of Nevada State Department of Business and Industry, Revenue Bonds, Las Vegas Monorail Project, Second Tier, Series 2000, 7.375%, 1/01/40 (5) | 1/12 at 100.00 | N/R | | 9,200 | |
| | 155 | | Nevada Housing Division, Single Family Mortgage Bonds, Senior Series 1998A-1, 5.300%, 4/01/18 (Alternative Minimum Tax) | 4/11 at 100.00 | Aaa | | 159,520 | |
| | 4,290 | | University of Nevada, Revenue Bonds, Community College System, Series 2001A, 5.250%, 7/01/26 (Pre-refunded 1/01/12) – FGIC Insured | 1/12 at 100.00 | Aa2 (4) | | 4,535,946 | |
| | 20,445 | | Total Nevada | | | | 15,891,526 | |
| | Principal | | | Optional Call | | | | |
| | Amount (000) | | Description (1) | Provisions (2) | Ratings (3) | | Value | |
| | | | New Hampshire – 0.3% (0.2% of Total Investments) | | | | | |
| $ | 2,000 | | New Hampshire Health and Education Authority, Hospital Revenue Bonds, Concord Hospital, Series 2001, 5.500%, 10/01/21 – AGM Insured | 10/11 at 101.00 | Aa3 | $ | 2,046,840 | |
| | | | New Jersey – 4.7% (3.1% of Total Investments) | | | | | |
| | 10,000 | | New Jersey Economic Development Authority, Water Facilities Revenue Bonds, American Water Company, Series 2002A, 5.250%, 11/01/32 – AMBAC Insured (Alternative Minimum Tax) | 11/12 at 101.00 | A2 | | 10,119,000 | |
| | 620 | | New Jersey Health Care Facilities Financing Authority, Revenue Bonds, Somerset Medical Center, Series 2003, 5.500%, 7/01/33 | 7/13 at 100.00 | Ba2 | | 520,540 | |
| | 4,125 | | New Jersey Transit Corporation, Certificates of Participation, Federal Transit Administration Grants, Series 2002A, 5.500%, 9/15/13 – AMBAC Insured | No Opt. Call | Aa3 | | 4,526,693 | |
| | 12,970 | | New Jersey Transportation Trust Fund Authority, Transportation System Bonds, Capital Appreciation Series 2010A, 0.000%, 12/15/33 | No Opt. Call | AA– | | 3,519,410 | |
| | 20,000 | | New Jersey Transportation Trust Fund Authority, Transportation System Bonds, Series 2006C, 0.000%, 12/15/28 – AMBAC Insured | No Opt. Call | AA– | | 7,626,200 | |
| | 2,045 | | Tobacco Settlement Financing Corporation, New Jersey, Tobacco Settlement Asset-Backed Bonds, Series 2007-1A, 4.750%, 6/01/34 | 6/17 at 100.00 | BBB | | 1,513,484 | |
| | 49,760 | | Total New Jersey | | | | 27,825,327 | |
| | | | New York – 4.5% (3.0% of Total Investments) | | | | | |
| | 900 | | Albany Industrial Development Agency, New York, Revenue Bonds, Brighter Choice Charter Schools, Series 2007A, 5.000%, 4/01/32 | 4/17 at 100.00 | N/R | | 825,714 | |
| | | | Brooklyn Areba Local Development Corporation, New York, Payment in Lieu of Taxes Revenue Bonds, Barclays Center Project, Series 2009: | | | | | |
| | 1,275 | | 6.000%, 7/15/30 | 1/20 at 100.00 | BBB– | | 1,368,088 | |
| | 3,400 | | 0.000%, 7/15/44 | No Opt. Call | BBB– | | 427,006 | |
| | 1,780 | | East Rochester Housing Authority, New York, GNMA Secured Revenue Bonds, Gates Senior Housing Inc., Series 2001, 5.300%, 4/20/31 | 10/11 at 101.00 | N/R | | 1,811,079 | |
| | 5,010 | | Hudson Yards Infrastructure Corporation, New York, Revenue Bonds, Series 2006A, 4.500%, 2/15/47 – NPFG Insured | 2/17 at 100.00 | A | | 4,809,901 | |
| | 4,155 | | Monroe County Airport Authority, New York, Revenue Refunding Bonds, Greater Rochester International Airport, Series 1999, 5.750%, 1/01/13 – NPFG Insured (Alternative Minimum Tax) | No Opt. Call | A | | 4,407,333 | |
| | 8,000 | | New York City Industrial Development Agency, New York, American Airlines-JFK International Airport Special Facility Revenue Bonds, Series 2005, 7.750%, 8/01/31 (Alternative Minimum Tax) | 8/16 at 101.00 | B– | | 8,508,160 | |
| | 1,715 | | New York City, New York, General Obligation Bonds, Fiscal Series 2002G, 5.625%, 8/01/20 – NPFG Insured | 8/12 at 100.00 | AA | | 1,845,820 | |
| | 785 | | New York City, New York, General Obligation Bonds, Fiscal Series 2002G, 5.625%, 8/01/20 (Pre-refunded 8/01/12) – NPFG Insured | 8/12 at 100.00 | AA (4) | | 856,561 | |
| | 2,000 | | New York State Tobacco Settlement Financing Corporation, Tobacco Settlement Asset-Backed and State Contingency Contract-Backed Bonds, Series 2003B-1C, 5.500%, 6/01/16 | 6/11 at 100.00 | AA– | | 2,047,800 | |
| | 29,020 | | Total New York | | | | 26,907,462 | |
| | | | North Carolina – 1.2% (0.8% of Total Investments) | | | | | |
| | 1,710 | | Charlotte-Mecklenberg Hospital Authority, North Carolina, Carolinas HealthCare System Revenue Bonds, Series 2008, Trust 1149, 14.679%, 7/15/32 (IF) | 1/18 at 100.00 | AA– | | 1,847,022 | |
| | 1,200 | | Charlotte-Mecklenburg Hospital Authority, North Carolina, Health Care System Revenue Bonds, Carolinas Health Care, Series 2007A, 5.000%, 1/15/31 | 1/17 at 100.00 | AA– | | 1,243,956 | |
| | 1,750 | | Charlotte-Mecklenburg Hospital Authority, North Carolina, Healthcare System Revenue Bonds, DBA Carolinas Healthcare System, Series 2005A, 4.875%, 1/15/32 (Pre-refunded 1/15/15) | 1/15 at 100.00 | AAA | | 2,020,463 | |
| | 515 | | North Carolina Municipal Power Agency 1, Catawba Electric Revenue Bonds, Series 2003A, 5.500%, 1/01/13 (ETM) | No Opt. Call | N/R (4) | | 568,725 | |
| | 1,085 | | North Carolina Municipal Power Agency 1, Catawba Electric Revenue Bonds, Series 2003A, 5.500%, 1/01/13 | No Opt. Call | A | | 1,190,137 | |
| | 6,260 | | Total North Carolina | | | | 6,870,303 | |
Nuveen Investments 77
| | | Nuveen Dividend Advantage Municipal Fund 3 (continued) |
| NZF | | Portfolio of Investments October 31, 2010 |
| | Principal | | | Optional Call | | | | |
| | Amount (000) | | Description (1) | Provisions (2) | Ratings (3) | | Value | |
| | | | Ohio – 0.9% (0.6% of Total Investments) | | | | | |
| | | | Buckeye Tobacco Settlement Financing Authority, Ohio, Tobacco Settlement Asset-Backed Revenue Bonds, Senior Lien, Series 2007A-2: | | | | | |
| $ | 3,140 | | 5.125%, 6/01/24 | 6/17 at 100.00 | BBB | $ | 2,743,795 | |
| | 710 | | 5.875%, 6/01/30 | 6/17 at 100.00 | BBB | | 598,232 | |
| | 685 | | 5.750%, 6/01/34 | 6/17 at 100.00 | BBB | | 546,274 | |
| | 1,570 | | 5.875%, 6/01/47 | 6/17 at 100.00 | BBB | | 1,201,458 | |
| | 6,105 | | Total Ohio | | | | 5,089,759 | |
| | | | Oklahoma – 2.0% (1.3% of Total Investments) | | | | | |
| | | | Oklahoma Development Finance Authority, Revenue Bonds, Saint John Health System, Series 2007: | | | | | |
| | 4,370 | | 5.000%, 2/15/37 | 2/17 at 100.00 | A | | 4,379,046 | |
| | 955 | | 5.000%, 2/15/42 | 2/17 at 100.00 | A | | 955,439 | |
| | 6,305 | | Tulsa County Industrial Authority, Oklahoma, Health Care Revenue Bonds, Saint Francis Health System, Series 2006, 5.000%, 12/15/36 (UB) | 12/16 at 100.00 | AA | | 6,424,543 | |
| | 88 | | Tulsa County Industrial Authority, Oklahoma, Health Care Revenue Bonds, Saint Francis Health System, Series 2006, Trust 3500, 8.333%, 6/15/30 (IF) | 12/16 at 100.00 | AA | | 91,037 | |
| | 11,718 | | Total Oklahoma | | | | 11,850,065 | |
| | | | Oregon – 0.8% (0.5% of Total Investments) | | | | | |
| | 4,700 | | Oregon Health, Housing, Educational and Cultural Facilities Authority, Revenue Bonds, PeaceHealth Project, Series 2001, 5.250%, 11/15/21 – AMBAC Insured | 11/11 at 101.00 | AA– | | 4,815,714 | |
| | | | Pennsylvania – 1.9% (1.3% of Total Investments) | | | | | |
| | | | Allegheny County Hospital Development Authority, Pennsylvania, Revenue Bonds, West Penn Allegheny Health System, Series 2000B: | | | | | |
| | 2,000 | | 9.250%, 11/15/22 (Pre-refunded 11/15/10) | 11/10 at 102.00 | AAA | | 2,047,940 | |
| | 2,000 | | 9.250%, 11/15/30 (Pre-refunded 11/15/10) | 11/10 at 102.00 | AAA | | 2,047,940 | |
| | 500 | | Bucks County Industrial Development Authority, Pennsylvania, Charter School Revenue Bonds, School Lane Charter School, Series 2007A, 5.000%, 3/15/37 | 3/17 at 100.00 | BBB | | 456,315 | |
| | 3,500 | | Pennsylvania Economic Development Financing Authority, Senior Lien Resource Recovery Revenue Bonds, Northampton Generating Project, Series 1994A, 6.600%, 1/01/19 (Alternative Minimum Tax) | 1/11 at 100.00 | CC | | 1,989,925 | |
| | 1,400 | | Pennsylvania Higher Educational Facilities Authority, Revenue Bonds, St. Joseph’s University, Series 2010A, 5.000%, 11/01/40 | 11/20 at 100.00 | A– | | 1,435,462 | |
| | 3,205 | | Philadelphia School District, Pennsylvania, General Obligation Bonds, Series 2002B, 5.625%, 8/01/16 (Pre-refunded 8/01/12) – FGIC Insured | 8/12 at 100.00 | Aa2 (4) | | 3,495,149 | |
| | 12,605 | | Total Pennsylvania | | | | 11,472,731 | |
| | | | Puerto Rico – 0.4% (0.3% of Total Investments) | | | | | |
| | 2,500 | | Puerto Rico Sales Tax Financing Corporation, Sales Tax Revenue Bonds, Series 2007A, 5.250%, 8/01/57 | 8/17 at 100.00 | Aa2 | | 2,610,825 | |
| | | | Tennessee – 1.2% (0.8% of Total Investments) | | | | | |
| | 3,680 | | Knox County Health, Educational and Housing Facilities Board, Tennessee, Hospital Revenue Refunding Bonds, Covenant Health, Series 2006, 0.000%, 1/01/41 | 1/17 at 30.07 | A– | | 631,488 | |
| | 5,210 | | Memphis-Shelby County Airport Authority, Tennessee, Airport Revenue Bonds, Series 2001A, 5.500%, 3/01/14 – AGM Insured (Alternative Minimum Tax) | 3/11 at 100.00 | AA+ | | 5,277,886 | |
| | 275 | | Sullivan County Health Educational and Housing Facilities Board, Tennessee, Revenue Bonds, Wellmont Health System, Series 2006C, 5.250%, 9/01/36 | 9/16 at 100.00 | BBB+ | | 270,397 | |
| | | | Sumner County Health, Educational, and Housing Facilities Board, Tennessee, Revenue Refunding Bonds, Sumner Regional Health System Inc., Series 2007: | | | | | |
| | 100 | | 5.500%, 11/01/37 (5) (7) | 11/17 at 100.00 | N/R | | 41,633 | |
| | 350 | | 5.500%, 11/01/46 (5) (7) | 11/17 at 100.00 | N/R | | 145,716 | |
| | 760 | | Tennessee Housing Development Agency, Homeownership Program Bonds, Series 2001-3A, 5.200%, 7/01/22 (Alternative Minimum Tax) | 7/11 at 100.00 | AA+ | | 764,940 | |
| | 10,375 | | Total Tennessee | | | | 7,132,060 | |
| | Principal | | | Optional Call | | | | |
| | Amount (000) | | Description (1) | Provisions (2) | Ratings (3) | | Value | |
| | | | Texas – 21.6% (14.6% of Total Investments) | | | | | |
| $ | 5,445 | | Board of Regents, University of Texas System, Financing System Revenue Bonds, Series 2006F, 4.250%, 8/15/36 (UB) | 2/17 at 100.00 | AAA | $ | 5,461,117 | |
| | | | Collins and Denton Counties, Frisco, Texas, General Obligation Bonds, Series 2001: | | | | | |
| | 1,910 | | 5.000%, 2/15/20 – FGIC Insured | 2/11 at 100.00 | Aa1 | | 1,936,645 | |
| | 2,005 | | 5.000%, 2/15/21 – FGIC Insured | 2/11 at 100.00 | Aa1 | | 2,032,970 | |
| | 3,850 | | Dallas-Ft. Worth International Airport, Texas, Joint Revenue Refunding and Improvement Bonds, Series 2001A, 5.500%, 11/01/35 – NPFG Insured (Alternative Minimum Tax) | 11/11 at 100.00 | A+ | | 3,874,063 | |
| | 5,000 | | Decatur Hospital Authority, Texas, Revenue Bonds, Wise Regional Health System, Series 2004A, 7.000%, 9/01/25 | 9/14 at 100.00 | N/R | | 5,051,100 | |
| | 4,040 | | Harris County, Texas, Tax and Revenue Certificates of Obligation, Series 2001, 5.000%, 8/15/27 | 8/11 at 100.00 | AAA | | 4,191,540 | |
| | 6,000 | | Houston, Texas, Junior Lien Water and Sewerage System Revenue Refunding Bonds, Series 2001B, 5.500%, 12/01/29 – NPFG Insured (ETM) | No Opt. Call | N/R (4) | | 7,587,900 | |
| | 7,000 | | Houston, Texas, Subordinate Lien Airport System Revenue Bonds, Series 1998B, 5.250%, 7/01/14 – NPFG Insured (Alternative Minimum Tax) | 1/11 at 100.00 | A | | 7,018,410 | |
| | | | Houston, Texas, Subordinate Lien Airport System Revenue Refunding Bonds, Series 2001A: | | | | | |
| | 2,525 | | 5.500%, 7/01/13 – FGIC Insured (Alternative Minimum Tax) | 1/12 at 100.00 | A | | 2,645,796 | |
| | 2,905 | | 5.500%, 7/01/14 – FGIC Insured (Alternative Minimum Tax) | 1/12 at 100.00 | A | | 3,043,278 | |
| | 14,200 | | Hutto Independent School District, Williamson County, Texas, General Obligation Bonds, Series 2007A, 4.750%, 8/01/43 (UB) | 8/16 at 100.00 | AAA | | 14,605,694 | |
| | | | Jefferson County Health Facilities Development Corporation, Texas, FHA-Insured Mortgage Revenue Bonds, Baptist Hospital of Southeast Texas, Series 2001: | | | | | |
| | 8,500 | | 5.400%, 8/15/31 – AMBAC Insured | 8/11 at 100.00 | N/R | | 8,808,210 | |
| | 8,500 | | 5.500%, 8/15/41 – AMBAC Insured | 8/11 at 100.00 | N/R | | 8,814,925 | |
| | 3,090 | | Laredo Independent School District, Webb County, Texas, General Obligation Refunding Bonds, Series 2001, 5.000%, 8/01/25 | 8/11 at 100.00 | AAA | | 3,174,357 | |
| | 7,610 | | Laredo Independent School District, Webb County, Texas, General Obligation Refunding Bonds, Series 2001, 5.000%, 8/01/25 (Pre-refunded 8/01/11) | 8/11 at 100.00 | Aaa | | 7,883,351 | |
| | 8,000 | | Lower Colorado River Authority, Texas, Transmission Contract Refunding Revenue Bonds, LCRA Transmission Services Corporation Project, Refunding & Improvement Series 2010, 5.000%, 5/15/40 | 5/20 at 100.00 | A | | 8,313,760 | |
| | 2,500 | | Matagorda County Navigation District 1, Texas, Collateralized Revenue Refunding Bonds, Houston Light and Power Company, Series 1997, 5.125%, 11/01/28 – AMBAC Insured (Alternative Minimum Tax) | No Opt. Call | A3 | | 2,469,600 | |
| | 3,150 | | North Texas Thruway Authority, Second Tier System Revenue Refunding Bonds, Series 2008, 5.750%, 1/01/38 | 1/18 at 100.00 | A3 | | 3,325,644 | |
| | 3,045 | | Port of Houston Authority, Harris County, Texas, General Obligation Port Improvement Bonds, Series 2001B, 5.500%, 10/01/17 – FGIC Insured (Alternative Minimum Tax) | 10/11 at 100.00 | AAA | | 3,122,648 | |
| | 3,500 | | Southwest Higher Education Authority Inc, Texas, Revenue Bonds, Southern Methodist University, Series 2010, 5.000%, 10/01/41 | No Opt. Call | AA– | | 3,678,745 | |
| | 7,700 | | Tarrant County Cultural & Educational Facilities Financing Corporation, Texas, Revenue Bonds, Texas Health Resources, Series 2007A, 5.000%, 2/15/36 (UB) | 2/17 at 100.00 | AA– | | 7,740,733 | |
| | 9,040 | | Texas Department of Housing and Community Affairs, Residential Mortgage Revenue Bonds, Series 2001A, 5.350%, 7/01/33 (Alternative Minimum Tax) | 7/11 at 100.00 | AAA | | 9,183,194 | |
| | | | White Settlement Independent School District, Tarrant County, Texas, General Obligation Bonds, Series 2006: | | | | | |
| | 9,110 | | 0.000%, 8/15/37 | 8/15 at 31.98 | AAA | | 2,308,747 | |
| | 9,110 | | 0.000%, 8/15/40 | 8/15 at 27.11 | AAA | | 1,949,176 | |
| | 7,110 | | 0.000%, 8/15/44 | 8/15 at 21.88 | AAA | | 1,223,631 | |
| | 144,845 | | Total Texas | | | | 129,445,234 | |
| | | | Utah – 0.4% (0.3% of Total Investments) | | | | | |
| | | | Utah Housing Corporation, Single Family Mortgage Bonds, Series 2001E: | | | | | |
| | 750 | | 5.200%, 1/01/18 (Alternative Minimum Tax) | 7/11 at 100.00 | AA– | | 756,720 | |
| | 245 | | 5.500%, 1/01/23 (Alternative Minimum Tax) | 7/11 at 100.00 | Aaa | | 253,016 | |
Nuveen Investments 79
| | | Nuveen Dividend Advantage Municipal Fund 3 (continued) |
| NZF | | Portfolio of Investments October 31, 2010 |
| | Principal | | | Optional Call | | | | |
| | Amount (000) | | Description (1) | Provisions (2) | Ratings (3) | | Value | |
| | | | Utah (continued) | | | | | |
| | | | Utah Housing Corporation, Single Family Mortgage Bonds, Series 2001F-1: | | | | | |
| $ | 1,155 | | 4.950%, 7/01/18 (Alternative Minimum Tax) | 7/11 at 100.00 | AA– | $ | 1,179,624 | |
| | 365 | | 5.300%, 7/01/23 (Alternative Minimum Tax) | 7/11 at 100.00 | Aaa | | 373,957 | |
| | 2,515 | | Total Utah | | | | 2,563,317 | |
| | | | Virginia – 0.2% (0.1% of Total Investments) | | | | | |
| | 1,000 | | Chesterfield County Health Center Commission, Virginia, Mortgage Revenue Bonds, Lucy Corr Village, Series 2005, 5.375%, 12/01/28 | 12/15 at 100.00 | N/R | | 943,100 | |
| | | | Washington – 15.6% (10.5% of Total Investments) | | | | | |
| | | | Bellingham Housing Authority, Washington, Housing Revenue Bonds, Varsity Village Project, Series 2001A: | | | | | |
| | 1,000 | | 5.500%, 12/01/27 – NPFG Insured | 12/11 at 100.00 | Aa3 | | 1,014,610 | |
| | 2,000 | | 5.600%, 12/01/36 – NPFG Insured | 12/11 at 100.00 | Aa3 | | 2,018,580 | |
| | 2,500 | | King County, Washington, Sewer Revenue Bonds, Series 2009, 5.250%, 1/01/42 | 1/19 at 100.00 | AA+ | | 2,713,150 | |
| | 12,955 | | Port of Seattle, Washington, Passenger Facility Charge Revenue Bonds, Series 1998A, 5.300%, 12/01/16 – AMBAC Insured (Alternative Minimum Tax) | 12/10 at 100.00 | A+ | | 12,981,299 | |
| | | | Port of Seattle, Washington, Revenue Bonds, Series 2001B: | | | | | |
| | 2,535 | | 5.625%, 4/01/18 – FGIC Insured (Alternative Minimum Tax) (UB) | 10/11 at 100.00 | Aa2 | | 2,626,209 | |
| | 16,000 | | 5.100%, 4/01/24 – FGIC Insured (Alternative Minimum Tax) (UB) | 1/11 at 100.00 | Aa2 | | 16,007,520 | |
| | 1,440 | | Public Utility District 1, Benton County, Washington, Electric Revenue
Refunding Bonds, Series 2001A, 5.625%, 11/01/15 (Pre-refunded
11/01/11) – AGM Insured | 11/11 at 100.00 | AA+ (4) | | 1,516,147 | |
| | 650 | | Public Utility District 1, Benton County, Washington, Electric Revenue Refunding Bonds, Series 2001A, 5.625%, 11/01/15 – AGM Insured | 11/11 at 100.00 | AA+ | | 679,281 | |
| | 4,235 | | Seattle, Washington, Municipal Light and Power Revenue Refunding and Improvement Bonds, Series 2001, 5.500%, 3/01/18 (Pre-refunded 3/01/11) – AGM Insured | 3/11 at 100.00 | AA+ (4) | | 4,310,636 | |
| | 1,445 | | Seattle, Washington, Municipal Light and Power Revenue Refunding and Improvement Bonds, Series 2001, 5.500%, 3/01/18 – AGM Insured | 3/11 at 100.00 | AA+ | | 1,466,110 | |
| | 4,530 | | Tacoma, Washington, Solid Waste Utility Revenue Refunding Bonds, Series 2001, 5.250%, 12/01/21 (Pre-refunded 12/01/11) – AMBAC Insured | 12/11 at 100.00 | AA (4) | | 4,770,045 | |
| | 3,720 | | Washington State Health Care Facilities Authority, Revenue Bonds, Children’s Hospital and Regional Medical Center, Series 2001, 5.375%, 10/01/18 (Pre-refunded 10/01/11) – AMBAC Insured | 10/11 at 100.00 | Aa3 (4) | | 3,889,631 | |
| | | | Washington State Health Care Facilities Authority, Revenue Bonds, Good Samaritan Hospital, Series 2001: | | | | | |
| | 5,480 | | 5.500%, 10/01/21 (Pre-refunded 10/01/11) – RAAI Insured | 10/11 at 101.00 | BBB– (4) | | 5,790,825 | |
| | 25,435 | | 5.625%, 10/01/31 (Pre-refunded 10/01/11) – RAAI Insured | 10/11 at 101.00 | BBB– (4) | | 26,906,668 | |
| | | | Washington State Health Care Facilities Authority, Revenue Bonds, Group Health Cooperative of Puget Sound, Series 2001: | | | | | |
| | 3,005 | | 5.375%, 12/01/17 – AMBAC Insured | 12/11 at 101.00 | BBB | | 3,074,025 | |
| | 2,915 | | 5.375%, 12/01/18 – AMBAC Insured | 12/11 at 101.00 | BBB | | 2,975,078 | |
| | 89,845 | | Total Washington | | | | 92,739,814 | |
| | | | Wisconsin – 4.4% (3.0% of Total Investments) | | | | | |
| | | | Appleton, Wisconsin, Waterworks Revenue Refunding Bonds, Series 2001: | | | | | |
| | 3,705 | | 5.375%, 1/01/20 (Pre-refunded 1/01/12) – FGIC Insured | 1/12 at 100.00 | N/R (4) | | 3,919,630 | |
| | 1,850 | | 5.000%, 1/01/21 (Pre-refunded 1/01/12) – FGIC Insured | 1/12 at 100.00 | N/R (4) | | 1,949,066 | |
| | 12,250 | | La Crosse, Wisconsin, Pollution Control Revenue Refunding Bonds, Dairyland Power Cooperative, Series 1997B, 5.550%, 2/01/15 – AMBAC Insured | 12/10 at 100.00 | A | | 12,317,252 | |
| | 1,000 | | Wisconsin Health and Educational Facilities Authority, Revenue Bonds, Franciscan Sisters of Christian Charity HealthCare Ministry, Series 2007, 5.000%, 9/01/33 | 9/17 at 100.00 | BBB+ | | 926,770 | |
| | 350 | | Wisconsin Health and Educational Facilities Authority, Revenue Bonds, Froedtert and Community Health Obligated Group, Series 2001, 5.375%, 10/01/30 | 10/11 at 101.00 | AA– | | 356,782 | |
| | 3,650 | | Wisconsin Health and Educational Facilities Authority, Revenue Bonds, Froedtert and Community Health Obligated Group, Series 2001, 5.375%, 10/01/30 (Pre-refunded 10/01/11) | 10/11 at 101.00 | AA– (4) | | 3,855,640 | |
| | Principal | | | Optional Call | | | | |
| | Amount (000) | | Description (1) | Provisions (2) | Ratings (3) | | Value | |
| | | | Wisconsin (continued) | | | | | |
| $ | 2,500 | | Wisconsin Health and Educational Facilities Authority, Revenue Bonds, Marshfield Clinic, Series 2001B, 6.000%, 2/15/25 | 2/12 at 100.00 | BBB+ | $ | 2,530,375 | |
| | 330 | | Wisconsin Health and Educational Facilities Authority, Revenue Bonds, Wheaton Franciscan Services Inc., Series 2003A, 5.125%, 8/15/33 | 8/13 at 100.00 | BBB+ | | 308,722 | |
| | 25,635 | | Total Wisconsin | | | | 26,164,237 | |
| $ | 937,653 | | Total Municipal Bonds (cost $870,485,123) | | | | 882,010,308 | |
| | | | | | | | | |
| | Shares | | Description (1) | | | | Value | |
| | | | Investment Companies – 0.6% (0.4% of Total Investments) | | | | | |
| | 6,266 | | BlackRock MuniHoldings Fund Inc. | | | $ | 104,517 | |
| | 26,880 | | Dreyfus Strategic Municipal Fund | | | | 240,845 | |
| | 131,278 | | DWS Municipal Income Trust | | | | 1,667,231 | |
| | 43,020 | | Invesco Van Kampen Investment Grade Municipal Trust | | | | 645,300 | |
| | 30,000 | | Invesco Van Kampen Municipal Opportunity Trust | | | | 435,300 | |
| | 43,420 | | PIMCO Municipal Income Fund II | | | | 505,409 | |
| | | | Total Investment Companies (cost $3,325,133) | | | | 3,598,602 | |
| | | | Total Investments (cost $873,810,256) – 148.7% | | | | 885,608,910 | |
| | | | Floating Rate Obligations – (11.5)% | | | | (68,408,650 | ) |
| | | | Other Assets Less Liabilities – 2.6% | | | | 15,162,684 | |
| | | | Auction Rate Preferred Shares, at Liquidation Value – (39.8)% (6) | | | | (236,950,000 | ) |
| | | | Net Assets Applicable to Common Shares – 100% | | | $ | 595,412,944 | |
| (1) | | All percentages shown in the Portfolio of Investments are based on net assets applicable to Common shares unless otherwise noted. |
| (2) | | Optional Call Provisions (not covered by the report of independent registered public accounting firm): Dates (month and year) and prices of the earliest optional call or redemption. There may be other call provisions at varying prices at later dates. Certain mortgage-backed securities may be subject to periodic principal paydowns. |
| (3) | | Ratings (not covered by the report of independent registered public accounting firm): Using the highest of Standard & Poor’s Group (“Standard & Poor’s”), Moody’s Investor Service, Inc. (“Moody’s”) or Fitch, Inc. (“Fitch”) rating. Ratings below BBB by Standard & Poor’s, Baa by Moody’s or BBB by Fitch are considered to be below investment grade. Holdings designated N/R are not rated by any of these national rating agencies. |
| (4) | | Backed by an escrow or trust containing sufficient U.S. Government or U.S. Government agency securities, which ensure the timely payment of principal and interest. Such investments are normally considered to be equivalent to AAA rated securities. |
| (5) | | The Fund’s Adviser has concluded this issue is not likely to meet its future interest payment obligations and has directed the Fund’s custodian to cease accruing additional income on the Fund’s records. |
| (6) | | Auction Rate Preferred Shares, at Liquidation Value as a percentage of Total Investments is 26.8%. |
| (7) | | For fair value measurement disclosure purposes, investment categorized as Level 3. See Notes to Financial Statements, Footnote 1 – General Information and Significant Accounting Policies, Investment Valuation for more information. |
| N/R | | Not rated. |
| (ETM) | | Escrowed to maturity. |
| (IF) | | Inverse floating rate investment. |
| (UB) | | Underlying bond of an inverse floating rate trust reflected as a financing transaction. See Notes to Financial Statements, Footnote 1 – General Information and Significant Accounting Policies, Inverse Floating Rate Securities for more information. |
See accompanying notes to financial statements.
Nuveen Investments 81
| | | Statement of |
| | | Assets & Liabilities |
| | | October 31, 2010 |
| | | | Performance | | | Municipal | | | Market | |
| | | | Plus | | | Advantage | | | Opportunity | |
| | | | (NPP | ) | | (NMA | ) | | (NMO | ) |
| Assets | | | | | | | | | | |
| Investments, at value (cost $1,299,836,945, $958,307,804 and $981,606,506, respectively) | | $ | 1,360,959,631 | | $ | 985,104,177 | | $ | 986,271,687 | |
| Cash | | | 3,301,519 | | | 6,787,016 | | | — | |
| Receivables: | | | | | | | | | | |
| Dividends and interest | | | 18,370,483 | | | 15,953,440 | | | 16,003,092 | |
| Investments sold | | | 795,000 | | | 595,000 | | | 61,144,000 | |
| Deferred offering costs | | | — | | | 2,089,923 | | | 4,131,100 | |
| Other assets | | | 298,376 | | | 429,482 | | | 395,655 | |
| Total assets | | | 1,383,725,009 | | | 1,010,959,038 | | | 1,067,945,534 | |
| Liabilities | | | | | | | | | | |
| Cash overdraft | | | — | | | — | | | 9,292,196 | |
| Floating rate obligations | | | 42,325,000 | | | 67,694,983 | | | 43,530,000 | |
| Payables: | | | | | | | | | | |
| Investments purchased | | | — | | | — | | | 11,733,982 | |
| Auction Rate Preferred share dividends | | | 25,686 | | | — | | | — | |
| Common share dividends | | | 4,120,327 | | | 3,054,302 | | | 3,244,159 | |
| Interest | | | — | | | — | | | — | |
| Offering costs | | | — | | | 243,294 | | | 393,751 | |
| MuniFund Term Preferred shares, at liquidation value | | | — | | | — | | | — | |
| Variable Rate Demand Preferred shares, at liquidation value | | | — | | | 296,800,000 | | | 350,900,000 | |
| Accrued expenses: | | | | | | | | | | |
| Management fees | | | 711,784 | | | 463,640 | | | 460,508 | |
| Other | | | 490,583 | | | 338,860 | | | 374,352 | |
| Total liabilities | | | 47,673,380 | | | 368,595,079 | | | 419,928,948 | |
| Auction Rate Preferred shares, at liquidation value | | | 419,900,000 | | | — | | | — | |
| Net assets applicable to Common shares | | $ | 916,151,629 | | $ | 642,363,959 | | $ | 648,016,586 | |
| Common shares outstanding | | | 59,932,964 | | | 43,437,773 | | | 45,728,661 | |
| Net asset value per Common share outstanding (net assets applicable to Common shares, divided by Common shares outstanding) | | $ | 15.29 | | $ | 14.79 | | $ | 14.17 | |
| Net assets applicable to Common shares consist of: | | | | | | | | | | |
| Common shares, $.01 par value per share | | $ | 599,330 | | $ | 434,378 | | $ | 457,287 | |
| Paid-in surplus | | | 838,632,973 | | | 607,474,070 | | | 638,055,592 | |
| Undistributed (Over-distribution of) net investment income | | | 16,554,168 | | | 10,244,572 | | | 9,994,354 | |
| Accumulated net realized gain (loss) | | | (757,528 | ) | | (2,585,434 | ) | | (5,155,828 | ) |
| Net unrealized appreciation (depreciation) | | | 61,122,686 | | | 26,796,373 | | | 4,665,181 | |
| Net assets applicable to Common shares | | $ | 916,151,629 | | $ | 642,363,959 | | $ | 648,016,586 | |
| Authorized shares: | | | | | | | | | | |
| Common | | | 200,000,000 | | | 200,000,000 | | | 200,000,000 | |
| Auction Rate Preferred | | | 1,000,000 | | | 1,000,000 | | | 1,000,000 | |
| MuniFund Term Preferred | | | — | | | — | | | — | |
| Variable Rate Demand Preferred | | | — | | | Unlimited | | | Unlimited | |
See accompanying notes to financial statements.
| | | | Dividend | | | Dividend | | | Dividend | |
| | | | Advantage | | | Advantage 2 | | | Advantage 3 | |
| | | | (NAD | ) | | (NXZ | ) | | (NZF | ) |
| Assets | | | | | | | | | | |
| Investments, at value (cost $849,065,142, $622,761,126 and $873,810,256, respectively) | | $ | 869,245,806 | | $ | 638,265,834 | | $ | 885,608,910 | |
| Cash | | | — | | | 143,248 | | | 2,868,068 | |
| Receivables: | | | | | | | | | | |
| Dividends and interest | | | 13,037,400 | | | 11,395,924 | | | 15,108,099 | |
| Investments sold | | | 19,428,125 | | | 8,110,000 | | | 854,980 | |
| Deferred offering costs | | | 2,240,083 | | | 2,142,508 | | | — | |
| Other assets | | | 193,963 | | | 225,482 | | | 179,059 | |
| Total assets | | | 904,145,377 | | | 660,282,996 | | | 904,619,116 | |
| Liabilities | | | | | | | | | | |
| Cash overdraft | | | 1,211,715 | | | — | | | — | |
| Floating rate obligations | | | 51,605,000 | | | 26,661,650 | | | 68,408,650 | |
| Payables: | | | | | | | | | | |
| Investments purchased | | | 5,859,060 | | | — | | | — | |
| Auction Rate Preferred share dividends | | | 18,956 | | | — | | | 13,176 | |
| Common share dividends | | | 2,872,111 | | | 2,273,787 | | | 3,203,704 | |
| Interest | | | 324,675 | | | — | | | — | |
| Offering costs | | | 264,290 | | | 108,461 | | | — | |
| MuniFund Term Preferred shares, at liquidation value | | | 144,300,000 | | | — | | | — | |
| Variable Rate Demand Preferred shares, at liquidation value | | | — | | | 196,000,000 | | | — | |
| Accrued expenses: | | | | | | | | | | |
| Management fees | | | 452,429 | | | 300,942 | | | 429,349 | |
| Other | | | 267,373 | | | 173,741 | | | 201,293 | |
| Total liabilities | | | 207,175,609 | | | 225,518,581 | | | 72,256,172 | |
| Auction Rate Preferred shares, at liquidation value | | | 120,075,000 | | | — | | | 236,950,000 | |
| Net assets applicable to Common shares | | $ | 576,894,768 | | $ | 434,764,415 | | $ | 595,412,944 | |
| Common shares outstanding | | | 39,291,788 | | | 29,457,616 | | | 40,387,484 | |
Net asset value per Common share outstanding (net assets applicable to Common shares, divided by Common shares outstanding) | | $ | 14.68 | | $ | 14.76 | | $ | 14.74 | |
| Net assets applicable to Common shares consist of: | | | | | | | | | | |
| Common shares, $.01 par value per share | | $ | 392,918 | | $ | 294,576 | | $ | 403,875 | |
| Paid-in surplus | | | 550,768,797 | | | 420,274,997 | | | 575,669,056 | |
| Undistributed (Over-distribution of) net investment income | | | 10,503,735 | | | 5,571,360 | | | 10,037,019 | |
| Accumulated net realized gain (loss) | | | (4,951,346 | ) | | (6,881,226 | ) | | (2,495,660 | ) |
| Net unrealized appreciation (depreciation) | | | 20,180,664 | | | 15,504,708 | | | 11,798,654 | |
| Net assets applicable to Common shares | | $ | 576,894,768 | | $ | 434,764,415 | | $ | 595,412,944 | |
| Authorized shares: | | | | | | | | | | |
| Common | | | Unlimited | | | Unlimited | | | Unlimited | |
| Auction Rate Preferred | | | Unlimited | | | Unlimited | | | Unlimited | |
| MuniFund Term Preferred | | | Unlimited | | | — | | | — | |
| Variable Rate Demand Preferred | | | — | | | Unlimited | | | — | |
See accompanying notes to financial statements.
Nuveen Investments 83
| | | Statement of |
| | | Operations |
| | | Year Ended October 31, 2010 |
| | | Performance | | Municipal | | Market | | Dividend | | Dividend | | Dividend | |
| | | Plus | | Advantage | | Opportunity | | Advantage | | Advantage 2 | | Advantage 3 | |
| | | (NPP) | | (NMA) | | (NMO) | | (NAD) | | (NXZ) | | (NZF) | |
| Investment Income | | $ 72,056,112 | | $ 54,208,788 | | $56,140,788 | | $ 48,338,588 | | $ 37,271,671 | | $ 49,001,552 | |
| Expenses | | | | | | | | | | | | | |
| Management fees | | 8,282,805 | | 5,883,150 | | 6,139,059 | | 5,249,483 | | 3,864,345 | | 5,474,555 | |
| Auction fees | | 629,851 | | 373,984 | | 436,007 | | 273,142 | | 188,684 | | 355,426 | |
| Dividend disbursing agent fees | | 50,000 | | 27,370 | | 20,712 | | 30,000 | | — | | 30,000 | |
| Shareholders’ servicing agent fees and expenses | | 117,000 | | 74,378 | | 77,225 | | 10,564 | | 4,554 | | 6,005 | |
| Interest expense and amortization of offering costs | | 315,958 | | 1,300,418 | | 1,326,715 | | 3,028,798 | | 1,642,473 | | 537,601 | |
| Liquidity fees | | — | | 2,232,196 | | 2,141,422 | | — | | 1,638,402 | | — | |
| Custodian’s fees and expenses | | 222,499 | | 162,684 | | 173,905 | | 145,309 | | 106,581 | | 146,151 | |
| Directors’/Trustees’ fees and expenses | | 37,514 | | 26,280 | | 28,008 | | 26,601 | | 19,205 | | 26,442 | |
| Professional fees | | 157,088 | | 120,149 | | 190,558 | | 166,190 | | 143,853 | | 140,053 | |
| Shareholders’ reports – printing and mailing expenses | | 251,068 | | 130,026 | | 177,308 | | 123,140 | | 84,657 | | 114,125 | |
| Stock exchange listing fees | | 20,305 | | 14,711 | | 15,440 | | 13,314 | | 4,117 | | 5,648 | |
| Other expenses | | 20,974 | | 11,015 | | 12,729 | | 355 | | 11,180 | | 5,216 | |
| Total expenses before custodian fee | | | | | | | | | | | | | |
| credit and expense reimbursement | | 10,105,062 | | 10,356,361 | | 10,739,088 | | 9,066,896 | | 7,708,051 | | 6,841,222 | |
| Custodian fee credit | | (10,109 | ) | (13,030 | ) | (14,257 | ) | (9,552 | ) | (5,806 | ) | (5,521 | ) |
| Expense reimbursement | | — | | — | | — | | — | | (442,943 | ) | (857,879 | ) |
| Net expenses | | 10,094,953 | | 10,343,331 | | 10,724,831 | | 9,057,344 | | 7,259,302 | | 5,977,822 | |
| Net investment income | | 61,961,159 | | 43,865,457 | | 45,415,957 | | 39,281,244 | | 30,012,369 | | 43,023,730 | |
| Realized and Unrealized Gain (Loss) | | | | | | | | | | | | | |
| Net realized gain (loss) from investments | | 5,333,340 | | 2,499,059 | | 7,021,125 | | 1,079,125 | | 1,450,091 | | 786,636 | |
| Change in net unrealized appreciation (depreciation) of investments | | 36,406,331 | | 29,929,503 | | 18,357,610 | | 27,410,233 | | 6,351,263 | | 20,450,314 | |
| Net realized and unrealized gain (loss) | | 41,739,671 | | 32,428,562 | | 25,378,735 | | 28,489,358 | | 7,801,354 | | 21,236,950 | |
| Distributions to Auction Rate Preferred Shareholders | | | | | | | | | | | | | |
| From net investment income | | (1,674,198 | ) | (355,444 | ) | (606,064) | | (724,675 | ) | — | | (880,640 | ) |
| From accumulated net realized gains | | (47,490 | ) | (183,376 | ) | — | | — | | — | | (125,552 | ) |
| Decrease in net assets applicable to Common shares from distributions to Auction Rate Preferred shareholders | | (1,721,688 | ) | (538,820 | ) | (606,064 | ) | (724,675 | ) | — | | (1,006,192 | ) |
| Net increase (decrease) in net assets applicable to Common shares from operations | | $101,979,142 | | $75,755,199 | | $70,188,628 | | $67,045,927 | | $37,813,723 | | $63,254,488 | |
See accompanying notes to financial statements.
84 Nuveen Investments
| | | Statement of |
| | | Changes in Net Assets |
| | | Performance Plus (NPP) | | | Municipal Advantage (NMA) | | | Market Opportunity (NMO) | |
| | | Year | | | Year | | | Year | | | Year | | | Year | | | Year | |
| | | Ended | | | Ended | | | Ended | | | Ended | | | Ended | | | Ended | |
| | | 10/31/10 | | | 10/31/09 | | | 10/31/10 | | | 10/31/09 | | | 10/31/10 | | | 10/31/09 | |
| Operations | | | | | | | | | | | | | | | | | | |
| Net investment income | | $ | 61,961,159 | | | $ | 61,694,850 | | | $ | 43,865,457 | | | $ | 47,685,667 | | | $ | 45,415,957 | | | $ | 49,900,093 | |
| Net realized gain (loss) from: | | | | | | | | | | | | | | | | | | | | | | | | |
| Investments | | | 5,333,340 | | | | (3,345,387 | ) | | | 2,499,059 | | | | (953,244 | ) | | | 7,021,125 | | | | 2,387,779 | |
| Futures contracts | | | — | | | | — | | | | — | | | | — | | | | — | | | | — | |
| Change in net unrealized appreciation (depreciation) of: | | | | | | | | | | | | | | | | | | | | | | | | |
| Investments | | | 36,406,331 | | | | 101,733,867 | | | | 29,929,503 | | | | 77,128,841 | | | | 18,357,610 | | | | 49,202,041 | |
| Futures contracts | | | — | | | | — | | | | — | | | | — | | | | — | | | | — | |
| Distributions to Auction Rate | | | | | | | | | | | | | | | | | | | | | | | | |
| Preferred Shareholders: | | | | | | | | | | | | | | | | | | | | | | | | |
| From net investment income | | | (1,674,198 | ) | | | (3,512,067 | ) | | | (355,444 | ) | | | (2,612,721 | ) | | | (606,064 | ) | | | (2,842,583 | ) |
| From accumulated net realized gains | | | (47,490 | ) | | | — | | | | (183,376 | ) | | | — | | | | — | | | | — | |
| Net increase (decrease) in net assets applicable to Common shares from operations | | | 101,979,142 | | | | 156,571,263 | | | | 75,755,199 | | | | 121,248,543 | | | | 70,188,628 | | | | 98,647,330 | |
| Distributions to Common Shareholders | | | | | | | | | | | | | | | | | | | | | | | | |
| From net investment income | | | (55,177,839 | ) | | | (47,194,320 | ) | | | (42,290,819 | ) | | | (36,309,116 | ) | | | (43,873,378 | ) | | | (36,674,027 | ) |
| From accumulated net realized gains | | | (814,831 | ) | | | — | | | | (2,827,574 | ) | | | — | | | | — | | | | — | |
| Decrease in net assets applicable to Common shares from distributions to Common shareholders | | | (55,992,670 | ) | | | (47,194,320 | ) | | | (45,118,393 | ) | | | (36,309,116 | ) | | | (43,873,378 | ) | | | (36,674,027 | ) |
| Capital Share Transactions | | | | | | | | | | | | | | | | | | | | | | | | |
| Net proceeds from Common shares issued to shareholders due to reinvestment of distributions | | | 292,445 | | | | — | | | | 2,913,988 | | | | 271,443 | | | | 2,382,420 | | | | — | |
| Net increase (decrease) in net assets applicable to Common shares from capital share transactions | | | 292,445 | | | | — | | | | 2,913,988 | | | | 271,443 | | | | 2,382,420 | | | | — | |
| Net increase (decrease) in net assets applicable to Common shares | | | 46,278,917 | | | | 109,376,943 | | | | 33,550,794 | | | | 85,210,870 | | | | 28,697,670 | | | | 61,973,303 | |
| Net assets applicable to Common shares at the beginning of year | | | 869,872,712 | | | | 760,495,769 | | | | 608,813,165 | | | | 523,602,295 | | | | 619,318,916 | | | | 557,345,613 | |
| Net assets applicable to Common shares at the end of year | | $ | 916,151,629 | | | $ | 869,872,712 | | | $ | 642,363,959 | | | $ | 608,813,165 | | | $ | 648,016,586 | | | $ | 619,318,916 | |
| Undistributed (Over-distribution of) net investment income at the end of year | | $ | 16,554,168 | | | $ | 11,740,346 | | | $ | 10,244,572 | | | $ | 8,985,143 | | | $ | 9,994,354 | | | $ | 9,176,487 | |
See accompanying notes to financial statements.
Nuveen Investments 85
| | | Statement of |
| | | Changes in Net Assets (continued) |
| | | Dividend Advantage (NAD) | | | Dividend Advantage 2 (NXZ) | | | Dividend Advantage 3 (NZF) | |
| | | Year | | | Year | | | Year | | | Year | | | Year | | | Year | |
| | | Ended | | | Ended | | | Ended | | | Ended | | | Ended | | | Ended | |
| | | 10/31/10 | | | 10/31/09 | | | 10/31/10 | | | 10/31/09 | | | 10/31/10 | | | 10/31/09 | |
| Operations | | | | | | | | | | | | | | | | | | |
| Net investment income | | $ | 39,281,244 | | | $ | 42,070,572 | | | $ | 30,012,369 | | | $ | 30,653,112 | | | $ | 43,023,730 | | | $ | 43,429,444 | |
| Net realized gain (loss) from: | | | | | | | | | | | | | | | | | | | | | | | | |
| Investments | | | 1,079,125 | | | | (762,348 | ) | | | 1,450,091 | | | | (3,563,781 | ) | | | 786,636 | | | | (520,239 | ) |
| Futures contracts | | | — | | | | — | | | | — | | | | — | | | | — | | | | 1,331,299 | |
| Change in net unrealized appreciation (depreciation) of: | | | | | | | | | | | | | | | | | | | | | | | | |
| Investments | | | 27,410,233 | | | | 76,279,407 | | | | 6,351,263 | | | | 50,177,046 | | | | 20,450,314 | | | | 76,051,358 | |
| Futures contracts | | | — | | | | — | | | | — | | | | — | | | | — | | | | 679,241 | |
| Distributions to Auction Rate Preferred Shareholders: | | | | | | | | | | | | | | | | | | | | | | | | |
| From net investment income | | | (724,675 | ) | | | (2,117,175 | ) | | | — | | | | — | | | | (880,640 | ) | | | (2,094,400 | ) |
| From accumulated net realized gains | | | — | | | | — | | | | — | | | | — | | | | (125,552 | ) | | | — | |
| Net increase (decrease) in net assets applicable to Common shares from operations | | | 67,045,927 | | | | 115,470,456 | | | | 37,813,723 | | | | 77,266,377 | | | | 63,254,488 | | | | 118,876,703 | |
| Distributions to Common Shareholders | | | | | | | | | | | | | | | | | | | | | | | | |
| From net investment income | | | (35,752,124 | ) | | | (32,490,598 | ) | | | (28,615,006 | ) | | | (26,078,788 | ) | | | (38,518,652 | ) | | | (34,349,713 | ) |
| From accumulated net realized gains | | | — | | | | — | | | | — | | | | — | | | | (2,547,863 | ) | | | — | |
| Decrease in net assets applicable to Common shares from distributions to Common shareholders | | | (35,752,124 | ) | | | (32,490,598 | ) | | | (28,615,006 | ) | | | (26,078,788 | ) | | | (41,066,515 | ) | | | (34,349,713 | ) |
| Capital Share Transactions | | | | | | | | | | | | | | | | | | | | | | | | |
| Net proceeds from Common shares issued to shareholders due to reinvestment of distributions | | | 66,815 | | | | — | | | | 312,251 | | | | 126,288 | | | | 137,143 | | | | — | |
| Net increase (decrease) in net assets applicable to Common shares from capital share transactions | | | 66,815 | | | | — | | | | 312,251 | | | | 126,288 | | | | 137,143 | | | | — | |
| Net increase (decrease) in net assets applicable to Common shares | | | 31,360,618 | | | | 82,979,858 | | | | 9,510,968 | | | | 51,313,877 | | | | 22,325,116 | | | | 84,526,990 | |
| Net assets applicable to Common shares at the beginning of year | | | 545,534,150 | | | | 462,554,292 | | | | 425,253,447 | | | | 373,939,570 | | | | 573,087,828 | | | | 488,560,838 | |
| Net assets applicable to Common shares at the end of year | | $ | 576,894,768 | | | $ | 545,534,150 | | | $ | 434,764,415 | | | $ | 425,253,447 | | | $ | 595,412,944 | | | $ | 573,087,828 | |
| Undistributed (Over-distribution of)net investment income at the end of year | | $ | 10,503,735 | | | $ | 7,380,865 | | | $ | 5,571,360 | | | $ | 3,538,442 | | | $ | 10,037,019 | | | $ | 6,415,652 | |
See accompanying notes to financial statements.
86 Nuveen Investments
| | | Statement of |
| | | Cash Flows |
| | | Year Ended October 31, 2010 |
| | | Municipal | | Market | | Dividend | |
| | | Advantage | | Opportunity | | Advantage | |
| | | (NMA | ) | (NMO | ) | (NAD | ) |
| Cash Flows from Operating Activities: | | | | | | | | | | |
| Net Increase (Decrease) In Net Assets Applicable to Common Shares from Operations | | $ | 75,755,199 | | $ | 70,188,628 | | $ | 67,045,927 | |
| Adjustments to reconcile the net increase (decrease) in net assets applicable to Common shares from operations to net cash provided by (used in) operating activities: | | | | | | | | | | |
| Purchases of investments | | | (150,166,786 | ) | | (259,440,032 | ) | | (69,300,881 | ) |
| Proceeds from sales and maturities of investments | | | 152,362,425 | | | 305,137,227 | | | 72,921,700 | |
| Proceeds from (Purchases of) short-term investments, net | | | — | | | — | | | — | |
| Amortization (Accretion) of premiums and discounts, net | | | (6,074,440 | ) | | (8,974,047 | ) | | (7,913,593 | ) |
| (Increase) Decrease in receivable for dividends and interest | | | 251,621 | | | (493,296 | ) | | 314,622 | |
| (Increase) Decrease in receivable for investments sold | | | 26,737,250 | | | (40,760,100 | ) | | 3,013,175 | |
| (Increase) Decrease in other assets | | | (218,643 | ) | | (155,001 | ) | | (25,105 | ) |
| Increase (Decrease) in payable for investments purchased | | | (19,528,605 | ) | | (5,743,331 | ) | | (1,415,816 | ) |
| Increase (Decrease) in payable for Auction Rate Preferred share dividends | | | (14,566 | ) | | (18,882 | ) | | 7,703 | |
| Increase (Decrease) in payable for interest | | | — | | | — | | | 324,675 | |
| Increase (Decrease) in accrued management fees | | | (35,630 | ) | | (63,324 | ) | | 8,646 | |
| Increase (Decrease) in accrued other liabilities | | | (6,636 | ) | | 26,908 | | | (5,077 | ) |
| Net realized (gain) loss from investments | | | (2,499,059 | ) | | (7,021,125 | ) | | (1,079,125 | ) |
| Change in net unrealized (appreciation) depreciation of investments | | | (29,929,503 | ) | | (18,357,610 | ) | | (27,410,233 | ) |
| Taxes paid on undistributed capital gains | | | — | | | (100 | ) | | (493 | ) |
| Net cash provided by (used in) operating activities | | | 46,632,627 | | | 34,325,915 | | | 36,486,125 | |
| Cash Flows from Financing Activities: | | | | | | | | | | |
| Increase (Decrease) in cash overdraft balance | | | — | | | 9,292,196 | | | (1,490,502 | ) |
| Cash distributions paid to Common shareholders | | | (41,925,387 | ) | | (41,155,298 | ) | | (35,594,830 | ) |
| Increase (Decrease) in floating rate obligations | | | — | | | (5,215,000 | ) | | — | |
| (Increase) Decrease in deferred offering costs | | | (2,089,923 | ) | | (4,131,100 | ) | | (2,240,083 | ) |
| Increase (Decrease) in payable for offering costs | | | 243,294 | | | 393,751 | | | 264,290 | |
| Increase (Decrease) in Auction Rate Preferred shares, at liquidation value | | | (293,200,000 | ) | | (346,675,000 | ) | | (141,725,000 | ) |
| Increase (Decrease) in MuniFund Term Preferred shares, at liquidation value | | | — | | | — | | | 144,300,000 | |
| Increase (Decrease) in Variable Rate Demand Preferred shares, at liquidation value | | | 296,800,000 | | | 350,900,000 | | | — | |
| Net cash provided by (used in) financing activities | | | (40,172,016 | ) | | (36,590,451 | ) | | (36,486,125 | ) |
| Net Increase (Decrease) in Cash | | | 6,460,611 | | | (2,264,536 | ) | | — | |
| Cash at the beginning of year | | | 326,405 | | | 2,264,536 | | | — | |
| Cash at the End of Year | | $ | 6,787,016 | | $ | — | | $ | — | |
Supplemental Disclosure of Cash Flow Information
| | | Municipal | | Market | | Dividend | |
| | | Advantage | | Opportunity | | Advantage | |
| | | (NMA | ) | (NMO | ) | (NAD | ) |
| Cash paid for interest (excluding amortization of offering costs, where applicable) | | $ | 1,256,341 | | $ | 1,243,815 | | $ | 2,384,206 | |
Non-cash financing activities not included herein consist of reinvestments of Common share distributions of $2,913,988, $2,382,420 and $66,815 for Municipal Advantage (NMA), Market Opportunity (NMO) and Dividend Advantage (NAD), respectively.
See accompanying notes to financial statements.
Nuveen Investments 87
| | | Statement of |
| | | Cash Flows (continued) |
| | | Year Ended October 31, 2010 |
| | | | Dividend | | | Dividend | |
| | | | Advantage 2 | | | Advantage 3 | |
| | | | (NXZ | ) | | (NZF | ) |
| Cash Flows from Operating Activities: | | | | | | | |
| Net Increase (Decrease) In Net Assets Applicable to Common Shares from Operations | | $ | 37,813,723 | | $ | 63,254,488 | |
Adjustments to reconcile the net increase (decrease) in net assets applicable to Common shares from operations to net
cash provided by (used in) operating activities: | | | | | | | |
| Purchases of investments | | | (31,487,822 | ) | | (64,703,549 | ) |
| Proceeds from sales and maturities of investments | | | 40,774,558 | | | 67,723,269 | |
| Proceeds from (Purchases of) short-term investments, net | | | — | | | 2,325,000 | |
| Amortization (Accretion) of premiums and discounts, net | | | (3,298,792 | ) | | (238,941 | ) |
| (Increase) Decrease in receivable for dividends and interest | | | 125,468 | | | 364,157 | |
| (Increase) Decrease in receivable for investments sold | | | (8,110,000 | ) | | 818,675 | |
| (Increase) Decrease in other assets | | | (188,292 | ) | | (16,369 | ) |
| Increase (Decrease) in payable for investments purchased | | | — | | | (11,359 | ) |
| Increase (Decrease) in payable for Auction Rate Preferred share dividends | | | — | | | 3,070 | |
| Increase (Decrease) in payable for interest | | | — | | | — | |
| Increase (Decrease) in accrued management fees | | | 22,387 | | | 37,305 | |
| Increase (Decrease) in accrued other liabilities | | | 78,689 | | | (15,507 | ) |
| Net realized (gain) loss from investments | | | (1,450,091 | ) | | (786,636 | ) |
| Change in net unrealized (appreciation) depreciation of investments | | | (6,351,263 | ) | | (20,450,314 | ) |
| Taxes paid on undistributed capital gains | | | (3,975 | ) | | — | |
| Net cash provided by (used in) operating activities | | | 27,924,590 | | | 48,303,289 | |
| Cash Flows from Financing Activities: | | | | | | | |
| Increase (Decrease) in cash overdraft balance | | | — | | | — | |
| Cash distributions paid to Common shareholders | | | (28,241,618 | ) | | (40,629,011 | ) |
| Increase (Decrease) in floating rate obligations | | | — | | | (7,500,000 | ) |
| (Increase) Decrease in deferred offering costs | | | 72,412 | | | — | |
| Increase (Decrease) in payable for offering costs | | | 108,461 | | | — | |
| Increase (Decrease) in Auction Rate Preferred shares, at liquidation value | | | — | | | — | |
| Increase (Decrease) in MuniFund Term Preferred shares, at liquidation value | | | — | | | — | |
| Increase (Decrease) in Variable Rate Demand Preferred shares, at liquidation value | | | — | | | — | |
| Net cash provided by (used in) financing activities | | | (28,060,745 | ) | | (48,129,011 | ) |
| Net Increase (Decrease) in Cash | | | (136,155 | ) | | 174,278 | |
| Cash at the beginning of year | | | 279,403 | | | 2,693,790 | |
Cash at the End of Year | | $ | 143,248 | | $ | 2,868,068 | |
Supplemental Disclosure of Cash Flow Information
| | | | Dividend | | | Dividend | |
| | | | Advantage 2 | | | Advantage 3 | |
| | | | (NXZ | ) | | (NZF | ) |
| Cash paid for interest (excluding amortization of offering costs, where applicable) | | $ | 913,613 | | $ | 537,601 | |
Non-cash financing activities not included herein consist of reinvestments of Common share distributions of $312,251 and $137,143 for Dividend Advantage 2 (NXZ)and Dividend Advantage 3 (NZF), respectively.
See accompanying notes to financial statements.
88 Nuveen Investments
| | | Notes to |
| | | Financial Statements |
1. General Information and Significant Accounting Policies
The funds covered in this report and their corresponding Common share stock exchange symbols are Nuveen Performance Plus Municipal Fund, Inc. (NPP), Nuveen Municipal Advantage Fund, Inc. (NMA), Nuveen Municipal Market Opportunity Fund, Inc. (NMO), Nuveen Dividend Advantage Municipal Fund (NAD), Nuveen Dividend Advantage Municipal Fund 2 (NXZ) and Nuveen Dividend Advantage Municipal Fund 3 (NZF) (collectively, the “Funds”). Performance Plus (NPP), Municipal Advantage (NMA), Market Opportunity (NMO) and Dividend Advantage (NAD) are traded on the New York Stock Exchange (“NYSE”) while Dividend Advantage 2 (NXZ) and Dividend Advantage 3 (NZF) are traded on the NYSE Amex. The Funds are registered under the Investment Company Act of 1940, as amended, as closed-end, management investment companies.
Each Fund seeks to provide current income exempt from regular federal income tax by investing primarily in a portfolio of municipal obligations issued by state and local government authorities or certain U.S. territories.
The following is a summary of significant accounting policies followed by the Funds in the preparation of their financial statements in accordance with U.S. generally accepted accounting principles (“U.S. GAAP”).
Investment Valuation
Common stocks and other equity-type securities are valued at the last sales price on the securities exchange on which such securities are primarily traded and are generally classified as Level 1. Securities primarily traded on the NASDAQ National Market (“NASDAQ”) are valued, except as indicated below, at the NASDAQ Official Closing Price and are generally classified as Level 1. However, securities traded on a securities exchange or NASDAQ for which there were no transactions on a given day or securities not listed on a securities exchange or NASDAQ are valued at the mean between the quoted bid and ask prices.
Prices of municipal bonds are provided by a pricing service approved by the Funds’ Board of Directors/Trustees. These securities are generally classified as Level 2. When price quotes are not readily available (which is usually the case for municipal bonds) the pricing service establishes a security’s fair value using methods that may include consideration of the following: yields or prices of investments of comparable quality, type of issue, coupon, maturity and rating, market quotes or indications of value from security dealers, evaluations of anticipated cash flows or collateral, general market conditions and other information and analysis, including the obligor’s credit characteristics considered relevant. In pricing certain securities, particularly less liquid and lower quality securities, the pricing service may consider information about a security, its issuer, or market activity, provided by Nuveen Asset Management (the “Adviser”), a wholly-owned subsidiary of Nuveen Investments, Inc. (“Nuveen”). These securities are generally classified as Level 2 or Level 3 depending on the priority of the significant inputs.
Futures contracts are valued using the closing settlement price or, in the absence of such a price, at the mean of the bid and ask prices. Futures contracts are generally classified as Level 1.
Temporary investments in securities that have variable rate and demand features qualifying them as short-term investments are valued at amortized cost, which approximates market value. These securities are generally classified as Level 1 or Level 2, which is usually the case for municipal bonds.
Certain securities may not be able to be priced by the pre-established pricing methods as described above. Such securities may be valued by the Funds’ Board of Directors/Trustees or its designee at fair value. These securities generally include, but are not limited to, restricted securities (securities which may not be publicly sold without registration under the Securities Act of 1933, as amended) for which a pricing service is unable to provide a market price; debt securities whose trading has been formally suspended; debt securities that have gone into default and for which there is no current market quotation; a security whose market price is not available from a pre-established pricing source; a security with respect to which an event has occurred that is likely to materially affect the value of the security after the market has closed but before th e calculation of a Fund’s net asset value (as may be the case in non-U.S. markets on which the security is primarily traded) or make it difficult or impossible to obtain a reliable market quotation; and a security whose price, as provided by the pricing service, is not deemed to reflect the security’s fair value. As a general principle, the fair value of a security would appear to be the amount that the owner might reasonably expect to receive for it in a current sale. A variety of factors may be considered in determining the fair value of such securities, which may include consideration of the following: yields or prices of investments of comparable quality, type of issue, coupon, maturity and rating, market quotes or indications of value from security dealers, evaluations of anticipated cash flows or collateral, general market conditions and other information and analysis, including the obligor’s credit characteristics considered relevant. These securities are generally classified as Leve l 2 or Level 3 depending on the priority of the significant inputs. Regardless of the method employed to value a particular security, all valuations are subject to review by the Funds’ Board of Directors/Trustees or its designee.
Refer to Footnote 2 – Fair Value Measurements for further details on the leveling of securities held by the Funds as of the end of the reporting period.
Nuveen Investments 89
| | | Notes to |
| | | Financial Statements (continued) |
Investment Transactions
Investment transactions are recorded on a trade date basis. Realized gains and losses from transactions are determined on the specific identification method. Investments purchased on a when-issued/delayed delivery basis may have extended settlement periods. Any investments so purchased are subject to market fluctuation during this period. The Funds have instructed the custodian to segregate assets with a current value at least equal to the amount of the when-issued/delayed delivery purchase commitments. At October 31, 2010, Market Opportunity (NMO) and Dividend Advantage (NAD) had outstanding when-issued/delayed delivery purchase commitments of $9,755,260 and $5,859,060, respectively. There were no such outstanding purchase commitments in any of the other Funds.
Investment Income
Dividend income is recorded on the ex-dividend date. Dividend income is recorded on the ex-dividend date or when information is available. Interest income, which includes the amortization of premiums and includes accretion of discounts for financial reporting purposes, is recorded on an accrual basis. Investment income also reflects paydown gains and losses, if any.
Professional Fees
Professional fees presented on the Statement of Operations consist of legal fees incurred in the normal course of operations, audit fees, tax consulting fees and, in some cases, workout expenditures. Workout expenditures are incurred in an attempt to protect or enhance an investment, or to pursue other claims or legal actions on behalf of Fund shareholders.
Income Taxes
Each Fund is a separate taxpayer for federal income tax purposes. Each Fund intends to distribute substantially all of its net investment income and net capital gains to shareholders and to otherwise comply with the requirements of Subchapter M of the Internal Revenue Code applicable to regulated investment companies. Therefore, no federal income tax provision is required. Furthermore, each Fund intends to satisfy conditions that will enable interest from municipal securities, which is exempt from regular federal income tax, to retain such tax-exempt status when distributed to shareholders of the Funds. Net realized capital gains and ordinary income distributions paid by the Funds are subject to federal taxation.
For all open tax years and all major taxing jurisdictions, management of the Funds has concluded that there are no significant uncertain tax positions that would require recognition in the financial statements. Open tax years are those that are open for examination by taxing authorities (i.e., generally the last four tax year ends and the interim tax period since then). Furthermore, management of the Funds is also not aware of any tax positions for which it is reasonably possible that the total amounts of unrecognized tax benefits will significantly change in the next twelve months.
Dividends and Distributions to Common Shareholders
Dividends from tax-exempt net investment income are declared monthly. Net realized capital gains and/or market discount from investment transactions, if any, are distributed to shareholders at least annually. Furthermore, capital gains are distributed only to the extent they exceed available capital loss carryforwards.
Distributions to Common shareholders of tax-exempt net investment income, net realized capital gains and/or market discount, if any, are recorded on the ex-dividend date. The amount and timing of distributions are determined in accordance with federal income tax regulations, which may differ from U.S. GAAP.
Auction Rate Preferred Shares
Each Fund is authorized to issue Auction Rate Preferred Shares (“ARPS”). The following Funds have issued and outstanding ARPS, $25,000 stated value per share, which approximates market value, as a means of effecting financial leverage. Each Fund’s ARPS are issued in more than one Series. The dividend rate paid by the Funds on each Series is determined every seven days, pursuant to a dutch auction process overseen by the auction agent, and is payable at the end of each rate period. As of October 31, 2010, the number of ARPS outstanding, by Series and in total, for each Fund is as follows:
| | | Performance | | Dividend | | Dividend | |
| | | Plus | | Advantage | | Advantage 3 | |
| | | (NPP | ) | (NAD | ) | (NZF | ) |
| Number of shares: | | | | | | | |
| Series M | | 3,507 | | 1,628 | | — | |
| Series T | | 3,506 | | 1,628 | | — | |
| Series W | | 3,505 | | — | | 3,159 | |
| Series TH | | 2,770 | | 1,547 | | 3,159 | |
| Series F | | 3,508 | | — | | 3,160 | |
| Total | | 16,796 | | 4,803 | | 9,478 | |
90 Nuveen Investments
Beginning in February 2008, more shares for sale were submitted in the regularly scheduled auctions for the ARPS issued by the Funds than there were offers to buy. This meant that these auctions “failed to clear,’’ and that many ARPS shareholders who wanted to sell their shares in these auctions were unable to do so. ARPS shareholders unable to sell their shares received distributions at the “maximum rate’’ applicable to failed auctions as calculated in accordance with the pre-established terms of the ARPS. As of October 31, 2010, the aggregate amount of outstanding ARPS redeemed by each Fund is as follows:
| | | | | | | | | | | | | | | | | | | | |
| | | Performance | | Municipal | | Market | | Dividend | | Dividend | | Dividend | |
| | | Plus | | Advantage | | Opportunity | | Advantage | | Advantage 2 | | Advantage 3 | |
| | | (NPP | ) | (NMA | ) | (NMO | ) | (NAD | ) | (NXZ | ) | (NZF | ) |
| ARPS redeemed, at liquidation value | | $ | 59,100,000 | | $ | 358,000,000 | | $ | 380,000,000 | | $ | 174,925,000 | | $ | 222,000,000 | | $ | 75,050,000 | |
During the fiscal year ended October 31, 2010, lawsuits pursuing claims made in the demand letter alleging that Dividend Advantage (NAD), Dividend Advantage 2 (NXZ) and Dividend Advantage 3’s (NZF) Board of Trustees breached their fiduciary duties related to the redemption at par of their ARPS had been filed on behalf of shareholders of Dividend Advantage (NAD), Dividend Advantage 2 (NXZ) and Dividend Advantage 3 (NZF), against the Adviser, the Nuveen holding company, the majority owner of the holding company, the lone interested trustee, and current and former officers of Dividend Advantage (NAD), Dividend Advantage 2 (NXZ) and Dividend Advantage 3 (NZF). Nuveen and the other named defendants believe these lawsuits to be without merit, and all named parties intend to defend themselves vigorously. Dividend Advantage (NAD), Dividend Advantage 2 (NXZ) and Divid end Advantage 3 (NZF) believe that these lawsuits will not have a material effect on them or on the Adviser’s ability to serve as investment adviser to them.
MuniFund Term Preferred Shares
Dividend Advantage (NAD) has issued and outstanding $144,300,000, of 2.70%, Series 2015 MuniFund Term Preferred (“MTP”) Shares, with a $10 stated value per share. Proceeds from the issuance of MTP Shares, net of offering expenses, were used to redeem a portion of the Fund’s outstanding ARPS. The Fund’s MTP Shares are issued in one Series. Dividends, which are recognized as interest expense for financial reporting purposes, are paid monthly at a fixed annual rate of 2.70%, subject to adjustment in certain circumstances.
The Fund is obligated to redeem its MTP Shares on April 1, 2015, unless earlier redeemed or repurchased by the Fund. MTP Shares are subject to optional and mandatory redemption in certain circumstances. As of April 1, 2011, the MTP Shares will be subject to redemption at the option of the Fund, subject to payment of a premium until March 31, 2012, and at par thereafter. The MTP Shares also will be subject to redemption, at the option of the Fund, at par in the event of certain changes in the credit rating of the MTP Shares. The Fund may be obligated to redeem certain of the MTP Shares if the Fund fails to maintain certain asset coverage and leverage ratio requirements and such failures are not cured by the applicable cure date. The redemption price per share is equal to the sum of the liquidation value per share plus any accumulated but unpaid dividends. The MTP Sh ares trade on NYSE under the symbol “NAD Pr C.”
During the period from March 16, 2010 (issuance date of shares) through October 31, 2010, Dividend Advantage (NAD) had an average balance of $144,156,522 MTP Shares outstanding.
For financial reporting purposes only, the liquidation value of MTP Shares is recorded as a liability on the Statement of Assets and Liabilities. Unpaid dividends on MTP Shares are recognized as “Interest payable” on the Statement of Assets and Liabilities. Dividends paid on MTP Shares are recognized as a component of “Interest expense and amortization of offering costs” on the Statement of Operations.
Net amounts earned by Nuveen as underwriter of the Fund’s MTP Share offering are recorded as reductions of offering costs recognized by the Fund. During the fiscal year ended October 31, 2010, there were no amounts earned by Dividend Advantage (NAD).
Variable Rate Demand Preferred Shares
The following funds have issued and outstanding Variable Rate Demand Preferred (“VRDP”) Shares, with a $100,000 liquidation value per share. Municipal Advantage (NMA), Market Opportunity (NMO) and Dividend Advantage 2 (NXZ) issued their VRDP Shares in a privately negotiated offering during March 2010, March 2010 and August 2008, respectively. Concurrent with renewing agreements with the liquidity provider for its VRDP Shares in June 2010, Dividend Advantage 2 (NXZ) exchanged all of its 1,960 Series 1 VRDP Shares for 1,960 Series 2 VRDP Shares. The principal difference in terms between Series 1 and Series 2 VRDP Shares in Dividend Advantage 2 (NXZ) is the requirement that the Fund redeem VRDP Shares owned by the liquidity provider if the VRDP Shares have been owned by the liquidity provider through six months of continuous, unsuccessful remarketing. Proc eeds of each Fund’s offering were used to redeem all, or a portion of, each Fund’s outstanding ARPS. The VRDP Shares were offered to qualified institutional buyers pursuant to Rule 144A under the Securities Act of 1933. As of October 31, 2010, the number of VRDP Shares outstanding and maturity date for each Fund are as follows:
| | | | | | | | |
| | | Municipal | | Market | | Dividend | |
| | | Advantage | | Opportunity | | Advantage 2 | |
| | | (NMA | ) | (NMO | ) | (NXZ | ) |
| Series | | 1 | | 1 | | 2 | |
| Shares outstanding | | 2,968 | | 3,509 | | 1,960 | |
| Maturity | | March 1, 2040 | | March 1, 2040 | | August 1, 2040 | |
Nuveen Investments 91
| | | Notes to |
| | | Financial Statements (continued) |
VRDP Shares include a liquidity feature that allows VRDP shareholders to have their shares purchased by a liquidity provider with whom each Fund has contracted in the event that purchase orders for VRDP Shares in a remarketing are not sufficient in number to be matched with the sale orders in that remarketing. Each Fund is required to redeem any VRDP Shares that are still owned by the liquidity provider after six months of continuous, unsuccessful remarketing.
Dividends on the VRDP Shares (which are treated as interest payments for financial reporting purposes) are set weekly at a rate established by a remarketing agent; therefore, the market value of the VRDP Shares is expected to approximate its liquidation value. If remarketings for VRDP Shares are continuously unsuccessful for six months, the maximum rate is designed to escalate according to a specified schedule in order to enhance the remarketing agent’s ability to successfully remarket the VRDP Shares.
Subject to certain conditions, VRDP Shares may be redeemed, in whole or in part, at any time at the option of each Fund. Each Fund may also redeem certain of the VRDP Shares if the Fund fails to maintain certain asset coverage requirements and such failures are not cured by the applicable cure date. The redemption price per share is equal to the sum of the liquidation value per share plus any accumulated but unpaid dividends.
The average liquidation value outstanding and annualized dividend rate of VRDP Shares for each Fund during the fiscal year ended October 31, 2010, were as follows:
| | | | | | | | | | | |
| | | Municipal | * | Market | ** | Dividend | |
| | | Advantage | | Opportunity | | Advantage 2 | |
| | | (NMA | ) | (NMO | ) | (NXZ | ) |
| Average liquidation value outstanding | | $ | 296,800,000 | | $ | 350,900,000 | | $ | 196,000,000 | |
| Annualized dividend rate | | | 0.43 | % | | 0.46 | % | | 0.37 | % |
| * | For the period March 18, 2010 (issuance date of shares) through October 31, 2010. |
| ** | For the period March 31, 2010 (issuance date of shares) through October 31, 2010. |
For financial reporting purposes only, the liquidation value of VRDP Shares is recognized as a liability on the Statement of Assets and Liabilities. Unpaid dividends on VRDP Shares are recognized as a component of “Interest payable” on the Statement of Assets and Liabilities. Dividends paid on the VRDP Shares are recognized as a component of “Interest expense and amortization of offering costs” on the Statement of Operations. In addition to interest expense, each Fund also pays a per annum liquidity fee to the liquidity provider, which is recognized as “Liquidity fees” on the Statement of Operations.
Inverse Floating Rate Securities
Each Fund is authorized to invest in inverse floating rate securities. An inverse floating rate security is created by depositing a municipal bond, typically with a fixed interest rate, into a special purpose trust created by a broker-dealer. In turn, this trust (a) issues floating rate certificates, in face amounts equal to some fraction of the deposited bond’s par amount or market value, that typically pay short-term tax-exempt interest rates to third parties, and (b) issues to a long-term investor (such as one of the Funds) an inverse floating rate certificate (sometimes referred to as an “inverse floater”) that represents all remaining or residual interest in the trust. The income received by the inverse floater holder varies inversely with the short-term rate paid to the floating rate certificates’ holders, and in most circumstances the inverse floater holder bears substantially all of the underlying bond’s downside investment risk and also benefits disproportionately from any potential appreciation of the underlying bond’s value. The price of an inverse floating rate security will be more volatile than that of the underlying bond because the interest rate is dependent on not only the fixed coupon rate of the underlying bond but also on the short-term interest paid on the floating rate certificates, and because the inverse floating rate security essentially bears the risk of loss of the greater face value of the underlying bond.
A Fund may purchase an inverse floating rate security in a secondary market transaction without first owning the underlying bond (referred to as an “externally-deposited inverse floater”), or instead by first selling a fixed-rate bond to a broker-dealer for deposit into the special purpose trust and receiving in turn the residual interest in the trust (referred to as a “self-deposited inverse floater”). The inverse floater held by a Fund gives the Fund the right (a) to cause the holders of the floating rate certificates to tender their notes at par, and (b) to have the broker transfer the fixed-rate bond held by the trust to the Fund, thereby collapsing the trust. An investment in an externally-deposited inverse floater is identified in the Portfolio of Investments as “(IF) – Inverse floating rate investment.” An investment in a self-deposited inverse floater is accounted for as a financing transaction. In such instances, a fixed-rate bond deposited into a special purpose trust is identified in the Portfolio of Investments as “(UB) – Underlying bond of an inverse floating rate trust reflected as a financing transaction,” with the Fund accounting for the short-term floating rate certificates issued by the trust as “Floating rate obligations” on the Statement of Assets and Liabilities. In addition, the Fund reflects in “Investment Income” the entire earnings of the underlying bond and recognizes the related interest paid to the holders of the short-term floating rate certificates as a component of “Interest expense and amortization of offering costs” on the Statement of Operations.
During the fiscal year ended October 31, 2010, each Fund invested in externally-deposited inverse floaters and/or self-deposited inverse floaters.
Each Fund may also enter into shortfall and forbearance agreements (sometimes referred to as a “recourse trust” or “credit recovery swap”) (such agreements referred to herein as “Recourse Trusts”) with a broker-dealer by which a Fund agrees to reimburse the broker-dealer, in certain circumstances, for the difference between the liquidation value of the fixed-rate bond held by the trust and the liquidation value of the floating rate
92 Nuveen Investments
certificates issued by the trust plus any shortfalls in interest cash flows. Under these agreements, a Fund’s potential exposure to losses related to or on inverse floaters may increase beyond the value of a Fund’s inverse floater investments as a Fund may potentially be liable to fulfill all amounts owed to holders of the floating rate certificates. At period end, any such shortfall is recognized as “Unrealized depreciation on Recourse Trusts” on the Statement of Assets and Liabilities.
At October 31, 2010, each Fund’s maximum exposure to externally-deposited Recourse Trusts is as follows:
| | | Performance | | Municipal | | Market | | | Dividend | | Dividend | | Dividend | |
| | | Plus | | Advantage | | Opportunity | | Advantage | | Advantage 2 | | Advantage 3 | |
| | | (NPP | ) | (NMA | ) | (NMO | ) | (NAD | ) | (NXZ | ) | (NZF | ) |
| Maximum exposure to Recourse Trusts | | $ | 18,750,000 | | $ | 11,250,000 | | $ | 7,500,000 | | $ | 11,250,000 | | $ | 11,250,000 | | $ | — | |
The average floating rate obligations outstanding and average annual interest rate and fees related to self-deposited inverse floaters during the fiscal year ended October 31, 2010, were as follows:
| | | | | | | | | | | | | | | | | | | | |
| | | Performance | | Municipal | | Market | | Dividend | | Dividend | | Dividend | |
| | | Plus | | Advantage | | Opportunity | | Advantage | | Advantage 2 | | Advantage 3 | |
| | | (NPP | ) | (NMA | ) | (NMO | ) | (NAD | ) | (NXZ | ) | (NZF | ) |
| Average floating rate obligations outstanding | | $ | 42,682,589 | | $ | 67,694,983 | | $ | 47,616,274 | | $ | 51,605,000 | | $ | 26,661,650 | | $ | 75,682,623 | |
| Average annual interest rate and fees | | | 0.74 | % | | 0.66 | % | | 0.63 | % | | 0.54 | % | | 0.70 | % | | 0.71 | % |
Futures Contracts
Each Fund is authorized to invest in futures contracts. Upon entering into a futures contract, a Fund is required to deposit with the broker an amount of cash or liquid securities equal to a specified percentage of the contract amount. This is known as the “initial margin.” Cash held by the broker to cover initial margin requirements on open futures contracts, if any, is recognized as “Deposits with brokers for open futures contracts” on the Statement of Assets and Liabilities. Subsequent payments (“variation margin”) are made or received by a Fund each day, depending on the daily fluctuation of the value of the contract. Variation margin is recognized as a receivable or payable for “Variation margin on futures contracts” on the Statement of Assets and Liabilities, when applicable.
During the period the futures contract is open, changes in the value of the contract are recorded as an unrealized gain or loss by “marking-to-market” on a daily basis to reflect the changes in market value of the contract and is recognized as a component of “Change in net unrealized appreciation (depreciation) of futures contracts” on the Statement of Operations. When the contract is closed or expired, a Fund records a realized gain or loss equal to the difference between the value of the contract on the closing date and value of the contract when originally entered into, which is recognized as a component of “Net realized gain (loss) from futures contracts” on the Statement of Operations.
Risks of investments in futures contracts include the possible adverse movement in the price of the securities or indices underlying the contracts, the possibility that there may not be a liquid secondary market for the contracts and/or that a change in the value of the contract may not correlate with a change in the value of the underlying securities or indices. The Funds did not enter into futures contracts during the fiscal year ended October 31, 2010.
Market and Counterparty Credit Risk
In the normal course of business each Fund may invest in financial instruments and enter into financial transactions where risk of potential loss exists due to changes in the market (market risk) or failure of the other party to the transaction to perform (counterparty credit risk). The potential loss could exceed the value of the financial assets recorded on the financial statements. Financial assets, which potentially expose each Fund to counterparty credit risk, consist principally of cash due from counterparties on forward, option and swap transactions, when applicable. The extent of each Fund’s exposure to counterparty credit risk in respect to these financial assets approximates their carrying value as recorded on the Statement of Assets and Liabilities. Futures contracts, when applicable, expose a Fund to minimal counterparty credit risk as they are ex change traded and the exchange’s clearinghouse, which is counterparty to all exchange traded futures, guarantees the futures contracts against default.
Each Fund helps manage counterparty credit risk by entering into agreements only with counterparties the Adviser believes have the financial resources to honor their obligations and by having the Adviser monitor the financial stability of the counterparties. Additionally, counterparties may be required to pledge collateral daily (based on the daily valuation of the financial asset) on behalf of each Fund with a value approximately equal to the amount of any unrealized gain above a pre-determined threshold. Reciprocally, when each Fund has an unrealized loss, the Funds have instructed the custodian to pledge assets of the Funds as collateral with a value approximately equal to the amount of the unrealized loss above a pre-determined threshold. Collateral pledges are monitored and subsequently adjusted if and when the valuations fluctuate, either up or down, by at le ast the predetermined threshold amount.
Zero Coupon Securities
Each Fund is authorized to invest in zero coupon securities. A zero coupon security does not pay a regular interest coupon to its holders during the life of the security. Tax-exempt income to the holder of the security comes from accretion of the difference between the original purchase price of the
Nuveen Investments 93
| | | Notes to |
| | | Financial Statements (continued) |
security at issuance and the par value of the security at maturity and is effectively paid at maturity. The market prices of zero coupon securities generally are more volatile than the market prices of securities that pay interest periodically.
Offering Costs
Costs incurred by Municipal Advantage (NMA), Market Opportunity (NMO) and Dividend Advantage 2 (NXZ) in connection with their offerings of VRDP Shares ($2,134,000, $4,214,000 and $2,270,000, respectively), were recorded as deferred charges and will be amortized over the 30-year life of the shares. Costs incurred by Dividend Advantage (NAD) in connection with its offering of MTP Shares ($2,559,500) were recorded as a deferred charge and will be amortized over the 5-year life of the shares. Each Fund’s amortized deferred charges are recognized as a component of “Interest expense and amortization of offering costs” on the Statement of Operations.
Custodian Fee Credit
Each Fund has an arrangement with the custodian bank whereby certain custodian fees and expenses are reduced by net credits earned on each Fund’s cash on deposit with the bank. Such deposit arrangements are an alternative to overnight investments. Credits for cash balances may be offset by charges for any days on which a Fund overdraws its account at the custodian bank.
Indemnifications
Under the Funds’ organizational documents, their officers and directors/trustees are indemnified against certain liabilities arising out of the performance of their duties to the Funds. In addition, in the normal course of business, the Funds enter into contracts that provide general indemnifications to other parties. The Funds’ maximum exposure under these arrangements is unknown as this would involve future claims that may be made against the Funds that have not yet occurred. However, the Funds have not had prior claims or losses pursuant to these contracts and expect the risk of loss to be remote.
Use of Estimates
The preparation of financial statements in conformity with U.S. GAAP requires management to make estimates and assumptions that affect the reported amounts of assets and liabilities at the date of the financial statements and the reported amounts of increases and decreases in net assets applicable to Common shares from operations during the reporting period. Actual results may differ from those estimates.
2. Fair Value Measurements
In determining the fair value of each Fund’s investments, various inputs are used. These inputs are summarized in the three broad levels listed below:
| | Level 1 – Quoted prices in active markets for identical securities. |
| | Level 2 – Other significant observable inputs (including quoted prices for similar securities, interest rates, prepayment speeds, credit risk, etc.). |
| | Level 3 – Significant unobservable inputs (including management’s assumptions in determining the fair value of investments). |
The inputs or methodologies used for valuing securities are not an indication of the risk associated with investing in those securities. The following is a summary of each Fund’s fair value measurements as of October 31, 2010:
| Performance Plus (NPP) | | Level 1 | | | Level 2 | | | Level 3 | | | Total | |
| Investments: | | | | | | | | | | | | |
| Municipal Bonds | | $ | — | | | $ | 1,360,959,631 | | | $ | — | | | $ | 1,360,959,631 | |
| Municipal Advantage (NMA) | | Level 1 | | | Level 2 | | | Level 3 | | | Total | |
| Investments: | | | | | | | | | | | | | | | | |
| Municipal Bonds | | $ | — | | | $ | 984,641,702 | | | $ | 462,475 | | | $ | 985,104,177 | |
| Market Opportunity (NMO) | | Level 1 | | | Level 2 | | | Level 3 | | | Total | |
| Investments: | | | | | | | | | | | | | | | | |
| Municipal Bonds | | $ | — | | | $ | 986,271,687 | | | $ | — | | | $ | 986,271,687 | |
| Dividend Advantage (NAD) | | Level 1 | | | Level 2 | | | Level 3 | | | Total | |
| Investments: | | | | | | | | | | | | | | | | |
| Municipal Bonds | | $ | — | | | $ | 868,588,804 | | | $ | 78,062 | | | $ | 868,666,866 | |
| Investment Companies | | | 578,940 | | | | — | | | | — | | | | 578,940 | |
| Total | | $ | 578,940 | | | $ | 868,588,804 | | | $ | 78,062 | | | $ | 869,245,806 | |
| Dividend Advantage 2 (NXZ) | | Level 1 | | | Level 2 | | | Level 3 | | | Total | |
| Investments: | | | | | | | | | | | | | | | | |
| Municipal Bonds | | $ | — | | | $ | 635,932,584 | | | $ | 2,333,250 | | | $ | 638,265,834 | |
94 Nuveen Investments
| | | | | | | | | | | | | | |
| Dividend Advantage 3 (NZF) | | | Level 1 | | | Level 2 | | | Level 3 | | | Total | |
| Investments: | | | | | | | | | | | | | |
| Municipal Bonds | | $ | — | | $ | 881,822,959 | | $ | 187,349 | | $ | 882,010,308 | |
| Investment Companies | | | 3,598,602 | | | — | | | — | | | 3,598,602 | |
| Total | | $ | 3,598,602 | | $ | 881,822,959 | | $ | 187,349 | | $ | 885,608,910 | |
The following is a reconciliation of the Funds’ Level 3 investments held at the beginning and end of the measurement period:
| | | | | | | | | | | | | | |
| | | Municipal | | Dividend | | Dividend | | Dividend | |
| | | Advantage | | Advantage | | Advantage 2 | | Advantage 3 | |
| | | (NMA | ) | (NAD | ) | (NXZ | ) | (NZF | ) |
| | | Level 3 | | Level 3 | | Level 3 | | Level 3 | |
| | | Municipal Bonds | | Municipal Bonds | | Municipal Bonds | | Municipal Bonds | |
| Balance at the beginning of year Gains (losses): | | $ | — | | $ | — | | $ | — | | $ | — | |
| Net realized gains (losses) | | | — | | | — | | | — | | | — | |
| Net change in unrealized appreciation (depreciation) | | | — | | | — | | | — | | | — | |
| Net purchases at cost (sales at proceeds) | | | — | | | — | | | — | | | — | |
| Net discounts (premiums) | | | — | | | — | | | — | | | — | |
| Net transfers in to (out of) at end of year fair value | | | 462,475 | | | 78,062 | | | 2,333,250 | | | 187,349 | |
| Balance at the end of year | | $ | 462,475 | | $ | 78,062 | | $ | 2,333,250 | | $ | 187,349 | |
“Change in net unrealized appreciation (depreciation) of investments” presented on the Statement of Operations includes net unrealized appreciation (depreciation) related to securities classified as Level 3 at year end as follows:
| | | | | | | | | | | | | | |
| | | Municipal | | Dividend | | Dividend | | Dividend | |
| | | Advantage | | Advantage | | Advantage 2 | | Advantage 3 | |
| | | (NMA | ) | (NAD | ) | (NXZ | ) | (NZF | ) |
| Level 3 net unrealized appreciation (depreciation) | | $ | 226,547 | | $ | 827,940 | | $ | (3,137,502 | ) | $ | (1,953,178 | ) |
3. Derivative Instruments and Hedging Activities
The Funds record derivative instruments at fair value, with changes in fair value recognized on the Statement of Operations, when applicable. Even though the Funds’ investments in derivatives may represent economic hedges, they are not considered to be hedge transactions for financial reporting purposes. The Funds did not invest in derivative instruments during the fiscal year ended October 31, 2010.
4. Fund Shares
Common Shares
Transactions in Common shares were as follows:
| | | Performance Plus (NPP) | | | Municipal Advantage (NMA) | | | Market Opportunity (NMO) | |
| | | Year | | | Year | | | Year | | | Year | | | Year | | | Year | |
| | | Ended | | | Ended | | | Ended | | | Ended | | | Ended | | | Ended | |
| | | 10/31/10 | | | 10/31/09 | | | 10/31/10 | | | 10/31/09 | | | 10/31/10 | | | 10/31/09 | |
| Common shares issued to shareholders due to reinvestment of distributions | | | 18,891 | | | | — | | | | 202,701 | | | | 20,548 | | | | 170,873 | | | | — | |
| | | Dividend Advantage (NAD) | | Dividend Advantage 2 (NXZ) | | Dividend Advantage 3 (NZF) |
| | | Year | | Year | | Year | | Year | | Year | | Year |
| | | Ended | | Ended | | Ended | | Ended | | Ended | | Ended |
| | | 10/31/10 | | 10/31/09 | | 10/31/10 | | 10/31/09 | | 10/31/10 | | 10/31/09 |
| Common shares issued to shareholders due to reinvestment of distributions | | 4,490 | | — | | 21,264 | | 10,026 | | 9,310 | | — |
Nuveen Investments 95
| | | Notes to |
| | | Financial Statements (continued) |
Preferred Shares
Dividend Advantage 2 (NXZ) redeemed all of its outstanding ARPS during the fiscal year ended October 31, 2008.
Transactions in ARPS were as follows:
| | | | Performance Plus (NPP) | | Municipal Advantage (NMA) | |
| | | | Year Ended 10/31/10 | | Year Ended 10/31/09 | | Year Ended 10/31/10 | | Year Ended 10/31/09 | |
| | | | Shares | | | Amount | | | Shares | | | Amount | | | Shares | | | Amount | | | Shares | | | Amount | |
| ARPS redeemed: | | | | | | | | | | | | | | | | | | | | | | | | | |
| Series M | | | — | | $ | — | | | 165 | | $ | 4,125,000 | | | 2,457 | | $ | 61,425,000 | | | 406 | | $ | 10,150,000 | |
| Series T | | | — | | | — | | | 165 | | | 4,125,000 | | | 2,457 | | | 61,425,000 | | | 406 | | | 10,150,000 | |
| Series W | | | — | | | — | | | 166 | | | 4,150,000 | | | 2,456 | | | 61,400,000 | | | 407 | | | 10,175,000 | |
| Series TH | | | — | | | — | | | 130 | | | 3,250,000 | | | 1,901 | | | 47,525,000 | | | 313 | | | 7,825,000 | |
| Series F | | | — | | | — | | | 164 | | | 4,100,000 | | | 2,457 | | | 61,425,000 | | | 406 | | | 10,150,000 | |
| Total | | | — | | $ | — | | | 790 | | $ | 19,750,000 | | | 11,728 | | $ | 293,200,000 | | | 1,938 | | $ | 48,450,000 | |
| | | | Market Opportunity (NMO) | | | Dividend Advantage (NAD) | |
| | | | Year Ended 10/31/09 | | Year Ended 10/31/10 | | | Year Ended 10/31/09 | | | Year Ended 10/31/10 | |
| | | | Shares | | | Amount | | | Shares | | | Amount | | | Shares | | | Amount | | | Shares | | | Amount | |
| ARPS redeemed: | | | | | | | | | | | | | | | | | | | | | | | | | |
| Series M | | | 3,649 | | $ | 91,225,000 | | | 158 | | $ | 3,950,000 | | | 1,922 | | $ | 48,050,000 | | | 68 | | $ | 1,700,000 | |
| Series T | | | 3,648 | | | 91,200,000 | | | 159 | | | 3,975,000 | | | 1,921 | | | 48,025,000 | | | 68 | | | 1,700,000 | |
| Series W | | | 2,920 | | | 73,000,000 | | | 126 | | | 3,150,000 | | | — | | | — | | | — | | | — | |
| Series TH | | | — | | | — | | | — | | | — | | | 1,826 | | | 45,650,000 | | | 64 | | | 1,600,000 | |
| Series F | | | 3,650 | | | 91,250,000 | | | 157 | | | 3,925,000 | | | — | | | — | | | — | | | — | |
| Total | | | 13,867 | | $ | 346,675,000 | | | 600 | | $ | 15,000,000 | | | 5,669 | | $ | 141,725,000 | | | 200 | | $ | 5,000,000 | |
| | | | | | | | | | | | | | |
| | | | Dividend Advantage 3 (NZF) | |
| | | | Year | | | Year | |
| | | | Ended | | | Ended | |
| | | | 10/31/10 | | | 10/31/09 | |
| | | | Shares | | | Amount | | | Shares | | | Amount | |
| ARPS redeemed: | | | | | | | | | | | | | |
| Series W | | | — | | $ | — | | | 451 | | $ | 11,275,000 | |
| Series TH | | | — | | | — | | | 451 | | | 11,275,000 | |
| Series F | | | — | | | — | | | 451 | | | 11,275,000 | |
| Total | | | — | | $ | — | | | 1,353 | | $ | 33,825,000 | |
Transactions in MTP Shares were as follows:
| | | | Dividend Advantage (NAD) | |
| | | | Year Ended 10/31/10 | | | Year Ended 10/31/09 | |
| | | | Shares | | | Amount | | | Shares | | | Amount | |
| MTP Shares issued: | | | | | | | | | | | | | |
| Series 2015 | | | 14,430,000 | | $ | 144,300,000 | | | — | | $ | — | |
96 Nuveen Investments
Transactions in VRDP Shares were as follows:
| | | Municipal Advantage (NMA) | | Market Opportunity (NMO) | |
| | | Year Ended 10/31/10 | | Year Ended 10/31/09 | | Year Ended 10/31/10 | | Year Ended 10/31/09 | |
| | | Shares | | Amount | | Shares | | Amount | | Shares | | Amount | | Shares | | Amount | |
| VRDP Shares issued: | | | | | | | | | | | | | | | | | |
| Series 1 | | 2,968 | | $296,800,000 | | — | | $— | | 3,509 | | $350,900,000 | | — | | $— | |
During the fiscal year ended October 31, 2010, Dividend Advantage 2 (NXZ) completed a private exchange offer in which all of its 1,960 Series 1 VRDP Shares were exchanged for 1,960 Series 2 VRDP Shares.
5. Investment Transactions
Purchases and sales (including maturities but excluding short-term investments) during the fiscal year ended October 31, 2010, were as follows:
| | | Performance | | | Municipal | | | Market | | | Dividend | | | Dividend | | | Dividend | |
| | | Plus | | | Advantage | | | Opportunity | | | Advantage | | | Advantage 2 | | | Advantage 3 | |
| | | (NPP | ) | | (NMA | ) | | (NMO | ) | | (NAD | ) | | (NXZ | ) | | (NZF | ) |
| Purchases | | $ | 191,899,396 | | | $ | 150,166,786 | | | $ | 259,440,032 | | | $ | 69,300,881 | | | $ | 31,487,822 | | | $ | 64,703,549 | |
| Sales and maturities | | | 195,736,124 | | | | 152,362,425 | | | | 305,137,227 | | | | 72,921,700 | | | | 40,774,558 | | | | 67,723,269 | |
6. Income Tax Information
The following information is presented on an income tax basis. Differences between amounts for financial statement and federal income tax purposes are primarily due to the timing differences in recognizing taxable market discount, timing differences in recognizing certain gains and losses on investment transactions and the treatment of investments in inverse floating rate securities reflected as financing transactions, if any. To the extent that differences arise that are permanent in nature, such amounts are reclassified within the capital accounts as detailed below. Temporary differences do not require reclassification. Temporary and permanent differences do not impact the net asset values of the Funds.
At October 31, 2010, the cost and unrealized appreciation (depreciation) of investments, as determined on a federal income tax basis, were as follows:
| | | | Performance | | | Municipal | | | Market | | | Dividend | | | Dividend | | | Dividend | |
| | | | Plus | | | Advantage | | | Opportunity | | | Advantage | | | Advantage 2 | | | Advantage 3 | |
| | | | (NPP | ) | | (NMA | ) | | (NMO | ) | | (NAD | ) | | (NXZ | ) | | (NZF | ) |
| Cost of investments | | $ | 1,261,074,185 | | $ | 894,532,530 | | $ | 937,635,273 | | $ | 796,078,808 | | $ | 599,355,625 | | $ | 806,701,028 | |
| Gross unrealized: | | | | | | | | | | | | | | | | | | | |
| Appreciation | | $ | 89,627,720 | | $ | 54,845,418 | | $ | 51,110,820 | | $ | 56,470,176 | | $ | 37,482,778 | | $ | 34,774,012 | |
| Depreciation | | | (32,061,721 | ) | | (31,967,071 | ) | | (46,005,334 | ) | | (34,907,674 | ) | | (25,240,265 | ) | | (24,215,586 | ) |
| Net unrealized appreciation (depreciation) of investments | | $ | 57,565,999 | | $ | 22,878,347 | | $ | 5,105,486 | | $ | 21,562,502 | | $ | 12,242,513 | | $ | 10,558,426 | |
Permanent differences, primarily due to federal taxes paid, taxable market discount and distribution character reclassifications, resulted in reclassifications among the Funds’ components of Common share net assets at October 31, 2010, the Funds’ tax year end, as follows:
| | | | Performance | | | Municipal | | | Market | | | Dividend | | | Dividend | | | Dividend | |
| | | | Plus | | | Advantage | | | Opportunity | | | Advantage | | | Advantage 2 | | | Advantage 3 | |
| | | | (NPP | ) | | (NMA | ) | | (NMO | ) | | (NAD | ) | | (NXZ | ) | | (NZF | ) |
| Paid-in surplus | | $ | (14,354 | ) | $ | (44,077 | ) | $ | (82,335 | ) | $ | (319,910 | ) | $ | (710,096 | ) | $ | — | |
| Undistributed (Over-distribution of) net investment income | | | (295,300 | ) | | 40,235 | | | (118,648 | ) | | 318,426 | | | 635,555 | | | (3,071 | ) |
| Accumulated net realized gain (loss) | | | 309,654 | | | 3,842 | | | 200,983 | | | 1,484 | | | 74,541 | | | 3,071 | |
The tax components of undistributed net tax-exempt income, net ordinary income and net long-term capital gains at October 31, 2010, the Funds’ tax year end, were as follows:
| | | | Performance | | | Municipal | | | Market | | | Dividend | | | Dividend | | | Dividend | |
| | | | Plus | | | Advantage | | | Opportunity | | | Advantage | | | Advantage 2 | | | Advantage 3 | |
| | | | (NPP | ) | | (NMA | ) | | (NMO | ) | | (NAD | ) | | (NXZ | ) | | (NZF | ) |
| Undistributed net tax-exempt income * | | $ | 19,969,255 | | $ | 11,572,786 | | $ | 12,834,483 | | $ | 11,751,685 | | $ | 7,112,008 | | $ | 13,088,050 | |
| Undistributed net ordinary income ** | | | 496,191 | | | 403,062 | | | 28,857 | | | 25,093 | | | 486 | | | — | |
| Undistributed net long-term capital gains | | | 5,536,530 | | | 3,489,441 | | | — | | | — | | | — | | | 640,607 | |
| * | Undistributed net tax-exempt income (on a tax basis) has not been reduced for the dividend declared on October 1, 2010, paid on November 1, 2010. |
| ** | Net ordinary income consists of taxable market discount income and net short-term capital gains, if any. |
Nuveen Investments 97
| | | Notes to |
| | | Financial Statements (continued) |
The tax character of distributions paid during the Funds’ tax years ended October 31, 2010 and October 31, 2009, was designated for purposes of the dividends paid deduction as follows:
| | | | | | | | | | | | | | | | | | | | |
| | | | Performance | | | Municipal | | | Market | | | Dividend | | | Dividend | | | Dividend | |
| | | | Plus | | | Advantage | | | Opportunity | | | Advantage | | | Advantage 2 | | | Advantage 3 | |
| 2010 | | | (NPP | ) | | (NMA | ) | | (NMO | ) | | (NAD | ) | | (NXZ | ) | | (NZF | ) |
| Distributions from net tax-exempt income *** | | $ | 56,430,144 | | $ | 43,084,415 | | $ | 45,084,665 | | $ | 38,498,093 | | $ | 28,872,454 | | $ | 39,033,313 | |
| Distributions from net ordinary income ** | | | 23,738 | | | 63,961 | | | — | | | — | | | 409,165 | | | 830,966 | |
| Distributions from net long-term capital gains **** | | | 863,865 | | | 3,011,399 | | | — | | | — | | | — | | | 1,901,758 | |
| | | | Performance | | | Municipal | | | Market | | | Dividend | | | Dividend | | | Dividend | |
| | | | Plus | | | Advantage | | | Opportunity | | | Advantage | | | Advantage 2 | | | Advantage 3 | |
| 2009 | | | (NPP | ) | | (NMA | ) | | (NMO | ) | | (NAD | ) | | (NXZ | ) | | (NZF | ) |
| Distributions from net tax-exempt income | | $ | 50,061,453 | | $ | 38,441,112 | | $ | 39,112,569 | | $ | 34,327,038 | | $ | 27,368,520 | | $ | 35,861,517 | |
| Distributions from net ordinary income ** | | | 60,857 | | | 126,563 | | | — | | | — | | | — | | | 312,544 | |
| Distributions from net long-term capital gains | | | — | | | — | | | — | | | — | | | — | | | — | |
| ** | Net ordinary income consists of taxable market discount income and net short-term capital gains, if any. |
| *** | The Funds hereby designate these amounts paid during the fiscal year ended October 31, 2010, as Exempt Interest Dividends. |
| **** | The Funds designated as a long-term capital gain dividend, pursuant to the Internal Revenue Code Section 852(b)(3), the amount necessary to reduce earnings and profits of the Funds related to net capital gain to zero for the tax year ended October 31, 2010. |
At October 31, 2010, the Funds’ tax year end, the following Funds had unused capital loss carryforwards available for federal income tax purposes to be applied against future capital gains, if any. If not applied, the carryforwards will expire as follows:
| | | | | | | | | | | |
| | | | Market | | | Dividend | | | Dividend | |
| | | | Opportunity | | | Advantage | | | Advantage 2 | |
| | | | (NMO | ) | | (NAD | ) | | (NXZ | ) |
| Expiration: | | | | | | | | | | |
| October 31, 2011 | | $ | — | | $ | 3,513,691 | | $ | — | |
| October 31, 2013 | | | — | | | 104,762 | | | — | |
| October 31, 2014 | | | 1,437,187 | | | — | | | — | |
| October 31, 2015 | | | 1,902,879 | | | — | | | 862,140 | |
| October 31, 2016 | | | 1,398,166 | | | — | | | — | |
| October 31, 2017 | | | — | | | 424,278 | | | — | |
| Total | | $ | 4,738,232 | | $ | 4,042,731 | | $ | 862,140 | |
During tax year ended October 31, 2010, the following Funds utilized capital loss carryforwards as follows:
| | | | Market | | | Dividend | | | Dividend | |
| | | | Opportunity | | | Advantage | | | Advantage 2 | |
| | | | (NMO | ) | | (NAD | ) | | (NXZ | ) |
| Utilized capital loss carryforwards | | $ | 6,894,937 | | $ | 1,080,609 | | $ | 1,524,632 | |
7. Management Fees and Other Transactions with Affiliates
Each Fund’s management fee is separated into two components — a fund-level fee, based only on the amount of assets within each individual Fund, and a complex-level fee, based on the aggregate amount of all fund assets managed by the Adviser. This pricing structure enables each Fund’s shareholders to benefit from growth in the assets within their respective Fund as well as from growth in the amount of complex-wide assets managed by the Adviser.
98 Nuveen Investments
The annual fund-level fee for each Fund, payable monthly, is calculated according to the following schedules:
| | | |
| | Performance Plus (NPP) |
| | Municipal Advantage (NMA) |
| | Market Opportunity (NMO) |
| Average Daily Managed Assets* | Fund-Level Fee Rate |
| For the first $125 million | .4500 | % |
| For the next $125 million | .4375 | |
| For the next $250 million | .4250 | |
| For the next $500 million | .4125 | |
| For the next $1 billion | .4000 | |
| For the next $3 billion | .3875 | |
| For managed assets over $5 billion | .3750 | |
| | Dividend Advantage (NAD) |
| | Dividend Advantage 2 (NXZ) |
| | Dividend Advantage 3 (NZF) |
| Average Daily Managed Assets* | Fund-Level Fee Rate |
| For the first $125 million | .4500 | % |
| For the next $125 million | .4375 | |
| For the next $250 million | .4250 | |
| For the next $500 million | .4125 | |
| For the next $1 billion | .4000 | |
| For managed assets over $2 billion | .3750 | |
The annual complex-level fee for each Fund, payable monthly, is calculated according to the following schedule:
| | | |
| Complex-Level Managed Asset Breakpoint Level* | Effective Rate at Breakpoint Level |
| $55 billion | .2000 | % |
| $56 billion | .1996 | |
| $57 billion | .1989 | |
| $60 billion | .1961 | |
| $63 billion | .1931 | |
| $66 billion | .1900 | |
| $71 billion | .1851 | |
| $76 billion | .1806 | |
| $80 billion | .1773 | |
| $91 billion | .1691 | |
| $125 billion | .1599 | |
| $200 billion | .1505 | |
| $250 billion | .1469 | |
| $300 billion | .1445 | |
| * | For the fund-level and complex-level fees, managed assets include closed-end fund assets managed by the Adviser that are attributable to financial leverage. For these purposes, financial leverage includes the funds’ use of preferred stock and borrowings and certain investments in the residual interest certificates (also called inverse floating rate securities) in tender option bond (TOB) trusts, including the portion of assets held by a TOB trust that has been effectively financed by the trust’s issuance of floating rate securities, subject to an agreement by the Adviser as to certain funds to limit the amount of such assets for determining managed assets in certain circumstances. The complex-level fee is calculated based upon the aggregate daily managed assets of all Nuveen funds, with such daily managed assets defined separately for each fund in its m anagement agreement, but excluding assets attributable to investments in other Nuveen funds. As of October 31, 2010, the complex-level fee rate was .1809%. |
The management fee compensates the Adviser for overall investment advisory and administrative services and general office facilities. The Funds pay no compensation directly to those of its directors/trustees who are affiliated with the Adviser or to its officers, all of whom receive remuneration for their services to the Funds from the Adviser or its affiliates. The Board of Directors/Trustees has adopted a deferred compensation plan for independent directors/trustees that enables directors/trustees to elect to defer receipt of all or a portion of the annual compensation they are entitled to receive from certain Nuveen advised funds. Under the plan, deferred amounts are treated as though equal dollar amounts had been invested in shares of select Nuveen advised funds.
Nuveen Investments 99
| | | Notes to |
| | | Financial Statements (continued) |
For the first ten years of Dividend Advantage 2’s (NXZ) operations, the Adviser has agreed to reimburse the Fund, as a percentage of average daily managed assets, for fees and expenses in the amounts and for the time periods set forth below:
| Year Ending | | | | Year Ending | | | |
| March 31, | | | | March 31, | | | |
| 2001* | | .30% | | 2007 | | .25 | % |
| 2002 | | .30 | | 2008 | | .20 | |
| 2003 | | .30 | | 2009 | | .15 | |
| 2004 | | .30 | | 2010 | | .10 | |
| 2005 | | .30 | | 2011 | | .05 | |
| 2006 | | .30 | | | | | |
* From the commencement of operations.
The Adviser has not agreed to reimburse Dividend Advantage 2 (NXZ) for any portion of its fees and expenses beyond March 31, 2011.
For the first ten years of Dividend Advantage 3’s (NZF) operations, the Adviser has agreed to reimburse the Fund, as a percentage of average daily managed assets, for fees and expenses in the amounts and for the time periods set forth below:
| Year Ending | | | | Year Ending | | | |
| September 30, | | | | September 30, | | | |
| 2001* | | .30% | | 2007 | | .25 | % |
| 2002 | | .30 | | 2008 | | .20 | |
| 2003 | | .30 | | 2009 | | .15 | |
| 2004 | | .30 | | 2010 | | .10 | |
| 2005 | | .30 | | 2011 | | .05 | |
| 2006 | | .30 | | | | | |
* From the commencement of operations.
The Adviser has not agreed to reimburse Dividend Advantage 3 (NZF) for any portion of its fees and expenses beyond September 30, 2011.
8. New Accounting Standards
Fair Value Measurements
On January 21, 2010, the Financial Accounting Standards Board issued changes to the authoritative guidance under U.S. GAAP for fair value measurements. The objective of which is to provide guidance on how investment assets and liabilities are to be valued and disclosed. Specifically, the amendment requires reporting entities to disclose Level 3 activity for purchases, sales, issuances and settlements in the Level 3 roll-forward on a gross basis rather than as one net number. The effective date of the amendment is for interim and annual periods beginning after December 15, 2010. At this time, management is evaluating the implications of this guidance and the impact it will have to the footnote disclosures, if any.
9. Subsequent Events
Preferred Shares
Subsequent to the reporting period, Dividend Advantage (NAD) filed with the Securities and Exchange Commission (“SEC”) a registration statement seeking to register additional MTP Shares. This registration statement declared effective by the SEC, enables the Fund to issue to the public additional MTP Shares to refinance Dividend Advantage’s (NAD) remaining ARPS. The issuance of MTP Shares by Dividend Advantage (NAD) is subject to market conditions. There is no assurance that MTP Shares will be issued.
During December 2010, Dividend Advantage 3 (NZF) successfully completed the issuance of $65 million of 2.80%, Series 2016 MTP Shares. The newly-issued MTP Shares trade on the NYSE under the symbol “NZF Pr C.” Immediately following its MTP issuance, Dividend Advantage 3 (NZF) noticed for redemption at par $63.625 million of its outstanding ARPS using the MTP proceeds.
Other Matters
During November 2010, Municipal Advantage (NMA) received a demand letter alleging its Board of Directors breached their fiduciary duties related to the redemption at par of its ARPS. The demand letter has been filed on behalf of shareholders of Municipal Advantage (NMA), against the Adviser, the Nuveen holding company, the majority owner of the holding company, the lone interested director, and current and former officers of Municipal Advantage (NMA).
100 Nuveen Investments
Nuveen Investments 101
Selected data for a Common share outstanding throughout each period:
| | | | | | | Investment Operations | | | Less Distributions | | | | | | | | | | |
| | | | Beginning Common Share Net Asset Value | | | Net Investment Income | | | Net Realized/ Unrealized Gain (Loss) | | | Distributions from Net Investment Income to Auction Rate Preferred Share- holders | (a) | | Distributions from Capital Gains to Auction Rate Preferred Share– holders | (a) | | Total | | | Net Investment Income to Common Share- holders | | | Capital Gains to Common Share– holders | | | Total | | | Discount from Common Shares Repur- chased and Retired | | | Ending Common Share Net Asset Value | | | Ending Market Value | |
| Performance Plus (NPP) |
| Year Ended 10/31: |
| 2010 | | $ | 14.52 | | $ | 1.03 | | $ | .70 | | $ | (.03 | ) | $ | — | * | $ | 1.70 | | $ | (.92 | ) | $ | (.01 | ) | $ | (.93 | ) | $ | — | | $ | 15.29 | | $ | 15.00 | |
| 2009 | | | 12.69 | | | 1.03 | | | 1.65 | | | (.06 | ) | | — | | | 2.62 | | | (.79 | ) | | — | | | (.79 | ) | | — | | | 14.52 | | | 13.48 | |
| 2008 | | | 15.22 | | | 1.02 | | | (2.56 | ) | | (.29 | ) | | — | | | (1.83 | ) | | (.70 | ) | | — | | | (.70 | ) | | — | | | 12.69 | | | 11.50 | |
| 2007 | | | 15.78 | | | .99 | | | (.47 | ) | | (.27 | ) | | (.01 | ) | | .24 | | | (.75 | ) | | (.05 | ) | | (.80 | ) | | — | | | 15.22 | | | 13.59 | |
| 2006 | | | 15.51 | | | 1.00 | | | .38 | | | (.25 | ) | | — | | | 1.13 | | | (.84 | ) | | (.02 | ) | | (.86 | ) | | — | | | 15.78 | | | 15.09 | |
| | | | | | | | | | | | | | | | | | | | | | | | | | | | | | | | | | | | | | |
| Municipal Advantage (NMA) |
| Year Ended 10/31: |
| 2010 | | | 14.08 | | | 1.01 | | | .76 | | | (.01 | ) | | — | * | | 1.76 | | | (.98 | ) | | (.07 | ) | | (1.05 | ) | | — | | | 14.79 | | | 14.92 | |
| 2009 | | | 12.12 | | | 1.10 | | | 1.76 | | | (.06 | ) | | — | | | 2.80 | | | (.84 | ) | | — | | | (.84 | ) | | — | | | 14.08 | | | 13.41 | |
| 2008 | | | 15.20 | | | 1.08 | | | (3.06 | ) | | (.30 | ) | | (.01 | ) | | (2.29 | ) | | (.77 | ) | | (.02 | ) | | (.79 | ) | | — | | | 12.12 | | | 11.41 | |
| 2007 | | | 15.88 | | | 1.07 | | | (.63 | ) | | (.29 | ) | | — | | | .15 | | | (.83 | ) | | — | | | (.83 | ) | | — | | | 15.20 | | | 13.95 | |
| 2006 | | | 15.70 | | | 1.08 | | | .27 | | | (.26 | ) | | — | | | 1.09 | | | (.90 | ) | | (.01 | ) | | (.91 | ) | | — | | | 15.88 | | | 15.85 | |
| | | | Auction Rate Preferred Shares at End of Period | | | Variable Rate Demand Preferred Shares at End of Period | |
| | | | Aggregate Amount Outstanding (000 | ) | | Liquidation Value Per Share | | | Asset Coverage Per Share | | | Aggregate Amount Outstanding (000 | ) | | Liquidation Value Per Share | | | Asset Coverage Per Share | |
| Performance Plus (NPP) |
| Year Ended 10/31: |
| 2010 | | $ | 419,900 | | $ | 25,000 | | $ | 79,546 | | $ | — | | $ | — | | $ | — | |
| 2009 | | | 419,900 | | | 25,000 | | | 76,790 | | | — | | | — | | | — | |
| 2008 | | | 439,650 | | | 25,000 | | | 68,244 | | | — | | | — | | | — | |
| 2007 | | | 479,000 | | | 25,000 | | | 72,603 | | | — | | | — | | | — | |
| 2006 | | | 479,000 | | | 25,000 | | | 74,333 | | | — | | | — | | | — | |
| | | | | | | | | | | | | | | | | | | | |
| Municipal Advantage (NMA) |
| Year Ended 10/31: |
| 2010 | | | — | | | — | | | — | | | 296,800 | | | 100,000 | | | 316,430 | |
| 2009 | | | 293,200 | | | 25,000 | | | 76,911 | | | — | | | — | | | — | |
| 2008 | | | 341,650 | | | 25,000 | | | 63,314 | | | — | | | — | | | — | |
| 2007 | | | 358,000 | | | 25,000 | | | 70,866 | | | — | | | — | | | — | |
| 2006 | | | 358,000 | | | 25,000 | | | 72,743 | | | — | | | — | | | — | |
102 Nuveen Investments
| | | | Ratios/Supplemental Data |
| Total Returns | | | | | | Ratios to Average Net Assets Applicable to Common Shares(c)(d) | | | | |
Based on Market Value | (b) | | Based on Common Share Net Asset Value | (b) | | Ending Net Assets Applicable to Common Shares (000 | ) | | Expenses Including Interest | (e) | | Expenses Excluding Interest | | | Net Investment Income | | | Portfolio Turnover Rate | |
| | | | | | | | | | | | | | | | | | | | |
| 18.65 | % | | 12.07 | % | $ | 916,152 | | | 1.13 | % | | 1.10 | % | | 6.93 | % | | 14 | % |
| 24.78 | | | 21.20 | | | 869,873 | | | 1.23 | | | 1.18 | | | 7.59 | | | 6 | |
| (10.71 | ) | | (12.49 | ) | | 760,496 | | | 1.25 | | | 1.17 | | | 6.96 | | | 9 | |
| (4.97 | ) | | 1.53 | | | 912,066 | | | 1.16 | | | 1.14 | | | 6.38 | | | 6 | |
| 10.78 | | | 7.50 | | | 945,222 | | | 1.15 | | | 1.15 | | | 6.44 | | | 9 | |
| | | | | | | | | | | | | | | | | | | | |
| | | | | | | | | | | | | | | | | | | | |
| 19.58 | | | 12.90 | | | 642,364 | | | 1.66 | | | 1.46 | | | 7.04 | | | 16 | |
| 25.70 | | | 23.89 | | | 608,813 | | | 1.31 | | | 1.22 | | | 8.51 | | | 9 | |
| (13.16 | ) | | (15.65 | ) | | 523,602 | | | 1.38 | | | 1.21 | | | 7.50 | | | 13 | |
| (7.08 | ) | | 1.06 | | | 656,806 | | | 1.40 | | | 1.17 | | | 6.87 | | | 10 | |
| 10.68 | | | 7.16 | | | 683,675 | | | 1.18 | | | 1.18 | | | 6.92 | | | 11 | |
| (a) | The amounts shown are based on Common share equivalents. |
| (b) | Total Return Based on Market Value is the combination of changes in the market price per share and the effect of reinvested dividend income and reinvested capital gains distributions, if any, at the average price paid per share at the time of reinvestment. The last dividend declared in the period, which is typically paid on the first business day of the following month, is assumed to be reinvested at the ending market price. The actual reinvestment for the last dividend declared in the period may take place over several days, and in some instances may not be based on the market price, so the actual reinvestment price may be different from the price used in the calculation. Total returns are not annualized. |
| | |
| | Total Return Based on Common Share Net Asset Value is the combination of changes in Common share net asset value, reinvested dividend income at net asset value and reinvested capital gains distributions at net asset value, if any. The last dividend declared in the period, which is typically paid on the first business day of the following month, is assumed to be reinvested at the ending net asset value. The actual reinvest price for the last dividend declared in the period may often be based on the Fund’s market price (and not its net asset value), and therefore may be different from the price used in the calculation. Total returns are not annualized. |
| (c) | Ratios do not reflect the effect of dividend payments to Auction Rate Preferred shareholders; Net Investment Income ratios reflect income earned and expenses incurred on assets attributable to Auction Rate Preferred shares and/or Variable Rate Demand Preferred shares, where applicable. |
| (d) | Ratios do not reflect the effect of custodian fee credits earned on the Fund’s net cash on deposit with the custodian bank, where applicable. |
| (e) | The expense ratios reflect, among other things, payments to Variable Rate Demand Preferred shareholders and/or the interest expense deemed to have been paid by the Fund on the floating rate certificates issued by the special purpose trusts for the self-deposited inverse floaters held by the Fund, where applicable, each as described in Footnote 1 – General Information and Significant Accounting Policies, Variable Rate Demand Preferred Shares and Inverse Floating Rate Securities, respectively. |
| * | Rounds to less than $.01 per share. |
See accompanying notes to financial statements.
Nuveen Investments 103
| | Financial |
| | Highlights (continued) |
Selected data for a Common share outstanding throughout each period:
| | | | | | | Investment Operations | | | Less Distributions | | | | | | | | | | |
| | | | Beginning Common Share Net Asset Value | | | Net Investment Income | | | Net Realized/ Unrealized Gain (Loss | ) | | Distributions from Net Investment Income to Auction Rate Preferred Share- holders | (a) | | Distributions from Capital Gains to Auction Rate Preferred Share– holders | (a) | | Total | | | Net Investment Income to Common Share- holders | | | Capital Gains to Common Share– holders | | | Total | | | Discount from Common Shares Repur- chased and Retired | | | Ending Common Share Net Asset Value | | | Ending Market Value | |
| Market Opportunity (NMO) |
| Year Ended 10/31: |
| 2010 | | $ | 13.59 | | $ | .99 | | $ | .56 | | $ | (.01 | ) | $ | — | | $ | 1.54 | | $ | (.96 | ) | $ | — | | $ | (.96 | ) | $ | — | | $ | 14.17 | | $ | 14.55 | |
| 2009 | | | 12.23 | | | 1.10 | | | 1.13 | | | (.06 | ) | | — | | | 2.17 | | | (.81 | ) | | — | | | (.81 | ) | | — | | | 13.59 | | | 13.32 | |
| 2008 | | | 14.83 | | | 1.03 | | | (2.59 | ) | | (.31 | ) | | — | | | (1.87 | ) | | (.73 | ) | | — | | | (.73 | ) | | — | | | 12.23 | | | 11.52 | |
| 2007 | | | 15.41 | | | 1.04 | | | (.56 | ) | | (.30 | ) | | — | | | .18 | | | (.76 | ) | | — | | | (.76 | ) | | — | | | 14.83 | | | 13.53 | |
| 2006 | | | 15.14 | | | 1.02 | | | .34 | | | (.26 | ) | | — | | | 1.10 | | | (.83 | ) | | — | | | (.83 | ) | | — | | | 15.41 | | | 15.00 | |
| Dividend Advantage (NAD) |
| Year Ended 10/31: |
| 2010 | | | 13.89 | | | 1.00 | | | .72 | | | (.02 | ) | | — | | | 1.70 | | | (.91 | ) | | — | | | (.91 | ) | | — | | | 14.68 | | | 14.40 | |
| 2009 | | | 11.77 | | | 1.07 | | | 1.93 | | | (.05 | ) | | — | | | 2.95 | | | (.83 | ) | | — | | | (.83 | ) | | — | | | 13.89 | | | 12.89 | |
| 2008 | | | 14.90 | | | 1.05 | | | (3.14 | ) | | (.27 | ) | | — | | | (2.36 | ) | | (.77 | ) | | — | | | (.77 | ) | | — | | | 11.77 | | | 10.72 | |
| 2007 | | | 15.54 | | | 1.04 | | | (.60 | ) | | (.27 | ) | | — | | | .17 | | | (.81 | ) | | — | | | (.81 | ) | | — | | | 14.90 | | | 13.63 | |
| 2006 | | | 15.28 | | | 1.04 | | | .32 | | | (.24 | ) | | — | | | 1.12 | | | (.86 | ) | | — | | | (.86 | ) | | — | | | 15.54 | | | 15.30 | |
| | | Auction Rate Preferred Shares at End of Period | | | MuniFund Term Preferred Shares at End of Period | | Auction Rate Preferred Shares and MuniFund Term Preferred Shares at End of Period | | Variable Rate Demand Preferred Shares at End of Period |
| | | | Aggregate Amount Outstanding (000 | ) | | Liquidation Value Per Share | | | Asset Coverage Per Share | | | Aggregate Amount Outstanding (000 | ) | | Liquidation Value Per Share | | | Ending Market Value Per Share | | | Average Market Value Per Share | | | Asset Coverage Per Share | | | Asset Coverage Per $1 Liquidation Preference | | | Aggregate Amount Outstanding (000 | ) | | Liquidation Value Per Share | | | Asset Coverage Per Share | |
| Market Opportunity (NMO) |
| Year Ended 10/31: |
| 2010 | | $ | — | | $ | — | | $ | — | | $ | — | | $ | — | | $ | — | | $ | — | | $ | — | | $ | — | | $ | 350,900 | | $ | 100,000 | | $ | 284,673 | |
| 2009 | | | 346,675 | | | 25,000 | | | 69,661 | | | — | | | — | | | — | | | — | | | — | | | — | | | — | | | — | | | — | |
| 2008 | | | 361,675 | | | 25,000 | | | 63,525 | | | — | | | — | | | — | | | — | | | — | | | — | | | — | | | — | | | — | |
| 2007 | | | 380,000 | | | 25,000 | | | 69,446 | | | — | | | — | | | — | | | — | | | — | | | — | | | — | | | — | | | — | |
| 2006 | | | 380,000 | | | 25,000 | | | 71,155 | | | — | | | — | | | — | | | — | | | — | | | — | | | — | | | — | | | — | |
| |
| Dividend Advantage (NAD) |
| Year Ended 10/31: |
| 2010 | | | 120,075 | | | 25,000 | | | 79,553 | | | 144,300 | | | 10.00 | | | 10.10 | | | 10.10^ | | | 31.82 | | | 3.18 | | | — | | | — | | | — | |
| 2009 | | | 261,800 | | | 25,000 | | | 77,095 | | | — | | | — | | | — | | | — | | | — | | | — | | | — | | | — | | | — | |
| 2008 | | | 266,800 | | | 25,000 | | | 68,343 | | | — | | | — | | | — | | | — | | | — | | | — | | | — | | | — | | | — | |
| 2007 | | | 295,000 | | | 25,000 | | | 74,618 | | | — | | | — | | | — | | | — | | | — | | | — | | | — | | | — | | | — | |
| 2006 | | | 295,000 | | | 25,000 | | | 76,722 | | | — | | | — | | | — | | | — | | | — | | | — | | | — | | | — | | | — | |
104 Nuveen Investments
| | | | | | | Ratios/Supplemental Data |
| Total Returns | | | | | | Ratios to Average Net Assets Applicable to Common Shares Before Reimbursement(c) | | | Ratios to Average Net Assets Applicable to Common Shares After Reimbursement(c)(d) | | | | |
Based on Market Value | (b) | | Based on Common Share Net Asset Value | (b) | | Ending Net Assets Applicable to Common Shares (000 | ) | | Expenses Including Interest | (e) | | Expenses Excluding Interest | | | Net Investment Income | | | Expenses Including Interest | (e) | | Expenses Excluding Interest | | | Net Investment Income | | | Portfolio Turnover Rate | |
| |
| 17.03 | % | | 11.71 | % | $ | 648,017 | | | 1.70 | % | | 1.50 | % | | 7.17 | % | | N/A | | | N/A | | | N/A | | | 26 | % |
| 23.67 | | | 18.30 | | | 619,319 | | | 1.32 | | | 1.25 | | | 8.58 | | | N/A | | | N/A | | | N/A | | | 10 | |
| (9.87 | ) | | (13.07 | ) | | 557,346 | | | 1.36 | | | 1.23 | | | 7.33 | | | N/A | | | N/A | | | N/A | | | 8 | |
| (5.00 | ) | | 1.20 | | | 675,577 | | | 1.38 | | | 1.19 | | | 6.87 | | | N/A | | | N/A | | | N/A | | | 5 | |
| 11.92 | | | 7.49 | | | 701,559 | | | 1.19 | | | 1.19 | | | 6.73 | | | N/A | | | N/A | | | N/A | | | 14 | |
| |
| |
| 19.17 | | | 12.60 | | | 576,895 | | | 1.61 | | | 1.13 | | | 6.99 | | | 1.61 | % | | 1.13 | % | | 6.99 | % | | 8 | |
| 28.86 | | | 25.78 | | | 545,534 | | | 1.26 | | | 1.17 | | | 8.38 | | | 1.21 | | | 1.12 | | | 8.43 | | | 9 | |
| (16.46 | ) | | (16.42 | ) | | 462,554 | | | 1.36 | | | 1.15 | | | 7.33 | | | 1.22 | | | 1.02 | | | 7.46 | | | 11 | |
| (5.96 | ) | | 1.10 | | | 585,496 | | | 1.24 | | | 1.13 | | | 6.60 | | | 1.03 | | | .92 | | | 6.81 | | | 11 | |
| 11.19 | | | 7.59 | | | 610,316 | | | 1.12 | | | 1.12 | | | 6.54 | | | .85 | | | .85 | | | 6.81 | | | 8 | |
| (a) | The amounts shown are based on Common share equivalents. |
| (b) | Total Return Based on Market Value is the combination of changes in the market price per share and the effect of reinvested dividend income and reinvested capital gains distributions, if any, at the average price paid per share at the time of reinvestment. The last dividend declared in the period, which is typically paid on the first business day of the following month, is assumed to be reinvested at the ending market price. The actual reinvestment for the last dividend declared in the period may take place over several days, and in some instances may not be based on the market price, so the actual reinvestment price may be different from the price used in the calculation. Total returns are not annualized. |
| | |
| | Total Return Based on Common Share Net Asset Value is the combination of changes in Common share net asset value, reinvested dividend income at net asset value and reinvested capital gains distributions at net asset value, if any. The last dividend declared in the period, which is typically paid on the first business day of the following month, is assumed to be reinvested at the ending net asset value. The actual reinvest price for the last dividend declared in the period may often be based on the Fund’s market price (and not its net asset value), and therefore may be different from the price used in the calculation. Total returns are not annualized. |
| (c) | Ratios do not reflect the effect of dividend payments to Auction Rate Preferred shareholders; Net Investment Income ratios reflect income earned and expenses incurred on assets attributable to Auction Rate Preferred shares, MuniFund Term Preferred shares and/or Variable Rate Demand Preferred shares, where applicable. |
| (d) | After expense reimbursement from the Adviser, where applicable. Ratios do not reflect the effect of custodian fee credits earned on the Fund’s net cash on deposit with the custodian bank, where applicable. As of July 31, 2009, the Adviser is no longer reimbursing Dividend Advantage (NAD) for any fees and expenses. (e) The expense ratios reflect, among other things, payments to MuniFund Term Preferred shareholders, Variable Rate Demand Preferred shareholders and/or the interest expense deemed to have been paid by the Fund on the floating rate certificates issued by the special purpose trusts for the self-deposited inverse floaters held by the Fund, where applicable, each as described in Footnote 1 – General Information and Significant Accounting Polices, MuniFund Term Preferred Shares, Variable Rate Demand Preferred Shares and Inverse Fl oating Rate Securities, respectively. |
| ^ | For the period March 16, 2010 (issuance date of shares) through October 31, 2010. |
| N/A | Fund does not have a contractual reimbursement agreement with the Adviser. |
See accompanying notes to financial statements.
Nuveen Investments 105
| | Financial |
| | Highlights (continued) |
Selected data for a Common share outstanding throughout each period:
| | | | | | | Investment Operations | | | Less Distributions | | | | | | | | | | |
| | | | Beginning Common Share Net Asset Value | | | Net Investment Income | | | Net Realized/ Unrealized Gain (Loss | ) | | Distributions from Net Investment Income to Auction Rate Preferred Share- holders | (a) | | Distributions from Capital Gains to Auction Rate Preferred Share– holders | (a) | | Total | | | Net Investment Income to Common Share- holders | | | Capital Gains to Common Share– holders | | | Total | | | Discount from Common Shares Repur- chased and Retired | | | Ending Common Share Net Asset Value | | | Ending Market Value | |
| Dividend Advantage 2 (NXZ) |
| Year Ended 10/31: |
| 2010 | | $ | 14.45 | | $ | 1.02 | | $ | .26 | | $ | — | | $ | — | | $ | 1.28 | | $ | (.97 | ) | $ | — | | $ | (.97 | ) | $ | — | | $ | 14.76 | | $ | 14.67 | |
| 2009 | | | 12.71 | | | 1.04 | | | 1.59 | | | — | | | — | | | 2.63 | | | (.89 | ) | | — | | | (.89 | ) | | — | | | 14.45 | | | 14.14 | |
| 2008 | | | 15.55 | | | 1.05 | | | (2.81 | ) | | (.20 | ) | | — | | | (1.96 | ) | | (.88 | ) | | — | | | (.88 | ) | | — | | | 12.71 | | | 12.35 | |
| 2007 | | | 16.02 | | | 1.13 | | | (.43 | ) | | (.27 | ) | | — | | | .43 | | | (.90 | ) | | — | | | (.90 | ) | | — | | | 15.55 | | | 15.48 | |
| 2006 | | | 15.80 | | | 1.12 | | | .32 | | | (.24 | ) | | — | | | 1.20 | | | (.98 | ) | | — | | | (.98 | ) | | — | | | 16.02 | | | 16.50 | |
| | | | | | | | | | | | | | | | | | | | | | | | | | | | | | | | | | | | | | |
| Dividend Advantage 3 (NZF) |
| Year Ended 10/31: |
| 2010 | | | 14.19 | | | 1.06 | | | .52 | | | (.02 | ) | | — | * | | 1.56 | | | (.95 | ) | | (.06 | ) | | (1.01 | ) | | — | | | 14.74 | | | 14.58 | |
| 2009 | | | 12.10 | | | 1.08 | | | 1.91 | | | (.05 | ) | | — | | | 2.94 | | | (.85 | ) | | — | | | (.85 | ) | | — | | | 14.19 | | | 13.38 | |
| 2008 | | | 15.03 | | | 1.06 | | | (2.95 | ) | | (.27 | ) | | — | | | (2.16 | ) | | (.77 | ) | | — | | | (.77 | ) | | — | | | 12.10 | | | 10.72 | |
| 2007 | | | 15.54 | | | 1.07 | | | (.44 | ) | | (.27 | ) | | (.01 | ) | | .35 | | | (.84 | ) | | (.02 | ) | | (.86 | ) | | — | | | 15.03 | | | 13.85 | |
| 2006 | | | 15.32 | | | 1.07 | | | .29 | | | (.24 | ) | | — | | | 1.12 | | | (.90 | ) | | — | | | (.90 | ) | | — | | | 15.54 | | | 15.88 | |
| | | Auction Rate Preferred Shares at End of Period | | Variable Rate Demand Preferred Shares at End of Period | |
| | | Aggregate Amount Outstanding (000 | ) | Liquidation Value Per Share | | Asset Coverage Per Share | | Aggregate Amount Outstanding (000 | ) | Liquidation Value Per Share | | Asset Coverage Per Share | |
| Dividend Advantage 2 (NXZ) |
| Year Ended 10/31: |
| 2010 | | $ | — | | $ | — | | $ | — | | $ | 196,000 | | $ | 100,000 | | $ | 321,819 | |
| 2009 | | | — | | | — | | | — | | | 196,000 | | | 100,000 | | | 316,966 | |
| 2008 | | | — | | | — | | | — | | | 196,000 | | | 100,000 | | | 290,785 | |
| 2007 | | | 222,000 | | | 25,000 | | | 76,463 | | | — | | | — | | | — | |
| 2006 | | | 222,000 | | | 25,000 | | | 77,949 | | | — | | | — | | | — | |
| | | | | | | | | | | | | | | | | | | | |
| Dividend Advantage 3 (NZF) |
| Year Ended 10/31: |
| 2010 | | | 236,950 | | | 25,000 | | | 87,821 | | | — | | | — | | | — | |
| 2009 | | | 236,950 | | | 25,000 | | | 85,465 | | | — | | | — | | | — | |
| 2008 | | | 270,775 | | | 25,000 | | | 70,108 | | | — | | | — | | | — | |
| 2007 | | | 312,000 | | | 25,000 | | | 73,630 | | | — | | | — | | | — | |
| 2006 | | | 312,000 | | | 25,000 | | | 75,227 | | | — | | | — | | | — | |
106 Nuveen Investments
| | | | | | | Ratios/Supplemental Data | |
| Total Returns | | | | | | Ratios to Average Net Assets Applicable to Common Shares Before Reimbursement(c) | | | Ratios to Average Net Assets Applicable to Common Shares After Reimbursement(c)(d) | | | | |
Based on Market Value | (b) | | Based on Common Share Net Asset Value | (b) | | Ending Net Assets Applicable to Common Shares (000 | ) | | Expenses Including Interest | (e) | | Expenses Excluding Interest | | | Net Investment Income | | | Expenses Including Interest | (e) | | Expenses Excluding Interest | | | Net Investment Income | | | Portfolio Turnover Rate | |
| | | | | | | | | | | | | | | | | | | | | | | | | | | | | |
| 10.89 | % | | 9.12 | % | $ | 434,764 | | | 1.79 | % | | 1.57 | % | | 6.85 | % | | 1.68 | % | | 1.47 | % | | 6.95 | % | | 5 | % |
| 22.63 | | | 21.41 | | | 425,253 | | | 1.91 | | | 1.47 | | | 7.59 | | | 1.73 | | | 1.29 | | | 7.77 | | | 2 | |
| (15.21 | ) | | (13.23 | ) | | 373,940 | | | 1.71 | | | 1.22 | | | 6.82 | | | 1.45 | | | .96 | | | 7.08 | | | 10 | |
| (.78) | | | 2.76 | | | 456,992 | | | 1.25 | | | 1.11 | | | 6.83 | | | .93 | | | .79 | | | 7.16 | | | 5 | |
| 11.95 | | | 7.86 | | | 470,189 | | | 1.11 | | | 1.11 | | | 6.70 | | | .72 | | | .72 | | | 7.09 | | | 5 | |
| | | | | | | | | | | | | | | | | | | | | | | | | | | | | |
| | | | | | | | | | | | | | | | | | | | | | | | | | | | | |
| 17.04 | | | 11.41 | | | 595,413 | | | 1.17 | | | 1.08 | | | 7.21 | | | 1.02 | | | .93 | | | 7.36 | | | 7 | |
| 33.89 | | | 25.08 | | | 573,088 | | | 1.26 | | | 1.15 | | | 7.98 | | | 1.04 | | | .92 | | | 8.20 | | | 2 | |
| (17.85 | ) | | (14.99 | ) | | 488,561 | | | 1.34 | | | 1.15 | | | 7.08 | | | 1.04 | | | .85 | | | 7.37 | | | 7 | |
| (7.72 | ) | | 2.31 | | | 606,908 | | | 1.32 | | | 1.13 | | | 6.65 | | | .94 | | | .76 | | | 7.02 | | | 14 | |
| 16.90 | | | 7.57 | | | 626,836 | | | 1.13 | | | 1.13 | | | 6.51 | | | .68 | | | .68 | | | 6.96 | | | 9 | |
| (a) | The amounts shown are based on Common share equivalents. |
| (b) | Total Return Based on Market Value is the combination of changes in the market price per share and the effect of reinvested dividend income and reinvested capital gains distributions, if any, at the average price paid per share at the time of reinvestment. The last dividend declared in the period, which is typically paid on the first business day of the following month, is assumed to be reinvested at the ending market price. The actual reinvestment for the last dividend declared in the period may take place over several days, and in some instances may not be based on the market price, so the actual reinvestment price may be different from the price used in the calculation. Total returns are not annualized. |
| | |
| | Total Return Based on Common Share Net Asset Value is the combination of changes in Common share net asset value, reinvested dividend income at net asset value and reinvested capital gains distributions at net asset value, if any. The last dividend declared in the period, which is typically paid on the first business day of the following month, is assumed to be reinvested at the ending net asset value. The actual reinvest price for the last dividend declared in the period may often be based on the Fund’s market price (and not its net asset value), and therefore may be different from the price used in the calculation. Total returns are not annualized. |
| (c) | Ratios do not reflect the effect of dividend payments to Auction Rate Preferred shareholders; Net Investment Income ratios reflect income earned and expenses incurred on assets attributable to Auction Rate Preferred shares and/or Variable Rate Demand Preferred shares, where applicable. |
| (d) | After expense reimbursement from the Adviser, where applicable. Ratios do not reflect the effect of custodian fee credits earned on the Fund’s net cash on deposit with the custodian bank, where applicable. |
| (e) | The expense ratios reflect, among other things, payments to Variable Rate Demand Preferred shareholders and/or the interest expense deemed to have been paid by the Fund on the floating rate certificates issued by the special purpose trusts for the self-deposited inverse floaters held by the Fund, where applicable, each as described in Footnote 1 – General Information and Significant Accounting Policies, Variable Rate Demand Preferred Shares and Inverse Floating Rate Securities, respectively. |
| * | Rounds to less than $.01 per share. |
See accompanying notes to financial statements.
Nuveen Investments 107
Board Members & Officers (Unaudited)
| | | The management of the Funds, including general supervision of the duties performed for the Funds by the Adviser, is the responsibility of the Board Members of the Funds. The number of board members of the Fund is currently set at nine. None of the board members who are not “interested” persons of the Funds (referred to herein as “independent board members”) has ever been a director or employee of, or consultant to, Nuveen or its affiliates. The names and business addresses of the board members and officers of the Funds, their principal occupations and other affiliations during the past five years, the number of portfolios each oversees and other directorships they hold are set forth below. |
.
| | | | Position(s) Heldwith the Funds | | | | PrincipalOccupation(s)Including otherDirectorshipsDuring Past 5 Years | | |
| | | | | | | | | |
| Independent Board Members: | | | | | | | | |
| ■ | ROBERT P. BREMNER(2) 8/22/40 333 W. Wacker Drive Chicago, IL 60606 | | Chairman of the Board and Board Member | | 1996 | | Private Investor and Management Consultant; Treasurer and Director, Humanities Council of Washington, D.C. | | 206 |
| | | | | | | | | | |
| ■ | JACK B. EVANS 10/22/48 333 W. Wacker Drive Chicago, IL 60606 | | Board Member | | 1999 | | President, The Hall-Perrine Foundation, a private philanthropic corporation (since 1996); Director and Chairman, United Fire Group, a publicly held company; President Pro Tem of the Board of Regents for the State of Iowa University System; Director, Gazette Companies; Life Trustee of Coe College and the Iowa College Foundation; formerly, Director, Alliant Energy; formerly, Director, Federal Reserve Bank of Chicago; formerly, President and Chief Operating Officer, SCI Financial Group, Inc., a regional financial services firm. | | 206 |
| | | | | | | | | | |
| ■ | WILLIAM C. HUNTER 3/6/48 333 W. Wacker Drive Chicago, IL 60606 | | Board Member | | 2004 | | Dean, Tippie College of Business, University of Iowa (since 2006); Director (since 2004) of Xerox Corporation; Director (since 2005), Beta Gamma Sigma International Honor Society; formerly, Dean and Distinguished Professor of Finance, School of Business at the University of Connecticut (2003-2006); previously, Senior Vice President and Director of Research at the Federal Reserve Bank of Chicago (1995-2003); formerly, Director (1997-2007), Credit Research Center at Georgetown University. | | 206 |
| | | | | | | | | | |
| ■ | DAVID J. KUNDERT(2) 10/28/42 333 W. Wacker Drive Chicago, IL 60606 | | Board Member | | 2005 | | Director, Northwestern Mutual Wealth Management Company; retired (since 2004) as Chairman, JPMorgan Fleming Asset Management, President and CEO, Banc One Investment Advisors Corporation, and President, One Group Mutual Funds; prior thereto, Executive Vice President, Banc One Corporation and Chairman and CEO, Banc One Investment Management Group; Member, Board of Regents, Luther College; member of the Wisconsin Bar Association; member of Board of Directors, Friends of Boerner Botanical Gardens; member of Board of Directors and chair of Investment Committee, Greater Milwaukee Foundation. | | 206 |
| | | | | | | | | | |
| ■ | WILLIAM J. SCHNEIDER(2) 9/24/44 333 W. Wacker Drive Chicago, IL 60606 (2) | | Board Member | | 1997 | | Chairman of Miller-Valentine Partners Ltd., a real estate investment company; formerly, Senior Partner and Chief Operating Officer (retired, 2004) of Miller-Valentine Group; member, University of Dayton Business School Advisory Council;member, Mid-America Health System board; formerly, member and chair, Dayton Philharmonic Orchestra Association; formerly, member, Business Advisory Council, Cleveland Federal Reserve Bank. | | 206 |
108 Nuveen Investments
| | Name, Birthdate & Address | | Position(s) Held with the Funds | | Year First Elected or Appointed and Term(1) | | Principal Occupation(s) Including other Directorships During Past 5 Years | | Number of Portfolios in Fund Complex Overseen by Board Member |
| | | | | | | | | | |
| Independent Board Members: | | | | | | | | |
| ■ | JUDITH M. STOCKDALE 12/29/47 333 W. Wacker Drive Chicago, IL 60606 | | Board Member | | 1997 | | Executive Director, Gaylord and Dorothy Donnelley Foundation (since 1994); prior thereto, Executive Director, Great Lakes Protection Fund (1990-1994). | | 206 |
| | | | | | | | | | |
| ■ | CAROLE E. STONE(2) 6/28/47 333 W. Wacker Drive Chicago, IL 60606 | | Board Member | | 2007 | | Director, Chicago Board Options Exchange (since 2006); Director, C2 Options Exchange, Incorporated (since 2009); formerly, Commissioner, New York State Commission on Public Authority Reform (2010); formerly, Chair, New York Racing Association Oversight Board (2005-2007). | | 206 |
| | | | | | | | | | |
| ■ | TERENCE J. TOTH(2) 9/29/59 333 W. Wacker Drive Chicago, IL 60606 | | Board Member | | 2008 | | Director, Legal & General Investment Management America, Inc. (since 2008); Managing Partner, Promus Capital (since 2008); formerly, CEO and President, Northern Trust Global Investments (2004-2007); Executive Vice President, Quantitative Management & Securities Lending (2000-2004); prior thereto, various positions with Northern Trust Company (since 1994); member: Goodman Theatre Board (since 2004), Chicago Fellowship Boards (since 2005), University of Illinois Leadership Council Board (since 2007) and Catalyst Schools of Chicago Board (since 2008); formerly, member: Northern Trust Mutual Funds Board (2005-2007), Northern Trust Global Investments Board (2004-2007), Northern Trust Japan Board (2004-2007), Northern Trust Securities Inc. Board (2003-2007) and Northern Trust Hong Kong Board (1997-2004). | | 206 |
| | | | | | | | | | |
| Interested Board Member: | | | | | | | | |
| ■ | JOHN P. AMBOIAN(3) 6/14/61 333 W. Wacker Drive Chicago, IL 60606 | | Board Member | | 2008 | | Chief Executive Officer (since July 2007), Director (since 1999) and Chairman (since 2007) of Nuveen Investments, Inc.; Chief Executive Officer (since 2007) of Nuveen Asset Management, Nuveen Investments Advisors, Inc. | | 206 |
| | | | | | | | | | |
| Officers of the Funds: | | | | | | | | |
| ■ | GIFFORD R. ZIMMERMAN 9/9/56 333 W. Wacker Drive Chicago, IL 60606 | | Chief Administrative Officer | | 1988 | | Managing Director (since 2002), Assistant Secretary and Associate General Counsel of Nuveen Investments, LLC; Managing Director (since 2004) and Assistant Secretary (since 1994) of Nuveen Investments, Inc.; Managing Director, Associate General Counsel and Assistant Secretary, of Nuveen Asset Management (since 2002) and of Symphony Asset Management LLC, (since 2003); Vice President and Assistant Secretary of NWQ Investment Management Company, LLC. (since 2002), Nuveen Investments Advisers Inc. (since 2002), Tradewinds Global Investors, LLC, and Santa Barbara Asset Management, LLC (since 2006), Nuveen HydePark Group LLC and Nuveen Investment Solutions, Inc. (since 2007) and of Winslow Capital Management, Inc. (since 2010); Chief Administrative Officer and Chief Compliance Officer (since 2010) of Nuveen Commodities Asset Management, LLC; Chartered Financial Analyst. | | 206 |
Nuveen Investments 109
Board Members & Officers (Unaudited)(continued)
| | Name, Birthdate and Address | | Position(s) Held with the Funds | | Year First Elected or Appointed(4) | | Principal Occupation(s) During Past 5 Years | | Number of Portfolios in Fund Complex Overseen by Officer |
| | | | | | | | | | |
| Officers of the Funds: | | | | | | | | |
| ■ | WILLIAM ADAMS IV 6/9/55 333 W. Wacker Drive Chicago, IL 60606 | | Vice President | | 2007 | | Executive Vice President of Nuveen Investments, Inc.; Executive Vice President, U.S. Structured Products of Nuveen Investments, LLC, (since 1999),; Managing Director (since 2010) of Nuveen Commodities Asset Management, LLC. | | 131 |
| | | | | | | | | | |
| ■ | MARGO L. COOK 4/11/64 333 W. Wacker Drive Chicago, IL 60606 | | Vice President | | 2009 | | Executive Vice President (since 2008) of Nuveen Investments, Inc.; previously, Head of Institutional Asset Management (2007-2008) of Bear Stearns Asset Management; Head of Institutional Asset Management (1986-2007) of Bank of NY Mellon; Chartered Financial Analyst. | | 206 |
| | | | | | | | | | |
| ■ | LORNA C. FERGUSON 10/24/45 333 W. Wacker Drive Chicago, IL 60606 | | Vice President | | 1998 | | Managing Director (since 2004) of Nuveen Investments, LLC and Managing Director (since 2005) of Nuveen Asset Management. | | 206 |
| | | | | | | | | | |
| ■ | STEPHEN D. FOY 5/31/54 333 W. Wacker Drive Chicago, IL 60606 | | Vice President and Controller | | 1998 | | Senior Vice President (since 2010), formerly, Vice President (1993- 2010) and Funds Controller (since 1998) of Nuveen Investments, LLC; Senior Vice President (since 2010), formerly, Vice President (2005-2010) of Nuveen Asset Management; Certified Public Accountant. | | 206 |
| | | | | | | | | | |
| ■ | SCOTT S. GRACE 8/20/70 333 W. Wacker Drive Chicago, IL 60606 | | Vice President and Treasurer | | 2009 | | Managing Director, Corporate Finance & Development, Treasurer (since 2009) of Nuveen Investments, LLC; Managing Director and Treasurer of Nuveen Asset Management (since 2009); Nuveen Investment Solutions, Inc., Nuveen Investments Advisers, Inc., and Nuveen Investments Holdings, Inc.; Vice President and Treasurer of NWQ Investment Management Company, LLC, Tradewinds Global Investors, LLC, Symphony Asset Management LLC and Winslow Capital Management, Inc.; Vice President of Santa Barbara Asset Management, LLC; formerly, Treasurer (2006-2009), Senior Vice President (2008-2009), previously, Vice President (2006-2008) of Janus Capital Group, Inc.; formerly, Senior Associate in Morgan Stanley’s Global Financial Services Group (2000- 2003); Chartered Accountant Designation. | | 206 |
| | | | | | | | | | |
| ■ | WALTER M. KELLY 2/24/70 333 W. Wacker Drive Chicago, IL 60606 | | Chief Compliance Officer and Vice President | | 2003 | | Senior Vice President (since 2008), Vice President (2006-2008) formerly, Assistant Vice President and Assistant General Counsel (2003-2006) of Nuveen Investments, LLC; Senior Vice President (since 2008), formerly, Vice President (2006-2008) and Assistant Secretary (since 2008) of Nuveen Asset Management. | | 206 |
| | | | | | | | | | |
| ■ | TINA M. LAZAR 8/27/61 333 W. Wacker Drive Chicago, IL 60606 | | Vice President | | 2002 | | Senior Vice President (since 2009), formerly, Vice President of Nuveen Investments, LLC (1999-2009); Senior Vice President (since 2010), formerly, Vice President (2005-2010) of Nuveen Asset Management. | | 206 |
110 Nuveen Investments
| | Name, Birthdate and Address | | Position(s) Held with the Funds | | Year First Elected or Appointed(4) | | Principal Occupation(s) During Past 5 Years | | Number of Portfolios in Fund Complex Overseen by Officer |
| | | | | | | | | | |
| Officers of the Funds: | | | | | | | | |
| ■ | KEVIN J. MCCARTHY 3/26/66 333 W. Wacker Drive Chicago, IL 60606 | | Vice President and Secretary | | 2007 | | Managing Director (since 2008), formerly, Vice President (2007-2008), Nuveen Investments, LLC; Managing Director (since 2008), formerly, Vice President, and Assistant Secretary, Nuveen Asset Management, and Nuveen Investments Holdings, Inc.; Vice President (since 2007) and Assistant Secretary, Nuveen Investment Advisers Inc., NWQ Investment Management Company, LLC, Tradewinds Global Investors LLC, NWQ Holdings, LLC, Symphony Asset Management LLC, Santa Barbara Asset Management LLC, Nuveen HydePark Group, LLC and Nuveen Investment Solutions, Inc. (since 2007) and of Winslow Capital Management, Inc. (since 2010); Vice President and Secretary (since 2010) of Nuveen Commodities Asset Management, LLC; prior thereto, Partner, Bell, Boyd & Lloyd LLP (1997-2007). | | 206 |
| (1) | | For Dividend Advantage (NAD), Dividend Advantage 2 (NXZ) and Dividend Advantage 3 (NZF), the Board of Trustees is divided into three classes, Class I, Class II, and Class III, with each being elected to serve until the third succeeding annual shareholders’ meeting subsequent to its election or thereafter in each case when its respective successors are duly elected or appointed, except two board members are elected by the holders of Preferred Shares to serve until the next annual shareholders’ meeting subsequent to its election or thereafter in each case when its respective successors are duly elected or appointed. For Performance Plus (NPP), Municipal Advantage (NMA) and Market Opportunity (NMO), the Board Members serve a one year term to serve until the next annual meeting or until their successors shall have been duly elected and qualified. The year first elected or appointed represents the year in which the board member was firs t elected or appointed to any fund in the Nuveen Complex. |
| (2) | | Also serves as a trustee of the Nuveen Diversified Commodity Fund, an exchange-traded commodity pool managed by Nuveen Commodities Asset Management, LLC, an affiliate of Nuveen Asset Management. |
| (3) | | Mr. Amboian is an interested trustee because of his position with Nuveen Investments, Inc. and certain of its subsidiaries, which are affiliates of the Nuveen Funds. |
| (4) | | Officers serve one year terms through August of each year. The year first elected or appointed represents the year in which the Officer was first elected or appointed to any fund in the Nuveen Complex. |
Nuveen Investments 111
Annual Investment Management Agreement Approval Process (Unaudited)
The Investment Company Act of 1940, as amended (the “1940 Act”), provides, in substance, that each investment advisory agreement between a fund and its investment adviser will continue in effect from year to year only if its continuance is approved at least annually by the fund’s board members, including by a vote of a majority of the board members who are not parties to the advisory agreement or “interested persons” of any parties (the “Independent Board Members”), cast in person at a meeting called for the purpose of considering such approval. In connection with such approvals, the fund’s board members must request and evaluate, and the investment adviser is required to furnish, such inf ormation as may be reasonably necessary to evaluate the terms of the advisory agreement. Accordingly, at a meeting held on May 25-26, 2010 (the “May Meeting”), the Boards of Directors or Trustees (as the case may be) (each, a “Board” and each Director or Trustee, a “Board Member”) of the Funds, including a majority of the Independent Board Members, considered and approved the continuation of the advisory agreements (each, an “Advisory Agreement”) between each Fund and Nuveen Asset Management (the “Adviser”) for an additional one-year period. In preparation for their considerations at the May Meeting, the Board also held a separate meeting on April 21-22, 2010 (the ̶ 0;April Meeting”). Accordingly, the factors considered and determinations made regarding the renewals by the Independent Board Members include those made at the April Meeting.
In addition, in evaluating the Advisory Agreements, the Independent Board Members reviewed a broad range of information relating to the Funds and the Adviser, including absolute and comparative performance, fee and expense information for the Funds (as described in more detail below), the profitability of Nuveen for its advisory activities (which includes its wholly owned subsidiaries), and other information regarding the organization, personnel, and services provided by the Adviser. The Independent Board Members also met quarterly as well as at other times as the need arose during the year and took into account the information provided at such meetings and the knowledge gained therefrom. Prior to approving the renewal of the Advisory Agreements, the Independent Board Members reviewed the foregoing information with their independent legal counsel a nd with management, reviewed materials from independent legal counsel describing applicable law and their duties in reviewing advisory contracts, and met with independent legal counsel in private sessions without management present. The Independent Board Members considered the legal advice provided by independent legal counsel and relied upon their knowledge of the Adviser, its services and the Funds resulting from their meetings and other interactions throughout the year and their own business judgment in determining the factors to be considered in evaluating the Advisory Agreements. Each Board Member may have accorded different weight to the various factors in reaching his or her conclusions with respect to a Fund’s Advisory Agreement. The Independent Board Members did not identify any single factor as all-important or controlling. The Independent Board Members’ considerations were instead
based on a comprehensive consideration of all the information presented. The principal factors considered by the Board and its conclusions are described below.
A. Nature, Extent and Quality of Services
In considering renewal of the Advisory Agreements, the Independent Board Members considered the nature, extent and quality of the Adviser’s services, including advisory services and administrative services. The Independent Board Members reviewed materials outlining, among other things, the Adviser’s organization and business; the types of services that the Adviser or its affiliates provide and are expected to provide to the Funds; the performance record of the applicable Fund (as described in further detail below); and any initiatives Nuveen had taken for the applicable fund product line, including continued activities to refinance auction rate preferred securities, manage leverage during periods of market turbulence and implement an enhanced leverage management process, modify investment mandates in light of market conditions and se ek shareholder approval as necessary, maintain the fund share repurchase program and maintain shareholder communications to keep shareholders apprised of Nuveen’s efforts in refinancing preferred shares. In addition to the foregoing, the Independent Board Members also noted the additional services that the Adviser or its affiliates provide to closed-end funds, including, in particular, Nuveen’s continued commitment to supporting the secondary market for the common shares of its closed-end funds through a variety of programs designed to raise investor and analyst awareness and understanding of closed-end funds. These efforts include maintaining an investor relations program to provide timely information and education to financial advisers and investors; providing marketing for the closed-end funds; maintaining and enhancing a closed-end fund website; participating in conferences and having direct communications with analysts and financial advisors.
As part of their review, the Independent Board Members also evaluated the background, experience and track record of the Adviser’s investment personnel. In this regard, the Independent Board Members considered any changes in the personnel, and the impact on the level of services provided to the Funds, if any. The Independent Board Members also reviewed information regarding portfolio manager compensation arrangements to evaluate the Adviser’s ability to attract and retain high quality investment personnel, preserve stability, and reward performance but not provide an incentive for taking undue risks.
In addition to advisory services, the Independent Board Members considered the quality of administrative services provided by the Adviser and its affiliates including product management, fund administration, oversight of service providers, shareholder services, administration of Board relations, regulatory and portfolio compliance and legal support. Given the importance of compliance, the Independent Board Members also considered the Adviser’s compliance program, including the report of the chief compliance officer regarding the Funds’ compliance policies and procedures.
Based on their review, the Independent Board Members found that, overall, the nature, extent and quality of services provided (and expected to be provided) to the respective Funds under the Advisory Agreements were satisfactory.
B. The Investment Performance of the Funds and the Adviser
The Board considered the performance results of each Fund over various time periods. The Board reviewed, among other things, each Fund’s historic investment performance as well as information comparing the Fund’s performance information with that of other
Nuveen Investments 113
Annual Investment Management Agreement
Approval Process (Unaudited) (continued)
funds (the “Performance Peer Group”) based on data provided by an independent provider of mutual fund data and with recognized and/or customized benchmarks. In this regard, the Board reviewed each Fund’s total return information compared to its Performance Peer Group for the quarter, one-, three- and five-year periods ended December 31, 2009 and for the same periods ended March 31, 2010. In addition, the Board reviewed each Fund’s total return information compared to recognized and/or customized benchmarks for the quarter, one- and three-year periods ended December 31, 2009 and for the same periods ended March 31, 2010. Moreover, the Board reviewed the peer ranking of the Nuveen municipal funds advised by the Adviser in the aggregate. The Independent Board Members also reviewed historic premium and discount levels. This information supplemented the Fund performance information provided to the Board at each of its quarterly meetings. In reviewing peer comparison information, the Independent Board Members recognized that the Performance Peer Group of certain funds may not adequately represent the objectives and strategies of the funds, thereby limiting the usefulness of comparing a fund’s performance with that of its Performance Peer Group.
Based on their review, the Independent Board Members determined that each Fund’s investment performance over time had been satisfactory. In this regard, the Independent Board Members noted that the performance of the Nuveen Dividend Advantage Municipal Fund and the Nuveen Municipal Advantage Fund, Inc. (the “Municipal Advantage Fund”) over time was satisfactory compared to peers, falling within the second or third quartile over various periods. Further, they noted that although the Nuveen Dividend Advantage Municipal Fund 2, the Nuveen Dividend Advantage Municipal Fund 3 and the Nuveen Performance Plus Municipal Fund, Inc. (the “Performance Plus Municipal Fund”) lagged their peers somewhat in the short-term one-year period, they demonstrated more favorable performance in the longer three-and five-year periods. In addition, the Independent Board Members noted that although the Nuveen Municipal Market Opportunity Fund, Inc. (the “Municipal Market Opportunity Fund”) lagged its peers over various periods, it outperformed its benchmark in the one-year period.
C. Fees, Expenses and Profitability
| | 1. Fees and Expenses |
| | The Board evaluated the management fees and expenses of each Fund reviewing, among other things, such Fund’s gross management fees, net management fees and net expense ratios in absolute terms as well as compared to the fee and expenses of a comparable universe of funds based on data provided by an independent fund data provider (the “Peer Universe”) and in certain cases, to a more focused subset of funds in the Peer Universe (the “Peer Group”) and any expense limitations. |
| | |
| | The Independent Board Members further reviewed the methodology regarding the construction of the applicable Peer Universe and/or Peer Group. In reviewing the comparisons of fee and expense information, the Independent Board Members took into account that in certain instances various factors such as: the asset level of a fund relative to peers; the limited size and particular composition of the Peer Universe or Peer Group; the investment objectives of the peers; expense anomalies; changes in the funds comprising the Peer Universe or Peer Group from year to year; levels of reimbursement; the timing of information used; and the differences in the type and |
| | use of leverage may impact the comparative data, thereby limiting the ability to make a meaningful comparison with peers. |
| | |
| | In reviewing the fee schedule for a Fund, the Independent Board Members also considered the fund-level and complex-wide breakpoint schedules (described in further detail below) and any fee waivers and reimbursements provided by Nuveen (applicable, in particular, for certain closed-end funds launched since 1999). The Independent Board Members recognized that the Municipal Advantage Fund, the Municipal Market Opportunity Fund and the Performance Plus Municipal Fund each had net advisory fees above the peer average but net expense ratios below, at or near the peer expense ratio average. Each other Fund had management fees and/or a net expense ratio below, at or near (within 5 basis points or less) the peer average of its Peer Group or Peer Universe. |
| | |
| | Based on their review of the fee and expense information provided, the Independent Board Members determined that each Fund’s management fees were reasonable in light of the nature, extent and quality of services provided to the Fund. |
| | |
| | 2. Comparisons with the Fees of Other Clients |
| | The Independent Board Members further reviewed information regarding the nature of services and fee rates offered by the Adviser to other clients, including municipal separately managed accounts and passively managed municipal bond exchange traded funds (ETFs) that are sub-advised by the Adviser. In evaluating the comparisons of fees, the Independent Board Members noted that the fee rates charged to the Funds and other clients vary, among other things, because of the different services involved and the additional regulatory and compliance requirements associated with registered investment companies, such as the Funds. Accordingly, the Independent Board Members considered the differences in the product types, including, but not limited to, the services provided, the structure and operations, product distribution and costs thereof, portfolio investme nt policies, investor profiles, account sizes and regulatory requirements. The Independent Board Members noted, in particular, that the range of services provided to the Funds (as discussed above) is much more extensive than that provided to separately managed accounts. Given the inherent differences in the products, particularly the extensive services provided to the Funds, the Independent Board Members believe such facts justify the different levels of fees. |
| | |
| | 3. Profitability of Nuveen |
| | In conjunction with its review of fees, the Independent Board Members also considered the profitability of Nuveen for its advisory activities (which incorporated Nuveen’s wholly-owned affiliated sub-advisers) and its financial condition. The Independent Board Members reviewed the revenues and expenses of Nuveen’s advisory activities for the last two years, the allocation methodology used in preparing the profitability data and an analysis of the key drivers behind the changes in revenues and expenses that impacted profitability in 2009. The Independent Board Members noted this information supplemented the profitability information requested and received during the year to help keep them apprised of developments affecting profitability (such as changes in fee waivers and expense reimbursement commitments). In this regard, the Independent Board Members noted that they had also appointed an Independent Board Member as a point person to review and keep them apprised of changes to the profitability analysis |
Annual Investment Management Agreement
Approval Process (Unaudited) (continued)
| | and/or methodologies during the year. The Independent Board Members also considered Nuveen’s revenues for advisory activities, expenses, and profit margin compared to that of various unaffiliated management firms with similar amounts of assets under management and relatively comparable asset composition prepared by Nuveen. In reviewing profitability, the Independent Board Members recognized the subjective nature of determining profitability, which may be affected by numerous factors including the allocation of expenses. Further, the Independent Board Members recognized the difficulties in making comparisons as the profitability of other advisers generally is not publicly available and the profitability information that is available for certain advisers or management firms may not be representative of the industry and may be affected by, among other things, the adviser’s particular business mix, capital costs, types of funds managed and expense allocations. Notwithstanding the foregoing, the Independent Board Members reviewed Nuveen’s methodology and assumptions for allocating expenses across product lines to determine profitability. In reviewing prof itability, the Independent Board Members recognized Nuveen’s investment in its fund business. Based on their review, the Independent Board Members concluded that Nuveen’s level of profitability for its advisory activities was reasonable in light of the services provided.
In evaluating the reasonableness of the compensation, the Independent Board Members also considered other amounts paid to the Adviser by the Funds as well as any indirect benefits (such as soft dollar arrangements, if any) the Adviser and its affiliates receive, or are expected to receive, that are directly attributable to the management of the Funds, if any. See Section E below for additional information on indirect benefits the Adviser may receive as a result of its relationship with the Funds. Based on their review of the overall fee arrangements of each Fund, the Independent Board Members determined that the advisory fees and expenses of the respective Fund were reasonable. |
D. Economies of Scale and Whether Fee Levels Reflect These Economies of Scale
With respect to economies of scale, the Independent Board Members have recognized the potential benefits resulting from the costs of a fund being spread over a larger asset base, although economies of scale are difficult to measure and predict with precision, particularly on a fund-by-fund basis. One method to help ensure the shareholders share in these benefits is to include breakpoints in the advisory fee schedule. Generally, management fees for funds in the Nuveen complex are comprised of a fund-level component and a complex-level component, subject to certain exceptions. Accordingly, the Independent Board Members reviewed and considered the applicable fund-level breakpoints in the advisory fee schedules that reduce advisory fees as asset levels increase. Further, the Independent Board Members noted that although closed-end funds may from tim e-to-time make additional share offerings, the growth of their assets will occur primarily through the appreciation of such funds’ investment portfolio.
In addition to fund-level advisory fee breakpoints, the Board also considered the Funds’ complex-wide fee arrangement. Pursuant to the complex-wide fee arrangement, the fees of the funds in the Nuveen complex are generally reduced as the assets in the fund complex reach certain levels. The complex-wide fee arrangement seeks to provide the benefits of economies of scale to fund shareholders when total fund complex assets
increase, even if assets of a particular fund are unchanged or have decreased. The approach reflects the notion that some of Nuveen’s costs are attributable to services provided to all its funds in the complex and therefore all funds benefit if these costs are spread over a larger asset base.
Based on their review, the Independent Board Members concluded that the breakpoint schedules and complex-wide fee arrangement were acceptable and reflect economies of scale to be shared with shareholders when assets under management increase.
E. Indirect Benefits
In evaluating fees, the Independent Board Members received and considered information regarding potential “fall out” or ancillary benefits the Adviser or its affiliates may receive as a result of its relationship with each Fund. In this regard, the Independent Board Members considered any revenues received by affiliates of the Adviser for serving as agent at Nuveen’s trading desk and as co-manager in initial public offerings of new closed-end funds.
In addition to the above, the Independent Board Members considered whether the Adviser received any benefits from soft dollar arrangements whereby a portion of the commissions paid by a Fund for brokerage may be used to acquire research that may be useful to the Adviser in managing the assets of the Funds and other clients. The Independent Board Members noted that the Adviser does not currently have any soft dollar arrangements; however, to the extent certain bona fide agency transactions that occur on markets that traditionally trade on a principal basis and riskless principal transactions are considered as generating “commissions,” the Adviser intends to comply with the applicable safe harbor provisions.
Based on their review, the Independent Board Members concluded that any indirect benefits received by the Adviser as a result of its relationship with the Funds were reasonable and within acceptable parameters.
F. Other Considerations
The Independent Board Members did not identify any single factor discussed previously as all-important or controlling. The Board Members, including the Independent Board Members, unanimously concluded that the terms of the Advisory Agreements are fair and reasonable, that the Adviser’s fees are reasonable in light of the services provided to each Fund and that the Advisory Agreements be renewed.
Reinvest Automatically
Easily and Conveniently
Nuveen makes reinvesting easy. A phone call is all it takes to set up your reinvestment account.
Nuveen Closed-End Funds Dividend Reinvestment Plan
Your Nuveen Closed-End Fund allows you to conveniently reinvest dividends and/or capital gains distributions in additional Fund shares.
By choosing to reinvest, you’ll be able to invest money regularly and automatically, and watch your investment grow through the power of tax-free compounding. Just like dividends or distributions in cash, there may be times when income or capital gains taxes may be payable on dividends or distributions that are reinvested.
It is important to note that an automatic reinvestment plan does not ensure a profit, nor does it protect you against loss in a declining market.
Easy and convenient
To make recordkeeping easy and convenient, each month you’ll receive a statement showing your total dividends and distributions, the date of investment, the shares acquired and the price per share, and the total number of shares you own.
How shares are purchased
The shares you acquire by reinvesting will either be purchased on the open market or newly issued by the Fund. If the shares are trading at or above net asset value at the time of valuation, the Fund will issue new shares at the greater of the net asset value or 95% of the then-current market price. If the shares are trading at less than net asset value, shares for your account will be purchased on the open market. If the Plan Agent begins purchasing Fund shares on the open market while shares are trading below net asset value, but the Fund’s shares subsequently trade at or above their net asset value before the Plan Agent is able to complete its purchases, the Plan Agent may cease open-market purchases and may invest the uninvested portion of the distribution in newly-issued Fund shares at a price equal to the greater of the shares’ ne t asset value or 95% of the shares’ market value on the last business day immediately prior to the purchase date. Dividends and distributions received to purchase shares in the open market will normally be invested shortly after the dividend payment date. No interest will be paid on dividends and distributions awaiting reinvestment. Because the market price of the shares may increase before purchases are completed, the average purchase price
per share may exceed the market price at the time of valuation, resulting in the acquisition of fewer shares than if the dividend or distribution had been paid in shares issued by the Fund. A pro rata portion of any applicable brokerage commissions on open market purchases will be paid by Plan participants. These commissions usually will be lower than those charged on individual transactions.
Flexible
You may change your distribution option or withdraw from the Plan at any time, should your needs or situation change.
You can reinvest whether your shares are registered in your name, or in the name of a brokerage firm, bank, or other nominee. Ask your investment advisor if his or her firm will participate on your behalf. Participants whose shares are registered in the name of one firm may not be able to transfer the shares to another firm and continue to participate in the Plan.
The Fund reserves the right to amend or terminate the Plan at any time. Although the Fund reserves the right to amend the Plan to include a service charge payable by the participants, there is no direct service charge to participants in the Plan at this time.
Call today to start reinvesting dividends and/or distributions
For more information on the Nuveen Automatic Reinvestment Plan or to enroll in or withdraw from the Plan, speak with your financial advisor or call us at (800) 257-8787.
Glossary of Terms
Used in this Report
| ■ | Auction Rate Bond: An auction rate bond is a security whose interest payments are adjusted periodically through an auction process, which process typically also serves as a means for buying and selling the bond. Auctions that fail to attract enough buyers for all the shares offered for sale are deemed to have “failed,” with current holders receiving a formula-based interest rate until the next scheduled auction. |
| | |
| Average Annual Total Return: This is a commonly used method to express an investment’s performance over a particular, usually multi-year time period. It expresses the return that would have been necessary each year to equal the investment’s actual cumulative performance (including change in NAV or market price and reinvested dividends and capital gains distributions, if any) over the time period being considered. |
| | |
| Average Effective Maturity: The market-value-weighted average of the effective maturity dates of the individual securities including cash. In the case of a bond that has been advance-refunded to a call date, the effective maturity is the date on which the bond is scheduled to be redeemed using the proceeds of an escrow account. In most other cases the effective maturity is the stated maturity date of the security. |
| | |
■ | Inverse Floaters: Inverse floating rate securities, also known as inverse floaters, are created by depositing a municipal bond, typically with a fixed interest rate, into a special purpose trust created by a broker-dealer. This trust, in turn, (a) issues floating rate certificates typically paying short-term tax-exempt interest rates to third parties in amounts equal to some fraction of the deposited bond’s par amount or market value, and (b) issues an inverse floating rate certificate (sometimes referred to as an “inverse floater”) to an investor (such as a Fund) interested in gaining investment exposure to a long-term municipal bond. The income received by the holder of the inverse floater varies inversely with the short-term rate paid to the floating ra te certificates’ holders, and in most circumstances the holder of the inverse floater bears substantially all of the underlying bond’s downside investment risk. The holder of the inverse floater typically also benefits disproportionately from any potential appreciation of the underlying bond’s value. Hence, an inverse floater essentially represents an investment in the underlying bond on a leveraged basis. |
| Leverage-Adjusted Duration: Duration is a measure of the expected period over which a bond’s principal and interest will be paid, and consequently is a measure of the sensitivity of a bond’s or bond Fund’s value to changes when market interest rates change. Generally, the longer a bond’s or Fund’s duration, the more the price of the bond or Fund will change as interest rates change. Leverage-adjusted duration takes into account the leveraging process for a Fund and therefore is longer than the duration of the Fund’s portfolio of bonds. |
| | |
| Market Yield (also known as Dividend Yield or Current Yield): An investment’s current annualized dividend divided by its current market price. |
| | |
| Net Asset Value (NAV): A Fund’s NAV per common share is calculated by subtracting the liabilities of the Fund (including any Preferred shares issued in order to leverage the Fund) from its total assets and then dividing the remainder by the number of common shares outstanding. Fund NAVs are calculated at the end of each business day. |
| | |
| Pre-refunding: Pre-refunding, also known as advanced refundings or refinancings, is a procedure used by state and local governments to refinance municipal bonds to lower interest expenses. The issuer sells new bonds with a lower yield and uses the proceeds to buy U.S. Treasury securities, the interest from which is used to make payments on the higher-yielding bonds. Because of this collateral, pre-refunding generally raises a bond’s credit rating and thus its value. |
| | |
| Taxable-Equivalent Yield: The yield necessary from a fully taxable investment to equal, on an after-tax basis, the yield of a municipal bond investment. |
| | |
■ | Zero Coupon Bond: A zero coupon bond does not pay a regular interest coupon to its holders during the life of the bond. Tax-exempt income to the holder of the bond comes from accretion of the difference between the original purchase price of the bond at issuance and the par value of the bond at maturity and is effectively paid at maturity. The market prices of zero coupon bonds generally are more volatile than the market prices of bonds that pay interest periodically. |
Notes
Notes
Notes
Other Useful Information
Board of Directors/Trustees John P. Amboian Robert P. Bremner Jack B. Evans William C. Hunter David J. Kundert William J. Schneider Judith M. Stockdale Carole E. Stone Terence J. Toth |
| |
Fund Manager Nuveen Asset Management 333 West Wacker Drive Chicago, IL 60606 |
| |
| |
Custodian State Street Bank & Trust Company Boston, MA |
| |
Transfer Agent and Shareholder Services State Street Bank & Trust Company Nuveen Funds P.O. Box 43071 Providence, RI 02940-3071 (800) 257-8787 |
| |
Legal Counsel Chapman and Cutler LLP Chicago, IL |
| |
Independent Registered Public Accounting Firm Ernst & Young LLP Chicago, IL |
Quarterly Portfolio of Investments and Proxy Voting Information
You may obtain (i) each Fund’s quarterly portfolio of investments, (ii) information regarding how the Funds voted proxies relating to portfolio securities held during the most recent twelve-month period ended June 30, and (iii) a description of the policies and procedures that the Funds used to determine how to vote proxies relating to portfolio securities without charge, upon request, by calling Nuveen Investments toll-free at (800) 257-8787 or on Nuveen’s website at www.nuveen.com.
You may also obtain this and other Fund information directly from the Securities and Exchange Commission (SEC). The SEC may charge a copying fee for this information. Visit the SEC on-line at http://www.sec.gov or in person at the SEC’s Public Reference Room in Washington, D.C. Call the SEC at (202) 942-8090 for room hours and operation. You may also request Fund information by sending an e-mail request to publicinfo@sec.gov or by writing to the SEC’s Public References Section at 100 F Street NE, Washington, D.C. 20549.
CEO Certification Disclosure
Each Fund’s Chief Executive Officer (CEO) has submitted to the New York Stock Exchange (NYSE) the annual CEO certification as required by Section 303A.12(a) of the NYSE Listed Company Manual.
Each Fund has filed with the SEC the certification of its Chief Executive Officer and Chief Financial Officer required by Section 302 of the Sarbanes-Oxley Act.
Common and Preferred Share Information
Each Fund intends to repurchase and/or redeem shares of its own common and/or auction rate preferred stock in the future at such times and in such amounts as is deemed advisable. During the period covered by this report, the Funds repurchased and/or redeemed shares of their common and/or auction rate preferred stock as shown in the accompanying table.
| | | |
| Fund | Common Shares Repurchased | Auction Rate Preferred Shares Redeemed |
| NPP | — | — |
| NMA | — | 11,728 |
| NMO | — | 13,867 |
| NAD | — | 5,669 |
| NXZ | — | — |
| NZF | — | — |
Any future repurchases and/or redemptions will be reported to shareholders in the next annual or semi-annual report.
Nuveen Investments:
Serving Investors for Generations
Since 1898, financial advisors and their clients have relied on Nuveen Investments to provide dependable investment solutions through continued adherence to proven, long-term investing principles. Today, we offer a range of high quality equity and fixed-income solutions designed to be integral components of a well-diversified core portfolio.
Focused on meeting investor needs.
Nuveen Investments is a global investment management firm that seeks to help secure the long-term goals of institutions and high net worth investors as well as the consultants and financial advisors who serve them. We market our growing range of specialized investment solutions under the high-quality brands of HydePark, NWQ, Nuveen, Santa Barbara, Symphony, Tradewinds and Winslow Capital. In total, Nuveen Investments managed more than $160 billion of assets on September 30, 2010.
Find out how we can help you.
To learn more about how the products and services of Nuveen Investments may be able to help you meet your financial goals, talk to your financial advisor, or call us at (800) 257-8787. Please read the information provided carefully before you invest. Investors should consider the investment objective and policies, risk considerations, charges and expenses of any investment carefully. Where applicable, be sure to obtain a prospectus, which contains this and other relevant information. To obtain a prospectus, please contact your securities representative or Nuveen Investments, 333 W. Wacker Dr., Chicago, IL 60606. Please read the prospectus carefully before you invest or send money. Learn more about Nuveen Funds at: www.nuveen.com/cef
| Nuveen makes things e-simple. |
| |
| It only takes a minute to sign up for e-Reports. Once enrolled, you’ll receive an e-mail as soon as your Nuveen Investments Fund information is ready—no more waiting for delivery by regular mail. Just click on the link within the e-mail to see the report and save it on your computer if you wish. |
| |
| Free e-Reports right to your e-mail! |
| |
| www.investordelivery.com |
| |
| If you receive your Nuveen Fund distributions and statements from your financial advisor or brokerage account. |
| |
| OR |
| |
| www.nuveen.com/accountaccess |
| |
| If you receive your Nuveen Fund distributions and statements directly from Nuveen. |
Distributed by
Nuveen Investments, LLC
333 West Wacker Drive
Chicago, IL 60606
www.nuveen.com
EAN B-1010D
ITEM 2. CODE OF ETHICS.
As of the end of the period covered by this report, the registrant has adopted a code of ethics that applies to the registrant's principal executive officer, principal financial officer, principal accounting officer or controller, or persons performing similar functions. There were no amendments to or waivers from the Code during the period covered by this report. The registrant has posted the code of ethics on its website at www.nuveen.com/CEF/Info/Shareholder. (To view the code, click on Fund Governance and then click on Code of Conduct.)
ITEM 3. AUDIT COMMITTEE FINANCIAL EXPERT.
Mr. Evans was formerly President and Chief Operating Officer of SCI Financial Group, Inc., a full service registered broker-dealer and registered investment adviser ("SCI"). As part of his role as President and Chief Operating Officer, Mr. Evans actively supervised the Chief Financial Officer (the "CFO") and actively supervised the CFO's preparation of financial statements and other filings with various regulatory authorities. In such capacity, Mr. Evans was actively involved in the preparation of SCI's financial statements and the resolution of issues raised in connection therewith. Mr. Evans has also served on the audit committee of various reporting companies. At such companies, Mr. Evans was involved in the oversight of audits, audit plans, and the preparation of financial statements. Mr. Evans also formerly chaired the audit committe e of the Federal Reserve Bank of Chicago.
ITEM 4. PRINCIPAL ACCOUNTANT FEES AND SERVICES.
Nuveen Municipal Advantage Fund, Inc.
The following tables show the amount of fees that Ernst & Young LLP, the Fund's auditor, billed to the Fund during the Fund's last two full fiscal years. For engagements with Ernst & Young LLP the Audit Committee approved in advance all audit services and non-audit services that Ernst & Young LLP provided to the Fund, except for those non-audit services that were subject to the pre-approval exception under Rule 2-01 of Regulation S-X (the "pre-approval exception"). The pre-approval exception for services provided directly to the Fund waives the pre-approval requirement for services other than audit, review or attest services if: (A) the aggregate amount of all such services provided constitutes no more than 5% of the total amount of revenues paid by the Fund to its accountant during the fiscal year in which the services are pr ovided; (B) the Fund did not recognize the services as non-audit services at the time of the engagement; and (C) the services are promptly brought to the Audit Committee's attention, and the Committee (or its delegate) approves the services before the audit is completed.
The Audit Committee has delegated certain pre-approval responsibilities to its Chairman (or, in his absence, any other member of the Audit Committee).
SERVICES THAT THE FUND'S AUDITOR BILLED TO THE ADVISER AND AFFILIATED FUND SERVICE PROVIDERS
The tables also show the percentage of fees subject to the pre-approval exception. The pre-approval exception for services provided to the Adviser and any Affiliated Fund Service Provider (other than audit, review or attest services) waives the pre-approval requirement if: (A) the aggregate amount of all such services provided constitutes no more than 5% of the total amount of revenues paid to Ernst & Young LLP by the Fund, the Adviser and Affiliated Fund Service Providers during the fiscal year in which the services are provided that would have to be pre-approved by the Audit Committee; (B) the Fund did not recognize the services as non-audit services at the time of the engagement; and (C) the services are promptly brought to the Audit Committee's attention, and the Committee (or its delegate) approves the services before the Fund's audit is completed.
The following table shows the amount of fees that Ernst & Young LLP billed during the Fund's last two full fiscal years for non-audit services. The Audit Committee is required to pre-approve non-audit services that Ernst & Young LLP provides to the Adviser and any Affiliated Fund Services Provider, if the engagement related directly to the Fund's operations and financial reporting (except for those subject to the pre-approval exception described above). The Audit Committee requested and received information from Ernst & Young LLP about any non-audit services that Ernst & Young LLP rendered during the Fund's last fiscal year to the Adviser and any Affiliated Fund Service Provider. The Committee considered this information in evaluating Ernst & Young LLP's independence.
Audit Committee Pre-Approval Policies and Procedures. Generally, the Audit Committee must approve (i) all non-audit services to be performed for the Fund by the Fund's independent accountants and (ii) all audit and non-audit services to be performed by the Fund's independent accountants for the Affiliated Fund Service Providers with respect to operations and financial reporting of the Fund. Regarding tax and research projects conducted by the independent accountants for the Fund and Affiliated Fund Service Providers (with respect to operations and financial reports of the Fund) such engagements will be (i) pre-approved by the Audit Committee if they are expected to be for amounts greater than $10,000; (ii) reported to the Audit Committee chairman for his verbal approval prior to engagement if they are expected to be for amounts under $10, 000 but greater than $5,000; and (iii) reported to the Audit Committee at the next Audit Committee meeting if they are expected to be for an amount under $5,000.
ITEM 5. AUDIT COMMITTEE OF LISTED REGISTRANTS.
ITEM 6. SCHEDULE OF INVESTMENTS.
a) See Portfolio of Investments in Item 1.
b) Not applicable.
ITEM 7. DISCLOSURE OF PROXY VOTING POLICIES AND PROCEDURES FOR CLOSED-END MANAGEMENT INVESTMENT COMPANIES.
The registrant invests its assets primarily in municipal bonds and cash management securities. The registrant also may invest in shares of investment companies that in turn invest primarily in municipal bonds.
The registrant has adopted the proxy voting policies and procedures of Nuveen Asset Management to govern the voting of proxies with respect to that fund. In the event that a municipal issuer were to issue a proxy or that the registrant were to receive a proxy issued by the issuer of a cash management security or municipal bond-oriented investment company, Nuveen Asset Management (as defined below) has approved and adopted the proxy voting policies of an independent third party, Institutional Shareholder Services, Inc. (“ISS”) to determine how the proxy should be voted. It has also engaged ISS to apprise Nuveen Asset Management of shareholder meeting dates, to provide research on proxy proposals and voting recommendations and to c ast the actual proxy votes. In addition, ISS also serves as Nuveen Asset Management’s proxy voting record keeper. Nuveen Asset Management’s Investment Policy Committee (“IPC”), comprised of the firm’s most senior investment professionals, is charged with the overall oversight of proxy voting policies and procedures, including the activities of the firm’s Proxy Voting Committee (“PVC”), which is responsible for providing an administrative framework to facilitate and monitor proxy voting, including oversight of the firm’s relationship with ISS.
From time to time, a portfolio manager may initiate action to override an ISS recommendation for a particular vote. Such override will be reviewed by Nuveen Asset Management’s legal department for material conflicts and if it is determined that no material conflicts exist, the approval of one investment professional on the IPC or Nuveen Asset Management’s Head of Equity Research shall authorize the override.
Nuveen Asset Management recognizes that there are circumstances where it may have a perceived or real conflict of interest in voting proxies and will vote proxies in the best interest of its clients regardless of any such real or perceived conflicts of interest. By adopting ISS policies, Nuveen Asset Management believes the risk related to conflicts will be minimized. To further minimize this risk, the IPC will review ISS’ conflict avoidance policy at least annually to ensure that it adequately addresses both the actual and perceived conflicts of interest the proxy voting service may face.
In the event ISS faces a material conflict of interest with respect to a specific vote, the PVC shall direct ISS how to vote after receiving voting direction from the Head of Research, who will seek voting direction from the appropriate investment personnel, after confirming that Nuveen Asset Management faces no material conflicts of its own with respect to the specific proxy vote. If the PVC concludes that a material conflict does exist, it will recommend to the IPC a course of action designed to address the conflict. Such actions could include, but are not limited to: (1) obtaining instructions from the affected client(s) on how to vote the proxy; (2) disclosing the conflict to the affected client(s) and seeking their consent to permit Nuveen Asset M anagement to vote the proxy; (3) voting in proportion to the other shareholders; (4) recusing an IPC member from all discussion or consideration of the matter, if the material conflict is due to such person’s actual or potential conflict of interest; or (5) following the recommendation of a different independent third party.
In addition to all of the above-mentioned and other conflicts, members of the IPC and the PVC must notify Nuveen Asset Management’s Chief Compliance Officer of any direct, indirect or perceived improper influence exerted by any employee, officer or director within Nuveen Asset Management, its affiliates or the Fund complex with regard to how Nuveen Asset Management should vote proxies. The Chief Compliance Officer will investigate the allegations and will report the findings to Nuveen Asset Management’s President and the General Counsel. If it is determined that improper influence was attempted, appropriate action shall be taken. Such appropriate action may include disciplinary action, notification of the appropriate senior managers, or notification o f the appropriate regulatory authorities. In all cases, the IPC shall not consider any improper influence in determining how to vote proxies, and will vote in the best interests of clients.
On rare occasions the registrant may acquire, directly or through a special purpose vehicle, equity securities of a municipal bond issuer whose bonds the registrant already owns when such bonds have deteriorated or are expected shortly to deteriorate significantly in credit quality. The purpose of acquiring such equity securities generally will be to acquire control of the municipal bond issuer and to seek to prevent the credit deterioration or facilitate the liquidation or other workout of the distressed issuer’s credit problem. In the course of exercising control of a distressed municipal issuer, Nuveen Asset Management may pursue the registrant’s interests in a variety of ways, which may entail negotiating and executing consen ts, agreements and other arrangements, and otherwise influencing the management of the issuer. Neither the registrant nor Nuveen Asset Management considers such control activities proxy voting for purposes of Rule 206(4)-6 under the 1940 Act, but nevertheless provides reports to the registrant’s Board on any such control activities on a quarterly basis.
ITEM 8. PORTFOLIO MANAGERS OF CLOSED-END MANAGEMENT INVESTMENT COMPANIES.
Nuveen Fund Advisors, Inc. is the registrant's investment adviser (also referred to as the "Adviser"). The Adviser is responsible for the selection and on-going monitoring of the Fund's investment portfolio, managing the Fund's business affairs and providing certain clerical, bookkeeping and administrative services. The Adviser has engaged Nuveen Asset Management, LLC (“Nuveen Asset Management” or “Sub-Adviser”) as Sub-Adviser to provide discretionary investment advisory services. The following section provides information on the portfolio manager at the Sub-Adviser:
The following individual has primary responsibility for the day-to-day implementation of the registrant’s investment strategies:
Thomas Spalding, CFA, is Vice President and Senior Investment Officer of Nuveen Investments. He has direct investment responsibility for the National Long Term funds. He joined Nuveen in 1976 as assistant portfolio manager and has been the portfolio manager of the Nuveen Municipal Value Fund, Nuveen's first closed-end exchange traded fund, since its inception in 1987. Currently, he manages investments for 21 Nuveen-sponsored investment companies.
ITEM 9. PURCHASES OF EQUITY SECURITIES BY CLOSED-END MANAGEMENT INVESTMENT COMPANY AND AFFILIATED PURCHASERS.
Not applicable.
ITEM 10. SUBMISSION OF MATTERS TO A VOTE OF SECURITY HOLDERS.
There have been no material changes to the procedures by which shareholders may recommend nominees to the registrant's Board implemented after the registrant last provided disclosure in response to this item.
ITEM 11. CONTROLS AND PROCEDURES.
ITEM 12. EXHIBITS.
File the exhibits listed below as part of this Form. Letter or number the exhibits in the sequence indicated.
Pursuant to the requirements of the Securities Exchange Act of 1934 and the Investment Company Act of 1940, the registrant has duly caused this report to be signed on its behalf by the undersigned, thereunto duly authorized.
Kevin J. McCarthy
Pursuant to the requirements of the Securities Exchange Act of 1934 and the Investment Company Act of 1940, this report has been signed below by the following persons on behalf of the registrant and in the capacities and on the dates indicated.
Gifford R. Zimmerman
Stephen D. Foy