Washington, D.C. 20549
Nuveen Municipal Advantage Fund, Inc.
Kevin J. McCarthy
Form N-CSR is to be used by management investment companies to file reports with the Commission not later than 10 days after the transmission to stockholders of any report that is required to be transmitted to stockholders under Rule 30e-1 under the Investment Company Act of 1940 (17 CFR 270.30e-1). The Commission may use the information provided on Form N-CSR in its regulatory, disclosure review, inspection, and policymaking roles.
A registrant is required to disclose the information specified by Form N-CSR, and the Commission will make this information public. A registrant is not required to respond to the collection of information contained in Form N-CSR unless the Form displays a currently valid Office of Management and Budget (“OMB”) control number. Please direct comments concerning the accuracy of the information collection burden estimate and any suggestions for reducing the burden to Secretary, Securities and Exchange Commission, 450 Fifth Street, NW, Washington, DC 20549-0609. The OMB has reviewed this collection of information under the clearance requirements of 44 U.S.C. ss. 3507.
ITEM 1. REPORTS TO STOCKHOLDERS.
Life is Complex
Nuveen makes things e-simple.
It only takes a minute to sign up for e-Reports. Once enrolled, you’ll receive an e-mail as soon as your Nuveen Investments Fund information is ready—no more waiting for delivery by regular mail. Just click on the link within the e-mail to see the report and save it on your computer if you wish.
Free e-Reports right to your e-mail!
www.investordelivery.com
If you receive your Nuveen Fund dividends and statements from your financial advisor or brokerage account.
or
www.nuveen.com/accountaccess
If you receive your Nuveen Fund dividends and statements directly from Nuveen.
Table of Contents
| Chairman’s Letter to Shareholders | 4 |
| | |
| Portfolio Managers’ Comments | 5 |
| | |
| Fund Leverage | 11 |
| | |
| Common Share Information | 13 |
| | |
| Risk Considerations | 15 |
| | |
| Performance Overview and Holding Summaries | 16 |
| | |
| Shareholder Meeting Report | 22 |
| | |
| Report of Independent Registered Public Accounting Firm | 24 |
| | |
| Portfolios of Investments | 25 |
| | |
| Statement of Assets and Liabilities | 99 |
| | |
| Statement of Operations | 101 |
| | |
| Statement of Changes in Net Assets | 102 |
| | |
| Statement of Cash Flows | 104 |
| | |
| Financial Highlights | 106 |
| | |
| Notes to Financial Statements | 115 |
| | |
| Board Members & Officers | 127 |
| | |
| Annual Investment Management Agreement Approval Process | 132 |
| | |
| Reinvest Automatically, Easily and Conveniently | 140 |
| | |
| Glossary of Terms Used in this Report | 141 |
| | |
| Additional Fund Information | 143 |
Chairman’s Letter to Shareholders
Dear Shareholders,
I am pleased to have this opportunity to introduce myself to you as the new independent chairman of the Nuveen Fund Board, effective July 1, 2013. I am honored to have been selected as chairman, with its primary responsibility to serve the interests of the Nuveen Fund shareholders. My predecessor, Robert Bremner, was the first independent director to serve as chairman of the Board and I, and my fellow Board members, plan to continue his legacy of strong independent oversight of your funds.
The global economy has hit major turning points over the last several months to a year. The developed world is gradually recovering from their financial crisis while the emerging markets appear to be struggling with the downshift of China’s growth potential. Japan is entering a new era of growth after decades of economic stagnation and many of the Eurozone nations appear to be exiting their recession. Despite the positive events, there are still potential risks. Middle East tensions, rising oil prices, defaults in Europe and fallout from the financial stress in emerging markets could all reverse the recent progress in the global economy.
On the domestic front, recent events such as the Federal Reserve decision to slow down its bond buying program beginning in January of 2014 and the federal budget compromise that would guide government spending into 2015 are both positives for the economy moving forward. Corporate fundamentals are strong as earnings per share and corporate cash are at the highest level in two decades. Unemployment is trending down and the housing market has experienced a rebound, each assisting the positive economic scenario. However, there are some issues to be watched. Interest rates are expected to increase but significant uncertainty about the timing remains. Partisan politics in Washington D.C. with their troublesome outcome add to the uncertainties that could cause problems for the economy going forward.
In the near term, governments are focused on economic recovery and the growth of their economies, which could lead to an environment of attractive investment opportunities. Over the long term, the uncertainties mentioned earlier could hinder the potential growth. Because of this, Nuveen’s investment management teams work hard to balance return and risk with a range of investment strategies. I encourage you to read the following commentary on the management of your fund.
On behalf of the other members of the Nuveen Fund Board, we look forward to continuing to earn your trust in the months and years ahead.
Sincerely,
William J. Schneider
Chairman of the Nuveen Fund Board
December 23, 2013
Portfolio Managers’ Comments
Nuveen Performance Plus Municipal Fund, Inc. (NPP)
Nuveen Municipal Advantage Fund, Inc. (NMA)
Nuveen Municipal Market Opportunity Fund, Inc. (NMO)
Nuveen Dividend Advantage Municipal Fund (NAD)
Nuveen Dividend Advantage Municipal Fund 2 (NXZ)
Nuveen Dividend Advantage Municipal Fund 3 (NZF)
These Funds feature management by Nuveen Asset Management, LLC, an affiliate of Nuveen Investments. Portfolio managers Thomas C. Spalding, CFA, and Paul L. Brennan, CFA, discuss U.S. economic and municipal market conditions, key investment strategies and the twelve-month performance of these six national Funds. Tom has managed NXZ since its inception in 2001 and NPP, NMA, NMO and NAD since 2003. Paul assumed portfolio management responsibility for NZF in 2006.
What factors affected the U.S. economy and the national municipal market during the twelve-month reporting period ended October 31, 2013?
During this reporting period, the U.S. economy’s progress toward recovery from recession continued at a moderate pace. The Federal Reserve (Fed) maintained its efforts to improve the overall economic environment by holding the benchmark fed funds rate at the record low level of zero to 0.25% that it established in December 2008. The Fed also continued its monthly purchases of $40 billion of mortgage-backed securities and $45 billion of longer-term Treasury securities in an open-ended effort to bolster growth and promote progress toward the Fed’s mandates of maximum employment and price stability. At its June 2013 meeting, the Fed indicated that it believed downside risks to the economy had diminished since the autumn of 2012. Subsequent comments by Fed Chairman Ben Bernanke suggested that the Fed might begin to reduce, or taper, its asset purchase program later in 2013. However, in September 2013, the Fed surprised the market by announcing that it had decided to wait for more evidence that the progress it discerned in June was sustainable before it made any adjustments to the pace of the purchase program. At its October 2013 meeting, the central bank reiterated this decision and said that it expected to continue its “highly accommodative stance of monetary policy” for “a considerable time” after the purchase program ends and the economic recovery strengthens. Finally, in December of 2013, the Fed announced a decision to slow down its bond buying program beginning in January of 2014.
Certain statements in this report are forward-looking statements. Discussions of specific investments are for illustration only and are not intended as recommendations of individual investments. The forward-looking statements and other views expressed herein are those of the portfolio managers as of the date of this report. Actual future results or occurrences may differ significantly from those anticipated in any forward-looking statements, and the views expressed herein are subject to change at any time, due to numerous market and other factors. The Funds disclaim any obligation to update publicly or revise any forward-looking statements or views expressed herein.
Ratings shown are the highest rating given by one of the following national rating agencies: Standard & Poor’s (S&P), Moody’s Investors Service (Moody’s), Inc. or Fitch, Inc. (Fitch). Credit ratings are subject to change. AAA, AA, A, and BBB are investment grade ratings; BB, B, CCC, CC, C and D are below investment grade ratings. Certain bonds backed by U.S. government or agency securities are regarded as having an implied rating equal to the rating of such securities. Holdings designated N/R are not rated by these national rating agencies.
Portfolio Managers’ Comments (continued)
In the third quarter of 2013, the U.S. economy, as measured by the U.S. gross domestic product (GDP), grew at an annualized rate of 2.8%, up from 2.5% for the second quarter of 2013, continuing the pattern of positive economic growth for the tenth consecutive quarter. The Consumer Price Index (CPI) rose 1.0% year-over-year as of October 2013, while the core CPI (which excludes food and energy) increased 1.7% during the same period, staying within the Fed’s unofficial objective of 2.0% or lower for this inflation measure. Improvements in the labor markets continued to be slow, and unemployment remained above the Fed’s target of 6.5%. As of October 2013, the national unemployment rate was 7.3%, up from 7.2% in September 2013 but below the 7.9% reported in October 2012. The slight uptick in October’s number reflected the increase in federal employees furloughed due to the government shutdown that month. The housing market continued to deliver good news, as the average home price in the S&P/Case-Shiller index of 20 major metropolitan areas rose 13.3% for the twelve months ended September 2013 (most recent data available at the time this report was prepared), the largest twelve-month percentage gain for the index since February 2006.
Early in this reporting period, the outlook for the U.S. economy was clouded by uncertainty about global financial markets and the outcome of the “fiscal cliff.” The tax consequences of the fiscal cliff situation were averted through a last-minute deal that raised payroll taxes, but left in place a number of tax breaks, including tax exemptions on municipal bond interest. However, lawmakers failed to reach a resolution on $1.2 trillion in spending cuts intended to address the federal budget deficit. This triggered a program of automatic spending cuts (or sequestration) that impacted federal programs beginning March 1, 2013. Although Congress later passed legislation that established federal funding levels for the remainder of fiscal 2013, the federal budget for fiscal 2014 continued to be debated. On October 1, 2013, the start date for fiscal 2014, the federal government shut down for 16 days until an interim appropriations bill was signed into law, funding the government at sequestration levels through January 15, 2014, and suspending the debt limit until February 7, 2014. Subsequent to the close of this reporting period, Congress preliminarily passed a federal budget deal that would guide government spending into 2015 and defuse the chances of another shutdown if it wins final passage. In addition to the ongoing political debate over federal spending, Chairman Bernanke’s June 2013 remarks about tapering the Fed’s asset purchase program touched off widespread uncertainty about the next step for the Fed’s quantitative easing program and about the potential impact on the economy and financial markets, leading to increased market volatility. This was compounded by headline credit stories involving Detroit’s bankruptcy filing in July 2013, the largest municipal bankruptcy in history, and the disappointing news that continued to come out of Puerto Rico, where a struggling economy and years of deficit spending and borrowing resulted in downgrades on the commonwealth’s bonds.
While municipal bond prices generally rallied during the first part of this reporting period, as strong demand and tight supply created favorable municipal market conditions, we saw the environment shift during the second half of the reporting period. The Treasury market traded off, the municipal market followed suit, and spreads widened as investor concern grew. This unsettled environment prompted increased selling by bondholders across the fixed income markets. Following the Fed’s September decision to delay tapering, we saw some stabilization of municipal bond fund flows and an October rally in municipal bond prices. However, for the reporting period as a whole, municipal bond prices generally declined, especially at the longer end of the maturity spectrum, while interest rates rose. At the same time, fundamentals on municipal bonds remained strong, as state governments made good progress in
dealing with budget issues. Due to strong growth in personal tax collections, state tax revenues have increased for 15 consecutive quarters, while on the expense side, the states made headway in cutting and controlling costs, with more than 40 states implementing some type of pension reform. The current level of municipal issuance reflects the present political distaste for additional borrowing by state and local governments facing fiscal constraints and the prevalent atmosphere of municipal budget austerity. Over the twelve months ended October 31, 2013, municipal bond issuance nationwide totaled $335.2 billion, a decrease of 11.7% from the issuance for the twelve-month period ended October 31, 2012.
What key strategies were used to manage these Funds during the twelve-month reporting period ended October 31, 2013?
As the municipal market environment shifted during this reporting period, from one characterized by heavy bond calls, tight supply and lower yields to one marked by increased market volatility and rising rates, we continued to take a bottom-up approach to discovering sectors that appeared undervalued as well as individual credits that had the potential to perform well over the long term.
During this reporting period, these Funds found value in diversified areas of the market, including health care, transportation, water and sewer and tobacco. A number of new health care issues that we considered attractively priced enabled us to add to our exposure in that sector. We also purchased a variety of bonds issued for tollroads in many of the Funds, including issues in Virginia, Illinois, Ohio and the Grand Parkway in Houston, Texas, which, when completed, will be the longest beltway in the U.S., at 184 miles. Also in the transportation sector, heavy supply of airport bonds in both the primary and secondary markets provided opportunities to add to our holdings there, such as airports in Dallas/Fort Worth, Miami and Denver. For those bond calls affecting our holdings of Louisiana and Washington tobacco credits, we also purchased tobacco bonds from other issuers in order to keep our tobacco exposure relatively stable. During the summer, as the market sold off, we were able to find these bonds at attractive prices in the secondary market. Geographically speaking, we often looked to states with heavier issuance to find value, such as California, Texas and Florida.
Our focus during the reporting period was to maintain the Funds’ positioning, as we believed they were well situated for the existing environment. During the market sell-off, we took advantage of attractive opportunities to slightly increase the Funds’ credit and duration profiles. As interest rates rose, NZF focused purchases on bonds with maturities of 20 years and longer, while NPP, NMA, NMO, NAD and NXZ emphasized maturities of 15 years and longer. In both cases, this enabled us to take advantage of more attractive yields at the longer end of the municipal yield curve. Over the reporting period, the Funds tended to purchase bonds in the middle to lower investment quality categories, including a small amount of below-investment grade credits.
Activity during the reporting period was driven primarily by the reinvestment of proceeds from called and matured bonds, which was aimed at keeping the Funds fully invested and supporting their income streams. During the first part of this reporting period, we experienced an increased number of current bond calls resulting from a growth in refinancings, which provided a meaningful source of liquidity. Although refinancing activity declined as interest rates rose in the latter
Portfolio Managers’ Comments (continued)
months of this reporting period, we continued to have cash from the earlier refundings to reinvest. Despite the decrease in new issuance, we continued to find opportunities to purchase bonds that helped achieve our goals for these Funds.
As of October 31, 2013, all six of these Funds continued to use inverse floating rate securities. We employ inverse floaters for a variety of reasons, including duration management, income enhancement and total return enhancement.
How did the Funds perform during this twelve-month reporting period ended October 31, 2013?
The tables in each Fund’s Performance Overview and Holding Summaries section of this report provide the Funds’ total returns for the one-year, five-year and ten-year periods ended October 31, 2013. Each Fund’s returns are compared with the performance of a corresponding market index & Lipper classification average.
For the twelve months ended October 31, 2013, the total returns on common share net asset value (NAV) for these six Funds underperformed the return for the national S&P Municipal Bond Index. For the same period, all six Funds exceeded the average return for the Lipper General and Insured Leveraged Municipal Debt Funds Classification Average.
Key management factors that influenced the Funds’ returns included duration and yield curve positioning, credit exposure and sector allocation. In addition, the use of regulatory leverage was an important factor affecting the Funds’ performance. Leverage is discussed in more detail later in this report.
As interest rates rose and the yield curve steepened, municipal bonds with shorter maturities generally outperformed those with longer maturities. Overall, credits with maturities of five years or less posted the best returns during this reporting period, while bonds at the longest end of the municipal yield curve produced the weakest results. In general, while these Funds tended to have durations longer than the market average, individual differences in duration and yield curve positioning were the major drivers of differences in performance. Among these Funds, NXZ was more advantageously positioned in terms of duration and yield curve, followed by NMO and NAD, which helped their performance. The remaining three Funds had less exposure to the outperforming short end of the yield curve and greater exposure to the longer parts of the yield curve that underperformed.
Credit exposure also factored into the Funds’ performance, especially during the latter half of the reporting period, as events in the municipal market led investors to avoid risk. High yield bonds came under selling pressure and credit spreads, or the difference in yield spreads between U.S. Treasury securities and comparable investments such as municipal bonds, began to widen. For the reporting period, AAA-rated and AA-rated bonds generally outperformed A-and BBB-rated bonds. Among these Funds, NMA had the greatest combined exposure to A- and BBB-rated bonds, which detracted from its performance. Although all of the Funds tended to have heavy weightings in A-rated bonds, this was offset to some degree by their weightings of AAA- and AA-rated bonds. Overall, the impact of the Funds’ credit exposure tended to be neutral to slightly negative for the reporting period.
After underperforming for many months, pre-refunded bonds, which are often backed by U.S. Treasury securities, were among the best performing market segments. The outperformance of these bonds can be attributed primarily
to their shorter effective maturities and higher credit quality. As of October 31, 2013, NMA held the heaviest weighting of pre-refunded bonds among these Funds, while NAD had the smallest allocation. Housing, health care and general obligation (GO) bonds also tended to outperform the general municipal market. All of these Funds had strong exposure to the health care sector, especially NMA and NXZ, which benefited their performance.
In contrast, revenue bonds as a whole underperformed the municipal market. Among the revenue sectors that lagged municipal market performance by the widest margins were transportation, water and sewer and electric utilities. All of the Funds had double-digit weightings in the transportation sector. Tobacco credits backed by the 1998 master tobacco settlement agreement also performed poorly, due in part to their longer effective durations and lower credit ratings. As of October 31, 2013, all of these Funds had exposure to tobacco bonds, with NPP having the heaviest weighting and NZF the smallest.
During this reporting period, two credit situations weighed on the municipal market. It is important to note that, while these situations received much attention from the media, they represent isolated events. On July 18, 2013, the City of Detroit filed for Chapter 9 bankruptcy. Detroit, burdened by decades of population loss, declines in the auto manufacturing industry and significant tax base deterioration, has been under severe financial stress for an extended period. Detroit’s bankruptcy filing will likely be a lengthy one, given the complexity of its debt portfolio, number of creditors, numerous union contracts and significant legal questions that must be addressed. All of these Funds had allocations of Detroit water and sewer credits, which are supported by revenue streams generated by service fees. Many of these holdings also are insured. In addition, NMO held a small position in Detroit limited tax obligation bonds for state aid backed by the state of Michigan and NZF held Detroit City School District bonds, which are insured. During this reporting period, these holdings had a negligible impact on the Funds’ investment performance due to the Detroit bankruptcy.
Another factor affecting the Funds’ holdings was the downgrade of debt issued by Puerto Rico. In 2012, Moody’s downgraded Puerto Rico GO bonds to Baa3 from Baa1, Puerto Rico Sales Tax Financing Corporation (COFINA) senior sales tax revenue bonds to Aa3 from Aa2 and COFINA subordinate sales tax revenue bonds to A3 from A1. In October 2013, Moody’s further downgraded the COFINA senior sales tax bonds to A2, while affirming the subordinate bonds at A3. On November 14, 2013(subsequent to the close of this reporting period), Fitch announced that it was placing the majority of Puerto Rico issuance—with the exception of the COFINA bonds—on negative credit watch, which implies that another downgrade may be likely.While Fitch currently rates Puerto Rico issuance at BBB-, it affirmed the ratings on COFINA bonds at AA- for the senior bonds and A+ for the subordinate bonds, with stable outlooks.On December 11, 2013 (subsequent to the close of this reporting period), Moody’s announced that it also had placed its Baa3 rating on Puerto Rico GOs (and other Puerto Rico issues linked to the GO rating) on review for downgrade. These downgrades were based on Puerto Rico’s ongoing economic problems and, in the case of the COFINA bonds, the impact of these problems on the projected growth of sales tax revenues. However, the COFINA bonds were able to maintain a higher credit rating than the GOs because, unlike the revenue streams supporting some Puerto Rican issues, the sales taxes supporting the COFINA bonds cannot be diverted and used to support Puerto Rico’s GO bonds.
Portfolio Managers’ Comments (continued)
For the reporting period ended October 31, 2013, Puerto Rico paper underperformed the municipal market as a whole. All of these Funds have limited exposure to Puerto Rico bonds, the majority of which are the sales tax bonds issued by COFINA, which we consider the best of the Puerto Rico issuance. The Funds also hold small positions in a variety of other Puerto Rico credits, including highway, housing, electric utilities and aqueduct bonds. Much of this exposure is insured, which we believe adds a measure of value. NMA also has a small position in insured Puerto Rico GO credits. Overall, the small nature of our exposure helped to limit the impact of the Puerto Rico bonds’ underperformance on the Funds.
Fund Leverage
IMPACT OF THE FUNDS’ LEVERAGE STRATEGIES ON PERFORMANCE
One important factor impacting the returns of the Funds relative to their comparative benchmarks was the Funds’ use of leverage through their issuance of preferred shares and/or investments in inverse floating rate securities, which represent leveraged investments in underlying bonds. The Funds use leverage because our research has shown that, over time, leveraging provides opportunities for additional income, particularly in the recent market environment where short-term market rates are at or near historical lows, meaning that the short-term rates the Fund has been paying on its leveraging instruments have been much lower than the interest the Fund has been earning on its portfolio of long-term bonds that it has bought with the proceeds of that leverage. However, use of leverage also can expose the Fund to additional price volatility. When a Fund uses leverage, the Fund will experience a greater increase in its net asset value if the municipal bonds acquired through the use of leverage increase in value, but it will also experience a correspondingly larger decline in its net asset value if the bonds acquired through leverage decline in value, which will make the Fund’s net asset value more volatile, and its total return performance more variable over time. In addition, income in levered funds will typically decrease in comparison to unlevered funds when short-term interest rates increase and increase when short-term interest rates decrease. Leverage made a negative contribution to the performance of these Funds over this reporting period.
As of October 31, 2013, the Funds’ percentages of effective and regulatory leverage are as shown in the accompanying table.
| | | | NPP | | | NMA | | | NMO | | | NAD | | | NXZ | | | NZF | |
| Effective Leverage* | | | 39.87% | | | 37.46% | | | 39.17% | | | 37.01% | | | 35.54% | | | 35.55% | |
| Regulatory Leverage* | | | 37.58% | | | 32.61% | | | 35.77% | | | 31.85% | | | 31.34% | | | 29.25% | |
| * | Effective Leverage is a Fund’s effective economic leverage, and includes both regulatory leverage and the leverage effects of certain derivative and other investments in a Fund’s portfolio that increase the Fund’s investment exposure. Currently, the leverage effects of Tender Option Bond (TOB) inverse floater holdings are included in effective leverage values, in addition to any regulatory leverage. Regulatory leverage consists of preferred shares issued or borrowings of a Fund. Both of these are part of a Fund’s capital structure. Regulatory leverage is subject to asset coverage limits set forth in the Investment Company Act of 1940. |
Fund Leverage (continued)
THE FUNDS’ REGULATORY LEVERAGE
As of October 31, 2013, the Funds have issued and outstanding MuniFund Term Preferred (MTP) Shares, Variable Rate MuniFund Term Preferred (VMTP) Shares and Variable Rate Demand Preferred (VRDP) Shares as shown in the accompanying table.
| | | MTP Shares | | VMTP Shares | | VRDP Shares | | | | |
| | | Series | | Shares Issued at Liquidation Value | | Annual Interest Rate | | NYSE MKT Ticker | | Series | | Shares Issued at Liquidation Value | | Series | | Shares Issued at Liquidation Value | | | Total | |
| NPP | | | | | $ | — | | | — | | | — | | | 2015 | | $ | 535,000,000 | | | | | $ | — | | $ | 535,000,000 | |
| NMA | | | | | $ | — | | | — | | | — | | | — | | $ | — | | | 1 | | $ | 296,800,000 | | $ | 296,800,000 | |
| NMO | | | | | $ | — | | | — | | | — | | | — | | $ | — | | | 1 | | $ | 350,900,000 | | $ | 350,900,000 | |
| NAD | | | 2015 | | $ | 144,300,000 | | | 2.70 | % | | NAD PRC | | | 2014 | | $ | 120,400,000 | | | — | | $ | — | | | | |
| | | | | | $ | 144,300,000 | | | | | | | | | | | $ | 120,400,000 | | | | | | | | $ | 264,700,000 | |
| NXZ | | | | | $ | — | | | — | | | — | | | — | | $ | — | | | 2 | | $ | 196,000,000 | | $ | 196,000,000 | |
| NZF | | | 2016 | | $ | 70,000,000 | | | 2.80 | % | | NZF PRC | | | 2014 | | $ | 169,200,000 | | | — | | $ | — | | | | |
| | | | | | $ | 70,000,000 | | | | | | | | | | | $ | 169,200,000 | | | | | | | | $ | 239,200,000 | |
During the current reporting period, NPP successfully exchanged of all of its outstanding 4,217 Series 2014 VMTP Shares for 4,217 Series 2015 VMTP Shares. Concurrent with this exchange, the Fund also issued an additional 1,133 shares, $113,300,000 at liquidation value, of Series 2015 VMTP Shares. Both of these transactions were completed in privately negotiated offerings. The Fund completed the exchange offer in which it refinanced its existing VMTP Shares with new VMTP Shares with a term redemption date of December 1, 2015. The proceeds from the additional VMTP Shares were used to take advantage of opportunities in the current municipal market.
Subsequent to the close of this reporting period, NAD redeemed all series of its MTP and 2014 VMTP Shares, at their $10.00 and $100,000 liquidation value per share, respectively, plus dividend amounts owed, with the proceeds from $265,000,000 of newly issued 2016 VMTP Shares. On December 10, 2013, 2016 VMTP Shares were issued to qualified institutional buyers in a private offering pursuant to Rule 144A of the Securities Act of 1933 and NAD’s MTP Shares were redeemed on December 20, 2013. NAD’s 2014 VMTP Shares are anticipated to be redeemed on January 6, 2014.
Refer to Notes to Financial Statements, Note 1 – General Information and Significant Accounting Policies for further details on MTP, VMTP and VRDP Shares.
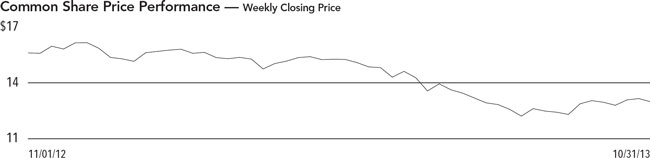
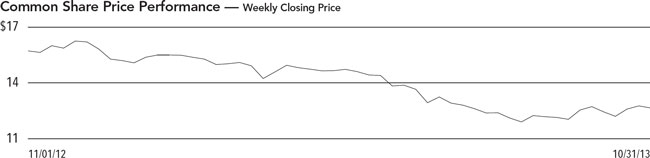
Common Share Information
COMMON SHARE DIVIDEND INFORMATION
During the current reporting period ended October 31, 2013, the Funds’ monthly dividends to common shareholders were as shown in the accompanying table.
| | | Per Common Share Amounts | |
| | | | NPP | | | NMA | | | NMO | | | NAD | | | NXZ | | | NZF | |
| November | | $ | 0.0800 | | $ | 0.0755 | | $ | 0.0705 | | $ | 0.0760 | | $ | 0.0750 | | $ | 0.0755 | |
| December | | | 0.0770 | | | 0.0710 | | | 0.0670 | | | 0.0730 | | | 0.0670 | | | 0.0660 | |
| January | | | 0.0770 | | | 0.0710 | | | 0.0670 | | | 0.0730 | | | 0.0670 | | | 0.0660 | |
| February | | | 0.0770 | | | 0.0710 | | | 0.0670 | | | 0.0730 | | | 0.0670 | | | 0.0660 | |
| March | | | 0.0770 | | | 0.0670 | | | 0.0645 | | | 0.0730 | | | 0.0670 | | | 0.0625 | |
| April | | | 0.0770 | | | 0.0670 | | | 0.0645 | | | 0.0730 | | | 0.0670 | | | 0.0625 | |
| May | | | 0.0770 | | | 0.0670 | | | 0.0645 | | | 0.0730 | | | 0.0670 | | | 0.0625 | |
| June | | | 0.0770 | | | 0.0670 | | | 0.0645 | | | 0.0730 | | | 0.0670 | | | 0.0580 | |
| July | | | 0.0770 | | | 0.0670 | | | 0.0645 | | | 0.0730 | | | 0.0670 | | | 0.0580 | |
| August | | | 0.0770 | | | 0.0670 | | | 0.0645 | | | 0.0730 | | | 0.0670 | | | 0.0580 | |
| September | | | 0.0770 | | | 0.0670 | | | 0.0645 | | | 0.0730 | | | 0.0670 | | | 0.0580 | |
| October | | | 0.0770 | | | 0.0670 | | | 0.0645 | | | 0.0730 | | | 0.0670 | | | 0.0580 | |
| | | | | | | | | | | | | | | | | | | | |
| Ordinary Income Distribution* | | $ | — | | $ | 0.0078 | | $ | — | | $ | 0.0053 | | $ | — | | $ | 0.0017 | |
| | | | | | | | | | | | | | | | | | | | |
| Market Yield** | | | 6.77% | | | 6.42% | | | 6.35% | | | 6.78% | | | 6.19% | | | 5.50% | |
| Taxable-Equivalent Yield** | | | 9.40% | | | 8.92% | | | 8.82% | | | 9.42% | | | 8.60% | | | 7.64% | |
| * | Distribution paid in December 2012. |
| | |
| ** | Market Yield is based on the Fund’s current annualized monthly dividend divided by the Fund’s current market price as of the end of the reporting period. Taxable-Equivalent Yield represents the yield that must be earned on a fully taxable investment in order to equal the yield of the Fund on an after-tax basis. It is based on a federal income tax rate of 28.0%. When comparing a Fund to investments that generate qualified dividend income, the Taxable-Equivalent Yield is lower. |
All of the Funds in this report seek to pay stable dividends at rates that reflect each Fund’s past results and projected future performance. During certain periods, each Fund may pay dividends at a rate that may be more or less than the amount of net investment income actually earned by the Fund during the period. If a Fund has cumulatively earned more than it has paid in dividends, it holds the excess in reserve as undistributed net investment income (UNII) as part of the Fund’s NAV. Conversely, if a Fund has cumulatively paid dividends in excess of its earnings, the excess constitutes negative UNII that is likewise reflected in the Fund’s NAV. Each Fund will, over time, pay all of its net investment income as dividends to shareholders. As of October 31, 2013, all of the Funds in this report had positive UNII balances for tax and financial reporting purposes.
Common Share Information (continued)
COMMON SHARE REPURCHASES
During November 2013 (subsequent to the close of this reporting period), the Nuveen Funds’ Board of Directors/Trustees reauthorized the Funds’ open-market share repurchase program, allowing each Fund to repurchase an aggregate of up to approximately 10% of its outstanding common shares.
Since the inception of the Funds’ repurchase programs, the Funds have not repurchased any of their outstanding common shares.
| | | | NPP | | | NMA | | | NMO | | | NAD | | | NXZ | | | NZF | |
| Common Shares Cumulatively Repurchased and Retired | | | — | | | — | | | — | | | — | | | — | | | — | |
| Common Shares Authorized for Repurchase | | | 6,000,000 | | | 4,370,000 | | | 4,585,000 | | | 3,930,000 | | | 2,950,000 | | | 4,040,000 | |
OTHER COMMON SHARE INFORMATION
As of October 31, 2013, and during the current reporting period, the Funds’ common share prices were trading at a premium/(discount) to their common share NAVs as shown in the accompanying table.
| | | | NPP | | | NMA | | | NMO | | | NAD | | | NXZ | | | NZF | |
| Common Share NAV | | $ | 14.81 | | $ | 14.04 | | $ | 13.73 | | $ | 14.42 | | $ | 14.57 | | $ | 14.32 | |
| Common Share Price | | $ | 13.64 | | $ | 12.52 | | $ | 12.19 | | $ | 12.92 | | $ | 12.99 | | $ | 12.66 | |
| Premium/(Discount) to NAV | | | (7.90 | )% | | (10.83 | )% | | (11.22 | )% | | (10.40 | )% | | (10.84 | )% | | (11.59 | )% |
| 12-Month Average Premium/(Discount) to NAV | | | (5.58 | )% | | (7.07 | )% | | (7.31 | )% | | (6.77 | )% | | (7.28 | )% | | (8.23 | )% |
Risk Considerations
Fund shares are not guaranteed or endorsed by any bank or other insured depository institution, and are not federally insured by the Federal Deposit Insurance Corporation. Past performance is no guarantee of future results. Fund common shares are subject to a variety of risks, including:
Investment, Market and Price Risk. An investment in common shares is subject to investment risk, including the possible loss of the entire principal amount that you invest. Your investment in common shares represents an indirect investment in the municipal securities owned by the Funds, which generally trade in the over-the-counter markets. Shares of closed-end investment companies like these Funds frequently trade at a discount to their net asset value (NAV). Your common shares at any point in time may be worth less than your original investment, even after taking into account the reinvestment of Fund dividends and distributions.
Leverage Risk. Each Fund’s use of leverage creates the possibility of higher volatility for the Fund’s per share NAV, market price, distributions and returns. There is no assurance that a Fund’s leveraging strategy will be successful. Certain aspects of the recently adopted Volcker Rule may limit the availability of tender option bonds, which are used by the Funds for leveraging and duration management purposes. The effects of this new Rule, expected to take effect in mid-2015, may make it more difficult for a Fund to maintain current or desired levels of leverage and may cause the Fund to incur additional expenses to maintain its leverage.
Tax Risk. The tax treatment of Fund distributions may be affected by new IRS interpretations of the Internal Revenue Code and future changes in tax laws and regulations.
Issuer Credit Risk. This is the risk that a security in a Fund’s portfolio will fail to make dividend or interest payments when due.
Interest Rate Risk. Fixed-income securities such as bonds, preferred, convertible and other debt securities will decline in value if market interest rates rise.
Reinvestment Risk. If market interest rates decline, income earned from a Fund’s portfolio may be reinvested at rates below that of the original bond that generated the income.
Call Risk or Prepayment Risk. Issuers may exercise their option to prepay principal earlier than scheduled, forcing a Fund to reinvest in lower-yielding securities.
Inverse Floater Risk. The Funds may invest in inverse floaters. Due to their leveraged nature, these investments can greatly increase a Fund’s exposure to interest rate risk and credit risk. In addition, investments in inverse floaters involve the risk that a Fund could lose more than its original principal investment.
Derivatives Risk. The Funds may use derivative instruments which involve a high degree of financial risk, including the risk that the loss on a derivative may be greater than the principal amount investment.
| NPP | |
| | Nuveen Performance Plus Municipal Fund, Inc. |
| | Performance Overview and Holding Summaries as of October 31, 2013 |
| Average Annual Total Returns as of October 31, 2013 | | | | | | | | |
| | Average Annual | |
| | 1-Year | | | 5-Year | | | 10-Year | |
| NPP at Common Share NAV | (5.90)% | | | 9.75% | | | 5.61% | |
| NPP at Common Share Price | (11.75)% | | | 10.40% | | | 5.65% | |
| S&P Municipal Bond Index | (1.69)% | | | 6.63% | | | 4.59% | |
| Lipper General & Insured Leveraged Municipal Debt Funds Classification Average | (6.12)% | | | 10.80% | | | 5.51% | |
Past performance is not predictive of future results. Current performance may be higher or lower than the data shown. Returns do not reflect the deduction of taxes that shareholders may have to pay on Fund distributions or upon the sale of Fund shares. Comparative index and Lipper return information is provided for the Fund’s shares at NAV only. Indexes and Lipper averages are not available for direct investment.
Portfolio Composition1 | | | | |
| (as a % of total investments) | | | | |
| Tax Obligation/Limited | | | 21.8 | % |
| Health Care | | | 17.3 | % |
| Transportation | | | 16.2 | % |
| Tax Obligation/General | | | 14.2 | % |
| U.S. Guaranteed | | | 8.3 | % |
| Utilities | | | 7.5 | % |
| Consumer Staples | | | 6.3 | % |
| Other | | | 8.4 | % |
Credit Quality1,2,3 | | | | |
| (as a % of total investment exposure) | | | | |
| AAA/U.S. Guaranteed | | | 13.9 | % |
| AA | | | 36.3 | % |
| A | | | 33.1 | % |
| BBB | | | 7.9 | % |
| BB or Lower | | | 6.5 | % |
| N/R | | | 0.9 | % |
States1 | | | | |
| (as a % of total investments) | | | | |
| Illinois | | | 17.5 | % |
| California | | | 13.6 | % |
| Texas | | | 9.3 | % |
| Colorado | | | 7.1 | % |
| Florida | | | 4.6 | % |
| Ohio | | | 4.2 | % |
| New York | | | 3.7 | % |
| Puerto Rico | | | 3.7 | % |
| Massachusetts | | | 2.6 | % |
| Pennsylvania | | | 2.6 | % |
| Virginia | | | 2.4 | % |
| Indiana | | | 2.4 | % |
| New Jersey | | | 2.3 | % |
| Nevada | | | 2.3 | % |
| Washington | | | 2.2 | % |
| Michigan | | | 2.0 | % |
| Other | | | 17.5 | % |
Refer to the Glossary of Terms Used in this Report for further definition of the terms used within this page.
| 1 | Holdings are subject to change. |
| 2 | Ratings shown are the highest rating given by one of the following national rating agencies: Standard & Poor’s Group, Moody’s Investors Service, Inc. or Fitch, Inc. Credit ratings are subject to change. AAA, AA, A and BBB are investment grade ratings; BB, B, CCC, CC, C and D are below-investment grade ratings. Certain bonds backed by U.S. Government or agency securities are regarded as having an implied rating equal to the rating of such securities. Holdings designated N/R are not rated by these national rating agencies. |
| 3 | Percentages may not add to 100% due to the exclusion of other assets less liabilities from the table. |
| NMA | |
| | Nuveen Municipal Advantage Fund, Inc. |
| | Performance Overview and Holding Summaries as of October 31, 2013 |
| Average Annual Total Returns as of October 31, 2013 | | | | | | | | |
| | Average Annual | |
| | 1-Year | | | 5-Year | | | 10-Year | |
| NMA at Common Share NAV | (5.87)% | | | 10.29% | | | 5.48% | |
| NMA at Common Share Price | (15.21)% | | | 9.29% | | | 4.58% | |
| S&P Municipal Bond Index | (1.69)% | | | 6.63% | | | 4.59% | |
| Lipper General & Insured Leveraged Municipal Debt Funds Classification Average | (6.12)% | | | 10.80% | | | 5.51% | |
Past performance is not predictive of future results. Current performance may be higher or lower than the data shown. Returns do not reflect the deduction of taxes that shareholders may have to pay on Fund distributions or upon the sale of Fund shares. Comparative index and Lipper return information is provided for the Fund’s shares at NAV only. Indexes and Lipper averages are not available for direct investment.
| | | | | |
Portfolio Composition1 | | | | |
| (as a % of total investments) | | | | |
| Health Care | | | 20.7 | % |
| Transportation | | | 17.5 | % |
| Tax Obligation/General | | | 16.5 | % |
| Tax Obligation/Limited | | | 15.1 | % |
| U.S. Guaranteed | | | 9.4 | % |
| Utilities | | | 6.6 | % |
| Consumer Staples | | | 5.2 | % |
| Other | | | 9.0 | % |
Credit Quality1,2,3 | | | | |
| (as a % of total investment exposure) | | | | |
| AAA/U.S. Guaranteed | | | 14.6 | % |
| AA | | | 32.8 | % |
| A | | | 31.9 | % |
| BBB | | | 10.4 | % |
| BB or Lower | | | 6.8 | % |
| N/R | | | 0.6 | % |
States1 | | | | |
| (as a % of total investments) | | | | |
| California | | | 16.1 | % |
| Illinois | | | 10.3 | % |
| Texas | | | 9.2 | % |
| Colorado | | | 8.5 | % |
| New York | | | 5.0 | % |
| Puerto Rico | | | 4.6 | % |
| Ohio | | | 4.5 | % |
| Louisiana | | | 4.5 | % |
| Pennsylvania | | | 3.8 | % |
| Indiana | | | 3.4 | % |
| Nevada | | | 3.1 | % |
| Michigan | | | 2.6 | % |
| Arizona | | | 2.4 | % |
| Florida | | | 2.2 | % |
| New Jersey | | | 2.1 | % |
| Other | | | 17.7 | % |
Refer to the Glossary of Terms Used in this Report for further definition of the terms used within this page.
| 1 | Holdings are subject to change. |
| 2 | Ratings shown are the highest rating given by one of the following national rating agencies: Standard & Poor’s Group, Moody’s Investors Service, Inc. or Fitch, Inc. Credit ratings are subject to change. AAA, AA, A and BBB are investment grade ratings; BB, B, CCC, CC, C and D are below-investment grade ratings. Certain bonds backed by U.S. Government or agency securities are regarded as having an implied rating equal to the rating of such securities. Holdings designated N/R are not rated by these national rating agencies. |
| 3 | Percentages may not add to 100% due to the exclusion of other assets less liabilities from the table. |
| NMO | |
| | Nuveen Municipal Market Opportunity Fund, Inc. |
| | Performance Overview and Holding Summaries as of October 31, 2013 |
| Average Annual Total Returns as of October 31, 2013 | | | | | | | | |
| | Average Annual | |
| | 1-Year | | | 5-Year | | | 10-Year | |
| NMO at Common Share NAV | (4.99)% | | | 9.10% | | | 5.16% | |
| NMO at Common Share Price | (13.41)% | | | 8.06% | | | 4.79% | |
| S&P Municipal Bond Index | (1.69)% | | | 6.63% | | | 4.59% | |
| Lipper General & Insured Leveraged Municipal Debt Funds Classification Average | (6.12)% | | | 10.80% | | | 5.51% | |
Past performance is not predictive of future results. Current performance may be higher or lower than the data shown. Returns do not reflect the deduction of taxes that shareholders may have to pay on Fund distributions or upon the sale of Fund shares. Comparative index and Lipper return information is provided for the Fund’s shares at NAV only. Indexes and Lipper averages are not available for direct investment.
| | | | | |
Portfolio Composition1 | | | | |
| (as a % of total investments) | | | | |
| Transportation | | | 22.8 | % |
| Health Care | | | 18.9 | % |
| Tax Obligation/General | | | 14.0 | % |
| Tax Obligation/Limited | | | 12.6 | % |
| U.S. Guaranteed | | | 9.0 | % |
| Utilities | | | 5.9 | % |
| Consumer Staples | | | 5.7 | % |
| Other | | | 11.1 | % |
Credit Quality1,2,3 | | | | |
| (as a % of total investment exposure) | | | | |
| AAA/U.S. Guaranteed | | | 13.8 | % |
| AA | | | 37.3 | % |
| A | | | 29.9 | % |
| BBB | | | 9.3 | % |
| BB or Lower | | | 6.8 | % |
| N/R | | | 0.5 | % |
States1 | | | | |
| (as a % of total investments) | | | | |
| California | | | 15.4 | % |
| Texas | | | 11.5 | % |
| Illinois | | | 11.0 | % |
| Ohio | | | 5.9 | % |
| Colorado | | | 5.5 | % |
| New York | | | 4.1 | % |
| Florida | | | 4.0 | % |
| Pennsylvania | | | 4.0 | % |
| Puerto Rico | | | 3.4 | % |
| Nevada | | | 3.2 | % |
| Virginia | | | 3.0 | % |
| Michigan | | | 2.9 | % |
| North Carolina | | | 2.9 | % |
| Indiana | | | 2.1 | % |
| Washington | | | 2.0 | % |
| Alaska | | | 1.9 | % |
| Missouri | | | 1.9 | % |
| Other | | | 15.3 | % |
Refer to the Glossary of Terms Used in this Report for further definition of the terms used within this page.
| 1 | Holdings are subject to change. |
| 2 | Ratings shown are the highest rating given by one of the following national rating agencies: Standard & Poor’s Group, Moody’s Investors Service, Inc. or Fitch, Inc. Credit ratings are subject to change. AAA, AA, A and BBB are investment grade ratings; BB, B, CCC, CC, C and D are below-investment grade ratings. Certain bonds backed by U.S. Government or agency securities are regarded as having an implied rating equal to the rating of such securities. Holdings designated N/R are not rated by these national rating agencies. |
| 3 | Percentages may not add to 100% due to the exclusion of other assets less liabilities from the table. |
| NAD | |
| | Nuveen Dividend Advantage Municipal Fund |
| | Performance Overview and Holding Summaries as of October 31, 2013 |
| Average Annual Total Returns as of October 31, 2013 | | | | | | | | |
| | Average Annual | |
| | 1-Year | | | 5-Year | | | 10-Year | |
| NAD at Common Share NAV | (4.87)% | | | 10.87% | | | 5.74% | |
| NAD at Common Share Price | (12.81)% | | | 10.84% | | | 4.89% | |
| S&P Municipal Bond Index | (1.69)% | | | 6.63% | | | 4.59% | |
| Lipper General & Insured Leveraged Municipal Debt Funds Classification Average | (6.12)% | | | 10.80% | | | 5.51% | |
Past performance is not predictive of future results. Current performance may be higher or lower than the data shown. Returns do not reflect the deduction of taxes that shareholders may have to pay on Fund distributions or upon the sale of Fund shares. Comparative index and Lipper return information is provided for the Fund’s shares at NAV only. Indexes and Lipper averages are not available for direct investment.
| | | | | |
Portfolio Composition1 | | | | |
| (as a % of total investments) | | | | |
| Health Care | | | 20.9 | % |
| Tax Obligation/Limited | | | 19.0 | % |
| Transportation | | | 17.1 | % |
| Tax Obligation/General | | | 17.0 | % |
| U.S. Guaranteed | | | 6.6 | % |
| Consumer Staples | | | 5.3 | % |
| Water and Sewer | | | 4.4 | % |
| Other | | | 9.7 | % |
Credit Quality1,2,3 | | | | |
| (as a % of total investment exposure) | | | | |
| AAA/U.S. Guaranteed | | | 12.1 | % |
| AA | | | 40.5 | % |
| A | | | 29.9 | % |
| BBB | | | 8.3 | % |
| BB or Lower | | | 4.0 | % |
| N/R | | | 2.9 | % |
States1 | | | | |
| (as a % of municipal and corporate bonds) | | | | |
| Illinois | | | 17.3 | % |
| California | | | 8.7 | % |
| Texas | | | 7.8 | % |
| New York | | | 7.7 | % |
| Florida | | | 6.0 | % |
| Colorado | | | 5.7 | % |
| Washington | | | 4.7 | % |
| Wisconsin | | | 4.1 | % |
| Ohio | | | 3.7 | % |
| Nevada | | | 3.6 | % |
| Puerto Rico | | | 3.5 | % |
| New Jersey | | | 2.6 | % |
| Indiana | | | 2.5 | % |
| Michigan | | | 2.3 | % |
| Massachusetts | | | 2.3 | % |
| Rhode Island | | | 2.2 | % |
| Arizona | | | 2.2 | % |
| Other | | | 13.1 | % |
Refer to the Glossary of Terms Used in this Report for further definition of the terms used within this page.
| 1 | Holdings are subject to change. |
| 2 | Ratings shown are the highest rating given by one of the following national rating agencies: Standard & Poor’s Group, Moody’s Investors Service, Inc. or Fitch, Inc. Credit ratings are subject to change. AAA, AA, A and BBB are investment grade ratings; BB, B, CCC, CC, C and D are below-investment grade ratings. Certain bonds backed by U.S. Government or agency securities are regarded as having an implied rating equal to the rating of such securities. Holdings designated N/R are not rated by these national rating agencies. |
| 3 | Percentages may not add to 100% due to the exclusion of other assets less liabilities from the table. |
| NXZ | |
| | Nuveen Dividend Advantage Municipal Fund 2 |
| | Performance Overview and Holding Summaries as of October 31, 2013 |
| Average Annual Total Returns as of October 31, 2013 | | | | | | | | |
| | Average Annual | |
| | 1-Year | | | 5-Year | | | 10-Year | |
| NXZ at Common Share NAV | (4.58)% | | | 9.71% | | | 6.20% | |
| NXZ at Common Share Price | (12.04)% | | | 8.07% | | | 5.29% | |
| S&P Municipal Bond Index | (1.69)% | | | 6.63% | | | 4.59% | |
| Lipper General & Insured Leveraged Municipal Debt Funds Classification Average | (6.12)% | | | 10.80% | | | 5.51% | |
Past performance is not predictive of future results. Current performance may be higher or lower than the data shown. Returns do not reflect the deduction of taxes that shareholders may have to pay on Fund distributions or upon the sale of Fund shares. Comparative index and Lipper return information is provided for the Fund’s shares at NAV only. Indexes and Lipper averages are not available for direct investment.
| | | | | |
Portfolio Composition1 | | | | |
| (as a % of total investments) | | | | |
| Tax Obligation/Limited | | | 23.1 | % |
| Health Care | | | 20.3 | % |
| Transportation | | | 16.4 | % |
| Tax Obligation/General | | | 10.1 | % |
| U.S. Guaranteed | | | 7.4 | % |
| Consumer Staples | | | 5.3 | % |
| Water and Sewer | | | 5.2 | % |
| Utilities | | | 5.2 | % |
| Other | | | 7.0 | % |
Credit Quality1,2,3 | | | | |
| (as a % of total investment exposure) | | | | |
| AAA/U.S. Guaranteed | | | 11.4 | % |
| AA | | | 34.5 | % |
| A | | | 32.1 | % |
| BBB | | | 8.4 | % |
| BB or Lower | | | 7.9 | % |
| N/R | | | 3.7 | % |
States1 | | | | |
| (as a % of total investments) | | | | |
| Texas | | | 18.4 | % |
| California | | | 16.0 | % |
| Illinois | | | 10.8 | % |
| Colorado | | | 6.6 | % |
| New York | | | 5.6 | % |
| Michigan | | | 4.8 | % |
| Indiana | | | 3.4 | % |
| Florida | | | 3.2 | % |
| South Carolina | | | 2.7 | % |
| Puerto Rico | | | 2.4 | % |
| Georgia | | | 2.2 | % |
| Nevada | | | 1.9 | % |
| Ohio | | | 1.8 | % |
| Massachusetts | | | 1.7 | % |
| West Virginia | | | 1.6 | % |
| Other | | | 16.9 | % |
Refer to the Glossary of Terms Used in this Report for further definition of the terms used within this page.
| 1 | Holdings are subject to change. |
| 2 | Ratings shown are the highest rating given by one of the following national rating agencies: Standard & Poor’s Group, Moody’s Investors Service, Inc. or Fitch, Inc. Credit ratings are subject to change. AAA, AA, A and BBB are investment grade ratings; BB, B, CCC, CC, C and D are below-investment grade ratings. Certain bonds backed by U.S. Government or agency securities are regarded as having an implied rating equal to the rating of such securities. Holdings designated N/R are not rated by these national rating agencies. |
| 3 | Percentages may not add to 100% due to the exclusion of other assets less liabilities from the table. |
| NZF | |
| | Nuveen Dividend Advantage Municipal Fund 3 |
| | Performance Overview and Holding Summaries as of October 31, 2013 |
| Average Annual Total Returns as of October 31, 2013 | | | | | | | | |
| | Average Annual | |
| | 1-Year | | | 5-Year | | | 10-Year | |
| NZF at Common Share NAV | (5.93)% | | | 10.23% | | | 6.02% | |
| NZF at Common Share Price | (15.08)% | | | 10.52% | | | 5.72% | |
| S&P Municipal Bond Index | (1.69)% | | | 6.63% | | | 4.59% | |
| Lipper General & Insured Leveraged Municipal Debt Funds Classification Average | (6.12)% | | | 10.80% | | | 5.51% | |
Past performance is not predictive of future results. Current performance may be higher or lower than the data shown. Returns do not reflect the deduction of taxes that shareholders may have to pay on Fund distributions or upon the sale of Fund shares. Comparative index and Lipper return information is provided for the Fund’s shares at NAV only. Indexes and Lipper averages are not available for direct investment.
| | | | | |
Portfolio Composition1 | | | | |
| (as a % of total investments) | | | | |
| Tax Obligation/Limited | | | 22.3 | % |
| Health Care | | | 16.3 | % |
| Transportation | | | 14.6 | % |
| Tax Obligation/General | | | 11.9 | % |
| U.S. Guaranteed | | | 9.4 | % |
| Education and Civic Organizations | | | 6.3 | % |
| Water and Sewer | | | 5.5 | % |
| Utilities | | | 4.5 | % |
| Other | | | 9.2 | % |
Credit Quality1,2,3 | | | | |
| (as a % of total investment exposure) | | | | |
| AAA/U.S. Guaranteed | | | 19.5 | % |
| AA | | | 38.3 | % |
| A | | | 24.6 | % |
| BBB | | | 4.8 | % |
| BB or Lower | | | 4.2 | % |
| N/R | | | 6.5 | % |
States1 | | | | |
| (as a % of municipal and corporate bonds) | | | | |
| Texas | | | 13.0 | % |
| Illinois | | | 12.0 | % |
| California | | | 9.2 | % |
| New York | | | 6.5 | % |
| Michigan | | | 5.6 | % |
| Indiana | | | 5.5 | % |
| Georgia | | | 4.5 | % |
| Nevada | | | 3.9 | % |
| Louisiana | | | 3.6 | % |
| Washington | | | 3.5 | % |
| New Jersey | | | 3.3 | % |
| Colorado | | | 3.3 | % |
| Florida | | | 2.7 | % |
| Massachusetts | | | 2.4 | % |
| Ohio | | | 2.3 | % |
| Arizona | | | 2.2 | % |
| Other | | | 16.5 | % |
Refer to the Glossary of Terms Used in this Report for further definition of the terms used within this page.
| 1 | Holdings are subject to change. |
| 2 | Ratings shown are the highest rating given by one of the following national rating agencies: Standard & Poor’s Group, Moody’s Investors Service, Inc. or Fitch, Inc. Credit ratings are subject to change. AAA, AA, A and BBB are investment grade ratings; BB, B, CCC, CC, C and D are below-investment grade ratings. Certain bonds backed by U.S. Government or agency securities are regarded as having an implied rating equal to the rating of such securities. Holdings designated N/R are not rated by these national rating agencies. |
| 3 | Percentages may not add to 100% due to the exclusion of other assets less liabilities from the table. |
| NPP | Shareholder Meeting Report The annual meeting of shareholders was held in the offices of Nuveen Investments on August 7, 2013; at this meeting the shareholders were asked to vote on the election of Board Members. |
| NMA |
| NMO |
| | | | NPP | | | NMA | | | NMO | |
| | | Common and | | | | | Common and | | | | | Common and | | | | |
| | | | Preferred | | | Preferred | | | Preferred | | | Preferred | | | Preferred | | | Preferred | |
| | | | shares voting | | | shares voting | | | shares voting | | | shares voting | | | shares voting | | | shares voting | |
| | | | together | | | together | | | together | | | together | | | together | | | together | |
| | | | as a class | | | as a class | | | as a class | | | as a class | | | as a class | | | as a class | |
| Approval of the Board Members was reached as follows: | | | | | | | | | | | | | | | | | | | |
| John P. Amboian | | | | | | | | | | | | | | | | | | | |
| For | | | 51,053,181 | | | — | | | 33,406,325 | | | — | | | 36,770,170 | | | — | |
| Withhold | | | 857,047 | | | — | | | 1,051,464 | | | — | | | 1,317,700 | | | — | |
| Total | | | 51,910,228 | | | — | | | 34,457,789 | | | — | | | 38,087,870 | | | — | |
| Robert P. Bremner | | | | | | | | | | | | | | | | | | | |
| For | | | 51,046,625 | | | — | | | 33,365,195 | | | — | | | 36,773,426 | | | — | |
| Withhold | | | 863,603 | | | — | | | 1,092,594 | | | — | | | 1,314,444 | | | — | |
| Total | | | 51,910,228 | | | — | | | 34,457,789 | | | — | | | 38,087,870 | | | — | |
| Jack B. Evans | | | | | | | | | | | | | | | | | | | |
| For | | | 51,085,773 | | | — | | | 33,358,593 | | | — | | | 36,792,549 | | | — | |
| Withhold | | | 824,455 | | | — | | | 1,099,196 | | | — | | | 1,295,321 | | | — | |
| Total | | | 51,910,228 | | | — | | | 34,457,789 | | | — | | | 38,087,870 | | | — | |
| William C. Hunter | | | | | | | | | | | | | | | | | | | |
| For | | | — | | | 5,350 | | | — | | | 2,268 | | | — | | | 2,959 | |
| Withhold | | | — | | | — | | | — | | | 700 | | | — | | | 550 | |
| Total | | | — | | | 5,350 | | | — | | | 2,968 | | | — | | | 3,509 | |
| David J. Kundert | | | | | | | | | | | | | | | | | | | |
| For | | | 51,030,988 | | | — | | | 33,334,562 | | | — | | | 36,743,255 | | | — | |
| Withhold | | | 879,240 | | | — | | | 1,123,227 | | | — | | | 1,344,615 | | | — | |
| Total | | | 51,910,228 | | | — | | | 34,457,789 | | | — | | | 38,087,870 | | | — | |
| William J. Schneider | | | | | | | | | | | | | | | | | | | |
| For | | | — | | | 5,350 | | | — | | | 2,268 | | | — | | | 2,959 | |
| Withhold | | | — | | | — | | | — | | | 700 | | | — | | | 550 | |
| Total | | | — | | | 5,350 | | | — | | | 2,968 | | | — | | | 3,509 | |
| Judith M. Stockdale | | | | | | | | | | | | | | | | | | | |
| For | | | 50,964,314 | | | — | | | 33,320,556 | | | — | | | 36,725,152 | | | — | |
| Withhold | | | 945,914 | | | — | | | 1,137,233 | | | — | | | 1,362,718 | | | — | |
| Total | | | 51,910,228 | | | — | | | 34,457,789 | | | — | | | 38,087,870 | | | — | |
| Carole E. Stone | | | | | | | | | | | | | | | | | | | |
| For | | | 50,962,247 | | | — | | | 33,274,940 | | | — | | | 36,757,464 | | | — | |
| Withhold | | | 947,981 | | | — | | | 1,182,849 | | | — | | | 1,330,406 | | | — | |
| Total | | | 51,910,228 | | | — | | | 34,457,789 | | | — | | | 38,087,870 | | | — | |
| Virginia L. Stringer | | | | | | | | | | | | | | | | | | | |
| For | | | 50,949,203 | | | — | | | 33,330,401 | | | — | | | 36,737,183 | | | — | |
| Withhold | | | 961,025 | | | — | | | 1,127,388 | | | — | | | 1,350,687 | | | — | |
| Total | | | 51,910,228 | | | — | | | 34,457,789 | | | — | | | 38,087,870 | | | — | |
| Terence J. Toth | | | | | | | | | | | | | | | | | | | |
| For | | | 51,072,189 | | | — | | | 33,355,511 | | | — | | | 36,796,368 | | | — | |
| Withhold | | | 838,039 | | | — | | | 1,102,278 | | | — | | | 1,291,502 | | | — | |
| Total | | | 51,910,228 | | | — | | | 34,457,789 | | | — | | | 38,087,870 | | | — | |
| | | | NAD | | | NXZ | | | NZF | |
| | | Common and | | | | | Common and | | | | | Common and | | | | |
| | | | Preferred | | | Preferred | | | Preferred | | | Preferred | | | Preferred | | | Preferred | |
| | | | shares voting | | | shares voting | | | shares voting | | | shares voting | | | shares voting | | | shares voting | |
| | | | together | | | together | | | together | | | together | | | together | | | together | |
| | | | as a class | | | as a class | | | as a class | | | as a class | | | as a class | | | as a class | |
| Approval of the Board Members was reached as follows: | | | | | | | | | | | | | | | | | | | |
| John P. Amboian | | | | | | | | | | | | | | | | | | | |
| For | | | — | | | — | | | — | | | — | | | — | | | — | |
| Withhold | | | — | | | — | | | — | | | — | | | — | | | — | |
| Total | | | — | | | — | | | — | | | — | | | — | | | — | |
| Robert P. Bremner | | | | | | | | | | | | | | | | | | | |
| For | | | — | | | — | | | — | | | — | | | — | | | — | |
| Withhold | | | — | | | — | | | — | | | — | | | — | | | — | |
| Total | | | — | | | — | | | — | | | — | | | — | | | — | |
| Jack B. Evans | | | | | | | | | | | | | | | | | | | |
| For | | | — | | | — | | | — | | | — | | | — | | | — | |
| Withhold | | | — | | | — | | | — | | | — | | | — | | | — | |
| Total | | | — | | | — | | | — | | | — | | | — | | | — | |
| William C. Hunter | | | | | | | | | | | | | | | | | | | |
| For | | | — | | | 11,427,686 | | | — | | | 980 | | | — | | | 5,529,390 | |
| Withhold | | | — | | | 2,136,673 | | | — | | | 980 | | | — | | | 1,179,491 | |
| Total | | | — | | | 13,564,359 | | | — | | | 1,960 | | | — | | | 6,708,881 | |
| David J. Kundert | | | | | | | | | | | | | | | | | | | |
| For | | | — | | | — | | | — | | | — | | | — | | | — | |
| Withhold | | | — | | | — | | | — | | | — | | | — | | | — | |
| Total | | | — | | | — | | | — | | | — | | | — | | | — | |
| William J. Schneider | | | | | | | | | | | | | | | | | | | |
| For | | | — | | | 11,304,686 | | | — | | | 980 | | | — | | | 5,518,779 | |
| Withhold | | | — | | | 2,259,673 | | | — | | | 980 | | | — | | | 1,190,102 | |
| Total | | | — | | | 13,564,359 | | | — | | | 1,960 | | | — | | | 6,708,881 | |
| Judith M. Stockdale | | | | | | | | | | | | | | | | | | | |
| For | | | 43,057,519 | | | — | | | 23,696,142 | | | — | | | 36,032,786 | | | — | |
| Withhold | | | 3,050,662 | | | — | | | 1,007,884 | | | — | | | 2,632,916 | | | — | |
| Total | | | 46,108,181 | | | — | | | 24,704,026 | | | — | | | 38,665,702 | | | — | |
| Carole E. Stone | | | | | | | | | | | | | | | | | | | |
| For | | | 43,120,098 | | | — | | | 23,709,136 | | | — | | | 36,073,882 | | | — | |
| Withhold | | | 2,988,083 | | | — | | | 994,890 | | | — | | | 2,591,820 | | | — | |
| Total | | | 46,108,181 | | | — | | | 24,704,026 | | | — | | | 38,665,702 | | | — | |
| Virginia L. Stringer | | | | | | | | | | | | | | | | | | | |
| For | | | 43,139,006 | | | — | | | 23,720,834 | | | — | | | 36,085,120 | | | — | |
| Withhold | | | 2,969,175 | | | — | | | 983,192 | | | — | | | 2,580,582 | | | — | |
| Total | | | 46,108,181 | | | — | | | 24,704,026 | | | — | | | 38,665,702 | | | — | |
| Terence J. Toth | | | | | | | | | | | | | | | | | | | |
| For | | | — | | | — | | | — | | | — | | | — | | | — | |
| Withhold | | | — | | | — | | | — | | | — | | | — | | | — | |
| Total | | | — | | | — | | | — | | | — | | | — | | | — | |
Report of Independent Registered Public Accounting Firm
The Board of Directors/Trustees and Shareholders of
Nuveen Performance Plus Municipal Fund, Inc.
Nuveen Municipal Advantage Fund, Inc.
Nuveen Municipal Market Opportunity Fund, Inc.
Nuveen Dividend Advantage Municipal Fund
Nuveen Dividend Advantage Municipal Fund 2
Nuveen Dividend Advantage Municipal Fund 3
We have audited the accompanying statements of assets and liabilities, including the portfolios of investments, of Nuveen Performance Plus Municipal Fund, Inc., Nuveen Municipal Advantage Fund, Inc., Nuveen Municipal Market Opportunity Fund, Inc., Nuveen Dividend Advantage Municipal Fund, Nuveen Dividend Advantage Municipal Fund 2, and Nuveen Dividend Advantage Municipal Fund 3 (the “Funds”), as of October 31, 2013, and the related statements of operations and cash flows for the year then ended, the statements of changes in net assets for each of the two years in the period then ended, and the financial highlights for each of the five years in the period then ended. These financial statements and financial highlights are the responsibility of the Funds’ management. Our responsibility is to express an opinion on these financial statements and financial highlights based on our audits.
We conducted our audits in accordance with the standards of the Public Company Accounting Oversight Board (United States). Those standards require that we plan and perform the audit to obtain reasonable assurance about whether the financial statements and financial highlights are free of material misstatement. We were not engaged to perform an audit of the Funds’ internal control over financial reporting. Our audits included consideration of internal control over financial reporting as a basis for designing audit procedures that are appropriate in the circumstances, but not for the purpose of expressing an opinion on the effectiveness of the Funds’ internal control over financial reporting. Accordingly, we express no such opinion. An audit also includes examining, on a test basis, evidence supporting the amounts and disclosures in the financial statements and financial highlights, assessing the accounting principles used and significant estimates made by management, and evaluating the overall financial statement presentation. Our procedures included confirmation of securities owned as of October 31, 2013, by correspondence with the custodian and brokers or by other appropriate auditing procedures where replies from brokers were not received. We believe that our audits provide a reasonable basis for our opinion.
In our opinion, the financial statements and financial highlights referred to above present fairly, in all material respects, the financial positions of Nuveen Performance Plus Municipal Fund, Inc., Nuveen Municipal Advantage Fund, Inc., Nuveen Municipal Market Opportunity Fund, Inc., Nuveen Dividend Advantage Municipal Fund, Nuveen Dividend Advantage Municipal Fund 2, and Nuveen Dividend Advantage Municipal Fund 3 at October 31, 2013, and the results of their operations and their cash flows for the year then ended, the changes in their net assets for each of the two years in the period then ended, and the financial highlights for each of the five years in the period then ended, in conformity with U.S. generally accepted accounting principles.
Chicago, Illinois
December 27, 2013
| NPP | |
| | Nuveen Performance Plus Municipal Fund, Inc. |
| | Portfolio of Investments |
| | October 31, 2013 |
| | Principal | | | Optional Call | | | | | | |
| | Amount (000) | | Description (1) | Provisions (2) | | Ratings (3) | | | Value | |
| | | | LONG-TERM INVESTMENTS – 161.8% (100.0% of Total Investments) | | | | | | | |
| | | | MUNICIPAL BONDS – 161.8% (100.0% of Total Investments) | | | | | | | |
| | | | Alabama – 0.2% (0.1% of Total Investments) | | | | | | | |
| | | | Jefferson County, Alabama, Sewer Revenue Refunding Warrants, Series 1997A: | | | | | | | |
| $ | 1,435 | | 5.625%, 2/01/22 – FGIC Insured (4) | 12/13 at 100.00 | | Ca | | $ | 1,054,825 | |
| | 1,505 | | 5.375%, 2/01/27 – FGIC Insured (4) | 12/13 at 100.00 | | Ca | | | 1,091,125 | |
| | 2,940 | | Total Alabama | | | | | | 2,145,950 | |
| | | | Alaska – 1.3% (0.8% of Total Investments) | | | | | | | |
| | 3,945 | | CivicVentures, Alaska, Anchorage Convention Center Revenue Bonds, Series 2006, 5.000%, 9/01/34 – NPFG Insured | 9/15 at 100.00 | | A1 | | | 4,102,721 | |
| | | | Northern Tobacco Securitization Corporation, Alaska, Tobacco Settlement Asset-Backed Bonds, Series 2006A: | | | | | | | |
| | 7,500 | | 5.000%, 6/01/32 | 6/14 at 100.00 | | B2 | | | 5,728,575 | |
| | 3,080 | | 5.000%, 6/01/46 | 6/14 at 100.00 | | B2 | | | 2,132,530 | |
| | 14,525 | | Total Alaska | | | | | | 11,963,826 | |
| | | | Arizona – 1.2% (0.7% of Total Investments) | | | | | | | |
| | 7,780 | | Phoenix Civic Improvement Corporation, Arizona, Junior Lien Airport Revenue Bonds, Series 2010A, 5.000%, 7/01/40 | 7/20 at 100.00 | | A+ | | | 7,862,935 | |
| | 2,500 | | Phoenix Civic Improvement Corporation, Arizona, Subordinate Excise Tax Revenue Bonds, Civic Plaza Expansion Project, Series 2005A, 5.000%, 7/01/35 – FGIC Insured | No Opt. Call | | AA | | | 2,571,175 | |
| | 10,280 | | Total Arizona | | | | | | 10,434,110 | |
| | | | Arkansas – 0.5% (0.3% of Total Investments) | | | | | | | |
| | 5,080 | | Independence County, Arkansas, Hydroelectric Power Revenue Bonds, Series 2003, 5.350%, 5/01/28 – ACA Insured | 12/13 at 100.00 | | N/R | | | 3,578,555 | |
| | 1,000 | | Washington County, Arkansas, Hospital Revenue Bonds, Washington Regional Medical Center, Series 2005A, 5.000%, 2/01/35 | 2/15 at 100.00 | | Baa1 | | | 1,000,940 | |
| | 6,080 | | Total Arkansas | | | | | | 4,579,495 | |
| | | | California – 21.9% (13.6% of Total Investments) | | | | | | | |
| | 3,500 | | Alameda Corridor Transportation Authority, California, Revenue Bonds, Refunding Subordinate Lien Series 2004A, 5.450%, 10/01/25 – AMBAC Insured | 10/17 at 100.00 | | BBB+ | | | 3,737,755 | |
| | 4,225 | | Alameda Unified School District, Alameda County, California, General Obligation Bonds, Series 2005B, 0.000%, 8/01/28 – AGM Insured | No Opt. Call | | Aa2 | | | 2,092,812 | |
| | 15,870 | | Anaheim Public Finance Authority, California, Subordinate Lease Revenue Bonds, Public Improvement Project, Series 1997C, 0.000%, 9/01/20 – AGM Insured | No Opt. Call | | AA– | | | 12,734,723 | |
| | 5,000 | | Bay Area Toll Authority, California, Revenue Bonds, San Francisco Bay Area Toll Bridge, Series 2013S-4, 5.000%, 4/01/38 | 4/23 at 100.00 | | A+ | | | 5,155,100 | |
| | 3,250 | | California Department of Water Resources, Power Supply Revenue Bonds, Refunding Series 2008H, 5.000%, 5/01/22 – AGM Insured | 5/18 at 100.00 | | AA | | | 3,762,980 | |
| | | | California Health Facilities Financing Authority, Revenue Bonds, Kaiser Permanante System, Series 2006: | | | | | | | |
| | 5,000 | | 5.000%, 4/01/37 | 4/16 at 100.00 | | A+ | | | 5,021,800 | |
| | 7,000 | | 5.250%, 4/01/39 | 4/16 at 100.00 | | A+ | | | 7,066,780 | |
| | 2,330 | | California Municipal Finance Authority, Revenue Bonds, Eisenhower Medical Center, Series 2010A, 5.750%, 7/01/40 | 7/20 at 100.00 | | Baa2 | | | 2,363,249 | |
| | 3,700 | | California Pollution Control Financing Authority, Revenue Bonds, Pacific Gas and Electric Company, Series 2004C, 4.750%, 12/01/23 – FGIC Insured (Alternative Minimum Tax) | 6/17 at 100.00 | | A3 | | | 3,868,239 | |
| | 5,000 | | California State, General Obligation Bonds, Series 2005, 5.000%, 3/01/31 | 3/16 at 100.00 | | A1 | | | 5,151,700 | |
| NPP | | Nuveen Performance Plus Municipal Fund, Inc. (continued) |
| | | Portfolio of Investments October 31, 2013 |
| | Principal | | | Optional Call | | | | | | |
| | Amount (000) | | Description (1) | Provisions (2) | | Ratings (3) | | | Value | |
| | | | California (continued) | | | | | | | |
| $ | 16,000 | | California State, General Obligation Bonds, Various Purpose Series 2007, 5.000%, 6/01/37 | 6/17 at 100.00 | | A1 | | $ | 16,448,000 | |
| | 10,000 | | California State, General Obligation Bonds, Various Purpose Series 2011, 5.000%, 10/01/41 | 10/21 at 100.00 | | A1 | | | 10,242,500 | |
| | 6,435 | | California State, General Obligation Refunding Bonds, Series 2002, 6.000%,
4/01/16 – AMBAC Insured | No Opt. Call | | A1 | | | 7,305,012 | |
| | 3,770 | | California Statewide Communities Development Authority, Revenue Bonds, Cottage Health System Obligated Group, Series 2010, 5.250%, 11/01/30 | 11/20 at 100.00 | | AA– | | | 3,962,421 | |
| | 3,000 | | California Statewide Community Development Authority, Health Facility Revenue Bonds, Catholic Healthcare West, Series 2008C, 5.625%, 7/01/35 | 7/18 at 100.00 | | A | | | 3,306,780 | |
| | 5,000 | | Coast Community College District, Orange County, California, General Obligation Bonds, Series 2006C, 5.000%, 8/01/32 – AGM Insured | 8/18 at 100.00 | | Aa1 | | | 5,238,300 | |
| | 7,240 | | Desert Community College District, Riverside County, California, General Obligation Bonds, Election 2004 Series 2007C, 0.000%, 8/01/28 – AGM Insured | 8/17 at 56.01 | | Aa2 | | | 3,375,505 | |
| | 10,000 | | Golden State Tobacco Securitization Corporation, California, Enhanced Tobacco Settlement Asset-Backed Revenue Bonds, Series 2005A, 0.000%, 6/01/26 – AGM Insured | No Opt. Call | | AA– | | | 5,916,400 | |
| | | | Golden State Tobacco Securitization Corporation, California, Tobacco Settlement Asset-Backed Bonds, Series 2007A-1: | | | | | | | |
| | 2,520 | | 4.500%, 6/01/27 | 6/17 at 100.00 | | B | | | 2,155,306 | |
| | 7,500 | | 5.000%, 6/01/33 | 6/17 at 100.00 | | B | | | 5,781,375 | |
| | 1,500 | | 5.125%, 6/01/47 | 6/17 at 100.00 | | B | | | 1,051,305 | |
| | 10,000 | | Golden State Tobacco Securitization Corporation, California, Tobacco Settlement Asset-Backed Bonds, Series 2007A-2, 5.300%, 6/01/37 | 6/22 at 100.00 | | B | | | 7,450,400 | |
| | 2,500 | | Huntington Beach Union High School District, Orange County, California, General Obligation Bonds, Series 2007, 0.000%, 8/01/32 – FGIC Insured | No Opt. Call | | Aa2 | | | 927,300 | |
| | 5,000 | | Los Angeles Community College District, California, General Obligation Bonds, Series 2007C, 5.000%, 8/01/32 – FGIC Insured | 8/17 at 100.00 | | Aa1 | | | 5,280,450 | |
| | 2,495 | | Los Angeles Department of Water and Power, California, Waterworks Revenue Bonds, Series 2009A, 5.375%, 7/01/34 | 1/19 at 100.00 | | AA | | | 2,752,684 | |
| | 1,855 | | Mount San Antonio Community College District, Los Angeles County, California, General Obligation Bonds, Election of 2008, Series 2013A, 0.000%, 8/01/43 | 8/35 at 100.00 | | AA | | | 885,967 | |
| | 3,300 | | M-S-R Energy Authority, California, Gas Revenue Bonds, Citigroup Prepay Contracts, Series 2009B, 6.500%, 11/01/39 | No Opt. Call | | A | | | 3,968,910 | |
| | 1,000 | | Mt. Diablo Hospital District, California, Insured Hospital Revenue Bonds, Series 1993A, 5.125%, 12/01/23 – AMBAC Insured (ETM) | 12/13 at 100.00 | | N/R (5) | | | 1,169,930 | |
| | 2,000 | | Murrieta Valley Unified School District Public Financing Authority, California, Special Tax Revenue Bonds, Series 2006A, 5.125%, 9/01/26 – AGM Insured | 9/16 at 100.00 | | AA– | | | 2,145,960 | |
| | 3,600 | | New Haven Unified School District, Alameda County, California, General Obligation Bonds, Series 2004A, 0.000%, 8/01/28 – NPFG Insured | No Opt. Call | | Aa3 | | | 1,693,404 | |
| | 10,575 | | Ontario Redevelopment Financing Authority, San Bernardino County, California, Revenue Refunding Bonds, Redevelopment Project 1, Series 1995, 7.200%, 8/01/17 – NPFG Insured | No Opt. Call | | A | | | 11,651,112 | |
| | 2,325 | | Palmdale Community Redevelopment Agency, California, Restructured Single Family Mortgage Revenue Bonds, Series 1986D, 8.000%, 4/01/16 (Alternative Minimum Tax) (ETM) | No Opt. Call | | Aaa | | | 2,749,220 | |
| | 2,525 | | Palmdale, California, Certificates of Participation, Park Improvement and Avenue Construction, Series 2002, 5.000%, 9/01/32 – NPFG Insured | 9/14 at 100.00 | | A | | | 2,526,768 | |
| | 5,960 | | Palomar Pomerado Health, California, General Obligation Bonds, Election of 2004, Series 2007A, 5.000%, 8/01/32 – NPFG Insured | 8/17 at 100.00 | | A+ | | | 6,059,294 | |
| | 9,320 | | Palomar Pomerado Health, California, General Obligation Bonds, Series 2009A, 0.000%, 8/01/33 – AGC Insured | No Opt. Call | | AA– | | | 3,167,309 | |
| | 1,945 | | Rancho Mirage Joint Powers Financing Authority, California, Certificates of Participation, Eisenhower Medical Center, Series 1997B, 4.875%, 7/01/22 – NPFG Insured | 7/15 at 102.00 | | Baa1 | | | 1,983,783 | |
| | 1,830 | | San Diego Public Facilities Financing Authority, California, Water Utility Revenue Bonds, Tender Option Bond Trust 3504, 19.820%, 2/01/33 (IF) | 8/19 at 100.00 | | Aa2 | | | 2,468,249 | |
| | Principal | | | Optional Call | | | | | | |
| | Amount (000) | | Description (1) | Provisions (2) | | Ratings (3) | | | Value | |
| | | | California (continued) | | | | | | | |
| | | | San Joaquin Hills Transportation Corridor Agency, Orange County, California, Toll Road Revenue Refunding Bonds, Series 1997A: | | | | | | | |
| $ | 7,210 | | 0.000%, 1/15/23 – NPFG Insured | No Opt. Call | | A | | $ | 4,286,201 | |
| | 13,540 | | 0.000%, 1/15/32 – NPFG Insured | No Opt. Call | | A | | | 4,292,992 | |
| | 3,000 | | 0.000%, 1/15/35 – NPFG Insured | No Opt. Call | | A | | | 775,920 | |
| | 2,965 | | San Juan Unified School District, Sacramento County, California, General Obligation Bonds, Series 2004A, 0.000%, 8/01/28 – NPFG Insured | No Opt. Call | | Aa2 | | | 1,416,766 | |
| | 4,005 | | San Mateo Union High School District, San Mateo County, California, General Obligation Bonds, Election of 2000, Series 2002B, 0.000%, 9/01/26 – FGIC Insured | No Opt. Call | | Aa1 | | | 2,385,018 | |
| | 2,390 | | Tobacco Securitization Authority of Northern California, Tobacco Settlement Asset-Backed Bonds, Series 2005A-1, 4.750%, 6/01/23 | 6/15 at 100.00 | | B+ | | | 2,227,361 | |
| | 2,630 | | Union Elementary School District, Santa Clara County, California, General Obligation Bonds, Series 2001B, 0.000%, 9/01/25 – FGIC Insured | No Opt. Call | | AA+ | | | 1,618,186 | |
| | 5,245 | | Vacaville Unified School District, California, General Obligation Bonds, Series 2005, 5.000%, 8/01/30 – NPFG Insured | 8/15 at 100.00 | | AA– | | | 5,481,707 | |
| | 235,055 | | Total California | | | | | | 195,102,933 | |
| | | | Colorado – 11.5% (7.1% of Total Investments) | | | | | | | |
| | 5,240 | | Adams 12 Five Star Schools, Adams County, Colorado, General Obligation Bonds, Series 2005, 5.000%, 12/15/24 (Pre-refunded 12/15/15) – AGM Insured | 12/15 at 100.00 | | Aa2 (5) | | | 5,758,184 | |
| | 3,000 | | Colorado Educational and Cultural Facilities Authority, Charter School Revenue Bonds, Peak-to-Peak Charter School, Series 2004, 5.250%, 8/15/34 – SYNCORA GTY Insured | 8/14 at 100.00 | | A | | | 3,008,130 | |
| | 3,350 | | Colorado Health Facilities Authority, Colorado, Revenue Bonds, Catholic Health Initiatives, Series 2006A, 4.500%, 9/01/38 | 9/16 at 100.00 | | A+ | | | 3,066,322 | |
| | 2,295 | | Colorado Health Facilities Authority, Colorado, Revenue Bonds, Catholic Health Initiatives, Series 2011A, 5.000%, 2/01/41 | 2/21 at 100.00 | | A+ | | | 2,249,628 | |
| | 14,000 | | Colorado Health Facilities Authority, Colorado, Revenue Bonds, Sisters of Charity of Leavenworth Health Services Corporation, Series 2010A, 5.000%, 1/01/40 | 1/20 at 100.00 | | AA– | | | 14,080,220 | |
| | 2,000 | | Colorado Health Facilities Authority, Colorado, Revenue Bonds, Valley View Hospital Association, Series 2007, 5.250%, 5/15/42 | 5/17 at 100.00 | | BBB+ | | | 1,978,060 | |
| | 3,225 | | Denver City and County, Colorado, Airport System Revenue Bonds, Subordinate Lien Series 2013B, 5.000%, 11/15/43 | 11/23 at 100.00 | | A | | | 3,245,189 | |
| | 20,000 | | Denver Convention Center Hotel Authority, Colorado, Revenue Bonds, Convention Center Hotel, Senior Lien Series 2003A, 5.000%, 12/01/33 (Pre-refunded 12/01/13) – SYNCORA GTY Insured | 12/13 at 100.00 | | N/R (5) | | | 20,080,600 | |
| | 13,620 | | E-470 Public Highway Authority, Colorado, Senior Revenue Bonds, Series 1997B, 0.000%, 9/01/21 – NPFG Insured | No Opt. Call | | A | | | 10,038,349 | |
| | | | E-470 Public Highway Authority, Colorado, Senior Revenue Bonds, Series 2000B: | | | | | | | |
| | 16,200 | | 0.000%, 9/01/32 – NPFG Insured | No Opt. Call | | A | | | 5,508,972 | |
| | 33,120 | | 0.000%, 9/01/33 – NPFG Insured | No Opt. Call | | A | | | 10,533,816 | |
| | | | E-470 Public Highway Authority, Colorado, Toll Revenue Bonds, Series 2004A: | | | | | | | |
| | 9,310 | | 0.000%, 9/01/28 – NPFG Insured | No Opt. Call | | A | | | 4,278,969 | |
| | 18,500 | | 0.000%, 3/01/36 – NPFG Insured | No Opt. Call | | A | | | 4,983,530 | |
| | 755 | | Jefferson County School District R1, Colorado, General Obligation Bonds, Series 2004, 5.000%, 12/15/22 (Pre-refunded 12/15/14) – AGM Insured | 12/14 at 100.00 | | Aa2 (5) | | | 795,604 | |
| | | | Regional Transportation District, Colorado, Denver Transit Partners Eagle P3 Project Private Activity Bonds, Series 2010: | | | | | | | |
| | 5,000 | | 6.500%, 1/15/30 | 7/20 at 100.00 | | Baa3 | | | 5,446,100 | |
| | 3,750 | | 6.000%, 1/15/41 | 7/20 at 100.00 | | Baa3 | | | 3,849,375 | |
| | 40 | | University of Colorado, Enterprise System Revenue Bonds, Series 2005, 5.000%, 6/01/30 – FGIC Insured | 6/15 at 100.00 | | Aa2 | | | 41,759 | |
| | | | University of Colorado, Enterprise System Revenue Bonds, Series 2005: | | | | | | | |
| | 2,130 | | 5.000%, 6/01/30 (Pre-refunded 6/01/15) – FGIC Insured | 6/15 at 100.00 | | Aa2 (5) | | | 2,286,470 | |
| | 1,145 | | 5.000%, 6/01/30 (Pre-refunded 6/01/15) – FGIC Insured | 6/15 at 100.00 | | Aa2 (5) | | | 1,229,112 | |
| | 156,680 | | Total Colorado | | | | | | 102,458,389 | |
| NPP | Nuveen Performance Plus Municipal Fund, Inc. (continued) |
| | Portfolio of Investments October 31, 2013 |
| | Principal | | | Optional Call | | | | | | |
| | Amount (000) | | Description (1) | Provisions (2) | | Ratings (3) | | | Value | |
| | | | Connecticut – 0.9% (0.6% of Total Investments) | | | | | | | |
| $ | 7,640 | | Connecticut Health and Educational Facilities Authority, Revenue Bonds, Yale University, Series 2007Z-1, 5.000%, 7/01/42 | 7/16 at 100.00 | | AAA | | $ | 8,066,694 | |
| | | | District of Columbia – 0.8% (0.5% of Total Investments) | | | | | | | |
| | 2,430 | | District of Columbia Tobacco Settlement Corporation, Tobacco Settlement Asset-Backed Bonds, Series 2001, 6.250%, 5/15/24 | 11/13 at 100.00 | | A1 | | | 2,442,077 | |
| | 5,000 | | Washington Convention Center Authority, District of Columbia, Dedicated Tax Revenue Bonds, Senior Lien Refunding Series 2007A, 4.500%, 10/01/30 – AMBAC Insured | 10/16 at 100.00 | | A1 | | | 4,958,900 | |
| | 7,430 | | Total District of Columbia | | | | | | 7,400,977 | |
| | | | Florida – 7.5% (4.6% of Total Investments) | | | | | | | |
| | 1,700 | | Beacon Tradeport Community Development District, Miami-Dade County, Florida, Special Assessment Bonds, Commercial Project, Series 2002A, 5.625%,
5/01/32 – RAAI Insured | 5/14 at 100.00 | | N/R | | | 1,685,924 | |
| | | | Broward County Housing Finance Authority, Florida, Multifamily Housing Revenue Bonds, Venice Homes Apartments, Series 2001A: | | | | | | | |
| | 1,545 | | 5.700%, 1/01/32 – AGM Insured (Alternative Minimum Tax) | 1/14 at 100.00 | | AA– | | | 1,545,757 | |
| | 1,805 | | 5.800%, 1/01/36 – AGM Insured (Alternative Minimum Tax) | 1/14 at 100.00 | | AA– | | | 1,805,740 | |
| | 5,600 | | Escambia County Health Facilities Authority, Florida, Revenue Bonds, Ascension Health Credit Group, Series 2003A, 5.250%, 11/15/14 | No Opt. Call | | AA+ | | | 5,882,184 | |
| | 3,080 | | Florida Housing Finance Corporation, Homeowner Mortgage Revenue Bonds, Series 2006-2, 4.950%, 7/01/37 (Alternative Minimum Tax) | 1/16 at 100.00 | | AA+ | | | 3,199,689 | |
| | 10,000 | | JEA, Florida, Electric System Revenue Bonds, Series Three 2006A, 5.000%, 10/01/41 – AGM Insured (UB) | 4/15 at 100.00 | | Aa2 | | | 10,308,900 | |
| | 3,775 | | Miami-Dade County, Florida, Aviation Revenue Bonds, Miami International Airport, Series 2005A, 5.000%, 10/01/37 – SYNCORA GTY Insured (Alternative Minimum Tax) | 10/15 at 100.00 | | A | | | 3,697,462 | |
| | 5,000 | | Miami-Dade County, Florida, Aviation Revenue Bonds, Miami International Airport, Series 2010A-1, 5.375%, 10/01/41 | 10/20 at 100.00 | | A | | | 5,176,250 | |
| | 2,500 | | Miami-Dade County, Florida, Aviation Revenue Bonds, Miami International Airport, Series 2010B, 5.000%, 10/01/27 | 10/20 at 100.00 | | A | | | 2,642,700 | |
| | 2,410 | | Miami-Dade County, Florida, General Obligation Bonds, Parks Program, Series 2005, 4.300%, 11/01/30 – NPFG Insured | 11/15 at 100.00 | | Aa2 | | | 2,404,240 | |
| | 5,500 | | Miami-Dade County, Florida, Transit System Sales Surtax Revenue Bonds, Series 2012, 5.000%, 7/01/31 | No Opt. Call | | AA | | | 5,763,615 | |
| | 1,665 | | Orange County Health Facilities Authority, Florida, Orlando Regional Healthcare System Revenue Bonds, Series 2009, 5.125%, 10/01/26 | 10/19 at 100.00 | | A | | | 1,764,117 | |
| | 2,500 | | Orange County School Board, Florida, Certificates of Participation, Series 2004A, 5.000%, 8/01/29 – AMBAC Insured | 8/14 at 100.00 | | Aa2 | | | 2,550,000 | |
| | 2,400 | | Orange County School Board, Florida, Certificates of Participation, Series 2005B, 5.000%, 8/01/25 – AMBAC Insured | 8/15 at 100.00 | | Aa2 | | | 2,562,072 | |
| | 5,085 | | Orange County, Florida, Tourist Development Tax Revenue Bonds, Refunding Series 2007, 4.750%, 10/01/29 – FGIC Insured | No Opt. Call | | AA– | | | 5,164,326 | |
| | | | Port Saint Lucie, Florida, Special Assessment Revenue Bonds, Southwest Annexation District 1B, Series 2007: | | | | | | | |
| | 2,000 | | 5.000%, 7/01/33 – NPFG Insured | 7/17 at 100.00 | | A | | | 2,025,920 | |
| | 4,700 | | 5.000%, 7/01/40 – NPFG Insured | 7/17 at 100.00 | | A | | | 4,724,675 | |
| | 3,300 | | Tampa, Florida, Health System Revenue Bonds, Baycare Health System, Series 2012A, 5.000%, 11/15/33 | 5/22 at 100.00 | | Aa2 | | | 3,391,113 | |
| | 64,565 | | Total Florida | | | | | | 66,294,684 | |
| | | | Georgia – 1.2% (0.7% of Total Investments) | | | | | | | |
| | 5,000 | | Atlanta, Georgia, Water and Wastewater Revenue Bonds, Series 1999A, 5.500%, 11/01/22 – FGIC Insured | No Opt. Call | | Aa3 | | | 5,867,100 | |
| | 2,000 | | DeKalb County Hospital Authority, Georgia, Anticipation Certificates Revenue Bonds, DeKalb Medical Center, Inc. Project, Series 2010, 6.000%, 9/01/30 | 9/20 at 100.00 | | BBB | | | 2,072,840 | |
| | Principal | | | Optional Call | | | | | | |
| | Amount (000) | | Description (1) | Provisions (2) | | Ratings (3) | | | Value | |
| | | | Georgia (continued) | | | | | | | |
| $ | 2,500 | | Medical Center Hospital Authority, Georgia, Revenue Anticipation Certificates, Columbus Regional Healthcare System, Inc. Project, Series 2008, 6.500%, 8/01/38 – AGC Insured | 8/18 at 100.00 | | AA– | | $ | 2,697,625 | |
| | 9,500 | | Total Georgia | | | | | | 10,637,565 | |
| | | | Idaho – 0.0% (0.0% of Total Investments) | | | | | | | |
| | 70 | | Idaho Housing and Finance Association, Single Family Mortgage Bonds, Series 2000D, 6.200%, 7/01/14 (Alternative Minimum Tax) | 12/13 at 100.00 | | A1 | | | 71,141 | |
| | 275 | | Idaho Housing and Finance Association, Single Family Mortgage Bonds, Series 2000G-2, 5.950%, 7/01/25 (Alternative Minimum Tax) | 12/13 at 100.00 | | AAA | | | 281,817 | |
| | 345 | | Total Idaho | | | | | | 352,958 | |
| | | | Illinois – 28.3% (17.5% of Total Investments) | | | | | | | |
| | 1,470 | | Chicago Board of Education, Cook County, Illinois, General Obligation Bonds, Dedicated Revenues Series 2011A, 5.000%, 12/01/41 | 12/21 at 100.00 | | A+ | | | 1,345,829 | |
| | 10,000 | | Chicago Board of Education, Illinois, Unlimited Tax General Obligation Bonds, Dedicated Tax Revenues, Series 1998B-1, 0.000%, 12/01/19 – FGIC Insured | No Opt. Call | | A+ | | | 7,829,600 | |
| | 10,000 | | Chicago Board of Education, Illinois, Unlimited Tax General Obligation Bonds, Dedicated Tax Revenues, Series 1999A, 0.000%, 12/01/20 – FGIC Insured | No Opt. Call | | A+ | | | 7,289,000 | |
| | | | Chicago, Illinois, General Obligation Bonds, City Colleges, Series 1999: | | | | | | | |
| | 32,170 | | 0.000%, 1/01/21 – FGIC Insured | No Opt. Call | | AA– | | | 23,140,846 | |
| | 32,670 | | 0.000%, 1/01/22 – FGIC Insured | No Opt. Call | | AA– | | | 21,722,936 | |
| | 9,240 | | Chicago, Illinois, Revenue Bonds, Midway Airport, Series 1996A, 5.500%, 1/01/29 – NPFG Insured | 1/14 at 100.00 | | A | | | 9,268,090 | |
| | 1,785 | | Chicago, Illinois, Third Lien General Airport Revenue Bonds, O’Hare International Airport, Series 2005A, 5.000%, 1/01/33 – FGIC Insured | 1/16 at 100.00 | | A | | | 1,789,962 | |
| | 5,325 | | Cook County, Illinois, General Obligation Bonds, Refunding Series 2010A, 5.250%, 11/15/33 | 11/20 at 100.00 | | AA | | | 5,362,222 | |
| | | | DuPage County Forest Preserve District, Illinois, General Obligation Bonds, Series 2000: | | | | | | | |
| | 8,000 | | 0.000%, 11/01/18 | No Opt. Call | | AAA | | | 7,302,160 | |
| | 15,285 | | 0.000%, 11/01/19 | No Opt. Call | | AAA | | | 13,432,152 | |
| | 3,000 | | Illinois Educational Facilities Authority, Revenue Bonds, Northwestern University, Series 2003, 5.000%, 12/01/33 (Pre-refunded 12/01/13) | 12/13 at 100.00 | | AAA | | | 3,012,210 | |
| | 1,500 | | Illinois Finance Authority, Revenue Bonds, Central DuPage Health, Series 2009B, 5.500%, 11/01/39 | 11/19 at 100.00 | | AA | | | 1,586,100 | |
| | 2,000 | | Illinois Finance Authority, Revenue Bonds, Children’s Memorial Hospital, Series 2008A, 5.250%, 8/15/47 – AGC Insured (UB) | 8/18 at 100.00 | | AA– | | | 2,006,960 | |
| | 5,245 | | Illinois Finance Authority, Revenue Bonds, Loyola University of Chicago, Tender Option Bond Trust 1137, 9.232%, 7/01/15 (IF) | No Opt. Call | | AA+ | | | 5,399,308 | |
| | 3,000 | | Illinois Finance Authority, Revenue Bonds, Memorial Health System, Series 2009, 5.500%, 4/01/34 | 4/19 at 100.00 | | A+ | | | 3,095,370 | |
| | 2,000 | | Illinois Finance Authority, Revenue Bonds, Provena Health, Series 2009A, 7.750%, 8/15/34 | 8/19 at 100.00 | | BBB+ | | | 2,424,140 | |
| | 870 | | Illinois Finance Authority, Revenue Bonds, Rehabilitation Institute of Chicago, Series 2013A, 6.000%, 7/01/43 | 7/23 at 100.00 | | A– | | | 897,918 | |
| | 2,500 | | Illinois Finance Authority, Revenue Bonds, The University of Chicago Medical Center, Series 2011C, 5.500%, 8/15/41 (UB), (6) | 2/21 at 100.00 | | AA– | | | 2,604,800 | |
| | | | Illinois Finance Authority, Revenue Bonds, University of Chicago, Series 2004A: | | | | | | | |
| | 815 | | 5.000%, 7/01/34 (Pre-refunded 7/01/14) | 7/14 at 100.00 | | Aa1 (5) | | | 841,357 | |
| | 185 | | 5.000%, 7/01/34 (Pre-refunded 7/01/14) | 7/14 at 100.00 | | Aa1 (5) | | | 190,983 | |
| | | | Illinois Finance Authority, Revenue Refunding Bonds, Silver Cross Hospital and Medical Centers, Series 2008A: | | | | | | | |
| | 2,250 | | 6.000%, 8/15/23 | 8/18 at 100.00 | | BBB+ | | | 2,462,288 | |
| | 3,055 | | 5.500%, 8/15/30 | 8/18 at 100.00 | | BBB+ | | | 3,123,646 | |
| | 4,970 | | Illinois Finance Authority, Student Housing Revenue Bonds, Educational Advancement Fund Inc., Refunding Series 2007A, 5.250%, 5/01/34 | 5/17 at 100.00 | | BBB+ | | | 4,673,043 | |
| | 995 | | Illinois Health Facilities Authority, Revenue Bonds, Silver Cross Hospital and Medical Centers, Series 1999, 5.250%, 8/15/15 | 2/14 at 100.00 | | BBB+ | | | 997,368 | |
| NPP | Nuveen Performance Plus Municipal Fund, Inc. (continued) |
| | Portfolio of Investments October 31, 2013 |
| | Principal | | | Optional Call | | | | | | |
| | Amount (000) | | Description (1) | Provisions (2) | | Ratings (3) | | | Value | |
| | | | Illinois (continued) | | | | | | | |
| $ | 2,515 | | Illinois State, General Obligation Bonds, Refunding Series 2012, 5.000%, 8/01/24 | 8/22 at 100.00 | | A– | | $ | 2,646,459 | |
| | 2,235 | | Illinois Toll Highway Authority, Toll Highway Revenue Bonds, Senior Lien Series 2013A, 5.000%, 1/01/38 | 1/23 at 100.00 | | AA– | | | 2,244,633 | |
| | 7,250 | | Kane, Kendall, LaSalle, and Will Counties, Illinois, Community College District 516, General Obligation Bonds, Series 2005E, 0.000%, 12/15/24 (Pre-refunded 12/15/13) – FGIC Insured | 12/13 at 57.71 | | AA+ (5) | | | 4,182,018 | |
| | 28,000 | | Metropolitan Pier and Exposition Authority, Illinois, Revenue Bonds, McCormick Place Expansion Project, Series 2002A, 0.000%, 12/15/35 – AGM Insured | No Opt. Call | | AAA | | | 7,702,800 | |
| | 10,650 | | Metropolitan Pier and Exposition Authority, Illinois, Revenue Bonds, McCormick Place Hospitality Facility, Series 1996A, 7.000%, 7/01/26 (ETM), (6) | No Opt. Call | | Aaa | | | 14,498,591 | |
| | | | Metropolitan Pier and Exposition Authority, Illinois, Revenue Refunding Bonds, McCormick Place Expansion Project, Series 1996A: | | | | | | | |
| | 9,400 | | 0.000%, 12/15/18 – NPFG Insured | No Opt. Call | | AA– | | | 8,235,904 | |
| | 16,570 | | 0.000%, 12/15/20 – NPFG Insured | No Opt. Call | | AA– | | | 12,881,187 | |
| | 23,920 | | 0.000%, 12/15/22 – NPFG Insured | No Opt. Call | | AA– | | | 16,336,882 | |
| | 13,350 | | 0.000%, 12/15/24 – NPFG Insured | No Opt. Call | | AA– | | | 8,044,443 | |
| | 5,100 | | Metropolitan Pier and Exposition Authority, Illinois, Revenue Refunding Bonds, McCormick Place Expansion Project, Series 1998A, 5.500%, 12/15/23 – FGIC Insured | No Opt. Call | | AAA | | | 5,816,244 | |
| | 5,180 | | Metropolitan Pier and Exposition Authority, Illinois, Revenue Refunding Bonds, McCormick Place Expansion Project, Series 1998A, 5.500%, 12/15/23 – FGIC Insured (ETM) | No Opt. Call | | AA– (5) | | | 6,286,966 | |
| | 2,685 | | Midlothian, Illinois, General Obligation Bonds, Series 2010A, 5.000%, 2/01/30 – AGM Insured | 2/20 at 100.00 | | AA– | | | 2,752,850 | |
| | 17,865 | | Regional Transportation Authority, Cook, DuPage, Kane, Lake, McHenry and Will Counties, Illinois, General Obligation Bonds, Series 1999, 5.750%, 6/01/23 – AGM Insured | No Opt. Call | | AA | | | 20,607,278 | |
| | 4,810 | | Will County Community High School District 210 Lincoln-Way, Illinois, General Obligation Bonds, Series 2006, 0.000%, 1/01/23 – AGM Insured | No Opt. Call | | Aa2 | | | 3,306,779 | |
| | 5,190 | | Will County Community High School District 210 Lincoln-Way, Illinois, General Obligation Bonds, Series 2006, 0.000%, 1/01/23 – AGM Insured (ETM) | No Opt. Call | | Aa2 (5) | | | 3,986,076 | |
| | 313,050 | | Total Illinois | | | | | | 251,327,398 | |
| | | | Indiana – 4.0% (2.4% of Total Investments) | | | | | | | |
| | 3,000 | | Delaware County Hospital Authority, Indiana, Hospital Revenue Bonds, Cardinal Health System, Series 2006, 5.250%, 8/01/36 | 8/16 at 100.00 | | A3 | | | 3,063,210 | |
| | 2,525 | | Indiana Finance Authority, Hospital Revenue Bonds, Community Health Network Project, Series 2012A, 5.000%, 5/01/42 | 5/23 at 100.00 | | A | | | 2,474,273 | |
| | 3,075 | | Indiana Finance Authority, Private Activity Bonds, Ohio River Bridges East End Crossing Project, Series 2013A, 5.000%, 7/01/48 (Alternative Minimum Tax) | 7/23 at 100.00 | | BBB | | | 2,729,862 | |
| | 750 | | Indiana Health Facility Financing Authority, Hospital Revenue Bonds, Clarian Health Obligation Group, Series 2006B, 5.000%, 2/15/23 | 2/16 at 100.00 | | AA– | | | 806,715 | |
| | 1,305 | | Indiana Health Facility Financing Authority, Hospital Revenue Bonds, Deaconess Hospital Inc., Series 2004A, 5.375%, 3/01/34 (Pre-refunded 3/01/14) – AMBAC Insured | 3/14 at 100.00 | | A+ (5) | | | 1,327,811 | |
| | 840 | | Indiana Health Facility Financing Authority, Hospital Revenue Refunding Bonds, Columbus Regional Hospital, Series 1993, 7.000%, 8/15/15 – AGM Insured | No Opt. Call | | AA– | | | 893,038 | |
| | 4,320 | | Indiana Health Facility Financing Authority, Revenue Bonds, Ancilla Systems Inc. Obligated Group, Series 1997, 5.250%, 7/01/22 – NPFG Insured (ETM) | 12/13 at 100.00 | | A (5) | | | 4,338,230 | |
| | 3,000 | | Indiana Health Facility Financing Authority, Revenue Bonds, Community Foundation of Northwest Indiana, Series 2007, 5.500%, 3/01/37 | 3/17 at 100.00 | | A | | | 3,094,050 | |
| | 2,000 | | Indiana Health Facility Financing Authority, Revenue Bonds, Community Hospitals of Indiana, Series 2005A, 5.000%, 5/01/35 (Pre-refunded 5/01/15) – AMBAC Insured | 5/15 at 100.00 | | A (5) | | | 2,142,420 | |
| | 3,000 | | Indiana Municipal Power Agency, Power Supply System Revenue Bonds, Series 2011A, 5.000%, 1/01/31 | No Opt. Call | | A+ | | | 3,141,720 | |
| | 9,560 | | Indianapolis Local Public Improvement Bond Bank, Indiana, Series 1999E, 0.000%, 2/01/26 – AMBAC Insured | No Opt. Call | | AA | | | 5,924,045 | |
| | Principal | | | Optional Call | | | | | | |
| | Amount (000) | | Description (1) | Provisions (2) | | Ratings (3) | | | Value | |
| | | | Indiana (continued) | | | | | | | |
| $ | 2,395 | | Shelbyville Central Renovation School Building Corporation, Indiana, First Mortgage Bonds, Series 2005, 4.375%, 7/15/26 – NPFG Insured | 7/15 at 100.00 | | AA+ | | $ | 2,453,270 | |
| | 1,800 | | Sunman Dearborn High School Building Corporation, Indiana, First Mortgage Bonds, Series 2005, 5.000%, 7/15/25 (Pre-refunded 1/15/15) – NPFG Insured | 1/15 at 100.00 | | AA+ (5) | | | 1,903,284 | |
| | 1,580 | | Zionsville Community Schools Building Corporation, Indiana, First Mortgage Bonds, Series 2005Z, 0.000%, 1/15/28 – AGM Insured | No Opt. Call | | AA– | | | 853,800 | |
| | 39,150 | | Total Indiana | | | | | | 35,145,728 | |
| | | | Iowa – 2.4% (1.5% of Total Investments) | | | | | | | |
| | 1,500 | | Iowa Finance Authority, Health Facility Revenue Bonds, Care Initiatives Project, Series 2006A, 5.500%, 7/01/21 | 7/16 at 100.00 | | BB+ | | | 1,522,875 | |
| | | | Iowa Finance Authority, Iowa, Midwestern Disaster Area Revenue Bonds, Iowa Fertilizer Company Project, Series 2013: | | | | | | | |
| | 3,000 | | 5.000%, 12/01/19 | No Opt. Call | | BB– | | | 2,915,640 | |
| | 2,220 | | 5.250%, 12/01/25 | 12/23 at 100.00 | | BB– | | | 2,035,296 | |
| | | | Iowa Tobacco Settlement Authority, Asset Backed Settlement Revenue Bonds, Series 2005C: | | | | | | | |
| | 5,000 | | 5.375%, 6/01/38 | 6/15 at 100.00 | | B+ | | | 3,860,700 | |
| | 4,465 | | 5.500%, 6/01/42 | 6/15 at 100.00 | | B+ | | | 3,440,416 | |
| | 5,400 | | 5.625%, 6/01/46 | 6/15 at 100.00 | | B+ | | | 4,172,202 | |
| | 4,500 | | Iowa Tobacco Settlement Authority, Tobacco Asset-Backed Revenue Bonds, Series 2005B, 5.600%, 6/01/34 | 6/17 at 100.00 | | B+ | | | 3,775,140 | |
| | 26,085 | | Total Iowa | | | | | | 21,722,269 | |
| | | | Kansas – 0.8% (0.5% of Total Investments) | | | | | | | |
| | 3,790 | | Kansas Department of Transportation, Highway Revenue Bonds, Series 2004A, 5.000%, 3/01/23 (Pre-refunded 3/01/14) | 3/14 at 100.00 | | AAA | | | 3,851,512 | |
| | 4,690 | | Wyandotte County-Kansas City Unified Government, Kansas, Sales Tax Special Obligation Capital Appreciation Revenue Bonds Redevelopment Project Area B – Major Multi-Sport Athletic Complex Project, Subordinate Lien Series 2010B, 0.000%, 6/01/21 | No Opt. Call | | BBB+ | | | 3,130,575 | |
| | 8,480 | | Total Kansas | | | | | | 6,982,087 | |
| | | | Louisiana – 0.5% (0.3% of Total Investments) | | | | | | | |
| | 235 | | East Baton Rouge Mortgage Finance Authority, Louisiana, GNMA/FNMA Mortgage-Backed Securities Program Single Family Mortgage Revenue Refunding Bonds, Series 1997B-1, 5.750%, 10/01/26 | 12/13 at 100.00 | | Aaa | | | 235,313 | |
| | 4,000 | | Lafayette City and Parish, Louisiana, Utilities Revenue Bonds, Series 2004, 5.250%, 11/01/25 (Pre-refunded 11/01/14) – NPFG Insured | 11/14 at 100.00 | | A+ (5) | | | 4,203,000 | |
| | 4,235 | | Total Louisiana | | | | | | 4,438,313 | |
| | | | Maine – 0.1% (0.1% of Total Investments) | | | | | | | |
| | 1,050 | | Maine Health and Higher Educational Facilities Authority, Revenue Bonds, MaineGeneral Medical Center, Series 2011, 6.750%, 7/01/41 | 7/21 at 100.00 | | BBB– | | | 1,108,265 | |
| | | | Maryland – 0.7% (0.4% of Total Investments) | | | | | | | |
| | 3,500 | | Maryland Health and Higher Educational Facilities Authority, Revenue Bonds, University of Maryland Medical System Issue, Series 2013A, 5.000%, 7/01/43 | 7/22 at 100.00 | | A2 | | | 3,470,320 | |
| | 2,550 | | Maryland Health and Higher Educational Facilities Authority, Revenue Bonds, Washington County Hospital, Series 2008, 6.000%, 1/01/28 | 1/18 at 100.00 | | BBB | | | 2,673,446 | |
| | 6,050 | | Total Maryland | | | | | | 6,143,766 | |
| | | | Massachusetts – 4.3% (2.6% of Total Investments) | | | | | | | |
| | 6,250 | | Massachusetts Department of Transportation, Metropolitan Highway System Revenue Bonds, Senior Lien Series 2010B, 5.000%, 1/01/37 | 1/20 at 100.00 | | A+ | | | 6,409,500 | |
| | 1,250 | | Massachusetts Development Finance Agency, Hospital Revenue Bonds, Cape Cod Healthcare Obligated Group, Series 2013, 5.250%, 11/15/41 | 11/23 at 100.00 | | A– | | | 1,266,025 | |
| NPP | Nuveen Performance Plus Municipal Fund, Inc. (continued) |
| | Portfolio of Investments October 31, 2013 |
| | Principal | | | Optional Call | | | | | | |
| | Amount (000) | | Description (1) | Provisions (2) | | Ratings (3) | | | Value | |
| | | | Massachusetts (continued) | | | | | | | |
| | | | Massachusetts Development Finance Authority, Revenue Bonds, 100 Cambridge Street Redevelopment, M/SRBC Project, Series 2002A: | | | | | | | |
| $ | 4,000 | | 5.125%, 8/01/28 – NPFG Insured | 12/13 at 100.00 | | A | | $ | 4,001,640 | |
| | 7,125 | | 5.125%, 2/01/34 – NPFG Insured | 12/13 at 100.00 | | A | | | 7,124,786 | |
| | 4,500 | | Massachusetts Health and Education Facilities Authority, Revenue Bonds, Partners HealthCare System, Series 2010J, 5.000%, 7/01/39 | 7/19 at 100.00 | | AA | | | 4,579,650 | |
| | 8,730 | | Massachusetts Health and Educational Facilities Authority, Revenue Bonds, Berkshire Health System, Series 2005F, 5.000%, 10/01/19 – AGC Insured | 10/15 at 100.00 | | AA– | | | 9,237,300 | |
| | 500 | | Massachusetts Health and Educational Facilities Authority, Revenue Bonds, CareGroup Inc., Series 2008E-1 &2, 5.125%, 7/01/38 | 7/18 at 100.00 | | A– | | | 504,505 | |
| | 4,560 | | Massachusetts School Building Authority, Dedicated Sales Tax Revenue Bonds, Senior Series 2013A, 5.000%, 5/15/43 | 5/23 at 100.00 | | AA+ | | | 4,807,517 | |
| | 36,915 | | Total Massachusetts | | | | | | 37,930,923 | |
| | | | Michigan – 3.3% (2.0% of Total Investments) | | | | | | | |
| | 1,060 | | Detroit Water and Sewerage Department, Michigan, Sewage Disposal System Revenue Bonds, Refunding Senior Lien Series 2012A, 5.250%, 7/01/39 | 7/22 at 100.00 | | BBB+ | | | 978,581 | |
| | 1,250 | | Detroit, Michigan, Distributable State Aid General Obligation Bonds, Limited Tax Series 2010, 4.500%, 11/01/23 | 11/20 at 100.00 | | AA | | | 1,223,700 | |
| | | | Detroit, Michigan, Second Lien Sewerage Disposal System Revenue Bonds, Series 2005A: | | | | | | | |
| | 5,565 | | 5.000%, 7/01/30 – NPFG Insured | 7/15 at 100.00 | | A | | | 5,177,286 | |
| | 5,000 | | 5.000%, 7/01/35 – NPFG Insured | 7/15 at 100.00 | | A | | | 4,515,450 | |
| | 3,305 | | Detroit, Michigan, Sewer Disposal System Revenue Bonds, Second Lien, Series 2006B, 5.000%, 7/01/33 – FGIC Insured | 7/16 at 100.00 | | A | | | 3,011,417 | |
| | 2,000 | | Detroit, Michigan, Water Supply System Second Lien Revenue Bonds, Series 2006A, 5.250%, 7/01/16 – NPFG Insured | No Opt. Call | | A | | | 2,009,520 | |
| | 1,000 | | Detroit, Michigan, Water Supply System Senior Lien Revenue Refunding Bonds, Series 2005C, 5.000%, 7/01/22 – FGIC Insured | 7/15 at 100.00 | | A | | | 977,260 | |
| | 2,000 | | Kalamazoo Hospital Finance Authority, Michigan, Hospital Revenue Refunding Bonds, Bronson Methodist Hospital, Series 2010, 5.250%, 5/15/36 – AGM Insured | 5/20 at 100.00 | | A2 | | | 2,035,920 | |
| | 6,250 | | Michigan State Building Authority, Revenue Bonds, Refunding Series 2006IA, 0.000%, 10/15/30 – FGIC Insured | 10/16 at 50.02 | | Aa3 | | | 2,570,188 | |
| | 3,050 | | Michigan Tobacco Settlement Finance Authority, Tobacco Settlement Asset-Backed Revenue Bonds, Series 2008A, 6.875%, 6/01/42 | 6/18 at 100.00 | | BB– | | | 2,760,647 | |
| | 2,500 | | Royal Oak Hospital Finance Authority, Michigan, Hospital Revenue and Refunding Bonds, William Beaumont Hospital Obligated Group, Series 2009W, 6.375%, 8/01/29 | 8/19 at 100.00 | | A1 | | | 2,775,700 | |
| | 1,150 | | Royal Oak Hospital Finance Authority, Michigan, Hospital Revenue Bonds, William Beaumont Hospital, Refunding Series 2009V, 8.250%, 9/01/39 | 9/18 at 100.00 | | A1 | | | 1,385,003 | |
| | 34,130 | | Total Michigan | | | | | | 29,420,672 | |
| | | | Minnesota – 2.4% (1.5% of Total Investments) | | | | | | | |
| | 5,000 | | Maple Grove, Minnesota, Health Care Facilities Revenue Bonds, Maple Grove Hospital Corporation, Series 2007, 5.250%, 5/01/37 | 5/17 at 100.00 | | Baa1 | | | 5,000,800 | |
| | 14,540 | | St. Paul Housing and Redevelopment Authority, Minnesota, Sales Tax Revenue Refunding Bonds, Civic Center Project, Series 1996, 7.100%, 11/01/23 – AGM Insured | 11/15 at 103.00 | | AA– | | | 16,468,004 | |
| | 19,540 | | Total Minnesota | | | | | | 21,468,804 | |
| | | | Mississippi – 1.4% (0.9% of Total Investments) | | | | | | | |
| | 9,750 | | Mississippi Business Finance Corporation, Pollution Control Revenue Refunding Bonds, System Energy Resources Inc. Project, Series 1998, 5.875%, 4/01/22 | 4/14 at 100.00 | | BBB | | | 9,749,220 | |
| | Principal | | | Optional Call | | | | | | |
| | Amount (000) | | Description (1) | Provisions (2) | | Ratings (3) | | | Value | |
| | | | Mississippi (continued) | | | | | | | |
| $ | 2,475 | | Mississippi Hospital Equipment and Facilities Authority, Revenue Bonds, Baptist Memorial Healthcare, Series 2004B-1, 5.000%, 9/01/24 (UB) | 9/14 at 100.00 | | AA– | | $ | 2,555,561 | |
| | 12,225 | | Total Mississippi | | | | | | 12,304,781 | |
| | | | Missouri – 2.7% (1.7% of Total Investments) | | | | | | | |
| | 2,585 | | Bi-State Development Agency of the Missouri-Illinois Metropolitan District, Mass Transit Sales Tax Appropriation Bonds, Refunding Combined Lien Series 2013A, 5.000%, 10/01/44 | 10/22 at 100.00 | | AA+ | | | 2,678,965 | |
| | 6,000 | | Missouri Joint Municipal Electric Utility Commission, Plum Point Project, Revenue Bonds, Series 2006, 5.000%, 1/01/34 – NPFG Insured | 1/16 at 100.00 | | A | | | 6,042,420 | |
| | 10,370 | | Missouri State Health and Educational Facilities Authority, Health Facilities Revenue Bonds, CoxHealth, Series 2013A, 5.000%, 11/15/48 | 11/23 at 100.00 | | A2 | | | 10,327,276 | |
| | 5,130 | | Saint Louis, Missouri, Parking Revenue Bonds, Series 2006A, 5.000%, 12/15/31 – NPFG Insured | 12/16 at 100.00 | | A | | | 5,158,574 | |
| | 24,085 | | Total Missouri | | | | | | 24,207,235 | |
| | | | Nevada – 3.7% (2.3% of Total Investments) | | | | | | | |
| | 24,195 | | Clark County, Nevada, Passenger Facility Charge Revenue Bonds, Las Vegas-McCarran International Airport, Series 2010A, 5.250%, 7/01/42 | 1/20 at 100.00 | | A+ | | | 24,768,663 | |
| | 5,130 | | Reno, Nevada, Health Facilities Revenue Bonds, Catholic Healthcare West, Series 2007A, 5.250%, 7/01/31 | 7/17 at 100.00 | | A | | | 5,222,802 | |
| | 2,500 | | Reno, Neveda, Health Facility Revenue Bonds, Catholic Healthcare West, Trust 2634, 18.714%, 7/01/31 – BHAC Insured (IF), (6) | 7/17 at 100.00 | | Aa1 | | | 2,777,500 | |
| | 31,825 | | Total Nevada | | | | | | 32,768,965 | |
| | | | New Hampshire – 0.6% (0.4% of Total Investments) | | | | | | | |
| | 5,000 | | New Hampshire Business Finance Authority, Revenue Bonds, Elliot Hospital Obligated Group Issue, Series 2009A, 6.125%, 10/01/39 | 10/19 at 100.00 | | Baa1 | | | 5,212,050 | |
| | | | New Jersey – 3.7% (2.3% of Total Investments) | | | | | | | |
| | 2,500 | | New Jersey Economic Development Authority, Revenue Bonds, Motor Vehicle Surcharge, Series 2004A, 5.250%, 7/01/33 – NPFG Insured | 7/14 at 100.00 | | A | | | 2,550,200 | |
| | 1,500 | | New Jersey Health Care Facilities Financing Authority, New Jersey, Revenue Bonds, Saint Peters University Hospital, Series 2007, 5.750%, 7/01/37 | 7/18 at 100.00 | | BB+ | | | 1,465,755 | |
| | 4,500 | | New Jersey Transportation Trust Fund Authority, Transportation System Bonds, Series 2001C, 5.500%, 12/15/18 – AGM Insured | No Opt. Call | | AA– | | | 5,389,470 | |
| | | | New Jersey Transportation Trust Fund Authority, Transportation System Bonds, Series 2006C: | | | | | | | |
| | 1,815 | | 0.000%, 12/15/26 – AMBAC Insured | No Opt. Call | | AA+ | | | 1,016,454 | |
| | 10,000 | | 0.000%, 12/15/30 – FGIC Insured | No Opt. Call | | A+ | | | 4,063,000 | |
| | 38,000 | | 0.000%, 12/15/33 – AGM Insured | No Opt. Call | | AA– | | | 12,752,420 | |
| | 2,000 | | Rutgers State University, New Jersey, Revenue Bonds, Refunding Series 2013L, 5.000%, 5/01/38 | 5/23 at 100.00 | | AA– | | | 2,127,500 | |
| | 5,000 | | Tobacco Settlement Financing Corporation, New Jersey, Tobacco Settlement Asset-Backed Bonds, Series 2007-1A, 4.750%, 6/01/34 | 6/17 at 100.00 | | B2 | | | 3,639,700 | |
| | 65,315 | | Total New Jersey | | | | | | 33,004,499 | |
| | | | New York – 5.9% (3.7% of Total Investments) | | | | | | | |
| | 5,500 | | Dormitory Authority of the State of New York, FHA-Insured Mortgage Revenue Bonds, Kaleida Health, Series 2004, 5.050%, 2/15/25 (Pre-refunded 2/15/14) | 2/14 at 100.00 | | AAA | | | 5,576,395 | |
| | 1,175 | | Dormitory Authority of the State of New York, Insured Revenue Bonds, 853 Schools Program, Gateway-Longview Inc., Series 1998A, 5.500%, 7/01/18 – AMBAC Insured | 1/14 at 100.00 | | N/R | | | 1,177,797 | |
| | 8,115 | | Hudson Yards Infrastructure Corporation, New York, Revenue Bonds, Senior Fiscal 2012 Series 2011A, 5.250%, 2/15/47 | 2/21 at 100.00 | | A | | | 8,328,911 | |
| NPP | Nuveen Performance Plus Municipal Fund, Inc. (continued) |
| | Portfolio of Investments October 31, 2013 |
| | Principal | | | Optional Call | | | | | | |
| | Amount (000) | | Description (1) | Provisions (2) | | Ratings (3) | | | Value | |
| | | | New York (continued) | | | | | | | |
| $ | 2,000 | | Hudson Yards Infrastructure Corporation, New York, Revenue Bonds, Series 2006A, 5.000%, 2/15/47 – FGIC Insured | 2/17 at 100.00 | | A | | $ | 2,004,760 | |
| | 13,600 | | Metropolitan Transportation Authority, New York, Transportation Revenue Bonds, Series 2006B, 4.500%, 11/15/32 – AGM Insured (UB) | 11/16 at 100.00 | | A2 | | | 13,657,256 | |
| | 11,560 | | New York City Municipal Water Finance Authority, New York, Water and Sewerage System Revenue Bonds, Fiscal Series 2005A, 5.000%, 6/15/39 | 6/14 at 100.00 | | AAA | | | 11,637,221 | |
| | 5,000 | | New York City Transitional Finance Authority, New York, Future Tax Secured Bonds, Subordinate Fiscal 2013 Series I, 5.000%, 5/01/38 | 5/23 at 100.00 | | AAA | | | 5,274,600 | |
| | 2,000 | | New York Liberty Development Corporation, Liberty Revenue Bonds, 4 World Trade Center Project, Series 2011, 5.750%, 11/15/51 | No Opt. Call | | A+ | | | 2,139,200 | |
| | 2,650 | | Port Authority of New York and New Jersey, Special Project Bonds, JFK International Air Terminal LLC Project, Eighth Series 2010, 6.000%, 12/01/42 | 12/20 at 100.00 | | BBB | | | 2,850,446 | |
| | 51,600 | | Total New York | | | | | | 52,646,586 | |
| | | | North Carolina – 2.5% (1.5% of Total Investments) | | | | | | | |
| | 5,550 | | Charlotte-Mecklenberg Hospital Authority, North Carolina, Health Care Revenue Bonds, DBA Carolinas HealthCare System, Series 2008A, 5.000%, 1/15/39 | 1/18 at 100.00 | | AA– | | | 5,583,023 | |
| | 4,900 | | Charlotte-Mecklenburg Hospital Authority, North Carolina, Healthcare System Revenue Bonds, DBA Carolinas Healthcare System, Series 2005A, 5.000%, 1/15/45 (Pre-refunded 1/15/15) | 1/15 at 100.00 | | AA+ (5) | | | 5,183,024 | |
| | 3,300 | | North Carolina Medical Care Commission, Health Care Facilities Revenue Refunding Bonds, WakeMed, Series 2012A, 5.000%, 10/01/31 | 10/22 at 100.00 | | AA– | | | 3,391,872 | |
| | 3,500 | | North Carolina Medical Care Commission, Healthcare Facilities Revenue Bonds, Duke University Health System, Series 2009A, 5.000%, 6/01/42 | 6/19 at 100.00 | | AA | | | 3,556,070 | |
| | 4,055 | | North Carolina Medical Care Commission, Healthcare Revenue Refunding Bonds, Novant Health Inc., Series 2006, 5.000%, 11/01/39 – NPFG Insured | 11/16 at 100.00 | | AA+ | | | 4,184,314 | |
| | 21,305 | | Total North Carolina | | | | | | 21,898,303 | |
| | | | North Dakota – 0.5% (0.3% of Total Investments) | | | | | | | |
| | 3,910 | | Fargo, North Dakota, Health System Revenue Bonds, Sanford Health, Refunding Series 2011, 6.250%, 11/01/31 | 11/21 at 100.00 | | A+ | | | 4,422,914 | |
| | | | Ohio – 6.9% (4.2% of Total Investments) | | | | | | | |
| | 10,000 | | American Municipal Power Ohio Inc., General Revenue Bonds, Prairie State Energy Campus Project Series 2008A, 5.250%, 2/15/43 | 2/18 at 100.00 | | A1 | | | 10,144,700 | |
| | | | Buckeye Tobacco Settlement Financing Authority, Ohio, Tobacco Settlement Asset-Backed Revenue Bonds, Senior Lien, Series 2007A-2: | | | | | | | |
| | 5,685 | | 5.125%, 6/01/24 | 6/17 at 100.00 | | B– | | | 4,858,970 | |
| | 5,640 | | 5.875%, 6/01/30 | 6/17 at 100.00 | | B | | | 4,593,836 | |
| | 4,875 | | 5.750%, 6/01/34 | 6/17 at 100.00 | | B | | | 3,817,125 | |
| | 4,290 | | 6.000%, 6/01/42 | 6/17 at 100.00 | | BB+ | | | 3,370,524 | |
| | 14,830 | | 5.875%, 6/01/47 | 6/17 at 100.00 | | B | | | 11,520,092 | |
| | 11,460 | | Buckeye Tobacco Settlement Financing Authority, Ohio, Tobacco Settlement Asset-Backed Revenue Bonds, Senior Lien, Series 2007A-3, 6.250%, 6/01/37 | 6/22 at 100.00 | | B | | | 9,398,231 | |
| | 2,305 | | Lucas County, Ohio, Hospital Revenue Bonds, ProMedica Healthcare Obligated Group, Series 2011A, 6.000%, 11/15/41 | 11/21 at 100.00 | | AA | | | 2,523,007 | |
| | 3,650 | | Montgomery County, Ohio, Revenue Bonds, Catholic Health Initiatives, Series 2004A, 5.000%, 5/01/30 | 5/14 at 100.00 | | A+ | | | 3,660,987 | |
| | 3,425 | | Ohio Municipal Electric Generation Agency, Beneficial Interest Certificates, Belleville Hydroelectric Project – Joint Venture 5, Series 2004, 5.000%, 2/15/19 – AMBAC Insured | 2/14 at 100.00 | | A1 | | | 3,467,813 | |
| | 3,685 | | Ohio Turnpike Commission, Turnpike Revenue Bonds, Infrastructure Project, Junior Lien Series 2013A-1, 5.000%, 2/15/48 | 2/23 at 100.00 | | A+ | | | 3,718,718 | |
| | 69,845 | | Total Ohio | | | | | | 61,074,003 | |
| | Principal | | | Optional Call | | | | | | |
| | Amount (000) | | Description (1) | Provisions (2) | | Ratings (3) | | | Value | |
| | | | Pennsylvania – 4.2% (2.6% of Total Investments) | | | | | | | |
| $ | 1,250 | | Allegheny County Hospital Development Authority, Pennsylvania, University of Pittsburgh Medical Center Revenue Bonds, Series 2009A, 5.500%, 8/15/34 | 8/19 at 100.00 | | Aa3 | | $ | 1,343,888 | |
| | | | Bethlehem Authority, Northampton and Lehigh Counties, Pennsylvania, Guaranteed Water Revenue Bonds, Series 1998: | | | | | | | |
| | 3,125 | | 0.000%, 5/15/22 – AGM Insured | No Opt. Call | | AA– | | | 2,410,344 | |
| | 3,125 | | 0.000%, 5/15/23 – AGM Insured | No Opt. Call | | AA– | | | 2,294,875 | |
| | 3,135 | | 0.000%, 5/15/24 – AGM Insured | No Opt. Call | | AA– | | | 2,188,512 | |
| | 3,155 | | 0.000%, 5/15/26 – AGM Insured | No Opt. Call | | AA– | | | 1,979,573 | |
| | 4,145 | | 0.000%, 11/15/26 – AGM Insured | No Opt. Call | | AA– | | | 2,542,958 | |
| | 2,800 | | 0.000%, 5/15/28 – AGM Insured | No Opt. Call | | AA– | | | 1,574,300 | |
| | 3,000 | | 0.000%, 11/15/28 – AGM Insured | No Opt. Call | | AA– | | | 1,653,660 | |
| | 700 | | Northampton County Industrial Development Authority, Pennsylvania, Recovery Revenue Bonds, Northampton Generating Project, Senior Lien Series 2013A0 & AE2, 5.000%, 12/01/23 | 12/13 at 100.00 | | N/R | | | 588,508 | |
| | 9 | | Northampton County Industrial Development Authority, Pennsylvania, Recovery Revenue Bonds, Northampton Generating Project, Senior Lien Taxable Series 2013B, 5.000%, 12/31/23 (Alternative Minimum Tax) | 12/13 at 100.00 | | N/R | | | 7,601 | |
| | 2,000 | | Pennsylvania Turnpike Commission, Motor License Fund-Enhanced Turnpike Subordinate Special Revenue, Series 2011B, 5.000%, 12/01/41 | 12/21 at 100.00 | | AA | | | 2,045,280 | |
| | 1,570 | | Pennsylvania Turnpike Commission, Turnpike Revenue Bonds, Capital Appreciation Series 2009E, 0.000%, 12/01/38 | 12/27 at 100.00 | | A– | | | 1,381,459 | |
| | 5,100 | | Pennsylvania Turnpike Commission, Turnpike Revenue Bonds, Subordinate Series 2009C, 0.000%, 6/01/33 – AGM Insured | 6/26 at 100.00 | | AA | | | 4,973,928 | |
| | 11,890 | | Philadelphia Hospitals and Higher Education Facilities Authority, Pennsylvania, Health System Revenue Bonds, Jefferson Health System, Series 2010B, 5.000%, 5/15/40 | 5/20 at 100.00 | | AA | | | 11,942,435 | |
| | 45,004 | | Total Pennsylvania | | | | | | 36,927,321 | |
| | | | Puerto Rico – 5.9% (3.7% of Total Investments) | | | | | | | |
| | 625 | | Puerto Rico Electric Power Authority, Power Revenue Bonds, Series 2005SS, 5.000%, 7/01/25 – NPFG Insured | 7/15 at 100.00 | | A | | | 531,281 | |
| | 1,000 | | Puerto Rico Electric Power Authority, Power Revenue Bonds, Series 2007TT, 5.000%, 7/01/20 | 7/17 at 100.00 | | BBB | | | 805,600 | |
| | 1,850 | | Puerto Rico Electric Power Authority, Power Revenue Bonds, Series WW, 5.000%, 7/01/28 | 7/18 at 100.00 | | BBB | | | 1,358,881 | |
| | 1,305 | | Puerto Rico Highway and Transportation Authority, Highway Revenue Bonds, Series 2005L, 5.250%, 7/01/23 – NPFG Insured | No Opt. Call | | A | | | 1,139,722 | |
| | 1,000 | | Puerto Rico Highway and Transportation Authority, Highway Revenue Bonds, Series 2007N, 5.250%, 7/01/31 – AMBAC Insured | No Opt. Call | | BBB | | | 747,470 | |
| | 2,500 | | Puerto Rico Municipal Finance Agency, Series 2005A, 5.250%, 8/01/24 | 8/15 at 100.00 | | BBB– | | | 1,913,275 | |
| | 1,060 | | Puerto Rico Public Buildings Authority, Guaranteed Government Facilities Revenue Bonds, Series 2007M, 5.750%, 7/01/17 | No Opt. Call | | BBB– | | | 954,583 | |
| | 11,975 | | Puerto Rico Sales Tax Financing Corporation, Sales Tax Revenue Bonds, First Subordinate Series 2009A, 5.000%, 8/01/24 | 8/19 at 100.00 | | A+ | | | 10,599,671 | |
| | 13,125 | | Puerto Rico Sales Tax Financing Corporation, Sales Tax Revenue Bonds, First Subordinate Series 2010A, 0.000%, 8/01/33 | 8/29 at 100.00 | | A+ | | | 7,337,006 | |
| | 8,625 | | Puerto Rico Sales Tax Financing Corporation, Sales Tax Revenue Bonds, First Subordinate Series 2010C, 5.250%, 8/01/41 | 8/20 at 100.00 | | A+ | | | 6,761,224 | |
| | | | Puerto Rico Sales Tax Financing Corporation, Sales Tax Revenue Bonds, Series 2007A: | | | | | | | |
| | 25,000 | | 0.000%, 8/01/47 – AMBAC Insured | No Opt. Call | | AA– | | | 2,766,500 | |
| | 64,335 | | 0.000%, 8/01/54 – AMBAC Insured | No Opt. Call | | AA– | | | 4,691,308 | |
| | 15,000 | | 5.250%, 8/01/57 | 8/17 at 100.00 | | AA– | | | 12,938,550 | |
| | 147,400 | | Total Puerto Rico | | | | | | 52,545,071 | |
| | | | Rhode Island – 0.2% (0.1% of Total Investments) | | | | | | | |
| | 1,805 | | Rhode Island Tobacco Settlement Financing Corporation, Tobacco Settlement Asset-Backed Bonds, Series 2002A, 6.125%, 6/01/32 | 1/14 at 100.00 | | BBB+ | | | 1,790,073 | |
| NPP | Nuveen Performance Plus Municipal Fund, Inc. (continued) |
| | Portfolio of Investments October 31, 2013 |
| | Principal | | | Optional Call | | | | | | |
| | Amount (000) | | Description (1) | Provisions (2) | | Ratings (3) | | | Value | |
| | | | South Carolina – 3.1% (1.9% of Total Investments) | | | | | | | |
| $ | 2,725 | | Medical University Hospital Authority, South Carolina, FHA-Insured Mortgage Revenue Bonds, Series 2004A, 5.250%, 2/15/25 (Pre-refunded 8/15/14) – NPFG Insured | 8/14 at 100.00 | | A (5) | | $ | 2,831,875 | |
| | 1,345 | | Myrtle Beach, South Carolina, Hospitality and Accommodation Fee Revenue Bonds, Series 2004A, 5.375%, 6/01/20 – FGIC Insured | 6/14 at 100.00 | | A+ | | | 1,382,996 | |
| | | | Piedmont Municipal Power Agency, South Carolina, Electric Revenue Bonds, Series 2004A-2: | | | | | | | |
| | 26,955 | | 0.000%, 1/01/31 – AMBAC Insured | No Opt. Call | | A– | | | 11,780,952 | |
| | 15,420 | | 0.000%, 1/01/32 – AMBAC Insured | No Opt. Call | | A– | | | 6,365,530 | |
| | 4,800 | | South Carolina Transportation Infrastructure Bank, Revenue Bonds, Series 2010A, 5.250%, 10/01/40 | 10/19 at 100.00 | | A1 | | | 5,072,016 | |
| | 51,245 | | Total South Carolina | | | | | | 27,433,369 | |
| | | | Tennessee – 1.4% (0.9% of Total Investments) | | | | | | | |
| | 2,260 | | Chattanooga Health, Educational and Housing Facility Board, Tennessee, Hospital Revenue Bonds, Catholic Health Initiatives, Series 2013A, 5.250%, 1/01/45 (WI/DD, Settling 11/14/13) | 1/23 at 100.00 | | A+ | | | 2,260,633 | |
| | 3,240 | | Chattanooga-Hamilton County Hospital Authority, Tennessee, Hospital Revenue Bonds, Erlanger Health System, Refunding Series 2004, 5.000%, 10/01/22 – AGM Insured | 10/19 at 100.00 | | AA– | | | 3,542,422 | |
| | 380 | | Johnson City Health and Educational Facilities Board, Tennessee, Hospital Revenue Refunding and Improvement Bonds, Johnson City Medical Center, Series 1998C, 5.125%, 7/01/25 (Pre-refunded 7/01/23) – NPFG Insured | 7/23 at 100.00 | | A (5) | | | 381,452 | |
| | 6,000 | | Metropolitan Government of Nashville-Davidson County Health and Educational Facilities Board, Tennessee, Revenue Refunding and Improvement Bonds, Meharry Medical College, Series 1996, 6.000%, 12/01/19 – AMBAC Insured | 12/17 at 100.00 | | N/R | | | 6,427,920 | |
| | 11,880 | | Total Tennessee | | | | | | 12,612,427 | |
| | | | Texas – 15.1% (9.3% of Total Investments) | | | | | | | |
| | 5,000 | | Bexar Metropolitan Water District, Texas, Waterworks System Revenue Bonds, Series 2006, 5.000%, 5/01/35 – NPFG Insured | 5/16 at 100.00 | | A1 | | | 5,109,700 | |
| | 2,500 | | Capital Area Cultural Education Facilities Finance Corporation, Texas, Revenue Bonds, The Roman Catholic Diocese of Austin, Series 2005B. Remarketed, 6.125%, 4/01/45 | 4/20 at 100.00 | | Baa1 | | | 2,651,225 | |
| | | | Central Texas Regional Mobility Authority, Revenue Bonds, Senior Lien Series 2005: | | | | | | | |
| | 4,000 | | 5.000%, 1/01/35 (Pre-refunded 1/01/15) – FGIC Insured | 1/15 at 100.00 | | A (5) | | | 4,221,440 | |
| | 13,000 | | 5.000%, 1/01/45 (Pre-refunded 1/01/15) – FGIC Insured | 1/15 at 100.00 | | A (5) | | | 13,719,680 | |
| | 1,000 | | Central Texas Regional Mobility Authority, Revenue Bonds, Senior Lien Series 2011, 6.000%, 1/01/41 | 1/21 at 100.00 | | Baa2 | | | 1,024,440 | |
| | 3,000 | | Conroe Independent School District, Montgomery County, Texas, General Obligation Bonds, Schoolhouse Series 2005C, 5.000%, 2/15/30 (Pre-refunded 2/15/15) | 2/15 at 100.00 | | AAA | | | 3,184,770 | |
| | 3,000 | | Dallas-Fort Worth International Airport, Texas, Joint Revenue Bonds, Refunding Series 2012E, 5.000%, 11/01/42 (Alternative Minimum Tax) | No Opt. Call | | A+ | | | 2,846,190 | |
| | | | Grand Parkway Transportation Corporation, Texas, System Toll Revenue Bonds, Subordinate Lien Series 2013B: | | | | | | | |
| | 3,240 | | 5.000%, 4/01/53 | 10/23 at 100.00 | | AA+ | | | 3,217,774 | |
| | 15,000 | | 5.000%, 4/01/53 (UB) | 10/23 at 100.00 | | AA+ | | | 14,897,100 | |
| | 9,000 | | Harris County Hospital District, Texas, Revenue Bonds, Series 2007A, 5.250%, 2/15/42 – NPFG Insured | 2/17 at 100.00 | | AA+ | | | 9,444,780 | |
| | 2,980 | | Harris County-Houston Sports Authority, Texas, Junior Lien Revenue Refunding Bonds, Series 2001B, 5.250%, 11/15/40 – NPFG Insured | 11/13 at 100.00 | | A | | | 2,979,791 | |
| | 3,885 | | Houston Independent School District, Public Facility Corporation, Harris County, Texas, Lease Revenue Bonds, Cesar E. Chavez High School, Series 1998A, 0.000%, 9/15/19 – AMBAC Insured | No Opt. Call | | AA | | | 3,381,387 | |
| | 1,495 | | Houston, Texas, Hotel Occupancy Tax and Special Revenue Bonds, Convention and Entertainment Project, Series 2001B, 0.000%, 9/01/23 – AGM Insured | No Opt. Call | | AA– | | | 982,948 | |
| | 1,600 | | Houston, Texas, Senior Lien Airport System Revenue Bonds, Refunding Series 2009A, 5.500%, 7/01/39 | 7/18 at 100.00 | | AA– | | | 1,758,656 | |
| | 1,275 | | Kerrville Health Facilities Development Corporation, Texas, Revenue Bonds, Sid Peterson Memorial Hospital Project, Series 2005, 5.375%, 8/15/35 | 2/16 at 100.00 | | BBB– | | | 1,277,066 | |
| | Principal | | | Optional Call | | | | | | |
| | Amount (000) | | Description (1) | Provisions (2) | | Ratings (3) | | | Value | |
| | | | Texas (continued) | | | | | | | |
| $ | 33,855 | | Leander Independent School District, Williamson and Travis Counties, Texas, General Obligation Bonds, Series 2006, 0.000%, 8/15/40 | 8/14 at 23.67 | | AAA | | $ | 7,687,793 | |
| | | | Leander Independent School District, Williamson and Travis Counties, Texas, General Obligation Bonds, Series 2008: | | | | | | | |
| | 5,000 | | 0.000%, 8/15/39 | 8/17 at 27.35 | | AAA | | | 1,195,650 | |
| | 19,300 | | 0.000%, 8/15/41 | 8/17 at 24.20 | | AAA | | | 4,096,811 | |
| | 2,000 | | Love Field Airport Modernization Corporation, Texas, Special Facilities Revenue Bonds, Southwest Airlines Company – Love Field Modernization Program Project, Series 2012, 5.000%, 11/01/28 (Alternative Minimum Tax) | 11/22 at 100.00 | | BBB– | | | 1,975,080 | |
| | 7,630 | | Northwest Independent School District, Denton County, Texas, General Obligation Bonds, Series 2007, 5.000%, 2/15/32 | No Opt. Call | | Aaa | | | 8,170,967 | |
| | 2,890 | | Tarrant County Cultural Education Facilities Finance Corporation, Texas, Hospital Revenue Bonds, Scott & White Healthcare Project, Series 2010, 5.500%, 8/15/45 | 8/20 at 100.00 | | AA– | | | 2,984,676 | |
| | 5,750 | | Tarrant County Cultural Education Facilities Finance Corporation, Texas, Revenue Bonds, Texas Health Resources, Series 2007B, 5.000%, 11/15/47 | 11/17 at 100.00 | | AA– | | | 5,726,828 | |
| | 3,500 | | Texas A&M University, Permanent University Fund Bonds, Series 2006, 5.000%, 7/01/36 | No Opt. Call | | AAA | | | 3,738,770 | |
| | | | Texas Municipal Gas Acquisition and Supply Corporation III, Gas Supply Revenue Bonds, Series 2012: | | | | | | | |
| | 14,815 | | 5.000%, 12/15/27 | No Opt. Call | | A3 | | | 14,897,668 | |
| | 3,250 | | 5.000%, 12/15/30 | No Opt. Call | | A3 | | | 3,191,240 | |
| | 4,905 | | Texas Transportation Commission, Central Texas Turnpike System Revenue Bonds, First Tier Refunding Series 2012A, 5.000%, 8/15/41 | 8/22 at 100.00 | | A– | | | 4,889,991 | |
| | 4,000 | | Texas Turnpike Authority, Central Texas Turnpike System Revenue Bonds, First Tier Series 2002A, 0.000%, 8/15/25 – AMBAC Insured | No Opt. Call | | A– | | | 2,283,160 | |
| | 2,710 | | Wood County Central Hospital District, Texas, Revenue Bonds, East Texas Medical Center Quitman Project, Series 2011, 6.000%, 11/01/41 | 11/21 at 100.00 | | Baa2 | | | 2,833,305 | |
| | 179,580 | | Total Texas | | | | | | 134,368,886 | |
| | | | Utah – 0.6% (0.4% of Total Investments) | | | | | | | |
| | 3,000 | | Riverton, Utah, Hospital Revenue Bonds, IHC Health Services, Inc., Series 2009, 5.000%, 8/15/41 | 8/19 at 100.00 | | AA+ | | | 3,044,940 | |
| | 955 | | Utah Housing Corporation, Single Family Mortgage Bonds, Series 2002A-1, 5.300%, 7/01/18 (Alternative Minimum Tax) | 12/13 at 100.00 | | AA– | | | 957,015 | |
| | 125 | | Utah Housing Finance Agency, Single Family Mortgage Bonds, Series 2000D-1, 6.050%, 7/01/14 (Alternative Minimum Tax) | 12/13 at 100.00 | | AA– | | | 126,945 | |
| | 415 | | Utah Housing Finance Agency, Single Family Mortgage Bonds, Series 2000E-1, Class II, 6.150%, 1/01/27 (Alternative Minimum Tax) | 1/14 at 100.00 | | AAA | | | 415,515 | |
| | 200 | | Utah Housing Finance Agency, Single Family Mortgage Bonds, Series 2000E-1, Class III, 6.000%, 1/01/15 (Alternative Minimum Tax) | 1/14 at 100.00 | | AA– | | | 203,064 | |
| | 235 | | Utah Housing Finance Agency, Single Family Mortgage Bonds, Series 2001A-2, 5.650%, 7/01/27 (Alternative Minimum Tax) | 1/14 at 100.00 | | AA | | | 235,216 | |
| | 260 | | Utah Housing Finance Agency, Single Family Mortgage Bonds, Series 2001B-1, 5.750%, 7/01/19 (Alternative Minimum Tax) | 1/14 at 100.00 | | Aaa | | | 260,593 | |
| | 5,190 | | Total Utah | | | | | | 5,243,288 | |
| | | | Virgin Islands – 0.6% (0.4% of Total Investments) | | | | | | | |
| | 5,300 | | Virgin Islands Public Finance Authority, Gross Receipts Taxes Loan Note, Series 2003, 5.000%, 10/01/33 – RAAI Insured | 10/14 at 100.00 | | BBB+ | | | 5,214,458 | |
| | | | Virginia – 4.0% (2.5% of Total Investments) | | | | | | | |
| | 900 | | Henrico County Economic Development Authority, Virginia, Revenue Bonds, Bon Secours Health System Obligated Group, Series 2013, 5.000%, 11/01/30 | No Opt. Call | | A– | | | 927,963 | |
| | 10,500 | | Metropolitan Washington Airports Authority, Virginia, Dulles Toll Road Revenue Bonds, Series 2009C, 0.000%, 10/01/41 – AGC Insured | 10/26 at 100.00 | | AA– | | | 9,881,550 | |
| NPP | Nuveen Performance Plus Municipal Fund, Inc. (continued) |
| | Portfolio of Investments October 31, 2013 |
| | Principal | | | Optional Call | | | | | | |
| | Amount (000) | | Description (1) | Provisions (2) | | Ratings (3) | | | Value | |
| | | | Virginia (continued) | | | | | | | |
| $ | 18,000 | | Metropolitan Washington Airports Authority, Virginia, Dulles Toll Road Revenue Bonds, Dulles Metrorail Capital Appreciation, Series 2010B, 0.000%, 10/01/44 | 10/28 at 100.00 | | BBB+ | | $ | 13,702,860 | |
| | | | Route 460 Funding Corporation, Virginia, Toll Road Revenue Bonds, Series 2012A: | | | | | | | |
| | 3,000 | | 5.125%, 7/01/49 | No Opt. Call | | BBB– | | | 2,824,770 | |
| | 4,150 | | 5.000%, 7/01/52 | No Opt. Call | | BBB– | | | 3,787,954 | |
| | 4,030 | | Virginia Small Business Financing Authority, Senior Lien Revenue Bonds, Elizabeth River Crossing, Opco LLC Project, Series 2012, 5.500%, 1/01/42 (Alternative Minimum Tax) | 7/22 at 100.00 | | BBB– | | | 4,032,418 | |
| | 40,580 | | Total Virginia | | | | | | 35,157,515 | |
| | | | Washington – 3.5% (2.2% of Total Investments) | | | | | | | |
| | 12,235 | | Chelan County Public Utility District 1, Washington, Columbia River-Rock Island Hydro-Electric System Revenue Refunding Bonds, Series 1997A, 0.000%, 6/01/26 – NPFG Insured | No Opt. Call | | AA+ | | | 7,410,250 | |
| | | | Cowlitz County Public Utilities District 1, Washington, Electric Production Revenue Bonds, Series 2004: | | | | | | | |
| | 465 | | 5.000%, 9/01/22 – FGIC Insured | 9/14 at 100.00 | | A1 | | | 482,593 | |
| | 3,100 | | 5.000%, 9/01/28 – FGIC Insured | 9/14 at 100.00 | | A1 | | | 3,180,442 | |
| | 4,000 | | Washington Health Care Facilities Authority, Revenue Bonds, Providence Health & Services, Series 2012A, 5.000%, 10/01/32 | 10/22 at 100.00 | | AA | | | 4,116,517 | |
| | 2,000 | | Washington State Health Care Facilities Authority, Revenue Bonds, Fred Hutchinson Cancer Research Center, Series 2009A, 6.000%, 1/01/33 | 7/19 at 100.00 | | A | | | 2,089,957 | |
| | 10,000 | | Washington State Health Care Facilities Authority, Revenue Bonds, Providence Health Care Services, Series 2006A, 4.625%, 10/01/34 – FGIC Insured (UB), (6) | 10/16 at 100.00 | | AA | | | 9,731,600 | |
| | 4,065 | | Washington State, General Obligation Motor Vehicle Fuel Tax Bonds, Series 2008D, 5.000%, 1/01/33 | No Opt. Call | | AA+ | | | 4,388,816 | |
| | 35,865 | | Total Washington | | | | | | 31,400,175 | |
| | | | Wisconsin – 1.5% (0.9% of Total Investments) | | | | | | | |
| | 2,500 | | Wisconsin Health and Educational Facilities Authority, Revenue Bonds, Aurora Health Care, Inc., Series 2013A, 5.125%, 4/15/31 | 4/23 at 100.00 | | A | | | 2,512,950 | |
| | 1,780 | | Wisconsin Health and Educational Facilities Authority, Revenue Bonds, Marshfield Clinic, Series 2012B, 5.000%, 2/15/40 | 2/22 at 100.00 | | A– | | | 1,758,053 | |
| | 3,000 | | Wisconsin Health and Educational Facilities Authority, Revenue Bonds, Wheaton Franciscan Healthcare System, Series 2006A, 5.250%, 8/15/23 | 8/16 at 100.00 | | A– | | | 3,122,460 | |
| | 5,000 | | Wisconsin State, General Fund Annual Appropriation Revenue Bonds, Refunding Series 2009A, 6.250%, 5/01/37 | 5/19 at 100.00 | | AA– | | | 5,569,700 | |
| | 12,280 | | Total Wisconsin | | | | | | 12,963,163 | |
| $ | 1,824,964 | | Total Municipal Bonds (cost $1,389,841,125) | | | | | | 1,438,320,888 | |
| | Principal | | | | | | | | | | |
| | Amount (000) | | Description (1) | Coupon | Maturity | | Ratings (3) | | | Value | |
| | | | Corporate Bonds – 0.0% (0.0% of Total Investments) | | | | | | | | |
| | | | Transportation – 0.0% (0.0% of Total Investments) | | | | | | | | |
| $ | 207 | | Las Vegas Monorail Company, Senior Interest Bonds (7), (8) | 5.500% | 7/15/19 | | N/R | | $ | 37,184 | |
| | 59 | | Las Vegas Monorail Company, Senior Interest Bonds (7), (8) | 3.000% | 7/15/55 | | N/R | | | 7,868 | |
| $ | 266 | | Total Corporate Bonds (cost $10,506) | | | | | | | 45,052 | |
| | | | Total Long-Term Investments – (cost $1,389,851,631) | | | | | | | 1,438,365,940 | |
| | | | Floating Rate Obligations – (4.0)% | | | | | | | (35,925,000 | ) |
| | | | Variable Rate MuniFund Term Preferred Shares, at Liquidation Value – (60.2)% (9) | | | | | | | (535,000,000 | ) |
| | | | Other Assets Less Liabilities – 2.4% | | | | | | | 21,277,389 | |
| | | | Net Assets Applicable to Common Shares – 100% | | | | | | $ | 888,718,329 | |
| (1) | All percentages shown in the Portfolio of Investments are based on net assets applicable to Common shares unless otherwise noted. |
| (2) | Optional Call Provisions (not covered by the report of independent registered public accounting firm): Dates (month and year) and prices of the earliest optional call or redemption. There may be other call provisions at varying prices at later dates. Certain mortgage-backed securities may be subject to periodic principal paydowns. |
| (3) | Ratings (not covered by the report of independent registered public accounting firm): Using the highest of Standard & Poor’s Group (“Standard & Poor’s”), Moody’s Investors Service, Inc. (“Moody’s”) or Fitch, Inc. (“Fitch”) rating. Ratings below BBB by Standard & Poor’s, Baa by Moody’s or BBB by Fitch are considered to be below investment grade. Holdings designated N/R are not rated by any of these national rating agencies. |
| (4) | At or subsequent to the end of the reporting period, this security is non-income producing. Non-income producing security, in the case of a fixed-income security, generally denotes that the issuer has (1) defaulted on the payment of principal or interest, (2) is under the protection of the Federal Bankruptcy Court or (3) the Fund’s Adviser has concluded that the issue is not likely to meet its future interest payment obligations and has directed the Fund’s custodian to cease accruing additional income on the Fund’s records. |
| (5) | Backed by an escrow or trust containing sufficient U.S. Government or U.S. Government agency securities, which ensure the timely payment of principal and interest. Certain bonds backed by U.S. Government or agency securities are regarded as having an implied rating equal to the rating of such securities. |
| (6) | Investment, or portion of investment, has been pledged to collateralize the net payment obligations for investments in inverse floating rate transactions. |
| (7) | Investment valued at fair value using methods determined in good faith by, or at the discretion of, the Board of Directors. For fair value measurement disclosure purposes, investment categorized as Level 3. See Notes to Financial Statements, Note 2 – Investment Valuation and Fair Value Measurements for more information. |
| (8) | During January 2010, Las Vegas Monorail Company (“Las Vegas Monorail”) filed for federal bankruptcy protection. During March 2012, Las Vegas Monorail emerged from federal bankruptcy with the acceptance of a reorganization plan assigned by the Federal Bankruptcy Court. Under the reorganization plan, the Fund surrendered its Las Vegas Monorail Project Revenue Bonds, First Tier, Series 2000 and in turn received two senior interest corporate bonds: the first with an annual coupon rate of 5.500% maturing on July 15, 2019 and the second with an annual coupon rate of 3.000% (5.500% after December 31, 2015) maturing on July 15, 2055. The Fund’s custodian is not accruing income on the Fund’s records for either senior interest corporate bond. |
| (9) | Variable Rate MuniFund Term Preferred Shares, at Liquidation Value as a percentage of Total Investments is 37.2%. |
| WI/DD | Purchased on a when-issued or delayed delivery basis. |
| (ETM) | Escrowed to maturity. |
| (IF) | Inverse floating rate investment. |
| (UB) | Underlying bond of an inverse floating rate trust reflected as a financing transaction. See Notes to Financial Statements, Note 3 – Portfolio Securities and Investments in Derivatives, Inverse Floating Rate Securities for more information. |
See accompanying notes to financial statements.
| NMA | |
| | Nuveen Municipal Advantage Fund, Inc. |
| | Portfolio of Investments |
| | October 31, 2013 |
| | Principal | | | Optional Call | | | | | | |
| | Amount (000) | | Description (1) | Provisions (2) | | Ratings (3) | | | Value | |
| | | | LONG-TERM INVESTMENTS – 151.2% (100.0% of Total Investments) | | | | | | | |
| | | | MUNICIPAL BONDS – 151.2% (100.0% of Total Investments) | | | | | | | |
| | | | Alaska – 1.6% (1.1% of Total Investments) | | | | | | | |
| | | | Alaska Housing Finance Corporation, General Housing Purpose Bonds, Series 2005A: | | | | | | | |
| $ | 1,125 | | 5.250%, 12/01/34 – FGIC Insured (UB) | 12/14 at 100.00 | | AA+ | | $ | 1,164,150 | |
| | 1,280 | | 5.250%, 12/01/41 – FGIC Insured (UB) | 12/14 at 100.00 | | AA+ | | | 1,323,430 | |
| | 1,690 | | Alaska Railroad Corporation, Capital Grant Receipts Bonds, Section 5307 and 5309 Formula Funds, Series 2006, 5.000%, 8/01/17 – FGIC Insured | 8/16 at 100.00 | | A+ | | | 1,860,082 | |
| | 2,495 | | CivicVentures, Alaska, Anchorage Convention Center Revenue Bonds, Series 2006, 5.000%, 9/01/34 – NPFG Insured | 9/15 at 100.00 | | A1 | | | 2,594,750 | |
| | | | Northern Tobacco Securitization Corporation, Alaska, Tobacco Settlement Asset-Backed Bonds, Series 2006A: | | | | | | | |
| | 705 | | 4.625%, 6/01/23 | 6/14 at 100.00 | | Ba1 | | | 665,012 | |
| | 3,595 | | 5.000%, 6/01/46 | 6/14 at 100.00 | | B2 | | | 2,489,106 | |
| | 10,890 | | Total Alaska | | | | | | 10,096,530 | |
| | | | Arizona – 3.6% (2.4% of Total Investments) | | | | | | | |
| | 3,465 | | Arizona Board of Regents, Certificates of Participation, Arizona State University, Refunding Series 2006, 5.000%, 7/01/25 – NPFG Insured | 7/17 at 100.00 | | AA– | | | 3,777,370 | |
| | 4,905 | | Maricopa County Industrial Development Authority, Arizona, Health Facility Revenue Bonds, Catholic Healthcare West, Series 2007A, 5.250%, 7/01/32 | 7/17 at 100.00 | | A | | | 4,965,724 | |
| | 10,700 | | Phoenix Civic Improvement Corporation, Arizona, Senior Lien Airport Revenue Bonds, Series 2008A, 5.000%, 7/01/38 | 7/18 at 100.00 | | AA– | | | 11,020,358 | |
| | 2,500 | | Phoenix Civic Improvement Corporation, Arizona, Subordinate Excise Tax Revenue Bonds, Civic Plaza Expansion Project, Series 2005A, 5.000%, 7/01/35 – FGIC Insured | No Opt. Call | | AA | | | 2,571,175 | |
| | 21,570 | | Total Arizona | | | | | | 22,334,627 | |
| | | | California – 24.3% (16.1% of Total Investments) | | | | | | | |
| | 2,000 | | ABC Unified School District, Los Angeles County, California, General Obligation Bonds, Series 2000B, 0.000%, 8/01/23 – FGIC Insured | No Opt. Call | | Aa3 | | | 1,352,540 | |
| | 3,500 | | Alameda Corridor Transportation Authority, California, Revenue Bonds, Refunding Subordinate Lien Series 2004A, 5.450%, 10/01/25 – AMBAC Insured | 10/17 at 100.00 | | BBB+ | | | 3,737,755 | |
| | 4,225 | | Alameda Unified School District, Alameda County, California, General Obligation Bonds, Series 2005B, 0.000%, 8/01/28 – AGM Insured | No Opt. Call | | Aa2 | | | 2,092,812 | |
| | | | Calexico Unified School District, Imperial County, California, General Obligation Bonds, Series 2005B: | | | | | | | |
| | 4,070 | | 0.000%, 8/01/32 – FGIC Insured | No Opt. Call | | A | | | 1,202,034 | |
| | 6,410 | | 0.000%, 8/01/34 – FGIC Insured | No Opt. Call | | A | | | 1,622,243 | |
| | 625 | | California County Tobacco Securitization Agency, Tobacco Settlement Asset-Backed Bonds, Merced County Tobacco Funding Corporation, Series 2005A, 5.000%, 6/01/26 | 6/15 at 100.00 | | BBB | | | 580,219 | |
| | 3,840 | | California Health Facilities Financing Authority, Revenue Bonds, Saint Joseph Health System, Series 2013A, 5.000%, 7/01/33 | 7/23 at 100.00 | | AA– | | | 3,964,608 | |
| | 7,500 | | California State Public Works Board, Lease Revenue Bonds, Department of Mental Health, Coalinga State Hospital, Series 2004A, 5.125%, 6/01/29 (Pre-refunded 6/01/14) | 6/14 at 100.00 | | AAA | | | 7,718,250 | |
| | 5,715 | | California State, General Obligation Bonds, Series 2003, 5.250%, 2/01/28 (Pre-refunded 12/05/13) | 12/13 at 100.00 | | A1 (4) | | | 5,737,117 | |
| | 2,500 | | California State, General Obligation Bonds, Series 2004, 5.000%, 3/01/34 – AMBAC Insured | 9/14 at 100.00 | | AA+ | | | 2,558,275 | |
| | 16,000 | | California State, General Obligation Bonds, Various Purpose Series 2007, 5.000%, 6/01/37 | 6/17 at 100.00 | | A1 | | | 16,448,000 | |
| | 4,250 | | California State, General Obligation Bonds, Various Purpose Series 2010, 5.250%, 11/01/40 | 11/20 at 100.00 | | A1 | | | 4,442,185 | |
| | Principal | | | Optional Call | | | | | | |
| | Amount (000) | | Description (1) | Provisions (2) | | Ratings (3) | | | Value | |
| | | | California (continued) | | | | | | | |
| $ | 2,455 | | California Statewide Community Development Authority, Revenue Bonds, Methodist Hospital Project, Series 2009, 6.750%, 2/01/38 | 8/19 at 100.00 | | Aa2 | | $ | 2,857,522 | |
| | 9,955 | | Capistrano Unified School District, Orange County, California, Special Tax Bonds, Community Facilities District, Series 2005, 0.000%, 9/01/31 – FGIC Insured | No Opt. Call | | A | | | 3,327,957 | |
| | | | Colton Joint Unified School District, San Bernardino County, California, General Obligation Bonds, Series 2006C: | | | | | | | |
| | 3,800 | | 0.000%, 2/01/33 – FGIC Insured | 2/15 at 38.73 | | A+ | | | 1,327,188 | |
| | 3,795 | | 0.000%, 2/01/37 – FGIC Insured | No Opt. Call | | A+ | | | 979,717 | |
| | 5,895 | | Contra Costa County, California, GNMA Mortgage-Backed Securities Program Home Mortgage Revenue Bonds, Series 1989, 7.750%, 5/01/22 (Alternative Minimum Tax) (ETM) | No Opt. Call | | Aaa | | | 7,429,056 | |
| | 2,510 | | Folsom Cordova Unified School District, Sacramento County, California, General Obligation Bonds, School Facilities Improvement District 1, Series 2004B, 0.000%, 10/01/28 – NPFG Insured | No Opt. Call | | A+ | | | 1,138,636 | |
| | 3,360 | | Folsom Cordova Unified School District, Sacramento County, California, General Obligation Bonds, School Facilities Improvement District 2, Series 2002A, 0.000%, 7/01/27 – NPFG Insured | No Opt. Call | | Aa3 | | | 1,687,123 | |
| | 2,315 | | Gateway Unified School District, California, General Obligation Bonds, Series 2004B, 0.000%, 8/01/32 – FGIC Insured | No Opt. Call | | A+ | | | 805,551 | |
| | 3,000 | | Golden State Tobacco Securitization Corporation, California, Enhanced Tobacco Settlement Asset-Backed Revenue Bonds, Series 2005A, 0.000%, 6/01/26 – AGM Insured | No Opt. Call | | AA– | | | 1,774,920 | |
| | | | Golden State Tobacco Securitization Corporation, California, Tobacco Settlement Asset-Backed Bonds, Series 2007A-1: | | | | | | | |
| | 1,275 | | 4.500%, 6/01/27 | 6/17 at 100.00 | | B | | | 1,090,482 | |
| | 3,885 | | 5.000%, 6/01/33 | 6/17 at 100.00 | | B | | | 2,994,752 | |
| | 1,000 | | 5.125%, 6/01/47 | 6/17 at 100.00 | | B | | | 700,870 | |
| | 5,000 | | Huntington Beach Union High School District, Orange County, California, General Obligation Bonds, Series 2005, 0.000%, 8/01/31 – NPFG Insured | No Opt. Call | | Aa2 | | | 2,020,650 | |
| | 2,500 | | Huntington Beach Union High School District, Orange County, California, General Obligation Bonds, Series 2007, 0.000%, 8/01/32 – FGIC Insured | No Opt. Call | | Aa2 | | | 927,300 | |
| | 5,000 | | Los Angeles Unified School District, Los Angeles County, California, General Obligation Bonds, Series 2007A, 4.500%, 1/01/28 – NPFG Insured | 7/17 at 100.00 | | Aa2 | | | 5,163,850 | |
| | 1,160 | | Mount San Antonio Community College District, Los Angeles County, California, General Obligation Bonds, Election of 2008, Series 2013A, 0.000%, 8/01/43 | 8/35 at 100.00 | | AA | | | 554,028 | |
| | 2,200 | | M-S-R Energy Authority, California, Gas Revenue Bonds, Series 2009C, 6.500%, 11/01/39 | No Opt. Call | | A | | | 2,645,940 | |
| | 2,000 | | Murrieta Valley Unified School District Public Financing Authority, California, Special Tax Revenue Bonds, Series 2006A, 5.125%, 9/01/26 – AGM Insured | 9/16 at 100.00 | | AA– | | | 2,145,960 | |
| | | | North Orange County Community College District, California, General Obligation Bonds, Series 2003B: | | | | | | | |
| | 7,735 | | 0.000%, 8/01/25 – FGIC Insured | No Opt. Call | | Aa1 | | | 4,901,437 | |
| | 4,180 | | 0.000%, 8/01/26 – FGIC Insured | No Opt. Call | | Aa1 | | | 2,452,824 | |
| | 5,000 | | Palmdale Community Redevelopment Agency, California, Single Family Restructured Mortgage Revenue Bonds, Series 1986A, 8.000%, 3/01/16 (Alternative Minimum Tax) (ETM) | No Opt. Call | | Aaa | | | 5,882,300 | |
| | 6,000 | | Palomar Pomerado Health, California, General Obligation Bonds, Election of 2004, Series 2007A, 0.000%, 8/01/24 – NPFG Insured | No Opt. Call | | A+ | | | 3,767,220 | |
| | 2,000 | | Pasadena, California, Certificates of Participation, Refunding Series 2008C, 5.000%, 2/01/33 | 2/18 at 100.00 | | AA+ | | | 2,080,500 | |
| | 9,315 | | Perris, California, GNMA Mortgage-Backed Securities Program Single Family Mortgage Revenue Bonds, Series 1989A, 7.600%, 1/01/23 (Alternative Minimum Tax) (ETM) | No Opt. Call | | Aaa | | | 13,133,405 | |
| | 3,205 | | San Diego Community College District, California, General Obligation Bonds, Series 2005, 5.000%, 5/01/25 (Pre-refunded 5/01/15) – AGM Insured | 5/15 at 100.00 | | AA+ (4) | | | 3,433,869 | |
| | 1,830 | | San Diego Public Facilities Financing Authority, California, Water Utility Revenue Bonds, Tender Option Bond Trust 3504, 19.820%, 2/01/33 (IF) | 8/19 at 100.00 | | Aa2 | | | 2,468,249 | |
| | 7,660 | | San Joaquin Hills Transportation Corridor Agency, Orange County, California, Senior Lien Toll Road Revenue Bonds, Series 1993, 0.000%, 1/01/24 (ETM) | No Opt. Call | | Aaa | | | 5,659,131 | |
| NMA | Nuveen Municipal Advantage Fund, Inc. (continued) |
| | Portfolio of Investments October 31, 2013 |
| | Principal | | | Optional Call | | | | | | |
| | Amount (000) | | Description (1) | Provisions (2) | | Ratings (3) | | | Value | |
| | | | California (continued) | | | | | | | |
| | | | San Joaquin Hills Transportation Corridor Agency, Orange County, California, Toll Road Revenue Refunding Bonds, Series 1997A: | | | | | | | |
| $ | 7,205 | | 0.000%, 1/15/23 – NPFG Insured | No Opt. Call | | A | | $ | 4,283,228 | |
| | 23,000 | | 0.000%, 1/15/35 – NPFG Insured | No Opt. Call | | A | | | 5,948,720 | |
| | 7,250 | | San Jose-Evergreen Community College District, Santa Clara County, California, General Obligation Bonds, Series 2005A, 0.000%, 9/01/29 – NPFG Insured | 9/15 at 100.00 | | Aa1 | | | 3,206,820 | |
| | 1,800 | | Walnut Valley Unified School District, Los Angeles County, California, General Obligation Bonds, Election 2000 Series 2003D, 0.000%, 8/01/27 – FGIC Insured | No Opt. Call | | Aa2 | | | 936,666 | |
| | 207,920 | | Total California | | | | | | 149,181,909 | |
| | | | Colorado – 12.9% (8.5% of Total Investments) | | | | | | | |
| | 1,600 | | Arkansas River Power Authority, Colorado, Power Revenue Bonds, Series 2006, 5.250%, 10/01/40 – SYNCORA GTY Insured | 10/16 at 100.00 | | BBB– | | | 1,484,848 | |
| | 3,000 | | Colorado Department of Transportation, Revenue Anticipation Bonds, Series 2003A, 5.250%, 12/15/15 (Pre-refunded 12/15/13) – AMBAC Insured | 12/13 at 100.00 | | AA (4) | | | 3,018,810 | |
| | 9,440 | | Colorado Health Facilities Authority, Colorado, Revenue Bonds, Catholic Health Initiatives, Series 2006A, 4.500%, 9/01/38 | 9/16 at 100.00 | | A+ | | | 8,640,621 | |
| | 3,335 | | Colorado Health Facilities Authority, Colorado, Revenue Bonds, Catholic Health Initiatives, Series 2009A, 5.500%, 7/01/34 | 7/19 at 100.00 | | A+ | | | 3,657,928 | |
| | 4,890 | | Colorado Health Facilities Authority, Colorado, Revenue Bonds, Catholic Health Initiatives, Series 2013A, 5.250%, 1/01/45 (WI/DD, Settling 11/14/13) | 1/23 at 100.00 | | A+ | | | 4,863,594 | |
| | 1,150 | | Colorado Health Facilities Authority, Colorado, Revenue Bonds, Poudre Valley Health System, Series 2005C, 5.250%, 3/01/40 – AGM Insured | 9/18 at 102.00 | | AA– | | | 1,181,119 | |
| | 7,500 | | Colorado Health Facilities Authority, Colorado, Revenue Bonds, Sisters of Charity of Leavenworth Health Services Corporation, Series 2010A, 5.000%, 1/01/40 | 1/20 at 100.00 | | AA– | | | 7,542,975 | |
| | 1,500 | | Colorado Health Facilities Authority, Colorado, Revenue Bonds, Valley View Hospital Association, Series 2007, 5.250%, 5/15/42 | 5/17 at 100.00 | | BBB+ | | | 1,483,545 | |
| | | | Denver City and County, Colorado, Airport Revenue Bonds, Series 2006: | | | | | | | |
| | 5,365 | | 5.000%, 11/15/23 – FGIC Insured (UB) | 11/16 at 100.00 | | A+ | | | 5,890,019 | |
| | 3,300 | | 5.000%, 11/15/24 – FGIC Insured | 11/16 at 100.00 | | A+ | | | 3,612,939 | |
| | 4,340 | | 5.000%, 11/15/25 – FGIC Insured (UB) | 11/16 at 100.00 | | A+ | | | 4,676,307 | |
| | 1,055 | | Denver City and County, Colorado, Airport System Revenue Bonds, Series 2005A, 5.000%, 11/15/25 – SYNCORA GTY Insured | 11/15 at 100.00 | | A+ | | | 1,126,318 | |
| | 3,870 | | Denver City and County, Colorado, Airport System Revenue Bonds, Subordinate Lien Series 2013B, 5.000%, 11/15/43 | 11/23 at 100.00 | | A | | | 3,894,226 | |
| | 2,000 | | Denver Convention Center Hotel Authority, Colorado, Revenue Bonds, Convention Center Hotel, Senior Lien Series 2006, 4.750%, 12/01/35 – SYNCORA GTY Insured | 11/16 at 100.00 | | BBB– | | | 1,852,840 | |
| | | | E-470 Public Highway Authority, Colorado, Senior Revenue Bonds, Series 1997B: | | | | | | | |
| | 2,650 | | 0.000%, 9/01/16 – NPFG Insured | No Opt. Call | | A | | | 2,484,879 | |
| | 8,845 | | 0.000%, 9/01/26 – NPFG Insured | No Opt. Call | | A | | | 4,704,744 | |
| | | | E-470 Public Highway Authority, Colorado, Senior Revenue Bonds, Series 2000B: | | | | | | | |
| | 7,500 | | 0.000%, 9/01/29 – NPFG Insured | No Opt. Call | | A | | | 3,211,125 | |
| | 10,000 | | 0.000%, 9/01/31 – NPFG Insured | No Opt. Call | | A | | | 3,632,400 | |
| | 10,000 | | 0.000%, 9/01/32 – NPFG Insured | No Opt. Call | | A | | | 3,400,600 | |
| | 3,110 | | Regional Transportation District, Colorado, Denver Transit Partners Eagle P3 Project Private Activity Bonds, Series 2010, 6.000%, 1/15/34 | 7/20 at 100.00 | | Baa3 | | | 3,240,122 | |
| | 5,000 | | Thornton, Colorado, Water Enterprise Revenue Bonds, Series 2004, 5.000%, 12/01/34 (Pre-refunded 12/01/14) – NPFG Insured | 12/14 at 100.00 | | AA (4) | | | 5,259,850 | |
| | 99,450 | | Total Colorado | | | | | | 78,859,809 | |
| | Principal | | | Optional Call | | | | | | |
| | Amount (000) | | Description (1) | Provisions (2) | | Ratings (3) | | | Value | |
| | | | Florida – 3.4% (2.2% of Total Investments) | | | | | | | |
| $ | 2,225 | | Miami-Dade County, Florida, General Obligation Bonds, Parks Program, Series 2005, 4.300%, 11/01/30 – NPFG Insured | 11/15 at 100.00 | | Aa2 | | $ | 2,219,682 | |
| | 590 | | South Broward Hospital District, Florida, Hospital Refunding Revenue Bonds, Memorial Health System, Series 2008, 5.000%, 5/01/28 | 5/18 at 100.00 | | AA– | | | 621,925 | |
| | 14,730 | | South Miami Health Facilities Authority, Florida, Hospital Revenue, Baptist Health System Obligation Group, Series 2007, 5.000%, 8/15/42 (UB) | 8/17 at 100.00 | | AA | | | 14,529,672 | |
| | 3,300 | | Tampa, Florida, Health System Revenue Bonds, Baycare Health System, Series 2012A, 5.000%, 11/15/33 | 5/22 at 100.00 | | Aa2 | | | 3,391,113 | |
| | 20,845 | | Total Florida | | | | | | 20,762,392 | |
| | | | Georgia – 1.8% (1.2% of Total Investments) | | | | | | | |
| | 4,000 | | Augusta, Georgia, Water and Sewerage Revenue Bonds, Series 2004, 5.250%, 10/01/39 – AGM Insured | 10/14 at 100.00 | | AA– | | | 4,121,320 | |
| | 2,900 | | Coffee County Hospital Authority, Georgia, Revenue Bonds, Coffee County Regional Medical Center, Series 2004, 5.000%, 12/01/26 | 12/14 at 100.00 | | BB– | | | 2,732,293 | |
| | 1,250 | | DeKalb County Hospital Authority, Georgia, Anticipation Certificates Revenue Bonds, DeKalb Medical Center, Inc. Project, Series 2010, 6.000%, 9/01/30 | 9/20 at 100.00 | | BBB | | | 1,295,525 | |
| | 2,500 | | Franklin County Industrial Building Authority, Georgia, Revenue Bonds, Ty Cobb Regional Medical Center Project, Series 2010, 7.625%, 12/01/30 | 12/20 at 100.00 | | N/R | | | 2,612,425 | |
| | 10,650 | | Total Georgia | | | | | | 10,761,563 | |
| | | | Illinois – 15.6% (10.3% of Total Investments) | | | | | | | |
| | 1,470 | | Chicago Board of Education, Cook County, Illinois, General Obligation Bonds, Dedicated Revenues Series 2011A, 5.000%, 12/01/41 | 12/21 at 100.00 | | A+ | | | 1,345,829 | |
| | 1,700 | | Chicago Board of Education, Illinois, Unlimited Tax General Obligation Bonds, Dedicated Revenues, Refunding Series 2004A, 5.000%, 12/01/20 – NPFG Insured | 12/14 at 100.00 | | A+ | | | 1,753,907 | |
| | 7,345 | | Chicago Board of Education, Illinois, Unlimited Tax General Obligation Bonds, Dedicated Tax Revenues, Series 1998B-1, 0.000%, 12/01/28 – FGIC Insured | No Opt. Call | | A+ | | | 2,924,265 | |
| | 4,260 | | Chicago Board of Education, Illinois, Unlimited Tax General Obligation Bonds, Dedicated Tax Revenues, Series 1999A, 0.000%, 12/01/31 – FGIC Insured | No Opt. Call | | A+ | | | 1,331,122 | |
| | 1,100 | | Chicago Transit Authority, Illinois, Sales Tax Receipts Revenue Bonds, Series 2011, 5.250%, 12/01/40 | 12/21 at 100.00 | | AA | | | 1,120,251 | |
| | 17,310 | | Chicago, Illinois, General Obligation Bonds, City Colleges, Series 1999, 0.000%, 1/01/37 – FGIC Insured | No Opt. Call | | AA– | | | 3,841,435 | |
| | 3,880 | | Chicago, Illinois, General Obligation Bonds, Series 2004A, 5.000%, 1/01/34 – AGM Insured | 1/14 at 100.00 | | AA– | | | 3,783,504 | |
| | 5,320 | | Chicago, Illinois, Third Lien General Airport Revenue Bonds, O’Hare International Airport, Series 2004A, 5.000%, 1/01/28 – NPFG Insured | 1/15 at 100.00 | | A | | | 5,473,854 | |
| | 7,100 | | Cook County, Illinois, General Obligation Bonds, Refunding Series 2010A, 5.250%, 11/15/33 | 11/20 at 100.00 | | AA | | | 7,149,629 | |
| | 1,500 | | Illinois Finance Authority, Revenue Bonds, Central DuPage Health, Series 2009B, 5.500%, 11/01/39 | 11/19 at 100.00 | | AA | | | 1,586,100 | |
| | 2,000 | | Illinois Finance Authority, Revenue Bonds, Children’s Memorial Hospital, Series 2008A, 5.250%, 8/15/47 – AGC Insured (UB) | 8/18 at 100.00 | | AA– | | | 2,006,960 | |
| | 8,395 | | Illinois Finance Authority, Revenue Bonds, Loyola University of Chicago, Tender Option Bond Trust 1137, 9.232%, 7/01/15 (IF) | No Opt. Call | | Aa1 | | | 8,641,981 | |
| | 2,500 | | Illinois Finance Authority, Revenue Bonds, Silver Cross Hospital and Medical Centers, Series 2009, 6.875%, 8/15/38 | 8/19 at 100.00 | | BBB+ | | | 2,694,475 | |
| | 4,000 | | Illinois Finance Authority, Revenue Refunding Bonds, Silver Cross Hospital and Medical Centers, Series 2008A, 6.000%, 8/15/23 | 8/18 at 100.00 | | BBB+ | | | 4,377,400 | |
| | 7,565 | | Illinois State, General Obligation Bonds, Refunding Series 2012, 5.000%, 8/01/21 | No Opt. Call | | A– | | | 8,215,817 | |
| | 3,000 | | Illinois Toll Highway Authority, State Toll Highway Authority Revenue Bonds, Series 2006A-1, 5.000%, 1/01/20 – AGM Insured | 7/16 at 100.00 | | AA– | | | 3,308,130 | |
| | 10,740 | | Lake and McHenry Counties Community Unit School District 118, Wauconda, Illinois, General Obligation Bonds, Series 2005B, 0.000%, 1/01/23 – AGM Insured | 1/15 at 66.94 | | A1 | | | 6,853,624 | |
| NMA | Nuveen Municipal Advantage Fund, Inc. (continued) |
| | Portfolio of Investments October 31, 2013 |
| | Principal | | | Optional Call | | | | | | |
| | Amount (000) | | Description (1) | Provisions (2) | | Ratings (3) | | | Value | |
| | | | Illinois (continued) | | | | | | | |
| $ | 1,315 | | McHenry and Kane Counties Community Consolidated School District 158, Huntley, Illinois, General Obligation Bonds, Series 2003, 0.000%, 1/01/21 – FGIC Insured | No Opt. Call | | Baa1 | | $ | 1,099,735 | |
| | 1,165 | | Metropolitan Pier and Exposition Authority, Illinois, Revenue Bonds, McCormick Place Expansion Project, Series 1993A, 0.000%, 6/15/21 – FGIC Insured | No Opt. Call | | Baa1 | | | 869,207 | |
| | 3,720 | | Metropolitan Pier and Exposition Authority, Illinois, Revenue Bonds, McCormick Place Expansion Project, Series 2002A, 0.000%, 6/15/41 – NPFG Insured | No Opt. Call | | AAA | | | 732,580 | |
| | 6,075 | | Metropolitan Pier and Exposition Authority, Illinois, Revenue Refunding Bonds, McCormick Place Expansion Project, Series 1996A, 0.000%, 6/15/24 – NPFG Insured | No Opt. Call | | AA– | | | 3,760,607 | |
| | 3,315 | | Regional Transportation Authority, Cook, DuPage, Kane, Lake, McHenry and Will Counties, Illinois, General Obligation Bonds, Series 1990A, 7.200%, 11/01/20 – AMBAC Insured | No Opt. Call | | AA | | | 3,893,003 | |
| | 2,410 | | Springfield, Illinois, Electric Revenue Bonds, Series 2006, 5.000%, 3/01/26 – NPFG Insured | 3/16 at 100.00 | | A | | | 2,447,235 | |
| | 11,350 | | Will County Community High School District 210 Lincoln-Way, Illinois, General Obligation Bonds, Series 2006, 0.000%, 1/01/24 – AGM Insured | No Opt. Call | | Aa2 | | | 7,298,958 | |
| | 12,775 | | Will County Community High School District 210 Lincoln-Way, Illinois, General Obligation Bonds, Series 2006, 0.000%, 1/01/24 – AGM Insured (ETM) | No Opt. Call | | Aa2 (4) | | | 9,334,693 | |
| | 131,310 | | Total Illinois | | | | | | 95,844,301 | |
| | | | Indiana – 5.1% (3.4% of Total Investments) | | | | | | | |
| | 4,400 | | Crown Point Multi-School Building Corporation, Indiana, First Mortgage Bonds, Crown Point Community School Corporation, Series 2000, 0.000%, 1/15/24 – NPFG Insured | No Opt. Call | | A | | | 2,947,956 | |
| | 4,465 | | Indiana Finance Authority Health System Revenue Bonds, Sisters of St. Francis Health Services, Inc. Obligated Group, Series 2009, 5.250%, 11/01/39 | 11/19 at 100.00 | | AA | | | 4,563,989 | |
| | 1,260 | | Indiana Finance Authority, Hospital Revenue Bonds, Community Health Network Project, Series 2012A, 5.000%, 5/01/42 | 5/23 at 100.00 | | A | | | 1,234,687 | |
| | 2,460 | | Indiana Finance Authority, Private Activity Bonds, Ohio River Bridges East End Crossing Project, Series 2013A, 5.000%, 7/01/48 (Alternative Minimum Tax) | 7/23 at 100.00 | | BBB | | | 2,183,890 | |
| | 6,000 | | Indiana Finance Authority, Revenue Bonds, Trinity Health Care Group, Refunding Series 2009A, 5.250%, 12/01/38 | 12/19 at 100.00 | | Aa2 | | | 6,231,120 | |
| | 3,485 | | Indiana Health and Educational Facilities Financing Authority, Revenue Bonds, Ascension Health, Series 2006B-5, 5.000%, 11/15/36 | 11/16 at 100.00 | | AA+ | | | 3,507,339 | |
| | 2,000 | | Indiana Health Facility Financing Authority, Hospital Revenue Bonds, Deaconess Hospital Inc., Series 2004A, 5.375%, 3/01/34 (Pre-refunded 3/01/14) – AMBAC Insured | 3/14 at 100.00 | | A+ (4) | | | 2,034,960 | |
| | 2,435 | | Indiana Health Facility Financing Authority, Revenue Bonds, Community Foundation of Northwest Indiana, Series 2007, 5.500%, 3/01/37 | 3/17 at 100.00 | | A | | | 2,511,337 | |
| | 10,000 | | Indianapolis Local Public Improvement Bond Bank, Indiana, Series 1999E, 0.000%, 2/01/26 – AMBAC Insured | No Opt. Call | | AA | | | 6,196,700 | |
| | 1,005 | | St. Joseph County Hospital Authority, Indiana, Revenue Bonds, Madison Center Inc., Series 1999, 5.450%, 2/15/14 (5) | No Opt. Call’ | | N/R | | | 108,309 | |
| | 37,510 | | Total Indiana | | | | | | 31,520,287 | |
| | | | Iowa – 1.9% (1.3% of Total Investments) | | | | | | | |
| | 7,055 | | Iowa Finance Authority, Iowa, Midwestern Disaster Area Revenue Bonds, Iowa Fertilizer Company Project, Series 2013, 5.500%, 12/01/22 | 12/18 at 100.00 | | BB– | | | 6,767,438 | |
| | 6,300 | | Iowa Tobacco Settlement Authority, Asset Backed Settlement Revenue Bonds, Series 2005C, 5.375%, 6/01/38 | 6/15 at 100.00 | | B+ | | | 4,864,482 | |
| | 250 | | Iowa Tobacco Settlement Authority, Tobacco Asset-Backed Revenue Bonds, Series 2005B, 5.600%, 6/01/34 | 6/17 at 100.00 | | B+ | | | 209,730 | |
| | 13,605 | | Total Iowa | | | | | | 11,841,650 | |
| | Principal | | | Optional Call | | | | | | |
| | Amount (000) | | Description (1) | Provisions (2) | | Ratings (3) | | | Value | |
| | | | Kansas – 1.2% (0.8% of Total Investments) | | | | | | | |
| $ | 3,530 | | Overland Park Development Corporation, Kansas, First Tier Revenue Bonds, Overland Park Convention Center, Series 2007A, 5.125%, 1/01/22 – AMBAC Insured | 1/17 at 100.00 | | BB+ | | $ | 3,521,599 | |
| | 1,750 | | Wamego, Kansas, Pollution Control Revenue Bonds, Kansas Gas and Electric Company, Series 2004, 5.300%, 6/01/31 – NPFG Insured | 6/14 at 100.00 | | A | | | 1,760,220 | |
| | 3,055 | | Wyandotte County-Kansas City Unified Government, Kansas, Sales Tax Special Obligation Capital Appreciation Revenue Bonds Redevelopment Project Area B – Major Multi-Sport Athletic Complex Project, Subordinate Lien Series 2010B, 0.000%, 6/01/21 | No Opt. Call | | BBB+ | | | 2,039,213 | |
| | 8,335 | | Total Kansas | | | | | | 7,321,032 | |
| | | | Kentucky – 1.5% (1.0% of Total Investments) | | | | | | | |
| | 6,015 | | Kentucky Economic Development Finance Authority, Hospital Facilities Revenue Bonds, Owensboro Medical Health System, Series 2010B, 6.375%, 3/01/40 | 6/20 at 100.00 | | BBB+ | | | 6,354,126 | |
| | 1,500 | | Kentucky Economic Development Finance Authority, Hospital Revenue Bonds, Baptist Healthcare System Obligated Group, Series 2009A, 5.375%, 8/15/24 | 8/19 at 100.00 | | AA– | | | 1,660,920 | |
| | 1,000 | | Kentucky Economic Development Finance Authority, Louisville Arena Project Revenue Bonds, Louisville Arena Authority, Inc., Series 2008-A1, 6.000%, 12/01/33 – AGC Insured | 6/18 at 100.00 | | AA– | | | 1,003,110 | |
| | 8,515 | | Total Kentucky | | | | | | 9,018,156 | |
| | | | Louisiana – 6.8% (4.5% of Total Investments) | | | | | | | |
| | | | Louisiana Public Facilities Authority, Extended Care Facilities Revenue Bonds, Comm-Care Corporation Project, Series 1994: | | | | | | | |
| | 150 | | 11.000%, 2/01/14 (ETM) | No Opt. Call | | N/R (4) | | | 153,897 | |
| | 1,375 | | 11.000%, 2/01/14 (ETM) | No Opt. Call | | N/R (4) | | | 1,410,723 | |
| | 9,000 | | Louisiana Public Facilities Authority, Revenue Bonds, Ochsner Clinic Foundation Project, Series 2007A, 5.500%, 5/15/47 | 5/17 at 100.00 | | Baa1 | | | 9,090,360 | |
| | 28 | | Louisiana State, Gasoline and Fuels Tax Revenue Bonds, Series 2006A, Trust 660, 16.045%, 5/01/34 (IF) | 5/16 at 100.00 | | Aa1 | | | 27,098 | |
| | | | Louisiana State, Gasoline and Fuels Tax Revenue Bonds, Series 2006A: | | | | | | | |
| | 10,000 | | 5.000%, 5/01/41 – FGIC Insured (UB) | 5/16 at 100.00 | | Aa1 | | | 10,373,100 | |
| | 20,690 | | 4.500%, 5/01/41 – FGIC Insured (UB) | 5/16 at 100.00 | | Aa1 | | | 20,464,479 | |
| | 41,243 | | Total Louisiana | | | | | | 41,519,657 | |
| | | | Maine – 0.2% (0.1% of Total Investments) | | | | | | | |
| | 1,050 | | Maine Health and Higher Educational Facilities Authority, Revenue Bonds, MaineGeneral Medical Center, Series 2011, 6.750%, 7/01/41 | 7/21 at 100.00 | | BBB– | | | 1,108,265 | |
| | | | Massachusetts – 3.1% (2.0% of Total Investments) | | | | | | | |
| | 2,500 | | Massachusetts Bay Transportation Authority, Assessment Bonds, Series 2004A, 5.000%, 7/01/28 (Pre-refunded 7/01/14) | 7/14 at 100.00 | | AA+ (4) | | | 2,581,350 | |
| | 8,825 | | Massachusetts Department of Transportation, Metropolitan Highway System Revenue Bonds, Senior Lien Series 2010B, 5.000%, 1/01/32 | 1/20 at 100.00 | | A+ | | | 9,160,880 | |
| | 620 | | Massachusetts Health and Educational Facilities Authority, Revenue Bonds, CareGroup Inc., Series 2008E-1 &2, 5.125%, 7/01/33 | 7/18 at 100.00 | | A– | | | 632,059 | |
| | 1,750 | | Massachusetts Health and Educational Facilities Authority, Revenue Bonds, UMass Memorial Healthcare, Series 1998A, 5.000%, 7/01/28 – AMBAC Insured | 1/14 at 100.00 | | BBB+ | | | 1,750,228 | |
| | 2,300 | | Massachusetts Health and Educational Facilities Authority, Revenue Refunding Bonds, Suffolk University Issue, Series 2009A, 5.750%, 7/01/39 | 7/19 at 100.00 | | BBB | | | 2,384,042 | |
| | 2,280 | | Massachusetts School Building Authority, Dedicated Sales Tax Revenue Bonds, Senior Series 2013A, 5.000%, 5/15/43 | 5/23 at 100.00 | | AA+ | | | 2,403,758 | |
| | 18,275 | | Total Massachusetts | | | | | | 18,912,317 | |
| NMA | Nuveen Municipal Advantage Fund, Inc. (continued) |
| | Portfolio of Investments October 31, 2013 |
| | Principal | | | Optional Call | | | | | | |
| | Amount (000) | | Description (1) | Provisions (2) | | Ratings (3) | | | Value | |
| | | | Michigan – 4.0% (2.7% of Total Investments) | | | | | | | |
| $ | 1,975 | | Detroit Water and Sewerage Department, Michigan, Sewage Disposal System Revenue Bonds, Refunding Senior Lien Series 2012A, 5.000%, 7/01/32 | 7/22 at 100.00 | | BBB+ | | $ | 1,796,124 | |
| | 3,695 | | Detroit, Michigan, Second Lien Sewerage Disposal System Revenue Bonds, Series 2005A, 5.000%, 7/01/35 – NPFG Insured | 7/15 at 100.00 | | A | | | 3,336,918 | |
| | 3,000 | | Detroit, Michigan, Senior Lien Sewerage Disposal System Revenue Bonds, Series 2001B, 5.500%, 7/01/29 – FGIC Insured | No Opt. Call | | A | | | 2,919,960 | |
| | 2,835 | | Detroit, Michigan, Sewage Disposal System Revenue Bonds, Second Lien Series 2006A, 5.500%, 7/01/36 – BHAC Insured | 7/18 at 100.00 | | AA+ | | | 2,848,636 | |
| | 2,500 | | Detroit, Michigan, Sewer Disposal System Revenue Bonds, Second Lien, Series 2001E, 5.750%, 7/01/31 – BHAC Insured | 7/18 at 100.00 | | AA+ | | | 2,562,375 | |
| | 2,000 | | Detroit, Michigan, Water Supply System Senior Lien Revenue Refunding Bonds, Series 2005C, 5.000%, 7/01/16 – FGIC Insured | No Opt. Call | | A | | | 1,999,760 | |
| | 4,000 | | Detroit, Michigan, Water Supply System Senior Lien Revenue Refunding Bonds, Series 2006D, 5.000%, 7/01/32 – AGM Insured | 7/16 at 100.00 | | AA– | | | 3,715,240 | |
| | 6,250 | | Michigan State Building Authority, Revenue Bonds, Refunding Series 2006IA, 0.000%, 10/15/30 – FGIC Insured | 10/16 at 50.02 | | Aa3 | | | 2,570,188 | |
| | 3,050 | | Michigan Tobacco Settlement Finance Authority, Tobacco Settlement Asset-Backed Revenue Bonds, Series 2008A, 6.875%, 6/01/42 | 6/18 at 100.00 | | BB– | | | 2,760,647 | |
| | 29,305 | | Total Michigan | | | | | | 24,509,848 | |
| | | | Missouri – 2.1% (1.4% of Total Investments) | | | | | | | |
| | 12,005 | | Kansas City Municipal Assistance Corporation, Missouri, Leasehold Revenue Bonds, Series 2004B-1, 0.000%, 4/15/29 – AMBAC Insured | No Opt. Call | | AA– | | | 5,715,460 | |
| | 6,930 | | Missouri State Health and Educational Facilities Authority, Health Facilities Revenue Bonds, CoxHealth, Series 2013A, 5.000%, 11/15/48 | 11/23 at 100.00 | | A2 | | | 6,901,448 | |
| | 18,935 | | Total Missouri | | | | | | 12,616,908 | |
| | | | Nevada – 4.7% (3.1% of Total Investments) | | | | | | | |
| | 15,000 | | Clark County, Nevada, Airport Revenue Bonds, Subordinate Lien Series 2010B, 5.750%, 7/01/42 | 1/20 at 100.00 | | A+ | | | 16,341,600 | |
| | 3,750 | | Henderson, Nevada, Healthcare Facility Revenue Refunding Bonds, Catholic Healthcare West, Series 2008, 18.987%, 7/01/31 – BHAC Insured (IF), (6) | 7/17 at 100.00 | | AA+ | | | 4,166,250 | |
| | 3,395 | | Las Vegas Valley Water District, Nevada, Limited Tax General Obligation Bonds, Water & Refunding Series 2009D, 5.000%, 6/01/27 | 6/19 at 100.00 | | AA+ | | | 3,750,423 | |
| | 5,000 | | North Las Vegas, Nevada, General Obligation Bonds, Series 2006, 5.000%,
5/01/36 – NPFG Insured | 5/16 at 100.00 | | A | | | 4,309,750 | |
| | 27,145 | | Total Nevada | | | | | | 28,568,023 | |
| | | | New Hampshire – 0.3% (0.2% of Total Investments) | | | | | | | |
| | 1,500 | | New Hampshire Business Finance Authority, Revenue Bonds, Elliot Hospital Obligated Group Issue, Series 2009A, 6.125%, 10/01/39 | 10/19 at 100.00 | | Baa1 | | | 1,563,615 | |
| | | | New Jersey – 3.2% (2.1% of Total Investments) | | | | | | | |
| | 2,500 | | New Jersey Economic Development Authority, Revenue Bonds, Motor Vehicle Surcharge, Series 2004A, 5.250%, 7/01/33 – NPFG Insured | 7/14 at 100.00 | | A | | | 2,550,200 | |
| | 3,050 | | New Jersey Educational Facilities Authority, Revenue Bonds, Princeton University, Series 2004D, 5.000%, 7/01/29 (Pre-refunded 7/01/14) | 7/14 at 100.00 | | AAA | | | 3,148,851 | |
| | 4,000 | | New Jersey Transportation Trust Fund Authority, Transportation System Bonds, Series 2004A, 5.250%, 6/15/18 (Pre-refunded 6/15/14) – FGIC Insured | 6/14 at 100.00 | | Aaa | | | 4,127,240 | |
| | 15,000 | | New Jersey Transportation Trust Fund Authority, Transportation System Bonds, Series 2006C, 0.000%, 12/15/30 – FGIC Insured | No Opt. Call | | A+ | | | 6,094,500 | |
| | 5,500 | | Tobacco Settlement Financing Corporation, New Jersey, Tobacco Settlement Asset-Backed Bonds, Series 2007-1A, 4.750%, 6/01/34 | 6/17 at 100.00 | | B2 | | | 4,003,670 | |
| | 30,050 | | Total New Jersey | | | | | | 19,924,461 | |
| | Principal | | | Optional Call | | | | | | |
| | Amount (000) | | Description (1) | Provisions (2) | | Ratings (3) | | | Value | |
| | | | New York – 7.6% (5.0% of Total Investments) | | | | | | | |
| $ | 2,000 | | Hudson Yards Infrastructure Corporation, New York, Revenue Bonds, Senior Fiscal 2012 Series 2011A, 5.250%, 2/15/47 | 2/21 at 100.00 | | A | | $ | 2,052,720 | |
| | 2,500 | | Metropolitan Transportation Authority, New York, Transportation Revenue Bonds, Refunding Series 2012F, 5.000%, 11/15/26 | 11/22 at 100.00 | | A | | | 2,760,375 | |
| | 875 | | New York City Industrial Development Agency, New York, American Airlines-JFK International Airport Special Facility Revenue Bonds, Series 2005, 7.500%, 8/01/16 (Alternative Minimum Tax) | No Opt. Call | | N/R | | | 910,866 | |
| | 4,975 | | New York City Industrial Development Agency, New York, Special Facilities Revenue Bonds, British Airways PLC, Series 1998, 5.250%, 12/01/32 (Alternative Minimum Tax) | 12/13 at 100.00 | | BB | | | 4,564,712 | |
| | 3,000 | | New York City Industrial Development Agency, New York, Special Facilities Revenue Bonds, British Airways PLC, Series 2002, 7.625%, 12/01/32 (Alternative Minimum Tax) | 12/13 at 100.00 | | BB | | | 3,014,220 | |
| | 3,800 | | New York City Municipal Water Finance Authority, New York, Water and Sewerage System Revenue Bonds, Fiscal Series 2005D, 5.000%, 6/15/38 | 6/15 at 100.00 | | AAA | | | 3,904,842 | |
| | 10,000 | | New York City Municipal Water Finance Authority, New York, Water and Sewerage System Revenue, Bonds, Series 2004B, 5.000%, 6/15/36 – AGM Insured (UB) | 12/14 at 100.00 | | AAA | | | 10,262,400 | |
| | 5,000 | | New York City Transitional Finance Authority, New York, Future Tax Secured Bonds, Fiscal Series 2007B, 4.750%, 11/01/27 | 5/17 at 100.00 | | AAA | | | 5,376,500 | |
| | 5,000 | | New York City Transitional Finance Authority, New York, Future Tax Secured Bonds, Subordinate Fiscal 2013 Series I, 5.000%, 5/01/38 | 5/23 at 100.00 | | AAA | | | 5,274,600 | |
| | | | Port Authority of New York and New Jersey, Special Project Bonds, JFK International Air Terminal LLC Project, Eighth Series 2010: | | | | | | | |
| | 6,065 | | 6.500%, 12/01/28 | 12/15 at 100.00 | | BBB | | | 6,363,580 | |
| | 1,760 | | 6.000%, 12/01/36 | 12/20 at 100.00 | | BBB | | | 1,904,126 | |
| | 44,975 | | Total New York | | | | | | 46,388,941 | |
| | | | North Carolina – 1.8% (1.2% of Total Investments) | | | | | | | |
| | 3,000 | | North Carolina Eastern Municipal Power Agency, Power System Revenue Bonds, Series 2005, 5.250%, 1/01/20 – AMBAC Insured | 1/16 at 100.00 | | A– | | | 3,278,670 | |
| | 3,500 | | North Carolina Medical Care Commission, Healthcare Facilities Revenue Bonds, Duke University Health System, Series 2009A, 5.000%, 6/01/42 | 6/19 at 100.00 | | AA | | | 3,556,070 | |
| | 2,380 | | North Carolina Medical Care Commission, Healthcare Revenue Refunding Bonds, Novant Health Inc., Series 2006, 5.000%, 11/01/39 – NPFG Insured | 11/16 at 100.00 | | AA+ | | | 2,455,898 | |
| | 1,900 | | North Carolina Turnpike Authority, Triangle Expressway System Revenue Bonds, Series 2009A, 5.750%, 1/01/39 – AGC Insured | 1/19 at 100.00 | | AA– | | | 2,047,269 | |
| | 10,780 | | Total North Carolina | | | | | | 11,337,907 | |
| | | | North Dakota – 0.7% (0.4% of Total Investments) | | | | | | | |
| | 1,500 | | Fargo, North Dakota, Health System Revenue Bonds, Sanford Health, Refunding Series 2011, 6.000%, 11/01/28 | 11/21 at 100.00 | | A+ | | | 1,693,260 | |
| | 2,350 | | Ward County Health Care, North Dakota, Revenue Bonds, Trinity Obligated Group, Series 2006, 5.125%, 7/01/25 | 7/16 at 100.00 | | BBB– | | | 2,383,135 | |
| | 3,850 | | Total North Dakota | | | | | | 4,076,395 | |
| | | | Ohio – 6.8% (4.5% of Total Investments) | | | | | | | |
| | 10,000 | | American Municipal Power Ohio Inc., General Revenue Bonds, Prairie State Energy Campus Project Series 2008A, 5.250%, 2/15/43 | 2/18 at 100.00 | | A1 | | | 10,144,700 | |
| | | | Buckeye Tobacco Settlement Financing Authority, Ohio, Tobacco Settlement Asset-Backed Revenue Bonds, Senior Lien, Series 2007A-2: | | | | | | | |
| | 1,760 | | 5.125%, 6/01/24 | 6/17 at 100.00 | | B– | | | 1,504,272 | |
| | 2,700 | | 5.875%, 6/01/30 | 6/17 at 100.00 | | B | | | 2,199,177 | |
| | 9,135 | | 5.750%, 6/01/34 | 6/17 at 100.00 | | B | | | 7,152,705 | |
| | 3,920 | | 6.000%, 6/01/42 | 6/17 at 100.00 | | BB+ | | | 3,079,826 | |
| | 6,080 | | 5.875%, 6/01/47 | 6/17 at 100.00 | | B | | | 4,723,005 | |
| NMA | Nuveen Municipal Advantage Fund, Inc. (continued) |
| | Portfolio of Investments October 31, 2013 |
| | Principal | | | Optional Call | | | | | | |
| | Amount (000) | | Description (1) | Provisions (2) | | Ratings (3) | | | Value | |
| | | | Ohio (continued) | | | | | | | |
| $ | 6,625 | | Buckeye Tobacco Settlement Financing Authority, Ohio, Tobacco Settlement Asset-Backed Revenue Bonds, Senior Lien, Series 2007A-3, 6.250%, 6/01/37 | 6/22 at 100.00 | | B | | $ | 5,433,096 | |
| | 7,050 | | Ohio Air Quality Development Authority, Ohio, Revenue Bonds, Ohio Valley Electric Corporation Project, Series 2009E, 5.625%, 10/01/19 | No Opt. Call | | BBB– | | | 7,719,891 | |
| | 47,270 | | Total Ohio | | | | | | 41,956,672 | |
| | | | Oklahoma – 2.8% (1.9% of Total Investments) | | | | | | | |
| | 1,000 | | Fort Sill Apache Tribe of Oklahoma Economic Development Authority, Gaming Enterprise Revenue Bonds, Fort Sill Apache Casino, Series 2011A, 8.500%, 8/25/26 | 8/21 at 100.00 | | N/R | | | 1,074,660 | |
| | 1,675 | | Oklahoma Development Finance Authority, Health System Revenue Bonds, Integris Baptist Medical Center, Series 2008B, 5.250%, 8/15/38 | 8/18 at 100.00 | | AA– | | | 1,707,495 | |
| | 12,600 | | Oklahoma Development Finance Authority, Revenue Bonds, Saint John Health System, Series 2007, 5.000%, 2/15/42 | 2/17 at 100.00 | | A+ | | | 12,776,274 | |
| | 2,000 | | Oklahoma Municipal Power Authority, Power Supply System Revenue Bonds, Series 2007, 4.500%, 1/01/47 – FGIC Insured | 1/17 at 100.00 | | A | | | 1,910,380 | |
| | 17,275 | | Total Oklahoma | | | | | | 17,468,809 | |
| | | | Oregon – 0.5% (0.3% of Total Investments) | | | | | | | |
| | 3,000 | | Oregon State Facilities Authority, Revenue Bonds, Willamette University, Series 2007A, 5.000%, 10/01/36 | 10/17 at 100.00 | | A | | | 3,043,530 | |
| | | | Pennsylvania – 5.8% (3.8% of Total Investments) | | | | | | | |
| | 5,000 | | Allegheny County Hospital Development Authority, Pennsylvania, University of Pittsburgh Medical Center Revenue Bonds, Series 2009A, 5.625%, 8/15/39 | 8/19 at 100.00 | | Aa3 | | | 5,381,850 | |
| | 1,250 | | Erie Water Authority, Pennsylvania, Water Revenue Bonds, Series 2008, 5.000%, 12/01/43 – AGM Insured | 12/18 at 100.00 | | AA– | | | 1,258,300 | |
| | 7,100 | | Montgomery County Industrial Development Authority, Pennsylvania, FHA Insured Mortgage Revenue Bonds, New Regional Medical Center Project, Series 2010, 5.750%, 8/01/30 | 8/15 at 100.00 | | AA | | | 7,516,202 | |
| | 1,500 | | Pennsylvania Housing Finance Agency, Single Family Mortgage Revenue Bonds, Series 2006-96A, 4.650%, 10/01/31 (Alternative Minimum Tax) (UB) | 10/16 at 100.00 | | AA+ | | | 1,494,525 | |
| | 1,500 | | Pennsylvania Turnpike Commission, Motor License Fund-Enhanced Subordinate Special Revenue Bonds, Series 2010A, 0.000%, 12/01/34 | 12/20 at 100.00 | | AA | | | 1,382,565 | |
| | 5,140 | | Pennsylvania Turnpike Commission, Motor License Fund-Enhanced Turnpike Subordinate Special Revenue, Series 2011B, 5.000%, 12/01/34 | No Opt. Call | | A1 | | | 5,305,302 | |
| | 2,600 | | Pennsylvania Turnpike Commission, Turnpike Revenue Bonds, Series 2004A, 5.500%, 12/01/31 – AMBAC Insured | 12/14 at 100.00 | | A+ | | | 2,692,872 | |
| | 10,000 | | Philadelphia Hospitals and Higher Education Facilities Authority, Pennsylvania, Health System Revenue Bonds, Jefferson Health System, Series 2010B, 5.250%, 5/15/30 | 5/20 at 100.00 | | AA | | | 10,513,100 | |
| | 34,090 | | Total Pennsylvania | | | | | | 35,544,716 | |
| | | | Puerto Rico – 6.8% (4.6% of Total Investments) | | | | | | | |
| | 2,500 | | Puerto Rico Aqueduct and Sewerage Authority, Revenue Bonds, Senior Lien Series 2012A, 5.125%, 7/01/37 | 7/22 at 100.00 | | BBB– | | | 1,840,100 | |
| | 5,000 | | Puerto Rico Electric Power Authority, Power Revenue Bonds, Series 2005RR, 5.000%, 7/01/26 – SYNCORA GTY Insured | 7/15 at 100.00 | | BBB | | | 3,664,150 | |
| | 10,000 | | Puerto Rico Electric Power Authority, Power Revenue Bonds, Series 2010XX, 5.750%, 7/01/36 | 7/20 at 100.00 | | BBB | | | 7,552,100 | |
| | | | Puerto Rico Highway and Transportation Authority, Highway Revenue Bonds, Series 2007N: | | | | | | | |
| | 215 | | 5.500%, 7/01/29 – AMBAC Insured | No Opt. Call | | Baa3 | | | 170,203 | |
| | 10,070 | | 5.250%, 7/01/39 – FGIC Insured | No Opt. Call | | BBB | | | 6,843,069 | |
| | Principal | | | Optional Call | | | | | | |
| | Amount (000) | | Description (1) | Provisions (2) | | Ratings (3) | | | Value | |
| | | | Puerto Rico (continued) | | | | | | | |
| $ | 1,455 | | Puerto Rico Highway and Transportation Authority, Subordinate Lien Highway Revenue Bonds, Series 2003, 5.000%, 7/01/28 – CIFG Insured | 1/14 at 100.00 | | BBB– | | $ | 1,073,775 | |
| | 10,000 | | Puerto Rico Sales Tax Financing Corporation, Sales Tax Revenue Bonds, First Subordinate Series 2009A, 6.000%, 8/01/42 | 8/19 at 100.00 | | A+ | | | 8,657,800 | |
| | 2,105 | | Puerto Rico Sales Tax Financing Corporation, Sales Tax Revenue Bonds, First Subordinate Series 2010A, 5.500%, 8/01/37 | 2/20 at 100.00 | | A+ | | | 1,724,984 | |
| | 9,310 | | Puerto Rico Sales Tax Financing Corporation, Sales Tax Revenue Bonds, First Subordinate Series 2010C, 5.250%, 8/01/41 | 8/20 at 100.00 | | A+ | | | 7,298,202 | |
| | 3,975 | | Puerto Rico, General Obligation and Public Improvement Bonds, Series 2002A, 5.500%, 7/01/20 – NPFG Insured | No Opt. Call | | A | | | 3,756,137 | |
| | 54,630 | | Total Puerto Rico | | | | | | 42,580,520 | |
| | | | Rhode Island – 1.2% (0.8% of Total Investments) | | | | | | | |
| | 950 | | Rhode Island Health and Educational Building Corporation, Hospital Financing Revenue Bonds, Lifespan Obligated Group, Series 1996, 5.500%, 5/15/16 – NPFG Insured | 1/14 at 100.00 | | A | | | 953,411 | |
| | 6,280 | | Rhode Island Housing and Mortgage Finance Corporation, Homeownership Opportunity Bond Program, Series 50A, 4.650%, 10/01/34 | 10/14 at 100.00 | | AA+ | | | 6,283,831 | |
| | 7,230 | | Total Rhode Island | | | | | | 7,237,242 | |
| | | | South Carolina – 1.5% (1.0% of Total Investments) | | | | | | | |
| | 2,105 | | Medical University Hospital Authority, South Carolina, FHA-Insured Mortgage Revenue Bonds, Series 2004A, 5.250%, 8/15/34 (Pre-refunded 8/15/14) – NPFG Insured | 8/14 at 100.00 | | A (4) | | | 2,187,558 | |
| | 3,100 | | Myrtle Beach, South Carolina, Hospitality and Accommodation Fee Revenue Bonds, Series 2004A, 5.000%, 6/01/36 – FGIC Insured | 6/14 at 100.00 | | A+ | | | 3,152,452 | |
| | 1,220 | | Piedmont Municipal Power Agency, South Carolina, Electric Revenue Bonds, Series 2004A-2, 0.000%, 1/01/23 – FGIC Insured | No Opt. Call | | A | | | 866,310 | |
| | 2,900 | | South Carolina Transportation Infrastructure Bank, Revenue Bonds, Series 2010A, 5.250%, 10/01/40 | 10/19 at 100.00 | | A1 | | | 3,064,343 | |
| | 9,325 | | Total South Carolina | | | | | | 9,270,663 | |
| | | | South Dakota – 0.5% (0.3% of Total Investments) | | | | | | | |
| | 2,945 | | South Dakota Health and Educational Facilities Authority, Revenue Bonds, Sanford Health, Series 2007, 5.000%, 11/01/40 | 5/17 at 100.00 | | A+ | | | 2,908,453 | |
| | | | Tennessee – 0.2% (0.1% of Total Investments) | | | | | | | |
| | 1,000 | | Metropolitan Government of Nashville-Davidson County Health and Educational Facilities Board, Tennessee, Revenue Refunding and Improvement Bonds, Meharry Medical College, Series 1996, 6.000%, 12/01/19 – AMBAC Insured | 12/17 at 100.00 | | N/R | | | 1,071,320 | |
| | 1,500 | | Sumner County Health, Educational, and Housing Facilities Board, Tennessee, Revenue Refunding Bonds, Sumner Regional Health System Inc., Series 2007, 5.500%, 11/01/46 (5) | 11/17 at 100.00 | | N/R | | | 3,600 | |
| | 2,500 | | Total Tennessee | | | | | | 1,074,920 | |
| | | | Texas – 13.9% (9.2% of Total Investments) | | | | | | | |
| | 5,555 | | Beaumont Independent School District, Jefferson County, Texas, General Obligation Bonds, Series 2008, 5.000%, 2/15/38 | 2/17 at 100.00 | | AAA | | | 5,791,421 | |
| | 6,000 | | Brazos River Authority, Texas, Revenue Refunding Bonds, Houston Lighting and Power Company, Series 1998, 5.050%, 11/01/18 – AMBAC Insured (Alternative Minimum Tax) | No Opt. Call | | A | | | 6,476,040 | |
| | 2,075 | | Brownsville, Texas, Utility System Priority Revenue Bonds, Series 2005A, 5.000%, 9/01/26 (Pre-refunded 9/01/15) – AMBAC Insured | 9/15 at 100.00 | | A2 (4) | | | 2,252,413 | |
| NMA | Nuveen Municipal Advantage Fund, Inc. (continued) |
| | Portfolio of Investments October 31, 2013 |
| | Principal | | | Optional Call | | | | | | |
| | Amount (000) | | Description (1) | Provisions (2) | | Ratings (3) | | | Value | |
| | | | Texas (continued) | | | | | | | |
| $ | 925 | | Brownsville, Texas, Utility System Priority Revenue Bonds, Series 2005A, 5.000%, 9/01/26 – AMBAC Insured | 9/15 at 100.00 | | A+ | | $ | 981,832 | |
| | 2,000 | | Capital Area Cultural Education Facilities Finance Corporation, Texas, Revenue Bonds, The Roman Catholic Diocese of Austin, Series 2005B. Remarketed, 6.125%, 4/01/45 | 4/20 at 100.00 | | Baa1 | | | 2,120,980 | |
| | 1,000 | | Central Texas Regional Mobility Authority, Revenue Bonds, Senior Lien Series 2011, 6.000%, 1/01/41 | 1/21 at 100.00 | | Baa2 | | | 1,024,440 | |
| | 20 | | Denton Independent School District, Denton County, Texas, General Obligation Bonds, Refunding Series 2004, 5.000%, 8/15/33 | No Opt. Call | | AAA | | | 20,512 | |
| | 2,080 | | Denton Independent School District, Denton County, Texas, General Obligation Bonds, Refunding Series 2004, 5.000%, 8/15/33 (Pre-refunded 8/15/14) | 8/14 at 100.00 | | N/R (4) | | | 2,159,539 | |
| | 4,250 | | Ennis Independent School District, Ellis County, Texas, General Obligation Bonds, Series 2006, 0.000%, 8/15/26 | 8/16 at 60.73 | | Aaa | | | 2,362,150 | |
| | 10,000 | | Grand Parkway Transportation Corporation, Texas, System Toll Revenue Bonds, Subordinate Lien Series 2013B, 5.250%, 10/01/51 | 10/23 at 100.00 | | AA+ | | | 10,201,000 | |
| | 5,000 | | Harris County Hospital District, Texas, Revenue Bonds, Series 2007A, 5.250%, 2/15/42 – NPFG Insured | 2/17 at 100.00 | | AA+ | | | 5,247,100 | |
| | 1,225 | | Katy Independent School District, Harris, Fort Bend and Waller Counties, Texas, General Obligation Bonds, Refunding Series 2007C, 5.625%, 2/15/14 | No Opt. Call | | AAA | | | 1,244,637 | |
| | 2,550 | | Kerrville Health Facilities Development Corporation, Texas, Revenue Bonds, Sid Peterson Memorial Hospital Project, Series 2005, 5.375%, 8/15/35 | 2/16 at 100.00 | | BBB– | | | 2,554,131 | |
| | 6,080 | | Laredo Independent School District, Webb County, Texas, General Obligation Bonds, Series 2006, 5.000%, 8/01/29 | 8/16 at 100.00 | | AAA | | | 6,528,582 | |
| | 9,345 | | Leander Independent School District, Williamson and Travis Counties, Texas, General Obligation Bonds, Series 2005, 0.000%, 8/15/34 – FGIC Insured | 8/15 at 35.34 | | AA– | | | 3,100,671 | |
| | 1,100 | | Leander Independent School District, Williamson and Travis Counties, Texas, General Obligation Bonds, Series 2007, 0.000%, 8/15/14 | No Opt. Call | | AAA | | | 1,097,646 | |
| | 13,510 | | Leander Independent School District, Williamson and Travis Counties, Texas, General Obligation Bonds, Series 2008, 0.000%, 8/15/39 | 8/17 at 27.35 | | AAA | | | 3,230,646 | |
| | 3,520 | | Marble Falls Independent School District, Burnet County, Texas, General Obligation Bonds, Series 2007, 5.000%, 8/15/34 | 8/16 at 100.00 | | Aaa | | | 3,767,738 | |
| | | | North Texas Tollway Authority, First Tier System Revenue Refunding Bonds, Capital Appreciation Series 2008I: | | | | | | | |
| | 2,555 | | 0.000%, 1/01/42 – AGC Insured | 1/25 at 100.00 | | AA– | | | 2,699,306 | |
| | 7,000 | | 0.000%, 1/01/43 | 1/25 at 100.00 | | A2 | | | 7,353,150 | |
| | 8,235 | | Texas Municipal Gas Acquisition and Supply Corporation III, Gas Supply Revenue Bonds, Series 2012, 5.000%, 12/15/29 | No Opt. Call | | A3 | | | 8,127,698 | |
| | 2,500 | | Texas Transportation Commission, Central Texas Turnpike System Revenue Bonds, First Tier Refunding Series 2012A, 5.000%, 8/15/41 | 8/22 at 100.00 | | A– | | | 2,492,350 | |
| | 3,600 | | Texas Turnpike Authority, Central Texas Turnpike System Revenue Bonds, First Tier Series 2002A, 0.000%, 8/15/25 – AMBAC Insured | No Opt. Call | | A– | | | 2,054,844 | |
| | 3,000 | | Wylie Independent School District, Collin County, Texas, General Obligation Bonds, Series 2005, 0.000%, 8/15/21 (Pre-refunded 8/15/15) | 8/15 at 74.57 | | AAA | | | 2,217,300 | |
| | 103,125 | | Total Texas | | | | | | 85,106,126 | |
| | | | Utah – 0.5% (0.3% of Total Investments) | | | | | | | |
| | 3,000 | | Riverton, Utah, Hospital Revenue Bonds, IHC Health Services, Inc., Series 2009, 5.000%, 8/15/41 | 8/19 at 100.00 | | AA+ | | | 3,044,940 | |
| | Principal | | | Optional Call | | | | | | |
| | Amount (000) | | Description (1) | Provisions (2) | | Ratings (3) | | | Value | |
| | | | Virgin Islands – 0.3% (0.2% of Total Investments) | | | | | | | |
| $ | 1,480 | | Virgin Islands Public Finance Authority, Matching Fund Revenue Loan Note – Diageo Project, Series 2009A, 6.750%, 10/01/37 | 10/19 at 100.00 | | BBB | | $ | 1,615,272 | |
| | | | Virginia – 1.2% (0.8% of Total Investments) | | | | | | | |
| | 1,200 | | Henrico County Economic Development Authority, Virginia, Revenue Bonds, Bon Secours Health System Obligated Group, Series 2013, 5.000%, 11/01/30 | No Opt. Call | | A– | | | 1,237,284 | |
| | 1,085 | | Route 460 Funding Corporation, Virginia, Toll Road Revenue Bonds, Series 2012B, 0.000%, 7/01/34 | No Opt. Call | | BBB– | | | 297,789 | |
| | 2,855 | | Tobacco Settlement Financing Corporation of Virginia, Tobacco Settlement Asset-Backed Bonds, Series 2007B2, 5.200%, 6/01/46 | 6/17 at 100.00 | | B2 | | | 1,897,918 | |
| | 3,810 | | Virginia Small Business Financing Authority, Senior Lien Revenue Bonds, Elizabeth River Crossing, Opco LLC Project, Series 2012, 5.500%, 1/01/42 (Alternative Minimum Tax) | 7/22 at 100.00 | | BBB– | | | 3,812,286 | |
| | 8,950 | | Total Virginia | | | | | | 7,245,277 | |
| | | | Washington – 1.1% (0.7% of Total Investments) | | | | | | | |
| | 1,260 | | Central Puget Sound Regional Transit Authority, Washington, Sales Tax and Motor Vehicle Excise Tax Bonds, Series 1999, 4.750%, 2/01/28 – FGIC Insured | 2/14 at 100.00 | | AAA | | | 1,275,624 | |
| | 2,485 | | Grant County Public Utility District 2, Washington, Revenue Bonds, Wanapum Hydroelectric Development, Series 2006B, 5.000%, 1/01/32 – NPFG Insured | 1/17 at 100.00 | | AA | | | 2,589,862 | |
| | 2,000 | | Washington State Health Care Facilities Authority, Revenue Bonds, Fred Hutchinson Cancer Research Center, Series 2009A, 6.000%, 1/01/33 | 7/19 at 100.00 | | A | | | 2,089,960 | |
| | 1,410 | | Washington State, Motor Vehicle Fuel Tax General Obligation Bonds, Series 2003F, 0.000%, 12/01/24 – NPFG Insured | No Opt. Call | | AA+ | | | 971,067 | |
| | 7,155 | | Total Washington | | | | | | 6,926,513 | |
| | | | Wisconsin – 0.7% (0.5% of Total Investments) | | | | | | | |
| | 566 | | Green Bay, Wisconsin, Water System Revenue Bonds, Series 2004, 5.000%, 11/01/29 – AGM Insured | 11/14 at 100.00 | | Aa2 | | | 580,933 | |
| | 3,000 | | Southeast Wisconsin Professional Baseball Park District, Sales Tax Revenue Refunding Bonds, Series 1998A, 5.500%, 12/15/19 – NPFG Insured (ETM) | No Opt. Call | | AA– (4) | | | 3,672,930 | |
| | 3,566 | | Total Wisconsin | | | | | | 4,253,863 | |
| $ | 1,103,249 | | Total Municipal Bonds (cost $920,866,384) | | | | | | 927,346,109 | |
| NMA | Nuveen Municipal Advantage Fund, Inc. (continued) |
| | Portfolio of Investments October 31, 2013 |
| | Principal | | | | | | | | | | |
| | Amount (000) | | Description (1) | Coupon | Maturity | | Ratings (3) | | | Value | |
| | | | Corporate Bonds – 0.0% (0.0% of Total Investments) | | | | | | | | |
| | | | Transportation – 0.0% (0.0% of Total Investments) | | | | | | | | |
| $ | 212 | | Las Vegas Monorail Company, Senior Interest Bonds (7), (8) | 5.500% | 7/15/19 | | N/R | | $ | 38,233 | |
| | 60 | | Las Vegas Monorail Company, Senior Interest Bonds (7), (8) | 3.000% | 7/15/55 | | N/R | | | 8,089 | |
| $ | 272 | | Total Corporate Bonds (cost $10,803) | | | | | | | 46,322 | |
| | | | Total Long-Term Investments – (cost $920,877,187) | | | | | | | 927,392,431 | |
| | | | Floating Rate Obligations – (7.4)% | | | | | | | (45,488,333 | ) |
| | | | Variable Rate Demand Preferred Shares, at Liquidation Value – (48.4)% (9) | | | | | | | (296,800,000 | ) |
| | | | Other Assets Less Liabilities – (4.6)% | | | | | | | 28,287,405 | |
| | | | Net Assets Applicable to Common Shares – 100% | | | | | | $ | 613,391,503 | |
| (1) | All percentages shown in the Portfolio of Investments are based on net assets applicable to Common shares unless otherwise noted. |
| (2) | Optional Call Provisions (not covered by the report of independent registered public accounting firm): Dates (month and year) and prices of the earliest optional call or redemption. There may be other call provisions at varying prices at later dates. Certain mortgage-backed securities may be subject to periodic principal paydowns. |
| (3) | Ratings (not covered by the report of independent registered public accounting firm): Using the highest of Standard & Poor’s Group (“Standard & Poor’s”), Moody’s Investors Service, Inc. (“Moody’s”) or Fitch, Inc. (“Fitch”) rating. Ratings below BBB by Standard & Poor’s, Baa by Moody’s or BBB by Fitch are considered to be below investment grade. Holdings designated N/R are not rated by any of these national rating agencies. |
| (4) | Backed by an escrow or trust containing sufficient U.S. Government or U.S. Government agency securities, which ensure the timely payment of principal and interest. Certain bonds backed by U.S. Government or agency securities are regarded as having an implied rating equal to the rating of such securities. |
| (5) | At or subsequent to the end of the reporting period, this security is non-income producing. Non-income producing security, in the case of a fixed-income security, generally denotes that the issuer has (1) defaulted on the payment of principal or interest, (2) is under the protection of the Federal Bankruptcy Court or (3) the Fund’s Adviser has concluded that the issue is not likely to meet its future interest payment obligations and has directed the Fund’s custodian to cease accruing additional income on the Fund’s records. |
| (6) | Investment, or portion of investment, has been pledged to collateralize the net payment obligations for investments in inverse floating rate transactions. |
| (7) | Investment valued at fair value using methods determined in good faith by, or at the discretion of, the Board of Directors. For fair value measurement disclosure purposes, investment categorized as Level 3. See Notes to Financial Statements, Note 2 – Investment Valuation and Fair Value Measurements for more information. |
| (8) | During January 2010, Las Vegas Monorail Company (“Las Vegas Monorail”) filed for federal bankruptcy protection. During March 2012, Las Vegas Monorail emerged from federal bankruptcy with the acceptance of a reorganization plan assigned by the Federal Bankruptcy Court. Under the reorganization plan, the Fund surrendered its Las Vegas Monorail Project Revenue Bonds, First Tier, Series 2000 and in turn received two senior interest corporate bonds: the first with an annual coupon rate of 5.500% maturing on July 15, 2019 and the second with an annual coupon rate of 3.000% (5.500% after December 31, 2015) maturing on July 15, 2055. The Fund’s custodian is not accruing income on the Fund’s records for either senior interest corporate bond. |
| (9) | Variable Rate Demand Preferred Shares, at Liquidation Value as a percentage of Total Investments is 32.0%. |
| WI/DD | Purchased on a when-issued or delayed delivery basis. |
| (ETM) | Escrowed to maturity. |
| (IF) | Inverse floating rate investment. |
| (UB) | Underlying bond of an inverse floating rate trust reflected as a financing transaction. See Notes to Financial Statements, Note 3 – Portfolio Securities and Investments in Derivatives, Inverse Floating Rate Securities for more information. |
See accompanying notes to financial statements.
| NMO | |
| | Nuveen Municipal Market Opportunity Fund, Inc. |
| | Portfolio of Investments |
| | October 31, 2013 |
| | Principal | | | Optional Call | | | | | | |
| | Amount (000) | | Description (1) | Provisions (2) | | Ratings (3) | | | Value | |
| | | | LONG-TERM INVESTMENTS – 157.2% (100.0% of Total Investments) | | | | | | | |
| | | | MUNICIPAL BONDS – 157.2% (100.0% of Total Investments) | | | | | | | |
| | | | Alabama – 0.8% (0.5% of Total Investments) | | | | | | | |
| | | | Henry County Water Authority, Alabama, Water Revenue Bonds, Series 2006: | | | | | | | |
| $ | 1,720 | | 5.000%, 1/01/36 (Pre-refunded 1/01/16) – RAAI Insured | 1/16 at 100.00 | | N/R (4) | | $ | 1,887,562 | |
| | 2,215 | | 5.000%, 1/01/41 (Pre-refunded 1/01/16) – RAAI Insured | 1/16 at 100.00 | | N/R (4) | | | 2,430,785 | |
| | | | Henry County Water Authority, Alabama, Water Revenue Bonds, Series 2006: | | | | | | | |
| | 215 | | 5.000%, 1/01/36 – RAAI Insured | 1/16 at 100.00 | | N/R | | | 204,213 | |
| | 270 | | 5.000%, 1/01/41 – RAAI Insured | 1/16 at 100.00 | | N/R | | | 249,982 | |
| | 4,420 | | Total Alabama | | | | | | 4,772,542 | |
| | | | Alaska – 3.0% (1.9% of Total Investments) | | | | | | | |
| | | | Alaska Housing Finance Corporation, General Housing Purpose Bonds, Series 2005A: | | | | | | | |
| | 1,125 | | 5.250%, 12/01/34 – FGIC Insured (UB) | 12/14 at 100.00 | | AA+ | | | 1,164,150 | |
| | 1,275 | | 5.250%, 12/01/41 – FGIC Insured (UB) | 12/14 at 100.00 | | AA+ | | | 1,318,261 | |
| | 7,000 | | Alaska Housing Finance Corporation, General Housing Purpose Bonds, Series 2005B-2, 5.250%, 12/01/30 – NPFG Insured | 6/15 at 100.00 | | AA+ | | | 7,473,130 | |
| | 13,025 | | Northern Tobacco Securitization Corporation, Alaska, Tobacco Settlement Asset-Backed Bonds, Series 2006A, 5.000%, 6/01/46 | 6/14 at 100.00 | | B2 | | | 9,018,250 | |
| | 22,425 | | Total Alaska | | | | | | 18,973,791 | |
| | | | Arizona – 0.9% (0.6% of Total Investments) | | | | | | | |
| | 3,000 | | Phoenix Civic Improvement Corporation, Arizona, Junior Lien Airport Revenue Bonds, Series 2010A, 5.000%, 7/01/40 | 7/20 at 100.00 | | A+ | | | 3,031,980 | |
| | 2,500 | | Phoenix Civic Improvement Corporation, Arizona, Subordinate Excise Tax Revenue Bonds, Civic Plaza Expansion Project, Series 2005A, 5.000%, 7/01/35 – FGIC Insured | No Opt. Call | | AA | | | 2,571,175 | |
| | 5,500 | | Total Arizona | | | | | | 5,603,155 | |
| | | | California – 24.2% (15.4% of Total Investments) | | | | | | | |
| | 3,450 | | Antelope Valley Union High School District, Los Angeles County, California, General Obligation Bonds, Series 2004B, 0.000%, 8/01/29 – NPFG Insured | No Opt. Call | | Aa3 | | | 1,532,318 | |
| | | | Bay Area Toll Authority, California, Revenue Bonds, San Francisco Bay Area Toll Bridge, Series 2009F-1: | | | | | | | |
| | 2,500 | | 5.125%, 4/01/39 | 4/19 at 100.00 | | AA | | | 2,648,775 | |
| | 2,500 | | 5.625%, 4/01/44 | 4/19 at 100.00 | | AA | | | 2,690,950 | |
| | 8,000 | | Beverly Hills Unified School District, Los Angeles County, California, General Obligation Bonds, Series 2009, 0.000%, 8/01/33 | No Opt. Call | | Aa1 | | | 3,010,640 | |
| | 7,845 | | California County Tobacco Securitization Agency, Tobacco Settlement Asset-Backed Bonds, Los Angeles County Securitization Corporation, Series 2006A, 5.600%, 6/01/36 | 12/18 at 100.00 | | BB– | | | 6,568,462 | |
| | 5,000 | | California Department of Water Resources, Central Valley Project Water System Revenue Bonds, Series 2009-AF, 5.000%, 12/01/29 | 12/18 at 100.00 | | AAA | | | 5,459,200 | |
| | 1,350 | | California Educational Facilities Authority, Revenue Refunding Bonds, Loyola Marymount University, Series 2001A, 0.000%, 10/01/39 – NPFG Insured | No Opt. Call | | A2 | | | 305,222 | |
| | 2,000 | | California State, General Obligation Bonds, Series 2004, 5.000%, 6/01/31 – AMBAC Insured | 12/14 at 100.00 | | AA+ | | | 2,064,620 | |
| | | | California State, General Obligation Bonds, Various Purpose Series 2010: | | | | | | | |
| | 7,000 | | 5.250%, 3/01/30 | 3/20 at 100.00 | | A1 | | | 7,648,550 | |
| | 4,250 | | 5.250%, 11/01/40 | 11/20 at 100.00 | | A1 | | | 4,442,185 | |
| | 25,000 | | California State, Various Purpose General Obligation Bonds, Series 2005, 4.750%, 3/01/35 – NPFG Insured (UB) | 3/16 at 100.00 | | A1 | | | 25,130,000 | |
| | 2,500 | | California Statewide Communities Development Authority, Revenue Bonds, Cottage Health System Obligated Group, Series 2010, 5.250%, 11/01/30 | 11/20 at 100.00 | | AA– | | | 2,627,600 | |
| NMO | Nuveen Municipal Market Opportunity Fund, Inc. (continued) |
| | Portfolio of Investments October 31, 2013 |
| | Principal | | | Optional Call | | | | | | |
| | Amount (000) | | Description (1) | Provisions (2) | | Ratings (3) | | | Value | |
| | | | California (continued) | | | | | | | |
| $ | 9,000 | | California Statewide Community Development Authority, Revenue Bonds, Kaiser Permanente System, Series 2006, 5.250%, 3/01/45 | 3/16 at 100.00 | | A+ | | $ | 9,072,990 | |
| | 1,550 | | California Statewide Community Development Authority, Revenue Bonds, St. Joseph Health System, Series 2007A, 5.750%, 7/01/47 – FGIC Insured | 7/18 at 100.00 | | AA– | | | 1,707,635 | |
| | 10,445 | | Castaic Lake Water Agency, California, Certificates of Participation, Water System Improvement Project, Series 1999, 0.000%, 8/01/29 – AMBAC Insured | No Opt. Call | | AA | | | 4,769,083 | |
| | | | Golden State Tobacco Securitization Corporation, California, Enhanced Tobacco Settlement Asset-Backed Revenue Bonds, Series 2005A: | | | | | | | |
| | 3,500 | | 0.000%, 6/01/26 – AGM Insured | No Opt. Call | | AA– | | | 2,070,740 | |
| | 3,485 | | 5.000%, 6/01/45 | 6/15 at 100.00 | | A2 | | | 3,366,824 | |
| | | | Golden State Tobacco Securitization Corporation, California, Tobacco Settlement Asset-Backed Bonds, Series 2007A-1: | | | | | | | |
| | 6,800 | | 4.500%, 6/01/27 | 6/17 at 100.00 | | B | | | 5,815,904 | |
| | 1,000 | | 5.125%, 6/01/47 | 6/17 at 100.00 | | B | | | 700,870 | |
| | 2,500 | | Huntington Beach Union High School District, Orange County, California, General Obligation Bonds, Series 2007, 0.000%, 8/01/32 – FGIC Insured | No Opt. Call | | Aa2 | | | 927,300 | |
| | 1,500 | | Lincoln Unified School District, Placer County, California, Community Facilities District 1, Special Tax Bonds, Series 2005, 0.000%, 9/01/26 – AMBAC Insured | No Opt. Call | | N/R | | | 712,875 | |
| | 3,500 | | Los Angeles County Sanitation Districts Financing Authority, California, Capital Projects Revenue Bonds, District 14, Series 2005, 5.000%, 10/01/34 – FGIC Insured | 10/15 at 100.00 | | AA– | | | 3,611,965 | |
| | 490 | | Los Angeles Department of Water and Power, California, Electric Plant Revenue Bonds, Second Series 1993, 4.750%, 10/15/20 (ETM) | 4/14 at 100.00 | | N/R (4) | | | 491,847 | |
| | 995 | | Los Angeles Department of Water and Power, California, Electric Plant Revenue Bonds, Series 1994, 5.375%, 2/15/34 (ETM) | 2/14 at 100.00 | | N/R (4) | | | 999,318 | |
| | 2,500 | | Los Angeles Department of Water and Power, California, Power System Revenue Bonds, Series 2005A-2, 5.000%, 7/01/22 – AGM Insured | 7/15 at 100.00 | | AA– | | | 2,686,500 | |
| | 1,160 | | Mount San Antonio Community College District, Los Angeles County, California, General Obligation Bonds, Election of 2008, Series 2013A, 0.000%, 8/01/43 | 8/35 at 100.00 | | AA | | | 554,028 | |
| | 2,200 | | M-S-R Energy Authority, California, Gas Revenue Bonds, Citigroup Prepay Contracts, Series 2009B, 6.500%, 11/01/39 | No Opt. Call | | A | | | 2,645,940 | |
| | 14,000 | | New Haven Unified School District, California, General Obligation Bonds, Refunding Series 2009, 0.000%, 8/01/34 – AGC Insured | No Opt. Call | | AA– | | | 4,450,600 | |
| | 2,500 | | Norwalk La Mirada Unified School District, Los Angeles County, California, General Obligation Bonds, Election of 2002 Series 2005B, 0.000%, 8/01/29 | No Opt. Call | | AA– | | | 1,131,000 | |
| | 1,000 | | Pajaro Valley Unified School District, Santa Cruz County, California, General Obligation Bonds, Series 2005B, 0.000%, 8/01/29 – AGM Insured | No Opt. Call | | Aa2 | | | 460,820 | |
| | 5,000 | | Palomar Pomerado Health Care District, California, Certificates of Participation, Series 2010, 6.000%, 11/01/30 | 11/20 at 100.00 | | Baa3 | | | 5,028,350 | |
| | | | Palomar Pomerado Health, California, General Obligation Bonds, Election of 2004, Series 2007A: | | | | | | | |
| | 2,000 | | 0.000%, 8/01/24 – NPFG Insured | No Opt. Call | | A+ | | | 1,255,740 | |
| | 4,795 | | 5.000%, 8/01/32 – NPFG Insured | 8/17 at 100.00 | | A+ | | | 4,874,885 | |
| | 2,500 | | Redding, California, Electric System Revenue Certificates of Participation, Series 2005, 5.000%, 6/01/30 – FGIC Insured | 6/15 at 100.00 | | A | | | 2,518,600 | |
| | 3,205 | | San Diego Community College District, California, General Obligation Bonds, Series 2005, 5.000%, 5/01/25 (Pre-refunded 5/01/15) – AGM Insured | 5/15 at 100.00 | | AA+ (4) | | | 3,433,869 | |
| | | | San Joaquin Hills Transportation Corridor Agency, Orange County, California, Toll Road Revenue Refunding Bonds, Series 1997A: | | | | | | | |
| | 5,000 | | 5.650%, 1/15/17 – NPFG Insured | 1/14 at 102.00 | | A | | | 5,109,800 | |
| | 26,000 | | 0.000%, 1/15/35 – NPFG Insured | No Opt. Call | | A | | | 6,724,640 | |
| | 5,000 | | San Jose-Evergreen Community College District, Santa Clara County, California, General Obligation Bonds, Series 2005A, 0.000%, 9/01/28 – NPFG Insured | 9/15 at 100.00 | | Aa1 | | | 2,347,300 | |
| | Principal | | | Optional Call | | | | | | |
| | Amount (000) | | Description (1) | Provisions (2) | | Ratings (3) | | | Value | |
| | | | California (continued) | | | | | | | |
| $ | 7,345 | | Sanger Unified School District, Fresno County, California, General Obligation Bonds, Series 2006A, 5.000%, 8/01/27 – AGM Insured | 8/16 at 102.00 | | AA– | | $ | 7,762,637 | |
| | 4,825 | | Santa Monica Community College District, Los Angeles County, California, General Obligation Bonds, Series 2005C, 0.000%, 8/01/25 (Pre-refunded 8/01/15) – NPFG Insured | 8/15 at 61.27 | | AA (4) | | | 2,932,394 | |
| | 205,190 | | Total California | | | | | | 152,292,976 | |
| | | | Colorado – 8.6% (5.5% of Total Investments) | | | | | | | |
| | 1,085 | | Arkansas River Power Authority, Colorado, Power Revenue Bonds, Series 2006, 5.250%, 10/01/40 – SYNCORA GTY Insured | 10/16 at 100.00 | | BBB– | | | 1,006,913 | |
| | 3,000 | | Colorado Department of Transportation, Revenue Anticipation Bonds, Series 2003A, 5.250%, 12/15/15 (Pre-refunded 12/15/13) – AMBAC Insured | 12/13 at 100.00 | | AA (4) | | | 3,018,810 | |
| | 11,200 | | Colorado Health Facilities Authority, Colorado, Revenue Bonds, Sisters of Charity of Leavenworth Health Services Corporation, Series 2010A, 5.000%, 1/01/40 | 1/20 at 100.00 | | AA– | | | 11,264,176 | |
| | 3,250 | | Colorado Health Facilities Authority, Colorado, Revenue Bonds, Yampa Valley Medical Center, Series 2007, 5.125%, 9/15/29 | 9/17 at 100.00 | | BBB+ | | | 3,271,320 | |
| | | | E-470 Public Highway Authority, Colorado, Senior Revenue Bonds, Series 2000B: | | | | | | | |
| | 6,200 | | 0.000%, 9/01/22 – NPFG Insured | No Opt. Call | | A | | | 4,302,118 | |
| | 9,945 | | 0.000%, 9/01/30 – NPFG Insured | No Opt. Call | | A | | | 3,899,335 | |
| | 16,060 | | 0.000%, 9/01/33 – NPFG Insured | No Opt. Call | | A | | | 5,107,883 | |
| | | | E-470 Public Highway Authority, Colorado, Toll Revenue Bonds, Series 2004B: | | | | | | | |
| | 3,800 | | 0.000%, 9/01/27 – NPFG Insured | 9/20 at 67.94 | | A | | | 1,810,472 | |
| | 13,300 | | 0.000%, 9/01/31 – NPFG Insured | 9/20 at 53.77 | | A | | | 4,871,125 | |
| | 6,250 | | 0.000%, 9/01/32 – NPFG Insured | 9/20 at 50.83 | | A | | | 2,148,875 | |
| | 10,000 | | 0.000%, 3/01/36 – NPFG Insured | 9/20 at 41.72 | | A | | | 2,693,800 | |
| | 10,000 | | Regional Transportation District, Colorado, Denver Transit Partners Eagle P3 Project Private Activity Bonds, Series 2010, 6.500%, 1/15/30 | 7/20 at 100.00 | | Baa3 | | | 10,892,200 | |
| | 94,090 | | Total Colorado | | | | | | 54,287,027 | |
| | | | District of Columbia – 1.6% (1.0% of Total Investments) | | | | | | | |
| | 10,000 | | Washington Convention Center Authority, District of Columbia, Dedicated Tax Revenue Bonds, Senior Lien Refunding Series 2007A, 4.500%, 10/01/30 – AMBAC Insured | 10/16 at 100.00 | | A1 | | | 9,917,800 | |
| | | | Florida – 6.4% (4.0% of Total Investments) | | | | | | | |
| | 1,275 | | Alachua County Health Facilities Authority, Florida, Revenue Bonds, Shands Teaching Hospital and Clinics Inc., Series 1996A, 6.250%, 12/01/16 – NPFG Insured | No Opt. Call | | A | | | 1,356,932 | |
| | 2,080 | | Brevard County School Board, Florida, Certificates of Participation, Series 2007C, 5.000%, 7/01/21 – AMBAC Insured | 7/17 at 100.00 | | Aa3 | | | 2,351,960 | |
| | 5,300 | | Broward County, Florida, General Obligation Bonds, Series 2004, 5.000%, 1/01/20 (Pre-refunded 1/01/14) | 1/14 at 100.00 | | Aaa | | | 5,342,930 | |
| | 2,650 | | Florida Housing Finance Corporation, Homeowner Mortgage Revenue Bonds, Series 2008, Trust 1191, 8.705%, 1/01/27 (Alternative Minimum Tax) (IF) | 1/17 at 100.00 | | AA+ | | | 2,806,297 | |
| | 2,500 | | Miami-Dade County, Florida, Aviation Revenue Bonds, Miami International Airport, Series 2010A-1, 5.375%, 10/01/41 | 10/20 at 100.00 | | A | | | 2,588,125 | |
| | 3,000 | | Miami-Dade County, Florida, Aviation Revenue Bonds, Miami International Airport, Series 2010B, 5.000%, 10/01/26 | 10/20 at 100.00 | | A | | | 3,216,120 | |
| | 2,410 | | Miami-Dade County, Florida, General Obligation Bonds, Parks Program, Series 2005, 4.300%, 11/01/30 – NPFG Insured | 11/15 at 100.00 | | Aa2 | | | 2,404,240 | |
| | 2,425 | | Miami-Dade County, Florida, Public Facilities Revenue Bonds, Jackson Health System, Series 2005B, 5.000%, 6/01/22 – NPFG Insured | 6/15 at 100.00 | | Aa3 | | | 2,500,515 | |
| | 2,000 | | Orange County School Board, Florida, Certificates of Participation, Series 2004A, 5.000%, 8/01/29 – AMBAC Insured | 8/14 at 100.00 | | Aa2 | | | 2,040,000 | |
| | 2,400 | | Orange County School Board, Florida, Certificates of Participation, Series 2005B, 5.000%, 8/01/25 – AMBAC Insured | 8/15 at 100.00 | | Aa2 | | | 2,562,072 | |
| NMO | Nuveen Municipal Market Opportunity Fund, Inc. (continued) |
| | Portfolio of Investments October 31, 2013 |
| | Principal | | | Optional Call | | | | | | |
| | Amount (000) | | Description (1) | Provisions (2) | | Ratings (3) | | | Value | |
| | | | Florida (continued) | | | | | | | |
| $ | 5,085 | | Orange County, Florida, Tourist Development Tax Revenue Bonds, Refunding Series 2007, 4.750%, 10/01/29 – FGIC Insured | No Opt. Call | | AA– | | $ | 5,164,326 | |
| | 4,000 | | Orlando, Florida, Tourist Development Tax Revenue Bonds, Senior Lien 6th Cent Contract Payments, Series 2008A, 5.250%, 11/01/23 – AGC Insured | 11/17 at 100.00 | | AA– | | | 4,215,840 | |
| | 3,500 | | South Miami Health Facilities Authority, Florida, Hospital Revenue, Baptist Health System Obligation Group, Series 2007, 5.000%, 8/15/37 | 8/17 at 100.00 | | AA | | | 3,494,890 | |
| | 38,625 | | Total Florida | | | | | | 40,044,247 | |
| | | | Georgia – 1.6% (1.0% of Total Investments) | | | | | | | |
| | 10,000 | | Gainesville and Hall County Hospital Authority, Georgia, Revenue Anticipation Certificates, Northeast Georgia Health Services Inc., Series 2010B, 5.250%, 2/15/45 | 2/41 at 100.00 | | AA– | | | 10,105,800 | |
| | | | Guam – 0.0% (0.0% of Total Investments) | | | | | | | |
| | 165 | | Guam International Airport Authority, Revenue Bonds, Series 2013C, 6.375%, 10/01/43 (Alternative Minimum Tax) | 10/23 at 100.00 | | BBB | | | 171,438 | |
| | | | Illinois – 17.3% (11.0% of Total Investments) | | | | | | | |
| | 4,595 | | Bolingbrook, Illinois, General Obligation Refunding Bonds, Series 2002B, 0.000%, 1/01/32 – FGIC Insured | No Opt. Call | | Aa3 | | | 1,696,704 | |
| | 1,470 | | Chicago Board of Education, Cook County, Illinois, General Obligation Bonds, Dedicated Revenues Series 2011A, 5.000%, 12/01/41 | 12/21 at 100.00 | | A+ | | | 1,345,829 | |
| | | | Chicago Board of Education, Illinois, Unlimited Tax General Obligation Bonds, Dedicated Tax Revenues, Series 1999A: | | | | | | | |
| | 4,600 | | 0.000%, 12/01/20 – FGIC Insured | No Opt. Call | | A+ | | | 3,352,940 | |
| | 1,000 | | 5.500%, 12/01/26 – FGIC Insured | No Opt. Call | | A+ | | | 1,038,040 | |
| | 4,000 | | Chicago, Illinois, Motor Fuel Tax Revenue Bonds, Series 2003A, 5.000%, 1/01/33 – AMBAC Insured | 1/14 at 100.00 | | AA+ | | | 4,001,080 | |
| | 5,050 | | Chicago, Illinois, Motor Fuel Tax Revenue Bonds, Series 2008A, 5.000%, 1/01/38 – AGC Insured | 1/18 at 100.00 | | AA+ | | | 4,871,180 | |
| | 510 | | Chicago, Illinois, Motor Fuel Tax Revenue Refunding Bonds, Series 1993, 5.375%, 1/01/14 – AMBAC Insured | No Opt. Call | | AA+ | | | 514,243 | |
| | 5,250 | | Chicago, Illinois, Revenue Bonds, Midway Airport, Series 1998B, 5.000%, 1/01/28 – NPFG Insured | 1/14 at 100.00 | | A | | | 5,262,758 | |
| | 2,000 | | Chicago, Illinois, Third Lien General Airport Revenue Bonds, O’Hare International Airport, Series 2003C-2, 5.250%, 1/01/30 – AGM Insured (Alternative Minimum Tax) | 1/14 at 100.00 | | AA– | | | 2,001,460 | |
| | 2,355 | | Chicago, Illinois, Third Lien General Airport Revenue Bonds, O’Hare International Airport, Series 2005A, 5.250%, 1/01/26 – NPFG Insured | 1/16 at 100.00 | | A | | | 2,500,939 | |
| | 7,100 | | Cook County, Illinois, General Obligation Bonds, Refunding Series 2010A, 5.250%, 11/15/33 | 11/20 at 100.00 | | AA | | | 7,149,629 | |
| | 3,500 | | Illinois Educational Facilities Authority, Revenue Bonds, Northwestern University, Series 2003, 5.000%, 12/01/33 (Pre-refunded 12/01/13) | 12/13 at 100.00 | | AAA | | | 3,514,245 | |
| | 10,000 | | Illinois Finance Authority, Illinois, Northwestern University, Revenue Bonds, Series 2006, 5.000%, 12/01/42 (UB) | 12/15 at 100.00 | | AAA | | | 10,524,200 | |
| | 1,750 | | Illinois Finance Authority, Revenue Bonds, Hospital Sisters Services Inc., Series 2007, 5.000%, 3/15/26 | No Opt. Call | | AA– | | | 1,877,978 | |
| | 3,000 | | Illinois Finance Authority, Revenue Bonds, Memorial Health System, Series 2009, 5.500%, 4/01/34 | 4/19 at 100.00 | | A+ | | | 3,095,370 | |
| | 5,390 | | Illinois Finance Authority, Revenue Bonds, OSF Healthcare System, Refunding Series 2010A, 6.000%, 5/15/39 | 5/20 at 100.00 | | A | | | 5,838,718 | |
| | 1,970 | | Illinois Finance Authority, Revenue Bonds, OSF Healthcare System, Series 2007A, 5.750%, 11/15/37 | 11/17 at 100.00 | | A | | | 2,041,944 | |
| | 2,000 | | Illinois Finance Authority, Revenue Bonds, Provena Health, Series 2009A, 7.750%, 8/15/34 | 8/19 at 100.00 | | BBB+ | | | 2,424,140 | |
| | 3,200 | | Illinois Finance Authority, Revenue Bonds, Resurrection Health Care System, Series 1999B, 5.000%, 5/15/24 – AGM Insured | 5/18 at 100.00 | | A2 | | | 3,387,776 | |
| | 5,550 | | Illinois Finance Authority, Revenue Refunding Bonds, Silver Cross Hospital and Medical Centers, Series 2008A, 5.500%, 8/15/30 | 8/18 at 100.00 | | BBB+ | | | 5,674,709 | |
| | 2,795 | | Illinois Toll Highway Authority, Toll Highway Revenue Bonds, Senior Lien Series 2013A, 5.000%, 1/01/38 | 1/23 at 100.00 | | AA– | | | 2,807,046 | |
| | Principal | | | Optional Call | | | | | | |
| | Amount (000) | | Description (1) | Provisions (2) | | Ratings (3) | | | Value | |
| | | | Illinois (continued) | | | | | | | |
| | | | Lake and McHenry Counties Community Unit School District 118, Wauconda, Illinois, General Obligation Bonds, Series 2005B: | | | | | | | |
| $ | 10,230 | | 0.000%, 1/01/22 – AGM Insured | 1/15 at 70.63 | | A1 | | $ | 6,911,183 | |
| | 6,780 | | 0.000%, 1/01/24 – AGM Insured | 1/15 at 63.44 | | A1 | | | 4,092,069 | |
| | 2,330 | | Metropolitan Pier and Exposition Authority, Illinois, Revenue Bonds, McCormick Place Expansion Project, Refunding Series 2010B-2, 5.000%, 6/15/50 | 6/20 at 100.00 | | AAA | | | 2,250,221 | |
| | | | Metropolitan Pier and Exposition Authority, Illinois, Revenue Bonds, McCormick Place Expansion Project, Series 2002A: | | | | | | | |
| | 6,500 | | 0.000%, 6/15/25 – NPFG Insured | 6/22 at 101.00 | | AAA | | | 5,936,125 | |
| | 3,700 | | 0.000%, 6/15/30 – NPFG Insured | No Opt. Call | | AAA | | | 1,470,232 | |
| | 3,280 | | 0.000%, 6/15/37 – NPFG Insured | No Opt. Call | | AAA | | | 824,822 | |
| | 11,715 | | 0.000%, 12/15/38 – NPFG Insured | No Opt. Call | | AAA | | | 2,692,107 | |
| | 2,080 | | Midlothian, Illinois, General Obligation Bonds, Series 2010A, 5.250%, 2/01/34 | 2/20 at 100.00 | | AA– | | | 2,140,050 | |
| | 3,000 | | Springfield, Illinois, Electric Revenue Bonds, Senior Lien Series 2007, 5.000%, 3/01/22 – NPFG Insured | 3/17 at 100.00 | | A | | | 3,122,070 | |
| | 2,685 | | Sterling, Whiteside County, Illinois, General Obligation Bonds, Recovery Zone Facility Series 2010A, 5.250%, 5/01/31 – AGM Insured | 5/20 at 100.00 | | AA– | | | 2,802,012 | |
| | 2,000 | | University of Illinois, Health Services Facilities System Revenue Bonds, Series 2013, 6.250%, 10/01/38 | 10/23 at 100.00 | | A | | | 2,105,560 | |
| | 131,385 | | Total Illinois | | | | | | 109,267,379 | |
| | | | Indiana – 3.3% (2.1% of Total Investments) | | | | | | | |
| | 4,030 | | Indiana Finance Authority Health System Revenue Bonds, Sisters of St. Francis Health Services, Inc. Obligated Group, Series 2009, 5.250%, 11/01/39 | 11/19 at 100.00 | | AA | | | 4,119,345 | |
| | 5,000 | | Indiana Finance Authority, Hospital Revenue Bonds, Community Health Network Project, Series 2012A, 4.000%, 5/01/35 | 5/23 at 100.00 | | A | | | 4,313,250 | |
| | 2,050 | | Indiana Finance Authority, Private Activity Bonds, Ohio River Bridges East End Crossing Project, Series 2013A, 5.000%, 7/01/48 (Alternative Minimum Tax) | 7/23 at 100.00 | | BBB | | | 1,819,908 | |
| | 6,000 | | Indiana Finance Authority, Revenue Bonds, Trinity Health Care Group, Refunding Series 2009A, 5.250%, 12/01/38 | 12/19 at 100.00 | | Aa2 | | | 6,231,120 | |
| | 2,500 | | Indiana Municipal Power Agency, Power Supply Revenue Bonds, Series 2007A, 5.000%, 1/01/42 – NPFG Insured | 1/17 at 100.00 | | A+ | | | 2,517,125 | |
| | 1,890 | | New Albany-Floyd County School Building Corporation, Indiana, First Mortgage Bonds, Series 2005, 5.000%, 7/15/26 (Pre-refunded 7/15/15) – AGM Insured | 7/15 at 100.00 | | AA+ (4) | | | 2,041,691 | |
| | 21,470 | | Total Indiana | | | | | | 21,042,439 | |
| | | | Iowa – 1.9% (1.2% of Total Investments) | | | | | | | |
| | 970 | | Iowa Finance Authority, Health Facility Revenue Bonds, Care Initiatives Project, Series 2006A, 5.000%, 7/01/19 | 7/16 at 100.00 | | BB+ | | | 977,634 | |
| | 7,255 | | Iowa Finance Authority, Iowa, Midwestern Disaster Area Revenue Bonds, Iowa Fertilizer Company Project, Series 2013, 5.500%, 12/01/22 | 12/18 at 100.00 | | BB– | | | 6,959,286 | |
| | 5,000 | | Iowa Tobacco Settlement Authority, Tobacco Asset-Backed Revenue Bonds, Series 2005B, 5.600%, 6/01/34 | 6/17 at 100.00 | | B+ | | | 4,194,600 | |
| | 13,225 | | Total Iowa | | | | | | 12,131,520 | |
| | | | Kansas – 1.7% (1.1% of Total Investments) | | | | | | | |
| | 3,000 | | Kansas Development Finance Authority Hospital Revenue Bonds, Adventist Health System/Sunbelt Obligated Group, Series 2012A, 5.000%, 11/15/28 | 5/22 at 100.00 | | AA | | | 3,217,380 | |
| | 4,000 | | Overland Park Development Corporation, Kansas, First Tier Revenue Bonds, Overland Park Convention Center, Series 2007A, 5.125%, 1/01/22 – AMBAC Insured | 1/17 at 100.00 | | BB+ | | | 3,990,480 | |
| | 600 | | Salina, Kansas, Hospital Revenue Bonds, Salina Regional Medical Center, Series 2006, 4.625%, 10/01/31 | 4/16 at 100.00 | | A1 | | | 597,084 | |
| | 4,090 | | Wyandotte County-Kansas City Unified Government, Kansas, Sales Tax Special Obligation Capital Appreciation Revenue Bonds Redevelopment Project Area B – Major Multi-Sport Athletic Complex Project, Subordinate Lien Series 2010B, 0.000%, 6/01/21 | No Opt. Call | | BBB+ | | | 2,730,075 | |
| | 11,690 | | Total Kansas | | | | | | 10,535,019 | |
| NMO | Nuveen Municipal Market Opportunity Fund, Inc. (continued) |
| | Portfolio of Investments October 31, 2013 |
| | Principal | | | Optional Call | | | | | | |
| | Amount (000) | | Description (1) | Provisions (2) | | Ratings (3) | | | Value | |
| | | | Kentucky – 0.2% (0.1% of Total Investments) | | | | | | | |
| $ | 1,000 | | Kentucky Economic Development Finance Authority, Louisville Arena Project Revenue Bonds, Louisville Arena Authority, Inc., Series 2008-A1, 6.000%, 12/01/38 – AGC Insured | 6/18 at 100.00 | | AA– | | $ | 1,000,730 | |
| | | | Louisiana – 0.3% (0.2% of Total Investments) | | | | | | | |
| | 1,635 | | Louisiana Public Facilities Authority, Revenue Bonds, Baton Rouge General Hospital, Series 2004, 5.250%, 7/01/24 (Pre-refunded 7/01/14) – NPFG Insured | 7/14 at 100.00 | | A (4) | | | 1,687,336 | |
| | | | Maryland – 1.1% (0.7% of Total Investments) | | | | | | | |
| | 4,410 | | Maryland Community Development Administration, Department of Housing and Community Development, Residential Revenue Bonds, Series 2007D, 4.900%, 9/01/42 (Alternative Minimum Tax) | 3/17 at 100.00 | | Aa2 | | | 4,329,518 | |
| | 2,500 | | Maryland Department of Transportation, Consolidated Transportation Revenue Bonds, Series 2002, 5.500%, 2/01/16 | No Opt. Call | | AAA | | | 2,788,450 | |
| | 6,910 | | Total Maryland | | | | | | 7,117,968 | |
| | | | Massachusetts – 1.5% (1.0% of Total Investments) | | | | | | | |
| | 2,500 | | Massachusetts Bay Transportation Authority, Assessment Bonds, Series 2004A, 5.000%, 7/01/28 (Pre-refunded 7/01/14) | 7/14 at 100.00 | | AA+ (4) | | | 2,581,350 | |
| | 1,500 | | Massachusetts Development Finance Authority, Revenue Bonds, 100 Cambridge Street Redevelopment, M/SRBC Project, Series 2002A, 5.125%, 2/01/34 – NPFG Insured | 1/14 at 100.00 | | A | | | 1,499,955 | |
| | 2,280 | | Massachusetts School Building Authority, Dedicated Sales Tax Revenue Bonds, Senior Series 2013A, 5.000%, 5/15/43 | 5/23 at 100.00 | | AA+ | | | 2,403,758 | |
| | 120 | | Massachusetts School Building Authority, Dedicated Sales Tax Revenue Bonds, Series 2005A, 5.000%, 8/15/30 | 8/15 at 100.00 | | AA+ | | | 125,405 | |
| | | | Massachusetts School Building Authority, Dedicated Sales Tax Revenue Bonds, Series 2005A: | | | | | | | |
| | 385 | | 5.000%, 8/15/30 (Pre-refunded 8/15/15) – AGM Insured | 8/15 at 100.00 | | Aa2 (4) | | | 417,421 | |
| | 2,495 | | 5.000%, 8/15/30 (Pre-refunded 8/15/15) | 8/15 at 100.00 | | Aa2 (4) | | | 2,705,104 | |
| | 9,280 | | Total Massachusetts | | | | | | 9,732,993 | |
| | | | Michigan – 4.6% (2.9% of Total Investments) | | | | | | | |
| | 1,975 | | Detroit Water and Sewerage Department, Michigan, Sewage Disposal System Revenue Bonds, Refunding Senior Lien Series 2012A, 5.000%, 7/01/32 | 7/22 at 100.00 | | BBB+ | | | 1,796,124 | |
| | 3,000 | | Detroit, Michigan, Distributable State Aid General Obligation Bonds, Limited Tax Series 2010, 4.500%, 11/01/23 | 11/20 at 100.00 | | AA | | | 2,936,880 | |
| | 2,830 | | Detroit, Michigan, Senior Lien Sewerage Disposal System Revenue Bonds, Series 2001B, 5.500%, 7/01/29 – FGIC Insured | No Opt. Call | | A | | | 2,754,496 | |
| | 2,435 | | Detroit, Michigan, Senior Lien Sewerage Disposal System Revenue Bonds, Series 2003A, 5.000%, 7/01/23 – AGM Insured | 1/14 at 100.00 | | AA– | | | 2,380,115 | |
| | 1,000 | | Detroit, Michigan, Water Supply System Senior Lien Revenue Bonds, Series 1997A, 6.000%, 7/01/14 – NPFG Insured | No Opt. Call | | A | | | 1,008,970 | |
| | 725 | | Detroit, Michigan, Water Supply System Senior Lien Revenue Bonds, Series 2004A, 5.250%, 7/01/18 – NPFG Insured | 7/16 at 100.00 | | A | | | 729,009 | |
| | | | Detroit, Michigan, Water Supply System Senior Lien Revenue Refunding Bonds, Series 2006D: | | | | | | | |
| | 4,000 | | 5.000%, 7/01/32 – AGM Insured | 7/16 at 100.00 | | AA– | | | 3,715,240 | |
| | 5,000 | | 4.625%, 7/01/32 – AGM Insured | 7/16 at 100.00 | | AA– | | | 4,431,100 | |
| | 5,000 | | Michigan State Hospital Finance Authority, Hospital Revenue Bonds, Henry Ford Health System, Refunding Series 2009, 5.750%, 11/15/39 | 11/19 at 100.00 | | A | | | 5,121,350 | |
| | 3,050 | | Michigan Tobacco Settlement Finance Authority, Tobacco Settlement Asset-Backed Revenue Bonds, Series 2008A, 6.875%, 6/01/42 | 6/18 at 100.00 | | BB– | | | 2,760,647 | |
| | 1,150 | | Royal Oak Hospital Finance Authority, Michigan, Hospital Revenue Bonds, William Beaumont Hospital, Refunding Series 2009V, 8.250%, 9/01/39 | 9/18 at 100.00 | | A1 | | | 1,385,003 | |
| | 30,165 | | Total Michigan | | | | | | 29,018,934 | |
| | Principal | | | Optional Call | | | | | | |
| | Amount (000) | | Description (1) | Provisions (2) | | Ratings (3) | | | Value | |
| | | | Minnesota – 0.6% (0.4% of Total Investments) | | | | | | | |
| $ | 930 | | Minnesota Agricultural and Economic Development Board, Healthcare System Revenue Bonds, Fairview Hospital and Healthcare Services, Series 2000A, 6.375%, 11/15/29 | 1/14 at 100.00 | | A | | $ | 933,236 | |
| | 2,260 | | St. Paul Housing and Redevelopment Authority, Minnesota, Sales Tax Revenue Refunding Bonds, Civic Center Project, Series 1996, 7.100%, 11/01/23 – AGM Insured | 11/15 at 103.00 | | AA– | | | 2,559,676 | |
| | 3,190 | | Total Minnesota | | | | | | 3,492,912 | |
| | | | Mississippi – 0.9% (0.6% of Total Investments) | | | | | | | |
| | 5,900 | | Mississippi Business Finance Corporation, Pollution Control Revenue Refunding Bonds, System Energy Resources Inc. Project, Series 1998, 5.875%, 4/01/22 | 4/14 at 100.00 | | BBB | | | 5,899,528 | |
| | | | Missouri – 2.9% (1.9% of Total Investments) | | | | | | | |
| | | | Kansas City Municipal Assistance Corporation, Missouri, Leasehold Revenue Bonds, Series 2004B-1: | | | | | | | |
| | 8,150 | | 0.000%, 4/15/27 – AMBAC Insured | No Opt. Call | | AA– | | | 4,391,546 | |
| | 5,000 | | 0.000%, 4/15/31 – AMBAC Insured | No Opt. Call | | AA– | | | 2,097,150 | |
| | 6,930 | | Missouri State Health and Educational Facilities Authority, Health Facilities Revenue Bonds, CoxHealth, Series 2013A, 5.000%, 11/15/48 | 11/23 at 100.00 | | A2 | | | 6,901,448 | |
| | 5,000 | | Saint Louis, Missouri, Parking Revenue Bonds, Series 2006A, 5.000%, 12/15/31 – NPFG Insured | 12/16 at 100.00 | | A | | | 5,027,850 | |
| | 25,080 | | Total Missouri | | | | | | 18,417,994 | |
| | | | Nebraska – 1.9% (1.2% of Total Investments) | | | | | | | |
| | 11,690 | | Omaha Convention Hotel Corporation, Nebraska, Convention Center Revenue Bonds, Series 2007, 5.000%, 2/01/35 – AMBAC Insured | 2/17 at 100.00 | | Aa3 | | | 11,913,630 | |
| | | | Nevada – 5.1% (3.2% of Total Investments) | | | | | | | |
| | 15,000 | | Clark County, Nevada, Airport Revenue Bonds, Subordinate Lien Series 2010B, 5.750%, 7/01/42 | 1/20 at 100.00 | | A+ | | | 16,341,600 | |
| | 11,665 | | Clark County, Nevada, Passenger Facility Charge Revenue Bonds, Las Vegas-McCarran International Airport, Series 2010A, 5.250%, 7/01/42 | 1/20 at 100.00 | | A+ | | | 11,941,577 | |
| | 3,760 | | Reno, Nevada, Capital Improvement Revenue Bonds, Series 2005B, 0.000%, 6/01/37 – FGIC Insured | 6/15 at 33.61 | | A | | | 762,453 | |
| | 2,500 | | Reno, Nevada, Health Facilities Revenue Bonds, Catholic Healthcare West, Trust 2634A, 18.714%, 7/01/31 – BHAC Insured (IF), (5) | 7/17 at 100.00 | | AA+ | | | 2,777,500 | |
| | 32,925 | | Total Nevada | | | | | | 31,823,130 | |
| | | | New Hampshire – 0.5% (0.3% of Total Investments) | | | | | | | |
| | 3,000 | | New Hampshire Business Finance Authority, Revenue Bonds, Elliot Hospital Obligated Group Issue, Series 2009A, 6.125%, 10/01/39 | 10/19 at 100.00 | | Baa1 | | | 3,127,230 | |
| | | | New Jersey – 2.3% (1.5% of Total Investments) | | | | | | | |
| | 18,400 | | New Jersey Health Care Facilities Financing Authority, Revenue Bonds, Saint Barnabas Health Care System, Refunding Series 2006B, 0.000%, 7/01/37 | 1/17 at 35.47 | | BBB+ | | | 4,636,248 | |
| | 5,065 | | New Jersey Turnpike Authority, Revenue Bonds, Growth and Income Securities, Series 2004B, 0.000%, 1/01/35 – AMBAC Insured | 1/17 at 100.00 | | A+ | | | 4,798,176 | |
| | 3,000 | | Rahway Valley Sewerage Authority, New Jersey, Sewer Revenue Bonds, Series 2005A, 0.000%, 9/01/25 – NPFG Insured | No Opt. Call | | Aa2 | | | 1,816,140 | |
| | 910 | | Rutgers State University, New Jersey, Revenue Bonds, Refunding Series 2013L, 5.000%, 5/01/43 | 5/23 at 100.00 | | AA– | | | 958,530 | |
| | 3,000 | | Tobacco Settlement Financing Corporation, New Jersey, Tobacco Settlement Asset-Backed Bonds, Series 2007-1A, 5.000%, 6/01/41 | 6/17 at 100.00 | | B2 | | | 2,177,100 | |
| | 30,375 | | Total New Jersey | | | | | | 14,386,194 | |
| | | | New York – 6.4% (4.1% of Total Investments) | | | | | | | |
| | 7,000 | | Brooklyn Arena Local Development Corporation, New York, Payment in Lieu of Taxes Revenue Bonds, Barclays Center Project, Series 2009, 0.000%, 7/15/45 | No Opt. Call | | BBB– | | | 1,064,280 | |
| | 2,460 | | Dormitory Authority of the State of New York, Revenue Bonds, The New York and Presbyterian Hospital Project, Series 2007, 5.250%, 8/15/26 (Pre-refunded 8/15/14) – AGM Insured | 8/14 at 100.00 | | AA– (4) | | | 2,558,867 | |
| NMO | Nuveen Municipal Market Opportunity Fund, Inc. (continued) |
| | Portfolio of Investments October 31, 2013 |
| | Principal | | | Optional Call | | | | | | |
| | Amount (000) | | Description (1) | Provisions (2) | | Ratings (3) | | | Value | |
| | | | New York (continued) | | | | | | | |
| $ | 2,000 | | Hudson Yards Infrastructure Corporation, New York, Revenue Bonds, Senior Fiscal 2012 Series 2011A, 5.250%, 2/15/47 | 2/21 at 100.00 | | A | | $ | 2,052,720 | |
| | 3,225 | | Long Island Power Authority, New York, Electric System General Revenue Bonds, Series 2006B, 5.000%, 12/01/35 | 6/16 at 100.00 | | A– | | | 3,287,984 | |
| | 2,500 | | Metropolitan Transportation Authority, New York, Transportation Revenue Bonds, Refunding Series 2012F, 5.000%, 11/15/26 | 11/22 at 100.00 | | A | | | 2,760,375 | |
| | 3,500 | | Monroe County Industrial Development Corporation, New York, FHA Insured Mortgage Revenue Bonds, Unity Hospital of Rochestor Project, Series 2010, 5.750%, 8/15/30 | 2/21 at 100.00 | | Aa2 | | | 3,928,365 | |
| | 875 | | New York City Industrial Development Agency, New York, American Airlines-JFK International Airport Special Facility Revenue Bonds, Series 2005, 7.500%, 8/01/16 (Alternative Minimum Tax) | No Opt. Call | | N/R | | | 910,866 | |
| | 5 | | New York City, New York, General Obligation Bonds, Fiscal Series 1997H, 6.125%, 8/01/25 | 1/14 at 100.00 | | AA | | | 5,026 | |
| | | | New York City, New York, General Obligation Bonds, Fiscal Series 2002G: | | | | | | | |
| | 20 | | 5.000%, 8/01/17 | 1/14 at 100.00 | | AA | | | 20,071 | |
| | 150 | | 5.750%, 8/01/18 | 1/14 at 100.00 | | AA | | | 151,604 | |
| | 2,000 | | New York Liberty Development Corporation, Liberty Revenue Bonds, 4 World Trade Center Project, Series 2011, 5.750%, 11/15/51 | No Opt. Call | | A+ | | | 2,139,200 | |
| | 8,550 | | Port Authority of New York and New Jersey, Special Project Bonds, JFK International Air Terminal LLC Project, Eighth Series 2010, 5.500%, 12/01/31 | 12/20 at 100.00 | | BBB | | | 8,942,018 | |
| | | | Port Authority of New York and New Jersey, Special Project Bonds, JFK International Air Terminal LLC, Sixth Series 1997: | | | | | | | |
| | 2,475 | | 6.250%, 12/01/15 – NPFG Insured (Alternative Minimum Tax) | No Opt. Call | | A | | | 2,600,730 | |
| | 10,000 | | 5.750%, 12/01/22 – NPFG Insured (Alternative Minimum Tax) | 12/13 at 100.00 | | A | | | 10,099,500 | |
| | 44,760 | | Total New York | | | | | | 40,521,606 | |
| | | | North Carolina – 4.5% (2.9% of Total Investments) | | | | | | | |
| | 1,900 | | Charlotte-Mecklenburg Hospital Authority, North Carolina, Healthcare System Revenue Bonds, DBA Carolinas Healthcare System, Series 2005A, 5.000%, 1/15/45 (Pre-refunded 1/15/15) | 1/15 at 100.00 | | AA+ (4) | | | 2,009,744 | |
| | 17,000 | | North Carolina Capital Facilities Financing Agency, Revenue Bonds, Duke University, Series 2005A, 5.000%, 10/01/41 | 10/15 at 100.00 | | AA+ | | | 17,421,260 | |
| | 3,000 | | North Carolina Eastern Municipal Power Agency, Power System Revenue Bonds, Series 2005, 5.250%, 1/01/20 – AMBAC Insured | 1/16 at 100.00 | | A– | | | 3,278,670 | |
| | 4,000 | | North Carolina Medical Care Commission, Health System Revenue Bonds, Mission St. Joseph’s Health System, Series 2007, 4.500%, 10/01/31 (UB) | 10/17 at 100.00 | | AA– | | | 3,908,440 | |
| | 1,900 | | North Carolina Turnpike Authority, Triangle Expressway System Revenue Bonds, Series 2009A, 5.750%, 1/01/39 – AGC Insured | 1/19 at 100.00 | | AA– | | | 2,047,269 | |
| | 27,800 | | Total North Carolina | | | | | | 28,665,383 | |
| | | | North Dakota – 0.3% (0.2% of Total Investments) | | | | | | | |
| | 1,500 | | Fargo, North Dakota, Health System Revenue Bonds, Sanford Health, Refunding Series 2011, 6.000%, 11/01/28 | 11/21 at 100.00 | | A+ | | | 1,693,260 | |
| | | | Ohio – 9.2% (5.9% of Total Investments) | | | | | | | |
| | | | Buckeye Tobacco Settlement Financing Authority, Ohio, Tobacco Settlement Asset-Backed Revenue Bonds, Senior Lien, Series 2007A-2: | | | | | | | |
| | 4,415 | | 5.375%, 6/01/24 | 6/17 at 100.00 | | B– | | | 3,869,615 | |
| | 1,340 | | 5.125%, 6/01/24 | 6/17 at 100.00 | | B– | | | 1,145,298 | |
| | 1,695 | | 5.875%, 6/01/30 | 6/17 at 100.00 | | B | | | 1,380,594 | |
| | 6,215 | | 5.750%, 6/01/34 | 6/17 at 100.00 | | B | | | 4,866,345 | |
| | 4,300 | | 6.000%, 6/01/42 | 6/17 at 100.00 | | BB+ | | | 3,378,381 | |
| | 1,500 | | 6.500%, 6/01/47 | 6/17 at 100.00 | | B | | | 1,269,015 | |
| | 4,750 | | 5.875%, 6/01/47 | 6/17 at 100.00 | | B | | | 3,689,848 | |
| | 3,110 | | Buckeye Tobacco Settlement Financing Authority, Ohio, Tobacco Settlement Asset-Backed Revenue Bonds, Senior Lien, Series 2007A-3, 6.250%, 6/01/37 | 6/22 at 100.00 | | B | | | 2,550,480 | |
| | 6,000 | | Butler County, Ohio, Hospital Facilities Revenue Bonds, UC Health, Series 2010, 5.250%, 11/01/29 | 11/20 at 100.00 | | BBB+ | | | 6,146,400 | |
| | 2,000 | | Cleveland State University, Ohio, General Receipts Bonds, Series 2004, 5.250%, 6/01/24 (Pre-refunded 6/01/14) – FGIC Insured | 6/14 at 100.00 | | A+ (4) | | | 2,059,640 | |
| | Principal | | | Optional Call | | | | | | |
| | Amount (000) | | Description (1) | Provisions (2) | | Ratings (3) | | | Value | |
| | | | Ohio (continued) | | | | | | | |
| $ | 10,000 | | Columbus City School District, Franklin County, Ohio, General Obligation Bonds, Series 2006, 4.250%, 12/01/32 – AGM Insured (UB) | 12/16 at 100.00 | | AA+ | | $ | 9,706,700 | |
| | 5,500 | | Ohio Air Quality Development Authority, Ohio, Revenue Bonds, Ohio Valley Electric Corporation Project, Series 2009E, 5.625%, 10/01/19 | No Opt. Call | | BBB– | | | 6,022,610 | |
| | 7,500 | | Ohio State, Hospital Facility Revenue Refunding Bonds, Cleveland Clinic Health System Obligated Group, Series 2009A, 5.500%, 1/01/39 | 1/19 at 100.00 | | Aa2 | | | 8,203,350 | |
| | 3,690 | | Ohio Turnpike Commission, Turnpike Revenue Bonds, Infrastructure Project, Junior Lien Series 2013A-1, 5.000%, 2/15/48 | 2/23 at 100.00 | | A+ | | | 3,723,764 | |
| | 62,015 | | Total Ohio | | | | | | 58,012,040 | |
| | | | Oklahoma – 0.3% (0.2% of Total Investments) | | | | | | | |
| | 1,675 | | Oklahoma Development Finance Authority, Health System Revenue Bonds, Integris Baptist Medical Center, Series 2008B, 5.250%, 8/15/38 | 8/18 at 100.00 | | AA– | | | 1,707,495 | |
| | | | Pennsylvania – 6.3% (4.0% of Total Investments) | | | | | | | |
| | 3,000 | | Allegheny County Hospital Development Authority, Pennsylvania, University of Pittsburgh Medical Center Revenue Bonds, Series 2009A, 5.625%, 8/15/39 | 8/19 at 100.00 | | Aa3 | | | 3,229,110 | |
| | 5,000 | | Delaware County Industrial Development Authority, Pennsylvania, Resource Recovery Revenue Refunding Bonds, Series 1997A, 6.200%, 7/01/19 | 1/14 at 100.00 | | Ba1 | | | 4,999,350 | |
| | 6,975 | | Pennsylvania Turnpike Commission, Motor License Fund-Enhanced Subordinate Special Revenue Bonds, Series 2010A, 0.000%, 12/01/34 | 12/20 at 100.00 | | AA | | | 6,428,927 | |
| | 3,115 | | Pennsylvania Turnpike Commission, Motor License Fund-Enhanced Turnpike Subordinate Special Revenue, Series 2013A, 5.000%, 12/01/36 | 12/22 at 100.00 | | AA | | | 3,208,886 | |
| | 10,000 | | Pennsylvania Turnpike Commission, Turnpike Revenue Bonds, Subordinate Series 2009C, 0.000%, 6/01/33 – AGM Insured | 6/26 at 100.00 | | AA | | | 9,752,800 | |
| | 11,890 | | Philadelphia Hospitals and Higher Education Facilities Authority, Pennsylvania, Health System Revenue Bonds, Jefferson Health System, Series 2010B, 5.000%, 5/15/40 | 5/20 at 100.00 | | AA | | | 11,942,435 | |
| | 39,980 | | Total Pennsylvania | | | | | | 39,561,508 | |
| | | | Puerto Rico – 5.4% (3.4% of Total Investments) | | | | | | | |
| | 3,330 | | Puerto Rico Aqueduct and Sewerage Authority, Revenue Bonds, Senior Lien Series 2008A, 6.000%, 7/01/44 | 7/18 at 100.00 | | BBB– | | | 2,578,319 | |
| | 1,000 | | Puerto Rico Electric Power Authority, Power Revenue Bonds, Series 2007VV, 5.250%, 7/01/24 – FGIC Insured | No Opt. Call | | A | | | 878,130 | |
| | 8,000 | | Puerto Rico Electric Power Authority, Power Revenue Bonds, Series 2010XX, 5.750%, 7/01/36 | 7/20 at 100.00 | | BBB | | | 6,041,680 | |
| | 4,300 | | Puerto Rico Housing Finance Authority, Capital Fund Program Revenue Bonds, Series 2003, 4.500%, 12/01/23 | 12/13 at 100.00 | | AA– | | | 4,221,611 | |
| | 8,200 | | Puerto Rico Housing Finance Authority, Capital Fund Program Revenue Bonds, Series 2003, 4.500%, 12/01/23 (Pre-refunded 12/01/13) | 12/13 at 100.00 | | Aaa | | | 8,229,766 | |
| | 10,000 | | Puerto Rico Sales Tax Financing Corporation, Sales Tax Revenue Bonds, First Subordinate Series 2009A, 6.000%, 8/01/42 | 8/19 at 100.00 | | A+ | | | 8,657,800 | |
| | 4,310 | | Puerto Rico Sales Tax Financing Corporation, Sales Tax Revenue Bonds, First Subordinate Series 2010C, 5.250%, 8/01/41 | 8/20 at 100.00 | | A+ | | | 3,378,652 | |
| | 39,140 | | Total Puerto Rico | | | | | | 33,985,958 | |
| | | | Rhode Island – 0.5% (0.3% of Total Investments) | | | | | | | |
| | 3,310 | | Rhode Island Tobacco Settlement Financing Corporation, Tobacco Settlement Asset-Backed Bonds, Series 2002A, 6.250%, 6/01/42 | 1/14 at 100.00 | | BBB– | | | 3,223,841 | |
| | | | South Carolina – 0.3% (0.2% of Total Investments) | | | | | | | |
| | 1,900 | | Medical University Hospital Authority, South Carolina, FHA-Insured Mortgage Revenue Bonds, Series 2004A, 5.250%, 8/15/34 (Pre-refunded 8/15/14) – NPFG Insured | 8/14 at 100.00 | | A (4) | | | 1,974,518 | |
| | | | Tennessee – 0.3% (0.2% of Total Investments) | | | | | | | |
| | 2,125 | | Chattanooga Health, Educational and Housing Facility Board, Tennessee, Hospital Revenue Bonds, Catholic Health Initiatives, Series 2013A, 5.250%, 1/01/45 (WI/DD, Settling 11/14/13) | 1/23 at 100.00 | | A+ | | | 2,125,595 | |
| NMO | Nuveen Municipal Market Opportunity Fund, Inc. (continued) |
| | Portfolio of Investments October 31, 2013 |
| | Principal | | | Optional Call | | | | | | |
| | Amount (000) | | Description (1) | Provisions (2) | | Ratings (3) | | | Value | |
| | | | Texas – 18.1% (11.5% of Total Investments) | | | | | | | |
| $ | 2,500 | | Alliance Airport Authority, Texas, Special Facilities Revenue Bonds, American Airlines Inc., Series 2007, 5.250%, 12/01/29 (Alternative Minimum Tax) (6) | 12/13 at 100.00 | | N/R | | $ | 2,824,975 | |
| | 5,080 | | Board of Regents of the University of Texas, Permanent University Fund Bonds, Refunding Series 2005B, 5.000%, 7/01/35 | 7/15 at 100.00 | | AAA | | | 5,319,116 | |
| | 1,210 | | Cedar Hill Independent School District, Dallas County, Texas, General Obligation Bonds, Refunding School Building Series 2005, 5.000%, 8/15/34 | 8/15 at 100.00 | | AAA | | | 1,271,250 | |
| | 1,635 | | Cedar Hill Independent School District, Dallas County, Texas, General Obligation Bonds, Refunding School Building Series 2005, 5.000%, 8/15/34 (Pre-refunded 8/15/15) | 8/15 at 100.00 | | N/R (4) | | | 1,772,307 | |
| | 1,000 | | Cedar Hill Independent School District, Dallas County, Texas, General Obligation Bonds, Series 2002, 0.000%, 8/15/32 – FGIC Insured | No Opt. Call | | AA– | | | 413,180 | |
| | 15,000 | | Central Texas Regional Mobility Authority, Revenue Bonds, Senior Lien Series 2005, 5.000%, 1/01/45 (Pre-refunded 1/01/15) – FGIC Insured | 1/15 at 100.00 | | A (4) | | | 15,830,400 | |
| | 2,005 | | Central Texas Regional Mobility Authority, Revenue Bonds, Senior Lien Series 2011, 5.750%, 1/01/31 | 1/21 at 100.00 | | Baa2 | | | 2,090,814 | |
| | 2,500 | | Comal Independent School District, Comal, Bexar, Guadalupe, Hays, and Kendall Counties, Texas, General Obligation Bonds, Series 2005A, 0.000%, 2/01/23 | No Opt. Call | | Aaa | | | 1,914,150 | |
| | 20 | | Denton Independent School District, Denton County, Texas, General Obligation Bonds, Refunding Series 2004, 5.000%, 8/15/33 | No Opt. Call | | AAA | | | 20,512 | |
| | 2,180 | | Denton Independent School District, Denton County, Texas, General Obligation Bonds, Refunding Series 2004, 5.000%, 8/15/33 (Pre-refunded 8/15/14) | 8/14 at 100.00 | | N/R (4) | | | 2,263,363 | |
| | | | Ennis Independent School District, Ellis County, Texas, General Obligation Bonds, Series 2006: | | | | | | | |
| | 3,950 | | 0.000%, 8/15/30 | 8/16 at 49.21 | | Aaa | | | 1,691,746 | |
| | 4,000 | | 0.000%, 8/15/31 | 8/16 at 46.64 | | Aaa | | | 1,585,600 | |
| | 13,680 | | Grand Parkway Transportation Corporation, Texas, System Toll Revenue Bonds, Subordinate Lien Series 2013B, 5.000%, 4/01/53 | 10/23 at 100.00 | | AA+ | | | 13,586,155 | |
| | 3,070 | | Harris County Hospital District, Texas, Revenue Bonds, Series 2007A, 5.250%, 2/15/42 – NPFG Insured | 2/17 at 100.00 | | AA+ | | | 3,221,719 | |
| | 2,000 | | Houston, Texas, First Lien Combined Utility System Revenue Bonds, First Lien Series 2011A, 5.250%, 11/15/30 | No Opt. Call | | AA | | | 2,216,400 | |
| | 1,715 | | Houston, Texas, Hotel Occupancy Tax and Special Revenue Bonds, Convention and Entertainment Project, Series 2001B, 0.000%, 9/01/32 – AMBAC Insured | No Opt. Call | | A2 | | | 601,639 | |
| | 2,400 | | Houston, Texas, Senior Lien Airport System Revenue Bonds, Refunding Series 2009A, 5.500%, 7/01/39 | 7/18 at 100.00 | | AA– | | | 2,637,984 | |
| | 1,390 | | Humble Independent School District, Harris County, Texas, General Obligation Bonds, Refunding Series 2011B, 3.000%, 2/15/14 | No Opt. Call | | AAA | | | 1,401,593 | |
| | 9,350 | | Leander Independent School District, Williamson and Travis Counties, Texas, General Obligation Bonds, Series 2005, 0.000%, 8/15/32 – FGIC Insured | 8/15 at 39.49 | | AA– | | | 3,475,208 | |
| | 6,000 | | Leander Independent School District, Williamson and Travis Counties, Texas, General Obligation Bonds, Series 2006, 0.000%, 8/15/33 (Pre-refunded 8/15/14) | 8/14 at 35.27 | | AAA | | | 2,112,180 | |
| | 3,525 | | Marble Falls Independent School District, Burnet County, Texas, General Obligation Bonds, Series 2007, 5.000%, 8/15/34 | 8/16 at 100.00 | | Aaa | | | 3,773,090 | |
| | 1,845 | | Midlothian Independent School District, Ellis County, Texas, General Obligation Bonds, Series 2005, 5.000%, 2/15/34 | No Opt. Call | | Aaa | | | 1,913,689 | |
| | 3,405 | | Midlothian Independent School District, Ellis County, Texas, General Obligation Bonds, Series 2005, 5.000%, 2/15/34 (Pre-refunded 2/15/15) | 2/15 at 100.00 | | N/R (4) | | | 3,614,237 | |
| | 4,000 | | North Texas Tollway Authority, First Tier System Revenue Refunding Bonds, Capital Appreciation Series 2008I, 0.000%, 1/01/43 | 1/25 at 100.00 | | A2 | | | 4,201,800 | |
| | 2,125 | | North Texas Tollway Authority, First Tier System Revenue Refunding Bonds, Series 2008D, 0.000%, 1/01/28 – AGC Insured | No Opt. Call | | AA– | | | 1,068,854 | |
| | 5,000 | | Richardson Hospital Authority, Texas, Revenue Bonds, Richardson Regional Medical Center, Series 2004, 6.000%, 12/01/34 (Pre-refunded 12/01/13) | 12/13 at 100.00 | | A+ (4) | | | 5,024,450 | |
| | 3,295 | | Tarrant County Cultural Education Facilities Finance Corporation, Revenue Bonds, Series 2007, 17.194%, 2/15/36 (IF) | 2/17 at 100.00 | | AA– | | | 3,357,407 | |
| | 2,890 | | Tarrant County Cultural Education Facilities Finance Corporation, Texas, Hospital Revenue Bonds, Scott & White Healthcare Project, Series 2010, 5.500%, 8/15/45 | 8/20 at 100.00 | | AA– | | | 2,984,676 | |
| | Principal | | | Optional Call | | | | | | |
| | Amount (000) | | Description (1) | Provisions (2) | | Ratings (3) | | | Value | |
| | | | Texas (continued) | | | | | | | |
| | | | Texas Municipal Gas Acquisition and Supply Corporation III, Gas Supply Revenue Bonds, Series 2012: | | | | | | | |
| $ | 7,925 | | 5.000%, 12/15/28 | No Opt. Call | | A3 | | $ | 7,867,782 | |
| | 1,600 | | 5.000%, 12/15/32 | No Opt. Call | | A3 | | | 1,551,840 | |
| | 2,500 | | Texas State, General Obligation Bonds, Transportation Commission Highway Improvement Series 2012A, 5.000%, 4/01/31 | No Opt. Call | | AAA | | | 2,765,500 | |
| | 5,000 | | Texas Transportation Commission, Central Texas Turnpike System Revenue Bonds, First Tier Refunding Series 2012A, 5.000%, 8/15/41 | 8/22 at 100.00 | | A– | | | 4,984,700 | |
| | 5,000 | | White Settlement Independent School District, Tarrant County, Texas, General Obligation Bonds, Series 2005, 0.000%, 8/15/34 | 8/15 at 36.81 | | AAA | | | 1,608,700 | |
| | | | Wylie Independent School District, Collin County, Texas, General Obligation Bonds, Series 2005: | | | | | | | |
| | 3,000 | | 0.000%, 8/15/23 (Pre-refunded 8/15/15) | 8/15 at 67.10 | | AAA | | | 1,995,090 | |
| | 2,000 | | 0.000%, 8/15/24 (Pre-refunded 8/15/15) | 8/15 at 63.56 | | AAA | | | 1,259,820 | |
| | 133,795 | | Total Texas | | | | | | 114,221,926 | |
| | | | Utah – 1.0% (0.6% of Total Investments) | | | | | | | |
| | 3,000 | | Riverton, Utah, Hospital Revenue Bonds, IHC Health Services, Inc., Series 2009, 5.000%, 8/15/41 | 8/19 at 100.00 | | AA+ | | | 3,044,940 | |
| | 2,000 | | Utah Transit Authority, Sales Tax Revenue Bonds, Series 2007A, 0.000%, 6/15/25 – NPFG Insured | No Opt. Call | | A1 | | | 1,179,860 | |
| | 1,695 | | West Valley City Municipal Building Authority, Salt Lake County, Utah, Lease Revenue Bonds, Series 2006A., 4.500%, 8/01/23 – FGIC Insured | 8/16 at 100.00 | | A+ | | | 1,812,921 | |
| | 6,695 | | Total Utah | | | | | | 6,037,721 | |
| | | | Virginia – 4.7% (3.0% of Total Investments) | | | | | | | |
| | 900 | | Henrico County Economic Development Authority, Virginia, Revenue Bonds, Bon Secours Health System Obligated Group, Series 2013, 5.000%, 11/01/30 | No Opt. Call | | A– | | | 927,963 | |
| | 21,500 | | Metropolitan Washington Airports Authority, Virginia, Dulles Toll Road Revenue Bonds, Series 2009C, 0.000%, 10/01/41 – AGC Insured | 10/26 at 100.00 | | AA– | | | 20,233,650 | |
| | 2,500 | | Route 460 Funding Corporation, Virginia, Toll Road Revenue Bonds, Series 2012A, 5.125%, 7/01/49 | No Opt. Call | | BBB– | | | 2,353,975 | |
| | 19,400 | | Route 460 Funding Corporation, Virginia, Toll Road Revenue Bonds, Series 2012B, 0.000%, 7/01/44 | No Opt. Call | | BBB– | | | 2,473,694 | |
| | 3,600 | | Virginia Small Business Financing Authority, Senior Lien Revenue Bonds, Elizabeth River Crossing, Opco LLC Project, Series 2012, 5.500%, 1/01/42 (Alternative Minimum Tax) | 7/22 at 100.00 | | BBB– | | | 3,602,160 | |
| | 47,900 | | Total Virginia | | | | | | 29,591,442 | |
| | | | Washington – 3.1% (2.0% of Total Investments) | | | | | | | |
| | 2,755 | | Cowlitz County, Washington, Special Sewerage Revenue Refunding Bonds, CSOB Wastewater Treatment Facilities, Series 2002, 5.500%, 11/01/16 – FGIC Insured | No Opt. Call | | A1 | | | 2,946,225 | |
| | 3,000 | | Spokane County School District 81, Spokane, Washington, General Obligation Bonds, Series 2005, 5.000%, 6/01/24 (Pre-refunded 6/01/15) – NPFG Insured | 6/15 at 100.00 | | Aa1 (4) | | | 3,224,370 | |
| | 8,000 | | Washington State Health Care Facilities Authority, Revenue Bonds, MultiCare Health System, Series 2008A, 5.250%, 8/15/34 – AGM Insured | 5/18 at 100.00 | | AA– | | | 8,180,960 | |
| | 9,000 | | Washington State, Motor Vehicle Fuel Tax General Obligation Bonds, Series 2003C, 0.000%, 6/01/28 – FGIC Insured | No Opt. Call | | AA+ | | | 5,138,730 | |
| | 22,755 | | Total Washington | | | | | | 19,490,285 | |
| | | | West Virginia – 0.5% (0.3% of Total Investments) | | | | | | | |
| | 3,000 | | West Virginia Hospital Finance Authority, Hospital Revenue Bonds, West Virginia United Health System Obligated Group, Refunding and Improvement Series 2013A, 5.375%, 6/01/38 | 6/23 at 100.00 | | A | | | 3,083,550 | |
| | | | Wisconsin – 2.4% (1.5% of Total Investments) | | | | | | | |
| | 1,830 | | Wisconsin Health and Educational Facilities Authority, Revenue Bonds, Divine Savior Healthcare, Series 2006, 4.750%, 5/01/25 | 5/16 at 100.00 | | BBB | | | 1,840,211 | |
| | | | Wisconsin Health and Educational Facilities Authority, Revenue Bonds, Marshfield Clinic, Series 2012B: | | | | | | | |
| | 1,000 | | 5.000%, 2/15/27 | 2/22 at 100.00 | | A– | | | 1,038,588 | |
| | 1,000 | | 5.000%, 2/15/28 | 2/22 at 100.00 | | A– | | | 1,027,588 | |
| | 10,070 | | Wisconsin State, General Fund Annual Appropriation Revenue Bonds, Refunding Series 2009A, 5.750%, 5/01/33 | 5/19 at 100.00 | | AA– | | | 11,159,372 | |
| | 13,900 | | Total Wisconsin | | | | | | 15,065,759 | |
| NMO | Nuveen Municipal Market Opportunity Fund, Inc. (continued) |
| | Portfolio of Investments October 31, 2013 |
| | Principal | | | | Optional Call | | | | | | |
| | Amount (000) | | Description (1) | | Provisions (2) | | Ratings (3) | | | Value | |
| | | | Wyoming – 0.7% (0.4% of Total Investments) | | | | | | | | |
| $ | 4,080 | | Campbell County, Wyoming Solid Waste Facilities Revenue Bonds, Basin Electric Power Cooperative – Dry Fork Station Facilities, Series 2009A, 5.750%, 7/15/39 | | 7/19 at 100.00 | | A1 | | $ | 4,425,576 | |
| $ | 1,185,665 | | Total Municipal Bonds (cost $973,932,519) | | | | | | | 990,151,175 | |
| | Principal | | | | | | | | | | |
| | Amount (000) | | Description (1) | Coupon | Maturity | | Ratings (3) | | | Value | |
| | | | Corporate Bonds – 0.0% (0.0% of Total Investments) | | | | | | | | |
| | | | Transportation – 0.0% (0.0% of Total Investments) | | | | | | | | |
| $ | 625 | | Las Vegas Monorail Company, Senior Interest Bonds (7), (8) | 5.500% | 7/15/19 | | N/R | | $ | 112,535 | |
| | 178 | | Las Vegas Monorail Company, Senior Interest Bonds (7), (8) | 3.000% | 7/15/55 | | N/R | | | 23,809 | |
| $ | 803 | | Total Corporate Bonds (cost $31,801) | | | | | | | 136,344 | |
| | | | Total Long-Term Investments – (cost $973,964,320) | | | | | | | 990,287,519 | |
| | | | Floating Rate Obligations – (5.5)% | | | | | | | (34,730,000 | ) |
| | | | Variable Rate Demand Preferred Shares, at Liquidation Value – (55.7)% (9) | | | | | | | (350,900,000 | ) |
| | | | Other Assets Less Liabilities – 4.0% | | | | | | | 25,312,745 | |
| | | | Net Assets Applicable to Common Shares – 100% | | | | | | $ | 629,970,264 | |
| (1) | All percentages shown in the Portfolio of Investments are based on net assets applicable to Common shares unless otherwise noted. |
| (2) | Optional Call Provisions (not covered by the report of independent registered public accounting firm): Dates (month and year) and prices of the earliest optional call or redemption. There may be other call provisions at varying prices at later dates. Certain mortgage-backed securities may be subject to periodic principal paydowns. |
| (3) | Ratings (not covered by the report of independent registered public accounting firm): Using the highest of Standard & Poor’s Group (“Standard & Poor’s”), Moody’s Investors Service, Inc. (“Moody’s”) or Fitch, Inc. (“Fitch”) rating. Ratings below BBB by Standard & Poor’s, Baa by Moody’s or BBB by Fitch are considered to be below investment grade. Holdings designated N/R are not rated by any of these national rating agencies. |
| (4) | Backed by an escrow or trust containing sufficient U.S. Government or U.S. Government agency securities, which ensure the timely payment of principal and interest. Certain bonds backed by U.S. Government or agency securities are regarded as having an implied rating equal to the rating of such securities. |
| (5) | Investment, or portion of investment, has been pledged to collateralize the net payment obligations for investments in inverse floating rate transactions. |
| (6) | At or subsequent to the end of the reporting period, this security is non-income producing. Non-income producing security, in the case of a fixed-income security, generally denotes that the issuer has (1) defaulted on the payment of principal or interest, (2) is under the protection of the Federal Bankruptcy Court or (3) the Fund’s Adviser has concluded that the issue is not likely to meet its future interest payment obligations and has directed the Fund’s custodian to cease accruing additional income on the Fund’s records. |
| (7) | Investment valued at fair value using methods determined in good faith by, or at the discretion of, the Board of Directors. For fair value measurement disclosure purposes, investment categorized as Level 3. See Notes to Financial Statements, Note 2 – Investment Valuation and Fair Value Measurements for more information. |
| (8) | During January 2010, Las Vegas Monorail Company (“Las Vegas Monorail”) filed for federal bankruptcy protection. During March 2012, Las Vegas Monorail merged from federal bankruptcy with the acceptance of a reorganization plan assigned by the Federal Bankruptcy Court. Under the reorganization plan, the Fund surrendered its Las Vegas Monorail Project Revenue Bonds, First Tier, Series 2000 and in turn received two senior interest corporate bonds: the first with an annual coupon rate of 5.500% maturing on July 15, 2019 and the second with an annual coupon rate of 3.000% (5.500% after December 31, 2015) maturing on July 15, 2055. The Fund’s custodian is not accruing income on the Fund’s records for either senior interest corporate bond. |
| (9) | Variable Rate Demand Preferred Shares, at Liquidation Value as a percentage of Total Investments is 35.4%. |
| WI/DD | Purchased on a when-issued or delayed delivery basis. |
| (ETM) | Escrowed to maturity. |
| (IF) | Inverse floating rate investment. |
| (UB) | Underlying bond of an inverse floating rate trust reflected as a financing transaction. See Notes to Financial Statements, Note 3 – Portfolio Securities and Investments in Derivatives, Inverse Floating Rate Securities for more information. |
See accompanying notes to financial statements.
| NAD | |
| | Nuveen Dividend Advantage Municipal Fund |
| | Portfolio of Investments |
| | October 31, 2013 |
| | Principal | | | Optional Call | | | | | | |
| | Amount (000) | | Description (1) | Provisions (2) | | Ratings (3) | | | Value | |
| | | | LONG-TERM INVESTMENTS – 150.8% (100.0% of Total Investments) | | | | | | | |
| | | | MUNICIPAL BONDS – 150.7% (99.9% of Total Investments) | | | | | | | |
| | | | Alaska – 0.1% (0.1% of Total Investments) | | | | | | | |
| $ | 750 | | Alaska Housing Finance Corporation, General Housing Purpose Bonds, Series 2005A, 5.250%, 12/01/34 – FGIC Insured (UB) | 12/14 at 100.00 | | AA+ | | $ | 776,100 | |
| | | | Arizona – 3.3% (2.2% of Total Investments) | | | | | | | |
| | 2,000 | | Phoenix Civic Improvement Corporation, Arizona, Junior Lien Airport Revenue Bonds, Series 2010A, 5.000%, 7/01/40 | 7/20 at 100.00 | | A+ | | | 2,021,320 | |
| | | | Phoenix Civic Improvement Corporation, Arizona, Senior Lien Airport Revenue Bonds, Series 2008A: | | | | | | | |
| | 2,350 | | 5.000%, 7/01/33 | 7/18 at 100.00 | | AA– | | | 2,461,249 | |
| | 8,200 | | 5.000%, 7/01/38 | 7/18 at 100.00 | | AA– | | | 8,445,508 | |
| | | | Salt Verde Financial Corporation, Arizona, Senior Gas Revenue Bonds, Citigroup Energy Inc Prepay Contract Obligations, Series 2007: | | | | | | | |
| | 500 | | 5.500%, 12/01/29 | No Opt. Call | | A– | | | 538,875 | |
| | 5,000 | | 5.000%, 12/01/37 | No Opt. Call | | A– | | | 5,031,950 | |
| | 18,050 | | Total Arizona | | | | | | 18,498,902 | |
| | | | California – 13.1% (8.7% of Total Investments) | | | | | | | |
| | 1,535 | | Alameda Corridor Transportation Authority, California, Senior Lien Revenue Bonds, Series 1999A, 0.000%, 10/01/37 – NPFG Insured | No Opt. Call | | A | | | 406,821 | |
| | 7,150 | | Anaheim Public Finance Authority, California, Subordinate Lease Revenue Bonds, Public Improvement Project, Series 1997C, 0.000%, 9/01/28 – AGM Insured | No Opt. Call | | AA– | | | 3,243,741 | |
| | 5,000 | | Bay Area Toll Authority, California, Revenue Bonds, San Francisco Bay Area Toll Bridge, Series 2013S-4, 5.000%, 4/01/38 | 4/23 at 100.00 | | A+ | | | 5,155,100 | |
| | 3,335 | | California Health Facilities Financing Authority, Revenue Bonds, Sutter Health, Series 2007A, 5.000%, 11/15/42 | 11/16 at 100.00 | | AA– | | | 3,314,690 | |
| | 5,000 | | California State, General Obligation Bonds, Series 2005, 5.000%, 3/01/31 | 3/16 at 100.00 | | A1 | | | 5,151,700 | |
| | 4,250 | | California State, General Obligation Bonds, Various Purpose Series 2010, 5.250%, 11/01/40 | 11/20 at 100.00 | | A1 | | | 4,442,185 | |
| | 2,250 | | California Statewide Communities Development Authority, Revenue Bonds, Cottage Health System Obligated Group, Series 2010, 5.250%, 11/01/30 | 11/20 at 100.00 | | AA– | | | 2,364,840 | |
| | 6,025 | | California Statewide Community Development Authority, Revenue Bonds, Methodist Hospital Project, Series 2009, 6.750%, 2/01/38 | 8/19 at 100.00 | | Aa2 | | | 7,012,859 | |
| | 65 | | California, General Obligation Bonds, Series 1997, 5.000%, 10/01/18 – AMBAC Insured | 1/14 at 100.00 | | A1 | | | 65,258 | |
| | 5,000 | | Corona-Norco Unified School District, Riverside County, California, General Obligation Bonds, Election 2006 Series 2007A, 5.000%, 8/01/31 – AGM Insured | 8/17 at 100.00 | | Aa2 | | | 5,270,700 | |
| | 2,000 | | Dublin Unified School District, Alameda County, California, General Obligation Bonds, Series 2007C, 0.000%, 8/01/31 – NPFG Insured | 8/17 at 49.41 | | Aa2 | | | 783,480 | |
| | | | Golden State Tobacco Securitization Corporation, California, Enhanced Tobacco Settlement Asset-Backed Revenue Bonds, Series 2005A: | | | | | | | |
| | 3,500 | | 0.000%, 6/01/26 – AGM Insured | No Opt. Call | | AA– | | | 2,070,740 | |
| | 10,730 | | 5.000%, 6/01/45 – AGC Insured | 6/15 at 100.00 | | AA– | | | 10,595,231 | |
| | | | Golden State Tobacco Securitization Corporation, California, Tobacco Settlement Asset-Backed Bonds, Series 2007A-1: | | | | | | | |
| | 3,030 | | 4.500%, 6/01/27 | 6/17 at 100.00 | | B | | | 2,591,498 | |
| | 7,745 | | 5.000%, 6/01/33 | 6/17 at 100.00 | | B | | | 5,970,233 | |
| | 1,000 | | 5.125%, 6/01/47 | 6/17 at 100.00 | | B | | | 700,870 | |
| NAD | Nuveen Dividend Advantage Municipal Fund (continued) |
| | Portfolio of Investments October 31, 2013 |
| | Principal | | | Optional Call | | | | | | |
| | Amount (000) | | Description (1) | Provisions (2) | | Ratings (3) | | | Value | |
| | | | California (continued) | | | | | | | |
| $ | 2,500 | | Huntington Beach Union High School District, Orange County, California, General Obligation Bonds, Series 2007, 0.000%, 8/01/32 – FGIC Insured | No Opt. Call | | Aa2 | | $ | 927,300 | |
| | 2,200 | | M-S-R Energy Authority, California, Gas Revenue Bonds, Series 2009C, 6.500%, 11/01/39 | No Opt. Call | | A | | | 2,645,940 | |
| | 2,000 | | Murrieta Valley Unified School District Public Financing Authority, California, Special Tax Revenue Bonds, Series 2006A, 5.125%, 9/01/26 – AGM Insured | 9/16 at 100.00 | | AA– | | | 2,145,960 | |
| | 2,000 | | Riverside Unified School District, Riverside County, California, General Obligation Bonds, Election 2001 Series 2006B, 5.000%, 8/01/30 – AGC Insured | 8/15 at 101.00 | | Aa2 | | | 2,109,460 | |
| | | | San Joaquin Hills Transportation Corridor Agency, Orange County, California, Toll Road Revenue Refunding Bonds, Series 1997A: | | | | | | | |
| | 2,350 | | 0.000%, 1/15/29 – NPFG Insured | No Opt. Call | | A | | | 921,835 | |
| | 17,000 | | 0.000%, 1/15/35 – NPFG Insured | No Opt. Call | | A | | | 4,396,880 | |
| | 575 | | Seaside Redevelopment Agency, California, Tax Allocation Bonds, Merged Project Area, Series 2003, 5.375%, 8/01/18 – NPFG Insured | 1/14 at 100.00 | | A | | | 576,236 | |
| | 2,410 | | Victor Elementary School District, San Bernardino County, California, General Obligation Bonds, Series 2002A, 0.000%, 8/01/26 – FGIC Insured | No Opt. Call | | Aa3 | | | 1,299,255 | |
| | 98,650 | | Total California | | | | | | 74,162,812 | |
| | | | Colorado – 8.7% (5.7% of Total Investments) | | | | | | | |
| | 1,125 | | Antelope Heights Metropolitan District, Colorado, Limited Tax General Obligation Bonds, Series 2007, 5.000%, 12/01/37 – RAAI Insured | 12/17 at 100.00 | | N/R | | | 977,445 | |
| | 3,475 | | Colorado Health Facilities Authority, Colorado, Revenue Bonds, Catholic Health Initiatives, Series 2009A, 5.500%, 7/01/34 | 7/19 at 100.00 | | A+ | | | 3,811,484 | |
| | 2,300 | | Colorado Health Facilities Authority, Colorado, Revenue Bonds, Catholic Health Initiatives, Series 2011A, 5.000%, 2/01/41 | 2/21 at 100.00 | | A+ | | | 2,254,529 | |
| | 4,890 | | Colorado Health Facilities Authority, Colorado, Revenue Bonds, Catholic Health Initiatives, Series 2013A, 5.250%, 1/01/45 (WI/DD, Settling 11/14/13) | 1/23 at 100.00 | | A+ | | | 4,863,594 | |
| | 4,000 | | Colorado Health Facilities Authority, Colorado, Revenue Bonds, Sisters of Charity of Leavenworth Health Services Corporation, Series 2010A, 5.000%, 1/01/40 | 1/20 at 100.00 | | AA– | | | 4,022,920 | |
| | 8,765 | | E-470 Public Highway Authority, Colorado, Senior Revenue Bonds, Series 1997B, 0.000%, 9/01/25 – NPFG Insured | No Opt. Call | | A | | | 4,996,313 | |
| | 25,000 | | E-470 Public Highway Authority, Colorado, Senior Revenue Bonds, Series 2000B, 0.000%, 9/01/31 – NPFG Insured | No Opt. Call | | A | | | 9,081,000 | |
| | 60,000 | | E-470 Public Highway Authority, Colorado, Toll Revenue Bonds, Series 2004A, 0.000%, 3/01/36 – NPFG Insured | No Opt. Call | | A | | | 16,162,800 | |
| | 12,500 | | E-470 Public Highway Authority, Colorado, Toll Revenue Bonds, Series 2006A, 0.000%, 9/01/38 – NPFG Insured | 9/26 at 54.77 | | A | | | 2,872,625 | |
| | 122,055 | | Total Colorado | | | | | | 49,042,710 | |
| | | | Connecticut – 0.5% (0.3% of Total Investments) | | | | | | | |
| | 3,782 | | Mashantucket Western Pequot Tribe, Connecticut, Special Revenue Bonds, Subordinate Series 2013A, 6.050%, 7/01/31 | No Opt. Call | | N/R | | | 2,610,946 | |
| | | | District of Columbia – 0.1% (0.1% of Total Investments) | | | | | | | |
| | 2,000 | | Metropolitan Washington Airports Authority, Virginia, Dulles Toll Road Revenue Bonds, Capital Appreciation Series 2009B-2, 0.000%, 10/01/36 – AGC Insured | No Opt. Call | | AA– | | | 512,720 | |
| | | | Florida – 9.0% (6.0% of Total Investments) | | | | | | | |
| | 15,000 | | Florida State Board of Education, Public Education Capital Outlay Bonds, Series 2005E, 4.500%, 6/01/35 (UB) | 6/15 at 101.00 | | AAA | | | 15,028,500 | |
| | 2,500 | | Marion County Hospital District, Florida, Revenue Bonds, Munroe Regional Medical Center, Series 2007, 5.000%, 10/01/34 | 10/17 at 100.00 | | A– | | | 2,548,375 | |
| | 1,665 | | Orange County Health Facilities Authority, Florida, Orlando Regional Healthcare System Revenue Bonds, Series 2009, 5.125%, 10/01/26 | 10/19 at 100.00 | | A | | | 1,764,117 | |
| | Principal | | | Optional Call | | | | | | |
| | Amount (000) | | Description (1) | Provisions (2) | | Ratings (3) | | | Value | |
| | | | Florida (continued) | | | | | | | |
| $ | 2,620 | | Orange County School Board, Florida, Certificates of Participation, Series 2004A, 5.000%, 8/01/29 – AMBAC Insured | 8/14 at 100.00 | | Aa2 | | $ | 2,672,400 | |
| | | | South Miami Health Facilities Authority, Florida, Hospital Revenue, Baptist Health System Obligation Group, Series 2007: | | | | | | | |
| | 22,000 | | 5.000%, 8/15/37 (UB) | 8/17 at 100.00 | | AA | | | 21,967,880 | |
| | 7,370 | | 5.000%, 8/15/42 (UB) | 8/17 at 100.00 | | AA | | | 7,269,768 | |
| | 51,155 | | Total Florida | | | | | | 51,251,040 | |
| | | | Georgia – 2.3% (1.5% of Total Investments) | | | | | | | |
| | 5,000 | | Cobb County Development Authority, Georgia, Student Housing Revenue Bonds, KSU Village II Real Estate Foundation LLC Project, Series 2007A, 5.250%, 7/15/38 – AMBAC Insured | 7/17 at 100.00 | | Baa2 | | | 4,818,700 | |
| | 5,000 | | Franklin County Industrial Building Authority, Georgia, Revenue Bonds, Ty Cobb Regional Medical Center Project, Series 2010, 8.000%, 12/01/40 | 12/20 at 100.00 | | N/R | | | 5,196,000 | |
| | 3,000 | | Gainesville and Hall County Hospital Authority, Georgia, Revenue Anticipation Certificates, Northeast Georgia Health Services Inc., Series 2010B, 5.250%, 2/15/37 | 2/20 at 100.00 | | AA– | | | 3,067,410 | |
| | 13,000 | | Total Georgia | | | | | | 13,082,110 | |
| | | | Idaho – 0.1% (0.0% of Total Investments) | | | | | | | |
| | 75 | | Idaho Housing and Finance Association, Single Family Mortgage Bonds, Series 1999E, 5.750%, 1/01/21 (Alternative Minimum Tax) | 1/14 at 100.00 | | AAA | | | 77,158 | |
| | 125 | | Idaho Housing and Finance Association, Single Family Mortgage Bonds, Series 2000D, 6.350%, 7/01/22 (Alternative Minimum Tax) | 1/14 at 100.00 | | Aa2 | | | 127,130 | |
| | 130 | | Idaho Housing and Finance Association, Single Family Mortgage Bonds, Series 2000E, 5.950%, 7/01/20 (Alternative Minimum Tax) | 1/14 at 100.00 | | Aaa | | | 130,276 | |
| | 330 | | Total Idaho | | | | | | 334,564 | |
| | | | Illinois – 26.1% (17.3% of Total Investments) | | | | | | | |
| | 2,205 | | Chicago Board of Education, Illinois, Unlimited Tax General Obligation Bonds, Dedicated Tax Revenues, Series 1998B-1, 0.000%, 12/01/29 – FGIC Insured | No Opt. Call | | A+ | | | 808,992 | |
| | 7,250 | | Chicago Board of Education, Illinois, Unlimited Tax General Obligation Bonds, Dedicated Tax Revenues, Series 1999A, 5.500%, 12/01/26 – FGIC Insured | No Opt. Call | | A+ | | | 7,525,790 | |
| | | | Chicago, Illinois, FHA/GNMA Multifamily Housing Revenue Bonds, Archer Court Apartments, Series 1999A: | | | | | | | |
| | 450 | | 5.500%, 12/20/19 (Alternative Minimum Tax) | 4/14 at 100.00 | | AA– | | | 450,806 | |
| | 1,210 | | 5.600%, 12/20/29 (Alternative Minimum Tax) | 4/14 at 100.00 | | AA– | | | 1,210,920 | |
| | 1,925 | | 5.650%, 12/20/40 (Alternative Minimum Tax) | 4/14 at 100.00 | | AA– | | | 1,925,770 | |
| | 2,480 | | Chicago, Illinois, General Obligation Bonds, City Colleges, Series 1999, 0.000%, 1/01/33 – FGIC Insured | No Opt. Call | | AA– | | | 720,390 | |
| | 22,750 | | Chicago, Illinois, General Obligation Refunding Bonds, Emergency Telephone System, Series 1999, 5.500%, 1/01/23 – FGIC Insured | No Opt. Call | | AA– | | | 25,096,208 | |
| | 580 | | Chicago, Illinois, Motor Fuel Tax Revenue Refunding Bonds, Series 1993, 5.375%, 1/01/14 – AMBAC Insured | No Opt. Call | | AA+ | | | 584,826 | |
| | 5,320 | | Chicago, Illinois, Third Lien General Airport Revenue Bonds, O’Hare International Airport, Series 2004A, 5.000%, 1/01/28 – NPFG Insured | 1/15 at 100.00 | | A | | | 5,473,854 | |
| | 3,465 | | Chicago, Illinois, Third Lien General Airport Revenue Bonds, O’Hare International Airport, Series 2005A, 5.000%, 1/01/33 – FGIC Insured | 1/16 at 100.00 | | A | | | 3,474,633 | |
| | 190 | | DuPage County Community School District 200, Wheaton, Illinois, General Obligation Bonds, Series 2003B, 5.250%, 11/01/20 (Pre-refunded 1/01/14) – AGM Insured | 1/14 at 100.00 | | AA (4) | | | 191,619 | |
| | 3,935 | | Illinois Development Finance Authority, Local Government Program Revenue Bonds, Lake County School District 116 – Round Lake, Series 1999, 0.000%, 1/01/15 – NPFG Insured | No Opt. Call | | Baa1 | | | 3,865,862 | |
| | 1,500 | | Illinois Finance Authority, Revenue Bonds, Central DuPage Health, Series 2009B, 5.500%, 11/01/39 | 11/19 at 100.00 | | AA | | | 1,586,100 | |
| NAD | Nuveen Dividend Advantage Municipal Fund (continued) |
| | Portfolio of Investments October 31, 2013 |
| | Principal | | | Optional Call | | | | | | |
| | Amount (000) | | Description (1) | Provisions (2) | | Ratings (3) | | | Value | |
| | | | Illinois (continued) | | | | | | | |
| $ | 2,000 | | Illinois Finance Authority, Revenue Bonds, Children’s Memorial Hospital, Series 2008A, 5.250%, 8/15/47 – AGC Insured (UB) | 8/18 at 100.00 | | AA– | | $ | 2,006,960 | |
| | 1,120 | | Illinois Finance Authority, Revenue Bonds, Edward Health Services Corporation, Series 2008A, 5.500%, 2/01/40 – AMBAC Insured | 2/18 at 100.00 | | A+ | | | 1,138,749 | |
| | | | Illinois Finance Authority, Revenue Bonds, University of Chicago, Series 2004A: | | | | | | | |
| | 4,580 | | 5.000%, 7/01/34 (Pre-refunded 7/01/14) | 7/14 at 100.00 | | Aa1 (4) | | | 4,728,117 | |
| | 1,060 | | 5.000%, 7/01/34 (Pre-refunded 7/01/14) | 7/14 at 100.00 | | Aa1 (4) | | | 1,094,280 | |
| | 1,225 | | Illinois Finance Authority, Revenue Bonds, University of Chicago, Series 2007, 5.000%, 7/01/19 | 7/17 at 100.00 | | Aa1 | | | 1,368,374 | |
| | 4,000 | | Illinois Finance Authority, Revenue Refunding Bonds, Silver Cross Hospital and Medical Centers, Series 2008A, 6.000%, 8/15/23 | 8/18 at 100.00 | | BBB+ | | | 4,377,400 | |
| | 5,960 | | Illinois Finance Authority, Student Housing Revenue Bonds, Educational Advancement Fund Inc., Refunding Series 2007A, 5.250%, 5/01/34 | 5/17 at 100.00 | | BBB+ | | | 5,603,890 | |
| | 1,500 | | Illinois Housing Development Authority, Housing Finance Bonds, Series 2005E, 4.800%, 1/01/36 – FGIC Insured | 1/15 at 100.00 | | AA | | | 1,489,785 | |
| | 2,000 | | Illinois Toll Highway Authority, State Toll Highway Authority Revenue Bonds, Series 2006A-1, 5.000%, 1/01/20 – AGM Insured | 7/16 at 100.00 | | AA– | | | 2,205,420 | |
| | 2,000 | | Kane & DeKalb Counties Community Unit School District 301, Illinois, General Obligation Bonds, Series 2006, 0.000%, 12/01/21 – NPFG Insured | No Opt. Call | | Aa3 | | | 1,510,140 | |
| | 11,345 | | Lake and McHenry Counties Community Unit School District 118, Wauconda, Illinois, General Obligation Bonds, Series 2005B, 0.000%, 1/01/25 – AGM Insured | 1/15 at 60.14 | | A1 | | | 6,478,108 | |
| | 3,000 | | Lombard Public Facilities Corporation, Illinois, First Tier Conference Center and Hotel Revenue Bonds, Series 2005A-1, 7.125%, 1/01/36 | 1/16 at 100.00 | | N/R | | | 1,762,770 | |
| | | | Metropolitan Pier and Exposition Authority, Illinois, Revenue Refunding Bonds, McCormick Place Expansion Project, Series 1996A: | | | | | | | |
| | 12,250 | | 0.000%, 12/15/22 – NPFG Insured | No Opt. Call | | AA– | | | 8,366,505 | |
| | 13,000 | | 0.000%, 12/15/23 – NPFG Insured | No Opt. Call | | AA– | | | 8,355,360 | |
| | 1,840 | | Oak Park, Illinois, General Obligation Bonds, Series 2005B, 0.000%, 11/01/27 – SYNCORA GTY Insured | 11/15 at 54.13 | | Aa2 | | | 908,592 | |
| | | | Regional Transportation Authority, Cook, DuPage, Kane, Lake, McHenry and Will Counties, Illinois, General Obligation Bonds, Series 1999: | | | | | | | |
| | 22,650 | | 5.750%, 6/01/19 – AGM Insured | No Opt. Call | | AA | | | 26,759,390 | |
| | 3,500 | | 5.750%, 6/01/23 – AGM Insured | No Opt. Call | | AA | | | 4,037,250 | |
| | 1,300 | | Schaumburg, Illinois, General Obligation Bonds, Series 2004B, 5.250%, 12/01/34 (Pre-refunded 12/01/14) – FGIC Insured | 12/14 at 100.00 | | AAA | | | 1,371,201 | |
| | 4,930 | | Will County Community High School District 210 Lincoln-Way, Illinois, General Obligation Bonds, Series 2006, 0.000%, 1/01/23 – AGM Insured | No Opt. Call | | Aa2 | | | 3,389,276 | |
| | 5,320 | | Will County Community High School District 210 Lincoln-Way, Illinois, General Obligation Bonds, Series 2006, 0.000%, 1/01/23 – AGM Insured (ETM) | No Opt. Call | | Aa2 (4) | | | 4,085,920 | |
| | 2,475 | | Will County School District 122, New Lenox, Illinois, General Obligation Bonds, Series 2000B, 0.000%, 11/01/18 – AGM Insured | No Opt. Call | | A2 | | | 2,184,386 | |
| | 2,025 | | Will County School District 122, New Lenox, Illinois, General Obligation Bonds, Series 2000B, 0.000%, 11/01/18 – AGM Insured (ETM) | No Opt. Call | | A2 (4) | | | 1,873,267 | |
| | 162,340 | | Total Illinois | | | | | | 148,010,910 | |
| | | | Indiana – 3.7% (2.5% of Total Investments) | | | | | | | |
| | 4,350 | | Indiana Finance Authority, Revenue Bonds, Trinity Health Care Group, Refunding Series 2009A, 5.250%, 12/01/38 | 12/19 at 100.00 | | Aa2 | | | 4,517,562 | |
| | 2,000 | | Indiana Health Facility Financing Authority, Hospital Revenue Bonds, Deaconess Hospital Inc., Series 2004A, 5.375%, 3/01/34 (Pre-refunded 3/01/14) – AMBAC Insured | 3/14 at 100.00 | | A+ (4) | | | 2,034,960 | |
| | 2,000 | | Indiana Health Facility Financing Authority, Revenue Bonds, Community Foundation of Northwest Indiana, Series 2007, 5.500%, 3/01/37 | 3/17 at 100.00 | | A | | | 2,062,700 | |
| | Principal | | | Optional Call | | | | | | |
| | Amount (000) | | Description (1) | Provisions (2) | | Ratings (3) | | | Value | |
| | | | Indiana (continued) | | | | | | | |
| $ | 3,850 | | Indiana Housing and Community Development Authority, Single Family Mortgage Revenue Bonds, Tender Option Bond Trust 1847, 7.692%, 1/01/25 (Alternative Minimum Tax) (IF) | 1/17 at 100.00 | | Aaa | | $ | 3,923,882 | |
| | 8,675 | | Indiana Municipal Power Agency, Power Supply Revenue Bonds, Series 2007A, 5.000%, 1/01/42 – NPFG Insured | 1/17 at 100.00 | | A+ | | | 8,734,424 | |
| | 20,875 | | Total Indiana | | | | | | 21,273,528 | |
| | | | Iowa – 1.5% (1.0% of Total Investments) | | | | | | | |
| | 1,335 | | Iowa Finance Authority, Iowa, Midwestern Disaster Area Revenue Bonds, Iowa Fertilizer Company Project, Series 2013, 5.250%, 12/01/25 | 12/23 at 100.00 | | BB– | | | 1,223,928 | |
| | | | Iowa Tobacco Settlement Authority, Asset Backed Settlement Revenue Bonds, Series 2005C: | | | | | | | |
| | 2,420 | | 5.500%, 6/01/42 | 6/15 at 100.00 | | B+ | | | 1,864,683 | |
| | 7,000 | | 5.625%, 6/01/46 | 6/15 at 100.00 | | B+ | | | 5,408,410 | |
| | 10,755 | | Total Iowa | | | | | | 8,497,021 | |
| | | | Kansas – 0.4% (0.2% of Total Investments) | | | | | | | |
| | 3,055 | | Wyandotte County-Kansas City Unified Government, Kansas, Sales Tax Special Obligation Capital Appreciation Revenue Bonds Redevelopment Project Area B – Major Multi-Sport Athletic Complex Project, Subordinate Lien Series 2010B, 0.000%, 6/01/21 | No Opt. Call | | BBB+ | | | 2,039,213 | |
| | | | Louisiana – 2.9% (1.9% of Total Investments) | | | | | | | |
| | 1,740 | | Louisiana Local Government Environmental Facilities and Community Development Authority, GNMA Collateralized Mortgage Revenue Refunding Bonds, Sharlo Apartments, Series 2002A, 6.500%, 6/20/37 | 6/36 at 101.00 | | Aa1 | | | 1,814,837 | |
| | 9,000 | | Louisiana Public Facilities Authority, Revenue Bonds, Ochsner Clinic Foundation Project, Series 2007A, 5.500%, 5/15/47 | 5/17 at 100.00 | | Baa1 | | | 9,090,360 | |
| | 5,445 | | Louisiana State, Gasoline and Fuels Tax Revenue Bonds, Series 2006A, 4.500%, 5/01/41 – FGIC Insured (UB) | 5/16 at 100.00 | | Aa1 | | | 5,385,650 | |
| | 16,185 | | Total Louisiana | | | | | | 16,290,847 | |
| | | | Maine – 0.2% (0.1% of Total Investments) | | | | | | | |
| | 1,050 | | Maine Health and Higher Educational Facilities Authority, Revenue Bonds, MaineGeneral Medical Center, Series 2011, 6.750%, 7/01/41 | 7/21 at 100.00 | | BBB– | | | 1,108,265 | |
| | | | Massachusetts – 3.4% (2.3% of Total Investments) | | | | | | | |
| | 1,440 | | Boston Industrial Development Financing Authority, Massachusetts, Subordinate Revenue Bonds, Crosstown Center Project, Series 2002, 8.000%, 9/01/35 (Alternative Minimum Tax) (5) | 3/14 at 101.00 | | N/R | | | 471,758 | |
| | 4,365 | | Massachusetts Health and Educational Facilities Authority, Revenue Bonds, Berkshire Health System, Series 2005F, 5.000%, 10/01/19 – AGC Insured | 10/15 at 100.00 | | AA– | | | 4,618,650 | |
| | 620 | | Massachusetts Health and Educational Facilities Authority, Revenue Bonds, CareGroup Inc., Series 2008E-1 &2, 5.125%, 7/01/33 | 7/18 at 100.00 | | A– | | | 632,059 | |
| | 2,300 | | Massachusetts Health and Educational Facilities Authority, Revenue Refunding Bonds, Suffolk University Issue, Series 2009A, 5.750%, 7/01/39 | 7/19 at 100.00 | | BBB | | | 2,384,042 | |
| | 2,805 | | Massachusetts Housing Finance Agency, Housing Bonds, Series 2009F, 5.700%, 6/01/40 | 12/18 at 100.00 | | AA– | | | 2,874,340 | |
| | 820 | | Massachusetts Port Authority, Special Facilities Revenue Bonds, US Airways Group Inc., Series 1996A, 5.875%, 9/01/23 – NPFG Insured (Alternative Minimum Tax) | 3/14 at 100.00 | | A | | | 820,295 | |
| | 2,280 | | Massachusetts School Building Authority, Dedicated Sales Tax Revenue Bonds, Senior Series 2013A, 5.000%, 5/15/43 | 5/23 at 100.00 | | AA+ | | | 2,403,758 | |
| | 160 | | Massachusetts School Building Authority, Dedicated Sales Tax Revenue Bonds, Series 2005A, 5.000%, 8/15/30 | 8/15 at 100.00 | | AA+ | | | 167,206 | |
| | | | Massachusetts School Building Authority, Dedicated Sales Tax Revenue Bonds, Series 2005A: | | | | | | | |
| | 515 | | 5.000%, 8/15/30 (Pre-refunded 8/15/15) – AGM Insured | 8/15 at 100.00 | | Aa2 (4) | | | 558,368 | |
| | 3,325 | | 5.000%, 8/15/30 (Pre-refunded 8/15/15) | 8/15 at 100.00 | | Aa2 (4) | | | 3,604,998 | |
| NAD | Nuveen Dividend Advantage Municipal Fund (continued) |
| | Portfolio of Investments October 31, 2013 |
| | Principal | | | Optional Call | | | | | | |
| | Amount (000) | | Description (1) | Provisions (2) | | Ratings (3) | | | Value | |
| | | | Massachusetts (continued) | | | | | | | |
| $ | 1,100 | | Massachusetts Turnpike Authority, Metropolitan Highway System Revenue Bonds, Senior Series 1997A, 0.000%, 1/01/24 – NPFG Insured | No Opt. Call | | A+ | | $ | 769,945 | |
| | 19,730 | | Total Massachusetts | | | | | | 19,305,419 | |
| | | | Michigan – 3.5% (2.3% of Total Investments) | | | | | | | |
| | 885 | | Detroit Water and Sewerage Department, Michigan, Sewage Disposal System Revenue Bonds, Refunding Senior Lien Series 2012A, 5.250%, 7/01/39 | 7/22 at 100.00 | | BBB+ | | | 817,023 | |
| | 6,000 | | Detroit, Michigan, Second Lien Sewerage Disposal System Revenue Bonds, Series 2005A, 5.000%, 7/01/35 – NPFG Insured | 7/15 at 100.00 | | A | | | 5,418,540 | |
| | 2,500 | | Detroit, Michigan, Senior Lien Sewerage Disposal System Revenue Bonds, Series 2003A, 5.000%, 7/01/23 – AGM Insured | 1/14 at 100.00 | | AA– | | | 2,443,650 | |
| | 1,550 | | Detroit, Michigan, Sewer Disposal System Revenue Bonds, Second Lien, Series 2001E, 5.750%, 7/01/31 – BHAC Insured | 7/18 at 100.00 | | AA+ | | | 1,588,673 | |
| | 3,215 | | Detroit, Michigan, Water Supply System Senior Lien Revenue Bonds, Series 2004A, 5.250%, 7/01/18 – NPFG Insured | 7/16 at 100.00 | | A | | | 3,232,779 | |
| | 1,000 | | Detroit, Michigan, Water Supply System Senior Lien Revenue Refunding Bonds, Series 2005C, 5.000%, 7/01/17 – FGIC Insured | 7/15 at 100.00 | | A | | | 999,960 | |
| | 4,000 | | Detroit, Michigan, Water Supply System Senior Lien Revenue Refunding Bonds, Series 2006D, 5.000%, 7/01/32 – AGM Insured | 7/16 at 100.00 | | AA– | | | 3,715,240 | |
| | 1,150 | | Royal Oak Hospital Finance Authority, Michigan, Hospital Revenue Bonds, William Beaumont Hospital, Refunding Series 2009V, 8.250%, 9/01/39 | 9/18 at 100.00 | | A1 | | | 1,385,003 | |
| | 20,300 | | Total Michigan | | | | | | 19,600,868 | |
| | | | Minnesota – 1.9% (1.2% of Total Investments) | | | | | | | |
| | 6,375 | | Minneapolis Health Care System, Minnesota, Revenue Bonds, Fairview Hospital and Healthcare Services, Series 2008A, 6.625%, 11/15/28 | 11/18 at 100.00 | | A | | | 7,451,419 | |
| | 3,000 | | Minneapolis-St. Paul Metropolitan Airports Commission, Minnesota, Airport Revenue Bonds, Refunding Subordinate Lien Series 2005C, 5.000%, 1/01/25 – FGIC Insured | 1/15 at 100.00 | | A | | | 3,125,730 | |
| | 9,375 | | Total Minnesota | | | | | | 10,577,149 | |
| | | | Missouri – 2.1% (1.4% of Total Investments) | | | | | | | |
| | | | Kansas City Municipal Assistance Corporation, Missouri, Leasehold Revenue Bonds, Series 2004B-1: | | | | | | | |
| | 7,000 | | 0.000%, 4/15/27 – AMBAC Insured | No Opt. Call | | AA– | | | 3,771,880 | |
| | 5,000 | | 0.000%, 4/15/29 – AMBAC Insured | No Opt. Call | | AA– | | | 2,380,450 | |
| | 5,545 | | Missouri State Health and Educational Facilities Authority, Health Facilities Revenue Bonds, CoxHealth, Series 2013A, 5.000%, 11/15/48 | 11/23 at 100.00 | | A2 | | | 5,522,155 | |
| | 17,545 | | Total Missouri | | | | | | 11,674,485 | |
| | | | Nevada – 5.4% (3.6% of Total Investments) | | | | | | | |
| | 10,000 | | Clark County, Nevada, Airport Revenue Bonds, Subordinate Lien Series 2010B, 5.750%, 7/01/42 | 1/20 at 100.00 | | A+ | | | 10,894,400 | |
| | 9,675 | | Clark County, Nevada, Passenger Facility Charge Revenue Bonds, Las Vegas-McCarran International Airport, Series 2010A, 5.250%, 7/01/42 | 1/20 at 100.00 | | A+ | | | 9,904,394 | |
| | 3,750 | | Henderson, Nevada, Healthcare Facility Revenue Refunding Bonds, Catholic Healthcare West, Series 2008, Trust 2633 18.987%, 7/01/31 – BHAC Insured (IF), (6) | 7/17 at 100.00 | | AA+ | | | 4,166,250 | |
| | 1,500 | | Las Vegas Redevelopment Agency, Nevada, Tax Increment Revenue Bonds, Series 2009A, 8.000%, 6/15/30 | 6/19 at 100.00 | | BBB– | | | 1,618,260 | |
| | 5,000 | | North Las Vegas, Nevada, General Obligation Bonds, Series 2006, 5.000%,
5/01/36 – NPFG Insured | 5/16 at 100.00 | | A | | | 4,309,750 | |
| | 29,925 | | Total Nevada | | | | | | 30,893,054 | |
| | Principal | | | Optional Call | | | | | | |
| | Amount (000) | | Description (1) | Provisions (2) | | Ratings (3) | | | Value | |
| | | | New Jersey – 3.9% (2.6% of Total Investments) | | | | | | | |
| $ | 6,850 | | New Jersey Educational Facilities Authority, Revenue Bonds, University of Medicine and Dentistry of New Jersey, Refunding Series 2009B, 5.750%, 12/01/15 | No Opt. Call | | N/R | | $ | 7,606,240 | |
| | 4,000 | | New Jersey Transportation Trust Fund Authority, Transportation System Bonds, Series 1999A, 5.750%, 6/15/18 | No Opt. Call | | A+ | | | 4,777,600 | |
| | 20,000 | | New Jersey Transportation Trust Fund Authority, Transportation System Bonds, Series 2006C, 0.000%, 12/15/28 – AMBAC Insured | No Opt. Call | | A+ | | | 9,352,400 | |
| | 570 | | Rutgers State University, New Jersey, Revenue Bonds, Refunding Series 2013L, 5.000%, 5/01/43 | 5/23 at 100.00 | | AA– | | | 600,398 | |
| | 31,420 | | Total New Jersey | | | | | | 22,336,638 | |
| | | | New Mexico – 0.7% (0.4% of Total Investments) | | | | | | | |
| | 3,730 | | University of New Mexico, FHA-Insured Hospital Mortgage Revenue Bonds, University of Mexico Hospital Project, Series 2004, 5.000%, 7/01/32 – AGM Insured | 7/14 at 100.00 | | AA– | | | 3,803,668 | |
| | | | New York – 11.6% (7.7% of Total Investments) | | | | | | | |
| | 1,335 | | Dormitory Authority of the State of New York, Insured Revenue Bonds, Franciscan Health Partnership Obligated Group – Frances Shervier Home and Hospital, Series 1997, 5.500%, 7/01/17 – RAAI Insured | 1/14 at 100.00 | | A3 | | | 1,338,191 | |
| | 7,500 | | Dormitory Authority of the State of New York, Secured Hospital Revenue Refunding Bonds, Wyckoff Heights Medical Center, Series 1998H, 5.300%, 8/15/21 – NPFG Insured | 2/14 at 100.00 | | AA– | | | 7,531,650 | |
| | 1,100 | | Hudson Yards Infrastructure Corporation, New York, Revenue Bonds, Senior Fiscal 2012 Series 2011A, 5.250%, 2/15/47 | 2/21 at 100.00 | | A | | | 1,128,996 | |
| | 6,000 | | New York City Industrial Development Agency, New York, American Airlines-JFK International Airport Special Facility Revenue Bonds, Series 2005, 7.750%, 8/01/31 (Alternative Minimum Tax) | 8/16 at 101.00 | | N/R | | | 6,508,740 | |
| | 4,755 | | New York City Industrial Development Agency, New York, Revenue Bonds, Yankee Stadium Project PILOT, Series 2009A, 7.000%, 3/01/49 – AGC Insured | 3/19 at 100.00 | | AA– | | | 5,453,795 | |
| | 5,000 | | New York City Municipal Water Finance Authority, New York, Water and Sewerage System Revenue Bonds, Fiscal Series 2005A, 5.000%, 6/15/39 | 6/14 at 100.00 | | AAA | | | 5,033,400 | |
| | 5,000 | | New York City Municipal Water Finance Authority, New York, Water and Sewerage System Revenue Bonds, Series 2004B, 5.000%, 6/15/36 – AGM Insured (UB) | 12/14 at 100.00 | | AAA | | | 5,131,200 | |
| | 8,800 | | New York City Sales Tax Asset Receivable Corporation, New York, Dedicated Revenue Bonds, Local Government Assistance Corporation, Series 2004A, 5.000%, 10/15/32 – AMBAC Insured (UB), (6) | 10/14 at 100.00 | | AAA | | | 9,090,664 | |
| | 5,000 | | New York City Transitional Finance Authority, New York, Future Tax Secured Bonds, Subordinate Fiscal 2013 Series I, 5.000%, 5/01/38 | 5/23 at 100.00 | | AAA | | | 5,274,600 | |
| | 2,000 | | New York Liberty Development Corporation, Liberty Revenue Bonds, 4 World Trade Center Project, Series 2011, 5.750%, 11/15/51 | No Opt. Call | | A+ | | | 2,139,200 | |
| | | | Port Authority of New York and New Jersey, Special Project Bonds, JFK International Air Terminal LLC Project, Eighth Series 2010: | | | | | | | |
| | 5,000 | | 6.500%, 12/01/28 | 12/15 at 100.00 | | BBB | | | 5,246,150 | |
| | 1,670 | | 6.000%, 12/01/36 | 12/20 at 100.00 | | BBB | | | 1,806,756 | |
| | 10,000 | | Port Authority of New York and New Jersey, Special Project Bonds, JFK International Air Terminal LLC, Sixth Series 1997, 5.900%, 12/01/17 – NPFG Insured (Alternative Minimum Tax) | 12/13 at 100.00 | | A | | | 10,014,200 | |
| | 63,160 | | Total New York | | | | | | 65,697,542 | |
| | | | North Carolina – 1.6% (1.1% of Total Investments) | | | | | | | |
| | 1,500 | | Charlotte-Mecklenberg Hospital Authority, North Carolina, Health Care Revenue Bonds, DBA Carolinas HealthCare System, Series 2008A, 5.250%, 1/15/24 – AGC Insured | 1/18 at 100.00 | | AA– | | | 1,665,285 | |
| | 3,830 | | Charlotte-Mecklenburg Hospital Authority, North Carolina, Healthcare System Revenue Bonds, DBA Carolinas Healthcare System, Series 2005A, 5.000%, 1/15/45 (Pre-refunded 1/15/15) | 1/15 at 100.00 | | AA+ (4) | | | 4,051,221 | |
| | 3,400 | | North Carolina Medical Care Commission, Health Care Facilities Revenue Refunding Bonds, WakeMed, Series 2012A, 5.000%, 10/01/31 | 10/22 at 100.00 | | AA– | | | 3,494,656 | |
| | 8,730 | | Total North Carolina | | | | | | 9,211,162 | |
| NAD | Nuveen Dividend Advantage Municipal Fund (continued) |
| | Portfolio of Investments October 31, 2013 |
| | Principal | | | Optional Call | | | | | | |
| | Amount (000) | | Description (1) | Provisions (2) | | Ratings (3) | | | Value | |
| | | | North Dakota – 0.8% (0.5% of Total Investments) | | | | | | | |
| $ | 3,910 | | Fargo, North Dakota, Health System Revenue Bonds, Sanford Health, Refunding Series 2011, 6.250%, 11/01/31 | 11/21 at 100.00 | | A+ | | $ | 4,422,914 | |
| | | | Ohio – 5.5% (3.7% of Total Investments) | | | | | | | |
| | | | Buckeye Tobacco Settlement Financing Authority, Ohio, Tobacco Settlement Asset-Backed Revenue Bonds, Senior Lien, Series 2007A-2: | | | | | | | |
| | 1,820 | | 5.375%, 6/01/24 | 6/17 at 100.00 | | B– | | | 1,595,175 | |
| | 210 | | 5.125%, 6/01/24 | 6/17 at 100.00 | | B– | | | 179,487 | |
| | 5,155 | | 5.875%, 6/01/30 | 6/17 at 100.00 | | B | | | 4,198,799 | |
| | 1,890 | | 5.750%, 6/01/34 | 6/17 at 100.00 | | B | | | 1,479,870 | |
| | 1,000 | | 6.500%, 6/01/47 | 6/17 at 100.00 | | B | | | 846,010 | |
| | 3,930 | | 5.875%, 6/01/47 | 6/17 at 100.00 | | B | | | 3,052,863 | |
| | 6,135 | | Buckeye Tobacco Settlement Financing Authority, Ohio, Tobacco Settlement Asset-Backed Revenue Bonds, Senior Lien, Series 2007A-3, 6.250%, 6/01/37 | 6/22 at 100.00 | | B | | | 5,031,252 | |
| | 6,000 | | Butler County, Ohio, Hospital Facilities Revenue Bonds, UC Health, Series 2010, 5.250%, 11/01/29 | 11/20 at 100.00 | | BBB+ | | | 6,146,400 | |
| | 3,650 | | Montgomery County, Ohio, Revenue Bonds, Catholic Health Initiatives, Series 2004A, 5.000%, 5/01/30 | 5/14 at 100.00 | | A+ | | | 3,660,987 | |
| | 1,000 | | Ohio Air Quality Development Authority, Ohio, Revenue Bonds, Ohio Valley Electric Corporation Project, Series 2009E, 5.625%, 10/01/19 | No Opt. Call | | BBB– | | | 1,095,020 | |
| | | | Ohio Turnpike Commission, Turnpike Revenue Bonds, Infrastructure Project, Junior Lien Series 2013A-1: | | | | | | | |
| | 1,500 | | 5.250%, 2/15/39 | 2/23 at 100.00 | | A+ | | | 1,581,045 | |
| | 1,845 | | 5.000%, 2/15/48 | 2/23 at 100.00 | | A+ | | | 1,861,882 | |
| | 520 | | Warren County, Ohio, Limited Tax General Obligations, Series 1997, 5.500%, 12/01/17 | 12/13 at 100.00 | | Aa1 | | | 522,298 | |
| | 34,655 | | Total Ohio | | | | | | 31,251,088 | |
| | | | Oklahoma – 0.2% (0.1% of Total Investments) | | | | | | | |
| | 1,000 | | Fort Sill Apache Tribe of Oklahoma Economic Development Authority, Gaming Enterprise Revenue Bonds, Fort Sill Apache Casino, Series 2011A, 8.500%, 8/25/26 | 8/21 at 100.00 | | N/R | | | 1,074,660 | |
| | | | Pennsylvania – 2.6% (1.7% of Total Investments) | | | | | | | |
| | 1,250 | | Erie Water Authority, Pennsylvania, Water Revenue Bonds, Series 2008, 5.000%, 12/01/43 – AGM Insured | 12/18 at 100.00 | | AA– | | | 1,258,300 | |
| | 1,500 | | Pennsylvania Housing Finance Agency, Single Family Mortgage Revenue Bonds, Series 2006-96A, 4.650%, 10/01/31 (Alternative Minimum Tax) (UB) | 10/16 at 100.00 | | AA+ | | | 1,494,525 | |
| | 8,200 | | Pennsylvania Turnpike Commission, Turnpike Revenue Bonds, Capital Appreciation Series 2009E, 0.000%, 12/01/38 | 12/27 at 100.00 | | A– | | | 7,215,262 | |
| | 5,000 | | Pennsylvania Turnpike Commission, Turnpike Revenue Bonds, Subordinate Series 2009C, 0.000%, 6/01/33 – AGM Insured | 6/26 at 100.00 | | AA | | | 4,876,400 | |
| | 15,950 | | Total Pennsylvania | | | | | | 14,844,487 | |
| | | | Puerto Rico – 5.3% (3.6% of Total Investments) | | | | | | | |
| | 2,500 | | Puerto Rico Aqueduct and Sewerage Authority, Revenue Bonds, Senior Lien Series 2008A, 6.000%, 7/01/44 | 7/18 at 100.00 | | BBB– | | | 1,935,675 | |
| | 1,045 | | Puerto Rico Highway and Transportation Authority, Subordinate Lien Highway Revenue Bonds, Series 2003, 5.250%, 7/01/17 – FGIC Insured | 1/14 at 100.00 | | BBB– | | | 951,075 | |
| | 4,300 | | Puerto Rico Housing Finance Authority, Capital Fund Program Revenue Bonds, Series 2003, 4.500%, 12/01/23 | 12/13 at 100.00 | | AA– | | | 4,221,611 | |
| | 8,200 | | Puerto Rico Housing Finance Authority, Capital Fund Program Revenue Bonds, Series 2003, 4.500%, 12/01/23 (Pre-refunded 12/01/13) | 12/13 at 100.00 | | Aaa | | | 8,229,766 | |
| | 12,845 | | Puerto Rico Infrastructure Financing Authority, Special Tax Revenue Bonds, Series 2005A, 0.000%, 7/01/42 – FGIC Insured | No Opt. Call | | BBB+ | | | 1,199,338 | |
| | Principal | | | Optional Call | | | | | | |
| | Amount (000) | | Description (1) | Provisions (2) | | Ratings (3) | | | Value | |
| | | | Puerto Rico (continued) | | | | | | | |
| $ | 10,000 | | Puerto Rico Sales Tax Financing Corporation, Sales Tax Revenue Bonds, First Subordinate Series 2009A, 6.000%, 8/01/42 | 8/19 at 100.00 | | A+ | | $ | 8,657,800 | |
| | 2,105 | | Puerto Rico Sales Tax Financing Corporation, Sales Tax Revenue Bonds, First Subordinate Series 2010A, 5.500%, 8/01/37 | 2/20 at 100.00 | | A+ | | | 1,724,984 | |
| | 4,310 | | Puerto Rico Sales Tax Financing Corporation, Sales Tax Revenue Bonds, First Subordinate Series 2010C, 5.250%, 8/01/41 | 8/20 at 100.00 | | A+ | | | 3,378,652 | |
| | 45,305 | | Total Puerto Rico | | | | | | 30,298,901 | |
| | | | Rhode Island – 3.3% (2.2% of Total Investments) | | | | | | | |
| | 2,015 | | Central Falls, Rhode Island, General Obligation School Bonds, Series 1999, 6.250%, 5/15/20 – RAAI Insured | 11/13 at 100.00 | | BB | | | 1,859,704 | |
| | 3,000 | | Rhode Island Economic Development Corporation, Airport Revenue Bonds, Refunding Series 2005A, 4.625%, 7/01/26 – NPFG Insured (Alternative Minimum Tax) | 7/15 at 100.00 | | A | | | 2,988,540 | |
| | 1,428 | | Rhode Island Housing & Mortgage Finance Corporation, Homeownership Opportunity 57-B Bond Program, Series 2008, Trust 1177, 9.744%, 4/01/23 (Alternative Minimum Tax) (IF) | 4/17 at 100.00 | | AA+ | | | 1,483,920 | |
| | 12,500 | | Rhode Island Tobacco Settlement Financing Corporation, Tobacco Settlement Asset-Backed Bonds, Series 2002A, 6.125%, 6/01/32 | 1/14 at 100.00 | | BBB+ | | | 12,396,625 | |
| | 18,943 | | Total Rhode Island | | | | | | 18,728,789 | |
| | | | South Carolina – 0.4% (0.3% of Total Investments) | | | | | | | |
| | 2,045 | | Florence County, South Carolina, Hospital Revenue Bonds, McLeod Regional Medical Center, Series 2004A, 5.250%, 11/01/27 – AGM Insured | 11/14 at 100.00 | | AA– | | | 2,109,131 | |
| | | | Tennessee – 0.4% (0.3% of Total Investments) | | | | | | | |
| | 2,310 | | Sullivan County Health Educational and Housing Facilities Board, Tennessee, Revenue Bonds, Wellmont Health System, Series 2006C, 5.250%, 9/01/36 | 9/16 at 100.00 | | BBB+ | | | 2,315,544 | |
| | 1,500 | | Sumner County Health, Educational, and Housing Facilities Board, Tennessee, Revenue Refunding Bonds, Sumner Regional Health System Inc., Series 2007, 5.500%, 11/01/46 (5) | 11/17 at 100.00 | | N/R | | | 3,600 | |
| | 3,810 | | Total Tennessee | | | | | | 2,319,144 | |
| | | | Texas – 11.7% (7.8% of Total Investments) | | | | | | | |
| | 2,560 | | Brazos River Authority, Texas, Pollution Control Revenue Refunding Bonds, TXU Electric Company, Series 1999C, 7.700%, 3/01/32 (Alternative Minimum Tax) | 4/14 at 100.00 | | C | | | 38,374 | |
| | 2,000 | | Capital Area Cultural Education Facilities Finance Corporation, Texas, Revenue Bonds, The Roman Catholic Diocese of Austin, Series 2005B. Remarketed, 6.125%, 4/01/45 | 4/20 at 100.00 | | Baa1 | | | 2,120,980 | |
| | 1,215 | | Cedar Hill Independent School District, Dallas County, Texas, General Obligation Bonds, Refunding School Building Series 2005, 5.000%, 8/15/34 | 8/15 at 100.00 | | AAA | | | 1,276,503 | |
| | 1,630 | | Cedar Hill Independent School District, Dallas County, Texas, General Obligation Bonds, Refunding School Building Series 2005, 5.000%, 8/15/34 (Pre-refunded 8/15/15) | 8/15 at 100.00 | | N/R (4) | | | 1,766,887 | |
| | 2,820 | | Central Texas Regional Mobility Authority, Revenue Bonds, Senior Lien Series 2005, 5.000%, 1/01/45 (Pre-refunded 1/01/15) – FGIC Insured | 1/15 at 100.00 | | A (4) | | | 2,976,115 | |
| | 3,000 | | Dallas-Fort Worth International Airport, Texas, Joint Revenue Bonds, Refunding Series 2012E, 5.000%, 11/01/42 (Alternative Minimum Tax) | No Opt. Call | | A+ | | | 2,846,190 | |
| | 15 | | Denton Independent School District, Denton County, Texas, General Obligation Bonds, Refunding Series 2004, 5.000%, 8/15/33 | No Opt. Call | | AAA | | | 15,384 | |
| | 2,085 | | Denton Independent School District, Denton County, Texas, General Obligation Bonds, Refunding Series 2004, 5.000%, 8/15/33 (Pre-refunded 8/15/14) | 8/14 at 100.00 | | N/R (4) | | | 2,164,730 | |
| | 2,305 | | Harris County-Houston Sports Authority, Texas, Senior Lien Revenue Refunding Bonds, Series 2001A, 0.000%, 11/15/20 – NPFG Insured | No Opt. Call | | A | | | 1,592,824 | |
| | 245 | | Harris County-Houston Sports Authority, Texas, Senior Lien Special Revenue Bonds, Series 1998A, 5.000%, 11/15/28 – NPFG Insured | 1/14 at 100.00 | | A | | | 244,988 | |
| | 4,000 | | Houston, Texas, First Lien Combined Utility System Revenue Bonds, Refunding Series 2009A, 5.125%, 11/15/32 – AGC Insured | No Opt. Call | | AA | | | 4,292,280 | |
| NAD | Nuveen Dividend Advantage Municipal Fund (continued) |
| | Portfolio of Investments October 31, 2013 |
| | Principal | | | Optional Call | | | | | | |
| | Amount (000) | | Description (1) | Provisions (2) | | Ratings (3) | | | Value | |
| | | | Texas (continued) | | | | | | | |
| | | | Houston, Texas, Hotel Occupancy Tax and Special Revenue Bonds, Convention and Entertainment Project, Series 2001B: | | | | | | | |
| $ | 3,130 | | 0.000%, 9/01/30 – AMBAC Insured | No Opt. Call | | A2 | | $ | 1,263,957 | |
| | 12,030 | | 0.000%, 9/01/31 – AMBAC Insured | No Opt. Call | | A2 | | | 4,492,724 | |
| | 9,345 | | Leander Independent School District, Williamson and Travis Counties, Texas, General Obligation Bonds, Series 2005, 0.000%, 8/15/33 – FGIC Insured | 8/15 at 37.33 | | AA– | | | 3,282,338 | |
| | 33,160 | | Leander Independent School District, Williamson and Travis Counties, Texas, General Obligation Bonds, Series 2006, 0.000%, 8/15/38 | 8/14 at 26.50 | | AAA | | | 8,434,246 | |
| | 1,845 | | Midlothian Independent School District, Ellis County, Texas, General Obligation Bonds, Series 2005, 5.000%, 2/15/34 | No Opt. Call | | Aaa | | | 1,913,689 | |
| | 3,405 | | Midlothian Independent School District, Ellis County, Texas, General Obligation Bonds, Series 2005, 5.000%, 2/15/34 (Pre-refunded 2/15/15) | 2/15 at 100.00 | | N/R (4) | | | 3,614,237 | |
| | 1,000 | | San Antonio, Texas, Water System Revenue Bonds, Series 2005, 4.750%,
5/15/37 – NPFG Insured | 5/15 at 100.00 | | AA+ | | | 1,039,960 | |
| | 3,295 | | Tarrant County Cultural Education Facilities Finance Corporation, Texas, Revenue Bonds, Residuals 1760-3, 17.194%, 2/15/36 (IF) | 2/17 at 100.00 | | AA– | | | 3,357,407 | |
| | 8,230 | | Texas Municipal Gas Acquisition and Supply Corporation III, Gas Supply Revenue Bonds, Series 2012, 5.000%, 12/15/29 | No Opt. Call | | A3 | | | 8,122,763 | |
| | 5,000 | | Texas Transportation Commission, Central Texas Turnpike System Revenue Bonds, First Tier Refunding Series 2012A, 5.000%, 8/15/41 | 8/22 at 100.00 | | A– | | | 4,984,700 | |
| | 7,000 | | White Settlement Independent School District, Tarrant County, Texas, General Obligation Bonds, Series 2005, 0.000%, 8/15/35 | 8/15 at 34.92 | | AAA | | | 2,114,560 | |
| | | | Wylie Independent School District, Collin County, Texas, General Obligation Bonds, Series 2005: | | | | | | | |
| | 3,000 | | 0.000%, 8/15/20 (Pre-refunded 8/15/15) | 8/15 at 78.46 | | AAA | | | 2,332,980 | |
| | 3,000 | | 0.000%, 8/15/22 (Pre-refunded 8/15/15) | 8/15 at 70.77 | | AAA | | | 2,104,290 | |
| | 115,315 | | Total Texas | | | | | | 66,393,106 | |
| | | | Utah – 0.0% (0.0% of Total Investments) | | | | | | | |
| | 105 | | Utah Housing Finance Agency, Single Family Mortgage Bonds, Series 2000F-2, Class III, 6.000%, 1/01/15 (Alternative Minimum Tax) | 1/14 at 100.00 | | AAA | | | 105,315 | |
| | | | Virginia – 1.1% (0.7% of Total Investments) | | | | | | | |
| | 1,500 | | Fairfax County Economic Development Authority, Virginia, Residential Care Facilities Mortgage Revenue Bonds, Goodwin House, Inc., Series 2007A, 5.125%, 10/01/42 | 10/17 at 100.00 | | BBB | | | 1,505,205 | |
| | 1,500 | | Henrico County Economic Development Authority, Virginia, Revenue Bonds, Bon Secours Health System Obligated Group, Series 2013, 5.000%, 11/01/30 | No Opt. Call | | A– | | | 1,546,605 | |
| | 3,000 | | Prince William County Industrial Development Authority, Virginia, Health Care Facilities Revenue Refunding Bonds, Novant Health Obligated Group-Prince William Hospital, Series 2013B, 5.000%, 11/01/46 | 11/22 at 100.00 | | AA– | | | 3,016,200 | |
| | 1,050 | | Route 460 Funding Corporation, Virginia, Toll Road Revenue Bonds, Series 2012B, 0.000%, 7/01/35 | No Opt. Call | | BBB– | | | 271,457 | |
| | 7,050 | | Total Virginia | | | | | | 6,339,467 | |
| | | | Washington – 7.1% (4.7% of Total Investments) | | | | | | | |
| | 4,000 | | Washington Health Care Facilities Authority, Revenue Bonds, Providence Health & Services, Series 2012A, 5.000%, 10/01/32 | 10/22 at 100.00 | | AA | | | 4,116,520 | |
| | 2,000 | | Washington State Health Care Facilities Authority, Revenue Bonds, Fred Hutchinson Cancer Research Center, Series 2009A, 6.000%, 1/01/33 | 7/19 at 100.00 | | A | | | 2,089,960 | |
| | 3,350 | | Washington, General Obligation Compound Interest Bonds, Series 1999S-2, 0.000%, 1/01/18 – AGM Insured | No Opt. Call | | AA+ | | | 3,155,600 | |
| | Principal | | | Optional Call | | | | | | |
| | Amount (000) | | Description (1) | Provisions (2) | | Ratings (3) | | | Value | |
| | | | Washington (continued) | | | | | | | |
| | | | Washington, General Obligation Compound Interest Bonds, Series 1999S-3: | | | | | | | |
| $ | 17,650 | | 0.000%, 1/01/20 | No Opt. Call | | AA+ | | $ | 15,365,914 | |
| | 18,470 | | 0.000%, 1/01/21 | No Opt. Call | | AA+ | | | 15,326,775 | |
| | 45,470 | | Total Washington | | | | | | 40,054,769 | |
| | | | Wisconsin – 6.2% (4.1% of Total Investments) | | | | | | | |
| | 1,690 | | Green Bay, Wisconsin, Water System Revenue Bonds, Series 2004, 5.000%, 11/01/29 (Pre-refunded 11/01/14) – AGM Insured | 11/14 at 100.00 | | Aa2 (4) | | | 1,771,255 | |
| | 560 | | Green Bay, Wisconsin, Water System Revenue Bonds, Series 2004, 5.000%, 11/01/29 – AGM Insured | 11/14 at 100.00 | | Aa2 | | | 575,792 | |
| | 7,620 | | Wisconsin Health and Educational Facilities Authority, Revenue Bonds, Ascension Health, Series 2006A, 5.000%, 11/15/36 | 11/16 at 100.00 | | AA+ | | | 7,679,588 | |
| | 1,000 | | Wisconsin Health and Educational Facilities Authority, Revenue Bonds, Bellin Memorial Hospital Inc., Series 2003, 5.500%, 2/15/19 – AMBAC Insured | No Opt. Call | | A2 | | | 1,081,590 | |
| | 4,330 | | Wisconsin Health and Educational Facilities Authority, Revenue Bonds, Childrens Hospital of Wisconsin Inc., Series 2008B, 5.500%, 8/15/29 | 2/20 at 100.00 | | AA– | | | 4,605,994 | |
| | 1,965 | | Wisconsin Health and Educational Facilities Authority, Revenue Bonds, Fort Healthcare Inc., Series 2004, 6.100%, 5/01/34 | 5/14 at 100.00 | | BBB+ | | | 2,002,355 | |
| | 1,250 | | Wisconsin Health and Educational Facilities Authority, Revenue Bonds, Marshfield Clinic, Series 2012B, 5.000%, 2/15/32 | 2/22 at 100.00 | | A– | | | 1,251,163 | |
| | 3,000 | | Wisconsin Public Power Incorporated System, Power Supply System Revenue Bonds, Series 2005A, 5.000%, 7/01/35 – AMBAC Insured | 7/15 at 100.00 | | Aa1 | | | 3,110,100 | |
| | | | Wisconsin State, General Fund Annual Appropriation Revenue Bonds, Refunding Series 2009A: | | | | | | | |
| | 6,650 | | 6.000%, 5/01/36 | 5/19 at 100.00 | | AA– | | | 7,441,217 | |
| | 5,100 | | 6.250%, 5/01/37 | 5/19 at 100.00 | | AA– | | | 5,681,094 | |
| | 33,165 | | Total Wisconsin | | | | | | 35,200,148 | |
| $ | 1,054,670 | | Total Municipal Bonds (cost $838,802,021) | | | | | | 853,733,592 | |
| | Principal | | | | | | | | | | |
| | Amount (000) | | Description (1) | Coupon | Maturity | | Ratings (3) | | | Value | |
| | | | Corporate Bonds – 0.0% (0.0% of Total Investments) | | | | | | | | |
| | | | Transportation – 0.0% (0.0% of Total Investments) | | | | | | | | |
| $ | 248 | | Las Vegas Monorail Company, Senior Interest Bonds (7), (8) | 5.500% | 7/15/19 | | N/R | | $ | 44,686 | |
| | 71 | | Las Vegas Monorail Company, Senior Interest Bonds (7), (8) | 3.000% | 7/15/55 | | N/R | | | 9,454 | |
| $ | 319 | | Total Corporate Bonds (cost $12,627) | | | | | | | 54,140 | |
| NAD | Nuveen Dividend Advantage Municipal Fund (continued) |
| | Portfolio of Investments October 31, 2013 |
| Shares | | Description (1), (9) | | | Value | |
| | | Investment Companies – 0.1% ( 0.1% of Total Investments) | | | | |
| 8,812 | | BlackRock MuniHoldings Fund Inc. | | $ | 134,559 | |
| 32,524 | | Invesco Quality Municipal Income Trust | | | 371,099 | |
| | | Total Investment Companies (cost $530,611) | | | 505,658 | |
| | | Total Long-Term Investments (cost $839,345,259) | | | 854,293,390 | |
| | | Floating Rate Obligations – (7.6)% | | | (42,810,000 | ) |
| | | MuniFund Term Preferred Shares, at Liquidation Value – (25.5)% (10) | | | (144,300,000 | ) |
| | | Variable Rate MuniFund Term Preferred Shares, at Liquidation Value – (21.3)% (10) | | | (120,400,000 | ) |
| | | Other Assets Less Liabilities – 3.6% | | | 19,703,732 | |
| | | Net Assets Applicable to Common Shares – 100% | | $ | 566,487,122 | |
| (1) | All percentages shown in the Portfolio of Investments are based on net assets applicable to Common shares unless otherwise noted. |
| (2) | Optional Call Provisions (not covered by the report of independent registered public accounting firm): Dates (month and year) and prices of the earliest optional call or redemption. There may be other call provisions at varying prices at later dates. Certain mortgage-backed securities may be subject to periodic principal paydowns. |
| (3) | Ratings (not covered by the report of independent registered public accounting firm): Using the highest of Standard & Poor’s Group (“Standard & Poor’s”), Moody’s Investors Service, Inc. (“Moody’s”) or Fitch, Inc. (“Fitch”) rating. Ratings below BBB by Standard & Poor’s, Baa by Moody’s or BBB by Fitch are considered to be below investment grade. Holdings designated N/R are not rated by any of these national rating agencies. |
| (4) | Backed by an escrow or trust containing sufficient U.S. Government or U.S. Government agency securities, which ensure the timely payment of principal and interest. Certain bonds backed by U.S. Government or agency securities are regarded as having an implied rating equal to the rating of such securities. |
| (5) | At or subsequent to the end of the reporting period, this security is non-income producing. Non-income producing security, in the case of a fixed-income security, generally denotes that the issuer has (1) defaulted on the payment of principal or interest, (2) is under the protection of the Federal Bankruptcy Court or (3) the Fund’s Adviser has concluded that the issue is not likely to meet its future interest payment obligations and has directed the Fund’s custodian to cease accruing additional income on the Fund’s records. |
| (6) | Investment, or portion of investment, has been pledged to collateralize the net payment obligations for investments in inverse floating rate transactions. |
| (7) | Investment valued at fair value using methods determined in good faith by, or at the discretion of, the Board of Trustees. For fair value measurement disclosure purposes, investment categorized as Level 3. See Notes to Financial Statements, Note 2 – Investment Valuation and Fair Value Measurements for more information. |
| (8) | During January 2010, Las Vegas Monorail Company (“Las Vegas Monorail”) filed for federal bankruptcy protection. During March 2012, Las Vegas Monorail emerged from federal bankruptcy with the acceptance of a reorganization plan assigned by the Federal Bankruptcy Court. Under the reorganization plan, the Fund surrendered its Las Vegas Monorail Project Revenue Bonds, First Tier, Series 2000 and in turn received two senior interest corporate bonds: the first with an annual coupon rate of 5.500% maturing on July 15, 2019 and the second with an annual coupon rate of 3.000% (5.500% after December 31, 2015) maturing on July 15, 2055. The Fund’s custodian is not accruing income on the Fund’s records for either senior interest corporate bond. |
| (9) | A copy of the most recent financial statements for the investment companies in which the Fund invests can be obtained directly from the Securities and Exchange Commission on its website at http://www.sec.gov. |
| (10) | MuniFund Term Preferred Shares and Variable Rate MuniFund Term Preferred Shares, at Liquidation Value as a percentage of Total Investments are 16.9% and 14.1%, respectively. |
| WI/DD | Purchased on a when-issued or delayed delivery basis. |
| (ETM) | Escrowed to maturity. |
| (IF) | Inverse floating rate investment. |
| (UB) | Underlying bond of an inverse floating rate trust reflected as a financing transaction. See Notes to Financial Statements, Note 3 – Portfolio Securities and Investments in Derivatives, Inverse Floating Rate Securities for more information. |
See accompanying notes to financial statements.
| NXZ | |
| | Nuveen Dividend Advantage Municipal Fund 2 |
| | Portfolio of Investments |
| | October 31, 2013 |
| | Principal | | | Optional Call | | | | | | |
| | Amount (000) | | Description (1) | Provisions (2) | | Ratings (3) | | | Value | |
| | | | LONG-TERM INVESTMENTS – 146.9% (100% of Total Investments) | | | | | | | |
| | | | MUNICIPAL BONDS- 146.9% (100% of Total Investments) | | | | | | | |
| | | | Alabama – 0.5% (0.3% of Total Investments) | | | | | | | |
| $ | 2,030 | | Alabama Special Care Facilities Financing Authority, Revenue Bonds, Ascension Health, Series 2006C-2, 5.000%, 11/15/39 | 11/16 at 100.00 | | AA+ | | $ | 2,040,739 | |
| | | | Alaska – 2.1% (1.4% of Total Investments) | | | | | | | |
| | 5,140 | | Alaska Municipal Bond Bank Authority, Revenue Bonds, Series 2003B, 5.250%, 12/01/22 – NPFG Insured | 12/13 at 100.00 | | AA | | | 5,160,560 | |
| | 2,290 | | Anchorage, Alaska, Water Revenue Bonds, Refunding Series 2007, 5.000%, 5/01/37 – NPFG Insured | 5/17 at 100.00 | | AA | | | 2,336,876 | |
| | 2,285 | | Northern Tobacco Securitization Corporation, Alaska, Tobacco Settlement Asset-Backed Bonds, Series 2006A, 5.000%, 6/01/46 | 6/14 at 100.00 | | B2 | | | 1,582,088 | |
| | 9,715 | | Total Alaska | | | | | | 9,079,524 | |
| | | | Arizona – 1.8% (1.2% of Total Investments) | | | | | | | |
| | 4,500 | | Phoenix Civic Improvement Corporation, Arizona, Junior Lien Airport Revenue Bonds, Series 2010A, 5.000%, 7/01/40 | 7/20 at 100.00 | | A+ | | | 4,547,970 | |
| | 2,905 | | Salt River Project Agricultural Improvement and Power District, Arizona, Electric System Revenue Bonds, Series 2008A, 5.000%, 1/01/33 | No Opt. Call | | Aa1 | | | 3,089,729 | |
| | 7,405 | | Total Arizona | | | | | | 7,637,699 | |
| | | | California – 23.5% (16.0% of Total Investments) | | | | | | | |
| | 1,000 | | California County Tobacco Securitization Agency, Tobacco Settlement Asset-Backed Bonds, Golden Gate Tobacco Funding Corporation, Turbo, Series 2007A, 5.000%, 6/01/36 | 6/17 at 100.00 | | BB | | | 771,840 | |
| | | | California County Tobacco Securitization Agency, Tobacco Settlement Asset-Backed Bonds, Los Angeles County Securitization Corporation, Series 2006A: | | | | | | | |
| | 3,280 | | 5.450%, 6/01/28 | 12/18 at 100.00 | | B+ | | | 2,929,991 | |
| | 9,000 | | 5.600%, 6/01/36 | 12/18 at 100.00 | | BB– | | | 7,535,520 | |
| | 4,080 | | California Health Facilities Financing Authority, Revenue Bonds, Kaiser Permanante System, Series 2006, 5.000%, 4/01/37 – BHAC Insured | 4/16 at 100.00 | | AA+ | | | 4,103,786 | |
| | 4,000 | | California State, General Obligation Bonds, Series 2004, 5.000%, 6/01/31 – AMBAC Insured | 12/14 at 100.00 | | AA+ | | | 4,129,240 | |
| | 4,250 | | California State, General Obligation Bonds, Various Purpose Series 2010, 5.250%, 11/01/40 | 11/20 at 100.00 | | A1 | | | 4,442,185 | |
| | 3,000 | | California State, General Obligation Bonds, Various Purpose Series 2011, 5.250%, 10/01/32 | 10/21 at 100.00 | | A1 | | | 3,233,220 | |
| | 4,000 | | Coast Community College District, Orange County, California, General Obligation Bonds, Series 2005, 0.000%, 8/01/22 – NPFG Insured | No Opt. Call | | Aa1 | | | 2,922,360 | |
| | 4,505 | | Foothill-De Anza Community College District, Santa Clara County, California, Election of 1999 General Obligation Bonds, Series A, 0.000%, 8/01/30 – NPFG Insured | No Opt. Call | | Aaa | | | 2,035,404 | |
| | 20,000 | | Golden State Tobacco Securitization Corporation, California, Enhanced Tobacco Settlement Asset-Backed Revenue Bonds, Series 2005A, 5.000%, 6/01/45 – FGIC Insured | 6/15 at 100.00 | | A2 | | | 19,232,000 | |
| | | | Golden State Tobacco Securitization Corporation, California, Tobacco Settlement Asset-Backed Bonds, Series 2007A-1: | | | | | | | |
| | 3,350 | | 5.000%, 6/01/33 | 6/17 at 100.00 | | B | | | 2,582,348 | |
| | 1,000 | | 5.125%, 6/01/47 | 6/17 at 100.00 | | B | | | 700,870 | |
| | 3,000 | | Los Angeles County Sanitation Districts Financing Authority, California, Capital Projects Revenue Bonds, District 14, Series 2005, 5.000%, 10/01/34 – FGIC Insured | 10/15 at 100.00 | | AA– | | | 3,095,970 | |
| NXZ | Nuveen Dividend Advantage Municipal Fund 2 (continued) |
| | Portfolio of Investments October 31, 2013 |
| | Principal | | | Optional Call | | | | | | |
| | Amount (000) | | Description (1) | Provisions (2) | | Ratings (3) | | | Value | |
| | | | California (continued) | | | | | | | |
| $ | 6,000 | | Los Angeles Regional Airports Improvement Corporation, California, Sublease Revenue Bonds, Los Angeles International Airport, American Airlines Inc. Terminal 4 Project, Series 2002C, 7.500%, 12/01/24 (Alternative Minimum Tax) | 12/13 at 101.00 | | N/R | | $ | 6,075,900 | |
| | 1,160 | | Mount San Antonio Community College District, Los Angeles County, California, General Obligation Bonds, Election of 2008, Series 2013A, 0.000%, 8/01/43 | 8/35 at 100.00 | | AA | | | 554,028 | |
| | 3,285 | | Murrieta Valley Unified School District Public Financing Authority, California, Special Tax Revenue Bonds, Series 2006A, 5.125%, 9/01/26 – AGM Insured | 9/16 at 100.00 | | AA– | | | 3,524,739 | |
| | 10,885 | | Norwalk La Mirada Unified School District, Los Angeles County, California, General Obligation Bonds, Election of 2002 Series 2005B, 0.000%, 8/01/25 – FGIC Insured | No Opt. Call | | Aa3 | | | 6,422,477 | |
| | 5,000 | | Palomar Pomerado Health, California, General Obligation Bonds, Series 2009A, 0.000%, 8/01/38 – AGC Insured | 8/29 at 100.00 | | AA– | | | 3,971,450 | |
| | 1,750 | | Paramount Unified School District, Los Angeles County, California, General Obligation Bonds, Series 2001B, 0.000%, 9/01/23 – AGM Insured | No Opt. Call | | AA– | | | 1,187,778 | |
| | 2,000 | | Rancho Mirage Joint Powers Financing Authority, California, Revenue Bonds, Eisenhower Medical Center, Series 2007A, 5.000%, 7/01/47 | 7/17 at 100.00 | | Baa2 | | | 1,856,300 | |
| | 3,200 | | Redlands Unified School District, San Bernardino County, California, General Obligation Bonds, Series 2003, 0.000%, 7/01/27 – AGM Insured | No Opt. Call | | AA– | | | 1,656,832 | |
| | 3,000 | | Riverside Unified School District, Riverside County, California, General Obligation Bonds,Election 2001 Series 2006B, 5.000%, 8/01/30 – AGC Insured | 8/15 at 101.00 | | Aa2 | | | 3,164,190 | |
| | 2,755 | | Sacramento City Unified School District, Sacramento County, California, General Obligation Bonds, Series 2007, 0.000%, 7/01/25 – AGM Insured | No Opt. Call | | A1 | | | 1,601,399 | |
| | 4,150 | | San Joaquin Delta Community College District, California, General Obligation Bonds, Election 2004 Series 2008B, 0.000%, 8/01/29 – AGM Insured | 8/18 at 53.32 | | Aa2 | | | 1,787,198 | |
| | 12,705 | | San Joaquin Hills Transportation Corridor Agency, Orange County, California, Toll Road Revenue Refunding Bonds, Series 1997A, 0.000%, 1/15/32 – NPFG Insured | No Opt. Call | | A | | | 4,028,247 | |
| | 5,000 | | San Jose, California, Airport Revenue Bonds, Series 2007A, 6.000%, 3/01/47 – AMBAC Insured (Alternative Minimum Tax) | 3/17 at 100.00 | | A2 | | | 5,254,200 | |
| | 1,930 | | San Mateo County Transit District, California, Sales Tax Revenue Bonds, Series 2005A, 5.000%, 6/01/29 – NPFG Insured | 6/15 at 100.00 | | AA | | | 2,025,130 | |
| | 127,285 | | Total California | | | | | | 100,824,602 | |
| | | | Colorado – 9.7% (6.6% of Total Investments) | | | | | | | |
| | 4,445 | | Colorado Health Facilities Authority, Colorado, Revenue Bonds, Catholic Health Initiatives, Series 2013A, 5.250%, 1/01/45 (WI/DD, Settling 11/14/13) | 1/23 at 100.00 | | A+ | | | 4,420,997 | |
| | 4,000 | | Colorado Health Facilities Authority, Colorado, Revenue Bonds, Sisters of Charity of Leavenworth Health Services Corporation, Series 2010A, 5.000%, 1/01/40 | 1/20 at 100.00 | | AA– | | | 4,022,920 | |
| | 2,000 | | Colorado Health Facilities Authority, Colorado, Revenue Bonds, Valley View Hospital Association, Series 2007, 5.250%, 5/15/42 | 5/17 at 100.00 | | BBB+ | | | 1,978,060 | |
| | 3,250 | | Colorado Health Facilities Authority, Colorado, Revenue Bonds, Yampa Valley Medical Center, Series 2007, 5.125%, 9/15/29 | 9/17 at 100.00 | | BBB+ | | | 3,271,320 | |
| | | | Denver City and County, Colorado, Airport Revenue Bonds, Series 2006: | | | | | | | |
| | 5,365 | | 5.000%, 11/15/23 – FGIC Insured (UB) | 11/16 at 100.00 | | A+ | | | 5,890,019 | |
| | 3,300 | | 5.000%, 11/15/24 – FGIC Insured | 11/16 at 100.00 | | A+ | | | 3,612,939 | |
| | 4,335 | | 5.000%, 11/15/25 – FGIC Insured (UB) | 11/16 at 100.00 | | A+ | | | 4,670,919 | |
| | 10,000 | | E-470 Public Highway Authority, Colorado, Senior Revenue Bonds, Capital Appreciation Series 2010A, 0.000%, 9/01/41 | No Opt. Call | | BBB | | | 1,995,000 | |
| | 8,000 | | E-470 Public Highway Authority, Colorado, Toll Revenue Bonds, Series 2004B, 0.000%, 9/01/28 – NPFG Insured | 9/20 at 63.98 | | A | | | 3,561,360 | |
| | 755 | | Jefferson County School District R1, Colorado, General Obligation Bonds, Series 2004, 5.000%, 12/15/22 (Pre-refunded 12/15/14) – AGM Insured | 12/14 at 100.00 | | Aa2 (4) | | | 795,604 | |
| | 1,000 | | Plaza Metropolitan District 1, Lakewood, Colorado, Tax Increment Revenue Bonds, Series 2003, 8.000%, 12/01/25 (Pre-refunded 6/01/14) | 6/14 at 101.00 | | N/R (4) | | | 1,055,350 | |
| | Principal | | | Optional Call | | | | | | |
| | Amount (000) | | Description (1) | Provisions (2) | | Ratings (3) | | | Value | |
| | | | Colorado (continued) | | | | | | | |
| $ | 960 | | Regional Transportation District, Colorado, Certificates of Participation, Series 2010A, 5.375%, 6/01/31 | 6/20 at 100.00 | | Aa3 | | $ | 1,021,133 | |
| | 5,000 | | Thornton, Colorado, Water Enterprise Revenue Bonds, Series 2004, 5.000%, 12/01/34 (Pre-refunded 12/01/14) – NPFG Insured | 12/14 at 100.00 | | AA (4) | | | 5,259,850 | |
| | 52,410 | | Total Colorado | | | | | | 41,555,471 | |
| | | | District of Columbia – 1.3% (0.9% of Total Investments) | | | | | | | |
| | 455 | | District of Columbia Tobacco Settlement Corporation, Tobacco Settlement Asset-Backed Bonds, Series 2001, 6.250%, 5/15/24 | 11/13 at 100.00 | | A1 | | | 457,261 | |
| | 5,000 | | Washington Convention Center Authority, District of Columbia, Dedicated Tax Revenue Bonds, Senior Lien Refunding Series 2007A, 4.500%, 10/01/30 – AMBAC Insured | 10/16 at 100.00 | | A1 | | | 4,958,900 | |
| | 5,455 | | Total District of Columbia | | | | | | 5,416,161 | |
| | | | Florida – 4.7% (3.2% of Total Investments) | | | | | | | |
| | 1,100 | | Greater Orlando Aviation Authority, Florida, Airport Facilities Revenue Refunding Bonds, Series 2007A, 5.000%, 10/01/14 – AGM Insured (Alternative Minimum Tax) | No Opt. Call | | AA– | | | 1,148,752 | |
| | 2,600 | | Miami-Dade County, Florida, General Obligation Bonds, Parks Program, Series 2005, 4.300%, 11/01/30 – NPFG Insured | 11/15 at 100.00 | | Aa2 | | | 2,593,786 | |
| | 2,400 | | Orange County School Board, Florida, Certificates of Participation, Series 2005B, 5.000%, 8/01/25 – AMBAC Insured | 8/15 at 100.00 | | Aa2 | | | 2,562,072 | |
| | 5,085 | | Orange County, Florida, Tourist Development Tax Revenue Bonds, Refunding Series 2007, 4.750%, 10/01/29 – FGIC Insured | No Opt. Call | | AA– | | | 5,164,326 | |
| | | | Port Saint Lucie. Florida, Special Assessment Revenue Bonds, Southwest Annexation District 1B, Series 2007: | | | | | | | |
| | 2,000 | | 5.000%, 7/01/33 – NPFG Insured | 7/17 at 100.00 | | A | | | 2,025,920 | |
| | 1,500 | | 5.000%, 7/01/40 – NPFG Insured | 7/17 at 100.00 | | A | | | 1,507,875 | |
| | 5,000 | | Seminole Tribe of Florida, Special Obligation Bonds, Series 2007A, 144A, 5.250%, 10/01/27 | 10/17 at 100.00 | | BBB– | | | 5,161,700 | |
| | 19,685 | | Total Florida | | | | | | 20,164,431 | |
| | | | Georgia – 3.2% (2.2% of Total Investments) | | | | | | | |
| | 2,000 | | DeKalb County Hospital Authority, Georgia, Anticipation Certificates Revenue Bonds, DeKalb Medical Center, Inc. Project, Series 2010, 6.000%, 9/01/30 | 9/20 at 100.00 | | BBB | | | 2,072,840 | |
| | 2,000 | | Franklin County Industrial Building Authority, Georgia, Revenue Bonds, Ty Cobb Regional Medical Center Project, Series 2010, 8.125%, 12/01/45 | 12/20 at 100.00 | | N/R | | | 2,070,840 | |
| | | | Gainesville and Hall County Hospital Authority, Georgia, Revenue Anticipation Certificates, Northeast Georgia Health Services Inc., Series 2010B: | | | | | | | |
| | 2,000 | | 5.250%, 2/15/37 | 2/20 at 100.00 | | AA– | | | 2,044,940 | |
| | 5,000 | | 5.125%, 2/15/40 | 2/20 at 100.00 | | AA– | | | 5,030,300 | |
| | 2,500 | | Medical Center Hospital Authority, Georgia, Revenue Anticipation Certificates, Columbus Regional Healthcare System, Inc. Project, Series 2008, 6.500%, 8/01/38 – AGC Insured | 8/18 at 100.00 | | AA– | | | 2,697,625 | |
| | 13,500 | | Total Georgia | | | | | | 13,916,545 | |
| | | | Idaho – 1.3% (0.9% of Total Investments) | | | | | | | |
| | 5,360 | | Pocatello Development Authority, Idaho, Revenue Allocation Tax Increment Bonds, Series 2004A, 6.000%, 8/01/28 (Pre-refunded 8/01/14) | 8/14 at 100.00 | | N/R (4) | | | 5,593,535 | |
| | | | Illinois – 15.9% (10.8% of Total Investments) | | | | | | | |
| | 3,370 | | Chicago, Illinois, FHA/GNMA Collateralized Multifamily Housing Revenue Bonds, Stone Terrace Apartments, Series 2001A, 5.750%, 12/20/42 (Alternative Minimum Tax) | 12/13 at 100.00 | | AA+ | | | 3,372,224 | |
| | 5,000 | | Chicago, Illinois, General Obligation Bonds, City Colleges, Series 1999, 0.000%, 1/01/34 – FGIC Insured | No Opt. Call | | AA– | | | 1,353,700 | |
| | 3,000 | | Chicago, Illinois, General Obligation Bonds, Project & Refunding Series 2006A, 4.625%, 1/01/31 – AGM Insured | 1/16 at 100.00 | | AA– | | | 2,821,740 | |
| NXZ | Nuveen Dividend Advantage Municipal Fund 2 (continued) |
| | Portfolio of Investments October 31, 2013 |
| | Principal | | | Optional Call | | | | | | |
| | Amount (000) | | Description (1) | Provisions (2) | | Ratings (3) | | | Value | |
| | | | Illinois (continued) | | | | | | | |
| $ | 3,360 | | Cook County Township High School District 225 Northfield, Illinois, General Obligation Bonds, Series 2007B, 0.000%, 12/01/24 | 12/16 at 69.01 | | AAA | | $ | 2,067,005 | |
| | 7,100 | | Cook County, Illinois, General Obligation Bonds, Refunding Series 2010A, 5.250%, 11/15/33 | 11/20 at 100.00 | | AA | | | 7,149,629 | |
| | 5,000 | | Illinois Finance Authority, Revenue Bonds, Elmhurst Memorial Healthcare, Series 2008A, 5.625%, 1/01/37 | 1/18 at 100.00 | | Baa2 | | | 5,124,350 | |
| | 1,000 | | Illinois Finance Authority, Revenue Bonds, Hospital Sisters Services Inc., Series 2007, 5.000%, 3/15/26 | No Opt. Call | | AA– | | | 1,073,130 | |
| | 10,270 | | Illinois Finance Authority, Revenue Bonds, Palos Community Hospital, Series 2007A, 5.000%, 5/15/32 – NPFG Insured | 5/17 at 100.00 | | AA– | | | 10,278,011 | |
| | 1,000 | | Illinois Finance Authority, Revenue Bonds, Silver Cross Hospital and Medical Centers, Series 2005, 5.250%, 8/15/20 – AGC Insured | 8/15 at 100.00 | | AA– | | | 1,038,000 | |
| | 2,500 | | Illinois Finance Authority, Revenue Bonds, Silver Cross Hospital and Medical Centers, Series 2009, 6.875%, 8/15/38 | 8/19 at 100.00 | | BBB+ | | | 2,694,475 | |
| | 2,500 | | Illinois Finance Authority, Revenue Bonds, The University of Chicago Medical Center, Series 2011C, 5.500%, 8/15/41 (UB), (5) | 2/21 at 100.00 | | AA– | | | 2,604,800 | |
| | 6,935 | | Illinois Finance Authority, Student Housing Revenue Bonds, Educational Advancement Fund Inc., Refunding Series 2007A, 5.250%, 5/01/34 | 5/17 at 100.00 | | BBB+ | | | 6,520,634 | |
| | 1,670 | | Illinois Housing Development Authority, Homeowner Mortgage Revenue Bonds, Series 2006C2, 5.050%, 8/01/27 (Alternative Minimum Tax) | 2/16 at 100.00 | | AA | | | 1,694,783 | |
| | 2,925 | | Illinois State, General Obligation Bonds, Refunding Series 2012, 5.000%, 8/01/22 | No Opt. Call | | A– | | | 3,151,892 | |
| | 1,955 | | Illinois Toll Highway Authority, Toll Highway Revenue Bonds, Senior Lien Series 2013A, 5.000%, 1/01/38 | 1/23 at 100.00 | | AA– | | | 1,963,426 | |
| | 2,500 | | Kane & DeKalb Counties Community Unit School District 301, Illinois, General Obligation Bonds, Series 2006, 0.000%, 12/01/23 – NPFG Insured | No Opt. Call | | Aa3 | | | 1,668,200 | |
| | | | Metropolitan Pier and Exposition Authority, Illinois, Revenue Bonds, McCormick Place Expansion Project, Series 2002A: | | | | | | | |
| | 8,200 | | 0.000%, 12/15/30 – NPFG Insured | No Opt. Call | | AAA | | | 3,169,136 | |
| | 10,000 | | 0.000%, 12/15/36 – NPFG Insured | No Opt. Call | | AAA | | | 2,595,100 | |
| | 2,500 | | Metropolitan Pier and Exposition Authority, Illinois, Revenue Refunding Bonds, McCormick Place Expansion Project, Series 2002B, 5.550%, 6/15/21 – NPFG Insured | 6/17 at 101.00 | | AAA | | | 2,759,025 | |
| | 3,379 | | Montgomery, Illinois, Lakewood Creek Project Special Assessment Bonds, Series 2007, 4.700%, 3/01/30 – RAAI Insured | 3/16 at 100.00 | | N/R | | | 2,956,388 | |
| | 1,890 | | Regional Transportation Authority, Cook, DuPage, Kane, Lake, McHenry and Will Counties, Illinois, General Obligation Bonds, Series 2003A, 5.500%, 7/01/22 – FGIC Insured | No Opt. Call | | AA | | | 2,191,852 | |
| | 86,054 | | Total Illinois | | | | | | 68,247,500 | |
| | | | Indiana – 5.1% (3.4% of Total Investments) | | | | | | | |
| | 2,640 | | Indiana Finance Authority, Private Activity Bonds, Ohio River Bridges East End Crossing Project, Series 2013A, 5.000%, 7/01/48 (Alternative Minimum Tax) | 7/23 at 100.00 | | BBB | | | 2,343,686 | |
| | 4,195 | | Indiana Health Facility Financing Authority, Hospital Revenue Bonds, Deaconess Hospital Inc., Series 2004A, 5.375%, 3/01/34 (Pre-refunded 3/01/14) – AMBAC Insured | 3/14 at 100.00 | | A+ (4) | | | 4,268,329 | |
| | 2,295 | | Indiana Health Facility Financing Authority, Hospital Revenue Bonds, Methodist Hospitals Inc., Series 2001, 5.500%, 9/15/31 | 1/14 at 100.00 | | BBB | | | 2,295,734 | |
| | 840 | | Indiana Health Facility Financing Authority, Hospital Revenue Refunding Bonds, Columbus Regional Hospital, Series 1993, 7.000%, 8/15/15 – AGM Insured | No Opt. Call | | AA– | | | 893,038 | |
| | 2,305 | | Indiana Health Facility Financing Authority, Revenue Bonds, Community Foundation of Northwest Indiana, Series 2007, 5.500%, 3/01/37 | 3/17 at 100.00 | | A | | | 2,377,262 | |
| | 5,180 | | Indiana Municipal Power Agency, Power Supply Revenue Bonds, Series 2007A, 5.000%, 1/01/42 – NPFG Insured | 1/17 at 100.00 | | A+ | | | 5,215,483 | |
| | 2,470 | | Indianapolis Local Public Improvement Bond Bank, Indiana, Series 1999E, 0.000%, 2/01/25 – AMBAC Insured | No Opt. Call | | AA | | | 1,619,752 | |
| | Principal | | | Optional Call | | | | | | |
| | Amount (000) | | Description (1) | Provisions (2) | | Ratings (3) | | | Value | |
| | | | Indiana (continued) | | | | | | | |
| $ | 1,890 | | New Albany-Floyd County School Building Corporation, Indiana, First Mortgage Bonds, Series 2005, 5.000%, 7/15/26 (Pre-refunded 7/15/15) – AGM Insured | 7/15 at 100.00 | | AA+ (4) | | $ | 2,041,691 | |
| | 6,100 | | St. Joseph County Hospital Authority, Indiana, Revenue Bonds, Madison Center Inc., Series 1999, 5.800%, 2/15/24 (6) | 2/14 at 100.00 | | N/R | | | 657,397 | |
| | 27,915 | | Total Indiana | | | | | | 21,712,372 | |
| | | | Iowa – 1.5% (1.0% of Total Investments) | | | | | | | |
| | 1,000 | | Iowa Finance Authority, Iowa, Midwestern Disaster Area Revenue Bonds, Iowa Fertilizer Company Project, Series 2013, 5.250%, 12/01/25 | 12/23 at 100.00 | | BB– | | | 916,800 | |
| | 6,340 | | Iowa Tobacco Settlement Authority, Tobacco Asset-Backed Revenue Bonds, Series 2005B, 5.600%, 6/01/34 | 6/17 at 100.00 | | B+ | | | 5,318,753 | |
| | 7,340 | | Total Iowa | | | | | | 6,235,553 | |
| | | | Kansas – 1.1% (0.8% of Total Investments) | | | | | | | |
| | 2,000 | | Kansas Development Finance Authority Hospital Revenue Bonds, Adventist Health System/Sunbelt Obligated Group, Series 2012A, 5.000%, 11/15/28 | 5/22 at 100.00 | | AA | | | 2,144,920 | |
| | 4,090 | | Wyandotte County-Kansas City Unified Government, Kansas, Sales Tax Special Obligation Capital Appreciation Revenue Bonds Redevelopment Project Area B – Major Multi-Sport Athletic Complex Project, Subordinate Lien Series 2010B, 0.000%, 6/01/21 | No Opt. Call | | BBB+ | | | 2,730,075 | |
| | 6,090 | | Total Kansas | | | | | | 4,874,995 | |
| | | | Kentucky – 0.2% (0.2% of Total Investments) | | | | | | | |
| | 1,000 | | Kentucky Economic Development Finance Authority, Louisville Arena Project Revenue Bonds, Louisville Arena Authority, Inc., Series 2008-A1, 6.000%, 12/01/38 – AGC Insured | 6/18 at 100.00 | | AA– | | | 1,000,730 | |
| | | | Louisiana – 1.5% (1.0% of Total Investments) | | | | | | | |
| | 3,960 | | Louisiana State, Gasoline and Fuels Tax Revenue Bonds, Series 2006A, 4.500%, 5/01/41 – FGIC Insured (UB) | 5/16 at 100.00 | | Aa1 | | | 3,916,836 | |
| | 2,305 | | New Orleans, Louisiana, Sewerage Service Revenue Bonds, Series 2002, 5.000%, 6/01/21 – NPFG Insured | No Opt. Call | | A | | | 2,309,380 | |
| | 6,265 | | Total Louisiana | | | | | | 6,226,216 | |
| | | | Massachusetts – 2.5% (1.7% of Total Investments) | | | | | | | |
| | 2,500 | | Martha’s Vineyard Land Bank, Massachusetts, Revenue Bonds, Series 2002, 5.000%, 5/01/32 – AMBAC Insured | 1/14 at 100.00 | | A– | | | 2,506,925 | |
| | 1,500 | | Massachusetts Health and Education Facilities Authority, Revenue Bonds, Partners HealthCare System, Series 2010J, 5.000%, 7/01/39 | 7/19 at 100.00 | | AA | | | 1,526,550 | |
| | 2,280 | | Massachusetts School Building Authority, Dedicated Sales Tax Revenue Bonds, Senior Series 2013A, 5.000%, 5/15/43 | 5/23 at 100.00 | | AA+ | | | 2,403,758 | |
| | 160 | | Massachusetts School Building Authority, Dedicated Sales Tax Revenue Bonds, Series 2005A, 5.000%, 8/15/30 | 8/15 at 100.00 | | AA+ | | | 167,206 | |
| | | | Massachusetts School Building Authority, Dedicated Sales Tax Revenue Bonds, Series 2005A: | | | | | | | |
| | 515 | | 5.000%, 8/15/30 (Pre-refunded 8/15/15) – AGM Insured | 8/15 at 100.00 | | Aa2 (4) | | | 558,368 | |
| | 3,325 | | 5.000%, 8/15/30 (Pre-refunded 8/15/15) | 8/15 at 100.00 | | Aa2 (4) | | | 3,604,998 | |
| | 10,280 | | Total Massachusetts | | | | | | 10,767,805 | |
| | | | Michigan – 7.1% (4.8% of Total Investments) | | | | | | | |
| | 885 | | Detroit Water and Sewerage Department, Michigan, Sewage Disposal System Revenue Bonds, Refunding Senior Lien Series 2012A, 5.250%, 7/01/39 | 7/22 at 100.00 | | BBB+ | | | 817,023 | |
| | 1,000 | | Detroit, Michigan, Second Lien Sewerage Disposal System Revenue Bonds, Series 2005A, 4.500%, 7/01/35 – NPFG Insured | 7/15 at 100.00 | | A | | | 841,820 | |
| | 3,135 | | Detroit, Michigan, Senior Lien Sewerage Disposal System Revenue Bonds, Series 1998B Remarketed, 5.250%, 7/01/22 – NPFG Insured | 7/17 at 100.00 | | A | | | 3,094,026 | |
| | 6,430 | | Detroit, Michigan, Senior Lien Sewerage Disposal System Revenue Bonds, Series 2003A, 5.000%, 7/01/32 – AGM Insured | 1/14 at 100.00 | | AA– | | | 5,977,135 | |
| | 3,960 | | Detroit, Michigan, Sewer Disposal System Revenue Bonds, Second Lien, Series 2006B, 5.000%, 7/01/36 – MBIA-NPFG Insured | 7/16 at 100.00 | | A | | | 3,553,744 | |
| NXZ | Nuveen Dividend Advantage Municipal Fund 2 (continued) |
| | Portfolio of Investments October 31, 2013 |
| | Principal | | | Optional Call | | | | | | |
| | Amount (000) | | Description (1) | Provisions (2) | | Ratings (3) | | | Value | |
| | | | Michigan (continued) | | | | | | | |
| $ | 2,000 | | Detroit, Michigan, Water Supply System Revenue Bonds, Senior Lien Series 2011A, 5.750%, 7/01/37 | 7/21 at 100.00 | | BB– | | $ | 1,919,980 | |
| | 3,500 | | Detroit, Michigan, Water Supply System Second Lien Revenue Refunding Bonds, Series 2006C, 5.000%, 7/01/33 – AGM Insured | No Opt. Call | | AA– | | | 3,235,575 | |
| | 6,880 | | Kalamazoo Hospital Finance Authority, Michigan, Hospital Revenue Bonds, Bronson Methodist Hospital, Refunding Series 2010, 5.500%, 5/15/36 | 5/20 at 100.00 | | A2 | | | 7,037,002 | |
| | 4,000 | | Michigan Municipal Bond Authority, Public School Academy Revenue Bonds, Detroit Academy of Arts and Sciences Charter School, Series 2001A, 8.000%, 10/01/31 (6) | 4/14 at 100.00 | | Ca | | | 2,160,160 | |
| | 1,950 | | Wayne County Airport Authority, Michigan, Revenue Bonds, Detroit Metropolitan Wayne County Airport, Series 2005, 5.000%, 12/01/34 – NPFG Insured (Alternative Minimum Tax) | 12/15 at 100.00 | | A | | | 1,893,041 | |
| | 33,740 | | Total Michigan | | | | | | 30,529,506 | |
| | | | Minnesota – 1.3% (0.9% of Total Investments) | | | | | | | |
| | 5,000 | | Minneapolis, Minnesota, Health Care System Revenue Bonds, Fairview Health Services, Series 2008B, 6.500%, 11/15/38 – AGC Insured | 11/18 at 100.00 | | AA– | | | 5,738,650 | |
| | | | Missouri – 0.7% (0.5% of Total Investments) | | | | | | | |
| | | | Saint Louis, Missouri, Parking Revenue Bonds, Series 2006A: | | | | | | | |
| | 1,325 | | 4.500%, 12/15/23 – NPFG Insured | 12/16 at 100.00 | | A | | | 1,378,914 | |
| | 1,475 | | 4.500%, 12/15/26 – NPFG Insured | 12/16 at 100.00 | | A | | | 1,502,937 | |
| | 2,800 | | Total Missouri | | | | | | 2,881,851 | |
| | | | Nevada – 2.8% (1.9% of Total Investments) | | | | | | | |
| | 1,405 | | Clark County, Nevada, Senior Lien Airport Revenue Bonds, Series 2005A, 5.000%, 7/01/40 – AMBAC Insured | 7/15 at 100.00 | | Aa2 | | | 1,413,711 | |
| | 5,035 | | Clark County, Nevada, Subordinate Lien Airport Revenue Bonds, Series 2004A-2, 5.000%, 7/01/36 – FGIC Insured | 7/14 at 100.00 | | A+ | | | 5,043,660 | |
| | 2,000 | | Henderson, Nevada, Healthcare Facility Revenue Refunding Bonds, Catholic Healthcare West, Series 2008, Trust 2633, 18.987%, 7/01/31 – BHAC Insured (IF), (5) | 7/17 at 100.00 | | AA+ | | | 2,222,000 | |
| | 1,455 | | Las Vegas Valley Water District, Nevada, General Obligation Bonds, Series 2005A, 5.000%, 6/01/24 – FGIC Insured | 6/15 at 100.00 | | AA+ | | | 1,549,240 | |
| | 1,750 | | Reno, Nevada, Health Facilities Revenue Bonds, Catholic Healthcare West, Trust 2634, 18.714%, 7/01/31 – BHAC Insured (IF), (5) | 7/17 at 100.00 | | AA+ | | | 1,944,250 | |
| | 11,645 | | Total Nevada | | | | | | 12,172,861 | |
| | | | New Jersey – 1.1% (0.7% of Total Investments) | | | | | | | |
| | 3,995 | | New Jersey Economic Development Authority, Special Facilities Revenue Bonds, Continental Airlines Inc., Series 2000, 7.000%, 11/15/30 (Alternative Minimum Tax) | 11/13 at 100.00 | | B | | | 3,994,880 | |
| | 600 | | New Jersey Health Care Facilities Financing Authority, New Jersey, Revenue Bonds, Saint Peters University Hospital, Refunding Series 2011, 6.000%, 7/01/26 | 7/21 at 100.00 | | BB+ | | | 623,064 | |
| | 4,595 | | Total New Jersey | | | | | | 4,617,944 | |
| | | | New York – 8.2% (5.6% of Total Investments) | | | | | | | |
| | 12,020 | | Brooklyn Arena Local Development Corporation, New York, Payment in Lieu of Taxes Revenue Bonds, Barclays Center Project, Series 2009, 0.000%, 7/15/46 | No Opt. Call | | BBB– | | | 1,695,060 | |
| | 2,000 | | Dormitory Authority of the State of New York, State Personal Income Tax Revenue Bonds, Education Series 2007C, 5.000%, 3/15/14 | No Opt. Call | | AAA | | | 2,036,400 | |
| | 4,160 | | Hudson Yards Infrastructure Corporation, New York, Revenue Bonds, Senior Fiscal 2012 Series 2011A, 5.250%, 2/15/47 | 2/21 at 100.00 | | A | | | 4,269,658 | |
| | 12,800 | | Metropolitan Transportation Authority, New York, Transportation Revenue Bonds, Series 2006B, 4.500%, 11/15/32 – AGM Insured (UB) | 11/16 at 100.00 | | AA– | | | 12,853,888 | |
| | 5,000 | | New York City Industrial Development Agency, New York, Special Facilities Revenue Bonds, JFK Airport – American Airlines Inc., Series 2002B, 8.500%, 8/01/28 (Alternative Minimum Tax) | 8/14 at 100.00 | | N/R | | | 5,321,600 | |
| | 5,000 | | New York City Transitional Finance Authority, New York, Future Tax Secured Bonds, Subordinate Fiscal 2013 Series I, 5.000%, 5/01/38 | 5/23 at 100.00 | | AAA | | | 5,274,600 | |
| | 2,000 | | New York Liberty Development Corporation, Liberty Revenue Bonds, 4 World Trade Center Project, Series 2011, 5.750%, 11/15/51 | No Opt. Call | | A+ | | | 2,139,200 | |
| | Principal | | | Optional Call | | | | | | |
| | Amount (000) | | Description (1) | Provisions (2) | | Ratings (3) | | | Value | |
| | | | New York (continued) | | | | | | | |
| $ | 1,670 | | Port Authority of New York and New Jersey, Special Project Bonds, JFK International Air Terminal LLC Project, Eighth Series 2010, 6.000%, 12/01/36 | 12/20 at 100.00 | | BBB | | $ | 1,806,756 | |
| | 44,650 | | Total New York | | | | | | 35,397,162 | |
| | | | North Carolina – 2.1% (1.4% of Total Investments) | | | | | | | |
| | 3,200 | | North Carolina Capital Facilities Financing Agency, General Revenue Bonds, Duke University, Series 2006A, 5.000%, 10/01/41 | No Opt. Call | | AA+ | | | 3,290,464 | |
| | 3,300 | | North Carolina Medical Care Commission, Health Care Facilities Revenue Refunding Bonds, WakeMed, Series 2012A, 5.000%, 10/01/31 | 10/22 at 100.00 | | AA– | | | 3,391,872 | |
| | 2,375 | | North Carolina Medical Care Commission, Healthcare Revenue Refunding Bonds, Novant Health Inc., Series 2006, 5.000%, 11/01/39 – NPFG Insured | 11/16 at 100.00 | | AA+ | | | 2,450,739 | |
| | 8,875 | | Total North Carolina | | | | | | 9,133,075 | |
| | | | North Dakota – 0.7% (0.5% of Total Investments) | | | | | | | |
| | 3,000 | | Grand Forks, North Dakota, Health Care System Revenue Bonds, Altru Health System Obligated Group, Series 2012, 5.000%, 12/01/29 | 12/21 at 100.00 | | A– | | | 3,066,930 | |
| | | | Ohio – 2.7% (1.8% of Total Investments) | | | | | | | |
| | | | Buckeye Tobacco Settlement Financing Authority, Ohio, Tobacco Settlement Asset-Backed Revenue Bonds, Senior Lien, Series 2007A-2: | | | | | | | |
| | 2,000 | | 5.875%, 6/01/30 | 6/17 at 100.00 | | B | | | 1,629,020 | |
| | 10,000 | | 5.750%, 6/01/34 | 6/17 at 100.00 | | B | | | 7,830,000 | |
| | 1,500 | | 6.500%, 6/01/47 | 6/17 at 100.00 | | B | | | 1,269,015 | |
| | 1,000 | | 5.875%, 6/01/47 | 6/17 at 100.00 | | B | | | 776,810 | |
| | 14,500 | | Total Ohio | | | | | | 11,504,845 | |
| | | | Oklahoma – 1.1% (0.8% of Total Investments) | | | | | | | |
| | 1,000 | | Fort Sill Apache Tribe of Oklahoma Economic Development Authority, Gaming Enterprise Revenue Bonds, Fort Sill Apache Casino, Series 2011A, 8.500%, 8/25/26 | 8/21 at 100.00 | | N/R | | | 1,074,660 | |
| | 3,500 | | Grand River Dam Authority, Oklahoma, Revenue Bonds, Series 2010A, 5.250%, 6/01/40 | 6/20 at 100.00 | | A | | | 3,724,875 | |
| | 4,500 | | Total Oklahoma | | | | | | 4,799,535 | |
| | | | Pennsylvania – 0.8% (0.6% of Total Investments) | | | | | | | |
| | 3,475 | | Erie Water Authority, Pennsylvania, Water Revenue Bonds, Series 2008, 5.000%, 12/01/43 – AGM Insured | 12/18 at 100.00 | | AA– | | | 3,498,074 | |
| | | | Puerto Rico – 3.6% (2.4% of Total Investments) | | | | | | | |
| | 1,500 | | Puerto Rico Highway and Transportation Authority, Highway Revenue Bonds, Series 2004-I, 5.000%, 7/01/24 – FGIC Insured | No Opt. Call | | BBB | | | 1,099,230 | |
| | 5,020 | | Puerto Rico Sales Tax Financing Corporation, Sales Tax Revenue Bonds, First Subordinate Series 2009A, 6.000%, 8/01/42 | 8/19 at 100.00 | | A+ | | | 4,346,216 | |
| | 9,310 | | Puerto Rico Sales Tax Financing Corporation, Sales Tax Revenue Bonds, First Subordinate Series 2010C, 5.250%, 8/01/41 | 8/20 at 100.00 | | A+ | | | 7,298,202 | |
| | | | Puerto Rico Sales Tax Financing Corporation, Sales Tax Revenue Bonds, Series 2007A: | | | | | | | |
| | 30,000 | | 0.000%, 8/01/54 – AMBAC Insured | No Opt. Call | | AA– | | | 2,187,600 | |
| | 6,150 | | 0.000%, 8/01/56 | No Opt. Call | | AA– | | | 370,599 | |
| | 51,980 | | Total Puerto Rico | | | | | | 15,301,847 | |
| | | | Rhode Island – 0.7% (0.5% of Total Investments) | | | | | | | |
| | 3,000 | | Rhode Island Economic Development Corporation, Airport Revenue Bonds, Refunding Series 2005A, 4.625%, 7/01/26 – NPFG Insured (Alternative Minimum Tax) | 7/15 at 100.00 | | A | | | 2,988,540 | |
| | | | South Carolina – 4.0% (2.7% of Total Investments) | | | | | | | |
| | 2,500 | | Florence County, South Carolina, Hospital Revenue Bonds, McLeod Regional Medical Center, Series 2004A, 5.250%, 11/01/23 – AGM Insured | 11/14 at 100.00 | | AA– | | | 2,601,625 | |
| | 2,000 | | Medical University Hospital Authority, South Carolina, FHA-Insured Mortgage Revenue Bonds, Series 2004A, 5.250%, 8/15/34 (Pre-refunded 8/15/14) – NPFG Insured | 8/14 at 100.00 | | A (4) | | | 2,078,440 | |
| NXZ | Nuveen Dividend Advantage Municipal Fund 2 (continued) |
| | Portfolio of Investments October 31, 2013 |
| | Principal | | | Optional Call | | | | | | |
| | Amount (000) | | Description (1) | Provisions (2) | | Ratings (3) | | | Value | |
| | | | South Carolina (continued) | | | | | | | |
| | | | Piedmont Municipal Power Agency, South Carolina, Electric Revenue Bonds, Series 2004A-2: | | | | | | | |
| $ | 21,570 | | 0.000%, 1/01/30 – AMBAC Insured | No Opt. Call | | A– | | $ | 10,003,088 | |
| | 5,560 | | 0.000%, 1/01/31 – AMBAC Insured | No Opt. Call | | AA– | | | 2,500,332 | |
| | 31,630 | | Total South Carolina | | | | | | 17,183,485 | |
| | | | Texas – 27.1% (18.4% of Total Investments) | | | | | | | |
| | 4,000 | | Board of Regents, University of Texas System, Financing System Revenue Refunding Bonds, Series 2006B, 5.000%, 8/15/31 | 8/16 at 100.00 | | AAA | | | 4,281,520 | |
| | 10,000 | | Central Texas Regional Mobility Authority, Revenue Bonds, Senior Lien Series 2005, 5.000%, 1/01/45 (Pre-refunded 1/01/15) – FGIC Insured | 1/15 at 100.00 | | A (4) | | | 10,553,600 | |
| | 1,250 | | Central Texas Regional Mobility Authority, Revenue Bonds, Senior Lien Series 2011, 6.000%, 1/01/41 | 1/21 at 100.00 | | Baa2 | | | 1,280,550 | |
| | 6,000 | | Decatur Hospital Authority, Texas, Revenue Bonds, Wise Regional Health System, Series 2004A, 7.125%, 9/01/34 | 9/14 at 100.00 | | N/R | | | 6,167,700 | |
| | 7,000 | | Grand Parkway Transportation Corporation, Texas, System Toll Revenue Bonds, Subordinate Lien Series 2013B, 5.250%, 10/01/51 | 10/23 at 100.00 | | AA+ | | | 7,140,700 | |
| | 10,000 | | Gulf Coast Industrial Development Authority, Texas, Solid Waste Disposal Revenue Bonds, Citgo Petroleum Corporation Project, Series 1998, 8.000%, 4/01/28 (Alternative Minimum Tax) | 1/14 at 100.00 | | BB+ | | | 10,007,900 | |
| | 4,000 | | Harris County Hospital District, Texas, Revenue Bonds, Series 2007A, 5.250%, 2/15/42 – NPFG Insured | 2/17 at 100.00 | | AA+ | | | 4,197,680 | |
| | 31,170 | | Harris County-Houston Sports Authority, Texas, Junior Lien Revenue Refunding Bonds, Series 2001B, 5.250%, 11/15/40 – NPFG Insured | 11/13 at 100.00 | | A | | | 31,167,818 | |
| | 1,920 | | Harris County-Houston Sports Authority, Texas, Revenue Bonds, Junior Lien Series 2001H, 0.000%, 11/15/37 – NPFG Insured | 11/31 at 69.08 | | A | | | 374,170 | |
| | 4,565 | | Harris County-Houston Sports Authority, Texas, Revenue Bonds, Third Lien Series 2004A-3, 0.000%, 11/15/35 – NPFG Insured | 11/24 at 52.47 | | A | | | 1,041,231 | |
| | 40,000 | | Harris County-Houston Sports Authority, Texas, Senior Lien Revenue Refunding Bonds, Series 2001A, 0.000%, 11/15/40 – NPFG Insured | 11/30 at 54.04 | | A | | | 7,169,200 | |
| | 2,000 | | Houston, Texas, First Lien Combined Utility System Revenue Bonds, First Lien Series 2011A, 5.250%, 11/15/30 | No Opt. Call | | AA | | | 2,216,400 | |
| | | | Houston, Texas, Hotel Occupancy Tax and Special Revenue Bonds, Convention and Entertainment Project, Series 2001B: | | | | | | | |
| | 5,000 | | 0.000%, 9/01/30 – AMBAC Insured | No Opt. Call | | A2 | | | 2,019,100 | |
| | 5,540 | | 0.000%, 9/01/31 – AMBAC Insured | No Opt. Call | | A2 | | | 2,068,968 | |
| | 4,285 | | Little Elm Independent School District, Denton County, Texas, General Obligation Bonds, Refunding Series 2006, 5.000%, 8/15/37 | 8/16 at 100.00 | | AAA | | | 4,541,029 | |
| | 10,000 | | North Texas Tollway Authority, First Tier System Revenue Refunding Bonds, Series 2008D, 0.000%, 1/01/28 – AGC Insured | No Opt. Call | | AA– | | | 5,029,900 | |
| | 3,295 | | Tarrant County Cultural Education Facilities Finance Corporation, Texas, Revenue Bonds, Residuals 1760-3, 17.194%, 2/15/36 (IF) | 2/17 at 100.00 | | AA– | | | 3,357,407 | |
| | 2,890 | | Tarrant County Cultural Education Facilities Finance Corporation, Texas, Hospital Revenue Bonds, Scott & White Healthcare Project, Series 2010, 5.500%, 8/15/45 | 8/20 at 100.00 | | AA– | | | 2,984,676 | |
| | 5,000 | | Texas Municipal Gas Acquisition and Supply Corporation III, Gas Supply Revenue Bonds, Series 2012, 5.000%, 12/15/29 | No Opt. Call | | A3 | | | 4,934,850 | |
| | 1,190 | | Texas Transportation Commission, Central Texas Turnpike System Revenue Bonds, First Tier Refunding Series 2012A, 5.000%, 8/15/41 | 8/22 at 100.00 | | A– | | | 1,186,359 | |
| | 1,000 | | Texas Turnpike Authority, Central Texas Turnpike System Revenue Bonds, First Tier Series 2002A, 0.000%, 8/15/28 – AMBAC Insured | 8/14 at 43.53 | | A– | | | 417,200 | |
| | 4,095 | | Texas, General Obligation Bonds, Water Financial Assistance Program, Series 2001, 5.250%, 8/01/35 | 2/14 at 100.00 | | AAA | | | 4,107,899 | |
| | 164,200 | | Total Texas | | | | | | 116,245,857 | |
| | Principal | | | Optional Call | | | | | | |
| | Amount (000) | | Description (1) | Provisions (2) | | Ratings (3) | | | Value | |
| | | | Virginia – 1.4% (1.0% of Total Investments) | | | | | | | |
| $ | 600 | | Henrico County Economic Development Authority, Virginia, Revenue Bonds, Bon Secours Health System Obligated Group, Series 2013, 5.000%, 11/01/30 | No Opt. Call | | A– | | $ | 618,642 | |
| | 2,500 | | Route 460 Funding Corporation, Virginia, Toll Road Revenue Bonds, Series 2012A, 5.125%, 7/01/49 | No Opt. Call | | BBB– | | | 2,353,975 | |
| | 1,335 | | Route 460 Funding Corporation, Virginia, Toll Road Revenue Bonds, Series 2012B, 0.000%, 7/01/33 | No Opt. Call | | BBB– | | | 393,051 | |
| | | | Virginia Small Business Financing Authority, Senior Lien Revenue Bonds, Elizabeth River Crossing, Opco LLC Project, Series 2012: | | | | | | | |
| | 1,885 | | 5.250%, 1/01/32 (Alternative Minimum Tax) | 7/22 at 100.00 | | BBB– | | | 1,876,122 | |
| | 820 | | 6.000%, 1/01/37 (Alternative Minimum Tax) | 7/22 at 100.00 | | BBB– | | | 851,898 | |
| | 7,140 | | Total Virginia | | | | | | 6,093,688 | |
| | | | Washington – 1.6% (1.1% of Total Investments) | | | | | | | |
| | 3,780 | | Washington Health Care Facilities Authority, Revenue Bonds, Fred Hutchinson Cancer Research Center, Series 2011A, 5.625%, 1/01/35 | 1/21 at 100.00 | | A | | | 3,885,046 | |
| | 2,940 | | Washington Health Care Facilities Authority, Revenue Bonds, Kadlec Regional Medical Center, Series 2010, 5.500%, 12/01/39 | 12/20 at 100.00 | | Baa3 | | | 2,816,285 | |
| | 6,720 | | Total Washington | | | | | | 6,701,331 | |
| | | | West Virginia – 2.3% (1.6% of Total Investments) | | | | | | | |
| | 2,950 | | West Virginia Economic Development Authority, Solid Waste Disposal Facilities Revenue Bonds, Appalachian Power Company Amos Project, Series 2010, 5.375%, 12/01/38 | 12/20 at 100.00 | | BBB | | | 3,037,320 | |
| | 6,720 | | West Virginia University, Revenue Bonds, West Virginia University Projects, Improvement Series 2004C, 5.000%, 10/01/34 (Pre-refunded 10/01/14) – FGIC Insured | 10/14 at 100.00 | | Aa3 (4) | | | 7,016,822 | |
| | 9,670 | | Total West Virginia | | | | | | 10,054,142 | |
| | | | Wisconsin – 1.7% (1.2% of Total Investments) | | | | | | | |
| | 1,250 | | Wisconsin Health and Educational Facilities Authority, Revenue Bonds, Marshfield Clinic, Series 2012B, 5.000%, 2/15/32 | 2/22 at 100.00 | | A– | | | 1,251,163 | |
| | 2,500 | | Wisconsin Health and Educational Facilities Authority, Revenue Bonds, Mercy Alliance, Inc., Series 2012, 5.000%, 6/01/39 | 6/22 at 100.00 | | A2 | | | 2,473,200 | |
| | 3,690 | | Wisconsin Health and Educational Facilities Authority, Revenue Bonds, Wheaton Franciscan Services Inc., Series 2006B, 5.125%, 8/15/30 | 8/16 at 100.00 | | A– | | | 3,699,184 | |
| | 7,440 | | Total Wisconsin | | | | | | 7,423,547 | |
| $ | 806,349 | | Total Municipal Bonds (cost $613,020,028) | | | | | | 630,626,748 | |
| NXZ | Nuveen Dividend Advantage Municipal Fund 2 (continued) |
| | Portfolio of Investments October 31, 2013 |
| | Principal | | | | | | | | | | |
| | Amount (000) | | Description (1) | Coupon | Maturity | | Ratings (3) | | | Value | |
| | | | Corporate Bonds – 0.0% (0.0% of Total Investments) | | | | | | | | |
| | | | Transportation – 0.0% (0.0% of Total Investments) | | | | | | | | |
| $ | 259 | | Las Vegas Monorail Company, Senior Interest Bonds (7), (8) | 5.500% | 7/15/19 | | N/R | | $ | 46,619 | |
| | 74 | | Las Vegas Monorail Company, Senior Interest Bonds (7), (8) | 3.000% | 7/15/55 | | N/R | | | 9,864 | |
| $ | 333 | | Total Corporate Bonds (cost $13,173) | | | | | | | 56,483 | |
| | | | Total Long-Term Investments (cost $613,033,201) | | | | | | | 630,683,231 | |
| | | | Floating Rate Obligations – (4.6)% | | | | | | | (19,570,000 | ) |
| | | | Variable Rate Demand Preferred Shares, at Liquidation Value – (45.6)% (9) | | | | | | | (196,000,000 | ) |
| | | | Other Assets Less Liabilities – 3.3% | | | | | | | 14,272,247 | |
| | | | Net Assets Applicable to Common Shares – 100% | | | | | | $ | 429,385,478 | |
| (1) | All percentages shown in the Portfolio of Investments are based on net assets applicable to Common shares unless otherwise noted. |
| (2) | Optional Call Provisions (not covered by the report of independent registered public accounting firm): Dates (month and year) and prices of the earliest optional call or redemption. There may be other call provisions at varying prices at later dates. Certain mortgage-backed securities may be subject to periodic principal paydowns. |
| (3) | Ratings (not covered by the report of independent registered public accounting firm): Using the highest of Standard & Poor’s Group (“Standard & Poor’s”), Moody’s Investors Service, Inc. (“Moody’s”) or Fitch, Inc. (“Fitch”) rating. Ratings below BBB by Standard & Poor’s, Baa by Moody’s or BBB by Fitch are considered to be below investment grade. Holdings designated N/R are not rated by any of these national rating agencies. |
| (4) | Backed by an escrow or trust containing sufficient U.S. Government or U.S. Government agency securities, which ensure the timely payment of principal and interest. Certain bonds backed by U.S. Government or agency securities are regarded as having an implied rating equal to the rating of such securities. |
| (5) | Investment, or portion of investment, has been pledged to collateralize the net payment obligations for investments in inverse floating rate transactions. |
| (6) | At or subsequent to the end of the reporting period, this security is non-income producing. Non-income producing security, in the case of a fixed-income security, generally denotes that the issuer has (1) defaulted on the payment of principal or interest, (2) is under the protection of the Federal Bankruptcy Court or (3) the Fund’s Adviser has concluded that the issue is not likely to meet its future interest payment obligations and has directed the Fund’s custodian to cease accruing additional income on the Fund’s records. |
| (7) | Investment valued at fair value using methods determined in good faith by, or at the discretion of, the Board of Trustees. For fair value measurement disclosure purposes, investment categorized as Level 3. See Notes to Financial Statements, Note 2 – Investment Valuation and Fair Value Measurements for more information. |
| (8) | During January 2010, Las Vegas Monorail Company (“Las Vegas Monorail”) filed for federal bankruptcy protection. During March 2012, Las Vegas Monorail emerged from federal bankruptcy with the acceptance of a reorganization plan assigned by the Federal Bankruptcy Court. Under the reorganization plan, the Fund surrendered its Las Vegas Monorail Project Revenue Bonds, First Tier, Series 2000 and in turn received two senior interest corporate bonds: the first with an annual coupon rate of 5.500% maturing on July 15, 2019 and the second with an annual coupon rate of 3.000% (5.500% after December 31, 2015) maturing on July 15, 2055. The Fund’s custodian is not accruing income on the Fund’s records for either senior interest corporate bond. |
| (9) | Variable Rate Demand Preferred Shares, at Liquidation Value as a percentage of Total Investments is 31.1%. |
| WI/DD | Purchased on a when-issued or delayed delivery basis. |
| (IF) | Inverse floating rate investment. |
| (UB) | Underlying bond of an inverse floating rate trust reflected as a financing transaction. See Notes to Financial Statements, Note 3 – Portfolio Securities and Investments in Derivatives, Inverse Floating Rate Securities for more information. |
| 144A | Investment is exempt from registration under Rule 144A of the Securities Act of 1933, as amended. These investments may only be resold in transactions exempt from registration, which are normally those transactions with qualified institutional buyers. |
See accompanying notes to financial statements.
| NZF | |
| | Nuveen Dividend Advantage Municipal Fund 3 |
| | Portfolio of Investments |
| | October 31, 2013 |
| | Principal | | | Optional Call | | | | | | |
| | Amount (000) | | Description (1) | Provisions (2) | | Ratings (3) | | | Value | |
| | | | LONG-TERM INVESTMENTS – 143.1% (97.8% of Total Investments) | | | | | | | |
| | | | MUNICIPAL BONDS – 142.5% (97.4% of Total Investments) | | | | | | | |
| | | | Alabama – 0.6% (0.4% of Total Investments) | | | | | | | |
| $ | 3,500 | | Alabama Special Care Facilities Financing Authority, Revenue Bonds, Ascension Health, Series 2006C-2, 5.000%, 11/15/36 (UB) | 11/16 at 100.00 | | AA+ | | $ | 3,527,370 | |
| | | | Alaska – 0.1% (0.1% of Total Investments) | | | | | | | |
| | 1,000 | | Northern Tobacco Securitization Corporation, Alaska, Tobacco Settlement Asset-Backed Bonds, Series 2006A, 5.000%, 6/01/46 | 6/14 at 100.00 | | B2 | | | 692,380 | |
| | | | Arizona – 2.3% (1.6% of Total Investments) | | | | | | | |
| | 3,390 | | Arizona State Transportation Board, Highway Revenue Bonds, Series 2006, 13.313%, 7/01/16 (IF) | No Opt. Call | | AAA | | | 4,132,173 | |
| | 5,000 | | Phoenix Civic Improvement Corporation, Arizona, Subordinate Excise Tax Revenue Bonds, Civic Plaza Expansion Project, Series 2005A, 5.000%, 7/01/30 – FGIC Insured | 7/15 at 100.00 | | AA | | | 5,197,700 | |
| | 3,800 | | Salt Verde Financial Corporation, Arizona, Senior Gas Revenue Bonds, Citigroup Energy Inc Prepay Contract Obligations, Series 2007, 5.000%, 12/01/37 | No Opt. Call | | A– | | | 3,824,282 | |
| | 12,190 | | Total Arizona | | | | | | 13,154,155 | |
| | | | California – 13.4% (9.2% of Total Investments) | | | | | | | |
| | 1,670 | | California Health Facilities Financing Authority, Refunding Revenue Bonds, Stanford Hospital and Clinics, Series 2008A-2. RMKT, 5.250%, 11/15/40 | 11/21 at 100.00 | | AA– | | | 1,743,931 | |
| | 3,400 | | California Health Facilities Financing Authority, Revenue Bonds, Providence Health & Services, Series 2009B, 5.500%, 10/01/39 | 10/19 at 100.00 | | AA | | | 3,740,238 | |
| | 2,900 | | California Health Facilities Financing Authority, Revenue Bonds, Sutter Health, 2007A 5.000%, 11/15/42 (UB) | 11/16 at 100.00 | | AA– | | | 2,882,339 | |
| | 5,355 | | California Statewide Community Development Authority, Revenue Bonds, Sutter Health, Tender Option Bond Trust 3175, 13.497%, 5/15/14 (IF) | No Opt. Call | | AA– | | | 6,432,265 | |
| | 20 | | California, General Obligation Veterans Welfare Bonds, Series 2001BZ, 5.350%, 12/01/21 – NPFG Insured (Alternative Minimum Tax) | 12/13 at 100.00 | | AA | | | 20,029 | |
| | 8,820 | | Golden State Tobacco Securitization Corporation, California, Enhanced Tobacco Settlement Asset-Backed Revenue Bonds, Series 2005A, 5.000%, 6/01/45 – AGC Insured | 6/15 at 100.00 | | AA– | | | 8,709,221 | |
| | | | Golden State Tobacco Securitization Corporation, California, Tobacco Settlement Asset-Backed Bonds, Series 2007A-1: | | | | | | | |
| | 900 | | 5.000%, 6/01/33 | 6/17 at 100.00 | | B | | | 693,765 | |
| | 11,865 | | 5.125%, 6/01/47 | 6/17 at 100.00 | | B | | | 8,315,823 | |
| | 7,150 | | Grossmont Healthcare District, California, General Obligation Bonds, Series 2011B, 6.125%, 7/15/40 | 7/21 at 100.00 | | Aa2 | | | 8,114,249 | |
| | 10,000 | | Los Angeles Department of Water and Power, California, Waterworks Revenue Bonds, Series 2011A, 5.000%, 7/01/41 | 1/21 at 100.00 | | AA | | | 10,427,200 | |
| | 2,750 | | Los Angeles Regional Airports Improvement Corporation, California, Lease Revenue Refunding Bonds, LAXFUEL Corporation at Los Angeles International Airport, Series 2012, 4.500%, 1/01/27 (Alternative Minimum Tax) | 1/22 at 100.00 | | A | | | 2,749,835 | |
| | 12,000 | | Palomar Pomerado Health, California, General Obligation Bonds, Convertible Capital Appreciation, Election 2004 Series 2010A, 0.000%, 8/01/40 | 8/30 at 100.00 | | A+ | | | 8,565,960 | |
| | 3,850 | | Placentia-Yorba Linda Unified School District, Orange County, California, Certificates of Participation, Series 2011, 0.000%, 10/01/28 – AGM Insured | 10/25 at 100.00 | | AA– | | | 3,592,589 | |
| | 205 | | Riverside County Transportation Commission, California, Toll Revenue Senior Lien Bonds, Series 2013A, 5.750%, 6/01/44 | 6/23 at 100.00 | | BBB– | | | 206,189 | |
| NZF | Nuveen Dividend Advantage Municipal Fund 3 (continued) |
| | Portfolio of Investments October 31, 2013 |
| | Principal | | | Optional Call | | | | | | |
| | Amount (000) | | Description (1) | Provisions (2) | | Ratings (3) | | | Value | |
| | | | California (continued) | | | | | | | |
| $ | 3,550 | | San Buenaventura, California, Revenue Bonds, Community Memorial Health System, Series 2011, 7.500%, 12/01/41 | 12/21 at 100.00 | | BB | | $ | 3,920,372 | |
| | 3,000 | | San Diego Community College District, California, General Obligation Bonds, Tender Option Bond Trust 1005, 13.666%, 8/01/41 (IF), (5) | 8/21 at 100.00 | | AA+ | | | 3,447,210 | |
| | 10,000 | | San Joaquin Hills Transportation Corridor Agency, Orange County, California, Toll Road Revenue Refunding Bonds, Series 1997A, 0.000%, 1/15/35 – NPFG Insured | No Opt. Call | | A | | | 2,586,400 | |
| | 3,000 | | San Mateo County Community College District, California, General Obligation Bonds, Series 2006C, 0.000%, 9/01/30 – NPFG Insured | No Opt. Call | | Aaa | | | 1,425,390 | |
| | 90,435 | | Total California | | | | | | 77,573,005 | |
| | | | Colorado – 4.8% (3.3% of Total Investments) | | | | | | | |
| | 2,000 | | Broomfield, Colorado, Certificates of Participation, Refunding Series 2010, 3.000%, 12/01/13 | No Opt. Call | | Aa3 | | | 2,004,720 | |
| | 2,805 | | Colorado Educational and Cultural Facilities Authority, Revenue Bonds, Montessori Peaks Academy, Series 2006A, 5.400%, 5/01/26 | 5/16 at 102.00 | | N/R | | | 2,488,680 | |
| | 5,000 | | Compark Business Campus Metropolitan District, Colorado, General Obligation Limited Tax Bonds, Series 2007A, 5.600%, 12/01/34 – RAAI Insured | 12/17 at 100.00 | | N/R | | | 4,572,650 | |
| | | | Denver City and County, Colorado, Airport Revenue Bonds, Series 2006: | | | | | | | |
| | 5,365 | | 5.000%, 11/15/23 – FGIC Insured | 11/16 at 100.00 | | A+ | | | 5,890,019 | |
| | 3,300 | | 5.000%, 11/15/24 – FGIC Insured | 11/16 at 100.00 | | A+ | | | 3,612,939 | |
| �� | 4,335 | | 5.000%, 11/15/25 – FGIC Insured | 11/16 at 100.00 | | A+ | | | 4,670,919 | |
| | | | Maher Ranch Metropolitan District 4, Colorado, General Obligation Limited Tax Bonds, Series 2007: | | | | | | | |
| | 950 | | 5.125%, 12/01/27 – RAAI Insured | 12/17 at 100.00 | | N/R | | | 874,209 | |
| | 2,000 | | 5.250%, 12/01/36 – RAAI Insured | 12/17 at 100.00 | | N/R | | | 1,698,900 | |
| | 1,000 | | Plaza Metropolitan District 1, Lakewood, Colorado, Tax Increment Revenue Bonds, Series 2003, 8.000%, 12/01/25 (Pre-refunded 6/01/14) | 6/14 at 101.00 | | N/R (4) | | | 1,055,350 | |
| | 630 | | Regional Transportation District, Colorado, Certificates of Participation, Series 2010A, 5.375%, 6/01/31 | 6/20 at 100.00 | | Aa3 | | | 670,118 | |
| | 27,385 | | Total Colorado | | | | | | 27,538,504 | |
| | | | Connecticut – 0.8% (0.6% of Total Investments) | | | | | | | |
| | 1,500 | | Connecticut Health and Educational Facilities Authority, Revenue Bonds, Hartford Healthcare, Series 2011A, 5.000%, 7/01/41 | 7/21 at 100.00 | | A | | | 1,485,465 | |
| | 3,375 | | Connecticut State, General Obligation Bonds, Economic Recovery Series 2009A, 5.000%, 1/01/14 | No Opt. Call | | AA | | | 3,402,506 | |
| | 4,875 | | Total Connecticut | | | | | | 4,887,971 | |
| | | | District of Columbia – 2.0% (1.4% of Total Investments) | | | | | | | |
| | 10,000 | | Washington Convention Center Authority, District of Columbia, Dedicated Tax Revenue Bonds, Senior Lien Refunding Series 2007A, 4.500%, 10/01/30 – AMBAC Insured | 10/16 at 100.00 | | AA+ | | | 10,100,400 | |
| | 1,335 | | Washington Convention Center Authority, District of Columbia, Dedicated Tax Revenue Bonds, Tender Option Bond Trust 1606, 11.801%, 10/01/30 – BHAC Insured (IF), (5) | 10/16 at 100.00 | | AA+ | | | 1,375,197 | |
| | 11,335 | | Total District of Columbia | | | | | | 11,475,597 | |
| | | | Florida – 4.0% (2.7% of Total Investments) | | | | | | | |
| | 4,980 | | Broward County, Florida, Airport System Revenue Refunding Bonds, Series 2009O, 5.375%, 10/01/29 | 10/19 at 100.00 | | A+ | | | 5,414,505 | |
| | 1,950 | | Miami-Dade County, Florida, Aviation Revenue Bonds, Miami International Airport, Refunding Series 2012A, 5.000%, 10/01/31 (Alternative Minimum Tax) | No Opt. Call | | A | | | 1,979,348 | |
| | 2,490 | | Miami-Dade County, Florida, Subordinate Special Obligation Refunding Bonds Series 2012B, 5.000%, 10/01/37 | 10/22 at 100.00 | | A+ | | | 2,551,105 | |
| | 6,850 | | Miami-Dade County, Florida, Transit System Sales Surtax Revenue Bonds, Series 2012, 5.000%, 7/01/42 | 7/22 at 100.00 | | AA | | | 6,970,081 | |
| | 5,455 | | South Miami Health Facilities Authority, Florida, Hospital Revenue, Baptist Health System Obligation Group, Series 2007, 5.000%, 8/15/42 (UB), (5) | 8/17 at 100.00 | | AA | | | 5,380,812 | |
| | 70 | | Tolomato Community Development District, Florida, Special Assessment Bonds, Convertible, Capital Appreciation, Series 2012A-2, 0.000%, 5/01/39 | 5/17 at 100.00 | | N/R | | | 51,655 | |
| | Principal | | | Optional Call | | | | | | |
| | Amount (000) | | Description (1) | Provisions (2) | | Ratings (3) | | | Value | |
| | | | Florida (continued) | | | | | | | |
| $ | 200 | | Tolomato Community Development District, Florida, Special Assessment Bonds, Convertible, Capital Appreciation, Series 2012A-3, 0.000%, 5/01/40 | 5/19 at 100.00 | | N/R | | $ | 120,376 | |
| | 85 | | Tolomato Community Development District, Florida, Special Assessment Bonds, Convertible, Capital Appreciation, Series 2012A-4, 0.000%, 5/01/40 | 5/22 at 100.00 | | N/R | | | 37,919 | |
| | 110 | | Tolomato Community Development District, Florida, Special Assessment Bonds, Hope Note, Series 2007-3, 6.650%, 5/01/40 (6) | 5/18 at 100.00 | | N/R | | | 1 | |
| | 10 | | Tolomato Community Development District, Florida, Special Assessment Bonds, Non Performing ParcelSeries 2007-1. RMKT, 6.650%, 5/01/40 (6) | 5/18 at 100.00 | | N/R | | | 9,771 | |
| | 200 | | Tolomato Community Development District, Florida, Special Assessment Bonds, Refunding Series 2012A-1, 6.650%, 5/01/40 | 5/17 at 100.00 | | N/R | | | 196,482 | |
| | 475 | | Tolomato Community Development District, Florida, Special Assessment Bonds, Southern/Forbearance Parcel Series 2007-2, 6.650%, 5/01/40 (6) | 5/18 at 100.00 | | N/R | | | 263,473 | |
| | 22,875 | | Total Florida | | | | | | 22,975,528 | |
| | | | Georgia – 6.5% (4.5% of Total Investments) | | | | | | | |
| | 1,000 | | Atlanta, Georgia, Airport General Revenue Bonds, Series 2004G, 5.000%, 1/01/26 – AGM Insured | 1/15 at 100.00 | | AA– | | | 1,045,370 | |
| | 15,205 | | Atlanta, Georgia, Airport General Revenue Refunding Bonds, Series 2010C, 5.250%, 1/01/30 | 1/21 at 100.00 | | A1 | | | 16,173,709 | |
| | 2,000 | | Atlanta, Georgia, Airport Passenger Facilities Charge Revenue Bonds, Series 2004J, 5.000%, 1/01/29 – AGM Insured | No Opt. Call | | AA– | | | 2,087,160 | |
| | 3,000 | | Franklin County Industrial Building Authority, Georgia, Revenue Bonds, Ty Cobb Regional Medical Center Project, Series 2010, 8.125%, 12/01/45 | 12/20 at 100.00 | | N/R | | | 3,106,260 | |
| | 2,000 | | Fulton County Residential Care Facilities Authority, Georgia, Revenue Bonds, Elderly Care, Lenbrook Square Project, Series 2006A, 5.125%, 7/01/42 | 7/17 at 100.00 | | N/R | | | 1,613,100 | |
| | 5,000 | | Fulton County, Georgia, Water and Sewerage Revenue Bonds, Series 2004, 5.000%, 1/01/35 (Pre-refunded 1/01/14) – FGIC Insured | 1/14 at 100.00 | | AA– (4) | | | 5,040,600 | |
| | 8,150 | | Gwinnett County School District, Georgia, General Obligation Bonds, Series 2008, 5.000%, 2/01/36 | 2/18 at 100.00 | | AAA | | | 8,812,758 | |
| | 36,355 | | Total Georgia | | | | | | 37,878,957 | |
| | | | Illinois – 17.5% (11.9% of Total Investments) | | | | | | | |
| | 3,200 | | Chicago Transit Authority, Illinois, Sales Tax Receipts Revenue Bonds, Series 2011, 5.250%, 12/01/40 | 12/21 at 100.00 | | AA | | | 3,258,912 | |
| | 8,375 | | Chicago, Illinois, Revenue Bonds, Midway Airport, Series 2001A, 5.500%, 1/01/19 – AGM Insured (Alternative Minimum Tax) | 1/14 at 100.00 | | AA– | | | 8,409,003 | |
| | 4,855 | | Chicago, Illinois, Sales Tax Revenue Bonds, Series 2011A, 5.000%, 1/01/41 | 1/22 at 100.00 | | AAA | | | 4,969,044 | |
| | 2,220 | | Chicago, Illinois, Second Lien Wastewater Transmission Revenue Bonds, Series 2001A, 5.500%, 1/01/16 – NPFG Insured | No Opt. Call | | A+ | | | 2,419,511 | |
| | 3,630 | | Chicago, Illinois, Third Lien General Airport Revenue Bonds, O’Hare International Airport, Series 2005A, 5.000%, 1/01/33 – FGIC Insured | 1/16 at 100.00 | | A | | | 3,640,091 | |
| | 7,500 | | Community Unit School District 308, Oswego, in the Counties of Kendall, Kane, and Will, Illinois, General Obligation Bonds, Series 2004, 5.375%, 10/01/17 (Pre-refunded 10/01/14) – AGM Insured | 10/14 at 100.00 | | Aa2 (4) | | | 7,857,375 | |
| | 11,175 | | Cook County, Illinois, General Obligation Bonds, Refunding Series 2010A, 5.250%, 11/15/33 | 11/20 at 100.00 | | AA | | | 11,253,113 | |
| | 2,415 | | Illinois Finance Authority, General Obligation Debt Certificates, Local Government Program – Kankakee County, Series 2005B, 5.000%, 12/01/24 (Pre-refunded 12/01/14) – AMBAC Insured | 12/14 at 100.00 | | Baa2 (4) | | | 2,540,725 | |
| | 1,000 | | Illinois Finance Authority, Revenue Bonds, Advocate Health Care Network, Series 2012, 5.000%, 6/01/42 | No Opt. Call | | AA | | | 1,001,340 | |
| | 3,630 | | Illinois Finance Authority, Revenue Bonds, Sherman Health Systems, Series 2007A, 5.500%, 8/01/37 | 8/17 at 100.00 | | BBB | | | 3,750,552 | |
| | 4,125 | | Illinois Finance Authority, Revenue Bonds, The University of Chicago, Series 2012A, 5.000%, 10/01/51 | 10/21 at 100.00 | | Aa1 | | | 4,156,969 | |
| NZF | Nuveen Dividend Advantage Municipal Fund 3 (continued) |
| | Portfolio of Investments October 31, 2013 |
| | Principal | | | Optional Call | | | | | | |
| | Amount (000) | | Description (1) | Provisions (2) | | Ratings (3) | | | Value | |
| | | | Illinois (continued) | | | | | | | |
| $ | 6,000 | | Illinois State, General Obligation Bonds, Series 2004A, 5.000%, 3/01/28 | 3/14 at 100.00 | | A– | | $ | 5,981,340 | |
| | 560 | | Illinois Toll Highway Authority, Toll Highway Revenue Bonds, Tender Option Bond Trust 4304, 17.917%, 1/01/21 (IF), (5) | No Opt. Call | | AA– | | | 569,654 | |
| | 5,000 | | Lake County School District 38, Big Hallow, Illinois, General Obligation Bonds, Series 2005, 0.000%, 2/01/22 – AMBAC Insured | No Opt. Call | | N/R | | | 3,380,750 | |
| | 7,000 | | Lombard Public Facilities Corporation, Illinois, First Tier Conference Center and Hotel Revenue Bonds, Series 2005A-1, 7.125%, 1/01/36 | 1/16 at 100.00 | | N/R | | | 4,113,130 | |
| | 12,000 | | Metropolitan Pier and Exposition Authority, Illinois, McCormick Place Expansion Project Refunding Bonds, Series 2010A, 5.500%, 6/15/50 | 6/20 at 100.00 | | AAA | | | 12,259,318 | |
| | 45,000 | | Metropolitan Pier and Exposition Authority, Illinois, Revenue Bonds, McCormick Place Expansion Project, Capital Appreciation Refunding Series 2010B-1, 0.000%, 6/15/43 – AGM Insured | No Opt. Call | | AAA | | | 7,878,150 | |
| | 2,790 | | Metropolitan Pier and Exposition Authority, Illinois, Revenue Refunding Bonds, McCormick Place Expansion Project, Series 1998A, 5.500%, 6/15/29 – FGIC Insured | No Opt. Call | | AAA | | | 3,128,901 | |
| | 10,000 | | Schaumburg, Illinois, General Obligation Bonds, Series 2004B, 5.000%, 12/01/41 (Pre-refunded 12/01/14) – AGM Insured | 12/14 at 100.00 | | AAA | | | 10,520,600 | |
| | 140,475 | | Total Illinois | | | | | | 101,088,478 | |
| | | | Indiana – 8.0% (5.5% of Total Investments) | | | | | | | |
| | 4,230 | | Indiana Finance Authority, Educational Facilities Revenue Bonds, Tudor Park Foundation, Series 2005B, 5.000%, 6/01/24 | 6/15 at 100.00 | | Aa3 | | | 4,351,782 | |
| | 6,310 | | Indiana Finance Authority, Hospital Revenue Bonds, Community Health Network Project, Series 2012A, 5.000%, 5/01/42 | 5/23 at 100.00 | | A | | | 6,183,232 | |
| | 5,370 | | Indiana Finance Authority, Private Activity Bonds, Ohio River Bridges East End Crossing Project, Series 2013A, 5.250%, 1/01/51 (Alternative Minimum Tax) | 7/23 at 100.00 | | BBB | | | 4,921,122 | |
| | 6,700 | | Indiana Finance Authority, Wastewater Utility Revenue Bonds, CWA Authority Project, Series 2011B, 5.000%, 10/01/41 | 10/21 at 100.00 | | AA– | | | 6,800,366 | |
| | 10,925 | | Indiana Health Facility Financing Authority, Revenue Bonds, Community Hospitals of Indiana, Series 2005A, 5.000%, 5/01/35 (Pre-refunded 5/01/15) – AMBAC Insured | 5/15 at 100.00 | | A (4) | | | 11,702,967 | |
| | 7,000 | | Indiana Municipal Power Agency, Power Supply System Revenue Bonds, Series 2004A, 5.000%, 1/01/32 – FGIC Insured | 1/15 at 100.00 | | A+ | | | 7,205,870 | |
| | | | Vigo County Hospital Authority, Indiana, Revenue Bonds, Union Hospital, Series 2007: | | | | | | | |
| | 2,500 | | 5.750%, 9/01/42 | 9/17 at 100.00 | | N/R | | | 2,504,875 | |
| | 2,500 | | 5.800%, 9/01/47 | 9/17 at 100.00 | | N/R | | | 2,506,375 | |
| | 45,535 | | Total Indiana | | | | | | 46,176,589 | |
| | | | Iowa – 0.2% (0.1% of Total Investments) | | | | | | | |
| | | | Iowa Tobacco Settlement Authority, Asset Backed Settlement Revenue Bonds, Series 2005C: | | | | | | | |
| | 525 | | 5.500%, 6/01/42 | 6/15 at 100.00 | | B+ | | | 404,528 | |
| | 1,000 | | 5.625%, 6/01/46 | 6/15 at 100.00 | | B+ | | | 772,630 | |
| | 1,525 | | Total Iowa | | | | | | 1,177,158 | |
| | | | Kansas – 0.3% (0.2% of Total Investments) | | | | | | | |
| | | | Manhattan Health Care Facility Revenue Bonds, Kansas, Meadowlarks Hills Retirement, Series 2007B: | | | | | | | |
| | 1,000 | | 5.125%, 5/15/37 | 5/14 at 103.00 | | N/R | | | 876,450 | |
| | 1,000 | | 5.125%, 5/15/42 | 5/14 at 103.00 | | N/R | | | 859,020 | |
| | 2,000 | | Total Kansas | | | | | | 1,735,470 | |
| | | | Kentucky – 1.2% (0.8% of Total Investments) | | | | | | | |
| | 1,000 | | Kentucky Economic Development Finance Authority, Louisville Arena Project Revenue Bonds, Louisville Arena Authority, Inc., Series 2008-A1, 6.000%, 12/01/42 – AGC Insured | 6/18 at 100.00 | | AA– | | | 994,490 | |
| | 5,400 | | Lexington-Fayette Urban County Government Public Facilities Corporation, Kentucky State Lease Revenue Bonds, Eastern State Hospital Project, Series 2011A, 5.250%, 6/01/29 | 6/21 at 100.00 | | Aa3 | | | 5,735,934 | |
| | Principal | | | Optional Call | | | | | | |
| | Amount (000) | | Description (1) | Provisions (2) | | Ratings (3) | | | Value | |
| | | | Kentucky (continued) | | | | | | | |
| $ | 215 | | Warren County, Kentucky, Hospital Revenue Bonds, Bowling Green-Warren County Community Hospital Corporation, Series 2012A, 4.000%, 10/01/29 | 10/22 at 100.00 | | A | | $ | 199,741 | |
| | 6,615 | | Total Kentucky | | | | | | 6,930,165 | |
| | | | Louisiana – 5.2% (3.5% of Total Investments) | | | | | | | |
| | 2,000 | | Jefferson Parish Hospital Service District 2, Louisiana, Hospital Revenue Bonds, East Jefferson General Hospital, Refunding Series 2011, 6.375%, 7/01/41 | 7/21 at 100.00 | | BBB– | | | 2,117,700 | |
| | 3,000 | | Louisiana Local Government Environmental Facilities & Community Development Authority, Revenue Bonds, Westlake Chemical Corporation Project, Series 2007, 6.750%, 11/01/32 | 11/17 at 100.00 | | BBB | | | 3,201,090 | |
| | 10,000 | | Louisiana Public Facilities Authority, Revenue Bonds, Loyola University Project, Refunding Series 2011, 5.000%, 10/01/41 | 10/21 at 100.00 | | A+ | | | 10,282,600 | |
| | 3,700 | | Louisiana Public Facilities Authority, Revenue Bonds, Ochsner Clinic Foundation Project, Series 2007A, 5.500%, 5/15/47 | 5/17 at 100.00 | | Baa1 | | | 3,737,148 | |
| | 4,425 | | Louisiana Public Facilities Authority, Revenue Bonds, Ochsner Clinic Foundation Project, Series 2011, 6.750%, 5/15/41 | 5/21 at 100.00 | | Baa1 | | | 4,896,086 | |
| | 5,855 | | Louisiana Stadium and Exposition District, Revenue Refunding Bonds, Senior Lien Series 2013A, 5.000%, 7/01/36 | 7/23 at 100.00 | | A | | | 5,921,747 | |
| | 28,980 | | Total Louisiana | | | | | | 30,156,371 | |
| | | | Maryland – 0.7% (0.5% of Total Investments) | | | | | | | |
| | 1,000 | | Howard County, Maryland, Retirement Community Revenue Bonds, Vantage House, Series 2007B, 5.250%, 4/01/37 | 4/17 at 100.00 | | N/R | | | 823,150 | |
| | 2,000 | | Maryland Economic Development Corporation, Revenue Bonds, Chesapeake Bay Hyatt Conference Center, Series 2006A, 5.000%, 12/01/31 | 12/16 at 100.00 | | N/R | | | 1,159,860 | |
| | 555 | | Maryland Health and Higher Educational Facilities Authority, Revenue Bonds, Mercy Ridge Retirement Community, Series 2007, 4.750%, 7/01/34 | 7/17 at 100.00 | | A– | | | 541,758 | |
| | 1,675 | | Maryland Health and Higher Educational Facilities Authority, Revenue Bonds, MedStar Health Issue, Series 2013A, 4.000%, 8/15/41 | 8/23 at 100.00 | | A2 | | | 1,371,624 | |
| | 5,230 | | Total Maryland | | | | | | 3,896,392 | |
| | | | Massachusetts – 3.5% (2.4% of Total Investments) | | | | | | | |
| | 1,375 | | Massachusetts Development Finance Agency, Revenue Bonds, Orchard Cove, Series 2007, 5.250%, 10/01/26 | 4/14 at 102.00 | | N/R | | | 1,299,678 | |
| | 1,000 | | Massachusetts Health and Educational Facilities Authority, Revenue Bonds, Milton Hospital Project, Series 2005D, 5.250%, 7/01/30 | 7/15 at 100.00 | | BB+ | | | 986,820 | |
| | 1,600 | | Massachusetts Health and Educational Facilities Authority, Revenue Refunding Bonds, Suffolk University Issue, Series 2009A, 5.750%, 7/01/39 | 7/19 at 100.00 | | BBB | | | 1,658,464 | |
| | 400 | | Massachusetts Port Authority, Special Facilities Revenue Bonds, ConRac Project, Series 2011A, 5.125%, 7/01/41 | 7/21 at 100.00 | | A | | | 407,972 | |
| | 5,000 | | Massachusetts Port Authority, Special Facilities Revenue Bonds, Delta Air Lines Inc., Series 2001A, 5.500%, 1/01/18 – AMBAC Insured (Alternative Minimum Tax) | 1/14 at 100.00 | | N/R | | | 5,001,300 | |
| | 3,465 | | Massachusetts Water Resources Authority, General Revenue Bonds, Series 2007A, 4.500%, 8/01/46 – AGM Insured (UB), (5) | 2/17 at 100.00 | | AA+ | | | 3,483,815 | |
| | 7,165 | | Metropolitan Boston Transit Parking Corporation, Massachusetts, Systemwide Senior Lien Parking Revenue Bonds, Series 2011, 5.000%, 7/01/41 | 7/21 at 100.00 | | A+ | | | 7,375,938 | |
| | 20,005 | | Total Massachusetts | | | | | | 20,213,987 | |
| | | | Michigan – 8.1% (5.5% of Total Investments) | | | | | | | |
| | 15,000 | | Detroit City School District, Wayne County, Michigan, Unlimited Tax School Building and Site Improvement Bonds, Series 2001A, 6.000%, 5/01/29 – AGM Insured (UB) | No Opt. Call | | Aa2 | | | 15,852,750 | |
| | 690 | | Detroit Water and Sewerage Department, Michigan, Sewage Disposal System Revenue Bonds, Refunding Senior Lien Series 2012A, 5.250%, 7/01/39 | 7/22 at 100.00 | | BBB+ | | | 637,001 | |
| | 2,000 | | Garden City Hospital Finance Authority, Michigan, Revenue Bonds, Garden City Hospital Obligated Group, Series 2007A, 5.000%, 8/15/38 | 8/17 at 100.00 | | N/R | | | 1,583,300 | |
| NZF | Nuveen Dividend Advantage Municipal Fund 3 (continued) |
| | Portfolio of Investments October 31, 2013 |
| | Principal | | | Optional Call | | | | | | |
| | Amount (000) | | Description (1) | Provisions (2) | | Ratings (3) | | | Value | |
| | | | Michigan (continued) | | | | | | | |
| $ | 3,580 | | Lansing Board of Water and Light, Michigan, Utility System Revenue Bonds, Series 2011A, 5.500%, 7/01/41 | 7/21 at 100.00 | | AA– | | $ | 3,845,743 | |
| | 5,000 | | Michigan Finance Authority, Revenue Bonds, Trinity Health Credit Group, Refunding Series 2011, 5.000%, 12/01/39 | 12/21 at 100.00 | | Aa2 | | | 4,999,800 | |
| | 13,000 | | Michigan Finance Authority, Unemployment Obligation Assessment Revenue Bonds, Series 2012A, 5.000%, 7/01/14 | No Opt. Call | | AAA | | | 13,416,778 | |
| | 2,250 | | Michigan State Building Authority, Revenue Refunding Bonds, Facilities Program, Series 2011-I-A, 5.375%, 10/15/41 | 10/21 at 100.00 | | Aa3 | | | 2,299,590 | |
| | 650 | | Michigan State Hospital Finance Authority, Hospital Revenue Refunding Bonds, Sisters of Mercy Health Corporation, Series 1993P, 5.375%, 8/15/14 – NPFG Insured (ETM) | No Opt. Call | | A (4) | | | 676,078 | |
| | 2,865 | | Michigan State Hospital Finance Authority, Revenue bonds, Trinity Health Care Group, Series 2006A, 5.000%, 12/01/31 (UB) | 12/16 at 100.00 | | Aa2 | | | 2,904,050 | |
| | 635 | | Michigan State Hospital Finance Authority, Revenue Bonds, Trinity Health Care Group, Series 2006A, 5.000%, 12/01/31 (Pre-refunded 12/01/16) (UB) | 12/16 at 100.00 | | Aa2 (4) | | | 719,525 | |
| | 45,670 | | Total Michigan | | | | | | 46,934,615 | |
| | | | Minnesota – 1.4% (1.0% of Total Investments) | | | | | | | |
| | 1,200 | | Cambridge Independent School District 911, Isanti County, Minnesota, General Obligation Bonds, Refunding Series 2005C, 5.000%, 4/01/14 – NPFG Insured | No Opt. Call | | Aa2 | | | 1,224,132 | |
| | 2,120 | | Dakota County Community Development Agency, Minnesota, GNMA Collateralized Multifamily Housing Revenue Bonds, Rose Apartments Project, Series 2001, 6.350%, 10/20/37 (Alternative Minimum Tax) | 4/14 at 103.00 | | Aa1 | | | 2,185,508 | |
| | 3,000 | | Minnesota State, General Obligation Bonds, Various Purpose, Refunding Series 2010D, 5.000%, 8/01/18 | No Opt. Call | | AA+ | | | 3,556,590 | |
| | 1,375 | | Saint Paul Port Authority, Minnesota, Lease Revenue Bonds, Regions Hospital Parking Ramp Project, Series 2007-1, 5.000%, 8/01/36 | 8/16 at 100.00 | | N/R | | | 1,252,213 | |
| | 7,695 | | Total Minnesota | | | | | | 8,218,443 | |
| | | | Mississippi – 0.9% (0.6% of Total Investments) | | | | | | | |
| | 2,135 | | Mississippi Business Finance Corporation, GNMA Collateralized Retirement Facility Mortgage Revenue Refunding Bonds, Aldersgate Retirement Community Inc. Project, Series 1999A, 5.450%, 5/20/34 | 11/13 at 100.00 | | AA+ | | | 2,135,961 | |
| | 3,000 | | Mississippi Hospital Equipment and Facilities Authority, Revenue Bonds, Baptist Memorial Healthcare, Series 2004B-1, 5.000%, 9/01/24 (UB) | 9/14 at 100.00 | | AA– | | | 3,097,650 | |
| | 5,135 | | Total Mississippi | | | | | | 5,233,611 | |
| | | | Missouri – 0.9% (0.6% of Total Investments) | | | | | | | |
| | 1,495 | | Cape Girardeau County Industrial Development Authority, Missouri, Health Facilities Revenue Bonds, Southeast Missouri Hospital Association, Series 2007, 5.000%, 6/01/36 | 6/17 at 100.00 | | BBB+ | | | 1,458,387 | |
| | 1,000 | | Clinton County Industrial Development Authority, Missouri, Revenue Bonds, Cameron Regional Medical Center, Series 2007, 5.000%, 12/01/32 | 12/17 at 100.00 | | N/R | | | 908,340 | |
| | 2,500 | | Missouri Health and Educational Facilities Authority, Revenue Bonds, Washington University, Series 2011B, 5.000%, 11/15/37 | 11/21 at 100.00 | | AAA | | | 2,688,175 | |
| | 4,995 | | Total Missouri | | | | | | 5,054,902 | |
| | | | Montana – 0.9% (0.6% of Total Investments) | | | | | | | |
| | 5,000 | | Montana Board of Investments, Exempt Facility Revenue Bonds, Stillwater Mining Company, Series 2000, 8.000%, 7/01/20 (Alternative Minimum Tax) | 1/14 at 100.00 | | B+ | | | 5,012,650 | |
| | | | Nebraska – 0.3% (0.2% of Total Investments) | | | | | | | |
| | 1,005 | | Omaha Public Power District, Nebraska, Separate Electric System Revenue Bonds, Nebraska City 2, Tender Option Bond Trust 11673, 20.018%, 8/01/40 – AMBAC Insured (IF) | 2/17 at 100.00 | | AA+ | | | 1,523,409 | |
| | Principal | | | Optional Call | | | | | | |
| | Amount (000) | | Description (1) | Provisions (2) | | Ratings (3) | | | Value | |
| | | | Nevada – 5.5% (3.8% of Total Investments) | | | | | | | |
| $ | 10,000 | | Clark County, Nevada, Airport Revenue Bonds, Subordinate Lien Series 2010B, 5.750%, 7/01/42 | 1/20 at 100.00 | | A+ | | $ | 10,894,400 | |
| | 6,000 | | Clark County, Nevada, Passenger Facility Charge Revenue Bonds, Las Vegas-McCarran International Airport, Series 2010A, 5.250%, 7/01/42 | 1/20 at 100.00 | | A+ | | | 6,142,260 | |
| | 5,000 | | Henderson, Nevada, General Obligation Bonds, Sewer Series 2004, 5.000%, 6/01/34 (Pre-refunded 12/01/14) – FGIC Insured | 12/14 at 100.00 | | AA (4) | | | 5,258,650 | |
| | 10,000 | | Las Vegas Valley Water District, Nevada, Limited Tax General Obligation Bonds, Water & Refunding Series 2011C, 5.000%, 6/01/38 | 6/21 at 100.00 | | AA+ | | | 10,272,600 | |
| | 31,000 | | Total Nevada | | | | | | 32,567,910 | |
| | | | New Jersey – 4.9% (3.3% of Total Investments) | | | | | | | |
| | 2,850 | | New Jersey Economic Development Authority, Cigarette Tax Revenue Bonds, Series 2004, 5.500%, 6/15/31 (Pre-refunded 6/15/14) | 6/14 at 100.00 | | Aaa | | | 2,945,076 | |
| | | | New Jersey Health Care Facilities Financing Authority, Revenue Bonds, Somerset Medical Center, Series 2003: | | | | | | | |
| | 200 | | 5.500%, 7/01/23 | 1/14 at 100.00 | | Ba2 | | | 200,058 | |
| | 1,115 | | 5.500%, 7/01/33 | 1/14 at 100.00 | | Ba2 | | | 1,113,584 | |
| | 12,970 | | New Jersey Transportation Trust Fund Authority, Transportation System Bonds, Capital Appreciation Series 2010A, 0.000%, 12/15/33 | No Opt. Call | | A+ | | | 4,361,552 | |
| | 20,000 | | New Jersey Transportation Trust Fund Authority, Transportation System Bonds, Series 2006C, 0.000%, 12/15/33 – AGM Insured | No Opt. Call | | AA– | | | 6,711,800 | |
| | 7,000 | | New Jersey Transportation Trust Fund Authority, Transportation System Bonds, Series 2012AA, 5.000%, 6/15/38 | No Opt. Call | | A+ | | | 7,177,030 | |
| | 7,670 | | Tobacco Settlement Financing Corporation, New Jersey, Tobacco Settlement Asset-Backed Bonds, Series 2007-1A, 4.750%, 6/01/34 | 6/17 at 100.00 | | B2 | | | 5,583,300 | |
| | 51,805 | | Total New Jersey | | | | | | 28,092,400 | |
| | | | New York – 8.1% (5.5% of Total Investments) | | | | | | | |
| | 900 | | Albany Industrial Development Agency, New York, Revenue Bonds, Brighter Choice Charter Schools, Series 2007A, 5.000%, 4/01/32 | 4/17 at 100.00 | | BB+ | | | 794,961 | |
| | | | Brooklyn Arena Local Development Corporation, New York, Payment in Lieu of Taxes Revenue Bonds, Barclays Center Project, Series 2009: | | | | | | | |
| | 1,275 | | 6.000%, 7/15/30 | 1/20 at 100.00 | | BBB– | | | 1,347,063 | |
| | 3,400 | | 0.000%, 7/15/44 | No Opt. Call | | BBB– | | | 548,590 | |
| | 4,675 | | Dormitory Authority of the State of New York, State Personal Income Tax Revenue Bonds, General Purpose Series 2011C, 5.000%, 3/15/41 | 3/21 at 100.00 | | AAA | | | 4,849,752 | |
| | 2,100 | | Hudson Yards Infrastructure Corporation, New York, Revenue Bonds, Senior Fiscal 2012 Series 2011A, 5.750%, 2/15/47 | 2/21 at 100.00 | | A | | | 2,228,520 | |
| | 4,945 | | Hudson Yards Infrastructure Corporation, New York, Revenue Bonds, Series 2006A, 4.500%, 2/15/47 – NPFG Insured | 2/17 at 100.00 | | A | | | 4,684,844 | |
| | 1,000 | | Long Island Power Authority, New York, Electric System General Revenue Bonds, Series 2003B, 5.250%, 6/01/14 | No Opt. Call | | A– | | | 1,027,440 | |
| | 1,200 | | Long Island Power Authority, New York, Electric System Revenue Bonds, Series 2011A, 5.000%, 5/01/36 – AGM Insured | 5/21 at 100.00 | | AA– | | | 1,230,924 | |
| | 5,000 | | Long Island Power Authority, New York, Electric System Revenue Bonds, Series 2012A, 5.000%, 9/01/42 | 9/22 at 100.00 | | A– | | | 5,056,600 | |
| | 750 | | Metropolitan Transportation Authority, New York, Transportation Revenue Bonds, Series 2011A, 5.000%, 11/15/41 | 11/21 at 100.00 | | A | | | 762,893 | |
| | 8,000 | | New York City Industrial Development Agency, New York, American Airlines-JFK International Airport Special Facility Revenue Bonds, Series 2005, 7.750%, 8/01/31 (Alternative Minimum Tax) | 8/16 at 101.00 | | N/R | | | 8,678,320 | |
| | 3,125 | | New York City Municipal Water Finance Authority, New York, Water and Sewer System Revenue Bonds, Second Generation Resolution, Fiscal 2011 Series EE, 5.375%, 6/15/43 | 12/20 at 100.00 | | AA+ | | | 3,333,000 | |
| | 8,000 | | New York City Sales Tax Asset Receivable Corporation, New York, Dedicated Revenue Bonds, Local Government Assistance Corporation, Series 2004A, 5.000%, 10/15/21 – NPFG Insured | 10/14 at 100.00 | | AAA | | | 8,353,840 | |
| NZF | Nuveen Dividend Advantage Municipal Fund 3 (continued) |
| | Portfolio of Investments October 31, 2013 |
| | Principal | | | Optional Call | | | | | | |
| | Amount (000) | | Description (1) | Provisions (2) | | Ratings (3) | | | Value | |
| | | | New York (continued) | | | | | | | |
| $ | 60 | | New York City, New York, General Obligation Bonds, Fiscal Series 2002G, 5.625%, 8/01/20 – NPFG Insured | 8/14 at 100.00 | | AA | | $ | 60,223 | |
| | 3,000 | | New York State Power Authority, General Revenue Bonds, Series 2011A, 5.000%, 11/15/38 | 11/21 at 100.00 | | Aa2 | | | 3,187,500 | |
| | 585 | | Triborough Bridge and Tunnel Authority, New York, General Purpose Revenue Bonds, Refunding Subordinate Lien Series 2013A, 5.000%, 11/15/28 | No Opt. Call | | A+ | | | 642,687 | |
| | 48,015 | | Total New York | | | | | | 46,787,157 | |
| | | | North Carolina – 0.8% (0.6% of Total Investments) | | | | | | | |
| | 1,710 | | Charlotte-Mecklenberg Hospital Authority, North Carolina, Carolinas HealthCare System Revenue Bonds, Series 2008, Trust 1149, 15.079%, 7/15/32 (IF), (5) | 1/18 at 100.00 | | AA– | | | 1,723,116 | |
| | 1,200 | | Charlotte-Mecklenburg Hospital Authority, North Carolina, Health Care System Revenue Bonds, Carolinas Health Care, Series 2007A, 5.000%, 1/15/31 | 1/17 at 100.00 | | AA– | | | 1,218,000 | |
| | 1,750 | | Charlotte-Mecklenburg Hospital Authority, North Carolina, Healthcare System Revenue Bonds, DBA Carolinas Healthcare System, Series 2005A, 4.875%, 1/15/32 (Pre-refunded 1/15/15) | 1/15 at 100.00 | | AA+ (4) | | | 1,848,455 | |
| | 4,660 | | Total North Carolina | | | | | | 4,789,571 | |
| | | | Ohio – 3.3% (2.2% of Total Investments) | | | | | | | |
| | | | Allen County, Ohio, Hospital Facilities Revenue Bonds, Catholic Health Partners, Refunding and Improvement Series 2012A: | | | | | | | |
| | 650 | | 5.000%, 5/01/33 | 5/22 at 100.00 | | AA– | | | 666,744 | |
| | 970 | | 4.000%, 5/01/33 | 5/22 at 100.00 | | AA– | | | 869,033 | |
| | 800 | | 5.000%, 5/01/42 | 5/22 at 100.00 | | AA– | | | 802,752 | |
| | | | Buckeye Tobacco Settlement Financing Authority, Ohio, Tobacco Settlement Asset-Backed Revenue Bonds, Senior Lien, Series 2007A-2: | | | | | | | |
| | 4,735 | | 5.125%, 6/01/24 | 6/17 at 100.00 | | B– | | | 4,047,005 | |
| | 710 | | 5.875%, 6/01/30 | 6/17 at 100.00 | | B | | | 578,302 | |
| | 3,705 | | 5.750%, 6/01/34 | 6/17 at 100.00 | | B | | | 2,901,015 | |
| | 1,670 | | 5.875%, 6/01/47 | 6/17 at 100.00 | | B | | | 1,297,273 | |
| | 1,915 | | Chagrin Falls Exempt Village School District, Ohio, General Obligation Bonds, Refunding Series 2005, 5.250%, 12/01/19 (Pre-refunded 12/01/14) – NPFG Insured | 12/14 at 100.00 | | Aa1 (4) | | | 2,020,287 | |
| | 5,800 | | Franklin County, Ohio, Hospital Revenue Bonds, OhioHealth Corporation, Series 2011A, 5.000%, 11/15/41 | 11/21 at 100.00 | | AA+ | | | 5,857,246 | |
| | 20,955 | | Total Ohio | | | | | | 19,039,657 | |
| | | | Oklahoma – 2.1% (1.4% of Total Investments) | | | | | | | |
| | | | Oklahoma Development Finance Authority, Revenue Bonds, Saint John Health System, Series 2007: | | | | | | | |
| | 4,535 | | 5.000%, 2/15/37 | 2/17 at 100.00 | | A+ | | | 4,606,744 | |
| | 1,145 | | 5.000%, 2/15/42 | 2/17 at 100.00 | | A+ | | | 1,161,019 | |
| | 6,305 | | Tulsa County Industrial Authority, Oklahoma, Health Care Revenue Bonds, Saint Francis Health System, Series 2006, 5.000%, 12/15/36 (UB) | 12/16 at 100.00 | | AA+ | | | 6,333,562 | |
| | 88 | | Tulsa County Industrial Authority, Oklahoma, Health Care Revenue Bonds, Saint Francis Health System, Series 2008, Trust 3500, 8.497%, 6/15/30 (IF) | 12/16 at 100.00 | | AA+ | | | 88,724 | |
| | 12,073 | | Total Oklahoma | | | | | | 12,190,049 | |
| | | | Oregon – 1.1% (0.7% of Total Investments) | | | | | | | |
| | 4,700 | | Oregon Health, Housing, Educational and Cultural Facilities Authority, Revenue Bonds, PeaceHealth Project, Series 2001, 5.250%, 11/15/21 – AMBAC Insured | 11/13 at 100.00 | | AA– | | | 4,716,168 | |
| | 1,435 | | Oregon State Department of Transportation, Highway User Tax Revenue Bonds, Series 2004B, 5.250%, 11/15/16 (Pre-refunded 11/15/14) | 11/14 at 100.00 | | AAA | | | 1,510,596 | |
| | 6,135 | | Total Oregon | | | | | | 6,226,764 | |
| | | | Pennsylvania – 1.4% (1.0% of Total Investments) | | | | | | | |
| | 500 | | Bucks County Industrial Development Authority, Pennsylvania, Charter School Revenue Bonds, School Lane Charter School, Series 2007A, 5.000%, 3/15/37 | 3/17 at 100.00 | | BBB | | | 443,870 | |
| | 2,451 | | Northampton County Industrial Development Authority, Pennsylvania, Recovery Revenue Bonds, Northampton Generating Project, Senior Lien Series 2013A0 & AE2, 5.000%, 12/01/23 | 1/14 at 100.00 | | N/R | | | 2,059,779 | |
| | Principal | | | Optional Call | | | | | | |
| | Amount (000) | | Description (1) | Provisions (2) | | Ratings (3) | | | Value | |
| | | | Pennsylvania (continued) | | | | | | | |
| $ | 32 | | Northampton County Industrial Development Authority, Pennsylvania, Recovery Revenue Bonds, Northampton Generating Project, Senior Lien Taxable Series 2013B, 5.000%, 12/31/23 (Alternative Minimum Tax) | 1/14 at 100.00 | | N/R | | $ | 26,605 | |
| | 5,605 | | Pennsylvania Turnpike Commission, Turnpike Revenue Bonds, Senior Lien Series 2012A, 5.000%, 12/01/42 | 12/22 at 100.00 | | A+ | | | 5,715,475 | |
| | 8,588 | | Total Pennsylvania | | | | | | 8,245,729 | |
| | | | Puerto Rico – 0.4% (0.3% of Total Investments) | | | | | | | |
| | 2,500 | | Puerto Rico Sales Tax Financing Corporation, Sales Tax Revenue Bonds, Series 2007A, 5.250%, 8/01/57 | 8/17 at 100.00 | | AA– | | | 2,156,425 | |
| | | | Rhode Island – 1.5% (1.0% of Total Investments) | | | | | | | |
| | | | Rhode Island Tobacco Settlement Financing Corporation, Tobacco Settlement Asset-Backed Bonds, Series 2002A: | | | | | | | |
| | 25 | | 6.000%, 6/01/23 | 1/14 at 100.00 | | Baa1 | | | 25,000 | |
| | 8,730 | | 6.250%, 6/01/42 | 1/14 at 100.00 | | BBB– | | | 8,502,758 | |
| | 8,755 | | Total Rhode Island | | | | | | 8,527,758 | |
| | | | South Carolina – 2.0% (1.4% of Total Investments) | | | | | | | |
| | 10,600 | | Greenville County School District, South Carolina, Installment Purchase Revenue Bonds, Series 2006, 5.000%, 12/01/24 | 12/16 at 100.00 | | AA | | | 11,696,780 | |
| | | | Tennessee – 0.6% (0.4% of Total Investments) | | | | | | | |
| | 1,065 | | Chattanooga Health, Educational and Housing Facility Board, Tennessee, Hospital Revenue Bonds, Catholic Health Initiatives, Series 2013A, 5.250%, 1/01/45 (WI/DD, Settling 11/14/13) | 1/23 at 100.00 | | A+ | | | 1,065,298 | |
| | 1,595 | | Harpeth Valley Utilities District, Davidson and Williamson Counties, Tennessee, Utilities Revenue Bonds, Series 2012A, 4.000%, 9/01/42 | 9/22 at 100.00 | | AA | | | 1,498,710 | |
| | 3,680 | | Knox County Health, Educational and Housing Facilities Board, Tennessee, Hospital Revenue Refunding Bonds, Covenant Health, Series 2006, 0.000%, 1/01/41 | 1/17 at 30.07 | | A | | | 767,685 | |
| | 415 | | Sullivan County Health Educational and Housing Facilities Board, Tennessee, Revenue Bonds, Wellmont Health System, Series 2006C, 5.250%, 9/01/36 | 9/16 at 100.00 | | BBB+ | | | 415,996 | |
| | | | Sumner County Health, Educational, and Housing Facilities Board, Tennessee, Revenue Refunding Bonds, Sumner Regional Health System Inc., Series 2007: | | | | | | | |
| | 800 | | 5.500%, 11/01/37 (6) | 11/17 at 100.00 | | N/R | | | 1,920 | |
| | 2,800 | | 5.500%, 11/01/46 (6) | 11/17 at 100.00 | | N/R | | | 6,720 | |
| | 10,355 | | Total Tennessee | | | | | | 3,756,329 | |
| | | | Texas – 19.0% (13.0% of Total Investments) | | | | | | | |
| | 5,445 | | Board of Regents, University of Texas System, Financing System Revenue Bonds, Series 2006F, 4.250%, 8/15/36 (UB) | 2/17 at 100.00 | | AAA | | | 5,454,638 | |
| | 2,700 | | Central Texas Regional Mobility Authority, Revenue Bonds, Senior Lien Series 2011, 6.250%, 1/01/46 | 1/21 at 100.00 | | Baa2 | | | 2,768,580 | |
| | 4,500 | | Colorado River Municipal Water District, Texas, Water System Revenue Bonds, Series 2011, 5.000%, 1/01/36 | 1/21 at 100.00 | | AA– | | | 4,664,160 | |
| | 5,000 | | Decatur Hospital Authority, Texas, Revenue Bonds, Wise Regional Health System, Series 2004A, 7.000%, 9/01/25 | 9/14 at 100.00 | | N/R | | | 5,156,800 | |
| | 1,140 | | Grand Parkway Transportation Corporation, Texas, System Toll Revenue Bonds, Tender Option Bond Trust 2013- 9A, 17.943%, 4/01/53 (IF) | 10/23 at 100.00 | | AA+ | | | 1,108,707 | |
| | 10,000 | | Houston, Texas, First Lien Combined Utility System Revenue Bonds, Series 2011D, 5.000%, 11/15/40 | 11/21 at 100.00 | | AA | | | 10,450,600 | |
| | 4,965 | | Houston, Texas, Hotel Occupancy Tax and Special Revenue Bonds, Convention and Entertainment Facilities Department, Refunding Series 2011B, 5.250%, 9/01/27 | 9/16 at 100.00 | | A2 | | | 5,316,770 | |
| | 6,000 | | Houston, Texas, Junior Lien Water and Sewerage System Revenue Refunding Bonds, Series 2001B, 5.500%, 12/01/29 – NPFG Insured (ETM) | No Opt. Call | | AA+ (4) | | | 7,521,120 | |
| | 14,200 | | Hutto Independent School District, Williamson County, Texas, General Obligation Bonds, Series 2007A, 4.750%, 8/01/43 (UB) | 8/16 at 100.00 | | AAA | | | 14,199,006 | |
| NZF | Nuveen Dividend Advantage Municipal Fund 3 (continued) |
| | Portfolio of Investments October 31, 2013 |
| | Principal | | | Optional Call | | | | | | |
| | Amount (000) | | Description (1) | Provisions (2) | | Ratings (3) | | | Value | |
| | | | Texas (continued) | | | | | | | |
| $ | 8,000 | | Lower Colorado River Authority, Texas, Transmission Contract Refunding Revenue Bonds, LCRA Transmission Services Corporation Project, Refunding & Improvement Series 2010, 5.000%, 5/15/40 | 5/20 at 100.00 | | A+ | | $ | 8,021,920 | |
| | 1,750 | | Martin County Hospital District, Texas, Combination Limited Tax and Revenue Bonds, Series 2011A, 7.250%, 4/01/36 | 4/21 at 100.00 | | BBB | | | 1,836,083 | |
| | 2,500 | | Matagorda County Navigation District 1, Texas, Collateralized Revenue Refunding Bonds, Houston Light and Power Company, Series 1997, 5.125%, 11/01/28 – AMBAC Insured (Alternative Minimum Tax) | No Opt. Call | | A | | | 2,624,450 | |
| | 3,500 | | North Texas Municipal Water District, Water System Revenue Bonds, Series 2004, 5.000%, 9/01/24 (Pre-refunded 9/01/14) – NPFG Insured | 9/14 at 100.00 | | AAA | | | 3,641,260 | |
| | 6,380 | | North Texas Tollway Authority, Second Tier System Revenue Refunding Bonds, Series 2008F, 5.750%, 1/01/38 | 1/18 at 100.00 | | A3 | | | 6,726,562 | |
| | | | North Texas Tollway Authority, Special Projects System Revenue Bonds, Series 2011A: | | | | | | | |
| | 4,370 | | 0.000%, 9/01/43 | 9/31 at 100.00 | | AA+ | | | 3,017,835 | |
| | 9,130 | | 0.000%, 9/01/45 | 9/31 at 100.00 | | AA+ | | | 6,934,418 | |
| | 3,500 | | Southwest Higher Education Authority Inc, Texas, Revenue Bonds, Southern Methodist University, Series 2010, 5.000%, 10/01/41 | 10/20 at 100.00 | | AA– | | | 3,806,705 | |
| | 7,700 | | Tarrant County Cultural Education Facilities Finance Corporation, Texas Health Resources, Series 2007A, 5.000%, 2/15/36 (UB) | 2/17 at 100.00 | | AA– | | | 7,736,498 | |
| | 435 | | Texas Municipal Gas Acquisition and Supply Corporation III, Gas Supply Revenue Bonds, Series 2012, 5.000%, 12/15/32 | No Opt. Call | | A3 | | | 421,907 | |
| | 1,665 | | Texas Transportation Commission, Central Texas Turnpike System Revenue Bonds, First Tier Refunding Series 2012A, 5.000%, 8/15/41 | 8/22 at 100.00 | | A– | | | 1,659,905 | |
| | | | White Settlement Independent School District, Tarrant County, Texas, General Obligation Bonds, Series 2006: | | | | | | | |
| | 1,445 | | 0.000%, 8/15/37 | 8/15 at 31.98 | | AAA | | | 385,699 | |
| | 1,445 | | 0.000%, 8/15/40 | 8/15 at 27.11 | | AAA | | | 322,293 | |
| | 1,125 | | 0.000%, 8/15/44 | 8/15 at 21.88 | | AAA | | | 187,223 | |
| | | | White Settlement Independent School District, Tarrant County, Texas, General Obligation Bonds, Series 2006: | | | | | | | |
| | 7,665 | | 0.000%, 8/15/37 (Pre-refunded 8/15/15) | 8/15 at 31.98 | | N/R (4) | | | 2,429,345 | |
| | 7,665 | | 0.000%, 8/15/40 (Pre-refunded 8/15/15) | 8/15 at 27.11 | | N/R (4) | | | 2,059,432 | |
| | 5,985 | | 0.000%, 8/15/44 (Pre-refunded 8/15/15) | 8/15 at 21.88 | | N/R (4) | | | 1,297,548 | |
| | 128,210 | | Total Texas | | | | | | 109,749,464 | |
| | | | Utah – 1.1% (0.8% of Total Investments) | | | | | | | |
| | | | Utah Housing Corporation, Single Family Mortgage Bonds, Series 2001E: | | | | | | | |
| | 415 | | 5.200%, 1/01/18 (Alternative Minimum Tax) | 1/14 at 100.00 | | AA– | | | 416,166 | |
| | 175 | | 5.500%, 1/01/23 (Alternative Minimum Tax) | 1/14 at 100.00 | | Aaa | | | 179,370 | |
| | | | Utah Housing Corporation, Single Family Mortgage Bonds, Series 2001F-1: | | | | | | | |
| | 685 | | 4.950%, 7/01/18 (Alternative Minimum Tax) | 1/14 at 100.00 | | AA– | | | 686,247 | |
| | 280 | | 5.300%, 7/01/23 (Alternative Minimum Tax) | 1/14 at 100.00 | | Aaa | | | 286,356 | |
| | 4,935 | | Utah Transit Authority, Sales Tax Revenue and Refunding Bonds, Series 2012, 5.000%, 6/15/42 | 6/22 at 100.00 | | A1 | | | 5,031,677 | |
| | 6,490 | | Total Utah | | | | | | 6,599,816 | |
| | | | Vermont – 1.6% (1.1% of Total Investments) | | | | | | | |
| | 9,000 | | University of Vermont and State Agricultural College, Revenue Bonds, Series 2005, 5.000%, 10/01/35 – NPFG Insured | 10/15 at 100.00 | | Aa3 | | | 9,431,730 | |
| | | | Virginia – 0.3% (0.2% of Total Investments) | | | | | | | |
| | 1,000 | | Chesterfield County Health Center Commission, Virginia, Mortgage Revenue Bonds, Lucy Corr Village, Series 2005, 5.375%, 12/01/28 | 12/15 at 100.00 | | N/R | | | 699,100 | |
| | 1,000 | | Virginia Commonwealth University Health System Authority, General Revenue Bonds, Series 2011, 4.750%, 7/01/41 | 7/21 at 100.00 | | AA– | | | 980,310 | |
| | 2,000 | | Total Virginia | | | | | | 1,679,410 | |
| | Principal | | | Optional Call | | | | | | |
| | Amount (000) | | Description (1) | Provisions (2) | | Ratings (3) | | | Value | |
| | | | Washington – 5.0% (3.4% of Total Investments) | | | | | | | |
| $ | 2,500 | | King County, Washington, Sewer Revenue Bonds, Series 2009, 5.250%, 1/01/42 | 1/19 at 100.00 | | AA+ | | $ | 2,708,825 | |
| | 1,820 | | Port of Seattle, Washington, Revenue Bonds, Intermediate Lien Refunding Series 2012A, 5.000%, 8/01/30 | 8/22 at 100.00 | | Aa3 | | | 1,948,983 | |
| | 5,205 | | Port of Seattle, Washington, Revenue Bonds, Series 2005A, 5.000%, 3/01/35 – NPFG Insured | 3/15 at 100.00 | | Aa3 | | | 5,236,334 | |
| | 10,000 | | Washington Health Care Facilities Authority, Revenue Bonds, Catholic Health, Series 2011A, 5.000%, 2/01/41 | 2/21 at 100.00 | | A+ | | | 9,802,300 | |
| | 3,410 | | Washington Health Care Facilities Authority, Revenue Bonds, Fred Hutchinson Cancer Research Center, Series 2011A, 5.625%, 1/01/35 | 1/21 at 100.00 | | A | | | 3,504,764 | |
| | | | Washington State Health Care Facilities Authority, Revenue Bonds, Group Health Cooperative of Puget Sound, Series 2001: | | | | | | | |
| | 3,005 | | 5.375%, 12/01/17 – AMBAC Insured | 12/13 at 100.00 | | BBB– | | | 3,008,576 | |
| | 2,915 | | 5.375%, 12/01/18 – AMBAC Insured | 12/13 at 100.00 | | BBB– | | | 2,918,032 | |
| | 28,855 | | Total Washington | | | | | | 29,127,814 | |
| | | | Wisconsin – 0.2% (0.1% of Total Investments) | | | | | | | |
| | 1,000 | | Wisconsin Health and Educational Facilities Authority, Revenue Bonds, Franciscan Sisters of Christian Charity HealthCare Ministry, Series 2007, 5.000%, 9/01/33 | 9/17 at 100.00 | | BBB+ | | | 975,970 | |
| $ | 920,811 | | Total Municipal Bonds (cost $817,077,134) | | | | | | 824,696,440 | |
| | Principal | | | | | | | | | | |
| | Amount (000) | | Description (1) | Coupon | Maturity | | Ratings (3) | | | Value | |
| | | | Corporate Bonds – 0.0% (0.0% of Total Investments) | | | | | | | | |
| | | | Transportation – 0.0% (0.0% of Total Investments) | | | | | | | | |
| $ | 42 | | Las Vegas Monorail Company, Senior Interest Bonds (7), (8) | 5.500% | 7/15/19 | | N/R | | $ | 7,595 | |
| | 12 | | Las Vegas Monorail Company, Senior Interest Bonds (7), (8) | 3.000% | 7/15/55 | | N/R | | | 1,607 | |
| $ | 54 | | Total Corporate Bonds (cost $2,145) | | | | | | | 9,202 | |
| | | | | | | | | | | | |
| | Shares | | Description (1), (9) | | | | | | | Value | |
| | | | Investment Companies – 0.6% (0.4% of Total Investments) | | | | | | | | |
| | 6,266 | | BlackRock MuniHoldings Fund Inc. | | | | | | $ | 95,682 | |
| | 26,880 | | Dreyfus Strategic Municipal Fund | | | | | | | 211,277 | |
| | 131,278 | | DWS Municipal Income Trust | | | | | | | 1,593,715 | |
| | 43,020 | | Invesco VK Investment Grade Municipal Trust | | | | | | | 525,274 | |
| | 30,000 | | Invesco VK Municipal Opportunity Trust | | | | | | | 352,800 | |
| | 43,420 | | PIMCO Municipal Income Fund II | | | | | | | 484,133 | |
| | | | Total Investment Companies (cost $3,325,133) | | | | | | | 3,262,881 | |
| | | | Total Long-Term Investments (cost $820,404,412) | | | | | | | 827,968,523 | |
| NZF | Nuveen Dividend Advantage Municipal Fund 3 (continued) |
| | Portfolio of Investments October 31, 2013 |
| | Principal | | | Optional Call | | | | | | |
| | Amount (000) | | Description (1) | Provisions (2) | | Ratings (3) | | | Value | |
| | | | Short-Term Investments 3.3% (2.2% of Total Investments) | | | | | | | |
| | | | Arizona – 0.9% (0.6% of Total Investments) | | | | | | | |
| $ | 5,000 | | Arizona School Facilities Board, Certificates of Participation, Variable Rate Demand Obligations, Tender Option Bond Trust 3199X, 0.130%, 9/01/21 – AGC Insured (10) | No Opt. Call | | A-1 | | $ | 5,000,000 | |
| | | | Iowa – 1.0% (0.7% of Total Investments) | | | | | | | |
| | 1,500 | | Iowa State, Special Obligation Bonds, I-Jobs Program, Variable Rate Demand Obligations, Tender Option Bond Trust 13B-A REG D, 0.100%, 6/01/25 (10) | No Opt. Call | | A-1 | | | 1,500,000 | |
| | 4,500 | | Iowa State, Special Obligation Bonds, I-Jobs Program, Variable Rate Demand Obligations, Tender Option Bond Trust 13B-B REG D, 0.100%, 6/01/26 (10) | 6/19 at 100.00 | | A-1 | | | 4,500,000 | |
| | 6,000 | | Total Iowa | | | | | | 6,000,000 | |
| | | | New York – 1.4% (0.9% of Total Investments) | | | | | | | |
| | 7,914 | | Liberty Development Corporation, New York, Goldman Sachs Headquarter Revenue Bonds, Variable Rate Demand Obligations, Tender Option Bond Trust 1251, 0.400%, 10/01/35 (10) | No Opt. Call | | VMIG-3 | | | 7,914,000 | |
| $ | 18,914 | | Total Short-Term Investments (cost $18,914,000) | | | | | | 18,914,000 | |
| | | | Total Investments (cost $839,318,412) | | | | | | 846,882,523 | |
| | | | Floating Rate Obligations – (7.7)% | | | | | | (44,412,000 | ) |
| | | | MuniFund Term Preferred Shares, at Liquidation Value – (12.1)% (11) | | | | | | (70,000,000 | ) |
| | | | Variable Rate MuniFund Term Preferred Shares, at Liquidation Value – (29.2)% (11) | | | | | | (169,200,000 | ) |
| | | | Other Assets Less Liabilities – 2.6% | | | | | | 15,237,303 | |
| | | | Net Assets Applicable to Common Shares – 100% | | | | | $ | 578,507,826 | |
| (1) | All percentages shown in the Portfolio of Investments are based on net assets applicable to Common shares unless otherwise noted. |
| (2) | Optional Call Provisions (not covered by the report of independent registered public accounting firm): Dates (month and year) and prices of the earliest optional call or redemption. There may be other call provisions at varying prices at later dates. Certain mortgage-backed securities may be subject to periodic principal paydowns. |
| (3) | Ratings (not covered by the report of independent registered public accounting firm): Using the highest of Standard & Poor’s Group (“Standard & Poor’s”), Moody’s Investors Service, Inc. (“Moody’s”) or Fitch, Inc. (“Fitch”) rating. Ratings below BBB by Standard & Poor’s, Baa by Moody’s or BBB by Fitch are considered to be below investment grade. Holdings designated N/R are not rated by any of these national rating agencies. |
| (4) | Backed by an escrow or trust containing sufficient U.S. Government or U.S. Government agency securities, which ensure the timely payment of principal and interest. Certain bonds backed by U.S. Government or agency securities are regarded as having an implied rating equal to the rating of such securities. |
| (5) | Investment, or portion of investment, has been pledged to collateralize the net payment obligations for investments in inverse floating rate transactions. |
| (6) | At or subsequent to the end of the reporting period, this security is non-income producing. Non-income producing security, in the case of a fixed-income security, generally denotes that the issuer has (1) defaulted on the payment of principal or interest, (2) is under the protection of the Federal Bankruptcy Court or (3) the Fund’s Adviser has concluded that the issue is not likely to meet its future interest payment obligations and has directed the Fund’s custodian to cease accruing additional income on the Fund’s records. |
| (7) | Investment valued at fair value using methods determined in good faith by, or at the discretion of, the Board of Trustees. For fair value measurement disclosure purposes, investment categorized as Level 3. See Notes to Financial Statements, Note 2 – Investment Valuation and Fair Value Measurements for more information. |
| (8) | During January 2010, Las Vegas Monorail Company (“Las Vegas Monorail”) filed for federal bankruptcy protection. During March 2012, Las Vegas Monorail emerged from federal bankruptcy with the acceptance of a reorganization plan assigned by the Federal Bankruptcy Court. Under the reorganization plan, the Fund surrendered its Las Vegas Monorail Project Revenue Bonds, First Tier, Series 2000 and in turn received two senior interest corporate bonds: the first with an annual coupon rate of 5.500% maturing on July 15, 2019 and the second with an annual coupon rate of 3.000% (5.500% after December 31, 2015) maturing on July 15, 2055. The Fund’s custodian is not accruing income on the Fund’s records for either senior interest corporate bond. |
| (9) | A copy of the most recent financial statements for the investment companies in which the Fund invests can be obtained directly from the Securities and Exchange Commission on its website at http://www.sec.gov. |
| (10) | Investment has a maturity of more than a year, but has variable rate and demand features which qualify it as a short-term investment. The rate disclosed is that in effect at the end of the reporting period. This rate changes periodically based on market conditions or a specified market index. |
| (11) | MuniFund Term Preferred Shares and Variable Rate MuniFund Term Preferred Shares, at Liquidation Value as a percentage of Total Investments are 8.3% and 20.0%, respectively. |
| WI/DD | Purchased on a when-issued or delayed delivery basis. |
| (ETM) | Escrowed to maturity. |
| (IF) | Inverse floating rate investment. |
| (UB) | Underlying bond of an inverse floating rate trust reflected as a financing transaction. See Notes to Financial Statements, Note 3 – Portfolio Securities and Investments in Derivatives, Inverse Floating Rate Securities for more information. |
See accompanying notes to financial statements.
| Statement of |
| | Assets & Liabilities |
| | October 31, 2013 |
| | | | Performance | | | Municipal | | | Market | |
| | | | Plus | | | Advantage | | | Opportunity | |
| | | | (NPP | ) | | (NMA | ) | | (NMO | ) |
| Assets | | | | | | | | | | |
| Investments, at value (cost $1,389,851,631, $920,877,187 and $973,964,320, respectively) | | $ | 1,438,365,940 | | $ | 927,392,431 | | $ | 990,287,519 | |
| Cash | | | 4,131,323 | | | — | | | — | |
| Receivables for: | | | | | | | | | | |
| Dividend and interest | | | 18,299,095 | | | 14,232,738 | | | 13,774,331 | |
| Investments sold | | | 9,430,726 | | | 20,014,381 | | | 19,045,485 | |
| Deferred offering costs | | | 118,272 | | | 2,242,515 | | | 3,872,942 | |
| Other assets | | | 170,153 | | | 415,944 | | | 430,020 | |
| Total assets | | | 1,470,515,509 | | | 964,298,009 | | | 1,027,410,297 | |
| Liabilities | | | | | | | | | | |
| Cash overdraft | | | — | | | 495,039 | | | 514,246 | |
| Floating rate obligations | | | 35,925,000 | | | 45,488,333 | | | 34,730,000 | |
| Payables for: | | | | | | | | | | |
| Common share dividends | | | 4,119,125 | | | 2,603,550 | | | 2,651,009 | |
| Interest | | | 558,599 | | | — | | | — | |
| Investments purchased | | | 5,008,464 | | | 4,736,747 | | | 7,816,887 | |
| Offering costs | | | 60,587 | | | — | | | — | |
| MuniFund Term Preferred (MTP) Shares, at liquidation value | | | — | | | — | | | — | |
| Variable Rate MuniFund Term Preferred (VMTP) Shares, at liquidation value | | | 535,000,000 | | | — | | | — | |
| Variable Rate Demand Preferred (VRDP) Shares, at liquidation value | | | — | | | 296,800,000 | | | 350,900,000 | |
| Accrued expenses: | | | | | | | | | | |
| Management fees | | | 720,700 | | | 476,918 | | | 501,604 | |
| Directors/Trustees fees | | | 175,646 | | | 126,586 | | | 132,856 | |
| Other | | | 229,059 | | | 179,333 | | | 193,431 | |
| Total liabilities | | | 581,797,180 | | | 350,906,506 | | | 397,440,033 | |
| Net assets applicable to common shares | | $ | 888,718,329 | | $ | 613,391,503 | | $ | 629,970,264 | |
| Common shares outstanding | | | 60,025,455 | | | 43,697,408 | | | 45,874,035 | |
| Net asset value per common share outstanding (net assets applicable to common shares, divided by common shares outstanding) | | $ | 14.81 | | $ | 14.04 | | $ | 13.73 | |
| Net assets applicable to common shares consist of: | | | | | | | | | | |
| Common shares, $.01 par value per share | | $ | 600,255 | | $ | 436,974 | | $ | 458,740 | |
| Paid-in surplus | | | 837,938,424 | | | 611,009,673 | | | 639,679,540 | |
| Undistributed (Over-distribution of) net investment income | | | 13,663,451 | | | 1,461,216 | | | 3,301,942 | |
| Accumulated net realized gain (loss) | | | (11,998,110 | ) | | (6,031,604 | ) | | (29,793,157 | ) |
| Net unrealized appreciation (depreciation) | | | 48,514,309 | | | 6,515,244 | | | 16,323,199 | |
| Net assets applicable to common shares | | $ | 888,718,329 | | $ | 613,391,503 | | $ | 629,970,264 | |
| Authorized shares: | | | | | | | | | | |
| Common | | | 200,000,000 | | | 200,000,000 | | | 200,000,000 | |
| Preferred | | | 1,000,000 | | | 1,000,000 | | | 1,000,000 | |
See accompanying notes to financial statements.
Statement of Assets and Liabilities (continued)
| | | | Dividend | | | Dividend | | | Dividend | |
| | | | Advantage | | | Advantage 2 | | | Advantage 3 | |
| | | | (NAD | ) | | (NXZ | ) | | (NZF | ) |
| Assets | | | | | | | | | | |
| Investments, at value (cost $839,345,259, $613,033,201 and $839,318,413, respectively) | | $ | 854,293,390 | | $ | 630,683,231 | | $ | 846,882,523 | |
| Cash | | | 805,823 | | | — | | | 3,575,392 | |
| Receivables for: | | | | | | | | | | |
| Dividend and interest | | | 12,601,678 | | | 9,842,327 | | | 13,452,883 | |
| Investments sold | | | 16,566,366 | | | 8,947,976 | | | 3,957,752 | |
| Deferred offering costs | | | 975,371 | | | 2,073,222 | | | 941,907 | |
| Other assets | | | 110,404 | | | 246,459 | | | 98,091 | |
| Total assets | | | 885,353,032 | | | 651,793,215 | | | 868,908,548 | |
| Liabilities | | | | | | | | | | |
| Cash overdraft | | | — | | | 88,086 | | | — | |
| Floating rate obligations | | | 42,810,000 | | | 19,570,000 | | | 44,412,000 | |
| Payables for: | | | | | | | | | | |
| Common share dividends | | | 2,790,771 | | | 1,927,183 | | | 2,292,423 | |
| Interest | | | 440,161 | | | — | | | 318,458 | |
| Investments purchased | | | 7,443,353 | | | 4,305,694 | | | 3,554,667 | |
| Offering costs | | | — | | | — | | | — | |
| MuniFund Term Preferred (MTP) Shares, at liquidation value | | | 144,300,000 | | | — | | | 70,000,000 | |
| Variable Rate MuniFund Term Preferred (VMTP) Shares, at liquidation value | | | 120,400,000 | | | — | | | 169,200,000 | |
| Variable Rate Demand Preferred (VRDP) Shares, at liquidation value | | | — | | | 196,000,000 | | | — | |
| Accrued expenses: | | | | | | | | | | |
| Management fees | | | 433,174 | | | 315,055 | | | 447,985 | |
| Directors/Trustees fees | | | 110,931 | | | 77,178 | | | 99,666 | |
| Other | | | 137,520 | | | 124,541 | | | 75,523 | |
| Total liabilities | | | 318,865,910 | | | 222,407,737 | | | 290,400,722 | |
| Net assets applicable to common shares | | $ | 566,487,122 | | $ | 429,385,478 | | $ | 578,507,826 | |
| Common shares outstanding | | | 39,296,352 | | | 29,478,412 | | | 40,400,028 | |
| Net asset value per common share outstanding (net assets applicable to common shares, divided by common shares outstanding) | | $ | 14.42 | | $ | 14.57 | | $ | 14.32 | |
| Net assets applicable to common shares consist of: | | | | | | | | | | |
| Common shares, $.01 par value per share | | $ | 392,964 | | $ | 294,784 | | $ | 404,000 | |
| Paid-in surplus | | | 549,004,538 | | | 420,445,459 | | | 574,483,534 | |
| Undistributed (Over-distribution of) net investment income | | | 6,977,549 | | | 6,039,433 | | | 2,175,375 | |
| Accumulated net realized gain (loss) | | | (4,836,060 | ) | | (15,044,228 | ) | | (6,119,193 | ) |
| Net unrealized appreciation (depreciation) | | | 14,948,131 | | | 17,650,030 | | | 7,564,110 | |
| Net assets applicable to common shares | | $ | 566,487,122 | | $ | 429,385,478 | | $ | 578,507,826 | |
| Authorized shares: | | | | | | | | | | |
| Common | | | Unlimited | | | Unlimited | | | Unlimited | |
| Preferred | | | Unlimited | | | Unlimited | | | Unlimited | |
See accompanying notes to financial statements.
| Statement of | |
| | Operations |
| | Year Ended October 31, 2013 |
| | | | | | | | | | | | | | | | | | | | |
| | | Performance | | | Municipal | | | Market | | | Dividend | | | Dividend | | | Dividend | |
| | | | Plus | | | Advantage | | Opportunity | | | Advantage | | Advantage 2 | | Advantage 3 | |
| | | | (NPP | ) | | (NMA | ) | | (NMO | ) | | (NAD | ) | | (NXZ | ) | | (NZF | ) |
| Investment Income | | $ | 70,950,526 | | $ | 46,325,997 | | $ | 47,945,960 | | $ | 43,887,244 | | $ | 32,601,940 | | $ | 39,402,315 | |
| Expenses | | | | | | | | | | | | | | | | | | | |
| Management fees | | | 9,007,358 | | | 5,936,187 | | | 6,196,117 | | | 5,373,430 | | | 3,907,678 | | | 5,524,643 | |
| Shareholder servicing agent fees and expenses | | | 117,722 | | | 63,742 | | | 66,835 | | | 40,408 | | | 3,412 | | | 36,819 | |
| Interest expense and amortization of offering costs | | | 8,085,894 | | | 897,556 | | | 1,182,595 | | | 6,296,460 | | | 614,959 | | | 4,665,619 | |
| Liquidity fees | | | — | | | 3,524,627 | | | 3,623,554 | | | — | | | 2,023,986 | | | — | |
| Remarketing fees | | | — | | | 300,097 | | | 355,773 | | | — | | | 198,722 | | | — | |
| Custodian fees and expenses | | | 212,122 | | | 144,289 | | | 153,707 | | | 131,691 | | | 100,166 | | | 123,910 | |
| Directors/Trustees fees and expenses | | | 39,197 | | | 25,087 | | | 26,835 | | | 22,910 | | | 17,209 | | | 22,467 | |
| Professional fees | | | 100,469 | | | 84,923 | | | 101,218 | | | 93,738 | | | 20,490 | | | 89,545 | |
| Shareholder reporting expenses | | | 103,357 | | | 56,416 | | | 52,722 | | | 24,258 | | | 33,337 | | | 21,729 | |
| Stock exchange listing fees | | | 19,321 | | | 14,232 | | | 14,775 | | | 27,506 | | | 4,120 | | | 20,640 | |
| Investor relations expenses | | | 76,080 | | | 44,684 | | | 48,111 | | | 42,411 | | | 30,385 | | | 39,496 | |
| Other expenses | | | 88,811 | | | 73,022 | | | 77,564 | | | 55,686 | | | 47,878 | | | 53,591 | |
| Total expenses | | | 17,850,331 | | | 11,164,862 | | | 11,899,806 | | | 12,108,498 | | | 7,002,342 | | | 10,598,459 | |
| Net investment income (loss) | | | 53,100,195 | | | 35,161,135 | | | 36,046,154 | | | 31,778,746 | | | 25,599,598 | | | 28,803,856 | |
| Realized and Unrealized Gain (Loss) | | | | | | | | | | | | | | | | | | | |
| Net realized gain (loss) from investments | | | (1,190,986 | ) | | 1,902,428 | | | 4,405,132 | | | 2,993,365 | | | (982,380 | ) | | (3,893,567 | ) |
| Change in net unrealized appreciation (depreciation) of investments | | | (108,633,727 | ) | | (76,105,657 | ) | | (73,715,669 | ) | | (64,050,459 | ) | | (45,727,407 | ) | | (61,986,667 | ) |
| Net realized and unrealized gain (loss) | | | (109,824,713 | ) | | (74,203,229 | ) | | (69,310,537 | ) | | (61,057,094 | ) | | (46,709,787 | ) | | (65,880,234 | ) |
| Net increase (decrease) in net assets applicable to common shares from operations | | $ | (56,724,518 | ) | $ | (39,042,094 | ) | $ | (33,264,383 | ) | $ | (29,278,348 | ) | $ | (21,110,189 | ) | $ | (37,076,378 | ) |
See accompanying notes to financial statements.
| Statement of | |
| | Changes in Net Assets |
| | | | Performance Plus (NPP) | | Municipal Advantage (NMA) | | | Market Opportunity (NMO) | |
| | | | Year | | | Year | | | Year | | | Year | | | Year | | | Year | |
| | | | Ended | | | Ended | | | Ended | | | Ended | | | Ended | | | Ended | |
| | | | 10/31/13 | | | 10/31/12 | | | 10/31/13 | | | 10/31/12 | | | 10/31/13 | | | 10/31/12 | |
| Operations | | | | | | | | | | | | | | | | | | | |
| Net investment income (loss) | | $ | 53,100,195 | | $ | 54,983,220 | | $ | 35,161,135 | | $ | 37,717,284 | | $ | 36,046,154 | | $ | 38,020,965 | |
| Net realized gain (loss) from investments | | | (1,190,986 | ) | | (4,496,980 | ) | | 1,902,428 | | | (4,110,526 | ) | | 4,405,132 | | | (26,149,022 | ) |
| Change in net unrealized appreciation (depreciation) of investments | | | (108,633,727 | ) | | 114,383,532 | | | (76,105,657 | ) | | 75,463,789 | | | (73,715,669 | ) | | 104,254,908 | |
| Net increase (decrease) in net assets applicable to common shares from operations | | | (56,724,518 | ) | | 164,869,772 | | | (39,042,094 | ) | | 109,070,547 | | | (33,264,383 | ) | | 116,126,851 | |
| Distributions to Common Shareholders | | | | | | | | | | | | | | | | | | | |
| From net investment income | | | (55,642,228 | ) | | (57,577,044 | ) | | (36,369,357 | ) | | (42,173,504 | ) | | (36,125,808 | ) | | (40,494,777 | ) |
| From accumulated net realized gains | | | — | | | — | | | — | | | (6,262,880 | ) | | — | | | — | |
| Decrease in net assets applicable to common shares from distributions to common shareholders | | | (55,642,228 | ) | | (57,577,044 | ) | | (36,369,357 | ) | | (48,436,384 | ) | | (36,125,808 | ) | | (40,494,777 | ) |
| Capital Share Transactions | | | | | | | | | | | | | | | | | | | |
| Net proceeds from common shares issued to shareholders due to reinvestment of distributions | | | 294,626 | | | 895,179 | | | — | | | 1,552,841 | | | — | | | 913,746 | |
| Net increase (decrease) in net assets applicable to common shares from capital share transactions | | | 294,626 | | | 895,179 | | | — | | | 1,552,841 | | | — | | | 913,746 | |
| Net increase (decrease) in net assets applicable to common shares | | | (112,072,120 | ) | | 108,187,907 | | | (75,411,451 | ) | | 62,187,004 | | | (69,390,191 | ) | | 76,545,820 | |
| Net assets applicable to common shares at the beginning of period | | | 1,000,790,449 | | | 892,602,542 | | | 688,802,954 | | | 626,615,950 | | | 699,360,455 | | | 622,814,635 | |
| Net assets applicable to common shares at the end of period | | $ | 888,718,329 | | $ | 1,000,790,449 | | $ | 613,391,503 | | $ | 688,802,954 | | $ | 629,970,264 | | $ | 699,360,455 | |
| Undistributed (Over-distribution of) net investment income at the end of period | | $ | 13,663,451 | | $ | 15,127,300 | | $ | 1,461,216 | | $ | 2,711,925 | | $ | 3,301,942 | | $ | 3,312,390 | |
See accompanying notes to financial statements.
| | | | Dividend Advantage (NAD) | | Dividend Advantage 2 (NXZ) | | Dividend Advantage 3 (NZF) | |
| | | | Year | | | Year | | | Year | | | Year | | | Year | | | Year | |
| | | | Ended | | | Ended | | | Ended | | | Ended | | | Ended | | | Ended | |
| | | | 10/31/13 | | | 10/31/12 | | | 10/31/13 | | | 10/31/12 | | | 10/31/13 | | | 10/31/12 | |
| Operations | | | | | | | | | | | | | | | | | | | |
| Net investment income (loss) | | $ | 31,778,746 | | $ | 33,737,305 | | $ | 25,599,598 | | $ | 26,046,294 | | $ | 28,803,856 | | $ | 31,475,368 | |
| Net realized gain (loss) from investments | | | 2,993,365 | | | (7,128,012 | ) | | (982,380 | ) | | (8,088,572 | ) | | (3,893,567 | ) | | 826,958 | |
| Change in net unrealized appreciation (depreciation) of investments | | | (64,050,459 | ) | | 76,258,406 | | | (45,727,407 | ) | | 62,604,155 | | | (61,986,667 | ) | | 66,498,560 | |
| Net increase (decrease) in net assets applicable to common shares from operations | | | (29,278,348 | ) | | 102,867,699 | | | (21,110,189 | ) | | 80,561,877 | | | (37,076,378 | ) | | 98,800,886 | |
| Distributions to Common Shareholders | | | | | | | | | | | | | | | | | | | |
| From net investment income | | | (34,749,765 | ) | | (36,077,981 | ) | | (23,936,470 | ) | | (28,132,531 | ) | | (30,409,101 | ) | | (38,439,108 | ) |
| From accumulated net realized gains | | | — | | | (1,638,658 | ) | | — | | | (5,329,641 | ) | | — | | | (1,535,068 | ) |
| Decrease in net assets applicable to common shares from distributions to common shareholders | | | (34,749,765 | ) | | (37,716,639 | ) | | (23,936,470 | ) | | (33,462,172 | ) | | (30,409,101 | ) | | (39,974,176 | ) |
| Capital Share Transactions | | | | | | | | | | | | | | | | | | | |
| Net proceeds from common shares issued to shareholders due to reinvestment of distributions | | | — | | | — | | | — | | | 247,562 | | | — | | | 119,194 | |
| Net increase (decrease) in net assets applicable to common shares from capital share transactions | | | — | | | — | | | — | | | 247,562 | | | — | | | 119,194 | |
| Net increase (decrease) in net assets applicable to common shares | | | (64,028,113 | ) | | 65,151,060 | | | (45,046,759 | ) | | 47,347,267 | | | (67,485,479 | ) | | 58,945,904 | |
| Net assets applicable to common shares at the beginning of period | | | 630,515,235 | | | 565,364,175 | | | 474,432,137 | | | 427,084,870 | | | 645,993,305 | | | 587,047,401 | |
| Net assets applicable to common shares at the end of period | | $ | 566,487,122 | | $ | 630,515,235 | | $ | 429,385,478 | | $ | 474,432,137 | | $ | 578,507,826 | | $ | 645,993,305 | |
| Undistributed (Over-distribution of) net investment income at the end of period | | $ | 6,977,549 | | $ | 9,269,383 | | $ | 6,039,433 | | $ | 4,336,549 | | $ | 2,175,375 | | $ | 3,241,456 | |
See accompanying notes to financial statements.
| Statement of | |
| | Cash Flows |
| | Year Ended October 31, 2013 |
| | | | Performance | | | Municipal | | | Market | |
| | | | Plus | | | Advantage | | | Opportunity | |
| | | | (NPP | ) | | (NMA | ) | | (NMO | ) |
| Cash Flows from Operating Activities: | | | | | | | | | | |
| Net Increase (Decrease) In Net Assets Applicable to Common Shares from Operations | | $ | (56,724,518 | ) | $ | (39,042,094 | ) | $ | (33,264,383 | ) |
| Adjustments to reconcile the net increase (decrease) in net assets applicable to common shares from operations to net cash provided by (used in) operating activities: | | | | | | | | | | |
| Purchases of investments | | | (396,698,053 | ) | | (167,238,424 | ) | | (211,231,283 | ) |
| Proceeds from sales and maturities of investments | | | 278,560,509 | | | 179,149,981 | | | 216,185,441 | |
| Proceeds from (Purchases of) short-term investments, net | | | — | | | — | | | 5,023,250 | |
| Amortization (Accretion) of premiums and discounts, net | | | (11,811,716 | ) | | (3,923,029 | ) | | (4,257,487 | ) |
| (Increase) Decrease in: | | | | | | | | | | |
| Receivable for dividends and interest | | | (1,302,174 | ) | | (215,224 | ) | | 761,979 | |
| Receivable for investments sold | | | 5,589,274 | | | (14,313,472 | ) | | (14,345,521 | ) |
| Other assets | | | (12,622 | ) | | (7,968 | ) | | (8,227 | ) |
| Increase (Decrease) in: | | | | | | | | | | |
| Payable for interest | | | 45,415 | | | — | | | — | |
| Payable for investments purchased | | | 2,265,481 | | | 3,367,971 | | | 2,868,187 | |
| Accrued management fees | | | (8,455 | ) | | (39,159 | ) | | (35,324 | ) |
| Accrued Directors/Trustees fees | | | 15,020 | | | 9,416 | | | 10,085 | |
| Accrued other expenses | | | (59,343 | ) | | (51,771 | ) | | (61,361 | ) |
| Net realized (gain) loss from investments | | | 1,190,986 | | | (1,902,428 | ) | | (4,405,132 | ) |
| Change in net unrealized (appreciation) depreciation of investments | | | 108,633,727 | | | 76,105,657 | | | 73,715,669 | |
| Taxes paid on undistributed capital gains | | | (6,501 | ) | | (2,948 | ) | | (4,705 | ) |
| Net cash provided by (used in) operating activities | | | (70,322,970 | ) | | 31,896,508 | | | 30,951,188 | |
| Cash Flows from Financing Activities: | | | | | | | | | | |
| (Increase) Decrease in deferred offering costs | | | 1,024,580 | | | 74,821 | | | 60,419 | |
| Increase (Decrease) in: | | | | | | | | | | |
| Cash overdraft | | | — | | | 495,039 | | | 514,246 | |
| Floating rate obligations | | | 12,135,000 | | | — | | | — | |
| Payable for offering costs | | | 60,587 | | | — | | | — | |
| VMTP Shares, at liquidation value | | | 113,300,000 | | | — | | | — | |
| Cash distributions paid to common shareholders | | | (55,477,764 | ) | | (36,626,982 | ) | | (36,326,718 | ) |
| Net cash provided by (used in) financing activities | | | 71,042,403 | | | (36,057,122 | ) | | (35,752,053 | ) |
| Net Increase (Decrease) in Cash | | | 719,433 | | | (4,160,614 | ) | | (4,800,865 | ) |
| Cash at beginning of period | | | 3,411,890 | | | 4,160,614 | | | 4,800,865 | |
| Cash at end of period | | $ | 4,131,323 | | $ | — | | $ | — | |
| | | | | | | | | | | |
| Supplemental Disclosure of Cash Flow Information | | | | | | | | | | |
| | | | Performance | | | Municipal | | | Market | |
| | | | Plus | | | Advantage | | | Opportunity | |
| | | | (NPP | ) | | (NMA | ) | | (NMO | ) |
| Cash paid for interest (excluding amortization of offering costs) | | $ | 6,840,899 | | $ | 812,829 | | $ | 1,038,781 | |
| Non-cash financing activities not included herein consists of reinvestments of common share distributions | | | 294,626 | | | — | | | — | |
See accompanying notes to financial statements.
| | | | Dividend | | | Dividend | | | Dividend | |
| | | | Advantage | | | Advantage 2 | | | Advantage 3 | |
| | | | (NAD | ) | | (NXZ | ) | | (NZF | ) |
| Cash Flows from Operating Activities: | | | | | | | | | | |
| Net Increase (Decrease) In Net Assets Applicable to Common Shares from Operations | | $ | (29,278,348 | ) | $ | (21,110,189 | ) | $ | (37,076,378 | ) |
| Adjustments to reconcile the net increase (decrease) in net assets applicable to common shares from operations to net cash provided by (used in) operating activities: | | | | | | | | | | |
| Purchases of investments | | | (103,215,105 | ) | | (146,216,398 | ) | | (140,669,774 | ) |
| Proceeds from sales and maturities of investments | | | 115,555,585 | | | 143,127,905 | | | 118,575,330 | |
| Proceeds from (Purchases of) short-term investments, net | | | 5,023,250 | | | 5,023,250 | | | (14,414,000 | ) |
| Amortization (Accretion) of premiums and discounts, net | | | (6,854,984 | ) | | (2,292,699 | ) | | 1,951,284 | |
| (Increase) Decrease in: | | | | | | | | | | |
| Receivable for dividends and interest | | | 934,390 | | | 817,796 | | | 206,507 | |
| Receivable for investments sold | | | (16,456,366 | ) | | (8,740,611 | ) | | 33,126,658 | |
| Other assets | | | (7,147 | ) | | (5,063 | ) | | (6,365 | ) |
| Increase (Decrease) in: | | | | | | | | | | |
| Payable for interest | | | (10,638 | ) | | — | | | (14,960 | ) |
| Payable for investments purchased | | | 7,443,353 | | | 4,305,694 | | | 446,992 | |
| Accrued management fees | | | (32,554 | ) | | (23,617 | ) | | 4,472 | |
| Accrued Directors/Trustees fees | | | 8,615 | | | 6,115 | | | 7,741 | |
| Accrued other expenses | | | (82,522 | ) | | (100,602 | ) | | (55,655 | ) |
| Net realized (gain) loss from investments | | | (2,993,365 | ) | | 982,380 | | | 3,893,568 | |
| Change in net unrealized (appreciation) depreciation of investments | | | 64,050,459 | | | 45,727,407 | | | 61,986,666 | |
| Taxes paid on undistributed capital gains | | | (4,752 | ) | | (244 | ) | | (1,309 | ) |
| Net cash provided by (used in) operating activities | | | 34,079,871 | | | 21,501,124 | | | 27,960,777 | |
| Cash Flows from Financing Activities: | | | | | | | | | | |
| (Increase) Decrease in deferred offering costs | | | 739,857 | | | 77,437 | | | 599,594 | |
| Increase (Decrease) in: | | | | | | | | | | |
| Cash overdraft | | | — | | | 88,086 | | | — | |
| Floating rate obligations | | | — | | | 1,310,000 | | | — | |
| Payable for offering costs | | | — | | | — | | | (168 | ) |
| VMTP Shares, at liquidation value | | | — | | | — | | | — | |
| Cash distributions paid to common shareholders | | | (34,848,642 | ) | | (24,155,528 | ) | | (31,092,503 | ) |
| Net cash provided by (used in) financing activities | | | (34,108,785 | ) | | (22,680,005 | ) | | (30,493,077 | ) |
| Net Increase (Decrease) in Cash | | | (28,914 | ) | | (1,178,881 | ) | | (2,532,300 | ) |
| Cash at beginning of period | | | 834,737 | | | 1,178,881 | | | 6,107,692 | |
| Cash at end of period | | $ | 805,823 | | $ | — | | $ | 3,575,392 | |
| | | | | | | | | | | |
| Supplemental Disclosure of Cash Flow Information | | | | | | | | | | |
| | | | Dividend | | | Dividend | | | Dividend | |
| | | | Advantage | | | Advantage 2 | | | Advantage 3 | |
| | | | (NAD | ) | | (NXZ | ) | | (NZF | ) |
| Cash paid for interest (excluding amortization of offering costs) | | $ | 5,566,506 | | $ | 537,046 | | $ | 4,080,418 | |
| Non-cash financing activities not included herein consists of reinvestments of common share distributions | | | — | | | — | | | — | |
See accompanying notes to financial statements.
| Financial | |
| | Highlights |
| | |
| Selected data for a common share outstanding throughout each period: |
| | | | | | Investment Operations | | | Less Distributions | | | | | | | |
| | | | | | | | | | | | | | Distributions | | | | | | | | | | | | | | | | | | | |
| | | | | | | | | | | Distributions | | | from | | | | | | | | | From | | | | | | | | | | |
| | | | | | | | | | | | from Net | | | Accumulated | | | | | | | | | Accumu- | | | | | | | | | | |
| | | | | | | | | | | | Investment | | | Net Realized | | | | | | From Net | | | lated Net | | | | | | Ending | | | | |
| | | Beginning | | | | | | Net | | | Income to | | | Gains to | | | | | | Investment | | | Realized | | | | | | Common | | | | |
| | | Common | | | Net | | | Realized/ | | Auction Rate | | | Auction Rate | | | | | | Income to | | | Gains to | | | | | | Share | | | | |
| | | Share | | | Investment | | | Unrealized | | | Preferred | | | Preferred | | | | | | Common | | | Common | | | | | | Net | | | Ending | |
| | | Net Asset | | | Income | | | Gain | | | Share- | | | Share- | | | | | | Share- | | | Share- | | | | | | Asset | | | Market | |
| | | Value | | | (Loss) | | | (Loss) | | | holders | (a) | | holders | (a) | | Total | | | holders | | | holders | | | Total | | | Value | | | Value | |
| Performance Plus (NPP) | | | | | | | | | | | | | | | | | | | | | | | | | | | | |
| Year Ended 10/31: | | | | | | | | | | | | | | | | | | | | | | | | | | | | | | | | | |
| 2013 | | $ | 16.68 | | | $ | .88 | | | $ | (1.82 | ) | | $ | — | | | $ | — | | | $ | (.94 | ) | | $ | (.93 | ) | | $ | — | | | $ | (.93 | ) | | $ | 14.81 | | | $ | 13.64 | |
| 2012 | | | 14.89 | | | | .92 | | | | 1.83 | | | | — | | | | — | | | | 2.75 | | | | (.96 | ) | | | — | | | | (.96 | ) | | | 16.68 | | | | 16.44 | |
| 2011 | | | 15.29 | | | | .97 | | | | (.32 | ) | | | (.01 | ) | | | — | * | | | .64 | | | | (.95 | ) | | | (.09 | ) | | | (1.04 | ) | | | 14.89 | | | | 14.36 | |
| 2010 | | | 14.52 | | | | 1.03 | | | | .70 | | | | (.03 | ) | | | — | * | | | 1.70 | | | | (.92 | ) | | | (.01 | ) | | | (.93 | ) | | | 15.29 | | | | 15.00 | |
| 2009 | | | 12.69 | | | | 1.03 | | | | 1.65 | | | | (.06 | ) | | | — | | | | 2.62 | | | | (.79 | ) | | | — | | | | (.79 | ) | | | 14.52 | | | | 13.48 | |
| | | | | | | | | | | | | | | | | | | | | | | | | | | | | | | | | | | | | | | | | | | | | |
| Municipal Advantage (NMA) | | | | | | | | | | | | | | | | | | | | | | | | | | | | | | | | | | | | | |
| 2013 | | | 15.76 | | | | .80 | | | | (1.69 | ) | | | — | | | | — | | | | (.89 | ) | | | (.83 | ) | | | — | | | | (.83 | ) | | | 14.04 | | | | 12.52 | |
| 2012 | | | 14.37 | | | | .86 | | | | 1.64 | | | | — | | | | — | | | | 2.50 | | | | (.97 | ) | | | (.14 | ) | | | (1.11 | ) | | | 15.76 | | | | 15.67 | |
| 2011 | | | 14.79 | | | | .93 | | | | (.27 | ) | | | — | | | | — | | | | .66 | | | | (1.00 | ) | | | (.08 | ) | | | (1.08 | ) | | | 14.37 | | | | 14.05 | |
| 2010 | | | 14.08 | | | | 1.01 | | | | .76 | | | | (.01 | ) | | | — | * | | | 1.76 | | | | (.98 | ) | | | (.07 | ) | | | (1.05 | ) | | | 14.79 | | | | 14.92 | |
| 2009 | | | 12.12 | | | | 1.10 | | | | 1.76 | | | | (.06 | ) | | | — | | | | 2.80 | | | | (.84 | ) | | | — | | | | (.84 | ) | | | 14.08 | | | | 13.41 | |
| (a) | The amounts shown are based on common share equivalents. |
| (b) | Total Return Based on Market Value is the combination of changes in the market price per share and the effect of reinvested dividend income and reinvested capital gains distributions, if any, at the average price paid per share at the time of reinvestment. The last dividend declared in the period, which is typically paid on the first business day of the following month, is assumed to be reinvested at the ending market price. The actual reinvestment for the last dividend declared in the period may take place over several days, and in some instances may not be based on the market price, so the actual reinvestment price may be different from the price used in the calculation. Total returns are not annualized. |
| | |
| | Total Return Based on Common Share Net Asset Value is the combination of changes in common share net asset value, reinvested dividend income at net asset value and reinvested capital gains distributions at net asset value, if any. The last dividend declared in the period, which is typically paid on the first business day of the following month, is assumed to be reinvested at the ending net asset value. The actual reinvest price for the last dividend declared in the period may often be based on the Fund’s market price (and not its net asset value), and therefore may be different from the price used in the calculation. Total returns are not annualized. |
| | | | | | | | Ratios/Supplemental Data |
| | | | | | | | | | | Ratios to Average Net Assets | | | | |
| | Total Returns | | | | | | Applicable to Common Shares(c) | | | | |
| | | | | | | | | | | | |
| | Based | | | | | | Ending | | | | | | | | | | |
| | on | | | | | | Net | | | | | | | | | | |
| | Common | | | Based | | | Assets | | | | | | | | | | |
| | Share Net | | | on | | | Applicable | | | | | | Net | | | Portfolio | |
| | Asset | | | Market | | | to Common | | | | | | Investment | | | Turnover | |
| | Value | (b) | | Value | (b) | | Shares (000) | | | Expenses | (d) | | Income (Loss) | | | Rate | (e) |
| | | | | | | | | | | | | | | | | | |
| | | | | | | | | | | | | | | | | | |
| | | (5.90 | )% | | | (11.75 | )% | | $ | 888,718 | | | | 1.85 | % | | | 5.52 | % | | | 19 | % |
| | | 18.89 | | | | 21.59 | | | | 1,000,790 | | | | 1.67 | | | | 5.72 | | | | 10 | |
| | | 4.78 | | | | 3.22 | | | | 892,603 | | | | 1.62 | | | | 6.84 | | | | 10 | |
| | | 12.07 | | | | 18.65 | | | | 916,152 | | | | 1.13 | | | | 6.93 | | | | 14 | |
| | | 21.20 | | | | 24.78 | | | | 869,873 | | | | 1.23 | | | | 7.59 | | | | 6 | |
| | | | | | | | | | | | | | | | | | | | | | | | |
| | | (5.87 | ) | | | (15.21 | ) | | | 613,392 | | | | 1.69 | | | | 5.31 | | | | 17 | |
| | | 17.99 | | | | 20.05 | | | | 688,803 | | | | 1.75 | | | | 5.67 | | | | 18 | |
| | | 5.05 | | | | 1.90 | | | | 626,616 | | | | 2.01 | | | | 6.76 | | | | 14 | |
| | | 12.90 | | | | 19.58 | | | | 642,364 | | | | 1.66 | | | | 7.04 | | | | 16 | |
| | | 23.89 | | | | 25.70 | | | | 608,813 | | | | 1.31 | | | | 8.51 | | | | 9 | |
| (c) | Ratios do not reflect the effect of dividend payments to Auction Rate Preferred shareholders, where applicable; Net Investment Income (Loss) ratios reflect income earned and expenses incurred on assets attributable to Auction Rate Preferred Shares (“ARPS”), VMTP Shares and/or VRDP Shares, where applicable. |
| (d) | The expense ratios reflect, among other things, all interest expense and other costs related to VMTP Shares, VRDP Shares and/or the interest expense deemed to have been paid by the Fund on the floating rate certificates issued by the special purpose trusts for the self-deposited inverse floaters held by the Fund, where applicable, each as described in Note 1 – General Information and Significant Accounting Policies, Variable Rate MuniFund Term Preferred Shares and Variable Rate Demand Preferred Shares and Note 3 – Portfolio Securities and Investments in Derivatives, Inverse Floating Rate Securities, respectively, as follows: |
| Performance Plus (NPP) | | | |
| Year Ended 10/31: | | | |
| 2013 | | | .84 | % |
| 2012 | | | .70 | |
| 2011 | | | .56 | |
| 2010 | | | .04 | |
| 2009 | | | .05 | |
| Municipal Advantage (NMA) | | | |
| Year Ended 10/31: | | | |
| 2013 | | | .71 | % |
| 2012 | | | .76 | |
| 2011 | | | .96 | |
| 2010 | | | .60 | |
| 2009 | | | .09 | |
| (e) | Portfolio Turnover Rate is calculated based on lesser of long-term purchases or sales (as disclosed in Note 5 – Investment Transactions) divided by the average long-term market value during the period. |
| * | Rounds to less than $.01 per share. |
See accompanying notes to financial statements.
Financial Highlights (continued)
Selected data for a common share outstanding throughout each period:
| | | | | | Investment Operations | | | Less Distributions | | | | | | | |
| | | | | | | | | | | | | | | Distributions | | | | | | | | | | | | | | | | | | | |
| | | | | | | | | | | | Distributions | | | from | | | | | | | | | From | | | | | | | | | | |
| | | | | | | | | | | | from Net | | | Accumulated | | | | | | | | | Accumu- | | | | | | | | | | |
| | | | | | | | | | | | Investment | | | Net Realized | | | | | | From Net | | | lated Net | | | | | | Ending | | | | |
| | | Beginning | | | | | | Net | | | Income to | | | Gains to | | | | | | Investment | | | Realized | | | | | | | | | | |
| | | Common | | | Net | | | | | Auction Rate | | | Auction Rate | | | | | | Income to | | | Gains to | | | | | | | | | | |
| | | Share | | | Investment | | | Unrealized | | | Preferred | | | Preferred | | | | | | Common | | | Common | | | | | | Net | | | Ending | |
| | | Net Asset | | | Income | | | Gain | | | Share- | | | Share- | | | | | | Share- | | | Share- | | | | | | Asset | | | Market | |
| | | Value | | | (Loss) | | | (Loss) | | | holders | (a) | | holders | (a) | | Total | | | holders | | | holders | | | Total | | | Value | | | Value | |
| Market Opportunity (NMO) | | | | | | | | | | | | | | | | | | | | | | | | | | | | |
| Year Ended 10/31: | | | | | | | | | | | | | | | | | | | | | | | | | | | | | | | |
| 2013 | | $ | 15.25 | | | $ | .79 | | | $ | (1.52 | ) | | $ | — | | | $ | — | | | $ | (.73 | ) | | $ | (.79 | ) | | $ | — | | | $ | (.79 | ) | | $ | 13.73 | | | $ | 12.19 | |
| 2012 | | | 13.60 | | | | .83 | | | | 1.70 | | | | — | | | | — | | | | 2.53 | | | | (.88 | ) | | | — | | | | (.88 | ) | | | 15.25 | | | | 14.92 | |
| 2011 | | | 14.17 | | | | .88 | | | | (.48 | ) | | | — | * | | | — | | | | .40 | | | | (.97 | ) | | | — | | | | (.97 | ) | | | 13.60 | | | | 13.18 | |
| 2010 | | | 13.59 | | | | .99 | | | | .56 | | | | (.01 | ) | | | — | | | | 1.54 | �� | | | (.96 | ) | | | — | | | | (.96 | ) | | | 14.17 | | | | 14.55 | |
| 2009 | | | 12.23 | | | | 1.10 | | | | 1.13 | | | | (.06 | ) | | | — | | | | 2.17 | | | | (.81 | ) | | | — | | | | (.81 | ) | | | 13.59 | | | | 13.32 | |
| | | | | | | | | | | | | | | | | | | | | | | | | | | | | | | | | | | | | | | | | | | | | |
| Dividend Advantage (NAD) | | | | | | | | | | | | | | | | | | | | | | | | | | | | | | | | | | | | | | | | |
| Year Ended 10/31: | | | | | | | | | | | | | | | | | | | | | | | | | | | | | | | | | | | | | | | | | |
| 2013 | | | 16.05 | | | | .81 | | | | (1.56 | ) | | | — | | | | — | | | | (.75 | ) | | | (.88 | ) | | | — | | | | (.88 | ) | | | 14.42 | | | | 12.92 | |
| 2012 | | | 14.39 | | | | .86 | | | | 1.76 | | | | — | | | | — | | | | 2.62 | | | | (.92 | ) | | | (.04 | ) | | | (.96 | ) | | | 16.05 | | | | 15.76 | |
| 2011 | | | 14.68 | | | | .92 | | | | (.29 | ) | | | (.01 | ) | | | — | | | | .62 | | | | (.91 | ) | | | — | | | | (.91 | ) | | | 14.39 | | | | 13.70 | |
| 2010 | | | 13.89 | | | | 1.00 | | | | .72 | | | | (.02 | ) | | | — | | | | 1.70 | | | | (.91 | ) | | | — | | | | (.91 | ) | | | 14.68 | | | | 14.40 | |
| 2009 | | | 11.77 | | | | 1.07 | | | | 1.93 | | | | (.05 | ) | | | — | | | | 2.95 | | | | (.83 | ) | | | — | | | | (.83 | ) | | | 13.89 | | | | 12.89 | |
| (a) | The amounts shown are based on common share equivalents. |
| (b) | Total Return Based on Market Value is the combination of changes in the market price per share and the effect of reinvested dividend income and reinvested capital gains distributions, if any, at the average price paid per share at the time of reinvestment. The last dividend declared in the period, which is typically paid on the first business day of the following month, is assumed to be reinvested at the ending market price. The actual reinvestment for the last dividend declared in the period may take place over several days, and in some instances may not be based on the market price, so the actual reinvestment price may be different from the price used in the calculation. Total returns are not annualized. |
| | |
| | Total Return Based on Common Share Net Asset Value is the combination of changes in common share net asset value, reinvested dividend income at net asset value and reinvested capital gains distributions at net asset value, if any. The last dividend declared in the period, which is typically paid on the first business day of the following month, is assumed to be reinvested at the ending net asset value. The actual reinvest price for the last dividend declared in the period may often be based on the Fund’s market price (and not its net asset value), and therefore may be different from the price used in the calculation. Total returns are not annualized. |
| | | | | | | | Ratios/Supplemental Data | |
| | | | | | | | | | | Ratios to Average Net Assets | | | Ratios to Average Net Assets | | | | |
| | | | | | | | | | | Applicable to Common Shares | | | Applicable to Common Shares | | | | |
| | Total Returns | | | | | | Before Reimbursement(c) | | | After Reimbursement(c)(d) | | | | |
| | | | | | | | | | | | | | | | | | | | | | | | |
| | Based | | | | | | Ending | | | | | | | | | | | | | | | | |
| | on | | | | | | Net | | | | | | | | | | | | | | | | |
| | Common | | | Based | | | Assets | | | | | | | | | | | | | | | | |
| | Share Net | | | on | | | Applicable | | | | | | Net | | | | | | Net | | | Portfolio | |
| | Asset | | | Market | | | to Common | | | | | | Investment | | | | | | Investment | | | Turnover | |
| | Value | (b) | | Value | (b) | | Shares (000) | | | Expenses | (e) | | Income (Loss) | | | Expenses | (e) | | Income (Loss) | | | Rate | (f) |
| | | | | | | | | | | | | | | | | | | | | | | | |
| | | | | | | | | | | | | | | | | | | | | | | | |
| | | (4.99 | )% | | | (13.41 | )% | | $ | 629,970 | | | | 1.77 | % | | | 5.35 | % | | | N/A | | | | N/A | | | | 20 | % |
| | | 19.09 | | | | 20.34 | | | | 699,360 | | | | 1.85 | | | | 5.64 | | | | N/A | | | | N/A | | | | 13 | |
| | | 3.40 | | | | (2.33 | ) | | | 622,815 | | | | 2.10 | | | | 6.74 | | | | N/A | | | | N/A | | | | 14 | |
| | | 11.71 | | | | 17.03 | | | | 648,017 | | | | 1.70 | | | | 7.17 | | | | N/A | | | | N/A | | | | 26 | |
| | | 18.30 | | | | 23.67 | | | | 619,319 | | | | 1.32 | | | | 8.58 | | | | N/A | | | | N/A | | | | 10 | |
| | | | | | | | | | | | | | | | | | | | | | | | | | | | | | | | |
| | | | | | | | | | | | | | | | | | | | | | | | | | | | | | | | |
| | | (4.87 | ) | | | (12.81 | ) | | | 566,487 | | | | 1.99 | | | | 5.21 | | | | N/A | | | | N/A | | | | 11 | |
| | | 18.67 | | | | 22.59 | | | | 630,515 | | | | 2.04 | | | | 5.55 | | | | N/A | | | | N/A | | | | 12 | |
| | | 4.76 | | | | 1.93 | | | | 565,364 | | | | 2.02 | | | | 6.77 | | | | N/A | | | | N/A | | | | 15 | |
| | | 12.60 | | | | 19.17 | | | | 576,895 | | | | 1.61 | | | | 6.99 | | | | N/A | | | | N/A | | | | 8 | |
| | | 25.78 | | | | 28.86 | | | | 545,534 | | | | 1.26 | | | | 8.38 | | | | 1.21 | % | | | 8.43 | % | | | 9 | |
| (c) | Ratios do not reflect the effect of dividend payments to Auction Rate Preferred shareholders, where applicable; Net Investment Income (Loss) ratios reflect income earned and expenses incurred on assets attributable to ARPS, MTP Shares, VMTP Shares and/or VRDP Shares, where applicable. |
| (d) | After expense reimbursement from the Adviser, where applicable. As of July 31, 2009, the Adviser is no longer reimbursing Dividend Advantage (NAD) for any fees and expenses. |
| (e) | The expense ratios reflect, among other things, all interest expense and other costs related to MTP Shares, VMTP Shares, VRDP Shares and/or the interest expense deemed to have been paid by the Fund on the floating rate certificates issued by the special purpose trusts for the self-deposited inverse floaters held by the Fund, where applicable, each as described in Note 1 – General Information and Significant Accounting Policies, MuniFund Term Preferred Shares, Variable Rate MuniFund Term Preferred Shares and Variable Rate Demand Preferred Shares and Note 3 – Portfolio Securities and Investments in Derivatives, Inverse Floating Rate Securities, respectively, as follows: |
| Market Opportunity (NMO) | | | |
| Year Ended 10/31: | | | |
| 2013 | | | .77 | % |
| 2012 | | | .82 | |
| 2011 | | | .97 | |
| 2010 | | | .58 | |
| 2009 | | | .07 | |
| Dividend Advantage (NAD) | | | |
| Year Ended 10/31: | | | |
| 2013 | | | 1.03 | % |
| 2012 | | | 1.03 | |
| 2011 | | | .94 | |
| 2010 | | | .54 | |
| 2009 | | | .09 | |
| (f) | Portfolio Turnover Rate is calculated based on lesser of long-term purchases or sales (as disclosed in Note 5 – Investment Transactions) divided by the average long-term market value during the period. |
| N/A | Fund did not have, or no longer has, a contractual reimbursement agreement with the Adviser. |
| * | Rounds to less than $.01 per share. |
See accompanying notes to financial statements.
Financial Highlights (continued)
Selected data for a common share outstanding throughout each period:
| | | | | | Investment Operations | | | Less Distributions | | | | | | | |
| | | | | | | | | | | | | | | Distributions | | | | | | | | | | | | | | | | | | | |
| | | | | | | | | | | | Distributions | | | from | | | | | | | | | From | | | | | | | | | | |
| | | | | | | | | | | | from Net | | | Accumulated | | | | | | | | | Accumu- | | | | | | | | | | |
| | | | | | | | | | | | Investment | | | Net Realized | | | | | | From Net | | | lated Net | | | | | | Ending | | | | |
| | | Beginning | | | | | | Net | | | Income to | | | Gains to | | | | | | Investment | | | Realized | | | | | | | | | | |
| | | Common | | | Net | | | | | Auction Rate | | | Auction Rate | | | | | | Income to | | | Gains to | | | | | | Share | | | | |
| | | Share | | | Investment | | | Unrealized | | | Preferred | | | Preferred | | | | | | Common | | | Common | | | | | | Net | | | Ending | |
| | | Net Asset | | | Income | | | Gain | | | Share- | | | Share- | | | | | | Share- | | | Share- | | | | | | Asset | | | Market | |
| | | Value | | | (Loss) | | | (Loss) | | | holders(a) | | | holders(a) | | | Total | | | holders | | | holders | | | Total | | | Value | | | Value | |
| Dividend Advantage 2 (NXZ) | | | | | | | | | | | | | | | | | | | | | | | | | | | | |
| Year Ended 10/31: | | | | | | | | | | | | | | | | | | | | | | | | | | | | | | | |
| 2013 | | $ | 16.09 | | | $ | .87 | | | $ | (1.58 | ) | | $ | — | | | $ | — | | | $ | (.71 | ) | | $ | (.81 | ) | | $ | — | | | $ | (.81 | ) | | $ | 14.57 | | | $ | 12.99 | |
| 2012 | | | 14.50 | | | | .88 | | | | 1.84 | | | | — | | | | — | | | | 2.72 | | | | (.95 | ) | | | (.18 | ) | | | (1.13 | ) | | | 16.09 | | | | 15.63 | |
| 2011 | | | 14.76 | | | | .99 | | | | (.29 | ) | | | — | | | | — | | | | .70 | | | | (.96 | ) | | | — | | | | (.96 | ) | | | 14.50 | | | | 13.90 | |
| 2010 | | | 14.45 | | | | 1.02 | | | | .26 | | | | — | | | | — | | | | 1.28 | | | | (.97 | ) | | | — | | | | (.97 | ) | | | 14.76 | | | | 14.67 | |
| 2009 | | | 12.71 | | | | 1.04 | | | | 1.59 | | | | — | | | | — | | | | 2.63 | | | | (.89 | ) | | | — | | | | (.89 | ) | | | 14.45 | | | | 14.14 | |
| | | | | | | | | | | | | | | | | | | | | | | | | | | | | | | | | | | | | | | | | | |
| Dividend Advantage 3 (NZF) | | | | | | | | | | | | | | | | | | | | | | | | | | | | | | | | | | | | | |
| Year Ended 10/31: | | | | | | | | | | | | | | | | | | | | | | | | | | | | | | | | | | | | | | | | | |
| 2013 | | | 15.99 | | | | .71 | | | | (1.63 | ) | | | — | | | | — | | | | (.92 | ) | | | (.75 | ) | | | — | | | | (.75 | ) | | | 14.32 | | | | 12.66 | |
| 2012 | | | 14.53 | | | | .78 | | | | 1.67 | | | | — | | | | — | | | | 2.45 | | | | (.95 | ) | | | (.04 | ) | | | (.99 | ) | | | 15.99 | | | | 15.73 | |
| 2011 | | | 14.74 | | | | .98 | | | | (.18 | ) | | | (.01 | ) | | | — | * | | | .79 | | | | (.98 | ) | | | (.02 | ) | | | (1.00 | ) | | | 14.53 | | | | 14.17 | |
| 2010 | | | 14.19 | | | | 1.06 | | | | .52 | | | | (.02 | ) | | | — | * | | | 1.56 | | | | (.95 | ) | | | (.06 | ) | | | (1.01 | ) | | | 14.74 | | | | 14.58 | |
| 2009 | | | 12.10 | | | | 1.08 | | | | 1.91 | | | | (.05 | ) | | | — | | | | 2.94 | | | | (.85 | ) | | | — | | | | (.85 | ) | | | 14.19 | | | | 13.38 | |
| (a) | The amounts shown are based on common share equivalents. |
| (b) | Total Return Based on Market Value is the combination of changes in the market price per share and the effect of reinvested dividend income and reinvested capital gains distributions, if any, at the average price paid per share at the time of reinvestment. The last dividend declared in the period, which is typically paid on the first business day of the following month, is assumed to be reinvested at the ending market price. The actual reinvestment for the last dividend declared in the period may take place over several days, and in some instances may not be based on the market price, so the actual reinvestment price may be different from the price used in the calculation. Total returns are not annualized. |
| | |
| | Total Return Based on Common Share Net Asset Value is the combination of changes in common share net asset value, reinvested dividend income at net asset value and reinvested capital gains distributions at net asset value, if any. The last dividend declared in the period, which is typically paid on the first business day of the following month, is assumed to be reinvested at the ending net asset value. The actual reinvest price for the last dividend declared in the period may often be based on the Fund’s market price (and not its net asset value), and therefore may be different from the price used in the calculation. Total returns are not annualized. |
| | | | | | | | Ratios/Supplemental Data |
| | | | | | | | | | | Ratios to Average Net Assets | | | Ratios to Average Net Assets | | | | |
| | | | | | | | | | | Applicable to Common Shares | | | Applicable to Common Shares | | | | |
| | Total Returns | | | | | | Before Reimbursement(c) | | | After Reimbursement(c)(d) | | | | |
| | | | | | | | | | | | | | | | | | | | | | | | |
| | Based | | | | | | Ending | | | | | | | | | | | | | | | | |
| | on | | | | | | Net | | | | | | | | | | | | | | | | |
| | Common | | | Based | | | Assets | | | | | | | | | | | | | | | | |
| | Share Net | | | on | | | Applicable | | | | | | Net | | | | | | Net | | | Portfolio | |
| | Asset | | | Market | | | to Common | | | | | | Investment | | | | | | Investment | | | Turnover | |
| | Value | (b) | | Value | (b) | | Shares (000) | | | Expenses | (e) | | Income (Loss) | | | Expenses | (e) | | Income (Loss) | | | Rate | (f) |
| | | | | | | | | | | | | | | | | | | | | | | | |
| | | | | | | | | | | | | | | | | | | | | | | | |
| | | (4.58 | )% | | | (12.04 | )% | | $ | 429,385 | | | | 1.53 | % | | | 5.58 | % | | | N/A | | | | N/A | | | | 22 | % |
| | | 19.46 | | | | 21.15 | | | | 474,432 | | | | 1.64 | | | | 5.70 | | | | N/A | | | | N/A | | | | 15 | |
| | | 5.24 | | | | 1.70 | | | | 427,085 | | | | 1.78 | | | | 7.08 | | | | 1.75 | % | | | 7.11 | % | | | 40 | |
| | | 9.12 | | | | 10.89 | | | | 434,764 | | | | 1.79 | | | | 6.85 | | | | 1.68 | | | | 6.95 | | | | 5 | |
| | | 21.41 | | | | 22.63 | | | | 425,253 | | | | 1.91 | | | | 7.59 | | | | 1.73 | | | | 7.77 | | | | 2 | |
| | | | | | | | | | | | | | | | | | | | | | | | | | | | | | | | |
| | | | | | | | | | | | | | | | | | | | | | | | | | | | | | | | |
| | | (5.93 | ) | | | (15.08 | ) | | | 578,508 | | | | 1.71 | | | | 4.66 | | | | N/A | | | | N/A | | | | 14 | |
| | | 17.33 | | | | 18.48 | | | | 645,993 | | | | 1.76 | | | | 5.06 | | | | N/A | | | | N/A | | | | 22 | |
| | | 5.83 | | | | 4.59 | | | | 587,047 | | | | 1.53 | | | | 6.93 | | | | 1.46 | | | | 7.00 | | | | 30 | |
| | | 11.41 | | | | 17.04 | | | | 595,413 | | | | 1.17 | | | | 7.21 | | | | 1.02 | | | | 7.36 | | | | 7 | |
| | | 25.08 | | | | 33.89 | | | | 573,088 | | | | 1.26 | | | | 7.98 | | | | 1.04 | | | | 8.20 | | | | 2 | |
| (c) | Ratios do not reflect the effect of dividend payments to Auction Rate Preferred shareholders, where applicable; Net Investment Income (Loss) ratios reflect income earned and expenses incurred on assets attributable to ARPS, MTP Shares, VMTP Shares and/or VRDP Shares, where applicable. |
| (d) | After expense reimbursement from the Adviser, where applicable. As of March 31, 2011, the Adviser is no longer reimbursing Dividend Advantage 2 (NXZ) for any fees and expenses. As of September 30, 2011, the Adviser is no longer reimbursing Dividend Advantage 3 (NZF) for any fees and expenses. |
| (e) | The expense ratios reflect, among other things, all interest expense and other costs related to MTP Shares, VMTP Shares, VRDP Shares and/or the interest expense deemed to have been paid by the Fund on the floating rate certificates issued by the special purpose trusts for the self-deposited inverse floaters held by the Fund, where applicable, each as described in Note 1 – General Information and Significant Accounting Policies, MuniFund Term Preferred Shares, Variable Rate MuniFund Term Preferred Shares and Variable Rate Demand Preferred Shares and Note 3 – Portfolio Securities and Investments in Derivatives, Inverse Floating Rate Securities, respectively, as follows: |
| Dividend Advantage 2 (NXZ) | | | |
| Year Ended 10/31: | | | |
| 2013 | | | .62 | % |
| 2012 | | | .65 | |
| 2011 | | | .78 | |
| 2010 | | | .78 | |
| 2009 | | | .83 | |
| Dividend Advantage 3 (NZF) | | | |
| Year Ended 10/31: | | | |
| 2013 | | | .75 | % |
| 2012 | | | .77 | |
| 2011 | | | .48 | |
| 2010 | | | .09 | |
| 2009 | | | .11 | |
| (f) | Portfolio Turnover Rate is calculated based on lesser of long-term purchases or sales (as disclosed in Note 5 – Investment Transactions) divided by the average long-term market value during the period. |
| N/A | Fund no longer has a contractual reimbursement agreement with the Adviser. |
| * | Rounds to less than $.01 per share. |
See accompanying notes to financial statements.
Financial Highlights (continued)
| | | ARPS at | | | VMTP Shares | | | VRDP Shares | |
| | | the End of Period | | | at the End of Period | | | at the End of Period | |
| | | Aggregate | | | Asset | | | Aggregate | | | Asset | | | Aggregate | | | Asset | |
| | | Amount | | | Coverage | | | Amount | | | Coverage | | | Amount | | | Coverage | |
| | | Outstanding | | | Per $25,000 | | | Outstanding | | | Per $100,000 | | | Outstanding | | | Per $100,000 | |
| | | | (000 | ) | | Share | | | | (000 | ) | | Share | | | | (000 | ) | | Share | |
| Performance Plus (NPP) | | | | | | | | | | | | | | | | | | | | | |
| Year Ended 10/31: | | | | | | | | | | | | | | | | | | | | | |
| 2013 | | $ | — | | | $ | — | | | $ | 535,000 | | | $ | 266,116 | | | $ | — | | | $ | — | |
| 2012 | | | — | | | | — | | | | 421,700 | | | | 337,323 | | | | — | | | | — | |
| 2011 | | | — | | | | — | | | | 421,700 | | | | 311,668 | | | | — | | | | — | |
| 2010 | | | 419,900 | | | | 79,546 | | | | — | | | | — | | | | — | | | | — | |
| 2009 | | | 419,900 | | | | 76,790 | | | | — | | | | — | | | | — | | | | — | |
| | | | | | | | | | | | | | | | | | | | | | | | | |
| Municipal Advantage (NMA) | | | | | | | | | | | | | | | | | | | | | | | | |
| Year Ended 10/31: | | | | | | | | | | | | | | | | | | | | | | | | |
| 2013 | | | — | | | | — | | | | — | | | | — | | | | 296,800 | | | | 306,668 | |
| 2012 | | | — | | | | — | | | | — | | | | — | | | | 296,800 | | | | 332,076 | |
| 2011 | | | — | | | | — | | | | — | | | | — | | | | 296,800 | | | | 311,124 | |
| 2010 | | | — | | | | — | | | | — | | | | — | | | | 296,800 | | | | 316,430 | |
| 2009 | | | 293,200 | | | | 76,911 | | | | — | | | | — | | | | — | | | | — | |
See accompanying notes to financial statements.
| | | | | | | | | | | | | | | | | | | | | | | | | | | ARPS, MTP | |
| | | | | | | | | | | | | | | | | | | | | | | | | | | and/or | |
| | | | | | | | | | | | | | | | | | | | | | | | | | | VMTP Shares | |
| | | ARPS | | | MTP Shares | | | VMTP Shares | | | VRDP Shares | | | at the End | |
| | | at the End of Period | | | at the End of Period (a) | | | at the End of Period | | | at the End of Period | | | of Period | |
| | | | | | | | | | | | | | | | | | | | | | | | | | | Asset | |
| | | Aggregate | | | Asset | | | Aggregate | | | Asset | | | Aggregate | | | Asset | | | Aggregate | | | Asset | | | Coverage | |
| | | Amount | | | Coverage | | | Amount | | | Coverage | | | Amount | | | Coverage | | | Amount | | | Coverage | | | Per $1 | |
| | | Outstanding | | | Per $25,000 | | | Outstanding | | | Per $10 | | | Outstanding | | | Per $100,000 | | | Outstanding | | | Per $100,000 | | | Liquidation | |
| | | | (000 | ) | | Share | | | | (000 | ) | | Share | | | | (000 | ) | | Share | | | | (000 | ) | | Share | | | Preference | |
| Market Opportunity (NMO) | | | | | | | | | | | | | | | | | | | | | | | | | |
| Year Ended 10/31: | | | | | | | | | | | | | | | | | | | | | | | | | | | | |
| 2013 | | $ | — | | | $ | — | | | $ | — | | | $ | — | | | $ | — | | | $ | — | | | $ | 350,900 | | | $ | 279,530 | | | $ | — | |
| 2012 | | | — | | | | — | | | | — | | | | — | | | | — | | | | — | | | | 350,900 | | | | 299,305 | | | | — | |
| 2011 | | | — | | | | — | | | | — | | | | — | | | | — | | | | — | | | | 350,900 | | | | 277,491 | | | | — | |
| 2010 | | | — | | | | — | | | | — | | | | — | | | | — | | | | — | | | | 350,900 | | | | 284,673 | | | | — | |
| 2009 | | | 346,675 | | | | 69,661 | | | | — | | | | — | | | | — | | | | — | | | | — | | | | — | | | | — | |
| | | | | | | | | | | | | | | | | | | | | | | | | | | | | | | | | | | | | |
| Dividend Advantage (NAD) | | | | | | | | | | | | | | | | | | | | | | | | | | | | | | | |
| Year Ended 10/31: | | | | | | | | | | | | | | | | | | | | | | | | | | | | | | | | | |
| 2013 | | | — | | | | — | | | | 144,300 | | | | 31.40 | | | | 120,400 | | | | 314,011 | | | | — | | | | — | | | | 3.14 | |
| 2012 | | | — | | | | — | | | | 144,300 | | | | 33.82 | | | | 120,400 | | | | 338,200 | | | | — | | | | — | | | | 3.38 | |
| 2011 | | | — | | | | — | | | | 144,300 | | | | 31.36 | | | | 120,400 | | | | 313,587 | | | | — | | | | — | | | | 3.14 | |
| 2010 | | | 120,075 | | | | 79,553 | | | | 144,300 | | | | 31.82 | | | | — | | | | — | | | | — | | | | — | | | | 3.18 | |
| 2009 | | | 261,800 | | | | 77,095 | | | | — | | | | — | | | | — | | | | — | | | | — | | | | — | | | | — | |
| (a) | The Ending and Average Market Value Per Share for each Series of the Fund’s MTP Shares were as follows: |
| | | 2013 | | | 2012 | | | 2011 | | | 2010 | |
| Dividend Advantage (NAD) | | | | | | | | | | | | |
| Series 2015 (NAD PRC) | | | | | | | | | | | | |
| Ending Market Value per Share | | $ | 10.06 | | | $ | 10.10 | | | $ | 10.06 | | | $ | 10.10 | |
| Average Market Value per Share | | | 10.08 | | | | 10.09 | | | | 10.05 | | | 10.10 | ^ |
| ^ | For the period March 16, 2010 (first issuance date of shares) through October 31, 2010. |
See accompanying notes to financial statements.
Financial Highlights (continued)
| | | | | | | | | | | | | | | | | | | | | | | | | | | MTP and/or | |
| | | | | | | | | | | | | | | | | | | | | | | | | | | VMTP Shares | |
| | | ARPS | | | MTP Shares | | | VMTP Shares | | | VRDP Shares | | | at the End | |
| | | at the End of Period | | | at the End of Period (a) | | | at the End of Period | | | at the End of Period | | | of Period | |
| | | | | | | | | | | | | | | | | | | | | | | | | | | Asset | |
| | | Aggregate | | | Asset | | | Aggregate | | | Asset | | | Aggregate | | | Asset | | | Aggregate | | | Asset | | | Coverage | |
| | | Amount | | | Coverage | | | Amount | | | Coverage | | | Amount | | | Coverage | | | Amount | | | Coverage | | | Per $1 | |
| | | Outstanding | | | Per $25,000 | | | Outstanding | | | Per $10 | | | Outstanding | | | Per $100,000 | | | Outstanding | | | Per $100,000 | | | Liquidation | |
| | | | (000 | ) | | Share | | | | (000 | ) | | Share | | | | (000 | ) | | Share | | | | (000 | ) | | Share | | | Preference | |
| Dividend Advantage 2 (NXZ) | | | | | | | | | | | | | | | | | | | | | | | | | | | | |
| Year Ended 10/31: | | | | | | | | | | | | | | | | | | | | | | | | | | | | |
| 2013 | | $ | — | | | $ | — | | | $ | — | | | $ | — | | | $ | — | | | $ | — | | | $ | 196,000 | | | $ | 319,074 | | | $ | — | |
| 2012 | | | — | | | | — | | | | — | | | | — | | | | — | | | | — | | | | 196,000 | | | | 342,057 | | | | — | |
| 2011 | | | — | | | | — | | | | — | | | | — | | | | — | | | | — | | | | 196,000 | | | | 317,900 | | | | — | |
| 2010 | | | — | | | | — | | | | — | | | | — | | | | — | | | | — | | | | 196,000 | | | | 321,819 | | | | — | |
| 2009 | | | — | | | | — | | | | — | | | | — | | | | — | | | | — | | | | 196,000 | | | | 316,966 | | | | — | |
| | | | | | | | | | | | | | | | | | | | | | | | | | | | | | | | | | | | | |
| Dividend Advantage 3 (NZF) | | | | | | | | | | | | | | | | | | | | | | | | | | | | | | | | | |
| Year Ended 10/31: | | | | | | | | | | | | | | | | | | | | | | | | | | | | | | | | | |
| 2013 | | | — | | | | — | | | | 70,000 | | | | 34.19 | | | | 169,200 | | | | 341,851 | | | | — | | | | — | | | | 3.42 | |
| 2012 | | | — | | | | — | | | | 70,000 | | | | 37.01 | | | | 169,200 | | | | 370,064 | | | | — | | | | — | | | | 3.70 | |
| 2011 | | | — | | | | — | | | | 70,000 | | | | 34.54 | | | | 169,200 | | | | 345,421 | | | | — | | | | — | | | | 3.45 | |
| 2010 | | | 236,950 | | | | 87,821 | | | | — | | | | — | | | | — | | | | — | | | | — | | | | — | | | | — | |
| 2009 | | | 236,950 | | | | 85,465 | | | | — | | | | — | | | | — | | | | — | | | | — | | | | — | | | | — | |
| (a) | The Ending and Average Market Value Per Share for each Series of the Fund’s MTP Shares were as follows: |
| | | 2013 | | | 2012 | | | 2011 | |
| Dividend Advantage 3 (NZF) | | | | | | | | | |
| Series 2016 (NZF PRC) | | | | | | | | | |
| Ending Market Value per Share | | $ | 10.10 | | | $ | 10.14 | | | $ | 10.14 | |
| Average Market Value per Share | | | 10.10 | | | | 10.12 | | | 10.05 | ^ |
| ^ | For the period December 20, 2010 (first issuance date of shares) through October 31, 2011. |
| Notes to |
| | Financial Statements |
1. General Information and Significant Accounting Policies
General Information
Fund Information
The funds covered in this report and their corresponding New York Stock Exchange (“NYSE”) or NYSE MKT symbols are as follows (each a “Fund” and collectively, the “Funds”):
| | | |
| | • | Nuveen Performance Plus Municipal Fund, Inc. (NPP) (“Performance Plus (NPP)”) |
| | • | Nuveen Municipal Advantage Fund, Inc. (NMA) (“Municipal Advantage (NMA)”) |
| | • | Nuveen Municipal Market Opportunity Funds, Inc. (NMO) (“Market Opportunity (NMO)”) |
| | • | Nuveen Dividend Advantage Municipal Fund (NAD) (“Dividend Advantage (NAD)”) |
| | • | Nuveen Dividend Advantage Municipal Fund 2 (NXZ) (“Dividend Advantage 2 (NXZ)”) |
| | • | Nuveen Dividend Advantage Municipal Fund 3 (NZF) (“Dividend Advantage 3 (NZF)”) |
The Funds are registered under the Investment Company Act of 1940, as amended, as diversified closed-end registered investment companies. Performance Plus (NPP), Municipal Advantage (NMA), Market Opportunity (NMD) and Dividend Advantage (NAD) are traded on the NYSE while Dividend Advantage 2 (NXZ) and Dividend Advantage 3 (NZF) are traded on the NYSE MKT. Performance Plus (NPP), Municipal Advantage (NMA) and Market Opportunity (NMO) were organized as Minnesota corporations on April 28, 1989, November 6, 1989 and January 23, 1990, respectively. Dividend Advantage (NAD), Dividend Advantage 2 (NXZ) and Dividend Advantage 3 (NZF) were organized as Massachusetts business trusts on January 15, 1999, June 1, 1999 and March 21, 2001, respectively.
Each Fund seeks to provide current income exempt from regular federal income tax by investing primarily in a portfolio of municipal obligations issued by state and local government authorities or certain U.S. territories.
Investment Adviser
On December 31, 2012, the Funds’ investment adviser converted from a Delaware corporation to a Delaware limited liability company. As a result, Nuveen Fund Advisors, Inc., a wholly-owned subsidiary of Nuveen Investments, Inc. (“Nuveen”), changed its name to Nuveen Fund Advisors, LLC (the “Adviser”). There were no changes to the identities or roles of any personnel as a result of the change.
The Adviser is responsible for each Fund’s overall investment strategy and asset allocation decisions. The Adviser has entered into sub-advisory agreements with Nuveen Asset Management, LLC (the “Sub-Adviser”), a subsidiary of the Adviser, under which the Sub-Adviser manages the investment portfolios of the Funds.
Significant Accounting Policies
The following is a summary of significant accounting policies followed by the Funds in the preparation of their financial statements in accordance with U.S. generally accepted accounting principles (“U.S. GAAP”).
Investment Transactions
Investment transactions are recorded on a trade date basis. Realized gains and losses from investment transactions are determined on the specific identification method, which is the same basis used for federal income tax purposes. Investments purchased on a when-issued/delayed delivery basis may have extended settlement periods. Any investments so purchased are subject to market fluctuation during this period. The Funds have instructed the custodian to earmark securities in the Funds’ portfolios with a current value at least equal to the amount of the when-issued/delayed delivery purchase commitments. As of October 31, 2013, outstanding when-issued/delayed delivery purchase commitments were as follow:
| | | Performance | | | Municipal | | | Market | | | Dividend | | | Dividend | | | Dividend | |
| | | | Plus | | | Advantage | | Opportunity | | | Advantage | | Advantage 2 | | Advantage 3 | |
| | | | (NPP | ) | | (NMA | ) | | (NMO | ) | | (NAD | ) | | (NXZ | ) | | (NZF | ) |
| Outstanding when-issued/delayed delivery purchase commitments | | $ | 2,192,449 | | $ | 4,736,747 | | $ | 2,061,484 | | $ | 4,736,747 | | $ | 4,305,694 | | $ | 3,554,667 | |
Notes to Financial Statements (continued)
Investment Income
Dividend income is recorded on the ex-dividend date. Investment income, which reflects the amortization of premiums and includes accretion of discounts for financial reporting purposes, is recorded on an accrual basis. Investment income also reflects paydown gains and losses, if any.
Professional Fees
Professional fees presented on the Statement of Operations consist of legal fees incurred in the normal course of operations, audit fees, tax consulting fees and, in some cases, workout expenditures. Workout expenditures are incurred in an attempt to protect or enhance an investment, or to pursue other claims or legal actions on behalf of Fund shareholders. Should a Fund receive a refund of workout expenditures paid in a prior reporting period, such amounts will be recognized as “Legal fee refund” on the Statements of Operations.
Dividends and Distributions to Common Shareholders
Dividends from net investment income are declared monthly. Net realized capital gains and/or market discount from investment transactions, if any, are distributed to shareholders at least annually. Furthermore, capital gains are distributed only to the extent they exceed available capital loss carryforwards.
Distributions to common shareholders of net investment income, net realized capital gains and/or market discount, if any, are recorded on the ex-dividend date. The amount and timing of distributions are determined in accordance with federal income tax regulations, which may differ from U.S. GAAP.
Auction Rate Preferred Shares
Each Fund is authorized to issue Auction Rate Preferred Shares (“ARPS”). During prior fiscal periods, the Funds redeemed all of their outstanding ARPS at liquidation value.
MuniFund Term Preferred Shares
The following Funds have issued and outstanding MuniFund Term Preferred (“MTP”) Shares, with a $10 stated par value per share. Each Fund’s MTP Shares are issued in one Series and trade on NYSE MKT. Dividends on MTP shares, which are recognized as interest expense for financial reporting purposes, are paid monthly at a fixed annual rate, subject to adjustments in certain circumstances.
As of October 31, 2013, the details of each Fund’s MTP Shares outstanding are as follows:
| | | | | | | | | | | | | Shares | | | | |
| | | | | | | | | | | | | Outstanding | | | | |
| | | | | | | NYSE MKT | | | Shares | | | at $10 Per Share | | | Annual | |
| | | | Series | | | Ticker | | | Outstanding | | | Liquidation Value | | | Interest Rate | |
| Dividend Advantage (NAD) | | | 2015 | | | NAD PRC | | | 14,430,000 | | $ | 144,300,000 | | | 2.70 | % |
| Dividend Advantage 3 (NZF) | | | 2016 | | | NZF PRC | | | 7,000,000 | | $ | 70,000,000 | | | 2.80 | % |
Each Fund is obligated to redeem its MTP Shares by the date as specified in its offering document (“Term Redemption Date”), unless earlier redeemed or repurchased by the Fund. MTP Shares are subject to optional and mandatory redemption in certain circumstances. MTP Shares were subject to redemption at the option of each Fund (“Optional Redemption Date”), subject to a payment of premium for one year following the Optional Redemption Date (“Premium Expiration Date”), and at par thereafter. MTP Shares also will be subject to redemption, at the option of each Fund, at par in the event of certain changes in the credit rating of the MTP Shares. Each Fund may be obligated to redeem certain of the MTP Shares if the Fund fails to maintain certain asset coverage and leverage ratio requirements and such failures are not cured by the applicable cure date. The redemption price per share is equal to the sum of the liquidation value per share plus any accumulated but unpaid dividends. The Term Redemption Date, Optional Redemption Date and Premium Expiration Date for each Fund’s series of MTP Shares by NYSE MKT ticker symbol are as follows:
| | | | | | | NYSE MKT | | | Term | | | Optional | | | Premium | |
| | | | Series | | | Ticker | | | Redemption Date | | | Redemption Date | | | Expiration Date | |
| Dividend Advantage (NAD) | | | 2015 | | | NAD PRC | | | April 1, 2015 | | | April 1, 2011 | | | March 31, 2012 | |
| Dividend Advantage 3 (NZF) | | | 2016 | | | NZF PRC | | | January 1, 2016 | | | January 1, 2012 | | | December 31, 2012 | |
The average liquidation value of MTP Shares outstanding for each Fund during the fiscal year ended October 31, 2013, was as follows:
| | | | Dividend | | | Dividend | |
| | | | Advantage | | Advantage 3 | |
| | | | (NAD | ) | | (NZF | ) |
| Average liquidation value of MTP Shares outstanding | | $ | 144,300,000 | | $ | 70,000,000 | |
For financial reporting purposes only, the liquidation value of MTP Shares is recorded as a liability and recognized as “MuniFund Term Preferred (MTP) Shares, at liquidation value” on the Statement of Assets and Liabilities. Unpaid dividends on MTP Shares are recognized as a component of “Interest payable” on the Statement of Assets and Liabilities. Dividends paid on MTP Shares are recognized as a component of “Interest expense and amortization of offering costs” on the Statement of Operations. Costs incurred by the Funds in connection with their offerings of MTP Shares were recorded as a deferred charge, which are amortized over the life of the shares and are recognized as components of “Deferred offering costs” on the Statement of Assets and Liabilities and “Interest expense and amortization of offering costs” on the Statement of Operations.
Variable Rate MuniFund Term Preferred Shares
The following Funds have issued and outstanding Variable Rate MuniFund Term Preferred (“VMTP”) Shares, with a $100,000 liquidation value per share. The Funds issued their VMTP Shares in privately negotiated offerings, which were offered to qualified institutional buyers pursuant to Rule 144A under the Securities Act of 1933.
During the current fiscal period, Performance Plus (NPP) exchanged all 4,217 shares of its outstanding Series 2014 VMTP for 4,217 shares of Series 2015 VMTP. Concurrent with the exchange, Performance Plus (NPP) issued an additional 1,133 shares of Series 2015 VMTP through a privately negotiated offering, which was offered to qualified institutional buyers pursuant to Rule 144A under the Securities Act of 1933. The Fund completed the exchange offer in which it refinanced its existing VMTP Shares with new VMTP Shares with a term redemption date of December 1, 2015.
As of October 31, 2013, VMTP Shares outstanding, at liquidation value, for each Fund are as follows:
| | | | | | | | | | Shares | |
| | | | | | | | | | Outstanding | |
| | | | | | | Shares | | | at $100,000 Per Share | |
| | | | Series | | | Outstanding | | | Liquidation Value | |
| Performance Plus (NPP) | | | 2015 | | | 5,350 | | $ | 535,000,000 | |
| Dividend Advantage (NAD) | | | 2014 | | | 1,204 | | $ | 120,400,000 | |
| Dividend Advantage 3 (NZF) | | | 2014 | | | 1,692 | | $ | 169,200,000 | |
Each Fund is obligated to redeem its VMTP Shares by the date as specified in its offering document (“Term Redemption Date”), unless earlier redeemed or repurchased by the Fund. VMTP Shares are subject to optional and mandatory redemption in certain circumstances. The VMTP Shares are subject to redemption at the option of each Fund (“Optional Redemption Date”), subject to payment of premium for approximately one year following the date of issuance (“Premium Expiration Date”), and at par thereafter. Each Fund may be obligated to redeem certain of the VMTP Shares if the Fund fails to maintain certain asset coverage and leverage ratio requirements and such failures are not cured by the applicable cure date. The redemption price per share is equal to the sum of the liquidation value per share plus any accumulated but unpaid dividends. The Term Redemption Date, Optional Redemption Date and Premium Expiration Date for each Fund’s series of VMTP Shares are as follows:
| | | | | | | Term | | | Optional | | | Premium | |
| | | | Series | | | Redemption Date | | | Redemption Date | | | Expiration Date | |
| Performance Plus (NPP) | | | 2015 | | | December 1, 2015 | | | December 1, 2013 | | | November 30, 2013 | |
| Dividend Advantage (NAD) | | | 2014 | | | August 1, 2014 | | | August 1, 2012 | | | July 31, 2012 | |
| Dividend Advantage 3 (NZF) | | | 2014 | | | October 1, 2014 | | | October 1, 2012 | | | September 30, 2012 | |
The average liquidation value of VMTP Shares outstanding and annualized dividend rate for each Fund during the fiscal year ended October 31, 2013, were as follows:
| | | | Performance | | | Dividend | | | Dividend | |
| | | | Plus | | | Advantage | | | Advantage 3 | |
| | | | (NPP | ) | | (NAD | ) | | (NZF | ) |
| Average liquidation value of VMTP Shares outstanding | | $ | 535,000,000 | | $ | 120,400,000 | | $ | 169,200,000 | |
| Annualized dividend rate | | | 1.26% | | | 1.16% | | | 1.11% | |
VMTP Shares generally do not trade, and market quotations are generally not available. VMTP Shares are short-term or short/intermediate-term instruments that pay a variable dividend rate tied to a short-term index, plus an additional fixed “spread” amount established at the time of issuance. The fair value of VMTP Shares is expected to be approximately their liquidation (“par”) value so long as the fixed “spread” on the VMTP Shares remains roughly in line with the “spread” rates being demanded by investors on instruments having similar terms in the current market environment. In present market conditions, the Funds’ Adviser has determined that the fair value of VMTP Shares is their liquidation value, but their fair value could vary if market conditions change materially. For financial reporting purposes only, the liquidation value of VMTP Shares is recorded as a liability and recognized as “Variable Rate MuniFund Term Preferred (VMTP) Shares, at liquidation value” on the Statement of Assets and Liabilities.
Notes to Financial Statements (continued)
Dividends on the VMTP Shares (which are treated as interest payments for financial reporting purposes) are set weekly. Unpaid dividends on VMTP Shares are recognized as a component of “Interest payable” on the Statement of Assets and Liabilities. Dividends paid on VMTP Shares are recognized as a component of “Interest expense and amortization of offering costs” on the Statement of Operations.
Costs incurred by the Fund in connection with its offering of VMTP Shares were recorded as a deferred charge, which are amortized over the life of the shares and are recognized as components of “Deferred offering costs” on the Statement of Assets and Liabilities and “Interest expense and amortization of offering costs” on the Statement of Operations.
In conjunction with Performance Plus’s (NPP) exchange of VMTP Shares, the remaining deferred offering costs of $1,142,851 for the Fund’s issuance of Series 2014 VMTP Shares were fully expensed during the current fiscal period, as the exchange was deemed an extinguishment of debt. Offering costs of $175,000 were incurred with the Fund’s issuance of Series 2015 VMTP Shares, which were recorded as a deferred charge and are being amortized over the life of the shares.
Variable Rate Demand Preferred Shares
The following Funds have issued and outstanding Variable Rate Demand Preferred (“VRDP”) Shares, with a $100,000 liquidation value per share. The Funds issued their VRDP Shares in privately negotiated offerings, which were offered to qualified institutional buyers pursuant to Rule 144A under the Securities Act of 1933.
As of October 31, 2013, the details for each Fund’s series VRDP Shares outstanding are as follows:
| | | | | | | | | | | | | | |
| | | | | | | | | | Shares | | | | |
| | | | | | | | | | Outstanding | | | | |
| | | | | | | Shares | | | at $100,000 Per Share | | | | |
| | | | Series | | | Outstanding | | | Liquidation Value | | | Maturity | |
| Municipal Advantage (NMA) | | | 1 | | | 2,968 | | $ | 296,800,000 | | | March 1, 2040 | |
| Market Opportunity (NMO) | | | 1 | | | 3,509 | | $ | 350,900,000 | | | March 1, 2040 | |
| Dividend Advantage 2 (NXZ) | | | 2 | | | 1,960 | | $ | 196,000,000 | | | August 1, 2040 | |
VRDP Shares include a liquidity feature that allows VRDP shareholders to have their shares purchased by a liquidity provider with whom each Fund has contracted in the event that purchase orders for VRDP Shares in a remarketing are not sufficient in number to be matched with the sale orders in that remarketing. Each Fund is required to redeem any VRDP Shares that are still owned by the liquidity provider after six months of continuous, unsuccessful remarketing. Each Fund pays an annual remarketing fee of .10% on the aggregate principal amount of all VRDP Shares outstanding. Each Fund’s VRDP Shares have successfully remarketed since issuance.
Dividends on the VRDP Shares (which are treated as interest payments for financial reporting purposes) are set weekly at a rate established by a remarketing agent; therefore, the market value of the VRDP Shares is expected to approximate its liquidation value. If remarketings for VRDP Shares are continuously unsuccessful for six months, the maximum rate is designed to escalate according to a specified schedule in order to enhance the remarketing agent’s ability to successfully remarket the VRDP Shares.
Subject to certain conditions, VRDP Shares may be redeemed, in whole or in part, at any time at the option of each Fund. Each Fund may also redeem certain of the VRDP Shares if the Fund fails to maintain certain asset coverage requirements and such failures are not cured by the applicable cure date. The redemption price per share is equal to the sum of the liquidation value per share plus any accumulated but unpaid dividends.
The average liquidation value of VRDP Shares outstanding and annualized dividend rate for each Fund during the fiscal year ended October 31, 2013, were as follows:
| | | | Municipal | | | Market | | | Dividend | |
| | | | Advantage | | | Opportunity | | | Advantage 2 | |
| | | | (NMA | ) | | (NMO | ) | | (NXZ | ) |
| Average liquidation value of VRDP Shares outstanding | | $ | 296,800,000 | | $ | 350,900,000 | | $ | 196,000,000 | |
| Annualized dividend rate | | | 0.18% | | | 0.25% | | | 0.22% | |
For financial reporting purposes only, the liquidation value of VRDP Shares is a liability and recognized as “Variable Rate Demand Preferred (VRDP) Shares, at liquidation value” on the Statement of Assets and Liabilities. Unpaid dividends on VRDP Shares are recognized as a component of “Interest payable” on the Statement of Assets and Liabilities, when applicable. Dividends paid on the VRDP Shares are recognized as a component of “Interest expense and amortization of offering costs” on the Statement of Operations. Costs incurred by the Funds in connection with their offerings of VRDP Shares were recorded as a deferred charge, which are amortized over the life of the shares and are recognized as a component of “Deferred offering costs” on the Statement of Assets and Liabilities” and “Interest expense and amortization of offering costs” on the Statement of Operations. In addition to interest expense, each Fund also pays a per annum liquidity fee to the liquidity provider, as well as a remarketing fee, which are recognized as “Liquidity fees” and “Remarketing fees,” respectively, on the Statement of Operations.
Indemnifications
Under the Funds’ organizational documents, their officers and directors/trustees are indemnified against certain liabilities arising out of the performance of their duties to the Funds. In addition, in the normal course of business, the Funds enter into contracts that provide general indemnifications to other parties. The Funds’ maximum exposure under these arrangements is unknown as this would involve future claims that may be made against the Funds that have not yet occurred. However, the Funds have not had prior claims or losses pursuant to these contracts and expect the risk of loss to be remote.
Use of Estimates
The preparation of financial statements in conformity with U.S. GAAP requires management to make estimates and assumptions that affect the reported amounts of assets and liabilities at the date of the financial statements and the reported amounts of increases and decreases in net assets applicable to common shares from operations during the reporting period. Actual results may differ from those estimates.
2. Investment Valuation and Fair Value Measurements
Investment Valuation
Prices of municipal bonds and other fixed income securities are provided by a pricing service approved by the Funds’ Board of Directors/Trustees. These securities are generally classified as Level 2 for fair value measurement purposes. The pricing service establishes a security’s fair value using methods that may include consideration of the following: yields or prices of investments of comparable quality, type of issue, coupon, maturity and rating, market quotes or indications of value from security dealers, evaluations of anticipated cash flows or collateral, general market conditions and other information and analysis, including the obligor’s credit characteristics considered relevant. In pricing certain securities, particularly less liquid and lower quality securities, the pricing service may consider information about a security, its issuer or market activity, provided by the Adviser. These securities are generally classified as Level 2 or Level 3 depending on the priority of the significant inputs.
Investments in investment companies are valued at their respective net asset value on the valuation date. These investment vehicles are generally classified as Level 1.
Certain securities may not be able to be priced by the pre-established pricing methods as described above. Such securities may be valued by the Funds’ Board of Directors/Trustees or its designee at fair value. These securities generally include, but are not limited to, restricted securities (securities which may not be publicly sold without registration under the Securities Act of 1933, as amended) for which a pricing service is unable to provide a market price; securities whose trading has been formally suspended; debt securities that have gone into default and for which there is no current market quotation; a security whose market price is not available from a pre-established pricing source; a security with respect to which an event has occurred that is likely to materially affect the value of the security after the market has closed but before the calculation of a Fund’s net asset value (as may be the case in non-U.S. markets on which the security is primarily traded) or make it difficult or impossible to obtain a reliable market quotation; and a security whose price, as provided by the pricing service, is not deemed to reflect the security’s fair value. As a general principle, the fair value of a security would appear to be the amount that the owner might reasonably expect to receive for it in a current sale. A variety of factors may be considered in determining the fair value of such securities, which may include consideration of the following: yields or prices of investments of comparable quality, type of issue, coupon, maturity and rating, market quotes or indications of value from security dealers, evaluations of anticipated cash flows or collateral, general market conditions and other information and analysis, including the obligor’s credit characteristics considered relevant. These securities are generally classified as Level 2 or Level 3 depending on the priority of the significant inputs. Regardless of the method employed to value a particular security, all valuations are subject to review by the Funds’ Board of Directors/Trustees or its designee.
Fair Value Measurements
Fair value is defined as the price that the Funds would receive upon selling an investment or transferring a liability in an orderly transaction to an independent buyer in the principal or most advantageous market for the investment. A three-tier hierarchy is used to maximize the use of observable market data and minimize the use of unobservable inputs and to establish classification of fair value measurements for disclosure purposes. Observable inputs reflect the assumptions market participants would use in pricing the asset or liability. Observable inputs are based on market data obtained from sources independent of the reporting entity. Unobservable inputs reflect the reporting entity’s own assumptions about the assumptions market participants would use in pricing the asset or liability. Unobservable inputs are based on the best information available in the circumstances. The following is a summary of the three-tiered hierarchy of valuation input levels.
| | | |
| | Level 1 – | Inputs are unadjusted and prices are determined using quoted prices in active markets for identical securities. |
| | | |
| | Level 2 – | Prices are determined using other significant observable inputs (including quoted prices for similar securities, interest rates, prepayment speeds, credit risk, etc.). |
| | | |
| | Level 3 – | Prices are determined using significant unobservable inputs (including management’s assumptions in determining the fair value of investments). |
Notes to Financial Statements (continued)
The inputs or methodologies used for valuing securities are not an indication of the risks associated with investing in those securities. The following is a summary of each Fund’s fair value measurements as of the end of the reporting period:
| Performance Plus (NPP) | | | Level 1 | | | Level 2 | | | Level 3 | | | Total | |
| Long-Term Investments*: | | | | | | | | | | | | | |
| Municipal Bonds | | $ | — | | $ | 1,438,320,888 | | $ | — | | $ | 1,438,320,888 | |
| Corporate Bonds | | | — | | | — | | | 45,052 | | | 45,052 | |
| Total | | $ | — | | $ | 1,438,320,888 | | $ | 45,052 | | $ | 1,438,365,940 | |
| | | | | | | | | | | | | | |
| Municipal Advantage (NMA) | | | Level 1 | | | Level 2 | | | Level 3 | | | Total | |
| Long-Term Investments*: | | | | | | | | | | | | | |
| Municipal Bonds | | $ | — | | $ | 927,346,109 | | $ | — | | $ | 927,346,109 | |
| Corporate Bonds | | | — | | | — | | | 46,322 | | | 46,322 | |
| Total | | $ | — | | $ | 927,346,109 | | $ | 46,322 | | $ | 927,392,431 | |
| | | | | | | | | | | | | | |
| Market Opportunity (NMO) | | | Level 1 | | | Level 2 | | | Level 3 | | | Total | |
| Long-Term Investments*: | | | | | | | | | | | | | |
| Municipal Bonds | | $ | — | | $ | 990,151,175 | | $ | — | | $ | 990,151,175 | |
| Corporate Bonds | | | — | | | — | | | 136,344 | | | 136,344 | |
| Total | | $ | — | | $ | 990,151,175 | | $ | 136,344 | | $ | 990,287,519 | |
| | | | | | | | | | | | | | |
| Dividend Advantage (NAD) | | | Level 1 | | | Level 2 | | | Level 3 | | | Total | |
| Long-Term Investments*: | | | | | | | | | | | | | |
| Municipal Bonds | | $ | — | | $ | 853,733,592 | | $ | — | | $ | 853,733,592 | |
| Corporate Bonds | | | — | | | — | | | 54,140 | | | 54,140 | |
| Investment Companies | | | 505,658 | | | — | | | — | | | 505,658 | |
| Total | | $ | 505,658 | | $ | 853,733,592 | | $ | 54,140 | | $ | 854,293,390 | |
| | | | | | | | | | | | | | |
| Dividend Advantage 2 (NXZ) | | | Level 1 | | | Level 2 | | | Level 3 | | | Total | |
| Long-Term Investments*: | | | | | | | | | | | | | |
| Municipal Bonds | | $ | — | | $ | 630,626,748 | | $ | — | | $ | 630,626,748 | |
| Corporate Bonds | | | — | | | — | | | 56,483 | | | 56,483 | |
| Total | | $ | — | | $ | 630,626,748 | | $ | 56,483 | | $ | 630,683,231 | |
| | | | | | | | | | | | | | |
| Dividend Advantage 3 (NZF) | | | Level 1 | | | Level 2 | | | Level 3 | | | Total | |
| Long-Term Investments*: | | | | | | | | | | | | | |
| Municipal Bonds | | $ | — | | $ | 824,696,440 | | $ | — | | $ | 824,696,440 | |
| Corporate Bonds | | | — | | | — | | | 9,202 | | | 9,202 | |
| Investment Companies | | | 3,262,881 | | | — | | | — | | | 3,262,881 | |
| Short-Term Investments*: | | | | | | | | | | | | | |
| Municipal Bonds | | | — | | | 18,914,000 | | | — | | | 18,914,000 | |
| Total | | $ | 3,262,881 | | $ | 843,610,440 | | $ | 9,202 | | $ | 846,882,523 | |
| * | Refer to the Fund’s Portfolio of Investments for state and industry classifications of Municipal Bonds and Corporate Bonds, respectively, and breakdown of Corporate Bonds classified as Level 3. |
The Nuveen funds’ Board of Directors/Trustees is responsible for the valuation process and has delegated the oversight of the daily valuation process to the Adviser’s Valuation Committee. The Valuation Committee, pursuant to the valuation policies and procedures adopted by the Board of Directors/Trustees, is responsible for making fair value determinations, evaluating the effectiveness of the funds’ pricing policies and reporting to the Board of Directors/Trustees. The Valuation Committee is aided in its efforts by the Adviser’s dedicated Securities Valuation Team, which is responsible for administering the daily valuation process and applying fair value methodologies as approved by the Valuation Committee. When determining the reliability of independent pricing services for investments owned by the funds, the Valuation Committee, among other things, conducts due diligence reviews of the pricing services and monitors the quality of security prices received through various testing reports conducted by the Securities Valuation Team.
The Valuation Committee will consider pricing methodologies it deems relevant and appropriate when making a fair value determination, based on the facts and circumstances specific to the portfolio instrument. Fair value determinations generally will be derived as follows, using public or private market information:
| | |
| (i) | If available, fair value determinations shall be derived by extrapolating from recent transactions or quoted prices for identical or comparable securities. |
| | |
| (ii) | If such information is not available, an analytical valuation methodology may be used based on other available information including, but not limited to: analyst appraisals, research reports, corporate action information, issuer financial statements and shelf registration statements. Such analytical valuation methodologies may include, but are not limited to: multiple of earnings, discount from market value of a similar freely-traded security, discounted cash flow analysis, book value or a multiple thereof, risk premium/yield analysis, yield to maturity and/or fundamental investment analysis. |
The purchase price of a portfolio instrument will be used to fair value the instrument only if no other valuation methodology is available or deemed appropriate, and it is determined that the purchase price fairly reflects the instrument’s current value.
For each portfolio security that has been fair valued pursuant to the policies adopted by the Board of Directors/Trustees, the fair value price is compared against the last available and next available market quotations. The Valuation Committee reviews the results of such testing and fair valuation occurrences are reported to the Board of Directors/Trustees.
3. Portfolio Securities and Investments in Derivatives
Portfolio Securities
Inverse Floating Rate Securities
Each Fund is authorized to invest in inverse floating rate securities. An inverse floating rate security is created by depositing a municipal bond, typically with a fixed interest rate, into a special purpose trust created by a broker-dealer. In turn, this trust (a) issues floating rate certificates, in face amounts equal to some fraction of the deposited bond’s par amount or market value, that typically pay short-term tax-exempt interest rates to third parties, and (b) issues to a long-term investor (such as one of the Funds) an inverse floating rate certificate (sometimes referred to as an “inverse floater”) that represents all remaining or residual interest in the trust. The income received by the inverse floater holder varies inversely with the short-term rate paid to the floating rate certificates’ holders, and in most circumstances the inverse floater holder bears substantially all of the underlying bond’s downside investment risk and also benefits disproportionately from any potential appreciation of the underlying bond’s value. The price of an inverse floating rate security will be more volatile than that of the underlying bond because the interest rate is dependent on not only the fixed coupon rate of the underlying bond but also on the short-term interest paid on the floating rate certificates, and because the inverse floating rate security essentially bears the risk of loss of the greater face value of the underlying bond.
A Fund may purchase an inverse floating rate security in a secondary market transaction without first owning the underlying bond (referred to as an “externally-deposited inverse floater”), or instead by first selling a fixed-rate bond to a broker-dealer for deposit into the special purpose trust and receiving in turn the residual interest in the trust (referred to as a “self-deposited inverse floater”). The inverse floater held by a Fund gives the Fund the right (a) to cause the holders of the floating rate certificates to tender their notes at par, and (b) to have the broker transfer the fixed-rate bond held by the trust to the Fund, thereby collapsing the trust. An investment in an externally-deposited inverse floater is identified in the Portfolio of Investments as “(IF) – Inverse floating rate investment.” An investment in a self-deposited inverse floater is accounted for as a financing transaction. In such instances, a fixed-rate bond deposited into a special purpose trust is identified in the Portfolio of Investments as “(UB) – Underlying bond of an inverse floating rate trust reflected as a financing transaction,” with the Fund accounting for the short-term floating rate certificates issued by the trust, at their liquidation value, as “Floating rate obligations” on the Statement of Assets and Liabilities. In addition, the Fund reflects in “Investment Income” the entire earnings of the underlying bond and the related interest paid to the holders of the short-term floating rate certificates as a component of “Interest expense and amortization of offering costs” on the Statement of Operations.
During the fiscal year ended October 31, 2013, each Fund invested in externally deposited inverse floaters and/or self-deposited inverse floaters.
Each Fund may also enter into shortfall and forbearance agreements (sometimes referred to as a “recourse trust” or “credit recovery swap”) (such agreements referred to herein as “Recourse Trusts”) with a broker-dealer by which a Fund agrees to reimburse the broker-dealer, in certain circumstances, for the difference between the liquidation value of the fixed-rate bond held by the trust and the liquidation value of the floating rate certificates issued by the trust plus any shortfalls in interest cash flows. Under these agreements, a Fund’s potential exposure to losses related to or on inverse floaters may increase beyond the value of a Fund’s inverse floater investments as a Fund may potentially be liable to fulfill all amounts owed to holders of the floating rate certificates. At period end, any such shortfall is recognized as “Unrealized depreciation on Recourse Trusts” on the Statement of Assets and Liabilities.
Notes to Financial Statements (continued)
As of October 31, 2013, each Fund’s maximum exposure to the floating rate obligations issued by the externally-deposited Recourse Trusts was as follows:
| | | | | | | | | | | | | | | | | | | | |
| | | Performance | | | Municipal | | | Market | | | Dividend | | | Dividend | | | Dividend | |
| | | | Plus | | | Advantage | | Opportunity | | | Advantage | | Advantage 2 | | Advantage 3 | |
| | | | (NPP | ) | | (NMA | ) | | (NMO | ) | | (NAD | ) | | (NXZ | ) | | (NZF | ) |
| Maximum exposure to Recourse Trusts | | $ | 7,500,000 | | $ | 11,250,000 | | $ | 7,500,000 | | $ | 11,250,000 | | $ | 11,250,000 | | $ | 5,095,000 | |
The average floating rate obligations outstanding and average annual interest rate and fees related to self-deposited inverse floaters during the fiscal year ended October 31, 2013, were as follows:
| | | | | | | | | | | | | | | | | | | | |
| | | Performance | | | Municipal | | | Market | | | Dividend | | | Dividend | | | Dividend | |
| | | | Plus | | | Advantage | | Opportunity | | | Advantage | | Advantage 2 | | Advantage 3 | |
| | | | (NPP | ) | | (NMA | ) | | (NMO | ) | | (NAD | ) | | (NXZ | ) | | (NZF | ) |
| Average floating rate obligations outstanding | | $ | 24,691,575 | | $ | 45,488,333 | | $ | 34,730,000 | | $ | 42,810,000 | | $ | 18,983,356 | | $ | 44,412,000 | |
| Average annual interest rate and fees | | | 0.61% | | | 0.60% | | | 0.47% | | | 0.62% | | | 0.54% | | | 0.51% | |
Zero Coupon Securities
Each Fund is authorized to invest in zero coupon securities. A zero coupon security does not pay a regular interest coupon to its holders during the life of the security. Income to the holder of the security comes from accretion of the difference between the original purchase price of the security at issuance and the par value of the security at maturity and is effectively paid at maturity. The market prices of zero coupon securities generally are more volatile than the market prices of securities that pay interest periodically.
Investments in Derivatives
Each Fund is authorized to invest in certain derivative instruments such as futures, options and swap contracts. Each Fund will limit its investments in futures, options on futures and swap contracts to the extent necessary for the Adviser to claim the exclusion from registration by the Commodity Futures Trading Commission as a commodity pool operator with respect to the Fund. The Funds record derivative instruments at fair value, with changes in fair value recognized on the Statement of Operations, when applicable. Even though the Funds’ investments in derivatives may represent economic hedges, they are not considered to be hedge transactions for financial reporting purposes. Although the Funds are authorized to invest in derivative instruments and may do so in future, they did not make any such investments during the fiscal year ended October 31, 2013.
Market and Counterparty Credit Risk
In the normal course of business each Fund may invest in financial instruments and enter into financial transactions where risk of potential loss exists due to changes in the market (market risk) or failure of the other party to the transaction to perform (counterparty credit risk). The potential loss could exceed the value of the financial assets recorded on the financial statements. Financial assets, which potentially expose each Fund to counterparty credit risk, consist principally of cash due from counterparties on forward, option and swap transactions, when applicable. The extent of each Fund’s exposure to counterparty credit risk in respect to these financial assets approximates their carrying value as recorded on the Statement of Assets and Liabilities.
Each Fund helps manage counterparty credit risk by entering into agreements only with counterparties the Adviser believes have the financial resources to honor their obligations and by having the Adviser monitor the financial stability of the counterparties. Additionally, counterparties may be required to pledge collateral daily (based on the daily valuation of the financial asset) on behalf of each Fund with a value approximately equal to the amount of any unrealized gain above a pre-determined threshold. Reciprocally, when each Fund has an unrealized loss, the Funds have instructed the custodian to pledge assets of the Funds as collateral with a value approximately equal to the amount of the unrealized loss above a pre-determined threshold. Collateral pledges are monitored and subsequently adjusted if and when the valuations fluctuate, either up or down, by at least the pre-determined threshold amount.
4. Fund Shares
Common Shares
Since the inception of the Funds’ repurchase programs, the Funds have not repurchased any of their outstanding common shares.
Transactions in common shares were as follows:
| | | | | | | Municipal | | | Market | |
| | | | Performance Plus (NPP) | | | Advantage (NMA) | | | Opportunity (NMO) | |
| | | | Year | | | Year | | | Year | | | Year | | | Year | | | Year | |
| | | | Ended | | | Ended | | | Ended | | | Ended | | | Ended | | | Ended | |
| | | | 10/31/13 | | | 10/31/12 | | | 10/31/13 | | | 10/31/12 | | | 10/31/13 | | | 10/31/12 | |
| Common shares issued to shareholders due to reinvestment of distributions | | | 17,159 | | | 55,834 | | | — | | | 106,232 | | | — | | | 64,861 | |
| | | | Dividend | | | Dividend | | | Dividend | |
| | | | Advantage (NAD) | | | Advantage 2 (NXZ) | | | Advantage 3 (NZF) | |
| | | | Year | | | Year | | | Year | | | Year | | | Year | | | Year | |
| | | | Ended | | | Ended | | | Ended | | | Ended | | | Ended | | | Ended | |
| | | | 10/31/13 | | | 10/31/12 | | | 10/31/13 | | | 10/31/12 | | | 10/31/13 | | | 10/31/12 | |
| Common shares issued to shareholders due to reinvestment of distributions | | | — | | | — | | | — | | | 16,604 | | | — | | | 8,007 | |
Preferred Shares
With the exception of Performance Plus (NPP), the Funds with VMTP Shares issued and outstanding did not have any transactions in VMTP Shares during the fiscal year ended October 31, 2013. The Funds did not have any transactions in VMTP Shares during the fiscal year ended October 31, 2012.
Transactions in VMTP Shares for Performance Plus (NPP) were as follows:
| | | | Year Ended 10/31/13 | |
| | | | Series | | | Shares | | | Amount | |
| Performance Plus (NPP) | | | | | | | | | | |
| VMTP Shares issued | | | 2015 | | | 5,350 | | $ | 535,000,000 | |
| VMTP Shares exchanged | | | 2014 | | | (4,217 | ) | | (421,700,000 | ) |
| Net increase (decrease) | | | | | | 1,133 | | $ | 113,300,000 | |
5. Investment Transactions
Purchases and sales (including maturities but excluding short-term investments, where applicable) during the fiscal year ended October 31, 2013, were as follows:
| | | | | | | | | | | | | | | | | | | | |
| | | Performance | | | Municipal | | | Market | | | Dividend | | | Dividend | | | Dividend | |
| | | | Plus | | | Advantage | | Opportunity | | | Advantage | | Advantage 2 | | Advantage 3 | |
| | | | (NPP | ) | | (NMA | ) | | (NMO | ) | | (NAD | ) | | (NXZ | ) | | (NZF | ) |
| Purchases | | $ | 396,698,053 | | $ | 167,238,424 | | $ | 211,231,283 | | $ | 103,215,105 | | $ | 146,216,398 | | $ | 140,669,774 | |
| Sales and maturities | | | 278,560,509 | | | 179,149,981 | | | 216,185,441 | | | 115,555,585 | | | 143,127,905 | | | 118,575,330 | |
6. Income Tax Information
Each Fund is a separate taxpayer for federal income tax purposes. Each Fund intends to distribute substantially all of its net investment income and net capital gains to shareholders and to otherwise comply with the requirements of Subchapter M of the Internal Revenue Code applicable to regulated investment companies. Therefore, no federal income tax provision is required. Furthermore, each Fund intends to satisfy conditions that will enable interest from municipal securities, which is exempt from regular federal income tax, to retain such tax-exempt status when distributed to shareholders of the Funds. Net realized capital gains and ordinary income distributions paid by the Funds are subject to federal taxation.
For all open tax years and all major taxing jurisdictions, management of the Funds has concluded that there are no significant uncertain tax positions that would require recognition in the financial statements. Open tax years are those that are open for examination by taxing authorities (i.e., generally the last four tax year ends and the interim tax period since then). Furthermore, management of the Funds is also not aware of any tax positions for which it is reasonably possible that the total amounts of unrecognized tax benefits will significantly change in the next twelve months.
The following information is presented on an income tax basis. Differences between amounts for financial statement and federal income tax purposes are primarily due to timing differences in recognizing taxable market discount, timing differences in recognizing certain gains and losses on investment transactions and the treatment of investments in inverse floating rate securities reflected as financing transactions, if any. To the extent that differences arise that are permanent in nature, such amounts are reclassified within the capital accounts as detailed below. Temporary differences do not require reclassification. Temporary and permanent differences do not impact the net asset values of the Funds.
Notes to Financial Statements (continued)
As of October 31, 2013, the cost and unrealized appreciation (depreciation) of investments, as determined on a federal income tax basis, were as follows:
| | | | | | | | | | | | | | | | | | | | |
| | | Performance | | | Municipal | | | Market | | | Dividend | | | Dividend | | | Dividend | |
| | | | Plus | | | Advantage | | Opportunity | | | Advantage | | Advantage 2 | | Advantage 3 | |
| | | | (NPP | ) | | (NMA | ) | | (NMO | ) | | (NAD | ) | | (NXZ | ) | | (NZF | ) |
| Cost of investments | | $ | 1,359,198,599 | | $ | 878,060,720 | | $ | 938,228,868 | | $ | 796,181,596 | | $ | 594,934,510 | | $ | 794,224,731 | |
| Gross unrealized: | | | | | | | | | | | | | | | | | | | |
| Appreciation | | $ | 87,090,354 | | $ | 41,127,431 | | $ | 40,921,341 | | $ | 43,127,002 | | $ | 39,769,909 | | $ | 32,119,672 | |
| Depreciation | | | (43,844,187 | ) | | (37,284,130 | ) | | (23,593,681 | ) | | (27,824,841 | ) | | (23,598,699 | ) | | (23,816,209 | ) |
| Net unrealized appreciation (depreciation) of investments | | $ | 43,246,167 | | $ | 3,843,301 | | $ | 17,327,660 | | $ | 15,302,161 | | $ | 16,171,210 | | $ | 8,303,463 | |
Permanent differences, primarily due to federal taxes paid, taxable market discount and non-deductible offering costs, resulted in reclassifications among the Funds’ components of common share net assets as of October 31, 2013, the Funds’ tax year end, as follows:
| | | | | | | | | | | | | | | | | | | | |
| | | Performance | | | Municipal | | | Market | | | Dividend | | | Dividend | | | Dividend | |
| | | | Plus | | | Advantage | | Opportunity | | | Advantage | | Advantage 2 | | Advantage 3 | |
| | | | (NPP | ) | | (NMA | ) | | (NMO | ) | | (NAD | ) | | (NXZ | ) | | (NZF | ) |
| Paid-in surplus | | $ | (1,163,504 | ) | $ | (80,034 | ) | $ | (116,857 | ) | $ | (713,666 | ) | $ | (76,528 | ) | $ | (592,744 | ) |
| Undistributed (Over-distribution of) net investment income | | | 1,078,184 | | | (42,487 | ) | | 69,206 | | | 679,185 | | | 39,756 | | | 539,164 | |
| Accumulated net realized gain (loss) | | | 85,320 | | | 122,521 | | | 47,651 | | | 34,481 | | | 36,772 | | | 53,580 | |
The tax components of undistributed net tax-exempt income, net ordinary income and net long-term capital gains as of October 31, 2013, the Funds’ tax year end, were as follows:
| | | | | | | | | | | | | | | | | | | | |
| | | Performance | | | Municipal | | | Market | | | Dividend | | | Dividend | | | Dividend | |
| | | | Plus | | | Advantage | | Opportunity | | | Advantage | | Advantage 2 | | Advantage 3 | |
| | | | (NPP | ) | | (NMA | ) | | (NMO | ) | | (NAD | ) | | (NXZ | ) | | (NZF | ) |
Undistributed net tax-exempt income1 | | $ | 16,138,214 | | $ | 3,106,630 | | $ | 4,628,380 | | $ | 8,430,331 | | $ | 5,395,642 | | $ | 3,919,121 | |
Undistributed net ordinary income2 | | | 42,237 | | | 41,221 | | | 210,382 | | | 827,058 | | | 6,428 | | | 9,046 | |
| Undistributed net long-term capital gains | | | — | | | — | | | — | | | — | | | — | | | — | |
| 1 | Undistributed net tax-exempt income (on a tax basis) has not been reduced for the dividend declared on October 1, 2013, paid on November 1, 2013. |
| 2 | Net ordinary income consists of taxable market discount income and net short-term capital gains, if any. |
The tax character of distributions paid during the Funds’ tax years ended October 31, 2013 and October 31, 2012, was designated for purposes of the dividends paid deduction as follows:
| | | | | | | | | | | | | | | | | | | | |
| | | Performance | | | Municipal | | | Market | | | Dividend | | | Dividend | | | Dividend | |
| | | | Plus | | | Advantage | | Opportunity | | | Advantage | | Advantage 2 | | Advantage 3 | |
| 2013 | | | (NPP | ) | | (NMA | ) | | (NMO | ) | | (NAD | ) | | (NXZ | ) | | (NZF | ) |
Distributions from net tax-exempt income3 | | $ | 62,511,839 | | $ | 36,937,595 | | $ | 37,276,853 | | $ | 39,961,764 | | $ | 24,606,089 | | $ | 34,899,121 | |
Distributions from net ordinary income2 | | | — | | | 340,840 | | | — | | | 208,271 | | | — | | | 68,680 | |
| Distributions from net long-term capital gains | | | — | | | — | | | — | | | — | | | — | | | — | |
| | | | | | | | | | | | | | | | | | | | |
| | | Performance | | | Municipal | | | Market | | | Dividend | | | Dividend | | | Dividend | |
| | | | Plus | | | Advantage | | Opportunity | | | Advantage | | Advantage 2 | | Advantage 3 | |
| 2012 | | | (NPP | ) | | (NMA | ) | | (NMO | ) | | (NAD | ) | | (NXZ | ) | | (NZF | ) |
| Distributions from net tax-exempt income | | $ | 63,491,216 | | $ | 42,341,299 | | $ | 41,941,619 | | $ | 41,039,903 | | $ | 28,716,318 | | $ | 42,554,847 | |
Distributions from net ordinary income2 | | | — | | | 1,340,750 | | | — | | | 269,121 | | | 133,775 | | | 1,740 | |
| Distributions from net long-term capital gains | | | — | | | 5,842,372 | | | — | | | 1,829,772 | | | 5,328,444 | | | 1,622,006 | |
| 2 | Net ordinary income consists of taxable market discount income and net short-term capital gains, if any. |
| 3 | The Funds hereby designate these amounts paid during the fiscal year ended October 31, 2013, as Exempt Interest Dividends. |
As of October 31, 2013, the Funds’ tax year end, the Funds had unused capital loss carryforwards available for federal income tax purposes to be applied against future capital gains, if any. If not applied, the carryforwards will expire as shown in the following table. The losses not subject to expiration retain the character reflected and will be utilized first by a Fund, while the losses subject to expiration are considered short-term.
| | | | | | | | | | | | | | | | | | | | |
| | | Performance | | | Municipal | | | Market | | | Dividend | | | Dividend | | | Dividend | |
| | | | Plus | | | Advantage | | Opportunity | | | Advantage | | Advantage 2 | | Advantage 3 | |
| | | | (NPP | ) | | (NMA | ) | | (NMO | ) | | (NAD | ) | | (NXZ | ) | | (NZF | ) |
| Expiration: | | | | | | | | | | | | | | | | | | | |
| October 31, 2014 | | $ | — | | $ | — | | $ | 1,437,187 | | $ | — | | $ | — | | $ | — | |
| October 31, 2015 | | | — | | | — | | | 1,902,879 | | | — | | | — | | | — | |
| October 31, 2016 | | | — | | | — | | | 1,398,166 | | | — | | | — | | | — | |
| October 31, 2019 | | | 310,323 | | | — | | | 3,031,141 | | | — | | | — | | | — | |
| Not subject to expiration: | | | | | | | | | | | | | | | | | | | |
| Short-term losses | | | 280,724 | | | — | | | 96,572 | | | — | | | 115,805 | | | — | |
| Long-term losses | | | 1,557,182 | | | 1,836,262 | | | 21,509,616 | | | 3,927,445 | | | 8,895,770 | | | 4,327,557 | |
| Total | | $ | 2,148,229 | | $ | 1,836,262 | | $ | 29,375,561 | | $ | 3,927,445 | | $ | 9,011,575 | | $ | 4,327,557 | |
During the Funds’ tax year ended October 31, 2013, the following Funds utilized capital loss carryforwards as follows:
| | | Performance | | | Municipal | | | Market | | | Dividend | |
| | | | Plus | | | Advantage | | Opportunity | | | Advantage | |
| | | | (NPP | ) | | (NMA | ) | | (NMO | ) | | (NAD | ) |
| Utilized capital loss carryforwards | | $ | 2,622,873 | | $ | 2,017,854 | | $ | 4,519,331 | | $ | 3,027,846 | |
7. Management Fees and Other Transactions with Affiliates
Each Fund’s management fee compensates the Adviser for overall investment advisory and administrative services and general office facilities. The Sub-Adviser is compensated for its services to the Funds from the management fees paid to the Adviser.
Each Fund’s management fee consists of two components — a fund-level fee, based only on the amount of assets within the Fund, and a complex-level fee, based on the aggregate amount of all eligible fund assets managed by the Adviser. This pricing structure enables Fund shareholders to benefit from growth in the assets within their respective Fund as well as from growth in the amount of complex-wide assets managed by the Adviser.
The annual fund-level fee for each Fund, payable monthly, is calculated according to the following schedules:
| | | | | |
| | | | Performance Plus (NPP) |
| | | | Municipal Advantage (NMA) |
| | | | Market Opportunity (NMO) |
| Average Daily Managed Assets* | | | Fund-Level Fee Rate |
| For the first $125 million | | | .4500 | % |
| For the next $125 million | | | .4375 | |
| For the next $250 million | | | .4250 | |
| For the next $500 million | | | .4125 | |
| For the next $1 billion | | | .4000 | |
| For the next $3 billion | | | .3875 | |
| For managed assets over $5 billion | | | .3750 | |
| | | | | |
| | | | Dividend Advantage (NAD) |
| | | | Dividend Advantage 2 (NXZ) |
| | | | Dividend Advantage 3 (NZF) |
| Average Daily Managed Assets* | | | Fund-Level Fee Rate |
| For the first $125 million | | | .4500 | % |
| For the next $125 million | | | .4375 | |
| For the next $250 million | | | .4250 | |
| For the next $500 million | | | .4125 | |
| For the next $1 billion | | | .4000 | |
| For managed assets over $2 billion | | | .3750 | |
Notes to Financial Statements (continued)
The annual complex-level fee for each Fund, payable monthly, is calculated according to the following schedule:
| | | | | |
| Complex-Level Managed Asset Breakpoint Level* | | | Effective Rate at Breakpoint Level |
| $55 billion | | | .2000 | % |
| $56 billion | | | .1996 | |
| $57 billion | | | .1989 | |
| $60 billion | | | .1961 | |
| $63 billion | | | .1931 | |
| $66 billion | | | .1900 | |
| $71 billion | | | .1851 | |
| $76 billion | | | .1806 | |
| $80 billion | | | .1773 | |
| $91 billion | | | .1691 | |
| $125 billion | | | .1599 | |
| $200 billion | | | .1505 | |
| $250 billion | | | .1469 | |
| $300 billion | | | .1445 | |
| * | For the fund-level and complex-level fees, managed assets include closed-end fund assets managed by the Adviser that are attributable to certain types of leverage. For these purposes, leverage includes the funds’ use of preferred stock and borrowings and certain investments in the residual interest certificates (also called inverse floating rate securities) in tender option bond (TOB) trusts, including the portion of assets held by a TOB trust that has been effectively financed by the trust’s issuance of floating rate securities, subject to an agreement by the Adviser as to certain funds to limit the amount of such assets for determining managed assets in certain circumstances. The complex-level fee is calculated based upon the aggregate daily managed assets of all Nuveen Funds that constitute “eligible assets.” Eligible assets do not include assets attributable to investments in other Nuveen Funds or assets in excess of $2 billion added to the Nuveen Fund complex in connection with the Adviser’s assumption of the management of the former First American Funds effective January 1, 2011. As of October 31, 2013, the complex-level fee rate for each of these Funds was .1683%. |
The Funds pay no compensation directly to those of its directors/trustees who are affiliated with the Adviser or to its officers, all of whom receive remuneration for their services to the Funds from the Adviser or its affiliates. The Board of Directors/Trustees has adopted a deferred compensation plan for independent directors/trustees that enables directors/trustees to elect to defer receipt of all or a portion of the annual compensation they are entitled to receive from certain Nuveen-advised funds. Under the plan, deferred amounts are treated as though equal dollar amounts had been invested in shares of select Nuveen-advised funds.
8. New Accounting Pronouncements
Financial Accounting Standards Board (“FASB”) Balance Sheet (Topic 210): Disclosures about Offsetting Assets and Liabilities
In January 2013, Accounting Standards Update (“ASU”) 2013-01, Clarifying the Scope of Disclosures about Offsetting Assets and Liabilities, replaced ASU 2011-11, Disclosures about Offsetting Assets and Liabilities. ASU 2013-01 is effective for fiscal years beginning on or after January 1, 2013. ASU 2011-11 was intended to enhance disclosure requirements on the offsetting of financial assets and liabilities. ASU 2013-01 limits the scope of the new balance sheet offsetting disclosures to derivatives, repurchase agreements and securities lending transactions to the extent that they are (1) offset in the financial statements or (2) subject to an enforceable master netting arrangement or similar agreement. Management is currently evaluating the application of ASU 2013-01 and its impact to the financial statements and footnote disclosures, if any.
9. Subsequent Events
Refinancing of MTP and VMTP Shares
Subsequent to the close of this reporting period, Dividend Advantage (NAD) redeemed all series of its MTP and 2014 VMTP Shares, at their $10.00 and $100,000 liquidation value per share, respectively, plus dividend amounts owed, with the proceeds from $265,000,000 of newly issued 2016 VMTP Shares. On December 10, 2013, 2016 VMTP Shares were issued to qualified institutional buyers in a private offering pursuant to Rule 144A of the Securities Act of 1933 and Dividend Advantage’s (NAD) MTP Shares were redeemed on December 20, 2013. Dividend Advantage’s (NAD) 2014 VMTP Shares are anticipated to be redeemed on January 6, 2014.
Board Members & Officers (Unaudited)
The management of the Funds, including general supervision of the duties performed for the Funds by the Adviser, is the responsibility of the board members of the Funds. The number of board members of the Funds is currently set at ten. None of the board members who are not “interested” persons of the Funds (referred to herein as “independent board members”) has ever been a director or employee of, or consultant to, Nuveen or its affiliates. The names and business addresses of the board members and officers of the Funds, their principal occupations and other affiliations during the past five years, the number of portfolios each oversees and other directorships they hold are set forth below.
| | Name, | | Position(s) Held | | Year First | | Principal | | Number |
| | Year of Birth | | with the Funds | | Elected or | | Occupation(s) | | of Portfolios |
| | & Address | | | | Appointed | | including other | | in Fund Complex |
| | | | | | and Term(1) | | Directorships | | Overseen by |
| | | | | | | | During Past 5 Years | | Board Member |
| | | | | | | | | | |
| Independent Board Members: | | | | | | |
| | | | | | | | | | |
| ■ | 1944 333 W. Wacker Drive Chicago, IL 60606 | | Board Member | | 1996 Class III | | Chairman of Miller-Valentine Partners Ltd., a real estate investment company; formerly, Senior Partner and Chief Operating Officer (retired 2004) of Miller-Valentine Group; an owner in several other Miller Valentine entities ; member, Mid-America Health System; Board Member of Tech Town, Inc., a not-for-profit community development company; Board Member of WDPR Public Radio station; formerly, member, Business Advisory Council, Cleveland Federal Reserve Bank and University of Dayton Business School Advisory Council. | | 206 |
| | | | | | | | | | |
| ■ | 333 W. Wacker Drive Chicago, IL 60606 | | Board Member | | 1996 Class III | | Private Investor and Management Consultant; Treasurer and Director, Humanities Council of Washington, D.C.; Board Member, Independent Directors Council affiliated with the Investment Company Institute. | | 206 |
| | | | | | | | | | |
| ■ | 333 W. Wacker Drive Chicago, IL 60606 | | Board Member | | 1999 Class III | | President, The Hall-Perrine Foundation, a private philanthropic corporation (since 1996); Chairman, United Fire Group, a publicly held company; formerly, President of the Board of Regents for the State of Iowa University System; Director, Source Media Group; Life Trustee of Coe College; formerly, Director, Alliant Energy; formerly, Director, Federal Reserve Bank of Chicago; formerly, President and Chief Operating Officer, SCI Financial Group, Inc., a regional financial services firm. | | 206 |
| | | | | | | | | | |
| ■ | 333 W. Wacker Drive Chicago, IL 60606 | | Board Member | | 2004 Class I | | Dean Emeritus (since June 30, 2012), formerly, Dean, Tippie College of Business, University of Iowa (2006-2012); Director (since 2004) of Xerox Corporation; Director (since 2005), and President (since July 2012) Beta Gamma Sigma, Inc., The International Honor Society; Director of Wellmark, Inc. (since 2009); formerly, Dean and Distinguished Professor of Finance, School of Business at the University of Connecticut (2003-2006); previously, Senior Vice President and Director of Research at the Federal Reserve Bank of Chicago (1995-2003); formerly, Director (1997-2007), Credit Research Center at Georgetown University. | | 206 |
| | | | | | | | | | |
| ■ | 333 W. Wacker Drive Chicago, IL 60606 | | Board Member | | 2005 Class II | | Formerly, Director, Northwestern Mutual Wealth Management Company; (2006-2013) retired (since 2004) as Chairman, JPMorgan Fleming Asset Management, President and CEO, Banc One Investment Advisors Corporation, and President, One Group Mutual Funds; prior thereto, Executive Vice President, Banc One Corporation and Chairman and CEO, Banc One Investment Management Group; Regent Emeritus, Member of Investment Committee, Luther College; member of the Wisconsin Bar Association; member of Board of Directors, Friends of Boerner Botanical Gardens; member of Board of Directors and Chair of Investment Committee, Greater Milwaukee Foundation; member of the Board of Directors (Milwaukee), College Possible. | | 206 |
Board Members & Officers (Unaudited) (continued)
| | Name, | | Position(s) Held | | Year First | | Principal | | Number |
| | Year of Birth | | with the Funds | | Elected or | | Occupation(s) | | of Portfolios |
| | & Address | | | | Appointed | | Including other | | in Fund Complex |
| | | | | | and Term(1) | | Directorships | | Overseen by |
| | | | | | | | During Past 5 Years | | Board Member |
| Independent Board Members (continued): | | | | | | |
| | | | | | | | | | |
| ■ | 333 West Wacker Drive Chicago, IL 60606 | | Board Member | | 2013 Class II | | Senior external advisor to the financial services practice of Deloitte Consulting LLP (since 2012); Member of Board of Directors of Core12 LLC (since 2008), a private firm which develops branding, marketing and communications strategies for clients; Chairman of the Board of Trustees of Marian University (since 2010 as trustee, 2011 as Chairman); Director of The Curran Center for Catholic American Studies (since 2009) and The President s Council, Fordham University (since 2010); formerly, Chief Executive Officer of ABN AMRO N.V. North America, and Global Head of its Financial Markets Division (2007-2008); prior senior positions held at ABN AMRO include Corporate Executive Vice President and Head of Global Markets-the Americas (2006-2007), CEO of Whole- sale Banking North America and Global Head of Foreign Exchange and Futures Markets (2001-2006), and Regional Commercial Treasurer and Senior Vice President Trading-North America (1996-2001); formerly, Trustee at St. Edmund Preparatory School in New York City. | | 206 |
| | | | | | | | | | |
| ■ | 333 W. Wacker Drive Chicago, IL 60606 | | Board Member | | 1997 Class I | | Formerly, Executive Director (1994-2012), Gaylord and Dorothy Donnelley Foundation (since 1994); prior thereto, Executive Director, Great Lakes Protection Fund (1990-1994). | | 206 |
| | | | | | | | | | |
| ■ | 333 W. Wacker Drive Chicago, IL 60606 | | Board Member | | 2007 Class I | | Director, Chicago Board Options Exchange (since 2006); Director, C2 Options Exchange, Incorporated (since 2009); formerly, Commissioner, New York State Commission on Public Authority Reform (2005-2010); formerly, Chair, New York Racing Association Oversight Board (2005-2007). | | 206 |
| | | | | | | | | | |
| ■ | 333 W. Wacker Drive Chicago, IL 60606 | | Board Member | | 2011 Class I | | Board Member, Mutual Fund Directors Forum; former governance consultant and non-profit board member; former Owner and President, Strategic Management Resources, Inc. a management consulting firm; former Member, Governing Board, Investment Company Institute’s Independent Directors Council; previously, held several executive positions in general management, marketing and human resources at IBM and The Pillsbury Company; Independent Director, First American Fund Complex (1987-2010) and Chair (1997-2010). | | 206 |
| | | | | | | | | | |
| ■ | 333 W. Wacker Drive Chicago, IL 60606 | | Board Member | | 2008 Class II | | Managing Partner, Promus Capital (since 2008); Director, Fulcrum IT Service LLC (since 2010), Quality Control Corporation (since 2012) and LogicMark LLC (since 2012); formerly, Director, Legal & General Investment Management America, Inc. (2008-2013); formerly, CEO and President, Northern Trust Global Investments (2004-2007); Executive Vice President, Quantitative Management & Securities Lending (2000-2004); prior thereto, various positions with Northern Trust Company (since 1994); member: Chicago Fellowship Board (since 2005), Catalyst Schools of Chicago Board (since 2008) and Chairman, and Mather Foundation Board (since 2012), and a member of its investment committee; formerly, Member, Northern Trust Mutual Funds Board (2005-2007), Northern Trust Global Investments Board (2004-2007), Northern Trust Japan Board (2004-2007), Northern Trust Securities Inc. Board (2003-2007) and Northern Trust Hong Kong Board (1997-2004). | | 206 |
| | Name, | | Position(s) Held | | Year First | | Principal | | Number |
| | Year of Birth | | with the Funds | | Elected or | | Occupation(s) | | of Portfolios |
| | & Address | | | | Appointed | | Including other | | in Fund Complex |
| | | | | | and Term(1) | | Directorships | | Overseen by |
| | | | | | | | During Past 5 Years | | Board Member |
| | | | | | | | | | |
| Interested Board Members: | | | | | | | | |
| | | | | | | | | | |
| ■ | 333 W. Wacker Drive Chicago, IL 60606 | | Board Member | | 2013 Class II | | Senior Executive Vice President, Global Structured Products (since 2010); Co-President of Nuveen Fund Advisors, LLC (since 2011); President (since 2011), formerly, Managing Director (2010-2011) of Nuveen Commodities Asset Management, LLC; Board Member of the Chicago Symphony Orchestra and of Gilda s Club Chicago; formerly, Executive Vice President, U.S. Structured Products, of Nuveen Investments, Inc. (1999-2010). | | 135 |
| | | | | | | | | | |
| ■ | THOMAS S. SCHREIER, JR. (2) 1962333 W. Wacker Drive Chicago, IL 60606 | | Board Member | | 2013 Class III | | Vice Chairman, Wealth Management of Nuveen Investments, Inc. (since 2011); Co-President of Nuveen Fund Advisors, LLC; Chairman of Nuveen Asset Management, LLC (since 2011); Co-Chief Executive Officer of Nuveen Securities, LLC (since 2011); Member of Board of Governors and Chairman’s Council of the Investment Company Institute; formerly, Chief Executive Officer (2000-2010) and Chief Investment Officer (2007-2010) of FAF Advisors, Inc.; formerly, President of First American Funds (2001-2010). | | 135 |
| | Name, | | Position(s) Held | | Year First | | Principal | | Number |
| | Year of Birth | | with the Funds | | Elected or | | Occupation(s) | | of Portfolios |
| | and Address | | | | Appointed(3) | | During Past 5 Years | | in Fund Complex |
| | | | | | | | | | Overseen |
| | | | | | | | | | by Officer |
| | | | | | | | | | |
| Officers of the Funds: | | | | | | | | |
| | | | | | | | | | |
| ■ | 333 W. Wacker Drive Chicago, IL 60606 | | Chief Administrative Officer | | 1988 | | Managing Director (since 2002), and Assistant Secretary of Nuveen Securities, LLC; Managing Director (since 2004) and Assistant Secretary (since 1994) of Nuveen Investments, Inc.; Managing Director (since 2002), Assistant Secretary (since 1997) and Co-General Counsel (since 2011) of Nuveen Fund Advisors, LLC; Managing Director, Assistant Secretary and Associate General Counsel of Nuveen Asset Management, LLC (since 2011); Managing Director, Associate General Counsel and Assistant Secretary, of Symphony Asset Management LLC (since 2003); Vice President and Assistant Secretary of NWQ Investment Management Company, LLC (since 2002), Nuveen Investments Advisers Inc. (since 2002), Santa Barbara Asset Management, LLC (since 2006), and of Winslow Capital Management, LLC, (since 2010); Vice President and Assistant Secretary (since 2013), formerly, Chief Administrative Officer and Chief Compliance Officer (2006-2013) of Nuveen Commodities Asset Management, LLC; Chartered Financial Analyst. | | 206 |
| | | | | | | | | | |
| ■ | CEDRIC H. ANTOSIEWICZ 1962333 W. Wacker Drive Chicago, IL 60606 | | Vice President | | 2007 | | Managing Director of Nuveen Securities, LLC. | | 103 |
| | | | | | | | | | |
| ■ | 333 W. Wacker Drive Chicago, IL 60606 | | Vice President | | 2009 | | Executive Vice President (since 2008) of Nuveen Investments, Inc. and of Nuveen Fund Advisors, LLC (since 2011); Managing Director-Investment Services of Nuveen Commodities Asset Management, LLC (since August 2011), previously, Head of Institutional Asset Management (2007-2008) of Bear Stearns Asset Management; Head of Institutional Asset Management (1986-2007) of Bank of NY Mellon; Chartered Financial Analyst. | | 206 |
Board Members & Officers (Unaudited) (continued)
| | Name, | | Position(s) Held | | Year First | | Principal | | Number |
| | Year of Birth | | with the Funds | | Elected or | | Occupation(s) | | of Portfolios |
| | and Address | | | | Appointed(3) | | During Past 5 Years | | in Fund Complex |
| | | | | | | | | | Overseen |
| | | | | | | | | | by Officer |
| | | | | | | | | | |
| Officers of the Funds (continued): | | | | | | | | |
| | | | | | | | | | |
| ■ | 333 W. Wacker Drive Chicago, IL 60606 | | Vice President | | 1998 | | Managing Director (since 2005) of Nuveen Fund Advisors, LLC and Nuveen Securities, LLC (since 2004). | | 206 |
| | | | | | | | | | |
| ■ | 333 W. Wacker Drive Chicago, IL 60606 | | Vice President and Controller | | 1998 | | Senior Vice President (2010-2011), formerly, Vice President (2005-2010) and Funds Controller of Nuveen Securities, LLC; Senior Vice President (since 2013), formerly, Vice President of Nuveen Fund Advisors, LLC; Chief Financial Officer of Nuveen Commodities Asset Management, LLC (since 2010); Certified Public Accountant. | | 206 |
| | | | | | | | | | |
| ■ | 333 W. Wacker Drive Chicago, IL 60606 | | Vice President and Treasurer | | 2009 | | Managing Director, Corporate Finance & Development, Treasurer (since 2009) of Nuveen Securities, LLC; Managing Director and Treasurer (since 2009) of Nuveen Fund Advisors, LLC, Nuveen Investments Advisers, Inc., Nuveen Investments Holdings Inc. and (since 2011) Nuveen Asset Management, LLC; Vice President and Treasurer of NWQ Investment Management Company, LLC, Tradewinds Global Investors, LLC, Symphony Asset Management LLC and Winslow Capital Management, LLC.; Vice President of Santa Barbara Asset Management, LLC; formerly, Treasurer (2006-2009), Senior Vice President (2008-2009), previously, Vice President (2006-2008) of Janus Capital Group, Inc.; formerly, Senior Associate in Morgan Stanley’s Global Financial Services Group (2000-2003); Chartered Accountant Designation. | | 206 |
| | | | | | | | | | |
| ■ | 333 W. Wacker Drive Chicago, IL 60606 | | Chief Compliance Officer and Vice President | | 2003 | | Senior Vice President (since 2008) and Assistant Secretary (since 2003) of Nuveen Fund Advisors, LLC; Senior Vice President (since 2008) of Nuveen Investment Holdings, Inc.; formerly, Senior Vice President (2008-2011) of Nuveen Securities, LLC. | | 206 |
| | | | | | | | | | |
| ■ | 333 W. Wacker Drive Chicago, IL 60606 | | Vice President | | 2002 | | Senior Vice President (since 2010), formerly, Vice President (2005-2010)of Nuveen Fund Advisors, LLC. | | 206 |
| | | | | | | | | | |
| ■ | 333 W. Wacker Drive Chicago, IL 60606 | | Vice President and Secretary | | 2007 | | Managing Director and Assistant Secretary (since 2008), Nuveen Securities, LLC; Managing Director (since 2008), Assistant Secretary (since 2007) and Co-General Counsel (since 2011) of Nuveen Fund Advisors, LLC; Managing Director, Assistant Secretary and Associate General Counsel (since 2011) of Nuveen Asset Management, LLC; Managing Director (since 2008), and Assistant Secretary, Nuveen Investment Holdings, Inc.; Vice President (since 2007) and Assistant Secretary of Nuveen Investments Advisers Inc., NWQ Investment Management Company, LLC, NWQ Holdings, LLC, Symphony Asset Management LLC, Santa Barbara Asset Management, LLC, and of Winslow Capital Management, LLC. (since 2010); Vice President and Secretary (since 2010) of Nuveen Commodities Asset Management, LLC. | | 206 |
| | Name, | | Position(s) Held | | Year First | | Principal | | Number |
| | Year of Birth | | with the Funds | | Elected or | | Occupation(s) | | of Portfolios |
| | and Address | | | | Appointed(3) | | During Past 5 Years | | in Fund Complex |
| | | | | | | | | | Overseen |
| | | | | | | | | | by Officer |
| | | | | | | | | | |
| Officers of the Funds (continued): | | | | | | |
| | | | | | | | | | |
| ■ | KATHLEEN L. PRUDHOMME 1953901 Marquette Avenue Minneapolis, MN 55402 | | Vice President and Assistant Secretary | | 2011 | | Managing Director, Assistant Secretary and Co-General Counsel (since 2011) of Nuveen Fund Advisors, LLC; Managing Director, Assistant Secretary and Associate General Counsel (since 2011) of Nuveen Asset Management, LLC; Managing Director and Assistant Secretary (since 2011) of Nuveen Securities, LLC; formerly, Deputy General Counsel, FAF Advisors, Inc. (2004-2010). | | 206 |
| | | | | | | | | | |
| ■ | 333 West Wacker Drive Chicago, IL 60606 | | Vice President and Assistant Secretary | | 2013 | | Fund Tax Director for Nuveen Funds (since May, 2013); previously, Vice President of Morgan Stanley Investment Management, Inc., Assistant Treasurer of the Morgan Stanley Funds (from 2010 to 2013); Tax Director at PricewaterhouseCoopers LLP (from 2008 to 2010). | | 206 |
| (1) | For Dividend Advantage (NAD), Dividend Advantage 2 (NXZ) and Dividend Advantage 3 (NZF), the Board of Trustees is divided into three classes, Class I, Class II, and Class III, with each being elected to serve until the third succeeding annual shareholders’ meeting subsequent to its election or thereafter in each case when its respective successors are duly elected or appointed, except two board members are elected by the holders of Preferred Shares to serve until the next annual shareholders’ meeting subsequent to its election or thereafter in each case when its respective successors are duly elected or appointed. For Performance Plus (NPP), Municipal Advantage (NMA) and Market Opportunity (NMO), the Board Members serve a one year term to serve until the next annual meeting or until their successors shall have been duly elected and qualified. The year first elected or appointed represents the year in which the board member was first elected or appointed to any fund in the Nuveen Complex. |
| (2) | “Interested person” as defined in the 1940 Act, by reason of his position with Nuveen Investments, Inc. and certain of its subsidiaries, which are affiliates of the Nuveen Funds. |
| (3) | Officers serve one year terms through August of each year. The year first elected or appointed represents the year in which the Officer was first elected or appointed to any fund in the Nuveen Complex. |
| Annual Investment Management |
| | Agreement Approval Process (Unaudited) |
The Board of Trustees or Directors (as the case may be) (each, a “Board” and each Trustee or Director, a “Board Member”) of the Funds, including the Board Members who are not parties to the Funds’ advisory or sub-advisory agreements or “interested persons” of any such parties (the “Independent Board Members”), is responsible for approving the advisory agreements (each, an “Investment Management Agreement”) between each Fund and Nuveen Fund Advisors, LLC (the “Adviser”) and the sub-advisory agreements (each, a “Sub-Advisory Agreement”) between the Adviser and Nuveen Asset Management, LLC (the “Sub-Adviser”) (the Investment Management Agreements and the Sub-Advisory Agreements are referred to collectively as the “Advisory Agreements”) and their periodic continuation. Pursuant to the Investment Company Act of 1940, as amended (the “1940 Act”), the Board is required to consider the continuation of the Advisory Agreements on an annual basis. Accordingly, at an in-person meeting held on May 20-22, 2013 (the “May Meeting”), the Board, including a majority of the Independent Board Members, considered and approved the continuation of the Advisory Agreements for the Funds for an additional one-year period.
In preparation for its considerations at the May Meeting, the Board requested and received extensive materials prepared in connection with the review of the Advisory Agreements. The materials provided a broad range of information regarding the Funds, the Adviser and the Sub-Adviser (the Adviser and the Sub-Adviser are collectively, the “Fund Advisers” and each, a “Fund Adviser”). As described in more detail below, the information provided included, among other things, a review of Fund performance, including Fund investment performance assessments against peer groups and appropriate benchmarks; a comparison of Fund fees and expenses relative to peers; a description and assessment of shareholder service levels for the Funds; a summary of the performance of certain service providers; a review of product initiatives and shareholder communications; and an analysis of the Adviser’s profitability with comparisons to comparable peers in the managed fund business. As part of its annual review, the Board also held a separate meeting on April 17-18, 2013, to review the Funds’ investment performance and consider an analysis provided by the Adviser of the Sub-Adviser which generally evaluated the Sub-Adviser’s investment team, investment mandate, organizational structure and history, investment philosophy and process, performance of the applicable Fund, and significant changes to the foregoing. As a result of its review of the materials and discussions, the Board presented the Adviser with questions and the Adviser responded.
The materials and information prepared in connection with the annual review of the Advisory Agreements supplement the information and analysis provided to the Board during the year. In this regard, throughout the year, the Board, acting directly or through its committees, regularly reviews the performance and various services provided by the Adviser and the Sub-Adviser. The Board meets at least quarterly as well as at other times as the need arises. At its quarterly meetings, the Board reviews reports by the Adviser regarding, among other things, fund performance, fund expenses, premium and discount levels of closed-end funds, the performance of the investment teams, and compliance, regulatory and risk management matters. In addition to regular reports, the Adviser provides special reports to the Board or a committee thereof from time to time to enhance the Board’s understanding of various topics that impact some or all the Nuveen funds (such as accounting and financial statement presentations of the various forms of leverage that may be used by a closed-end fund or an update on the valuation policies and procedures), to update the Board on regulatory developments impacting the investment company industry or to update the Board on the business
plans or other matters impacting the Adviser. The Board also meets with key investment personnel managing the fund portfolios during the year. In October 2011, the Board also created two standing committees (the Open-End Fund Committee and the Closed-End Fund Committee) to assist the full Board in monitoring and gaining a deeper insight into the distinctive business practices of open-end and closed-end funds. These Committees meet prior to each quarterly Board meeting, and the Adviser provides presentations to these Committees permitting them to delve further into specific matters or initiatives impacting the respective product line.
In addition, the Board continues its program of seeking to have the Board Members or a subset thereof visit each sub-adviser to the Nuveen funds at least once over a multiple year rotation, meeting with key investment and business personnel. In this regard, the Independent Board Members visited certain of the Sub-Adviser’s investment teams in Minneapolis in September 2012, and the Sub-Adviser’s municipal team in November 2012. In addition, the ad hoc Securities Lending Committee of the Board met with certain service providers and the Audit Committee of the Board made a site visit to three pricing service providers.
The Board considers the information provided and knowledge gained at these meetings and visits during the year when performing its annual review of the Advisory Agreements. The Independent Board Members also are assisted throughout the process by independent legal counsel. Counsel provided materials describing applicable law and the duties of directors or trustees in reviewing advisory contracts. During the course of the year and during their deliberations regarding the review of advisory contracts, the Independent Board Members met with independent legal counsel in executive sessions without management present. In addition, it is important to recognize that the management arrangements for the Nuveen funds are the result of many years of review and discussion between the Independent Board Members and fund management and that the Board Members’ conclusions may be based, in part, on their consideration of fee arrangements and other factors developed in previous years.
The Board considered all factors it believed relevant with respect to each Fund, including among other factors: (a) the nature, extent and quality of the services provided by the Fund Advisers, (b) the investment performance of the Fund and Fund Advisers, (c) the advisory fees and costs of the services to be provided to the Fund and the profitability of the Fund Advisers, (d) the extent of any economies of scale, (e) any benefits derived by the Fund Advisers from the relationship with the Fund and (f) other factors. Each Board Member may have accorded different weight to the various factors in reaching his or her conclusions with respect to a Fund’s Advisory Agreements. The Independent Board Members did not identify any single factor as all important or controlling. The Independent Board Members’ considerations were instead based on a comprehensive consideration of all the information presented. The principal factors considered by the Board and its conclusions are described below.
A. Nature, Extent and Quality of Services
In considering renewal of the Advisory Agreements, the Independent Board Members considered the nature, extent and quality of the Fund Adviser’s services, including advisory services and the resulting Fund performance and administrative services. The Independent Board Members further considered the overall reputation and capabilities of the Adviser and its affiliates, the commitment of the Adviser to provide high quality service to the Funds, their overall confidence in the capability and integrity of the Adviser and its staff and the Adviser’s responsiveness to questions and concerns raised by them. The Independent Board Members reviewed materials outlining, among other things, the Fund Adviser’s organization and business; the types of services that the Fund Adviser or its affiliates provide to the Funds; the performance record of the applicable Fund (as described in further detail below); and any applicable initiatives Nuveen had taken for the closed-end fund product line.
Annual Investment Management Agreement Approval Process (Unaudited) (continued)
In considering advisory services, the Board recognized that the Adviser provides various oversight, administrative, compliance and other services for the Funds and the Sub-Adviser generally provides the portfolio investment management services to the Funds. In reviewing the portfolio management services provided to each Fund, the Board reviewed the materials provided by the Nuveen Investment Services Oversight Team analyzing, among other things, the Sub-Adviser’s investment team and changes thereto, organization and history, assets under management, the investment team’s philosophy and strategies in managing the Fund, developments affecting the Sub-Adviser or Fund and Fund performance. The Independent Board Members also reviewed portfolio manager compensation arrangements to evaluate each Fund Adviser’s ability to attract and retain high quality investment personnel, preserve stability, and reward performance but not provide an inappropriate incentive to take undue risks. In addition, the Board considered the Adviser’s execution of its oversight responsibilities over the Sub-Adviser. Given the importance of compliance, the Independent Board Members also considered Nuveen’s compliance program, including the report of the chief compliance officer regarding the Funds’ compliance policies and procedures; the resources dedicated to compliance; and the record of compliance with the policies and procedures. Given the Adviser’s emphasis on business risk, the Board also appointed an Independent Board Member as a point person to review and keep the Board apprised of developments in this area during the year.
In addition to advisory services, the Board considered the quality and extent of administrative and other non-investment advisory services the Adviser and its affiliates provide to the Funds, including product management, investment services (such as oversight of investment policies and procedures, risk management, and pricing), fund administration, oversight of service providers, shareholder services and communications, administration of Board relations, regulatory and portfolio compliance, legal support, managing leverage and promoting an orderly secondary market for common shares. The Board further recognized Nuveen’s additional investments in personnel, including in compliance and risk management.
In reviewing the services provided, the Board considered the new services and service enhancements that the Adviser has implemented since the various advisory agreements were last reviewed. In reviewing the activities of 2012, the Board recognized the Adviser’s focus on product rationalization for both closed-end and open-end funds during the year, consolidating certain Nuveen funds through mergers that were designed to improve efficiencies and economies of scale for shareholders, repositioning various Nuveen funds through updates in their investment policies and guidelines with the expectation of bringing greater value to shareholders, and liquidating certain Nuveen funds. The Board recognized the Adviser’s significant investment in technology initiatives to, among other things, create a central repository for fund and other Nuveen product data, develop a group within the Adviser designed to handle and analyze fund performance data, and implement a data system to support the risk oversight group. The Board also recognized the enhancements in the valuation group within the Adviser, including upgrading the team and process and automating certain basic systems, and in the compliance group with the addition of personnel, particularly within the testing group. With the advent of the Open-End Fund Committee and Closed-End Fund Committee, the Board also noted the enhanced support and comprehensive in-depth presentations provided by the Adviser to these committees.
In addition to the foregoing actions, the Board also considered other initiatives related to the Nuveen closed-end funds, including the significant level of oversight and administration necessary to manage leverage that has become increasingly varied and complex and the ongoing redesign of technology systems to manage and track the various forms of leverage; continued capital management services, including developing shelf offering programs for various funds; the implementation of projects designed to enhance data integrity for information published on the web and to increase the use of data received from third parties to gain market intelligence; and the continued communication efforts with shareholders, fund analysts and financial advisers. With respect to the latter, the Independent Board Members noted Nuveen’s continued commitment to supporting the secondary market for the common shares of its
closed-end funds through a comprehensive secondary market communication program and campaigns designed to raise investor and analyst awareness and understanding of closed-end funds. Nuveen’s support services included, among other things: developing materials covering the Nuveen closed-end fund product line and educational materials regarding closed-end funds; designing and executing various marketing campaigns; supporting and promoting the alternative minimum tax (AMT)-free funds; sponsoring and participating in conferences; communicating with closed-end fund analysts and financial advisers throughout the year; providing marketing and product updates for the closed-end funds; and maintaining and enhancing a closed-end fund website.
Based on their review, the Independent Board Members found that, overall, the nature, extent and quality of services provided to the respective Funds under each applicable Advisory Agreement were satisfactory.
B. The Investment Performance of the Funds and Fund Advisers
The Board, including the Independent Board Members, considered the performance history of each Fund over various time periods. The Board reviewed reports, including an analysis of the Funds’ performance and the applicable investment team. In general, in considering a fund’s performance, the Board recognized that a fund’s performance can be reviewed through various measures including the fund’s absolute return, the fund’s return compared to the performance of other peer funds, and the fund’s performance compared to its respective benchmark. Accordingly, the Board reviewed, among other things, each Fund’s historic investment performance as well as information comparing the Fund’s performance information with that of other funds (the “Performance Peer Group”) and with recognized and/or customized benchmarks (i.e., generally benchmarks derived from multiple recognized benchmarks) for the quarter, one-, three- and five-year periods ending December 31, 2012 as well as performance information reflecting the first quarter of 2013. In addition, with respect to closed-end funds (such as the Funds), the Independent Board Members also reviewed historic premium and discount levels, including a summary of actions taken to address or discuss other developments affecting the secondary market discounts of various funds. This information supplemented the fund performance information provided to the Board at each of its quarterly meetings.
In evaluating performance, the Board recognized several factors that may impact the performance data as well as the consideration given to particular performance data. The Board recognized that the performance data reflects a snapshot of time, in this case as of the end of the most recent calendar year or quarter. The Board noted that selecting a different performance period could derive significantly different results. Further, the Board recognized that it is possible that long-term performance can be adversely affected by even one period of significant underperformance so that a single investment decision or theme has the ability to disproportionately affect long-term performance. The Independent Board Members also noted that the investment experience of a particular shareholder in the Nuveen funds will vary depending on when such shareholder invests in the applicable fund, the class held (if multiple classes are offered in a fund) and the performance of the fund (or respective class) during that shareholder’s investment period.
With respect to the comparative performance information, the Board recognized that the usefulness of comparative performance data as a frame of reference to measure a fund’s performance may be limited because the Performance Peer Group, among other things, does not adequately reflect the objectives and strategies of the fund, has a different investable universe, or the composition of the peer set may be limited in size or number as well as other factors. In this regard, the Board noted that the Adviser classified, in relevant part, the Performance Peer Groups of certain funds as having significant differences from the funds but to still be somewhat relevant while the Performance Peer Groups of other funds were classified as having such significant differences as to be irrelevant. Accordingly, while the Board is cognizant of the relative performance of a fund’s peer set and/or benchmark(s), the Board evaluated fund performance in light of the respective fund’s investment objectives, investment parameters and guidelines and considered that the variations between the objectives and investment parameters or guidelines of the funds with their peers
Annual Investment Management Agreement Approval Process (Unaudited) (continued)
and/or benchmarks result in differences in performance results. In addition, with respect to any Nuveen funds for which the Board has identified performance concerns, the Board monitors such funds closely until performance improves, discusses with the Adviser the reasons for such results, considers those steps necessary or appropriate to address such issues, and reviews the results of any efforts undertaken.
In considering the performance data for the Funds, the Independent Board Members observed that the Nuveen Dividend Advantage Municipal Fund (the “Dividend Advantage Fund”) and the Nuveen Performance Plus Municipal Fund, Inc. (the “Performance Plus Fund”) demonstrated generally favorable performance in comparison to peers. In this regard, the Dividend Advantage Fund performed in the second quartile over various periods and although the Performance Plus Fund performed in the third quartile for the three-year period, such Fund performed in the second quartile for the one- and five-year periods and outperformed its benchmark for the one-, three- and five-year periods. In addition, the Independent Board Members observed that each of the other Funds had satisfactory performance in comparison to peers. In this regard, the Nuveen Dividend Advantage Municipal Fund 3, the Nuveen Municipal Advantage Fund, Inc. (the “Municipal Advantage Fund”) and the Nuveen Municipal Market Opportunity Fund, Inc. (the “Municipal Market Opportunity Fund”) each performed in the second or third quartile over various periods and outperformed their respective benchmarks for the one-, three- and five-year periods. With respect to the Nuveen Dividend Advantage Municipal Fund 2, although such Fund was in the third quartile for the three- and five-year periods, it was in the first quartile for the one-year period and outperformed its benchmark for the one-, three- and five-year periods.
Based on their review, the Independent Board Members determined that each Fund’s investment performance had been satisfactory.
C. Fees, Expenses and Profitability
1. Fees and Expenses
The Board evaluated the management fees and expenses of each Fund reviewing, among other things, such Fund’s gross management fees, net management fees and net expense ratio in absolute terms as well as compared to the fees and expenses of a comparable universe of funds provided by an independent fund data provider (the “Peer Universe”) and any expense limitations.
The Independent Board Members further reviewed the methodology regarding the construction of the applicable Peer Universe. In reviewing the comparisons of fee and expense information, the Independent Board Members took into account that in certain instances various factors such as: the limited size and particular composition of the Peer Universe (including the inclusion of other Nuveen funds in the peer set); expense anomalies; changes in the funds comprising the Peer Universe from year to year; levels of reimbursement or fee waivers; the timing of information used; and the differences in the type and use of leverage may impact the comparative data, thereby limiting somewhat the ability to make a meaningful comparison with peers.
In reviewing the fee schedule for a Fund, the Independent Board Members also considered the fund-level and complex-wide breakpoint schedules (described in further detail below) and any fee waivers and reimbursements provided by Nuveen. In reviewing fees and expenses (excluding leverage costs and leveraged assets, as applicable), the Board considered the expenses and fees to be higher if they were over 10 basis points higher, slightly higher if they were approximately 6 to 10 basis points higher, in line if they were within approximately 5 basis points higher than the peer average and below if they were below the peer average of the Peer Universe. In reviewing the reports, the Board noted that the majority of the Nuveen funds were at, close to or below their peer set average based on the net total expense ratio.
The Independent Board Members noted that the Funds other than the Municipal Advantage Fund and the Municipal Market Opportunity Fund had net management fees that were in line with their respective peer averages and net expense ratios (including fee waivers and expense reimbursements) that were below their respective peer averages. The Independent Board Members observed that the Municipal Advantage Fund and the Municipal Market Opportunity Fund had net management fees that were slightly higher than their respective peer averages, but net expense ratios that were below their respective peer averages.
Based on their review of the fee and expense information provided, the Independent Board Members determined that each Fund’s management fees to a Fund Adviser were reasonable in light of the nature, extent and quality of services provided to the Fund.
2. Comparisons with the Fees of Other Clients
The Board recognized that all Nuveen funds have a sub-adviser (which, in the case of the Funds, is an affiliated sub-adviser), and therefore, the overall fund management fee can be divided into two components, the fee retained by the Adviser and the fee paid to the sub-adviser. In general terms, the fee to the Adviser reflects the administrative services it provides to support the funds, and while some administrative services may occur at the sub-adviser level, the fee generally reflects the portfolio management services provided by the sub-adviser. The Independent Board Members reviewed information regarding the nature of services provided by the Adviser, including through the Sub-Adviser, and the range of fees and average fee the Sub-Adviser assessed for such services to other clients. Such other clients include municipal separately managed accounts and passively managed exchange traded funds (ETFs) sub-advised by the Adviser. In evaluating the comparisons of fees, the Independent Board Members noted that the fee rates charged to the Funds and other clients vary, among other things, because of the different services involved and the additional regulatory and compliance requirements associated with registered investment companies, such as the Funds. Accordingly, the Independent Board Members considered the differences in the product types, including, but not limited to, the services provided, the structure and operations, product distribution and costs thereof, portfolio investment policies, investor profiles, account sizes and regulatory requirements. The Independent Board Members noted, in particular, that the range of services provided to the Funds (as discussed above) is much more extensive than that provided to separately managed accounts. Many of the additional administrative services provided by the Adviser are not required for institutional clients. Given the inherent differences in the various products, particularly the extensive services provided to the Funds, the Independent Board Members believe such facts justify the different levels of fees.
3. Profitability of Fund Advisers
In conjunction with their review of fees, the Independent Board Members also considered the profitability of Nuveen for its advisory activities and its financial condition. The Independent Board Members reviewed the revenues and expenses of Nuveen’s advisory activities for the last two calendar years, the allocation methodology used in preparing the profitability data and an analysis of the key drivers behind the changes in revenues and expenses that impacted profitability in 2012. The Independent Board Members noted this information supplemented the profitability information requested and received during the year to help keep them apprised of developments affecting profitability (such as changes in fee waivers and expense reimbursement commitments). In this regard, the Independent Board Members noted that they have an Independent Board Member serve as a point person to review and keep them apprised of changes to the profitability analysis and/or methodologies during the year. The Independent Board Members also considered Nuveen’s revenues for advisory activities, expenses, and profit margin compared to that of various unaffiliated management firms with comparable assets under management (based on asset size and asset composition).
Annual Investment Management Agreement Approval Process (Unaudited) (continued)
In reviewing profitability, the Independent Board Members recognized the Adviser’s continued investment in its business to enhance its services, including capital improvements to investment technology, updated compliance systems, and additional personnel. In addition, in evaluating profitability, the Independent Board Members also recognized the subjective nature of determining profitability which may be affected by numerous factors including the allocation of expenses and that various allocation methodologies may each be reasonable but yield different results. Further, the Independent Board Members recognized the difficulties in making comparisons as the profitability of other advisers generally is not publicly available and the profitability information that is available for certain advisers or management firms may not be representative of the industry and may be affected by, among other things, the adviser’s particular business mix, capital costs, types of funds managed and expense allocations. Notwithstanding the foregoing, the Independent Board Members reviewed Nuveen’s methodology and assumptions for allocating expenses across product lines to determine profitability. Based on their review, the Independent Board Members concluded that the Adviser’s level of profitability for its advisory activities was reasonable in light of the services provided.
With respect to sub-advisers affiliated with Nuveen, including the Sub-Adviser, the Independent Board Members reviewed the sub-adviser’s revenues, expenses and profitability margins (pre- and post-tax) for its advisory activities and the methodology used for allocating expenses among the internal sub-advisers. Based on their review, the Independent Board Members were satisfied that the Sub-Adviser’s level of profitability was reasonable in light of the services provided.
In evaluating the reasonableness of the compensation, the Independent Board Members also considered other amounts paid to a Fund Adviser by the Funds as well as indirect benefits (such as soft dollar arrangements), if any, the Fund Adviser and its affiliates receive, or are expected to receive, that are directly attributable to the management of the Funds. See Section E below for additional information on indirect benefits a Fund Adviser may receive as a result of its relationship with the Funds. Based on their review of the overall fee arrangements of each Fund, the Independent Board Members determined that the advisory fees and expenses of the respective Fund were reasonable.
D. Economies of Scale and Whether Fee Levels Reflect These Economies of Scale
With respect to economies of scale, the Independent Board Members have recognized the potential benefits resulting from the costs of a fund being spread over a larger asset base, although economies of scale are difficult to measure and predict with precision, particularly on a fund-by-fund basis. One method to help ensure the shareholders share in these benefits is to include breakpoints in the advisory fee schedule. Generally, management fees for funds in the Nuveen complex are comprised of a fund-level component and a complex-level component, subject to certain exceptions. Accordingly, the Independent Board Members reviewed and considered the applicable fund-level breakpoints in the advisory fee schedules that reduce advisory fees as asset levels increase. Further, the Independent Board Members noted that although closed-end funds may from time-to-time make additional share offerings, the growth of their assets will occur primarily through the appreciation of such funds’ investment portfolio.
In addition to fund-level advisory fee breakpoints, the Board also considered the Funds’ complex-wide fee arrangement. Pursuant to the complex-wide fee arrangement, the fees of the funds in the Nuveen complex are generally reduced as the assets in the fund complex reach certain levels. The complex-wide fee arrangement seeks to provide the benefits of economies of scale to fund shareholders when total fund complex assets increase, even if assets of a particular fund are unchanged or have decreased. The approach reflects the notion that some of Nuveen’s costs are attributable to services provided to all its funds in the complex and therefore all funds benefit if these costs are spread over a larger asset base. In addition, with the acquisition of the funds previously advised by FAF Advisors, Inc. at the end of 2010, the Board noted that a portion of such funds’ assets at the time of acquisition were deemed eligible to be
included in the complex-wide fee calculation in order to deliver fee savings to shareholders in the combined complex and such funds were subject to differing complex-level fee rates.
Based on their review, the Independent Board Members concluded that the breakpoint schedules and complex-wide fee arrangement were acceptable and reflect economies of scale to be shared with shareholders when assets under management increase.
E. Indirect Benefits
In evaluating fees, the Independent Board Members received and considered information regarding potential “fall out” or ancillary benefits the respective Fund Adviser or its affiliates may receive as a result of its relationship with each Fund. In this regard, the Independent Board Members considered any revenues received by affiliates of the Adviser for serving as co-manager in initial public offerings of new closed-end funds as well as revenues received in connection with secondary offerings.
In addition to the above, the Independent Board Members considered whether the Fund Advisers received any benefits from soft dollar arrangements whereby a portion of the commissions paid by a Fund for brokerage may be used to acquire research that may be useful to the Fund Adviser in managing the assets of the Funds and other clients. The Funds’ portfolio transactions are determined by the Sub-Adviser. Accordingly, the Independent Board Members considered that the Sub-Adviser may benefit from its soft dollar arrangements pursuant to which it receives research from brokers that execute the Funds’ portfolio transactions. With respect to fixed income securities, however, the Board recognized that such securities generally trade on a principal basis that does not generate soft dollar credits. Nevertheless, the Sub-Adviser may also engage in soft dollar arrangements on behalf of other clients, and the Funds as well as the Sub-Adviser may benefit from the research or other services received. Similarly, the Board recognized that the research received pursuant to soft dollar arrangements by the Sub-Adviser may also benefit a Fund and shareholders to the extent the research enhances the ability of the Sub-Adviser to manage the Fund. The Independent Board Members noted that the Sub-Adviser’s profitability may be somewhat lower if it did not receive the research services pursuant to the soft dollar arrangements and had to acquire such services directly.
Based on their review, the Independent Board Members concluded that any indirect benefits received by a Fund Adviser as a result of its relationship with the Funds were reasonable and within acceptable parameters.
F. Other Considerations
The Independent Board Members did not identify any single factor discussed previously as all-important or controlling. The Board Members, including the Independent Board Members, unanimously concluded that the terms of each Advisory Agreement are fair and reasonable, that the respective Fund Adviser’s fees are reasonable in light of the services provided to each Fund and that the Advisory Agreements be renewed.
| Reinvest Automatically, |
| | Easily and Conveniently |
Nuveen makes reinvesting easy. A phone call is all it takes to set up your reinvestment account.
Nuveen Closed-End Funds Automatic Reinvestment Plan
Nuveen Closed-End Fund allows you to conveniently reinvest distributions in additional Fund shares. By choosing to reinvest, you’ll be able to invest money regularly and automatically, and watch your investment grow through the power of compounding. Just like distributions in cash, there may be times when income or capital gains taxes may be payable on distributions that are reinvested. It is important to note that an automatic reinvestment plan does not ensure a profit, nor does it protect you against loss in a declining market.
Easy and convenient
To make recordkeeping easy and convenient, each month you’ll receive a statement showing your total distributions, the date of investment, the shares acquired and the price per share, and the total number of shares you own.
How shares are purchased
The shares you acquire by reinvesting will either be purchased on the open market or newly issued by the Fund. If the shares are trading at or above net asset value at the time of valuation, the Fund will issue new shares at the greater of the net asset value or 95% of the then-current market price. If the shares are trading at less than net as -set value, shares for your account will be purchased on the open market. If the Plan Agent begins purchasing Fund shares on the open market while shares are trading below net asset value, but the Fund’s shares subsequently trade at or above their net asset value before the Plan Agent is able to complete its purchases, the Plan Agent may cease open-market purchases and may invest the uninvested portion of the distribution in newly-issued Fund shares at a price equal to the greater of the shares’ net asset value or 95% of the shares’ market value on the last business day imme -diately prior to the purchase date. Distributions received to purchase shares in the open market will normally be invested shortly after the distribution payment date. No interest will be paid on distributions awaiting reinvestment. Because the market price of the shares may increase before purchases are completed, the average purchase price per share may exceed the market price at the time of valuation, resulting in the acquisition of fewer shares than if the distribution had been paid in shares issued by the Fund. A pro rata portion of any applicable brokerage commissions on open market purchases will be paid by Plan participants. These commissions usually will be lower than those charged on individual transactions.
Flexible
You may change your distribution option or withdraw from the Plan at any time, should your needs or situation change. You can reinvest whether your shares are registered in your name, or in the name of a brokerage firm, bank, or other nominee. Ask your investment advisor if his or her firm will participate on your behalf. Participants whose shares are registered in the name of one firm may not be able to transfer the shares to another firm and continue to participate in the Plan. The Fund reserves the right to amend or terminate the Plan at any time. Although the Fund reserves the right to amend the Plan to include a service charge payable by the participants, there is no direct service charge to participants in the Plan at this time.
Call today to start reinvesting distributions
For more information on the Nuveen Automatic Reinvestment Plan or to enroll in or withdraw from the Plan, speak with your financial advisor or call us at (800) 257-8787.
Glossary of Terms Used in this Report
■ | Auction Rate Bond: An auction rate bond is a security whose interest payments are adjusted periodically through an auction process, which process typically also serves as a means for buying and selling the bond. Auctions that fail to attract enough buyers for all the shares offered for sale are deemed to have “failed,” with current holders receiving a formula-based interest rate until the next scheduled auction. |
■ | Average Annual Total Return: This is a commonly used method to express an investment’s performance over a particular, usually multi-year time period. It expresses the return that would have been necessary each year to equal the investment’s actual cumulative performance (including change in NAV or market price and reinvested dividends and capital gains distributions, if any) over the time period being considered. |
■ | Duration: Duration is a measure of the expected period over which a bond’s principal and interest will be paid, and consequently is a measure of the sensitivity of a bond’s or bond fund’s value to changes when market interest rates change. Generally, the longer a bond’s or fund’s duration, the more the price of the bond or fund will change as interest rates change. |
■ | Effective Leverage: Effective leverage is a fund’s effective economic leverage, and includes both regulatory leverage (see Leverage) and the leverage effects of certain derivative investments in the fund’s portfolio. Currently, the leverage effects of Tender Option Bond (TOB) inverse floater holdings are included in effective leverage values, in addition to any regulatory leverage. |
■ | Forward Interest Rate Swap: A contractual agreement between two counterparties under which one party agrees to make periodic payments to the other for an agreed period of time based on a fixed rate, while the other party agrees to make periodic payments based on a floating rate of interest based on an underlying index. Alternatively, both series of cash flows to be exchanged could be calculated using floating rates of interest but floating rates that are based upon different underlying indexes. |
■ | Gross Domestic Product (GDP): The total market value of all final goods and services produced in a country/region in a given year, equal to total consumer, investment and government spending, plus the value of exports, minus the value of imports. |
■ | Inverse Floating Rate Securities: Inverse floating rate securities, also known as inverse floaters or tender option bonds (TOBs), are created by depositing a municipal bond, typically with a fixed interest rate, into a special purpose trust created by a broker-dealer. This trust, in turn, (a) issues floating rate certificates typically paying short-term tax-exempt interest rates to third parties in amounts equal to some fraction of the deposited bond’s par amount or market value, and (b) issues an inverse floating rate certificate (sometimes referred to as an “inverse floater”) to an investor (such as a fund) interested in gaining investment exposure to a long-term municipal bond. The income received by the holder of the inverse floater varies inversely with the short term rate paid to the floating rate certificates’ holders, and in most circumstances the holder of the inverse floater bears substantially all of the underlying bond’s downside investment risk. The holder of the inverse floater typically also benefits disproportionately from any potential appreciation of the underlying bond’s value. Hence, an inverse floater essentially represents an investment in the underlying bond on a leveraged basis. |
Glossary of Terms Used in this Report (Unaudited) (continued)
■ | Leverage: Leverage is created whenever a fund has investment exposure (both reward and/or risk) equivalent to more than 100% of the investment capital. |
■ | Lipper General & Insured Leveraged Municipal Debt Funds Classification Average: Calculated using the returns of all closed-end funds in this category. Lipper returns account for the effects of management fees and assume reinvestment of distributions, but do not reflect any applicable sales charges. |
■ | Net Asset Value (NAV) Per Share: A fund’s Net Assets is equal to its total assets (securities, cash, accrued earnings and receivables) less its total liabilities. NAV per share is equal to the fund’s Net Assets divided by its number of shares outstanding. |
■ | Pre-Refunding: Pre-Refunding, also known as advanced refundings or refinancings, is a procedure used by state and local governments to refinance municipal bonds to lower interest expenses. The issuer sells new bonds with a lower yield and uses the proceeds to buy U.S. Treasury securities, the interest from which is used to make payments on the higher-yielding bonds. Because of this collateral, pre-refunding generally raises a bond’s credit rating and thus its value. |
■ | Regulatory Leverage: Regulatory Leverage consists of preferred shares issued by or borrowings of a fund. Both of these are part of a fund’s capital structure. Regulatory leverage is sometimes referred to as “‘40 Act Leverage” and is subject to asset coverage limits set in the Investment Company Act of 1940. |
■ | S&P Municipal Bond Index: An unleveraged, market value-weighted index designed to measure the performance of the tax-exempt, investment-grade U.S. municipal bond market. Index returns assume reinvestment of distributions, but do not reflect any applicable sales charges or management fees. |
■ | Total Investment Exposure: Total investment exposure is a fund’s assets managed by the Adviser that are attributable to financial leverage. For these purposes, financial leverage includes a fund’s use of preferred stock and borrowings and investments in the residual interest certificates (also called inverse floating rate securities) in tender option bond (TOB) trusts, including the portion of assets held by a TOB trust that has been effectively financed by the trust’s issuance of floating rate securities. |
■ | Zero Coupon Bond: A zero coupon bond does not pay a regular interest coupon to its holders during the life of the bond. Income to the holder of the bond comes from accretion of the difference between the original purchase price of the bond at issuance and the par value of the bond at maturity and is effectively paid at maturity. The market prices of zero coupon bonds generally are more volatile than the market prices of bonds that pay interest periodically. |
Additional Fund Information
| Board of Directors/Trustees | | | | |
| William Adams IV* | Robert P. Bremner | Jack B. Evans | William C. Hunter | David J. Kundert John K. Nelson |
| William J. Schneider | Thomas S. Schreier, Jr.* | Judith M. Stockdale | Carole E. Stone | Virginia L. Stringer Terence J. Toth |
| | | | | |
| * Interested Board Member. | | | |
| | | | |
| | | | | |
| Fund Manager | Custodian | Legal Counsel | Independent Registered | Transfer Agent and |
| Nuveen Fund Advisors, LLC | State Street Bank | Chapman and Cutler LLP | Public Accounting Firm | Shareholder Services |
| 333 West Wacker Drive | & Trust Company | Chicago, IL 60603 | Ernst & Young LLP | State Street Bank |
| Chicago, IL 60606 | Boston, MA 02111 | | Chicago, IL 60606 | & Trust Company |
| | | | | Nuveen Funds |
| | | | | P.O. Box 43071 |
| | | | | Providence, RI 02940-3071 |
| | | | | (800) 257-8787 |
Quarterly Form N-Q Portfolio of Investments Information
Each Fund is required to file its complete schedule of portfolio holdings with the Securities and Exchange Commission (SEC) for the first and third quarters of each fiscal year on Form N-Q. You may obtain this information directly from the SEC. Visit the SEC on-line at http://www.sec.gov or in person at the SEC’s Public Reference Room in Washington, D.C. Call the SEC toll-free at (800) SEC -0330 for room hours and operation.
Nuveen Funds’ Proxy Voting Information
You may obtain (i) information regarding how each fund voted proxies relating to portfolio securities held during the most recent twelve-month period ended June 30, without charge, upon request, by calling Nuveen Investments toll-free at (800) 257-8787 or on Nuveen’s website at www.nuveen.com and (ii) a description of the policies and procedures that each fund used to determine how to vote proxies relating to portfolio securities without charge, upon request, by calling Nuveen Investments toll free at (800) 257-8787. You may also obtain this information directly from the SEC. Visit the SEC on-line at http://www.sec.gov.
CEO Certification Disclosure
Each Fund’s Chief Executive Officer has submitted to the New York Stock Exchange (NYSE) the annual CEO certification as required by Section 303A.12(a) of the NYSE Listed Company Manual. Each Fund has filed with the SEC the certification of its Chief Executive Officer and Chief Financial Officer required by Section 302 of the Sarbanes-Oxley Act.
Common Share Information
Each Fund intends to repurchase shares of its own common stock at such times and in such amounts as is deemed advisable. During the period covered by this report, the Fund repurchased shares of its common stock as shown in the accompanying table. Any future repurchases will be reported to shareholders in the next annual or semi-annual report.
| | | NPP | | | NMA | | | NMO | | | NAD | | | NXZ | | | NZF | |
| Common shares repurchased | | | — | | | | — | | | | — | | | | — | | | | — | | | | — | |
| Nuveen Investments: |
| | Serving Investors for Generations |
Since 1898, financial advisors and their clients have relied on Nuveen Investments to provide dependable investment solutions through continued adherence to proven, long-term investing principles. Today, we offer a range of high quality equity and fixed-income solutions designed to be integral components of a well-diversified core portfolio.
Focused on meeting investor needs.
Nuveen Investments provides high-quality investment services designed to help secure the long-term goals of institutional and individual investors as well as the consultants and financial advisors who serve them. Nuveen Investments markets a wide range of specialized investment solutions which provide investors access to capabilities of its high-quality boutique investment affiliates—Nuveen Asset Management, Symphony Asset Management, NWQ Investment Management Company, Santa Barbara Asset Management, Tradewinds Global Investors, Winslow Capital Management and Gresham Investment Management. In total, Nuveen Investments managed approximately $215 billion as of September 30, 2013.
Find out how we can help you.
To learn more about how the products and services of Nuveen Investments may be able to help you meet your financial goals, talk to your financial advisor, or call us at (800) 257-8787. Please read the information provided carefully before you invest. Investors should consider the investment objective and policies, risk considerations, charges and expenses of any investment carefully. Where applicable, be sure to obtain a prospectus, which contains this and other relevant information. To obtain a prospectus, please contact your securities representative or Nuveen Investments, 333 W. Wacker Dr., Chicago, IL 60606. Please read the prospectus carefully before you invest or send money.
Learn more about Nuveen Funds at: www.nuveen.com/cef
| Distributed by Nuveen Investments, LLC | 333 West Wacker Drive | Chicago, IL 60606 | www.nuveen.com | |
EAN-B-1013D
ITEM 2. CODE OF ETHICS.
As of the end of the period covered by this report, the registrant has adopted a code of ethics that applies to the registrant's principal executive officer, principal financial officer, principal accounting officer or controller, or persons performing similar functions. There were no amendments to or waivers from the Code during the period covered by this report. The registrant has posted the code of ethics on its website at www.nuveen.com/CEF/Shareholder/FundGovernance.aspx. (To view the code, click on Code of Conduct.)
ITEM 3. AUDIT COMMITTEE FINANCIAL EXPERT.
The registrant's Board of Directors or Trustees (“Board”) determined that the registrant has at least one “audit committee financial expert” (as defined in Item 3 of Form N-CSR) serving on its Audit Committee. The registrant's audit committee financial expert is Carole E. Stone, who is “independent” for purposes of Item 3 of Form N-CSR.
Ms. Stone served for five years as Director of the New York State Division of the Budget. As part of her role as Director, Ms. Stone was actively involved in overseeing the development of the State's operating, local assistance and capital budgets, its financial plan and related documents; overseeing the development of the State's bond-related disclosure documents and certifying that they fairly presented the State's financial position; reviewing audits of various State and local agencies and programs; and coordinating the State's system of internal audit and control. Prior to serving as Director, Ms. Stone worked as a budget analyst/examiner with increasing levels of responsibility over a 30 year period, including approximately five years as Deputy Budget Director. Ms. Stone has also served as Chair of the New York State Racing Association Oversight Board, as Chair of the Public Authorities Control Board, as a Commissioner on the New York State Commission on Public Authority Reform and as a member of the Boards of Directors of several New York State public authorities. These positions have involved overseeing operations and finances of certain entities and assessing the adequacy of project/entity financing and financial reporting. Currently, Ms. Stone is on the Board of Directors of CBOE Holdings, Inc., of the Chicago Board Options Exchange, and of C2 Options Exchange. Ms. Stone's position on the boards of these entities and as a member of both CBOE Holdings' Audit Committee and its Finance Committee has involved, among other things, the oversight of audits, audit plans and preparation of financial statements.
ITEM 4. PRINCIPAL ACCOUNTANT FEES AND SERVICES.
Nuveen Municipal Advantage Fund, Inc.
The following tables show the amount of fees that Ernst & Young LLP, the Fund's auditor, billed to the Fund during the Fund's last two full fiscal years. For engagements with Ernst & Young LLP the Audit Committee approved in advance all audit services and non-audit services that Ernst & Young LLP provided to the Fund, except for those non-audit services that were subject to the pre-approval exception under Rule 2-01 of Regulation S-X (the “pre-approval exception”). The pre-approval exception for services provided directly to the Fund waives the pre-approval requirement for services other than audit, review or attest services if: (A) the aggregate amount of all such services provided constitutes no more than 5% of the total amount of revenues paid by the Fund to its accountant during the fiscal year in which the services are provided; (B) the Fund did not recognize the services as non-audit services at the time of the engagement; and (C) the services are promptly brought to the Audit Committee's attention, and the Committee (or its delegate) approves the services before the audit is completed.
The Audit Committee has delegated certain pre-approval responsibilities to its Chairman (or, in his absence, any other member of the Audit Committee).
SERVICES THAT THE FUND'S AUDITOR BILLED TO THE ADVISER AND AFFILIATED FUND SERVICE PROVIDERS
The tables also show the percentage of fees subject to the pre-approval exception. The pre-approval exception for services provided to the Adviser and any Affiliated Fund Service Provider (other than audit, review or attest services) waives the pre-approval requirement if: (A) the aggregate amount of all such services provided constitutes no more than 5% of the total amount of revenues paid to Ernst & Young LLP by the Fund, the Adviser and Affiliated Fund Service Providers during the fiscal year in which the services are provided that would have to be pre-approved by the Audit Committee; (B) the Fund did not recognize the services as non-audit services at the time of the engagement; and (C) the services are promptly brought to the Audit Committee's attention, and the Committee (or its delegate) approves the services before the Fund's audit is completed.
The following table shows the amount of fees that Ernst & Young LLP billed during the Fund's last two full fiscal years for non-audit services. The Audit Committee is required to pre-approve non-audit services that Ernst & Young LLP provides to the Adviser and any Affiliated Fund Services Provider, if the engagement related directly to the Fund's operations and financial reporting (except for those subject to the pre-approval exception described above). The Audit Committee requested and received information from Ernst & Young LLP about any non-audit services that Ernst & Young LLP rendered during the Fund's last fiscal year to the Adviser and any Affiliated Fund Service Provider. The Committee considered this information in evaluating Ernst & Young LLP's independence.
ITEM 6. SCHEDULE OF INVESTMENTS.
a) See Portfolio of Investments in Item 1.
b) Not applicable.
ITEM 7. DISCLOSURE OF PROXY VOTING POLICIES AND PROCEDURES FOR CLOSED-END MANAGEMENT INVESTMENT COMPANIES.
ITEM 9. PURCHASES OF EQUITY SECURITIES BY CLOSED-END MANAGEMENT INVESTMENT COMPANY AND AFFILIATED PURCHASERS.
Not applicable.
ITEM 10. SUBMISSION OF MATTERS TO A VOTE OF SECURITY HOLDERS.
There have been no material changes to the procedures by which shareholders may recommend nominees to the registrant's Board implemented after the registrant last provided disclosure in response to this Item.
ITEM 11. CONTROLS AND PROCEDURES.
ITEM 12. EXHIBITS.
File the exhibits listed below as part of this Form.
Pursuant to the requirements of the Securities Exchange Act of 1934 and the Investment Company Act of 1940, the registrant has duly caused this report to be signed on its behalf by the undersigned, thereunto duly authorized.
Kevin J. McCarthy
Pursuant to the requirements of the Securities Exchange Act of 1934 and the Investment Company Act of 1940, this report has been signed below by the following persons on behalf of the registrant and in the capacities and on the dates indicated.
Gifford R. Zimmerman
Stephen D. Foy