LIFE IS COMPLEX.
Nuveen makes things e-simple.
It only takes a minute to sign up for e-Reports. Once enrolled, you’ll receive an e-mail as soon as your Nuveen Fund information is ready. No more waiting for delivery by regular mail. Just click on the link within the e-mail to see the report and save it on your computer if you wish.
If you receive your Nuveen Fund dividends and statements from your financial advisor or brokerage account.
If you receive your Nuveen Fund dividends and statements directly from Nuveen.
These are perplexing times for investors. The global economy continues to struggle. The solutions being implemented in the eurozone to deal with the debt crises of many of its member countries are not yet seen as sufficient by the financial markets. The political paralysis in the U.S. has prevented the compromises necessary to deal with the fiscal imbalance and government spending priorities. The efforts by individual consumers, governments and financial institutions to reduce their debts are increasing savings but reducing demand for the goods and services that drive employment. These developments are undermining the rebuilding of confidence by consumers, corporations and investors that is so essential to a resumption of economic growth.
Although it is painfully slow, progress is being made. In Europe, the turnover of a number of national governments reflects the realization by politicians and voters alike that leaders who practiced business as usual had to be replaced by leaders willing to face problems and accept the hard choices needed to resolve them. The recent coordinated efforts by central banks in the U.S. and Europe to provide liquidity to the largest European banks indicates that these monetary authorities are committed to facilitating a recovery in the European banking sector.
In the U.S., the failure of the congressionally appointed Debt Reduction Committee was a blow to those who hoped for a bipartisan effort to finally begin addressing the looming fiscal crisis. Nevertheless, Congress and the administration cannot ignore the issue for long. The Bush era tax cuts are scheduled to expire on December 31, 2012, and six months later the $1.2 trillion of mandatory across-the-board spending cuts under the Budget Control Act of 2011 begin to go into effect. Any legislative modification would require bipartisan support and the prospects for a bipartisan solution are unclear. The impact of these two developments would be a mixed blessing: a meaningful reduction in the annual budget deficit at the cost of slowing the economic recovery.
It is in these particularly volatile markets that professional investment management is most important. Skillful investment teams who have experienced challenging markets and remain committed to their investment disciplines are critical to the success of an investor’s long-term objectives. In fact, many long-term investment track records are built during challenging markets when managers are able to protect investors against these economic crosscurrents. Experienced investment teams know that volatile markets put a premium on companies and investment ideas that will weather the short-term volatility and that compelling values and opportunities are opened up when markets overreact to negative developments. By maintaining appropriate time horizons, diversification and relying on practiced investment teams, we believe that investors can achieve their long-term investment objectives.
As always, I encourage you to contact your financial consultant if you have any questions about your investment in a Nuveen Fund. On behalf of the other members of your Fund Board, we look forward to continuing to earn your trust in the months and years ahead.
Robert P. Bremner
Nuveen Performance Plus Municipal Fund, Inc. (NPP)
Nuveen Municipal Advantage Fund, Inc. (NMA)
Nuveen Municipal Market Opportunity Fund, Inc. (NMO)
Portfolio managers Tom Spalding and Paul Brennan discuss U.S. economic and municipal market conditions, key investment strategies and the twelve-month performance of these six national Funds. A 34-year veteran of Nuveen, Tom has managed NXZ since its inception in 2001 and NPP, NMA, NMO and NAD since 2003. With 20 years of industry experience, including 14 years at Nuveen, Paul assumed portfolio management responsibility for NZF in 2006.
What factors affected the U.S. economy and municipal market during the twelve-month reporting period ended October 31, 2011?
During this period, the U.S. economy’s recovery from recession remained slow. The Federal Reserve (Fed) maintained its efforts to improve the overall economic environment by continuing to hold the benchmark fed funds rate at the record low level of zero to 0.25% that it had established in December 2008. At its November 2011 meeting (shortly after the end of this reporting period), the central bank reaffirmed its opinion that economic conditions would likely warrant keeping this rate at “exceptionally low levels” at least through mid-2013. The Fed also said that it would continue its program to extend the average maturity of its U.S. Treasury holdings by purchasing $400 billion of these securities with maturities of six to thirty years and selling an equal amount of U.S.Treasury securities with maturities of three years or less. The goals of this program, which the Fed expects to complete by the end of June 2012, are to lower longer-term interest rates, support a stronger economic recovery, and help ensure that inflation remains at levels consistent with the Fed’s mandates of maximum employment and price stability.
In the third quarter of 2011, the U.S. economy, as measured by the U.S. gross domestic product (GDP), grew at an annualized rate of 2.0%, the best growth number since the fourth quarter of 2010 and the ninth consecutive quarter of positive growth. The Consumer Price Index (CPI) rose 3.5% year-over-year as of October 2011, while the core CPI (which excludes food and energy) increased 2.1%, edging just above the Fed’s unofficial objective of 2.0% or lower for this inflation measure. Unemployment numbers remained high, as October 2011 marked the seventh straight month with a national jobless number of 9.0% or higher. However, after the reporting period came to a close, the U.S. unemployment rate fell to 8.6% in November 2011. While the dip was a step in
Certain statements in this report are forward-looking statements. Discussions of specific investments are for illustration only and are not intended as recommendations of individual investments. The forward-looking statements and other views expressed herein are those of the portfolio managers as of the date of this report. Actual future results or occurrences may differ significantly from those anticipated in any forward-looking statements, and the views expressed herein are subject to change at any time, due to numerous market and other factors. The Funds disclaim any obligation to update publicly or revise any forward-looking statements or views expressed herein.
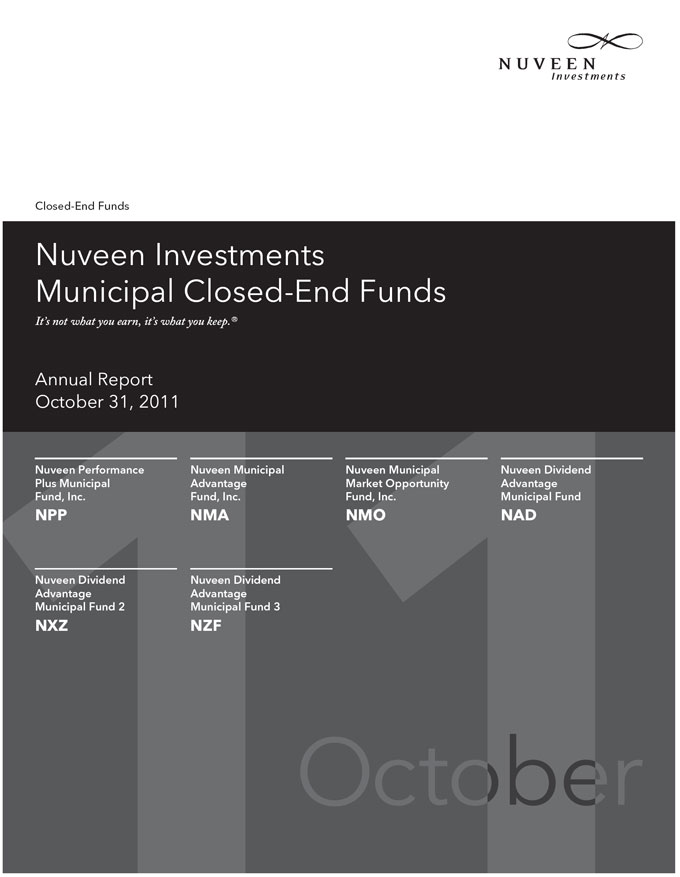
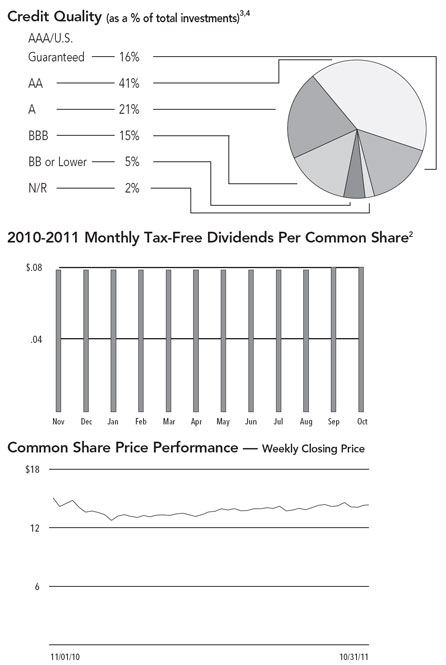
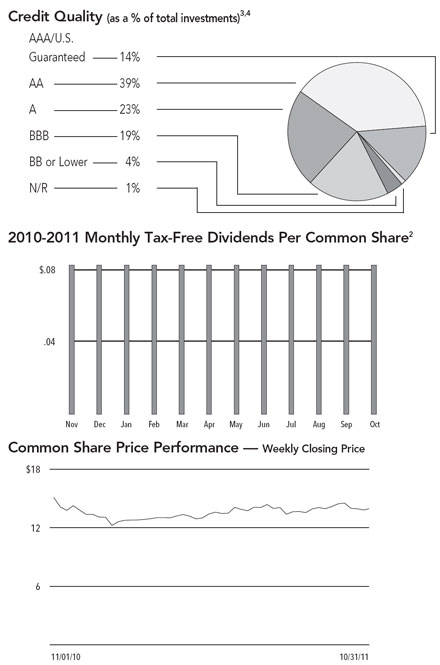
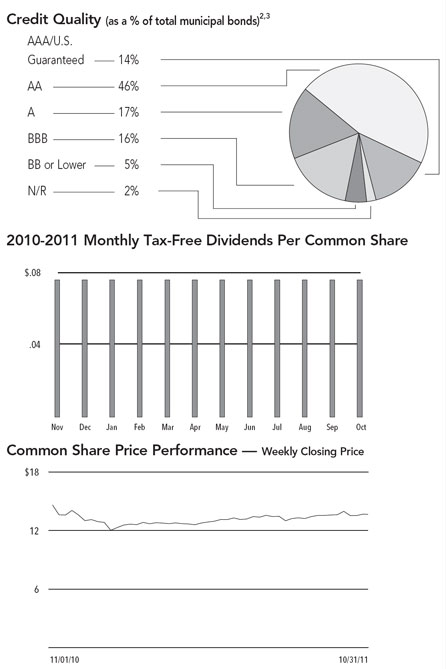
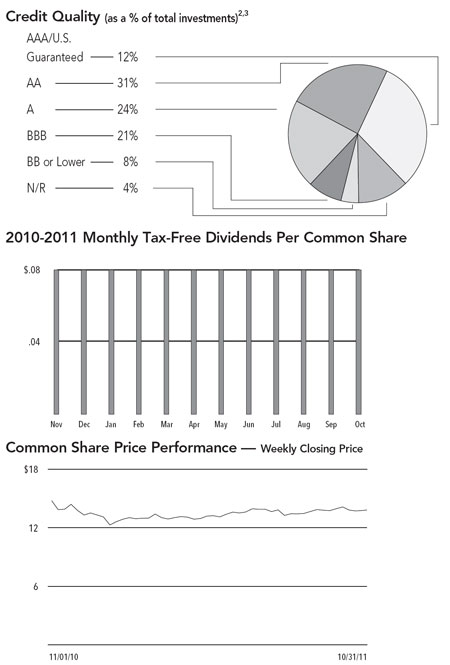
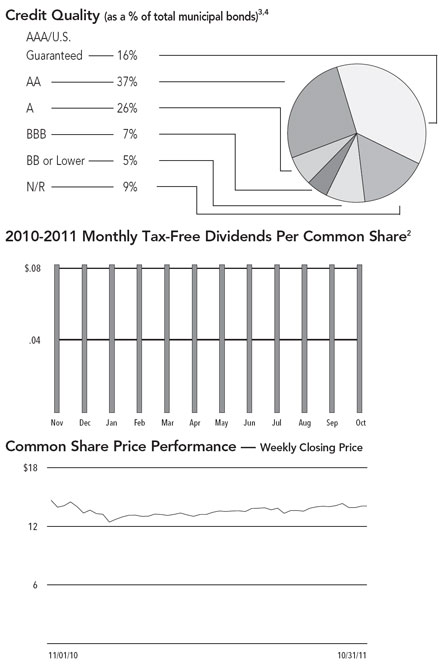
Ratings shown are the highest rating given by one of the following national rating agencies: Standard & Poor’s Group, Moody’s Investor Services, Inc. or Fitch, Inc. Credit ratings are subject to change. AAA, AA, A and BBB are investment grade ratings; BB, B, CCC, CC, C and D are below investment grade ratings. Bonds backed by U.S. Government or agency securities are given an implied rating equal to the rating of such securities. Holdings designated N/R are not rated by a national rating agency.
the right direction, it was due partly to a number of individuals dropping out of the hunt for work. The housing market also continued to be a major weak spot. For the twelve months ended September 2011 (the most recent data available at the time this report was prepared), the average home price in the Standard & Poor’s/Case-Shiller Index lost 3.6% over the preceding twelve months, with 18 of the 20 major metropolitan areas reporting losses. In addition, the U.S. economic picture continued to be clouded by concerns about the European debt crisis and efforts to reduce the federal deficit.
Municipal bond prices ended this period generally unchanged versus the beginning of this reporting period, masking a sell-off that commenced in the fourth quarter of 2010 as the result of investor concerns about inflation, the federal deficit and its impact on demand for U.S. Treasuries. Adding to this situation was media coverage of the strained finances of many state and local governments, which failed to differentiate between gaps in these governments’ operating budgets and their ability to meet their debt service obligations. As a result, money flowed out of municipal mutual funds, yields rose, and valuations declined.
During the second half of this reporting period (i.e., May-October 2011), municipal bond prices generally rallied as yields declined across the municipal curve. The decline in yields was due in part to the continued depressed level of municipal bond issuance. Tax-exempt volume, which had been limited in 2010 by issuers’ extensive use of taxable Build America Bonds (BABs), continued to drift lower in 2011. Even though BABs were no longer an option for issuers (the BAB program expired at the end of 2010), some borrowers had accelerated issuance into 2010 in order to take advantage of the program’s favorable terms before its termination, fulfilling their capital program borrowing needs well into 2012. This reduced the need for many borrowers to come to market with new issues during this period. Over the twelve months ended October 31, 2011, municipal bond issuance nationwide totaled $320.2 billion, a decrease of 23% compared with the issuance of the twelve-month period ended October 31, 2010. During the majority of this period, demand for municipal bonds remained very strong.
What key strategies were used to manage these Funds during this reporting period?
In an environment characterized by tighter municipal supply and relatively lower yields, we continued to take a bottom-up approach to discovering sectors and individual credits that we believed were undervalued and that had the potential to perform well over the long term. During this period, these Funds found value in the health care sector, where we added to our holdings at attractive prices; essential services such as water and sewer bonds; and tax-supported credits. NPP, NMA, NMO, NAD and NXZ also purchased selected transportation bonds—primarily for airlines, airports and toll-roads—and took advantage of attractive valuation levels to add some tobacco credits. In general, the Funds focused on purchasing longer bonds in order to capitalize on opportunities to add more attractive yields at the longer end of the municipal yield curve. The purchase of longer bonds also helped maintain the Funds’ duration (price sensitivity to interest rate movements) and yield curve positioning.
Cash for new purchases during this period was generated primarily by the proceeds from bond calls and maturing bonds, which we worked to redeploy to keep the Funds
fully invested. In particular, NZF, which reached its ten-year anniversary in September 2011, had the elevated number of calls often associated with that milestone. By taking advantage of opportunities to reinvest call proceeds into bonds with longer maturities, we were able to extend NZF’s duration, which had shortened over time. In NMO, we also sold some zero coupon bonds with long maturities as part of our efforts to more closely align this Fund’s duration with its target objectives.
As of October 31, 2011, all six of these Funds continued to use inverse floating rate securities. We employ inverse floaters for a variety of reasons, including duration management, income enhancement and total return enhancement.
Individual results for these Funds, as well as relevant index and peer group information, are presented in the accompanying table.
For the twelve months ended October 31, 2011, the total returns on common share net asset value (NAV) for NPP, NMA, NAD, NXZ and NZF exceeded the return for the Standard & Poor’s (S&P) National Municipal Bond Index, while NMO trailed the S&P Index return. For this same period, NMA, NXZ and NZF outperformed the average return for the Lipper General and Insured Leveraged Municipal Debt Funds Classification Average, NPP and NAD performed in line with the Lipper average and NMO lagged the Lipper peer group.
Key management factors that influenced the Funds’ returns during this period included duration and yield curve positioning, credit exposure and sector allocation. In addition, the use of leverage was an important positive factor affecting the Funds’ performance over this period. The impact of leverage is discussed in more detail later in this report.
During this period, municipal bonds with intermediate and longer maturities tended to outperform the short maturity categories, with credits having maturities of seven years and longer generally outpacing the market. Among these Funds, NZF and NXZ were the most advantageously situated in terms of duration and yield curve positioning, with better exposure to the segments of the yield curve that performed best. During this period, these two Funds had relatively more bond calls and the subsequent ability to reinvest longer on the yield curve. In general during this period, the greater a Fund’s
exposure to the outperforming intermediate and longer parts of the curve, the greater the positive impact on the Fund’s return.
NMO began the period with a relatively long duration, which hurt its overall performance during the first part of the period when yields generally were rising and prices were falling. As noted, we worked to shorten the Fund’s duration during the period, and therefore sold longer maturity securities to invest in shorter term issues. This repositioning, which we believe will serve the Fund well over the longer term, hurt its relative performance as this Fund did not benefit as much as the others from the generally strong market seen in the second half of the period. In addition, several of the Fund’s individual bond holdings did not perform as well as expected, which also hurt overall return.
Credit exposure also played a role in performance, as bonds rated A and AA typically outperformed the other credit quality categories. On the whole, bonds with higher levels of credit risk were not favored by the market during this period. The performance of the BBB category, in particular, was dragged down by poor returns in the tobacco bond sector. All of these Funds benefited from their strong weightings in the A and AA sectors. This was offset to some degree by heavy weightings in bonds rated BBB in all of these Funds except NZF.
Holdings that generally made positive contributions to the Funds’ returns during this period included zero coupon bonds and housing, water and sewer and health care credits. General obligation and other tax-supported bonds also generally outpaced the overall municipal market return. All of these Funds, particularly NMA and NAD, had strong weightings in health care, which added to their performance. On the whole, some of the best performing bonds in the Funds’ portfolios for this period were those purchased during the earlier part of this period before the market rallied, when yields were relatively higher and prices especially attractive.
In contrast, pre-refunded bonds, which are often backed by U.S. Treasury securities, were among the poorest performing market segments during this period. The underperfor-mance of these bonds can be attributed primarily to their shorter effective maturities and higher credit quality. As of October 31, 2011, NPP held the heaviest weighting of pre-refunded bonds, which detracted from its performance during this period.
One important factor impacting the returns of all these Funds relative to the comparative indexes was the Funds’ use of leverage. The Funds use leverage because their managers believe that, over time, leveraging provides opportunities for additional income and total return for common shareholders. However, use of leverage also can expose common shareholders to additional volatility. For example, as the prices of securities held by a Fund decline, the negative impact of these valuation changes on common share net asset value and common shareholder total return is magnified by the use of leverage. Conversely, leverage may enhance common share returns during periods, when the prices of securities held by a Fund are generally rising. Leverage made a positive contribution to the performance of these Funds over this reporting period.
RECENT DEVELOPMENTS REGARDING THE FUNDS’ REDEMPTION OF AUCTION RATE PREFERRED SHARES
Shortly after their respective inceptions, each of the Funds issued auction rate preferred shares (ARPS) to create structural leverage. As noted in past shareholder reports, the ARPS issued by many closed-end funds, including these Funds, have been hampered by a lack of liquidity since February 2008. Since that time, more ARPS have been submitted for sale in each of their regularly scheduled auctions than there have been offers to buy. In fact, offers to buy have been almost completely nonexistent since late February 2008. This means that these auctions have “failed to clear,” and that many, or all, of the ARPS shareholders who wanted to sell their shares in these auctions were unable to do so. This lack of liquidity in ARPS did not lower the credit quality of these shares, and ARPS shareholders unable to sell their shares continued to receive distributions at the “maximum rate” applicable to failed auctions, as calculated in accordance with the pre-established terms of the ARPS. In the recent market, with short term rates at multi-generational lows, those maximum rates also have been low.
One continuing implication for common shareholders from the auction failures is that each Fund’s cost of leverage likely has been incrementally higher at times than it otherwise might have been had the auctions continued to be successful. As a result, each Fund’s common share earnings likely have been incrementally lower at times than they otherwise might have been.
As noted in past shareholder reports, the Nuveen funds’ Board of Directors/Trustees authorized several methods that can be used separately or in combination to refinance a portion of the Nuveen funds’ outstanding ARPS. Some funds have utilized tender option bonds (TOBs), also known as inverse floating rate securities, for leverage purposes. The amount of TOBs that a fund may use varies according to the composition of each fund’s
portfolio. Some funds have a greater ability to use TOBs than others. Some funds have issued Variable Rate Demand Preferred (VRDP) Shares or Variable Rate MuniFund Term Preferred (VMTP) Shares, which are a floating rate form of preferred stock with a mandatory term redemption. Some funds have issued MuniFund Term Preferred (MTP) Shares, a fixed rate form of preferred stock with a mandatory redemption period of three to five years.
During 2010 and 2011, certain Nuveen leveraged closed-end funds (including NMA, NAD, NXZ and NZF) received a demand letter from a law firm on behalf of purported holders of common shares of each such fund, alleging that Nuveen and the funds’ officers and Board of Directors/Trustees breached their fiduciary duties related to the redemption at par of the funds’ ARPS. In response, the Board established an ad hoc Demand Committee consisting of certain of its disinterested and independent Board members to investigate the claims. The Demand Committee retained independent counsel to assist it in conducting an extensive investigation. Based upon its investigation, the Demand Committee found that it was not in the best interests of each fund or its shareholders to take the actions suggested in the demand letters, and recommended that the full Board reject the demands made in the demand letters. After reviewing the findings and recommendation of the Demand Committee, the full Board of each fund unanimously adopted the Demand Committee’s recommendation.
As of October 31, 2011, each of the Funds has redeemed all of their outstanding APRS at liquidation value.
As of October 31, 2011, the Funds have issued and outstanding MTP Shares, VMTP Shares and VRDP Shares as shown in the accompanying tables.
(Refer to Notes to Financial Statements, Footnote 1 – General Information and Significant Accounting Policies and Footnote 4 – Fund Shares for further details on MTP Shares, VMTP Shares and VRDP Shares.)
As of October 5, 2011, all 84 of the Nuveen closed-end municipal funds that had issued ARPS, approximately $11.0 billion, have redeemed at liquidation value all of these shares.
For up-to-date information, please visit the Nuveen CEF Auction Rate Preferred Resource Center at: http://www.nuveen.com/arps.
During May 2011, Nuveen Securities, LLC, known as Nuveen Investments, LLC prior to April 30, 2011, entered into a settlement with the Financial Industry Regulatory Authority (FINRA) with respect to certain allegations regarding Nuveen-sponsored closed-end fund ARPS marketing brochures. As part of this settlement, Nuveen Securities, LLC neither admitted to nor denied FINRA’s allegations. Nuveen Securities, LLC is the broker-dealer subsidiary of Nuveen Investments. The settlement with FINRA concludes an investigation that followed the widespread failure of auctions for ARPS and other auction rate securities, which generally began in mid-February 2008. In the settlement, FINRA alleged that certain marketing materials provided by Nuveen Securities, LLC were false and misleading. Nuveen Securities, LLC agreed to a censure and the payment of a $3 million fine.
Fund shares are not guaranteed or endorsed by any bank or other insured depository institution, and are not federally insured by the Federal Deposit Insurance Corporation. Past performance is no guarantee of future results. Fund common shares are subject to a variety of risks, including:
During the twelve-month reporting period ended October 31, 2011, NPP had one monthly dividend increase, while the dividends of NMA, NAD, NXZ and NZF remained stable throughout the reporting period. The dividend of NMO was cut effective September 2011.
Due to normal portfolio activity, common shareholders of the following Funds received capital gains and/or net ordinary income distributions during the past twelve months (NPP and NZF in December 2010 and NMA in June 2011) as follows:
All of the Funds in this report seek to pay stable dividends at rates that reflect each Fund’s past results and projected future performance. During certain periods, each Fund may pay dividends at a rate that may be more or less than the amount of net investment income actually earned by the Fund during the period. If a Fund has cumulatively earned more than it has paid in dividends, it holds the excess in reserve as undistributed net investment income (UNII) as part of the Fund’s NAV. Conversely, if a Fund has cumulatively paid dividends in excess of its earnings, the excess constitutes negative UNII that is likewise reflected in the Fund’s NAV. Each Fund will, over time, pay all of its net investment income as dividends to shareholders. As of October 31, 2011, all of the Funds in this report had positive UNII balances for both tax and financial reporting purposes.
Since the inception of the Funds’ repurchase program, the Funds have not repurchased any of their outstanding common shares.
As of October 31, 2011, the Funds’ common share prices were trading at (-) discounts to their common share NAVs as shown in the accompanying table.
Nuveen Performance Plus Municipal Fund, Inc.
Nuveen Municipal Advantage Fund, Inc.
Nuveen Municipal Market Opportunity Fund, Inc.
We have audited the accompanying statements of assets and liabilities, including the portfolios of investments, of Nuveen Performance Plus Municipal Fund, Inc., Nuveen Municipal Advantage Fund, Inc., Nuveen Municipal Market Opportunity Fund, Inc., Nuveen Dividend Advantage Municipal Fund, Nuveen Dividend Advantage Municipal Fund 2, and Nuveen Dividend Advantage Municipal Fund 3 (the “Funds”) as of October 31, 2011, and the related statements of operations and cash flows for the year then ended, the statements of changes in net assets for each of the two years in the period then ended, and the financial highlights for each of the five years in the period then ended. These financial statements and financial highlights are the responsibility of the Funds’ management. Our responsibility is to express an opinion on these financial statements and financial highlights based on our audits.
We conducted our audits in accordance with the standards of the Public Company Accounting Oversight Board (United States). Those standards require that we plan and perform the audits to obtain reasonable assurance about whether the financial statements and financial highlights are free of material misstatement. We were not engaged to perform an audit of the Funds’ internal control over financial reporting. Our audits included consideration of internal control over financial reporting as a basis for designing audit procedures that are appropriate in the circumstances, but not for the purpose of expressing an opinion on the effectiveness of the Funds’ internal control over financial reporting. Accordingly, we express no such opinion. An audit also includes examining, on a test basis, evidence supporting the amounts and disclosures in the financial statements and financial highlights, assessing the accounting principles used and significant estimates made by management, and evaluating the overall financial statement presentation. Our procedures included confirmation of securities owned as of October 31, 2011, by correspondence with the custodian and brokers or by other appropriate auditing procedures where replies from brokers were not received. We believe that our audits provide a reasonable basis for our opinion.
In our opinion, the financial statements and financial highlights referred to above present fairly, in all material respects, the financial positions of Nuveen Performance Plus Municipal Fund, Inc., Nuveen Municipal Advantage Fund, Inc., Nuveen Municipal Market Opportunity Fund, Inc., Nuveen Dividend Advantage Municipal Fund, Nuveen Dividend Advantage Municipal Fund 2, and Nuveen Dividend Advantage Municipal Fund 3 at October 31, 2011, and the results of their operations and their cash flows for the year then ended, the changes in their net assets for each of the two years in the period then ended, and the financial highlights for each of the five years in the period then ended in conformity with U.S. generally accepted accounting principles.
See accompanying notes to financial statements.
| | | Nuveen Municipal Advantage Fund, Inc. (continued) |
| NMA | | Portfolio of Investments |
| | | October 31, 2011 |
| | Principal | | | Optional Call | | | | | |
| | Amount (000) | | Description (1) | Provisions (2) | Ratings (3) | | | Value | |
| | | | Wisconsin – 2.1% (1.4% of Total Investments) | | | | | | |
| $ | 535 | | Badger Tobacco Asset Securitization Corporation, Wisconsin, Tobacco Settlement Asset-Backed Bonds, Series 2002, 5.750%, 6/01/12 (ETM) | No Opt. Call | Aaa | | $ | 551,691 | |
| | 2,945 | | Badger Tobacco Asset Securitization Corporation, Wisconsin, Tobacco Settlement Asset-Backed Bonds, Series 2002, 6.125%, 6/01/27 (Pre-refunded 6/01/12) | 6/12 at 100.00 | Aaa | | | 3,044,216 | |
| | 565 | | Green Bay, Wisconsin, Water System Revenue Bonds, Series 2004, 5.000%, 11/01/29 – AGM Insured | 11/14 at 100.00 | Aa2 | | | 582,034 | |
| | 5,000 | | Madison, Wisconsin, Industrial Development Revenue Refunding Bonds, Madison Gas and Electric Company Projects, Series 2002A, 5.875%, 10/01/34 (Alternative Minimum Tax) | 4/12 at 100.00 | AA– | | | 5,020,349 | |
| | 3,000 | | Southeast Wisconsin Professional Baseball Park District, Sales Tax Revenue Refunding Bonds, Series 1998A, 5.500%, 12/15/19 – NPFG Insured | No Opt. Call | AA– | | | 3,655,559 | |
| | 12,045 | | Total Wisconsin | | | | | 12,853,849 | |
| $ | 1,110,538 | | Total Investments (cost $929,006,567) – 149.4% | | | | | 936,163,679 | |
| | | | Floating Rate Obligations – (7.4)% | | | | | (46,513,333 | ) |
| | | | Variable Rate Demand Preferred Shares, at Liquidation Value – (47.4)% (7) | | | | | (296,800,000 | ) |
| | | | Other Assets Less Liabilities – 5.4% | | | | | 33,765,604 | |
| | | | Net Assets Applicable to Common Shares – 100% | | | | $ | 626,615,950 | |
| (1) | | All percentages shown in the Portfolio of Investments are based on net assets applicable to Common shares unless otherwise noted. |
| (2) | | Optional Call Provisions (not covered by the report of independent registered public accounting firm): Dates (month and year) and prices of the earliest optional call or redemption. There may be other call provisions at varying prices at later dates. Certain mortgage-backed securities may be subject to periodic principal paydowns. |
| (3) | | Ratings (not covered by the report of independent registered public accounting firm): Using the highest of Standard & Poor’s Group (“Standard & Poor’s”), Moody’s Investors Service, Inc. (“Moody’s”) or Fitch, Inc. (“Fitch”) rating. Ratings below BBB by Standard & Poor’s, Baa by Moody’s or BBB by Fitch are considered to be below investment grade. Holdings designated N/R are not rated by any of these national rating agencies. |
| (4) | | Backed by an escrow or trust containing sufficient U.S. Government or U.S. Government agency securities, which ensure the timely payment of principal and interest. Bonds backed by U.S. Government or agency securities are given an implied rating equal to the rating of such securities. |
| (5) | | At or subsequent to the end of the reporting period, this security is non-income producing. Non-income producing security, in the case of a bond, generally denotes that the issuer has (1) defaulted on the payment of principal or interest, (2) is under the protection of the Federal Bankruptcy Court or (3) the Fund’s Adviser has concluded that the issue is not likely to meet its future interest payment obligations and has directed the Fund’s custodian to cease accruing additional income on the Fund’s records. |
| (6) | | For fair value measurement disclosure purposes, investment categorized as Level 3. See Notes to Financial Statements, Footnote 1 – General Information and Significant Accounting Policies, Investment Valuation for more information. |
| (7) | | Variable Rate Demand Preferred Shares, at Liquidation Value as a percentage of Total Investments is 31.7%. |
| N/R | | Not rated. |
| WI/DD | | Purchased on a when-issued or delayed delivery basis. |
| (ETM) | | Escrowed to maturity. |
| (IF) | | Inverse floating rate investment. |
| (UB) | | Underlying bond of an inverse floating rate trust reflected as a financing transaction. See Notes to Financial Statements, Footnote 1 – General Information and Significant Accounting Policies, Inverse Floating Rate Securities for more information. |
See accompanying notes to financial statements.
| | | Nuveen Municipal Market Opportunity Fund, Inc. |
| NMO | | Portfolio of Investments |
| | | October 31, 2011 |
| | Principal | | | Optional Call | | | | | |
| | Amount (000) | | Description (1) | Provisions (2) | Ratings (3) | | | Value | |
| | | | Alabama – 0.6% (0.4% of Total Investments) | | | | | | |
| | | | Henry County Water Authority, Alabama, Water Revenue Bonds, Series 2006: | | | | | | |
| $ | 1,935 | | 5.000%, 1/01/36 – RAAI Insured | 1/16 at 100.00 | N/R | | $ | 1,807,580 | |
| | 2,485 | | 5.000%, 1/01/41 – RAAI Insured | 1/16 at 100.00 | N/R | | | 2,263,437 | |
| | 4,420 | | Total Alabama | | | | | 4,071,017 | |
| | | | Alaska – 3.4% (2.1% of Total Investments) | | | | | | |
| | | | Alaska Housing Finance Corporation, General Housing Purpose Bonds, Series 2005A: | | | | | | |
| | 1,125 | | 5.250%, 12/01/34 – FGIC Insured (UB) | 12/14 at 100.00 | AA+ | | | 1,149,649 | |
| | 1,275 | | 5.250%, 12/01/41 – FGIC Insured (UB) | 12/14 at 100.00 | AA+ | | | 1,298,855 | |
| | 7,000 | | Alaska Housing Finance Corporation, General Housing Purpose Bonds, Series 2005B-2, 5.250%, 12/01/30 – NPFG Insured | 6/15 at 100.00 | AA+ | | | 7,157,710 | |
| | 3,000 | | Alaska State, International Airport System Revenue Bonds, Series 2006A, 5.000%, 10/01/12 – NPFG Insured (Alternative Minimum Tax) | No Opt. Call | Aa3 | | | 3,121,890 | |
| | 13,025 | | Northern Tobacco Securitization Corporation, Alaska, Tobacco Settlement Asset-Backed Bonds, Series 2006A, 5.000%, 6/01/46 | 6/14 at 100.00 | B2 | | | 8,256,678 | |
| | 25,425 | | Total Alaska | | | | | 20,984,782 | |
| | | | California – 23.8% (15.1% of Total Investments) | | | | | | |
| | 1,350 | | Antelope Valley Union High School District, Los Angeles County, California, General Obligation Bonds, Series 2004B, 0.000%, 8/01/29 – NPFG Insured | No Opt. Call | Aa2 | | | 478,049 | |
| | | | Bay Area Toll Authority, California, Revenue Bonds, San Francisco Bay Area Toll Bridge, Series 2009F-1: | | | | | | |
| | 2,500 | | 5.125%, 4/01/39 | 4/19 at 100.00 | AA | | | 2,611,775 | |
| | 2,500 | | 5.625%, 4/01/44 | 4/19 at 100.00 | AA | | | 2,711,650 | |
| | 8,000 | | Beverly Hills Unified School District, Los Angeles County, California, General Obligation Bonds, Series 2009, 0.000%, 8/01/33 | No Opt. Call | Aa1 | | | 2,393,840 | |
| | 7,800 | | California County Tobacco Securitization Agency, Tobacco Settlement Asset-Backed Bonds, Los Angeles County Securitization Corporation, Series 2006A, 5.600%, 6/01/36 | 12/18 at 100.00 | B1 | | | 5,643,690 | |
| | 5,000 | | California Department of Water Resources Central Valley Project Water System Revenue Bonds, Series 2009-AF, 5.000%, 12/01/29 | No Opt. Call | AAA | | | 5,429,200 | |
| | 2,730 | | California Department of Water Resources, Water System Revenue Bonds, Central Valley Project, Series 2003Y, 5.000%, 12/01/25 – FGIC Insured | 6/13 at 100.00 | AAA | | | 2,876,929 | |
| | 1,350 | | California Educational Facilities Authority, Revenue Refunding Bonds, Loyola Marymount University, Series 2001A, 0.000%, 10/01/39 – NPFG Insured | No Opt. Call | A2 | | | 229,757 | |
| | 4,295 | | California Health Facilities Financing Authority, Health Facility Revenue Bonds, Adventist | 3/13 at 100.00 | A | | | 4,209,143 | |
| | | | Health System/West, Series 2003A, 5.000%, 3/01/33 California State, General Obligation Bonds, Various Purpose Series 2010: | | | | | | |
| | 7,000 | | 5.250%, 3/01/30 | 3/20 at 100.00 | A1 | | | 7,304,150 | |
| | 4,250 | | 5.250%, 11/01/40 | 11/20 at 100.00 | A1 | | | 4,349,450 | |
| | 25,000 | | California State, Various Purpose General Obligation Bonds, Series 2005, 4.750%, 3/01/35 – NPFG Insured (UB) | 3/16 at 100.00 | A1 | | | 24,126,500 | |
| | 9,000 | | California Statewide Community Development Authority, Revenue Bonds, Kaiser Permanante System, Series 2006, 5.250%, 3/01/45 | 3/16 at 100.00 | A+ | | | 9,028,710 | |
| | 1,550 | | California Statewide Community Development Authority, Revenue Bonds, St. Joseph Health System, Series 2007A, 5.750%, 7/01/47 – FGIC Insured | 7/18 at 100.00 | AA– | | | 1,572,196 | |
| | 10,445 | | Castaic Lake Water Agency, California, Certificates of Participation, Water System Improvement Project, Series 1999, 0.000%, 8/01/29 – AMBAC Insured | No Opt. Call | AA | | | 3,782,552 | |
| | 8,365 | | Cupertino Union School District, Santa Clara County, California, General Obligation Bonds, Series 2003B, 0.000%, 8/01/26 – FGIC Insured | 8/13 at 52.66 | Aa1 | | | 3,733,300 | |
| | 5,000 | | Golden State Tobacco Securitization Corporation, California, Enhanced Tobacco Settlement Asset-Backed Bonds, Series 2003B, 5.000%, 6/01/38 (Pre-refunded 6/01/13) – AMBAC Insured | 6/13 at 100.00 | Aaa | | | 5,349,250 | |
| | | Nuveen Municipal Market Opportunity Fund, Inc. (continued) |
| NMO | | Portfolio of Investments |
October 31, 2011
| | Principal | | | Optional Call | | | | | |
| | Amount (000) | | Description (1) | Provisions (2) | Ratings (3) | | | Value | |
| | | | California (continued) | | | | | | |
| | | | Golden State Tobacco Securitization Corporation, California, Enhanced Tobacco Settlement Asset-Backed Revenue Bonds, Series 2005A: | �� | | | | | |
| $ | 3,500 | | 0.000%, 6/01/26 – AGM Insured | No Opt. Call | AA+ | | $ | 1,618,540 | |
| | 3,000 | | 5.000%, 6/01/45 | 6/15 at 100.00 | A2 | | | 2,810,370 | |
| | 1,000 | | Golden State Tobacco Securitization Corporation, California, Tobacco Settlement Asset-Backed Bonds, Series 2007A-1, 5.125%, 6/01/47 | 6/17 at 100.00 | BB+ | | | 651,200 | |
| | 1,500 | | Lincoln Unified School District, Placer County, California, Community Facilities District 1, Special Tax Bonds, Series 2005, 0.000%, 9/01/26 – AMBAC Insured | No Opt. Call | N/R | | | 532,515 | |
| | 490 | | Los Angeles Department of Water and Power, California, Electric Plant Revenue Bonds, Second Series 1993, 4.750%, 10/15/20 (ETM) | 4/12 at 100.00 | AA– (4) | | | 491,509 | |
| | 995 | | Los Angeles Department of Water and Power, California, Electric Plant Revenue Bonds, Series 1994, 5.375%, 2/15/34 (ETM) | 2/12 at 100.00 | AA– (4) | | | 998,781 | |
| | 2,500 | | Los Angeles Department of Water and Power, California, Power System Revenue Bonds, Series 2005A-2, 5.000%, 7/01/22 – AGM Insured | No Opt. Call | AA+ | | | 2,768,500 | |
| | 5,000 | | Los Angeles Department of Water and Power, California, Waterworks Revenue Bonds, Series 2003A, 5.125%, 7/01/40 – FGIC Insured | 7/12 at 100.00 | AA | | | 5,049,350 | |
| | 2,000 | | Metropolitan Water District of Southern California, General Obligation Bonds, Series 2003A, 5.000%, 3/01/12 | No Opt. Call | AAA | | | 2,032,140 | |
| | 2,200 | | M-S-R Energy Authority, California, Gas Revenue Bonds, Citigroup Prepay Contracts, Series 2009B, 6.500%, 11/01/39 | No Opt. Call | A | | | 2,481,578 | |
| | 14,000 | | New Haven Unified School District, California, General Obligation Bonds, Refunding Series 2009, 0.000%, 8/01/34 – AGC Insured | No Opt. Call | AA+ | | | 3,463,460 | |
| | 1,000 | | Pajaro Valley Unified School District, Santa Cruz County, California, General Obligation Bonds, Series 2005B, 0.000%, 8/01/29 – AGM Insured | No Opt. Call | Aa2 | | | 345,910 | |
| | 5,000 | | Palomar Pomerado Health Care District, California, Certificates of Participation, Series 2010, 6.000%, 11/01/30 | 11/20 at 100.00 | Baa3 | | | 4,933,150 | |
| | 4,795 | | Palomar Pomerado Health, California, General Obligation Bonds, Election of 2004, Series 2007A, 5.000%, 8/01/32 – NPFG Insured | No Opt. Call | A+ | | | 4,836,333 | |
| | 3,205 | | San Diego Community College District, California, General Obligation Bonds, Series 2005, 5.000%, 5/01/25 – AGM Insured | 5/15 at 50.47 | AA+ | | | 3,473,387 | |
| | | | San Joaquin Hills Transportation Corridor Agency, Orange County, California, Toll Road Revenue Refunding Bonds, Series 1997A: | | | | | | |
| | 5,000 | | 5.650%, 1/15/17 – NPFG Insured | 1/14 at 102.00 | Baa1 | | | 4,638,150 | |
| | 26,000 | | 0.000%, 1/15/35 – NPFG Insured | No Opt. Call | Baa1 | | | 3,655,860 | |
| | 5,000 | | San Jose-Evergreen Community College District, Santa Clara County, California, General Obligation Bonds, Series 2005A, 0.000%, 9/01/28 – NPFG Insured | 9/15 at 50.47 | Aa1 | | | 1,858,950 | |
| | 7,345 | | Sanger Unified School District, Fresno County, California, General Obligation Bonds, Series 2006A, 5.000%, 8/01/27 – AGM Insured | 8/16 at 102.00 | AA+ | | | 7,755,292 | |
| | 4,825 | | Santa Monica Community College District, Los Angeles County, California, General Obligation Bonds, Series 2005C, 0.000%, 8/01/25 – NPFG Insured | 8/15 at 61.27 | Aa1 | | | 2,301,429 | |
| | 3,000 | | University of California, General Revenue Bonds, Series 2005F, 4.750%, 5/15/25 – AGM Insured | 5/13 at 101.00 | AA+ | | | 3,148,050 | |
| | 2,550 | | Vista Unified School District, San Diego County, California, General Obligation Bonds, Series 2004B, 5.000%, 8/01/28 – FGIC Insured | 8/13 at 100.00 | Aa2 | | | 2,648,507 | |
| | 210,040 | | Total California | | | | | 148,323,102 | |
| | | | Colorado – 10.2% (6.5% of Total Investments) | | | | | | |
| | 1,085 | | Arkansas River Power Authority, Colorado, Power Revenue Bonds, Series 2006, 5.250%, 10/01/40 – SYNCORA GTY Insured | 10/16 at 100.00 | BBB | | | 954,366 | |
| | 6,385 | | Broomfield, Colorado, Sales and Use Tax Revenue Refunding and Improvement Bonds, Series 2002A, 5.500%, 12/01/22 – AMBAC Insured | 12/12 at 100.00 | Aa3 | | | 6,645,380 | |
| | 3,250 | | Colorado Health Facilities Authority, Colorado, Revenue Bonds, Yampa Valley Medical Center, Series 2007, 5.125%, 9/15/29 | 9/17 at 100.00 | BBB | | | 3,023,053 | |
| | 7,200 | | Colorado Health Facilities Authority, Health Facilities Revenue Bonds, Sisters of Charity of Leavenworth Health Services Corporation, Series 2010A, 5.000%, 1/01/40 | No Opt. Call | AA | | | 7,119,000 | |
| | Principal | | | Optional Call | | | | | |
| | Amount (000) | | Description (1) | Provisions (2) | Ratings (3) | | | Value | |
| | | | Colorado (continued) | | | | | | |
| $ | 5,625 | | Denver City and County, Colorado, Airport System Revenue Bonds, Refunding Series 2006A, 5.000%, 11/15/11 – FGIC Insured (Alternative Minimum Tax) | No Opt. Call | A+ | | $ | 5,635,181 | |
| | | | E-470 Public Highway Authority, Colorado, Senior Revenue Bonds, Series 2000B: | | | | | | |
| | 6,200 | | 0.000%, 9/01/22 – NPFG Insured | No Opt. Call | Baa1 | | | 3,170,308 | |
| | 9,850 | | 0.000%, 9/01/30 – NPFG Insured | No Opt. Call | Baa1 | | | 2,762,827 | |
| | 15,960 | | 0.000%, 9/01/33 – NPFG Insured | No Opt. Call | Baa1 | | | 3,572,167 | |
| | | | E-470 Public Highway Authority, Colorado, Toll Revenue Bonds, Series 2004B: | | | | | | |
| | 3,800 | | 0.000%, 9/01/27 – NPFG Insured | 9/20 at 67.94 | Baa1 | | | 1,337,486 | |
| | 13,300 | | 0.000%, 9/01/31 – NPFG Insured | 9/20 at 53.77 | Baa1 | | | 3,362,373 | |
| | 6,250 | | 0.000%, 9/01/32 – NPFG Insured | 9/20 at 50.83 | Baa1 | | | 1,471,250 | |
| | 10,000 | | 0.000%, 3/01/36 – NPFG Insured | 9/20 at 41.72 | Baa1 | | | 1,805,400 | |
| | | | Lower Colorado River Authority, Texas, Contract Revenue bonds, Transmission Services Corporation, Series 2003B: | | | | | | |
| | 2,195 | | 5.000%, 5/15/31 (Pre-refunded 5/15/12) – AGM Insured | 5/12 at 100.00 | AA+ (4) | | | 2,249,897 | |
| | 9,655 | | 5.000%, 5/15/31 – AGM Insured | 5/12 at 100.00 | AA+ | | | 9,695,261 | |
| | 10,000 | | Regional Transportation District, Colorado, Denver Transit Partners Eagle P3 Project Private Activity Bonds, Series 2010, 6.500%, 1/15/30 | 7/20 at 100.00 | Baa3 | | | 10,712,000 | |
| | 110,755 | | Total Colorado | | | | | 63,515,949 | |
| | | | District of Columbia – 1.5% (1.0% of Total Investments) | | | | | | |
| | 10,000 | | Washington Convention Center Authority, District of Columbia, Dedicated Tax Revenue Bonds, Senior Lien Refunding Series 2007A, 4.500%, 10/01/30 – AMBAC Insured | 10/16 at 100.00 | A1 | | | 9,480,500 | |
| | | | Florida – 3.0% (1.9% of Total Investments) | | | | | | |
| | 4,715 | | Florida Housing Finance Corporation, Homeowner Mortgage Revenue Bonds, Series 2008, Trust 1191, 8.574%, 1/01/27 (Alternative Minimum Tax) (IF) | 1/17 at 100.00 | AA+ | | | 4,490,943 | |
| | 2,500 | | Miami-Dade County, Florida, Aviation Revenue Bonds, Miami International Airport, Series 2010A-1, 5.375%, 10/01/41 | 10/20 at 100.00 | A2 | | | 2,574,825 | |
| | 3,000 | | Miami-Dade County, Florida, Aviation Revenue Bonds, Miami International Airport, Series 2010B, 5.000%, 10/01/26 | 10/20 at 100.00 | A2 | | | 3,134,850 | |
| | 4,000 | | Orlando, Florida, Tourist Development Tax Revenue Bonds, Senior Lien 6th Cent Contract Payments, Series 2008A, 5.250%, 11/01/23 – AGC Insured | 11/17 at 100.00 | AA+ | | | 4,131,800 | |
| | 1,000 | | Orlando-Orange County Expressway Authority, Florida, Expressway Revenue Refunding Bonds, Series 2003A, 5.000%, 7/01/12 – AMBAC Insured | No Opt. Call | A | | | 1,030,320 | |
| | 3,500 | | South Miami Health Facilities Authority, Florida, Hospital Revenue, Baptist Health System Obligation Group, Series 2007, 5.000%, 8/15/37 | 8/17 at 100.00 | AA | | | 3,507,595 | |
| | 18,715 | | Total Florida | | | | | 18,870,333 | |
| | | | Georgia – 1.6% (1.0% of Total Investments) | | | | | | |
| | 10,000 | | Gainesville and Hall County Hospital Authority, Georgia, Revenue Anticipation Certificates, Northeast Georgia Health Services Inc., Series 2010B, 5.250%, 2/15/45 | 2/41 at 100.00 | A+ | | | 9,776,100 | |
| | | | Illinois – 16.8% (10.6% of Total Investments) | | | | | | |
| | 4,595 | | Bolingbrook, Illinois, General Obligation Refunding Bonds, Series 2002B, 0.000%, 1/01/32 – FGIC Insured | No Opt. Call | Aa3 | | | 1,303,785 | |
| | 1,470 | | Chicago Board of Education, Cook County, Illinois, General Obligation Bonds, Dedicated Revenues Series 2011A, 5.000%, 12/01/41 (WI/DD, Settling 11/01/11) | 12/21 at 100.00 | AA– | | | 1,470,515 | |
| | | | Chicago Board of Education, Illinois, Unlimited Tax General Obligation Bonds, Dedicated Tax Revenues, Series 1999A: | | | | | | |
| | 4,600 | | 0.000%, 12/01/20 – FGIC Insured | No Opt. Call | AA– | | | 3,177,128 | |
| | 1,000 | | 5.500%, 12/01/26 – FGIC Insured | No Opt. Call | AA– | | | 1,076,270 | |
| | 4,000 | | Chicago, Illinois, Motor Fuel Tax Revenue Bonds, Series 2003A, 5.000%, 1/01/33 – AMBAC Insured | 7/13 at 100.00 | AA+ | | | 4,033,120 | |
| | 5,000 | | Chicago, Illinois, Motor Fuel Tax Revenue Bonds, Series 2008A, 5.000%, 1/01/38 – AGC Insured | 1/18 at 100.00 | AA+ | | | 5,096,600 | |
| | 1,450 | | Chicago, Illinois, Motor Fuel Tax Revenue Refunding Bonds, Series 1993, 5.375%, 1/01/14 - AMBAC Insured | No Opt. Call | AA+ | | | 1,513,119 | |
| | 5,250 | | Chicago, Illinois, Revenue Bonds, Midway Airport, Series 1998B, 5.000%, 1/01/28 – NPFG Insured | 1/12 at 100.00 | A | | | 5,252,153 | |
| | 2,000 | | Chicago, Illinois, Third Lien General Airport Revenue Bonds, O’Hare International Airport, Series 2003C-2, 5.250%, 1/01/30 – AGM Insured (Alternative Minimum Tax) | 1/14 at 100.00 | AA+ | | | 2,003,700 | |
| | | Nuveen Municipal Market Opportunity Fund, Inc. (continued) |
| NMO | | Portfolio of Investments |
October 31, 2011
| | Principal | | | Optional Call | | | | | |
| | Amount (000) | | Description (1) | Provisions (2) | Ratings (3) | | | Value | |
| | | | Illinois (continued) | | | | | | |
| $ | 7,100 | | Cook County, Illinois, General Obligation Bonds, Refunding Series 2010A, 5.250%, 11/15/33 | 11/20 at 100.00 | AA | | $ | 7,339,838 | |
| | 1,780 | | Illinois Educational Facilities Authority, Revenue Bonds, University of Chicago, Refunding Series 2003A, 5.000%, 7/01/33 | 7/13 at 100.00 | Aa1 | | | 1,802,446 | |
| | 10,000 | | Illinois Finance Authority, Illinois, Northwestern University, Revenue Bonds, Series 2006, 5.000%, 12/01/42 (UB) | 12/15 at 100.00 | AAA | | | 10,463,100 | |
| | 3,000 | | Illinois Finance Authority, Revenue Bonds, Memorial Health System, Series 2009, 5.500%, 4/01/34 | No Opt. Call | A+ | | | 3,044,520 | |
| | 5,450 | | Illinois Finance Authority, Revenue Bonds, OSF Healthcare System, Refunding Series 2010A, 6.000%, 5/15/39 | 5/20 at 100.00 | A | | | 5,639,170 | |
| | 5,550 | | Illinois Finance Authority, Revenue Refunding Bonds, Silver Cross Hospital and Medical Centers, Series 2008A, 5.500%, 8/15/30 | 8/18 at 100.00 | BBB | | | 5,110,218 | |
| | 2,160 | | Illinois Health Facilities Authority, Revenue Bonds, Sherman Health Systems, Series 1997, 5.250%, 8/01/17 – AMBAC Insured | 2/12 at 100.00 | BBB | | | 2,162,009 | |
| | 5,025 | | Illinois Health Facilities Authority, Revenue Refunding Bonds, Elmhurst Memorial Healthcare, Series 2002, 5.625%, 1/01/28 | 1/13 at 100.00 | Baa1 | | | 5,026,809 | |
| | | | Lake and McHenry Counties Community Unit School District 118, Wauconda, Illinois, General Obligation Bonds, Series 2005B: | | | | | | |
| | 10,230 | | 0.000%, 1/01/22 – AGM Insured | 1/15 at 70.63 | Aa3 | | | 6,218,408 | |
| | 6,780 | | 0.000%, 1/01/24 – AGM Insured | 1/15 at 63.44 | Aa3 | | | 3,666,827 | |
| | 1,975 | | Lake County Community High School District 127, Grayslake, Illinois, General Obligation Bonds, Series 2002A, 9.000%, 2/01/13 – FGIC Insured | No Opt. Call | AAA | | | 2,165,252 | |
| | 2,330 | | Metropolitan Pier and Exposition Authority, Illinois, Revenue Bonds, McCormick Place Expansion Project, Refunding Series 2010B-2, 5.000%, 6/15/50 | No Opt. Call | AAA | | | 2,277,249 | |
| | | | Metropolitan Pier and Exposition Authority, Illinois, Revenue Bonds, McCormick Place Expansion Project, Series 2002A: | | | | | | |
| | 6,500 | | 0.000%, 6/15/25 – NPFG Insured | 6/22 at 101.00 | AAA | | | 5,368,675 | |
| | 3,270 | | 5.000%, 12/15/28 – NPFG Insured | 6/12 at 101.00 | AAA | | | 3,292,334 | |
| | 3,700 | | 0.000%, 6/15/30 – NPFG Insured | No Opt. Call | AAA | | | 1,277,018 | |
| | 3,280 | | 0.000%, 6/15/37 – NPFG Insured | No Opt. Call | AAA | | | 714,909 | |
| | 11,715 | | 0.000%, 12/15/38 – NPFG Insured | No Opt. Call | AAA | | | 2,335,620 | |
| | 6,500 | | Metropolitan Pier and Exposition Authority, Illinois, Revenue Refunding Bonds, McCormick Place Expansion Project, Series 2002B, 5.750%, 6/15/23 – NPFG Insured | 6/12 at 101.00 | AAA | | | 6,733,740 | |
| | 2,080 | | Midlothian, Illinois, General Obligation Bonds, Series 2010A, 5.250%, 2/01/34 | 2/20 at 100.00 | AA+ | | | 2,173,974 | |
| | 2,685 | | Sterling, Whiteside County, Illinois, General Obligation Bonds, Recovery Zone Facility Series 2010A, 5.250%, 5/01/31 – AGM Insured | 5/20 at 100.00 | AA+ | | | 2,815,303 | |
| | 130,475 | | Total Illinois | | | | | 104,553,809 | |
| | | | Indiana – 2.2% (1.4% of Total Investments) | | | | | | |
| | 3,400 | | Indiana Educational Facilities Authority, Revenue Bonds, Butler University, Series 2001, 5.500%, 2/01/26 – NPFG Insured | 2/12 at 100.00 | Baa1 | | | 3,408,976 | |
| | 4,030 | | Indiana Finance Authority Health System Revenue Bonds, Sisters of St. Francis Health Services, Inc. Obligated Group, Series 2009, 5.250%, 11/01/39 | 11/19 at 100.00 | Aa3 | | | 4,113,058 | |
| | 6,000 | | Indiana Finance Authority, Revenue Bonds, Trinity Health Care Group, Refunding Series 2009A, 5.250%, 12/01/38 | 12/19 at 100.00 | AA | | | 6,213,420 | |
| | 13,430 | | Total Indiana | | | | | 13,735,454 | |
| | | | Iowa – 0.8% (0.5% of Total Investments) | | | | | | |
| | 970 | | Iowa Finance Authority, Health Facility Revenue Bonds, Care Initiatives Project, Series 2006A, 5.000%, 7/01/19 | 7/16 at 100.00 | BB+ | | | 876,608 | |
| | 5,000 | | Iowa Tobacco Settlement Authority, Tobacco Asset-Backed Revenue Bonds, Series 2005B, 5.600%, 6/01/34 | 6/17 at 100.00 | BBB | | | 4,206,150 | |
| | 5,970 | | Total Iowa | | | | | 5,082,758 | |
| | | | Kansas – 1.2% (0.7% of Total Investments) | | | | | | |
| | 2,500 | | Kansas Development Finance Authority, Water Pollution Control Revolving Fund Leveraged Bonds, Series 2002-II, 5.500%, 11/01/21 (Pre-refunded 11/01/12) | 11/12 at 100.00 | AAA | | | 2,630,175 | |
| | 4,215 | | Overland Park Development Corporation, Kansas, First Tier Revenue Bonds, Overland Park Convention Center, Series 2007A, 5.125%, 1/01/22 – AMBAC Insured | 1/17 at 100.00 | Baa3 | | | 3,980,182 | |
| | Principal | | | Optional Call | | | | | |
| | Amount (000) | | Description (1) | Provisions (2) | Ratings (3) | | | Value | |
| | | | Kansas (continued) | | | | | | |
| $ | 600 | | Salina, Kansas, Hospital Revenue Bonds, Salina Regional Medical Center, Series 2006, 4.625%, 10/01/31 | 4/16 at 100.00 | A1 | | $ | 600,000 | |
| | 7,315 | | Total Kansas | | | | | 7,210,357 | |
| | | | Kentucky – 0.2% (0.1% of Total Investments) | | | | | | |
| | 1,000 | | Kentucky Economic Development Finance Authority, Louisville Arena Project Revenue Bonds, Louisville Arena Authority, Inc., Series 2008-A1, 6.000%, 12/01/38 – AGC Insured | 6/18 at 100.00 | AA+ | | | 1,058,620 | |
| | | | Louisiana – 3.7% (2.4% of Total Investments) | | | | | | |
| | 7,415 | | Louisiana Local Government Environmental Facilities and Community Development Authority, Revenue Bonds, Baton Rouge Community College Facilities Corporation, Series 2002, 5.000%, 12/01/32 – NPFG Insured | 12/12 at 100.00 | Baa1 | | | 6,968,543 | |
| | | | Louisiana Public Facilities Authority, Revenue Bonds, Baton Rouge General Hospital, Series 2004: | | | | | | |
| | 1,765 | | 5.250%, 7/01/24 – NPFG Insured | 7/14 at 100.00 | Baa1 | | | 1,842,448 | |
| | 3,350 | | 5.250%, 7/01/33 – NPFG Insured | 7/14 at 100.00 | Baa1 | | | 3,430,434 | |
| | 3,000 | | Louisiana State, Gasoline and Fuels Tax Revenue Bonds, Series 2002A, 5.000%, 6/01/32 – AMBAC Insured | 6/12 at 100.00 | Aa1 | | | 3,053,070 | |
| | 7,850 | | Tobacco Settlement Financing Corporation, Louisiana, Tobacco Settlement Asset-Backed Bonds, Series 2001B, 5.875%, 5/15/39 | 11/11 at 101.00 | A– | | | 7,855,181 | |
| | 23,380 | | Total Louisiana | | | | | 23,149,676 | |
| | | | Maryland – 1.2% (0.7% of Total Investments) | | | | | | |
| | 4,410 | | Maryland Community Development Administration, Department of Housing and Community Development, Residential Revenue Bonds, Series 2007D, 4.900%, 9/01/42 (Alternative Minimum Tax) | 3/17 at 100.00 | Aa2 | | | 4,276,686 | |
| | 2,500 | | Maryland Department of Transportation, Consolidated Transportation Revenue Bonds, Series 2002, 5.500%, 2/01/16 | No Opt. Call | AAA | | | 2,940,650 | |
| | 6,910 | | Total Maryland | | | | | 7,217,336 | |
| | | | Michigan – 3.3% (2.1% of Total Investments) | | | | | | |
| | 5,000 | | Detroit Water Supply System, Michigan, Water Supply System Revenue Bonds, Series 2006D, 4.625%, 7/01/32 – AGM Insured | 7/16 at 100.00 | AA+ | | | 4,747,450 | |
| | 5,000 | | Michigan State Hospital Finance Authority, Hospital Revenue Bonds, Henry Ford Health System, Refunding Series 2009, 5.750%, 11/15/39 | 11/19 at 100.00 | A1 | | | 5,120,950 | |
| | 3,050 | | Michigan Tobacco Settlement Finance Authority, Tobacco Settlement Asset-Backed Revenue Bonds, Series 2008A, 6.875%, 6/01/42 | 6/18 at 100.00 | B2 | | | 2,735,789 | |
| | 2,500 | | Okemos Public School District, Ingham County, Michigan, General Obligation Refunding Bonds, Series 1993, 0.000%, 5/01/12 – NPFG Insured | No Opt. Call | Aa3 | | | 2,485,825 | |
| | 1,150 | | Royal Oak Hospital Finance Authority, Michigan, Hospital Revenue Bonds, William Beaumont Hospital, Refunding Series 2009V, 8.250%, 9/01/39 | 9/18 at 100.00 | A1 | | | 1,366,534 | |
| | 3,795 | | Utica Community Schools, Macomb County, Michigan, General Obligation Bonds, Series 2004, 5.000%, 5/01/19 | 11/13 at 100.00 | AA | | | 4,060,271 | |
| | 20,495 | | Total Michigan | | | | | 20,516,819 | |
| | | | Minnesota – 0.8% (0.5% of Total Investments) | | | | | | |
| | 930 | | Minnesota Agricultural and Economic Development Board, Healthcare System Revenue Bonds, Fairview Hospital and Healthcare Services, Series 2000A, 6.375%, 11/15/29 | 11/11 at 100.00 | A | | | 930,846 | |
| | 1,285 | | Minnesota Housing Finance Agency, Single Family Remarketed Mortgage Bonds, Series 1998H-2, 6.050%, 7/01/31 (Alternative Minimum Tax) | 1/12 at 100.00 | AA+ | | | 1,317,343 | |
| | 2,555 | | St. Paul Housing and Redevelopment Authority, Minnesota, Sales Tax Revenue Refunding Bonds, Civic Center Project, Series 1996, 7.100%, 11/01/23 – AGM Insured | 11/15 at 103.00 | AA+ | | | 3,065,310 | |
| | 4,770 | | Total Minnesota | | | | | 5,313,499 | |
| | | | Mississippi – 0.9% (0.6% of Total Investments) | | | | | | |
| | 5,900 | | Mississippi Business Finance Corporation, Pollution Control Revenue Refunding Bonds, System Energy Resources Inc. Project, Series 1998, 5.875%, 4/01/22 | 4/12 at 100.00 | BBB | | | 5,929,500 | |
| | | Nuveen Municipal Market Opportunity Fund, Inc. (continued) |
| NMO | | Portfolio of Investments |
October 31, 2011
| | Principal | | | Optional Call | | | | | |
| | Amount (000) | | Description (1) | Provisions (2) | Ratings (3) | | | Value | |
| | | | Missouri – 0.8% (0.5% of Total Investments) | | | | | | |
| | | | Kansas City Municipal Assistance Corporation, Missouri, Leasehold Revenue Bonds, Series 2004B-1: | | | | | | |
| $ | 8,000 | | 0.000%, 4/15/27 – AMBAC Insured | No Opt. Call | AA– | | $ | 3,572,320 | |
| | 5,000 | | 0.000%, 4/15/31 – AMBAC Insured | No Opt. Call | AA– | | | 1,722,200 | |
| | 13,000 | | Total Missouri | | | | | 5,294,520 | |
| | | | Nebraska – 1.9% (1.2% of Total Investments) | | | | | | |
| | 11,690 | | Omaha Convention Hotel Corporation, Nebraska, Convention Center Revenue Bonds, Series 2007, 5.000%, 2/01/35 – AMBAC Insured | 2/17 at 100.00 | Aa3 | | | 11,951,622 | |
| | | | Nevada – 6.7% (4.2% of Total Investments) | | | | | | |
| | 15,000 | | Clark County, Nevada, Airport Revenue Bonds, Subordinate Lien Series 2010B, 5.750%, 7/01/42 | 1/20 at 100.00 | Aa3 | | | 16,104,300 | |
| | 11,615 | | Clark County, Nevada, Passenger Facility Charge Revenue Bonds, Las Vegas-McCarran International Airport, Series 2010A, 5.250%, 7/01/42 | 1/20 at 100.00 | Aa3 | | | 11,952,067 | |
| | | | Director of Nevada State Department of Business and Industry, Revenue Bonds, Las Vegas Monorail Project, First Tier, Series 2000: | | | | | | |
| | 6,125 | | 0.000%, 1/01/17 – AMBAC Insured | No Opt. Call | N/R | | | 1,050,438 | |
| | 8,500 | | 0.000%, 1/01/26 – AMBAC Insured | No Opt. Call | N/R | | | 850,000 | |
| | 7,860 | | 0.000%, 1/01/27 – AMBAC Insured | No Opt. Call | N/R | | | 741,198 | |
| | 19,300 | | 5.375%, 1/01/40 – AMBAC Insured (5) | 1/12 at 100.00 | N/R | | | 4,439,000 | |
| | 3,000 | | Las Vegas Valley Water District, Nevada, General Obligation Bonds, Series 2003B Refunding, 5.250%, 6/01/20 (Pre-refunded 12/01/12) – NPFG Insured | 12/12 at 100.00 | AA+ (4) | | | 3,160,170 | |
| | 2,135 | | Reno, Nevada, Capital Improvement Revenue Bonds, Series 2005B, 0.000%, 6/01/37 – FGIC Insured | 6/15 at 33.61 | A3 | | | 378,493 | |
| | 2,500 | | Reno, Nevada, Health Facilities Revenue Bonds, Catholic Healthcare West, Series 2007A, 18.534%, 7/01/31 – BHAC Insured (IF) | 7/17 at 100.00 | AA+ | | | 2,838,000 | |
| | 76,035 | | Total Nevada | | | | | 41,513,666 | |
| | | | New Hampshire – 0.5% (0.3% of Total Investments) | | | | | | |
| | 3,000 | | New Hampshire Business Finance Authority, Revenue Bonds, Elliot Hospital Obligated Group Issue, Series 2009A, 6.125%, 10/01/39 | 10/19 at 100.00 | BBB+ | | | 2,948,640 | |
| | | | New Jersey – 2.9% (1.8% of Total Investments) | | | | | | |
| | 18,400 | | New Jersey Health Care Facilities Financing Authority, Revenue Bonds, Saint Barnabas Health Care System, Series 2006A, 0.000%, 7/01/37 | 1/17 at 35.47 | BBB | | | 3,453,864 | |
| | 5,065 | | New Jersey Turnpike Authority, Revenue Bonds, Growth and Income Securities, Series 2004B, 0.000%, 1/01/35 – AMBAC Insured | 1/17 at 100.00 | A+ | | | 4,398,953 | |
| | 3,000 | | Rahway Valley Sewerage Authority, New Jersey, Sewer Revenue Bonds, Series 2005A, 0.000%, 9/01/25 – NPFG Insured | No Opt. Call | Aa2 | | | 1,464,630 | |
| | 3,525 | | Tobacco Settlement Financing Corporation, New Jersey, Tobacco Settlement Asset-Backed Bonds, Series 2002, 6.125%, 6/01/42 (Pre-refunded 6/01/12) | 6/12 at 100.00 | Aaa | | | 3,645,943 | |
| | 2,100 | | Tobacco Settlement Financing Corporation, New Jersey, Tobacco Settlement Asset-Backed Bonds, Series 2003, 6.375%, 6/01/32 (Pre-refunded 6/01/13) | 6/13 at 100.00 | Aaa | | | 2,269,533 | |
| | 4,000 | | Tobacco Settlement Financing Corporation, New Jersey, Tobacco Settlement Asset-Backed Bonds, Series 2007-1A, 5.000%, 6/01/41 | 6/17 at 100.00 | BB– | | | 2,663,320 | |
| | 36,090 | | Total New Jersey | | | | | 17,896,243 | |
| | | | New Mexico – 0.2% (0.1% of Total Investments) | | | | | | |
| | 1,275 | | University of New Mexico, Revenue Refunding Bonds, Series 1992A, 6.250%, 6/01/12 | No Opt. Call | AA | | | 1,306,607 | |
| | | | New York – 7.1% (4.5% of Total Investments) | | | | | | |
| | 7,000 | | Brooklyn Arena Local Development Corporation, New York, Payment in Lieu of Taxes Revenue Bonds, Barclays Center Project, Series 2009, 0.000%, 7/15/45 | No Opt. Call | BBB– | | | 852,600 | |
| | 2,500 | | Dormitory Authority of the State of New York, Revenue Bonds, The New York and Presbyterian Hospital Project, Series 2007, 5.250%, 8/15/26 – AGM Insured | 8/14 at 100.00 | AA+ | | | 2,657,925 | |
| | 2,000 | | Hudson Yards Infrastructure Corporation, New York, Revenue Bonds, Senior Fiscal 2012 Series 2011A, 5.250%, 2/15/47 | No Opt. Call | A | | | 2,034,400 | |
| | 3,000 | | Long Island Power Authority, New York, Electric System General Revenue Bonds, Series 2006B, 5.000%, 12/01/35 | 6/16 at 100.00 | A– | | | 3,060,750 | |
| | Principal | | | Optional Call | | | | | |
| | Amount (000) | | Description (1) | Provisions (2) | Ratings (3) | | | Value | |
| | | | New York (continued) | | | | | | |
| $ | 3,500 | | Monroe County Industrial Development Corporation, New York, FHA Insured Mortgage Revenue Bonds, Unity Hospital of Rochester Project, Series 2010, 5.750%, 8/15/30 | 2/21 at 100.00 | Aa2 | | $ | 3,960,915 | |
| | 5 | | New York City, New York, General Obligation Bonds, Fiscal Series 1997H, 6.125%, 8/01/25 | 2/12 at 100.00 | AA | | | 5,021 | |
| | 4,865 | | New York City, New York, General Obligation Bonds, Fiscal Series 2002A, 5.750%, 8/01/16 | 8/12 at 100.00 | AA | | | 5,039,459 | |
| | 135 | | New York City, New York, General Obligation Bonds, Fiscal Series 2002A, 5.750%, 8/01/16 (Pre-refunded 8/01/12) | 8/12 at 100.00 | Aa2 (4) | | | 140,571 | |
| | | | New York City, New York, General Obligation Bonds, Fiscal Series 2002G: | | | | | | |
| | 725 | | 5.000%, 8/01/17 | 8/12 at 100.00 | AA | | | 746,946 | |
| | 5,410 | | 5.750%, 8/01/18 | 8/12 at 100.00 | AA | | | 5,611,090 | |
| | | | New York City, New York, General Obligation Bonds, Fiscal Series 2002G: | | | | | | |
| | 275 | | 5.000%, 8/01/17 (Pre-refunded 8/01/12) | 8/12 at 100.00 | Aa2 (4) | | | 284,807 | |
| | 1,120 | | 5.750%, 8/01/18 (Pre-refunded 8/01/12) | 8/12 at 100.00 | AA (4) | | | 1,166,222 | |
| | 8,550 | | Port Authority of New York and New Jersey, Special Project Bonds, JFK International Air Terminal LLC Project, Eighth Series 2010, 5.500%, 12/01/31 | 12/20 at 100.00 | BBB– | | | 8,604,207 | |
| | 10,000 | | Port Authority of New York and New Jersey, Special Project Bonds, JFK International Air Terminal LLC, Sixth Series 1997, 5.750%, 12/01/22 – NPFG Insured (Alternative Minimum Tax) | 12/11 at 100.00 | Baa1 | | | 9,932,400 | |
| | 49,085 | | Total New York | | | | | 44,097,313 | |
| | | | North Carolina – 5.9% (3.7% of Total Investments) | | | | | | |
| | 1,900 | | Charlotte-Mecklenburg Hospital Authority, North Carolina, Healthcare System Revenue Bonds, DBA Carolinas Healthcare System, Series 2005A, 5.000%, 1/15/45 (Pre-refunded 1/15/15) | 1/15 at 100.00 | AA+ (4) | | | 2,152,681 | |
| | 17,000 | | North Carolina Capital Facilities Financing Agency, Revenue Bonds, Duke University, Series 2005A, 5.000%, 10/01/41 | 10/15 at 100.00 | AA+ | | | 17,631,890 | |
| | 3,000 | | North Carolina Eastern Municipal Power Agency, Power System Revenue Bonds, Series 2005, 5.250%, 1/01/20 – AMBAC Insured | 1/16 at 100.00 | A– | | | 3,351,510 | |
| | 4,000 | | North Carolina Medical Care Commission, Health System Revenue Bonds, Mission St. Joseph’s Health System, Series 2007, 4.500%, 10/01/31 (UB) | 10/17 at 100.00 | AA | | | 3,874,480 | |
| | 7,500 | | North Carolina Municipal Power Agency 1, Catawba Electric Revenue Bonds, Series 2003A, 5.250%, 1/01/19 – NPFG Insured | 1/13 at 100.00 | A | | | 7,830,600 | |
| | 1,900 | | North Carolina Turnpike Authority, Triangle Expressway System Revenue Bonds, Series 2009A, 5.750%, 1/01/39 – AGC Insured | 1/19 at 100.00 | AA+ | | | 2,047,003 | |
| | 35,300 | | Total North Carolina | | | | | 36,888,164 | |
| | | | North Dakota – 0.3% (0.2% of Total Investments) | | | | | | |
| | 1,500 | | Fargo, North Dakota, Health System Revenue Bonds, Sanford Health, Refunding Series 2011, 6.000%, 11/01/28 | 11/21 at 100.00 | AA– | | | 1,662,375 | |
| | | | Ohio – 8.2% (5.2% of Total Investments) | | | | | | |
| | | | Buckeye Tobacco Settlement Financing Authority, Ohio, Tobacco Settlement Asset-Backed Revenue Bonds, Senior Lien, Series 2007A-2: | | | | | | |
| | 110 | | 5.125%, 6/01/24 | 6/17 at 100.00 | BB– | | | 84,756 | |
| | 4,415 | | 5.375%, 6/01/24 | 6/17 at 100.00 | BB– | | | 3,488,071 | |
| | 1,250 | | 5.875%, 6/01/30 | 6/17 at 100.00 | BB– | | | 945,100 | |
| | 6,215 | | 5.750%, 6/01/34 | 6/17 at 100.00 | BB– | | | 4,510,598 | |
| | 4,300 | | 6.000%, 6/01/42 | 6/17 at 100.00 | BB– | | | 3,134,098 | |
| | 4,750 | | 5.875%, 6/01/47 | 6/17 at 100.00 | BB– | | | 3,374,305 | |
| | 6,000 | | Butler County, Ohio, Hospital Facilities Revenue Bonds, UC Health, Series 2010, 5.250%, 11/01/29 | 11/20 at 100.00 | BBB+ | | | 5,826,660 | |
| | 10,000 | | Columbus City School District, Franklin County, Ohio, General Obligation Bonds, Series 2006, 4.250%, 12/01/32 – AGM Insured (UB) | 12/16 at 100.00 | AA+ | | | 9,896,600 | |
| | 5,705 | | Montgomery County, Ohio, Hospital Facilities Revenue Bonds, Kettering Medical Center, Series1999, 6.300%, 4/01/12 | No Opt. Call | A | | | 5,822,979 | |
| | 5,500 | | Ohio Air Quality Development Authority, Ohio, Revenue Bonds, Ohio Valley Electric Corporation Project, Series 2009E, 5.625%, 10/01/19 | No Opt. Call | BBB– | | | 6,069,745 | |
| | 7,500 | | Ohio State, Hospital Facility Revenue Refunding Bonds, Cleveland Clinic Health System Obligated Group, Series 2009A, 5.500%, 1/01/39 | 1/19 at 100.00 | Aa2 | | | 7,816,950 | |
| | 55,745 | | Total Ohio | | | | | 50,969,862 | |
| | | Nuveen Municipal Market Opportunity Fund, Inc. (continued) |
| NMO | | Portfolio of Investments |
October 31, 2011
| | Principal | | | Optional Call | | | | | |
| | Amount (000) | | Description (1) | Provisions (2) | Ratings (3) | | | Value | |
| | | | Oklahoma – 0.3% (0.2% of Total Investments) | | | | | | |
| $ | 1,675 | | Oklahoma Development Finance Authority, Health System Revenue Bonds, Integris Baptist Medical Center, Series 2008B, 5.250%, 8/15/38 | 8/18 at 100.00 | AA– | | $ | 1,737,260 | |
| | | | Oregon – 0.8% (0.5% of Total Investments) | | | | | | |
| | 5,000 | | Oregon Health Sciences University, Revenue Bonds, Series 2002A, 5.250%, 7/01/22 – NPFG Insured | 1/13 at 100.00 | A1 | | | 5,093,750 | |
| | | | Pennsylvania – 5.4% (3.4% of Total Investments) | | | | | | |
| | 3,000 | | Allegheny County Hospital Development Authority, Pennsylvania, University of Pittsburgh Medical Center Revenue Bonds, Series 2009A, 5.625%, 8/15/39 | No Opt. Call | Aa3 | | | 3,128,340 | |
| | 5,000 | | Delaware County Industrial Development Authority, Pennsylvania, Resource Recovery Revenue Refunding Bonds, Series 1997A, 6.200%, 7/01/19 | 1/12 at 100.00 | Ba1 | | | 4,994,050 | |
| | 5,975 | | Pennsylvania Turnpike Commission, Motor License Fund-Enhanced Subordinate Special Revenue Bonds, Series 2010A-2, 0.000%, 12/01/34 | 12/20 at 100.00 | AA | | | 4,898,066 | |
| | 10,000 | | Pennsylvania Turnpike Commission, Turnpike Subordinate Revenue Bonds, Series 2009C, 0.000%, 6/01/33 – AGM Insured | 6/26 at 100.00 | AA– | | | 8,493,100 | |
| | 11,890 | | Philadelphia Hospitals and Higher Education Facilities Authority, Pennsylvania, Health System Revenue Bonds, Jefferson Health System, Series 2010B, 5.000%, 5/15/40 | 5/20 at 100.00 | AA | | | 12,092,249 | |
| | 35,865 | | Total Pennsylvania | | | | | 33,605,805 | |
| | | | Puerto Rico – 7.6% (4.8% of Total Investments) | | | | | | |
| | 3,330 | | Puerto Rico Aqueduct and Sewerage Authority, Revenue Bonds, Senior Lien Series 2008A, 6.000%, 7/01/44 | 7/18 at 100.00 | Baa2 | | | 3,454,475 | |
| | 8,000 | | Puerto Rico Electric Power Authority, Power Revenue Bonds, Series 2010XX, 5.750%, 7/01/36 | 7/20 at 100.00 | A3 | | | 8,402,880 | |
| | 4,300 | | Puerto Rico Housing Finance Authority, Capital Fund Program Revenue Bonds, Series 2003, 4.500%, 12/01/23 (UB) | 12/13 at 100.00 | AA+ | | | 4,351,858 | |
| | 8,200 | | Puerto Rico Housing Finance Authority, Capital Fund Program Revenue Bonds, Series 2003, 4.500%, 12/01/23 (Pre-refunded 12/01/13) (UB) | 12/13 at 100.00 | Aaa | | | 8,864,856 | |
| | 10,000 | | Puerto Rico Sales Tax Financing Corporation, Sales Tax Revenue Bonds, First Subordinate Series 2009A, 6.000%, 8/01/42 | 8/19 at 100.00 | A+ | | | 10,808,400 | |
| | 4,310 | | Puerto Rico Sales Tax Financing Corporation, Sales Tax Revenue Bonds, First Subordinate Series 2010C, 5.250%, 8/01/41 | 8/20 at 100.00 | A+ | | | 4,374,564 | |
| | 7,000 | | Puerto Rico Sales Tax Financing Corporation, Sales Tax Revenue Bonds, Series 2007A, 0.000%, 8/01/40 – NPFG Insured | No Opt. Call | Aa2 | | | 1,175,230 | |
| | 6,255 | | Puerto Rico, The Children’s Trust Fund, Tobacco Settlement Asset-Backed Refunding Bonds, Series 2002, 5.375%, 5/15/33 | 5/12 at 100.00 | BBB | | | 5,886,330 | |
| | 51,395 | | Total Puerto Rico | | | | | 47,318,593 | |
| | | | Rhode Island – 1.5% (0.9% of Total Investments) | | | | | | |
| | 5,815 | | Rhode Island Convention Center Authority, Lease Revenue Bonds, Series 2003A, 5.000%, 5/15/18 – AGM Insured | No Opt. Call | AA+ | | | 6,100,575 | |
| | 3,310 | | Rhode Island Tobacco Settlement Financing Corporation, Tobacco Settlement Asset-Backed Bonds, Series 2002A, 6.250%, 6/01/42 | 6/12 at 100.00 | BBB | | | 3,037,091 | |
| | 9,125 | | Total Rhode Island | | | | | 9,137,666 | |
| | | | South Carolina – 4.8% (3.1% of Total Investments) | | | | | | |
| | 24,730 | | Greenville County School District, South Carolina, Installment Purchase Revenue Bonds, Series 2002, 5.500%, 12/01/22 (Pre-refunded 12/01/12) | 12/12 at 101.00 | Aaa | | | 26,366,631 | |
| | 3,560 | | South Carolina Public Service Authority, Revenue Refunding Bonds, Santee Cooper Electric System, Series 2003A, 5.000%, 1/01/20 – AMBAC Insured | 7/13 at 100.00 | AA– | | | 3,766,373 | |
| | 28,290 | | Total South Carolina | | | | | 30,133,004 | |
| | | | Tennessee – 0.8% (0.5% of Total Investments) | | | | | | |
| | 5,000 | | Knox County Health, Educational and Housing Facilities Board, Tennessee, Hospital Revenue Bonds, East Tennessee Children’s Hospital, Series 2003A, 5.000%, 7/01/23 – RAAI Insured | 7/13 at 100.00 | BBB+ | | | 4,966,950 | |
| | Principal | | | Optional Call | | | | | |
| | Amount (000) | | Description (1) | Provisions (2) | Ratings (3) | | | Value | |
| | | | Texas – 12.0% (7.6% of Total Investments) | | | | | | |
| $ | 2,500 | | Alliance Airport Authority, Texas, Special Facilities Revenue Bonds, American Airlines Inc., Series 2007, 5.250%, 12/01/29 (Alternative Minimum Tax) (5) | 12/12 at 100.00 | CCC+ | | $ | 1,329,750 | |
| | 2,845 | | Cedar Hill Independent School District, Dallas County, Texas, General Obligation Bonds, Refunding School Building Series 2005, 5.000%, 8/15/34 | 8/15 at 100.00 | AAA | | | 3,061,618 | |
| | 1,000 | | Cedar Hill Independent School District, Dallas County, Texas, General Obligation Bonds, Series 2002, 0.000%, 8/15/32 – FGIC Insured | No Opt. Call | AA– | | | 346,420 | |
| | 1,500 | | Central Texas Regional Mobility Authority, Senior Lien Revenue Bonds, Series 2011, 5.750%, 1/01/31 | 1/21 at 100.00 | BBB– | | | 1,515,825 | |
| | 15,000 | | Central Texas Regional Mobility Authority, Travis and Williamson Counties, Toll Road Revenue Bonds, Series 2005, 5.000%, 1/01/45 – FGIC Insured | 1/15 at 100.00 | BBB | | | 12,971,400 | |
| | 2,500 | | Comal Independent School District, Comal, Bexar, Guadalupe, Hays, and Kendall Counties, Texas, General Obligation Bonds, Series 2005A, 0.000%, 2/01/23 | No Opt. Call | Aaa | | | 1,725,900 | |
| | 6,000 | | Dallas-Ft. Worth International Airport Facility Improvement Corporation, Texas, Revenue Bonds, American Airlines Inc., Series 1999, 6.375%, 5/01/35 (Alternative Minimum Tax) (5) | 5/12 at 100.00 | CCC+ | | | 3,311,040 | |
| | 2,200 | | Denton Independent School District, Denton County, Texas, General Obligation Bonds, Refunding Series 2004, 5.000%, 8/15/33 | 8/14 at 100.00 | AAA | | | 2,267,056 | |
| | | | Ennis Independent School District, Ellis County, Texas, General Obligation Bonds, Series 2006: | | | | | | |
| | 3,950 | | 0.000%, 8/15/30 | 8/16 at 49.21 | Aaa | | | 1,562,146 | |
| | 4,000 | | 0.000%, 8/15/31 | 8/16 at 46.64 | Aaa | | | 1,491,840 | |
| | 1,715 | | Houston, Texas, Hotel Occupancy Tax and Special Revenue Bonds, Convention and Entertainment Project, Series 2001B, 0.000%, 9/01/32 – AMBAC Insured | No Opt. Call | A2 | | | 476,290 | |
| | 1,250 | | Houston, Texas, Junior Lien Water and Sewerage System Revenue Refunding Bonds, Series 2001A, 5.000%, 12/01/20 – AGM Insured | 6/12 at 100.00 | AA+ | | | 1,255,025 | |
| | 2,400 | | Houston, Texas, Senior Lien Airport System Revenue Bonds, Refunding Series 2009A, 5.500%, 7/01/39 | 7/18 at 100.00 | AA– | | | 2,551,656 | |
| | 9,350 | | Leander Independent School District, Williamson and Travis Counties, Texas, General Obligation Bonds, Series 2005, 0.000%, 8/15/32 – FGIC Insured | 8/15 at 39.50 | AAA | | | 3,059,788 | |
| | 6,000 | | Leander Independent School District, Williamson and Travis Counties, Texas, General Obligation Bonds, Series 2006, 0.000%, 8/15/33 | 8/14 at 35.28 | AAA | | | 1,853,760 | |
| | 3,525 | | Marble Falls Independent School District, Burnet County, Texas, General Obligation Bonds, Series 2007, 5.000%, 8/15/34 | 8/16 at 100.00 | Aaa | | | 3,731,354 | |
| | 5,250 | | Midlothian Independent School District, Ellis County, Texas, General Obligation Bonds, Series 2005, 5.000%, 2/15/34 | 2/15 at 100.00 | Aaa | | | 5,433,698 | |
| | 4,000 | | North Texas Tollway Authority, First Tier System Revenue Refunding Bonds, Capital Appreciation Series 2008I, 0.000%, 1/01/43 | 1/25 at 100.00 | A2 | | | 3,690,400 | |
| | 3,755 | | Northside Independent School District, Bexar County, Texas, General Obligation Bonds, Series 2001A, 5.000%, 8/01/31 | 2/12 at 100.00 | AAA | | | 3,766,040 | |
| | 3,500 | | San Antonio, Texas, Electric and Gas Revenue Bonds, Series 2008A, 5.500%, 2/01/12 | No Opt. Call | Aa1 | | | 3,546,375 | |
| | 3,295 | | Tarrant County Cultural & Educational Facilities Financing Corporation, Texas, Revenue Bonds, Series 2007, Residuals 1762, 17.044%, 2/15/36 (IF) | 2/17 at 100.00 | AA– | | | 3,394,509 | |
| | 2,890 | | Tarrant County Cultural Education Facilities Finance Corporation, Texas, Hospital Revenue Bonds, Scott & White HealthCare Project, Series 2010, 5.500%, 8/15/45 | 8/20 at 100.00 | A1 | | | 2,957,453 | |
| | 5,000 | | Texas Turnpike Authority, Central Texas Turnpike System Revenue Bonds, First Tier Series 2002A, 5.750%, 8/15/38 – AMBAC Insured | 8/12 at 100.00 | BBB+ | | | 5,019,600 | |
| | 5,000 | | White Settlement Independent School District, Tarrant County, Texas, General Obligation Bonds, Series 2005, 0.000%, 8/15/34 | 8/15 at 36.81 | AAA | | | 1,539,450 | |
| | | | Wylie Independent School District, Collin County, Texas, General Obligation Bonds, Series 2005: | | | | | | |
| | 3,000 | | 0.000%, 8/15/23 | 8/15 at 67.10 | AAA | | | 1,774,380 | |
| | 2,000 | | 0.000%, 8/15/24 | 8/15 at 63.56 | AAA | | | 1,113,200 | |
| | 103,425 | | Total Texas | | | | | 74,745,973 | |
| | | Nuveen Municipal Market Opportunity Fund, Inc. (continued) |
| NMO | | Portfolio of Investments |
October 31, 2011
| | Principal | | | Optional Call | | | | | |
| | Amount (000) | | Description (1) | Provisions (2) | Ratings (3) | | | Value | |
| | | | Utah – 0.5% (0.3% of Total Investments) | | | | | | |
| $ | 3,000 | | Riverton, Utah, Hospital Revenue Bonds, IHC Health Services, Inc., Series 2009, 5.000%, 8/15/41 | 8/19 at 100.00 | AA+ | | $ | 3,045,210 | |
| | | | Virginia – 2.8% (1.8% of Total Investments) | | | | | | |
| | 21,500 | | Metropolitan Washington DC Airports Authority, Virginia, Dulles Toll Road Revenue Bonds, Series 2009C, 0.000%, 10/01/41 – AGC Insured | 10/26 at 100.00 | AA+ | | | 17,654,725 | |
| | | | Washington – 8.8% (5.5% of Total Investments) | | | | | | |
| | 2,755 | | Cowlitz County, Washington, Special Sewerage Revenue Refunding Bonds, CSOB Wastewater Treatment Facilities, Series 2002, 5.500%, 11/01/16 – FGIC Insured | No Opt. Call | A1 | | | 3,044,165 | |
| | 1,235 | | Energy Northwest, Washington, Electric Revenue Bonds, Nuclear Project 1, Series 2006A, 5.000%, 7/01/12 | No Opt. Call | Aa1 | | | 1,274,174 | |
| | 1,830 | | Kennewick Public Facilities District, Washington, Sales Tax Revenue Bonds,
Series 2003, 5.000%, 12/01/20 – AMBAC Insured | 6/13 at 100.00 | A1 | | | 1,908,928 | |
| | | | King County, Washington, Sewer Revenue Bonds, Series 2001: | | | | | | |
| | 820 | | 5.000%, 1/01/23 (Pre-refunded 1/01/12) – FGIC Insured | 1/12 at 100.00 | Aa2 (4) | | | 826,585 | |
| | 1,680 | | 5.000%, 1/01/23 (Pre-refunded 1/01/12) – FGIC Insured | 1/12 at 100.00 | AA+ (4) | | | 1,693,490 | |
| | 3,050 | | Port of Seattle, Washington, Revenue Bonds, Series 2001A, 5.000%, 4/01/31 – FGIC Insured | 4/12 at 100.00 | Aa2 | | | 3,052,013 | |
| | 2,150 | | Seattle, Washington, General Obligation Refunding and Improvement Bonds, Series 2002, 4.500%, 12/01/20 | 12/12 at 100.00 | AAA | | | 2,197,601 | |
| | 5,000 | | Seattle, Washington, General Obligation Refunding Bonds, Series 2002, 5.200%, 7/01/32 | No Opt. Call | AAA | | | 5,099,500 | |
| | 3,000 | | Spokane County School District 81, Spokane, Washington, General Obligation Bonds, Series 2005, 5.000%, 6/01/24 – NPFG Insured | 6/15 at 100.00 | Aa1 | | | 3,204,450 | |
| | 8,000 | | Washington State Health Care Facilities Authority, Revenue Bonds, MultiCare Health System, Series 2008A, 5.250%, 8/15/34 – AGM Insured | 5/18 at 100.00 | AA+ | | | 8,273,760 | |
| | 10,340 | | Washington State Tobacco Settlement Authority, Tobacco Settlement Asset-Backed Revenue Bonds, Series 2002, 6.500%, 6/01/26 | 6/13 at 100.00 | A3 | | | 10,516,089 | |
| | 9,000 | | Washington State, Motor Vehicle Fuel Tax General Obligation Bonds, Series 2002C, 5.000%, 1/01/21 (Pre-refunded 1/01/12) – AGM Insured | 1/12 at 100.00 | AA+ (4) | | | 9,072,269 | |
| | 9,000 | | Washington State, Motor Vehicle Fuel Tax General Obligation Bonds, Series 2003C, 0.000%, 6/01/28 – FGIC Insured | No Opt. Call | AA+ | | | 4,412,249 | |
| | 57,860 | | Total Washington | | | | | 54,575,273 | |
| | | | Wisconsin – 2.5% (1.6% of Total Investments) | | | | | | |
| | 1,675 | | Badger Tobacco Asset Securitization Corporation, Wisconsin, Tobacco Settlement Asset-Backed Bonds, Series 2002, 6.125%, 6/01/27 (Pre-refunded 6/01/12) | 6/12 at 100.00 | Aaa | | | 1,731,430 | |
| | 1,755 | | Wisconsin Health and Educational Facilities Authority, Revenue Bonds, Divine Savior Healthcare, Series 2006, 4.750%, 5/01/25 | 5/16 at 100.00 | BBB | | | 1,630,570 | |
| | 1,250 | | Wisconsin Health and Educational Facilities Authority, Revenue Bonds, United Lutheran Program for the Aging Inc., Series 1998, 5.700%, 3/01/28 | 3/12 at 100.00 | N/R | | | 1,147,787 | |
| | 9,920 | | Wisconsin State, General Fund Annual Appropriation Revenue Bonds, Refunding Series 2009A, 5.750%, 5/01/33 | 5/19 at 100.00 | AA– | | | 11,038,677 | |
| | 14,600 | | Total Wisconsin | | | | | 15,548,464 | |
| | Principal | | | Optional Call | | | | | |
| | Amount (000) | | Description (1) | Provisions (2) | Ratings (3) | | | Value | |
| | | | Wyoming – 0.7% (0.5% of Total Investments) | | | | | | |
| $ | 4,080 | | Campbell County, Wyoming Solid Waste Facilities Revenue Bonds, Basin Electric Power Cooperative – Dry Fork Station Facilities, Series 2009A, 5.750%, 7/15/39 | 7/19 at 100.00 | A1 | | $ | 4,432,185 | |
| $ | 1,232,535 | | Total Investments (cost $999,529,521) – 158.2% | | | | | 985,313,481 | |
| | | | Floating Rate Obligations – (7.0)% | | | | | (43,530,000 | ) |
| | | | Variable Rate Demand Preferred Shares, at Liquidation Value- (56.3)% (6) | | | | | (350,900,000 | ) |
| | | | Other Assets Less Liabilities – 5.1% | | | | | 31,931,154 | |
| | | | Net Assets Applicable to Common Shares – 100% | | | | $ | 622,814,635 | |
| (1) | | All percentages shown in the Portfolio of Investments are based on net assets applicable to Common shares unless otherwise noted. |
| (2) | | Optional Call Provisions (not covered by the report of independent registered public accounting firm): Dates (month and year) and prices of the earliest optional call or redemption. There may be other call provisions at varying prices at later dates. Certain mortgage-backed securities may be subject to periodic principal paydowns. |
| (3) | | Ratings (not covered by the report of independent registered public accounting firm): Using the highest of Standard & Poor’s Group (“Standard & Poor’s”), Moody’s Investors Service, Inc. (“Moody’s”) or Fitch, Inc. (“Fitch”) rating. Ratings below BBB by Standard & Poor’s, Baa by Moody’s or BBB by Fitch are considered to be below investment grade. Holdings designated N/R are not rated by any of these national rating agencies. |
| (4) | | Backed by an escrow or trust containing sufficient U.S. Government or U.S. Government agency securities, which ensure the timely payment of principal and interest. Bonds backed by U.S. Government or agency securities are given an implied rating equal to the rating of such securities. |
| (5) | | At or subsequent to the end of the reporting period, this security is non-income producing. Non-income producing security, in the case of a bond, generally denotes that the issuer has (1) defaulted on the payment of principal or interest, (2) is under the protection of the Federal Bankruptcy Court or (3) the Fund’s Adviser has concluded that the issue is not likely to meet its future interest payment obligations and has directed the Fund’s custodian to cease accruing additional income on the Fund’s records. |
| (6) | | Variable Rate Demand Preferred Shares, at Liquidation Value as a percentage of Total Investments is 35.6%. |
| N/R | | Not rated. |
| WI/DD | | Purchased on a when-issued or delayed delivery basis. |
| (ETM) | | Escrowed to maturity. |
| (IF) | | Inverse floating rate investment. |
| (UB) | | Underlying bond of an inverse floating rate trust reflected as a financing transaction. See Notes to Financial Statements, Footnote 1 – General Information and Significant Accounting Policies, Inverse Floating Rate Securities for more information. |
See accompanying notes to financial statements.
| | | Nuveen Dividend Advantage Municipal Fund |
| NAD | | Portfolio of Investments |
October 31, 2011
| | Principal | | | Optional Call | | | | | |
| | Amount (000) | | Description (1) | Provisions (2) | Ratings (3) | | | Value | |
| | | | Municipal Bonds – 152.2% (99.9% of Total Investments) | | | | | | |
| | | | Alabama – 0.3% (0.2% of Total Investments) | | | | | | |
| $ | 1,600 | | Alabama 21st Century Authority, Tobacco Settlement Revenue Bonds, Series 2000, 5.750%, 12/01/20 | 12/11 at 101.00 | A1 | | $ | 1,609,392 | |
| | | | Alaska – 0.1% (0.1% of Total Investments) | | | | | | |
| | 750 | | Alaska Housing Finance Corporation, General Housing Purpose Bonds, Series 2005A, 5.250%, 12/01/34 – FGIC Insured (UB) | 12/14 at 100.00 | AA+ | | | 766,433 | |
| | | | Arizona – 2.8% (1.9% of Total Investments) | | | | | | |
| | | | Phoenix Civic Improvement Corporation, Arizona, Senior Lien Airport Revenue Bonds, Series 2008A: | | | | | | |
| | 2,350 | | 5.000%, 7/01/33 | 7/18 at 100.00 | AA– | | | 2,440,875 | |
| | 8,200 | | 5.000%, 7/01/38 | 7/18 at 100.00 | AA– | | | 8,469,124 | |
| | | | Salt Verde Financial Corporation, Arizona, Senior Gas Revenue Bonds, Citigroup Energy Inc Prepay Contract Obligations, Series 2007: | | | | | | |
| | 500 | | 5.500%, 12/01/29 | No Opt. Call | A | | | 497,890 | |
| | 5,000 | | 5.000%, 12/01/37 | No Opt. Call | A | | | 4,534,850 | |
| | 16,050 | | Total Arizona | | | | | 15,942,739 | |
| | | | California – 9.7% (6.4% of Total Investments) | | | | | | |
| | 1,535 | | Alameda Corridor Transportation Authority, California, Senior Lien Revenue Bonds, Series 1999A, 0.000%, 10/01/37 – NPFG Insured | No Opt. Call | A | | | 291,773 | |
| | 6,000 | | Anaheim Public Finance Authority, California, Subordinate Lease Revenue Bonds, Public Improvement Project, Series 1997C, 0.000%, 9/01/28 – AGM Insured | No Opt. Call | AA– | | | 1,980,240 | |
| | 3,000 | | California Health Facilities Financing Authority, Revenue Bonds, Sutter Health, Series 2007A, 5.000%, 11/15/42 | 11/16 at 100.00 | AA– | | | 2,955,720 | |
| | 5,000 | | California State, General Obligation Bonds, Series 2005, 5.000%, 3/01/31 | 3/16 at 100.00 | A1 | | | 5,062,750 | |
| | 4,250 | | California State, General Obligation Bonds, Various Purpose Series 2010, 5.250%, 11/01/40 | 11/20 at 100.00 | A1 | | | 4,349,450 | |
| | 6,750 | | California Statewide Community Development Authority, Revenue Bonds, Methodist Hospital Project, Series 2009, 6.750%, 2/01/38 | 8/19 at 100.00 | Aa2 | | | 7,679,408 | |
| | 65 | | California, General Obligation Bonds, Series 1997, 5.000%, 10/01/18 – AMBAC Insured | 4/12 at 100.00 | A1 | | | 65,211 | |
| | 5,000 | | Corona-Norco Unified School District, Riverside County, California, General Obligation Bonds, Election 2006 Series 2007A, 5.000%, 8/01/31 – AGM Insured | No Opt. Call | AA+ | | | 5,175,000 | |
| | 2,000 | | Dublin Unified School District, Alameda County, California, General Obligation Bonds, Series 2007C, 0.000%, 8/01/31 – NPFG Insured | 8/17 at 49.41 | Aa2 | | | 576,680 | |
| | | | Golden State Tobacco Securitization Corporation, California, Enhanced Tobacco Settlement Asset-Backed Revenue Bonds, Series 2005A: | | | | | | |
| | 3,500 | | 0.000%, 6/01/26 – AGM Insured | No Opt. Call | AA+ | | | 1,618,540 | |
| | 9,925 | | 5.000%, 6/01/45 – AGC Insured | 6/15 at 100.00 | AA+ | | | 9,444,829 | |
| | | | Golden State Tobacco Securitization Corporation, California, Tobacco Settlement Asset-Backed Bonds, Series 2007A-1: | | | | | | |
| | 5,860 | | 5.000%, 6/01/33 | 6/17 at 100.00 | BB+ | | | 4,140,559 | |
| | 1,000 | | 5.125%, 6/01/47 | 6/17 at 100.00 | BB+ | | | 651,200 | |
| | 2,200 | | M-S-R Energy Authority, California, Gas Revenue Bonds, Series 2009C, 6.500%, 11/01/39 | No Opt. Call | A | | | 2,481,578 | |
| | 2,000 | | Murrieta Valley Unified School District Public Financing Authority, California, Special Tax Revenue Bonds, Series 2006A, 5.125%, 9/01/26 – AGM Insured | 9/16 at 100.00 | AA+ | | | 2,076,060 | |
| | 765 | | Palmdale Civic Authority, California, Revenue Refinancing Bonds, Civic Center Project, Series 1997A, 5.375%, 7/01/12 – NPFG Insured | 1/12 at 100.00 | Baa1 | | | 766,744 | |
| | 2,000 | | Riverside Unified School District, Riverside County, California, General Obligation Bonds, Election 2001 Series 2006B, 5.000%, 8/01/30 – AGC Insured | 8/15 at 101.00 | Aa2 | | | 2,034,920 | |
| | | | San Joaquin Hills Transportation Corridor Agency, Orange County, California, Toll Road Revenue Refunding Bonds, Series 1997A: | | | | | | |
| | 2,000 | | 0.000%, 1/15/29 – NPFG Insured | No Opt. Call | Baa1 | | | 474,800 | |
| | 17,000 | | 0.000%, 1/15/35 – NPFG Insured | No Opt. Call | Baa1 | | | 2,390,370 | |
| | Principal | | | Optional Call | | | | | |
| | Amount (000) | | Description (1) | Provisions (2) | Ratings (3) | | | Value | |
| | | | California (continued) | | | | | | |
| $ | 575 | | Seaside Redevelopment Agency, California, Tax Allocation Bonds, Merged Project Area, Series 2003, 5.375%, 8/01/18 – NPFG Insured | 8/13 at 100.00 | A | | $ | 590,450 | |
| | 80,425 | | Total California | | | | | 54,806,282 | |
| | | | Colorado – 6.5% (4.2% of Total Investments) | | | | | | |
| | 1,125 | | Antelope Heights Metropolitan District, Colorado, Limited Tax General Obligation Bonds, Series 2007, 5.000%, 12/01/37 – RAAI Insured | 12/17 at 100.00 | N/R | | | 819,968 | |
| | 3,330 | | Colorado Health Facilities Authority, Colorado, Revenue Bonds, Catholic Health Initiatives, Series 2009A, 5.500%, 7/01/34 | 7/19 at 100.00 | AA | | | 3,494,136 | |
| | | | Denver City and County, Colorado, Airport Special Facilities Revenue Bonds, Rental Car Projects, Series 1999A: | | | | | | |
| | 2,170 | | 6.000%, 1/01/12 – NPFG Insured (Alternative Minimum Tax) | No Opt. Call | A– | | | 2,179,808 | |
| | 675 | | 6.000%, 1/01/13 – NPFG Insured (Alternative Minimum Tax) | 1/12 at 100.00 | A– | | | 677,626 | |
| | 4,500 | | Denver City and County, Colorado, Airport System Revenue Refunding Bonds, Series 2001A, 5.500%, 11/15/11 – FGIC Insured (Alternative Minimum Tax) | No Opt. Call | A+ | | | 4,509,000 | |
| | 8,515 | | E-470 Public Highway Authority, Colorado, Senior Revenue Bonds, Series 1997B, 0.000%, 9/01/25 – NPFG Insured | No Opt. Call | Baa1 | | | 3,487,574 | |
| | 25,000 | | E-470 Public Highway Authority, Colorado, Senior Revenue Bonds, Series 2000B, 0.000%, 9/01/31 – NPFG Insured | No Opt. Call | Baa1 | | | 6,492,000 | |
| | 60,000 | | E-470 Public Highway Authority, Colorado, Toll Revenue Bonds, Series 2004A, 0.000%, 3/01/36 – NPFG Insured | No Opt. Call | Baa1 | | | 11,087,400 | |
| | 12,500 | | E-470 Public Highway Authority, Colorado, Toll Revenue Bonds, Series 2006B, 0.000%, 9/01/38 – NPFG Insured | 9/26 at 54.77 | Baa1 | | | 1,829,125 | |
| | 2,000 | | Metropolitan Football Stadium District, Colorado, Sales Tax Revenue Bonds, Series 1999A, 0.000%, 1/01/12 – NPFG Insured | No Opt. Call | Baa1 | | | 1,994,960 | |
| | 119,815 | | Total Colorado | | | | | 36,571,597 | |
| | | | Connecticut – 0.3% (0.2% of Total Investments) | | | | | | |
| | 4,335 | | Mashantucket Western Pequot Tribe, Connecticut, Subordinate Special Revenue Bonds, Series 2007A, 5.750%, 9/01/34 | 11/17 at 100.00 | N/R | | | 1,594,933 | |
| | | | Florida – 10.9% (7.2% of Total Investments) | | | | | | |
| | 1,185 | | Florida Housing Finance Agency, Housing Revenue Bonds, Mar Lago Village Apartments, Series 1997F, 5.800%, 12/01/17 – AMBAC Insured (Alternative Minimum Tax) | 12/11 at 100.00 | N/R | | | 1,185,818 | |
| | 15,000 | | Florida State Board of Education, Public Education Capital Outlay Bonds, Series 2005E, 4.500%, 6/01/35 (UB) | 6/15 at 101.00 | AAA | | | 15,033,300 | |
| | 2,500 | | Marion County Hospital District, Florida, Revenue Bonds, Munroe Regional Medical Center, Series 2007, 5.000%, 10/01/34 | 10/17 at 100.00 | A3 | | | 2,402,650 | |
| | 13,625 | | Martin County Industrial Development Authority, Florida, Industrial Development Revenue Bonds, Indiantown Cogeneration LP, Series 1994A, 7.875%, 12/15/25 (Alternative Minimum Tax) | 12/11 at 100.00 | BB+ | | | 13,667,510 | |
| | | | South Miami Health Facilities Authority, Florida, Hospital Revenue, Baptist Health System Obligation Group, Series 2007: | | | | | | |
| | 22,000 | | 5.000%, 8/15/37 (UB) | 8/17 at 100.00 | AA | | | 22,047,740 | |
| | 7,370 | | 5.000%, 8/15/42 (UB) | 8/17 at 100.00 | AA | | | 7,363,662 | |
| | 61,680 | | Total Florida | | | | | 61,700,680 | |
| | | | Georgia – 1.7% (1.1% of Total Investments) | | | | | | |
| | 5,000 | | Cobb County Development Authority, Georgia, Student Housing Revenue Bonds, KSU Village II Real Estate Foundation LLC Project, Series 2007A, 5.250%, 7/15/38 – AMBAC Insured | 7/17 at 100.00 | Baa2 | | | 4,670,100 | |
| | 5,000 | | Franklin County Industrial Building Authority, Georgia, Revenue Bonds, Ty Cobb Regional Medical Center Project, Series 2010, 8.000%, 12/01/40 | 12/20 at 100.00 | N/R | | | 5,122,400 | |
| | 10,000 | | Total Georgia | | | | | 9,792,500 | |
| | | | Idaho – 0.1% (0.0% of Total Investments) | | | | | | |
| | 100 | | Idaho Housing and Finance Association, Single Family Mortgage Bonds, Series 1999E, 5.750%, 1/01/21 (Alternative Minimum Tax) | 1/12 at 100.00 | Aa2 | | | 104,152 | |
| | 125 | | Idaho Housing and Finance Association, Single Family Mortgage Bonds, Series 2000D, 6.350%, 7/01/22 (Alternative Minimum Tax) | 1/12 at 100.00 | Aa2 | | | 127,544 | |
| | | Nuveen Dividend Advantage Municipal Fund (continued) |
| NAD | | Portfolio of Investments |
October 31, 2011
| | Principal | | | Optional Call | | | | | |
| | Amount (000) | | Description (1) | Provisions (2) | Ratings (3) | | | Value | |
| | | | Idaho (continued) | | | | | | |
| $ | 165 | | Idaho Housing and Finance Association, Single Family Mortgage Bonds, Series 2000E, 5.950%, 7/01/20 (Alternative Minimum Tax) | 1/12 at 100.00 | Aaa | | $ | 167,378 | |
| | 390 | | Total Idaho | | | | | 399,074 | |
| | | | Illinois – 27.5% (18.0% of Total Investments) | | | | | | |
| | 1,070 | | Channahon, Illinois, Revenue Refunding Bonds, Morris Hospital, Series 1999, 5.750%, 12/01/12 | 12/11 at 100.00 | BBB+ | | | 1,072,761 | |
| | 2,205 | | Chicago Board of Education, Illinois, Unlimited Tax General Obligation Bonds, Dedicated Tax Revenues, Series 1998B-1, 0.000%, 12/01/29 – FGIC Insured | No Opt. Call | AA– | | | 792,852 | |
| | 7,250 | | Chicago Board of Education, Illinois, Unlimited Tax General Obligation Bonds, Dedicated Tax Revenues, Series 1999A, 5.500%, 12/01/26 – FGIC Insured | No Opt. Call | AA– | | | 7,802,958 | |
| | | | Chicago, Illinois, FHA/GNMA Multifamily Housing Revenue Bonds, Archer Court Apartments, Series 1999A: | | | | | | |
| | 595 | | 5.500%, 12/20/19 (Alternative Minimum Tax) | 4/12 at 100.00 | AA– | | | 595,666 | |
| | 1,210 | | 5.600%, 12/20/29 (Alternative Minimum Tax) | 4/12 at 100.00 | AA– | | | 1,210,545 | |
| | 1,925 | | 5.650%, 12/20/40 (Alternative Minimum Tax) | 4/12 at 100.00 | AA– | | | 1,925,635 | |
| | 22,750 | | Chicago, Illinois, General Obligation Refunding Bonds, Emergency Telephone System, Series 1999, 5.500%, 1/01/23 – FGIC Insured | No Opt. Call | Aa3 | | | 24,701,268 | |
| | 1,655 | | Chicago, Illinois, Motor Fuel Tax Revenue Refunding Bonds, Series 1993, 5.375%, 1/01/14 - AMBAC Insured | No Opt. Call | AA+ | | | 1,727,042 | |
| | 3,340 | | Chicago, Illinois, Third Lien General Airport Revenue Bonds, O’Hare International Airport, Series 2005A, 5.000%, 1/01/33 – FGIC Insured | 1/16 at 100.00 | A1 | | | 3,360,341 | |
| | 190 | | DuPage County Community School District 200, Wheaton, Illinois, General Obligation Bonds, Series 2003B, 5.250%, 11/01/20 – AGM Insured | 11/13 at 100.00 | Aa3 | | | 203,900 | |
| | 810 | | DuPage County Community School District 200, Wheaton, Illinois, General Obligation Bonds, Series 2003B, 5.250%, 11/01/20 (Pre-refunded 11/01/13) – AGM Insured | 11/13 at 100.00 | Aa3 (4) | | | 886,270 | |
| | 3,935 | | Illinois Development Finance Authority, Local Government Program Revenue Bonds, Lake County School District 116 – Round Lake, Series 1999, 0.000%, 1/01/15 – NPFG Insured | No Opt. Call | Baa1 | | | 3,542,602 | |
| | 5,000 | | Illinois Educational Facilities Authority, Revenue Bonds, University of Chicago, Refunding Series 2003A, 5.000%, 7/01/33 | 7/13 at 100.00 | Aa1 | | | 5,063,050 | |
| | 1,500 | | Illinois Finance Authority, Revenue Bonds, Central DuPage Health, Series 2009B, 5.500%, 11/01/39 | 11/19 at 100.00 | AA | | | 1,555,455 | |
| | 2,000 | | Illinois Finance Authority, Revenue Bonds, Children’s Memorial Hospital, Series 2008A, 5.250%, 8/15/47 – AGC Insured (UB) | 8/18 at 100.00 | AA– | | | 2,017,680 | |
| | 1,000 | | Illinois Finance Authority, Revenue Bonds, Edward Health Services Corporation, Series 2008A, 5.500%, 2/01/40 – AMBAC Insured | 2/18 at 100.00 | A+ | | | 1,002,260 | |
| | 5,640 | | Illinois Finance Authority, Revenue Bonds, University of Chicago, Series 2004A, 5.000%, 7/01/34 | 7/14 at 100.00 | Aa1 | | | 5,790,193 | |
| | 1,225 | | Illinois Finance Authority, Revenue Bonds, University of Chicago, Series 2007, 5.000%, 7/01/19 | 7/17 at 100.00 | Aa1 | | | 1,385,144 | |
| | 4,000 | | Illinois Finance Authority, Revenue Refunding Bonds, Silver Cross Hospital and Medical Centers, Series 2008A, 6.000%, 8/15/23 | 8/18 at 100.00 | BBB | | | 4,079,880 | |
| | 5,980 | | Illinois Finance Authority, Student Housing Revenue Bonds, Educational Advancement Fund Inc., Refunding Series 2007A, 5.250%, 5/01/34 | 5/17 at 100.00 | Baa3 | | | 5,464,584 | |
| | 9,780 | | Illinois Health Facilities Authority, Remarketed Revenue Bonds, University of Chicago Project, Series 1985A, 5.500%, 8/01/20 | 2/12 at 103.00 | Aa1 | | | 10,088,266 | |
| | 1,500 | | Illinois Housing Development Authority, Housing Finance Bonds, Series 2005E, 4.800%, 1/01/36 – FGIC Insured | 1/15 at 100.00 | AA | | | 1,464,255 | |
| | 2,000 | | Kane & DeKalb Counties, Illinois, Community United School District 301, General Obligation Bonds, Series 2006, 0.000%, 12/01/21 – NPFG Insured | No Opt. Call | Aa3 | | | 1,273,360 | |
| | 11,345 | | Lake and McHenry Counties Community Unit School District 118, Wauconda, Illinois, General Obligation Bonds, Series 2005B, 0.000%, 1/01/25 – AGM Insured | 1/15 at 60.14 | Aa3 | | | 5,759,970 | |
| | 3,000 | | Lombard Public Facilities Corporation, Illinois, First Tier Conference Center and Hotel Revenue Bonds, Series 2005A-1, 7.125%, 1/01/36 | 1/16 at 100.00 | N/R | | | 2,017,470 | |
| | Principal | | | Optional Call | | | | | |
| | Amount (000) | | Description (1) | Provisions (2) | Ratings (3) | | | Value | |
| | | | Illinois (continued) | | | | | | |
| | | | Metropolitan Pier and Exposition Authority, Illinois, Revenue Refunding Bonds, McCormick Place Expansion Project, Series 1996A: | | | | | | |
| $ | 12,250 | | 0.000%, 12/15/22 – NPFG Insured | No Opt. Call | AA– | | $ | 7,203,735 | |
| | 13,000 | | 0.000%, 12/15/23 – NPFG Insured | No Opt. Call | AA– | | | 7,134,010 | |
| | 3,000 | | Metropolitan Pier and Exposition Authority, Illinois, Revenue Refunding Bonds, McCormick Place Expansion Project, Series 2002B, 5.750%, 6/15/23 – NPFG Insured | 6/12 at 101.00 | AAA | | | 3,107,880 | |
| | 1,840 | | Oak Park, Illinois, General Obligation Bonds, Series 2005B, 0.000%, 11/01/27 – SYNCORA GTY Insured | 11/15 at 54.14 | Aa2 | | | 789,967 | |
| | | | Regional Transportation Authority, Cook, DuPage, Kane, Lake, McHenry and Will Counties, Illinois, General Obligation Bonds, Series 1999: | | | | | | |
| | 22,650 | | 5.750%, 6/01/19 – AGM Insured | No Opt. Call | AA+ | | | 27,519,071 | |
| | 3,500 | | 5.750%, 6/01/23 – AGM Insured | No Opt. Call | AA+ | | | 4,185,475 | |
| | 1,300 | | Schaumburg, Illinois, General Obligation Bonds, Series 2004B, 5.250%, 12/01/34 – FGIC Insured | 12/14 at 100.00 | Aaa | | | 1,400,815 | |
| | 10,000 | | Will County Community High School District 210 Lincoln-Way, Illinois, General Obligation Bonds, Series 2006, 0.000%, 1/01/23 – AGM Insured | No Opt. Call | Aa2 | | | 5,846,400 | |
| | 4,500 | | Will County School District 122, New Lenox, Illinois, General Obligation Bonds, Series 2000B, 0.000%, 11/01/18 – AGM Insured | No Opt. Call | Aa3 | | | 3,426,885 | |
| | 172,945 | | Total Illinois | | | | | 155,397,645 | |
| | | | Indiana – 3.9% (2.6% of Total Investments) | | | | | | |
| | 1,360 | | Hospital Authority of Delaware County, Indiana, Hospital Revenue Refunding Bonds, Cardinal Health System, Series 1997, 5.000%, 8/01/16 – AMBAC Insured | 2/12 at 100.00 | N/R | | | 1,342,619 | |
| | 4,000 | | Indiana Finance Authority, Revenue Bonds, Trinity Health Care Group, Refunding Series 2009A, 5.250%, 12/01/38 | 12/19 at 100.00 | AA | | | 4,142,280 | |
| | 2,000 | | Indiana Health Facility Financing Authority, Hospital Revenue Bonds, Deaconess Hospital Inc., Series 2004A, 5.375%, 3/01/34 – AMBAC Insured | 3/14 at 100.00 | A | | | 2,007,220 | |
| | 2,000 | | Indiana Health Facility Financing Authority, Revenue Bonds, Community Foundation of Northwest Indiana, Series 2007, 5.500%, 3/01/37 | 3/17 at 100.00 | BBB+ | | | 1,968,940 | |
| | 5,700 | | Indiana Housing and Community Development Authority, Single Family Mortgage Revenue Bonds, Tender Option Bond Trust 1847, 7.822%, 1/01/25 (Alternative Minimum Tax) (IF) | 1/17 at 100.00 | Aaa | | | 5,761,047 | |
| | 6,675 | | Indiana Municipal Power Agency, Power Supply Revenue Bonds, Series 2007A, 5.000%, 1/01/42 – NPFG Insured | 1/17 at 100.00 | A+ | | | 6,822,317 | |
| | 21,735 | | Total Indiana | | | | | 22,044,423 | |
| | | | Iowa – 0.9% (0.6% of Total Investments) | | | | | | |
| | 7,000 | | Iowa Tobacco Settlement Authority, Asset Backed Settlement Revenue Bonds, Series 2005C, 5.625%, 6/01/46 | 6/15 at 100.00 | BBB | | | 5,022,220 | |
| | | | Kansas – 1.5% (1.0% of Total Investments) | | | | | | |
| | 3,825 | | Wichita, Kansas, Water and Sewerage Utility Revenue Bonds, Series 1999, 4.000%, 10/01/18 – FGIC Insured | 4/12 at 100.00 | Aa2 | | | 3,831,005 | |
| | 2,485 | | Wyandotte County-Kansas City Unified Government, Kansas, Sales Tax Special Obligation Bonds, Redevelopment Project Area B, Series 2005, 5.000%, 12/01/20 | 12/15 at 100.00 | N/R | | | 2,571,056 | |
| | 3,730 | | Wyandotte County-Kansas City Unified Government, Kansas, Sales Tax Special Obligation Capital Appreciation Revenue Bonds Redevelopment Project Area B – Major Multi-Sport Athletic Complex Project, Subordinate Lien Series 2010B, 0.000%, 6/01/21 | No Opt. Call | BBB | | | 2,240,089 | |
| | 10,040 | | Total Kansas | | | | | 8,642,150 | |
| | | | Kentucky – 1.1% (0.7% of Total Investments) | | | | | | |
| | | | Kentucky Economic Development Finance Authority, Hospital System Revenue Refunding and Improvement Bonds, Appalachian Regional Healthcare Inc., Series 1997: | | | | | | |
| | 1,850 | | 5.850%, 10/01/17 | 4/12 at 100.00 | BB | | | 1,791,152 | |
| | 4,990 | | 5.875%, 10/01/22 | 4/12 at 100.00 | BB | | | 4,611,558 | |
| | 6,840 | | Total Kentucky | | | | | 6,402,710 | |
| | | Nuveen Dividend Advantage Municipal Fund (continued) |
| NAD | | Portfolio of Investments |
October 31, 2011
| | Principal | | | Optional Call | | | | | |
| | Amount (000) | | Description (1) | Provisions (2) | Ratings (3) | | | Value | |
| | | | Louisiana – 8.1% (5.3% of Total Investments) | | | | | | |
| $ | 1,750 | | Louisiana Local Government Environmental Facilities and Community Development Authority, GNMA Collateralized Mortgage Revenue Refunding Bonds, Sharlo Apartments, Series 2002A, 6.500%, 6/20/37 | 6/12 at 105.00 | Aaa | | $ | 1,851,413 | |
| | 5,350 | | Louisiana Public Facilities Authority, Revenue Bonds, Baton Rouge General Hospital, Series 2004, 5.250%, 7/01/33 – NPFG Insured | 7/14 at 100.00 | Baa1 | | | 5,478,454 | |
| | 9,000 | | Louisiana Public Facilities Authority, Revenue Bonds, Ochsner Clinic Foundation Project, Series 2007A, 5.500%, 5/15/47 | 5/17 at 100.00 | Baa1 | | | 8,637,030 | |
| | 5,000 | | Louisiana State, Gasoline and Fuels Tax Revenue Bonds, Series 2002A, 5.000%, 6/01/32 – AMBAC Insured | 6/12 at 100.00 | Aa1 | | | 5,088,450 | |
| | 5,445 | | Louisiana State, Gasoline and Fuels Tax Revenue Bonds, Series 2006A, 4.500%, 5/01/41 – FGIC Insured (UB) | 5/16 at 100.00 | Aa1 | | | 5,379,224 | |
| | 13,570 | | Louisiana Transportation Authority, Senior Lien Toll Road Revenue Bonds, Series 2005B, 0.000%, 12/01/28 – AMBAC Insured | 12/11 at 100.00 | AA– | | | 5,156,464 | |
| | | | Tobacco Settlement Financing Corporation, Louisiana, Tobacco Settlement Asset-Backed Bonds, Series 2001B: | | | | | | |
| | 7,340 | | 5.500%, 5/15/30 | 11/11 at 101.00 | A1 | | | 7,349,469 | |
| | 6,750 | | 5.875%, 5/15/39 | 11/11 at 101.00 | A– | | | 6,754,455 | |
| | 54,205 | | Total Louisiana | | | | | 45,694,959 | |
| | | | Maine – 0.2% (0.1% of Total Investments) | | | | | | |
| | 1,050 | | Maine Health and Higher Educational Facilities Authority, Revenue Bonds, MaineGeneral Medical Center, Series 2011, 6.750%, 7/01/41 | 7/21 at 100.00 | Baa3 | | | 1,083,705 | |
| | | | Massachusetts – 2.2% (1.4% of Total Investments) | | | | | | |
| | 1,440 | | Boston Industrial Development Financing Authority, Massachusetts, Subordinate Revenue Bonds, Crosstown Center Project, Series 2002, 8.000%, 9/01/35 (Alternative Minimum Tax) | 9/12 at 102.00 | N/R | | | 498,398 | |
| | 4,365 | | Massachusetts Health and Educational Facilities Authority, Revenue Bonds, Berkshire Health System, Series 2005F, 5.000%, 10/01/19 – AGC Insured | 10/15 at 100.00 | AA+ | | | 4,599,313 | |
| | 620 | | Massachusetts Health and Educational Facilities Authority, Revenue Bonds, CareGroup Inc., Series 2008E-1 &2, 5.125%, 7/01/33 | 7/18 at 100.00 | A– | | | 623,081 | |
| | 2,300 | | Massachusetts Health and Educational Facilities Authority, Revenue Refunding Bonds, Suffolk University Issue, Series 2009A, 5.750%, 7/01/39 | 7/19 at 100.00 | BBB | | | 2,307,567 | |
| | 2,900 | | Massachusetts Housing Finance Agency, Housing Bonds, Series 2009F, 5.700%, 6/01/40 | 12/18 at 100.00 | AA– | | | 2,978,822 | |
| | 820 | | Massachusetts Port Authority, Special Facilities Revenue Bonds, US Airways Group Inc., Series 1996A, 5.875%, 9/01/23 – NPFG Insured (Alternative Minimum Tax) | 3/12 at 100.00 | Baa1 | | | 724,503 | |
| | 1,000 | | Massachusetts Turnpike Authority, Metropolitan Highway System Revenue Bonds, Senior Series 1997A, 0.000%, 1/01/24 – NPFG Insured | No Opt. Call | A+ | | | 576,750 | |
| | 13,445 | | Total Massachusetts | | | | | 12,308,434 | |
| | | | Michigan – 2.2% (1.4% of Total Investments) | | | | | | |
| | 6,000 | | Detroit, Michigan, Second Lien Sewerage Disposal System Revenue Bonds, Series 2005A, 5.000%, 7/01/35 – NPFG Insured | 7/15 at 100.00 | A | | | 5,946,180 | |
| | 3,215 | | Detroit, Michigan, Water Supply System Revenue Bonds, Series 2004A, 5.250%, 7/01/18 – NPFG Insured | 7/16 at 100.00 | A2 | | | 3,462,330 | |
| | 1,150 | | Royal Oak Hospital Finance Authority, Michigan, Hospital Revenue Bonds, William Beaumont Hospital, Refunding Series 2009V, 8.250%, 9/01/39 | 9/18 at 100.00 | A1 | | | 1,366,534 | |
| | 1,500 | | Michigan State Hospital Authority, Hospital Revenue Bonds, Oakwood Obligated Group, Series 2003, 5.500%, 11/01/11 | No Opt. Call | A | | | 1,500,000 | |
| | 11,865 | | Total Michigan | | | | | 12,275,044 | |
| | | | Minnesota – 1.3% (0.9% of Total Investments) | | | | | | |
| | 6,375 | | Minneapolis Health Care System, Minnesota, Revenue Bonds, Fairview Hospital and Healthcare Services, Series 2008A, 6.625%, 11/15/28 | 11/18 at 100.00 | A | | | 7,084,920 | |
| | 430 | | Minnesota Housing Finance Agency, Single Family Mortgage Bonds, Series 1998H-1, 5.650%,7/01/31 (Alternative Minimum Tax) | 1/12 at 100.00 | AA+ | | | 444,874 | |
| | 6,805 | | Total Minnesota | | | | | 7,529,794 | |
| | Principal | | | Optional Call | | | | | |
| | Amount (000) | | Description (1) | Provisions (2) | Ratings (3) | | | Value | |
| | | | Missouri – 0.9% (0.6% of Total Investments) | | | | | | |
| | | | Kansas City Municipal Assistance Corporation, Missouri, Leasehold Revenue Bonds, Series 2004B-1: | | | | | | |
| $ | 7,000 | | 0.000%, 4/15/27 – AMBAC Insured | No Opt. Call | AA– | | $ | 3,125,780 | |
| | 5,000 | | 0.000%, 4/15/29 – AMBAC Insured | No Opt. Call | AA– | | | 1,951,550 | |
| | 12,000 | | Total Missouri | | | | | 5,077,330 | |
| | | | Montana – 0.2% (0.2% of Total Investments) | | | | | | |
| | 310 | | Montana Board of Housing, Single Family Mortgage Bonds, Series 2000A-2, 6.450%, 6/01/29 (Alternative Minimum Tax) | 12/11 at 100.00 | AA+ | | | 315,555 | |
| | 1,000 | | Montana Higher Education Student Assistance Corporation, Student Loan Revenue Bonds, Subordinate Series 1999B, 6.400%, 12/01/32 (Alternative Minimum Tax) | 12/11 at 100.00 | A2 | | | 977,330 | |
| | 1,310 | | Total Montana | | | | | 1,292,885 | |
| | | | Nevada – 6.7% (4.4% of Total Investments) | | | | | | |
| | 10,000 | | Clark County, Nevada, Airport Revenue Bonds, Subordinate Lien Series 2010B, 5.750%, 7/01/42 | 1/20 at 100.00 | Aa3 | | | 10,736,200 | |
| | 9,675 | | Clark County, Nevada, Passenger Facility Charge Revenue Bonds, Las Vegas-McCarran International Airport, Series 2010A, 5.250%, 7/01/42 | 1/20 at 100.00 | Aa3 | | | 9,955,769 | |
| | | | Director of Nevada State Department of Business and Industry, Revenue Bonds, Las Vegas Monorail Project, First Tier, Series 2000: | | | | | | |
| | 8,000 | | 0.000%, 1/01/19 – AMBAC Insured | No Opt. Call | N/R | | | 1,218,400 | |
| | 4,000 | | 5.625%, 1/01/32 – AMBAC Insured (5) | 1/12 at 100.00 | N/R | | | 920,000 | |
| | 3,000 | | 5.375%, 1/01/40 – AMBAC Insured (5) | 1/12 at 100.00 | N/R | | | 690,000 | |
| | 3,750 | | Henderson, Nevada, Healthcare Facility Revenue Refunding Bonds, Catholic Healthcare West, Series 2007B, Trust 2633, 18.807%, 7/01/31 – BHAC Insured (IF) | 7/17 at 100.00 | AA+ | | | 4,386,150 | |
| | 1,500 | | Las Vegas Redevelopment Agency, Nevada, Tax Increment Revenue Bonds, Series 2009A, 8.000%, 6/15/30 | 6/19 at 100.00 | A | | | 1,719,735 | |
| | 3,000 | | Las Vegas Valley Water District, Nevada, General Obligation Bonds, Series 2003B Refunding, 5.250%, 6/01/20 (Pre-refunded 12/01/12) – NPFG Insured | 12/12 at 100.00 | AA+ (4) | | | 3,160,170 | |
| | 5,040 | | Las Vegas Valley Water District, Nevada, General Obligation Bonds, Water Improvement Series 2003A Refunding, 5.000%, 6/01/32 – FGIC Insured | 12/12 at 100.00 | AA+ | | | 5,083,949 | |
| | 47,965 | | Total Nevada | | | | | 37,870,373 | |
| | | | New Jersey – 6.6% (4.3% of Total Investments) | | | | | | |
| | 6,850 | | New Jersey Educational Facilities Authority, Revenue Refunding Bonds, University of Medicine and Dentistry of New Jersey, Series 2009B, 5.750%, 12/01/15 | No Opt. Call | Baa1 | | | 7,660,355 | |
| | 1,830 | | New Jersey Higher Education Assistance Authority, Student Loan Revenue Bonds, Series 2000A, 6.000%, 6/01/13 – NPFG Insured (Alternative Minimum Tax) | 12/11 at 100.00 | Aaa | | | 1,836,387 | |
| | 4,130 | | New Jersey Transit Corporation, Certificates of Participation, Federal Transit Administration Grants, Series 2002A, 5.500%, 9/15/13 – AMBAC Insured | No Opt. Call | Aa3 | | | 4,425,502 | |
| | 4,000 | | New Jersey Transportation Trust Fund Authority, Transportation System Bonds, Series 1999A, 5.750%, 6/15/18 | No Opt. Call | A+ | | | 4,688,040 | |
| | 20,000 | | New Jersey Transportation Trust Fund Authority, Transportation System Bonds, Series 2006C, 0.000%, 12/15/28 – AMBAC Insured | No Opt. Call | A+ | | | 7,723,200 | |
| | | | Tobacco Settlement Financing Corporation, New Jersey, Tobacco Settlement Asset-Backed Bonds, Series 2002: | | | | | | |
| | 5,955 | | 5.750%, 6/01/32 (Pre-refunded 6/01/12) | 6/12 at 100.00 | Aaa | | | 6,146,334 | |
| | 3,165 | | 6.125%, 6/01/42 (Pre-refunded 6/01/12) | 6/12 at 100.00 | Aaa | | | 3,273,591 | |
| | 1,365 | | Tobacco Settlement Financing Corporation, New Jersey, Tobacco Settlement Asset-Backed Bonds, Series 2003, 6.750%, 6/01/39 (Pre-refunded 6/01/13) | 6/13 at 100.00 | Aaa | | | 1,502,305 | |
| | 47,295 | | Total New Jersey | | | | | 37,255,714 | |
| | | | New Mexico – 0.7% (0.4% of Total Investments) | | | | | | |
| | 3,730 | | University of New Mexico, FHA-Insured Mortgage Hospital Revenue Bonds, Series 2004, 5.000%, 7/01/32 – AGM Insured | 7/14 at 100.00 | AA+ | | | 3,790,687 | |
| | | Nuveen Dividend Advantage Municipal Fund (continued) |
| NAD | | Portfolio of Investments |
October 31, 2011
| | Principal | | | Optional Call | | | | | |
| | Amount (000) | | Description (1) | Provisions (2) | Ratings (3) | | | Value | |
| | | | New York – 9.4% (6.2% of Total Investments) | | | | | | |
| $ | 1,905 | | Dormitory Authority of the State of New York, Insured Revenue Bonds, Franciscan Health Partnership Obligated Group – Frances Shervier Home and Hospital, Series 1997, 5.500%, 7/01/17 – RAAI Insured | 1/12 at 100.00 | A3 | | $ | 1,907,438 | |
| | 7,500 | | Dormitory Authority of the State of New York, Secured Hospital Revenue Refunding Bonds, Wyckoff Heights Medical Center, Series 1998H, 5.300%, 8/15/21 – NPFG Insured | 2/12 at 100.00 | AA– | | | 7,511,400 | |
| | 1,000 | | Hudson Yards Infrastructure Corporation, New York, Revenue Bonds, Senior Fiscal 2012 Series 2011A, 5.250%, 2/15/47 | No Opt. Call | A | | | 1,017,200 | |
| | 6,000 | | New York City Industrial Development Agency, New York, American Airlines-JFK International Airport Special Facility Revenue Bonds, Series 2005, 7.750%, 8/01/31 (Alternative Minimum Tax) | 8/16 at 101.00 | B– | | | 5,571,660 | |
| | 4,755 | | New York City Industrial Development Agency, New York, Revenue Bonds, Yankee Stadium Project PILOT, Series 2009A, 7.000%, 3/01/49 – AGC Insured | 3/19 at 100.00 | AA+ | | | 5,421,651 | |
| | 5,000 | | New York City Municipal Water Finance Authority, New York, Water and Sewerage System Revenue Bonds, Series 2004B, 5.000%, 6/15/36 – AGM Insured (UB) | 12/14 at 100.00 | AAA | | | 5,250,950 | |
| | 8,800 | | New York City Sales Tax Asset Receivable Corporation, New York, Dedicated Revenue Bonds, Local Government Assistance Corporation, Series 2004A, 5.000%, 10/15/32 – AMBAC Insured (UB) | 10/14 at 100.00 | AAA | | | 9,424,008 | |
| | | | Port Authority of New York and New Jersey, Special Project Bonds, JFK International Air Terminal LLC Project, Eighth Series 2010: | | | | | | |
| | 5,000 | | 6.500%, 12/01/28 | 12/15 at 100.00 | BBB– | | | 5,279,300 | |
| | 1,670 | | 6.000%, 12/01/36 | 12/20 at 100.00 | BBB– | | | 1,733,811 | |
| | 10,000 | | Port Authority of New York and New Jersey, Special Project Bonds, JFK International Air Terminal LLC, Sixth Series 1997, 5.900%, 12/01/17 – NPFG Insured (Alternative Minimum Tax) | 12/11 at 100.00 | Baa1 | | | 10,009,900 | |
| | 51,630 | | Total New York | | | | | 53,127,318 | |
| | | | North Carolina – 1.1% (0.7% of Total Investments) | | | | | | |
| | 1,500 | | Charlotte-Mecklenberg Hospital Authority, North Carolina, Carolinas HealthCare System Revenue Bonds, Series 2008A, 5.250%, 1/15/24 – AGC Insured | 1/18 at 100.00 | AA– | | | 1,628,205 | |
| | 3,830 | | Charlotte-Mecklenburg Hospital Authority, North Carolina, Healthcare System Revenue Bonds, DBA Carolinas Healthcare System, Series 2005A, 5.000%, 1/15/45 (Pre-refunded 1/15/15) | 1/15 at 100.00 | AA+ (4) | | | 4,339,352 | |
| | 5,330 | | Total North Carolina | | | | | 5,967,557 | |
| | | | North Dakota – 1.4% (0.9% of Total Investments) | | | | | | |
| | 3,545 | | Bismarck, North Dakota, Health Care Revenue Bonds, St. Alexius Medical Center, Series 1998A, 5.250%, 7/01/15 – AGM Insured | 1/12 at 100.00 | AA+ | | | 3,555,954 | |
| | 3,910 | | Fargo, North Dakota, Health System Revenue Bonds, Sanford Health, Refunding Series 2011, 6.250%, 11/01/31 | 11/21 at 100.00 | AA– | | | 4,311,987 | |
| | 7,455 | | Total North Dakota | | | | | 7,867,941 | |
| | | | Ohio – 3.6% (2.4% of Total Investments) | | | | | | |
| | 2,300 | | Amherst Exempted Village School District, Ohio, Unlimited Tax General Obligation School Improvement Bonds, Series 2001, 5.125%, 12/01/21 (Pre-refunded 12/01/11) – FGIC Insured | 12/11 at 100.00 | Aa2 (4) | | | 2,309,476 | |
| | | | Buckeye Tobacco Settlement Financing Authority, Ohio, Tobacco Settlement Asset-Backed Revenue Bonds, Senior Lien, Series 2007A-2: | | | | | | |
| | 160 | | 5.125%, 6/01/24 | 6/17 at 100.00 | BB– | | | 123,282 | |
| | 1,655 | | 5.375%, 6/01/24 | 6/17 at 100.00 | BB– | | | 1,307,533 | |
| | 1,800 | | 5.875%, 6/01/30 | 6/17 at 100.00 | BB– | | | 1,360,944 | |
| | 1,740 | | 5.750%, 6/01/34 | 6/17 at 100.00 | BB– | | | 1,262,822 | |
| | 3,930 | | 5.875%, 6/01/47 | 6/17 at 100.00 | BB– | | | 2,791,793 | |
| | 6,000 | | Butler County, Ohio, Hospital Facilities Revenue Bonds, UC Health, Series 2010, 5.250%, 11/01/29 | 11/20 at 100.00 | BBB+ | | | 5,826,660 | |
| | 3,650 | | Montgomery County, Ohio, Revenue Bonds, Catholic Health Initiatives, Series 2004A, 5.000%, 5/01/30 | 5/14 at 100.00 | AA | | | 3,692,267 | |
| | 1,000 | | Ohio Air Quality Development Authority, Ohio, Revenue Bonds, Ohio Valley Electric Corporation Project, Series 2009E, 5.625%, 10/01/19 | No Opt. Call | BBB– | | | 1,103,590 | |
| | 740 | | Warren County, Ohio, Limited Tax General Obligations, Series 1997, 5.500%, 12/01/17 | 12/11 at 100.00 | Aa1 | | | 743,078 | |
| | 22,975 | | Total Ohio | | | | | 20,521,445 | |
| | Principal | | | Optional Call | | | | | |
| | Amount (000) | | Description (1) | Provisions (2) | Ratings (3) | | | Value | |
| | | | Oklahoma – 0.2% (0.1% of Total Investments) | | | | | | |
| $ | 1,000 | | Fort Sill Apache Tribe of Oklahoma Economic Development Authority, Gaming Enterprise Revenue Bonds, Fort Sill Apache Casino, Series 2011A, 8.500%, 8/25/26 | 8/21 at 100.00 | N/R | | $ | 998,130 | |
| | | | Pennsylvania – 3.0% (1.9% of Total Investments) | | | | | | |
| | 1,250 | | Erie Water Authority, Pennsylvania, Water Revenue Bonds, Series 2008, 5.000%, 12/01/43 – AGM Insured | 12/18 at 100.00 | AA+ | | | 1,291,713 | |
| | 1,500 | | Pennsylvania Housing Finance Agency, Single Family Mortgage Revenue Bonds, Series 2006-96A, 4.650%, 10/01/31 (Alternative Minimum Tax) (UB) | 10/16 at 100.00 | AA+ | | | 1,453,515 | |
| | 8,200 | | Pennsylvania Turnpike Commission, Turnpike Revenue Bonds, Capital Appreciation Series 2009E, 0.000%, 12/01/38 | 12/27 at 100.00 | A– | | | 6,414,450 | |
| | 5,000 | | Pennsylvania Turnpike Commission, Turnpike Subordinate Revenue Bonds, Series 2009C, 0.000%, 6/01/33 – AGM Insured | 6/26 at 100.00 | AA– | | | 4,246,550 | |
| | 3,205 | | Philadelphia School District, Pennsylvania, General Obligation Bonds, Series 2002B, 5.625 %, 8/01/16 (Pre-refunded 8/01/12) – FGIC Insured | 8/12 at 100.00 | AA– (4) | | | 3,334,290 | |
| | 19,155 | | Total Pennsylvania | | | | | 16,740,518 | |
| | | | Puerto Rico – 5.8% (3.8% of Total Investments) | | | | | | |
| | 2,500 | | Puerto Rico Aqueduct and Sewerage Authority, Revenue Bonds, Senior Lien Series 2008A, 6.000%, 7/01/44 | 7/18 at 100.00 | Baa2 | | | 2,593,450 | |
| | 4,300 | | Puerto Rico Housing Finance Authority, Capital Fund Program Revenue Bonds, Series 2003, 4.500%, 12/01/23 (UB) | 12/13 at 100.00 | AA+ | | | 4,351,858 | |
| | 8,200 | | Puerto Rico Housing Finance Authority, Capital Fund Program Revenue Bonds, Series 2003, 4.500%, 12/01/23 (Pre-refunded 12/01/13) (UB) | 12/13 at 100.00 | Aaa | | | 8,864,856 | |
| | 12,845 | | Puerto Rico Infrastructure Financing Authority, Special Tax Revenue Bonds, Series 2005A, 0.000%, 7/01/42 – FGIC Insured | No Opt. Call | BBB+ | | | 1,553,217 | |
| | 10,000 | | Puerto Rico Sales Tax Financing Corporation, Sales Tax Revenue Bonds, First Subordinate Series 2009A, 6.000%, 8/01/42 | 8/19 at 100.00 | A+ | | | 10,808,400 | |
| | 4,310 | | Puerto Rico Sales Tax Financing Corporation, Sales Tax Revenue Bonds, First Subordinate Series 2010C, 5.250%, 8/01/41 | 8/20 at 100.00 | A+ | | | 4,374,564 | |
| | 42,155 | | Total Puerto Rico | | | | | 32,546,345 | |
| | | | Rhode Island – 4.0% (2.6% of Total Investments) | | | | | | |
| | 2,015 | | Central Falls, Rhode Island, General Obligation School Bonds, Series 1999, 6.250%, 5/15/20 – RAAI Insured | 11/11 at 100.00 | Caa1 | | | 1,497,931 | |
| | 5,815 | | Rhode Island Convention Center Authority, Lease Revenue Bonds, Series 2003A, 5.000%, 5/15/18 – AGM Insured | No Opt. Call | AA+ | | | 6,100,575 | |
| | | | Rhode Island Housing & Mortgage Finance Corporation, Homeownership Opportunity 57-B Bond Program, Series 2008, Trust 1177: | | | | | | |
| | 1,500 | | 9.569%, 4/01/23 (Alternative Minimum Tax) (IF) | 4/17 at 100.00 | AA+ | | | 1,531,530 | |
| | 1,000 | | 9.669%, 4/01/23 (Alternative Minimum Tax) (IF) | 4/17 at 100.00 | AA+ | | | 1,016,280 | |
| | 12,500 | | Rhode Island Tobacco Settlement Financing Corporation, Tobacco Settlement Asset-Backed Bonds, Series 2002A, 6.125%, 6/01/32 | 6/12 at 100.00 | BBB | | | 12,505,500 | |
| | 22,830 | | Total Rhode Island | | | | | 22,651,816 | |
| | | | South Carolina – 0.6% (0.4% of Total Investments) | | | | | | |
| | 2,045 | | Florence County, South Carolina, Hospital Revenue Bonds, McLeod Regional Medical Center, Series 2004A, 5.250%, 11/01/27 – AGM Insured | 11/14 at 100.00 | AA+ | | | 2,104,060 | |
| | 1,500 | | Greenville, South Carolina, Hospital Facilities Revenue Bonds, Series 2001, 5.000%, 5/01/31 – AMBAC Insured | 5/12 at 100.00 | AA– | | | 1,502,385 | |
| | 3,545 | | Total South Carolina | | | | | 3,606,445 | |
| | | | Tennessee – 0.4% (0.3% of Total Investments) | | | | | | |
| | 2,310 | | Sullivan County Health Educational and Housing Facilities Board, Tennessee, Revenue Bonds, Wellmont Health System, Series 2006C, 5.250%, 9/01/36 | 9/16 at 100.00 | BBB+ | | | 2,179,924 | |
| | 1,500 | | Sumner County Health, Educational, and Housing Facilities Board, Tennessee, Revenue Refunding Bonds, Sumner Regional Health System Inc., Series 2007, 5.500%, 11/01/46 (5), (6) | 11/17 at 100.00 | N/R | | | 111,150 | |
| | 3,810 | | Total Tennessee | | | | | 2,291,074 | |
| | | Nuveen Dividend Advantage Municipal Fund (continued) |
| NAD | | Portfolio of Investments |
October 31, 2011
| | Principal | | | Optional Call | | | | | |
| | Amount (000) | | Description (1) | Provisions (2) | Ratings (3) | | | Value | |
| | | | Texas – 10.1% (6.6% of Total Investments) | | | | | | |
| $ | 2,560 | | Brazos River Authority, Texas, Pollution Control Revenue Refunding Bonds, TXU Electric Company, Series 1999C, 7.700%, 3/01/32 (Alternative Minimum Tax) | 4/13 at 101.00 | Ca | | $ | 666,496 | |
| | 2,000 | | Capital Area Cultural Education Facilities Finance Corporation, Texas, Revenue Bonds, The Roman Catholic Diocese of Austin, Series 2005B, Remarketed, 6.125%, 4/01/45 | 4/20 at 100.00 | Baa2 | | | 2,060,120 | |
| | 2,845 | | Cedar Hill Independent School District, Dallas County, Texas, General Obligation Bonds, Refunding School Building Series 2005, 5.000%, 8/15/34 | 8/15 at 100.00 | AAA | | | 3,061,618 | |
| | 2,820 | | Central Texas Regional Mobility Authority, Travis and Williamson Counties, Toll Road Revenue Bonds, Series 2005, 5.000%, 1/01/45 – FGIC Insured | 1/15 at 100.00 | BBB | | | 2,438,623 | |
| | 820 | | Dallas Area Rapid Transit, Texas, Senior Lien Sales Tax Revenue Bonds, Series 2001, 5.000%, 12/01/31 (Pre-refunded 12/01/11) – AMBAC Insured | 12/11 at 100.00 | AA+ (4) | | | 823,296 | |
| | 2,100 | | Denton Independent School District, Denton County, Texas, General Obligation Bonds, Refunding Series 2004, 5.000%, 8/15/33 | 8/14 at 100.00 | AAA | | | 2,164,008 | |
| | 2,305 | | Harris County-Houston Sports Authority, Texas, Senior Lien Revenue Refunding Bonds, Series 2001A, 0.000%, 11/15/20 – NPFG Insured | No Opt. Call | Baa1 | | | 1,263,832 | |
| | | | Houston, Texas, Hotel Occupancy Tax and Special Revenue Bonds, Convention and Entertainment Project, Series 2001B: | | | | | | |
| | 3,130 | | 0.000%, 9/01/30 – AMBAC Insured | No Opt. Call | A2 | | | 993,869 | |
| | 12,030 | | 0.000%, 9/01/31 – AMBAC Insured | No Opt. Call | A2 | | | 3,559,677 | |
| | 30,095 | | Leander Independent School District, Williamson and Travis Counties, Texas, General Obligation Bonds, Series 2004, 0.000%, 8/15/34 | 8/12 at 27.94 | AAA | | | 8,099,166 | |
| | 9,345 | | Leander Independent School District, Williamson and Travis Counties, Texas, General Obligation Bonds, Series 2005, 0.000%, 8/15/33 – FGIC Insured | 8/15 at 37.33 | AAA | | | 2,887,605 | |
| | 33,160 | | Leander Independent School District, Williamson and Travis Counties, Texas, General Obligation Bonds, Series 2006, 0.000%, 8/15/38 | 8/14 at 26.50 | AAA | | | 7,656,644 | |
| | 1,500 | | Lower Colorado River Authority, Texas, Refunding Revenue Bonds, Series 2010, 5.000%, 5/15/12 | No Opt. Call | A1 | | | 1,537,710 | |
| | 5,250 | | Midlothian Independent School District, Ellis County, Texas, General Obligation Bonds, Series 2005, 5.000%, 2/15/34 | 2/15 at 100.00 | Aaa | | | 5,433,698 | |
| | 3,755 | | Northside Independent School District, Bexar County, Texas, General Obligation Bonds, Series 2001A, 5.000%, 8/01/31 | 2/12 at 100.00 | AAA | | | 3,766,040 | |
| | 1,000 | | San Antonio, Texas, Water System Revenue Bonds, Series 2005, 4.750%, 5/15/37 – NPFG Insured | 5/15 at 100.00 | Aa1 | | | 1,019,380 | |
| | 3,295 | | Tarrant County Cultural & Educational Facilities Financing Corporation, Texas, Revenue Bonds, Series 2007, Residuals 1761, 17.044%, 2/15/36 (IF) | 2/17 at 100.00 | AA– | | | 3,394,509 | |
| | 7,000 | | White Settlement Independent School District, Tarrant County, Texas, General Obligation Bonds, Series 2005, 0.000%, 8/15/35 | 8/15 at 34.92 | AAA | | | 2,043,790 | |
| | | | Wylie Independent School District, Collin County, Texas, General Obligation Bonds, Series 2005: | | | | | | |
| | 3,000 | | 0.000%, 8/15/20 | 8/15 at 78.46 | AAA | | | 2,120,670 | |
| | 3,000 | | 0.000%, 8/15/22 | 8/15 at 70.77 | AAA | | | 1,917,660 | |
| | 131,010 | | Total Texas | | | | | 56,908,411 | |
| | | | Utah – 0.0% (0.0% of Total Investments) | | | | | | |
| | | | Utah Housing Finance Agency, Single Family Mortgage Bonds, Series 1999C-2, Class II: | | | | | | |
| | 50 | | 5.700%, 7/01/19 (Alternative Minimum Tax) | 1/12 at 100.00 | Aaa | | | 51,408 | |
| | 15 | | 5.750%, 7/01/21 (Alternative Minimum Tax) | 1/12 at 100.00 | Aa2 | | | 15,028 | |
| | 245 | | Utah Housing Finance Agency, Single Family Mortgage Bonds, Series 2000F-2, Class III, 6.000%, 1/01/15 (Alternative Minimum Tax) | 1/12 at 100.00 | AA– | | | 245,365 | |
| | 310 | | Total Utah | | | | | 311,801 | |
| | Principal | | | Optional Call | | | | | |
| | Amount (000) | | Description (1) | Provisions (2) | Ratings (3) | | | Value | |
| | | | Virginia – 0.2% (0.2% of Total Investments) | | | | | | |
| $ | 1,500 | | Fairfax County Economic Development Authority, Virginia, Residential Care Facilities Mortgage Revenue Bonds, Goodwin House, Inc., Series 2007A, 5.125%, 10/01/42 | 10/17 at 100.00 | N/R | | $ | 1,410,420 | |
| | | | Washington – 9.1% (6.0% of Total Investments) | | | | | | |
| | 4,000 | | Energy Northwest, Washington, Electric Revenue Refunding Bonds, Nuclear Project 3, Series 2003A, 5.500%, 7/01/17 – SYNCORA GTY Insured | 7/13 at 100.00 | Aa1 | | | 4,295,000 | |
| | 1,825 | | Kennewick Public Facilities District, Washington, Sales Tax Revenue Bonds, Series 2003, 5.000%, 12/01/20 – AMBAC Insured | 6/13 at 100.00 | A1 | | | 1,903,712 | |
| | | | Port of Seattle, Washington, Special Facility Revenue Bonds, Terminal 18, Series 1999B: | | | | | | |
| | 1,755 | | 6.000%, 9/01/15 – NPFG Insured (Alternative Minimum Tax) | 3/12 at 100.00 | Baa1 | | | 1,759,388 | |
| | 2,590 | | 6.000%, 9/01/16 – NPFG Insured (Alternative Minimum Tax) | 3/12 at 100.00 | Baa1 | | | 2,595,905 | |
| | | | Port of Seattle, Washington, Special Facility Revenue Bonds, Terminal 18, Series 1999C: | | | | | | |
| | 875 | | 6.000%, 9/01/15 – NPFG Insured (Alternative Minimum Tax) | 3/12 at 100.00 | Baa1 | | | 877,188 | |
| | 1,260 | | 6.000%, 9/01/16 – NPFG Insured (Alternative Minimum Tax) | 3/12 at 100.00 | Baa1 | | | 1,262,873 | |
| | 2,000 | | Washington State Health Care Facilities Authority, Revenue Bonds, Fred Hutchinson Cancer Research Center, Series 2009A, 6.000%, 1/01/33 | 7/19 at 100.00 | A | | | 2,082,620 | |
| | 5,935 | | Washington State Tobacco Settlement Authority, Tobacco Settlement Asset-Backed Revenue Bonds, Series 2002, 6.500%, 6/01/26 | 6/13 at 100.00 | A3 | | | 6,036,073 | |
| | 3,350 | | Washington, General Obligation Compound Interest Bonds, Series 1999S-2, 0.000%, 1/01/18 – AGM Insured | No Opt. Call | AA+ | | | 2,906,695 | |
| | | | Washington, General Obligation Compound Interest Bonds, Series 1999S-3: | | | | | | |
| | 17,650 | | 0.000%, 1/01/20 | No Opt. Call | AA+ | | | 13,912,436 | |
| | 18,470 | | 0.000%, 1/01/21 | No Opt. Call | AA+ | | | 13,887,593 | |
| | 59,710 | | Total Washington | | | | | 51,519,483 | |
| | | | Wisconsin – 6.9% (4.6% of Total Investments) | | | | | | |
| | 1,690 | | Green Bay, Wisconsin, Water System Revenue Bonds, Series 2004, 5.000%, 11/01/29 (Pre-refunded 11/01/14) – AGM Insured | 11/14 at 100.00 | Aa2 (4) | | | 1,907,941 | |
| | 560 | | Green Bay, Wisconsin, Water System Revenue Bonds, Series 2004, 5.000%, 11/01/29 – AGM Insured | 11/14 at 100.00 | Aa2 | | | 576,882 | |
| | 7,410 | | Wisconsin Health and Educational Facilities Authority, Revenue Bonds, Ascension Health, Series 2006A, 5.000%, 11/15/36 | 11/16 at 100.00 | AA+ | | | 7,540,118 | |
| | 4,330 | | Wisconsin Health and Educational Facilities Authority, Revenue Bonds, Childrens Hospital of Wisconsin Inc., Series 2008B, 5.500%, 8/15/29 | 2/20 at 100.00 | AA– | | | 4,606,470 | |
| | 4,380 | | Wisconsin Health and Educational Facilities Authority, Revenue Bonds, Kenosha Hospital and Medical Center Inc., Series 1999, 5.625%, 5/15/29 | 11/11 at 100.00 | A | | | 4,381,401 | |
| | 12,725 | | Wisconsin Health and Educational Facilities Authority, Revenue Bonds, Mercy Health System Corporation, Series 1999, 5.500%, 8/15/25 – AMBAC Insured | 2/12 at 100.00 | A2 | | | 12,730,471 | |
| | 2,200 | | Wisconsin Health and Educational Facilities Authority, Revenue Bonds, Wheaton Franciscan Services Inc., Series 2003A, 5.125%, 8/15/33 | 8/13 at 100.00 | BBB+ | | | 1,963,763 | |
| | 5,000 | | Wisconsin State, General Fund Annual Appropriation Revenue Bonds, Refunding Series 2009A, 6.000%, 5/01/36 | 5/19 at 100.00 | AA– | | | 5,602,899 | |
| | 38,295 | | Total Wisconsin | | | | | 39,309,945 | |
| $ | 1,123,985 | | Total Municipal Bonds (cost $857,941,560) | | | | | 860,650,352 | |
| | | Nuveen Dividend Advantage Municipal Fund (continued) |
| NAD | | Portfolio of Investments |
October 31, 2011
| | | | | | | | | | |
| | Shares | | Description (1) | | | | | Value | |
| | | | Investment Companies – 0.1% (0.1% of Total Investments) | | | | | | |
| | 8,812 | | BlackRock MuniHoldings Fund Inc. | | | | $ | 140,111 | |
| | 32,332 | | Invesco Quality Municipal Income Trust | | | | | 419,669 | |
| | | | Total Investment Companies (cost $528,388) | | | | | 559,780 | |
| | | | Total Investments (cost $858,469,948) – 152.3% | | | | | 861,210,132 | |
| | | | Floating Rate Obligations – (9.1%) | | | | | (51,605,000 | ) |
| | | | MuniFund Term Preferred Shares, at Liquidation Value – (25.5)% (7) | | | | | (144,300,000 | ) |
| | | | Variable Rate MuniFund Term Preferred Shares, at Liquidation Value – (21.3)% (7) | | | | | (120,400,000 | ) |
| | | | Other Assets Less Liabilities – 3.6% | | | | | 20,459,043 | |
| | | | Net Assets Applicable to Common Shares – 100% | | | | $ | 565,364,175 | |
| (1) | | All percentages shown in the Portfolio of Investments are based on net assets applicable to Common shares unless otherwise noted. |
| (2) | | Optional Call Provisions (not covered by the report of independent registered public accounting firm): Dates (month and year) and prices of the earliest optional call or redemption. There may be other call provisions at varying prices at later dates. Certain mortgage-backed securities may be subject to periodic principal paydowns. |
| (3) | | Ratings (not covered by the report of independent registered public accounting firm): Using the highest of Standard & Poor’s Group (“Standard & Poor’s”), Moody’s Investors Service, Inc. (“Moody’s”) or Fitch, Inc. (“Fitch”) rating. Ratings below BBB by Standard & Poor’s, Baa by Moody’s or BBB by Fitch are considered to be below investment grade. Holdings designated N/R are not rated by any of these national rating agencies. |
| (4) | | Backed by an escrow or trust containing sufficient U.S. Government or U.S. Government agency securities, which ensure the timely payment of principal and interest. Bonds backed by U.S. Government or agency securities are given an implied rating equal to the rating of such securities. |
| (5) | | At or subsequent to the end of the reporting period, this security is non-income producing. Non-income producing security, in the case of a bond, generally denotes that the issuer has (1) defaulted on the payment of principal or interest, (2) is under the protection of the Federal Bankruptcy Court or (3) the Fund’s Adviser has concluded that the issue is not likely to meet its future interest payment obligations and has directed the Fund’s custodian to cease accruing additional income on the Fund’s records. |
| (6) | | For fair value measurement disclosure purposes, investment categorized as Level 3. See Notes to Financial Statements, Footnote 1 – General Information and Significant Accounting Policies, Investment Valuation for more information. |
| (7) | | MuniFund Term Preferred Shares and Variable Rate MuniFund Term Preferred Shares, at Liquidation Value as a percentage of Total Investments are 16.8% and 14.0%, respectively. |
| N/R | | Not rated. |
| (IF) | | Inverse floating rate investment. |
| (UB) | | Underlying bond of an inverse floating rate trust reflected as a financing transaction. See Notes to Financial Statements, Footnote 1 – General Information and Significant Accounting Policies, Inverse Floating Rate Securities for more information. |
See accompanying notes to financial statements.
| | | Nuveen Dividend Advantage Municipal Fund 2 |
| NXZ | | Portfolio of Investments |
| | | October 31, 2011 |
| | Principal | | | Optional Call | | | | | |
| | Amount (000) | | Description (1) | Provisions (2) | Ratings (3) | | | Value | |
| | | | Alabama – 0.5% (0.3% of Total Investments) | | | | | | |
| $ | 2,030 | | Alabama Special Care Facilities Financing Authority, Revenue Bonds, Ascension Health, Series 2006C-2, 5.000%, 11/15/39 | 11/16 at 100.00 | AA+ | | $ | 2,064,733 | |
| | | | Alaska – 3.1% (2.2% of Total Investments) | | | | | | |
| | 5,140 | | Alaska Municipal Bond Bank Authority, Revenue Bonds, Series 2003B, 5.250%, 12/01/22 – NPFG Insured | 12/13 at 100.00 | A+ | | | 5,489,469 | |
| | 3,860 | | Anchorage, Alaska, General Obligation Refunding Bonds, Series 2002B, 5.500%, 7/01/21 (Pre-refunded 7/01/12) – NPFG Insured | 7/12 at 100.00 | AA (4) | | | 3,995,563 | |
| | 2,290 | | Anchorage, Alaska, Water Revenue Bonds, Refunding Series 2007, 5.000%, 5/01/37 – NPFG Insured | No Opt. Call | AA | | | 2,362,685 | |
| | 2,200 | | Northern Tobacco Securitization Corporation, Alaska, Tobacco Settlement Asset-Backed Bonds, Series 2006A, 5.000%, 6/01/46 | 6/14 at 100.00 | B2 | | | 1,394,602 | |
| | 13,490 | | Total Alaska | | | | | 13,242,319 | |
| | | | Arizona – 2.6% (1.8% of Total Investments) | | | | | | |
| | 4,500 | | Phoenix Civic Improvement Corporation, Arizona, Junior Lien Airport Revenue Bonds, Series 2010A, 5.000%, 7/01/40 | No Opt. Call | A+ | | | 4,609,395 | |
| | 3,120 | | Phoenix Civic Improvement Corporation, Arizona, Senior Lien Airport Revenue Bonds, Series 2002B, 5.250%, 7/01/32 – FGIC Insured (Alternative Minimum Tax) | 7/12 at 100.00 | AA– | | | 3,127,176 | |
| | 3,000 | | Salt River Project Agricultural Improvement and Power District, Arizona, Electric System Revenue Bonds, Series 2002B, 5.000%, 1/01/26 (Pre-refunded 1/01/13) | 1/13 at 100.00 | Aa1 (4) | | | 3,162,450 | |
| | 10,620 | | Total Arizona | | | | | 10,899,021 | |
| | | | Arkansas – 0.1% (0.1% of Total Investments) | | | | | | |
| | 405 | | Arkansas Development Finance Authority, Single Family Mortgage Revenue Bonds, GNMA Mortgage-Backed Securities Program, Series 2002C, 5.400%, 1/01/34 (Alternative Minimum Tax) | 1/12 at 100.00 | AA+ | | | 405,235 | |
| | | | California – 22.4% (15.9% of Total Investments) | | | | | | |
| | 9,000 | | California County Tobacco Securitization Agency, Tobacco Settlement Asset-Backed Bonds, Los Angeles County Securitization Corporation, Series 2006A, 5.600%, 6/01/36 | 12/18 at 100.00 | B1 | | | 6,511,950 | |
| | 6,000 | | California Educational Facilities Authority, Revenue Bonds, Stanford University, Series 2001Q, 5.250%, 12/01/32 | 12/11 at 101.00 | AAA | | | 6,079,320 | |
| | 4,080 | | California Health Facilities Financing Authority, Revenue Bonds, Kaiser Permanante System, Series 2006, 5.000%, 4/01/37 – BHAC Insured | 4/16 at 100.00 | AA+ | | | 4,141,975 | |
| | 4,250 | | California State, General Obligation Bonds, Various Purpose Series 2010, 5.250%, 11/01/40 | 11/20 at 100.00 | A1 | | | 4,349,450 | |
| | 3,000 | | California State, General Obligation Bonds, Various Purpose Series 2011, 5.250%, 10/01/32 | 10/21 at 100.00 | A1 | | | 3,128,250 | |
| | 4,000 | | Coast Community College District, Orange County, California, General Obligation Bonds, Series 2005, 0.000%, 8/01/22 – NPFG Insured | No Opt. Call | Aa1 | | | 2,366,680 | |
| | 4,380 | | Glendale, California, Electric Revenue Bonds, Series 2003, 5.000%, 2/01/32 – NPFG Insured | 2/13 at 100.00 | AA– | | | 4,499,443 | |
| | 20,000 | | Golden State Tobacco Securitization Corporation, California, Enhanced Tobacco Settlement Asset-Backed Revenue Bonds, Series 2005A, 5.000%, 6/01/45 – FGIC Insured | 6/15 at 100.00 | A2 | | | 18,735,800 | |
| | 5,000 | | Golden State Tobacco Securitization Corporation, California, Tobacco Settlement Asset-Backed Bonds, Series 2003A-1, 6.750%, 6/01/39 (Pre-refunded 6/01/13) | 6/13 at 100.00 | Aaa | | | 5,487,000 | |
| | | | Golden State Tobacco Securitization Corporation, California, Tobacco Settlement Asset-Backed Bonds, Series 2007A-1: | | | | | | |
| | 2,050 | | 5.000%, 6/01/33 | 6/17 at 100.00 | BB+ | | | 1,448,489 | |
| | 1,000 | | 5.125%, 6/01/47 | 6/17 at 100.00 | BB+ | | | 651,200 | |
| | 6,000 | | Los Angeles Regional Airports Improvement Corporation, California, Sublease Revenue Bonds, Los Angeles International Airport, American Airlines Inc. Terminal 4 Project, Series 2002C, 7.500%, 12/01/24 (Alternative Minimum Tax) | 12/12 at 102.00 | B– | | | 5,530,140 | |
| | 3,285 | | Murrieta Valley Unified School District Public Financing Authority, California, Special Tax Revenue Bonds, Series 2006A, 5.125%, 9/01/26 – AGM Insured | 9/16 at 100.00 | AA+ | | | 3,409,929 | |
| | 10,885 | | Norwalk La Mirada Unified School District, Los Angeles County, California, General Obligation Bonds, Series 2005, 0.000%, 8/01/25 – FGIC Insured | No Opt. Call | Aa3 | | | 4,882,249 | |
| | | Nuveen Dividend Advantage Municipal Fund 2 (continued) |
| NXZ | | Portfolio of Investments |
October 31, 2011
| | Principal | | | Optional Call | | | | | |
| | Amount (000) | | Description (1) | Provisions (2) | Ratings (3) | | | Value | |
| | | | California (continued) | | | | | | |
| $ | 5,000 | | Palomar Pomerado Health, California, General Obligation Bonds, Series 2009A, 0.000%, 8/01/38 – AGC Insured | 8/29 at 100.00 | AA | | $ | 3,604,350 | |
| | 2,000 | | Rancho Mirage Joint Powers Financing Authority, California, Revenue Bonds, Eisenhower Medical Center, Series 2007A, 5.000%, 7/01/47 | 7/17 at 100.00 | Baa2 | | | 1,730,720 | |
| | 3,200 | | Redlands Unified School District, San Bernardino County, California, General Obligation Bonds, Series 2003, 0.000%, 7/01/27 – AGM Insured | No Opt. Call | AA– | | | 1,315,552 | |
| | 3,000 | | Riverside Unified School District, Riverside County, California, General Obligation Bonds, Election 2001 Series 2006B, 5.000%, 8/01/30 – AGC Insured | 8/15 at 101.00 | Aa2 | | | 3,052,380 | |
| | 2,755 | | Sacramento City Unified School District, Sacramento County, California, General Obligation Bonds, Series 2007, 0.000%, 7/01/25 – AGM Insured | No Opt. Call | AA | | | 1,310,884 | |
| | 3,000 | | San Joaquin Delta Community College District, California, General Obligation Bonds, Election 2004 Series 2008B, 0.000%, 8/01/29 – AGM Insured | 8/18 at 53.32 | Aa2 | | | 1,021,080 | |
| | 12,500 | | San Joaquin Hills Transportation Corridor Agency, Orange County, California, Toll Road Revenue Refunding Bonds, Series 1997A, 0.000%, 1/15/32 – NPFG Insured | No Opt. Call | Baa1 | | | 2,245,375 | |
| | 5,000 | | San Jose, California, Airport Revenue Bonds, Series 2007A, 6.000%, 3/01/47 – AMBAC Insured (Alternative Minimum Tax) | 3/17 at 100.00 | A | | | 5,159,150 | |
| | 1,930 | | San Mateo County Transit District, California, Sales Tax Revenue Bonds, Series 2005A, 5.000%, 6/01/29 – NPFG Insured | No Opt. Call | AA | | | 2,035,899 | |
| | 3,000 | | University of California, General Revenue Bonds, Series 2005F, 4.750%, 5/15/25 – AGM Insured | 5/13 at 101.00 | AA+ | | | 3,148,050 | |
| | 25 | | Yuba County Water Agency, California, Yuba River Development Revenue Bonds, Pacific Gas and Electric Company, Series 1966A, 4.000%, 3/01/16 | 3/12 at 100.00 | Baa1 | | | 24,636 | |
| | 124,340 | | Total California | | | | | 95,869,951 | |
| | | | Colorado – 6.0% (4.2% of Total Investments) | | | | | | |
| | 2,000 | | Colorado Health Facilities Authority, Colorado, Revenue Bonds, Valley View Hospital Association, Series 2007, 5.250%, 5/15/42 | 5/17 at 100.00 | BBB+ | | | 1,810,400 | |
| | 3,250 | | Colorado Health Facilities Authority, Colorado, Revenue Bonds, Yampa Valley Medical Center, Series 2007, 5.125%, 9/15/29 | 9/17 at 100.00 | BBB | | | 3,023,053 | |
| | | | Denver City and County, Colorado, Airport Revenue Bonds, Series 2006A: | | | | | | |
| | 5,365 | | 5.000%, 11/15/23 – FGIC Insured (UB) | 11/16 at 100.00 | A+ | | | 5,799,350 | |
| | 3,300 | | 5.000%, 11/15/24 – FGIC Insured | 11/16 at 100.00 | A+ | | | 3,541,626 | |
| | 4,335 | | 5.000%, 11/15/25 – FGIC Insured (UB) | 11/16 at 100.00 | A+ | | | 4,623,668 | |
| | 10,000 | | E-470 Public Highway Authority, Colorado, Senior Revenue Bonds, Capital Appreciation Series 2010A, 0.000%, 9/01/41 | No Opt. Call | Baa2 | | | 1,210,300 | |
| | 8,000 | | E-470 Public Highway Authority, Colorado, Toll Revenue Bonds, Series 2004B, 0.000%, 9/01/28 – NPFG Insured | 9/20 at 63.99 | Baa1 | | | 2,593,440 | |
| | 755 | | Jefferson County School District R1, Colorado, General Obligation Bonds, Series 2004, 5.000%, 12/15/22 (Pre-refunded 12/15/14) – AGM Insured (UB) | 12/14 at 100.00 | Aa2 (4) | | | 854,607 | |
| | 1,000 | | Plaza Metropolitan District 1, Lakewood, Colorado, Tax Increment Revenue Bonds, Series 2003, 8.000%, 12/01/25 | 6/14 at 101.00 | N/R | | | 1,009,510 | |
| | 960 | | Regional Transportation District, Colorado, Certificates of Participation, Series 2010A, 5.375%, 6/01/31 | 6/20 at 100.00 | Aa3 | | | 1,019,578 | |
| | 38,965 | | Total Colorado | | | | | 25,485,532 | |
| | | | District of Columbia – 2.3% (1.6% of Total Investments) | | | | | | |
| | 825 | | District of Columbia Tobacco Settlement Corporation, Tobacco Settlement Asset-Backed Bonds, Series 2001, 6.250%, 5/15/24 | 11/11 at 101.00 | A1 | | | 825,404 | |
| | 4,250 | | District of Columbia, Revenue Bonds, National Public Radio, Series 2010A, 5.000%, 4/01/43 | 4/15 at 100.00 | AA– | | | 4,307,715 | |
| | 5,000 | | Washington Convention Center Authority, District of Columbia, Dedicated Tax Revenue Bonds, Senior Lien Refunding Series 2007A, 4.500%, 10/01/30 – AMBAC Insured | 10/16 at 100.00 | A1 | | | 4,740,250 | |
| | 10,075 | | Total District of Columbia | | | | | 9,873,369 | |
| | | | Florida – 7.7% (5.4% of Total Investments) | | | | | | |
| | 15,000 | | Jacksonville, Florida, Transportation Revenue Bonds, Series 2001, 5.250%, 10/01/29 – NPFG Insured | 4/12 at 100.00 | Aa2 | | | 15,013,200 | |
| | Principal | | | Optional Call | | | | | |
| | Amount (000) | | Description (1) | Provisions (2) | Ratings (3) | | | Value | |
| | | | Florida (continued) | | | | | | |
| $ | 3,000 | | Miami-Dade County, Florida, Aviation Revenue Bonds, Miami International Airport, Series 2002, 5.375%, 10/01/32 – FGIC Insured (Alternative Minimum Tax) | 10/12 at 100.00 | A2 | | $ | 3,003,300 | |
| | 5,000 | | Orlando Utilities Commission, Florida, Subordinate Lien Water and Electric Revenue Refunding Bonds, Series 2003A, 5.000%, 10/01/21 | No Opt. Call | Aa1 | | | 5,268,600 | |
| | 1,500 | | Orlando Utilities Commission, Florida, Water and Electric Revenue Refunding Bonds, Series 2003B, 5.000%, 10/01/22 | No Opt. Call | Aa1 | | | 1,578,840 | |
| | | | Port Saint Lucie, Florida, Special Assessment Revenue Bonds, Southwest Annexation District 1B, Series 2007: | | | | | | |
| | 2,000 | | 5.000%, 7/01/33 – NPFG Insured | 7/17 at 100.00 | Baa1 | | | 1,893,520 | |
| | 1,500 | | 5.000%, 7/01/40 – NPFG Insured | 7/17 at 100.00 | Baa1 | | | 1,376,160 | |
| | 5,000 | | Seminole Tribe of Florida, Special Obligation Bonds, Series 2007A, 5.250%, 10/01/27 | 10/17 at 100.00 | BBB– | | | 4,594,150 | |
| | 33,000 | | Total Florida | | | | | 32,727,770 | |
| | | | Georgia – 2.7% (1.9% of Total Investments) | | | | | | |
| | 2,000 | | DeKalb County Hospital Authority, Georgia, Anticipation Certificates Revenue Bonds, DeKalb Medical Center, Inc. Project, Series 2010, 6.000%, 9/01/30 | 9/20 at 100.00 | N/R | | | 2,065,520 | |
| | 2,000 | | Franklin County Industrial Building Authority, Georgia, Revenue Bonds, Ty Cobb Regional Medical Center Project, Series 2010, 8.125%, 12/01/45 | 12/20 at 100.00 | N/R | | | 2,048,440 | |
| | 5,000 | | Gainesville and Hall County Hospital Authority, Georgia, Revenue Anticipation Certificates, Northeast Georgia Health Services Inc., Series 2010B, 5.125%, 2/15/40 | No Opt. Call | A+ | | | 4,825,950 | |
| | 2,500 | | Medical Center Hospital Authority, Georgia, Revenue Anticipation Certificates, Columbus Regional Healthcare System, Inc. Project, Series 2008, 6.500%, 8/01/38 – AGC Insured | 8/18 at 100.00 | AA+ | | | 2,741,600 | |
| | 11,500 | | Total Georgia | | | | | 11,681,510 | |
| | | | Illinois – 16.5% (11.7% of Total Investments) | | | | | | |
| | 3,485 | | Chicago, Illinois, FHA/GNMA Collateralized Multifamily Housing Revenue Bonds, Stone Terrace Apartments, Series 2001A, 5.750%, 12/20/42 (Alternative Minimum Tax) | 12/11 at 100.00 | AA+ | | | 3,488,729 | |
| | 475 | | Chicago, Illinois, FNMA/GNMA Collateralized Single Family Mortgage Revenue Bonds, Series 2001A, 6.250%, 10/01/32 (Alternative Minimum Tax) | 4/12 at 104.50 | Aaa | | | 490,974 | |
| | 5,000 | | Chicago, Illinois, General Obligation Bonds, City Colleges, Series 1999, 0.000%, 1/01/34 – FGIC Insured | No Opt. Call | Aa3 | | | 1,309,900 | |
| | 3,985 | | Chicago, Illinois, General Obligation Bonds, Series 2001A, 5.250%, 1/01/33 – NPFG Insured | 1/12 at 100.00 | Aa3 | | | 3,987,829 | |
| | 7,100 | | Cook County, Illinois, General Obligation Bonds, Refunding Series 2010A, 5.250%, 11/15/33 | 11/20 at 100.00 | AA | | | 7,339,838 | |
| | 3,180 | | Illinois Development Finance Authority, Revenue Bonds, Chicago Charter School Foundation, Series 2002A, 6.250%, 12/01/32 (Pre-refunded 12/01/12) | 12/12 at 100.00 | N/R (4) | | | 3,375,793 | |
| | 910 | | Illinois Development Finance Authority, Revenue Bonds, Illinois Wesleyan University, Series 2001, 5.500%, 9/01/32 – AMBAC Insured | 3/12 at 100.00 | BBB+ | | | 909,927 | |
| | 5,000 | | Illinois Finance Authority, Revenue Bonds, Elmhurst Memorial Healthcare, Series 2008A, 5.625%, 1/01/37 | 1/18 at 100.00 | Baa1 | | | 4,992,900 | |
| | 9,815 | | Illinois Finance Authority, Revenue Bonds, Palos Community Hospital, Series 2007A, 5.000%, 5/15/32 – NPFG Insured | 5/17 at 100.00 | Baa1 | | | 9,278,708 | |
| | 1,000 | | Illinois Finance Authority, Revenue Bonds, Silver Cross Hospital and Medical Centers, Series 2005, 5.250%, 8/15/20 – AGC Insured | 8/15 at 100.00 | AA+ | | | 1,039,130 | |
| | 2,500 | | Illinois Finance Authority, Revenue Bonds, Silver Cross Hospital and Medical Centers, Series 2009, 6.875%, 8/15/38 | 8/19 at 100.00 | BBB | | | 2,615,250 | |
| | 2,500 | | Illinois Finance Authority, Revenue Bonds, The University of Chicago Medical Center, Series 2011C, 5.500%, 8/15/41 | 2/21 at 100.00 | AA– | | | 2,634,500 | |
| | 6,965 | | Illinois Finance Authority, Student Housing Revenue Bonds, Educational Advancement Fund Inc., Refunding Series 2007A, 5.250%, 5/01/34 | 5/17 at 100.00 | Baa3 | | | 6,364,687 | |
| | 5,025 | | Illinois Health Facilities Authority, Revenue Refunding Bonds, Elmhurst Memorial Healthcare, Series 2002, 5.625%, 1/01/28 | 1/13 at 100.00 | Baa1 | | | 5,026,809 | |
| | 2,215 | | Illinois Housing Development Authority, Homeowner Mortgage Revenue Bonds, Series 2006C2, 5.050%, 8/01/27 (Alternative Minimum Tax) | 2/16 at 100.00 | AA | | | 2,238,014 | |
| | 1,535 | | Illinois, Sales Tax Revenue Bonds, Series 2001, 5.500%, 6/15/16 | No Opt. Call | AAA | | | 1,539,712 | |
| | | Nuveen Dividend Advantage Municipal Fund 2 (continued) |
| NXZ | | Portfolio of Investments |
October 31, 2011
| | Principal | | | Optional Call | | | | | |
| | Amount (000) | | Description (1) | Provisions (2) | Ratings (3) | | | Value | |
| | | | Illinois (continued) | | | | | | |
| $ | 2,500 | | Kane & DeKalb Counties, Illinois, Community United School District 301, General Obligation Bonds, Series 2006, 0.000%, 12/01/23 – NPFG Insured | No Opt. Call | Aa3 | | $ | 1,388,075 | |
| | | | Metropolitan Pier and Exposition Authority, Illinois, Revenue Bonds, McCormick Place Expansion Project, Series 2002A: | | | | | | |
| | 7,500 | | 0.000%, 12/15/30 – NPFG Insured | No Opt. Call | AAA | | | 2,515,650 | |
| | 10,000 | | 0.000%, 12/15/36 – NPFG Insured | No Opt. Call | AAA | | | 2,239,900 | |
| | 2,500 | | Metropolitan Pier and Exposition Authority, Illinois, Revenue Refunding Bonds, McCormick Place Expansion Project, Series 2002B, 0.000%, 6/15/21 – NPFG Insured | 6/17 at 101.00 | AAA | | | 2,615,150 | |
| | 3,625 | | Montgomery, Illinois, Lakewood Creek Project Special Assessment Bonds, Series 2007, 4.700%, 3/01/30 – RAAI Insured | 3/16 at 100.00 | N/R | | | 3,061,458 | |
| | 3,360 | | Northfield Township High School District 225, Cook County, Illinois, Glenbrook, General Obligation School Bonds, Series 2007B, 0.000%, 12/01/24 | 12/16 at 69.01 | AAA | | | 1,866,480 | |
| | 90,175 | | Total Illinois | | | | | 70,319,413 | |
| | | | Indiana – 4.6% (3.2% of Total Investments) | | | | | | |
| | 1,305 | | Indiana Health Facility Financing Authority, Hospital Revenue Bonds, Deaconess Hospital Inc., Series 2004A, 5.375%, 3/01/34 – AMBAC Insured | 3/14 at 100.00 | A | | | 1,309,711 | |
| | 2,295 | | Indiana Health Facility Financing Authority, Hospital Revenue Bonds, Methodist Hospitals Inc., Series 2001, 5.500%, 9/15/31 | 3/12 at 100.00 | BBB | | | 1,994,699 | |
| | 1,570 | | Indiana Health Facility Financing Authority, Hospital Revenue Refunding Bonds, Columbus Regional Hospital, Series 1993, 7.000%, 8/15/15 – AGM Insured | No Opt. Call | AA+ | | | 1,726,984 | |
| | 2,305 | | Indiana Health Facility Financing Authority, Revenue Bonds, Community Foundation of Northwest Indiana, Series 2007, 5.500%, 3/01/37 | 3/17 at 100.00 | BBB+ | | | 2,269,203 | |
| | 5,180 | | Indiana Municipal Power Agency, Power Supply Revenue Bonds, Series 2007A, 5.000%, 1/01/42 – NPFG Insured | 1/17 at 100.00 | A+ | | | 5,294,323 | |
| | 4,000 | | Indiana Transportation Finance Authority, Highway Revenue Bonds, Series 2003A, 5.000%, 6/01/23 (Pre-refunded 6/01/13) – AGM Insured | 6/13 at 100.00 | AA+ (4) | | | 4,291,320 | |
| | 1,500 | | Marion High School Building Corporation, Grant County, Indiana, First Mortgage Bonds, Series 2003, 5.000%, 7/15/25 – NPFG Insured | 7/13 at 100.00 | AA+ | | | 1,580,355 | |
| | 6,100 | | St. Joseph County Hospital Authority, Indiana, Revenue Bonds, Madison Center Inc., Series 1999, 5.800%, 2/15/24 (5) | 2/12 at 100.00 | N/R | | | 1,046,028 | |
| | 24,255 | | Total Indiana | | | | | 19,512,623 | |
| | | | Iowa – 1.5% (1.1% of Total Investments) | | | | | | |
| | 1,000 | | Iowa Higher Education Loan Authority, Private College Facility Revenue Bonds, Wartburg College, Series 2002, 5.500%, 10/01/28 (Pre-refunded 10/01/12) – ACA Insured | 10/12 at 100.00 | N/R (4) | | | 1,047,420 | |
| | 6,340 | | Iowa Tobacco Settlement Authority, Tobacco Asset-Backed Revenue Bonds, Series 2005B, 5.600%, 6/01/34 | 6/17 at 100.00 | BBB | | | 5,333,398 | |
| | 7,340 | | Total Iowa | | | | | 6,380,818 | |
| | | | Kentucky – 0.2% (0.2% of Total Investments) | | | | | | |
| | 1,000 | | Kentucky Economic Development Finance Authority, Louisville Arena Project Revenue Bonds, Louisville Arena Authority, Inc., Series 2008-A1, 6.000%, 12/01/38 – AGC Insured | 6/18 at 100.00 | AA+ | | | 1,058,620 | |
| | | | Louisiana – 5.3% (3.8% of Total Investments) | | | | | | |
| | 3,960 | | Louisiana State, Gasoline and Fuels Tax Revenue Bonds, Series 2006A, 4.500%, 5/01/41 – FGIC Insured (UB) | 5/16 at 100.00 | Aa1 | | | 3,912,163 | |
| | 18,825 | | Tobacco Settlement Financing Corporation, Louisiana, Tobacco Settlement Asset-Backed Bonds, Series 2001B, 5.875%, 5/15/39 | 11/11 at 101.00 | A– | | | 18,837,425 | |
| | 22,785 | | Total Louisiana | | | | | 22,749,588 | |
| | | | Maryland – 0.2% (0.1% of Total Investments) | | | | | | |
| | 1,000 | | Westminster, Maryland, Educational Facilities Revenue Bonds, McDaniel College, Series 2006, 4.500%, 11/01/36 | 11/16 at 100.00 | BBB+ | | | 863,190 | |
| | | | Massachusetts – 0.4% (0.3% of Total Investments) | | | | | | |
| | 1,500 | | Massachusetts Health and Education Facilities Authority, Revenue Bonds, Partners HealthCare System, Series 2010J, 5.000%, 7/01/39 | 7/19 at 100.00 | AA | | | 1,532,955 | |
| | Principal | | | Optional Call | | | | | |
| | Amount (000) | | Description (1) | Provisions (2) | Ratings (3) | | | Value | |
| | | | Michigan – 6.1% (4.4% of Total Investments) | | | | | | |
| $ | 3,135 | | Detroit, Michigan, Senior Lien Sewerage Disposal System Revenue Bonds, Series 1998B Remarketed, 5.250%, 7/01/22 – NPFG Insured | 7/17 at 100.00 | A+ | | $ | 3,273,567 | |
| | 5,865 | | Detroit, Michigan, Senior Lien Sewerage Disposal System Revenue Bonds, Series 2003A, 5.000%, 7/01/32 – AGM Insured | 7/13 at 100.00 | AA+ | | | 5,885,528 | |
| | 2,910 | | Detroit, Michigan, Sewer Disposal System Revenue Bonds, Second Lien, Series 2006B, 5.000%, 7/01/36 – MBIA-NPFG Insured | 7/16 at 100.00 | A | | | 2,887,389 | |
| | 6,880 | | Kalamazoo Hospital Finance Authority, Michigan, Hospital Revenue Bonds, Bronson Methodist Hospital, Refunding Series 2010, 5.500%, 5/15/36 | 5/20 at 100.00 | A2 | | | 6,938,067 | |
| | 3,300 | | Michigan Municipal Bond Authority, General Obligation Bonds, Detroit City School District, Series 2005, 5.000%, 6/01/19 – AGM Insured | 6/15 at 100.00 | AA+ | | | 3,406,029 | |
| | 4,000 | | Michigan Municipal Bond Authority, Public School Academy Revenue Bonds, Detroit Academy of Arts and Sciences Charter School, Series 2001A, 8.000%, 10/01/31 | 4/12 at 100.00 | B1 | | | 3,842,320 | |
| | 26,090 | | Total Michigan | | | | | 26,232,900 | |
| | | | Minnesota – 1.3% (0.9% of Total Investments) | | | | | | |
| | 5,000 | | Minneapolis, Minnesota, Health Care System Revenue Bonds,S Fairview Health Services, Series 2008B, 6.500%, 11/15/38 – AGC Insured | 11/18 at 100.00 | AA+ | | | 5,615,100 | |
| | | | Montana – 0.3% (0.3% of Total Investments) | | | | | | |
| | 1,480 | | Montana Board of Housing, Single Family Program Bonds, Series 2001A-2, 5.700%, 6/01/32 (Alternative Minimum Tax) | 12/11 at 100.00 | AA+ | | | 1,480,844 | |
| | | | Nevada – 4.6% (3.3% of Total Investments) | | | | | | |
| | 12,275 | | Director of Nevada State Department of Business and Industry, Revenue Bonds, Las Vegas Monorail Project, First Tier, Series 2000, 5.375%, 1/01/40 – AMBAC Insured (5) | 1/12 at 100.00 | N/R | | | 2,823,250 | |
| | 3,500 | | Director of Nevada State Department of Business and Industry, Revenue Bonds, Las Vegas Monorail Project, Second Tier, Series 2000, 7.375%, 1/01/40 (5) | 1/12 at 100.00 | N/R | | | 5,215 | |
| | 2,000 | | Henderson, Nevada, Healthcare Facility Revenue Refunding Bonds, Catholic Healthcare West, Series 2007B, Trust 2633, 18.807%, 7/01/31 – BHAC Insured (IF) | 7/17 at 100.00 | AA+ | | | 2,339,280 | |
| | 1,455 | | Las Vegas Valley Water District, Nevada, General Obligation Bonds, Series 2005A, 5.000%, 6/01/24 – FGIC Insured | No Opt. Call | AA+ | | | 1,557,330 | |
| | 5,040 | | Las Vegas Valley Water District, Nevada, General Obligation Bonds, Water Improvement Series 2003A Refunding, 5.000%, 6/01/32 – FGIC Insured | 12/12 at 100.00 | AA+ | | | 5,083,949 | |
| | 5,625 | | Las Vegas Valley Water District, Nevada, General Obligation Bonds, Water Improvement Series 2003A Refunding, 5.250%, 6/01/21 (Pre-refunded 12/01/12) – FGIC Insured | 12/12 at 100.00 | AA+ (4) | | | 5,925,319 | |
| | 1,750 | | Reno, Nevada, Health Facilities Revenue Bonds, Catholic Healthcare West, Series 2007A, Trust 2634, 18.534%, 7/01/31 – BHAC Insured (IF) | 7/17 at 100.00 | AA+ | | | 1,986,600 | |
| | 31,645 | | Total Nevada | | | | | 19,720,943 | |
| | | | New Hampshire – 2.1% (1.5% of Total Investments) | | | | | | |
| | 8,000 | | New Hampshire Business Finance Authority, Pollution Control Remarketed Revenue Refunding Bonds, Connecticut Light and Power Company, Series 1992A, 5.850%, 12/01/22 | 4/12 at 100.50 | BBB+ | | | 8,050,480 | |
| | 995 | | New Hampshire Housing Finance Authority, Single Family Mortgage Acquisition Bonds, Series 2001A, 5.700%, 1/01/31 (Alternative Minimum Tax) | 11/11 at 100.00 | Aa3 | | | 995,537 | |
| | 8,995 | | Total New Hampshire | | | | | 9,046,017 | |
| | | | New Jersey – 2.6% (1.9% of Total Investments) | | | | | | |
| | 3,995 | | New Jersey Economic Development Authority, Special Facilities Revenue Bonds, Continental Airlines Inc., Series 2000, 7.000%, 11/15/30 (Alternative Minimum Tax) | 11/11 at 100.00 | B | | | 3,994,481 | |
| | 600 | | New Jersey Health Care Facilities Financing Authority, New Jersey, Revenue Bonds, Saint Peters University Hospital, Refunding Series 2011, 6.000%, 7/01/26 | 7/21 at 100.00 | BBB– | | | 613,404 | |
| | 265 | | Tobacco Settlement Financing Corporation, New Jersey, Tobacco Settlement Asset-Backed Bonds, Series 2002, 5.750%, 6/01/32 (Pre-refunded 6/01/12) | 6/12 at 100.00 | Aaa | | | 273,514 | |
| | | Nuveen Dividend Advantage Municipal Fund 2 (continued) |
| NXZ | | Portfolio of Investments |
October 31, 2011
| | Principal | | | Optional Call | | | | | |
| | Amount (000) | | Description (1) | Provisions (2) | Ratings (3) | | | Value | |
| | | | New Jersey (continued) | | | | | | |
| | | | Tobacco Settlement Financing Corporation, New Jersey, Tobacco Settlement Asset-Backed Bonds, Series 2003: | | | | | | |
| $ | 2,200 | | 6.375%, 6/01/32 (Pre-refunded 6/01/13) | 6/13 at 100.00 | Aaa | | $ | 2,377,606 | |
| | 425 | | 6.750%, 6/01/39 (Pre-refunded 6/01/13) | 6/13 at 100.00 | Aaa | | | 467,751 | |
| | 3,085 | | 6.250%, 6/01/43 (Pre-refunded 6/01/13) | 6/13 at 100.00 | Aaa | | | 3,370,980 | |
| | 10,570 | | Total New Jersey | | | | | 11,097,736 | |
| | | | New York – 6.2% (4.4% of Total Investments) | | | | | | |
| | 12,020 | | Brooklyn Arena Local Development Corporation, New York, Payment in Lieu of Taxes Revenue Bonds, Barclays Center Project, Series 2009, 0.000%, 7/15/46 | No Opt. Call | BBB– | | | 1,375,328 | |
| | 4,250 | | Dormitory Authority of the State of New York, Insured Revenue Bonds, New York University, Series 2001-2, 5.000%, 7/01/31 – AMBAC Insured | 1/12 at 100.00 | AA+ | | | 4,262,240 | |
| | 1,600 | | Hudson Yards Infrastructure Corporation, New York, Revenue Bonds, Senior Fiscal 2012 Series 2011A, 5.250%, 2/15/47 | No Opt. Call | A | | | 1,627,520 | |
| | 12,800 | | Metropolitan Transportation Authority, New York, Transportation Revenue Bonds, Series 2006B, 4.500%, 11/15/32 – AGM Insured (UB) | 11/16 at 100.00 | AA– | | | 12,905,984 | |
| | 5,000 | | New York City Industrial Development Agency, New York, Special Facilities Revenue Bonds, JFK Airport – American Airlines Inc., Series 2002B, 8.500%, 8/01/28 (Alternative Minimum Tax) | 8/12 at 101.00 | B– | | | 4,645,800 | |
| | 1,670 | | Port Authority of New York and New Jersey, Special Project Bonds, JFK International Air Terminal LLC Project, Eighth Series 2010, 6.000%, 12/01/36 | 12/20 at 100.00 | BBB– | | | 1,733,811 | |
| | 37,340 | | Total New York | | | | | 26,550,683 | |
| | | | North Carolina – 0.7% (0.5% of Total Investments) | | | | | | |
| | 2,950 | | North Carolina Capital Facilities Financing Agency, Revenue Bonds, Johnson and Wales University, Series 2003A, 5.000%, 4/01/33 – SYNCORA GTY Insured | 4/13 at 100.00 | N/R | | | 2,944,100 | |
| | | | Ohio – 1.9% (1.3% of Total Investments) | | | | | | |
| | | | Buckeye Tobacco Settlement Financing Authority, Ohio, Tobacco Settlement Asset-Backed Revenue Bonds, Senior Lien, Series 2007A-2: | | | | | | |
| | 10,000 | | 5.750%, 6/01/34 | 6/17 at 100.00 | BB– | | | 7,257,600 | |
| | 1,000 | | 5.875%, 6/01/47 | 6/17 at 100.00 | BB– | | | 710,380 | |
| | 11,000 | | Total Ohio | | | | | 7,967,980 | |
| | | | Oklahoma – 1.1% (0.8% of Total Investments) | | | | | | |
| | 1,000 | | Fort Sill Apache Tribe of Oklahoma Economic Development Authority, Gaming Enterprise Revenue Bonds, Fort Sill Apache Casino, Series 2011A, 8.500%, 8/25/26 | 8/21 at 100.00 | N/R | | | 998,130 | |
| | 3,500 | | Grand River Dam Authority, Oklahoma, Revenue Bonds, Series 2010A, 5.250%, 6/01/40 | 6/20 at 100.00 | A | | | 3,748,080 | |
| | 4,500 | | Total Oklahoma | | | | | 4,746,210 | |
| | | | Puerto Rico – 3.4% (2.4% of Total Investments) | | | | | | |
| | 2,500 | | Puerto Rico Sales Tax Financing Corporation, Sales Tax Revenue Bonds, First Subordinate Series 2009A, 6.000%, 8/01/42 | 8/19 at 100.00 | A+ | | | 2,702,100 | |
| | 9,310 | | Puerto Rico Sales Tax Financing Corporation, Sales Tax Revenue Bonds, First Subordinate Series 2010C, 5.250%, 8/01/41 | 8/20 at 100.00 | A+ | | | 9,449,464 | |
| | | | Puerto Rico Sales Tax Financing Corporation, Sales Tax Revenue Bonds, Series 2007A: | | | | | | |
| | 30,000 | | 0.000%, 8/01/54 – AMBAC Insured | No Opt. Call | Aa2 | | | 1,942,200 | |
| | 6,150 | | 0.000%, 8/01/56 | No Opt. Call | Aa2 | | | 350,550 | |
| | 47,960 | | Total Puerto Rico | | | | | 14,444,314 | |
| | | | South Carolina – 2.4% (1.7% of Total Investments) | | | | | | |
| | 2,500 | | Florence County, South Carolina, Hospital Revenue Bonds, McLeod Regional Medical Center, Series 2004A, 5.250%, 11/01/23 – AGM Insured | 11/14 at 100.00 | AA+ | | | 2,606,550 | |
| | 21,570 | | Piedmont Municipal Power Agency, South Carolina, Electric Revenue Bonds, Series 2004A-2, 0.000%, 1/01/30 – AMBAC Insured | No Opt. Call | A– | | | 7,859,892 | |
| | 24,070 | | Total South Carolina | | | | | 10,466,442 | |
| | Principal | | | Optional Call | | | | | |
| | Amount (000) | | Description (1) | Provisions (2) | Ratings (3) | | | Value | |
| | | | Texas – 26.4% (18.7% of Total Investments) | | | | | | |
| $ | 4,000 | | Board of Regents, University of Texas System, Financing System Revenue Refunding Bonds, Series 2006B, 5.000%, 8/15/31 | No Opt. Call | AAA | | $ | 4,352,520 | |
| | 1,250 | | Central Texas Regional Mobility Authority, Senior Lien Revenue Bonds, Series 2011, 6.000%, 1/01/41 | 1/21 at 100.00 | BBB– | | | 1,261,888 | |
| | 10,000 | | Central Texas Regional Mobility Authority, Travis and Williamson Counties, Toll Road Revenue Bonds, Series 2005, 5.000%, 1/01/45 – FGIC Insured | 1/15 at 100.00 | BBB | | | 8,647,600 | |
| | | | Dallas-Fort Worth International Airport Public Facility Corporation, Texas, Airport Hotel Revenue Bonds, Series 2001: | | | | | | |
| | 15,000 | | 5.250%, 1/15/26 – AGM Insured | 1/12 at 100.00 | AA+ | | | 15,010,200 | |
| | 1,750 | | 5.200%, 1/15/31 – AGM Insured | 1/12 at 100.00 | AA+ | | | 1,750,385 | |
| | 6,000 | | Decatur Hospital Authority, Texas, Revenue Bonds, Wise Regional Health System, Series 2004A, 7.125%, 9/01/34 | 9/14 at 100.00 | N/R | | | 6,001,920 | |
| | 3,500 | | Fort Bend County, Texas, General Obligation Bonds, Toll Road Series 2006, 5.000%, 3/01/32 – NPFG Insured | 9/13 at 100.00 | AA+ | | | 3,568,215 | |
| | 10,000 | | Gulf Coast Industrial Development Authority, Texas, Solid Waste Disposal Revenue Bonds, Citgo Petroleum Corporation Project, Series 1998, 8.000%, 4/01/28 (Alternative Minimum Tax) | 4/12 at 100.00 | Ba2 | | | 10,047,700 | |
| | 31,170 | | Harris County-Houston Sports Authority, Texas, Junior Lien Revenue Refunding Bonds, Series 2001B, 5.250%, 11/15/40 – NPFG Insured | 11/11 at 100.00 | Baa1 | | | 26,074,952 | |
| | 1,845 | | Harris County-Houston Sports Authority, Texas, Revenue Bonds, Junior Lien Series 2001H, 0.000%, 11/15/37 – NPFG Insured | 11/31 at 69.08 | Baa1 | | | 273,983 | |
| | 4,465 | | Harris County-Houston Sports Authority, Texas, Revenue Bonds, Third Lien Series 2004-A3, 0.000%, 11/15/35 – NPFG Insured | 11/24 at 52.47 | Baa1 | | | 767,667 | |
| | 40,000 | | Harris County-Houston Sports Authority, Texas, Senior Lien Revenue Refunding Bonds, Series 2001A, 0.000%, 11/15/40 – NPFG Insured | 11/30 at 54.04 | Baa1 | | | 5,737,600 | |
| | | | Houston, Texas, Hotel Occupancy Tax and Special Revenue Bonds, Convention and Entertainment Project, Series 2001B: | | | | | | |
| | 5,000 | | 0.000%, 9/01/30 – AMBAC Insured | No Opt. Call | A2 | | | 1,587,650 | |
| | 5,540 | | 0.000%, 9/01/31 – AMBAC Insured | No Opt. Call | A2 | | | 1,639,286 | |
| | 4,285 | | Little Elm Independent School District, Denton County, Texas, General Obligation Bonds, Refunding Series 2006, 5.000%, 8/15/37 | 8/16 at 100.00 | AAA | | | 4,503,192 | |
| | 10,000 | | North Texas Tollway Authority, First Tier System Revenue Refunding Bonds, Series 2008D, 0.000%, 1/01/28 – AGC Insured | No Opt. Call | AA– | | | 4,130,300 | |
| | 3,295 | | Tarrant County Cultural & Educational Facilities Financing Corporation, Texas, Revenue Bonds, Series 2007, Residuals 1760-3, 17.044%, 2/15/36 (IF) | 2/17 at 100.00 | AA– | | | 3,394,509 | |
| | 2,890 | | Tarrant County Cultural Education Facilities Finance Corporation, Texas, Hospital Revenue Bonds, Scott & White HealthCare Project, Series 2010, 5.500%, 8/15/45 | 8/20 at 100.00 | A1 | | | 2,957,453 | |
| | 1,000 | | Texas Turnpike Authority, Central Texas Turnpike System Revenue Bonds, First Tier Series 2002A, 0.000%, 8/15/28 – AMBAC Insured | 8/12 at 39.43 | BBB+ | | | 360,810 | |
| | 10,500 | | Texas, General Obligation Bonds, Water Financial Assistance Program, Series 2001, 5.250%, 8/01/35 | 2/12 at 100.00 | Aaa | | | 10,532,760 | |
| | 171,490 | | Total Texas | | | | | 112,600,590 | |
| | | | Washington – 2.4% (1.7% of Total Investments) | | | | | | |
| | 2,500 | | King County School District 001 Seattle, Washington, General Obligation Bonds, Series 2007A, 5.000%, 6/01/12 | No Opt. Call | Aaa | | | 2,569,525 | |
| | 3,780 | | Washington State Health Care Facilities Authority, Revenue Bonds, Fred Hutchinson Cancer Research Center, Series 2011A, 5.625%, 1/01/35 | 1/21 at 100.00 | A | | | 3,833,714 | |
| | 2,940 | | Washington State Health Care Facilities Authority, Revenue Bonds, Kadlec Regional Medical Center, Series 2010, 5.500%, 12/01/39 | 12/20 at 100.00 | Baa2 | | | 2,785,238 | |
| | 845 | | Washington State Tobacco Settlement Authority, Tobacco Settlement Asset-Backed Revenue Bonds, Series 2002, 6.500%, 6/01/26 | 6/13 at 100.00 | A3 | | | 859,390 | |
| | 10,065 | | Total Washington | | | | | 10,047,867 | |
| | | Nuveen Dividend Advantage Municipal Fund 2 (continued) |
| NXZ | | Portfolio of Investments |
October 31, 2011
| | Principal | | | Optional Call | | | | | |
| | Amount (000) | | Description (1) | Provisions (2) | Ratings (3) | | | Value | |
| | | | West Virginia – 2.3% (1.7% of Total Investments) | | | | | | |
| $ | 2,950 | | West Virginia Economic Development Authority, Solid Waste Disposal Facilities Revenue Bonds, Appalachian Power Company Project, Series 2010, 5.375%, 12/01/38 | 12/20 at 100.00 | BBB | | $ | 3,022,275 | |
| | 6,720 | | West Virginia University, University Revenue Improvement Bonds, West Virginia University Projects, Series 2004C, 5.000%, 10/01/34 – FGIC Insured | 10/14 at 100.00 | Aa3 | | | 6,957,552 | |
| | 9,670 | | Total West Virginia | | | | | 9,979,827 | |
| | | | Wisconsin – 1.0% (0.7% of Total Investments) | | | | | | |
| | 1,000 | | Wisconsin Health and Educational Facilities Authority, Revenue Bonds, Divine Savior Healthcare, Series 2002A, 7.375%, 5/01/26 (Pre-refunded 5/01/12) | 5/12 at 100.00 | N/R (4) | | | 1,035,109 | |
| | 3,640 | | Wisconsin Health and Educational Facilities Authority, Revenue Bonds, Wheaton Franciscan Services Inc., Series 2006B, 5.125%, 8/15/30 | 8/16 at 100.00 | BBB+ | | | 3,296,965 | |
| | 4,640 | | Total Wisconsin | | | | | 4,332,074 | |
| $ | 799,945 | | Total Investments (cost $601,166,992) – 140.9% | | | | | 601,940,274 | |
| | | | Floating Rate Obligations – (4.3)% | | | | | (18,260,000 | ) |
| | | | Variable Rate Demand Preferred Shares, at Liquidation Value – (45.9)% (6) | | | | | (196,000,000 | ) |
| | | | Other Assets Less Liabilities – 9.3% | | | | | 39,404,596 | |
| | | | Net Assets Applicable to Common Shares – 100% | | | | $ | 427,084,870 | |
| (1) | | All percentages shown in the Portfolio of Investments are based on net assets applicable to Common shares unless otherwise noted. |
| (2) | | Optional Call Provisions (not covered by the report of independent registered public accounting firm): Dates (month and year) and prices of the earliest optional call or redemption. There may be other call provisions at varying prices at later dates. Certain mortgage-backed securities may be subject to periodic principal paydowns. |
| (3) | | Ratings (not covered by the report of independent registered public accounting firm): Using the highest of Standard & Poor’s Group (“Standard & Poor’s”), Moody’s Investors Service, Inc. (“Moody’s”) or Fitch, Inc. (“Fitch”) rating. Ratings below BBB by Standard & Poor’s, Baa by Moody’s or BBB by Fitch are considered to be below investment grade. Holdings designated N/R are not rated by any of these national rating agencies. |
| (4) | | Backed by an escrow or trust containing sufficient U.S. Government or U.S. Government agency securities, which ensure the timely payment of principal and interest. Bonds backed by U.S. Government or agency securities are given an implied rating equal to the rating of such securities. |
| (5) | | At or subsequent to the end of the reporting period, this security is non-income producing. Non-income producing security, in the case of a bond, generally denotes that the issuer has (1) defaulted on the payment of principal or interest, (2) is under the protection of the Federal Bankruptcy Court or (3) the Fund’s Adviser has concluded that the issue is not likely to meet its future interest payment obligations and has directed the Fund’s custodian to cease accruing additional income on the Fund’s records. |
| (6) | | Variable Rate Demand Preferred Shares, at Liquidation Value as a percentage of Total Investments are 32.6%. |
| N/R | | Not rated. |
| (IF) | | Inverse floating rate investment. |
| (UB) | | Underlying bond of an inverse floating rate trust reflected as a financing transaction. See Notes to Financial Statements, Footnote 1 – General Information and Significant Accounting Policies, Inverse Floating Rate Securities for more information. |
See accompanying notes to financial statements.
| | | Nuveen Dividend Advantage Municipal Fund 3 |
| NZF | | Portfolio of Investments |
| | | October 31, 2011 |
| | Principal | | | Optional Call | | | | | |
| | Amount (000) | | Description (1) | Provisions (2) | Ratings (3) | | | Value | |
| | | | Municipal Bonds – 138.4% (96.6% of Total Investments) | | | | | | |
| | | | Alabama – 0.6% (0.4% of Total Investments) | | | | | | |
| $ | 3,500 | | Alabama Special Care Facilities Financing Authority, Revenue Bonds, Ascension Health, Series 2006C-2, 5.000%, 11/15/36 (UB) | 11/16 at 100.00 | AA+ | | $ | 3,566,185 | |
| | | | Alaska – 0.1% (0.1% of Total Investments) | | | | | | |
| | 1,000 | | Northern Tobacco Securitization Corporation, Alaska, Tobacco Settlement Asset-Backed Bonds, Series 2006A, 5.000%, 6/01/46 | 6/14 at 100.00 | B2 | | | 633,910 | |
| | | | Arizona – 1.0% (0.7% of Total Investments) | | | | | | |
| | 3,390 | | Arizona State Transportation Board, Highway Revenue Bonds, Series 2006, Trust 3151, 13.416%, 7/01/16 (IF) | No Opt. Call | AAA | | | 4,026,710 | |
| | 2,200 | | Salt Verde Financial Corporation, Arizona, Senior Gas Revenue Bonds, Citigroup Energy Inc Prepay Contract Obligations, Series 2007, 5.000%, 12/01/37 | No Opt. Call | A | | | 1,995,334 | |
| | 5,590 | | Total Arizona | | | | | 6,022,044 | |
| | | | California – 15.6% (10.9% of Total Investments) | | | | | | |
| | | | California Health Facilities Financing Authority, Health Facility Revenue Bonds, Adventist Health System/West, Series 2003A: | | | | | | |
| | 2,220 | | 5.000%, 3/01/28 | 3/13 at 100.00 | A | | | 2,220,000 | |
| | 140 | | 5.000%, 3/01/33 | 3/13 at 100.00 | A | | | 137,201 | |
| | 1,670 | | California Health Facilities Financing Authority, Refunding Revenue Bonds, Stanford Hospital and Clinics, Series 2008A-2, RMKT, 5.250%, 11/15/40 | No Opt. Call | Aa3 | | | 1,709,880 | |
| | 3,400 | | California Health Facilities Financing Authority, Revenue Bonds, Providence Health & Services, Series 2009B, 5.500%, 10/01/39 | 10/19 at 100.00 | AA | | | 3,572,210 | |
| | 2,900 | | California Health Facilities Financing Authority, Revenue Bonds, Sutter Health, Series 2007A, 5.000%, 11/15/42 (UB) | 11/16 at 100.00 | AA– | | | 2,857,196 | |
| | 5,355 | | California Statewide Community Development Authority, Revenue Bonds, Sutter Health, Tender Option Bond Trust 3175, 13.584%, 5/15/14 (IF) | No Opt. Call | AA– | | | 6,389,640 | |
| | 20 | | California, General Obligation Veterans Welfare Bonds, Series 2001BZ, 5.350%, 12/01/21 – NPFG Insured (Alternative Minimum Tax) | 12/11 at 100.00 | AA | | | 20,020 | |
| | | | Ceres Unified School District, Stanislaus County, California, General Obligation Bonds, Series 2002B: | | | | | | |
| | 2,180 | | 0.000%, 8/01/31 – FGIC Insured | 8/12 at 32.87 | A+ | | | 578,092 | |
| | 3,300 | | 0.000%, 8/01/32 – FGIC Insured | 8/12 at 30.97 | A+ | | | 818,202 | |
| | 11,865 | | Golden State Tobacco Securitization Corporation, California, Tobacco Settlement Asset-Backed Bonds, Series 2007A-1, 5.125%, 6/01/47 | 6/17 at 100.00 | BB+ | | | 7,726,488 | |
| | 7,150 | | Grossmont Healthcare District, California, General Obligation Bonds, Series 2011B, 6.125%, 7/15/40 | 7/21 at 100.00 | Aa2 | | | 8,079,000 | |
| | 10,000 | | Los Angeles Department of Water and Power, California, Waterworks Revenue Bonds, Series 2011A, 5.000%, 7/01/41 | 1/21 at 100.00 | AA | | | 10,529,000 | |
| | | | Los Angeles Regional Airports Improvement Corporation, California, Lease Revenue Refunding Bonds, LAXFUEL Corporation at Los Angeles International Airport, Series 2001: | | | | | | |
| | 10,510 | | 5.750%, 1/01/16 – AMBAC Insured (Alternative Minimum Tax) | 1/12 at 100.00 | A– | | | 10,552,776 | |
| | 5,000 | | 5.375%, 1/01/21 – AMBAC Insured (Alternative Minimum Tax) | 1/12 at 100.00 | A– | | | 5,006,350 | |
| | 1,500 | | 5.250%, 1/01/23 – AMBAC Insured (Alternative Minimum Tax) | 1/12 at 100.00 | A– | | | 1,500,840 | |
| | 10,000 | | 5.500%, 1/01/32 – AMBAC Insured (Alternative Minimum Tax) | 1/12 at 100.00 | A– | | | 9,650,900 | |
| | 12,000 | | Palomar Pomerado Health, California, General Obligation Bonds, Convertible Capital Appreciation, Election 2004 Series 2010A, 0.000%, 8/01/40 | 8/30 at 100.00 | A+ | | | 7,770,360 | |
| | 3,850 | | Placentia-Yorba Linda Unified School District, Orange County, California, Certificates of Participation, Series 2011, 0.000%, 10/01/28 – AGM Insured | 10/21 at 100.00 | AA– | | | 3,036,187 | |
| | 3,550 | | San Buenaventura, California, Revenue Bonds, Community Memorial Health System, Series 2011, 7.500%, 12/01/41 | 12/21 at 100.00 | BB | | | 3,622,562 | |
| | 3,000 | | San Diego Community College District, California, General Obligation Bonds, Tender Option Bond Trust 1005, 13.606%, 8/01/41 (IF) | 8/21 at 100.00 | AA+ | | | 3,589,140 | |
| | | Nuveen Dividend Advantage Municipal Fund 3 (continued) |
| NZF | | Portfolio of Investments |
October 31, 2011
| | Principal | | | Optional Call | | | | | |
| | Amount (000) | | Description (1) | Provisions (2) | Ratings (3) | | | Value | |
| | | | California (continued) | | | | | | |
| $ | 10,000 | | San Joaquin Hills Transportation Corridor Agency, Orange County, California, Toll Road Revenue Refunding Bonds, Series 1997A, 0.000%, 1/15/35 – NPFG Insured | No Opt. Call | Baa1 | | $ | 1,406,100 | |
| | 3,000 | | San Mateo County Community College District, California, General Obligation Bonds, Series 2006C, 0.000%, 9/01/30 – NPFG Insured | No Opt. Call | Aaa | | | 1,096,950 | |
| | 112,610 | | Total California | | | | | 91,869,094 | |
| | | | Colorado – 5.5% (3.8% of Total Investments) | | | | | | |
| | 2,250 | | Canterberry Crossing Metropolitan District II, Parker, Colorado, Limited Tax General Obligation Bonds, Series 2002, 7.375%, 12/01/32 (Pre-refunded 12/01/12) | 12/12 at 100.00 | N/R (4) | | | 2,395,215 | |
| | 1,535 | | Colorado Educational and Cultural Facilities Authority, Charter School Revenue Bonds, Belle Creek Education Center, Series 2002A, 7.625%, 3/15/32 (Pre-refunded 3/15/13) | 3/13 at 100.00 | N/R (4) | | | 1,668,345 | |
| | 3,090 | | Colorado Educational and Cultural Facilities Authority, Revenue Bonds, Montessori Peaks Academy, Series 2006A, 5.400%, 5/01/26 | 5/16 at 102.00 | N/R | | | 2,631,629 | |
| | 3,380 | | Colorado Housing Finance Authority, Multifamily Project Bonds, Class I, Series 2001A-1, 5.500%, 4/01/31 (Alternative Minimum Tax) | 4/12 at 100.00 | AAA | | | 3,381,251 | |
| | 5,000 | | Compark Business Campus Metropolitan District, Colorado, General Obligation Limited Tax Bonds, Series 2007A, 5.600%, 12/01/34 – RAAI Insured | 12/17 at 100.00 | N/R | | | 4,120,150 | |
| | | | Denver City and County, Colorado, Airport Revenue Bonds, Series 2006: | | | | | | |
| | 5,365 | | 5.000%, 11/15/23 – FGIC Insured | 11/16 at 100.00 | A+ | | | 5,799,350 | |
| | 3,300 | | 5.000%, 11/15/24 – FGIC Insured | 11/16 at 100.00 | A+ | | | 3,541,626 | |
| | 4,335 | | 5.000%, 11/15/25 – FGIC Insured | 11/16 at 100.00 | A+ | | | 4,623,668 | |
| | | | Maher Ranch Metropolitan District 4, Colorado, General Obligation Limited Tax Bonds, Series 2007: | | | | | | |
| | 950 | | 5.125%, 12/01/27 – RAAI Insured | 12/17 at 100.00 | N/R | | | 841,615 | |
| | 2,000 | | 5.250%, 12/01/36 – RAAI Insured | 12/17 at 100.00 | N/R | | | 1,664,660 | |
| | 1,000 | | Plaza Metropolitan District 1, Lakewood, Colorado, Tax Increment Revenue Bonds, Series 2003, 8.000%, 12/01/25 | 6/14 at 101.00 | N/R | | | 1,009,510 | |
| | 630 | | Regional Transportation District, Colorado, Certificates of Participation, Series 2010A, 5.375%, 6/01/31 | 6/20 at 100.00 | Aa3 | | | 669,098 | |
| | 32,835 | | Total Colorado | | | | | 32,346,117 | |
| | | | Connecticut – 0.3% (0.2% of Total Investments) | | | | | | |
| | 1,500 | | Connecticut Health and Educational Facilities Authority, Revenue Bonds, Hartford Healthcare, Series 2011A, 5.000%, 7/01/41 | 7/21 at 100.00 | A | | | 1,491,855 | |
| | | | Delaware – 0.1% (0.1% of Total Investments) | | | | | | |
| | 520 | | Delaware State Housing Authority, Multifamily Mortgage Revenue Bonds, Series 2001A, 5.400%, 7/01/24 | 7/12 at 100.00 | Aa3 | | | 536,853 | |
| | | | District of Columbia – 0.8% (0.6% of Total Investments) | | | | | | |
| | 1,335 | | Washington Convention Center Authority, District of Columbia, Dedicated Tax Revenue Bonds, Tender Option Bond Trust 1606, 11.616%, 10/01/30 – AMBAC Insured (IF) | 10/16 at 100.00 | AA+ | | | 1,367,360 | |
| | 3,335 | | Washington Convention Center Authority, District of Columbia, Dedicated Tax Revenue Bonds, Tender Option Bond Trust 1730, 11.592%, 10/01/30 – AMBAC Insured (IF) | 10/16 at 100.00 | AA+ | | | 3,415,840 | |
| | 4,670 | | Total District of Columbia | | | | | 4,783,200 | |
| | | | Florida – 3.3% (2.3% of Total Investments) | | | | | | |
| | 4,980 | | Broward County, Florida, Airport System Revenue Refunding Bonds, Series 2009O, 5.375%, 10/01/29 | 10/19 at 100.00 | A+ | | | 5,241,898 | |
| | | | Orange County Housing Finance Authority, Florida, Multifamily Housing Revenue Bonds, Oak Glen Apartments, Series 2001G: | | | | | | |
| | 1,105 | | 5.400%, 12/01/32 – AGM Insured | 12/11 at 100.00 | AA+ | | | 1,105,343 | |
| | 2,195 | | 5.450%, 12/01/41 – AGM Insured | 12/11 at 100.00 | AA+ | | | 2,195,329 | |
| | 5,000 | | Orlando-Orange County Expressway Authority, Florida, Expressway Revenue Bonds, Series 2003B, 5.000%, 7/01/30 – AMBAC Insured | 7/13 at 100.00 | A | | | 5,059,050 | |
| | Principal | | | Optional Call | | | | | |
| | Amount (000) | | Description (1) | Provisions (2) | Ratings (3) | | | Value | |
| | | | Florida (continued) | | | | | | |
| $ | 5,455 | | South Miami Health Facilities Authority, Florida, Hospital Revenue, Baptist Health System Obligation Group, Series 2007, 5.000%, 8/15/42 (UB) | 8/17 at 100.00 | AA | | $ | 5,450,309 | |
| | 1,000 | | Tolomato Community Development District, Florida, Special Assessment Bonds, Series 2007, 6.650%, 5/01/40 (5) | 5/18 at 100.00 | N/R | | | 623,180 | |
| | 19,735 | | Total Florida | | | | | 19,675,109 | |
| | | | Georgia – 4.9% (3.4% of Total Investments) | | | | | | |
| | 15,000 | | Atlanta, Georgia, Airport General Revenue Refunding Bonds, Series 2010C, 5.250%, 1/01/30 | 1/21 at 100.00 | A1 | | | 15,842,250 | |
| | 2,700 | | Atlanta, Georgia, Tax Allocation Bonds, Atlantic Station Project, Series 2001, 7.900%, 12/01/24 (Pre-refunded 12/01/11) | 12/11 at 101.00 | AAA | | | 2,744,280 | |
| | 3,000 | | Franklin County Industrial Building Authority, Georgia, Revenue Bonds, Ty Cobb Regional Medical Center Project, Series 2010, 8.125%, 12/01/45 | 12/20 at 100.00 | N/R | | | 3,072,660 | |
| | 2,000 | | Fulton County Residential Care Facilities Authority, Georgia, Revenue Bonds, Elderly Care, Lenbrook Square Project, Series 2006A, 5.125%, 7/01/42 | 7/17 at 100.00 | N/R | | | 1,363,700 | |
| | 5,000 | | Fulton County, Georgia, Water and Sewerage Revenue Bonds, Series 2004, 5.000%, 1/01/35 – FGIC Insured | 1/14 at 100.00 | AA– | | | 5,127,050 | |
| | 500 | | Gainesville Redevelopment Authority, Georgia, Educational Facilities Revenue Bonds, Riverside Military Academy Project, Series 2007, 5.125%, 3/01/37 | 3/17 at 100.00 | N/R | | | 367,470 | |
| | 28,200 | | Total Georgia | | | | | 28,517,410 | |
| | | | Illinois – 12.4% (8.6% of Total Investments) | | | | | | |
| | 2,200 | | Chicago Transit Authority, Illinois, Sales Tax Receipts Revenue Bonds, Series 2011, 5.250%, 12/01/40 (WI/DD, Settling 11/04/11) | 12/21 at 100.00 | AA | | | 2,270,312 | |
| | 8,375 | | Chicago, Illinois, Revenue Bonds, Midway Airport, Series 2001A, 5.500%, 1/01/19 – AGM Insured (Alternative Minimum Tax) | 1/12 at 100.00 | AA+ | | | 8,399,706 | |
| | 4,950 | | Chicago, Illinois, Second Lien Passenger Facility Charge Revenue Bonds, O’Hare International Airport, Series 2001A, 5.375%, 1/01/32 – AMBAC Insured (Alternative Minimum Tax) | 1/12 at 100.00 | A2 | | | 4,950,297 | |
| | 2,220 | | Chicago, Illinois, Second Lien Wastewater Transmission Revenue Bonds, Series 2001A, 5.500%, 1/01/16 – NPFG Insured | No Opt. Call | Aa3 | | | 2,462,868 | |
| | 1,165 | | Chicago, Illinois, Third Lien General Airport Revenue Bonds, O’Hare International Airport, Series 2005A, 5.000%, 1/01/33 – FGIC Insured | 1/16 at 100.00 | A1 | | | 1,172,095 | |
| | 8,875 | | Cook County, Illinois, General Obligation Bonds, Refunding Series 2010A, 5.250%, 11/15/33 | 11/20 at 100.00 | AA | | | 9,174,798 | |
| | 2,415 | | Illinois Finance Authority, General Obligation Debt Certificates, Local Government Program – Kankakee County, Series 2005B, 5.000%, 12/01/24 – AMBAC Insured | 12/14 at 100.00 | A2 | | | 2,471,028 | |
| | 3,465 | | Illinois Finance Authority, Revenue Bonds, Sherman Health Systems, Series 2007A, 5.500%, 8/01/37 | 8/17 at 100.00 | BBB | | | 3,190,052 | |
| | 9,000 | | Illinois Health Facilities Authority, Revenue Bonds, Covenant Retirement Communities Inc., Series 2001, 5.875%, 12/01/31 | 12/11 at 101.00 | BBB– | | | 9,009,900 | |
| | 5,000 | | Lake County School District 38, Big Hallow, Illinois, General Obligation Bonds, Series 2005, 0.000%, 2/01/22 – AMBAC Insured | No Opt. Call | N/R | | | 2,727,200 | |
| | 7,000 | | Lombard Public Facilities Corporation, Illinois, First Tier Conference Center and Hotel Revenue Bonds, Series 2005A-1, 7.125%, 1/01/36 | 1/16 at 100.00 | N/R | | | 4,707,430 | |
| | 12,000 | | Metropolitan Pier and Exposition Authority, Illinois, McCormick Place Expansion Project Refunding Bonds, Series 2010A, 5.500%, 6/15/50 | 6/20 at 100.00 | AAA | | | 12,276,120 | |
| | 45,000 | | Metropolitan Pier and Exposition Authority, Illinois, Revenue Bonds, McCormick Place Expansion Project, Capital Appreciation Refunding Series 2010B-1, 0.000%, 6/15/43 – AGM Insured | No Opt. Call | AAA | | | 6,719,400 | |
| | 2,790 | | Metropolitan Pier and Exposition Authority, Illinois, Revenue Refunding Bonds, McCormick Place Expansion Project, Series 1998A, 5.500%, 6/15/29 – FGIC Insured | No Opt. Call | AAA | | | 3,107,669 | |
| | 114,455 | | Total Illinois | | | | | 72,638,875 | |
| | | | Indiana – 6.5% (4.5% of Total Investments) | | | | | | |
| | | | Clark-Pleasant Community School Building Corporation, Indiana, First Mortgage Bonds, Series 2001: | | | | | | |
| | 1,255 | | 5.000%, 7/15/21 (Pre-refunded 1/15/12) – AMBAC Insured | 1/12 at 100.00 | AA+ (4) | | | 1,267,425 | |
| | 1,000 | | 5.000%, 1/15/26 (Pre-refunded 1/15/12) – AMBAC Insured | 1/12 at 100.00 | AA+ (4) | | | 1,009,900 | |
| | | Nuveen Dividend Advantage Municipal Fund 3 (continued) |
| NZF | | Portfolio of Investments |
October 31, 2011
| | Principal | | | Optional Call | | | | | |
| | Amount (000) | | Description (1) | Provisions (2) | Ratings (3) | | | Value | |
| | | | Indiana (continued) | | | | | | |
| | | | Evansville Vanderburgh Public Library Lease Corporation, Indiana, First Mortgage Bonds, Series 2001: | | | | | | |
| $ | 2,000 | | 5.750%, 7/15/18 (Pre-refunded 1/15/12) – NPFG Insured | 1/12 at 100.00 | A+ (4) | | $ | 2,022,880 | |
| | 2,750 | | 5.125%, 1/15/24 (Pre-refunded 1/15/12) – NPFG Insured | 1/12 at 100.00 | A+ (4) | | | 2,777,940 | |
| | 1,250 | | Hamilton Southeastern Cumberland Campus School Building Corporation, Indiana, First Mortgage Bonds, Series 2001, 5.125%, 1/15/23 (Pre-refunded 1/15/12) – AMBAC Insured | 1/12 at 100.00 | A (4) | | | 1,262,700 | |
| | 6,885 | | Indiana Educational Facilities Authority, Revenue Bonds, Butler University, Series 2001, 5.500%, 2/01/26 – NPFG Insured | 2/12 at 100.00 | Baa1 | | | 6,903,176 | |
| | 4,230 | | Indiana Finance Authority, Educational Facilities Revenue Bonds, Tudor Park Foundation, Series 2005B, 5.000%, 6/01/24 | 6/15 at 100.00 | Aa3 | | | 4,420,646 | |
| | 6,700 | | Indiana Finance Authority, Wastewater Utility Revenue Bonds, CWA Authority Project, Series 2011B, 5.000%, 10/01/41 | 10/21 at 100.00 | AA– | | | 6,812,426 | |
| | 2,600 | | Indiana Health Facility Financing Authority, Revenue Bonds, Community Hospitals of Indiana, Series 2005A, 5.000%, 5/01/35 – AMBAC Insured | 5/15 at 100.00 | A | | | 2,541,994 | |
| | 3,500 | | University of Southern Indiana, Student Fee Revenue Bonds, Series 2001H, 5.000%, 10/01/21 – AMBAC Insured | 4/12 at 100.00 | A1 | | | 3,505,250 | |
| | | | Vigo County Hospital Authority, Indiana, Revenue Bonds, Union Hospital, Series 2007: | | | | | | |
| | 2,500 | | 5.750%, 9/01/42 | 9/17 at 100.00 | N/R | | | 2,269,825 | |
| | 2,500 | | 5.800%, 9/01/47 | 9/17 at 100.00 | N/R | | | 2,277,575 | |
| | 1,090 | | Wayne County Jail Holding Corporation, Indiana, First Mortgage Bonds, Series 2001, 5.500%, 7/15/22 (Pre-refunded 1/15/13) – AMBAC Insured | 1/13 at 101.00 | A1 (4) | | | 1,168,349 | |
| | 38,260 | | Total Indiana | | | | | 38,240,086 | |
| | | | Iowa – 0.5% (0.3% of Total Investments) | | | | | | |
| | 2,000 | | Iowa Finance Authority, Healthcare Revenue Bonds, Great River Medical Center, Series 2001, 5.250%, 5/15/31 – AGM Insured | 11/11 at 100.00 | Aa3 | | | 2,000,080 | |
| | 1,000 | | Iowa Tobacco Settlement Authority, Asset Backed Settlement Revenue Bonds, Series 2005C, 5.625%, 6/01/46 | 6/15 at 100.00 | BBB | | | 717,460 | |
| | 3,000 | | Total Iowa | | | | | 2,717,540 | |
| | | | Kansas – 0.3% (0.2% of Total Investments) | | | | | | |
| | | | Manhattan Health Care Facility Revenue Bonds, Kansas, Meadowlarks Hills Retirement, Series 2007B: | | | | | | |
| | 1,000 | | 5.125%, 5/15/37 | 5/14 at 103.00 | N/R | | | 818,730 | |
| | 1,000 | | 5.125%, 5/15/42 | 5/14 at 103.00 | N/R | | | 805,810 | |
| | 2,000 | | Total Kansas | | | | | 1,624,540 | |
| | | | Kentucky – 1.2% (0.8% of Total Investments) | | | | | | |
| | 1,000 | | Kentucky Economic Development Finance Authority, Louisville Arena Project Revenue Bonds, Louisville Arena Authority, Inc., Series 2008-A1, 6.000%, 12/01/42 – AGC Insured | 6/18 at 100.00 | AA+ | | | 1,060,350 | |
| | 5,400 | | Lexington-Fayette Urban County Government Public Facilities Corporation, Kentucky State Lease Revenue Bonds, Eastern State Hospital Project, Series 2011A, 5.250%, 6/01/29 | 6/21 at 100.00 | Aa3 | | | 5,744,682 | |
| | 6,400 | | Total Kentucky | | | | | 6,805,032 | |
| | | | Louisiana – 7.6% (5.3% of Total Investments) | | | | | | |
| | 2,000 | | Jefferson Parish Hospital Service District 2, Louisiana, Hospital Revenue Bonds, East Jefferson General Hospital, Refunding Series 2011, 6.375%, 7/01/41 | 7/21 at 100.00 | Baa2 | | | 2,005,500 | |
| | 3,000 | | Louisiana Local Government Environmental Facilities & Community Development Authority, Revenue Bonds, Westlake Chemical Corporation Project, Series 2007, 6.750%, 11/01/32 | 11/17 at 100.00 | BBB– | | | 3,136,680 | |
| | 10,000 | | Louisiana Public Facilities Authority, Revenue Bonds, Loyola University Project, Refunding Series 2011, 5.000%, 10/01/41 | 10/21 at 100.00 | A+ | | | 10,003,400 | |
| | 3,700 | | Louisiana Public Facilities Authority, Revenue Bonds, Ochsner Clinic Foundation Project, Series 2007A, 5.500%, 5/15/47 | 5/17 at 100.00 | Baa1 | | | 3,550,779 | |
| | 4,425 | | Louisiana Public Facilities Authority, Revenue Bonds, Ochsner Clinic Foundation Project, Series 2011, 6.750%, 5/15/41 | 5/21 at 100.00 | Baa1 | | | 4,785,107 | |
| | 20,890 | | Tobacco Settlement Financing Corporation, Louisiana, Tobacco Settlement Asset-Backed Bonds, Series 2001B, 5.875%, 5/15/39 | 11/11 at 101.00 | A– | | | 20,903,787 | |
| | 44,015 | | Total Louisiana | | | | | 44,385,253 | |
| | Principal | | | Optional Call | | | | | |
| | Amount (000) | | Description (1) | Provisions (2) | Ratings (3) | | | Value | |
| | | | Maine – 0.2% (0.1% of Total Investments) | | | | | | |
| $ | 1,075 | | Maine State Housing Authority, Single Family Mortgage Purchase Bonds, Series 2001B, 5.500%, 11/15/32 (Alternative Minimum Tax) | 11/11 at 100.00 | AA+ | | $ | 1,075,409 | |
| | | | Maryland – 2.4% (1.7% of Total Investments) | | | | | | |
| | 1,000 | | Howard County, Maryland, Retirement Community Revenue Bonds, Vantage House, Series 2007B, 5.250%, 4/01/37 | 4/17 at 100.00 | N/R | | | 714,240 | |
| | 1,135 | | Maryland Community Development Administration, Insured Multifamily Housing Mortgage Loan Revenue Bonds, Series 2001B, 5.250%, 7/01/21 (Pre-refunded 11/21/11) (Alternative Minimum Tax) | 11/11 at 100.00 | Aa2 (4) | | | 1,137,894 | |
| | 2,000 | | Maryland Economic Development Corporation, Revenue Bonds, Chesapeake Bay Hyatt Conference Center, Series 2006A, 5.000%, 12/01/31 | 12/16 at 100.00 | N/R | | | 1,242,520 | |
| | 10,600 | | Maryland Energy Financing Administration, Revenue Bonds, AES Warrior Run Project, Series 1995, 7.400%, 9/01/19 (Alternative Minimum Tax) | 3/12 at 100.00 | N/R | | | 10,674,200 | |
| | 555 | | Maryland Health and Higher Educational Facilities Authority, Revenue Bonds, Mercy Ridge Retirement Community, Series 2007, 4.750%, 7/01/34 | 7/17 at 100.00 | A– | | | 513,930 | |
| | 15,290 | | Total Maryland | | | | | 14,282,784 | |
| | | | Massachusetts – 3.6% (2.5% of Total Investments) | | | | | | |
| | 1,375 | | Massachusetts Development Finance Agency, Revenue Bonds, Orchard Cove, Series 2007, 5.250%, 10/01/26 | 10/12 at 102.00 | N/R | | | 1,175,941 | |
| | 1,000 | | Massachusetts Health and Educational Facilities Authority, Revenue Bonds, Milton Hospital Project, Series 2005D, 5.250%, 7/01/30 | 7/15 at 100.00 | BB– | | | 844,850 | |
| | 1,600 | | Massachusetts Health and Educational Facilities Authority, Revenue Refunding Bonds, Suffolk University Issue, Series 2009A, 5.750%, 7/01/39 | 7/19 at 100.00 | BBB | | | 1,605,264 | |
| | 1,505 | | Massachusetts Housing Finance Agency, Single Family Housing Revenue Bonds, Series 2008, Trust 3145, 15.393%, 6/01/16 (IF) | No Opt. Call | AA | | | 1,589,491 | |
| | 400 | | Massachusetts Port Authority, Special Facilities Revenue Bonds, ConRac Project, Series 2011A, 5.125%, 7/01/41 | 7/21 at 100.00 | A | | | 413,216 | |
| | 5,000 | | Massachusetts Port Authority, Special Facilities Revenue Bonds, Delta Air Lines Inc., Series 2001A, 5.500%, 1/01/18 – AMBAC Insured (Alternative Minimum Tax) | 1/12 at 100.00 | N/R | | | 4,617,700 | |
| | 3,465 | | Massachusetts Water Resources Authority, General Revenue Bonds, Series 2007A, 4.500%, 8/01/46 – AGM Insured (UB), (6) | 2/17 at 100.00 | AA+ | | | 3,480,558 | |
| | 7,165 | | Metropolitan Boston, Massachusetts, Transit Parking Corporation, Systemwide Parking Revenue Bonds, Senior Lien Series 2011, 5.000%, 7/01/41 | 7/21 at 100.00 | A+ | | | 7,316,038 | |
| | 21,510 | | Total Massachusetts | | | | | 21,043,058 | |
| | | | Michigan – 8.1% (5.6% of Total Investments) | | | | | | |
| | 15,000 | | Detroit City School District, Wayne County, Michigan, Unlimited Tax School Building and Site Improvement Bonds, Series 2001A, 6.000%, 5/01/29 – AGM Insured (UB) | No Opt. Call | Aa2 | | | 16,602,150 | |
| | 2,000 | | Garden City Hospital Finance Authority, Michigan, Revenue Bonds, Garden City Hospital Obligated Group, Series 2007A, 5.000%, 8/15/38 | 8/17 at 100.00 | N/R | | | 1,420,560 | |
| | 2,750 | | Lansing Board of Water and Light, Michigan, Utility System Revenue Bonds Series 2011A, 5.500%, 7/01/41 | 7/21 at 100.00 | AA– | | | 3,032,618 | |
| | 5,000 | | Michigan Finance Authority, Revenue Bonds, Trinity Health Credit Group, Refunding Series 2011, 5.000%, 12/01/39 | No Opt. Call | AA | | | 4,988,550 | |
| | 2,250 | | Michigan State Building Authority, Revenue Refunding Bonds, Facilities Program, Series 2011-I-A, 5.375%, 10/15/41 | No Opt. Call | Aa3 | | | 2,413,080 | |
| | 2,395 | | Michigan State Hospital Finance Authority, Hospital Revenue Refunding Bonds, Sisters of Mercy Health Corporation, Series 1993P, 5.375%, 8/15/14 – NPFG Insured (ETM) | No Opt. Call | BBB (4) | | | 2,563,369 | |
| | 2,865 | | Michigan State Hospital Finance Authority, Revenue Bonds, Trinity Health Care Group, Series 2006A, 5.000%, 12/01/31 (UB) | 12/16 at 100.00 | AA | | | 2,913,075 | |
| | 635 | | Michigan State Hospital Finance Authority, Revenue Bonds, Trinity Health Care Group, Series 2006A, 5.000%, 12/01/31 (Pre-refunded 12/01/16) (UB) | 12/16 at 100.00 | N/R (4) | | | 748,595 | |
| | 12,640 | | Royal Oak Hospital Finance Authority, Michigan, Hospital Revenue Bonds, William Beaumont Hospital, Series 2001M, 5.250%, 11/15/31 – NPFG Insured | 11/11 at 100.00 | A1 | | | 12,639,494 | |
| | 45,535 | | Total Michigan | | | | | 47,321,491 | |
| | | Nuveen Dividend Advantage Municipal Fund 3 (continued) |
| NZF | | Portfolio of Investments |
October 31, 2011
| | Principal | | | Optional Call | | | | | |
| | Amount (000) | | Description (1) | Provisions (2) | Ratings (3) | | | Value | |
| | | | Minnesota – 1.2% (0.9% of Total Investments) | | | | | | |
| $ | 2,185 | | Dakota County Community Development Agency, Minnesota, GNMA Collateralized Multifamily Housing Revenue Bonds, Rose Apartments Project, Series 2001, 6.350%,10/20/37 (Alternative Minimum Tax) | 4/12 at 105.00 | Aaa | | $ | 2,265,233 | |
| | 3,000 | | Minnesota State, General Obligation Bonds, Various Purpose, Refunding Series 2010D, 5.000%, 8/01/18 | No Opt. Call | AA+ | | | 3,625,770 | |
| | 1,375 | | Saint Paul Port Authority, Minnesota, Lease Revenue Bonds, Regions Hospital Parking Ramp Project, Series 2007-1, 5.000%, 8/01/36 | 8/16 at 100.00 | N/R | | | 1,245,503 | |
| | 6,560 | | Total Minnesota | | | | | 7,136,506 | |
| | | | Mississippi – 0.9% (0.6% of Total Investments) | | | | | | |
| | 2,155 | | Mississippi Business Finance Corporation, GNMA Collateralized Retirement Facility Mortgage Revenue Refunding Bonds, Aldersgate Retirement Community Inc. Project, Series 1999A, 5.450%, 5/20/34 | 11/11 at 101.00 | AA+ | | | 2,163,469 | |
| | 3,000 | | Mississippi Hospital Equipment and Facilities Authority, Revenue Bonds, Baptist Memorial Healthcare, Series 2004B-1, 5.000%, 9/01/24 (UB) | 9/14 at 100.00 | AA | | | 3,091,200 | |
| | 5,155 | | Total Mississippi | | | | | 5,254,669 | |
| | | | Missouri – 3.3% (2.3% of Total Investments) | | | | | | |
| | 1,495 | | Cape Girardeau County Industrial Development Authority, Missouri, Health Facilities Revenue Bonds, Southeast Missouri Hospital Association, Series 2007, 5.000%, 6/01/36 | 6/17 at 100.00 | N/R | | | 1,333,017 | |
| | 1,000 | | Clinton County Industrial Development Authority, Missouri, Revenue Bonds, Cameron Regional Medical Center, Series 2007, 5.000%, 12/01/32 | 12/17 at 100.00 | N/R | | | 813,320 | |
| | 1,825 | | Fenton, Missouri, Tax Increment Refunding and Improvement Revenue Bonds, Gravois Bluffs Redevelopment Project, Series 2002, 6.125%, 10/01/21 (Pre-refunded 10/01/12) | 10/12 at 100.00 | N/R (4) | | | 1,922,838 | |
| | | | Missouri Development Finance Board, Cultural Facilities Revenue Bonds, Nelson Gallery Foundation, Series 2001A: | | | | | | |
| | 3,335 | | 5.250%, 12/01/19 (Pre-refunded 12/01/11) – NPFG Insured | 12/11 at 100.00 | AA– (4) | | | 3,348,974 | |
| | 3,510 | | 5.250%, 12/01/20 (Pre-refunded 12/01/11) – NPFG Insured | 12/11 at 100.00 | AA– (4) | | | 3,524,707 | |
| | 3,695 | | 5.250%, 12/01/21 (Pre-refunded 12/01/11) – NPFG Insured | 12/11 at 100.00 | AA– (4) | | | 3,710,482 | |
| | 2,040 | | 5.250%, 12/01/22 (Pre-refunded 12/01/11) – NPFG Insured | 12/11 at 100.00 | AA– (4) | | | 2,048,548 | |
| | 2,500 | | Missouri Health and Educational Facilities Authority, Revenue Bonds, Washington University, Series 2011B, 5.000%, 11/15/37 | 11/21 at 100.00 | AAA | | | 2,760,500 | |
| | 19,400 | | Total Missouri | | | | | 19,462,386 | |
| | | | Montana – 0.9% (0.6% of Total Investments) | | | | | | |
| | 5,000 | | Montana Board of Investments, Exempt Facility Revenue Bonds, Stillwater Mining Company, Series 2000, 8.000%, 7/01/20 (Alternative Minimum Tax) | 7/12 at 100.00 | B+ | | | 5,037,950 | |
| | | | Nebraska – 1.1% (0.7% of Total Investments) | | | | | | |
| | 4,330 | | Nebraska Investment Finance Authority, Single Family Housing Revenue Bonds, Series 2010A, 6.050%, 9/01/41 | 2/17 at 100.00 | AA+ | | | 4,689,693 | |
| | 1,005 | | Omaha Public Power District, Nebraska, Separate Electric System Revenue Bonds, Nebraska City 2, Series 2006A, Trust 11673, 19.838%, 8/01/40 – AMBAC Insured (IF) | 2/17 at 100.00 | AA+ | | | 1,578,041 | |
| | 5,335 | | Total Nebraska | | | | | 6,267,734 | |
| | | | Nevada – 6.3% (4.4% of Total Investments) | | | | | | |
| | 10,000 | | Clark County, Nevada, Airport Revenue Bonds, Subordinate Lien Series 2010B, 5.750%, 7/01/42 | 1/20 at 100.00 | Aa3 | | | 10,736,200 | |
| | 6,000 | | Clark County, Nevada, Passenger Facility Charge Revenue Bonds, Las Vegas-McCarran International Airport, Series 2010A, 5.250%, 7/01/42 | 1/20 at 100.00 | Aa3 | | | 6,174,120 | |
| | 2,000 | | Director of Nevada State Department of Business and Industry, Revenue Bonds, Las Vegas Monorail Project, First Tier, Series 2000, 5.375%, 1/01/40 – AMBAC Insured (5) | 1/12 at 100.00 | N/R | | | 460,000 | |
| | 4,000 | | Director of Nevada State Department of Business and Industry, Revenue Bonds, Las Vegas Monorail Project, Second Tier, Series 2000, 7.375%, 1/01/40 (5) | 1/12 at 100.00 | N/R | | | 5,960 | |
| | 5,000 | | Henderson, Nevada, General Obligation Sewer Bonds, Series 2004, 5.000%, 6/01/34 – FGIC Insured | 12/14 at 100.00 | AA+ | | | 5,099,150 | |
| | 10,000 | | Las Vegas Valley Water District, Nevada, Limited Tax General Obligation Bonds, Water & Refunding Series 2011C, 5.000%, 6/01/38 | 6/21 at 100.00 | AA+ | | | 10,248,300 | |
| | 4,290 | | University of Nevada, Revenue Bonds, Community College System, Series 2001A, 5.250%, 7/01/26 (Pre-refunded 1/01/12) – FGIC Insured | 1/12 at 100.00 | Aa2 (4) | | | 4,326,251 | |
| | 41,290 | | Total Nevada | | | | | 37,049,981 | |
| | Principal | | | Optional Call | | | | | |
| | Amount (000) | | Description (1) | Provisions (2) | Ratings (3) | | | Value | |
| | | | New Hampshire – 0.3% (0.2% of Total Investments) | | | | | | |
| $ | 2,000 | | New Hampshire Health and Education Authority, Hospital Revenue Bonds, Concord Hospital, Series 2001, 5.500%, 10/01/21 – AGM Insured | 10/12 at 100.50 | Aa3 | | $ | 2,022,980 | |
| | | | New Jersey – 4.9% (3.4% of Total Investments) | | | | | | |
| | 10,000 | | New Jersey Economic Development Authority, Water Facilities Revenue Bonds, American Water Company, Series 2002A, 5.250%, 11/01/32 – AMBAC Insured (Alternative Minimum Tax) | 11/12 at 101.00 | A2 | | | 10,127,600 | |
| | 620 | | New Jersey Health Care Facilities Financing Authority, Revenue Bonds, Somerset Medical Center, Series 2003, 5.500%, 7/01/33 | 7/13 at 100.00 | Ba2 | | | 484,834 | |
| | 4,125 | | New Jersey Transit Corporation, Certificates of Participation, Federal Transit Administration Grants, Series 2002A, 5.500%, 9/15/13 – AMBAC Insured | No Opt. Call | Aa3 | | | 4,420,144 | |
| | 12,970 | | New Jersey Transportation Trust Fund Authority, Transportation System Bonds, Capital Appreciation Series 2010A, 0.000%, 12/15/33 | No Opt. Call | A+ | | | 3,451,187 | |
| | 20,000 | | New Jersey Transportation Trust Fund Authority, Transportation System Bonds, Series 2006C, 0.000%, 12/15/33 – AGM Insured | No Opt. Call | AA– | | | 5,553,000 | |
| | 7,045 | | Tobacco Settlement Financing Corporation, New Jersey, Tobacco Settlement Asset-Backed Bonds, Series 2007-1A, 4.750%, 6/01/34 | 6/17 at 100.00 | BB+ | | | 4,734,733 | |
| | 54,760 | | Total New Jersey | | | | | 28,771,498 | |
| | | | New York – 7.0% (4.9% of Total Investments) | | | | | | |
| | 900 | | Albany Industrial Development Agency, New York, Revenue Bonds, Brighter Choice Charter Schools, Series 2007A, 5.000%, 4/01/32 | 4/17 at 100.00 | N/R | | | 763,830 | |
| | | | Brooklyn Arena Local Development Corporation, New York, Payment in Lieu of Taxes Revenue Bonds, Barclays Center Project, Series 2009: | | | | | | |
| | 1,275 | | 6.000%, 7/15/30 | 1/20 at 100.00 | BBB– | | | 1,325,477 | |
| | 3,400 | | 0.000%, 7/15/44 | No Opt. Call | BBB– | | | 447,848 | |
| | 4,675 | | Dormitory Authority of the State of New York, State Personal Income Tax Revenue Bonds, General Purpose Series 2011C, 5.000%, 3/15/41 | 3/21 at 100.00 | AAA | | | 4,978,875 | |
| | 1,780 | | East Rochester Housing Authority, New York, GNMA Secured Revenue Bonds, Gates Senior Housing Inc., Series 2001, 5.300%, 4/20/31 | 4/12 at 101.00 | N/R | | | 1,782,528 | |
| | 2,100 | | Hudson Yards Infrastructure Corporation, New York, Revenue Bonds, Senior Fiscal 2012 Series 2011A, 5.750%, 2/15/47 | No Opt. Call | A | | | 2,227,722 | |
| | 5,010 | | Hudson Yards Infrastructure Corporation, New York, Revenue Bonds, Series 2006A, 4.500%, 2/15/47 – NPFG Insured | 2/17 at 100.00 | A | | | 4,561,705 | |
| | 2,800 | | Long Island Power Authority, New York, Electric System Revenue Bonds, Series 2011A, 5.000%, 5/01/36 – AGM Insured | 5/21 at 100.00 | AA+ | | | 2,941,512 | |
| | 750 | | Metropolitan Transportation Authority, New York, Transportation Revenue Bonds, Series 2011A, 5.000%, 11/15/41 | 11/21 at 100.00 | A | | | 775,418 | |
| | 4,155 | | Monroe County Airport Authority, New York, Revenue Refunding Bonds, Greater Rochester International Airport, Series 1999, 5.750%, 1/01/13 – NPFG Insured (Alternative Minimum Tax) | No Opt. Call | Baa1 | | | 4,315,258 | |
| | 8,000 | | New York City Industrial Development Agency, New York, American Airlines-JFK International Airport Special Facility Revenue Bonds, Series 2005, 7.750%, 8/01/31 (Alternative Minimum Tax) | 8/16 at 101.00 | B– | | | 7,428,880 | |
| | 3,125 | | New York City Municipal Water Finance Authority, New York, Water and Sewer System Revenue Bonds, Second Generation Resolution, Fiscal 2011 Series EE, 5.375%, 6/15/43 | 12/20 at 100.00 | AA+ | | | 3,441,781 | |
| | 910 | | New York City, New York, General Obligation Bonds, Fiscal Series 2002G, 5.625%, 8/01/20 – NPFG Insured | 8/12 at 100.00 | AA | | | 942,978 | |
| | 1,590 | | New York City, New York, General Obligation Bonds, Fiscal Series 2002G, 5.625%, 8/01/20 (Pre-refunded 8/01/12) – NPFG Insured | 8/12 at 100.00 | AA (4) | | | 1,654,141 | |
| | 3,000 | | New York State Power Authority, General Revenue Bonds, Series 2011A, 5.000%, 11/15/38 | 11/21 at 100.00 | Aa2 | | | 3,234,420 | |
| | 43,470 | | Total New York | | | | | 40,822,373 | |
| | | | North Carolina – 1.1% (0.8% of Total Investments) | | | | | | |
| | 1,710 | | Charlotte-Mecklenberg Hospital Authority, North Carolina, Carolinas HealthCare System Revenue Bonds, Series 2008, Trust 1149, 14.799%, 7/15/32 (IF), (6) | 1/18 at 100.00 | AA– | | | 1,742,781 | |
| | 1,200 | | Charlotte-Mecklenburg Hospital Authority, North Carolina, Health Care System Revenue Bonds, Carolinas Health Care, Series 2007A, 5.000%, 1/15/31 | 1/17 at 100.00 | AA– | | | 1,226,652 | |
| | 1,750 | | Charlotte-Mecklenburg Hospital Authority, North Carolina, Healthcare System Revenue Bonds, DBA Carolinas Healthcare System, Series 2005A, 4.875%, 1/15/32 (Pre-refunded 1/15/15) | 1/15 at 100.00 | AA+ (4) | | | 1,975,820 | |
| | | Nuveen Dividend Advantage Municipal Fund 3 (continued) |
| NZF | | Portfolio of Investments |
October 31, 2011
| | Principal | | | Optional Call | | | | | |
| | Amount (000) | | Description (1) | Provisions (2) | Ratings (3) | | | Value | |
| | | | North Carolina (continued) | | | | | | |
| $ | 515 | | North Carolina Municipal Power Agency 1, Catawba Electric Revenue Bonds, Series 2003A, 5.500%,1/01/13 (ETM) | No Opt. Call | N/R (4) | | $ | 545,946 | |
| | 1,085 | | North Carolina Municipal Power Agency 1, Catawba Electric Revenue Bonds, Series 2003A, 5.500%, 1/01/13 | No Opt. Call | A | | | 1,144,935 | |
| | 6,260 | | Total North Carolina | | | | | 6,636,134 | |
| | | | Ohio – 2.0% (1.4% of Total Investments) | | | | | | |
| | | | Buckeye Tobacco Settlement Financing Authority, Ohio, Tobacco Settlement Asset-Backed Revenue Bonds, Senior Lien, Series 2007A-2: | | | | | | |
| | 4,735 | | 5.125%, 6/01/24 | 6/17 at 100.00 | BB– | | | 3,648,365 | |
| | 710 | | 5.875%, 6/01/30 | 6/17 at 100.00 | BB– | | | 536,817 | |
| | 685 | | 5.750%, 6/01/34 | 6/17 at 100.00 | BB– | | | 497,146 | |
| | 1,570 | | 5.875%, 6/01/47 | 6/17 at 100.00 | BB– | | | 1,115,297 | |
| | 5,800 | | Franklin County, Ohio, Hospital Revenue Bonds, Ohio Health Corporation, Series 2011A, 5.000%, 11/15/41 | 11/21 at 100.00 | AA | | | 5,833,988 | |
| | 13,500 | | Total Ohio | | | | | 11,631,613 | |
| | | | Oklahoma – 2.0% (1.4% of Total Investments) | | | | | | |
| | | | Oklahoma Development Finance Authority, Revenue Bonds, Saint John Health System, Series 2007: | | | | | | |
| | 4,370 | | 5.000%, 2/15/37 | 2/17 at 100.00 | A | | | 4,421,260 | |
| | 955 | | 5.000%, 2/15/42 | 2/17 at 100.00 | A | | | 963,538 | |
| | 6,305 | | Tulsa County Industrial Authority, Oklahoma, Health Care Revenue Bonds, Saint Francis Health System, Series 2006, 5.000%, 12/15/36 (UB) | 12/16 at 100.00 | AA+ | | | 6,399,890 | |
| | 88 | | Tulsa County Industrial Authority, Oklahoma, Health Care Revenue Bonds, Saint Francis Health System, Series 2008, Trust 3500, 8.415%, 6/15/30 (IF) | 12/16 at 100.00 | AA+ | | | 90,408 | |
| | 11,718 | | Total Oklahoma | | | | | 11,875,096 | |
| | | | Oregon – 0.8% (0.6% of Total Investments) | | | | | | |
| | 4,700 | | Oregon Health, Housing, Educational and Cultural Facilities Authority, Revenue Bonds, PeaceHealth Project, Series 2001, 5.250%, 11/15/21 – AMBAC Insured | 11/11 at 101.00 | A+ | | | 4,753,392 | |
| | | | Pennsylvania – 1.7% (1.2% of Total Investments) | | | | | | |
| | 500 | | Bucks County Industrial Development Authority, Pennsylvania, Charter School Revenue Bonds, School Lane Charter School, Series 2007A, 5.000%, 3/15/37 | 3/17 at 100.00 | BBB | | | 417,070 | |
| | 3,500 | | Pennsylvania Economic Development Financing Authority, Senior Lien Resource Recovery Revenue Bonds, Northampton Generating Project, Series 1994A, 6.600%, 1/01/19 (Alternative Minimum Tax) | 1/12 at 100.00 | CC | | | 1,981,140 | |
| | 1,400 | | Pennsylvania Higher Educational Facilities Authority, Revenue Bonds, St. Joseph’s University, Series 2010A, 5.000%, 11/01/40 | 11/20 at 100.00 | A– | | | 1,419,754 | |
| | 5,705 | | Philadelphia School District, Pennsylvania, General Obligation Bonds, Series 2002B, 5.625%, 8/01/16 (Pre-refunded 8/01/12) – FGIC Insured | 8/12 at 100.00 | Aa2 (4) | | | 5,935,140 | |
| | 11,105 | | Total Pennsylvania | | | | | 9,753,104 | |
| | | | Puerto Rico – 0.4% (0.3% of Total Investments) | | | | | | |
| | 2,500 | | Puerto Rico Sales Tax Financing Corporation, Sales Tax Revenue Bonds, Series 2007A, 5.250%, 8/01/57 | 8/17 at 100.00 | Aa2 | | | 2,570,800 | |
| | | | Tennessee – 0.3% (0.2% of Total Investments) | | | | | | |
| | 3,680 | | Knox County Health, Educational and Housing Facilities Board, Tennessee, Hospital Revenue Refunding Bonds, Covenant Health, Series 2006, 0.000%, 1/01/41 | 1/17 at 30.07 | A | | | 627,477 | |
| | 275 | | Sullivan County Health Educational and Housing Facilities Board, Tennessee, Revenue Bonds, Wellmont Health System, Series 2006C, 5.250%, 9/01/36 | 9/16 at 100.00 | BBB+ | | | 259,515 | |
| | | | Sumner County Health, Educational, and Housing Facilities Board, Tennessee, Revenue Refunding Bonds, Sumner Regional Health System Inc., Series 2007: | | | | | | |
| | 800 | | 5.500%, 11/01/37 (5), (7) | 11/17 at 100.00 | N/R | | | 59,280 | |
| | 2,800 | | 5.500%, 11/01/46 (5), (7) | 11/17 at 100.00 | N/R | | | 207,480 | |
| | 660 | | Tennessee Housing Development Agency, Homeownership Program Bonds, Series 2001-3A, 5.200%, 7/01/22 (Alternative Minimum Tax) | 1/12 at 100.00 | AA+ | | | 660,403 | |
| | 8,215 | | Total Tennessee | | | | | 1,814,155 | |
| | Principal | | | Optional Call | | | | | |
| | Amount (000) | | Description (1) | Provisions (2) | Ratings (3) | | | Value | |
| | | | Texas – 18.0% (12.6% of Total Investments) | | | | | | |
| $ | 5,445 | | Board of Regents, University of Texas System, Financing System Revenue Bonds, Series 2006F, 4.250%, 8/15/36 (UB) | 2/17 at 100.00 | AAA | | $ | 5,515,513 | |
| | 2,700 | | Central Texas Regional Mobility Authority, Senior Lien Revenue Bonds, Series 2011, 6.250%, 1/01/46 | 1/21 at 100.00 | BBB– | | | 2,753,460 | |
| | 4,500 | | Colorado River Municipal Water District, Texas, Water System Revenue Bonds, Series 2011, 5.000%, 1/01/36 | 1/21 at 100.00 | AA– | | | 4,720,635 | |
| | 3,135 | | Dallas-Ft. Worth International Airport, Texas, Joint Revenue Refunding and Improvement Bonds, Series 2001A, 5.500%, 11/01/35 – NPFG Insured (Alternative Minimum Tax) | 11/11 at 100.00 | A+ | | | 3,135,596 | |
| | 5,000 | | Decatur Hospital Authority, Texas, Revenue Bonds, Wise Regional Health System, Series 2004A, 7.000%, 9/01/25 | 9/14 at 100.00 | N/R | | | 5,036,200 | |
| | 10,000 | | Houston, Texas, First Lien Combined Utility System Revenue Bonds, Series 2011D, 5.000%, 11/15/40 | 11/21 at 100.00 | AA | | | 10,653,900 | |
| | 4,965 | | Houston, Texas, Hotel Occupancy Tax and Special Revenue Bonds, Convention and Entertainment Facilities Department, Refunding Series 2011B, 5.250%, 9/01/27 | No Opt. Call | A2 | | | 5,102,034 | |
| | 6,000 | | Houston, Texas, Junior Lien Water and Sewerage System Revenue Refunding Bonds, Series 2001B, 5.500%, 12/01/29 – NPFG Insured (ETM) | No Opt. Call | AA+ (4) | | | 7,667,820 | |
| | | | Houston, Texas, Subordinate Lien Airport System Revenue Refunding Bonds, Series 2001A: | | | | | | |
| | 2,525 | | 5.500%, 7/01/13 – FGIC Insured (Alternative Minimum Tax) | 1/12 at 100.00 | A | | | 2,543,988 | |
| | 2,905 | | 5.500%, 7/01/14 – FGIC Insured (Alternative Minimum Tax) | 1/12 at 100.00 | A | | | 2,926,846 | |
| | 14,200 | | Hutto Independent School District, Williamson County, Texas, General Obligation Bonds, Series 2007A, 4.750%, 8/01/43 (UB) | 8/16 at 100.00 | AAA | | | 14,516,944 | |
| | 8,000 | | Lower Colorado River Authority, Texas, Transmission Contract Refunding Revenue Bonds, LCRA Transmission Services Corporation Project, Refunding & Improvement Series 2010, 5.000%, 5/15/40 | 5/20 at 100.00 | A | | | 8,158,560 | |
| | 1,750 | | Martin County Hospital District, Texas, Combination Limited Tax and Revenue Bonds, Series 2011A, 7.250%, 4/01/36 | 4/21 at 100.00 | N/R | | | 1,823,710 | |
| | 2,500 | | Matagorda County Navigation District 1, Texas, Collateralized Revenue Refunding Bonds, Houston Light and Power Company, Series 1997, 5.125%, 11/01/28 – AMBAC Insured (Alternative Minimum Tax) | No Opt. Call | A3 | | | 2,610,000 | |
| | 3,150 | | North Texas Tollway Authority, Second Tier System Revenue Refunding Bonds, Series 2008F, 5.750%, 1/01/38 | 1/18 at 100.00 | A3 | | | 3,247,682 | |
| | | | North Texas Tollway Authority, Special Projects System Revenue Bonds, Series 2011C: | | | | | | |
| | 4,370 | | 0.000%, 9/01/43 | 9/31 at 100.00 | AA | | | 2,420,062 | |
| | 9,130 | | 0.000%, 9/01/45 | 9/31 at 100.00 | AA | | | 5,593,312 | |
| | 3,500 | | Southwest Higher Education Authority Inc, Texas, Revenue Bonds, Southern Methodist University, Series 2010, 5.000%, 10/01/41 | No Opt. Call | AA– | | | 3,638,985 | |
| | 7,700 | | Tarrant County Cultural & Educational Facilities Financing Corporation, Texas, Revenue Bonds, Texas Health Resources, Series 2007A, 5.000%, 2/15/36 (UB) | 2/17 at 100.00 | AA– | | | 7,758,135 | |
| | | | White Settlement Independent School District, Tarrant County, Texas, General Obligation Bonds, Series 2006: | | | | | | |
| | 9,110 | | 0.000%, 8/15/37 | 8/15 at 31.98 | AAA | | | 2,427,268 | |
| | 9,110 | | 0.000%, 8/15/40 | 8/15 at 27.11 | AAA | | | 2,053,303 | |
| | 7,110 | | 0.000%, 8/15/44 | 8/15 at 21.88 | AAA | | | 1,290,323 | |
| | 126,805 | | Total Texas | | | | | 105,594,276 | |
| | | | Utah – 0.4% (0.3% of Total Investments) | | | | | | |
| | | | Utah Housing Corporation, Single Family Mortgage Bonds, Series 2001E: | | | | | | |
| | 630 | | 5.200%, 1/01/18 (Alternative Minimum Tax) | 1/12 at 100.00 | AA– | | | 632,293 | |
| | 240 | | 5.500%, 1/01/23 (Alternative Minimum Tax) | 1/12 at 100.00 | Aaa | | | 247,999 | |
| | | | Utah Housing Corporation, Single Family Mortgage Bonds, Series 2001F-1: | | | | | | |
| | 965 | | 4.950%, 7/01/18 (Alternative Minimum Tax) | 1/12 at 100.00 | AA– | | | 980,623 | |
| | 355 | | 5.300%, 7/01/23 (Alternative Minimum Tax) | 1/12 at 100.00 | Aaa | | | 365,100 | |
| | 2,190 | | Total Utah | | | | | 2,226,015 | |
| | | | Virginia – 0.1% (0.1% of Total Investments) | | | | | | |
| | 1,000 | | Chesterfield County Health Center Commission, Virginia, Mortgage Revenue Bonds, Lucy Corr Village, Series 2005, 5.375%, 12/01/28 | 12/15 at 100.00 | N/R | | | 870,920 | |
| | | Nuveen Dividend Advantage Municipal Fund 3 (continued) |
| NZF | | Portfolio of Investments |
October 31, 2011
| | Principal | | | Optional Call | | | | | |
| | Amount (000) | | Description (1) | Provisions (2) | Ratings (3) | | | Value | |
| | | | Washington – 9.1% (6.4% of Total Investments) | | | | | | |
| | | | Bellingham Housing Authority, Washington, Housing Revenue Bonds, Varsity Village Project, Series 2001A: | | | | | | |
| $ | 1,000 | | 5.500%, 12/01/27 – NFPG Insured | 12/11 at 100.00 | Aaa | | $ | 1,001,350 | |
| | 2,000 | | 5.600%, 12/01/36 – NFPG Insured | 12/11 at 100.00 | Aaa | | | 2,002,280 | |
| | 2,500 | | King County, Washington, Sewer Revenue Bonds, Series 2009, 5.250%, 1/01/42 Port of Seattle, Washington, Revenue Bonds, Series 2001B: | 1/19 at 100.00 | AA+ | | | 2,692,100 | |
| | 2,535 | | 5.625%, 4/01/18 – FGIC Insured (Alternative Minimum Tax) | 4/12 at 100.00 | Aa2 | | | 2,543,949 | |
| | 16,000 | | 5.100%, 4/01/24 – FGIC Insured (Alternative Minimum Tax) (UB) | 1/12 at 100.00 | Aa2 | | | 16,011,200 | |
| | 5,205 | | Port of Seattle, Washington, Revenue Bonds, Series 2005A, 5.000%, 3/01/35 – NPFG Insured | 3/15 at 100.00 | Aa3 | | | 5,339,185 | |
| | 4,530 | | Tacoma, Washington, Solid Waste Utility Revenue Refunding Bonds, Series 2001, 5.250%, 12/01/21 (Pre-refunded 12/01/11) – AMBAC Insured | 12/11 at 100.00 | AA (4) | | | 4,549,162 | |
| | 10,000 | | Washington Health Care Facilities Authority, Revenue Bonds, Catholic Health, Series 2011A, 5.000%, 2/01/41 (WI/DD, Settling 11/10/11) | 2/21 at 100.00 | AA | | | 9,945,901 | |
| | 3,410 | | Washington State Health Care Facilities Authority, Revenue Bonds, Fred Hutchinson Cancer Research Center, Series 2011A, 5.625%, 1/01/35 | 1/21 at 100.00 | A | | | 3,458,457 | |
| | | | Washington State Health Care Facilities Authority, Revenue Bonds, Group Health Cooperative of Puget Sound, Series 2001: | | | | | | |
| | 3,005 | | 5.375%, 12/01/17 – AMBAC Insured | 12/11 at 101.00 | BBB | | | 3,037,393 | |
| | 2,915 | | 5.375%, 12/01/18 – AMBAC Insured | 12/11 at 101.00 | BBB | | | 2,942,692 | |
| | 53,100 | | Total Washington | | | | | 53,523,669 | |
| | | | Wisconsin – 1.6% (1.2% of Total Investments) | | | | | | |
| | | | Appleton, Wisconsin, Waterworks Revenue Refunding Bonds, Series 2001: | | | | | | |
| | 3,705 | | 5.375%, 1/01/20 (Pre-refunded 1/01/12) – FGIC Insured | 1/12 at 100.00 | N/R (4) | | | 3,736,936 | |
| | 1,850 | | 5.000%, 1/01/21 (Pre-refunded 1/01/12) – FGIC Insured | 1/12 at 100.00 | N/R (4) | | | 1,864,799 | |
| | 1,000 | | Wisconsin Health and Educational Facilities Authority, Revenue Bonds, Franciscan Sisters of Christian Charity HealthCare Ministry, Series 2007, 5.000%, 9/01/33 | 9/17 at 100.00 | BBB+ | | | 927,829 | |
| | 350 | | Wisconsin Health and Educational Facilities Authority, Revenue Bonds, Froedtert and Community Health Obligated Group, Series 2001, 5.375%, 10/01/30 | 10/12 at 100.00 | AA– | | | 352,628 | |
| | 2,500 | | Wisconsin Health and Educational Facilities Authority, Revenue Bonds, Marshfield Clinic, Series 2001B, 6.000%, 2/15/25 | 2/12 at 100.00 | BBB+ | | | 2,505,224 | |
| | 330 | | Wisconsin Health and Educational Facilities Authority, Revenue Bonds, Wheaton Franciscan Services Inc., Series 2003A, 5.125%, 8/15/33 | 8/13 at 100.00 | BBB+ | | | 294,564 | |
| | 9,735 | | Total Wisconsin | | | | | 9,681,980 | |
| $ | 935,498 | | Total Municipal Bonds (cost $809,450,354) | | | | | 812,333,076 | |
| | | | | | | | | | |
| | Shares | | Description (1) | | | | | Value | |
| | | | Investment Companies – 0.6% (0.4% of Total Investments) | | | | | | |
| | 6,266 | | BlackRock MuniHoldings Fund Inc. | | | | $ | 99,629 | |
| | 26,880 | | Dreyfus Strategic Municipals Inc. | | | | | 231,168 | |
| | 131,278 | | DWS Municipal Income Trust | | | | | 1,659,354 | |
| | 43,020 | | Invesco Van Kampen Investment Grade Municipal Trust | | | | | 615,186 | |
| | 30,000 | | Invesco Van Kampen Municipal Opportunity Trust | | | | | 409,500 | |
| | 43,420 | | PIMCO Municipal Income Fund II | | | | | 479,791 | |
| | | | Total Investment Companies (cost $3,325,133) | | | | | 3,494,628 | |
| | Principal | | | Optional Call | | | | | |
| | Amount (000) | | Description (1) | Provisions (2) | Ratings (3) | | | Value | |
| | | | Short-Term Investments – 4.3% (3.0% of Total Investments) | | | | | | |
| | | | Illinois – 1.5% (1.1% of Total Investments) | | | | | | |
| $ | 9,000 | | Chicago, Illinois, General Obligation Bonds, Tender Option Bonds Trust 3190, Variable Rate Demand Series, 0.140%, 1/01/17 (8) | No Opt. Call | N/R | | $ | 9,000,000 | |
| | | | South Carolina – 0.8% (0.6% of Total Investments) | | | | | | |
| | 5,990 | | South Carolina Educational Facilities Authority, Charleston Southern University Education Facilities Revenue Bond, Variable Rate Demand Series 2003, 0.200%, 4/01/28 (8) | 2/12 at 100.00 | N/R | | | 4,730,000 | |
| | | | Texas – 1.0% (0.7% of Total Investments) | | | | | | |
| | 4,730 | | Houston, Texas, Subordinate Lien Airport System Revenue Bonds, Tender Option Bond Trust 3181, Variable Rate Demand Series, 0.240%, 1/01/12 - AGM Insured (8) | No Opt. Call | AA+ | | | 5,990,000 | |
| | | | Washington – 1.0% (0.6% of Total Investments) | | | | | | |
| | 5,480 | | Bellingham, Washington, Water and Sewer Revenue Bonds, Tender Option Bond Trust 11981X, Variable Rate Demand Series, 0.150%, 8/01/19 (8) | No Opt. Call | Aa2 | | | 5,480,000 | |
| $ | 25,200 | | Total Short-Term Investments (cost $25,200,000) | | | | | 25,200,000 | |
| | | | Total Investments (cost $837,975,487) – 143.3% | | | | | 841,027,704 | |
| | | | Floating Rate Obligations – (9.5)% | | | | | (55,612,000 | ) |
| | | | MuniFund Rate Term Preferred Shares, at Liquidation Value – (11.9)% (9) | | | | | (70,000,000 | ) |
| | | | Variable Rate MuniFund Term Preferred Shares, at Liquidation Value - (28.8)% (9) | | | | | (169,200,000 | ) |
| | | | Other Assets Less Liabilities – 6.9% | | | | | 40,831,697 | |
| | | | Net Assets Applicable to Common Shares – 100% | | | | $ | 587,047,401 | |
| (1) | | All percentages shown in the Portfolio of Investments are based on net assets applicable to Common shares unless otherwise noted. |
| (2) | | Optional Call Provisions (not covered by the report of independent registered public accounting firm): Dates (month and year) and prices of the earliest optional call or redemption. There may be other call provisions at varying prices at later dates. Certain mortgage-backed securities may be subject to periodic principal paydowns. |
| (3) | | Ratings (not covered by the report of independent registered public accounting firm): Using the highest of Standard & Poor’s Group (“Standard & Poor’s”), Moody’s Investors Service, Inc. (“Moody’s”) or Fitch, Inc. (“Fitch”) rating. Ratings below BBB by Standard & Poor’s, Baa by Moody’s or BBB by Fitch are considered to be below investment grade. Holdings designated N/R are not rated by any of these national rating agencies. |
| (4) | | Backed by an escrow or trust containing sufficient U.S. Government or U.S. Government agency securities, which ensure the timely payment of principal and interest. Bonds backed by U.S. Government or agency securities are given an implied rating equal to the rating of such securities. |
| (5) | | At or subsequent to the end of the reporting period, this security is non-income producing. Non-income producing security, in the case of a bond, generally denotes that the issuer has (1) defaulted on the payment of principal or interest, (2) is under the protection of the Federal Bankruptcy Court or (3) the Fund’s Adviser has concluded that the issue is not likely to meet its future interest payment obligations and has directed the Fund’s custodian to cease accruing additional income on the Fund’s records. |
| (6) | | Investment, or portion of investment, has been pledged to collateralize the net payment obligations of investments in inverse floating rate transactions. |
| (7) | | For fair value measurement disclosure purposes, investment categorized as Level 3. See Notes to Financial Statements, Footnote 1 – General Information and Significant Accounting Policies, Investment Valuation for more information. |
| (8) | | Investment has a maturity of more than one year, but has variable rate and demand features which qualify it as a short-term investment. The rate disclosed is that in effect at the end of the reporting period. This rate changes periodically based on market conditions or a specified market index. |
| (9) | | MuniFund Term Preferred Shares and Variable Rate MuniFund Term Preferred Shares, at Liquidation Value as a percentage of Total Investments are 8.3% and 20.1%, respectively. |
| N/R | | Not rated. |
| WI/DD | | Purchased on a when-issued or delayed delivery basis. |
| (ETM) | | Escrowed to maturity. |
| (IF) | | Inverse floating rate investment. |
| (UB) | | Underlying bond of an inverse floating rate trust reflected as a financing transaction. See Notes to Financial Statements, Footnote 1 – General Information and Significant Accounting Policies, Inverse Floating Rate Securities for more information. |
See accompanying notes to financial statements.
| | | Statement of |
| | | Assets & Liabilities |
| | | | Performance | | | Municipal | | | Market | |
| | | | Plus | | | Advantage | | | Opportunity | |
| | | | (NPP | ) | | (NMA | ) | | (NMO | ) |
| Assets | | | | | | | | | | |
| Investments, at value (cost $1,278,507,478, $929,006,567 and $999,529,521, respectively) | | $ | 1,321,271,982 | | $ | 936,163,679 | | $ | 985,313,481 | |
| Cash | | | 10,167,184 | | | — | | | 6,384,223 | |
| Receivables: | | | | | | | | | | |
| Dividends and interest | | | 17,867,972 | | | 15,315,508 | | | 15,435,671 | |
| Investments sold | | | 13,977,567 | | | 27,967,649 | | | 14,691,256 | |
| Deferred offering costs | | | 1,376,188 | | | 2,018,348 | | | 3,990,364 | |
| Other assets | | | 320,400 | | | 436,152 | | | 424,530 | |
| Total assets | | | 1,364,981,293 | | | 981,901,336 | | | 1,026,239,525 | |
| Liabilities | | | | | | | | | | |
| Cash overdraft | | | — | | | 5,295,713 | | | — | |
| Floating rate obligations | | | 40,020,000 | | | 46,513,333 | | | 43,530,000 | |
| Payables: | | | | | | | | | | |
| Common share dividends | | | 4,231,787 | | | 3,072,666 | | | 3,111,812 | |
| Investments purchased | | | 4,635,093 | | | 2,557,027 | | | 4,635,093 | |
| Interest | | | 498,992 | | | — | | | — | |
| Offering costs | | | 172,081 | | | 243,294 | | | 393,751 | |
| MuniFund Term Preferred (MTP) Shares, at liquidation value | | | — | | | — | | | — | |
| Variable Rate MuniFund Term Preferred (VMTP) Shares, at liquidation value | | | 421,700,000 | | | — | | | — | |
| Variable Rate Demand Preferred (VRDP) Shares, at liquidation value | | | — | | | 296,800,000 | | | 350,900,000 | |
| Accrued expenses: | | | | | | | | | | |
| Management fees | | | 693,016 | | | 494,449 | | | 510,125 | |
| Other | | | 427,782 | | | 308,904 | | | 344,109 | |
| Total liabilities | | | 472,378,751 | | | 355,285,386 | | | 403,424,890 | |
| Net assets applicable to Common shares | | $ | 892,602,542 | | $ | 626,615,950 | | $ | 622,814,635 | |
| Common shares outstanding | | | 59,952,462 | | | 43,591,176 | | | 45,809,174 | |
| Net asset value per Common share outstanding (net assets applicable to Common shares, divided by Common shares outstanding) | | $ | 14.89 | | $ | 14.37 | | $ | 13.60 | |
| | | | | | | | | | | |
| Net assets applicable to Common shares consist of: | | | | | | | | | | |
| Common shares, $.01 par value per share | | $ | 599,525 | | $ | 435,912 | | $ | 458,092 | |
| Paid-in surplus | | | 838,514,978 | | | 609,469,537 | | | 638,984,246 | |
| Undistributed (Over-distribution of) net investment income | | | 17,435,924 | | | 7,315,192 | | | 5,775,306 | |
| Accumulated net realized gain (loss) | | | (6,712,389 | ) | | 2,238,197 | | | (8,186,969 | ) |
| Net unrealized appreciation (depreciation) | | | 42,764,504 | | | 7,157,112 | | | (14,216,040 | ) |
| Net assets applicable to Common shares | | $ | 892,602,542 | | $ | 626,615,950 | | $ | 622,814,635 | |
| Authorized shares: | | | | | | | | | | |
| Common | | | 200,000,000 | | | 200,000,000 | | | 200,000,000 | |
| Auction Rate Preferred Shares (ARPS) | | | 1,000,000 | | | 1,000,000 | | | 1,000,000 | |
| MTP | | | — | | | — | | | — | |
| VMTP | | | Unlimited | | | — | | | — | |
| VRDP | | | — | | | Unlimited | | | Unlimited | |
See accompanying notes to financial statements.
| | | | Dividend | | | Dividend | | | Dividend | |
| | | | Advantage | | | Advantage 2 | | | Advantage 3 | |
| | | | (NAD | ) | | (NXZ | ) | | (NZF | ) |
| Assets | | | | | | | | | | |
| Investments, at value (cost $858,469,948, $601,166,992 and $837,975,487, respectively) | | $ | 861,210,132 | | $ | 601,940,274 | | $ | 841,027,704 | |
| Cash | | | 4,862,056 | | | 3,413,566 | | | 1,671,232 | |
| Receivables: | | | | | | | | | | |
| Dividends and interest | | | 13,685,487 | | | 10,708,543 | | | 14,435,906 | |
| Investments sold | | | 4,150,908 | | | 31,611,284 | | | 41,686,551 | |
| Deferred offering costs | | | 1,970,512 | | | 2,069,544 | | | 1,921,295 | |
| Other assets | | | 201,118 | | | 242,590 | | | 197,478 | |
| Total assets | | | 886,080,213 | | | 649,985,801 | | | 900,940,166 | |
| Liabilities | | | | | | | | | | |
| Cash overdraft | | | — | | | — | | | — | |
| Floating rate obligations | | | 51,605,000 | | | 18,260,000 | | | 55,612,000 | |
| Payables: | | | | | | | | | | |
| Common share dividends | | | 2,883,060 | | | 2,282,465 | | | 3,208,335 | |
| Investments purchased | | | — | | | 5,804,183 | | | 14,594,915 | |
| Interest | | | 446,691 | | | — | | | 327,624 | |
| Offering costs | | | 380,549 | | | 32,532 | | | 375,368 | |
| MuniFund Term Preferred (MTP) Shares, at liquidation value | | | 144,300,000 | | | — | | | 70,000,000 | |
| Variable Rate MuniFund Term Preferred (VMTP) Shares, at liquidation value | | | 120,400,000 | | | — | | | 169,200,000 | |
| Variable Rate Demand Preferred (VRDP) Shares, at liquidation value | | | — | | | 196,000,000 | | | — | |
| Accrued expenses: | | | | | | | | | | |
| Management fees | | | 441,518 | | | 321,465 | | | 423,241 | |
| Other | | | 259,220 | | | 200,286 | | | 151,282 | |
| Total liabilities | | | 320,716,038 | | | 222,900,931 | | | 313,892,765 | |
| Net assets applicable to Common shares | | $ | 565,364,175 | | $ | 427,084,870 | | $ | 587,047,401 | |
| Common shares outstanding | | | 39,296,352 | | | 29,461,808 | | | 40,392,021 | |
| Net asset value per Common share outstanding (net assets applicable to Common shares, divided by Common shares outstanding) | | $ | 14.39 | | $ | 14.50 | | $ | 14.53 | |
| | | | | | | | | | | |
| Net assets applicable to Common shares consist of: | | | | | | | | | | |
| Common shares, $.01 par value per share | | $ | 392,964 | | $ | 294,618 | | $ | 403,920 | |
| Paid-in surplus | | | 550,324,441 | | | 420,261,977 | | | 575,456,976 | |
| Undistributed (Over-distribution of) net investment income | | | 10,952,267 | | | 6,451,843 | | | 9,617,756 | |
| Accumulated net realized gain (loss) | | | 954,319 | | | (696,850 | ) | | (1,483,468 | ) |
| Net unrealized appreciation (depreciation) | | | 2,740,184 | | | 773,282 | | | 3,052,217 | |
| Net assets applicable to Common shares | | $ | 565,364,175 | | $ | 427,084,870 | | $ | 587,047,401 | |
| Authorized shares: | | | | | | | | | | |
| Common | | | Unlimited | | | Unlimited | | | Unlimited | |
| Auction Rate Preferred Shares (ARPS) | | | Unlimited | | | Unlimited | | | Unlimited | |
| MTP | | | Unlimited | | | — | | | Unlimited | |
| VMTP | | | Unlimited | | | — | | | Unlimited | |
| VRDP | | | — | | | Unlimited | | | — | |
See accompanying notes to financial statements.
| Year Ended October 31, 2011 |
| | | | Performance | | | Municipal | | | Market | | | Dividend | | | Dividend | | | Dividend | |
| | | | Plus | | | Advantage | | | Opportunity | | | Advantage | | | Advantage 2 | | | Advantage 3 | |
| | | | (NPP | ) | | (NMA | ) | | (NMO | ) | | (NAD | ) | | (NXZ | ) | | (NZF | ) |
| Investment Income | | $ | 72,230,403 | | $ | 52,429,697 | | $ | 52,600,695 | | $ | 47,268,678 | | $ | 36,283,619 | | $ | 47,919,507 | |
| Expenses | | | | | | | | | | | | | | | | | | | |
| Management fees | | | 7,960,706 | | | 5,675,061 | | | 5,845,747 | | | 5,055,608 | | | 3,693,113 | | | 5,315,387 | |
| Auction fees | | | 198,133 | | | — | | | — | | | 107,015 | | | — | | | 199,365 | |
| Dividend disbursing agent fees | | | 17,105 | | | — | | | — | | | 29,918 | | | — | | | 30,000 | |
| Shareholders’ servicing agent fees and expenses | | | 113,811 | | | 64,050 | | | 67,632 | | | 44,159 | | | 3,711 | | | 14,721 | |
| Interest expense and amortization of offering costs | | | 4,810,267 | | | 1,586,051 | | | 1,814,037 | | | 5,060,910 | | | 971,958 | | | 2,694,130 | |
| Fees on VRDP Shares | | | — | | | 4,123,013 | | | 3,979,328 | | | — | | | 2,222,708 | | | — | |
| Custodian’s fees and expenses | | | 211,097 | | | 150,310 | | | 158,513 | | | 137,185 | | | 102,286 | | | 133,205 | |
| Directors’/Trustees’ fees and expenses | | | 37,957 | | | 27,687 | | | 28,741 | | | 24,548 | | | 18,541 | | | 24,895 | |
| Professional fees | | | 142,973 | | | 151,619 | | | 325,915 | | | 144,932 | | | 143,550 | | | 51,290 | |
| Shareholders’ reports – printing and mailing expenses | | | 158,975 | | | 80,423 | | | 110,547 | | | 88,958 | | | 50,132 | | | 84,921 | |
| Stock exchange listing fees | | | 20,064 | | | 15,182 | | | 15,830 | | | 36,842 | | | 3,850 | | | 17,349 | |
| Investor relations expense | | | 95,841 | | | 62,540 | | | 67,260 | | | 58,085 | | | 41,151 | | | 55,236 | |
| Other expenses | | | 72,031 | | | 59,243 | | | 63,418 | | | 66,202 | | | 43,908 | | | 55,565 | |
| Total expenses before custodian fee credit and expense reimbursement | | | 13,838,960 | | | 11,995,179 | | | 12,476,968 | | | 10,854,362 | | | 7,294,908 | | | 8,676,064 | |
| Custodian fee credit | | | (10,954 | ) | | (10,681 | ) | | (10,717 | ) | | (11,140 | ) | | (9,874 | ) | | (18,539 | ) |
| Expense reimbursement | | | — | | | — | | | — | | | — | | | (123,892 | ) | | (401,481 | ) |
| Net expenses | | | 13,828,006 | | | 11,984,498 | | | 12,466,251 | | | 10,843,222 | | | 7,161,142 | | | 8,256,044 | |
| Net investment income (loss) | | | 58,402,397 | | | 40,445,199 | | | 40,134,444 | | | 36,425,456 | | | 29,122,477 | | | 39,663,463 | |
| Realized and Unrealized Gain (Loss) | | | | | | | | | | | | | | | | | | | |
| Net realized gain (loss) from investments | | | (591,675 | ) | | 8,178,413 | | | (3,062,685 | ) | | 5,578,402 | | | 6,152,659 | | | 1,617,428 | |
| Change in net unrealized appreciation (depreciation) of investments | | | (18,358,182 | ) | | (19,639,261 | ) | | (18,881,221 | ) | | (17,440,480 | ) | | (14,731,426 | ) | | (8,746,437 | ) |
| Net realized and unrealized gain (loss) | | | (18,949,857 | ) | | (11,460,848 | ) | | (21,943,906 | ) | | (11,862,078 | ) | | (8,578,767 | ) | | (7,129,009 | ) |
| Distributions to Auction Rate Preferred Shareholders | | | | | | | | | | | | | | | | | | | |
| From net investment income | | | (605,027 | ) | | (13,530 | ) | | (18,596 | ) | | (319,994 | ) | | — | | | (579,698 | ) |
| From accumulated net realized gains | | | (115,631 | ) | | — | | | — | | | — | | | — | | | (9,510 | ) |
| Decrease in net assets applicable to Common shares from distributions to Auction Rate Preferred shareholders | | | (720,658 | ) | | (13,530 | ) | | (18,596 | ) | | (319,994 | ) | | — | | | (589,208 | ) |
| Net increase (decrease) in net assets applicable to Common shares from operations | | $ | 38,731,882 | | $ | 28,970,821 | | $ | 18,171,942 | | $ | 24,243,384 | | $ | 20,543,710 | | $ | 31,945,246 | |
See accompanying notes to financial statements.
| | | Statement of |
| | | Changes in Net Assets |
| | | | Performance Plus (NPP) | | | Municipal Advantage (NMA) | | | Market Opportunity (NMO) | |
| | | | Year | | | Year | | | Year | | | Year | | | Year | | | Year | |
| | | | Ended | | | Ended | | | Ended | | | Ended | | | Ended | | | Ended | |
| | | | 10/31/11 | | | 10/31/10 | | | 10/31/11 | | | 10/31/10 | | | 10/31/11 | | | 10/31/10 | |
| Operations | | | | | | | | | | | | | | | | | | | |
| Net investment income (loss) | | $ | 58,402,397 | | $ | 61,961,159 | | $ | 40,445,199 | | $ | 43,865,457 | | $ | 40,134,444 | | $ | 45,415,957 | |
| Net realized gain (loss) from investments | | | (591,675 | ) | | 5,333,340 | | | 8,178,413 | | | 2,499,059 | | | (3,062,685 | ) | | 7,021,125 | |
| Change in net unrealized appreciation (depreciation) of investments | | | (18,358,182 | ) | | 36,406,331 | | | (19,639,261 | ) | | 29,929,503 | | | (18,881,221 | ) | | 18,357,610 | |
| Distributions to Auction Rate Preferred Shareholders: | | | | | | | | | | | | | | | | | | | |
| From net investment income | | | (605,027 | ) | | (1,674,198 | ) | | (13,530 | ) | | (355,444 | ) | | (18,596 | ) | | (606,064 | ) |
| From accumulated net realized gains | | | (115,631 | ) | | (47,490 | ) | | — | | | (183,376 | ) | | — | | | — | |
| Net increase (decrease) in net assets applicable to Common shares from operations | | | 38,731,882 | | | 101,979,142 | | | 28,970,821 | | | 75,755,199 | | | 18,171,942 | | | 70,188,628 | |
| Distributions to Common Shareholders | | | | | | | | | | | | | | | | | | | |
| From net investment income | | | (57,031,258 | ) | | (55,177,839 | ) | | (43,394,199 | ) | | (42,290,819 | ) | | (44,419,598 | ) | | (43,873,378 | ) |
| From accumulated net realized gains | | | (5,533,612 | ) | | (814,831 | ) | | (3,480,219 | ) | | (2,827,574 | ) | | — | | | — | |
| Decrease in net assets applicable to Common shares from distributions to Common shareholders | | | (62,564,870 | ) | | (55,992,670 | ) | | (46,874,418 | ) | | (45,118,393 | ) | | (44,419,598 | ) | | (43,873,378 | ) |
| Capital Share Transactions | | | | | | | | | | | | | | | | | | | |
| Net proceeds from Common shares issued to shareholders due to reinvestment of distributions | | | 283,901 | | | 292,445 | | | 2,155,588 | | | 2,913,988 | | | 1,045,705 | | | 2,382,420 | |
| Net increase (decrease) in net assets applicable to Common shares from capital share transactions | | | 283,901 | | | 292,445 | | | 2,155,588 | | | 2,913,988 | | | 1,045,705 | | | 2,382,420 | |
| Net increase (decrease) in net assets applicable to Common shares | | | (23,549,087 | ) | | 46,278,917 | | | (15,748,009 | ) | | 33,550,794 | | | (25,201,951 | ) | | 28,697,670 | |
| Net assets applicable to Common shares at the beginning of period | | | 916,151,629 | | | 869,872,712 | | | 642,363,959 | | | 608,813,165 | | | 648,016,586 | | | 619,318,916 | |
| Net assets applicable to Common shares at the end of period | | $ | 892,602,542 | | $ | 916,151,629 | | $ | 626,615,950 | | $ | 642,363,959 | | $ | 622,814,635 | | $ | 648,016,586 | |
| Undistributed (Over-distribution of) net investment income at the end of period | | $ | 17,435,924 | | $ | 16,554,168 | | $ | 7,315,192 | | $ | 10,244,572 | | $ | 5,775,306 | | $ | 9,994,354 | |
| See accompanying notes to financial statements. |
| | | Statement of |
| | | Changes in Net Assets (continued) |
| | | | Dividend Advantage (NAD) | | | Dividend Advantage 2 (NXZ) | | | Dividend Advantage 3 (NZF) | |
| | | | Year | | | Year | | | Year | | | Year | | | Year | | | Year | |
| | | | Ended | | | Ended | | | Ended | | | Ended | | | Ended | | | Ended | |
| | | | 10/31/11 | | | 10/31/10 | | | 10/31/11 | | | 10/31/10 | | | 10/31/11 | | | 10/31/10 | |
| Operations | | | | | | | | | | | | | | | | | | | |
| Net investment income (loss) | | $ | 36,425,456 | | $ | 39,281,244 | | $ | 29,122,477 | | $ | 30,012,369 | | $ | 39,663,463 | | $ | 43,023,730 | |
| Net realized gain (loss) from investments | | | 5,578,402 | | | 1,079,125 | | | 6,152,659 | | | 1,450,091 | | | 1,617,428 | | | 786,636 | |
| Change in net unrealized appreciation (depreciation) of investments | | | (17,440,480 | ) | | 27,410,233 | | | (14,731,426 | ) | | 6,351,263 | | | (8,746,437 | ) | | 20,450,314 | |
| Distributions to Auction Rate Preferred Shareholders: | | | | | | | | | | | | | | | | | | | |
| From net investment income | | | (319,994 | ) | | (724,675 | ) | | — | | | — | | | (579,698 | ) | | (880,640 | ) |
| From accumulated net realized gains | | | — | | | — | | | — | | | — | | | (9,510 | ) | | (125,552 | ) |
| Net increase (decrease) in net assets applicable to Common shares from operations | | | 24,243,384 | | | 67,045,927 | | | 20,543,710 | | | 37,813,723 | | | 31,945,246 | | | 63,254,488 | |
| Distributions to Common Shareholders | | | | | | | | | | | | | | | | | | | |
| From net investment income | | | (35,837,926 | ) | | (35,752,124 | ) | | (28,282,999 | ) | | (28,615,006 | ) | | (39,745,377 | ) | | (38,518,652 | ) |
| From accumulated net realized gains | | | — | | | — | | | — | | | — | | | (630,116 | ) | | (2,547,863 | ) |
| Decrease in net assets applicable to Common shares from distributions to Common shareholders | | | (35,837,926 | ) | | (35,752,124 | ) | | (28,282,999 | ) | | (28,615,006 | ) | | (40,375,493 | ) | | (41,066,515 | ) |
| Capital Share Transactions | | | | | | | | | | | | | | | | | | | |
| Net proceeds from Common shares issued to shareholders due to reinvestment of distributions | | | 63,949 | | | 66,815 | | | 59,744 | | | 312,251 | | | 64,704 | | | 137,143 | |
| Net increase (decrease) in net assets applicable to Common shares from capital share transactions | | | 63,949 | | | 66,815 | | | 59,744 | | | 312,251 | | | 64,704 | | | 137,143 | |
| Net increase (decrease) in net assets applicable to Common shares | | | (11,530,593 | ) | | 31,360,618 | | | (7,679,545 | ) | | 9,510,968 | | | (8,365,543 | ) | | 22,325,116 | |
| Net assets applicable to Common shares at the beginning of period | | | 576,894,768 | | | 545,534,150 | | | 434,764,415 | | | 425,253,447 | | | 595,412,944 | | | 573,087,828 | |
| Net assets applicable to Common shares at the end of period | | $ | 565,364,175 | | $ | 576,894,768 | | $ | 427,084,870 | | $ | 434,764,415 | | $ | 587,047,401 | | $ | 595,412,944 | |
| Undistributed (Over-distribution of) net investment income at the end of period | | $ | 10,952,267 | | $ | 10,503,735 | | $ | 6,451,843 | | $ | 5,571,360 | | $ | 9,617,756 | | $ | 10,037,019 | |
| | | See accompanying notes to financial statements. |
| | Year Ended October 31, 2011 |
| | | | Performance | | | Municipal | | | Market | |
| | | | Plus | | | Advantage | | | Opportunity | |
| | | | (NPP | ) | | (NMA | ) | | (NMO | ) |
| Cash Flows from Operating Activities: | | | | | | | | | | |
| Net Increase (Decrease) In Net Assets Applicable to Common Shares from Operations | | $ | 38,731,882 | | $ | 28,970,821 | | $ | 18,171,942 | |
| Adjustments to reconcile the net increase (decrease) in net assets applicable to Common shares from operations to net cash provided by (used in) operating activities: | | | | | | | | | | |
| Purchases of investments | | | (125,871,204 | ) | | (134,828,212 | ) | | (153,734,830 | ) |
| Proceeds from sales and maturities of investments | | | 160,856,247 | | | 178,925,746 | | | 139,793,839 | |
| Proceeds from (Purchases of) short-term investments, net | | | — | | | — | | | — | |
| Amortization (Accretion) of premiums and discounts, net | | | (14,246,878 | ) | | (6,436,159 | ) | | (7,040,343 | ) |
| (Increase) Decrease in: | | | | | | | | | | |
| Receivable for dividends and interest | | | 502,511 | | | 637,932 | | | 567,421 | |
| Receivable for investments sold | | | (13,182,567 | ) | | (27,372,649 | ) | | 46,452,744 | |
| Other assets | | | (22,024 | ) | | (6,670 | ) | | (28,875 | ) |
| Increase (Decrease) in: | | | | | | | | | | |
| Payable for Auction Rate Preferred share dividends | | | (25,686 | ) | | — | | | — | |
| Payable for investments purchased | | | 4,635,093 | | | 2,557,027 | | | (7,098,889 | ) |
| Payable for interest | | | 498,992 | | | — | | | — | |
| Accrued management fees | | | (18,768 | ) | | 30,809 | | | 49,617 | |
| Accrued other expenses | | | (62,801 | ) | | (29,956 | ) | | (30,243 | ) |
| Net realized (gain) loss from investments | | | 591,675 | | | (8,178,413 | ) | | 3,062,685 | |
| Change in net unrealized (appreciation) depreciation of investments | | | 18,358,182 | | | 19,639,261 | | | 18,881,221 | |
| Taxes paid on undistributed capital gains | | | (373 | ) | | (181,725 | ) | | (4,366 | ) |
| Net cash provided by (used in) operating activities | | | 70,744,281 | | | 53,727,812 | | | 59,041,923 | |
| Cash Flows from Financing Activities: | | | | | | | | | | |
| (Increase) Decrease in deferred offering costs | | | (1,376,188 | ) | | 71,575 | | | 140,736 | |
| Increase (Decrease) in: | | | | | | | | | | |
| Cash overdraft | | | — | | | 5,295,713 | | | (9,292,196 | ) |
| Floating rate obligations | | | (2,305,000 | ) | | (21,181,650 | ) | | — | |
| Payable for offering costs | | | 172,081 | | | — | | | — | |
| ARPS, at liquidation value | | | (419,900,000 | ) | | — | | | — | |
| MTP Shares, at liquidation value | | | — | | | — | | | — | |
| VMTP Shares, at liquidation value | | | 421,700,000 | | | — | | | — | |
| Cash distributions paid to Common shareholders | | | (62,169,509 | ) | | (44,700,466 | ) | | (43,506,240 | ) |
| Net cash provided by (used in) financing activities | | | (63,878,616 | ) | | (60,514,828 | ) | | (52,657,700 | ) |
| Net Increase (Decrease) in Cash | | | 6,865,665 | | | (6,787,016 | ) | | 6,384,223 | |
| Cash at the beginning of period | | | 3,301,519 | | | 6,787,016 | | | — | |
| Cash at the End of Period | | $ | 10,167,184 | | $ | — | | $ | 6,384,223 | |
| Supplemental Disclosure of Cash Flow Information |
Non-cash financing activities not included herein consist of reinvestments of Common share distributions of $283,901, $2,155,588 and $1,045,705 for Performance Plus (NPP), Municipal Advantage (NMA) and Market Opportunity (NMO), respectively. |
| | | | Performance | | | Municipal | | | Market | |
| | | | Plus | | | Advantage | | | Opportunity | |
| | | | (NPP | ) | | (NMA | ) | | (NMO | ) |
| Cash paid for interest (excluding amortization of offering costs) | | $ | 3,907,462 | | $ | 1,514,476 | | $ | 1,673,300 | |
| See accompanying notes to financial statements. |
| | | Statement of |
| | | Cash Flows (continued) |
| | | Year Ended October 31, 2011 |
| | | | Dividend | | | Dividend | | | Dividend | |
| | | | Advantage | | | Advantage 2 | | | Advantage 3 | |
| | | | (NAD | ) | | (NXZ | ) | | (NZF | ) |
| Cash Flows from Operating Activities: | | | | | | | | | | |
| Net Increase (Decrease) In Net Assets Applicable to Common Shares from Operations | | $ | 24,243,384 | | $ | 20,543,710 | | $ | 31,945,246 | |
| Adjustments to reconcile the net increase (decrease) in net assets applicable to Common shares from operations to net cash provided by (used in) operating activities: | | | | | | | | | | |
| Purchases of investments | | | (128,568,854 | ) | | (243,875,221 | ) | | (250,046,891 | ) |
| Proceeds from sales and maturities of investments | | | 132,702,951 | | | 275,555,510 | | | 314,415,649 | |
| Proceeds from (Purchases of) short-term investments, net | | | — | | | — | | | (25,200,000 | ) |
| Amortization (Accretion) of premiums and discounts, net | | | (7,956,720 | ) | | (3,933,252 | ) | | (1,716,217 | ) |
| (Increase) Decrease in: | | | | | | | | | | |
| Receivable for dividends and interest | | | (648,087 | ) | | 687,381 | | | 672,193 | |
| Receivable for investments sold | | | 15,277,217 | | | (23,501,284 | ) | | (40,831,571 | ) |
| Other assets | | | (7,155 | ) | | (17,108 | ) | | (18,419 | ) |
| Increase (Decrease) in: | | | | | | | | | | |
| Payable for Auction Rate Preferred share dividends | | | (18,956 | ) | | — | | | (13,176 | ) |
| Payable for investments purchased | | | (5,859,060 | ) | | 5,804,183 | | | 14,594,915 | |
| Payable for interest | | | 122,016 | | | — | | | 327,624 | |
| Accrued management fees | | | (10,911 | ) | | 20,523 | | | (6,108 | ) |
| Accrued other expenses | | | (8,153 | ) | | 26,545 | | | (50,011 | ) |
| Net realized (gain) loss from investments | | | (5,578,402 | ) | | (6,152,659 | ) | | (1,617,428 | ) |
| Change in net unrealized (appreciation) depreciation of investments | | | 17,440,480 | | | 14,731,426 | | | 8,746,437 | |
| Taxes paid on undistributed capital gains | | | (3,781 | ) | | (244 | ) | | (344 | ) |
| Net cash provided by (used in) operating activities | | | 41,125,969 | | | 39,889,510 | | | 51,201,899 | |
| Cash Flows from Financing Activities: | | | | | | | | | | |
| (Increase) Decrease in deferred offering costs | | | 269,571 | | | 72,964 | | | (1,921,295 | ) |
| Increase (Decrease) in: | | | | | | | | | | |
| Cash overdraft | | | (1,211,715 | ) | | — | | | — | |
| Floating rate obligations | | | — | | | (8,401,650 | ) | | (12,796,650 | ) |
| Payable for offering costs | | | 116,259 | | | (75,929 | ) | | 375,368 | |
| ARPS, at liquidation value | | | (120,075,000 | ) | | — | | | (236,950,000 | ) |
| MTP Shares, at liquidation value | | | — | | | — | | | 70,000,000 | |
| VMTP Shares, at liquidation value | | | 120,400,000 | | | — | | | 169,200,000 | |
| Cash distributions paid to Common shareholders | | | (35,763,028 | ) | | (28,214,577 | ) | | (40,306,158 | ) |
| Net cash provided by (used in) financing activities | | | (36,263,913 | ) | | (36,619,192 | ) | | (52,398,735 | ) |
| Net Increase (Decrease) in Cash | | | 4,862,056 | | | 3,270,318 | | | (1,196,836 | ) |
| Cash at the beginning of period | | | — | | | 143,248 | | | 2,868,068 | |
| Cash at the End of Period | | $ | 4,862,056 | | $ | 3,413,566 | | $ | 1,671,232 | |
| Supplemental Disclosure of Cash Flow Information |
| Non-cash financing activities not included herein consist of reinvestments of Common share distributions of $63,949, $59,744 and $64,704 for Dividend Advantage (NAD), Dividend Advantage 2 (NXZ) and Dividend Advantage 3 (NZF), respectively. |
| | | | | | | | | | | |
| | | | Dividend | | | Dividend | | | Dividend | |
| | | | Advantage | | | Advantage 2 | | | Advantage 3 | |
| | | | (NAD | ) | | (NXZ | ) | | (NZF | ) |
| Cash paid for interest (excluding amortization of offering costs) | | $ | 4,409,323 | | $ | 898,994 | | $ | 2,089,129 | |
| See accompanying notes to financial statements. |
| | Selected data for a Common share outstanding throughout each period: |
| | | | | | Investment Operations | | | Less Distributions | | | | | | | | | | |
| | | | | | | | | | | | | Distributions | | | Distributions | | | | | | | | | | | | | | | Discount | | | | | | | |
| | | | | | | | | | | | | from Net | | | from | | | | | | | | | | | | | | | from | | | | | | | |
| | | | | | | | | | | | | Investment | | | Capital | | | | | | Net | | | | | | | | | Common | | | | | | | |
| | | | Beginning | | | | | | | | | Income to | | | Gains to | | | | | | Investment | | | Capital | | | | | | Shares | | | Ending | | | | |
| | | | Common | | | | | | Net | | | Auction Rate | | | Auction Rate | | | | | | Income to | | | Gains to | | | | | | Repur- | | | Common | | | | |
| | | | Share | | | Net | | | Realized/ | | | Preferred | | | Preferred | | | | | | Common | | | Common | | | | | | chased | | | Share | | | Ending | |
| | | | Net Asset | | | Investment | | | Unrealized | | | Share- | | | Share- | | | | | | Share- | | | Share- | | | | | | and | | | Net Asset | | | Market | |
| | | | Value | | | Income | | | Gain (Loss | ) | | holders(a | ) | | holders | (a) | | Total | | | holders | | | holders | | | Total | | | Retired | | | Value | | | Value | |
| Performance Plus (NPP) | | | | | | | | | | | | | | | | | | | | | | | | | | |
| Year Ended 10/31: | | | | | | | | | | | | | | | | | | | | | | | | | | | | | | |
| 2011 | | $ | 15.29 | | $ | .97 | | $ | (.32 | ) | $ | (.01 | ) | $ | — | * | $ | .64 | | $ | (.95 | ) | $ | (.09 | ) | $ | (1.04 | ) | $ | — | | $ | 14.89 | | $ | 14.36 | |
| 2010 | | | 14.52 | | | 1.03 | | | .70 | | | (.03 | ) | | — | * | | 1.70 | | | (.92 | ) | | (.01 | ) | | (.93 | ) | | — | | | 15.29 | | | 15.00 | |
| 2009 | | | 12.69 | | | 1.03 | | | 1.65 | | | (.06 | ) | | — | | | 2.62 | | | (.79 | ) | | — | | | (.79 | ) | | — | | | 14.52 | | | 13.48 | |
| 2008 | | | 15.22 | | | 1.02 | | | (2.56 | ) | | (.29 | ) | | — | | | (1.83 | ) | | (.70 | ) | | — | | | (.70 | ) | | — | | | 12.69 | | | 11.50 | |
| 2007 | | | 15.78 | | | .99 | | | (.47 | ) | | (.27 | ) | | (.01 | ) | | .24 | | | (.75 | ) | | (.05 | ) | | (.80 | ) | | — | | | 15.22 | | | 13.59 | |
| | | | | | | | | | | | | | | | | | | | | | | | | | | | | | | | | | | | | | |
| Municipal Advantage (NMA) | | | | | | | | | | | | | | | | | | | | | | | | | |
| Year Ended 10/31: | | | | | | | | | | | | | | | | | | | | | | | | | | | | |
| 2011 | | | 14.79 | | | .93 | | | (.27 | ) | | — | | | — | | | .66 | | | (1.00 | ) | | (.08 | ) | | (1.08 | ) | | — | | | 14.37 | | | 14.05 | |
| 2010 | | | 14.08 | | | 1.01 | | | .76 | | | (.01 | ) | | — | * | | 1.76 | | | (.98 | ) | | (.07 | ) | | (1.05 | ) | | — | | | 14.79 | | | 14.92 | |
| 2009 | | | 12.12 | | | 1.10 | | | 1.76 | | | (.06 | ) | | — | | | 2.80 | | | (.84 | ) | | — | | | (.84 | ) | | — | | | 14.08 | | | 13.41 | |
| 2008 | | | 15.20 | | | 1.08 | | | (3.06 | ) | | (.30 | ) | | (.01 | ) | | (2.29 | ) | | (.77 | ) | | (.02 | ) | | (.79 | ) | | — | | | 12.12 | | | 11.41 | |
| 2007 | | | 15.88 | | | 1.07 | | | (.63 | ) | | (.29 | ) | | — | | | .15 | | | (.83 | ) | | — | | | (.83 | ) | | — | | | 15.20 | | | 13.95 | |
| (a) | The amounts shown are based on Common share equivalents. |
| (b) | Total Return Based on Market Value is the combination of changes in the market price per share and the effect of reinvested dividend income and reinvested capital gains distributions, if any, at the average price paid per share at the time of reinvestment. The last dividend declared in the period, which is typically paid on the first business day of the following month, is assumed to be reinvested at the ending market price. The actual reinvestment for the last dividend declared in the period may take place over several days, and in some instances may not be based on the market price, so the actual reinvestment price may be different from the price used in the calculation. Total returns are not annualized. |
| | |
| | Total Return Based on Common Share Net Asset Value is the combination of changes in Common share net asset value, reinvested dividend income at net asset value and reinvested capital gains distributions at net asset value, if any. The last dividend declared in the period, which is typically paid on the first business day of the following month, is assumed to be reinvested at the ending net asset value. The actual reinvest price for the last dividend declared in the period may often be based on the Fund’s market price (and not its net asset value), and therefore may be different from the price used in the calculation. Total returns are not annualized. |
| | | | | | | | Ratios/Supplemental Data |
| | | | | | | | | | Ratios to Average Net Assets | | | | |
| | Total Returns | | | | | Applicable to Common Shares(c)(d) | | | | |
| | | | | | | | | | | | | | | | | | |
| | | | | | | | | | | | | | | | | | |
| | | | | Based | | | Ending | | | | | | | | | | |
| | | | | on | | | Net | | | | | | | | | | |
| | Based | | | Common | | | Assets | | | | | | | | | | |
| | on | | | Share Net | | | Applicable | | | | | | Net | | | Portfolio | |
| | Market | | | Asset | | | to Common | | | | | | Investment | | | Turnover | |
| | Value | (b) | | Value | (b) | | Shares (000 | ) | | Expenses | (e) | | Income (Loss | ) | | Rate | |
| | | | | | | | | | | | | | | | | | |
| | | | | | | | | | | | | | | | | | |
| | 3.22 | % | | 4.78 | % | $ | 892,603 | | | 1.62 | % | | 6.84 | % | | 10 | % |
| | 18.65 | | | 12.07 | | | 916,152 | | | 1.13 | | | 6.93 | | | 14 | |
| | 24.78 | | | 21.20 | | | 869,873 | | | 1.23 | | | 7.59 | | | 6 | |
| | (10.71 | ) | | (12.49 | ) | | 760,496 | | | 1.25 | | | 6.96 | | | 9 | |
| | (4.97 | ) | | 1.53 | | | 912,066 | | | 1.16 | | | 6.38 | | | 6 | |
| | | | | | | | | | | | | | | | | | |
| | | | | | | | | | | | | | | | | | |
| | 1.90 | | | 5.05 | | | 626,616 | | | 2.01 | | | 6.76 | | | 14 | |
| | 19.58 | | | 12.90 | | | 642,364 | | | 1.66 | | | 7.04 | | | 16 | |
| | 25.70 | | | 23.89 | | | 608,813 | | | 1.31 | | | 8.51 | | | 9 | |
| | (13.16 | ) | | (15.65 | ) | | 523,602 | | | 1.38 | | | 7.50 | | | 13 | |
| | (7.08 | ) | | 1.06 | | | 656,806 | | | 1.40 | | | 6.87 | | | 10 | |
| (c) | Ratios do not reflect the effect of dividend payments to Auction Rate Preferred shareholders, where applicable; Net Investment Income (Loss) ratios reflect income earned and expenses incurred on assets attributable to ARPS, VMTP Shares and/or VRDP Shares, where applicable. |
| (d) | Ratios do not reflect the effect of custodian fee credits earned on the Fund’s net cash on deposit with the custodian bank, where applicable. |
| (e) | The expense ratios reflect, among other things, all interest expense and other costs related to VMTP Shares, VRDP Shares and/or the interest expense deemed to have been paid by the Fund on the floating rate certificates issued by the special purpose trusts for the self-deposited inverse floaters held by the Fund, where applicable, each as described in Footnote 1 – General Information and Significant Accounting Policies, Variable Rate MuniFund Term Preferred Shares, Variable Rate Demand Preferred Shares and Inverse Floating Rate Securities, respectively as follows: |
| Performance Plus (NPP) | | | | |
| Year Ended 10/31: | | | | |
| 2011 | | | .56 | % |
| 2010 | | | .04 | |
| 2009 | | | .05 | |
| 2008 | | | .08 | |
| 2007 | | | .02 | |
| | | | | |
| Municipal Advantage (NMA) | | | | |
| Year Ended 10/31: | | | | |
| 2011 | | | .96 | % |
| 2010 | | | .60 | |
| 2009 | | | .09 | |
| 2008 | | | .17 | |
| 2007 | | | .23 | |
| * | Rounds to less than $.01 per share. |
| See accompanying notes to financial statements. |
| | | Financial |
| | | Highlights (continued) |
| | | |
| | Selected data for a Common share outstanding throughout each period: |
| | | | | | Investment Operations | | Less Distributions | | | | | | | | | | |
| | | | | | | | | | | | | Distributions | | | Distributions | | | | | | | | | | | | | | | Discount | | | | | | | |
| | | | | | | | | | | | | from Net | | | from | | | | | | | | | | | | | | | from | | | | | | | |
| | | | | | | | | | | | | Investment | | | Capital | | | | | | Net | | | | | | | | | Common | | | | | | | |
| | | | Beginning | | | | | | | | | Income to | | | Gains to | | | | | | Investment | | | Capital | | | | | | Shares | | | Ending | | | | |
| | | | Common | | | | | | Net | | | Auction Rate | | | Auction Rate | | | | | | Income to | | | Gains to | | | | | | Repur- | | | Common | | | | |
| | | | Share | | | Net | | | Realized/ | | | Preferred | | | Preferred | | | | | | Common | | | Common | | | | | | chased | | | Share | | | Ending | |
| | | | Net Asset | | | Investment | | | Unrealized | | | Share- | | | Share- | | | | | | Share- | | | Share- | | | | | | and | | | Net Asset | | | Market | |
| | | | Value | | | Income | | | Gain (Loss | ) | | holders(a | ) | | holders(a | ) | | Total | | | holders | | | holders | | | Total | | | Retired | | | Value | | | Value | |
| Market Opportunity (NMO) | | | | | | | | | | | | | | | | | | | | | | | | | | |
| Year Ended 10/31: | | | | | | | | | | | | | | | | | | | | | | | | | | |
| 2011 | | $ | 14.17 | | $ | .88 | | $ | (.48 | ) | $ | —* | | $ | — | | $ | .40 | | $ | (.97 | ) | $ | — | | $ | (.97 | ) | $ | — | | $ | 13.60 | | $ | 13.18 | |
| 2010 | | | 13.59 | | | .99 | | | .56 | | | (.01 | ) | | — | | | 1.54 | | | (.96 | ) | | — | | | (.96 | ) | | — | | | 14.17 | | | 14.55 | |
| 2009 | | | 12.23 | | | 1.10 | | | 1.13 | | | (.06 | ) | | — | | | 2.17 | | | (.81 | ) | | — | | | (.81 | ) | | — | | | 13.59 | | | 13.32 | |
| 2008 | | | 14.83 | | | 1.03 | | | (2.59 | ) | | (.31 | ) | | — | | | (1.87 | ) | | (.73 | ) | | — | | | (.73 | ) | | — | | | 12.23 | | | 11.52 | |
| 2007 | | | 15.41 | | | 1.04 | | | (.56 | ) | | (.30 | ) | | — | | | .18 | | | (.76 | ) | | — | | | (.76 | ) | | — | �� | | 14.83 | | | 13.53 | |
| | | | | | | | | | | | | | | | | | | | | | | | | | | | | | | | | | | | | | |
| Dividend Advantage (NAD) | | | | | | | | | | | | | | | | | | | | | | | | | | |
| Year Ended 10/31: | | | | | | | | | | | | | | | | | | | | | | | | | | |
| 2011 | | | 14.68 | | | .92 | | | (.29 | ) | | (.01 | ) | | — | | | .62 | | | (.91 | ) | | — | | | (.91 | ) | | — | | | 14.39 | | | 13.70 | |
| 2010 | | | 13.89 | | | 1.00 | | | .72 | | | (.02 | ) | | — | | | 1.70 | | | (.91 | ) | | — | | | (.91 | ) | | — | | | 14.68 | | | 14.40 | |
| 2009 | | | 11.77 | | | 1.07 | | | 1.93 | | | (.05 | ) | | — | | | 2.95 | | | (.83 | ) | | — | | | (.83 | ) | | — | | | 13.89 | | | 12.89 | |
| 2008 | | | 14.90 | | | 1.05 | | | (3.14 | ) | | (.27 | ) | | — | | | (2.36 | ) | | (.77 | ) | | — | | | (.77 | ) | | — | | | 11.77 | | | 10.72 | |
| 2007 | | | 15.54 | | | 1.04 | | | (.60 | ) | | (.27 | ) | | — | | | .17 | | | (.81 | ) | | — | | | (.81 | ) | | — | | | 14.90 | | | 13.63 | |
| (a) | The amounts shown are based on Common share equivalents. |
| (b) | Total Return Based on Market Value is the combination of changes in the market price per share and the effect of reinvested dividend income and reinvested capital gains distributions, if any, at the average price paid per share at the time of reinvestment. The last dividend declared in the period, which is typically paid on the first business day of the following month, is assumed to be reinvested at the ending market price. The actual reinvestment for the last dividend declared in the period may take place over several days, and in some instances may not be based on the market price, so the actual reinvestment price may be different from the price used in the calculation. Total returns are not annualized. |
| | |
| | Total Return Based on Common Share Net Asset Value is the combination of changes in Common share net asset value, reinvested dividend income at net asset value and reinvested capital gains distributions at net asset value, if any. The last dividend declared in the period, which is typically paid on the first business day of the following month, is assumed to be reinvested at the ending net asset value. The actual reinvest price for the last dividend declared in the period may often be based on the Fund’s market price (and not its net asset value), and therefore may be different from the price used in the calculation. Total returns are not annualized. |
| | | | | | | Ratios/Supplemental Data |
| | | | | | | | | | Ratios to Average Net Assets | | Ratios to Average Net Assets | | | | |
| | | | | | | | | | Applicable to Common Shares | | Applicable to Common Shares | | | | |
| | Total Returns | | | | | Before Reimbursement(c) | | After Reimbursement(c)(d) | | | | |
| | | | | | | | | | | | | | | | | | | | | | | | |
| | | | | | | | | | | | | | | | | | | | | | | | |
| | | | | Based | | | Ending | | | | | | | | | | | | | | | | |
| | | | | on | | | Net | | | | | | | | | | | | | | | | |
| | Based | | | Common | | | Assets | | | | | | | | | | | | | | | | |
| | on | | | Share Net | | | Applicable | | | | | | Net | | | | | | Net | | | Portfolio | |
| | Market | | | Asset | | | to Common | | | | | | Investment | | | | | | Investment | | | Turnover | |
| | Value | (b) | | Value | (b) | | Shares (000 | ) | | Expenses | (e) | | Income (Loss | ) | | Expenses | (e) | | Income (Loss | ) | | Rate | |
| | | | | | | | | | | | | | | | | | | | | | | | |
| | | | | | | | | | | | | | | | | | | | | | | | |
| | (2.33 | )% | | 3.40 | % | $ | 622,815 | | | 2.10 | % | | 6.74 | % | | N/A | | | N/A | | | 14 | % |
| | 17.03 | | | 11.71 | | | 648,017 | | | 1.70 | | | 7.17 | | | N/A | | | N/A | | | 26 | |
| | 23.67 | | | 18.30 | | | 619,319 | | | 1.32 | | | 8.58 | | | N/A | | | N/A | | | 10 | |
| | (9.87 | ) | | (13.07 | ) | | 557,346 | | | 1.36 | | | 7.33 | | | N/A | | | N/A | | | 8 | |
| | (5.00 | ) | | 1.20 | | | 675,577 | | | 1.38 | | | 6.87 | | | N/A | | | N/A | | | 5 | |
| | | | | | | | | | | | | | | | | | | | | | | | |
| | | | | | | | | | | | | | | | | | | | | | | | |
| | 1.93 | | | 4.76 | | | 565,364 | | | 2.02 | | | 6.77 | | | 2.02 | % | | 6.77 | % | | 15 | |
| | 19.17 | | | 12.60 | | | 576,895 | | | 1.61 | | | 6.99 | | | 1.61 | | | 6.99 | | | 8 | |
| | 28.86 | | | 25.78 | | | 545,534 | | | 1.26 | | | 8.38 | | | 1.21 | | | 8.43 | | | 9 | |
| | (16.46 | ) | | (16.42 | ) | | 462,554 | | | 1.36 | | | 7.33 | | | 1.22 | | | 7.46 | | | 11 | |
| | (5.96 | ) | | 1.10 | | | 585,496 | | | 1.24 | | | 6.60 | | | 1.03 | | | 6.81 | | | 11 | |
| (c) | Ratios do not reflect the effect of dividend payments to Auction Rate Preferred shareholders, where applicable; Net Investment Income (Loss) ratios reflect income earned and expenses incurred on assets attributable to ARPS, MTP Shares, VMTP Shares, and/or VRDP Shares, where applicable. |
| (d) | After expense reimbursement from the Adviser, where applicable. Ratios do not reflect the effect of custodian fee credits earned on the Fund’s net cash on deposit with the custodian bank, where applicable. As of July 31, 2009, the Adviser is no longer reimbursing Dividend Advantage (NAD) for any fees and expenses. |
| (e) | The expense ratios reflect, among other things, all interest expense and other costs related to MTP Shares, VMTP Shares, VRDP Shares and/or the interest expense deemed to have been paid by the Fund on the floating rate certificates issued by the special purpose trusts for the self-deposited inverse floaters held by the Fund, where applicable, each as described in Footnote 1 – General Information and Significant Accounting Policies, MuniFund Term Preferred Shares, Variable Rate MuniFund Term Preferred Shares, Variable Rate Demand Preferred Shares and Inverse Floating Rate Securities, respectively as follows: |
| Market Opportunity (NMO) | | | | |
| Year Ended 10/31: | | | | |
| 2011 | | | .97 | % |
| 2010 | | | .58 | |
| 2009 | | | .07 | |
| 2008 | | | .14 | |
| 2007 | | | .19 | |
| | | | | |
| Dividend Advantage (NAD) | | | | |
| Year Ended 10/31: | | | | |
| 2011 | | | .94 | % |
| 2010 | | | .54 | |
| 2009 | | | .09 | |
| 2008 | | | .21 | |
| 2007 | | | .11 | |
| N/A | Fund does not have a contractual reimbursement agreement with the Adviser. |
| * | Rounds to less than $.01 per share. |
| See accompanying notes to financial statements. |
| | | Financial |
| | | Highlights (continued) |
| | | |
| | Selected data for a Common share outstanding throughout each period: |
| | | | | | Investment Operations | | Less Distributions | | | | | | | | | | |
| | | | | | | | | | | | | Distributions | | | Distributions | | | | | | | | | | | | | | | Discount | | | | | | | |
| | | | | | | | | | | | | from Net | | | from | | | | | | | | | | | | | | | from | | | | | | | |
| | | | | | | | | | | | | Investment | | | Capital | | | | | | Net | | | | | | | | | Common | | | | | | | |
| | | | Beginning | | | | | | | | | Income to | | | Gains to | | | | | | Investment | | | Capital | | | | | | Shares | | | Ending | | | | |
| | | | Common | | | | | | Net | | | Auction Rate | | | Auction Rate | | | | | | Income to | | | Gains to | | | | | | Repur- | | | Common | | | | |
| | | | Share | | | Net | | | Realized/ | | | Preferred | | | Preferred | | | | | | Common | | | Common | | | | | | chased | | | Share | | | Ending | |
| | | | Net Asset | | | Investment | | | Unrealized | | | Share- | | | Share- | | | | | | Share- | | | Share- | | | | | | and | | | Net Asset | | | Market | |
| | | | Value | | | Income | | | Gain (Loss | ) | | holders | (a) | | holders | (a) | | Total | | | holders | | | holders | | | Total | | | Retired | | | Value | | | Value | |
| Dividend Advantage 2 (NXZ) | | | | | | | | | | | | | | | | | | | | | | | | | | |
| Year Ended 10/31: | | | | | | | | | | | | | | | | | | | | | | | | | | |
| 2011 | | $ | 14.76 | | $ | .99 | | $ | (.29 | ) | $ | — | | $ | — | | $ | .70 | | $ | (.96 | ) | $ | — | | $ | (.96 | ) | $ | — | | $ | 14.50 | | $ | 13.90 | |
| 2010 | | | 14.45 | | | 1.02 | | | .26 | | | — | | | — | | | 1.28 | | | (.97 | ) | | — | | | (.97 | ) | | — | | | 14.76 | | | 14.67 | |
| 2009 | | | 12.71 | | | 1.04 | | | 1.59 | | | — | | | — | | | 2.63 | | | (.89 | ) | | — | | | (.89 | ) | | — | | | 14.45 | | | 14.14 | |
| 2008 | | | 15.55 | | | 1.05 | | | (2.81 | ) | | (.20 | ) | | — | | | (1.96 | ) | | (.88 | ) | | — | | | (.88 | ) | | — | | | 12.71 | | | 12.35 | |
| 2007 | | | 16.02 | | | 1.13 | | | (.43 | ) | | (.27 | ) | | — | | | .43 | | | (.90 | ) | | — | | | (.90 | ) | | — | | | 15.55 | | | 15.48 | |
| | | | | | | | | | | | | | | | | | | | | | | | | | | | | | | | | | | | | | |
| Dividend Advantage 3 (NZF) | | | | | | | | | | | | | | | | | | | | | | | | | | |
| Year Ended 10/31: | | | | | | | | | | | | | | | | | | | | | | | | | | | |
| 2011 | | | 14.74 | | | .98 | | | (.18 | ) | | (.01 | ) | | —* | | | .79 | | | (.98 | ) | | (.02 | ) | | (1.00 | ) | | — | | | 14.53 | | | 14.17 | |
| 2010 | | | 14.19 | | | 1.06 | | | .52 | | | (.02 | ) | | —* | | | 1.56 | | | (.95 | ) | | (.06 | ) | | (1.01 | ) | | — | | | 14.74 | | | 14.58 | |
| 2009 | | | 12.10 | | | 1.08 | | | 1.91 | | | (.05 | ) | | — | | | 2.94 | | | (.85 | ) | | — | | | (.85 | ) | | — | | | 14.19 | | | 13.38 | |
| 2008 | | | 15.03 | | | 1.06 | | | (2.95 | ) | | (.27 | ) | | — | | | (2.16 | ) | | (.77 | ) | | — | | | (.77 | ) | | — | | | 12.10 | | | 10.72 | |
| 2007 | | | 15.54 | | | 1.07 | | | (.44 | ) | | (.27 | ) | | (.01 | ) | | .35 | | | (.84 | ) | | (.02 | ) | | (.86 | ) | | — | | | 15.03 | | | 13.85 | |
| (a) | The amounts shown are based on Common share equivalents. |
| (b) | Total Return Based on Market Value is the combination of changes in the market price per share and the effect of reinvested dividend income and reinvested capital gains distributions, if any, at the average price paid per share at the time of reinvestment. The last dividend declared in the period, which is typically paid on the first business day of the following month, is assumed to be reinvested at the ending market price. The actual reinvestment for the last dividend declared in the period may take place over several days, and in some instances may not be based on the market price, so the actual reinvestment price may be different from the price used in the calculation. Total returns are not annualized. |
| | |
| | Total Return Based on Common Share Net Asset Value is the combination of changes in Common share net asset value, reinvested dividend income at net asset value and reinvested capital gains distributions at net asset value, if any. The last dividend declared in the period, which is typically paid on the first business day of the following month, is assumed to be reinvested at the ending net asset value. The actual reinvest price for the last dividend declared in the period may often be based on the Fund’s market price (and not its net asset value), and therefore may be different from the price used in the calculation. Total returns are not annualized. |
| | | | | | | Ratios/Supplemental Data |
| | | | | | | | | | Ratios to Average Net Assets | | Ratios to Average Net Assets | | | | |
| | | | | | | | | | Applicable to Common Shares | | Applicable to Common Shares | | | | |
| | Total Returns | | | | | Before Reimbursement(c) | | After Reimbursement(c)(d) | | | | |
| | | | | | | | | | | | | | | | | | | | | | | | |
| | | | | Based | | | Ending | | | | | | | | | | | | | | | | |
| | | | | on | | | Net | | | | | | | | | | | | | | | | |
| | Based | | | Common | | | Assets | | | | | | | | | | | | | | | | |
| | on | | | Share Net | | | Applicable | | | | | | Net | | | | | | Net | | | Portfolio | |
| | Market | | | Asset | | | to Common | | | | | | Investment | | | | | | Investment | | | Turnover | |
| | Value | (b) | | Value | (b) | | Shares (000 | ) | | Expenses | (e) | | Income (Loss | ) | | Expenses | (e) | | Income (Loss | ) | | Rate | |
| | | | | | | | | | | | | | | | | | | | | | | | |
| | | | | | | | | | | | | | | | | | | | | | | | |
| | 1.70 | % | | 5.24 | % | $ | 427,085 | | | 1.78 | % | | 7.08 | % | | 1.75 | % | | 7.11 | % | | 40 | % |
| | 10.89 | | | 9.12 | | | 434,764 | | | 1.79 | | | 6.85 | | | 1.68 | | | 6.95 | | | 5 | |
| | 22.63 | | | 21.41 | | | 425,253 | | | 1.91 | | | 7.59 | | | 1.73 | | | 7.77 | | | 2 | |
| | (15.21 | ) | | (13.23 | ) | | 373,940 | | | 1.71 | | | 6.82 | | | 1.45 | | | 7.08 | | | 10 | |
| | (.78 | ) | | 2.76 | | | 456,992 | | | 1.25 | | | 6.83 | | | .93 | | | 7.16 | | | 5 | |
| | | | | | | | | | | | | | | | | | | | | | | | |
| | | | | | | | | | | | | | | | | | | | | | | | |
| | 4.59 | | | 5.83 | | | 587,047 | | | 1.53 | | | 6.93 | | | 1.46 | | | 7.00 | | | 30 | |
| | 17.04 | | | 11.41 | | | 595,413 | | | 1.17 | | | 7.21 | | | 1.02 | | | 7.36 | | | 7 | |
| | 33.89 | | | 25.08 | | | 573,088 | | | 1.26 | | | 7.98 | | | 1.04 | | | 8.20 | | | 2 | |
| | (17.85 | ) | | (14.99 | ) | | 488,561 | | | 1.34 | | | 7.08 | | | 1.04 | | | 7.37 | | | 7 | |
| | (7.72 | ) | | 2.31 | | | 606,908 | | | 1.32 | | | 6.65 | | | .94 | | | 7.02 | | | 14 | |
| (c) | Ratios do not reflect the effect of dividend payments to Auction Rate Preferred shareholders, where applicable; Net Investment Income (Loss) ratios reflect income earned and expenses incurred on assets attributable to ARPS, MTP Shares, VMTP Shares, and/or VRDP Shares, where applicable. |
| (d) | After expense reimbursement from the Adviser, where applicable. Ratios do not reflect the effect of custodian fee credits earned on the Fund’s net cash on deposit with the custodian bank, where applicable. As of March 31, 2011, the Adviser is no longer reimbursing Dividend Advantage 2 (NXZ) for any fees and expenses. As of September 30, 2011, the Adviser is no longer reimbursing Dividend Advantage 3 (NZF) for any fees and expenses. |
| (e) | The expense ratios reflect, among other things, all interest expense and other costs related to MTP Shares, VMTP Shares, VRDP Shares and/or the interest expense deemed to have been paid by the Fund on the floating rate certificates issued by the special purpose trusts for the self-deposited inverse floaters held by the Fund, where applicable, each as described in Footnote 1 – General Information and Significant Accounting Policies, MuniFund Term Preferred Shares, Variable Rate MuniFund Term Preferred Shares, Variable Rate Demand Preferred Shares and Inverse Floating Rate Securities, respectively as follows: |
| Dividend Advantage 2 (NXZ) | | | | |
| Year Ended 10/31: | | | | |
| 2011 | | | .78 | % |
| 2010 | | | .78 | |
| 2009 | | | .83 | |
| 2008 | | | .49 | |
| 2007 | | | .14 | |
| | | | | |
| Dividend Advantage 3 (NZF) | | | | |
| Year Ended 10/31: | | | | |
| 2011 | | | .48 | % |
| 2010 | | | .09 | |
| 2009 | | | .11 | |
| 2008 | | | .19 | |
| 2007 | | | .19 | |
| * | Rounds to less than $.01 per share. |
| See accompanying notes to financial statements. |
| | | Financial |
| | | Highlights (continued) |
| | | ARPS at | | VMTP Shares | | VRDP Shares | |
| | | the End of Period | | at the End of Period | | at the End of Period | |
| | | | Aggregate | | | | | | | | | Aggregate | | | | | | | | | Aggregate | | | | | | | |
| | | | Amount | | | Liquidation | | | Asset | | | Amount | | | Liquidation | | | Asset | | | Amount | | | Liquidation | | | Asset | |
| | | | Outstanding | | | Value | | | Coverage | | | Outstanding | | | Value | | | Coverage | | | Outstanding | | | Value | | | Coverage | |
| | | | (000 | ) | | Per Share | | | Per Share | | | (000 | ) | | Per Share | | | Per Share | | | (000 | ) | | Per Share | | | Per Share | |
| Performance Plus (NPP) | | | | | | | | | | | | | | | | | | |
| Year Ended 10/31: | | | | | | | | | | | | | | | | | | | | |
| 2011 | | $ | — | | $ | — | | $ | — | | $ | 421,700 | | $ | 100,000 | | $ | 311,668 | | $ | — | | $ | — | | $ | — | |
| 2010 | | | 419,900 | | | 25,000 | | | 79,546 | | | — | | | — | | | — | | | — | | | — | | | — | |
| 2009 | | | 419,900 | | | 25,000 | | | 76,790 | | | — | | | — | | | — | | | — | | | — | | | — | |
| 2008 | | | 439,650 | | | 25,000 | | | 68,244 | | | — | | | — | | | — | | | — | | | — | | | — | |
| 2007 | | | 479,000 | | | 25,000 | | | 72,603 | | | — | | | — | | | — | | | — | | | — | | | — | |
| | | | | | | | | | | | | | | | | | | | | | | | | | | | | |
| Municipal Advantage (NMA) | | | | | | | | | | | | | | | | | | | |
| Year Ended 10/31: | | | | | | | | | | | | | | | | | | | |
| 2011 | | | — | | | — | | | — | | | — | | | — | | | — | | | 296,800 | | | 100,000 | | | 311,124 | |
| 2010 | | | — | | | — | | | — | | | — | | | — | | | — | | | 296,800 | | | 100,000 | | | 316,430 | |
| 2009 | | | 293,200 | | | 25,000 | | | 76,911 | | | — | | | — | | | — | | | — | | | — | | | — | |
| 2008 | | | 341,650 | | | 25,000 | | | 63,314 | | | — | | | — | | | — | | | — | | | — | | | — | |
| 2007 | | | 358,000 | | | 25,000 | | | 70,866 | | | — | | | — | | | — | | | — | | | — | | | — | |
| See accompanying notes to financial statements. |
| | | ARPS at the End of Period | | MTP Shares at the End of Period (f) | | VMTP Shares at the End of Period | | VRDP Shares at the End of Period | | | ARPS, MTP and/or VMTP Shares at the End of Period | |
| | | Aggregate Amount Outstanding (000) | | Liquidation Value Per Share | | Asset Coverage Per Share | | Aggregate Amount Outstanding (000) | | Liquidation Value Per Share | | Asset Coverage Per Share | | Aggregate Amount Outstanding (000) | | Liquidation Value Per Share | | Asset Coverage Per Share | | Aggregate Amount Outstanding (000) | | Liquidation Value Per Share | | Asset Coverage Per Share | | Asset Coverage
Per $1 Liquidation Preference | |
| Market Opportunity (NMO) | | | | | | | | | | | | | | | | | | | | | | | | | | | |
| Year Ended 10/31: | | | | | | | | | | | | | | | | | | | | | | | | | | | |
| 2011 | | $ | — | | $ | — | | $ | — | | $ | — | | $ | — | | $ | — | | $ | — | | $ | — | | $ | — | | $ | 350,900 | | $ | 100,000 | | $ | 277,491 | | $ | — | |
| 2010 | | | — | | | — | | | — | | | — | | | — | | | — | | | — | | | — | | | — | | | 350,900 | | | 100,000 | | | 284,673 | | | — | |
| 2009 | | | 346,675 | | | 25,000 | | | 69,661 | | | — | | | — | | | — | | | — | | | — | | | — | | | — | | | — | | | — | | | — | |
| 2008 | | | 361,675 | | | 25,000 | | | 63,525 | | | — | | | — | | | — | | | — | | | — | | | — | | | — | | | — | | | — | | | — | |
| 2007 | | | 380,000 | | | 25,000 | | | 69,446 | | | — | | | — | | | — | | | — | | | — | | | — | | | — | | | — | | | — | | | — | |
| | | | | | | | | | | | | | | | | | | | | | | | | | | | | | | | | | | | | | | | | |
| Dividend Advantage (NAD) | | | | | | | | | | | | | | | | | | | | | | | | | | | |
| Year Ended 10/31: | | | | | | | | | | | | | | | | | | | | | | | | | | | | | | |
| 2011 | | | — | | | — | | | — | | | 144,300 | | | 10.00 | | | 31.36 | | | 120,400 | | | 100,000 | | | 313,587 | | | — | | | — | | | — | | | 3.14 | |
| 2010 | | | 120,075 | | | 25,000 | | | 79,553 | | | 144,300 | | | 10.00 | | | 31.82 | | | — | | | — | | | — | | | — | | | — | | | — | | | 3.18 | |
| 2009 | | | 261,800 | | | 25,000 | | | 77,095 | | | — | | | — | | | — | | | — | | | — | | | — | | | — | | | — | | | — | | | — | |
| 2008 | | | 266,800 | | | 25,000 | | | 68,343 | | | — | | | — | | | — | | | — | | | — | | | — | | | — | | | — | | | — | | | — | |
| 2007 | | | 295,000 | | | 25,000 | | | 74,618 | | | — | | | — | | | — | | | — | | | — | | | — | | | — | | | — | | | — | | | — | |
| (f) | The Ending and Average Market Value Per Share for each Series of the Fund’s MTP Shares were as follows: |
| | | | | | Ending | | | Average | |
| | | | | | Market Value | | | Market Value | |
| | | Series | | | Per Share | | | Per Share | |
| Dividend Advantage (NAD) | | | | | | | | | |
| Year Ended 10/31: | | | | | | | | | |
| 2011 | | 2015 | | | $ | 10.06 | | | $ | 10.05 | |
| 2010 | | 2015 | | | | 10.10 | | | | 10.10^ | |
| 2009 | | | — | | | | — | | | | — | |
| 2008 | | | — | | | | — | | | | — | |
| 2007 | | | — | | | | — | | | | — | |
| ^ | For the period March 16, 2010 (issuance date of shares) through October 31, 2010. |
| See accompanying notes to financial statements. |
| | | Financial |
| | | Highlights (continued) |
| | | | | | | | | | | | | | | | | | | | | | | | | | | | | | | | | | | | | | | | | |
| | | ARPS at the End of Period | | MTP Shares at the End of Period (f) | | VMTP Shares at the End of Period | | VRDP Shares at the End of Period | | MTP and/or VMTP Shares at the End of Period | |
| | | Aggregate Amount Outstanding (000) | | Liquidation Value Per Share | | Asset Coverage Per Share | | Aggregate Amount Outstanding (000) | | Liquidation Value Per Share | | Asset Coverage Per Share | | Aggregate Amount Outstanding (000) | | Liquidation Value Per Share | | Asset Coverage Per Share | | Aggregate Amount Outstanding (000) | | Liquidation Value Per Share | | Asset Coverage Per Share | | Asset Coverage Per $1 Liquidation Preference | |
| Dividend Advantage 2 (NXZ) | | | | | | | | | | | | | | | | | | | | | | | | | | | | | |
| Year Ended 10/31: | | | | | | | | | | | | | | | | | | | | | | | | | | | | | | | | | |
| 2011 | | $ | — | | $ | — | | $ | — | | $ | — | | $ | — | | $ | — | | $ | — | | $ | — | | $ | — | | $ | 196,000 | | $ | 100,000 | | $ | 317,900 | | $ | — | |
| 2010 | | | — | | | — | | | — | | | — | | | — | | | — | | | — | | | — | | | — | | | 196,000 | | | 100,000 | | | 321,819 | | | — | |
| 2009 | | | — | | | — | | | — | | | — | | | — | | | — | | | — | | | — | | | — | | | 196,000 | | | 100,000 | | | 316,966 | | | — | |
| 2008 | | | — | | | — | | | — | | | — | | | — | | | — | | | — | | | — | | | — | | | 196,000 | | | 100,000 | | | 290,785 | | | — | |
| 2007 | | | 222,000 | | | 25,000 | | | 76,463 | | | — | | | — | | | — | | | — | | | — | | | — | | | — | | | — | | | — | | | — | |
| | | | | | | | | | | | | | | | | | | | | | | | | | | | | | | | | | | | | | | | | |
| Dividend Advantage 3 (NZF) | | | | | | | | | | | | | | | | | | | | | | | | | | | |
| Year Ended 10/31: | | | | | | | | | | | | | | | | | | | | | | | | | | | | | | |
| 2011 | | | — | | | — | | | — | | | 70,000 | | | 10.00 | | | 34.54 | | | 169,200 | | | 100,000 | | | 345,421 | | | — | | | — | | | — | | | 3.45 | |
| 2010 | | | 236,950 | | | 25,000 | | | 87,821 | | | — | | | — | | | — | | | — | | | — | | | — | | | — | | | — | | | — | | | — | |
| 2009 | | | 236,950 | | | 25,000 | | | 85,465 | | | — | | | — | | | — | | | — | | | — | | | — | | | — | | | — | | | — | | | — | |
| 2008 | | | 270,775 | | | 25,000 | | | 70,108 | | | — | | | — | | | — | | | — | | | — | | | — | | | — | | | — | | | — | | | — | |
| 2007 | | | 312,000 | | | 25,000 | | | 73,630 | | | — | | | — | | | — | | | — | | | — | | | — | | | — | | | — | | | — | | | — | |
| (f) | The Ending and Average Market Value Per Share for each Series of the Fund’s MTP Shares were as follows: |
| | | Series | | Ending Market Value Per Share | | Average Market Value Per Share | |
| Dividend Advantage 3 (NZF) | | | | | | | | | | |
| Year Ended 10/31: | | | | | | | | | | |
| 2011 | | | 2016 | | $ | 10.14 | | $ | 10.05 | ^ |
| 2010 | | | — | | | — | | | — | |
| 2009 | | | — | | | — | | | — | |
| 2008 | | | — | | | — | | | — | |
| 2007 | | | — | | | — | | | — | |
| ^ | For the period December 20, 2010 (issuance date of shares) through October 31, 2011. |
| See accompanying notes to financial statements. |
| | | Notes to |
| | | Financial Statements |
1. General Information and Significant Accounting Policies
General Information
The funds covered in this report and their corresponding Common share stock exchange symbols are Nuveen Performance Plus Municipal Fund, Inc. (NPP), Nuveen Municipal Advantage Fund, Inc. (NMA), Nuveen Municipal Market Opportunity Fund, Inc. (NMO), Nuveen Dividend Advantage Municipal Fund (NAD), Nuveen Dividend Advantage Municipal Fund 2 (NXZ) and Nuveen Dividend Advantage Municipal Fund 3 (NZF) (each a “Fund” and each a “Fund” and collectively, the “Funds”). Performance Plus (NPP), Municipal Advantage (NMA), Market Opportunity (NMO) and Dividend Advantage (NAD) are traded on the New York Stock Exchange (“NYSE”) while Dividend Advantage 2 (NXZ) and Dividend Advantage 3 (NZF) are traded on the NYSE Amex. The Funds are registered under the Investment Company Act of 1940, as amended, as closed-end, management investment companies.
Effective January 1, 2011, the Funds’ adviser, Nuveen Asset Management, a wholly-owned subsidiary of Nuveen Investments, Inc. (“Nuveen”), changed its name to Nuveen Fund Advisors, Inc. (the “Adviser”). Concurrently, the Adviser formed a wholly-owned subsidiary, Nuveen Asset Management, LLC (the “Sub-Adviser”), to house its portfolio management capabilities and to serve as the Funds’ sub-adviser, and the Funds’ portfolio managers became employees of the Sub-Adviser. This allocation of responsibilities between the Adviser and the Sub-Adviser affects each of the Funds. The Adviser will compensate the Sub-Adviser for the portfolio management services it provides to the Funds from each Fund’s management fee.
Each Fund seeks to provide current income exempt from regular federal income tax by investing primarily in a portfolio of municipal obligations issued by state and local government authorities or certain U.S. territories.
Significant Accounting Policies
The following is a summary of significant accounting policies followed by the Funds in the preparation of their financial statements in accordance with U.S. generally accepted accounting principles (“U.S. GAAP”).
Investment Valuation
Prices of municipal bonds are provided by a pricing service approved by the Funds’ Board of Directors/Trustees. These securities are generally classified as Level 2 for fair value measurement purposes. When price quotes are not readily available (which is usually the case for municipal bonds) the pricing service establishes a security’s fair value using methods that may include consideration of the following: yields or prices of investments of comparable quality, type of issue, coupon, maturity and rating, market quotes or indications of value from security dealers, evaluations of anticipated cash flows or collateral, general market conditions and other information and analysis, including the obligor’s credit characteristics considered relevant. In pricing certain securities, particularly less liquid and lower quality securities, the pricing service may consider information about a security, its issuer, or market activity, provided by the Adviser. These securities are generally classified as Level 2 or Level 3 depending on the priority of the significant inputs. Investments in investment companies are valued at their respective net asset values on the valuation date. These investment vehicles are generally classified as Level 1.
Certain securities may not be able to be priced by the pre-established pricing methods as described above. Such securities may be valued by the Funds’ Board of Directors/Trustees or its designee at fair value. These securities generally include, but are not limited to, restricted securities (securities which may not be publicly sold without registration under the Securities Act of 1933, as amended) for which a pricing service is unable to provide a market price; securities whose trading has been formally suspended; debt securities that have gone into default and for which there is no current market quotation; a security whose market price is not available from a pre-established pricing source; a security with respect to which an event has occurred that is likely to materially affect the value of the security after the market has closed but before the calculation of a Fund’s net asset value (as may be the case in non-U.S. markets on which the security is primarily traded) or make it difficult or impossible to obtain a reliable market quotation; and a security whose price, as provided by the pricing service, is not deemed to reflect the security’s fair value. As a general principle, the fair value of a security would appear to be the amount that the owner might reasonably expect to receive for it in a current sale. A variety of factors may be considered in determining the fair value of these securities, which may include consideration of the following: yields or prices of investments of comparable quality, type of issue, coupon, maturity and rating, market quotes or indications of value from security dealers, evaluations of anticipated cash flows or collateral, general market conditions and other information and analysis, including the obligor’s credit characteristics considered relevant.
| | | Notes to |
| | | Financial Statements (continued) |
These securities are generally classified as Level 2 or Level 3 depending on the priority of the significant inputs. Regardless of the method employed to value a particular security, all valuations are subject to review by the Funds’ Board of Directors/Trustees or its designee.
Refer to Footnote 2 – Fair Value Measurements for further details on the leveling of securities held by the Funds as of the end of the reporting period.
Investment Transactions
Investment transactions are recorded on a trade date basis. Realized gains and losses from transactions are determined on the specific identification method, which is the same basis used for federal income tax purposes. Investments purchased on a when-issued/delayed delivery basis may have extended settlement periods. Any investments so purchased are subject to market fluctuation during this period. The Funds have instructed the custodian to segregate assets with a current value at least equal to the amount of the when-issued/delayed delivery purchase commitments. At October 31, 2011, Performance Plus (NPP), Municipal Advantage (NMA), Market Opportunity (NMO), and Dividend Advantage 3 (NZF) had outstanding when-issued/delayed delivery commitments of $1,427,635, $2,557,027, $1,427,635, and $11,959,084, respectively. There were no such outstanding purchase commitments in either of the other Funds.
Investment Income
Dividend income is recorded on the ex-dividend date. Investment income, which reflects the amortization of premiums and includes accretion of discounts for financial reporting purposes, is recorded on an accrual basis. Investment income also reflects paydown gains and losses, if any.
Professional Fees
Professional fees presented on the Statement of Operations consist of legal fees incurred in the normal course of operations, audit fees, tax consulting fees and, in some cases, workout expenditures. Workout expenditures are incurred in an attempt to protect or enhance an investment, or to pursue other claims or legal actions on behalf of Fund shareholders.
Income Taxes
Each Fund is a separate taxpayer for federal income tax purposes. Each Fund intends to distribute substantially all of its net investment income and net capital gains to shareholders and to otherwise comply with the requirements of Subchapter M of the Internal Revenue Code applicable to regulated investment companies. Therefore, no federal income tax provision is required. Furthermore, each Fund intends to satisfy conditions that will enable interest from municipal securities, which is exempt from regular federal income tax, to retain such tax-exempt status when distributed to shareholders of the Funds. Net realized capital gains and ordinary income distributions paid by the Funds are subject to federal taxation.
For all open tax years and all major taxing jurisdictions, management of the Funds has concluded that there are no significant uncertain tax positions that would require recognition in the financial statements. Open tax years are those that are open for examination by taxing authorities (i.e., generally the last four tax year ends and the interim tax period since then). Furthermore, management of the Funds is also not aware of any tax positions for which it is reasonably possible that the total amounts of unrecognized tax benefits will significantly change in the next twelve months.
Dividends and Distributions to Common Shareholders
Dividends from net investment income are declared monthly. Net realized capital gains and/or market discount from investment transactions, if any, are distributed to shareholders at least annually. Furthermore, capital gains are distributed only to the extent they exceed available capital loss carryforwards. Distributions to Common shareholders of net investment income, net realized capital gains and/or market discount, if any, are recorded on the ex-dividend date. The amount and timing of distributions are determined in accordance with federal income tax regulations, which may differ from U.S. GAAP.
Auction Rate Preferred Shares
Each Fund is authorized to issue Auction Rate Preferred Shares (“ARPS”). As of October 31, 2010, Municipal Advantage (NMA) and Market Opportunity (NMO) redeemed all of their outstanding ARPS at liquidation value. As of October 31, 2008, Dividend Advantage 2 (NXZ) redeemed all of its outstanding ARPS at liquidation value. During the fiscal year ended October 31, 2011, Performance Plus (NPP), Dividend Advantage (NAD) and Dividend Advantage 3 (NZF) had issued and outstanding ARPS, $25,0000 stated value per share, which approximates market value, as a means of effecting financial leverage. Each Fund’s ARPS were issued in one or more Series. The dividend rate paid by the Funds on each Series was determined every seven days, pursuant to a dutch auction process overseen by the auction agent, and was payable at the end of each rate period.
Beginning in February 2008, more shares for sale were submitted in the regularly scheduled auctions for the ARPS issued by the Funds than there were offers to buy. This meant that these auctions “failed to clear,’’ and that many Auction Rate Preferred shareholders who wanted to sell their shares in these auctions were unable to do so. Auction Rate Preferred shareholders unable to sell their shares received distributions at the “maximum rate’’
applicable to failed auctions as calculated in accordance with the pre-established terms of the ARPS. As of October 31, 2011, each Fund redeemed all of their outstanding ARPS, at liquidation value, as follows:
| | | | Performance | | | Municipal | | | Market | | | Dividend | | | Dividend | | | Dividend | |
| | | | Plus | | | Advantage | | | Opportunity | | | Advantage | | | Advantage 2 | | | Advantage 3 | |
| | | | (NPP | ) | | (NMA | ) | | (NMO | ) | | (NAD | ) | | (NXZ | ) | | (NZF | ) |
| ARPS redeemed, at liquidation value | | $ | 479,000,000 | | $ | 358,000,000 | | $ | 380,000,000 | | $ | 295,000,000 | | $ | 222,000,000 | | $ | 312,000,000 | |
During the fiscal year ended October 31, 2010, lawsuits pursuing claims made in a demand letter alleging that Dividend Advantage (NAD), Dividend Advantage 2 (NXZ) and Dividend Advantage 3’s (NZF) Board of Trustees breached their fiduciary duties related to the redemption at par of their ARPS had been filed on behalf of shareholders of the Funds, against the Adviser, the Nuveen holding company, the majority owner of the holding company, the lone interested trustee, and current and former officers of the Funds. Nuveen and the other named defendants filed a motion to dismiss the lawsuits and on December 16, 2011, the court granted that motion dismissing the lawsuits with prejudice.
During the current reporting period, Nuveen Investments, LLC, known as Nuveen Securities, LLC, effective April 30, 2011, (“Nuveen Securities”) entered into a settlement with the Financial Industry Regulatory Authority (“FINRA”) with respect to certain allegations regarding Nuveen-sponsored closed-end fund ARPS marketing brochures. As part of this settlement, Nuveen Securities neither admitted to nor denied FINRA’s allegations. Nuveen Securities is the broker-dealer subsidiary of Nuveen.
The settlement with FINRA concludes an investigation that followed the widespread failure of auctions for ARPS and other auction rate securities, which generally began in mid-February 2008. In the settlement, FINRA alleged that certain marketing materials provided by Nuveen Securities were false and misleading. Nuveen Securities agreed to a censure and the payment of a $3 million fine.
MuniFund Term Preferred Shares
The following Funds have issued and outstanding MuniFund Term Preferred (“MTP”) Shares, with a $10 stated (“par”) value per share. Proceeds from the issuance of MTP Shares, net of offering expenses, were used to redeem all, or a portion of, each Fund’s outstanding ARPS. Each Fund’s MTP Shares are issued in one Series. Dividends on MTP shares, which are recognized as interest expense for financial reporting purposes, are paid monthly at a fixed annual rate, subject to adjustments in certain circumstances. The MTP Shares trade on the NYSE. As of October 31, 2011, the number of MTP Shares outstanding, annual interest rate and the NYSE “ticker” symbol for each Fund are as follows:
| | | Dividend Advantage (NAD) | | Dividend Advantage 3 (NZF) | |
| | | | | Annual | | | | | | Annual | | | |
| | | Shares | | Interest | | NYSE | | Shares | | Interest | | NYSE | |
| | | Outstanding | | Rate | | Ticker | | Outstanding | | Rate | | Ticker | |
| Series: | | | | | | | | | | | | | | | | | | | |
| 2015 | | | 14,430,000 | | | 2.70 | % | | NAD Pr C | | | — | | | — | | | — | |
| 2016 | | | — | | | — | | | — | | | 7,000,000 | | | 2.80 | % | | NZF Pr C | |
Each Fund is obligated to redeem its MTP Shares by the date as specified in its offering document (“Term Redemption Date”), unless earlier redeemed or repurchased by the Fund. MTP Shares are subject to optional and mandatory redemption in certain circumstances. MTP Shares will be subject to redemption at the option of each Fund (“Optional Redemption Date”), subject to a payment of premium for one year following the Optional Redemption Date (“Premium Expiration Date”), and at par thereafter. MTP Shares will also be subject to redemption, at the option of each Fund, at par in the event of certain changes in the credit rating of the MTP Shares. Each Fund may be obligated to redeem certain of the MTP Shares if the Fund fails to maintain certain asset coverage and leverage ratio requirements and such failures are not cured by the applicable cure date. The redemption price per share is equal to the sum of the liquidation value per share plus any accumulated but unpaid dividends. The Term Redemption Date, Optional Redemption Date and Premium Expiration Date for each Fund’s MTP Shares are as follows:
| | | | Dividend | | | Dividend | |
| | | | Advantage | | | Advantage 3 | |
| | | | (NAD | ) | | (NZF | ) |
| | | | Series 2015 | | | Series 2016 | |
| Term Redemption Date | | | April 1, 2015 | | | January 1, 2016 | |
| Optional Redemption Date | | | April 1, 2011 | | | January 1, 2012 | |
| Premium Expiration Date | | | March 31, 2012 | | | December 31, 2012 | |
The average liquidation value of MTP Shares outstanding for each Fund during the fiscal year ended October 31, 2011, was as follows:
| | | | | | | | |
| | | | Dividend | | | Dividend | |
| | | | Advantage | | | Advantage 3 | |
| | | | (NAD | ) | | (NZF | )* |
| Average liquidation value of MTP Shares outstanding | | $ | 144,300,000 | | $ | 69,873,059 | |
| * | For the period December 20, 2010 (issuance date of shares) through October 31, 2011. |
| | | Notes to |
| | | Financial Statements (continued) |
For financial reporting purposes only, the liquidation value of MTP Shares is recorded as a liability on the Statement of Assets and Liabilities. Unpaid dividends on MTP Shares are recognized as a component of “Interest payable” on the Statement of Assets and Liabilities. Dividends paid on MTP Shares are recognized as a component of “Interest expense and amortization of offering costs” on the Statement of Operations.
Net amounts earned by Nuveen as the underwriter of each Fund’s MTP Share offering was recorded as a reduction of offering costs recognized by the Funds. For the fiscal year ended October 31, 2011, the amounts earned by Nuveen were as follows:
| | | | | | | | |
| | | | Dividend | | | Dividend | |
| | | | Advantage | | | Advantage 3 | |
| | | | (NAD | ) | | (NZF | )* |
| Net amounts earned by Nuveen | | $ | — | | $ | 6,328 | |
| * | For the period December 20, 2010 (issuance date of shares) through October 31, 2011. |
Variable Rate MuniFund Term Preferred Shares
The following funds have issued and outstanding Variable Rate MuniFund Term Preferred (“VMTP”) Shares, with $100,000 liquidation value per share. Performance Plus (NPP), Dividend Advantage (NAD) and Dividend Advantage 3 (NZF) issued their VMTP Shares in a privately negotiated offering in February 2011, July 2011 and September 2011, respectively. Proceeds from the issuance of VMTP Shares, net of offering expenses, were used to redeem each Fund’s outstanding ARPS. The Fund’s VMTP Shares were offered to qualified institutional buyers pursuant to Rule 144A under the Securities Act of 1933. As of October 31, 2011, the number of VMTP Shares outstanding at liquidation value for each Fund are as follows:
| | | | | | | | | | | |
| | | | Performance | | | Dividend | | | Dividend | |
| | | | Plus | | | Advantage | | | Advantage 3 | |
| | | | (NPP | ) | | (NAD | ) | | (NZF | ) |
| Series 2014 | | $ | 421,700,000 | | $ | 120,400,000 | | $ | 169,200,000 | |
Each Fund is obligated to redeem its VMTP Shares by the date as specified in its offering document (“Term Redemption Date”), unless earlier redeemed or repurchased by the Fund. VMTP Shares are subject to optional and mandatory redemption in certain circumstances . The VMTP Shares are subject to redemption at the option of each Fund (“Optional Redemption Date”), subject to payment of premium for one year following the Optional Redemption Date (“Premium Expiration Date”), and at par thereafter. Each Fund may be obligated to redeem certain of the VMTP Shares if the Fund fails to maintain certain asset coverage and leverage ratio requirements and such failures are not cured by the applicable cure date. The redemption price per share is equal to the sum of the liquidation value per share plus any accumulated but unpaid dividends. The Term Redemption Date, Optional Redemption Date and Premium Expiration Date for each Fund’s VMTP Shares as follows:
| | | | Performance | | | Dividend | | | Dividend | |
| | | | Plus | | | Advantage | | | Advantage 3 | |
| | | | (NPP | ) | | (NAD | ) | | (NZF | ) |
| Term Redemption Date | | | March 1, 2014 | | | August 1, 2014 | | | October 1, 2014 | |
| Optional Redemption Date | | | March 1, 2012 | | | August 1, 2012 | | | October 1, 2012 | |
| Premium Expiration Date | | | February 29, 2012 | | | July 31, 2012 | | | September 30, 2012 | |
The average liquidation value of VMTP Shares outstanding and average annualized dividend rate of VMTP Shares for each Fund during the fiscal year ended October 31, 2011, were as follows:
| | | | | | | | | | | |
| | | | Performance | | | Dividend | | | Dividend | |
| | | | Plus | | | Advantage | | | Advantage 3 | |
| | | | (NPP | )* | | (NAD | )** | | (NZF | )*** |
| Average liquidation Value of VMTP Shares outstanding | | $ | 421,700,000 | | $ | 120,400,000 | | $ | 169,200,000 | |
| Average annualized dividend rate | | | 1.43 | % | | 1.21 | % | | 1.15 | % |
| * | For the period February 24, 2011 (issuance date of shares) through October 31, 2011. |
| ** | For the period July 28, 2011 (issuance date of shares) through October 31, 2011. |
| *** | For the period September 8, 2011 (issuance date of shares) through October 31, 2011. |
Dividends on the VMTP Shares (which are treated as interest payments for financial reporting purposes) are set weekly. For financial reporting purposes only, the liquidation value of VMTP Shares is recorded as a liability on the Statement of Assets and Liabilities. Unpaid dividends on VMTP Shares are recognized as a component of “Interest payable” on the Statement of Assets and Liabilities. Dividends paid on VMTP Shares are recognized as a component of “Interest expense and amortization of offering costs” on the Statement of Operations.
Variable Rate Demand Preferred Shares
The following funds have issued and outstanding Variable Rate Demand Preferred (“VRDP”) Shares, with a $100,000 liquidation value per share. Municipal Advantage (NMA), Market Opportunity (NMO) and Dividend Advantage 2 (NXZ) issued their VRDP Shares in a privately negotiated offering
during March 2010, March 2010 and August 2008, respectively. Concurrent with renewing agreements with the liquidity provider for its VRDP Shares in June 2010, Dividend Advantage 2 (NXZ) exchanged all of its 1,960 Series 1 VRDP Shares for 1,960 Series 2 VRDP Shares. The principal difference in terms between Series 1 and Series 2 VRDP Shares in Dividend Advantage 2 (NXZ) is the requirement that the Fund redeem VRDP Shares owned by the liquidity provider if the VRDP Shares have been owned by the liquidity provider through six months of continuous, unsuccessful remarketing. Proceeds of each Fund’s offering were used to redeem all, or a portion of, each Fund’s outstanding ARPS. The VRDP Shares were offered to qualified institutional buyers pursuant to Rule 144A under the Securities Act of 1933. As of October 31, 2011, the number of VRDP Shares outstanding and maturity date for each Fund are as follows:
| | | | Municipal | | | Market | | | Dividend | |
| | | | Advantage | | | Opportunity | | | Advantage 2 | |
| | | | (NMA | ) | | (NMO | ) | | (NXZ | ) |
| Series | | | 1 | | | 1 | | | 2 | |
| Shares outstanding | | | 2,968 | | | 3,509 | | | 1,960 | |
| Maturity | | | March 1, 2040 | | | March 1, 2040 | | | August 1, 2040 | |
VRDP Shares include a liquidity feature that allows VRDP shareholders to have their shares purchased by a liquidity provider with whom each Fund has contracted in the event that purchase orders for VRDP Shares in a remarketing are not sufficient in number to be matched with the sale orders in that remarketing. Each Fund is required to redeem any VRDP Shares that are still owned by the liquidity provider after six months of continuous, unsuccessful remarketing.
Dividends on the VRDP Shares (which are treated as interest payments for financial reporting purposes) are set weekly at a rate established by a remarketing agent; therefore, the market value of the VRDP Shares is expected to approximate its liquidation value. If remarketings for VRDP Shares are continuously unsuccessful for six months, the maximum rate is designed to escalate according to a specified schedule in order to enhance the remarketing agent’s ability to successfully remarket the VRDP Shares.
Subject to certain conditions, VRDP Shares may be redeemed, in whole or in part, at any time at the option of each Fund. Each Fund may also redeem certain of the VRDP Shares if the Fund fails to maintain certain asset coverage requirements and such failures are not cured by the applicable cure date. The redemption price per share is equal to the sum of the liquidation value per share plus any accumulated but unpaid dividends.
The average liquidation value outstanding and annualized dividend rate of VRDP Shares for each Fund during fiscal year ended October 31, 2011, were as follows:
| | | | Municipal | | | Market | | | Dividend | |
| | | | Advantage | | | Opportunity | | | Advantage 2 | |
| | | | (NMA | ) | | (NMO | ) | | (NXZ | ) |
| Average liquidation value outstanding | | $ | 296,800,000 | | $ | 350,900,000 | | $ | 196,000,000 | |
| Annualized dividend rate | | | 0.40 | % | | 0.41 | % | | 0.37 | % |
For financial reporting purposes only, the liquidation value of VRDP Shares is recognized as a liability on the Statement of Assets and Liabilities. Unpaid dividends on VRDP Shares are recognized as a component of “Interest payable” on the Statement of Assets and Liabilities. Dividends paid on the VRDP Shares are recognized as a component of “Interest expense and amortization of offering costs” on the Statement of Operations. In addition to interest expense, each Fund also pays a per annum liquidity fee to the liquidity provider as well as a remarketing fee, which are recognized as components of “Fees on VRDP Shares” on the Statement of Operations.
Inverse Floating Rate Securities
Each Fund is authorized to invest in inverse floating rate securities. An inverse floating rate security is created by depositing a municipal bond, typically with a fixed interest rate, into a special purpose trust created by a broker-dealer. In turn, this trust (a) issues floating rate certificates, in face amounts equal to some fraction of the deposited bond’s par amount or market value, that typically pay short-term tax-exempt interest rates to third parties, and (b) issues to a long-term investor (such as one of the Funds) an inverse floating rate certificate (sometimes referred to as an “inverse floater”) that represents all remaining or residual interest in the trust. The income received by the inverse floater holder varies inversely with the short-term rate paid to the floating rate certificates’ holders, and in most circumstances the inverse floater holder bears substantially all of the underlying bond’s downside investment risk and also benefits disproportionately from any potential appreciation of the underlying bond’s value. The price of an inverse floating rate security will be more volatile than that of the underlying bond because the interest rate is dependent on not only the fixed coupon rate of the underlying bond but also on the short-term interest paid on the floating rate certificates, and because the inverse floating rate security essentially bears the risk of loss of the greater face value of the underlying bond.
A Fund may purchase an inverse floating rate security in a secondary market transaction without first owning the underlying bond (referred to as an “externally-deposited inverse floater”), or instead by first selling a fixed-rate bond to a broker-dealer for deposit into the special purpose trust and receiving in turn the residual interest in the trust (referred to as a “self-deposited inverse floater”). The inverse floater held by a Fund gives the Fund the right (a) to cause the holders of the floating rate certificates to tender their notes at par, and (b) to have the broker transfer the fixed-rate bond held by the trust to the Fund, thereby collapsing the trust. An investment in an externally-deposited inverse floater is identified in the Portfolio of Investments as “(IF) – Inverse floating rate investment.” An investment in a self-deposited inverse floater is accounted for as a financing transaction. In such instances,
| | | Notes to |
| | | Financial Statements (continued) |
a fixed-rate bond deposited into a special purpose trust is identified in the Portfolio of Investments as “(UB) – Underlying bond of an inverse floating rate trust reflected as a financing transaction,” with the Fund accounting for the short-term floating rate certificates issued by the trust as “Floating rate obligations” on the Statement of Assets and Liabilities. In addition, the Fund reflects in “Investment Income” the entire earnings of the underlying bond and recognizes the related interest paid to the holders of the short-term floating rate certificates as a component of “Interest expense and amortization of offering costs” on the Statement of Operations.
During the fiscal year ended October 31, 2011, each Fund invested in externally-deposited inverse floaters and/or self-deposited inverse floaters.
Each Fund may also enter into shortfall and forbearance agreements (sometimes referred to as a “recourse trust” or “credit recovery swap”) (such agreements referred to herein as “Recourse Trusts”) with a broker-dealer by which a Fund agrees to reimburse the broker-dealer, in certain circumstances, for the difference between the liquidation value of the fixed-rate bond held by the trust and the liquidation value of the floating rate certificates issued by the trust plus any shortfalls in interest cash flows. Under these agreements, a Fund’s potential exposure to losses related to or on inverse floaters may increase beyond the value of a Fund’s inverse floater investments as a Fund may potentially be liable to fulfill all amounts owed to holders of the floating rate certificates. At period end, any such shortfall is recognized as “Unrealized depreciation on Recourse Trusts” on the Statement of Assets and Liabilities. At
October 31, 2011, each Fund’s maximum exposure to externally-deposited Recourse Trusts was as follows:
| | | | | | | | | | | | | | | | | | | | |
| | | | Performance | | | Municipal | | | Market | | | Dividend | | | Dividend | | | Dividend | |
| | | | Plus | | | Advantage | | | Opportunity | | | Advantage | | | Advantage 2 | | | Advantage 3 | |
| | | | (NPP | ) | | (NMA | ) | | (NMO | ) | | (NAD | ) | | (NXZ | ) | | (NZF | ) |
| Maximum exposure to Recourse Trusts | | $ | 18,750,000 | | $ | 11,250,000 | | $ | 7,500,000 | | $ | 11,250,000 | | $ | 11,250,000 | | $ | — | |
The average floating rate obligations outstanding and average annual interest rate and fees related to self-deposited inverse floaters during the fiscal year ended October 31, 2011, were as follows:
| | | | | | | | | | | | | | | | | | | | |
| | | | Performance | | | Municipal | | | Market | | | Dividend | | | Dividend | | | Dividend | |
| | | | Plus | | | Advantage | | | Opportunity | | | Advantage | | | Advantage 2 | | | Advantage 3 | |
| | | | (NPP | ) | | (NMA | ) | | (NMO | ) | | (NAD | ) | | (NXZ | ) | | (NZF | ) |
| Average floating rate obligations outstanding | | $ | 41,089,315 | | $ | 57,843,402 | | $ | 43,530,000 | | $ | 51,605,000 | | $ | 26,498,904 | | $ | 62,801,342 | |
| Average annual interest rate and fees | | | 0.69 | % | | 0.58 | % | | 0.56 | % | | 0.49 | % | | 0.65 | % | | 0.66 | % |
Derivative Financial Instruments
Each Fund is authorized to invest in certain derivative instruments, including foreign currency forwards, futures, options and swap contracts. Although each Fund is authorized to invest in such derivative instruments, and may do so in the future, they did not make any such investments during the fiscal year ended October 31, 2011.
Market and Counterparty Credit Risk
In the normal course of business each Fund may invest in financial instruments and enter into financial transactions where risk of potential loss exists due to changes in the market (market risk) or failure of the other party to the transaction to perform (counterparty credit risk). The potential loss could exceed the value of the financial assets recorded on the financial statements. Financial assets, which potentially expose each Fund to counterparty credit risk, consist principally of cash due from counterparties on forward, option and swap transactions, when applicable. The extent of each Fund’s exposure to counterparty credit risk in respect to these financial assets approximates their carrying value as recorded on the Statement of Assets and Liabilities. Futures contracts, when applicable, expose a Fund to minimal counterparty credit risk as they are exchange traded and the exchange’s clearinghouse, which is counterparty to all exchange traded futures, guarantees the futures contracts against default.
Each Fund helps manage counterparty credit risk by entering into agreements only with counterparties the Adviser believes have the financial resources to honor their obligations and by having the Adviser monitor the financial stability of the counterparties. Additionally, counterparties may be required to pledge collateral daily (based on the daily valuation of the financial asset) on behalf of each Fund with a value approximately equal to the amount of any unrealized gain above a pre-determined threshold. Reciprocally, when each Fund has an unrealized loss, the Funds have instructed the custodian to pledge assets of the Funds as collateral with a value approximately equal to the amount of the unrealized loss above a pre-determined threshold. Collateral pledges are monitored and subsequently adjusted if and when the valuations fluctuate, either up or down, by at least the predetermined threshold amount.
Zero Coupon Securities
Each Fund is authorized to invest in zero coupon securities. A zero coupon security does not pay a regular interest coupon to its holders during the life of the security. Tax-exempt income to the holder of the security comes from accretion of the difference between the original purchase price of the security at issuance and the par value of the security at maturity and is effectively paid at maturity. The market prices of zero coupon securities generally are more volatile than the market prices of securities that pay interest periodically.
Offering Costs
Costs incurred by Dividend Advantage (NAD) and Dividend Advantage 3 (NZF) in connection with their offerings of MTP Shares ($2,559,500 and $1,435,000, respectively), were recorded as deferred charges, which are being amortized over the life of the shares. Costs incurred by Performance Plus (NPP), Dividend Advantage (NAD) and Dividend Advantage 3 (NZF) in connection with their offerings of VMTP Shares ($1,780,000, $260,000 and $770,000, respectively), were recorded as deferred charges, which are being amortized over the life of the shares. Costs incurred by Municipal Advantage (NMA), Market Opportunity (NMO) and Dividend Advantage 2 (NXZ) in connection with their offerings of VRDP Shares ($2,134,000, $4,214,000 and $2,270,000, respectively), were recorded as deferred charges, which are being amortized over the life of the shares. Each Fund’s amortized deferred charges are recognized as a component of “Interest expense and amortization of offering costs” on the Statement of Operations.
Custodian Fee Credit
Each Fund has an arrangement with the custodian bank whereby certain custodian fees and expenses are reduced by net credits earned on each Fund’s cash on deposit with the bank. Such deposit arrangements are an alternative to overnight investments. Credits for cash balances may be offset by charges for any days on which a Fund overdraws its account at the custodian bank.
Indemnifications
Under the Funds’ organizational documents, their officers and directors/trustees are indemnified against certain liabilities arising out of the performance of their duties to the Funds. In addition, in the normal course of business, the Funds enter into contracts that provide general indemnifications to other parties. The Funds’ maximum exposure under these arrangements is unknown as this would involve future claims that may be made against the Funds that have not yet occurred. However, the Funds have not had prior claims or losses pursuant to these contracts and expect the risk of loss to be remote.
Use of Estimates
The preparation of financial statements in conformity with U.S. GAAP requires management to make estimates and assumptions that affect the reported amounts of assets and liabilities at the date of the financial statements and the reported amounts of increases and decreases in net assets applicable to Common shares from operations during the reporting period. Actual results may differ from those estimates.
2. Fair Value Measurements
Fair value is defined as the price that the Funds would receive upon selling an investment or transferring a liability in an orderly transaction to an independent buyer in the principal or most advantageous market for the investment. A three-tier hierarchy is used to maximize the use of observable market data and minimize the use of unobservable inputs and to establish classification of fair value measurements for disclosure purposes. Observable inputs reflect the assumptions market participants would use in pricing the asset or liability. Observable inputs are based on market data obtained from sources independent of the reporting entity. Unobservable inputs reflect the reporting entity’s own assumptions about the assumptions market participants would use in pricing the asset or liability. Unobservable inputs are based on the best information available in the circumstances. The three-tier hierarchy of inputs is summarized in the three broad levels listed below:
| Level 1 – | Quoted prices in active markets for identical securities. |
| Level 2 – | Other significant observable inputs (including quoted prices for similar securities, interest rates, prepayment speeds, credit risk, etc.). |
| Level 3 – | Significant unobservable inputs (including management’s assumptions in determining the fair value of investments). |
The inputs or methodologies used for valuing securities are not an indication of the risk associated with investing in those securities. The following is a summary of each Fund’s fair value measurements as of October 31, 2011:
| | | | | | | | | | | | | | |
| Performance Plus (NPP) | | | Level 1 | | | Level 2 | | | Level 3 | | | Total | |
| Investments: | | | | | | | | | | | | | |
| Municipal Bonds | | $ | — | | $ | 1,321,271,982 | | $ | — | | $ | 1,321,271,982 | |
| | | | | | | | | | | | | | |
| Municipal Advantage (NMA) | | | Level 1 | | | Level 2 | | | Level 3 | | | Total | |
| Investments: | | | | | | | | | | | | | |
| Municipal Bonds | | $ | — | | $ | 936,052,529 | | $ | 111,150 | | $ | 936,163,679 | |
| | | | | | | | | | | | | | |
| Market Opportunity (NMO) | | | Level 1 | | | Level 2 | | | Level 3 | | | Total | |
| Investments: | | | | | | | | | | | | | |
| Municipal Bonds | | $ | — | | $ | 985,313,481 | | $ | — | | $ | 985,313,481 | |
| | | Notes to |
| | | Financial Statements (continued) |
| Dividend Advantage (NAD) | | | Level 1 | | | Level 2 | | | Level 3 | | | Total | |
| Investments: | | | | | | | | | | | | | |
| Municipal Bonds | | $ | — | | $ | 860,539,202 | | $ | 111,150 | | $ | 860,650,352 | |
| Investment Companies | | | 559,780 | | | — | | | — | | | 559,780 | |
| Total | | $ | 559,780 | | $ | 860,539,202 | | $ | 111,150 | | $ | 861,210,132 | |
| | | | | | | | | | | | | | |
| Dividend Advantage 2 (NXZ) | | | Level 1 | | | Level 2 | | | Level 3 | | | Total | |
| Investments: | | | | | | | | | | | | | |
| Municipal Bonds | | $ | — | | $ | 601,940,274 | | $ | — | | $ | 601,940,274 | |
| | | | | | | | | | | | | | |
| Dividend Advantage 3 (NZF) | | | Level 1 | | | Level 2 | | | Level 3 | | | Total | |
| Investments: | | | | | | | | | | | | | |
| Municipal Bonds | | $ | — | | $ | 812,066,316 | | $ | 266,760 | | $ | 812,333,076 | |
| Investment Companies | | | 3,494,628 | | | — | | | — | | | 3,494,628 | |
| Short-Term Investments | | | — | | | 25,200,000 | | | — | | | 25,200,000 | |
| Total | | $ | 3,494,628 | | $ | 837,266,316 | | $ | 266,760 | | $ | 841,027,704 | |
The following is a reconciliation of the Funds’ Level 3 investments held at the beginning and end of the measurement period:
| | | | | | | | | | | | | | |
| | | | Municipal | | | Dividend | | | Dividend | | | Dividend | |
| | | | Advantage | | | Advantage | | | Advantage 2 | | | Advantage 3 | |
| | | | (NMA | ) | | (NAD | ) | | (NXZ | ) | | (NZF | ) |
| | | | Level 3 | | | Level 3 | | | Level 3 | | | Level 3 | |
| | | | Municipal Bonds | | | Municipal Bonds | | | Municipal Bonds | | | Municipal Bonds | |
| Balance at the beginning of year | | $ | 462,475 | | $ | 78,062 | | $ | 2,333,250 | | $ | 187,349 | |
| Gains (losses): | | | | | | | | | | | | | |
| Net realized gains (losses) | | | 6,799 | | | 6,799 | | | — | | | (17,141 | ) |
| Net change in unrealized appreciation (depreciation) | | | (106,276 | ) | | 26,289 | | | (804,671 | ) | | 96,552 | |
| Purchases at cost | | | — | | | — | | | — | | | — | |
| Sales at proceeds | | | (79,510 | ) | | — | | | (482,600 | ) | | — | |
| Net discounts (premiums) | | | — | | | — | | | 49 | | | — | |
| Transfers in to | | | — | | | — | | | — | | | — | |
| Transfers out of | | | (172,338 | ) | | — | | | (1,046,028 | ) | | — | |
| Balance at the end of year | | $ | 111,150 | | $ | 111,150 | | $ | — | | $ | 266,760 | |
| Change in net unrealized appreciation (depreciation) during the year of Level 3 securities held as of October 31, 2011 | | $ | 26,289 | | $ | 26,289 | | $ | — | | $ | 96,552 | |
During the fiscal year ended October 31, 2011, the Funds recognized no significant transfers to or from Level 1 or Level 2. Transfers in and/or out of Level 3 are shown using end of period values.
3. Derivative Instruments and Hedging Activities
The Funds record derivative instruments at fair value, with changes in fair value recognized on the Statement of Operations, when applicable. Even though the Funds’ investments in derivatives may represent economic hedges, they are not considered to be hedge transactions for financial reporting purposes. The Funds did not invest in derivative instruments during the fiscal year ended October 31, 2011.
4. Fund Shares
Common Shares
Since the inception of the Funds’ repurchase programs, the Funds have not repurchased any of their outstanding Common shares.
Transactions in Common shares were as follows:
| | | Performance Plus (NPP) | | Municipal Advantage (NMA) | | Market Opportunity (NMO) | |
| | | Year | | Year | | Year | | Year | | Year | | Year | |
| | | Ended | | Ended | | Ended | | Ended | | Ended | | Ended | |
| | | 10/31/11 | | 10/31/10 | | 10/31/11 | | 10/31/10 | | 10/31/11 | | 10/31/10 | |
| Common shares issued to shareholders due to reinvestment of distributions | | | 19,498 | | | 18,891 | | | 153,403 | | | 202,701 | | | 80,513 | | | 170,873 | |
| | | Dividend Advantage (NAD) | | Dividend Advantage 2 (NXZ) | | Dividend Advantage 3 (NZF) | |
| | | Year | | Year | | Year | | Year | | Year | | Year | |
| | | Ended | | Ended | | Ended | | Ended | | Ended | | Ended | |
| | | 10/31/11 | | 10/31/10 | | 10/31/11 | | 10/31/10 | | 10/31/11 | | 10/31/10 | |
| Common shares issued to shareholders due to reinvestment of distributions | | | 4,564 | | | 4,490 | | | 4,192 | | | 21,264 | | | 4,537 | | | 9,310 | |
Preferred Shares
Transactions in ARPS were as follows:
| | | Performance Plus (NPP) | | Municipal Advantage (NMA) | |
| | | Year
Ended
10/31/11 | | Year
Ended
10/31/10 | | Year
Ended
10/31/11 | | Year
Ended
10/31/10 | |
| | | Shares | | Amount | | Shares | | Amount | | Shares | | Amount | | Shares | | Amount | |
| ARPS redeemed: | | | | | | | | | | | | | | | | | | | | | | | | | |
| Series M | | | 3,507 | | $ | 87,675,000 | | | — | | $ | — | | | N/A | | | N/A | | | 2,457 | | $ | 61,425,000 | |
| Series T | | | 3,506 | | | 87,650,000 | | | — | | | — | | | N/A | | | N/A | | | 2,457 | | | 61,425,000 | |
| Series W | | | 3,505 | | | 87,625,000 | | | — | | | — | | | N/A | | | N/A | | | 2,456 | | | 61,400,000 | |
| Series TH | | | 2,770 | | | 69,250,000 | | | — | | | — | | | N/A | | | N/A | | | 1,901 | | | 47,525,000 | |
| Series F | | | 3,508 | | | 87,700,000 | | | — | | | — | | | N/A | | | N/A | | | 2,457 | | | 61,425,000 | |
| Total | | | 16,796 | | $ | 419,900,000 | | | — | | $ | — | | | N/A | | | N/A | | | 11,728 | | $ | 293,200,000 | |
| | | Market Opportunity (NMO) | | Dividend Advantage (NAD) | |
| | | Year
Ended
10/31/11 | | Year
Ended
10/31/10 | | Year
Ended
10/31/11 | | Year
Ended
10/31/10 | |
| | | | Shares | | | Amount | | | Shares | | | Amount | | | Shares | | | Amount | | | Shares | | | Amount | |
| ARPS redeemed: | | | | | | | | | | | | | | | | | | | | | | | | | |
| Series M | | | N/A | | | N/A | | | 3,649 | | $ | 91,225,000 | | | 1,628 | | $ | 40,700,000 | | | 1,922 | | $ | 48,050,000 | |
| Series T | | | N/A | | | N/A | | | 3,648 | | | 91,200,000 | | | 1,628 | | | 40,700,000 | | | 1,921 | | | 48,025,000 | |
| Series W | | | N/A | | | N/A | | | 2,920 | | | 73,000,000 | | | — | | | — | | | — | | | — | |
| Series TH | | | N/A | | | N/A | | | — | | | — | | | 1,547 | | | 38,675,000 | | | 1,826 | | | 45,650,000 | |
| Series F | | | N/A | | | N/A | | | 3,650 | | | 91,250,000 | | | — | | | — | | | — | | | — | |
| Total | | | N/A | | | N/A | | | 13,867 | | $ | 346,675,000 | | | 4,803 | | $ | 120,075,000 | | | 5,669 | | $ | 141,725,000 | |
| | | Dividend Advantage 3 (NZF) | |
| | | Year | | Year | |
| | | Ended | | Ended | |
| | | 10/31/11 | | 10/31/10 | |
| | | | Shares | | | Amount | | | Shares | | | Amount | |
| ARPS redeemed: | | | | | | | | | | | | | |
| Series W | | | 3,159 | | $ | 78,975,000 | | | — | | $ | — | |
| Series TH | | | 3,159 | | | 78,975,000 | | | — | | | — | |
| Series F | | | 3,160 | | | 79,000,000 | | | — | | | — | |
| Total | | | 9,478 | | $ | 236,950,000 | | | — | | $ | — | |
N/A – As of October 31, 2010, the Fund redeemed all of its outstanding ARPS at liquidation value.
| | | Notes to |
| | | Financial Statements (continued) |
Transactions in MTP Shares were as follows:
| | | Dividend Advantage (NAD) | | Dividend Advantage 3 (NZF) | |
| | | Year | | Year | | Year | | Year | |
| | | Ended | | Ended | | Ended | | Ended | |
| | | 10/31/11 | | 10/31/10 | | 10/31/11 | | 10/31/10 | |
| | | Shares | | Amount | | Shares | | Amount | | Shares | | Amount | | Shares | | Amount | |
| MTP Shares issued: | | | | | | | | | | | | | | | | | | | | | | | | | |
| Series 2015 | | | — | | $ | — | | | 14,430,000 | | $ | 144,300,000 | | | — | | $ | — | | | — | | $ | — | |
| Series 2016 | | | — | | | — | | | — | | | — | | | 7,000,000 | | | 70,000,000 | | | — | | | — | |
| Total | | | — | | $ | — | | | 14,430,000 | | $ | 144,300,000 | | | 7,000,000 | | $ | 70,000,000 | | | — | | $ | — | |
Transactions in VMTP Shares were as follows:
| | | Performance Plus (NPP) | |
| | | Year | | Year | |
| | | Ended | | Ended | |
| | | 10/31/11 | | 10/31/10 | |
| | | | Shares | | | Amount | | | Shares | | | Amount | |
| VMTP Shares issued: | | | | | | | | | | | | | |
| Series 2014 | | | 4,217 | | $ | 421,700,000 | | | — | | $ | — | |
| | | Dividend Advantage (NAD) | | Dividend Advantage 3 (NZF) | |
| | | Year | | Year | | Year | | Year | |
| | | Ended | | Ended | | Ended | | Ended | |
| | | 10/31/11 | | 10/31/10 | | 10/31/11 | | 10/31/10 | |
| | | Shares | | Amount | | Shares | | Amount | | Shares | | Amount | | Shares | | Amount | |
| VMTP Shares issued: | | | | | | | | | | | | | | | | | | | | | | | | | |
| Series 2014 | | | 1,204 | | $ | 120,400,000 | | | — | | $ | — | | | 1,692 | | $ | 169,200,000 | | | — | | $ | — | |
Transactions in VRDP Shares were as follows:
| | | Municipal Advantage (NMA) | | Market Opportunity (NMO) | |
| | | Year | | Year | | Year | | Year | |
| | | Ended | | Ended | | Ended | | Ended | |
| | | 10/31/11 | | 10/31/10 | | 10/31/11 | | 10/31/10 | |
| | | | Shares | | | Amount | | | Shares | | | Amount | | | Shares | | | Amount | | | Shares | | | Amount | |
| VRDP Shares issued: | | | | | | | | | | | | | | | | | | | | | | | | | |
| Series 1 | | | — | | $ | — | | | 2,968 | | $ | 296,800,000 | | | — | | $ | — | | | 3,509 | | $ | 350,900,000 | |
During the fiscal year ended October 31, 2010, Dividend Advantage 2 (NXZ) completed a private exchange offer in which all of its 1,960 Series 1 VRDP Shares were exchanged for 1,960 Series 2 VRDP Shares.
5. Investment Transactions
Purchases and sales (including maturities but excluding short-term investments, where applicable) during the fiscal year ended October 31, 2011, were as follows:
| | | | Performance | | | Municipal | | | Market | | | Dividend | | | Dividend | | | Dividend | |
| | | | Plus | | | Advantage | | | Opportunity | | | Advantage | | | Advantage 2 | | | Advantage 3 | |
| | | | (NPP | ) | | (NMA | ) | | (NMO | ) | | (NAD | ) | | (NXZ | ) | | (NZF | ) |
| Purchases | | $ | 125,871,204 | | $ | 134,828,212 | | $ | 153,734,830 | | $ | 128,568,854 | | $ | 243,875,221 | | $ | 250,046,891 | |
| Sales and maturities | | | 160,856,247 | | | 178,925,746 | | | 139,793,839 | | | 132,702,951 | | | 275,555,510 | | | 314,415,649 | |
6. Income Tax Information
The following information is presented on an income tax basis. Differences between amounts for financial statement and federal income tax purposes are primarily due to the timing differences in recognizing taxable market discount, timing differences in recognizing certain gains and losses on investment transactions and the treatment of investments in inverse floating rate securities reflected as financing transactions, if any. To the extent that differences arise that are permanent in nature, such amounts are reclassified within the capital accounts as detailed below. Temporary differences do not require reclassification. Temporary and permanent differences do not impact the net asset values of the Funds.
At October 31, 2011, the cost and unrealized appreciation (depreciation) of investments, as determined on a federal income tax basis, were as follows:
| | | | | | | | | | | | | | | | | | | | |
| | | | Performance | | | Municipal | | | Market | | | Dividend | | | Dividend | | | Dividend | |
| | | | Plus | | | Advantage | | | Opportunity | | | Advantage | | | Advantage 2 | | | Advantage 3 | |
| | | | (NPP | ) | | (NMA | ) | | (NMO | ) | | (NAD | ) | | (NXZ | ) | | (NZF | ) |
| Cost of investments | | $ | 1,241,560,172 | | $ | 885,106,608 | | $ | 955,318,294 | | $ | 805,735,734 | | $ | 585,874,967 | | $ | 783,495,786 | |
| Gross unrealized: | | | | | | | | | | | | | | | | | | | |
| Appreciation | | $ | 79,025,537 | | $ | 41,305,101 | | $ | 38,689,866 | | $ | 46,371,204 | | $ | 29,165,729 | | $ | 30,153,912 | |
| Depreciation | | | (39,328,366 | ) | | (36,761,064 | ) | | (52,225,707 | ) | | (42,501,529 | ) | | (31,367,561 | ) | | (28,175,367 | ) |
| Net unrealized appreciation (depreciation) of investments | | $ | 39,697,171 | | $ | 4,544,037 | | $ | (13,535,841 | ) | $ | 3,869,675 | | $ | (2,201,832 | ) | $ | 1,978,545 | |
Permanent differences, primarily due to federal taxes paid, taxable market discount, non-deductible offering costs, and distribution character reclassifications, resulted in reclassifications among the Funds’ components of Common share net assets at October 31, 2011, the Funds’ tax year end, as follows:
| | | | | | | | | | | | | | | | | | | | |
| | | Performance | | Municipal | | Market | | Dividend | | Dividend | | Dividend | |
| | | Plus | | Advantage | | Opportunity | | Advantage | | Advantage 2 | | Advantage 3 | |
| | | (NPP | ) | (NMA | ) | (NMO | ) | (NAD | ) | (NXZ | ) | (NZF | ) |
| Paid-in surplus | | $ | (401,701 | ) | $ | (158,587 | ) | $ | (116,246 | ) | $ | (508,259 | ) | $ | (72,722 | ) | $ | (276,739 | ) |
| Undistributed (Over-distribution of) net investment income | | | 115,644 | | | 33,150 | | | 84,702 | | | 180,996 | | | 41,005 | | | 242,350 | |
| Accumulated net realized gain (loss) | | | 286,057 | | | 125,437 | | | 31,544 | | | 327,263 | | | 31,717 | | | 34,389 | |
The tax components of undistributed net tax-exempt income, net ordinary income and net long-term capital gains at October 31, 2011, the Funds’ tax year end, were as follows:
| | | | Performance | | | Municipal | | | Market | | | Dividend | | | Dividend | | | Dividend | |
| | | | Plus | | | Advantage | | | Opportunity | | | Advantage | | | Advantage 2 | | | Advantage 3 | |
| | | | (NPP | ) | | (NMA | ) | | (NMO | ) | | (NAD | ) | | (NXZ | ) | | (NZF | ) |
| Undistributed net tax-exempt income * | | $ | 21,299,788 | | $ | 8,659,106 | | $ | 8,179,853 | | $ | 12,307,116 | | $ | 7,437,168 | | $ | 12,793,543 | |
| Undistributed net ordinary income ** | | | 14,771 | | | 1,375,267 | | | 47,871 | | | 273,949 | | | 135,183 | | | 24,938 | |
| Undistributed net long-term capital gains | | | — | | | 6,010,671 | | | — | | | 1,862,934 | | | 5,456,117 | | | 1,651,370 | |
| * | Undistributed net tax-exempt income (on a tax basis has not been reduced for the dividend declared on October 3, 2011, paid on November 1, 2011.) |
| ** | Net ordinary income consists of taxable market discount income and net short-term capital gains, if any. |
The tax character of distributions paid during the Funds’ tax years ended October 31, 2011 and October 31, 2010, was designated for purposes of the dividends paid deduction as follows:
| | | | | | | | | | | | | | | | | | | | |
| | | | Performance | | | Municipal | | | Market | | | Dividend | | | Dividend | | | Dividend | |
| | | | Plus | | | Advantage | | | Opportunity | | | Advantage | | | Advantage 2 | | | Advantage 3 | |
| 2011 | | | (NPP | ) | | (NMA | ) | | (NMO | ) | | (NAD | ) | | (NXZ | ) | | (NZF | ) |
| Distributions from net tax-exempt income *** | | $ | 60,810,670 | | $ | 44,257,385 | | $ | 46,042,502 | | $ | 40,333,683 | | $ | 29,009,098 | | $ | 42,015,540 | |
| Distributions from net ordinary income ** | | | 498,412 | | | 391,525 | | | — | | | — | | | — | | | — | |
| Distributions from net long-term capital gains **** | | | 5,536,530 | | | 3,406,265 | | | — | | | — | | | — | | | 639,625 | |
| | | | | | | | | | | | | | | | | | | | |
| | | | Performance | | | Municipal | | | Market | | | Dividend | | | Dividend | | | Dividend | |
| | | | Plus | | | Advantage | | | Opportunity | | | Advantage | | | Advantage 2 | | | Advantage 3 | |
| 2010 | | | (NPP | ) | | (NMA | ) | | (NMO | ) | | (NAD | ) | | (NXZ | ) | | (NZF | ) |
| Distributions from net tax-exempt income | | $ | 56,430,144 | | $ | 43,084,415 | | $ | 45,084,665 | | $ | 38,498,093 | | $ | 28,872,454 | | $ | 39,033,313 | |
| Distributions from net ordinary income ** | | | 23,738 | | | 63,961 | | | — | | | — | | | 409,165 | | | 830,966 | |
| Distributions from net long-term capital gains | | | 863,865 | | | 3,011,399 | | | — | | | — | | | — | | | 1,901,758 | |
| ** | Net ordinary income consists of taxable market discount income and net short-term capital gains, if any. |
| *** | The Funds hereby designate these amounts paid during the fiscal year ended October 31, 2011, as Exempt Interest Dividends. |
| **** | The Funds designated as a long-term capital gain dividend, pursuant to the Internal Revenue Code Section 852 (b) (3), the amount necessary to reduce earnings and profits of the Funds related to net capital gain to zero for the tax year ended October 31, 2011. |
| | | Notes to |
| | | Financial Statements (continued) |
At October 31, 2011, the Funds’ tax year end, the following Funds had unused capital loss carryforwards available for federal income tax purposes to be applied against future capital gains, if any. If not applied, the carryforwards will expire as follows:
| | | | | | | | |
| | | | Performance | | | Market | |
| | | | Plus | | | Opportunity | |
| | | | (NPP | ) | | (NMO | ) |
| Expiration: | | | | | | | |
| October 31, 2014 | | $ | — | | $ | 1,437,187 | |
| October 31, 2015 | | | — | | | 1,902,879 | |
| October 31, 2016 | | | — | | | 1,398,166 | |
| October 31, 2019 | | | 310,323 | | | 3,031,141 | |
| Total | | $ | 310,323 | | $ | 7,769,373 | |
During Funds’ tax year ended October 31, 2011, the following Funds utilized capital loss carryforwards as follows:
| | | | Dividend | | | Dividend | |
| | | | Advantage | | | Advantage 2 | |
| | | | (NAD | ) | | (NXZ | ) |
| Utilized capital loss carryforwards | | $ | 4,042,731 | | $ | 862,140 | |
7. Management Fees and Other Transactions with Affiliates
Each Fund’s management fee consists of two components — a fund-level fee, based only on the amount of assets within the Fund, and a complex-level fee, based on the aggregate amount of all eligible fund assets managed by the Adviser. This pricing structure enables Fund shareholders to benefit from growth in the assets within their respective Fund as well as from growth in the amount of complex-wide assets managed by the Adviser.
The annual fund-level fee for each Fund, payable monthly, is calculated according to the following schedules:
| | | | Performance Plus (NPP | ) |
| | | | Municipal Advantage (NMA | ) |
| | | | Market Opportunity (NMO | ) |
| Average Daily Managed Assets* | | | Fund-Level Fee Rate | |
| For the first $125 million | | | .4500 | % |
| For the next $125 million | | | .4375 | |
| For the next $250 million | | | .4250 | |
| For the next $500 million | | | .4125 | |
| For the next $1 billion | | | .4000 | |
| For the next $3 billion | | | .3875 | |
| For managed assets over $5 billion | | | .3750 | |
| | | | Dividend Advantage (NAD | ) |
| | | | Dividend Advantage 2 (NXZ | ) |
| | | | Dividend Advantage 3 (NZF | ) |
| Average Daily Managed Assets* | | | Fund-Level Fee Rate | |
| For the first $125 million | | | .4500 | % |
| For the next $125 million | | | .4375 | |
| For the next $250 million | | | .4250 | |
| For the next $500 million | | | .4125 | |
| For the next $1 billion | | | .4000 | |
| For managed assets over $2 billion | | | .3750 | |
The annual complex-level fee for each Fund, payable monthly, is calculated according to the following schedule:
| | | | | |
| Complex-Level Managed Asset Breakpoint Level* | | | Effective Rate at Breakpoint Level |
| $55 billion | | | .2000 | % |
| $56 billion | | | .1996 | |
| $57 billion | | | .1989 | |
| $60 billion | | | .1961 | |
| $63 billion | | | .1931 | |
| $66 billion | | | .1900 | |
| $71 billion | | | .1851 | |
| $76 billion | | | .1806 | |
| $80 billion | | | .1773 | |
| $91 billion | | | .1691 | |
| $125 billion | | | .1599 | |
| $200 billion | | | .1505 | |
| $250 billion | | | .1469 | |
| $300 billion | | | .1445 | |
| * | For the fund-level and complex-level fees, managed assets include closed-end fund assets managed by the Adviser that are attributable to financial leverage. For these purposes, financial leverage includes the funds’ use of preferred stock and borrowings and certain investments in the residual interest certificates (also called inverse floating rate securities) in tender option bond (TOB) trusts, including the portion of assets held by a TOB trust that has been effectively financed by the trust’s issuance of floating rate securities, subject to an agreement by the Adviser as to certain funds to limit the amount of such assets for determining managed assets in certain circumstances. The complex-level fee is calculated based upon the aggregate daily managed assets of all Nuveen Funds that constitute “eligible assets.” Eligible assets do not include assets attributable to investments in other Nuveen Funds or assets in excess of $2 billion added to the Nuveen Fund complex in connection with the Adviser’s assumption of the management of the former First American Funds effective January 1, 2011. As of October 31, 2011, the complex-level fee rate for these Funds was .1759%. |
The management fee compensates the Adviser for overall investment advisory and administrative services and general office facilities. The Adviser has entered into sub-advisory agreements with the Sub-Adviser under which the Sub-Adviser manages the investment portfolios of the Funds. The Sub-Adviser is compensated for its services to the Funds from the management fees paid to the Adviser.
The Funds pay no compensation directly to those of its directors/trustees who are affiliated with the Adviser or to its officers, all of whom receive remuneration for their services to the Funds from the Adviser or its affiliates. The Board of Directors/Trustees has adopted a deferred compensation plan for independent directors/trustees that enables directors/trustees to elect to defer receipt of all or a portion of the annual compensation they are entitled to receive from certain Nuveen-advised funds. Under the plan, deferred amounts are treated as though equal dollar amounts had been invested in shares of select Nuveen-advised funds.
For the first ten years of Dividend Advantage 2’s (NXZ) operations, the Adviser has agreed to reimburse the Fund, as a percentage of average daily managed assets, for fees and expenses in the amounts and for the time periods set forth below:
| | | | | | | | | | | |
| Year Ending | | | | | | Year Ending | | | | |
| March 31, | | | | | | March 31, | | | | |
| 2001* | | | .30 | % | | 2007 | | | .25 | % |
| 2002 | | | .30 | | | 2008 | | | .20 | |
| 2003 | | | .30 | | | 2009 | | | .15 | |
| 2004 | | | .30 | | | 2010 | | | .10 | |
| 2005 | | | .30 | | | 2011 | | | .05 | |
| 2006 | | | .30 | | | | | | | |
| * | From the commencement of operations. |
The Adviser has not agreed to reimburse Dividend Advantage 2 (NXZ) for any portion of its fees and expenses beyond March 31, 2011. For the first ten years of Dividend Advantage 3’s (NZF) operations, the Adviser has agreed to reimburse the Fund, as a percentage of average daily managed assets, for fees and expenses in the amounts and for the time periods set forth below:
| | | | | | | | | | | |
| Year Ending | | | | | | Year Ending | | | | |
| September 30, | | | | | | September 30, | | | | |
| 2001* | | | .30 | % | | 2007 | | | .25 | % |
| 2002 | | | .30 | | | 2008 | | | .20 | |
| 2003 | | | .30 | | | 2009 | | | .15 | |
| 2004 | | | .30 | | | 2010 | | | .10 | |
| 2005 | | | .30 | | | 2011 | | | .05 | |
| 2006 | | | .30 | | | | | | | |
| * | From the commencement of operations. |
The Adviser has not agreed to reimburse Dividend Advantage 3 (NZF) for any portion of its fees and expenses beyond September 30, 2011.
| | | Notes to |
| | | Financial Statements (continued) |
8. New Accounting Pronouncements
Fair Value Measurements and Disclosures
On May 12, 2011, the Financial Accounting Standards Board (“FASB”) issued Accounting Standards Update (“ASU”) No. 2011-04 (“ASU No. 2011-04”) modifying Topic 820, Fair Value Measurements and Disclosures. At the same time, the International Accounting Standards Board (“IASB”) issued International Financial Reporting Standard (“IFRS”) 13, Fair Value Measurement. The objective of the FASB and IASB is convergence of their guidance on fair value measurements and disclosures. Specifically, ASU No. 2011-04 requires reporting entities to disclose i) the amounts of any transfers between Level 1 and Level 2 and the reasons for the transfers and ii) for Level 3 fair value measurements, a) quantitative information about significant unobservable inputs used, b) a description of the valuation processes used by the reporting entity and c) a narrative description of the sensitivity of the fair value measurement to changes in unobservable inputs if a change in those inputs might result in a significantly higher or lower fair value measurement. The effective date of ASU No. 2011-04 is for interim and annual periods beginning after December 15, 2011. At this time, management is evaluating the implications of this guidance and the impact it will have on the financial statement amounts and footnote disclosures, if any.
| Annual Investment Management |
Agreement Approval Process (Unaudited) |
The Board of Trustees or Directors (as the case may be) (each, a “Board” and each Trustee or Director, a “Board Member”) of the Funds, including the Board Members who are not parties to the Funds’ advisory or sub-advisory agreements or “interested persons” of any such parties (the “Independent Board Members”), is responsible for approving the advisory agreements (each, an “Investment Management Agreement”) between each Fund and Nuveen Fund Advisors, Inc. (the “Advisor”) and the sub-advisory agreements (each a “Sub-Advisory Agreement”) between the Advisor and Nuveen Asset Management, LLC (the “Sub-Advisor”) (the Investment Management Agreements and the Sub-Advisory Agreements are referred to collectively as the “Advisory Agreements”) and their periodic continuation. Pursuant to the Investment Company Act of 1940, as amended (the “1940 Act”), the Board is generally required to consider the continuation of advisory agreements and sub-advisory agreements on an annual basis. Accordingly, at an in-person meeting held on May 23-25, 2011 (the “May Meeting”), the Board, including a majority of the Independent Board Members, considered and approved the continuation of the Advisory Agreements for the Funds for an additional one-year period.
In preparation for their considerations at the May Meeting, the Board requested and received extensive materials prepared in connection with the review of the Advisory Agreements. The materials provided a broad range of information regarding the Funds, the Advisor and the Sub-Advisor (the Advisor and the Sub-Advisor are collectively, the “Fund Advisers” and each, a “Fund Adviser”). As described in more detail below, the information provided included, among other things, a review of Fund performance, including Fund investment performance assessments against peer groups and appropriate benchmarks, a comparison of Fund fees and expenses relative to peers, a description and assessment of shareholder service levels for the Funds, a summary of the performance of certain service providers, a review of product initiatives and shareholder communications and an analysis of the Advisor’s profitability with comparisons to comparable peers in the managed fund business. As part of their annual review, the Board also held a separate meeting on April 19-20, 2011, to review the Funds’ investment performance and consider an analysis provided by the Advisor of the Sub-Advisor which generally evaluated the Sub-Advisor’s investment team, investment mandate, organizational structure and history, investment philosophy and process, performance of the applicable Fund, and significant changes to the foregoing. As a result of their review of the materials and discussions, the Board presented the Advisor with questions and the Advisor responded.
| Annual Investment Management Agreement |
Approval Process (Unaudited) (continued) |
The materials and information prepared in connection with the review of the Advisory Agreements at the May Meeting supplemented the information provided to the Board during the year. In this regard, throughout the year, the Board, acting directly or through its committees, regularly reviews the performance and various services provided by the Advisor and, since the internal restructuring described in Section A below, the Sub-Advisor. The Board meets at least quarterly as well as at other times as the need arises. At its quarterly meetings, the Board reviews reports by the Advisor which include, among other things, Fund performance, a review of the investment teams and compliance reports. The Board also meets with key investment personnel managing the Fund portfolios during the year. In addition, the Board continues its program of seeking to visit each sub-advisor to the Nuveen funds at least once over a multiple year rotation, meeting with key investment and business personnel. The Board also met with State Street Bank & Trust Company, the Funds’ accountant and custodian, in 2010. The Board considers factors and information that are relevant to its consideration of the renewal of the Advisory Agreements at these meetings held throughout the year. Accordingly, the Board considered the information provided and knowledge gained at these meetings when performing its review at the May Meeting of the Advisory Agreements. The Independent Board Members are assisted throughout the process by independent legal counsel who provided materials describing applicable law and the duties of directors or trustees in reviewing advisory contracts and met with the Independent Board Members in executive sessions without management present.
The Board considered all factors it believed relevant with respect to each Fund, including among other factors: (a) the nature, extent and quality of the services provided by the Fund Advisers, (b) the investment performance of the Fund and Fund Advisers, (c) the advisory fees and costs of the services to be provided to the Funds and the profitability of the Fund Advisers, (d) the extent of any economies of scale, (e) any benefits derived by the Fund Advisers from the relationship with the Fund and (f) other factors. Each Board Member may have accorded different weight to the various factors in reaching his or her conclusions with respect to a Fund’s Advisory Agreements. The Independent Board Members did not identify any single factor as all important or controlling. The Independent Board Members’ considerations were instead based on a comprehensive consideration of all the information presented. The principal factors considered by the Board and its conclusions are described below.
A. Nature, Extent and Quality of Services
In considering renewal of the Advisory Agreements, the Independent Board Members considered the nature, extent and quality of the Fund Adviser’s services, including advisory services and the resulting Fund performance and administrative services. The Independent Board Members reviewed materials outlining, among other things, the Fund Adviser’s organization and business; the types of services that the Fund Adviser or
its affiliates provide to the Funds; the performance record of the applicable Fund (as described in further detail below); and any initiatives Nuveen had taken for the applicable fund product line.
In considering advisory services, the Board recognized that the Advisor provides various oversight, administrative, compliance and other services for the Funds and the Sub-Advisor provides the portfolio investment management services to the Funds. The Board recognized that Nuveen engaged in an internal restructuring in 2010 pursuant to which portfolio management services the Advisor had provided directly to the Funds were transferred to the Sub-Advisor, a newly-organized, wholly-owned subsidiary of the Advisor consisting of largely the same investment personnel. Accordingly, in reviewing the portfolio management services provided to each Fund, the Board reviewed the materials provided by the Nuveen Investment Services Oversight Team analyzing, among other things, the Sub-Advisor’s investment team and changes thereto, organization and history, assets under management, Fund objectives and mandate, the investment team’s philosophy and strategies in managing the Fund, developments affecting the Sub-Advisor or Fund and Fund performance. The Independent Board Members also reviewed portfolio manager compensation arrangements to evaluate each Fund Adviser’s ability to attract and retain high quality investment personnel, preserve stability, and reward performance but not provide an incentive to take undue risks. In addition, the Board considered the Advisor’s execution of its oversight responsibilities over the Sub-Advisor. Given the importance of compliance, the Independent Board Members also considered Nuveen’s compliance program, including the report of the chief compliance officer regarding the Funds’ compliance policies and procedures.
In addition to advisory services, the Board considered the quality and extent of administrative and other non-investment advisory services the Advisor and its affiliates provide to the Funds, including product management, investment services (such as oversight of investment policies and procedures, risk management, and pricing), fund administration, oversight of service providers, shareholder services, administration of Board relations, regulatory and portfolio compliance, legal support, managing leverage and promoting an orderly secondary market for common shares.
In reviewing the services provided, the Board also reviewed materials describing various notable initiatives and projects the Advisor performed in connection with the closed-end fund product line. These initiatives included continued activities to refinance auction rate preferred securities; ongoing services to manage leverage that has become increasingly complex; continued secondary market offerings and share repurchases for certain funds; and continued communications efforts with shareholders, fund analysts and financial advisers. With respect to the latter, the Independent Board Members noted Nuveen’s continued commitment to supporting the secondary market for the common
| Annual Investment Management Agreement |
Approval Process (Unaudited) (continued) |
shares of its closed-end funds through a comprehensive secondary market communication program designed to raise investor and analyst awareness and understanding of closed-end funds. Nuveen’s support services included, among other things: continuing communications in support of refinancing efforts related to auction rate preferred securities; participating in conferences; communicating continually with closed-end fund analysts covering the Nuveen funds; providing marketing for the closed-end funds; share purchases; and maintaining and enhancing a closed-end fund website.
Based on their review, the Independent Board Members found that, overall, the nature, extent and quality of services provided to the respective Funds under each applicable Advisory Agreement were satisfactory.
B. The Investment Performance of the Funds and Fund Advisers
The Board, including the Independent Board Members, reviewed and considered the performance history of each Fund over various time periods. The Board reviewed, among other things, each Fund’s historic investment performance as well as information comparing the Fund’s performance information with that of other funds (the “Performance Peer Group”) based on data provided by an independent provider of mutual fund data and with recognized and/or customized benchmarks.
The Board reviewed reports, including a comprehensive analysis of the Funds’ performance and the applicable investment team. In this regard, the Board reviewed each Fund’s total return information compared to its Performance Peer Group for the quarter, one-, three- and five-year periods ending December 31, 2010 and for the same periods ending March 31, 2011. In addition, the Board reviewed each Fund’s total return information compared to recognized and/or customized benchmarks for the quarter, one- and three-year periods ending December 31, 2010 and for the same periods ending March 31, 2011. The Independent Board Members also reviewed historic premium and discount levels, including a summary of actions taken to address or discuss other developments affecting the secondary market discounts of various funds. This information supplemented the Fund performance information provided to the Board at each of its quarterly meetings.
In reviewing performance comparison information, the Independent Board Members recognized that the usefulness of the comparisons of the performance of certain funds with the performance of their respective Performance Peer Group may be limited because the Performance Peer Group may not adequately represent the objectives and strategies of the applicable funds or may be limited in size or number. The Independent Board Members also noted that the investment experience of a particular shareholder in the Nuveen funds will vary depending on when such shareholder invests in the applicable fund, the class held (if multiple classes are offered) and the performance of the fund (or respective class) during that shareholder’s investment period.
In considering the results of the comparisons, the Independent Board Members observed, among other things, that (a) the Nuveen Dividend Advantage Municipal Fund 3 had demonstrated generally favorable performance in comparison to peers, performing in the first or second quartile over various periods and (b) the Nuveen Performance Plus Municipal Fund, Inc. (the “Performance Plus Fund”), the Nuveen Municipal Advantage Fund, Inc. (the “Municipal Advantage Fund”) and the Nuveen Dividend Advantage Municipal Fund (the “Dividend Advantage Fund”) each had demonstrated satisfactory performance compared to peers, performing in the second or third quartile over various periods. They also noted that the Nuveen Dividend Advantage Municipal Fund 2 lagged its peers somewhat in the shorter one- and three-year periods, but demonstrated more favorable performance in the longer five-year period, and that the Nuveen Municipal Market Opportunity Fund, Inc. (the “Municipal Market Opportunity Fund”) lagged its peers and/or benchmark over various periods. With respect to Nuveen funds that lagged their peers and/or benchmarks over various periods, the Independent Board Members considered the factors affecting performance and any steps taken or proposed to address performance issues, and were satisfied with the process followed.
With respect to any Nuveen funds that underperformed their peers and/or benchmarks from time to time, the Board monitors such funds closely and considers any steps necessary or appropriate to address such issues.
Except as otherwise noted above, based on their review, the Independent Board Members determined that each Fund’s investment performance had been satisfactory.
| C. | Fees, Expenses and Profitability |
| | |
| | The Board evaluated the management fees and expenses of each Fund reviewing, among other things, such Fund’s gross management fees, net management fees and net expense ratios in absolute terms as well as compared to the fee and expenses of a comparable universe of funds based on data provided by an independent fund data provider (the “Peer Universe”) and in certain cases, to a more focused subset of funds in the Peer Universe (the “Peer Group”) and any expense limitations. The Independent Board Members further reviewed the methodology regarding the construction of the applicable Peer Universe and Peer Group (if any). In reviewing the comparisons of fee and expense information, the Independent Board Members took into account that in certain instances various factors such as: the asset level of a fund relative to peers; the limited size and particular composition of the Peer Universe or Peer Group; the investment objectives of the peers; expense anomalies; changes in the funds comprising the Peer Universe or Peer Group from year to year; levels of reimbursement; the timing of information used; and the differences in the type and use of leverage may impact the comparative data thereby limiting the ability to make a meaningful comparison with peers. |
| Annual Investment Management Agreement |
Approval Process (Unaudited) (continued) |
| | In reviewing the fee schedule for a Fund, the Independent Board Members also considered the fund-level and complex-wide breakpoint schedules (described in further detail below) and any fee waivers and reimbursements provided by Nuveen (applicable, in particular, for certain closed-end funds launched since 1999). In reviewing fees and expenses, the Board considered the expenses and fees to be higher if they were over 10 basis points higher, slightly higher if they were 6 to 10 basis points higher, in line if they were within 5 basis points higher than the peer average and below if they were below the peer average of the Peer Group (if available) or Peer Universe if there was no separate Peer Group. The Independent Board Members noted that the Municipal Advantage Fund and the Municipal Market Opportunity Fund had higher net management fees than their peer averages and a slightly higher or higher net expense ratio compared to their peer averages while the Dividend Advantage Fund and the Performance Plus Fund had net management fees slightly higher or higher than their peer averages but a net expense ratio below or in line with their peer averages. In addition, they noted that each of the other Funds had net management fees and net expense ratios below their peer averages. Based on their review of the fee and expense information provided, the Independent Board Members determined that each Fund’s management fees were reasonable in light of the nature, extent and quality of services provided to the Fund. |
| | |
| | 2. Comparisons with the Fees of Other Clients |
| | The Independent Board Members further reviewed information regarding the nature of services and fee rates offered by the Advisor to other clients, including municipal separately managed accounts and passively managed exchange traded funds (ETFs) sub-advised by the Advisor. In evaluating the comparisons of fees, the Independent Board Members noted that the fee rates charged to the Funds and other clients vary, among other things, because of the different services involved and the additional regulatory and compliance requirements associated with registered investment companies, such as the Funds. Accordingly, the Independent Board Members considered the differences in the product types, including, but not limited to, the services provided, the structure and operations, product distribution and costs thereof, portfolio investment policies, investor profiles, account sizes and regulatory requirements. The Independent Board Members noted, in particular, that the range of services provided to the Funds (as discussed above) is much more extensive than that provided to separately managed accounts. Given the inherent differences in the products, particularly the extensive services provided to the Funds, the Independent Board Members believe such facts justify the different levels of fees. |
| | In considering the fees of the Sub-Advisor, the Independent Board Members also considered the pricing schedule or fees that the Sub-Advisor charges for similar investment management services for other Nuveen funds. |
| | |
| | 3. Profitability of Fund Advisers |
| | In conjunction with its review of fees, the Independent Board Members also considered the profitability of Nuveen for its advisory activities (which incorporated Nuveen’s wholly-owned affiliated sub-advisers) and its financial condition. The Independent Board Members reviewed the revenues and expenses of Nuveen’s advisory activities for the last two years, the allocation methodology used in preparing the profitability data and an analysis of the key drivers behind the changes in revenues and expenses that impacted profitability in 2010. The Independent Board Members noted this information supplemented the profitability information requested and received during the year to help keep them apprised of developments affecting profitability (such as changes in fee waivers and expense reimbursement commitments). In this regard, the Independent Board Members noted that they have an Independent Board Member serve as a point person to review and keep them apprised of changes to the profitability analysis and/or methodologies during the year. The Independent Board Members also considered Nuveen’s revenues for advisory activities, expenses, and profit margin compared to that of various unaffiliated management firms with similar amounts of assets under management and relatively comparable asset composition prepared by Nuveen. In reviewing profitability, the Independent Board Members recognized the subjective nature of determining profitability which may be affected by numerous factors including the allocation of expenses. Further, the Independent Board Members recognized the difficulties in making comparisons as the profitability of other advisers generally is not publicly available and the profitability information that is available for certain advisers or management firms may not be representative of the industry and may be affected by, among other things, the adviser’s particular business mix, capital costs, types of funds managed and expense allocations. Notwithstanding the foregoing, the Independent Board Members reviewed Nuveen’s methodology and assumptions for allocating expenses across product lines to determine profitability. In reviewing profitability, the Independent Board Members recognized Nuveen’s investment in its fund business. Based on their review, the Independent Board Members concluded that the Advisor’s level of profitability for its advisory activities was reasonable in light of the services provided. In evaluating the reasonableness of the compensation, the Independent Board Members also considered other amounts paid to a Fund Adviser by the Funds as well as any indirect benefits (such as soft dollar arrangements, if any) the Fund Adviser and its affiliates receive, or are expected to receive, that are directly attributable to the management of the Funds, if any. See Section E below for additional |
Annual Investment Management Agreement
Approval Process (Unaudited) (continued)
| | information on indirect benefits a Fund Adviser may receive as a result of its relationship with the Funds. Based on their review of the overall fee arrangements of each Fund, the Independent Board Members determined that the advisory fees and expenses of the respective Fund were reasonable. |
| | |
| D. | Economies of Scale and Whether Fee Levels Reflect These Economies of Scale |
With respect to economies of scale, the Independent Board Members have recognized the potential benefits resulting from the costs of a fund being spread over a larger asset base, although economies of scale are difficult to measure and predict with precision, particularly on a fund-by-fund basis. One method to help ensure the shareholders share in these benefits is to include breakpoints in the advisory fee schedule. Generally, management fees for funds in the Nuveen complex are comprised of a fund-level component and a complex-level component, subject to certain exceptions. Accordingly, the Independent Board Members reviewed and considered the applicable fund-level breakpoints in the advisory fee schedules that reduce advisory fees as asset levels increase. Further, the Independent Board Members noted that although closed-end funds may from time-to-time make additional share offerings, the growth of their assets will occur primarily through the appreciation of such funds’ investment portfolio.
In addition to fund-level advisory fee breakpoints, the Board also considered the Funds’ complex-wide fee arrangement. Pursuant to the complex-wide fee arrangement, the fees of the funds in the Nuveen complex are generally reduced as the assets in the fund complex reach certain levels. The complex-wide fee arrangement seeks to provide the benefits of economies of scale to fund shareholders when total fund complex assets increase, even if assets of a particular fund are unchanged or have decreased. The approach reflects the notion that some of Nuveen’s costs are attributable to services provided to all its funds in the complex and therefore all funds benefit if these costs are spread over a larger asset base.
Based on their review, the Independent Board Members concluded that the breakpoint schedules and complex-wide fee arrangement were acceptable and reflect economies of scale to be shared with shareholders when assets under management increase.
E. Indirect Benefits
In evaluating fees, the Independent Board Members received and considered information regarding potential “fall out” or ancillary benefits the respective Fund Adviser or its affiliates may receive as a result of its relationship with each Fund. In this regard, the Independent Board Members considered any revenues received by affiliates of the Advisor for serving as agent at Nuveen’s trading desk and as co-manager in initial public offerings of new closed-end funds.
In addition to the above, the Independent Board Members considered whether the Fund Advisers received any benefits from soft dollar arrangements whereby a portion of the commissions paid by a Fund for brokerage may be used to acquire research that may be useful to the Fund Adviser in managing the assets of the Funds and other clients. The Independent Board Members recognized that each Fund Adviser has the authority to pay a higher commission in return for brokerage and research services if it determines in good faith that the commission paid is reasonable in relation to the value of the brokerage and research services provided. Nevertheless, the Independent Board Members noted that commissions are generally not paid in connection with municipal securities transactions typically executed on a principal basis.
Based on their review, the Independent Board Members concluded that any indirect benefits received by a Fund Adviser as a result of its relationship with the Funds were reasonable and within acceptable parameters.
F. Other Considerations
The Independent Board Members did not identify any single factor discussed previously as all-important or controlling. The Board Members, including the Independent Board Members, unanimously concluded that the terms of each Advisory Agreement are fair and reasonable, that the respective Fund Adviser’s fees are reasonable in light of the services provided to each Fund and that the Advisory Agreements be renewed.
Board Members & Officers (Unaudited)
The management of the Funds, including general supervision of the duties performed for the Funds by the Adviser, is the responsibility of the board members of the Funds. The number of board members of the Funds is currently set at ten. None of the board members who are not “interested” persons of the Funds (referred to herein as “independent board members”) has ever been a director or employee of, or consultant to, Nuveen or its affiliates. The names and business addresses of the board members and officers of the Funds, their principal occupations and other affiliations during the past five years, the number of portfolios each oversees and other directorships they hold are set forth below.
| | Name, Birthdate & Address | | Position(s) Held with the Funds | | Year First Elected or Appointed and Term(1) | | Principal Occupation(s) including other Directorships During Past 5 Years | | Number of Portfolios in Fund Complex Overseen by Board Member |
| Independent Board Members: | | | |
| ■ | ROBERT P. BREMNER(2) 8/22/40
333 W. Wacker Drive Chicago, IL 60606 | | Chairman of the Board and Board Member | | 1996 Class III | | Private Investor and Management Consultant; Treasurer and Director, Humanities Council of Washington, D.C.; Board Member, Independent Directors Council affiliated with the Investment Company Institute. | | 241 |
| | | | | | | | | | |
| JACK B. EVANS 10/22/48 333 W. Wacker Drive Chicago, IL 60606 | | Board Member | | 1999 Class III | | President, The Hall-Perrine Foundation, a private philanthropic corporation (since 1996); Director and Chairman, United Fire Group, a publicly held company; member of the Board of Regents for the State of Iowa University System; Director, Source Media Group; Life Trustee of Coe College and the Iowa College Foundation; formerly, Director, Alliant Energy; formerly, Director, Federal Reserve Bank of Chicago; formerly, President and Chief Operating Officer, SCI Financial Group, Inc., a regional financial services firm. | | 241 |
| | | | | | | | | | |
| WILLIAM C. HUNTER 3/6/48 333 W. Wacker Drive Chicago, IL 60606 | | Board Member | | 2004 Class I | | Dean, Tippie College of Business, University of Iowa (since 2006); Director (since 2004) of Xerox Corporation; Director (since 2005), Beta Gamma Sigma International Honor Society; Director of Wellmark, Inc. (since 2009); formerly, Dean and Distinguished Professor of Finance, School of Business at the University of Connecticut (2003-2006); previously, Senior Vice President and Director of Research at the Federal Reserve Bank of Chicago (1995-2003); formerly, Director (1997-2007), Credit Research Center at Georgetown University. | | 241 |
| | | | | | | | | | |
| DAVID J. KUNDERT(2) 10/28/42 333 W. Wacker Drive Chicago, IL 60606 | | Board Member | | 2005 Class II | | Director, Northwestern Mutual Wealth Management Company; retired (since 2004) as Chairman, JPMorgan Fleming Asset Management, President and CEO, Banc One Investment Advisors Corporation, and President, One Group Mutual Funds; prior thereto, Executive Vice President, Banc One Corporation and Chairman and CEO, Banc One Investment Management Group; Member, Board of Regents, Luther College; member of the Wisconsin Bar Association; member of Board of Directors, Friends of Boerner Botanical Gardens; member of Board of Directors and Chair of Investment Committee, Greater Milwaukee Foundation. | | 241 |
| | | | | | | | | | |
| WILLIAM J. SCHNEIDER(2) 9/24/44 333 W. Wacker Drive Chicago, IL 60606 | | Board Member | | 1996 Class III | | Chairman of Miller-Valentine Partners Ltd., a real estate investment company; formerly, Senior Partner and Chief Operating Officer (retired 2004) of Miller-Valentine Group; member, University of Dayton Business School Advisory Council;member, Mid-America Health System Board; formerly, member and chair, Dayton Philharmonic Orchestra Association; formerly, member, Business Advisory Council, Cleveland Federal Reserve Bank. | | 241 |
| | Name, Birthdate & Address | | Position(s) Held with the Funds | | Year First Elected or Appointed and Term(1) | | Principal Occupation(s) Including other Directorships During Past 5 Years | | Number of Portfolios in Fund Overseen by Board Member |
| Independent Board Members: | | | | |
| ■ | JUDITH M. STOCKDALE 12/29/47 333 W. Wacker Drive Chicago, IL 60606 | | Board Member | | 1997 Class I | | Executive Director, Gaylord and Dorothy Donnelley Foundation (since 1994); prior thereto, Executive Director, Great Lakes Protection Fund (1990-1994). | | 241 |
| ■ | CAROLE E. STONE(2) 6/28/47 333 W. Wacker Drive Chicago, IL 60606 | | Board Member | | 2007 Class I | | Director, Chicago Board Options Exchange (since 2006); Director, C2 Options Exchange, Incorporated (since 2009); formerly, Commissioner, New York State Commission on Public Authority Reform (2005-2010); formerly, Chair, New York Racing Association Oversight Board (2005-2007). | | 241 |
| ■ | VIRGINIA L. STRINGER 8/16/44 333 W. Wacker Drive Chicago, IL 60606 | | Board Member | | 2011 | | Board Member, Mutual Fund Directors Forum; Member, Governing Board, Investment Company Institute’s Independent Directors Council; governance consultant and non-profit board member; former Owner and President, Strategic Management Resources, Inc. a management consulting firm; previously, held several executive positions in general management, marketing and human resources at IBM and The Pillsbury Company; Independent Director, First American Fund Complex (1987-2010) and Chair (1997-2010). | | 241 |
| ■ | TERENCE J. TOTH(2) 9/29/59 333 W. Wacker Drive Chicago, IL 60606 | | Board Member | | 2008 Class II | | Director, Legal & General Investment Management America, Inc. (since 2008); Managing Partner, Promus Capital (since 2008); formerly, CEO and President, Northern Trust Global Investments (2004-2007); Executive Vice President, Quantitative Management & Securities Lending (2000-2004); prior thereto, various positions with Northern Trust Company (since 1994); member: Goodman Theatre Board (since 2004), Chicago Fellowship Board (since 2005) and Catalyst Schools of Chicago Board (since 2008); formerly, member: Northern Trust Mutual Funds Board (2005-2007), Northern Trust Global Investments Board (2004-2007), Northern Trust Japan Board (2004-2007), Northern Trust Securities Inc. Board (2003-2007) and Northern Trust Hong Kong Board (1997-2004). | | 241 |
| Interested Board Member: | | | | | | | |
| ■ | JOHN P. AMBOIAN(3) 6/14/61 333 W. Wacker Drive Chicago, IL 60606 | | Board Member | | 2008 Class II | | Chief Executive Officer and Chairman (since 2007) and Director (since 1999) of Nuveen Investments, Inc., formerly, President (1999-2007); Chief Executive Officer (since 2007) of Nuveen Investments Advisers, Inc.; Director (since 1998) formerly, Chief Executive Officer (2007-2010) of Nuveen Fund Advisors, Inc. | | 241 |
Board Members & Officers (Unaudited) (continued) |
| | Name, Birthdate and Address | | Position(s) Held with the Funds | | Year First Elected or Appointed(4) | | Principal Occupation(s) During Past 5 Years | | Number of Portfolios in Fund Complex Overseen by Officer |
| Officers of the Funds: | | | | | | | | |
| | | | | | | | |
■ | GIFFORD R. ZIMMERMAN 9/9/56333 W. Wacker Drive Chicago, IL 60606 | | Chief Administrative Officer | | 1988 | | Managing Director (since 2002), Assistant Secretary and Associate General Counsel of Nuveen Securities, LLC; Managing Director (since 2004) and Assistant Secretary (since 1994) of Nuveen Investments, Inc.; Managing Director (since 2002), Assistant Secretary (since 1997) and Co-General Counsel (since 2011) of Nuveen Fund Advisors, Inc.; Managing Director, Assistant Secretary and Associate General Counsel of Nuveen Asset Management, LLC (since 2011); Managing Director, Associate General Counsel and Assistant Secretary, of Symphony Asset Management LLC (since 2003); Vice President and Assistant Secretary of NWQ Investment Management Company, LLC (since 2002), Nuveen Investments Advisers Inc. (since 2002), Tradewinds Global Investors LLC, and Santa Barbara Asset Management, LLC (since 2006), Nuveen HydePark Group LLC and Nuveen Investment Solutions, Inc. (since 2007) and of Winslow Capital Management Inc. (since 2010); Chief Administrative Officer and Chief Compliance Officer (since 2010) of Nuveen Commodities Asset Management, LLC; Chartered Financial Analyst. | | 241 |
| | | | | | | | | | |
| WILLIAM ADAMS IV 6/9/55 333 W. Wacker Drive Chicago, IL 60606 | | Vice President | | 2007 | | Senior Executive Vice President, Global Structured Products (since 2010), formerly, Executive Vice President (1999-2010) of Nuveen Securities, LLC; Co-President of Nuveen Fund Advisors, Inc. (since 2011); formerly, Managing Director (2010-2011) of Nuveen Commodities Asset Management, LLC. | | 133 |
| | | | | | | | | | |
| CEDRIC H. ANTOSIEWICZ 1/11/62 333 W. Wacker Drive Chicago, IL 60606 | | Vice President | | 2007 | | Managing Director of Nuveen Securities, LLC. | | 133 |
| | | | | | | | | | |
| MARGO L. COOK 4/11/64 333 W. Wacker Drive Chicago, IL 60606 | | Vice President | | 2009 | | Executive Vice President (since 2008) of Nuveen Investments, Inc.and of Nuveen Fund Advisors, Inc. (since 2011); Managing Director-Investment Services of Nuveen Commodities Asset Management, LLC (since August 2011), previously, Head of Institutional Asset Management (2007-2008) of Bear Stearns Asset Management; Head of Institutional Asset Management (1986-2007) of Bank of NY Mellon; Chartered Financial Analyst. | | 241 |
| | | | | | | | | | |
| LORNA C. FERGUSON 10/24/45 333 W. Wacker Drive Chicago, IL 60606 | | Vice President | | 1998 | | Managing Director (since 2005) of Nuveen Fund Advisors, Inc. and Nuveen Securities, LLC (since 2004). | | 241 |
| STEPHEN D. FOY 5/31/54 333 W. Wacker Drive Chicago, IL 60606 | | Vice President and Controller | | 1998 | | Senior Vice President (since 2010), formerly, Vice President (2005-2010) and Funds Controller of Nuveen Securities, LLC; Vice President of Nuveen Fund Advisors, Inc.; Chief Financial Officer of Nuveen Commodities Asset Management, LLC; (since 2010) Certified Public Accountant. | | 241 |
| | Name, Birthdate and Address | | Position(s) Held with the Funds | | Year First Elected or Appointed(4) | | Principal Occupation(s) During Past 5 Years | | Number of Portfolios in Fund Complex Overseen by Officer |
| | | | | | | | | | |
| Officers of the Funds: | | | | | | | | |
| SCOTT S. GRACE 8/20/70 333 W. Wacker Drive Chicago, IL 60606 | | Vice President and Treasurer | | 2009 | | Managing Director, Corporate Finance & Development, Treasurer (since 2009) of Nuveen Securities, LLC; Managing Director and Treasurer (since 2009) of Nuveen Fund Advisors, Inc., Nuveen Investment Solutions, Inc., Nuveen Investments Advisers, Inc., Nuveen Investments Holdings Inc. and (since 2011) Nuveen Asset Management, LLC; Vice President and Treasurer of NWQ Investment Management Company, LLC, Tradewinds Global Investors, LLC, Symphony Asset Management LLC and Winslow Capital Management, Inc.; Vice President of Santa Barbara Asset Management, LLC; formerly, Treasurer (2006-2009), Senior Vice President (2008-2009), previously, Vice President (2006-2008) of Janus Capital Group, Inc.; formerly, Senior Associate in Morgan Stanley’s Global Financial Services Group (2000-2003); Chartered Accountant Designation. | | 241 |
| | | | | | | | | | |
| WALTER M. KELLY 2/24/70 333 W. Wacker Drive Chicago, IL 60606 | | Chief Compliance Officer and Vice President | | 2003 | | Senior Vice President (since 2008) and Assistant Secretary (since 2003) of Nuveen Fund Advisors, Inc. | | 241 |
| | | | | | | | | | |
| TINA M. LAZAR 8/27/61 333 W. Wacker Drive Chicago, IL 60606 | | Vice President | | 2002 | | Senior Vice President (since 2010), formerly, Vice President (2005-2010) of Nuveen Fund Advisors, Inc. | | 241 |
| | | | | | | | | | |
| LARRY W. MARTIN 7/27/51 333 W. Wacker Drive Chicago, IL 60606 | | Vice President and Assistant Secretary | | 1997 | | Senior Vice President (since 2010), formerly, Vice President (1993-2010), Assistant Secretary and Assistant General Counsel of Nuveen Securities, LLC; Senior Vice President (since 2011) of Nuveen Asset Management, LLC: Senior Vice President (since 2010), formerly, Vice President (2005-2010), and Assistant Secretary of Nuveen Investments, Inc.; Senior Vice President (since 2010), formerly Vice President (2005-2010), and Assistant Secretary (since 1997) of Nuveen Fund Advisors, Inc., Vice President and Assistant Secretary of Nuveen Investments Advisers Inc. (since 2002), NWQ Investment Management Company, LLC, Symphony Asset Management, LLC (since 2003), Tradewinds Global Investors, LLC, Santa Barbara Asset Management LLC (since 2006), Nuveen HydePark Group, LLC and Nuveen Investment Solutions, Inc. (since 2007), and of Winslow Capital Management, Inc. (since 2010); Vice President and Assistant Secretary of Nuveen Commodities Asset Management, LLC (since 2010). | | 241 |
| | | | | | | | | | |
| KEVIN J. MCCARTHY 3/26/66 333 W. Wacker Drive Chicago, IL 60606 | | Vice President and Secretary | | 2007 | | Managing Director (since 2008), formerly, Vice President (2007-2008), Nuveen Securities, LLC; Managing Director (since 2008), Assistant Secretary (since 2007) and Co-General Counsel (since 2011) of Nuveen Fund Advisors, Inc.; Managing Director, Assistant Secretary and Associate General Counsel (since 2011) of Nuveen Asset Management, LLC; Managing Director (since 2008), and Assistant Secretary, Nuveen Investment Holdings, Inc.; Vice President (since 2007) and Assistant Secretary of Nuveen Investments Advisers Inc., NWQ Investment Management Company, LLC, Tradewinds Global Investors LLC, NWQ Holdings, LLC, Symphony Asset Management LLC, Santa Barbara Asset Management, LLC, Nuveen HydePark Group, LLC, Nuveen Investment Solutions, Inc. (since 2007) and of Winslow Capital Management, Inc. (since 2010); Vice President and Secretary (since 2010) of Nuveen Commodities Asset Management, LLC; prior thereto, Partner, Bell, Boyd & Lloyd LLP (1997-2007). | | 241 |
Board Members & Officers (Unaudited) (continued)
| | | | | | | | | | | |
| | Name, Birthdate and Address | | | Position(s) Held with the Funds | | Year First Elected or Appointed(4) | | Principal Occupation(s) During Past 5 Years | | Number of Portfolios in Fund Complex Overseen by Officer |
| Officers of the Funds: | | | | | | | | | |
| | | | | | | | |
| KATHLEEN L. PRUDHOMME 3/30/53 901 Marquette Avenue Minneapolis, MN 55402 | | | Vice President and Assistant Secretary | | 2011 | | Managing Director, Assistant Secretary and Co-General Counsel (since 2011) of Nuveen Fund Advisors, Inc.; Managing Director, Assistant Secretary and Associate General Counsel (since 2011) of Nuveen Asset Management, LLC; Managing Director and Assistant Secretary (since 2011) of Nuveen Securities, LLC; formerly, Deputy General Counsel, FAF Advisors, Inc. (2004-2010). | | 241 |
| (1) | For Dividend Advantage (NAD), Dividend Advantage 2 (NXZ) and Dividend Advantage 3 (NZF), the Board of Trustees is divided into three classes, Class I, Class II, and Class III, with each being elected to serve until the third succeeding annual shareholders’ meeting subsequent to its election or thereafter in each case when its respective successors are duly elected or appointed, except two board members are elected by the holders of Preferred Shares to serve until the next annual shareholders’ meeting subsequent to its election or thereafter in each case when its respective successors are duly elected or appointed. For Performance Plus (NPP), Municipal Advantage (NMA) and Market Opportunity (NMO), the Board Members serve a one year term to serve until the next annual meeting or until their succes-sors shall have been duly elected and qualified. The year first elected or appointed represents the year in which the board member was first elected or appointed to any fund in the Nuveen Complex. |
| (2) | Also serves as a trustee of the Nuveen Diversified Commodity Fund, an exchange-traded commodity pool managed by Nuveen Commodities Asset Management, LLC, an affiliate of the Adviser. |
| (3) | Mr. Amboian is an interested trustee because of his position with Nuveen Investments, Inc. and certain of its subsidiaries, which are affiliates of the Nuveen Funds. | |
| (4) | Officers serve one year terms through August of each year. The year first elected or appointed represents the year in which the Officer was first elected or appointed to any fund in the Nuveen Complex. |
Reinvest Automatically,
Easily and Conveniently
Nuveen makes reinvesting easy. A phone call is all it takes to set up your reinvestment account.
Nuveen Closed-End Funds Automatic Reinvestment Plan
Your Nuveen Closed-End Fund allows you to conveniently reinvest distributions in additional Fund shares.
By choosing to reinvest, you’ll be able to invest money regularly and automatically, and watch your investment grow through the power of compounding. Just like distributions in cash, there may be times when income or capital gains taxes may be payable on distributions that are reinvested.
It is important to note that an automatic reinvestment plan does not ensure a profit, nor does it protect you against loss in a declining market.
Easy and convenient
To make recordkeeping easy and convenient, each month you’ll receive a statement showing your total distributions, the date of investment, the shares acquired and the price per share, and the total number of shares you own.
How shares are purchased
The shares you acquire by reinvesting will either be purchased on the open market or newly issued by the Fund. If the shares are trading at or above net asset value at the time of valuation, the Fund will issue new shares at the greater of the net asset value or 95% of the then-current market price. If the shares are trading at less than net asset value, shares for your account will be purchased on the open market. If the Plan Agent begins purchasing Fund shares on the open market while shares are trading below net asset value, but the Fund’s shares subsequently trade at or above their net asset value before the Plan Agent is able to complete its purchases, the Plan Agent may cease open-market purchases and may invest the uninvested portion of the distribution in newly-issued Fund shares at a price equal to the greater of the shares’ net asset value or 95% of the shares’ market value on the last business day immediately prior to the purchase date. Distributions received to purchase shares in the open market will normally be invested shortly after the distribution payment date. No interest will be paid on distributions awaiting reinvestment. Because the market price of the shares may increase before purchases are completed, the average purchase price per share may
Reinvest Automatically
Easily and Conveniently (continued)
exceed the market price at the time of valuation, resulting in the acquisition of fewer shares than if the distribution had been paid in shares issued by the Fund. A pro rata portion of any applicable brokerage commissions on open market purchases will be paid by Plan participants. These commissions usually will be lower than those charged on individual transactions.
Flexible
You may change your distribution option or withdraw from the Plan at any time, should your needs or situation change.
You can reinvest whether your shares are registered in your name, or in the name of a brokerage firm, bank, or other nominee. Ask your investment advisor if his or her firm will participate on your behalf. Participants whose shares are registered in the name of one firm may not be able to transfer the shares to another firm and continue to partici-pate in the Plan.
The Fund reserves the right to amend or terminate the Plan at any time. Although the Fund reserves the right to amend the Plan to include a service charge payable by the participants, there is no direct service charge to participants in the Plan at this time.
Call today to start reinvesting distributions
For more information on the Nuveen Automatic Reinvestment Plan or to enroll in or withdraw from the Plan, speak with your financial advisor or call us at (800) 257-8787.
Glossary of Terms
Used in this Report
■ | Auction Rate Bond: An auction rate bond is a security whose interest payments are adjusted periodically through an auction process, which process typically also serves as a means for buying and selling the bond. Auctions that fail to attract enough buyers for all the shares offered for sale are deemed to have “failed,” with current holders receiving a formula-based interest rate until the next scheduled auction. |
| |
■ | Average Annual Total Return: This is a commonly used method to express an investment’s performance over a particular, usually multi-year time period. It expresses the return that would have been necessary each year to equal the investment’s actual cumulative performance (including change in NAV or market price and reinvested dividends and capital gains distributions, if any) over the time period being considered. |
| |
| ■ | Average Effective Maturity: The market-value-weighted average of the effective maturity dates of the individual securities including cash. In the case of a bond that has been advance-refunded to a call date, the effective maturity is the date on which the bond is scheduled to be redeemed using the proceeds of an escrow account. In most other cases the effective maturity is the stated maturity date of the security. |
| | |
| Effective Leverage: Effective leverage is a Fund’s effective economic leverage, and includes both structural leverage and the leverage effects of certain derivative investments in the Fund’s portfolio. Currently, the leverage effects of Tender Option Bond (TOB) inverse floater holdings are included in effective leverage values, in addition to any structural leverage. |
| |
| ■ | Inverse Floaters: Inverse floating rate securities, also known as inverse floaters, are created by depositing a municipal bond, typically with a fixed interest rate, into a special purpose trust created by a broker-dealer. This trust, in turn, (a) issues floating rate certificates typically paying short-term tax-exempt interest rates to third parties in amounts equal to some fraction of the deposited bond’s par amount or market value, and (b) issues an inverse floating rate certificate (sometimes referred to as an “inverse floater”) to an investor (such as a Fund) interested in gaining investment exposure to a long-term municipal bond. The income received by the holder of the inverse floater varies inversely with the short-term rate paid to the floating rate certificates’ holders, and in most circumstances the holder of the inverse floater bears substantially all of the underlying bond’s downside investment risk. The holder of the inverse floater typically also benefits disproportionately from any potential appreciation of the underlying bond’s value. Hence, an inverse floater essentially represents an investment in the underlying bond on a leveraged basis. |
| | |
| Leverage: Using borrowed money to invest in securities or other assets. |
Glossary of Terms
Used in this Report (continued)
| ■ | Leverage-Adjusted Duration: Duration is a measure of the expected period over which a bond’s principal and interest will be paid, and consequently is a measure of the sensitivity of a bond’s or bond Fund’s value to changes when market interest rates change. Generally, the longer a bond’s or Fund’s duration, the more the price of the bond or Fund will change as interest rates change. Leverage-adjusted duration takes into account the leveraging process for a Fund and therefore is longer than the duration of the Fund’s portfolio of bonds. |
| | |
| Lipper General and Insured Leveraged Municipal Debt Classification Average: Calculated using the returns of all closed-end funds in this category for each period as follows: 1-year, 23 funds; 5-year, 22 funds; and 10-year, 13 funds. Lipper returns account for the effects of management fees and assume reinvestment of dividends, but do not reflect any applicable sales charges. The Lipper average is not available for direct investment. |
| | |
| Market Yield (also known as Dividend Yield or Current Yield): An investment’s current annualized dividend divided by its current market price. |
| | |
| Net Asset Value (NAV): The net market value of all securities held in a portfolio. |
| | |
| Net Asset Value (NAV) Per Share: The market value of one share of a mutual fund or closed-end fund. For a Fund, the NAV is calculated daily by taking the Fund’s total assets (securities, cash, and accrued earnings), subtracting the Fund’s liabilities, and dividing by the number of shares outstanding. |
| | |
| Pre-Refunding: Pre-Refunding, also known as advanced refundings or refinancings, is a procedure used by state and local governments to refinance municipal bonds to lower interest expenses. The issuer sells new bonds with a lower yield and uses the proceeds to buy U.S. Treasury securities, the interest from which is used to make payments on the higher-yielding bonds. Because of this collateral, pre-refunding generally raises a bond’s credit rating and thus its value. |
| | |
| Standard & Poor’s (S&P) National Municipal Bond Index: An unleveraged, market value-weighted index designed to measure the performance of the tax-exempt, investment-grade U.S. municipal bond market. The index returns assume reinvestment of dividends but do not reflect any applicable sales charges. You cannot invest directly in an index. |
| | |
| Structural Leverage: Structural Leverage consists of preferred shares or debt issued by the Fund. Both of these are part of a Fund’s capital structure. Structural leverage is sometimes referred to as “‘40 Act Leverage” and is subject to asset coverage limits set in the Investment Company Act of 1940. |
| | |
| Taxable-Equivalent Yield: The yield necessary from a fully taxable investment to equal, on an after-tax basis, the yield of a municipal bond investment. |
| | |
| Zero Coupon Bond: A zero coupon bond does not pay a regular interest coupon to its holders during the life of the bond. Tax-exempt income to the holder of the bond comes from accretion of the difference between the original purchase price of the bond at issuance and the par value of the bond at maturity and is effectively paid at maturity. The market prices of zero coupon bonds generally are more volatile than the market prices of bonds that pay interest periodically. |
Other Useful Information
| Board of |
| Directors/Trustees |
| John P. Amboian |
| Robert P. Bremner |
| Jack B. Evans |
| William C. Hunter |
| David J. Kundert |
| William J. Schneider |
| Judith M. Stockdale |
| Carole E. Stone |
| Virginia L. Stringer |
| Terence J. Toth |
| |
| Fund Manager |
| Nuveen Fund Advisers, Inc. |
| 333 West Wacker Drive |
| Chicago, IL 60606 |
| |
| Custodian |
| State Street Bank |
| & Trust Company |
| Boston, MA |
| |
| Transfer Agent and |
| Shareholder Services |
| State Street Bank & Trust |
| Company |
| Nuveen Funds |
| P.O. Box 43071 |
| Providence, RI 02940-3071 |
| (800) 257-8787 |
| |
| Legal Counsel |
| Chapman and Cutler LLP |
| Chicago, IL |
| |
| Independent Registered |
| Public Accounting Firm |
| Ernst & Young LLP |
| Chicago, IL |
Quarterly Portfolio of Investments and Proxy Voting Information
You may obtain (i) each Fund’s quarterly portfolio of investments, (ii) information regarding how the Funds voted proxies relating to portfolio securities held during the most recent twelve-month period ended June 30, and (iii) a description of the policies and procedures that the Funds used to determine how to vote proxies relating to portfolio securities without charge, upon request, by calling Nuveen Investments toll-free at (800) 257-8787 or on Nuveen’s website at www.nuveen.com.
You may also obtain this and other Fund information directly from the Securities and Exchange Commission (SEC). The SEC may charge a copying fee for this information. Visit the SEC on-line at http://www.sec.gov or in person at the SEC’s Public Reference Room in Washington, D.C. Call the SEC at (202) 942-8090 for room hours and operation. You may also request Fund information by sending an e-mail request to publicinfo@sec.gov or by writing to the SEC’s Public References Section at 100 F Street NE, Washington, D.C. 20549.
CEO Certification Disclosure
Each Fund’s Chief Executive Officer (CEO) has submitted to the New York Stock Exchange (NYSE) the annual CEO certification as required by Section 303A.12(a) of the NYSE Listed Company Manual.
Each Fund has filed with the SEC the certification of its Chief Executive Officer and Chief Financial Officer required by Section 302 of the Sarbanes-Oxley Act.
Common and Preferred Share Information
Each Fund intends to repurchase and/or redeem shares of its own common and/or auction rate preferred stock in the future at such times and in such amounts as is deemed advisable. During the period covered by this report, the Funds repurchased and/or redeemed shares of their common and/or auction rate preferred stock as shown in the accompanying table.
| | | | Auction Rate |
| | Common Shares | | Preferred Shares |
| Fund | Repurchased | | Redeemed |
| NPP | — | | 16,796 |
| NMA | — | | — |
| NMO | — | | — |
| NAD | — | | 4,803 |
| NXZ | — | | — |
| NZF | — | | 9,478 |
Any future repurchases will be reported to shareholders in the next annual or semi-annual report.
Nuveen Investments:
Serving Investors for Generations
Since 1898, financial advisors and their clients have relied on Nuveen Investments to provide dependable investment solutions through continued adherence to proven, long-term investing principles. Today, we offer a range of high quality equity and fixed-income solutions designed to be integral components of a well-diversified core portfolio.
Focused on meeting investor needs.
Nuveen Investments is a global investment management firm that seeks to help secure the long-term goals of institutions and high net worth investors as well as the consultants and financial advisors who serve them. We market our growing range of specialized investment solutions under the high-quality brands of NWQ, Nuveen Asset Management, Santa Barbara, Symphony, Tradewinds and Winslow Capital. In total, Nuveen Investments managed approximately $207 billion of assets as of October 31, 2011.
Find out how we can help you.
To learn more about how the products and services of Nuveen Investments may be able to help you meet your financial goals, talk to your financial advisor, or call us at (800) 257-8787. Please read the information provided carefully before you invest. Investors should consider the investment objective and policies, risk considerations, charges and expenses of any investment carefully. Where applicable, be sure to obtain a prospectus, which contains this and other relevant information. To obtain a prospectus, please contact your securities representative or Nuveen Investments, 333 W. Wacker Dr., Chicago, IL 60606. Please read the prospectus carefully before you invest or send money.
Learn more about Nuveen Funds at: www.nuveen.com/cef
Distributed by
Nuveen Securities,LLC
333 West Wacker Drive
Chicago, IL 60606
www.nuveen.com
EAN-B-1011D