| |
| UNITED STATES |
| SECURITIES AND EXCHANGE COMMISSION |
| Washington, D.C. 20549 |
|
| FORM N-CSR |
|
| CERTIFIED SHAREHOLDER REPORT OF REGISTERED |
|
| MANAGEMENT INVESTMENT COMPANIES |
|
| Investment Company Act file number 811- 5968 |
|
| John Hancock Municipal Securities Trust |
| (Exact name of registrant as specified in charter) |
|
| 601 Congress Street, Boston, Massachusetts 02210 |
| (Address of principal executive offices) (Zip code) |
|
| Salvatore Schiavone |
| Treasurer |
|
| 601 Congress Street |
|
| Boston, Massachusetts 02210 |
| |
| (Name and address of agent for service) |
|
| Registrant's telephone number, including area code: 617-663-4497 |
| |
| Date of fiscal year end: | May 31 |
| |
| Date of reporting period: | November 30, 2010 |
ITEM 1. REPORTS TO STOCKHOLDERS.

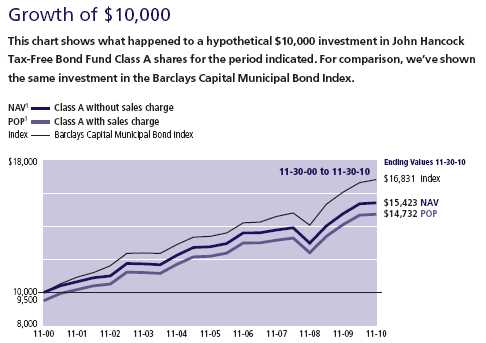
A look at performance
For the period ended November 30, 2010
| | | | | | | | |
| | Average annual total returns (%) | Cumulative total returns (%) | | SEC 30-day |
| | with maximum sales charge (POP) | with maximum sales charge (POP) | | yield (%) |
| | | | | | | | | as of |
| | 1-year | 5-year | 10-year | 6-months | 1-year | 5-year | 10-year | 11-30-10 |
|
| Class A | –0.21 | 2.91 | 3.95 | –4.14 | –0.21 | 15.40 | 47.32 | 3.24 |
|
| Class B | –1.30 | 2.74 | 3.80 | –4.91 | –1.30 | 14.48 | 45.26 | 2.64 |
|
| Class C | 2.59 | 3.06 | 3.63 | –1.09 | 2.59 | 16.28 | 42.80 | 2.64 |
|
Performance figures assume all distributions are reinvested. Public offering price (POP) figures reflect maximum sales charges on Class A shares of 4.5% and the applicable contingent deferred sales charge (CDSC) on Class B shares and Class C shares. The returns for Class C shares have been adjusted to reflect the elimination of the front-end sales charge effective 7-15-04. The Class B shares’ CDSC declines annually between years 1 to 6 according to the following schedule: 5, 4, 3, 3, 2, 1%. No sales charge will be assessed after the sixth year. Class C shares held for less than one year are subject to a 1% CDSC.
The expense ratios of the Fund, both net (including any fee waivers or expense limitations) and gross (excluding any fee waivers or expense limitations), are set forth according to the most recent publicly available prospectus for the Fund and may differ from the expense ratios disclosed in the Financial Highlights tables in this report. The net expenses equal the gross expenses and are as follows: Class A — 0.96%, Class B — 1.71% and Class C — 1.71%.
The returns reflect past results and should not be considered indicative of future performance. The return and principal value of an investment will fluctuate so that shares, when redeemed, may be worth more or less than their original cost. Due to market volatility, the Fund’s current performance may be higher or lower than the performance shown. For current to the most recent month end performance data, please call 1–800–225–5291 or visit the Fund’s Web site at www.jhfunds.com.
The performance table above and the chart on the next page do not reflect the deduction of taxes that a shareholder may pay on fund distributions or on the redemption of fund shares. Please note that a portion of the Fund’s income may be subject to taxes, and some investors may be subject to the Alternative Minimum Tax (AMT). Also note that capital gains are taxable.
The Fund’s performance results reflect any applicable fee waivers or expense reductions, without which the expenses would increase and results would have been less favorable.
| |
| 6 | Tax-Free Bond Fund | Semiannual report |
| | | | |
| | Period | Without | With maximum | |
| | beginning | sales charge | sales charge | Index |
|
| Class B2 | 11-30-00 | $14,526 | $14,526 | $16,831 |
|
| Class C2 | 11-30-00 | 14,280 | 14,280 | 16,831 |
|
Assuming all distributions were reinvested for the period indicated, the table above shows the value of a $10,000 investment in the Fund’s Class B and Class C shares, respectively, as of 11-30-10. The Class C shares investment with maximum sales charge has been adjusted to reflect the elimination of the front-end sales charge effective 7-15-04. Performance of the classes will vary based on the difference in sales charges paid by shareholders investing in the different classes and the fee structure of those classes.
Barclays Capital Municipal Bond Index is an unmanaged index representative of the tax-exempt bond market.
It is not possible to invest directly in an index. Index figures do not reflect sales charges or direct expenses, which would have resulted in lower values if they did.
1 NAV represents net asset value and POP represents public offering price.
2 No contingent deferred sales charge applicable.
| | |
| | Semiannual report | Tax-Free Bond Fund | 7 |
Your expenses
These examples are intended to help you understand your ongoing operating expenses.
Understanding fund expenses
As a shareholder of the Fund, you incur two types of costs:
▪ Transaction costs which include sales charges (loads) on purchases or redemptions (varies by share class), minimum account fee charge, etc.
▪ Ongoing operating expenses including management fees, distribution and service fees (if applicable), and other fund expenses.
We are going to present only your ongoing operating expenses here.
Actual expenses/actual returns
This example is intended to provide information about your fund’s actual ongoing operating expenses, and is based on your fund’s actual return. It assumes an account value of $1,000.00 on June 1, 2010 with the same investment held until November 30, 2010.
| | | |
| | Account value | Ending value | Expenses paid during |
| | on 6-1-10 | on 11-30-10 | period ended 11-30-101 |
|
| Class A | $1,000.00 | $1,003.70 | $4.82 |
|
| Class B | 1,000.00 | 1,000.00 | 8.52 |
|
| Class C | 1,000.00 | 999.00 | 8.52 |
|
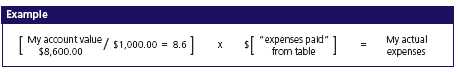
Together with the value of your account, you may use this information to estimate the operating expenses that you paid over the period. Simply divide your account value at November 30, 2010, by $1,000.00, then multiply it by the “expenses paid” for your share class from the table above. For example, for an account value of $8,600.00, the operating expenses should be calculated as follows:
| |
| 8 | Tax-Free Bond Fund | Semiannual report |
Hypothetical example for comparison purposes
This table allows you to compare your fund’s ongoing operating expenses with those of any other fund. It provides an example of the Fund’s hypothetical account values and hypothetical expenses based on each class’s actual expense ratio and an assumed 5% annualized return before expenses (which is not your fund’s actual return). It assumes an account value of $1,000.00 on June 1, 2010, with the same investment held until November 30, 2010. Look in any other fund shareholder report to find its hypothetical example and you will be able to compare these expenses.
| | | |
| | Account value | Ending value | Expenses paid during |
| | on 6-1-10 | on 11-30-10 | period ended 11-30-101 |
|
| Class A | $1,000.00 | $1,020.30 | $4.86 |
|
| Class B | 1,000.00 | 1,016.50 | 8.59 |
|
| Class C | 1,000.00 | 1,016.50 | 8.59 |
|
Remember, these examples do not include any transaction costs, therefore, these examples will not help you to determine the relative total costs of owning different funds. If transaction costs were included, your expenses would have been higher. See the prospectus for details regarding transaction costs.
1 Expenses are equal to the Fund’s annualized expense ratio of 0.96%, 1.70% and 1.70% for Class A, Class B and Class C shares, respectively, multiplied by the average account value over the period, multiplied by 183/365 (to reflect the one-half year period).
| | |
| | Semiannual report | Tax-Free Bond Fund | 9 |
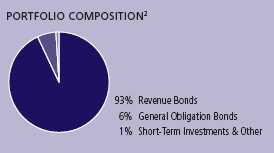
Portfolio summary
| | | | |
| Top 10 Holdings1 | | | | |
|
| Foothill Eastern Transportation Corridor Agency, Zero, 1-1-19 | 4.8% |
|
| Madera County Certificates of Participation, 6.500%, 3-15-15 | 2.9% |
|
| New York City Municipal Water Finance Authority, 5.000%, 6-15-39 | 2.0% |
|
| Commonwealth of Massachusetts, 5.500%, 12-1-24 | 1.9% |
|
| San Joaquin Hills Transportation Corridor Agency, 5.650%, 1-15-17 | 1.9% |
|
| Triborough Bridge & Tunnel Authority, 5.000%, 11-15-33 | 1.9% |
|
| San Bernardino County, 5.500%, 8-1-17 | | | 1.7% |
|
| Port Authority of New York & New Jersey, 6.750%, 10-1-19 | 1.7% |
|
| South Carolina State Public Service Authority, 5.000%, 1-1-40 | 1.7% |
|
| JEA Electric System Revenue, 5.000%, 10-1-38 | | | 1.6% |
|
| |
| Sector Composition2,3 | | | | |
|
| General Obligation Bonds | 6% | | Development | 5% |
| |
|
| Revenue Bonds | | | Pollution | 5% |
| |
|
| Transportation | 21% | | Water & Sewer | 5% |
| |
|
| Utilities | 17% | | Education | 4% |
| |
|
| Health Care | 7% | | Facilities | 2% |
| |
|
| Tobacco | 6% | | Other Revenue | 16% |
| |
|
| Airport | 5% | | Short-Term Investments & Other | 1% |
| |
|
| | |
| Quality Composition2,4 | | |
| |
| AAA | 26% | |
| |
| AA | 35% | |
| |
| A | 20% | |
| |
| BBB | 13% | |
| |
| BB | 5% | |
| |
| Short-Term Investments & Other | 1% | |
| |
1 As a percentage of net assets on 11-30-10. Cash and cash equivalents not included in Top 10 Holdings.
2 As a percentage of net assets on 11-30-10.
3 Investments focused on one sector may fluctuate more widely than investments across multiple sectors. Because the Fund may focus on particular sectors, its performance may depend on the performance of those sectors.
4 Ratings are from Moody’s Investor Services, Inc. If not available, we have used S&P ratings. In the absence of ratings from these agencies, we have used Fitch, Inc. ratings. “Not Rated” securities are those with no ratings available. They may have internal ratings similar to those shown. All are as of 11-30-10 and do not reflect subsequent downgrades, if any.
| |
| 10 | Tax-Free Bond Fund | Semiannual report |
Fund’s investments
As of 11-30-10 (unaudited)
| | | | | |
| | | | Maturity | | |
| | Rate (%) | | date | Par value | Value |
| Municipal Bonds 98.68% | | | | | $486,362,134 |
|
| (Cost $456,499,028) | | | | | |
| |
| Alabama 0.42% | | | | | 2,066,153 |
|
| Birmingham Special Care Facilities | | | | | |
| Financing Authority, Childrens Hospital | 6.125 | | 06-01-34 | $2,000,000 | 2,066,153 |
| |
| Arizona 2.70% | | | | | 13,327,392 |
|
| Arizona Health Facilities Authority, | | | | | |
| Phoenix Memorial Hospital (H) | 8.200 | | 06-01-21 | 2,150,000 | 22 |
|
| Maricopa County Pollution Control Corp., | | | | | |
| El Paso Electric Co. Project, Series B | 7.250 | | 04-01-40 | 1,000,000 | 1,114,240 |
|
| Phoenix Civic Improvement Corp. District, | | | | | |
| Series B (Zero Coupon Steps up to | | | | | |
| 5.500% on 7-1-13) (D) | Zero | | 07-01-28 | 1,000,000 | 916,730 |
|
| Salt River Project Agricultural Improvement & | | | | | |
| Power District Electric System, | | | | | |
| Electric, Power & Light Revenues, Series A | 5.000 | | 01-01-33 | 7,000,000 | 7,205,800 |
|
| Salt River Project Agricultural Improvement & | | | | | |
| Power District Electric System, | | | | | |
| Electric, Power & Light Revenues, Series A | 5.000 | | 01-01-39 | 4,000,000 | 4,090,600 |
| |
| California 16.78% | | | | | 82,721,505 |
|
| Foothill Eastern Transportation | | | | | |
| Corridor Agency, | | | | | |
| Highway Revenue Tolls | Zero | | 01-15-25 | 5,000,000 | 1,843,550 |
|
| Foothill Eastern Transportation | | | | | |
| Corridor Agency, Highway Revenue Tolls, | | | | | |
| Escrowed to Maturity, Series A | Zero | | 01-01-19 | 30,000,000 | 23,787,900 |
|
| Los Angeles Department of Water & Power, | | | | | |
| Electric, Power & Light Revenues, Series A | 5.000 | | 07-01-39 | 3,490,000 | 3,538,511 |
|
| M-S-R Energy Authority, | | | | | |
| Natural Gas Revenue, Series B | 7.000 | | 11-01-34 | 2,500,000 | 2,874,625 |
|
| Madera County Certificates of Participation | 6.500 | | 03-15-15 | 13,185,000 | 14,099,775 |
|
| San Bernardino County, | | | | | |
| Medical Center Financial Project, Series B (D) | 5.500 | | 08-01-17 | 8,195,000 | 8,504,689 |
|
| San Bernardino County, | | | | | |
| Medical Center Financing Project | 5.500 | | 08-01-22 | 2,500,000 | 2,640,600 |
|
| San Diego Redevelopment Agency, | | | | | |
| City Heights, Series A | 5.750 | | 09-01-23 | 25,000 | 23,867 |
|
| San Joaquin Hills Transportation | | | | | |
| Corridor Agency, Highway Revenue Tolls, | | | | | |
| Escrowed to Maturity | Zero | | 01-01-14 | 5,000,000 | 4,812,850 |
| | |
| See notes to financial statements | Semiannual report | Tax-Free Bond Fund | 11 |
| | | | | |
| | | | Maturity | | |
| | Rate (%) | | date | Par value | Value |
| California (continued) | | | | | |
|
| San Joaquin Hills Transportation | | | | | |
| Corridor Agency, Highway Revenue Tolls, | | | | | |
| Escrowed to Maturity | Zero | | 01-01-17 | $4,900,000 | $4,307,198 |
|
| San Joaquin Hills Transportation | | | | | |
| Corridor Agency, Highway Revenue Tolls, | | | | | |
| Escrowed to Maturity | Zero | | 01-01-20 | 2,000,000 | 1,506,900 |
|
| San Joaquin Hills Transportation | | | | | |
| Corridor Agency, Highway Revenue Tolls, | | | | | |
| Series A | 5.650 | | 01-15-17 | 10,000,000 | 9,481,000 |
|
| Santa Ana Financing Authority, | | | | | |
| Police Administration & Holdings Facility, | | | | | |
| Series A (D) | 6.250 | | 07-01-19 | 2,000,000 | 2,296,020 |
|
| State of California, Highway Improvements | 5.500 | | 03-01-40 | 3,000,000 | 3,004,020 |
| |
| Colorado 3.03% | | | | | 14,911,757 |
|
| Colorado Springs Utilities Revenue, Series C | 5.250 | | 11-15-42 | 2,825,000 | 2,936,616 |
|
| Denver, Colorado City & County Airport | | | | | |
| Revenue, Series A | 5.250 | | 11-15-36 | 5,000,000 | 5,096,500 |
|
| Northwest Parkway Public Highway Authority, | | | | | |
| Highway Revenue Tolls, Prerefunded to | | | | | |
| 6-15-11, Series D | 7.125 | | 06-15-41 | 2,865,000 | 3,018,106 |
|
| Public Authority for Colorado Energy, | | | | | |
| Natural Gas Revenue | 6.250 | | 11-15-28 | 3,500,000 | 3,860,535 |
| |
| Connecticut 0.63% | | | | | 3,129,510 |
|
| Connecticut State Health & Educational | | | | | |
| Facility Authority, Yale University, Series Z3 | 5.050 | | 07-01-42 | 3,000,000 | 3,129,510 |
| |
| District of Columbia 4.10% | | | | | 20,230,013 |
|
| District of Columbia | 6.500 | | 05-15-33 | 5,000,000 | 5,064,900 |
|
| Metropolitan Washington DC Airports | | | | | |
| Authority, Highway Revenue Tolls (D) | Zero | | 10-01-33 | 6,565,000 | 1,578,423 |
|
| Metropolitan Washington DC Airports | | | | | |
| Authority, Highway Revenue Tolls (D) | Zero | | 10-01-35 | 6,470,000 | 1,318,004 |
|
| Metropolitan Washington DC Airports | | | | | |
| Authority, Highway Revenue Tolls (D) | Zero | | 10-01-36 | 7,250,000 | 1,381,778 |
|
| Metropolitan Washington DC Airports | | | | | |
| Authority, Highway Revenue Tolls, Series A | 5.250 | | 10-01-44 | 4,500,000 | 4,592,115 |
|
| Metropolitan Washington DC Airports | | | | | |
| Authority, Highway Revenue Tolls, | | | | | |
| Series C (Zero Coupon Steps up to 6.500% | | | | | |
| on 10-1-16) (D) | Zero | | 10-01-41 | 1,750,000 | 1,287,143 |
|
| Metropolitan Washington DC Airports | | | | | |
| Authority, Series C | 5.125 | | 10-01-39 | 5,000,000 | 5,007,650 |
| |
| Florida 7.05% | | | | | 34,732,697 |
|
| Bonnet Creek Resort Community | | | | | |
| Development District | 7.250 | | 05-01-18 | 1,000,000 | 926,450 |
|
| Bonnet Creek Resort Community | | | | | |
| Development District | 7.375 | | 05-01-34 | 1,500,000 | 1,287,960 |
|
| Capital Projects Finance Authority, | | | | | |
| College & University Revenue, Series G | 9.125 | | 10-01-11 | 690,000 | 602,846 |
|
| Capital Trust Agency, Seminole Tribe | | | | | |
| Convention, Prerefunded to 10-1-12, | | | | | |
| Series A (S) | 8.950 | | 10-01-33 | 3,000,000 | 3,473,670 |
| | |
| 12 | Tax-Free Bond Fund | Semiannual report | See notes to financial statements |
| | | | | |
| | | | Maturity | | |
| | Rate (%) | | date | Par value | Value |
| Florida (continued) | | | | | |
|
| Crossings at Fleming Island Community | | | | | |
| Development District, Recreations Facilities | | | | | |
| Improvements, Series C | 7.100 | | 05-01-30 | $1,000,000 | $996,790 |
|
| Hernando County, Criminal Justice (D) | 7.650 | | 07-01-16 | 500,000 | 603,675 |
|
| JEA Electric System Revenue, Series | | | | | |
| Three — D-2 | 5.000 | | 10-01-38 | 8,000,000 | 8,130,800 |
|
| Miami-Dade County Aviation Revenue, | | | | | |
| Miami International Airport, Series A-1 | 5.375 | | 10-01-41 | 3,000,000 | 3,019,590 |
|
| Miami-Dade County Aviation Revenue, | | | | | |
| Miami International Airport, Series A | 5.500 | | 10-01-36 | 3,250,000 | 3,308,890 |
|
| Miami-Dade County Water & Sewer Revenue, | | | | | |
| Water Revenue | 5.000 | | 10-01-34 | 5,000,000 | 5,007,350 |
|
| Orange County School Board, School | | | | | |
| Improvements, Series A (D) | Zero | | 08-01-13 | 5,000,000 | 4,782,900 |
|
| Orlando Utilities Commission, Electric, Power & | | | | | |
| Light Revenues, Escrowed to Maturity, | | | | | |
| Series D | 6.750 | | 10-01-17 | 2,200,000 | 2,591,776 |
| |
| Georgia 2.36% | | | | | 11,612,207 |
|
| Atlanta Tax Allocation, Eastside Project, | | | | | |
| Series B | 5.600 | | 01-01-30 | 1,000,000 | 950,490 |
|
| Georgia Municipal Electric Authority, | | | | | |
| Electric, Power & Light Revenues, Escrowed | | | | | |
| to Maturity, Series Y (D) | 6.500 | | 01-01-17 | 145,000 | 170,129 |
|
| Georgia Municipal Electric Authority, | | | | | |
| Electric, Power & Light Revenues, Escrowed | | | | | |
| to Maturity, Series Z (D) | 5.500 | | 01-01-20 | 150,000 | 169,802 |
|
| Georgia Municipal Electric Authority, | | | | | |
| Electric, Power & Light Revenues, | | | | | |
| Prerefunded to 1-1-14, Series 2005 (D) | 6.500 | | 01-01-17 | 60,000 | 70,063 |
|
| Georgia Municipal Electric Authority, | | | | | |
| Electric, Power & Light Revenues, Series BB | 5.700 | | 01-01-19 | 980,000 | 1,108,449 |
|
| Georgia Municipal Electric Authority, | | | | | |
| Electric, Power & Light Revenues, Series C (D) | 5.700 | | 01-01-19 | 4,895,000 | 5,505,994 |
|
| Georgia Municipal Electric Authority, | | | | | |
| Electric, Power & Light Revenues, Series EE (D) | 7.250 | | 01-01-24 | 2,000,000 | 2,585,680 |
|
| Monroe County Development Authority, | | | | | |
| Oglethorpe Power Corp., Series A | 6.800 | | 01-01-12 | 1,000,000 | 1,051,600 |
| |
| Illinois 3.61% | | | | | 17,785,581 |
|
| Chicago Board of Education, Series A | 5.500 | | 12-01-30 | 3,650,000 | 3,898,237 |
|
| Chicago Tax Increment Revenue, | | | | | |
| Pilsen Redevelopment, Series B | 6.750 | | 06-01-22 | 3,000,000 | 2,962,320 |
|
| Illinois Development Finance Authority, | | | | | |
| Edison Project (D) | 5.850 | | 01-15-14 | 3,000,000 | 3,285,060 |
|
| Illinois Finance Authority, | | | | | |
| Rush University Medical Center, Series A | 7.250 | | 11-01-38 | 1,500,000 | 1,669,665 |
|
| Lake County Community Consolidated School | | | | | |
| District No: 24 | Zero | | 01-01-22 | 2,440,000 | 1,399,145 |
|
| Round Lake Lakewood Grove Special Service | | | | | |
| Area No: 1, Prerefunded to 3-1-13 | 6.700 | | 03-01-33 | 1,000,000 | 1,130,320 |
|
| Will County Community Unit School District | | | | | |
| No: 365 | Zero | | 11-01-21 | 5,780,000 | 3,440,834 |
| | |
| See notes to financial statements | Semiannual report | Tax-Free Bond Fund | 13 |
| | | | | |
| | | | Maturity | | |
| | Rate (%) | | date | Par value | Value |
| Indiana 0.65% | | | | | $3,210,900 |
|
| Indiana Finance Authority, Duke Energy, | | | | | |
| Series B | 6.000 | | 08-01-39 | $3,000,000 | 3,210,900 |
| |
| Kentucky 2.01% | | | | | 9,923,483 |
|
| Kentucky Economic Development | | | | | |
| Finance Authority, Louisville Arena, | | | | | |
| Series A-1 (D) | 6.000 | | 12-01-33 | 1,000,000 | 1,055,530 |
|
| Kentucky Economic Development | | | | | |
| Finance Authority, Norton Healthcare, | | | | | |
| Prerefunded to 10-1-13, Series C (D) | 6.100 | | 10-01-21 | 1,770,000 | 2,043,306 |
|
| Kentucky Economic Development | | | | | |
| Finance Authority, Norton Healthcare, | | | | | |
| Series C (D) | 6.100 | | 10-01-21 | 3,230,000 | 3,384,717 |
|
| Kentucky State Property & | | | | | |
| Buildings Commission, Project No: 93 (D) | 5.250 | | 02-01-29 | 3,250,000 | 3,439,930 |
| |
| Louisiana 0.83% | | | | | 4,079,660 |
|
| Louisiana Local Government | | | | | |
| Environmental Facilities, Westlake Chemical | | | | | |
| Corp. Projects | 6.750 | | 11-01-32 | 2,500,000 | 2,556,800 |
|
| Louisiana Local Government | | | | | |
| Environmental Facilities, Westlake Chemical | | | | | |
| Corp. Projects, Series A | 6.500 | | 11-01-35 | 1,500,000 | 1,522,860 |
| |
| Massachusetts 7.08% | | | | | 34,883,337 |
|
| Commonwealth of Massachusetts, Series C | 5.500 | | 12-01-24 | 8,000,000 | 9,524,960 |
|
| Massachusetts Bay Transportation Authority, | | | | | |
| Sales Tax Revenue, Series A-2 | Zero | | 07-01-26 | 13,595,000 | 6,724,087 |
|
| Massachusetts Development Finance Agency, | | | | | |
| Harvard University, Series B | 5.000 | | 10-15-40 | 2,500,000 | 2,645,675 |
|
| Massachusetts Health & Educational | | | | | |
| Facilities Authority, Civic Investments, | | | | | |
| Prerefunded to 12-15-12, Series B | 9.200 | | 12-15-31 | 3,500,000 | 4,111,905 |
|
| Massachusetts Health & Educational | | | | | |
| Facilities Authority, Partners HealthCare, | | | | | |
| Series C | 5.750 | | 07-01-32 | 85,000 | 86,387 |
|
| Massachusetts State Department of | | | | | |
| Transportation, Highway Revenue Tolls | 5.000 | | 01-01-37 | 5,000,000 | 5,014,250 |
|
| Massachusetts Water Pollution Abatement, | | | | | |
| Series A | 6.375 | | 02-01-15 | 75,000 | 75,353 |
|
| Massachusetts Water Resources Authority, | | | | | |
| Water Revenue, Series A | 5.000 | | 08-01-40 | 6,500,000 | 6,700,720 |
| |
| Michigan 0.23% | | | | | 1,132,210 |
|
| Detroit Water Supply System Revenue, | | | | | |
| Water Revenue, Second Lien, Series B | 7.000 | | 07-01-36 | 1,000,000 | 1,132,210 |
| |
| Missouri 0.62% | | | | | 3,034,854 |
|
| Fenton Tax Increment Revenue, Public | | | | | |
| Improvements, Prerefunded to 10-1-11 | 7.000 | | 10-01-21 | 955,000 | 1,014,134 |
|
| Missouri State Health & Educational | | | | | |
| Facilities Authority, Children’s Mercy Hospital | 5.625 | | 05-15-39 | 2,000,000 | 2,020,720 |
| | |
| 14 | Tax-Free Bond Fund | Semiannual report | See notes to financial statements |
| | | | | |
| | | | Maturity | | |
| | Rate (%) | | date | Par value | Value |
| Nebraska 1.30% | | | | | $6,415,259 |
|
| Central Plains Energy Project Revenue, | | | | | |
| Natural Gas Revenue, Series A | 5.250 | | 12-01-20 | $4,970,000 | 5,014,283 |
|
| Omaha Public Power District, Electric, Power & | | | | | |
| Light Revenues, Escrowed to Maturity, | | | | | |
| Series B | 6.200 | | 02-01-17 | 1,200,000 | 1,400,976 |
| | | | | | |
| New Hampshire 0.26% | | | | | 1,276,138 |
|
| New Hampshire Health & Education | | | | | |
| Facilities Authority, Exeter Project | 6.000 | | 10-01-24 | 1,250,000 | 1,276,138 |
| | | | | | |
| New Jersey 4.43% | | | | | 21,816,661 |
|
| New Jersey State Turnpike Authority, | | | | | |
| Highway Revenue Tolls, Series I | 5.000 | | 01-01-35 | 3,750,000 | 3,837,825 |
|
| New Jersey State Turnpike Authority, Series E | 5.250 | | 01-01-40 | 4,500,000 | 4,643,325 |
|
| Tobacco Settlement Financing Corp., | | | | | |
| Prerefunded to 6-1-13 | 6.250 | | 06-01-43 | 4,000,000 | 4,540,920 |
|
| Tobacco Settlement Financing Corp., | | | | | |
| Prerefunded to 6-1-13 | 6.750 | | 06-01-39 | 5,000,000 | 5,738,000 |
|
| Tobacco Settlement Financing Corp., Series 1A | 4.500 | | 06-01-23 | 3,420,000 | 3,056,591 |
| | | | | | |
| New York 14.60% | | | | | 71,951,359 |
|
| Brooklyn Arena Local Development Corp., | | | | | |
| Barclays Center Project | 6.000 | | 07-15-30 | 2,500,000 | 2,556,150 |
|
| Brooklyn Arena Local Development Corp., | | | | | |
| Barclays Center Project | 6.250 | | 07-15-40 | 2,000,000 | 2,065,780 |
|
| New York City Industrial Development Agency, | | | | | |
| 7 World Trade Center, Series A | 6.250 | | 03-01-15 | 2,000,000 | 2,000,540 |
|
| New York City Industrial Development Agency, | | | | | |
| Terminal One Group Association Project | | | | | |
| AMT (P) | 5.500 | | 01-01-24 | 1,500,000 | 1,514,475 |
|
| New York City Municipal Water Finance | | | | | |
| Authority, Water Revenue, Series 2009-EE | 5.250 | | 06-15-40 | 5,000,000 | 5,202,250 |
|
| New York City Municipal Water Finance | | | | | |
| Authority, Water Revenue, Series GG-1 | 5.000 | | 06-15-39 | 10,000,000 | 10,237,100 |
|
| New York City Transitional Finance Authority, | | | | | |
| Government Fund/Grant Revenue, Series S-4 | 5.500 | | 01-15-39 | 2,995,000 | 3,203,093 |
|
| New York City Transitional Finance Authority, | | | | | |
| Income Tax Revenue, Series A (Zero Coupon | | | | | |
| Steps up to 14.000% on 11-1-11) | Zero | | 11-01-29 | 5,000,000 | 4,932,650 |
|
| New York City Transitional Finance Authority, | | | | | |
| Income Tax Revenue, Series S-3 | 5.250 | | 01-15-39 | 3,000,000 | 3,097,920 |
|
| New York City Transitional Finance Authority, | | | | | |
| Income Tax Revenue, Series S-3 | 5.375 | | 01-15-34 | 2,000,000 | 2,109,520 |
|
| New York Liberty Development Corp., | | | | | |
| Goldman Sachs Headquarters | 5.250 | | 10-01-35 | 3,500,000 | 3,499,755 |
|
| New York State Dormitory Authority, | | | | | |
| College & University Revenue, Series B | 7.500 | | 05-15-11 | 145,000 | 149,431 |
|
| New York State Dormitory Authority, | | | | | |
| Income Tax Revenue, Series A | 5.000 | | 02-15-39 | 2,500,000 | 2,552,125 |
|
| New York State Dormitory Authority, | | | | | |
| State University Education Facilities, Series A | 5.500 | | 05-15-19 | 1,000,000 | 1,148,360 |
|
| New York State Housing Finance Agency, | | | | | |
| College & University Revenue, Escrowed to | | | | | |
| Maturity, Series A | 8.000 | | 05-01-11 | 245,000 | 251,836 |
| | |
| See notes to financial statements | Semiannual report | Tax-Free Bond Fund | 15 |
| | | | | |
| | | | Maturity | | |
| | Rate (%) | | date | Par value | Value |
| New York (continued) | | | | | |
|
| Port Authority of New York & New Jersey, | | | | | |
| 144th Construction Project | 5.000 | | 10-01-29 | $3,500,000 | $3,632,405 |
|
| Port Authority of New York & New Jersey, | | | | | |
| 163rd Construction Project | 5.000 | | 07-15-39 | 3,500,000 | 3,591,280 |
|
| Port Authority of New York & New Jersey, | | | | | |
| 5th Installment Special Project AMT | 6.750 | | 10-01-19 | 8,700,000 | 8,330,772 |
|
| Triborough Bridge & Tunnel Authority, | | | | | |
| Highway Revenue Tolls | 5.000 | | 11-15-33 | 9,025,000 | 9,261,997 |
|
| Westchester Tobacco Asset Securitization | | | | | |
| Corp., Public Improvements, Prerefunded | | | | | |
| to 7-15-17 | 6.950 | | 07-15-39 | 2,000,000 | 2,613,920 |
| | | | | | |
| Ohio 0.94% | | | | | 4,641,960 |
|
| Buckeye Ohio Tobacco Settlement Financing | | | | | |
| Authority, Series A-2 | 5.125 | | 06-01-24 | 4,330,000 | 3,559,000 |
|
| Ohio Air Quality Development Authority, | | | | | |
| FirstEnergy Solutions Corp., Series C AMT (P) | 7.250 | | 11-01-32 | 1,000,000 | 1,082,960 |
| | | | | | |
| Oklahoma 0.83% | | | | | 4,094,400 |
|
| Grand River Dam Authority, Series A | 5.250 | | 06-01-40 | 2,000,000 | 2,034,420 |
|
| Tulsa Municipal Airport Trust Trustees, | | | | | |
| Series A AMT | 7.750 | | 06-01-35 | 2,000,000 | 2,059,980 |
| | | | | | |
| Oregon 1.38% | | | | | 6,794,679 |
|
| Clackamas County School District No. 12, | | | | | |
| Series B (Zero Coupon Steps up to 5.000% | | | | | |
| on 6-15-11) | Zero | | 06-15-28 | 5,630,000 | 5,710,002 |
|
| Western Generation Agency, Wauna | | | | | |
| Cogeneration Project, Series B AMT | 5.000 | | 01-01-14 | 1,100,000 | 1,084,677 |
| | | | | | |
| Pennsylvania 3.60% | | | | | 17,718,780 |
|
| Allegheny County Hospital | | | | | |
| Development Authority, | | | | | |
| West Penn Health Systems, Series A | 5.000 | | 11-15-28 | 3,500,000 | 2,547,965 |
|
| Allegheny County Redevelopment Authority, | | | | | |
| Pittsburgh Mills Project | 5.600 | | 07-01-23 | 1,000,000 | 924,180 |
|
| Carbon County Industrial Development | | | | | |
| Authority, Panther Creek Partners | | | | | |
| Project AMT | 6.700 | | 05-01-12 | 4,960,000 | 4,955,090 |
|
| Luzerne County Industrial Development | | | | | |
| Authority, Amern Water Company | 5.500 | | 12-01-39 | 1,000,000 | 1,013,460 |
|
| Pennsylvania Turnpike Commission, Series C | Zero | | 12-01-38 | 4,000,000 | 784,240 |
|
| Philadelphia Authority for Industrial | | | | | |
| Development, Commercial | | | | | |
| Development AMT | 7.750 | | 12-01-17 | 3,250,000 | 3,252,925 |
|
| Philadelphia School District, Series E | 6.000 | | 09-01-38 | 4,000,000 | 4,240,920 |
| | | | | | |
| Puerto Rico 4.13% | | | | | 20,355,814 |
|
| Commonwealth of Puerto Rico, | | | | | |
| Income Tax Revenue (D)(P) | 10.852 | | 07-01-11 | 4,900,000 | 5,180,280 |
|
| Puerto Rico Aqueduct & Sewer Authority, | | | | | |
| Water Revenue (D) | 6.000 | | 07-01-11 | 200,000 | 206,706 |
|
| Puerto Rico Aqueduct & Sewer Authority, | | | | | |
| Water Revenue (D)(P) | 11.026 | | 07-01-11 | 3,300,000 | 3,521,298 |
|
| Puerto Rico Public Buildings Authority, | | | | | |
| Government Facilities, Series P | 6.750 | | 07-01-36 | 3,000,000 | 3,273,000 |
| | |
| 16 | Tax-Free Bond Fund | Semiannual report | See notes to financial statements |
| | | | | |
| | | | Maturity | | |
| | Rate (%) | | date | Par value | Value |
| Puerto Rico (continued) | | | | | |
|
| Puerto Rico Sales Tax Financing Authority, | | | | | |
| Sales Tax Revenue, Series A (Zero coupon | | | | | |
| Steps up to 6.750% on 8-1-16) | Zero | | 08-01-32 | $4,000,000 | $3,249,880 |
|
| Puerto Rico Sales Tax Financing Corp., | | | | | |
| Sales Tax Revenue, Series C | 5.250 | | 08-01-41 | 5,000,000 | 4,924,650 |
| | | | | | |
| Rhode Island 0.17% | | | | | 857,934 |
|
| Town of Tiverton, Mount Hope Bay Village, | | | | | |
| Series A | 6.875 | | 05-01-22 | 900,000 | 857,934 |
| | | | | | |
| South Carolina 3.64% | | | | | 17,961,576 |
|
| Richland County, International Paper | | | | | |
| Company AMT | 6.100 | | 04-01-23 | 3,325,000 | 3,366,596 |
|
| South Carolina State Public Service Authority, | | | | | |
| Santee Cooper, Series A | 5.500 | | 01-01-38 | 6,000,000 | 6,419,460 |
|
| South Carolina State Public Service Authority, | | | | | |
| Santee Cooper, Series E | 5.000 | | 01-01-40 | 8,000,000 | 8,175,520 |
| | | | | | |
| South Dakota 1.02% | | | | | 5,025,100 |
|
| Educational Enhancement Funding Corp., | | | | | |
| Series B | 6.500 | | 06-01-32 | 5,000,000 | 5,025,100 |
| | | | | | |
| Texas 7.32% | | | | | 36,086,580 |
|
| Bexar County Health Facilities Development | | | | | |
| Corp., Army Retirement Residence Project, | | | | | |
| Prerefunded to 7-1-12 | 6.300 | | 07-01-32 | 1,000,000 | 1,091,860 |
|
| Brazos River Authority, TXU Energy Company, | | | | | |
| Series A AMT | 8.250 | | 10-01-30 | 2,000,000 | 740,020 |
|
| Dallas Waterworks & Sewer System Revenue | 5.000 | | 10-01-35 | 5,000,000 | 5,160,500 |
|
| Harris County, Highway Revenue Tolls, Series C | 5.000 | | 08-15-49 | 5,000,000 | 4,850,700 |
|
| Houston Independent School District Public | | | | | |
| Financing Corp., Cesar Chavez Project, | | | | | |
| Series A (D) | Zero | | 09-15-16 | 900,000 | 771,930 |
|
| Lower Colorado River Authority | 5.625 | | 05-15-39 | 4,000,000 | 4,176,240 |
|
| Lower Colorado River Authority, | | | | | |
| Electric, Power & Light Revenues | 5.000 | | 05-15-40 | 5,000,000 | 5,003,600 |
|
| Mission Economic Development Corp., | | | | | |
| Allied Waste, Inc. Project, Series A AMT | 5.200 | | 04-01-18 | 1,000,000 | 1,010,260 |
|
| North Texas Tollway Authority, | | | | | |
| Highway Revenue Tolls, Series K-2 | 6.000 | | 01-01-38 | 4,000,000 | 4,066,280 |
|
| North Texas Tollway Authority, Series A | 6.000 | | 01-01-25 | 3,000,000 | 3,197,250 |
|
| Texas Municipal Power Agency Revenue | 5.000 | | 09-01-40 | 6,000,000 | 6,017,940 |
| | | | | | |
| Utah 0.15% | | | | | 725,107 |
|
| Salt Lake City, IHC Hospital, Inc., Escrowed to | | | | | |
| Maturity, Series A | 8.125 | | 05-15-15 | 635,000 | 725,107 |
| | | | | | |
| Washington 0.38% | | | | | 1,896,210 |
|
| Washington Public Power Supply Systems, | | | | | |
| Electric, Power & Light Revenues, Series B | 7.125 | | 07-01-16 | 1,500,000 | 1,896,210 |
| | | | | | |
| Wisconsin 0.44% | | | | | 2,148,860 |
|
| State of Wisconsin, Series A | 5.750 | | 05-01-33 | 2,000,000 | 2,148,860 |
| | | | | | |
| Wyoming 0.65% | | | | | 3,201,360 |
|
| Campbell County Solid Waste Facilities | | | | | |
| Revenue, Basin Electric Power Company, | | | | | |
| Series A | 5.750 | | 07-15-39 | 3,000,000 | 3,201,360 |
| | |
| See notes to financial statements | Semiannual report | Tax-Free Bond Fund | 17 |
| | | | | |
| | | | Maturity | | |
| | Rate (%) | | date | Par value | Value |
| Other 1.34% | | | | | $6,613,098 |
|
| Charter MAC Equity Issuer Trust, | | | | | |
| Series A–4-1 AMT (S) | 5.750 | | 05-15-15 | $3,000,000 | 3,185,520 |
|
| Municipal Mortgage & Equity, LLC AMT (P)(S) | 7.500 | | 06-30-49 | 3,731,104 | 3,427,578 |
|
| |
| |
| Short-Term Investments 0.65% | | | | | $3,194,000 |
|
| (Cost $3,194,000) | | | | | |
| | | | | | |
| | | | | Par value | Value |
| Repurchase Agreement 0.65% | | | | | 3,194,000 |
|
| Repurchase Agreement with State Street Corp. dated 11-30-10 | | | | |
| at 0.010% to be repurchased at $3,194,001 on 12-1-10, | | | | |
| collateralized by $2,925,000 Federal Home Loan Mortgage Corp., | | |
| 4.500% due 7-15-13 (valued at $3,261,375, including interest) | | | $3,194,000 | 3,194,000 |
|
| |
| Total investments (Cost $459,693,028)† 99.33% | | | | $489,556,134 |
|
| |
| Other assets and liabilities, net 0.67% | | | | $3,294,950 |
|
| |
| Total net assets 100.00% | | | | | $492,851,084 |
|
The percentage shown for each investment category is the total value of that category as a percentage of the net assets of the Fund.
AMT Interest earned from these securities may be considered a tax preference item for purpose of the Federal Alternative Minimum Tax.
(D) Bond is insured by one of these companies:
| | | |
| Insurance Coverage | As a % of total investments | |
| |
| Ambac Financial Group, Inc. | | 3.43% | |
| Assured Guaranty Corp. | | 2.06% | |
| Financial Guaranty Insurance Company | | 1.16% | |
| National Public Finance Guarantee Insurance Corp. | 10.31% | |
(H) Non-income producing — Issuer is in default.
(P) Variable rate obligation. The coupon rate shown represents the rate at period end.
(S) These securities are exempt from registration under Rule 144A of the Securities Act of 1933. Such securities may be resold, normally to qualified institutional buyers, in transactions exempt from registration.
† At 11-30-10, the aggregate cost of investment securities for federal income tax purposes was $457,072,554. Net unrealized appreciation aggregated $32,483,580, of which $39,287,751 related to appreciated investment securities and $6,804,171 related to depreciated investment securities.
| | |
| 18 | Tax-Free Bond Fund | Semiannual report | See notes to financial statements |
Notes to Schedule of Investments (continued)
The portfolio had the following sector composition as a percentage of total net assets on 11-30-10:
| | | |
| | | Value as a | |
| | | percentage of | |
| Sector composition | | Fund’s net assets | |
| General Obligation Bonds | | 6% | |
| Revenue Bonds | | | |
| Transportation | | 21% | |
| Utilities | | 17% | |
| Health Care | | 7% | |
| Tobacco | | 6% | |
| Airport | | 5% | |
| Development | | 5% | |
| Pollution | | 5% | |
| Water & Sewer | | 5% | |
| Education | | 4% | |
| Facilities | | 2% | |
| Other Revenue | | 16% | |
| Short-Term Investments & Other | | 1% | |
| | |
| See notes to financial statements | Semiannual report | Tax-Free Bond Fund | 19 |
F I N A N C I A L S T A T E M E N T S
Financial statements
Statement of assets and liabilities 11-30-10 (unaudited)
This Statement of Assets and Liabilities is the Fund’s balance sheet. It shows the value of what the Fund owns, is due and owes. You’ll also find the net asset value and the maximum offering price per share.
| |
| Assets | |
|
| Investments, at value (Cost $459,693,028) | $489,556,134 |
| Cash | 724 |
| Receivable for investments sold | 975,430 |
| Receivable for fund shares sold | 649,570 |
| Interest receivable | 7,010,123 |
| Other receivables and prepaid assets | 92,837 |
| | |
| Total assets | 498,284,818 |
| |
| Liabilities | |
|
| Payable for investments purchased | 4,392,321 |
| Payable for fund shares repurchased | 377,136 |
| Distributions payable | 486,996 |
| Payable to affiliates | |
| Accounting and legal services fees | 5,481 |
| Transfer agent fees | 28,063 |
| Distribution and service fees | 36,304 |
| Trustees’ fees | 44,172 |
| Other liabilities and accrued expenses | 63,261 |
| | |
| Total liabilities | 5,433,734 |
| |
| Net assets | |
|
| Capital paid-in | $486,030,689 |
| Undistributed net investment income | 1,663,695 |
| Accumulated net realized loss on investments | (24,706,406) |
| Net unrealized appreciation (depreciation) on investments | 29,863,106 |
| | |
| Net assets | $492,851,084 |
| |
| Net asset value per share | |
|
| Based on net asset values and shares outstanding — the Fund has an | |
| unlimited number of shares authorized with no par value | |
| Class A ($439,485,553 ÷ 44,911,205 shares) | $9.79 |
| Class B ($8,936,539 ÷ 913,173 shares)1 | $9.79 |
| Class C ($44,428,992 ÷ 4,540,562 shares)1 | $9.78 |
| |
| Maximum offering price per share | |
|
| Class A (net asset value per share ÷ 95.5%)2 | $10.25 |
1 Redemption price is equal to net asset value less any applicable contingent deferred sales charge.
2 On single retail sales of less than $100,000. On sales of $100,000 or more and on group sales the offering price is reduced.
| | |
| 20 | Tax-Free Bond Fund | Semiannual report | See notes to financial statements |
F I N A N C I A L S T A T E M E N T S
Statement of operations For the six-month period ended 11-30-10 (unaudited)
This Statement of Operations summarizes the Fund’s investment income earned and expenses incurred in operating the Fund. It also shows net gains (losses) for the period stated.
| |
| Investment income | |
|
| Interest | $13,453,206 |
| |
| Expenses | |
|
| Investment management fees (Note 4) | 1,372,546 |
| Distribution and service fees (Note 4) | 816,847 |
| Accounting and legal services fees (Note 4) | 36,067 |
| Transfer agent fees (Note 4) | 192,702 |
| Trustees’ fees (Note 4) | 23,635 |
| State registration fees | 25,405 |
| Printing and postage | 20,837 |
| Professional fees | 30,922 |
| Custodian fees | 35,454 |
| Registration and filing fees | 11,499 |
| Other | 12,144 |
| | |
| Total expenses | 2,578,058 |
| | |
| Net investment income | 10,875,148 |
| |
| Realized and unrealized loss | |
|
| Net realized loss on investments | (1,068,592) |
| Change in net unrealized appreciation (depreciation) of investments | (8,431,783) |
| | |
| Net realized and unrealized loss | (9,500,375) |
| |
| Increase in net assets from operations | $1,374,773 |
| | |
| See notes to financial statements | Semiannual report | Tax-Free Bond Fund | 21 |
F I N A N C I A L S T A T E M E N T S
Statements of changes in net assets
These Statements of Changes in Net Assets show how the value of the Fund’s net assets has changed during the last two periods. The difference reflects earnings less expenses, any investment gains and losses, distributions, if any, paid to shareholders and the net of Fund share transactions.
| | |
| | Six months | |
| | ended | Year |
| | 11-30-10 | ended |
| | (Unaudited) | 5-31-10 |
| Increase (decrease) in net assets | | |
|
| From operations | | |
| Net investment income | $10,875,148 | $21,591,591 |
| Net realized gain (loss) | (1,068,592) | 3,917,641 |
| Change in net unrealized appreciation (depreciation) | (8,431,783) | 16,829,443 |
| | | |
| Increase in net assets resulting from operations | 1,374,773 | 42,338,675 |
| | | |
| Distributions to shareholders | | |
| From net investment income | | |
| Class A | (9,818,282) | (19,877,142) |
| Class B | (169,517) | (395,884) |
| Class C | (760,910) | (1,253,985) |
| | | |
| Total distributions | (10,748,709) | (21,527,011) |
| | | |
| From Fund share transactions (Note 5) | 15,204,072 | 16,263,207 |
| | | |
| Total increase | 5,830,136 | 37,074,871 |
| |
| Net assets | | |
|
| Beginning of period | 487,020,948 | 449,946,077 |
| | | |
| End of period | $492,851,084 | $487,020,948 |
| | | |
| Undistributed net investment income | $1,663,695 | $1,537,256 |
| | |
| 22 | Tax-Free Bond Fund | Semiannual report | See notes to financial statements |
Financial highlights
The Financial Highlights show how the Fund’s net asset value for a share has changed since the end of the previous period.
| | | | | | | |
| CLASS A SHARES Period ended | 11-30-101 | 5-31-10 | 5-31-092 | 8-31-08 | 8-31-07 | 8-31-06 | 8-31-053 |
| | | | | | | | |
| Per share operating performance | | | | | | | |
|
| Net asset value, beginning | | | | | | | |
| of period | $9.97 | $9.53 | $9.82 | $9.95 | $10.24 | $10.41 | $10.22 |
| Net investment income4 | 0.22 | 0.45 | 0.35 | 0.45 | 0.45 | 0.47 | 0.48 |
| Net realized and unrealized gain | | | | | | | |
| (loss) on investments | (0.18) | 0.44 | (0.30) | (0.13) | (0.29) | (0.18) | 0.19 |
| Total from investment operations | 0.04 | 0.89 | 0.05 | 0.32 | 0.16 | 0.29 | 0.67 |
| Less distributions | | | | | | | |
| From net investment income | (0.22) | (0.45) | (0.34) | (0.45) | (0.45) | (0.46) | (0.48) |
| Net asset value, end of period | $9.79 | $9.97 | $9.53 | $9.82 | $9.95 | $10.24 | $10.41 |
| Total return (%)5 | 0.376 | 9.567 | 0.666 | 3.257 | 1.557 | 2.877 | 6.72 |
| |
| Ratios and supplemental data | | | | | | | |
|
| Net assets, end of period (in millions) | $439 | $440 | $411 | $417 | $434 | $459 | $487 |
| Ratios (as a percentage of average | | | | | | | |
| net assets): | | | | | | | |
| Expenses before reductions | 0.968 | 0.98 | 1.028,9 | 0.96 | 0.95 | 0.96 | 0.99 |
| Interest and fees10 | — | — | — | 0.06 | 0.08 | — | — |
| Expenses net of fee waivers | 0.968 | 0.98 | 1.028,9 | 1.02 | 1.03 | 0.96 | 0.99 |
| Net investment income | 4.438 | 4.64 | 5.058 | 4.53 | 4.45 | 4.54 | 4.71 |
| Portfolio turnover (%) | 8 | 28 | 36 | 36 | 40 | 54 | 32 |
| | |
1 Semiannual period from 6-1-10 to 11-30-10. Unaudited.
2 For the nine-month period ended 5-31-09. The Fund changed its fiscal year end from August 31 to May 31.
3 Audited by previous independent registered public accounting firm.
4 Based on the average daily shares outstanding.
5 Does not reflect the effect of sales charges, if any.
6 Not annualized.
7 Total returns would have been lower had certain expenses not been reduced during the periods shown.
8 Annualized.
9 Includes the impact of proxy expenses, which amounted to 0.04% of average net assets.
10 Interest expenses and fees are related to the Fund’s investment in inverse floater rate investments. Under accounting rules, the Fund recognizes additional income in an amount equal to these expenses.
| | |
| See notes to financial statements | Semiannual report | Tax-Free Bond Fund | 23 |
| | | | | | | |
| CLASS B SHARES Period ended | 11-30-101 | 5-31-10 | 5-31-092 | 8-31-08 | 8-31-07 | 8-31-06 | 8-31-053 |
| | | | | | | | |
| Per share operating performance | | | | | | | |
|
| Net asset value, beginning | | | | | | | |
| of period | $9.97 | $9.53 | $9.82 | $9.95 | $10.24 | $10.41 | $10.22 |
| Net investment income4 | 0.19 | 0.38 | 0.29 | 0.38 | 0.38 | 0.39 | 0.41 |
| Net realized and unrealized gain | | | | | | | |
| (loss) on investments | (0.19) | 0.44 | (0.29) | (0.14) | (0.30) | (0.18) | 0.18 |
| Total from investment operations | — | 0.82 | — | 0.24 | 0.08 | 0.21 | 0.59 |
| Less distributions | | | | | | | |
| From net investment income | (0.18) | (0.38) | (0.29) | (0.37) | (0.37) | (0.38) | (0.40) |
| Net asset value, end of period | $9.79 | $9.97 | $9.53 | $9.82 | $9.95 | $10.24 | $10.41 |
| Total return (%)5 | —6,7 | 8.748 | 0.106 | 2.478 | 0.808 | 2.108 | 5.93 |
| |
| Ratios and supplemental data | | | | | | | |
|
| Net assets, end of period | | | | | | | |
| (in millions) | $9 | $10 | $11 | $13 | $16 | $21 | $32 |
| Ratios (as a percentage of average | | | | | | | |
| net assets): | | | | | | | |
| Expenses before reductions | 1.709 | 1.74 | 1.779,10 | 1.71 | 1.70 | 1.71 | 1.74 |
| Interest and fees11 | — | — | — | 0.06 | 0.08 | — | — |
| Expenses net of fee waivers | 1.709 | 1.73 | 1.779,10 | 1.77 | 1.78 | 1.71 | 1.74 |
| Net investment income | 3.689 | 3.89 | 4.299 | 3.77 | 3.69 | 3.79 | 3.96 |
| Portfolio turnover (%) | 8 | 28 | 36 | 36 | 40 | 54 | 32 |
| |
1 Semiannual period from 6-1-10 to 11-30-10. Unaudited.
2 For the nine-month period ended 5-31-09. The Fund changed its fiscal year end from August 31 to May 31.
3 Audited by previous independent registered public accounting firm.
4 Based on the average daily shares outstanding.
5 Does not reflect the effect of sales charges, if any.
6 Not annualized.
7 Less than (0.005%).
8 Total returns would have been lower had certain expenses not been reduced during the periods shown.
9 Annualized.
10 Includes the impact of proxy expenses, which amounted to 0.04% of average net assets.
11 Interest expenses and fees are related to the Fund’s investment in inverse floater rate investments. Under accounting rules, the Fund recognizes additional income in an amount equal to these expenses.
| | |
| 24 | Tax-Free Bond Fund | Semiannual report | See notes to financial statements |
| | | | | | | |
| CLASS C SHARES Period ended | 11-30-101 | 5-31-10 | 5-31-092 | 8-31-08 | 8-31-07 | 8-31-06 | 8-31-053 |
| | | | | | | | |
| Per share operating performance | | | | | | | |
|
| Net asset value, beginning | | | | | | | |
| of period | $9.97 | $9.53 | $9.82 | $9.95 | $10.24 | $10.41 | $10.22 |
| Net investment income4 | 0.18 | 0.38 | 0.29 | 0.38 | 0.37 | 0.39 | 0.41 |
| Net realized and unrealized gain | | | | | | | |
| (loss) on investments | (0.19) | 0.44 | (0.29) | (0.14) | (0.29) | (0.18) | 0.18 |
| Total from investment operations | (0.01) | 0.82 | — | 0.24 | 0.08 | 0.21 | 0.59 |
| Less distributions | | | | | | | |
| From net investment income | (0.18) | (0.38) | (0.29) | (0.37) | (0.37) | (0.38) | (0.40) |
| Net asset value, end of period | $9.78 | $9.97 | $9.53 | $9.82 | $9.95 | $10.24 | $10.41 |
| Total return (%)5 | (0.10)6 | 8.747 | 0.106 | 2.477 | 0.807 | 2.107 | 5.93 |
| |
| Ratios and supplemental data | | | | | | | |
|
| Net assets, end of period | | | | | | | |
| (in millions) | $44 | $38 | $27 | $13 | $7 | $7 | $7 |
| Ratios (as a percentage of average | | | | | | | |
| net assets): | | | | | | | |
| Expenses before reductions | 1.708 | 1.73 | 1.778,9 | 1.71 | 1.70 | 1.71 | 1.74 |
| Interest and fees10 | — | — | — | 0.06 | 0.08 | — | — |
| Expenses net of fee waivers | 1.708 | 1.73 | 1.778,9 | 1.77 | 1.78 | 1.71 | 1.74 |
| Net investment income | 3.678 | 3.88 | 4.318 | 3.78 | 3.70 | 3.79 | 3.96 |
| Portfolio turnover (%) | 8 | 28 | 36 | 36 | 40 | 54 | 32 |
| |
1 Semiannual period from 6-1-10 to 11-30-10. Unaudited.
2 For the nine-month period ended 5-31-09. The Fund changed its fiscal year end from August 31 to May 31.
3 Audited by previous independent registered public accounting firm.
4 Based on the average daily shares outstanding.
5 Does not reflect the effect of sales charges, if any.
6 Not annualized.
7 Total returns would have been lower had certain expenses not been reduced during the periods shown.
8 Annualized.
9 Includes the impact of proxy expenses, which amounted to 0.04% of average net assets.
10 Interest expenses and fees are related to the Fund’s investment in inverse floater rate investments. Under accounting rules, the Fund recognizes additional income in an amount equal to these expenses.
| | |
| See notes to financial statements | Semiannual report | Tax-Free Bond Fund | 25 |
Notes to financial statements
(unaudited)
Note 1 — Organization
John Hancock Tax-Free Bond Fund (the Fund) is a diversified series of John Hancock Municipal Securities Trust (the Trust), an open-end management investment company organized as a Massachusetts business trust and registered under the Investment Company Act of 1940, as amended (the 1940 Act). The investment objective of the Fund is to seek as high a level of interest income exempt from federal income tax as is consistent with preservation of capital.
The Fund may offer multiple classes of shares. The shares currently offered are detailed in the Statement of Assets and Liabilities. Class A, Class B and Class C shares are offered to all investors. Shareholders of each class have exclusive voting rights to matters that affect that class. The distribution and service fees, if any, and transfer agent fees for each class may differ. Class B shares convert to Class A shares eight years after purchase.
Note 2 — Significant accounting policies
The financial statements have been prepared in conformity with accounting principles generally accepted in the United States of America, which require management to make certain estimates and assumptions at the date of the financial statements. Actual results could differ from those estimates. Events or transactions occurring after the end of the fiscal period through the date that the financial statements were issued have been evaluated in the preparation of the financial statements. The following summarizes the significant accounting policies of the Fund:
Security valuation. Investments are stated at value as of the close of regular trading on the New York Stock Exchange (NYSE), normally at 4:00 P.M., Eastern Time. The Fund uses a three-tier hierarchy to prioritize the pricing assumptions, referred to as inputs, used in valuation techniques to measure fair value. Level 1 includes quoted prices in active markets for identical securities. Level 2 includes significant observable inputs. Observable inputs may include quoted prices for similar securities, interest rates, prepayment speeds and credit risk. Prices for securities valued using these techniques are received from independent pricing vendors and brokers and are based on an evaluation of the inputs described. Level 3 includes significant unobservable inputs when market prices are not readily available or reliable, including the Fund’s own assumptions in determining the fair value of investments. The inputs or methodology used for valuing securities are not necessarily an indication of the risk associated with investing in those securities.
As of November 30, 2010, all investments are categorized as Level 2 under the hierarchy described above. During the six month period ended November 30, 2010, there were no significant transfers in or out of Level 2 assets.
In order to value the securities, the Fund uses the following valuation techniques. Debt obligations are valued based on the evaluated prices provided by an independent pricing service, which utilizes both dealer-supplied and electronic data processing techniques, taking into account factors such as institutional-size trading in similar groups of securities, yield, quality, coupon rate, maturity, type of issue, trading characteristics and other market data. Certain securities traded only in the over-the-counter market are valued at the last bid price quoted by brokers making markets in the securities at the close of trading. Certain short-term securities are valued at amortized cost. Other portfolio securities and assets, where market quotations are not readily available, are valued at fair value, as determined in good faith by the Fund’s Pricing Committee, following procedures established by the Board of Trustees.
| |
| 26 | Tax-Free Bond Fund | Semiannual report |
Repurchase agreements. The Fund may enter into repurchase agreements. When a Fund enters into a repurchase agreement it receives collateral which is held in a segregated account by the Fund’s custodian. The collateral amount is marked-to-market and monitored on a daily basis to ensure that the collateral held is in an amount not less than the principal amount of the repurchase agreement plus any accrued interest. In the event of a default by the counterparty, realization of the collateral proceeds could be delayed, during which time the collateral value may decline.
Security transactions and related investment income. Investment security transactions are accounted for on a trade date plus one basis for daily net asset value calculations. However, for financial reporting purposes, investment transactions are reported on trade date. Interest income is accrued as earned. Gains and losses on securities sold are determined on the basis of identified cost and may include proceeds from litigation. Interest income includes coupon interest and amortization/accretion of premiums/discounts on debt securities. Debt obligations may be placed in a non-accrual status and related interest income may be reduced by stopping current accruals and writing off interest receivables when the collection of all or a portion of interest has become doubtful.
Line of credit. The Fund may borrow from banks for temporary or emergency purposes, including meeting redemption requests that otherwise might require the untimely sale of securities. Pursuant to the custodian agreement, the custodian may loan money to a Fund to make properly authorized payments. The Fund is obligated to repay the custodian for any overdraft, including any related costs or expenses. The custodian has a lien, security interest or security entitlement in any Fund property that is not segregated, to the maximum extent permitted by law for any overdraft.
In addition, the Fund and other affiliated funds have entered into an agreement with State Street Bank and Trust Company which enables them to participate in a $100 million unsecured committed line of credit. A commitment fee, payable at the end of each calendar quarter, based on the average daily unused portion of the line of credit, is charged to each participating fund on a pro rata basis and is reflected in other expenses on the Statement of Operations. For the six months ended November 30, 2010, the Fund had no borrowings under the line of credit.
Expenses. The majority of expenses are directly attributable to an individual fund. Expenses that are not readily attributable to a specific fund are allocated among all funds in an equitable manner, taking into consideration, among other things, the nature and type of expense and the fund’s relative assets. Expense estimates are accrued in the period to which they relate and adjustments are made when actual amounts are known.
Class allocations. Income, common expenses, and realized and unrealized gains (losses) are determined at the fund level and allocated daily to each class of shares based on the net asset value of the class. Class-specific expenses, such as distribution and service fees, if any, and transfer agent fees, for all classes, are calculated daily at the class level based on the appropriate net asset value of each class and the specific expense rates applicable to each class.
Federal income taxes. The Fund intends to qualify as a regulated investment company by complying with the applicable provisions of the Internal Revenue Code and will not be subject to federal income tax on taxable income that is distributed to shareholders. Therefore, no federal income tax provision is required.
For federal income tax purposes, the Fund has a capital loss carryforward of $23,617,849 available to offset future net realized capital gains as of May 31, 2010. The following table details the capital loss carryforward available as of May 31, 2010.
| | |
| | Semiannual report | Tax-Free Bond Fund | 27 |
| | | | | |
| CAPITAL LOSS CARRYFORWARD EXPIRING AT MAY 31 | | | |
| |
| 2011 | 2012 | 2015 | 2016 | 2017 | 2018 |
|
| $7,431,104 | $6,837,618 | $257,214 | $209,653 | $5,383,181 | $3,499,079 |
As of May 31, 2010, the Fund had no uncertain tax positions that would require financial statement recognition, de-recognition or disclosure. The Fund’s federal tax return is subject to examination by the Internal Revenue Service for a period of three years.
Distribution of income and gains. Distributions to shareholders from net investment income and net realized gains, if any, are recorded on the ex-date. The Fund generally declares dividends daily and pays them monthly. Capital gain distributions, if any, are distributed annually.
Distributions paid by the Fund with respect to each class of shares are calculated in the same manner, at the same time and are in the same amount, except for the effect of expenses that may be applied differently to each class.
Such distributions, on a tax basis, are determined in conformity with income tax regulations, which may differ from accounting principles generally accepted in the United States of America. Material distributions in excess of tax basis earnings and profits, if any, are reported in the Fund’s financial statements as a return of capital.
Capital accounts within financial statements are adjusted for permanent book-tax differences. These adjustments have no impact on net assets or the results of operations. Temporary book-tax differences will reverse in a subsequent period. Permanent book-tax differences are primarily attributable to amortization and accretion of debt securities.
Note 3 — Guarantees and indemnifications
Under the Fund’s organizational documents, its Officers and Trustees are indemnified against certain liabilities arising out of the performance of their duties to the Fund. Additionally, in the normal course of business, the Fund enters into contracts with service providers that contain general indemnification clauses. The Fund’s maximum exposure under these arrangements is unknown, as this would involve future claims that may be made against the Fund that have not yet occurred. The risk of material loss from such claims is considered remote.
Note 4 — Fees and transactions with affiliates
John Hancock Advisers, LLC (the Adviser) serves as investment adviser for the Fund. John Hancock Funds, LLC (the Distributor), an affiliate of the Adviser, serves as principal underwriter of the Fund. The Adviser and the Distributor are indirect wholly owned subsidiaries of Manulife Financial Corporation (MFC).
Management fee. The Fund has an investment management contract with the Adviser under which the Fund pays a daily management fee to the Adviser equivalent, on an annual basis, to the sum of: (a) 0.55% of the first $500,000,000 of the Fund’s average daily net assets, (b) 0.50% of the next $500,000,000, (c) 0.45% of the next $2,000,000,000 and (d) 0.425% of the Fund’s average daily net assets in excess of $3,000,000,000. The Adviser has a subadvisory agreement with John Hancock Asset Management a division of Manulife Asset Management (US) LLC (formerly MFC Global Investment Management (U.S.), LLC), an indirect owned subsidiary of MFC and an affiliate of the Adviser. The Fund is not responsible for payment of the subadvisory fees.
The investment management fees incurred for the six months ended November 30, 2010 were equivalent to an annual effective rate of 0.55% of the Fund’s average daily net assets.
Accounting and legal services. Pursuant to the service agreement, the Fund reimburses the Adviser for all expenses associated with providing the administrative, financial, legal, accounting and
| |
| 28 | Tax-Free Bond Fund | Semiannual report |
recordkeeping services of the Fund, including the preparation of all tax returns, periodic reports to shareholders and regulatory reports, among other services. These expenses are allocated to each share class based on its relative net assets at the time the expense was incurred. The accounting and legal services fees incurred for the six months ended November 30, 2010, amounted to an annual rate of 0.01% of the Fund’s average daily net assets.
Distribution and service plans. The Fund has a distribution agreement with the Distributor. The Fund has adopted distribution and service plans with respect to Class A, Class B and Class C shares pursuant to Rule 12b-1 under the 1940 Act, to pay the Distributor for services provided as the distributor of shares of the Fund. The Fund may pay up to the following contractual rates of distribution and service fee under these arrangements, expressed as an annual percentage of average daily net assets for each class of the Fund’s shares.
| | | |
| CLASS | 12b–1 FEE | | |
| | |
| Class A | 0.25% | | |
| Class B | 1.00% | | |
| Class C | 1.00% | | |
Sales charges. Class A shares are assessed up-front sales charges, which resulted in payments to the Distributor amounting to $312,307 for the six months ended November 30, 2010. Of this amount, $5,519 was retained and used for printing prospectuses, advertising, sales literature and other purposes, $265,588 was paid as sales commissions to broker-dealers and $41,200 was paid as sales commissions to sales personnel of Signator Investors, Inc. (Signator Investors), a broker-dealer affiliate of the Adviser.
Class B and Class C shares are subject to contingent deferred sales charges (CDSC). Class B shares that are redeemed within six years of purchase are subject to CDSC, at declining rates, beginning at 5.00% of the lesser of the current market value at the time of redemption or the original purchase cost of the shares being redeemed. Class C shares that are redeemed within one year of purchase are subject to a 1.00% CDSC on the lesser of the current market value at the time of redemption or the original purchase cost of the shares being redeemed. Proceeds from CDSCs are used to compensate the Distributor for providing distribution-related services in connection with the sale of these shares. During the six months ended November 30, 2010, CDSCs received by the Distributor amounted to $5,729 and $2,146 for Class B and Class C shares, respectively.
Transfer agent fees. The Fund has a transfer agent agreement with John Hancock Signature Services, Inc. (Signature Services or Transfer Agent), an affiliate of the Adviser. The transfer agent fees paid to Signature Services are determined based on the cost to Signature Services (Signature Services Cost) of providing recordkeeping services. The Signature Services Cost includes a component of allocated John Hancock corporate overhead for providing transfer agent services to the Fund and to all other John Hancock affiliated funds. It also includes out-of-pocket expenses that are comprised of payments made to third-parties for recordkeeping services provided to their clients who invest in one or more John Hancock funds. In addition, Signature Services Cost may be reduced by certain revenues that Signature Services received in connection with the service they provide to the funds. Signature Services Cost is calculated m onthly and allocated, as applicable, to four categories of share classes: Institutional Share Classes, Retirement Share Classes, Municipal Bond Classes and all other Retail Share Classes. Within each of these categories, the applicable costs are allocated to the affected John Hancock affiliated funds and/or classes, based on the relative average daily net assets.
Prior to July 1, 2010, the transfer agent fees were made up of three components:
• The Fund paid a monthly transfer agent fee at an annual rate of 0.01% for all classes, based on each class’s average daily net assets.
| | |
| | Semiannual report | Tax-Free Bond Fund | 29 |
• The Fund paid a monthly fee based on an annual rate of $17.50 per shareholder account for all classes.
• In addition, Signature Services was reimbursed for certain out-of-pocket expenses.
Class level expenses. Class level expenses for the six months ended November 30, 2010 were:
| | | |
| | DISTRIBUTION AND | TRANSFER | |
| CLASS | SERVICE FEES | AGENT FEES | |
| |
| Class A | $560,034 | $172,951 | |
| Class B | 46,730 | 3,622 | |
| Class C | 210,083 | 16,129 | |
| Total | $816,847 | $192,702 | |
Trustee expenses. The Trust compensates each Trustee who is not an employee of the Adviser or its affiliates. These Trustees may, for tax purposes, elect to defer receipt of this compensation under the John Hancock Group of Funds Deferred Compensation Plan (the Plan). Deferred amounts are invested in various John Hancock funds and remain in the funds until distributed in accordance with the Plan. The investment of deferred amounts and the offsetting liability are included within other receivables and prepaid assets and payable to affiliates — Trustees’ fees, respectively, in the accompanying Statement of Assets and Liabilities.
Note 5 — Fund share transactions
Transactions in Fund shares for the six months ended November 30, 2010 and for the year ended May 31, 2010 were as follows:
| | | | |
| | Six months ended 11-30-10 | Year ended 5-31-10 |
| | Shares | Amount | Shares | Amount |
| Class A shares | | | | |
|
| Sold | 2,524,697 | $25,297,059 | 4,875,194 | $47,637,868 |
| Distributions reinvested | 723,587 | 7,250,617 | 1,476,034 | 14,482,920 |
| Repurchased | (2,444,489) | (24,447,707) | (5,376,670) | (52,612,017) |
| | | | | |
| Net increase | 803,795 | $8,099,969 | 974,558 | $9,508,771 |
| |
| Class B shares | | | | |
|
| Sold | 117,072 | $1,174,226 | 249,689 | $2,435,087 |
| Distributions reinvested | 10,952 | 109,729 | 25,681 | 251,664 |
| Repurchased | (173,652) | (1,742,348) | (515,860) | (5,007,125) |
| | | | | |
| Net decrease | (45,628) | ($458,393) | (240,490) | ($2,320,374) |
| |
| Class C shares | | | | |
|
| Sold | 1,043,190 | $10,449,718 | 1,691,925 | $16,571,159 |
| Distributions reinvested | 44,084 | 441,556 | 60,632 | 596,260 |
| Repurchased | (332,423) | (3,328,778) | (828,104) | (8,092,609) |
| | | | | |
| Net increase | 754,851 | $7,562,496 | 924,453 | $9,074,810 |
| |
| Net increase | 1,513,018 | $15,204,072 | 1,658,521 | $16,263,207 |
|
Note 6 — Purchase and sale of securities
Purchases and sales of securities, other than short-term securities, aggregated to $57,243,270 and $42,075,341, respectively, for the six months ended November 30, 2010. Included in the sales amount are sales of variable rate demand notes, which amounted to $550,000. Other short-term securities are excluded from the purchase and sales amount.
| |
| 30 | Tax-Free Bond Fund | Semiannual report |
Board Consideration of and Continuation of Investment Advisory Agreement and Subadvisory Agreement
The Board of Trustees (the Board, the members of which are referred to as Trustees) of John Hancock Tax-Free Bond Fund (the Fund), a series of John Hancock Municipal Securities Trust (the Trust), met in-person on May 2–4 and June 6–8, 2010 to consider the approval of the Fund’s investment advisory agreement (the Advisory Agreement) with John Hancock Advisers, LLC (the Adviser), the Fund’s investment adviser. The Board also considered the approval of the investment subadvisory agreement (the Subadvisory Agreement) among the Adviser, John Hancock Asset Management a division of Manulife Asset Management (US) LLC (the Subadviser) and the Trust on behalf of the Fund. The Advisory Agreement and the Subadvisory Agreement are referred to as the Agreements.
Activities and composition of the Board
The Board consists of eleven individuals, nine of whom are Independent Trustees. Independent Trustees are generally those individuals who are unaffiliated with the Fund, the Adviser and the Subadviser. The Trustees are responsible for the oversight of operations of the Fund and perform the various duties required of directors of investment companies by the Investment Company Act of 1940, as amended (the 1940 Act). The Independent Trustees have retained independent legal counsel to assist them in connection with their duties. The Board has appointed an Independent Trustee as Chairperson. The Board has established four standing committees that are composed entirely of Independent Trustees: the Audit Committee; the Compliance Committee; the Nominating, Governance and Administration Committee; and the Contracts/Operations Committee. Additionally, Investment Performance Committee A is a standing committee of the Board that is composed of Independent Trustees and one Trustee who is affiliated with the Adviser. Investment Performance Committee A oversees and monitors matters relating to the investment performance of the Fund. The Board has also designated a Vice Chairperson to serve in the absence of the Chairperson, who also serves as Chairman of the Board’s Nominating, Governance and Administration Committee. The Board also designates working groups or ad hoc committees as it deems appropriate.
The approval process
Pursuant to the 1940 Act, the Board is required to consider the continuation of the Agreements on an annual basis. Throughout the year, the Board, acting directly and through its committees, regularly reviews and assesses the quality of the services that the Fund receives under these Agreements. In this regard, the Board reviews reports of the Adviser at least quarterly, which include, among other things, Fund performance reports and compliance reports. In addition, the Board meets with portfolio managers and senior investment officers at various times throughout the year. The Board considers at each of its meetings factors that are relevant to its annual consideration of the renewal of the Agreements, including the services and support provided by the Adviser and Subadviser to the Fund and its shareholders.
Prior to the May 2–4, 2010 meeting, the Board requested and received materials specifically relating to the Agreements. The materials provided in connection with the May meeting included information independently compiled and prepared by Morningstar, Inc. (Morningstar) on Fund fees and expenses, and the investment performance of the Fund. This Fund information is assembled in a format that permits comparison with similar information from a category of relevant funds (the Category) and a peer group of comparable funds (the Peer Group) as determined by Morningstar, and its benchmark index. Other material provided for the Fund review included (a) information on the profitability of the Agreements to the Adviser and a discussion of any additional benefits to the Adviser and its affiliates that result from being the Adviser or Subadviser to the Fund; (b) a general analysis provided by the Adviser and the Subadviser concerning investment advisory fees charge d to other clients, such as institutional clients and other investment companies, under similar investment mandates, as well as the performance of such other clients; (c) the impact of economies of scale; (d) a summary of aggregate amounts paid by the Fund to the Adviser; and (e) sales and redemption data regarding the Fund’s shares.
| | |
| | Semiannual report | Tax-Free Bond Fund | 31 |
At an in-person meeting held on May 2–4, 2010, the Board reviewed materials relating to its consideration of the Agreements. As a result of the discussions that occurred during the May 2–4, 2010 meeting, the Board presented the Adviser and Subadviser with questions and requests for additional information and the Adviser and Subadviser responded to these requests with additional written information in advance of the June 6–8, 2010 Board meeting. The Board also reviewed these additional materials relating to its consideration of the Agreements.
At an in-person meeting held on June 6–8, 2010, the Board, including the Independent Trustees, formally considered the continuation of the Advisory Agreement between the Adviser and the Fund and the Subadvisory Agreement among the Adviser, the Subadviser and the Trust on behalf of the Fund, each for an additional one-year term. The Board considered all factors it believed relevant with respect to the Fund, including, among other factors: (a) the nature, extent and quality of the services provided by the Adviser and the Subadviser; (b) the investment performance of the Fund and portfolio management of the Subadviser; (c) the advisory fees and the cost of the services and profits to be realized by the Adviser and certain affiliates from their relationship with the Fund; (d) economies of scale; and (e) other factors.
The Board also considered other matters important to the approval process, such as payments made to the Adviser or its affiliates relating to the distribution of Fund shares and other services. The Board reviewed services related to the valuation and pricing of Fund portfolio holdings. Other important matters considered by the Board were the direct and indirect benefits to the Adviser, the Subadviser, and their affiliates from their relationship with the Fund and advice from independent legal counsel with respect to the review process and materials submitted for the Board’s review. Each Trustee may have attributed different weights to the various items considered.
The key factors considered by the Board and the conclusions reached are described below.
Nature, extent and quality of services
The Board, including the Independent Trustees, reviewed the nature, extent and quality of services provided by the Adviser and the Subadviser, including the investment advisory services and the resulting performance of the Fund. The Board reviewed the Adviser’s and Subadviser’s senior management personnel responsible for investment operations, including the senior investment officers. The Board also reviewed the materials provided by the Fund’s portfolio management team discussing Fund performance and the Fund’s investment objective, strategies and outlook.
The Board considered the ability of the Adviser and the Subadviser, based on their resources, reputation and other attributes, to attract and retain qualified investment professionals, including research, advisory, and supervisory personnel. It considered the background and experience of senior management and investment professionals responsible for managing the Fund. The Board considered the investment philosophy, research and investment decision-making processes of the Adviser and the Subadviser responsible for the daily investment activities of the Fund, including, among other things, portfolio trading capabilities, use of technology, commitment to compliance and approach to training and retaining portfolio managers and other research, advisory and management personnel.
The Board considered the Subadviser’s history and experience with the Fund. The Board considered the Adviser’s execution of its oversight responsibilities. The Board further considered the culture of compliance, resources dedicated to compliance, compliance programs, record of compliance with applicable laws and regulation, with the Fund’s investment policies and restrictions and with the applicable Code of Ethics, and the responsibilities of the Adviser’s and Subadviser’s compliance departments.
In addition to advisory services, the Board considered the quality of the administrative and non-investment advisory services provided to the Fund by the Adviser under a separate agreement.
| |
| 32 | Tax-Free Bond Fund | Semiannual report |
The Board noted that the Adviser and its affiliates provide the Fund with certain administrative, transfer agency, shareholder and other services (in addition to any such services provided to the Fund by third parties) and officers and other personnel as are necessary for the operations of the Fund. The Board reviewed the structure and duties of the Adviser’s administration, accounting, legal and compliance departments and considered the Adviser’s policies and procedures for assuring compliance with applicable laws and regulations.
The Board also received information about the nature, extent and quality of services and fee rates offered by the Adviser and Subadviser to their other clients, including other registered investment companies, institutional investors and separate accounts. The Board reviewed a general analysis provided by the Adviser and the Subadviser concerning investment advisory fees charged to such other clients under similar investment mandates, the services provided to such other clients as compared to the services provided to the Fund, the performance of such other clients, and other factors relating to such other clients. The Board considered the significant differences between the Adviser’s and Subadviser’s services to the Fund and those services they provide to other clients which, to the extent the other client is not a mutual fund, may generally be attributable to the greater frequency of shareholder redemptions in a mutual fund, the higher turnover o f mutual fund assets, the more burdensome regulatory and legal obligations of mutual funds, and the higher marketing costs for mutual funds.
Fund performance
The Board, including the Independent Trustees, reviewed and considered the performance history of the Fund. The Board was provided with reports, independently prepared by Morningstar, which included a comprehensive analysis of the Fund’s performance. The Board also reviewed a narrative and statistical analysis of the Morningstar data that was prepared by the Adviser, which analyzed various factors that may affect the Morningstar rankings. The Board reviewed information regarding the investment performance of the Fund as compared to its Morningstar Category and Peer Group as well as its benchmark index (see chart below). The Board was provided with a description of the methodology used by Morningstar to select the funds in the Category and the Peer Group. The Board also considered updated performance information provided by the Adviser at its May and June 2010 meetings. The Board regularly reviews the performance of the Fund throughout the year and atta ches more importance to performance over relatively longer periods of time, typically three to five years.
| | | | |
| | 1 YEAR | 3 YEAR | 5 YEAR | 10 YEAR |
|
| Tax-Free Bond Fund | 14.34% | 3.27% | 3.76% | 4.83% |
| BarCap Municipal TR Index | 12.91% | 4.41% | 4.32% | 5.75% |
| Muni National Long Category Median | 15.26% | 3.26% | 3.54% | 5.08% |
| Morningstar 15(c) Peer Group Median | 16.51% | 2.67% | 3.21% | 4.88% |
The Board noted that the Subadviser remained consistent with its investment style and adhered to its investment mandates.
Expenses and fees
The Board, including the Independent Trustees, reviewed the Fund’s contractual advisory fee rate payable by the Fund to the Adviser as compared with the other funds in its Category and Peer Group. The Board also received information about the investment subadvisory fee rate payable by the Adviser to the Subadviser for investment subadvisory services. The Board considered the services provided and the fees charged by the Adviser and the Subadviser to other types of clients with similar investment mandates, including separately managed institutional accounts.
In addition, the Board considered the cost of the services provided to the Fund by the Adviser. The Board received and considered expense information regarding the Fund’s various components, including advisory fees, distribution fees and fees other than advisory and distribution fees,
| | |
| Semiannual report | Tax-Free Bond Fund | 33 |
including transfer agent fees, custodian fees, administration fees and other miscellaneous fees (e.g., fees for accounting and legal services). The Board considered comparisons of these expenses to the Peer Group median. The Board also considered expense information regarding the Fund’s total operating expense ratio (Gross Expense Ratio) and total operating expense ratio after taking any fee waiver arrangement applicable to the Advisory Agreement rate into account (Net Expense Ratio). The Board considered information comparing the Gross Expense Ratio and Net Expense Ratio of the Fund to that of the Peer Group and Category medians. As part of its analysis, the Board reviewed the Adviser’s methodology in allocating its costs to the management of the Fund. The Board considered expenses and fee rates to be higher or lower if they were over or under 10 basis points, respectively; slig htly higher or slightly lower if they were above or below 6–10 basis points, respectively; and inline if they were above or below by 5 basis points.
The Board noted that the investment advisory rate was inline with the Category median and slightly higher than the Peer Group median. The Board noted the following information about the Fund’s Gross and Net Expense Ratios in relation with the Fund’s Peer Group and Category:
| | | |
| EXPENSE RATIO | | RELATION TO PEER GROUP | RELATION TO CATEGORY |
|
| Gross Expense Ratio (Class A) | 1.01% | Slightly Higher | Higher |
| Net Expense Ratio (Class A) | 1.00% | Higher | Higher |
The Board also received and considered information relating to the Fund’s Gross Expense Ratio that reflected a proposed change in the methodology for calculating transfer agent fees.
The Board received and reviewed statements relating to the Adviser’s financial condition and profitability with respect to the services it provides the Fund. The Board was also provided with a profitability analysis that detailed the revenues earned and the expenses incurred by the Adviser for services provided to the Fund. The Board reviewed the Adviser’s profitability with respect to the Fund and other funds the Board currently oversees for the year ended December 31, 2009 compared to available aggregate profitability data provided for the year ended December 31, 2008.
The Board received and considered a detailed profitability analysis of the Adviser based on the Advisory Agreement, as well as on other relationships between the Fund and the Adviser and its affiliates. The Board also considered a comparison of the Adviser’s profitability to that of other similar investment advisers whose profitability information is publicly available. The Board reviewed the Adviser’s profitability with respect to other fund complexes managed by the Adviser and/or its affiliates. The Board reviewed the Adviser’s assumptions and methodology of allocating expenses in the profitability analysis, noting the inherent limitations in allocating costs among various advisory products. The Board recognized that profitability may be affected by numerous factors including, among other things, fee waivers and expense reimbursements by the Adviser, the types of funds managed, expense allocations and business mix, and therefore comparabili ty of profitability is somewhat limited.
The Board considered the profitability information with respect to the Subadviser, which is affiliated with the Adviser. In addition, as noted above, the Board considered the methodologies involved in allocating such profit to the Subadviser.
Economies of scale
The Board, including the Independent Trustees, considered the extent to which economies of scale might be realized as the assets of the Fund increase and whether there should be changes in the advisory fee rate or structure in order to enable the Fund to participate in these economies of scale, for example through the use of breakpoints in the advisory fee based upon the assets of the Fund. The Board also considered the Adviser’s overall operations and its efforts to expand the scale of, and improve the quality of, its operations.
| |
| 34 | Tax-Free Bond Fund | Semiannual report |
The Board recognized the inherent limitations of any analysis of economies of scale, stemming largely from the Board’s understanding that most of the Adviser’s costs are not specific to individual funds, but rather are incurred across a variety of products and services. To ensure that any economies are reasonably shared with the Fund as its assets increase, the Adviser and the Board agreed to continue the existing breakpoints to the Agreement fee rate.
Other benefits to the Adviser and the Subadviser
The Board understands that the Adviser, the Subadviser, or their affiliates may derive other ancillary benefits from their relationship with the Fund, both tangible and intangible, such as their ability to leverage investment professionals who manage other portfolios, an increase in their profile in the investment advisory community, and the engagement of their affiliates and/or significant shareholders as service providers to the Fund, including for administrative, transfer agency and distribution services. The Board believes that certain of these benefits are difficult to quantify. The Board also was informed that the Subadviser may use third party research obtained by soft dollars generated by certain mutual fund transactions to assist itself in managing all or a number of its other client accounts.
Board determination
The Board, including the Independent Trustees, unanimously approved the continuation of the Advisory Agreement between the Adviser and the Fund for an additional one-year term and the Subadvisory Agreement among the Adviser, the Subadviser and the Trust on behalf of the Fund for an additional one-year term. Based upon its evaluation of relevant factors in their totality, the Board, including a majority of the Independent Trustees, was satisfied that the terms of the Agreements were fair and reasonable and in the best interest of the Fund and its shareholders. In arriving at a decision to approve the Agreements, the Board did not identify any single factor listed above, or any group of factors listed above, as all-important or controlling, but considered all factors together, and different Trustees may have attributed different weights to the various factors considered. The Independent Trustees were also assisted by the advice of independent legal counsel in making this determination. The Board noted that contractual fee arrangements for the Fund reflect the results of several years of review by the Board and certain predecessor Trustees, and discussions between such Trustees (and predecessor Trustees) and the Adviser. Certain aspects of the arrangements may be the subject of more attention in some years than in others, and the Trustees’ conclusions may be based in part on their consideration of these arrangements in prior years.
| | |
| | Semiannual report | Tax-Free Bond Fund | 35 |
More information
| | |
| Trustees | Investment adviser | |
| Steven R. Pruchansky,* Chairperson*** | John Hancock Advisers, LLC | |
| James F. Carlin | | |
| William H. Cunningham | Subadviser | |
| Deborah C. Jackson* | John Hancock Asset Management | |
| Charles L. Ladner | (formerly MFC Global Investment | |
| Stanley Martin* | Management (U.S.), LLC) | |
| Hugh McHaffie†** | | |
| Dr. John A. Moore | Principal distributor | |
| Patti McGill Peterson | John Hancock Funds, LLC | |
| Gregory A. Russo | | |
| John G. Vrysen† | Custodian | |
| | State Street Bank and Trust Company | |
| Officers | | |
| Keith F. Hartstein | Transfer agent | |
| President and Chief Executive Officer | John Hancock Signature Services, Inc. | |
| | | |
| Andrew G. Arnott | Legal counsel | |
| Senior Vice President** and Chief Operating Officer | K&L Gates LLP | |
|
| |
| Thomas M. Kinzler | The report is certified under the Sarbanes-Oxley | |
| Secretary and Chief Legal Officer | Act, which requires mutual funds and other public | |
| | companies to affirm that, to the best of their | |
| Francis V. Knox, Jr. | knowledge, the information in their financial reports | |
| Chief Compliance Officer | is fairly and accurately stated in all material respects. | |
|
| |
| Charles A. Rizzo | | |
| Chief Financial Officer | | |
| | |
| Salvatore Schiavone** | | |
| Treasurer | | |
| | | |
| *Member of the Audit Committee | | |
| **Effective 8-31-10 | | |
| ***Effective 1-1-11 | | |
| †Non-Independent Trustee | | |
The Fund’s proxy voting policies and procedures, as well as the Fund’s proxy voting record for the most recent twelve-month period ended June 30, are available free of charge on the Securities and Exchange Commission (SEC) Web site at www.sec.gov or on our Web site.
The Fund’s complete list of portfolio holdings, for the first and third fiscal quarters, is filed with the SEC on Form N-Q. The Fund’s Form N-Q is available on our Web site and the SEC’s Web site, www.sec.gov, and can be reviewed and copied (for a fee) at the SEC’s Public Reference Room in Washington, DC. Call 1-800-SEC-0330 to receive information on the operation of the SEC’s Public Reference Room.
We make this information on your fund, as well as monthly portfolio holdings, and other fund details available on our Web site www.jhfunds.com or by calling 1-800-225-5291.
| | |
| You can also contact us: | | |
| 1-800-225-5291 | Regular mail: | Express mail: |
| jhfunds.com | John Hancock Signature Services, Inc. | John Hancock Signature Services, Inc. |
| | P.O. Box 55913 | Mutual Fund Image Operations |
| | Boston, MA 02205-5913 | 30 Dan Road |
| | | Canton, MA 02021 |
| |
| 36 | Tax-Free Bond Fund | Semiannual report |

1-800-225-5291
1-800-554-6713 TDD
1-800-338-8080 EASI-Line
www.jhfunds.com
Now available: electronic delivery
www.jhfunds.com/edelivery
| |
| This report is for the information of the shareholders of John Hancock Tax-Free Bond Fund. | 520SA 11/10 |
| It is not authorized for distribution to prospective investors unless preceded or accompanied by a prospectus. | 1/11 |

A look at performance
For the period ended November 30, 2010
| | | | | | | | |
| | Average annual total returns (%) | Cumulative total returns (%) | | SEC 30-day |
| | with maximum sales charge (POP) | with maximum sales charge (POP) | | yield (%) |
| | | | | | | | | as of |
| | 1-year | 5-year | 10-year | 6-months | 1-year | 5-year | 10-year | 11-30-10 |
|
| Class A | 2.04 | 2.68 | 4.28 | –3.59 | 2.04 | 14.14 | 52.05 | 4.16 |
|
| Class B | 1.07 | 2.52 | 4.14 | –4.36 | 1.07 | 13.23 | 50.00 | 3.59 |
|
| Class C | 5.08 | 2.85 | 3.98 | –0.42 | 5.08 | 15.10 | 47.71 | 3.60 |
|
Performance figures assume all distributions are reinvested. Public offering price (POP) figures reflect maximum sales charges on Class A shares of 4.5% and the applicable contingent deferred sales charge (CDSC) on Class B shares and Class C shares. The returns for Class C shares have been adjusted to reflect the elimination of the front-end sales charge, effective 7-15-04. The Class B shares’ CDSC declines annually between years 1 to 6 according to the following schedule: 5, 4, 3, 3, 2, 1%. No sales charge will be assessed after the sixth year. Class C shares held for less than one year are subject to a 1% CDSC.
The expense ratios of the Fund, both net (including any fee waivers or expense limitations) and gross (excluding any fee waivers or expense limitations), are set forth according to the most recent publicly available prospectus for the Fund and may differ from the expense ratios disclosed in the Financial Highlights tables in this report. The net expenses equal the gross expenses and are as follows: Class A — 1.01%, Class B — 1.76% and Class C — 1.76%.
The returns reflect past results and should not be considered indicative of future performance. The return and principal value of an investment will fluctuate so that shares, when redeemed, may be worth more or less than their original cost. Due to market volatility, the Fund’s current performance may be higher or lower than the performance shown. For current to the most recent month end performance data, please call 1–800–225–5291 or visit the Fund’s Web site at www.jhfunds.com.
The performance table above and the chart on the next page do not reflect the deduction of taxes that a shareholder may pay on fund distributions or on the redemption of fund shares. Please note that a portion of the Fund’s income may be subject to taxes, and some investors may be subject to the Alternative Minimum Tax (AMT). Also note that capital gains are taxable.
The Fund’s performance results reflect any applicable fee waivers or expense reductions, without which the expenses would increase and results would have been less favorable.
| |
6 | High Yield Municipal Bond Fund | Semiannual report |
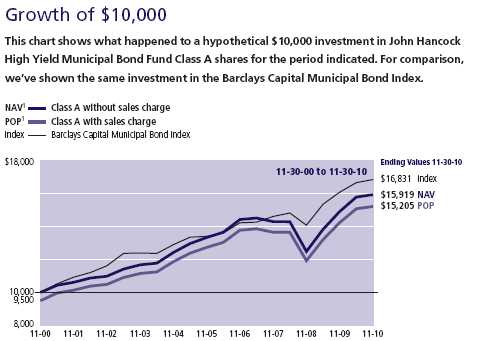
| | | | |
| | Period | Without | With maximum | |
| | beginning | sales charge | sales charge | Index |
|
| Class B2 | 11-30-00 | $15,000 | $15,000 | $16,831 |
|
| Class C2 | 11-30-00 | 14,771 | 14,771 | 16,831 |
|
Assuming all distributions were reinvested for the period indicated, the table above shows the value of a $10,000 investment in the Fund’s Class B and Class C shares, respectively, as of 11-30-10. The Class C shares investment with maximum sales charge has been adjusted to reflect the elimination of the front-end sales charge, effective 7-15-04. Performance of the classes will vary based on the difference in sales charges paid by shareholders investing in the different classes and the fee structure of those classes.
Barclays Capital Municipal Bond Index is an unmanaged index representative of the tax-exempt bond market.
It is not possible to invest directly in an index. Index figures do not reflect sales charges or direct expenses, which would have resulted in lower values if they did.
1 NAV represents net asset value and POP represents public offering price.
2 No contingent deferred sales charge applicable.
| | |
| | Semiannual report | High Yield Municipal Bond Fund | 7 |
Your expenses
These examples are intended to help you understand your ongoing operating expenses.
Understanding fund expenses
As a shareholder of the Fund, you incur two types of costs:
▪ Transaction costs which include sales charges (loads) on purchases or redemptions (varies by share class), minimum account fee charge, etc.
▪ Ongoing operating expenses including management fees, distribution and service fees (if applicable), and other fund expenses.
We are going to present only your ongoing operating expenses here.
Actual expenses/actual returns
This example is intended to provide information about your fund’s actual ongoing operating expenses, and is based on your fund’s actual return. It assumes an account value of $1,000.00 on June 1, 2010 with the same investment held until November 30, 2010.
| | | |
| | Account value | Ending value | Expenses paid during |
| | on 6-1-10 | on 11-30-10 | period ended 11-30-101 |
|
| Class A | $1,000.00 | $1,009.50 | $4.94 |
|
| Class B | 1,000.00 | 1,005.70 | 8.75 |
|
| Class C | 1,000.00 | 1,005.70 | 8.70 |
|
Together with the value of your account, you may use this information to estimate the operating expenses that you paid over the period. Simply divide your account value at November 30, 2010, by $1,000.00, then multiply it by the “expenses paid” for your share class from the table above. For example, for an account value of $8,600.00, the operating expenses should be calculated as follows:
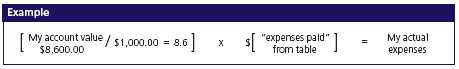
| |
| 8 | High Yield Municipal Bond Fund | Semiannual report |
Hypothetical example for comparison purposes
This table allows you to compare your fund’s ongoing operating expenses with those of any other fund. It provides an example of the Fund’s hypothetical account values and hypothetical expenses based on each class’s actual expense ratio and an assumed 5% annualized return before expenses (which is not your fund’s actual return). It assumes an account value of $1,000.00 on June 1, 2010, with the same investment held until November 30, 2010. Look in any other fund shareholder report to find its hypothetical example and you will be able to compare these expenses.
| | | |
| | Account value | Ending value | Expenses paid during |
| | on 6-1-10 | on 11-30-10 | period ended 11-30-101 |
|
| Class A | $1,000.00 | $1,020.00 | $4.94 |
|
| Class B | 1,000.00 | 1,016.30 | 8.75 |
|
| Class C | 1,000.00 | 1,016.30 | 8.70 |
|
Remember, these examples do not include any transaction costs, therefore, these examples will not help you to determine the relative total costs of owning different funds. If transaction costs were included, your expenses would have been higher. See the prospectus for details regarding transaction costs.
1 Expenses are equal to the Fund’s annualized expense ratio of 0.98%, 1.74% and 1.73% for Class A, Class B, and Class C shares, respectively, multiplied by the average account value over the period, multiplied by 183/365 (to reflect the one-half year period).
| |
| Semiannual report | High Yield Municipal Bond Fund | 9 |
Portfolio summary
| |
| Top 10 Holdings1 | |
|
| Atlanta Water & Waste Water Revenue, 5.000% 11-1-19 | 3.6% |
|
| Foothill Eastern Transportation Corridor Agency, Zero, 1-1-18 | 2.3% |
|
| Texas Municipal Gas Acquisition & Supply Corp., 6.250%, 12-15-26 | 2.0% |
|
| Golden State Tobacco Securitization Corp., 4.500%, 6-1-27 | 1.8% |
|
| New York Liberty Development Corp., 5.250%, 10-1-35 | 1.8% |
|
| Love Field Airport Modernization Corp., 5.250%, 11-1-40 | 1.6% |
|
| Tennessee Energy Acquisition Corp., 5.000%, 2-1-25 | 1.6% |
|
| North Texas Tollway Authority, 5.750%, 1-1-38 | 1.5% |
|
| Puerto Rico Sales Tax Financing Corp., 5.250%, 8-1-41 | 1.3% |
|
| Pennsylvania Turnpike Commission, Zero, 12-1-38 | 1.2% |
|
| | | | |
| Sector Composition2,3 | | | | |
|
| General Obligation | 2% | | Tobacco | 5% |
| |
|
| Revenue Bonds | | | Water & Sewer | 5% |
| |
|
| Development | 19% | | Airport | 4% |
| |
|
| Pollution | 13% | | Education | 3% |
| |
|
| Transportation | 11% | | Facilities | 1% |
| |
|
| Health Care | 10% | | Other Revenue | 18% |
| |
|
| Utilities | 7% | | Short-Term Investments & Other | 2% |
| |
|
| | |
| Quality Composition2,4 | | |
| |
| AAA | 8% | |
| |
| AA | 7% | |
| |
| A | 35% | |
| |
| BBB | 34% | |
| |
| BB | 10% | |
| |
| B | 2% | |
| |
| CCC and Below | 2% | |
| |
| Short-Term Investments & Other | 2% | |
| |
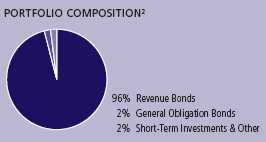
1 As a percentage of net assets on 11-30-10. Cash and cash equivalents are not included in Top 10 Holdings.
2 As a percentage of net assets on 11-30-10.
3 Investments concentrated in one sector may fluctuate more widely than investments across multiple sectors. Because the Fund may focus on particular sectors, its performance may depend on the performance of those sectors.
4 Ratings are from Moody’s Investor Services, Inc. If not available, we have used S&P ratings. In the absence of ratings from these agencies, we have used Fitch, Inc. ratings. “Not Rated” securities are those with no ratings available. They may have internal ratings similar to those shown. All are as of 11-30-10 and do not reflect subsequent downgrades, if any.
| |
| 10 | High Yield Municipal Bond Fund | Semiannual report |
Fund’s investments
As of 11-30-10 (unaudited)
| | | | | |
| | | | Maturity | | |
| | Rate (%) | | date | Par value | Value |
| Municipal Bonds 98.08% | | | | | $288,255,712 |
|
| (Cost $272,846,099) | | | | | |
| | | | | | |
| Alabama 2.06% | | | | | 6,046,035 |
|
| Birmingham Special Care Facilities | | | | | |
| Financing Authority, Childrens Hospital | 6.125 | | 06-01-34 | $2,000,000 | 2,066,155 |
|
| Courtland Industrial Development Board, | | | | | |
| International Paper Company Project, | | | | | |
| Series A AMT | 5.200 | | 06-01-25 | 2,000,000 | 1,896,540 |
|
| Selma Industrial Development Board, | | | | | |
| Gulf Opportunity Zone, Series A | 6.250 | | 11-01-33 | 2,000,000 | 2,083,340 |
| | | | | | |
| Arizona 2.18% | | | | | 6,399,440 |
|
| Maricopa County Industrial Development | | | | | |
| Authority, Catholic Healthcare West, Series A | 6.000 | | 07-01-39 | 3,000,000 | 3,128,490 |
|
| Maricopa County Pollution Control Corp., | | | | | |
| El Paso Electric Co. Project, Series B | 7.250 | | 04-01-40 | 2,000,000 | 2,228,480 |
|
| Maricopa County Pollution Control Corp., | | | | | |
| Public Service Palo Verde, Series A | 6.250 | | 01-01-38 | 1,000,000 | 1,042,470 |
| | | | | | |
| California 8.47% | | | | | 24,888,693 |
|
| California State Public Works Board, | | | | | |
| Trustees California State University, Series D | 6.250 | | 04-01-34 | 1,000,000 | 1,039,360 |
|
| California Statewide Communities | | | | | |
| Development Authority, Thomas Jefferson | | | | | |
| School of Law, Series A | 7.250 | | 10-01-38 | 1,000,000 | 1,041,940 |
|
| Foothill Eastern Transportation | | | | | |
| Corridor Agency, Highway Revenue Tolls | Zero | | 01-15-36 | 4,000,000 | 630,520 |
|
| Foothill Eastern Transportation Corridor | | | | | |
| Agency, Highway Revenue Tolls, Escrowed | | | | | |
| to Maturity, Series A | Zero | | 01-01-18 | 7,950,000 | 6,638,727 |
|
| Golden State Tobacco Securitization Corp., | | | | | |
| Series A-1 | 4.500 | | 06-01-27 | 6,405,000 | 5,377,702 |
|
| M-S-R Energy Authority, Natural Gas Revenue, | | | | | |
| Series A | 6.500 | | 11-01-39 | 1,500,000 | 1,626,270 |
|
| M-S-R Energy Authority, Natural Gas Revenue, | | | | | |
| Series B | 7.000 | | 11-01-34 | 1,500,000 | 1,724,775 |
|
| San Bernardino County, Medical Center | | | | | |
| Financial Project, Series B (D) | 5.500 | | 08-01-17 | 2,245,000 | 2,329,839 |
|
| Southern California Public Power Authority, | | | | | |
| Natural Gas Revenue, Series A | 5.250 | | 11-01-26 | 1,500,000 | 1,534,140 |
| | |
| See notes to financial statements | Semiannual report | High Yield Municipal Bond Fund | 11 |
| | | | | |
| | | | Maturity | | |
| | Rate (%) | | date | Par value | Value |
| California (continued) | | | | | |
|
| State of California | 5.250 | | 11-01-40 | $2,000,000 | $1,944,080 |
|
| State of California, Highway Improvements | 5.500 | | 03-01-40 | 1,000,000 | 1,001,340 |
| | | | | | |
| Colorado 2.53% | | | | | 7,442,908 |
|
| Colorado Health Facilities Authority, Christian | | | | | |
| Living Community Project, Series A | 9.000 | | 01-01-34 | 750,000 | 801,053 |
|
| Colorado Health Facilities Authority, Christian | | | | | |
| Living Community Project, Series A | 5.750 | | 01-01-26 | 1,000,000 | 931,230 |
|
| E-470 Public Highway Authority, Highway | | | | | |
| Revenue Tolls, Series C | 5.375 | | 09-01-26 | 1,000,000 | 944,560 |
|
| Public Authority for Colorado Energy, | | | | | |
| Natural Gas Revenue | 6.250 | | 11-15-28 | 2,500,000 | 2,757,525 |
|
| Regional Transportation District, Denver | | | | | |
| Transit Partners | 6.000 | | 01-15-41 | 2,000,000 | 2,008,540 |
| | | | | | |
| Connecticut 0.54% | | | | | 1,597,365 |
|
| Hamden Facility Revenue, Whitney Center | | | | | |
| Project, Series A | 7.750 | | 01-01-43 | 1,500,000 | 1,597,365 |
| | | | | | |
| Delaware 0.63% | | | | | 1,845,340 |
|
| Delaware Economic Development Authority, | | | | | |
| Indian River Power Authority | 5.375 | | 10-01-45 | 2,000,000 | 1,845,340 |
| | | | | | |
| District of Columbia 1.21% | | | | | 3,561,966 |
|
| Metropolitan Washington DC Airports | | | | | |
| Authority, Highway Revenue Tolls, Series A | Zero | | 10-01-37 | 4,000,000 | 675,280 |
|
| Metropolitan Washington DC Airports | | | | | |
| Authority, Highway Revenue Tolls, Series B | Zero | | 10-01-39 | 4,600,000 | 680,156 |
|
| Metropolitan Washington DC Airports Authority, | | | | | |
| Highway Revenue Tolls, Series C (Zero Coupon | | | | | |
| Steps up to 6.500% on 10-1-16) (D) | Zero | | 10-01-41 | 3,000,000 | 2,206,530 |
| | | | | | |
| Florida 7.26% | | | | | 21,341,000 |
|
| Bonnet Creek Resort Community | | | | | |
| Development District | 7.375 | | 05-01-34 | 1,055,000 | 905,865 |
|
| Bonnet Creek Resort Community | | | | | |
| Development District | 7.250 | | 05-01-18 | 1,445,000 | 1,338,720 |
|
| Capital Projects Finance Authority, | | | | | |
| College & University Revenue, Series G | 9.125 | | 10-01-11 | 755,000 | 659,636 |
|
| Capital Trust Agency, Seminole Tribe Convention, | | | | | |
| Prerefunded to 10-1-12, Series A (S) | 8.950 | | 10-01-33 | 1,000,000 | 1,157,890 |
|
| Crossings at Fleming Island Community | | | | | |
| Development District, Recreations Facilities | | | | | |
| Improvements, Series C | 7.100 | | 05-01-30 | 1,000,000 | 996,790 |
|
| Heritage Harbour North Community | | | | | |
| Development District | 6.375 | | 05-01-38 | 1,245,000 | 1,032,093 |
|
| Live Oak Community Development | | | | | |
| District No: 1, Series A | 6.300 | | 05-01-34 | 1,000,000 | 1,010,010 |
|
| Miami Beach Health Facilities Authority, | | | | | |
| Mt. Sinai Medical Center, Series A | 6.125 | | 11-15-11 | 200,000 | 200,590 |
|
| Miami-Dade County Aviation Revenue, | | | | | |
| Miami International Airport, Series A | 5.500 | | 10-01-36 | 2,000,000 | 2,036,240 |
|
| Miami-Dade County Aviation Revenue, | | | | | |
| Miami International Airport, Series A AMT (D) | 5.000 | | 10-01-38 | 2,000,000 | 1,781,420 |
| | |
| 12 | High Yield Municipal Bond Fund | Semiannual report | See notes to financial statements |
| | | | | |
| | | | Maturity | | |
| | Rate (%) | | date | Par value | Value |
| Florida (continued) | | | | | |
|
| Orlando Urban Community Development District, | | | | | |
| Electric Light & Power Improvements | 6.250 | | 05-01-34 | $1,000,000 | $863,950 |
|
| Orlando Urban Community Development District, | | | | | |
| Electric Light & Power Improvements | 6.000 | | 05-01-20 | 595,000 | 547,108 |
|
| Pensacola Airport Revenue AMT | 6.000 | | 10-01-28 | 2,000,000 | 2,079,560 |
|
| Poinciana Community Development District, | | | | | |
| Sewer Improvements, Series A | 7.125 | | 05-01-31 | 1,180,000 | 1,179,858 |
|
| South Kendall Community Development | | | | | |
| District, Series A | 5.900 | | 05-01-35 | 930,000 | 866,388 |
|
| Tolomato Community Development District | 6.650 | | 05-01-40 | 1,000,000 | 705,560 |
|
| Tolomato Community Development | | | | | |
| District No: 8 | 6.450 | | 05-01-23 | 1,000,000 | 766,980 |
|
| Village Community Development District | 6.375 | | 05-01-38 | 865,000 | 872,820 |
|
| Village Community Development District No 8 | 6.125 | | 05-01-39 | 1,000,000 | 987,340 |
|
| Village Community Development District No: 5, | | | | | |
| Series A | 6.500 | | 05-01-33 | 1,320,000 | 1,352,182 |
| | | | | | |
| Georgia 6.67% | | | | | 19,600,763 |
|
| Atlanta Tax Allocation, Eastside Project, | | | | | |
| Series B | 5.600 | | 01-01-30 | 1,500,000 | 1,425,735 |
|
| Atlanta Water & Waste Water Revenue (D) | 5.000 | | 11-01-19 | 10,000,000 | 10,601,100 |
|
| Atlanta Water & Waste Water Revenue, | | | | | |
| Series A | 6.000 | | 11-01-20 | 1,000,000 | 1,176,670 |
|
| Atlanta Water & Waste Water Revenue, | | | | | |
| Series A | 6.000 | | 11-01-28 | 1,000,000 | 1,080,920 |
|
| Clayton County Development Authority, | | | | | |
| Delta Air Lines AMT | 9.000 | | 06-01-35 | 1,000,000 | 1,087,490 |
|
| Gainesville & Hall County Development Authority, | | | | | |
| ACTS Retirement-Life Communities, Inc., | | | | | |
| Series A-2 | 6.625 | | 11-15-39 | 1,100,000 | 1,133,253 |
|
| Marietta Development Authority, Life | | | | | |
| University, Inc. Project | 7.000 | | 06-15-30 | 1,500,000 | 1,495,185 |
|
| Municipal Electric Authority of Georgia, | | | | | |
| Electric, Power & Light Revenues, Series D | 5.500 | | 01-01-26 | 1,500,000 | 1,600,410 |
| | | | | | |
| Guam 0.74% | | | | | 2,186,820 |
|
| Guam Government, Series A | 7.000 | | 11-15-39 | 2,000,000 | 2,186,820 |
| | | | | | |
| Hawaii 0.39% | | | | | 1,141,420 |
|
| Hawaii State Department of Budget & Finance, | | | | | |
| 15 Craigside Place Project, Series A | 9.000 | | 11-15-44 | 1,000,000 | 1,141,420 |
| | | | | | |
| Illinois 2.83% | | | | | 8,316,901 |
|
| Chicago Tax Increment Revenue, Pilsen | | | | | |
| Redevelopment, Series B | 6.750 | | 06-01-22 | 2,000,000 | 1,974,880 |
|
| Illinois Development Finance Authority, | | | | | |
| Series C1 (P) | 5.950 | | 08-15-26 | 1,000,000 | 993,450 |
|
| Illinois Finance Authority, Navistar International | | | | | |
| Recover Facility | 6.500 | | 10-15-40 | 3,100,000 | 3,122,351 |
|
| Illinois Finance Authority, Rush University | | | | | |
| Medical Center, Series A | 7.250 | | 11-01-38 | 2,000,000 | 2,226,220 |
| | |
| See notes to financial statements | Semiannual report | High Yield Municipal Bond Fund | 13 |
| | | | | |
| | | | Maturity | | |
| | Rate (%) | | date | Par value | Value |
| Indiana 1.68% | | | | | $4,947,818 |
|
| Crown Point Economic Development Revenue, | | | | | |
| Wittenberg Village Project, Series A | 8.000 | | 11-15-39 | $1,250,000 | 1,251,500 |
|
| Indiana Finance Authority, Duke Energy, | | | | | |
| Series B | 6.000 | | 08-01-39 | 1,000,000 | 1,070,300 |
|
| Indiana Finance Authority, U.S. Steel Corp. | 6.000 | | 12-01-26 | 2,000,000 | 1,955,800 |
|
| St. Joseph County, Holy Cross Village at Notre | | | | | |
| Dame Project, Series A | 6.000 | | 05-15-26 | 230,000 | 222,578 |
|
| St. Joseph County, Holy Cross Village at Notre | | | | | |
| Dame Project, Series A | 6.000 | | 05-15-38 | 475,000 | 447,640 |
| | | | | | |
| Iowa 0.41% | | | | | 1,204,678 |
|
| Altoona Urban Renewal Tax Increment Revenue | 6.000 | | 06-01-34 | 1,000,000 | 1,021,770 |
|
| Iowa Finance Authority, Care Initiatives Project, | | | | | |
| Prerefunded to 7-11-11 | 9.250 | | 07-01-25 | 170,000 | 182,908 |
| | | | | | |
| Kansas 0.84% | | | | | 2,472,705 |
|
| Wyandotte County-Kansas City Unified | | | | | |
| Government, Sales Tax Revenue, Series B | Zero | | 06-01-21 | 4,500,000 | 2,472,705 |
| | | | | | |
| Kentucky 1.06% | | | | | 3,103,520 |
|
| Kentucky Economic Development | | | | | |
| Finance Authority, Owensboro Medical | | | | | |
| Health System | 6.500 | | 03-01-45 | 2,000,000 | 2,045,480 |
|
| Owen County Kentucky Waterworks System | | | | | |
| Revenue, Amern Water Company Project, | | | | | |
| Series A | 6.250 | | 06-01-39 | 1,000,000 | 1,058,040 |
| | | | | | |
| Louisiana 2.68% | | | | | 7,889,340 |
|
| Louisiana Local Government Environmental | | | | | |
| Facilities, Westlake Chemical Corp. Projects | 6.750 | | 11-01-32 | 3,000,000 | 3,068,160 |
|
| Louisiana Local Government Environmental | | | | | |
| Facilities, Westlake Chemical Corp., | | | | | |
| Series A-2 | 6.500 | | 11-01-35 | 2,000,000 | 2,036,280 |
|
| St. John Baptist Parish Revenue, Marathon Oil | | | | | |
| Corp., Series A | 5.125 | | 06-01-37 | 3,000,000 | 2,784,900 |
| | | | | | |
| Maryland 1.12% | | | | | 3,304,410 |
|
| Baltimore County, East Baltimore Research | | | | | |
| Park, Series A | 7.000 | | 09-01-38 | 1,000,000 | 1,006,970 |
|
| Maryland Economic Development Corp., | | | | | |
| Potomac Electric Power Company | 6.200 | | 09-01-22 | 2,000,000 | 2,297,440 |
| | | | | | |
| Massachusetts 2.43% | | | | | 7,150,838 |
|
| Massachusetts Development Finance Agency, | | | | | |
| Dominion Energy Brayton Point AMT (P) | 5.000 | | 02-01-36 | 1,000,000 | 951,830 |
|
| Massachusetts Development Finance Agency, | | | | | |
| Ogden Haverhill Project, Series B AMT | 5.500 | | 12-01-19 | 1,700,000 | 1,701,258 |
|
| Massachusetts Health & Educational Facilities | | | | | |
| Authority, Civic Investments, Prerefunded to | | | | | |
| 12-15-12 Series B | 9.200 | | 12-15-31 | 2,500,000 | 2,937,075 |
|
| Massachusetts State College Building Authority, | | | | | |
| College & University Revenue, Series A | 5.500 | | 05-01-49 | 1,500,000 | 1,560,675 |
| | |
| 14 | High Yield Municipal Bond Fund | Semiannual report | See notes to financial statements |
| | | | | |
| | | | Maturity | | |
| | Rate (%) | | date | Par value | Value |
| Michigan 0.75% | | | | | $2,191,640 |
|
| Michigan Strategic Fund Ltd., Detroit Education | 5.625 | | 07-01-20 | $1,000,000 | 1,100,680 |
|
| Michigan Strategic Fund Ltd., Dow Chemical | | | | | |
| Company, Series A-1 AMT (P) | 6.750 | | 12-01-28 | 1,000,000 | 1,090,960 |
| | | | | | |
| Minnesota 0.66% | | | | | 1,936,460 |
|
| North Oak Senior Housing Revenue, | | | | | |
| Presbyterian Homes North Oaks | 6.000 | | 10-01-27 | 1,000,000 | 995,710 |
|
| St Paul Housing & Redevelopment Authority, | | | | | |
| Carondelet Village Project, Series A | 6.000 | | 08-01-42 | 1,000,000 | 940,750 |
| | | | | | |
| Mississippi 0.69% | | | | | 2,015,910 |
|
| Mississippi Business Finance Corp., System | | | | | |
| Energy Resources, Inc. Project | 5.875 | | 04-01-22 | 1,000,000 | 995,170 |
|
| Warren County, International Paper Company, | | | | | |
| Series A | 5.800 | | 05-01-34 | 1,000,000 | 1,020,740 |
| | | | | | |
| Missouri 0.64% | | | | | 1,884,766 |
|
| Missouri Joint Municipal Electric Utility | | | | | |
| Commission, Iatan 2 Project, Series A | 6.000 | | 01-01-39 | 1,000,000 | 1,054,910 |
|
| St. Louis Airport Revenue, Lambert St. Louis | | | | | |
| International Airport | 6.625 | | 07-01-34 | 800,000 | 829,856 |
| | | | | | |
| Nevada 0.31% | | | | | 911,140 |
|
| Sparks Tourism Improvement District No: 1, | | | | | |
| Sales Tax Revenue, Series A (S) | 6.750 | | 06-15-28 | 1,000,000 | 911,140 |
| | | | | | |
| New Hampshire 0.86% | | | | | 2,519,600 |
|
| New Hampshire Business Finance Authority, | | | | | |
| Public Service Company Project, Series B | | | | | |
| AMT (D) | 4.750 | | 05-01-21 | 1,500,000 | 1,470,600 |
|
| New Hampshire Business Finance Authority, | | | | | |
| Series A AMT (P) | 6.875 | | 12-01-29 | 1,000,000 | 1,049,000 |
| | | | | | |
| New Jersey 3.48% | | | | | 10,234,964 |
|
| New Jersey Economic Development Authority, | | | | | |
| Continental Airlines, Inc. Project AMT | 6.625 | | 09-15-12 | 2,460,000 | 2,497,540 |
|
| New Jersey Economic Development Authority, | | | | | |
| Continental Airlines, Inc. Project AMT | 6.250 | | 09-15-29 | 1,300,000 | 1,222,000 |
|
| New Jersey Health Care Facilities Financing | | | | | |
| Authority, St. Peter’s University Hospital, | | | | | |
| Series A | 6.875 | | 07-01-30 | 1,000,000 | 1,002,710 |
|
| New Jersey State Educational Facilities Authority, | | | | | |
| University of Medical and Dentistry | 7.500 | | 12-01-32 | 1,000,000 | 1,124,270 |
|
| Tobacco Settlement Financing Corp., | | | | | |
| Prerefunded to 6-1-13 | 6.250 | | 06-01-43 | 1,000,000 | 1,135,230 |
|
| Tobacco Settlement Financing Corp., Series 1A | 4.500 | | 06-01-23 | 3,640,000 | 3,253,214 |
| | | | | | |
| New Mexico 1.38% | | | | | 4,055,880 |
|
| Farmington Pollution Control, Electric, Power & | | | | | |
| Light Revenues | 5.900 | | 06-01-40 | 3,000,000 | 3,043,560 |
|
| Farmington Pollution Control Revenue | 5.900 | | 06-01-40 | 1,000,000 | 1,012,320 |
| | | | | | |
| New York 5.79% | | | | | 17,004,846 |
|
| Brooklyn Arena Local Development Corp., | | | | | |
| Barclays Center Project | 6.375 | | 07-15-43 | 1,000,000 | 1,035,920 |
|
| Brooklyn Arena Local Development Corp., | | | | | |
| Barclays Center Project | 6.250 | | 07-15-40 | 1,000,000 | 1,032,890 |
| | |
| See notes to financial statements | Semiannual report | High Yield Municipal Bond Fund | 15 |
| | | | | |
| | | | Maturity | | |
| | Rate (%) | | date | Par value | Value |
| New York (continued) | | | | | |
|
| Chautauqua County Industrial Development | | | | | |
| Agency, Dunkirk Power Project | 5.875 | | 04-01-42 | $1,350,000 | $1,371,776 |
|
| Long Island Power Authority, Electric, Power & | | | | | |
| Light Revenues, Series A | 5.750 | | 04-01-39 | 2,500,000 | 2,633,325 |
|
| Long Island Power Authority, Electric, Power & | | | | | |
| Light Revenues, Series C (D) | 5.250 | | 09-01-29 | 1,475,000 | 1,575,271 |
|
| New York City Industrial Development Agency, | | | | | |
| 7 World Trade Center, Series A | 6.250 | | 03-01-15 | 1,500,000 | 1,500,405 |
|
| New York City Industrial Development Agency, | | | | | |
| American Airlines-JFK Airport AMT | 7.500 | | 08-01-16 | 2,000,000 | 2,074,180 |
|
| New York Liberty Development Corp., | | | | | |
| Goldman Sachs Headquarters | 5.250 | | 10-01-35 | 5,250,000 | 5,249,633 |
|
| Port Authority of New York & New Jersey, | | | | | |
| 5th Installment Special Project AMT | 6.750 | | 10-01-19 | 555,000 | 531,446 |
| | | | | | |
| North Carolina 0.76% | | | | | 2,244,480 |
|
| North Carolina Eastern Municipal Power Agency, | | | | | |
| Electric, Power & Light Revenues, Series A | 5.500 | | 01-01-26 | 1,000,000 | 1,072,720 |
|
| North Carolina Eastern Municipal Power Agency, | | | | | |
| Electric, Power & Light Revenues, Series C | 6.750 | | 01-01-24 | 1,000,000 | 1,171,760 |
| | | | | | |
| Ohio 3.85% | | | | | 11,316,273 |
|
| Buckeye Ohio Tobacco Settlement Financing | | | | | |
| Authority, Series A-2 | 5.875 | | 06-01-30 | 4,500,000 | 3,483,045 |
|
| Buckeye Ohio Tobacco Settlement Financing | | | | | |
| Authority, Series A-2 | 5.125 | | 06-01-24 | 2,870,000 | 2,358,968 |
|
| Cleveland Ohio Airport Revenue, Continental | | | | | |
| Airlines, Inc. Project AMT | 5.375 | | 09-15-27 | 2,510,000 | 2,063,245 |
|
| Hickory Chase Community Authority, Hickory | | | | | |
| Chase Project | 7.000 | | 12-01-38 | 1,000,000 | 654,250 |
|
| Ohio Air Quality Development Authority, | | | | | |
| FirstEnergy Solutions Corp., Series A (P) | 5.750 | | 06-01-33 | 1,500,000 | 1,673,805 |
|
| Ohio Air Quality Development Authority, | | | | | |
| FirstEnergy Solutions Corp., Series C AMT (P) | 7.250 | | 11-01-32 | 1,000,000 | 1,082,960 |
| | | | | | |
| Oklahoma 1.41% | | | | | 4,157,667 |
|
| Oklahoma Municipal Power Authority, Electric, | | | | | |
| Power & Light Revenues, Series A | 6.000 | | 01-01-38 | 1,685,000 | 1,814,593 |
|
| Tulsa Municipal Airport Trust Trustees, | | | | | |
| American Airlines Project | 6.250 | | 06-01-20 | 1,375,000 | 1,313,084 |
|
| Tulsa Municipal Airport Trust Trustees, | | | | | |
| Series A AMT | 7.750 | | 06-01-35 | 1,000,000 | 1,029,990 |
| | | | | | |
| Oregon 0.53% | | | | | 1,563,432 |
|
| Western Generation Agency, Wauna | | | | | |
| Cogeneration Project, Series B AMT | 5.000 | | 01-01-14 | 1,105,000 | 1,089,607 |
|
| Western Generation Agency, Wauna | | | | | |
| Cogeneration Project, Series B AMT | 5.000 | | 01-01-16 | 500,000 | 473,825 |
| | | | | | |
| Pennsylvania 5.12% | | | | | 15,032,195 |
|
| Allegheny County Hospital Development Authority, | | | | |
| West Penn Health Systems, Series A | 5.000 | | 11-15-28 | 1,000,000 | 727,990 |
|
| Allegheny County Industrial Development | | | | | |
| Authority, Environmental Improvements | 6.875 | | 05-01-30 | 1,000,000 | 1,036,990 |
| | |
| 16 | High Yield Municipal Bond Fund | Semiannual report | See notes to financial statements |
| | | | | |
| | | | Maturity | | |
| | Rate (%) | | date | Par value | Value |
| Pennsylvania (continued) | | | | | |
|
| Allegheny County Industrial Development | | | | | |
| Authority, Environmental Improvements | 5.500 | | 11-01-16 | $1,000,000 | $1,032,740 |
|
| Pennsylvania Economic Development Financing | | | | | |
| Authority, Allegheny Energy | | | | | |
| Supply Company | 7.000 | | 07-15-39 | 2,500,000 | 2,750,975 |
|
| Pennsylvania Economic Development Financing | | | | | |
| Authority, Philadelphia Biosolids Facility | 6.250 | | 01-01-32 | 1,000,000 | 1,029,950 |
|
| Pennsylvania Turnpike Commission, Highway | | | | | |
| Revenue Tolls, Series E (Zero Coupon Steps | | | | | |
| up to 6.375% on 12-1-17) | Zero | | 12-01-38 | 5,000,000 | 3,585,500 |
|
| Pennsylvania Turnpike Commission, Series C | Zero | | 12-01-38 | 4,000,000 | 784,240 |
|
| Pennsylvania Turnpike Commission, | | | | | |
| Series C-2 (Zero Coupon Steps up to 5.350% | | | | | |
| on 12-1-15) | Zero | | 12-01-30 | 3,000,000 | 2,172,450 |
|
| Philadelphia Gas Waterworks Revenue | 5.250 | | 08-01-40 | 2,000,000 | 1,911,360 |
| | | | | | |
| Puerto Rico 8.30% | | | | | 24,404,823 |
|
| Commonwealth of Puerto Rico, Series B | 6.500 | | 07-01-37 | 2,000,000 | 2,221,980 |
|
| Commonwealth of Puerto Rico, Series C | 6.000 | | 07-01-39 | 1,000,000 | 1,041,430 |
|
| Puerto Rico Aqueduct & Sewer Authority, | | | | | |
| Water Revenue, Series A (Zero Coupon Steps | | | | | |
| up to 6.125% on 7-1-11) | Zero | | 07-01-24 | 1,500,000 | 1,526,715 |
|
| Puerto Rico Aqueduct & Sewer Authority, | | | | | |
| Water Revenue, Series A | 6.000 | | 07-01-38 | 1,000,000 | 1,028,740 |
|
| Puerto Rico Electric Power Authority, Electric, | | | | | |
| Power & Light Revenues, Series TT | 5.000 | | 07-01-32 | 1,250,000 | 1,206,738 |
|
| Puerto Rico Electric Power Authority, Electric, | | | | | |
| Power & Light Revenues, Series XX | 5.250 | | 07-01-40 | 3,000,000 | 2,955,540 |
|
| Puerto Rico Sales Tax Financing Authority, Sales | | | | | |
| Tax Revenue, Series A | 5.750 | | 08-01-37 | 3,000,000 | 3,094,710 |
|
| Puerto Rico Sales Tax Financing Authority, Sales | | | | | |
| Tax Revenue, Series A (Zero Coupon Steps up | | | | | |
| to 6.750% on 8-1-16) | Zero | | 08-01-32 | 3,000,000 | 2,437,410 |
|
| Puerto Rico Sales Tax Financing Corp., Sales Tax | | | | | |
| Revenue, Series A | 5.500 | | 08-01-42 | 3,000,000 | 3,032,040 |
|
| Puerto Rico Sales Tax Financing Corp., Sales Tax | | | | | |
| Revenue, Series A | Zero | | 08-01-33 | 5,000,000 | 1,198,800 |
|
| Puerto Rico Sales Tax Financing Corp., Sales Tax | | | | | |
| Revenue, Series A (D) | Zero | | 08-01-41 | 5,000,000 | 721,000 |
|
| Puerto Rico Sales Tax Financing Corp., Sales Tax | | | | | |
| Revenue, Series C | 5.250 | | 08-01-41 | 4,000,000 | 3,939,720 |
| | | | | | |
| Rhode Island 0.16% | | | | | 467,183 |
|
| Tobacco Settlement Financing Corp., Series A | 6.000 | | 06-01-23 | 165,000 | 166,906 |
|
| Town of Tiverton, Mount Hope Bay Village, | | | | | |
| Series A | 6.875 | | 05-01-22 | 315,000 | 300,277 |
| | | | | | |
| South Carolina 0.11% | | | | | 319,615 |
|
| Lancaster County, Edenmoor Improvement | | | | | |
| District, Series A (H) | 5.750 | | 12-01-37 | 970,000 | 319,615 |
| | |
| See notes to financial statements | Semiannual report | High Yield Municipal Bond Fund | 17 |
| | | | | |
| | | | Maturity | | |
| | Rate (%) | | date | Par value | Value |
| Tennessee 1.94% | | | | | $5,685,566 |
|
| Johnson City Health & Educational Facilities, | | | | | |
| Mountain States Health Alliance, Prerefunded | | | | | |
| to 7-1-12, Series A | 7.500 | | 07-01-33 | $1,000,000 | 1,105,750 |
|
| Tennessee Energy Acquisition Corp., Natural | | | | | |
| Gas Revenue, Series C | 5.000 | | 02-01-25 | 4,720,000 | 4,579,816 |
| |
| Texas 12.84% | | | | | 37,736,949 |
|
| Bexar County Health Facilities Development | | | | | |
| Corp., Army Retirement Residence Project, | | | | | |
| Prerefunded to 7-1-12 | 6.300 | | 07-01-32 | 150,000 | 163,779 |
|
| Brazos Harbor Industrial Development Corp., | | | | | |
| Dow Chemical Company Project AMT (P) | 5.900 | | 05-01-38 | 1,500,000 | 1,510,650 |
|
| Brazos River Authority, TXU Energy Company, | | | | | |
| Series A AMT | 7.700 | | 04-01-33 | 2,500,000 | 925,000 |
|
| Gulf Coast Industrial Development Authority, | | | | | |
| CITGO Petroleum Corp. AMT | 8.000 | | 04-01-28 | 2,100,000 | 2,127,552 |
|
| Gulf Coast Waste Disposal Authority, | | | | | |
| International Paper Company, Series A AMT | 6.100 | | 08-01-24 | 1,500,000 | 1,509,750 |
|
| Harris County Health Facilities Development Corp., | | | | |
| Memorial Hermann Healthcare., Series B | 7.250 | | 12-01-35 | 1,000,000 | 1,117,550 |
|
| Love Field Airport Modernization Corp., | | | | | |
| Southwest Airlines Co. Project | 5.250 | | 11-01-40 | 5,000,000 | 4,631,300 |
|
| Matagorda County Navigation District, Electric, | | | | | |
| Power & Light Revenues, Series A | 6.300 | | 11-01-29 | 1,000,000 | 1,065,980 |
|
| Metro Health Facilities Development Corp., | | | | | |
| Wilson N. Jones Memorial Hospital Project, | | | | | |
| Prerefunded to 1-1-11 | 7.250 | | 01-01-31 | 1,000,000 | 1,005,840 |
|
| Mission Economic Development Corp., | | | | | |
| Allied Waste, Inc. Project, Series A AMT | 5.200 | | 04-01-18 | 1,500,000 | 1,515,390 |
|
| Mission Economic Development Corp., | | | | | |
| Waste Management, Inc. Project AMT (P) | 6.000 | | 08-01-20 | 975,000 | 1,047,638 |
|
| North Texas Tollway Authority, | | | | | |
| Highway Revenue Tolls, Series A | 6.250 | | 02-01-23 | 2,000,000 | 2,065,700 |
|
| North Texas Tollway Authority, | | | | | |
| Highway Revenue Tolls, Series A | 6.250 | | 01-01-39 | 3,000,000 | 3,117,330 |
|
| North Texas Tollway Authority, | | | | | |
| Highway Revenue Tolls, Series C | 5.250 | | 01-01-44 | 1,500,000 | 1,366,875 |
|
| North Texas Tollway Authority, | | | | | |
| Highway Revenue Tolls, Series F | 5.750 | | 01-01-38 | 4,500,000 | 4,499,730 |
|
| North Texas Tollway Authority, | | | | | |
| Highway Revenue Tolls, Series K-2 | 6.000 | | 01-01-38 | 1,000,000 | 1,016,570 |
|
| Tarrant County Cultural Education Facilities | | | | | |
| Finance Corp., Air Force Retirement Facility | 6.375 | | 11-15-44 | 2,000,000 | 1,973,660 |
|
| Texas Municipal Gas Acquisition & Supply | | | | | |
| Corp., Natural Gas Revenue, Series D | 6.250 | | 12-15-26 | 5,500,000 | 6,034,655 |
|
| Travis County Health Facilities | | | | | |
| Development Corp., Westminster Manor | 7.000 | | 11-01-30 | 1,000,000 | 1,042,000 |
| | |
| 18 | High Yield Municipal Bond Fund | Semiannual report | See notes to financial statements |
| | | | | |
| | | | Maturity | | |
| | Rate (%) | | date | Par value | Value |
| Virgin Islands 0.36% | | | | | $1,047,470 |
|
| Virgin Islands Public Finance Authority, Series A | 6.750 | | 10-01-37 | $1,000,000 | 1,047,470 |
| | | | | | |
| Virginia 0.76% | | | | | 2,247,380 |
|
| Washington County Industrial Development | | | | | |
| Authority, Mountain States Health Alliance, | | | | | |
| Series C | 7.750 | | 07-01-38 | 2,000,000 | 2,247,380 |
| | | | | | |
| Washington 0.36% | | | | | 1,057,680 |
|
| Washington Health Care Facilities Authority, | | | | | |
| Swedish Health Services, Series A | 6.500 | | 11-15-33 | 1,000,000 | 1,057,680 |
| | | | | | |
| West Virginia 0.34% | | | | | 985,050 |
|
| West Virginia Economic Development | | | | | |
| Authority, Appalachian Power Company, | | | | | |
| Series A (P) | 5.375 | | 12-01-38 | 1,000,000 | 985,050 |
| | | | | | |
| Wisconsin 0.26% | | | | | 774,413 |
|
| Wisconsin Health & Educational Facilities Authority, | | | | | |
| St. John’s Community, Inc., Series A | 7.625 | | 09-15-39 | 750,000 | 774,413 |
| | | | | | |
| Wyoming 0.33% | | | | | 955,000 |
|
| Sweetwater County, FMC Corp. Project AMT | 5.600 | | 12-01-35 | 1,000,000 | 955,000 |
| | | | | | |
| Other 0.36% | | | | | 1,063,370 |
|
| Charter MAC Equity Issuer Trust AMT (S) | 6.000 | | 05-15-19 | 1,000,000 | 1,063,370 |
| |
| Short-Term Investments 1.08% | | | | | $3,166,000 |
|
| (Cost $3,166,000) | | | | | |
| Repurchase Agreement with State Street Corp. dated 11-30-10 at | | |
| 0.010% to be repurchased at $3,166,001 on 12-01-10, collateralized by | | |
| $2,900,000 Federal Home Loan Mortgage Corp., 4.500% due 7-15-13 | | |
| (valued at $3,233,500, including interest) | | | | $3,166,000 | 3,166,000 |
| |
| Total investments (Cost $276,012,099)† 99.16% | | | | $291,421,712 |
|
| |
| Other assets and liabilities, net 0.84% | | | | | $2,458,203 |
|
| |
| Total net assets 100.00% | | | | | $293,879,915 |
|
The percentage shown for each investment category is the total value of that category as a percentage of the net assets of the Fund.
| | |
| See notes to financial statements | Semiannual report | High Yield Municipal Bond Fund | 19 |
Notes to Schedule of Investments
AMT Interest earned from these securities may be considered a tax preference item for purpose of the Federal Alternative Minimum Tax.
(D) Bond is insured by one of these companies:
| | | |
| Insurance Coverage | As a % of total investments | |
| |
| Assured Guaranty Corp. | | 0.76% | |
| Assured Guaranty Municipal Corp. | | 3.64% | |
| CIFG Holding Ltd. | | 1.15% | |
| National Public Finance Guarantee Insurance Company | 1.55% | |
(H) Non-income producing — Issuer is in default.
(P) Variable rate obligation. The coupon rate shown represents the rate at period end.
(S) These securities are exempt from registration under Rule 144A of the Securities Act of 1933. Such securities may be resold, normally to qualified institutional buyers, in transactions exempt from registration.
† At 11-30-10, the aggregate cost of investment securities for federal income tax purposes was $274,505,329. Net unrealized appreciation aggregated $16,916,383, of which $21,581,885 related to appreciated investment securities and $4,665,502 related to depreciated investment securities.
The portfolio had the following sector composition as a percentage of total net assets on 11-30-10:
| | |
| General Obligation | 2% | |
| Revenue Bonds | | |
| Development | 19% | |
| Pollution | 13% | |
| Transportation | 11% | |
| Health Care | 10% | |
| Utilities | 7% | |
| Tobacco | 5% | |
| Water & Sewer | 5% | |
| Airport | 4% | |
| Education | 3% | |
| Facilities | 1% | |
| Other Revenue | 18% | |
| Short-Term Investments & Other | 2% | |
| | |
| 20 | High Yield Municipal Bond Fund | Semiannual report | See notes to financial statements |
F I N A N C I A L S T A T E M E N T S
Financial statements
Statement of assets and liabilities 11-30-10 (unaudited)
This Statement of Assets and Liabilities is the Fund’s balance sheet. It shows the valueof what the Fund owns, is due and owes. You’ll also find the net asset value and themaximum offering price per share.
| |
| Assets | |
|
| Investments, at value (Cost $276,012,099) | $291,421,712 |
| Cash | 837 |
| Receivable for investments sold | 1,869,553 |
| Receivable for fund shares sold | 1,116,081 |
| Interest receivable | 4,518,439 |
| Other receivables and prepaid assets | 69,106 |
| |
| Total assets | 298,995,728 |
| |
| Liabilities | |
|
| Payable for investments purchased | 3,926,920 |
| Payable for fund shares repurchased | 691,391 |
| Distributions payable | 366,033 |
| Payable to affiliates | |
| Accounting and legal services fees | 3,329 |
| Transfer agent fees | 17,047 |
| Distribution and service fees | 51,718 |
| Trustees’ fees | 10,629 |
| Other liabilities and accrued expenses | 48,746 |
| | |
| Total liabilities | 5,115,813 |
| |
| Net assets | |
|
| Capital paid-in | $294,378,494 |
| Undistributed net investment income | 260,271 |
| Accumulated net realized loss on investments | (16,168,463) |
| Net unrealized appreciation (depreciation) on investments | 15,409,613 |
| | |
| Net assets | $293,879,915 |
| |
| Net asset value per share | |
|
| Based on net asset values and shares outstanding — the Fund has an | |
| unlimited number of shares authorized with no par value | |
| Class A ($223,138,818 ÷ 28,046,870 shares) | $7.96 |
| Class B ($9,077,542 ÷ 1,140,993 shares)1 | $7.96 |
| Class C ($61,663,555 ÷ 7,751,098 shares)1 | $7.96 |
| |
| Maximum offering price per share | |
|
| Class A (net asset value per share ÷ 95.5%)2 | $8.34 |
1 Redemption price is equal to net asset value less any applicable contingent deferred sales charge.
2 On single retail sales of less than $100,000. On sales of $100,000 or more and on group sales the offering price is reduced.
| | |
| See notes to financial statements | Semiannual report | High Yield Municipal Bond Fund | 21 |
F I N A N C I A L S T A T E M E N T S
Statement of operations For the six month period ended 11-30-10 (unaudited)
This Statement of Operations summarizes the Fund’s investment income earned and expenses incurred in operating the Fund. It also shows net gains (losses) for the period stated.
| |
| Investment income | |
|
| Interest | $8,600,939 |
| |
| Expenses | |
|
| Investment management fees (Note 4) | 816,806 |
| Distribution and service fees (Note 4) | 640,856 |
| Accounting and legal services fees (Note 4) | 21,919 |
| Transfer agent fees (Note 4) | 125,049 |
| Trustees’ fees (Note 4) | 11,541 |
| State registration fees | 29,578 |
| Printing and postage | 13,944 |
| Professional fees | 34,755 |
| Custodian fees | 20,456 |
| Registration and filing fees | 10,628 |
| Other | 7,924 |
| | |
| Total expenses | 1,733,456 |
| | |
| Net investment income | 6,867,483 |
| |
| Realized and unrealized loss | |
|
| Net realized loss on investments | (595,306) |
| Change in net unrealized appreciation (depreciation) of investments | (4,474,892) |
| | |
| Net realized and unrealized loss | (5,070,198) |
| | |
| Increase in net assets from operations | $1,797,285 |
| | |
| 22 | High Yield Municipal Bond Fund | Semiannual report | See notes to financial statements |
Statements of changes in net assets
These Statements of Changes in Net Assets show how the value of the Fund’s net assets has changed during the last two periods. The difference reflects earnings less expenses, any investment gains and losses, distributions, if any, paid to shareholders and the net of Fund share transactions.
| | |
| | Six months | |
| | ended | Year |
| | 11-30-10 | ended |
| | (Unaudited) | 5-31-10 |
| Increase (decrease) in net assets | | |
|
| From operations | | |
| Net investment income | $6,867,483 | $11,680,528 |
| Net realized loss | (595,306) | (1,080,009) |
| Change in net unrealized appreciation (depreciation) | (4,474,892) | 19,405,158 |
| | | |
| Increase in net assets resulting from operations | 1,797,285 | 30,005,677 |
| | | |
| Distributions to shareholders | | |
| From net investment income | | |
| Class A | (5,243,672) | (8,780,331) |
| Class B | (174,235) | (374,291) |
| Class C | (1,207,003) | (2,067,677) |
| | | |
| Total distributions | (6,624,910) | (11,222,299) |
| | |
| From Fund share transactions (Note 5) | 23,382,708 | 74,636,115 |
| | | |
| Total increase | 18,555,083 | 93,419,493 |
| |
| Net assets | | |
|
| Beginning of period | 275,324,832 | 181,905,339 |
| | | |
| End of period | $293,879,915 | $275,324,832 |
| | | |
| Undistributed net investment income | $260,271 | $17,698 |
| | |
| See notes to financial statements | Semiannual report | High Yield Municipal Bond Fund | 23 |
Financial highlights
The Financial Highlights show how the Fund’s net asset value for a share has changed since the end of the previous period.
| | | | | | | |
| CLASS A SHARES Period ended | 11-30-101 | 5-31-10 | 5-31-092 | 8-31-08 | 8-31-07 | 8-31-06 | 8-31-053 |
| | | | | | | | |
| Per share operating performance | | | | | | | |
|
| Net asset value, beginning | | | | | | | |
| of period | $8.07 | $7.43 | $7.99 | $8.33 | $8.68 | $8.62 | $8.27 |
| Net investment income4 | 0.20 | 0.40 | 0.32 | 0.41 | 0.41 | 0.42 | 0.43 |
| Net realized and unrealized gain | | | | | | | |
| (loss) on investments | (0.12) | 0.63 | (0.58) | (0.34) | (0.35) | 0.05 | 0.35 |
| Total from investment operations | 0.08 | 1.03 | (0.26) | 0.07 | 0.06 | 0.47 | 0.78 |
| Less distributions | | | | | | | |
| From net investment income | (0.19) | (0.39) | (0.30) | (0.41) | (0.41) | (0.41) | (0.43) |
| Net asset value, end of period | $7.96 | $8.07 | $7.43 | $7.99 | $8.33 | $8.68 | $8.62 |
| Total return (%)5 | 0.957 | 14.156 | (3.04)7 | 0.816 | 0.606 | 5.616 | 9.64 |
| |
| Ratios and supplemental data | | | | | | | |
|
| Net assets, end of period (in millions) | $223 | $207 | $139 | $94 | $71 | $72 | $72 |
| Ratios (as a percentage of average | | | | | | | |
| net assets): | | | | | | | |
| Expenses before reductions | 0.988 | 1.01 | 1.158,9 | 1.09 | 1.13 | 1.09 | 1.14 |
| Interest and fees10 | — | — | — | 0.16 | 0.20 | — | — |
| Expenses net of fee waivers | 0.988 | 1.00 | 1.158,9 | 1.25 | 1.33 | 1.09 | 1.14 |
| Net investment income | 4.788 | 5.16 | 6.078 | 4.85 | 4.77 | 4.71 | 5.09 |
| Portfolio turnover (%) | 16 | 14 | 49 | 75 | 63 | 52 | 65 |
| |
1 Semiannual period from 6-1-10 to 11-30-10. Unaudited.
2 For the nine-month period ended 5-31-09. The Fund changed its fiscal year end from August 31 to May 31.
3 Audited by previous independent registered public accounting firm.
4 Based on the average daily shares outstanding.
5 Does not reflect the effect of sales charges, if any.
6 Total returns would have been lower had certain expenses not been reduced during the periods shown.
7 Not annualized.
8 Annualized.
9 Includes the impact of proxy expenses, which amounted to 0.04% of average net assets.
10 Interest expenses and fees are related to the Fund’s investment in inverse floater rate investments. Under accounting rules, the Fund recognizes additional income in an amount equal to these expenses.
| | |
| 24 | High Yield Municipal Bond Fund | Semiannual report | See notes to financial statements |
| | | | | | | |
| CLASS B SHARES Period ended | 11-30-101 | 5-31-10 | 5-31-092 | 8-31-08 | 8-31-07 | 8-31-06 | 8-31-053 |
| | | | | | | | |
| Per share operating performance | | | | | | | |
|
| Net asset value, beginning | | | | | | | |
| of period | $8.07 | $7.43 | $7.99 | $8.33 | $8.68 | $8.62 | $8.27 |
| Net investment income4 | 0.16 | 0.35 | 0.28 | 0.35 | 0.35 | 0.36 | 0.37 |
| Net realized and unrealized gain | | | | | | | |
| (loss) on investments | (0.11) | 0.62 | (0.58) | (0.34) | (0.36) | 0.04 | 0.35 |
| Total from investment operations | 0.05 | 0.97 | (0.30) | 0.01 | (0.01) | 0.40 | 0.72 |
| Less distributions | | | | | | | |
| From net investment income | (0.16) | (0.33) | (0.26) | (0.35) | (0.34) | (0.34) | (0.37) |
| Net asset value, end of period | $7.96 | $8.07 | $7.43 | $7.99 | $8.33 | $8.68 | $8.62 |
| Total return (%)5 | 0.577 | 13.296 | (3.59)7 | 0.066 | (0.15)6 | 4.836 | 8.84 |
| |
| Ratios and supplemental data | | | | | | | |
|
| Net assets, end of period (in millions) | $9 | $9 | $8 | $8 | $11 | $16 | $24 |
| Ratios (as a percentage of average | | | | | | | |
| net assets): | | | | | | | |
| Expenses before reductions | 1.748 | 1.76 | 1.908,9 | 1.84 | 1.88 | 1.84 | 1.87 |
| Interest and fees10 | — | — | — | 0.16 | 0.20 | — | — |
| Expenses net of fee waivers | 1.748 | 1.75 | 1.908,9 | 2.00 | 2.08 | 1.84 | 1.87 |
| Net investment income | 4.038 | 4.42 | 5.348 | 4.09 | 4.05 | 4.11 | 4.35 |
| Portfolio turnover (%) | 16 | 14 | 49 | 75 | 63 | 52 | 65 |
| |
1 Semiannual period from 6-1-10 to 11-30-10. Unaudited.
2 For the nine-month period ended 5-31-09. The Fund changed its fiscal year end from August 31 to May 31.
3 Audited by previous independent registered public accounting firm.
4 Based on the average daily shares outstanding.
5 Does not reflect the effect of sales charges, if any.
6 Total returns would have been lower had certain expenses not been reduced during the periods shown.
7 Not annualized.
8 Annualized.
9 Includes the impact of proxy expenses, which amounted to 0.04% of average net assets.
10 Interest expenses and fees are related to the Fund’s investment in inverse floater rate investments. Under accounting rules, the Fund recognizes additional income in an amount equal to these expenses.
| | |
| See notes to financial statements | Semiannual report | High Yield Municipal Bond Fund | 25 |
| | | | | | | |
| CLASS C SHARES Period ended | 11-30-101 | 5-31-10 | 5-31-092 | 8-31-08 | 8-31-07 | 8-31-06 | 8-31-053 |
| | | | | | | | |
| Per share operating performance | | | | | | | |
|
| Net asset value, beginning | | | | | | | |
| of period | $8.07 | $7.43 | $7.99 | $8.33 | $8.68 | $8.62 | $8.27 |
| Net investment income4 | 0.16 | 0.34 | 0.28 | 0.34 | 0.34 | 0.35 | 0.36 |
| Net realized and unrealized gain | | | | | | | |
| (loss) on investments | (0.11) | 0.63 | (0.58) | (0.33) | (0.35) | 0.05 | 0.36 |
| Total from investment operations | 0.05 | 0.97 | (0.30) | 0.01 | (0.01) | 0.40 | 0.72 |
| Less distributions | | | | | | | |
| From net investment income | (0.16) | (0.33) | (0.26) | (0.35) | (0.34) | (0.34) | (0.37) |
| Net asset value, end of period | $7.96 | $8.07 | $7.43 | $7.99 | $8.33 | $8.68 | $8.62 |
| Total return (%)5 | 0.577 | 13.306 | (3.59)7 | 0.066 | (0.15)6 | 4.836 | 8.82 |
| |
| Ratios and supplemental data | | | | | | | |
|
| Net assets, end of period (in millions) | $62 | $59 | $35 | $23 | $9 | $9 | $8 |
| Ratios (as a percentage of average | | | | | | | |
| net assets): | | | | | | | |
| Expenses before reductions | 1.738 | 1.76 | 1.908,9 | 1.84 | 1.88 | 1.84 | 1.89 |
| Interest and fees10 | — | — | — | 0.16 | 0.20 | — | — |
| Expenses net of fee waivers | 1.738 | 1.75 | 1.908,9 | 2.00 | 2.08 | 1.84 | 1.89 |
| Net investment income | 4.038 | 4.40 | 5.298 | 4.11 | 4.02 | 4.09 | 4.33 |
| Portfolio turnover (%) | 16 | 14 | 49 | 75 | 63 | 52 | 65 |
| |
1 Semiannual period from 6-1-10 to 11-30-10. Unaudited.
2 For the nine-month period ended 5-31-09. The Fund changed its fiscal year end from August 31 to May 31.
3 Audited by previous independent registered public accounting firm.
4 Based on the average daily shares outstanding.
5 Does not reflect the effect of sales charges, if any.
6 Total returns would have been lower had certain expenses not been reduced during the periods shown.
7 Not annualized.
8 Annualized.
9 Includes the impact of proxy expenses, which amounted to 0.04% of average net assets.
10 Interest expenses and fees are related to the Fund’s investment in inverse floater rate investments. Under accounting rules, the Fund recognizes additional income in an amount equal to these expenses.
| | |
| 26 | High Yield Municipal Bond Fund | Semiannual report | See notes to financial statements |
Notes to financial statements
(unaudited)
Note 1 — Organization
John Hancock High Yield Municipal Bond Fund (the Fund) is a non-diversified series of John Hancock Municipal Securities Trust (the Trust), an open-end management investment company organized as a Massachusetts business trust and registered under the Investment Company Act of 1940, as amended (the 1940 Act). The investment objective of the Fund is to seek a high level of current income that is largely exempt from federal income tax, consistent with the preservation of capital.
The Fund may offer multiple classes of shares. The shares currently offered are detailed in the Statement of Assets and Liabilities. Class A, Class B and Class C shares are offered to all investors. Shareholders of each class have exclusive voting rights to matters that affect that class. The distribution and service fees, if any, and transfer agent fees for each class may differ. Class B shares convert to Class A shares eight years after purchase.
Note 2 — Significant accounting policies
The financial statements have been prepared in conformity with accounting principles generally accepted in the United States of America, which require management to make certain estimates and assumptions at the date of the financial statements. Actual results could differ from those estimates. Events or transactions occurring after the end of the fiscal period through the date that the financial statements were issued have been evaluated in the preparation of the financial statements. The following summarizes the significant accounting policies of the Fund:
Security valuation. Investments are stated at value as of the close of regular trading on the New York Stock Exchange (NYSE), normally at 4:00 P.M., Eastern Time. The Fund uses a three-tier hierarchy to prioritize the pricing assumptions, referred to as inputs, used in valuation techniques to measure fair value. Level 1 includes quoted prices in active markets for identical securities. Level 2 includes significant observable inputs. Observable inputs may include quoted prices for similar securities, interest rates, prepayment speeds and credit risk. Prices for securities valued using these techniques are received from independent pricing vendors and brokers and are based on an evaluation of the inputs described. Level 3 includes significant unobservable inputs when market prices are not readily available or reliable, including the Fund’s own assumptions in determining the fair value of investments. The inputs or methodology used for valuing securities are not necessarily an indication of the risk associated with investing in those securities.
As of November 30, 2010, all investments are categorized as Level 2 under the hierarchy described above. During the six month period ended November 30, 2010, there were no significant transfers in or out of Level 2 assets.
In order to value the securities, the Fund uses the following valuation techniques. Debt obligations are valued based on the evaluated prices provided by an independent pricing service, which utilizes both dealer-supplied and electronic data processing techniques, taking into account factors such as institutional-size trading in similar groups of securities, yield, quality, coupon rate, maturity, type of issue, trading characteristics and other market data. Certain securities traded only in the over-the-counter market are valued at the last bid price quoted by brokers making markets in the securities at the close of trading. Certain short-term securities are valued at amortized cost. Other portfolio securities and assets, where market quotations are not readily available, are valued at fair value, as determined in good faith by the Fund’s Pricing Committee, following procedures established by the Board of Trustees.
| | |
| | Semiannual report | High Yield Municipal Bond Fund | 27 |
Repurchase agreements. The Fund may enter into repurchase agreements. When a Fund enters into a repurchase agreement it receives collateral which is held in a segregated account by the Fund’s custodian. The collateral amount is marked-to-market and monitored on a daily basis to ensure that the collateral held is in an amount not less than the principal amount of the repurchase agreement plus any accrued interest. In the event of a default by the counterparty, realization of the collateral proceeds could be delayed, during which time the collateral value may decline.
Security transactions and related investment income. Investment security transactions are accounted for on a trade date plus one basis for daily net asset value calculations. However, for financial reporting purposes, investment transactions are reported on trade date. Interest income is accrued as earned. Gains and losses on securities sold are determined on the basis of identified cost and may include proceeds from litigation. Interest income includes coupon interest and amortization/accretion of premiums/discounts on debt securities. Debt obligations may be placed in a non-accrual status and related interest income may be reduced by stopping current accruals and writing off interest receivable when the collection of all or a portion of interest has become doubtful.
Line of credit. The Fund may borrow from banks for temporary or emergency purposes, including meeting redemption requests that otherwise might require the untimely sale of securities. Pursuant to the custodian agreement, the custodian may loan money to a Fund to make properly authorized payments. The Fund is obligated to repay the custodian for any overdraft, including any related costs or expenses. The custodian has a lien, security interest or security entitlement in any Fund property that is not segregated, to the maximum extent permitted by law for any overdraft.
In addition, the Fund and other affiliated funds have entered into an agreement with State Street Bank and Trust Company which enables them to participate in a $100 million unsecured committed line of credit. A commitment fee, payable at the end of each calendar quarter, based on the average daily unused portion of the line of credit, is charged to each participating fund on a pro rata basis and is reflected in other expenses on the Statement of Operations. For the six months ended November 30, 2010, the Fund had no borrowings under the line of credit.
Expenses. The majority of expenses are directly attributable to an individual fund. Expenses that are not readily attributable to a specific fund are allocated among all funds in an equitable manner, taking into consideration, among other things, the nature and type of expense and the fund’s relative assets. Expense estimates are accrued in the period to which they relate and adjustments are made when actual amounts are known.
Class allocations. Income, common expenses, and realized and unrealized gains (losses) are determined at the fund level and allocated daily to each class of shares based on the net asset value of the class. Class-specific expenses, such as distribution and service fees, if any, and transfer agent fees, for all classes, are calculated daily at the class level based on the appropriate net asset value of each class and the specific expense rates applicable to each class.
Federal income taxes. The Fund intends to continue to qualify as a regulated investment company by complying with the applicable provisions of the Internal Revenue Code and will not be subject to federal income tax on taxable income that is distributed to shareholders. Therefore, no federal income tax provision is required.
For federal income tax purposes, the Fund has a capital loss carryforward of $16,394,645 available to offset future net realized capital gains as of May 31, 2010. The following table details the capital loss carryforward available as of May 31, 2010.
| |
| 28 | High Yield Municipal Bond Fund | Semiannual report |
| | | | | | | |
| CAPITAL LOSS CARRYFORWARD EXPIRING AT MAY 31 | | | | |
| |
| 2011 | 2012 | 2013 | 2014 | 2015 | 2016 | 2017 | 2018 |
|
| $2,540,698 | $2,816,241 | $1,681,342 | $119,574 | $1,176,656 | $502,278 | $3,292,390 | $4,265,466 |
As of May 31, 2010, the Fund had no uncertain tax positions that would require financial statement recognition, de-recognition or disclosure. The Fund’s federal tax return is subject to examination by the Internal Revenue Service for a period of three years.
Distribution of income and gains. Distributions to shareholders from net investment income and net realized gains, if any, are recorded on the ex-date. The Fund generally declares dividends daily and pays them monthly. Capital gain distributions, if any, are distributed annually.
Distributions paid by the Fund with respect to each class of shares are calculated in the same manner, at the same time and are in the same amount, except for the effect of expenses that may be applied differently to each class.
Such distributions, on a tax basis, are determined in conformity with income tax regulations, which may differ from accounting principles generally accepted in the United States of America. Material distributions in excess of tax basis earnings and profits, if any, are reported in the Fund’s financial statements as a return of capital.
Capital accounts within financial statements are adjusted for permanent book-tax differences. These adjustments have no impact on net assets or the results of operations. Temporary book-tax differences, if any, will reverse in a subsequent period. Permanent book-tax differences are primarily attributable to expiration of capital loss carryforward and amortization and accretion on debt securities.
Note 3 — Guarantees and indemnifications
Under the Fund’s organizational documents, its Officers and Trustees are indemnified against certain liabilities arising out of the performance of their duties to the Fund. Additionally, in the normal course of business, the Fund enters into contracts with service providers that contain general indemnification clauses. The Fund’s maximum exposure under these arrangements is unknown, as this would involve future claims that may be made against the Fund that have not yet occurred. The risk of material loss from such claims is considered remote.
Note 4 — Fees and transactions with affiliates
John Hancock Advisers, LLC (the Adviser) serves as investment adviser for the Fund. John Hancock Funds, LLC (the Distributor), an affiliate of the Adviser, serves as principal underwriter of the Fund. The Adviser and the Distributor are indirect wholly owned subsidiaries of Manulife Financial Corporation (MFC).
Management fee. The Fund has an investment management contract with the Adviser under which the Fund pays a daily management fee to the Adviser equivalent, on an annual basis, to the sum of: (a) 0.6250% of the first $75,000,000 of the Fund’s average daily net asset value, (b) 0.5625% of the next $75,000,000, (c) 0.5000% of the next $1,850,000,000, (d) 0.4800% of the next $2,000,000,000 and (e) 0.4500% of the Fund’s average daily net asset value in excess of $4,000,000,000. The Adviser has a subadvisory agreement with John Hancock Asset Management a division of Manulife Asset Management (US) LLC (formerly MFC Global Investment Management (U.S.), LLC), an indirect owned subsidiary of MFC and an affiliate of the Adviser. The Fund is not responsible for payment of the subadvisory fees.
The investment management fees incurred for the six months ended November 30, 2010 were equivalent to an annual effective rate of 0.55% of the Fund’s average daily net assets.
| | |
| | Semiannual report | High Yield Municipal Bond Fund | 29 |
Accounting and legal services. Pursuant to the service agreement, the Fund reimburses the Adviser for all expenses associated with providing the administrative, financial, legal, accounting and recordkeeping services of the Fund, including the preparation of all tax returns, periodic reports to shareholders and regulatory reports, among other services. These expenses are allocated to each share class based on its relative net assets at the time the expense was incurred. The accounting and legal services fees incurred for the six months ended November 30, 2010 amounted to an annual rate of 0.01% of the Fund’s average daily net assets.
Distribution and service plans. The Fund has a distribution agreement with the Distributor. The Fund has adopted distribution and service plans with respect to Class A, Class B and Class C shares pursuant to Rule 12b-1 under the 1940 Act, to pay the Distributor for services provided as the distributor of shares of the Fund. The Fund may pay up to the following contractual rates of distribution and service fees under these arrangements, expressed as an annual percentage of average daily net assets for each class of the Fund’s shares.
| | | |
| CLASS | 12b–1 FEE | | |
| | |
| Class A | 0.25% | | |
| Class B | 1.00% | | |
| Class C | 1.00% | | |
Sales charges. Class A shares are assessed up-front sales charges, which resulted in payments to the Distributor amounting to $352,036 for the six months ended November 30, 2010. Of this amount, $354 was retained and used for printing prospectuses, advertising, sales literature and other purposes, $349,838 was paid as sales commissions to broker-dealers and $1,844 was paid as sales commissions to sales personnel of Signator Investors, Inc. (Signator Investors), a broker-dealer affiliate of the Adviser.
Class B and Class C shares are subject to contingent deferred sales charges (CDSC). Class B shares that are redeemed within six years of purchase are subject to CDSC, at declining rates, beginning at 5.00% of the lesser of the current market value at the time of redemption or the original purchase cost of the shares being redeemed. Class C shares that are redeemed within one year of purchase are subject to a 1.00% CDSC on the lesser of the current market value at the time of redemption or the original purchase cost of the shares being redeemed. Proceeds from CDSCs are used to compensate the Distributor for providing distribution-related services in connection with the sale of these shares. During the six months ended November 30, 2010, CDSCs received by the Distributor amounted to $5,753 and $4,930 for Class B and Class C shares, respectively.
Transfer agent fees. The Fund has a transfer agent agreement with John Hancock Signature Services, Inc. (Signature Services or Transfer Agent), an affiliate of the Adviser. The transfer agent fees paid to Signature Services are determined based on the cost to Signature Services (Signature Services Cost) of providing recordkeeping services. The Signature Services Cost includes a component of allocated John Hancock corporate overhead for providing transfer agent services to the Fund and to all other John Hancock affiliated funds. It also includes out-of-pocket expenses that are comprised of payments made to third-parties for recordkeeping services provided to their clients who invest in one or more John Hancock funds. In addition, Signature Services Cost may be reduced by certain revenues that Signature Services received in connection with the service they provide to the funds. Signature Services Cost is calculated m onthly and allocated, as applicable, to four categories of share classes: Institutional Share Classes, Retirement Share Classes, Municipal Bond Classes and all other Retail Share Classes. Within each of these categories, the applicable costs are allocated to the affected John Hancock affiliated funds and/or classes, based on the relative average daily net assets.
| |
| 30 | High Yield Municipal Bond Fund | Semiannual report |
Prior to July 1, 2010, the transfer agent fees were made up of three components:
• The Fund paid a monthly transfer agent fee at an annual rate of 0.01% for all classes, based on each class’s average daily net assets.
• The Fund paid a monthly fee based on an annual rate of $17.50 per shareholder account for all classes.
• In addition, Signature Services was reimbursed for certain out-of-pocket expenses.
Class level expenses. Class level expenses for the six months ended November 30, 2010 were:
| | | |
| | DISTRIBUTION AND | TRANSFER | |
| CLASS | SERVICE FEES | AGENT FEES | |
| |
| Class A | $283,916 | $95,050 | |
| Class B | 45,100 | 3,959 | |
| Class C | 311,840 | 26,040 | |
| Total | $640,856 | $125,049 | |
Trustee expenses. The Trust compensates each Trustee who is not an employee of the Adviser or its affiliates. These Trustees may, for tax purposes, elect to defer receipt of this compensation under the John Hancock Group of Funds Deferred Compensation Plan (the Plan). Deferred amounts are invested in various John Hancock funds and remain in the funds until distributed in accordance with the Plan. The investment of deferred amounts and the offsetting liability are included within other receivables and prepaid assets and payable to affiliates — Trustees’ fees, respectively, in the accompanying Statement of Assets and Liabilities.
Note 5 — Fund share transactions
Transactions in Fund shares for the six months ended November 30, 2010 and year ended May 31, 2010 were as follows:
| | | | |
| | Six months ended 11-30-10 | Year ended 5-31-10 |
| | Shares | Amount | Shares | Amount |
| Class A shares | | | | |
|
| Sold | 6,224,000 | $50,925,199 | 12,585,622 | $98,015,504 |
| Distributions reinvested | 438,797 | 3,577,143 | 732,919 | 5,751,558 |
| Repurchased | (4,267,803) | (34,764,212) | (6,329,377) | (49,430,949) |
| | | | | |
| Net increase | 2,394,994 | $19,738,130 | 6,989,164 | $54,336,113 |
| |
| Class B shares | | | | |
|
| Sold | 172,185 | $1,407,892 | 325,326 | $2,522,582 |
| Distributions reinvested | 11,780 | 95,946 | 24,432 | 191,244 |
| Repurchased | (163,175) | (1,329,785) | (330,214) | (2,581,992) |
| | | | | |
| Net increase | 20,790 | $174,053 | 19,544 | $131,834 |
| |
| Class C shares | | | | |
|
| Sold | 1,267,271 | $10,341,768 | 3,662,614 | $28,417,457 |
| Distributions reinvested | 92,064 | 750,050 | 153,298 | 1,205,134 |
| Repurchased | (937,619) | (7,621,293) | (1,206,543) | (9,454,423) |
| | | | | |
| Net increase | 421,716 | $3,470,525 | 2,609,369 | $20,168,168 |
| |
| Net increase | 2,837,500 | $23,382,708 | 9,618,077 | $74,636,115 |
|
Note 6 — Purchase and sale of securities
Purchases and sales of securities, other than short-term securities, aggregated to $66,929,923 and $45,384,372, respectively, for the six months ended November 30, 2010.
| | |
| | Semiannual report | High Yield Municipal Bond Fund | 31 |
Board Consideration of and Continuation of Investment Advisory Agreement and Subadvisory Agreement
The Board of Trustees (the Board, the members of which are referred to as Trustees) of John Hancock High Yield Municipal Bond Fund (the Fund), a series of John Hancock Municipal Securities Trust (the Trust), met in-person on May 2–4 and June 6–8, 2010 to consider the approval of the Fund’s investment advisory agreement (the Advisory Agreement) with John Hancock Advisers, LLC (the Adviser), the Fund’s investment adviser. The Board also considered the approval of the investment subadvisory agreement (the Subadvisory Agreement) among the Adviser, John Hancock Asset Management a division of Manulife Asset Management (US) LLC (the Subadviser) and the Trust on behalf of the Fund. The Advisory Agreement and the Subadvisory Agreement are referred to as the Agreements.
Activities and composition of the Board
The Board consists of eleven individuals, nine of whom are Independent Trustees. Independent Trustees are generally those individuals who are unaffiliated with the Fund, the Adviser and the Subadviser. The Trustees are responsible for the oversight of operations of the Fund and perform the various duties required of directors of investment companies by the Investment Company Act of 1940, as amended (the 1940 Act). The Independent Trustees have retained independent legal counsel to assist them in connection with their duties. The Board has appointed an Independent Trustee as Chairperson. The Board has established four standing committees that are composed entirely of Independent Trustees: the Audit Committee; the Compliance Committee; the Nominating, Governance and Administration Committee; and the Contracts/Operations Committee. Additionally, Investment Performance Committee A is a standing committee of the Board that is composed of Independent Trustees and one Trustee who is affiliated with the Adviser. Investment Performance Committee A oversees and monitors matters relating to the investment performance of the Fund. The Board has also designated a Vice Chairperson to serve in the absence of the Chairperson, who also serves as Chairman of the Board’s Nominating, Governance and Administration Committee. The Board also designates working groups or ad hoc committees as it deems appropriate.
The approval process
Pursuant to the 1940 Act, the Board is required to consider the continuation of the Agreements on an annual basis. Throughout the year, the Board, acting directly and through its committees, regularly reviews and assesses the quality of the services that the Fund receives under these Agreements. In this regard, the Board reviews reports of the Adviser at least quarterly, which include, among other things, Fund performance reports and compliance reports. In addition, the Board meets with portfolio managers and senior investment officers at various times throughout the year. The Board considers at each of its meetings factors that are relevant to its annual consideration of the renewal of the Agreements, including the services and support provided by the Adviser and Subadviser to the Fund and its shareholders.
Prior to the May 2–4, 2010 meeting, the Board requested and received materials specifically relating to the Agreements. The materials provided in connection with the May meeting included information independently compiled and prepared by Morningstar, Inc. (Morningstar) on Fund fees and expenses, and the investment performance of the Fund. This Fund information is assembled in a format that permits comparison with similar information from a category of relevant funds (the Category) and a peer group of comparable funds (the Peer Group) as determined by Morningstar, and its benchmark index. Other material provided for the Fund review included (a) information on the profitability of the Agreements to the Adviser and a discussion of any additional benefits to the Adviser and its affiliates that result from being the Adviser or Subadviser to the Fund; (b) a general analysis provided by the Adviser and the Subadviser concerning investment advisory fees charge d to other clients, such as institutional clients and other investment companies, under similar investment mandates, as well as the performance of such other clients;
| |
| 32 | High Yield Municipal Bond Fund | Semiannual report |
(c) the impact of economies of scale; (d) a summary of aggregate amounts paid by the Fund to the Adviser; and (e) sales and redemption data regarding the Fund’s shares.
At an in-person meeting held on May 2–4, 2010, the Board reviewed materials relating to its consideration of the Agreements. As a result of the discussions that occurred during the May 2–4, 2010 meeting, the Board presented the Adviser and Subadviser with questions and requests for additional information and the Adviser and Subadviser responded to these requests with additional written information in advance of the June 6–8, 2010 Board meeting. The Board also reviewed these additional materials relating to its consideration of the Agreements.
At an in-person meeting held on June 6–8, 2010, the Board, including the Independent Trustees, formally considered the continuation of the Advisory Agreement between the Adviser and the Fund and the Subadvisory Agreement among the Adviser, the Subadviser and the Trust on behalf of the Fund, each for an additional one-year term. The Board considered all factors it believed relevant with respect to the Fund, including, among other factors: (a) the nature, extent and quality of the services provided by the Adviser and the Subadviser; (b) the investment performance of the Fund and portfolio management of the Subadviser; (c) the advisory fees and the cost of the services and profits to be realized by the Adviser and certain affiliates from their relationship with the Fund; (d) economies of scale; and (e) other factors.
The Board also considered other matters important to the approval process, such as payments made to the Adviser or its affiliates relating to the distribution of Fund shares and other services. The Board reviewed services related to the valuation and pricing of Fund portfolio holdings. Other important matters considered by the Board were the direct and indirect benefits to the Adviser, the Subadviser, and their affiliates from their relationship with the Fund and advice from independent legal counsel with respect to the review process and materials submitted for the Board’s review. Each Trustee may have attributed different weights to the various items considered.
The key factors considered by the Board and the conclusions reached are described below.
Nature, extent and quality of services
The Board, including the Independent Trustees, reviewed the nature, extent and quality of services provided by the Adviser and the Subadviser, including the investment advisory services and the resulting performance of the Fund. The Board reviewed the Adviser’s and Subadviser’s senior management personnel responsible for investment operations, including the senior investment officers. The Board also reviewed the materials provided by the Fund’s portfolio management team discussing Fund performance and the Fund’s investment objective, strategies and outlook.
The Board considered the ability of the Adviser and the Subadviser, based on their resources, reputation and other attributes, to attract and retain qualified investment professionals, including research, advisory, and supervisory personnel. It considered the background and experience of senior management and investment professionals responsible for managing the Fund. The Board considered the investment philosophy, research and investment decision-making processes of the Adviser and the Subadviser responsible for the daily investment activities of the Fund, including, among other things, portfolio trading capabilities, use of technology, commitment to compliance and approach to training and retaining portfolio managers and other research, advisory and management personnel.
The Board considered the Subadviser’s history and experience with the Fund. The Board considered the Adviser’s execution of its oversight responsibilities. The Board further considered the culture of compliance, resources dedicated to compliance, compliance programs, record of compliance with applicable laws and regulation, with the Fund’s investment policies and restrictions and with the applicable Code of Ethics, and the responsibilities of the Adviser’s and Subadviser’s compliance departments.
| | |
| | Semiannual report | High Yield Municipal Bond Fund | 33 |
In addition to advisory services, the Board considered the quality of the administrative and non-investment advisory services provided to the Fund by the Adviser under a separate agreement. The Board noted that the Adviser and its affiliates provide the Fund with certain administrative, transfer agency, shareholder and other services (in addition to any such services provided to the Fund by third parties) and officers and other personnel as are necessary for the operations of the Fund.
The Board reviewed the structure and duties of the Adviser’s administration, accounting, legal and compliance departments and considered the Adviser’s policies and procedures for assuring compliance with applicable laws and regulations.
The Board also received information about the nature, extent and quality of services and fee rates offered by the Adviser and Subadviser to their other clients, including other registered investment companies, institutional investors and separate accounts. The Board reviewed a general analysis provided by the Adviser and the Subadviser concerning investment advisory fees charged to such other clients under similar investment mandates, the services provided to such other clients as compared to the services provided to the Fund, the performance of such other clients, and other factors relating to such other clients. The Board considered the significant differences between the Adviser’s and Subadviser’s services to the Fund and those services they provide to other clients which, to the extent the other client is not a mutual fund, may generally be attributable to the greater frequency of shareholder redemptions in a mutual fund, the higher turnover o f mutual fund assets, the more burdensome regulatory and legal obligations of mutual funds, and the higher marketing costs for mutual funds.
Fund performance
The Board, including the Independent Trustees, reviewed and considered the performance history of the Fund. The Board was provided with reports, independently prepared by Morningstar, which included a comprehensive analysis of the Fund’s performance. The Board also reviewed a narrative and statistical analysis of the Morningstar data that was prepared by the Adviser, which analyzed various factors that may affect the Morningstar rankings. The Board reviewed information regarding the investment performance of the Fund as compared to its Morningstar Category and Peer Group as well as its benchmark index (see chart below). The Board was provided with a description of the methodology used by Morningstar to select the funds in the Category and the Peer Group. The Board also considered updated performance information provided by the Adviser at its May and June 2010 meetings. The Board regularly reviews the performance of the Fund throughout the year and atta ches more importance to performance over relatively longer periods of time, typically three to five years.
| | | | |
| | 1 YEAR | 3 YEAR | 5 YEAR | 10 YEAR |
|
| High-Yield Municipal Bond Fund | 25.17% | 1.68% | 3.71% | 4.62% |
| BarCap Municipal TR Index | 12.91% | 4.41% | 4.32% | 5.75% |
| High Yield Muni Category Median | 29.52% | –0.84% | 2.01% | 4.26% |
| Morningstar 15(c) Peer Group Median | 29.41% | –1.63% | 1.81% | 4.35% |
The Board noted that the Subadviser remained consistent with its investment style and adhered to its investment mandates.
Expenses and fees
The Board, including the Independent Trustees, reviewed the Fund’s contractual advisory fee rate payable by the Fund to the Adviser as compared with the other funds in its Category and Peer Group. The Board also received information about the investment subadvisory fee rate payable by the Adviser to the Subadviser for investment subadvisory services. The Board considered the services provided and the fees charged by the Adviser and the Subadviser to other types of clients with similar investment mandates, including separately managed institutional accounts.
| |
| 34 | High Yield Municipal Bond Fund | Semiannual report |
In addition, the Board considered the cost of the services provided to the Fund by the Adviser. The Board received and considered expense information regarding the Fund’s various components, including advisory fees, distribution fees and fees other than advisory and distribution fees, including transfer agent fees, custodian fees, administration fees and other miscellaneous fees (e.g., fees for accounting and legal services). The Board considered comparisons of these expenses to the Peer Group median. The Board also considered expense information regarding the Fund’s total operating expense ratio (Gross Expense Ratio) and total operating expense ratio after taking any fee waiver arrangement applicable to the Advisory Agreement rate into account (Net Expense Ratio). The Board considered information comparing the Gross Expense Ratio and Net Expense Ratio of the Fund to that of the Peer Group and Category medians. As part of its analysis, the Board reviewed the Adviser’s methodology in allocating its costs to the management of the Fund. The Board considered expenses and fee rates to be higher or lower if they were over or under 10 basis points, respectively; slightly higher or slightly lower if they were above or below 6–10 basis points, respectively; and inline if they were above or below by 5 basis points.
The Board noted that the investment advisory rate was inline with the Category and Peer Group medians. The Board noted the following information about the Fund’s Gross and Net Expense Ratios in relation with the Fund’s Peer Group and Category:
| | | |
| EXPENSE RATIO | | RELATION TO PEER GROUP | RELATION TO CATEGORY |
|
| Gross Expense Ratio (Class A) | 1.04% | Inline | Higher |
| Net Expense Ratio (Class A) | 1.03% | Higher | Higher |
The Board favorably considered the impact of fee waivers towards ultimately lowering the Fund’s Gross Expense Ratio. The Board also received and considered information relating to the Fund’s Gross Expense Ratio and Net Expense Ratio that reflected a proposed change in the methodology for calculating transfer agent fees.
The Board received and reviewed statements relating to the Adviser’s financial condition and profitability with respect to the services it provides the Fund. The Board was also provided with a profitability analysis that detailed the revenues earned and the expenses incurred by the Adviser for services provided to the Fund. The Board reviewed the Adviser’s profitability with respect to the Fund and other funds the Board currently oversees for the year ended December 31, 2009 compared to available aggregate profitability data provided for the year ended December 31, 2008.
The Board received and considered a detailed profitability analysis of the Adviser based on the Advisory Agreement, as well as on other relationships between the Fund and the Adviser and its affiliates. The Board also considered a comparison of the Adviser’s profitability to that of other similar investment advisers whose profitability information is publicly available. The Board reviewed the Adviser’s profitability with respect to other fund complexes managed by the Adviser and/or its affiliates. The Board reviewed the Adviser’s assumptions and methodology of allocating expenses in the profitability analysis, noting the inherent limitations in allocating costs among various advisory products. The Board recognized that profitability may be affected by numerous factors including, among other things, fee waivers and expense reimbursements by the Adviser, the types of funds managed, expense allocations and business mix, and therefore comparabili ty of profitability is somewhat limited.
The Board considered the profitability information with respect to the Subadviser, which is affiliated with the Adviser. In addition, as noted above, the Board considered the methodologies involved in allocating such profit to the Subadviser.
Economies of scale
The Board, including the Independent Trustees, considered the extent to which economies of scale might be realized as the assets of the Fund increase and whether there should be changes in the
| | |
| | Semiannual report | High Yield Municipal Bond Fund | 35 |
advisory fee rate or structure in order to enable the Fund to participate in these economies of scale, for example through the use of breakpoints in the advisory fee based upon the assets of the Fund. The Board also considered the Adviser’s overall operations and its efforts to expand the scale of, and improve the quality of, its operations.
The Board recognized the inherent limitations of any analysis of economies of scale, stemming largely from the Board’s understanding that most of the Adviser’s costs are not specific to individual funds, but rather are incurred across a variety of products and services. To ensure that any economies are reasonably shared with the Fund as its assets increase, the Adviser and the Board agreed to continue the existing breakpoints to the Agreement fee rate.
Other benefits to the Adviser and the Subadviser
The Board understands that the Adviser, the Subadviser, or their affiliates may derive other ancillary benefits from their relationship with the Fund, both tangible and intangible, such as their ability to leverage investment professionals who manage other portfolios, an increase in their profile in the investment advisory community, and the engagement of their affiliates and/or significant shareholders as service providers to the Fund, including for administrative, transfer agency and distribution services. The Board believes that certain of these benefits are difficult to quantify. The Board also was informed that the Subadviser may use third party research obtained by soft dollars generated by certain mutual fund transactions to assist itself in managing all or a number of its other client accounts.
Board determination
The Board, including the Independent Trustees, unanimously approved the continuation of the Advisory Agreement between the Adviser and the Fund for an additional one-year term and the Subadvisory Agreement among the Adviser, the Subadviser and the Trust on behalf of the Fund for an additional one-year term. Based upon its evaluation of relevant factors in their totality, the Board, including a majority of the Independent Trustees, was satisfied that the terms of the Agreements were fair and reasonable and in the best interest of the Fund and its shareholders. In arriving at a decision to approve the Agreements, the Board did not identify any single factor listed above, or any group of factors listed above, as all-important or controlling, but considered all factors together, and different Trustees may have attributed different weights to the various factors considered. The Independent Trustees were also assisted by the advice of independent legal counsel in making this determination. The Board noted that contractual fee arrangements for the Fund reflect the results of several years of review by the Board and certain predecessor Trustees, and discussions between such Trustees (and predecessor Trustees) and the Adviser. Certain aspects of the arrangements may be the subject of more attention in some years than in others, and the Trustees’ conclusions may be based in part on their consideration of these arrangements in prior years.
| |
| 36 | High Yield Municipal Bond Fund | Semiannual report |
More information
| | |
| Trustees | Investment adviser | |
| Steven R. Pruchansky,* Chairperson*** | John Hancock Advisers, LLC | |
| James F. Carlin | | |
| William H. Cunningham | Subadviser | |
| Deborah C. Jackson* | John Hancock Asset Management | |
| Charles L. Ladner | (formerly MFC Global Investment | |
| Stanley Martin* | Management (U.S.), LLC) | |
| Hugh McHaffie†** | | |
| Dr. John A. Moore | Principal distributor | |
| Patti McGill Peterson | John Hancock Funds, LLC | |
| Gregory A. Russo | | |
| John G. Vrysen† | Custodian | |
| | State Street Bank and Trust Company | |
| Officers | | |
| Keith F. Hartstein | Transfer agent | |
| President and Chief Executive Officer | John Hancock Signature Services, Inc. | |
| | |
| Andrew G. Arnott | Legal counsel | |
| Senior Vice President** and Chief Operating Officer | K&L Gates LLP | |
|
| |
| Thomas M. Kinzler | The report is certified under the Sarbanes-Oxley | |
| Secretary and Chief Legal Officer | Act, which requires mutual funds and other public | |
| companies to affirm that, to the best of their | |
| Francis V. Knox, Jr. | knowledge, the information in their financial reports | |
| Chief Compliance Officer | is fairly and accurately stated in all material respects. | |
|
| |
| Charles A. Rizzo | | |
| Chief Financial Officer | | |
| | | |
| Salvatore Schiavone** | | |
| Treasurer | | |
| | | |
| *Member of the Audit Committee | | |
| **Effective 8-31-10 | | |
| ***Effective 1-1-11 | | |
| †Non-Independent Trustee | | |
The Fund’s proxy voting policies and procedures, as well as the Fund’s proxy voting record for the most recent twelve-month period ended June 30, are available free of charge on the Securities and Exchange Commission (SEC) Web site at www.sec.gov or on our Web site.
The Fund’s complete list of portfolio holdings, for the first and third fiscal quarters, is filed with the SEC on Form N-Q. The Fund’s Form N-Q is available on our Web site and the SEC’s Web site, www.sec.gov, and can be reviewed and copied (for a fee) at the SEC’s Public Reference Room in Washington, DC. Call 1-800-SEC-0330 to receive information on the operation of the SEC’s Public Reference Room.
We make this information on your fund, as well as monthly portfolio holdings, and other fund details available on our Web site www.jhfunds.com or by calling 1-800-225-5291.
| | |
| You can also contact us: | | |
| 1-800-225-5291 | Regular mail: | Express mail: |
| jhfunds.com | John Hancock Signature Services, Inc. | John Hancock Signature Services, Inc. |
| | P.O. Box 55913 | Mutual Fund Image Operations |
| | Boston, MA 02205-5913 | 30 Dan Road |
| | | Canton, MA 02021 |
| | |
| | Semiannual report | High Yield Municipal Bond Fund | 37 |

1-800-225-5291
1-800-554-6713 TDD
1-800-338-8080 EASI-Line
www.jhfunds.com
Now available: electronic delivery
www.jhfunds.com/edelivery
| |
| This report is for the information of the shareholders of John Hancock High Yield Municipal Bond Fund. | 590SA 11/10 |
| It is not authorized for distribution to prospective investors unless preceded or accompanied by a prospectus. | 1/11 |
ITEM 2. CODE OF ETHICS.
Not applicable at this time.
ITEM 3. AUDIT COMMITTEE FINANCIAL EXPERT.
Not applicable at this time.
ITEM 4. PRINCIPAL ACCOUNTANT FEES AND SERVICES.
Not applicable at this time.
ITEM 5. AUDIT COMMITTEE OF LISTED REGISTRANTS.
Not applicable at this time.
ITEM 6. SCHEDULE OF INVESTMENTS.
(a) Not applicable.
(b) Not applicable.
ITEM 7. DISCLOSURE OF PROXY VOTING POLICIES AND PROCEDURES FOR CLOSED-END MANAGEMENT INVESTMENT COMPANIES.
Not applicable.
ITEM 8. PORTFOLIO MANAGERS OF CLOSED-END MANAGEMENT INVESTMENT COMPANIES.
Not applicable.
ITEM 9. PURCHASES OF EQUITY SECURITIES BY CLOSED-END MANAGEMENT INVESTMENT COMPANY AND AFFILIATED PURCHASERS.
Not applicable.
ITEM 10. SUBMISSION OF MATTERS TO A VOTE OF SECURITY HOLDERS.
Not applicable.
ITEM 11. CONTROLS AND PROCEDURES.
(a) Based upon their evaluation of the registrant's disclosure controls and procedures as conducted within 90 days of the filing date of this Form N-CSR, the registrant's principal executive officer and principal financial officer have concluded that those disclosure controls and procedures provide reasonable assurance that the material information required to be disclosed by the registrant on this report is recorded, processed, summarized and reported within the time periods specified in the Securities and Exchange Commission's rules and forms.
(b) There were no changes in the registrant's internal control over financial reporting that occurred during the registrant's most recent fiscal half-year (the registrant's second fiscal half-year in the case of an annual report) that have materially affected, or are reasonably likely to materially affect, the registrant's internal control over financial reporting.
ITEM 12. EXHIBITS.
(a) Separate certifications for the registrant's principal executive officer and principal financial officer, as required by Section 302 of the Sarbanes-Oxley Act of 2002 and Rule 30a-2(a) under the Investment Company Act of 1940, are attached.
(b) Separate certifications for the registrant's principal executive officer and principal financial officer, as required by 18 U.S.C. Section 1350, as adopted pursuant to Section 906 of the Sarbanes-Oxley Act of 2002, and Rule 30a-2(b) under the Investment Company Act of 1940, are attached. The certifications furnished pursuant to this paragraph are not deemed to be "filed" for purposes of Section 18 of the Securities Exchange Act of 1934, or otherwise subject to the liability of that section. Such certifications are not deemed to be incorporated by reference into any filing under the Securities Act of 1933 or the Securities Exchange Act of 1934, except to the extent that the Registrant specifically incorporates them by reference.
(c)(1) Contact person at the registrant.
Pursuant to the requirements of the Securities Exchange Act of 1934 and the Investment Company Act of 1940, the registrant has duly caused this report to be signed on its behalf by the undersigned, thereunto duly authorized.
John Hancock Municipal Securities Trust
By: /s/ Keith F. Hartstein
Keith F. Hartstein
President and Chief Executive Officer
Date: January 24, 2011
Pursuant to the requirements of the Securities Exchange Act of 1934 and the Investment Company Act of 1940, this report has been signed below by the following persons on behalf of the registrant and in the capacities and on the dates indicated.
By: /s/ Keith F. Hartstein
Keith F. Hartstein
President and Chief Executive Officer
Date: January 24, 2011
By: /s/ Charles A. Rizzo
Charles A. Rizzo
Chief Financial Officer
Date: January 24, 2011