| |
| UNITED STATES |
| SECURITIES AND EXCHANGE COMMISSION |
| Washington, D. C. 20549 |
| |
| FORM N-CSR |
| |
| CERTIFIED SHAREHOLDER REPORT OF REGISTERED |
| MANAGEMENT INVESTMENT COMPANIES |
| |
| Investment Company Act file number 811- 5968 |
| |
| John Hancock Municipal Securities Trust |
| (Exact name of registrant as specified in charter) |
| |
| 601 Congress Street, Boston, Massachusetts 02210 |
| (Address of principal executive offices) (Zip code) |
| |
| Alfred P. Ouellette |
| Senior Counsel and Assistant Secretary |
| |
| 601 Congress Street |
| |
| Boston, Massachusetts 02210 |
| |
| (Name and address of agent for service) |
| |
| Registrant's telephone number, including area code: 617-663-4324 |
| |
| Date of fiscal year end: | August 31 |
| |
| |
| Date of reporting period: | February 29, 2008 |
ITEM 1. REPORT TO SHAREHOLDERS.

A look at performance
For the periods ended February 29, 2008
| | | | | | | | | | | | | | |
| | | | Average annual returns | | | Cumulative total returns | | | | |
| | | | with maximum sales charge (POP) | | with maximum sales charge (POP) | | | | SEC 30- |
| | |
| |
| | day yield |
| | Inception | | | | | Since | | | | | | Since | | as of |
| Class | date | | 1-year | 5-year | 10-year | inception | | 6 months | 1-year | 5-year | 10-year | inception | | 2-29-08 |
|
| A | 1-5-90 | | –7.13% | 2.28% | 3.24% | — | | –5.70% | –7.13% | 11.91% | 37.54% | — | | 3.91% |
|
| B | 12-31-91 | | –8.11 | 2.12 | 3.10 | — | | –6.45 | –8.11 | 11.05 | 35.70 | — | | 3.30 |
|
| C | 4-1-99 | | –4.38 | 2.46 | — | 2.84% | | –2.58 | –4.38 | 12.91 | — | 28.31% | | 3.31 |
|
Performance figures assume all distributions are reinvested. Public offering price (POP) figures reflect maximum sales charge on Class A shares of 4.5% and the applicable contingent deferred sales charge (CDSC) on Class B and Class C shares. The returns for Class C shares have been adjusted to reflect the elimination of the front-end sales charge effective July 15, 2004. The Class B shares’ CDSC declines annually between years 1 to 6 according to the following schedule: 5, 4, 3, 3, 2, 1%. No sales charge will be assessed after the sixth year. Class C shares held for less than one year are subject to a 1% CDSC.
The expense ratios of the Fund, both net (including any fee waivers or expense limitations) and gross (excluding any fee waivers or expense limitations), are set forth according to the most recent publicly available prospectus for the Fund and may differ from the expense ratios disclosed in the Financial Highlights tables in this report. The net expenses equal the gross expenses and are as follows: Class A — 1.03%, Class B — 1.78%, Class C — 1.78% . The expenses, excluding interest expense, are as follows: Class A — 0.95%, Class B — 1.70%, Class C — 1.70% .
The returns reflect past results and should not be considered indicative of future performance. The return and principal value of an investment will fluctuate so that shares, when redeemed, may be worth more or less than their original cost. Due to market volatility, the Fund’s current performance may be higher or lower than the performance shown. For performance data current to the most recent month end, please call 1-800-225-5291 or visit the Fund’s Web site at www.jhfunds.com.
The performance table above and the chart on the next page do not reflect the deduction of taxes that a shareholder would pay on fund distributions or the redemption of fund shares. Please note that a portion of the Fund’s income may be subject to taxes, and some investors may be subject to the Alternative Minimum Tax (AMT). Also note that capital gains are taxable.
The Fund’s performance results reflect any applicable expense reductions, without which the expenses would increase and results would have been less favorable.
Tax-Free Bond Fund | Semiannual report
6
Growth of $10,000
This chart shows what happened to a hypothetical $10,000 investment in Tax-Free Bond Fund Class A shares for the period indicated. For comparison, we’ve shown the same investment in the Lehman Brothers Municipal Bond Index.

| | | | |
| | | | With maximum | |
| Class | Period beginning | Without sales charge | sales charge | Index |
|
| B2 | 2-28-98 | $13,570 | $13,570 | $15,837 |
|
| C 2 | 4-1-99 | 12,831 | 12,831 | 14,900 |
|
Assuming all distributions were reinvested for the period indicated, the table above shows the value of a $10,000 investment in the Fund’s Class B and Class C shares, respectively, as of February 29, 2008. The Class C shares investment with maximum sales charge has been adjusted to reflect the elimination of the front-end sales charge effective July 15, 2004. Performance of the classes will vary based on the difference in sales charges paid by shareholders investing in the different classes and the fee structure of those classes.
Lehman Brothers Municipal Bond Index is an unmanaged index that includes municipal bonds and is commonly used as a measure of bond performance.
It is not possible to invest directly in an index. Index figures do not reflect sales charges, which would have resulted in lower values if they did.
1 NAV represents net asset value and POP represents public offering price.
2 No contingent deferred sales charge applicable.
Semiannual report | Tax-Free Bond Fund
7
Your expenses
These examples are intended to help you understand your ongoing operating expenses.
Understanding fund expenses
As a shareholder of the Fund, you incur two types of costs:
■ Transaction costs which include sales charges (loads) on purchases or redemptions (varies by share class), minimum account fee charge, etc.
■ Ongoing operating expenses including management fees, distribution and service fees (if applicable), and other fund expenses.
We are going to present only your ongoing operating expenses here.
Actual expenses/actual returns
This example is intended to provide information about your fund’s actual ongoing operating expenses, and is based on your fund’s actual return. It assumes an account value of $1,000.00 on September 1, 2007, with the same investment held until February 29, 2008.
| | | |
| | Account value | Ending value | Expenses paid during |
| | on 9-1-07 | on 2-29-08 | period ended 2-29-081 |
|
| Class A | $1,000.00 | $987.70 | $5.07 |
|
| Class B | 1,000.00 | 983.90 | 8.83 |
|
| Class C | 1,000.00 | 983.90 | 8.83 |
|
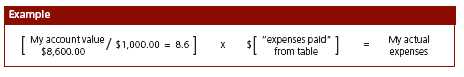
Together with the value of your account, you may use this information to estimate the operating expenses that you paid over the period. Simply divide your account value at February 29, 2008, by $1,000.00, then multiply it by the “expenses paid” for your share class from the table above. For example, for an account value of $8,600.00, the operating expenses should be calculated as follows:
Tax-Free Bond Fund | Semiannual report
8
Hypothetical example for comparison purposes
This table allows you to compare your fund’s ongoing operating expenses with those of any other fund. It provides an example of the Fund’s hypothetical account values and hypothetical expenses based on each class’s actual expense ratio and an assumed 5% annualized return before expenses (which is not your fund’s actual return). It assumes an account value of $1,000.00 on September 1, 2007, with the same investment held until February 29, 2008. Look in any other fund shareholder report to find its hypothetical example and you will be able to compare these expenses.
| | | |
| | Account value | Ending value | Expenses paid during |
| | on 9-1-07 | on 2-29-08 | period ended 2-29-081 |
|
| Class A | $1,000.00 | $1,019.80 | $5.15 |
|
| Class B | 1,000.00 | 1,016.00 | 8.97 |
|
| Class C | 1,000.00 | 1,016.00 | 8.97 |
|
Remember, these examples do not include any transaction costs, such as sales charges; therefore, these examples will not help you to determine the relative total costs of owning different funds. If transaction costs were included, your expenses would have been higher. See the prospectus for details regarding transaction costs.
1 Expenses are equal to the Fund’s annualized expense ratio of 1.03%, 1.78% and 1.78% for Class A, Class B and Class C, respectively, multiplied by the average account value over the period, multiplied by number of days in most recent fiscal half-year/365 or 366 (to reflect the one-half year period).
Semiannual report | Tax-Free Bond Fund
9
Portfolio summary
| |
| Top 10 holdings1 | |
|
| Foothill/Eastern Transportation Corridor Agency, 01-01-16, 6.000% | 4.3% |
|
| Foothill/Eastern Transportation Corridor Agency, 01-01-19, Zero | 4.2% |
|
| Puerto Rico, Commonwealth of, 07-01-11, 7.720% | 3.9% |
|
| Madera, County of, 03-15-15, 6.500% | 3.4% |
|
| South Dakota Educational Enhancement Funding Corp, 06-01-32, 6.500% | 2.3% |
|
| San Bernardino, County of, 08-01,17, 5.500% | 2.3% |
|
| Alabama St Pub Inverse Fltr 12-01-15, 6.300% | 2.3% |
|
| San Joaquin Hills Transportation Corridor Agency, 01-15-17, 5.650% | 2.2% |
|
| Port Auth of New York & New Jersey, 10-01-19, 6.750% | 2.0% |
|
| Massachusetts, Commonwealth of, 12-01-24, 5.500% | 2.0% |
|
| | | | |
| Sector distribution1 | | | | |
|
| General obligation bonds | 8% | | Industrial development | 3% |
| |
|
| Revenue bonds | | | Water & sewer | 2% |
| |
|
| Transportation | 18% | | Special tax | 2% |
| |
|
| Health | 12% | | Sales tax | 1% |
| |
|
| Tobacco | 7% | | Economic development | 1% |
| |
|
| Electric | 6% | | Housing | 1% |
| |
|
| Pollution | 4% | | Correctional facilities | 1% |
| |
|
| Education | 4% | | Other | 30% |
| |
|
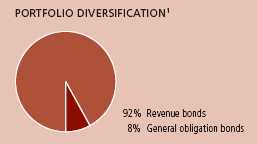
1 As a percentage of net assets on February 29, 2008.
Tax-Free Bond Fund | Semiannual report
10
F I N A N C I A L S T A T E M E N T S
Fund’s investments
Securities owned by the Fund on 2-29-08 (unaudited)
This schedule is divided into two main categories: tax-exempt long-term bonds and short-term investments. Tax-exempt long-term bonds are broken down by state or territory. Under each state or territory is a list of securities owned by the Fund. Short-term investments, which represent the Fund’s cash position, are listed last.
| | | | | | |
| | Interest | | Maturity | Credit | Par value | |
| State, issuer, description | rate | | date | rating (A) | (000) | Value |
| |
| Tax-exempt long-term bonds 101.47% | | | | | $435,493,052 |
|
| (Cost $421,097,910) | | | | | | |
| | | | | | | |
| Alabama 2.27% | | | | | | 9,730,600 |
|
| Alabama St Pub Sch & | | | | | | |
| College Auth, | | | | | | |
| Rev Bond Drivers Ser 2403 (M)(P) | 6.300% | | 12-01-15 | AA | $10,000 | 9,730,600 |
| | | | | | | |
| Arizona 0.48% | | | | | | 2,054,578 |
|
| Arizona Health Facilities Auth, | | | | | | |
| Rev Ref Phoenix Memorial | | | | | | |
| Hosp (G)(H) | Zero | | 06-01-21 | D | 2,150 | 43,000 |
|
| Maricopa County Industrial | | | | | | |
| Development Auth, | | | | | | |
| Rev Mtg Back Secs Prog Ser 1998B | 6.200 | | 12-01-30 | Aaa | 280 | 282,808 |
|
| Navajo County Industrial | | | | | | |
| Development Auth, | | | | | | |
| Rev Stone Container Corp Proj (G) | 7.200 | | 06-01-27 | B | 1,000 | 990,500 |
|
| Phoenix Civic Improvement Corp | | | | | | |
| District, | | | | | | |
| Rev Conc Cap Apprec Civic Plaza | | | | | | |
| Ser 2005B (Zero to 07-01-13 then | | | | | | |
| 5.500%) (O) | Zero | | 07-01-28 | AA | 1,000 | 738,270 |
| | | | | | | |
| California 23.63% | | | | | | 101,437,731 |
|
| California Pollution Control | | | | | | |
| Financing Auth, | | | | | | |
| Rev Ref Waste Management | 5.000 | | 01-01-22 | BBB | 3,000 | 2,676,240 |
|
| California State Kindergarten University, | | | | | | |
| California, State of, | | | | | | |
| Gen Oblig Unltd | 5.125 | | 04-01-23 | A+ | 1,400 | 1,359,134 |
| Daily Kindergarten Univ | | | | | | |
| 2007A4 (P) | 3.680 | | 05-01-34 | AA | 900 | 900,000 |
| Gen Oblig Unltd Econ Recovery | | | | | | |
| Ser C-5 (P) | 3.680 | | 07-01-23 | AA+ | 100 | 100,000 |
|
| Foothill/Eastern Transportation | | | | | | |
| Corridor Agency, | | | | | | |
| Rev Ref Toll Rd Cap Apprec | Zero | | 01-15-25 | BBB– | 5,000 | 1,721,000 |
| Rev Toll Rd Cap Apprec Sr Lien | | | | | | |
| Ser 1995A | Zero | | 01-01-19 | AAA | 30,000 | 17,865,000 |
| Rev Toll Rd Sr Lien Ser 1995A | 6.000 | | 01-01-16 | AAA | 17,500 | 18,450,950 |
See notes to financial statements
Semiannual report | Tax-Free Bond Fund
11
F I N A N C I A L S T A T E M E N T S
| | | | | | |
| | Interest | | Maturity | Credit | Par value | |
| State, issuer, description | rate | | date | rating (A) | (000) | Value |
| |
| California (continued) | | | | | | |
|
| Madera, County of, | | | | | | |
| Rev Cert of Part Valley | | | | | | |
| Childrens Hosp | 6.500% | | 03-15-15 | AAA | $13,185 | $14,580,105 |
|
| Millbrae, City of, | | | | | | |
| Rev Magnolia of Milbrae Proj | | | | | | |
| Ser 1997A (G) | 7.375 | | 09-01-27 | BB | 1,750 | 1,773,608 |
|
| Sacramento City Financing Auth, | | | | | | |
| Rev Convention Ctr Hotel Sr | | | | | | |
| Ser 1999A (G) | 6.250 | | 01-01-30 | BB+ | 4,000 | 3,645,160 |
|
| San Bernardino, County of, | | | | | | |
| Rev Ref Cert of Part Med Ctr | | | | | | |
| Fin Proj | 5.500 | | 08-01-17 | AAA | 9,130 | 9,731,302 |
| Rev Ref Cert of Part Med Ctr | | | | | | |
| Fin Proj | 5.500 | | 08-01-22 | A+ | 2,500 | 2,527,200 |
|
| San Diego Redevelopment Agency, | | | | | | |
| Rev Tax Alloc City Heights Proj | | | | | | |
| Ser 1999A (G) | 5.750 | | 09-01-23 | BB | 25 | 23,604 |
|
| San Joaquin Hills Transportation | | | | | | |
| Corridor Agency, | | | | | | |
| Rev Toll Rd Conv Cap Apprec | | | | | | |
| Ser 1997A (Zero to 1-15-07, then | | | | | | |
| 5.650%) (O) | 5.650 | | 01-15-17 | BB– | 10,000 | 9,394,100 |
| Rev Toll Rd Jr Lien | Zero | | 01-01-10 | AAA | 6,250 | 5,940,625 |
| Rev Toll Rd Sr Lien | Zero | | 01-01-14 | AAA | 5,000 | 4,036,500 |
| Rev Toll Rd Sr Lien | Zero | | 01-01-17 | AAA | 4,900 | 3,332,343 |
| Rev Toll Rd Sr Lien | Zero | | 01-01-20 | AAA | 2,000 | 1,118,460 |
|
| Santa Ana Financing Auth, | | | | | | |
| Rev Lease Police Admin & Hldg | | | | | | |
| Facil Ser 1994A | 6.250 | | 07-01-19 | AAA | 2,000 | 2,262,400 |
| Colorado 1.04% | | | | | | 4,444,500 |
|
| E-470 Public Highway Auth, | | | | | | |
| Rev Cap Apprec Sr Ser 2000B | Zero | | 09-01-34 | BBB– | 7,000 | 1,069,950 |
|
| Northwest Parkway Public | | | | | | |
| Highway Auth, | | | | | | |
| Rev 1st Tier Sub Ser 2001D | 7.125 | | 06-15-41 | CCC | 3,000 | 3,374,550 |
| | | | | | | |
| Delaware 0.74% | | | | | | 3,167,280 |
|
| Charter MAC Equity Issuer Trust, | | | | | | |
| Preferred Tax Exempt Shares | | | | | | |
| Ser A-4-1 (S) | 5.750 | | 04-30-15 | Aaa | 3,000 | 3,167,280 |
| | | | | | | |
| Florida 5.49% | | | | | | 23,559,652 |
|
| Bonnet Creek Resort Community | | | | | | |
| Development District, | | | | | | |
| Rev Spec Assessment (G) | 7.375 | | 05-01-34 | BB+ | 1,500 | 1,517,385 |
| Rev Spec Assessment (G) | 7.250 | | 05-01-18 | BB+ | 1,000 | 1,011,410 |
|
| Capital Projects Finance Auth, | | | | | | |
| Rev Student Hsg Cap Projs Ln Prog | | | | | | |
| Ser 2000A (G) | 7.850 | | 08-15-31 | AA | 3,500 | 3,972,255 |
| Rev Student Hsg Cap Projs Ln Prog | | | | | | |
| Ser 2001G (G) | 9.125 | | 10-01-11 | BBB | 900 | 934,614 |
See notes to financial statements
Tax-Free Bond Fund | Semiannual report
12
F I N A N C I A L S T A T E M E N T S
| | | | | | |
| | Interest | | Maturity | Credit | Par value | |
| State, issuer, description | rate | | date | rating (A) | (000) | Value |
| | | | | | | |
| Florida (continued) | | | | | | |
|
| Capital Trust Agency, | | | | | | |
| Rev Seminole Tribe Convention | | | | | | |
| Ser 2003A | 8.950% | | 10-01-33 | AAA | $3,000 | $3,716,310 |
|
| Crossings at Fleming Island | | | | | | |
| Community Development District, | | | | | | |
| Rev Ref Spec Assessment | | | | | | |
| Ser 2000C (G) | 7.100 | | 05-01-30 | BBB– | 1,000 | 1,007,170 |
|
| Hernando, County of, | | | | | | |
| Rev Criminal Justice Complex | 7.650 | | 07-01-16 | A | 500 | 619,070 |
|
| Midtown Miami Community | | | | | | |
| Development District, | | | | | | |
| Rev Spec Assessment Ser 2004A (G) | 6.000 | | 05-01-24 | BB | 1,000 | 908,470 |
|
| Orange County School Board, | | | | | | |
| Rev Ref Cert of Part Ser 1997A | Zero | | 08-01-13 | Aaa | 5,000 | 4,024,750 |
|
| Orlando Urban Community | | | | | | |
| Development District, | | | | | | |
| Rev Spec Assessment Cap Imp | | | | | | |
| Ser 2001A (G) | 6.950 | | 05-01-33 | AA | 2,500 | 2,757,500 |
|
| Orlando Utilities Commission, | | | | | | |
| Rev Ref Wtr & Elec Sys Sub | | | | | | |
| Ser 1989D | 6.750 | | 10-01-17 | AA | 2,200 | 2,552,088 |
|
| Stoneybrook West Community | | | | | | |
| Development District, | | | | | | |
| Rev Spec Assessment Ser 2000A (G) | 7.000 | | 05-01-32 | BBB | 410 | 419,266 |
| Rev Spec Assessment Ser 2000B (G) | 6.450 | | 05-01-10 | BBB | 120 | 119,364 |
| | | | | | | |
| Georgia 5.28% | | | | | | 22,666,131 |
|
| Atlanta, City of, | | | | | | |
| Rev Tax Alloc Eastside Proj | | | | | | |
| Ser 2005B (G) | 5.600 | | 01-01-30 | BB+ | 1,000 | 867,660 |
|
| Georgia Municipal Electric Auth, | | | | | | |
| Rev Preref Ser 1993Z | 5.500 | | 01-01-20 | A+ | 150 | 163,149 |
| Rev Preref Ser 1998Y | 6.500 | | 01-01-17 | AAA | 60 | 69,052 |
| Rev Ref Pwr Ser 1993BB | 5.700 | | 01-01-19 | A+ | 1,000 | 1,078,320 |
| Rev Ref Pwr Ser 1993C | 5.700 | | 01-01-19 | A+ | 5,000 | 5,436,850 |
| Rev Ref Pwr Ser 1994EE | 7.250 | | 01-01-24 | AAA | 2,000 | 2,431,260 |
| Rev Ref Pwr Ser 1998Y | 6.500 | | 01-01-17 | AAA | 145 | 166,364 |
| Rev Unref Bal Ser 1993Z | 5.500 | | 01-01-20 | A+ | 5,690 | 6,117,205 |
| Rev Unref Bal Ser 1998Y | 6.500 | | 01-01-17 | AAA | 4,635 | 5,238,431 |
|
| Monroe County Development Auth, | | | | | | |
| Rev Ref Poll Control Oglethorpe | | | | | | |
| Pwr Corp Scherer Ser 1992A | 6.800 | | 01-01-12 | A | 1,000 | 1,097,840 |
| | | | | | | |
| Illinois 7.77% | | | | | | 33,367,434 |
|
| Chicago Board of Education, | | | | | | |
| Rev Ref Ser 2005A | 5.500 | | 12-01-26 | AAA | 5,290 | 5,433,359 |
| Gen Oblig Unltd Cap App Sch | | | | | | |
| Reform Ser 1999A | Zero | | 12-01-18 | AA– | 5,440 | 3,089,539 |
| Gen Oblig Unltd Cap Apprec | | | | | | |
| City Colleges | Zero | | 01-01-16 | AA– | 2,850 | 1,960,515 |
See notes to financial statements
Semiannual report | Tax-Free Bond Fund
13
F I N A N C I A L S T A T E M E N T S
| | | | | | |
| | Interest | | Maturity | Credit | Par value | |
| State, issuer, description | rate | | date | rating (A) | (000) | Value |
| | | | | | | |
| Illinois (continued) | | | | | | |
|
| Chicago, City of, | | | | | | |
| Gen Oblig Tax Alloc Jr Pilsen | | | | | | |
| Redev Ser 2004B (G) | 6.750% | | 06-01-22 | BBB+ | $3,000 | $3,078,630 |
|
| Illinois Development | | | | | | |
| Finance Auth, | | | | | | |
| Rev Ref Commonwealth Edison | | | | | | |
| Co Proj | 5.850 | | $01-15-14 | AAA | 3,000 | 3,295,740 |
|
| Kane County Community School | | | | | | |
| District No 304, | | | | | | |
| Gen Oblig Unltd Cap Apprec | | | | | | |
| Ser 2004A | Zero | | 01-01-17 | AA | 4,705 | 3,017,269 |
|
| Lake County Community Unit School | | | | | | |
| District No 95 | | | | | | |
| Gen Oblig Unltd Cap Apprec | | | | | | |
| Lake Zurich | Zero | | 12-01-18 | AA | 3,000 | 1,710,930 |
|
| Lake County Community Unit School | | | | | | |
| District No 24 | | | | | | |
| Gen Oblig Unltd Cap | | | | | | |
| Apprec Millburn | Zero | | 01-01-22 | A | 2,440 | 1,095,658 |
|
| Metropolitan Pier & | | | | | | |
| Exposition Auth, | | | | | | |
| Rev Cap Apprec McCormick Pl Expn | | | | | | |
| Ser 1993A | Zero | | 06-15-15 | A | 1,500 | 1,086,150 |
| Rev Ref Cap Apprec McCormick Proj | Zero | | 06-15-15 | AAA | 1,000 | 725,650 |
| Rev Ref Cap Apprec McCormick Proj | | | | | | |
| Ser 1996A | Zero | | 12-15-16 | AAA | 2,330 | 1,549,869 |
|
| Round Lake Beach, Village of, | | | | | | |
| Rev Spec Tax Lakewood Grove Spec | | | | | | |
| Serv Area No. 1 (G) | 6.700 | | 03-01-33 | AA | 1,000 | 1,132,790 |
|
| Southern Illinois University, | | | | | | |
| Rev Cap Apprec Housing & Auxiliary | | | | | | |
| Sys Ser 1993A | Zero | | 04-01-15 | AAA | 1,000 | 730,870 |
|
| Will County Community Unit School | | | | | | |
| District No 365, | | | | | | |
| Gen Oblig Cap Apprec Comp Int | | | | | | |
| Ser 1997B | Zero | | 11-01-14 | AAA | 3,510 | 2,670,864 |
| Gen Oblig Unltd Cap Apprec | Zero | | 11-01-21 | AAA | 5,780 | 2,789,601 |
| | | | | | | |
| Indiana 0.21% | | | | | | 891,060 |
|
| Vanderburgh County Redevelopment | | | | | | |
| Commission, | | | | | | |
| Rev Dist Tax Increment | 5.000 | | 02-01-26 | A– | 1,000 | 891,060 |
| | | | | | | |
| Kentucky 1.29% | | | | | | 5,533,952 |
|
| Kentucky Economic Development | | | | | | |
| Finance Auth, | | | | | | |
| Rev Preref Norton Healthcare | | | | | | |
| Ser 2000C | 6.100 | | 10-01-21 | AAA | 1,770 | 2,016,773 |
| Rev Unref Bond Balance Norton | | | | | | |
| Ser 2000C | 6.100 | | 10-01-21 | AAA | 3,230 | 3,517,179 |
See notes to financial statements
Tax-Free Bond Fund | Semiannual report
14
F I N A N C I A L S T A T E M E N T S
| | | | | | |
| | Interest | | Maturity | Credit | Par value | |
| State, issuer, description | rate | | date | rating (A) | (000) | Value |
| | | | | | | |
| Louisiana 0.88% | | | | | | $3,783,902 |
|
| Jefferson Parish Home | | | | | | |
| Mortgage Auth, | | | | | | |
| Rev Ref Single Family Mtg | | | | | | |
| Ser 1999B | 6.750% | | 06-01-30 | Aaa | $580 | 587,117 |
|
| Louisiana Local Government | | | | | | |
| Environmental Facilities | | | | | | |
| Community Development Auth, | | | | | | |
| Rev Westlake Chemical Corp | 6.750 | | 11-01-32 | BB+ | 1,500 | 1,456,905 |
|
| St. John Baptist Parish, | | | | | | |
| Rev Marathon Oil Corp Ser 2007A | 5.125 | | 06-01-37 | BBB+ | 2,000 | 1,739,880 |
| | | | | | | |
| Maryland 0.97% | | | | | | 4,153,200 |
|
| Municipal Mortgage & Equity LLC, | | | | | | |
| Bond (S) | 6.875 | | 06-30-49 | A3 | 4,000 | 4,153,200 |
| | | | | | | |
| Massachusetts 5.71% | | | | | | 24,497,845 |
|
| Massachusetts Bay | | | | | | |
| Transportation Auth, | | | | | | |
| Rev Ref Cap Apprec Ser 2007A-2 | Zero | | 07-01-26 | AAA | 13,595 | 4,565,065 |
|
| Massachusetts, Commonwealth of, | | | | | | |
| Gen Oblig Unltd Ref Ser 2004C | 5.500 | | 12-01-24 | AAA | 8,000 | 8,356,880 |
|
| Massachusetts Health & | | | | | | |
| Educational Facilities Auth, | | | | | | |
| Rev Civic Investments Inc | | | | | | |
| Ser 2002B (G) | 9.200 | | 12-15-31 | AA | 3,500 | 4,375,350 |
| Rev Preref Partners Health Care | | | | | | |
| Ser 2001C | 5.750 | | 07-01-32 | AA | 1,915 | 2,086,239 |
| Rev Ref Partners Health Care | | | | | | |
| Ser 2001C | 5.750 | | 07-01-32 | AA | 85 | 85,787 |
|
| Massachusetts Special Obligation | | | | | | |
| Dedicated Tax, | | | | | | |
| Rev Ref Spec Oblig | 5.500 | | 01-01-27 | A | 5,000 | 4,953,300 |
|
| Massachusetts Water Pollution | | | | | | |
| Abatement Trust, | | | | | | |
| Rev Unref Bal Ser 1994A | 6.375 | | 02-01-15 | AAA | 75 | 75,224 |
| | | | | | | |
| Michigan 0.23% | | | | | | 969,880 |
|
| Kent Hospital Finance Auth, | | | | | | |
| Rev Met Hosp Proj Ser 2005A | 6.000 | | 07-01-35 | BBB | 1,000 | 969,880 |
| | | | | | | |
| Minnesota 0.80% | | | | | | 3,450,015 |
|
| St. Cloud, City of, | | | | | | |
| Rev Ref St Cloud Hosp Oblig Group | | | | | | |
| Ser 2000A | 5.875 | | 05-01-30 | Aaa | 2,000 | 2,064,000 |
|
| St. Paul Housing & | | | | | | |
| Redevelopment Auth, | | | | | | |
| Rev Healtheast Hosp Proj | 6.000 | | 11-15-35 | BB+ | 1,500 | 1,386,015 |
| | | | | | | |
| Missouri 0.25% | | | | | | 1,080,038 |
|
| Fenton, City of, | | | | | | |
| Rev Ref Tax Increment Imp Gravois | | | | | | |
| Bluffs (G) | 7.000 | | 10-01-21 | AAA | 955 | 1,080,038 |
See notes to financial statements
Semiannual report | Tax-Free Bond Fund
15
F I N A N C I A L S T A T E M E N T S
| | | | | | |
| | Interest | | Maturity | Credit | Par value | |
| State, issuer, description | rate | | date | rating (A) | (000) | Value |
| | | | | | | |
| Nebraska 0.32% | | | | | | $1,355,124 |
|
| Omaha Public Power District, | | | | | | |
| Rev Ref Elec Imp Ser 1992B | 6.200% | | 02-01-17 | Aa2 | $1,200 | 1,355,124 |
| | | | | | | |
| Nevada 0.01% | | | | | | 25,082 |
|
| Nevada, State of, | | | | | | |
| Gen Oblig Ltd Unref Bal Ser 1992A | 6.750 | | 07-01-09 | AA+ | 25 | 25,082 |
| | | | | | | |
| New Hampshire 0.30% | | | | | | 1,280,250 |
|
| New Hampshire Health & Education | | | | | | |
| Facilities Auth, | | | | | | |
| Rev Exeter Proj | 6.000 | | 10-01-24 | A+ | 1,250 | 1,280,250 |
| | | | | | | |
| New Jersey 3.78% | | | | | | 16,225,080 |
|
| New Jersey Economic | | | | | | |
| Development Auth, | | | | | | |
| Rev Cigarette Tax | 5.500 | | 06-15-24 | BBB | 3,000 | 2,800,800 |
| Rev Ref Newark Airport | | | | | | |
| Marriot Hotel | 7.000 | | 10-01-14 | Ba1 | 2,000 | 2,017,500 |
|
| New Jersey Health Care Facilities | | | | | | |
| Financing Auth, | | | | | | |
| Rev Care Institute Inc Cherry | | | | | | |
| Hill Proj (G) | 8.000 | | 07-01-27 | CCC | 1,120 | 1,113,280 |
|
| New Jersey Tobacco Settlement | | | | | | |
| Financing Corp, | | | | | | |
| Rev Preref Asset Backed Bond | 6.750 | | 06-01-39 | AAA | 5,000 | 5,771,500 |
| Rev Preref Asset Backed Bond | 6.250 | | 06-01-43 | AAA | 4,000 | 4,522,000 |
| | | | | | | |
| New Mexico 0.47% | | | | | | 2,013,420 |
|
| Farmington, City of, | | | | | | |
| Rev Ref Poll Control Tucson Elec | | | | | | |
| Pwr Co Ser 1997A | 6.950 | | 10-01-20 | B+ | 2,000 | 2,013,420 |
| | | | | | | |
| New York 8.82% | | | | | | 37,864,634 |
|
| Nassau County Industrial | | | | | | |
| Development Agency, | | | | | | |
| Rev Ref Civic Facil North Shore | | | | | | |
| Hlth Sys Projs Ser 2001B | 5.875 | | 11-01-11 | A3 | 495 | 511,152 |
|
| New York, City of, | | | | | | |
| Gen Oblig Unltd Ser 1993E (P) | 3.750 | | 08-01-21 | AAA | 1,700,000 | 1,700,000 |
| Gen Oblig Unltd Ser 1993B-2 (P) | 3.750 | | 08-15-20 | AAA | 1,100 | 1,100,000 |
| Gen Oblig Unltd Ser A-10 (P) | 3.750 | | 08-01-17 | AAA | 1,000 | 1,000,000 |
|
| New York City Industrial | | | | | | |
| Development Agency, | | | | | | |
| Rev American Airlines JFK | | | | | | |
| Intl Arpt | 7.625 | | 08-01-25 | B | 2,500 | 2,559,275 |
| Rev Liberty 7 World Trade Ctr | | | | | | |
| Ser 2005A (G) | 6.250 | | 03-01-15 | BB+ | 2,000 | 2,025,980 |
| Rev Ref Terminal One Group | | | | | | |
| Assn Proj | 5.500 | | 01-01-24 | BBB+ | 1,500 | 1,464,270 |
|
| New York City Municipal Water | | | | | | |
| Finance Auth, | | | | | | |
| Rev Preref Wtr & Swr Sys | | | | | | |
| Ser 2000B | 6.000 | | 06-15-33 | AA+ | 365 | 393,043 |
| Rev Unref Bal Wtr & Swr Sys | | | | | | |
| Ser 2000B | 6.000 | | 06-15-33 | AA+ | 375 | 401,768 |
See notes to financial statements
Tax-Free Bond Fund | Semiannual report
16
F I N A N C I A L S T A T E M E N T S
| | | | | | |
| | Interest | | Maturity | Credit | Par value | |
| State, issuer, description | rate | | date | rating (A) | (000) | Value |
| | | | | | | |
| New York (continued) | | | | | | |
|
| New York City Transitional | | | | | | |
| Finance Auth, | | | | | | |
| Rev Ref Future Tax Sec Ser 2002A | | | | | | |
| (Zero to 11-01-11 then | | | | | | |
| 14.000%) (O) | Zero | | 11-01-29 | AAA | $5,000 | $4,485,350 |
|
| New York Liberty | | | | | | |
| Development Corp, | | | | | | |
| Rev National Sports Museum Proj | | | | | | |
| Ser 2006A (G) | 6.125% | | 02-15-19 | BB– | 1,000 | 948,100 |
|
| New York State Dormitory Auth, | | | | | | |
| Rev City Univ Sys Consol 2nd | | | | | | |
| Generation Ser 1993A | 5.750 | | 07-01-09 | AA– | 1,000 | 1,021,920 |
| Rev Preref Ser 1990B | 7.500 | | 05-15-11 | AA– | 160 | 172,008 |
| Rev Ref State Univ Edl Facil | | | | | | |
| Ser 1993A | 5.500 | | 05-15-19 | AA– | 1,000 | 1,069,340 |
| Rev Unref Bal Ser 1990B | 7.500 | | 05-15-11 | AA– | 190 | 207,556 |
|
| New York State Environmental | | | | | | |
| Facilities Corp, | | | | | | |
| Rev Ref Poll Control (P) | 9.755 | | 06-15-11 | AAA | 2,000 | 2,541,200 |
|
| New York State Housing | | | | | | |
| Finance Agency, | | | | | | |
| Rev Ref State Univ Constr | | | | | | |
| Ser 1986A | 8.000 | | 05-01-11 | AAA | 1,580 | 1,709,955 |
|
| Port Auth of New York & | | | | | | |
| New Jersey, | | | | | | |
| Rev Ref Spec Proj KIAC Partners | | | | | | |
| Ser 4 (G) | 6.750 | | 10-01-19 | BBB– | 8,700 | 8,718,618 |
|
| Triborough Bridge & Tunnel Auth, | | | | | | |
| Rev Ser 2006A | 5.000 | | 11-15-22 | AA– | 3,545 | 3,572,119 |
|
| Westchester Tobacco Asset | | | | | | |
| Securitization Corp, | | | | | | |
| Rev Asset Backed Bond (Zero to | | | | | | |
| 7-15-09, then 6.950%) (O) | Zero | | 07-15-09 | AAA | 2,000 | 2,262,980 |
| | | | | | | |
| Ohio 4.74% | | | | | | 20,345,031 |
|
| Buckeye Ohio Tobacco Settlement | | | | | | |
| Financing Auth, | | | | | | |
| Rev Asset Backed Ser 2007A-2 | 5.875 | | 06-01-30 | BBB | 2,000 | 1,864,880 |
| Rev Asset Backed Sr Bond | | | | | | |
| Ser 2007A-2 | 5.125 | | 06-01-24 | BBB | 5,500 | 5,095,750 |
|
| Cuyahoga, County of, | | | | | | |
| Rev Ref Cleveland Clinic Hlth Sys | | | | | | |
| Ser 2003A | 5.750 | | 01-01-25 | AA– | 2,500 | 2,531,825 |
|
| Milford Exempt Village School | | | | | | |
| District, | | | | | | |
| Gen Oblig Unltd | 5.500 | | 12-01-30 | Aaa | 5,275 | 5,542,126 |
|
| Ohio State Turnpike Commission, | | | | | | |
| Rev Ref Bond Ser 2000A (P) | 5.500 | | 02-15-20 | AA | 5,000 | 5,310,450 |
| | | | | | | |
| Oklahoma 0.48% | | | | | | 2,057,700 |
|
| Tulsa Municipal Airport Trust, | | | | | | |
| Rev Ref Ser 2000A | 7.750 | | 06-01-35 | B | 2,000 | 2,057,700 |
See notes to financial statements
Semiannual report | Tax-Free Bond Fund
17
F I N A N C I A L S T A T E M E N T S
| | | | | | |
| | Interest | | Maturity | Credit | Par value | |
| State, issuer, description | rate | | date | rating (A) | (000) | Value |
| | | | | | | |
| Oregon 0.84% | | | | | | $3,618,448 |
|
| Clackamas County School District | | | | | | |
| No. 12, | | | | | | |
| Gen Oblig Unltd Ser 2007B | Zero | | 06-15-28 | AAA | $3,130 | 2,543,000 |
|
| Western Generation Agency, | | | | | | |
| Rev Wauna Cogeneration Proj | | | | | | |
| Ser 2006B (G) | 5.000% | | 01-01-14 | BBB– | 1,100 | 1,075,448 |
| | | | | | | |
| Pennsylvania 4.59% | | | | | | 19,702,882 |
|
| Allegheny County Hospital | | | | | | |
| Development Auth, | | | | | | |
| Rev West Penn Hlth Sys Ser 2007A | 5.000 | | 11-15-28 | BB | 3,500 | 2,838,395 |
|
| Allegheny County Industrial | | | | | | |
| Development Auth, | | | | | | |
| Rev Ref Environmental Imp | 5.500 | | 11-01-16 | BB+ | 2,500 | 2,447,550 |
|
| Allegheny County | | | | | | |
| Redevelopment Auth, | | | | | | |
| Rev Tax Alloc Pittsburgh Mills | | | | | | |
| Proj (G) | 5.600 | | 07-01-23 | BB+ | 1,000 | 908,830 |
|
| Carbon County Industrial | | | | | | |
| Development Auth, | | | | | | |
| Rev Reg Resource Recovery Panther | | | | | | |
| Creek Partners Proj | 6.700 | | 05-01-12 | BBB– | 4,960 | 5,169,709 |
|
| Pennsylvania State Turnpike | | | | | | |
| Commission, | | | | | | |
| Rev Ref Bond Ser 2005A | 5.250 | | 07-15-30 | AAA | 5,000 | 5,085,700 |
|
| Philadelphia Industrial | | | | | | |
| Development Auth, | | | | | | |
| Rev Commercial Dev Marriot | | | | | | |
| Hotel (G) | 7.750 | | 12-01-17 | BB | 3,250 | 3,252,698 |
| | | | | | | |
| Puerto Rico 9.82% | | | | | | 42,166,465 |
|
| Puerto Rico Aqueduct & | | | | | | |
| Sewer Auth, | | | | | | |
| Rev Inverse Floater (Gtd) (M)(P) | 7.470 | | 07-01-11 | AAA | 6,500 | 7,489,560 |
| Rev Ref Pars & Inflos (Gtd) | 6.000 | | 07-01-11 | AAA | 200 | 215,224 |
|
| Puerto Rico, Commonwealth of, | | | | | | |
| Pub Impt Ser A (I) | 5.000 | | 07-01-18 | Aaa | 12,655 | 13,105,771 |
| Rev Inverse Floater (M)(P) | 7.720 | | 07-01-11 | AAA | 14,000 | 16,527,560 |
|
| Puerto Rico Electric Power Auth, | | | | | | |
| Rev Ref Bond Ser 2007V | 5.250 | | 07-01-26 | AAA | 5,000 | 4,828,350 |
| | | | | | | |
| Rhode Island 0.24% | | | | | | 1,020,320 |
|
| Tiverton, Town of, | | | | | | |
| Rev Spec Oblig Tax Mount Hope Bay | | | | | | |
| Village Ser 2002A (G) | 6.875 | | 05-01-22 | BBB– | 1,000 | 1,020,320 |
| | | | | | | |
| South Dakota 2.30% | | | | | | 9,878,500 |
|
| South Dakota Educational | | | | | | |
| Enhancement Funding Corp, | | | | | | |
| Rev Tobacco Settlement Asset | | | | | | |
| Backed Bond Ser 2002B | 6.500 | | 06-01-32 | BBB | 10,000 | 9,878,500 |
See notes to financial statements
Tax-Free Bond Fund | Semiannual report
18
F I N A N C I A L S T A T E M E N T S
| | | | | | |
| | Interest | | Maturity | Credit | Par value | |
| State, issuer, description | rate | | date | rating (A) | (000) | Value |
| | | | | | | |
| Texas 4.20% | | | | | | $18,027,302 |
|
| Austin, City of, | | | | | | |
| Rev Ref Combined Util Sys | | | | | | |
| Ser 1998 | 6.750% | | 11-15-10 | AAA | $3,125 | 3,429,063 |
|
| Bexar County Health Facilities | | | | | | |
| Development Corp, | | | | | | |
| Rev Ref Army Retirement | | | | | | |
| Residence Proj | 6.300 | | 07-01-32 | BBB | 1,000 | 1,124,220 |
|
| Brazos River Auth, | | | | | | |
| Rev Ref Poll Control Texas | | | | | | |
| Utilities Co Ser 1999A | 7.700 | | 04-01-33 | CCC | 1,500 | 1,503,435 |
|
| Harris, County of, | | | | | | |
| Gen Oblig Ltd | Zero | | 08-15-19 | AAA | 3,000 | 1,660,140 |
|
| Houston Independent School | | | | | | |
| District, | | | | | | |
| Rev Cap Apprec Cesar E Chavez | | | | | | |
| Ser 1998A | Zero | | 09-15-16 | AAA | 900 | 600,759 |
|
| Mission Economic | | | | | | |
| Development Corp, | | | | | | |
| Rev Ref Solid Waste Disp 2007A | 5.200 | | 04-01-18 | B+ | 1,000 | 865,350 |
|
| SA Energy Acquisition Pub | | | | | | |
| Fac Corp, | | | | | | |
| Rev Texas Gas Supply | 5.500 | | 08-01-27 | AA– | 5,000 | 4,607,650 |
|
| Tarrant County Cultural Education | | | | | | |
| Facilities, | | | | | | |
| Rev Ref Texas Health Resources | | | | | | |
| Ser 2007A | 5.000 | | 02-15-26 | AA– | 2,500 | 2,299,525 |
|
| Texas Water Devel Board, | | | | | | |
| Rev Revolving Fund Sub Lien Ser A | 5.000 | | 07-15-27 | AAA | 2,000 | 1,937,160 |
| | | | | | | |
| Utah 0.47% | | | | | | 2,010,826 |
|
| Mountain Regional Water Special | | | | | | |
| Service District, | | | | | | |
| Rev Spec Assessment Spec Imp Dist | | | | | | |
| No. 2002-1 (G) | 7.000 | | 12-01-18 | BBB+ | 860 | 861,806 |
|
| Salt Lake City Hospital, | | | | | | |
| Rev Ref IHC Hosp Inc Ser 1998A | 8.125 | | 05-15-15 | AAA | 1,000 | 1,149,020 |
| | | | | | | |
| Virginia 0.63% | | | | | | 2,688,250 |
|
| Pocahontas Parkway Association, | | | | | | |
| Rev Toll Rd Cap Apprec Sr | | | | | | |
| Ser 1998B | Zero | | 08-15-19 | AAA | 5,000 | 2,688,250 |
| | | | | | | |
| Washington 1.66% | | | | | | 7,143,999 |
|
| Washington Public Power | | | | | | |
| Supply System, | | | | | | |
| Rev Ref Nuclear Proj No. 1 | | | | | | |
| Ser 1989B | 7.125 | | 07-01-16 | AA– | 1,500 | 1,812,915 |
|
| Washington, State of, | | | | | | |
| Gen Oblig Unltd Ser 1990A | 6.750 | | 02-01-15 | AA+ | 1,000 | 1,132,540 |
|
| Washington Tobacco | | | | | | |
| Settlement Auth, | | | | | | |
| Rev Asset Backed Bond | 6.500 | | 06-01-26 | BBB | 4,155 | 4,198,544 |
See notes to financial statements
Semiannual report | Tax-Free Bond Fund
19
F I N A N C I A L S T A T E M E N T S
| | | | | | |
| | Interest | | Maturity | Credit | Par value | |
| State, issuer, description | rate | | date | rating (A) | (000) | Value |
| | | | | | | |
| West Virginia 0.76% | | | | | | $3,281,941 |
|
| West Virginia State Hospital | | | | | | |
| Finance Auth, | | | | | | |
| Rev Preref Charleston Area | | | | | | |
| Med Ctr | 6.750% | | 09-01-22 | A2 | $2,400 | 2,625,553 |
| Rev Unref Bal Charleston Area | | | | | | |
| Med Ctr | 6.750 | | 09-01-22 | A2 | 600 | 656,388 |
| |
| | | | | Interest | Par value | |
| Issuer, description, maturity date | | | | rate | (000) | Value |
| |
| Short-term investments 0.03% | | | | | | $137,000 |
|
| (Cost $137,000) | | | | | | |
| | | | | | | |
| Joint Repurchase Agreement 0.03% | | | | | | 137,000 |
|
| Repurchase Agreement with Barclays Plc dated 2-29-08 at | | | |
| 1.800% to be repurchased at $137,021 on 3-3-08, | | | | | |
| collateralized by U. S. Treasury Inflation Indexed Bond, | | | | | |
| 3.875%, due 4-15-29 (valued at $139,740, including interest) | 1.800% | $137 | 137,000 |
|
| |
| Total investments (Cost $421,234,910)† 101.50% | | | $435,630,052 |
|
| |
| Other assets and liabilities, net (1.50%) | | | | | ($6,428,077) |
|
| |
| Total net assets 100.00% | | | | | | $429,201,975 |
|
The percentage shown for each investment category is the total value of that category as a percentage of the net assets of the Fund.
(A) Credit ratings are unaudited and are rated by Moody’s Investors Service or Fitch where Standard & Poor’s ratings are not available unless indicated otherwise.
(G) Security rated internally by John Hancock Advisers, LLC. Unaudited.
(H) Non-income-producing issuer filed for protection under the Federal Bankruptcy Code or is in default of interest payment.
(I) Security is part of an inverse floater trust.
(M) Inverse floater bond purchased on secondary market.
(O) Cash interest will be paid on this obligation at the stated rate beginning on the stated date.
(P) Variable rate obligation. The coupon rate shown represents the rate at end of period.
(S) This security is exempt from registration under Rule 144A of the Securities Act of 1933. Such securities may be resold, normally to qualified institutional buyers, in transactions exempt from registration. Rule 144A securities amounted to $7,320,480 or 1.71% of the Fund’s net assets as of February 29, 2008.
† The cost of investments owned on February 29, 2008, including short-term investments, for federal income tax purposes was $409,277,307. Gross unrealized appreciation and depreciation of investments aggregated $29,769,351 and $13,345,814, respectively, resulting in net unrealized appreciation of $16,423,537.
See notes to financial statements
Tax-Free Bond Fund | Semiannual report
20
F I N A N C I A L S T A T E M E N T S
Financial statements
Statement of assets and liabilities 2-29-08 (unaudited)
This Statement of Assets and Liabilities is the Fund’s balance sheet. It shows the value of what the Fund owns, is due and owes. You’ll also find the net asset value and the maximum offering price per share.
| |
| Assets | |
|
| Investments at value (cost $421,234,910) | $435,630,052 |
| Cash | 169 |
| Receivable for shares sold | 1,508,424 |
| Interest receivable | 4,946,776 |
| Receivable from affiliates | 102,423 |
| Other assets | 32,783 |
| | |
| Total assets | 442,220,627 |
| |
| Liabilities | |
|
| Payable for shares repurchased | 785,753 |
| Interest expense and fees payable on inverse floaters | 67,297 |
| Payable for floating rate notes issued | 9,740,000 |
| Inverse floater bond swap at value | 189,208 |
| Dividends payable | 1,639,999 |
| Payable to affiliates | |
| Management fees | 196,144 |
| Distribution and service fees | 122,328 |
| Other | 165,777 |
| Other payables and accrued expenses | 112,146 |
| | |
| Total liabilities | 13,018,652 |
| |
| Net assets | |
|
| Capital paid-in | 431,372,085 |
| Accumulated net realized loss on investments | (18,162,806) |
| Net unrealized appreciation of investments | 14,640,896 |
| Accumulated net investment income | 1,351,800 |
| | |
| Net assets | $429,201,975 |
| |
| Net asset value per share | |
|
| Based on net asset values and shares outstanding — the Fund has an | |
| unlimited number of shares authorized with no par value | |
| Class A ($407,374,967 ÷ 42,369,496 shares) | $9.61 |
| Class B ($13,693,866 ÷ 1,424,249 shares)1 | $9.61 |
| Class C ($8,133,142 ÷ 845,902 shares)1 | $9.61 |
| |
| Maximum offering price per share | |
|
| Class A2 ($9.61 ÷ 95.5%) | $10.06 |
1 Redemption price is equal to net asset value less any applicable contingent deferred sales charge.
2 On single retail sales of less than $100,000. On sales of $100,000 or more and on group sales the offering price is reduced.
See notes to financial statements
Semiannual report | Tax-Free Bond Fund
21
F I N A N C I A L S T A T E M E N T S
Statement of operations For the period ended 2-29-08 (unaudited)1
This Statement of Operations summarizes the Fund’s investment income earned and expenses incurred in operating the Fund. It also shows net gains (losses) for the period stated.
| |
| Investment income | |
|
| Interest | $12,591,556 |
| | |
| Total investment income | 12,591,556 |
| |
| Expenses | |
|
| Investment management fees (Note 3) | 1,239,792 |
| Distribution and service fees (Note 3) | 651,304 |
| Transfer agent fees (Note 3) | 188,532 |
| Accounting and legal services fees (Note 3) | 24,152 |
| Interest expense and fees on inverse floaters | 177,905 |
| Custodian fees | 49,078 |
| Blue sky fees | 25,526 |
| Professional fees | 25,025 |
| Printing fees | 17,290 |
| Trustees’ fees | 10,374 |
| Miscellaneous | 10,784 |
| | |
| Total expenses | 2,419,762 |
| Less expense reductions (Note 3) | (5,541) |
| | |
| Net expenses | 2,414,221 |
| | |
| Net investment income | 10,177,335 |
| |
| Realized and unrealized loss | |
|
| Net realized loss on investments | (381,967) |
| Change in net unrealized appreciation (depreciation) of investments | (14,710,085) |
| | |
| Net realized and unrealized loss | (15,092,052) |
| | |
| Decrease in net assets from operations | ($4,914,717) |
1 Semiannual period from 9-1-07 to 2-29-08.
See notes to financial statements
Tax-Free Bond Fund | Semiannual report
22
F I N A N C I A L S T A T E M E N T S
Statement of changes in net assets
These Statements of Changes in Net Assets show how the value of the Fund’s net assets has changed during the last two periods. The difference reflects earnings less expenses, any investment gains and losses, distributions, if any, paid to shareholders and the net of Fund share transactions.
| | |
| | Year | Period |
| | ended | ended |
| | 8-31-07 | 2-29-081 |
|
| Increase (decrease) in net assets | | |
|
| From operations | | |
| Net investment income | $21,012,388 | $10,177,335 |
| Net realized loss | (660,264) | (381,967) |
| Change in net unrealized appreciation (depreciation) | (13,017,511) | (14,710,085) |
| | | |
| Increase (decrease) in net assets resulting from operations | 7,334,613 | (4,914,717) |
| | | |
| Distributions to shareholders | | |
| From net investment income | | |
| Class A | (19,973,612) | (9,510,983) |
| Class B | (689,098) | (279,421) |
| Class C | (255,262) | (144,402) |
| | | |
| | (20,917,972) | (9,934,806) |
| | | |
| From Fund share transactions (Note 4) | (15,389,465) | (13,588,239) |
| | | |
| Total decrease | (28,972,824) | (28,437,762) |
| |
| Net assets | | |
|
| Beginning of period | 486,612,561 | 457,639,737 |
| | | |
| End of period2 | $457,639,737 | $429,201,975 |
1 Semiannual period from 9-1-07 to 2-29-08. Unaudited.
2 Includes accumulated net investment income of $1,109,271 and $1,351,800, respectively.
See notes to financial statements
Semiannual report | Tax-Free Bond Fund
23
F I N A N C I A L S T A T E M E N T S
Financial highlights
The Financial Highlights show how the Fund’s net asset value for a share has changed since the end of the previous period.
CLASS A SHARES
| | | | | | |
| Period ended | 8-31-03 1 | 8-31-04 1 | 8-31-05 1 | 8-31-06 | 8-31-07 | 2-29-08 2 |
| |
| Per share operating performance | | | | | | |
|
| Net asset value, beginning of period | $10.40 | $9.96 | $10.22 | $10.41 | $10.24 | $9.95 |
| Net investment income3 | 0.53 | 0.49 | 0.48 | 0.47 | 0.45 | 0.23 |
| Net realized and unrealized gain | | | | | | |
| (loss) on investments | (0.45) | 0.26 | 0.19 | (0.18) | (0.29) | (0.35) |
| Total from investment operations | 0.08 | 0.75 | 0.67 | 0.29 | 0.16 | (0.12) |
| Less distributions | | | | | | |
| From net investment income | (0.52) | (0.49) | (0.48) | (0.46) | (0.45) | (0.22) |
| Net asset value, end of period | $9.96 | $10.22 | $10.41 | $10.24 | $9.95 | $9.61 |
| Total return4 (%) | 0.70 5 | 7.70 5 | 6.72 | 2.87 5 | 1.55 5 | (1.23) 5,6 |
| |
| Ratios and supplemental data | | | | | | |
|
| Net assets, end of period | | | | | | |
| (in millions) | $507 | $492 | $487 | $459 | $434 | $407 |
| Ratio (as a percentage of | | | | | | |
| average net assets): | | | | | | |
| Expenses excluding interest | | | | | | |
| and fees | 0.98 | 0.97 | 0.99 | 0.96 | 0.95 | 0.95 7 |
| Interest and fees | — | — | — | — | 0.08 | 0.08 7 |
| Expenses net of fee waivers, if any | 0.97 | 0.96 | 0.99 | 0.96 | 1.03 | 1.03 7 |
| Expenses net of all fee waivers | | | | | | |
| and credits | 0.97 | 0.96 | 0.99 | 0.96 | 1.03 | 1.03 7 |
| Net investment income | 5.11 | 4.87 | 4.71 | 4.54 | 4.45 | 4.55 7 |
| Portfolio turnover (%) | 23 | 49 | 32 | 54 | 40 | 18 6 |
1 Audited by previous Independent Registered Public Accounting Firm.
2 Semiannual period from 9-1-07 to 2-29-08. Unaudited.
3 Based on the average of the shares outstanding.
4 Assumes dividend reinvestment and does not reflect the effect of sales charges.
5 Total returns would have been lower had certain expenses not been reduced during the periods shown.
6 Not annualized.
7 Annualized.
See notes to financial statements
Tax-Free Bond Fund | Semiannual report
24
F I N A N C I A L S T A T E M E N T S
Financial highlights
CLASS B SHARES
| | | | | | |
| Period ended | 8-31-03 1 | 8-31-04 1 | 8-31-05 1 | 8-31-06 | 8-31-07 | 2-29-08 2 |
| |
| Per share operating performance | | | | | | |
|
| Net asset value, beginning of period | $10.40 | $9.96 | $10.22 | $10.41 | $10.24 | $9.95 |
| Net investment income3 | 0.45 | 0.42 | 0.41 | 0.39 | 0.38 | 0.19 |
| Net realized and unrealized gain | | | | | | |
| (loss) on investments | (0.45) | 0.26 | 0.18 | (0.18) | (0.30) | (0.34) |
| Total from investment operations | 0.00 | 0.68 | 0.59 | 0.21 | 0.08 | (0.15) |
| Less distributions | | | | | | |
| From net investment income | (0.44) | (0.42) | (0.40) | (0.38) | (0.37) | (0.19) |
| Net asset value, end of period | $9.96 | $10.22 | $10.41 | $10.24 | $9.95 | $9.61 |
| Total return4 (%) | (0.05) 5 | 6.89 5 | 5.93 | 2.10 5 | 0.80 5 | (1.61) 5,6 |
| |
| Ratios and supplemental data | | | | | | |
|
| Net assets, end of period | | | | | | |
| (in millions) | $49 | $39 | $32 | $21 | $16 | $14 |
| Ratio (as a percentage of | | | | | | |
| average net assets): | | | | | | |
| Expenses excluding interest | | | | | | |
| and fees | 1.73 | 1.73 | 1.74 | 1.71 | 1.70 | 1.71 7 |
| Interest and fees | — | — | — | — | 0.08 | 0.07 7 |
| Expenses net of fee waivers, if any | 1.72 | 1.72 | 1.74 | 1.71 | 1.78 | 1.78 7 |
| Expenses net of all fee waivers | | | | | | |
| and credits | 1.72 | 1.72 | 1.74 | 1.71 | 1.78 | 1.78 7 |
| Net investment income | 4.36 | 4.11 | 3.96 | 3.79 | 3.69 | 3.80 7 |
| Portfolio turnover (%) | 23 | 49 | 32 | 54 | 40 | 18 6 |
1 Audited by previous Independent Registered Public Accounting Firm.
2 Semiannual period from 9-1-07 to 2-29-08. Unaudited.
3 Based on the average of the shares outstanding.
4 Assumes dividend reinvestment and does not reflect the effect of sales charges.
5 Total returns would have been lower had certain expenses not been reduced during the periods shown.
6 Not annualized.
7 Annualized.
See notes to financial statements
Semiannual report | Tax-Free Bond Fund
25
F I N A N C I A L S T A T E M E N T S
Financial highlights
CLASS C SHARES
| | | | | | |
| Period ended | 8-31-03 1 | 8-31-04 1 | 8-31-05 1 | 8-31-06 | 8-31-07 | 2-29-08 2 |
| |
| Per share operating performance | | | | | | |
|
| Net asset value, beginning of period | $10.40 | $9.96 | $10.22 | $10.41 | $10.24 | $9.95 |
| Net investment income3 | 0.45 | 0.42 | 0.41 | 0.39 | 0.37 | 0.19 |
| Net realized and unrealized gain | | | | | | |
| (loss) on investments | (0.45) | 0.26 | 0.18 | (0.18) | (0.29) | (0.34) |
| Total from investment operations | 0.00 | 0.68 | 0.59 | 0.21 | 0.08 | (0.15) |
| Less distributions | | | | | | |
| From net investment income | (0.44) | (0.42) | (0.40) | (0.38) | (0.37) | (0.19) |
| Net asset value, end of period | $9.96 | $10.22 | $10.41 | $10.24 | $9.95 | $9.61 |
| Total return4 (%) | (0.05) 5 | 6.89 5 | 5.93 | 2.10 5 | 0.80 5 | (1.61) 5,6 |
| |
| Ratios and supplemental data | | | | | | |
|
| Net assets, end of period | | | | | | |
| (in millions) | $8 | $8 | $7 | $7 | $7 | $8 |
| Ratio (as a percentage of | | | | | | |
| average net assets): | | | | | | |
| Expenses excluding interest | | | | | | |
| and fees | 1.73 | 1.72 | 1.74 | 1.71 | 1.70 | 1.70 7 |
| Interest and fees | — | — | — | — | 0.08 | 0.08 7 |
| Expenses net of fee waivers, if any | 1.72 | 1.71 | 1.74 | 1.71 | 1.78 | 1.78 7 |
| Expenses net of all fee waivers | | | | | | |
| and credits | 1.72 | 1.71 | 1.74 | 1.71 | 1.78 | 1.78 7 |
| Net investment income | 4.35 | 4.11 | 3.96 | 3.79 | 3.70 | 3.81 7 |
| Portfolio turnover (%) | 23 | 49 | 32 | 54 | 40 | 18 6 |
1 Audited by previous Independent Registered Public Accounting Firm.
2 Semiannual period from 9-1-07 to 2-29-08. Unaudited.
3 Based on the average of the shares outstanding.
4 Assumes dividend reinvestment and does not reflect the effect of sales charges.
5 Total returns would have been lower had certain expenses not been reduced during the periods shown.
6 Not annualized.
7 Annualized.
See notes to financial statements
Tax-Free Bond Fund | Semiannual report
26
Notes to financial statements (unaudited)
Note 1
Organization
John Hancock Tax-Free Bond Fund (the Fund) is a diversified series of John Hancock Municipal Securities Trust (the Trust), an open-end management investment company registered under the Investment Company Act of 1940, as amended (the 1940 Act). The investment objective of the Fund is to provide as high a level of interest income exempt from federal income taxes as is consistent with preservation of capital.
The Trustees have authorized the issuance of multiple classes of shares of the Fund, designated as Class A, Class B and Class C shares. The shares of each class represent an interest in the same portfolio of investments of the Fund and have equal rights as to voting, redemptions, dividends and liquidation, except that certain expenses, subject to the approval of the Trustees, may be applied differently to each class of shares in accordance with current regulations of the Securities and Exchange Commission (SEC) and the Internal Revenue Service. Shareholders of a class that bears distribution and service expenses under the terms of a distribution plan have exclusive voting rights to that distribution plan. Class B shares will convert to Class A shares eight years after purchase.
Note 2
Significant accounting policies
The financial statements have been prepared in conformity with accounting principles generally accepted in the United States of America, which require management to make certain estimates and assumptions at the date of the financial statements. Actual results could differ from those estimates. The following summarizes the significant accounting policies of the Fund:
Security valuation
The net asset value of Class A, Class B and Class C shares of the Fund is determined daily as of the close of the New York Stock Exchange (NYSE), normally at 4:00 P.M., Eastern Time. Short-term debt investments that have a remaining maturity of 60 days or less are valued at amortized cost, and thereafter assume a constant amortization to maturity of any discount or premium, which approximates market value. All other securities held by the Fund are valued at the last sale price or official closing price (closing bid price or last evaluated quote if no sale has occurred) as of the close of business on the principal securities exchange (domestic or foreign) on which they trade or, lacking any sales, at the closing bid price. Securities traded only in the over-the-counter market are valued at the last bid price quoted by b rokers making markets in the securities at the close of trading. Securities for which there are no such quotations, principally debt securities, are valued based on the evaluated prices provided by an independent pricing service, which utilizes both dealer-supplied and electronic data processing techniques, which take into account factors such as institutional-size trading in similar groups of securities, yield, quality, coupon rate, maturity, type of issue, trading characteristics and other market data. Debt securities whose prices cannot be provided by an independent pricing service are valued at prices provided by broker-dealers.
Other assets and securities for which no such quotations are readily available are valued at fair value as determined in good faith under consistently applied procedures established by and under the general supervision of the Board of Trustees. Generally, trading in non-U.S. securities is substantially completed each day at various times prior to the close of trading on the NYSE. The values of such securities used in computing the net asset value of the Fund’s shares are generally determined as of such times. Occasionally, significant events that affect the values of such securities may occur between the times at which such
Semiannual report | Tax-Free Bond Fund
27
values are generally determined and the close of the NYSE. Upon such an occurrence, these securities will be valued at fair value as determined in good faith under consistently applied procedures established by and under the general supervision of the Board of Trustees.
Joint repurchase agreement
Pursuant to an exemptive order issued by the SEC, the Fund, along with other registered investment companies having a management contract with John Hancock Advisers, LLC (the Adviser), a wholly owned subsidiary of John Hancock Financial Services, Inc., a subsidiary of Manulife Financial Corporation (MFC), may participate in a joint repurchase agreement transaction. Aggregate cash balances are invested in one or more large repurchase agreements, whose underlying securities are obligations of the U.S. government and/ or its agencies. The Fund’s custodian bank receives delivery of the underlying securities for the joint account on the Fund’s behalf.
Investment transactions
Investment transactions are accounted for on a trade date plus one basis for daily net asset value calculations. However, for financial reporting purposes, investment security transactions are reported on trade date. Interest income is recorded on the accrual basis. Dividend income is recorded on the ex-dividend date net of foreign withholding taxes. Discounts/premiums are accreted/amortized for financial reporting purposes. Realized gains and losses from investment transactions are recorded on an identified cost basis.
Class allocations
Income, common expenses and realized and unrealized gains (losses) are determined at the fund level and allocated daily to each class of shares based on the appropriate net asset value of the respective classes. Distribution and service fees, if any, and transfer agent fees for Class A, Class B and Class C shares are calculated daily at the class level based on the appropriate net asset value of each class and the specific expense rate(s) applicable to each class.
Guarantees and indemnifications
Under the Fund’s organizational documents, its Officers and Trustees are indemnified against certain liability arising out of the performance of their duties to the Fund. Additionally, in the normal course of business, the Fund enters into contracts with service providers that contain general indemnification clauses. The Fund’s maximum exposure under these arrangements is unknown, as this would involve future claims that may be made against the Fund that have not yet occurred.
Expenses
The majority of expenses are directly identifiable to an individual fund. Expenses that are not readily identifiable to a specific fund are allocated in such a manner as deemed equitable, taking into consideration, among other things, the nature and type of expense and the relative size of the funds.
Bank borrowings
The Fund is permitted to have bank borrowings for temporary or emergency purposes, including the meeting of redemption requests that otherwise might require the untimely disposition of securities. The Fund has entered into a line of credit agreement with The Bank of New York Mellon (BNYM), the Swing Line Lender and Administrative Agent. This agreement enables the Fund to participate, with other funds managed by the Adviser, in an unsecured line of credit with BNYM, which permits borrowings of up to $100 million, collectively. Interest is charged to each fund based on its borrowing. In addition, a commitment fee is charged to each fund based on the average daily unused portion of the line of credit and is allocated among the participating funds. Effective February 29, 2008, the credit line increased to $150 million. The Fund had no borrowing activity under the line of credit during the period ended February 29, 2008.
Inverse floaters
Inverse floating rate notes are debt instruments with a floating rate of interest that bears an inverse relationship to changes in short-term market interest rates. Investments in this type of instrument involve special risks as compared to investments in a fixed rate municipal security. The debt instrument
Tax-Free Bond Fund | Semiannual report
28
in which the Fund may invest is a tender option bond trust (the trust) which can be established by the Fund, a financial institution, or broker, consisting of underlying municipal obligations with intermediate to long maturities and a fixed interest rate. Other investors in the trust usually consist of money market fund investors receiving weekly floating interest rate payments who have put options with the financial institutions. The Fund may enter into shortfall and forebearance agreements by which a Fund agrees to reimburse the trust, in certain circumstances, for the difference between the liquidation value of the fixed rate municipal security held by the trust and the liquidation value of the floating rate notes.
The Fund has the price risk of the underlying municipal obligations at the applicable leverage factor. Certain inverse floating rate securities held by the Fund have been created with bonds purchased by the Fund and subsequently transferred to a trust. These transactions are considered a form of financing for accounting purposes. As a result, the Fund includes the original transferred bond and a corresponding liability equal to the floating rate note issued. In addition, when the original transferred bond value and the floating rate note value are disproportionate, the Fund processes a bond swap transaction for the difference in value. The Fund does not consider the Fund’s investment in inverse floaters borrowing within the meaning of the 1940 Act. Inverse floating rate notes exhibit added interest rate sensitivity compared to other bonds with a similar maturity. Moreover, since these securities are in a trust form, a sale may take longer to settle than the standard two days after trade date.
The weighted average outstanding daily balance of the floating rate notes issued during the period ended February 29, 2008 was approximately $9,740,000 with a weighted average interest rate of 3.65%.
Federal income taxes
The Fund qualifies as a regulated investment company by complying with the applicable provisions of the Internal Revenue Code and will not be subject to federal income tax on taxable income that is distributed to shareholders. Therefore, no federal income tax provision is required. For federal income tax purposes, the Fund has $14,525,936 of a capital loss carryforward available, to the extent provided by regulations, to offset future net realized capital gains. To the extent that such carryforward is used by the Fund, no capital gain distributions will be made. The loss carryforwards expire as follows: August 31, 2011 — $7,431,104, August 31, 2012 —$6,837,618 and August 31, 2015 — $257,214.
The Fund has adopted the provisions of Financial Accounting Standards Board (FASB) Interpretation No. 48, Accounting for Uncertainty in Income Taxes , an interpretation of FASB Statement 109 (FIN 48), at the beginning of the Fund’s fiscal year. FIN 48 prescribes a minimum threshold for financial statement recognition of the benefit of a tax position taken or expected to be taken in a tax return. The implementation of FIN 48 did not have a material impact on the Fund’s financial statements. Each of the Fund’s federal tax returns for the prior fiscal years remains subject to examination by the Internal Revenue Service.
New accounting pronouncement
In September 2006, FASB Standard No. 157, Fair Value Measurements (FAS 157), was issued and is effective for fiscal years beginning after November 15, 2007. FAS 157 defines fair value, establishing a framework for measuring fair value and expands disclosure about fair value measurements. As of February 29, 2008, management does not believe the adoption of FAS 157 will impact the amounts reported in the financial statements; however, additional disclosures regarding pricing sources will be required about the inputs used to develop the measurements of fair value and the related realized and unrealized gain/loss as reported in the Statement of Operations for a fiscal period.
Distribution of income and gains
The Fund records distributions to shareholders from net investment income and net realized gains, if any, on the ex-dividend date. The Fund’s net investment income is declared daily as dividends to shareholders of record as of the close of business on the preceding day, and distributed monthly. During the year ended August 31, 2007, the tax character
Semiannual report | Tax-Free Bond Fund
29
of distributions paid was as follows: ordinary income $14,449 and tax exempt income $20,903,523. Distributions paid by the Fund with respect to each class of shares are calculated in the same manner, at the same time and are in the same amount, except for the effect of expenses that may be applied differently to each class.
Such distributions, on a tax basis, are determined in conformity with income tax regulations, which may differ from accounting principles generally accepted in the United States of America. Distributions in excess of tax basis earnings and profits, if any, are reported in the Fund’s financial statements as a return of capital.
Note 3
Management fee and transactions with
affiliates and others
The Fund has an investment management contract with the Adviser. Under the investment management contract, the Fund pays a monthly management fee to the Adviser equivalent, on an annual basis, to the sum of: (a) 0.55% of the first $500,000,000 of the Fund’s average daily net asset value, (b) 0.50% of the next $500,000,000 and (c) 0.45% of the Fund’s average daily net assets in excess of $1,000,000,000. The effective rate for the period ended February 29, 2008 is 0.55% of the Fund’s average daily net asset value. The Fund has a subadvisory agreement with MFC Global Investment Management (U.S.), LLC, a subsidiary of John Hancock Financial Services, Inc. The Fund is not responsible for payment of subadvisory fees.
The Fund has a Distribution Agreement with John Hancock Funds, LLC (JH Funds), a wholly owned subsidiary of the Adviser. The Fund has adopted Distribution Plans with respect to Class A, Class B and Class C, pursuant to Rule 12b-1 under the 1940 Act, to reimburse JH Funds for the services it provides as distributor of shares of the Fund. Accordingly, the Fund makes monthly payments to JH Funds at an annual rate not to exceed 0.25%, 1.00% and 1.00% of average daily net asset value of Class A, Class B and Class C, respectively. A maximum of 0.25% of such payments may be service fees, as defined by the Conduct Rules of the Financial Industry Regulatory Authority (formerly the National Association of Securities Dealers). Under the Conduct Rules, curtailment of a portion of the Fund’s 12b-1 payments could occur under certain circumstances.
The Fund has an agreement with its custodian bank, under which custody fees are reduced by balance credits applied during the period. Accordingly, the expense reductions related to custody fee offsets amounted to $438.
Class A shares are assessed up-front sales charges. During the period ended February 29, 2008, JH Funds received net up-front sales charges of $85,718 with regard to sales of Class A shares. Of this amount, $10,541 was retained and used for printing prospectuses, advertising, sales literature and other purposes, $54,285 was paid as sales commissions to unrelated broker-dealers and $20,892 was paid as sales commissions to sales personnel of Signator Investors, Inc. (Signator Investors), a related broker-dealer. The Adviser’s indirect parent, John Hancock Life Insurance Company (JHLICO), is the indirect sole shareholder of Signator Investors.
Class B shares that are redeemed within six years of purchase are subject to a contingent deferred sales charge (CDSC) at declining rates, beginning at 5.00% of the lesser of the current market value at the time of redemption or the original purchase cost of the shares being redeemed. Class C shares that are redeemed within one year of purchase are subject to a CDSC at a rate of 1.00% of the lesser of the current market value at the time of redemption or the original purchase cost of the shares being redeemed. Proceeds from the CDSCs are paid to JH Funds and are used in whole or in part to defray its expenses for providing distribution-related services to the Fund in connection with the sale of Class B and Class C shares. During the period ended February 29, 2008, CDSCs received by JH Funds amounted to $7,275 for Class B shares and $0 for Class C shares.
The Fund has a transfer agent agreement with John Hancock Signature Services, Inc.
Tax-Free Bond Fund | Semiannual report
30
(Signature Services), an indirect subsidiary of JHLICO. For Class A, Class B and Class C shares, the Fund pays a monthly transfer agent fee at an annual rate of 0.01% of each class’s average daily net asset value, plus a fee based on the number of shareholder accounts and reimbursement for certain out-of-pocket expenses, aggregated and allocated to each class on the basis of its relative net asset value. The Fund pays a monthly fee which is based on an annual rate of $16.00 for each Class A shareholder account, $18.50 for each Class B shareholder account and $17.50 for each Class C shareholder account.
In May 2007, the Fund began receiving earnings credits from its transfer agent as a result of uninvested cash balances. These credits are used to reduce a portion of the Fund’s transfer agent fees and out-of-pocket expenses. During the period ended February 29, 2008, the Fund’s transfer agent fees and out-of-pocket expenses were reduced by $5,103 for transfer agent credits earned.
Class level expenses for the period ended February 29, 2008 were as follows:
| | | |
| | Transfer | Distribution and | |
| Share class | agent fees | service fees | |
| |
| Class A | $178,986 | $536,311 | |
| Class B | 6,324 | 75,948 | |
| Class C | 3,222 | 39,045 | |
| Total | $188,532 | $651,304 | |
The Fund has an agreement with the Adviser and affiliates to perform necessary tax, accounting, compliance, legal and other administrative services for the Fund. The compensation for the period amounted to $24,152 with an effective rate of 0.01% of the Fund’s average daily net asset value.
Mr. James R. Boyle is Chairman of the Adviser, as well as affiliated Trustee of the Fund, and is compensated by the Adviser and/or its affiliates. The compensation of unaffiliated Trustees is borne by the Fund. The unaffiliated Trustees may elect to defer, for tax purposes, their receipt of this compensation under the John Hancock Group of Funds Deferred Compensation Plan. The Fund makes investments into other John Hancock funds, as applicable, to cover its liability for the deferred compensation. Investments to cover the Fund’s deferred compensation liability are recorded on the Fund’s books as an other asset. The deferred compensation liability and the related other asset are always equal and are marked to market on a periodic basis to reflect any income earned by the investments, as well as any unrealized gains or losses. The Deferred Compensation Plan investments had no impact on the operations of the Fund.
Semiannual report | Tax-Free Bond Fund
31
Note 4
Fund share transactions
This listing illustrates the number of Fund shares sold, reinvested and repurchased during the year ended August 31, 2007, and the period ended February 29, 2008, along with the corresponding dollar value.
| | | | |
| | | Year ended 8-31-07 | Period ended 2-29-081 |
| | Shares | Amount | Shares | Amount |
| Class A shares | | | | |
|
| Sold | 2,034,449 | $20,755,106 | 1,049,847 | $10,559,259 |
| Distributions reinvested | 1,429,483 | 14,585,320 | 704,698 | 7,038,879 |
| Repurchased | (4,598,208) | (46,872,840) | (3,029,817) | (30,418,513) |
| Net decrease | (1,134,276) | ($11,532,414) | (1,275,272) | ($12,820,375) |
| |
| Class B shares | | | | |
|
| Sold | 91,785 | $938,458 | 72,727 | $737,652 |
| Distributions reinvested | 42,045 | 429,254 | 17,881 | 178,650 |
| Repurchased | (585,219) | (5,971,686) | (270,162) | (2,719,294) |
| Net decrease | (451,389) | ($4,603,974) | (179,554) | ($1,802,992) |
| |
| Class C shares | | | | |
|
| Sold | 200,261 | $2,026,548 | 140,675 | $1,414,684 |
| Distributions reinvested | 15,230 | 155,331 | 10,005 | 99,881 |
| Repurchased | (140,322) | (1,434,956) | (47,666) | (479,437) |
| Net increase | 75,169 | $746,923 | 103,014 | $1,035,128 |
| |
| Net decrease | (1,510,496) | ($15,389,465) | (1,351,812) | ($13,588,239) |
|
1Semiannual period from 9-1-07 to 2-29-08. Unaudited.
Note 5
Purchase and sale of securities
Purchases and proceeds from sales or maturities of securities, other than short-term securities and obligations of the U.S. government, during the period ended February 29, 2008, aggregated $79,304,540 and $93,519,615, respectively.
Tax-Free Bond Fund | Semiannual report
32
Board Consideration of and
Continuation of Investment Advisory
Agreement and Subadvisory
Agreement: John Hancock Tax-Free
Bond Fund
The Investment Company Act of 1940 (the 1940 Act) requires the Board of Trustees (the Board) of John Hancock Tax-Exempt Series Fund (the Trust), including a majority of the Trustees who have no direct or indirect interest in the investment advisory agreement and are not “interested persons” of the Trust, as defined in the 1940 Act (the Independent Trustees), annually to meet in person to review and consider the continuation of: (i) the investment advisory agreement (the Advisory Agreement) with John Hancock Advisers, LLC (the Adviser) and (ii) the investment subadvisory agreement (the Subadvisory Agreement) with MFC Global Investment Management (U.S.), LLC (the Subadviser) for the John Hancock Tax-Free Bond Fund (the Fund). The Advisory Agreement and the Subadvisory Agreement are collectively referred to as the Advisory Agreements.
At meetings held on May 7 and June 4–5, 2007, the Board considered the factors and reached the conclusions described below relating to the selection of the Adviser and Subadviser and the continuation of the Advisory Agreements. During such meetings, the Board’s Contracts/ Operations Committee and the Independent Trustees also met in executive sessions with their independent legal counsel.
In evaluating the Advisory Agreements, the Board, including the Contracts/Operations Committee and the Independent Trustees, reviewed a broad range of information requested for this purpose by the Independent Trustees, including: (i) the investment performance of the Fund relative to a category of relevant funds (the Category) and a peer group of comparable funds (the Peer Group) each selected by Morningstar, Inc. (Morningstar), an independent provider of investment company data, for a range of periods ended December 31, 2006, (ii) advisory and other fees incurred by, and the expense ratios of, the Fund relative to a Category and a Peer Group, (iii) the advisory fees of comparable portfolios of other clients of the Adviser and the Subadviser, (iv) the Adviser’s financial results and condition, including its and certain of its affiliates’ profitability from services performed for the Fund, (v) breakpoints in the Fund’s and the Peer Group’s fees, and information about economies of scale, (vi) the Adviser’s and Subadviser’s record of compliance with applicable laws and regulations, with the Fund’s investment policies and restrictions, and with the applicable Code of Ethics, and the structure and responsibilities of the Adviser’s and Subadviser’s compliance department, (vii) the background and experience of senior management and investment professionals, and (viii) the nature, cost and character of advisory and non-investment management services provided by the Adviser and its affiliates and by the Subadviser.
The Independent Trustees considered the legal advice of independent legal counsel and relied on their own business judgment in determining the factors to be considered in evaluating the materials that were presented to them and the weight to be given to each such factor. The Board’s review and conclusions were based on a comprehensive consideration of all information presented to the Board and not the result of any single controlling factor. They principally considered performance and other information from Morningstar as of December 31, 2006. The Board also considered updated performance information provided to it by the Adviser or Subadviser at the May and June 2007 meetings. Performance and other information may be quite different as of the date of this shareholders report. The key factors considered by the Board and the conclusions reached are described below.
Nature, extent and quality of services
The Board considered the ability of the Adviser and the Subadviser, based on their resources, reputation and other attributes, to attract and retain qualified investment professionals, including research, advisory and supervisory personnel. The Board considered the investment philosophy, research and investment decision-making processes of the Adviser and Subadviser. The Board further considered the culture of compliance, resources dedicated to
Semiannual report | Tax-Free Bond Fund
33
compliance, compliance programs and compliance records of the Adviser and Subadviser. In addition, the Board took into account the administrative and other non-advisory services provided to the Fund by the Adviser and its affiliates.
Based on the above factors, together with those referenced below, the Board concluded that, within the context of its full deliberations, the nature, extent and quality of the investment advisory services provided to the Fund by the Adviser and Subadviser supported renewal of the Advisory Agreements.
Fund performance
The Board considered the performance results for the Fund over various time periods ended December 31, 2006. The Board also considered these results in comparison to the performance of the Category, as well as the Fund’s benchmark index. Morningstar determined the Category and Peer Group for the Fund. The Board reviewed with a representative of Morningstar the methodology used by Morningstar to select the funds in the Category and the Peer Group.
The Board noted that the Fund’s performance during the periods under review was generally competitive with the performance of the Peer Group and Category medians and its benchmark index, the Lehman Brothers Municipal Bond Index. The Board noted that, for the 5- and 10-year periods under review, the Fund’s performance was lower than the performance of the Peer Group and Category medians and the performance of the benchmark index. The Board viewed favorably that the Fund’s performance during the 1- and 3-year periods under review was higher than the performance of the Peer Group and Category medians, and its benchmark index.
Investment advisory fee and subadvisory fee rates and expenses
The Board reviewed and considered the contractual investment advisory fee rate payable by the Fund to the Adviser for investment advisory services (the Advisory Agreement Rate). The Board received and considered information comparing the Advisory Agreement Rate with the advisory fees for the Peer Group. The Board noted that the Advisory Agreement Rate was not appreciably higher than the Peer Group and Category medians.
The Board received and considered expense information regarding the Fund’s various components, including advisory fees, distribution and fees other than advisory and distribution fees, including transfer agent fees, custodian fees and other miscellaneous fees (e.g., fees for accounting and legal services). The Board considered comparisons of these expenses to the Peer Group median. The Board also received and considered expense information regarding the Fund’s total operating expense ratio (Expense Ratio). The Board noted that, unlike the Fund, several funds in the Peer Group employed fee waivers or reimbursements. The Board received and considered information comparing the Expense Ratio of the Fund to that of the Peer Group and Category medians before the application of fee waivers and reimbursements (Gross Expense Ratio) and after the application of such waivers and reimbursement (Net Expens e Ratio). The Board noted that the Fund’s Gross Ratio was lower than the Peer Group and higher than the Category median. The Board noted that the Fund’s Net Ratio was higher than the Peer Group and Category medians. The Board also noted the differences in the funds included in the Peer Group and Category, including differences in the employment of fee waivers.
The Adviser also discussed the Morningstar data and rankings, and other relevant information, for the Fund. Based on the above-referenced considerations and other factors, the Board concluded that the Fund’s overall performance and expenses supported the re-approval of the Advisory Agreements.
The Board also received information about the investment subadvisory fee rate (the Subadvisory Agreement Rate) payable by the Adviser to the Subadviser for investment subadvisory services. The Board concluded that the Subadvisory Agreement Rate was fair and equitable, based on its consideration of the factors described here.
Tax-Free Bond Fund | Semiannual report
34
Profitability
The Board received and considered a detailed profitability analysis of the Adviser based on the Advisory Agreements, as well as on other relationships between the Fund and the Adviser and its affiliates, including the Subadviser. The Board also considered a comparison of the Adviser’s profitability to that of other similar investment advisers whose profitability information is publicly available. The Board concluded that, in light of the costs of providing investment management and other services to the Fund, the profits and other ancillary benefits reported by the Adviser were not unreasonable.
Economies of scale
The Board received and considered general information regarding economies of scale with respect to the management of the Fund, including the Fund’s ability to appropriately benefit from economies of scale under the Fund’s fee structure. The Board recognized the inherent limitations of any analysis of economies of scale, stemming largely from the Board’s understanding that most of the Adviser’s costs are not specific to individual Funds, but rather are incurred across a variety of products and services.
To the extent the Board and the Adviser were able to identify actual or potential economies of scale from Fund-specific or allocated expenses, in order to ensure that any such economies continue to be reasonably shared with the Fund as its assets increase, the Adviser and the Board agreed to continue the existing breakpoints to the Advisory Agreement Rate.
Information about services to other clients
The Board also received information about the nature, extent and quality of services and fee rates offered by the Adviser and Subadviser to their other clients, including other registered investment companies, institutional investors and separate accounts. The Board concluded that the Advisory Agreement Rate and the Subadvisory Agreement Rate were not unreasonable, taking into account fee rates offered to others by the Adviser and Subadviser, respectively, after giving effect to differences in services.
Other benefits to the Adviser
The Board received information regarding potential “fall-out” or ancillary benefits received by the Adviser and its affiliates as a result of the Adviser’s relationship with the Fund. Such benefits could include, among others, benefits directly attributable to the relationship of the Adviser with the Fund and benefits potentially derived from an increase in the business of the Adviser as a result of its relationship with the Fund (such as the ability to market to shareholders other financial products offered by the Adviser and its affiliates).
The Board also considered the effectiveness of the Adviser’s, Subadviser’s and Fund’s policies and procedures for complying with the requirements of the federal securities laws, including those relating to best execution of portfolio transactions and brokerage allocation.
Other factors and broader review
As discussed above, the Board reviewed detailed materials received from the Adviser and Subadviser as part of the annual re-approval process. The Board also regularly reviews and assesses the quality of the services that the Fund receives throughout the year. In this regard, the Board reviews reports of the Adviser at least quarterly, which include, among other things, a detailed portfolio review, detailed fund performance reports and compliance reports. In addition, the Board meets with portfolio managers and senior investment officers at various times throughout the year.
After considering the above-described factors and based on its deliberations and its evaluation of the information described above, the Board concluded that approval of the continuation of the Advisory Agreements for the Fund was in the best interest of the Fund and its shareholders. Accordingly, the Board unanimously approved the continuation of the Advisory Agreements.
Semiannual report | Tax-Free Bond Fund
35
For more information
The Fund’s proxy voting policies, procedures and records are available without charge, upon request:
| | |
| By phone | On the Fund’s Web site | On the SEC’s Web site |
| 1-800-225-5291 | www. jhfunds. com/proxy | www. sec. gov |
|
| Trustees | Charles A. Rizzo | Custodian |
| James F. Carlin, Chairman | Chief Financial Officer | The Bank of New York |
| James R. Boyle† | | One Wall Street |
| William H. Cunningham | Gordon M. Shone | New York, NY 10286 |
| Charles L. Ladner* | Treasurer | |
| Dr. John A. Moore* | | Transfer agent |
| Patti McGill Peterson* | John G. Vrysen | John Hancock Signature |
| Steven R. Pruchansky | Chief Operating Officer | Services, Inc. |
| *Members of the Audit Committee | | P. O. Box 9510 |
| †Non-Independent Trustee | Investment adviser | Portsmouth, NH 03802-9510 |
| John Hancock Advisers, LLC | |
| Officers | 601 Congress Street | Legal counsel |
| Keith F. Hartstein | Boston, MA 02210-2805 | Kirkpatrick & Lockhart |
| President and | | Preston Gates Ellis LLP |
| Chief Executive Officer | Subadviser | One Lincoln Street |
| MFC Global Investment | Boston, MA 02111-2950 |
| Thomas M. Kinzler | Management (U. S. ), LLC | |
| Secretary and Chief Legal Officer | 101 Huntington Avenue | |
| | Boston, MA 02199 | |
| Francis V. Knox, Jr. | | |
| Chief Compliance Officer | Principal distributor | |
| John Hancock Funds, LLC | |
| 601 Congress Street | |
| | Boston, MA 02210-2805 | |
| | | |
| | |
| How to contact us | |
|
| |
| Internet | www. jhfunds.com | |
|
| Mail | Regular mail: | Express mail: |
| | John Hancock Signature | John Hancock Signature |
| | Services, Inc. | Services, Inc. |
| | P. O. Box 9510 | Mutual Fund Image Operations |
| | Portsmouth, NH 03802-9510 | 164 Corporate Drive |
| | | Portsmouth, NH 03801 |
|
| |
| Phone | Customer service representatives | 1-800-225-5291 |
| | EASI-Line | 1-800-338-8080 |
| | TDD line | 1-800-554-6713 |
|
A listing of month-end portfolio holdings is available on our Web site, www.jhfunds.com. A more detailed portfolio holdings summary is available on a quarterly basis 60 days after the fiscal quarter on our Web site or upon request by calling 1-800-225-5291, or on the SEC’s Web site, www.sec.gov.
Tax-Free Bond Fund | Semiannual report
36

1-800-225-5291
1-800-554-6713 (TDD)
1-800-338-8080 EASI-Line
www. jhfunds.com
Now available: electronic delivery
www. jhfunds.com/edelivery
| | |
| This report is for the information of the shareholders of John Hancock Tax-Free Bond Fund. | 520SA | 2/08 |
| It is not authorized for distribution to prospective investors unless preceded or accompanied by a prospectus. | | 4/08 |

A look at performance
For the periods ended February 29, 2008
| | | | | | | | | | | | | | |
| | | | Average annual returns | | | Cumulative total returns | | | | |
| | | | with maximum sales charge (POP) | | with maximum sales charge (POP) | | | | SEC 30- |
| | |
| |
| | day yield |
| | Inception | | | | | Since | | | | | | Since | | as of |
| Class | date | | 1-year | 5-year | 10-year | inception | | 6 months | 1-year | 5-year | 10-year | inception | | 2-29-08 |
|
| A | 12-31-93 | | –9.12% | 3.44% | 3.21% | — | | –6.58% | –9.12% | 18.40% | 37.10% | — | | 4.82% |
|
| B | 8-25-86 | | –10.11 | 3.28 | 3.07 | — | | –7.34 | –10.11 | 17.53 | 35.31 | — | | 4.26 |
|
| C | 4-1-99 | | –6.49 | 3.61 | — | 2.84% | | –3.52 | –6.49 | 19.42 | — | 28.36% | | 4.25 |
|
Performance figures assume all distributions are reinvested. Public offering price (POP) figures reflect maximum sales charge on Class A shares of 4.5% and the applicable contingent deferred sales charge (CDSC) on Class B and Class C shares. The returns for Class C shares have been adjusted to reflect the elimination of the front-end sales charge effective July 15, 2004. The Class B shares’ CDSC declines annually between years 1 to 6 according to the following schedule: 5, 4, 3, 3, 2, 1%. No sales charge will be assessed after the sixth year. Class C shares held for less than one year are subject to a 1% CDSC.
The expense ratios of the Fund, both net (including any fee waivers or expense limitations) and gross (excluding any fee waivers or expense limitations), are set forth according to the most recent publicly available prospectus for the Fund and may differ from the expense ratios disclosed in the Financial Highlights tables in this report. The net expenses equal the gross expenses and are as follows: Class A — 1.33%, Class B — 2.08%, Class C — 2.08% . The expenses, excluding interest expense, are as follows: Class A — 1.03%, Class B — 1.88%, Class C — 1.88% .
The returns reflect past results and should not be considered indicative of future performance. The return and principal value of an investment will fluctuate so that shares, when redeemed, may be worth more or less than their original cost. Due to market volatility, the Fund’s current performance may be higher or lower than the performance shown. For performance data current to the most recent month end, please call 1-800-225-5291 or visit the Fund’s Web site at www.jhfunds.com.
The performance table above and the chart on the next page do not reflect the deduction of taxes that a shareholder would pay on fund distributions or the redemption of fund shares. Please note that a portion of the Fund’s income may be subject to taxes, and some investors may be subject to the Alternative Minimum Tax (AMT). Also note that capital gains are taxable.
The Fund’s performance results reflect any applicable expense reductions, without which the expenses would increase and results would have been less favorable.
High Yield Municipal Bond Fund | Semiannual Report
6
Growth of $10,000
This chart shows what happened to a hypothetical $10,000 investment in High Yield Municipal Bond Fund Class A shares for the period indicated. For comparison, we’ve shown the same investment in the Lehman Brothers Municipal Bond Index.
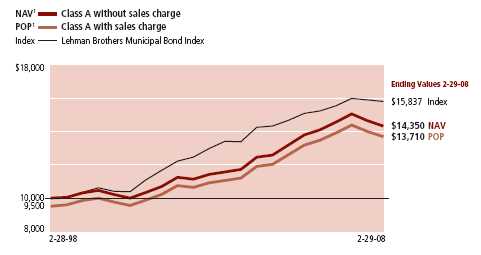
| | | | |
| | | | With maximum | |
| Class | Period beginning | Without sales charge | sales charge | Index |
|
| B2 | 2-28-98 | $13,531 | $13,531 | $15,837 |
|
| C 2 | 4-1-99 | 12,836 | 12,836 | 14,900 |
|
Assuming all distributions were reinvested for the period indicated, the table above shows the value of a $10,000 investment in the Fund’s Class B and Class C shares, respectively, as of February 29, 2008. The Class C shares investment with maximum sales charge has been adjusted to reflect the elimination of the front-end sales charge effective July 15, 2004. Performance of the classes will vary based on the difference in sales charges paid by shareholders investing in the different classes and the fee structure of those classes.
Lehman Brothers Municipal Bond Index is an unmanaged index that includes municipal bonds and is commonly used as a measure of bond performance.
It is not possible to invest directly in an index. Index figures do not reflect sales charges, which would have resulted in lower values if they did.
1 NAV represents net asset value and POP represents public offering price.
2 No contingent deferred sales charge applicable.
Semiannual Repo rt | High Yield Municipal Bond Fund
7
Your expenses
These examples are intended to help you understand your ongoing operating expenses.
Understanding fund expenses
As a shareholder of the Fund, you incur two types of costs:
■ Transaction costs which include sales charges (loads) on purchases or redemptions (varies by share class), minimum account fee charge, etc.
■ Ongoing operating expenses including management fees, distribution and service fees (if applicable), and other fund expenses.
We are going to present only your ongoing operating expenses here.
Actual expenses/actual returns
This example is intended to provide information about your fund’s actual ongoing operating expenses, and is based on your fund’s actual return. It assumes an account value of $1,000.00 on September 1, 2007, with the same investment held until February 29, 2008.
| | | |
| | Account value | Ending value | Expenses paid during |
| | on 9-1-07 | on 2-29-08 | period ended 2-29-081 |
|
| Class A | $1,000.00 | $978.10 | $6.43 |
|
| Class B | 1,000.00 | 974.40 | 10.07 |
|
| Class C | 1,000.00 | 974.40 | 10.07 |
|
Together with the value of your account, you may use this information to estimate the operating expenses that you paid over the period. Simply divide your account value at February 29, 2008, by $1,000.00, then multiply it by the “expenses paid” for your share class from the table above. For example, for an account value of $8,600.00, the operating expenses should be calculated as follows:

High Yield Municipal Bond Fund | Semiannual Report
8
Hypothetical example for comparison purposes
This table allows you to compare your fund’s ongoing operating expenses with those of any other fund. It provides an example of the Fund’s hypothetical account values and hypothetical expenses based on each class’s actual expense ratio and an assumed 5% annualized return before expenses (which is not your fund’s actual return). It assumes an account value of $1,000.00 on September 1, 2007, with the same investment held until February 29, 2008. Look in any other fund shareholder report to find its hypothetical example and you will be able to compare these expenses.
| | | | |
| | Account value | Ending value | Expenses paid during |
| | on 9-1-07 | on 2-29-08 | period ended 2-29-081 |
|
| Class A | $1,000.00 | $1,018.40 | $6.56 |
|
| Class B | 1,000.00 | 1,014.70 | 10.27 |
|
| Class C | 1,000.00 | 1,014.70 | 10.27 |
|
Remember, these examples do not include any transaction costs, such as sales charges; therefore, these examples will not help you to determine the relative total costs of owning different funds. If transaction costs were included, your expenses would have been higher. See the prospectus for details regarding transaction costs.
1 Expenses are equal to the Fund’s annualized expense ratio of 1.31%, 2.06% and 2.06% for Class A, Class B and Class C, respectively, multiplied by the average account value over the period, multiplied by number of days in most recent fiscal half-year/365 or 366 (to reflect the one-half year period).
Semiannual Repo rt | High Yield Municipal Bond Fund
9
Portfolio summary
| |
| Top 10 holdings1 | |
|
| Atlanta, City of, 11-01-19, 6.936% | 5.7% |
|
| Foothill/Eastern Transportation Corridor Agency, 01-01-18, Zero | 5.5% |
|
| Puerto Rico, Commonwealth of, 07-01-18, 6.600% | 4.2% |
|
| Massachusetts Health & Educational Facilities Auth, 12-15-31, 9.200% | 3.4% |
|
| Pocahontas Parkway Association, 08-15-19, Zero | 2.9% |
|
| San Bernardino, County of, 08-01-17, 5.500% | 2.9% |
|
| Capital Projects Finance Auth, 08-15-31, 7.850% | 2.5% |
|
| Gulf Coast Industrial Development Auth, 04-01-28, 8.000% | 2.4% |
|
| E-470 Public Highway Auth, 09-01-35, Zero | 2.4% |
|
| Chicago, City of, 06-01-22, 6.750% | 2.2% |
|
| | | | |
| Sector distribution1 | | | | |
|
| General obligation bonds | 8% | | Industrial development | 3% |
| |
|
| Revenue bonds | | | Housing | 3% |
| |
|
| Health | 14% | | Economic development | 3% |
| |
|
| Transportation | 9% | | Tobacco | 2% |
| |
|
| Special tax | 8% | | Water & sewer | 2% |
| |
|
| Pollution | 6% | | Other | 42% |
| |
|
| | | | | |
| Quality distribution1 | | | | |
| | | |
| AAA | 27% | | | |
| | |
| AA | 9% | | | |
| | |
| BBB | 28% | | | |
| | |
| BB | 32% | | | |
| | |
| B | 1% | | | |
| | |
| CCC | 3% | | | |
| | |

1As a percentage of net assets on February 29, 2008.
High Yield Municipal Bond Fund | Semiannual Report
10
F I N A N C I A L S T A T E M E N T S
Fund’s investments
Securities owned by the Fund on 2-29-08 (unaudited)
This schedule is divided into two main categories: tax-exempt long-term bonds and short-term investments. Tax-exempt long-term bonds are broken down by state or territory. Under each state or territory is a list of securities owned by the Fund. Short-term investments, which represent the Fund’s cash position, are listed last.
| | | | | | |
| | Interest | | Maturity | Credit | Par value | |
| State, issuer, description | rate | | date | rating (A) | (000) | Value |
| |
| Tax-exempt long-term bonds 104.46% | | | | | $95,847,103 |
|
| (Cost $95,534,510) | | | | | | |
| | | | | | | |
| California 15.28% | | | | | | 14,020,916 |
|
| California Pollution Control | | | | | | |
| Financing Auth, Rev | | | | | | |
| Chemical Waste Mgmt Inc Proj | | | | | | |
| Ser 2005C | 5.125% | | 11-01-23 | BBB | $2,000 | 1,778,880 |
|
| California, State of, Gen Oblig Ref Daily | | | | | | |
| Kindergarten Univ Ser 2004A-4 (P) | 3.680 | | 05-01-34 | AA | 600 | 600,000 |
|
| Foothill/Eastern Transportation | | | | | | |
| Corridor Agency, | | | | | | |
| Rev Ref Toll Rd Cap Apprec | Zero | | 01-15-36 | BBB– | 4,000 | 659,800 |
| Rev Toll Rd Cap Apprec Sr Lien | | | | | | |
| Ser 1995A | Zero | | 01-01-18 | AAA | 7,950 | 5,057,631 |
|
| Golden State Tobacco | | | | | | |
| Securitization Corp. , | | | | | | |
| Rev Asset Backed Bond Ser 2007A-1 | 5.000 | | 06-01-33 | BBB | 1,500 | 1,236,945 |
|
| Millbrae, City of, | | | | | | |
| Rev Magnolia of Milbrae Proj | | | | | | |
| Ser 1997A (G) | 7.375 | | 09-01-27 | BB | 1,000 | 1,013,490 |
|
| San Bernardino, County of, | | | | | | |
| Rev Ref Cert of Part Med Ctr | | | | | | |
| Fin Proj | 5.500 | | 08-01-17 | AAA | 2,500 | 2,664,650 |
|
| San Diego County Water Auth, | | | | | | |
| Rev Ref Cert of Part Inverse | | | | | | |
| Floater (M)(P) | 7.991 | | 04-23-08 | AA | 1,000 | 1,009,520 |
| | | | | | | |
| Colorado 3.38% | | | | | | 3,097,712 |
|
| Colorado Health Facilities Auth, | | | | | | |
| Rev Ref Christian Living Cmnty | | | | | | |
| Proj Ser 2006A (G) | 5.750 | | 01-01-26 | BB+ | 1,000 | 873,650 |
|
| E-470 Public Highway Auth, | | | | | | |
| Rev Cap Apprec Sr Ser 2000B | Zero | | 09-01-35 | BBB– | 15,700 | 2,224,062 |
| | | | | | | |
| Delaware 1.14% | | | | | | 1,049,540 |
|
| Charter MAC Equity Issuer Trust, | | | | | | |
| Bond (S) | 6.000 | | 04-30-19 | Aaa | 1,000 | 1,049,540 |
See notes to financial statements
Semiannual Report | High Yield Municipal Bond Fund
11
F I N A N C I A L S T A T E M E N T S
| | | | | | |
| | Interest | | Maturity | Credit | Par value | |
| State, issuer, description | rate | | date | rating (A) | (000) | Value |
| |
| Florida 20.93% | | | | | | $19,200,384 |
|
| Bonnet Creek Resort Community | | | | | | |
| Development District, | | | | | | |
| Rev Spec Assessment (G) | 7.375% | | 05-01-34 | BB+ | $1,055 | 1,067,228 |
| Rev Spec Assessment (G) | 7.250 | | 05-01-18 | BB+ | 1,445 | 1,461,487 |
|
| Capital Projects Finance Auth, | | | | | | |
| Rev Student Hsg Cap Projs Ln Prog | | | | | | |
| Ser 2000A (G) | 7.850 | | 08-15-31 | AA | 2,000 | 2,269,860 |
| Rev Student Hsg Cap Projs Ln Prog | | | | | | |
| Ser 2001G (G) | 9.125 | | 10-01-11 | BBB | 1,280 | 1,329,229 |
|
| Capital Trust Agency, | | | | | | |
| Rev Seminole Tribe Convention | | | | | | |
| Ser 2003A | 8.950 | | 10-01-33 | AAA | 1,000 | 1,238,770 |
|
| Crossings at Fleming Island | | | | | | |
| Community Development District, | | | | | | |
| Rev Ref Spec Assessment | | | | | | |
| Ser 2000C (G) | 7.100 | | 05-01-30 | BBB– | 1,000 | 1,007,170 |
|
| Grand Haven Community | | | | | | |
| Development District, | | | | | | |
| Rev Spec Assessment Ser 1997B (G) | 6.900 | | 05-01-19 | BBB– | 775 | 775,271 |
|
| Heritage Harbor North Community | | | | | | |
| Development District, | | | | | | |
| Rev Spec Assessment Cap Imp (G) | 6.375 | | 05-01-38 | BB+ | 1,250 | 1,094,675 |
|
| Main Street Community | | | | | | |
| Development District, | | | | | | |
| Rev Bond Ser 2008A (G)(N) | 6.800 | | 05-01-38 | BB | 1,000 | 959,290 |
|
| Miami Beach Health | | | | | | |
| Facilities Auth, | | | | | | |
| Rev Ref Hosp Mt Sinai Medical Ctr | | | | | | |
| Ser 2001A | 6.125 | | 11-15-11 | BB+ | 755 | 768,922 |
|
| Midtown Miami Community | | | | | | |
| Development District, | | | | | | |
| Rev Spec Assessment Ser 2004A (G) | 6.000 | | 05-01-24 | BB | 750 | 681,353 |
|
| Orlando Urban Community | | | | | | |
| Development District, | | | | | | |
| Rev Spec Assessment Cap Imp (G) | 6.000 | | 05-01-20 | BB+ | 750 | 689,715 |
| Rev Spec Assessment Cap Imp (G) | 6.250 | | 05-01-34 | BB+ | 1,000 | 887,580 |
|
| Poinciana Community | | | | | | |
| Development District, | | | | | | |
| Rev Spec Assessment (G) | 6.000 | | 05-01-37 | BB+ | 1,000 | 843,790 |
| Rev Spec Assessment Ser 2000A (G) | 7.125 | | 05-01-31 | BB+ | 500 | 502,465 |
|
| Seminole Tribe, | | | | | | |
| Rev Spec Oblig Ser 2007A (S) | 5.250 | | 10-01-27 | BBB | 1,000 | 877,620 |
|
| South Kendall Community | | | | | | |
| Development District, | | | | | | |
| Rev Spec Assessment Ser 2000A (G) | 5.900 | | 05-01-35 | BBB– | 975 | 870,119 |
|
| Tolomato Community Development | | | | | | |
| District, | | | | | | |
| Rev Spec Assessment (G) | 6.450 | | 05-01-23 | BB+ | 1,000 | 944,510 |
| Rev Spec Assessment (G) | 6.650 | | 05-01-40 | BB+ | 1,000 | 931,330 |
See notes to financial statements
High Yield Municipal Bond Fund | Semiannual Report
12
F I N A N C I A L S T A T E M E N T S
| | | | | | |
| | Interest | | Maturity | Credit | Par value | |
| State, issuer, description | rate | | date | rating (A) | (000) | Value |
| | | | | | | |
| Georgia 12.56% | | | | | | $11,524,390 |
|
| Atlanta, City of, | | | | | | |
| Rev Tax Alloc Eastside Proj | | | | | | |
| Ser 2005B (G) | 5.600% | | 01-01-30 | BB+ | $1,500 | 1,301,490 |
| Rev Wtr & Waste Wtr (G)(K)(I) | 5.000 | | 11-01-19 | AAA | 10,000 | 10,222,900 |
| | | | | | | |
| Illinois 2.24% | | | | | | 2,052,420 |
|
| Chicago, City of, | | | | | | |
| Gen Oblig Tax Alloc Jr Pilsen | | | | | | |
| Redev Ser 2004B (G) | 6.750 | | 06-01-22 | BBB+ | 2,000 | 2,052,420 |
| | | | | | | |
| Indiana 0.68% | | | | | | 621,888 |
|
| St. Joseph, County of, | | | | | | |
| Rev Econ Dev Holy Cross Village | | | | | | |
| Notre Dame Proj Ser 2006A (G) | 6.000 | | 05-15-26 | BB+ | 230 | 210,025 |
| Rev Econ Dev Holy Cross Village | | | | | | |
| Notre Dame Proj Ser 2006A (G) | 6.000 | | 05-15-38 | BB+ | 475 | 411,863 |
| | | | | | | |
| Iowa 0.26% | | | | | | 233,961 |
|
| Iowa Finance Auth, | | | | | | |
| Rev Ref Hlth Care Facil Care | | | | | | |
| Initiatives Proj | 9.250 | | 07-01-25 | AAA | 195 | 233,961 |
| | | | | | | |
| Louisiana 1.06% | | | | | | 971,270 |
|
| Local Government Environmental | | | | | | |
| Facilities Community | | | | | | |
| Development Auth, | | | | | | |
| Rev Bond | 6.750 | | 11-01-32 | BB+ | 1,000 | 971,270 |
| | | | | | | |
| Maryland 1.72% | | | | | | 1,576,750 |
|
| Prince Georges, County of, | | | | | | |
| Rev Spec Tax Dist Victoria Falls Proj (G) | 5.250 | | 07-01-35 | BB+ | 1,000 | 787,000 |
| Spec Oblig National Harbor Proj (G) | 5.200 | | 07-01-34 | BBB | 1,000 | 789,750 |
| | | | | | | |
| Massachusetts 7.66% | | | | | | 7,028,641 |
|
| Massachusetts Development | | | | | | |
| Finance Agency, | | | | | | |
| Rev Linden Ponds Facil | | | | | | |
| Ser 2007A (G) | 5.750 | | 11-15-42 | BB+ | 1,500 | 1,253,190 |
| Rev Resource Recovery Ogden | | | | | | |
| Haverhill Proj Ser 1998B | 5.500 | | 12-01-19 | BBB | 1,700 | 1,637,321 |
|
| Massachusetts Health & | | | | | | |
| Educational Facilities Auth, | | | | | | |
| Rev Civic Investments Inc | | | | | | |
| Ser 2002B (G) | 9.200 | | 12-15-31 | AA | 2,500 | 3,125,250 |
| Rev Jordan Hosp Ser 2003E | 6.750 | | 10-01-33 | BB+ | 1,000 | 1,012,880 |
| | | | | | | |
| Minnesota 1.03% | | | | | | 943,920 |
|
| North Oaks Senior Housing, | | | | | | |
| Rev Presbyterian Homes (G) | 6.000 | | 10-01-27 | BB– | 1,000 | 943,920 |
| | | | | | | |
| Missouri 0.96% | | | | | | 884,810 |
|
| Branson Regional Airport, | | | | | | |
| Rev Bond Ser 2007B (G) | 6.000 | | 07-01-25 | BB– | 1,000 | 884,810 |
See notes to financial statements
Semiannual Report | High Yield Municipal Bond Fund
13
F I N A N C I A L S T A T E M E N T S
| | | | | | |
| | Interest | | Maturity | Credit | Par value | |
| State, issuer, description | rate | | date | rating (A) | (000) | Value |
| | | | | | | |
| New Jersey 5.49% | | | | | | $5,041,330 |
|
| New Jersey Health Care Facilities | | | | | | |
| Financing Auth, | | | | | | |
| Rev Care Institute Inc Cherry | | | | | | |
| Hill Proj (G) | 8.000% | | 07-01-27 | CCC | $1,250 | 1,242,500 |
| Rev Ref St Peters Univ Hosp | | | | | | |
| Ser 2000A | 6.875 | | 07-01-30 | BBB– | 1,000 | 1,011,340 |
|
| New Jersey Tobacco Settlement | | | | | | |
| Financing Corp, | | | | | | |
| Rev Asset Backed Bond | 6.250 | | 06-01-43 | AAA | 1,000 | 1,130,500 |
| Rev Bond Ser 2007A | 5.000 | | 06-01-41 | BBB | 2,080 | 1,656,990 |
| New York 5.18% | | | | | | 4,756,383 |
|
| New York, City of, | | | | | | |
| Gen Oblig Unltd Ser 1993B-2 (P) | 3.750 | | 08-15-20 | AAA | 200 | 200,000 |
|
| New York City Industrial | | | | | | |
| Development Agency, | | | | | | |
| Rev Liberty 7 World Trade Ctr | | | | | | |
| Ser 2005A (G) | 6.250 | | 03-01-15 | BB+ | 1,500 | 1,519,485 |
| Rev Spec Facil Rev British | | | | | | |
| Airways Plc Proj | 5.250 | | 12-01-32 | BB+ | 1,000 | 766,660 |
|
| New York City Municipal Water | | | | | | |
| Finance Auth, | | | | �� | | |
| Rev Wtr & Swr Sys Ser 2000C (P) | 3.780 | | 06-15-33 | AA+ | 700 | 700,000 |
| Rev Wtr & Swr Sys Ser 2003F | | | | | | |
| Subser F-2 (P) | 3.780 | | 06-15-35 | AA+ | 540 | 540,000 |
|
| New York Liberty | | | | | | |
| Development Corp. , | | | | | | |
| Rev National Sports Museum Proj | | | | | | |
| Ser 2006A (G) | 6.125 | | 02-15-19 | BB– | 500 | 474,050 |
|
| Port Auth of New York & | | | | | | |
| New Jersey, | | | | | | |
| Rev Ref Spec Proj KIAC Partners | | | | | | |
| Ser 4 (G) | 6.750 | | 10-01-19 | BBB– | 555 | 556,188 |
| | | | | | | |
| Ohio 2.47% | | | | | | 2,270,650 |
|
| Buckeye Tobacco Settlement | | | | | | |
| Financing Auth, | | | | | | |
| Rev Asset Backed Sr Bond | | | | | | |
| Ser 2007A-2 | 5.750 | | 06-01-34 | BBB | 2,000 | 1,807,400 |
| Rev Asset Backed Sr Bond | | | | | | |
| Ser 2007A-2 | 5.125 | | 06-01-24 | BBB | 500 | 463,250 |
| | | | | | | |
| Oklahoma 1.12% | | | | | | 1,028,850 |
|
| Tulsa Municipal Airport Trust, | | | | | | |
| Rev Ref Ser 2000A (P) | 7.750 | | 06-01-35 | B | 1,000 | 1,028,850 |
| | | | | | | |
| Oregon 1.69% | | | | | | 1,554,481 |
|
| Western Generation Agency, | | | | | | |
| Rev Wauna Cogeneration Proj | | | | | | |
| Ser 2006B (G) | 5.000 | | 01-01-14 | BBB– | 1,105 | 1,080,336 |
| Rev Wauna Cogeneration Proj | | | | | | |
| Ser 2006B (G) | 5.000 | | 01-01-16 | BBB– | 500 | 474,145 |
See notes to financial statements
High Yield Municipal Bond Fund | Semiannual Report
14
F I N A N C I A L S T A T E M E N T S
| | | | | | |
| | Interest | | Maturity | Credit | Par value | |
| State, issuer, description | rate | | date | rating (A) | (000) | Value |
| | | | | | | |
| Pennsylvania 0.88% | | | | | | $810,970 |
|
| Allegheny County Hospital | | | | | | |
| Development Auth, | | | | | | |
| Rev West Penn Hlth Sys Ser 2007A | 5.000% | | 11-15-28 | BB | $1,000 | 810,970 |
| | | | | | | |
| Puerto Rico 3.94% | | | | | | 3,612,098 |
|
| Puerto Rico, Commonwealth of, | | | | | | |
| Pub Impt Ser A (I) | 5.000 | | 07-01-18 | Aaa | 3,345 | 3,612,098 |
| | | | | | | |
| Rhode Island 0.50% | | | | | | 454,042 |
|
| Tiverton, Town of, | | | | | | |
| Rev Spec Oblig Tax Mount Hope Bay | | | | | | |
| Village Ser 2002A (G) | 6.875 | | 05-01-22 | BBB– | 445 | 454,042 |
| | | | | | | |
| South Carolina 0.87% | | | | | | 799,560 |
|
| Lancaster, County of, | | | | | | |
| Rev Assessment Edenmoor Imp Dist | | | | | | |
| Ser 2006A (G) | 5.750 | | 12-01-37 | BB | 1,000 | 799,560 |
| | | | | | | |
| Tennessee 1.29% | | | | | | 1,183,230 |
|
| Johnson City Health & Educational | | | | | | |
| Facilities Board, | | | | | | |
| Rev Ref Hosp 1st Mtg Mtn States | | | | | | |
| Hlth Ser 2000A | 7.500 | | 07-01-33 | BBB+ | 1,000 | 1,183,230 |
| | | | | | | |
| Texas 4.80% | | | | | | 4,405,420 |
|
| Bexar County Health Facilities | | | | | | |
| Development Corp. , | | | | | | |
| Rev Ref Army Retirement | | | | | | |
| Residence Proj | 6.300 | | 07-01-32 | BBB | 150 | 168,633 |
|
| Brazos River Auth, | | | | | | |
| Rev Ref Poll Control Texas | | | | | | |
| Utilities Co Ser 1999A | 7.700 | | 04-01-33 | CCC | 1,000 | 1,002,290 |
|
| Gulf Coast Industrial | | | | | | |
| Development Auth, | | | | | | |
| Rev Solid Waste Disposal Citgo | | | | | | |
| Petroleum Proj | 8.000 | | 04-01-28 | Baa3 | 2,100 | 2,231,397 |
|
| Metro Health Facilities | | | | | | |
| Development Corp. , | | | | | | |
| Rev Wilson N Jones Mem Hosp Proj | 7.250 | | 01-01-31 | Ba3 | 1,000 | 1,003,100 |
| | | | | | | |
| Virginia 5.38% | | | | | | 4,932,640 |
|
| Peninsula Ports Auth, | | | | | | |
| Rev Ref Baptist Homes Res Care | | | | | | |
| Facility Ser 2006C (G) | 5.375 | | 12-01-26 | BB– | 1,000 | 841,440 |
|
| Pocahontas Parkway Assoc. , | | | | | | |
| Rev Toll Rd Cap Apprec Sr | | | | | | |
| Ser 1998B | Zero | | 08-15-19 | AAA | 5,000 | 2,688,250 |
| Rev Toll Rd Cap Apprec Sr | | | | | | |
| Ser 1998B | Zero | | 08-15-30 | AAA | 5,000 | 1,402,950 |
| | | | | | | |
| Washington 1.00% | | | | | | 919,537 |
|
| Washington Tobacco | | | | | | |
| Settlement Auth, | | | | | | |
| Rev Asset Backed Bond | 6.500 | | 06-01-26 | BBB | 910 | 919,537 |
See notes to financial statements
Semiannual Report | High Yield Municipal Bond Fund
15
F I N A N C I A L S T A T E M E N T S
| | | | | | |
| | Interest | | Maturity | Credit | Par value | |
| State, issuer, description | rate | | date | rating (A) | (000) | Value |
| | | | | | | |
| Wyoming 0.95% | | | | | | $871,310 |
|
| Sweetwater, County of, | | | | | | |
| Rev Ref Solid Waste Disposal FMC | | | | | | |
| Corp Proj | 5.600% | | 12-01-35 | BBB | $1,000 | 871,310 |
| |
| | | | | Interest | Par value | |
| Issuer, description, maturity date | | | | rate | (000) | Value |
| |
| Short-term investments 0.41% | | | | | | $379,000 |
|
| (Cost $379,000) | | | | | | |
| | | | | | | |
| Joint Repurchase Agreement 0.41% | | | | | | 379,000 |
|
| Repurchase Agreement with Barclays Plc dated 2-29-08 | | | | | |
| at 1.800% to be repurchased at $379,057 on 3-3-08, | | | | | |
| collateralized by U. S. Treasury Inflation Indexed | | | | | |
| Bond 3.875%, due 4-15-29 (valued at $386,580, | | | | | |
| including interest) | | | | 1.800% | $379 | 379,000 |
|
| Total investments (Cost $95,913,510)† 104.87% | | | | | $96,226,103 |
|
| |
| Other assets and liabilities, net (4.87%) | | | | | ($4,470,608) |
|
| |
| Total net assets 100.00% | | | | | | $91,755,495 |
|
The percentage shown for each investment category is the total value of that category as a percentage of the net assets of the Fund.
(A) Credit ratings are unaudited and are rated by Moody’s Investors Service or Fitch where Standard & Poor’s ratings are not available unless indicated otherwise.
(G) Security rated internally by John Hancock Advisers, LLC.
(I) Security is part of an inverse floater trust.
(K) Private placement securities are restricted to resale. The Fund may be unable to sell a direct placement security and it may be more difficult to determine a market value for a private placement security. Moreover, if adverse market conditions were to develop during the period between the Fund’s decision to sell a private placement security and the point at which the Fund is permitted or able to sell such security, the Fund might obtain a price less favorable than the price that prevailed when it decided to sell. This investment practice, therefore, could have the effect of increasing the level of illiquidity of the Fund. The Fund has limited rights to registration under the Securities Act of 1933 with respect to these restricted securities. Additional information on these securities is shown below:
| | | | |
| | | | Value as a | |
| | | | percentage | |
| | Acquisition | Acquisition | of Fund’s | Value as of |
| Issuer, description | date | cost | net assets | February 29, 2008 |
|
| Atlanta, City of, | | | | |
| Rev Wtr & Waste Wtr | 09-22-04 | $10,720,900 | 11.14% | $10,222,900 |
(M) Inverse floater bond purchased on secondary market.
(N) This security having an aggregate value of $959,290 or 1.05% of the Fund’s net assets, has been purchased as a forward commitment — that is, the Fund has agreed on trade date to take delivery of and to make payment for these securities on a delayed basis subsequent to the date of this schedule. The purchase price and the interest rate of such securities are fixed at trade date, although the Fund does not earn any interest on such securities until settlement date.
(P) Variable rate obligation. The coupon rate shown represents the rate at period end.
See notes to financial statements
High Yield Municipal Bond Fund | Semiannual Report
16
F I N A N C I A L S T A T E M E N T S
(S) These securities are exempt from registration under Rule 144A of the Securities Act of 1933. Such securities may be resold, normally to qualified institutional buyers, in transactions exempt from registration. Rule 144A securities amounted to $1,927,160 or 2.10% of the Fund’s net assets as of February 29, 2008.
† The cost of investments owned on February 29, 2008, including short-term investments, for federal income tax purposes was $90,916,241. Gross unrealized appreciation and depreciation of investments aggregated $4,501,195 and $3,989,376, respectively, resulting in net unrealized appreciation of $511,819.
See notes to financial statements
Semiannual Report | High Yield Municipal Bond Fund
17
F I N A N C I A L S T A T E M E N T S
Financial statements
Statement of assets and liabilities 2-29-08 (unaudited)
This Statement of Assets and Liabilities is the Fund’s balance sheet. It shows the value of what the Fund owns, is due and owes. You’ll also find the net asset value and the maximum offering price per share.
| |
| Assets | |
|
| Investments at value (cost $95,913,510) | $96,226,103 |
| Cash | 209 |
| Inverse floater bond swap at value | 201,957 |
| Receivable for shares sold | 691,542 |
| Interest receivable | 1,429,310 |
| Receivable from affiliates | 21,505 |
| Other assets | 16,162 |
| | |
| Total assets | 98,586,788 |
| |
| Liabilities | |
|
| Payable for settlements of investments purchased on a when-issued basis | 1,000,944 |
| Payable for shares repurchased | 256,001 |
| Interest expense and fees payable on inverse floaters | 43,108 |
| Payable for floating rate notes issued | 5,000,000 |
| Dividends payable | 365,898 |
| Payable to affiliates | |
| Management fees | 46,482 |
| Distribution and service fees | 38,083 |
| Other | 36,750 |
| Other payables and accrued expenses | 44,027 |
| | |
| Total liabilities | 6,831,293 |
| |
| Net assets | |
|
| Capital paid-in | 106,059,175 |
| Accumulated net realized loss on investments | (14,536,726) |
| Net unrealized appreciation of investments | 203,091 |
| Accumulated net investment income | 29,955 |
| | |
| Net assets | $91,755,495 |
| |
| Net asset value per share | |
|
| Based on net asset values and shares outstanding — the Fund has an | |
| unlimited number of shares authorized with no par value | |
| Class A ($68,301,515 ÷ 8,592,711 shares) | $7.95 |
| Class B ($8,842,764 ÷ 1,112,483 shares)1 | $7.95 |
| Class C ($14,611,216 ÷ 1,838,115 shares)1 | $7.95 |
| |
| Maximum offering price per share | |
|
| Class A2 ($7.95 ÷ 95.5%) | $8.32 |
1 Redemption price is equal to net asset value less any applicable contingent deferred sales charge.
2 On single retail sales of less than $100,000. On sales of $100,000 or more and on group sales the offering price is reduced.
See notes to financial statements
High Yield Municipal Bond Fund | Semiannual Report
18
F I N A N C I A L S T A T E M E N T S
Statement of operations For the period ended 2-29-08 (unaudited)1
This Statement of Operations summarizes the Fund’s investment income earned and expenses incurred in operating the Fund. It also shows net gains (losses) for the period stated.
| |
| Investment income | |
|
| Interest | $2,893,109 |
| | |
| Total investment income | 2,893,109 |
| |
| Expenses | |
|
| Investment management fees (Note 3) | 282,330 |
| Distribution and service fees (Note 3) | 195,069 |
| Transfer agent fees (Note 3) | 29,669 |
| Accounting and legal services fees (Note 3) | 4,923 |
| Interest expense and fees on inverse floaters | 92,327 |
| Printing fees | 22,008 |
| Professional fees | 19,385 |
| Blue sky fees | 16,934 |
| Custodian fees | 15,961 |
| Trustees’ fees | 2,138 |
| Miscellaneous | 4,004 |
| | |
| Total expenses | 684,748 |
| Less expense reductions (Note 3) | (981) |
| | |
| Net expenses | 683,767 |
| | |
| Net investment income | 2,209,342 |
| |
| Realized and unrealized loss | |
|
| Net realized loss on investments | (1,178,748) |
| Change in net unrealized appreciation (depreciation) of investments | (3,303,936) |
| | |
| Net realized and unrealized loss | (4,482,684) |
| | |
| Decrease in net assets from operations | ($2,273,342) |
1 Semiannual period from 9-1-07 to 2-29-08.
See notes to financial statements
Semiannual Report | High Yield Municipal Bond Fund
19
F I N A N C I A L S T A T E M E N T S
Statement of changes in net assets
These Statements of Changes in Net Assets show how the value of the Fund’s net assets has changed during the last two periods. The difference reflects earnings less expenses, any investment gains and losses, distributions, if any, paid to shareholders and the net of Fund share transactions.
| | |
| | Year | Period |
| | ended | ended |
| | 8-31-07 | 2-29-081 |
| |
| Increase (decrease) in net assets | | |
|
| From operations | | |
| Net investment income | $4,495,676 | $2,209,342 |
| Net realized loss | (500,700) | (1,178,748) |
| Change in net unrealized appreciation (depreciation) | (3,372,287) | (3,303,936) |
| | | |
| Increase (decrease) in net assets resulting from operations | 622,689 | (2,273,342) |
| | | |
| Distributions to shareholders | | |
| From net investment income | | |
| Class A | (3,535,927) | (1,726,152) |
| Class B | (525,790) | (203,715) |
| Class C | (387,413) | (236,283) |
| | | |
| | (4,449,130) | (2,166,150) |
| | | |
| From Fund share transactions (Note 4) | (3,476,825) | 5,672,262 |
| | | |
| Total increase (decrease) | (7,303,266) | 1,232,770 |
| |
| Net assets | | |
|
| Beginning of period | 97,825,991 | 90,522,725 |
| | | |
| End of period2 | $90,522,725 | $91,755,495 |
1 Semiannual period from 9-1-07 to 2-29-08. Unaudited.
2 Includes accumulated (distributions in excess of) net investment of ($13,237) and $29,955, respectively.
See notes to financial statements
High Yield Municipal Bond Fund | Semiannual Report
20
F I N A N C I A L S T A T E M E N T S
Financial highlights
The Financial Highlights show how the Fund’s net asset value for a share has changed since the end of the previous period.
CLASS A SHARES
| | | | | | |
| Period ended | 8-31-03 1 | 8-31-04 1 | 8-31-05 1 | 8-31-06 | 8-31-07 | 2-29-08 2 |
| |
| Per share operating performance | | | | | | |
|
| Net asset value, beginning of period | $8.43 | $8.14 | $8.27 | $8.62 | $8.68 | $8.33 |
| Net investment income3 | 0.51 | 0.47 | 0.43 | 0.42 | 0.41 | 0.20 |
| Net realized and unrealized gain | | | | | | |
| (loss) on investments | (0.29) | 0.12 | 0.35 | 0.05 | (0.35) | (0.38) |
| Total from investment operations | 0.22 | 0.59 | 0.78 | 0.47 | 0.06 | (0.18) |
| Less distributions | | | | | | |
| From net investment income | (0.51) | (0.46) | (0.43) | (0.41) | (0.41) | (0.20) |
| Net asset value, end of period | $8.14 | $8.27 | $8.62 | $8.68 | $8.33 | $7.95 |
| Total return4 (%) | 2.63 5 | 7.41 5 | 9.64 | 5.61 5 | 0.60 5 | (2.19) 5,6 |
| |
| Ratios and supplemental data | | | | | | |
|
| Net assets, end of period | | | | | | |
| (in millions) | $71 | $69 | $72 | $72 | $71 | $68 |
| Ratio (as a percentage of average | | | | | | |
| net assets): | | | | | | |
| Expenses excluding interest | | | | | | |
| and fees | 1.11 | 1.10 | 1.14 | 1.09 | 1.13 | 1.11 7 |
| Interest and fees | — | — | — | — | 0.20 | 0.20 7 |
| Expenses net of fee waivers, if any | 1.09 | 1.09 | 1.14 | 1.09 | 1.33 | 1.31 7 |
| Expenses net of all fee waivers | | | | | | |
| and credits | 1.09 | 1.09 | 1.14 | 1.09 | 1.33 | 1.31 7 |
| Net investment income | 6.16 | 5.67 | 5.09 | 4.71 | 4.77 | 4.97 7 |
| Portfolio turnover (%) | 35 | 57 | 65 | 52 | 63 | 25 6 |
1 Audited by previous Independent Registered Public Accounting Firm.
2 Semiannual period from 9-1-07 to 2-29-08. Unaudited.
3 Based on the average of the shares outstanding.
4 Assumes dividend reinvestment and does not reflect the effect of sales charges.
5 Total returns would have been lower had certain expenses not been reduced during the periods shown.
6 Not annualized.
7 Annualized.
See notes to financial statements
Semiannual Report | High Yield Municipal Bond Fund
21
F I N A N C I A L S T A T E M E N T S
Financial highlights
CLASS B SHARES
| | | | | | |
| Period ended | 8-31-03 1 | 8-31-04 1 | 8-31-05 1 | 8-31-06 | 8-31-07 | 2-29-08 2 |
| |
| Per share operating performance | | | | | | |
|
| Net asset value, beginning of period | $8.43 | $8.14 | $8.27 | $8.62 | $8.68 | $8.33 |
| Net investment income3 | 0.45 | 0.41 | 0.37 | 0.36 | 0.35 | 0.17 |
| Net realized and unrealized gain | | | | | | |
| (loss) on investments | (0.30) | 0.12 | 0.35 | 0.04 | (0.36) | (0.38) |
| Total from investment operations | 0.15 | 0.53 | 0.72 | 0.40 | (0.01) | (0.21) |
| Less distributions | | | | | | |
| From net investment income | (0.44) | (0.40) | (0.37) | (0.34) | (0.34) | (0.17) |
| Net asset value, end of period | $8.14 | $8.27 | $8.62 | $8.68 | $8.33 | $7.95 |
| Total return4 (%) | 1.87 5 | 6.62 5 | 8.84 | 4.83 5 | (0.15) 5 | (2.56) 5,6 |
| |
| Ratios and supplemental data | | | | | | |
|
| Net assets, end of period | | | | | | |
| (in millions) | $37 | $31 | $24 | $16 | $11 | $9 |
| Ratio (as a percentage of average | | | | | | |
| net assets): | | | | | | |
| Expenses excluding interest | | | | | | |
| and fees | 1.86 | 1.84 | 1.87 | 1.84 | 1.88 | 1.86 7 |
| Interest and fees | — | — | — | — | 0.20 | 0.20 7 |
| Expenses net of fee waivers, if any | 1.84 | 1.83 | 1.87 | 1.84 | 2.08 | 2.06 7 |
| Expenses net of all fee waivers | | | | | | |
| and credits | 1.84 | 1.83 | 1.87 | 1.84 | 2.08 | 2.06 7 |
| Net investment income | 5.41 | 4.93 | 4.35 | 4.11 | 4.05 | 4.22 7 |
| Portfolio turnover (%) | 35 | 57 | 65 | 52 | 63 | 25 6 |
1 Audited by previous Independent Registered Public Accounting Firm.
2 Semiannual period from 9-1-07 to 2-29-08. Unaudited.
3 Based on the average of the shares outstanding.
4 Assumes dividend reinvestment and does not reflect the effect of sales charges.
5 Total returns would have been lower had certain expenses not been reduced during the periods shown.
6 Not annualized.
7 Annualized.
See notes to financial statements
High Yield Municipal Bond Fund | Semiannual Report
22
F I N A N C I A L S T A T E M E N T S
Financial highlights
CLASS C SHARES
| | | | | | |
| Period ended | 8-31-03 1 | 8-31-04 1 | 8-31-05 1 | 8-31-06 | 8-31-07 | 2-29-08 2 |
| |
| Per share operating performance | | | | | | |
|
| Net asset value, beginning of period | $8.43 | $8.14 | $8.27 | $8.62 | $8.68 | $8.33 |
| Net investment income3 | 0.44 | 0.40 | 0.36 | 0.35 | 0.34 | 0.17 |
| Net realized and unrealized gain | | | | | | |
| (loss) on investments | (0.29) | 0.13 | 0.36 | 0.05 | (0.35) | (0.38) |
| Total from investment operations | 0.15 | 0.53 | 0.72 | 0.40 | (0.01) | (0.21) |
| Less distributions | | | | | | |
| From net investment income | (0.44) | (0.40) | (0.37) | (0.34) | (0.34) | (0.17) |
| Net asset value, end of period | $8.14 | $8.27 | $8.62 | $8.68 | $8.33 | $7.95 |
| Total return4 (%) | 1.87 5 | 6.61 5 | 8.82 | 4.83 5 | (0.15) 5 | (2.56) 5,6 |
| |
| Ratios and supplemental data | | | | | | |
|
| Net assets, end of period | | | | | | |
| (in millions) | $6 | $8 | $8 | $9 | $9 | $15 |
| Ratio (as a percentage of average | | | | | | |
| net assets): | | | | | | |
| Expenses excluding interest | | | | | | |
| and fees | 1.86 | 1.84 | 1.89 | 1.84 | 1.88 7 | 1.86 7 |
| Interest and fees | — | — | — | — | 0.20 | 0.20 7 |
| Expenses net of fee waivers, if any | 1.84 | 1.83 | 1.89 | 1.84 | 2.08 | 2.06 7 |
| Expenses net of all fee waivers | | | | | | |
| and credits | 1.84 | 1.83 | 1.89 | 1.84 | 2.08 | 2.06 7 |
| Net investment income | 5.38 | 4.88 | 4.33 | 4.09 | 4.02 | 4.23 7 |
| Portfolio turnover (%) | 35 | 57 | 65 | 52 | 63 | 25 6 |
1 Audited by previous Independent Registered Public Accounting Firm.
2 Semiannual period from 9-1-07 to 2-29-08. Unaudited.
3 Based on the average of the shares outstanding.
4 Assumes dividend reinvestment and does not reflect the effect of sales charges.
5 Total returns would have been lower had certain expenses not been reduced during the periods shown.
6 Not annualized.
7 Annualized.
See notes to financial statements
Semiannual Report | High Yield Municipal Bond Fund
23
Notes to financial statements (unaudited)
Note 1
Organization
John Hancock High Yield Municipal Bond Fund (the Fund) is a non-diversified series of John Hancock Municipal Securities Trust (the Trust), an open-end management investment company registered under the Investment Company Act of 1940, as amended (the 1940 Act). The investment objective of the Fund is to seek a high level of current income that is largely exempt from federal income tax, consistent with preservation of capital.
The Trustees have authorized the issuance of multiple classes of shares of the Fund, designated as Class A, Class B and Class C shares. The shares of each class represent an interest in the same portfolio of investments of the Fund and have equal rights as to voting, redemptions, dividends and liquidation, except that certain expenses, subject to the approval of the Trustees, may be applied differently to each class of shares in accordance with current regulations of the Securities and Exchange Commission (SEC) and the Internal Revenue Service. Shareholders of a class that bears distribution and service expenses under the terms of a distribution plan have exclusive voting rights to that distribution plan. Class B shares will convert to Class A shares eight years after purchase.
Note 2
Significant accounting policies
The financial statements have been prepared in conformity with accounting principles generally accepted in the United States of America, which require management to make certain estimates and assumptions at the date of the financial statements. Actual results could differ from those estimates. The following summarizes the significant accounting policies of the Fund:
Security valuation
The net asset value of Class A, Class B and Class C shares of the Fund is determined daily as of the close of the New York Stock Exchange (NYSE), normally at 4:00 P.M., Eastern Time. Short-term debt investments that have a remaining maturity of 60 days or less are valued at amortized cost, and thereafter assume a constant amortization to maturity of any discount or premium, which approximates market value. All other securities held by the Fund are valued at the last sale price or official closing price (closing bid price or last evaluated quote if no sale has occurred) as of the close of business on the principal securities exchange (domestic or foreign) on which they trade or, lacking any sales, at the closing bid price. Securities traded only in the over-the-counter market are valued at the last bid price quoted by brokers making markets in the securities at the close of trading. Securities for which there are no such quotations, principally debt securities, are valued based on the evaluated prices provided by an independent pricing service, which utilizes both dealer-supplied and electronic data processing techniques, which take into account factors such as institutional-size trading in similar groups of securities, yield, quality, coupon rate, maturity, type of issue, trading characteristics and other market data. Debt securities whose prices cannot be provided by an independent pricing service are valued at prices provided by broker-dealers.
Other assets and securities for which no such quotations are readily available are valued at fair value as determined in good faith under consistently applied procedures established by and under the general supervision of the Board of Trustees. Generally, trading in non-U.S. securities is substantially completed each day at various times prior to the close of trading on the NYSE. The values of such securities used in computing the net asset value of the Fund’s shares are generally determined as of such times. Occasionally, significant events that affect the values of such securities may occur between the times at which such values are generally determined and the close of the NYSE. Upon
High Yield Municipal Bond Fund | Semiannual Report
24
such an occurrence, these securities will be valued at fair value as determined in good faith under consistently applied procedures established by and under the general supervision of the Board of Trustees.
Joint repurchase agreement
Pursuant to an exemptive order issued by the SEC, the Fund, along with other registered investment companies having a management contract with John Hancock Advisers, LLC (the Adviser), a wholly owned subsidiary of John Hancock Financial Services, Inc., a subsidiary of Manulife Financial Corporation (MFC), may participate in a joint repurchase agreement transaction. Aggregate cash balances are invested in one or more large repurchase agreements, whose underlying securities are obligations of the U.S. government and/ or its agencies. The Fund’s custodian bank receives delivery of the underlying securities for the joint account on the Fund’s behalf.
Investment transactions
Investment transactions are accounted for on a trade date plus one basis for daily net asset value calculations. However, for financial reporting purposes, investment security transactions are reported on trade date. Interest income is recorded on the accrual basis. Dividend income is recorded on the ex-dividend date net of foreign withholding taxes. Discounts/premiums are accreted/amortized for financial reporting purposes. Realized gains and losses from investment transactions are recorded on an identified cost basis.
Class allocations
Income, common expenses and realized and unrealized gains (losses) are determined at the fund level and allocated daily to each class of shares based on the appropriate net asset value of the respective classes. Distribution and service fees, if any, and transfer agent fees for Class A, Class B and Class C shares are calculated daily at the class level based on the appropriate net asset value of each class and the specific expense rate(s) applicable to each class.
Guarantees and indemnifications
Under the Fund’s organizational documents, its Officers and Trustees are indemnified against certain liability arising out of the performance of their duties to the Fund. Additionally, in the normal course of business, the Fund enters into contracts with service providers that contain general indemnification clauses. The Fund’s maximum exposure under these arrangements is unknown, as this would involve future claims that may be made against the Fund that have not yet occurred.
Expenses
The majority of expenses are directly identifiable to an individual fund. Expenses that are not readily identifiable to a specific fund are allocated in such a manner as deemed equitable, taking into consideration, among other things, the nature and type of expense and the relative size of the funds.
Bank borrowings
The Fund is permitted to have bank borrowings for temporary or emergency purposes, including the meeting of redemption requests that otherwise might require the untimely disposition of securities. The Fund has entered into a line of credit agreement with The Bank of New York Mellon (BNYM), the Swing Line Lender and Administrative Agent. This agreement enables the Fund to participate, with other funds managed by the Adviser, in an unsecured line of credit with BNYM, which permits borrowings of up to $100 million, collectively. Interest is charged to each fund based on its borrowing. In addition, a commitment fee is charged to each fund based on the average daily unused portion of the line of credit and is allocated among the participating funds. Effective February 29, 2008, the credit line increased to $150 million. The Fund had no borrowing activity under the line of credit during the period ended February 29, 2008.
Inverse floaters
Inverse floating rate notes are debt instruments with a floating rate of interest that bears an inverse relationship to changes in short-term market interest rates. Investments in this type of instrument involve special risks as compared to investments in a fixed rate municipal security. The debt instrument in which the Fund may invest is a tender option bond trust (the trust) which can be established by the Fund, a financial institution,
Semiannual Report | High Yield Municipal Bond Fund
25
or broker, consisting of underlying municipal obligations with intermediate to long maturities and a fixed interest rate. Other investors in the trust usually consist of money market fund investors receiving weekly floating interest rate payments who have put options with the financial institutions. The Fund may enter into shortfall and forebearance agreements by which a Fund agrees to reimburse the trust, in certain circumstances, for the difference between the liquidation value of the fixed rate municipal security held by the trust and the liquidation value of the floating rate notes.
The Fund has the price risk of the underlying municipal obligations at the applicable leverage factor. Certain inverse floating rate securities held by the Fund have been created with bonds purchased by the Fund and subsequently transferred to a trust. These transactions are considered a form of financing for accounting purposes. As a result, the Fund includes the original transferred bond and a corresponding liability equal to the floating rate note issued. In addition, when the original transferred bond value and the floating rate note value are disproportionate, the Fund processes a bond swap transaction for the difference in value. The Fund does not consider the Fund’s investment in inverse floaters borrowing within the meaning of the 1940 Act. Inverse floating rate notes exhibit added interest rate sensitivity compared to other bonds with a similar maturity. Moreover, since these securities are in a trust form, a sale may take longer to settle than the standard two days after trade date.
The weighted average outstanding daily balance of the floating rate notes issued during the period ended February 29, 2008 was approximately $5,000,000 with a weighted average interest rate of 3.69% .
Federal income taxes
The Fund qualifies as a regulated investment company by complying with the applicable provisions of the Internal Revenue Code and will not be subject to federal income tax on taxable income that is distributed to shareholders. Therefore, no federal income tax provision is required. For federal income tax purposes, the Fund has $13,318,581 of a capital loss carryforward available, to the extent provided by regulations, to offset future net realized capital gains. To the extent that such carryforward is used by the Fund, no capital gain distributions will be made. The loss carryforwards expire as follows: August 31, 2008 —$3,756,798, August 31, 2010 — $1,227,272, August 31, 2011 — $2,540,698, August 31, 2012 — $2,816,241, August 31, 2013 —$1,681,342, August 31, 2014 — $119,574 and August 31, 2015 — $1,176,656.
The Fund has adopted the provisions of Financial Accounting Standards Board (FASB) Interpretation No. 48, Accounting for Uncertainty in Income Taxes , an interpretation of FASB Statement 109 (FIN 48), at the beginning of the Fund’s fiscal year. FIN 48 prescribes a minimum threshold for financial statement recognition of the benefit of a tax position taken or expected to be taken in a tax return. The implementation of FIN 48 did not have a material impact on the Fund’s financial statements. Each of the Fund’s federal tax returns for the prior fiscal years remains subject to examination by the Internal Revenue Service.
New accounting pronouncement
In September 2006, FASB Standard No. 157, Fair Value Measurements (FAS 157), was issued and is effective for fiscal years beginning after November 15, 2007. FAS 157 defines fair value, establishing a framework for measuring fair value and expands disclosure about fair value measurements. As of February 29, 2008, management does not believe the adoption of FAS 157 will impact the amounts reported in the financial statements; however, additional disclosures regarding pricing sources will be required about the inputs used to develop the measurements of fair value and the related realized and unrealized gain/loss as reported in the Statement of Operations for a fiscal period.
Distribution of income and gains
The Fund records distributions to shareholders from net investment income and net realized gains, if any, on the ex-dividend date. The Fund’s net investment income is declared daily as dividends to shareholders of record as of the close of business on the preceding day, and distributed monthly. During the year ended August 31, 2007, the tax character of
High Yield Municipal Bond Fund | Semiannual Report
26
distributions paid was as follows: ordinary income $16,035 and tax exempt income $4,433,095. Distributions paid by the Fund with respect to each class of shares are calculated in the same manner, at the same time and are in the same amount, except for the effect of expenses that may be applied differently to each class.
Such distributions, on a tax basis, are determined in conformity with income tax regulations, which may differ from accounting principles generally accepted in the United States of America. Distributions in excess of tax basis earnings and profits, if any, are reported in the Fund’s financial statements as a return of capital.
Note 3
Management fee and transactions with
affiliates and others
The Fund has an investment management contract with the Adviser. Under the investment management contract, the Fund pays a monthly management fee to the Adviser equivalent, on an annual basis, to the sum of: (a) 0.625% of the first $75,000,000 of the Fund’s average daily net asset value, (b) 0.5625% of the next $75,000,000 and (c) 0.50% of the Fund’s average daily net asset value in excess of $150,000,000. The effective rate for the period ended February 29, 2008 is 0.61% of the Fund’s average daily net asset value. The Fund has a subadvisory agreement with MFC Global Investment Management (U.S.), LLC, a subsidiary of John Hancock Financial Services, Inc. The Fund is not responsible for payment of subadvisory fees.
The Fund has a Distribution Agreement with John Hancock Funds, LLC (JH Funds), a wholly owned subsidiary of the Adviser. The Fund has adopted Distribution Plans with respect to Class A, Class B and Class C, pursuant to Rule 12b-1 under the 1940 Act, to reimburse JH Funds for the services it provides as distributor of shares of the Fund. Accordingly, the Fund makes monthly payments to JH Funds at an annual rate not to exceed 0.25%, 1.00% and 1.00% of average daily net asset value of Class A, Class B and Class C, respectively. A maximum of 0.25% of such payments may be service fees, as defined by the Conduct Rules of the Financial Industry Regulatory Authority (formerly the National Association of Securities Dealers). Under the Conduct Rules, curtailment of a portion of the Fund’s 12b-1 payments could occur under certain circumstances.
The Fund has an agreement with its custodian bank, under which custody fees are reduced by balance credits applied during the period. Accordingly, the expense reductions related to custody fee offsets amounted to $305.
Class A shares are assessed up-front sales charges. During the period ended February 29, 2008, JH Funds received net up-front sales charges of $44,481 with regard to sales of Class A shares. Of this amount, $5,334 was retained and used for printing prospectuses, advertising, sales literature and other purposes, $37,570 was paid as sales commissions to unrelated broker-dealers and $1,577 was paid as sales commissions to sales personnel of Signator Investors, Inc. (Signator Investors), a related broker-dealer. The Adviser’s indirect parent, John Hancock Life Insurance Company (JHLICO), is the indirect sole shareholder of Signator Investors.
Class B shares that are redeemed within six years of purchase are subject to a contingent deferred sales charge (CDSC) at declining rates, beginning at 5.00% of the lesser of the current market value at the time of redemption or the original purchase cost of the shares being redeemed. Class C shares that are redeemed within one year of purchase are subject to a CDSC at a rate of 1.00% of the lesser of the current market value at the time of redemption or the original purchase cost of the shares being redeemed. Proceeds from the CDSCs are paid to JH Funds and are used in whole or in part to defray its expenses for providing distribution-related services to the Fund in connection with the sale of Class B and Class C shares. During the period ended February 29, 2008, CDSCs received by JH Funds amounted to $8,895 for Class B shares and $808 for Class C shares.
The Fund has a transfer agent agreement with John Hancock Signature Services, Inc. (Signature Services), an indirect subsidiary
Semiannual Report | High Yield Municipal Bond Fund
27
of JHLICO. For Class A, Class B and Class C shares, the Fund pays a monthly transfer agent fee at an annual rate of 0.01% of each class’s average daily net asset value, plus a fee based on the number of shareholder accounts and reimbursement for certain out-of-pocket expenses, aggregated and allocated to each class on the basis of its relative net asset value. The Fund pays a monthly fee which is based on an annual rate of $16.00 for each Class A shareholder account, $18.50 for each Class B shareholder account and $17.50 for each Class C shareholder account.
In May 2007, the Fund began receiving earnings credits from its transfer agent as a result of uninvested cash balances. These credits are used to reduce a portion of the Fund’s transfer agent fees and out-of-pocket expenses. During the period ended February 29, 2008, the Fund’s transfer agent fees and out-of-pocket expenses were reduced by $676 for transfer agent credits earned.
Class level expenses for the period ended February 29, 2008 were as follows:
| | |
| | Transfer | Distribution and |
| Share class | agent fees | service fees |
|
| Class A | $22,812 | $88,471 |
| Class B | 3,200 | 49,416 |
| Class C | 3,657 | 57,182 |
| Total | $29,669 | $195,069 |
The Fund has an agreement with the Adviser and affiliates to perform necessary tax, accounting, compliance, legal and other administrative services for the Fund. The compensation for the period amounted to $4,923 with an effective rate of 0.01% of the Fund’s average daily net asset value.
Mr. James R. Boyle is Chairman of the Adviser, as well as affiliated Trustee of the Fund, and is compensated by the Adviser and/ or its affiliates. The compensation of unaffiliated Trustees is borne by the Fund. The unaffiliated Trustees may elect to defer, for tax purposes, their receipt of this compensation under the John Hancock Group of Funds Deferred Compensation Plan. The Fund makes investments into other John Hancock funds, as applicable, to cover its liability for the deferred compensation. Investments to cover the Fund’s deferred compensation liability are recorded on the Fund’s books as an other asset. The deferred compensation liability and the related other asset are always equal and are marked to market on a periodic basis to reflect any income earned by the investments, as well as any unrealized gains or losses. The Deferred Compensation Plan investments had no impact on the operations of the Fund.
High Yield Municipal Bond Fund | Semiannual Report
28
Note 4
Fund share transactions
This listing illustrates the number of Fund shares sold, reinvested and repurchased during the year ended August 31, 2007, and the period ended February 29, 2008, along with the corresponding dollar value.
| | | | |
| | | Year ended 8-31-07 | Period ended 2-29-081 |
| | Shares | Amount | Shares | Amount |
| Class A shares | | | | |
|
| Sold | 1,580,206 | $13,718,967 | 896,675 | $7,477,387 |
| Distributions reinvested | 199,960 | 1,732,127 | 105,109 | 870,112 |
| Repurchased | (1,666,172) | (14,391,723) | (872,677) | (7,233,831) |
| Net increase | 113,994 | $1,059,371 | 129,107 | $1,113,668 |
| |
| Class B shares | | | | |
|
| Sold | 124,185 | $1,074,189 | 66,991 | $555,094 |
| Distributions reinvested | 26,263 | 227,789 | 11,362 | 94,143 |
| Repurchased | (732,391) | (6,367,545) | (239,555) | (2,003,003) |
| Net decrease | (581,943) | ($5,065,567) | (161,202) | ($1,353,766) |
| |
| Class C shares | | | | |
|
| Sold | 232,043 | $2,019,466 | 1,001,679 | $8,343,604 |
| Distributions reinvested | 23,094 | 199,968 | 14,874 | 122,925 |
| Repurchased | (195,597) | (1,690,063) | (306,410) | (2,554,169) |
| Net increase | 59,540 | $529,371 | 710,143 | $5,912,360 |
| |
| Net increase (decrease) | (408,409) | ($3,476,825) | 678,048 | $5,672,262 |
|
1Semiannual period from 9-1-07 to 2-29-08. Unaudited.
Note 5
Purchase and sale of securities
Purchases and proceeds from sales or maturities of securities, other than short-term securities and obligations of the U.S. government, during the period ended February 29, 2008, aggregated $27,713,863 and $22,831,229, respectively.
Semiannual Report | High Yield Municipal Bond Fund
29
Board Consideration of and
Continuation of Investment Advisory
Agreement and Subadvisory
Agreement: John Hancock High Yield
Municipal Bond Fund
The Investment Company Act of 1940 (the 1940 Act) requires the Board of Trustees (the Board) of John Hancock Tax-Exempt Series Fund (the Trust), including a majority of the Trustees who have no direct or indirect interest in the investment advisory agreement and are not “interested persons” of the Trust, as defined in the 1940 Act (the Independent Trustees), annually to meet in person to review and consider the continuation of: (i) the investment advisory agreement (the Advisory Agreement) with John Hancock Advisers, LLC (the Adviser) and (ii) the investment subadvisory agreement (the Subadvisory Agreement) with MFC Global Investment Management (U.S.), LLC (the Subadviser) for the John Hancock High Yield Municipal Bond Fund (the Fund). The Advisory Agreement and the Subadvisory Agreement are collectively referred to as the Advisory Agreements.
At meetings held on May 7 and June 4–5, 2007, the Board considered the factors and reached the conclusions described below relating to the selection of the Adviser and Subadviser and the continuation of the Advisory Agreements. During such meetings, the Board’s Contracts/ Operations Committee and the Independent Trustees also met in executive sessions with their independent legal counsel.
In evaluating the Advisory Agreements, the Board, including the Contracts/Operations Committee and the Independent Trustees, reviewed a broad range of information requested for this purpose by the Independent Trustees, including: (i) the investment performance of the Fund relative to a category of relevant funds (the Category) and a peer group of comparable funds (the Peer Group) each selected by Morningstar, Inc. (Morningstar), an independent provider of investment company data, for a range of periods ended December 31, 2006, (ii) advisory and other fees incurred by, and the expense ratios of, the Fund relative to a Category and a Peer Group, (iii) the advisory fees of comparable portfolios of other clients of the Adviser and the Subadviser, (iv) the Adviser’s financial results and condition, including its and certain of its affiliates’ profitability from services performed for the Fund, (v) breakpoints in the Fund’s and the Peer Group’s fees, and information about economies of scale, (vi) the Adviser’s and Subadviser’s record of compliance with applicable laws and regulations, with the Fund’s investment policies and restrictions, and with the applicable Code of Ethics, and the structure and responsibilities of the Adviser’s and Subadviser’s compliance department, (vii) the background and experience of senior management and investment professionals, and (viii) the nature, cost and character of advisory and non-investment management services provided by the Adviser and its affiliates and by the Subadviser.
The Independent Trustees considered the legal advice of independent legal counsel and relied on their own business judgment in determining the factors to be considered in evaluating the materials that were presented to them and the weight to be given to each such factor. The Board’s review and conclusions were based on a comprehensive consideration of all information presented to the Board and not the result of any single controlling factor. They principally considered performance and other information from Morningstar as of December 31, 2006. The Board also considered updated performance information provided to it by the Adviser or Subadviser at the May and June 2007 meetings. Performance and other information may be quite different as of the date of this shareholders report. The key factors considered by the Board and the conclusions reached are described below.
Nature, extent and quality of services
The Board considered the ability of the Adviser and the Subadviser, based on their resources, reputation and other attributes, to attract and retain qualified investment professionals, including research, advisory and supervisory personnel. The Board considered the investment philosophy, research and investment decision-making processes of the Adviser and Subadviser. The Board further considered the culture of compliance, resources dedicated to compliance,
High Yield Municipal Bond Fund | Semiannual Report
30
compliance programs and compliance records of the Adviser and Subadviser. In addition, the Board took into account the administrative and other non-advisory services provided to the Fund by the Adviser and its affiliates.
Based on the above factors, together with those referenced below, the Board concluded that, within the context of its full deliberations, the nature, extent and quality of the investment advisory services provided to the Fund by the Adviser and Subadviser supported renewal of the Advisory Agreements.
Fund performance
The Board considered the performance results for the Fund over various time periods ended December 31, 2006. The Board also considered these results in comparison to the performance of the Category, as well as the Fund’s benchmark index. Morningstar determined the Category and Peer Group for the Fund. The Board reviewed with a representative of Morningstar the methodology used by Morningstar to select the funds in the Category and the Peer Group.
The Board noted that the Fund’s performance during the periods under review was generally competitive with the performance of the Peer Group and Category medians, and its benchmark index, the Lehman Brothers Municipal Bond Index. The Board noted that, for the 10-year period under review, the Fund’s performance was lower than the performance of the Peer Group and Category medians, and its benchmark index. The Board noted that the Fund’s performance during the five-year period under review was lower than the performance of the Category median, but higher than the performance of the Peer Group and benchmark index. The Board also noted that the Fund’s performance during the three-year period was higher than the performance of the Peer Group and Category medians, and the benchmark index. The Board noted that the Fund’s more recent performance for the one-year period ended December 31, 2006 was lower than the Category median but equal to the Peer Group median, and higher than its benchmark index.
Investment advisory fee and subadvisory fee rates and expenses
The Board reviewed and considered the contractual investment advisory fee rate payable by the Fund to the Adviser for investment advisory services (the Advisory Agreement Rate). The Board received and considered information comparing the Advisory Agreement Rate with the advisory fees for the Peer Group. The Board noted that the Advisory Agreement Rate was not appreciably higher than the Peer Group and Category medians.
The Board received and considered expense information regarding the Fund’s various components, including advisory fees, distribution and fees other than advisory and distribution fees, including transfer agent fees, custodian fees and other miscellaneous fees (e.g., fees for accounting and legal services). The Board considered comparisons of these expenses to the Peer Group median. The Board also received and considered expense information regarding the Fund’s total operating expense ratio (Expense Ratio). The Board noted that, unlike the Fund, several funds in the Peer Group employed fee waivers or reimbursements. The Board received and considered information comparing the Expense Ratio of the Fund to that of the Peer Group and Category medians before the application of fee waivers and reimbursements (Gross Expense Ratio) and after the application of such waivers and reimbursement (Net Expense Ratio). The Board noted that the Fund’s Gross and Net Expense Ratios were higher than the Peer Group and Category medians. The Board also noted the differences in the funds included in the Peer Group and Category, including differences in the employment of fee waivers.
The Adviser also discussed the Morningstar data and rankings, and other relevant information, for the Fund. Based on the above-referenced considerations and other factors, the Board concluded that the Fund’s overall performance and expenses supported the re-approval of the Advisory Agreements.
The Board also received information about the investment subadvisory fee rate (the Subadvisory Agreement Rate) payable by the Adviser to the Subadviser for investment subadvisory services. The Board concluded
Semiannual Report | High Yield Municipal Bond Fund
31
that the Subadvisory Agreement Rate was fair and equitable, based on its consideration of the factors described here.
Profitability
The Board received and considered a detailed profitability analysis of the Adviser based on the Advisory Agreements, as well as on other relationships between the Fund and the Adviser and its affiliates, including the Subadviser. The Board also considered a comparison of the Adviser’s profitability to that of other similar investment advisers whose profitability information is publicly available. The Board concluded that, in light of the costs of providing investment management and other services to the Fund, the profits and other ancillary benefits reported by the Adviser were not unreasonable.
Economies of scale
The Board received and considered general information regarding economies of scale with respect to the management of the Fund, including the Fund’s ability to appropriately benefit from economies of scale under the Fund’s fee structure. The Board recognized the inherent limitations of any analysis of economies of scale, stemming largely from the Board’s understanding that most of the Adviser’s costs are not specific to individual Funds, but rather are incurred across a variety of products and services.
To the extent the Board and the Adviser were able to identify actual or potential economies of scale from Fund-specific or allocated expenses, in order to ensure that any such economies continue to be reasonably shared with the Fund as its assets increase, the Adviser and the Board agreed to continue the existing breakpoints to the Advisory Agreement Rate.
Information about services to other clients
The Board also received information about the nature, extent and quality of services and fee rates offered by the Adviser and Subadviser to their other clients, including other registered investment companies, institutional investors and separate accounts. The Board concluded that the Advisory Agreement Rate and the Subadvisory Agreement Rate were not unreasonable, taking into account fee rates offered to others by the Adviser and Subadviser, respectively, after giving effect to differences in services.
Other benefits to the Adviser
The Board received information regarding potential “fall-out” or ancillary benefits received by the Adviser and its affiliates as a result of the Adviser’s relationship with the Fund. Such benefits could include, among others, benefits directly attributable to the relationship of the Adviser with the Fund and benefits potentially derived from an increase in the business of the Adviser as a result of its relationship with the Fund (such as the ability to market to shareholders other financial products offered by the Adviser and its affiliates).
The Board also considered the effectiveness of the Adviser’s, Subadviser’s and Fund’s policies and procedures for complying with the requirements of the federal securities laws, including those relating to best execution of portfolio transactions and brokerage allocation.
Other factors and broader review
As discussed above, the Board reviewed detailed materials received from the Adviser and Subadviser as part of the annual re-approval process. The Board also regularly reviews and assesses the quality of the services that the Fund receives throughout the year. In this regard, the Board reviews reports of the Adviser at least quarterly, which include, among other things, a detailed portfolio review, detailed fund performance reports and compliance reports. In addition, the Board meets with portfolio managers and senior investment officers at various times throughout the year.
After considering the above-described factors and based on its deliberations and its evaluation of the information described above, the Board concluded that approval of the continuation of the Advisory Agreements for the Fund was in the best interest of the Fund and its shareholders. Accordingly, the Board unanimously approved the continuation of the Advisory Agreements.
High Yield Municipal Bond Fund | Semiannual Report
32
For more information
The Fund’s proxy voting policies, procedures and records are available without charge, upon request:
| | |
| By phone | On the Fund’s Web site | On the SEC’s Web site |
| 1-800-225-5291 | www. jhfunds.com/proxy | www. sec. gov |
|
|
| Trustees | Charles A. Rizzo | Custodian |
| James F. Carlin, Chairman | Chief Financial Officer | The Bank of New York |
| James R. Boyle† | | One Wall Street |
| William H. Cunningham | Gordon M. Shone | New York, NY 10286 |
| Charles L. Ladner* | Treasurer | |
| Dr. John A. Moore* | | Transfer agent |
| Patti McGill Peterson* | John G. Vrysen | John Hancock Signature |
| Steven R. Pruchansky | Chief Operating Officer | Services, Inc. |
| *Members of the Audit Committee | | P. O. Box 9510 |
| †Non-Independent Trustee | Investment adviser | Portsmouth, NH 03802-9510 |
| John Hancock Advisers, LLC | |
| Officers | 601 Congress Street | Legal counsel |
| Keith F. Hartstein | Boston, MA 02210-2805 | Kirkpatrick & Lockhart |
| President and | | Preston Gates Ellis LLP |
| Chief Executive Officer | Subadviser | One Lincoln Street |
| MFC Global Investment | Boston, MA 02111-2950 |
| Thomas M. Kinzler | Management (U. S. ), LLC | |
| Secretary and Chief Legal Officer | 101 Huntington Avenue | |
| | Boston, MA 02199 | |
| Francis V. Knox, Jr. | | |
| Chief Compliance Officer | Principal distributor | |
| John Hancock Funds, LLC | |
| 601 Congress Street | |
| | Boston, MA 02210-2805 | |
| | | |
| | |
| How to contact us | |
|
| |
| Internet | www. jhfunds.com | |
|
| |
| Mail | Regular mail: | Express mail: |
| | John Hancock Signature | John Hancock Signature |
| | Services, Inc. | Services, Inc. |
| | P. O. Box 9510 | Mutual Fund Image Operations |
| | Portsmouth, NH 03802-9510 | 164 Corporate Drive |
| | | Portsmouth, NH 03801 |
|
| |
| Phone | Customer service representatives | 1-800-225-5291 |
| | EASI-Line | 1-800-338-8080 |
| | TDD line | 1-800-554-6713 |
|
A listing of month-end portfolio holdings is available on our Web site, www.jhfunds.com. A more detailed portfolio holdings summary is available on a quarterly basis 60 days after the fiscal quarter on our Web site or upon request by calling 1-800-225-5291, or on the SEC’s Web site, www.sec.gov.
Semiannual Repo rt | High Yield Municipal Bond Fund
33

1-800-225-5291
1-800-554-6713 TDD
1-800-338-8080 EASI-Line
www. jhfunds.com
Now available: electronic delivery
www. jhfunds.com/edelivery
| | |
| This report is for the information of the shareholders of John Hancock High Yield Municipal Bond Fund. | 590SA | 2/08 |
| It is not authorized for distribution to prospective investors unless preceded or accompanied by a prospectus. | | 4/08 |
| | |
ITEM 2. CODE OF ETHICS.
As of the end of the period, February 29, 2008, the registrant has adopted a code of ethics, as defined in Item 2 of Form N-CSR, that applies to its Chief Executive Officer, Chief Financial Officer and Treasurer (respectively, the principal executive officer, the principal financial officer and the principal accounting officer, the “Senior Financial Officers”). A copy of the code of ethics is filed as an exhibit to this Form N-CSR.
ITEM 3. AUDIT COMMITTEE FINANCIAL EXPERT.
Not applicable at this time.
ITEM 4. PRINCIPAL ACCOUNTANT FEES AND SERVICES.
Not applicable at this time.
ITEM 5. AUDIT COMMITTEE OF LISTED REGISTRANTS.
Not applicable at this time.
ITEM 6. SCHEDULE OF INVESTMENTS.
Not applicable.
ITEM 7. DISCLOSURE OF PROXY VOTING POLICIES AND PROCEDURES FOR CLOSED-END MANAGEMENT INVESTMENT COMPANIES.
Not applicable.
ITEM 8. PORTFOLIO MANAGERS OF CLOSED-END MANAGEMENT INVESTMENT COMPANIES.
Not applicable.
ITEM 9. PURCHASES OF EQUITY SECURITIES BY CLOSED-END MANAGEMENT INVESTMENT COMPANY AND AFFILIATED PURCHASERS.
Not applicable.
ITEM 10. SUBMISSION OF MATTERS TO A VOTE OF SECURITY HOLDERS.
There were no material changes to previously disclosed John Hancock Funds – Governance Committee Charter.
ITEM 11. CONTROLS AND PROCEDURES.
(a) Based upon their evaluation of the registrant's disclosure controls and procedures as conducted within 90 days of the filing date of this Form N-CSR, the registrant's principal executive officer and principal financial officer have concluded that those disclosure controls and procedures provide reasonable assurance that the material information required to be disclosed by the registrant on this report is recorded, processed, summarized and reported within the time periods specified in the Securities and Exchange Commission's rules and forms.
(b) There were no changes in the registrant's internal control over financial reporting that occurred during the registrant's most recent fiscal half-year (the registrant's second fiscal half-
year in the case of an annual report) that have materially affected, or are reasonably likely to materially affect, the registrant's internal control over financial reporting.
ITEM 12. EXHIBITS.
(a) Separate certifications for the registrant's principal executive officer and principal financial officer, as required by Section 302 of the Sarbanes-Oxley Act of 2002 and Rule 30a-2(a) under the Investment Company Act of 1940, are attached.
(b) Separate certifications for the registrant's principal executive officer and principal financial officer, as required by 18 U.S.C. Section 1350, as adopted pursuant to Section 906 of the Sarbanes-Oxley Act of 2002, and Rule 30a-2(b) under the Investment Company Act of 1940, are attached. The certifications furnished pursuant to this paragraph are not deemed to be "filed" for purposes of Section 18 of the Securities Exchange Act of 1934, or otherwise subject to the liability of that section. Such certifications are not deemed to be incorporated by reference into any filing under the Securities Act of 1933 or the Securities Exchange Act of 1934, except to the extent that the Registrant specifically incorporates them by reference.
(c)(1) Submission of Matters to a Vote of Security Holders is attached. See attached "John Hancock Funds - Governance Committee Charter".
(c)(2) Contact person at the registrant.
SIGNATURES
Pursuant to the requirements of the Securities Exchange Act of 1934 and the Investment Company Act of 1940, the registrant has duly caused this report to be signed on its behalf by the undersigned, thereunto duly authorized.
John Hancock Municipal Series Trust
By: /s/ Keith F. Hartstein
-------------------------------------
Keith F. Hartstein
President and Chief Executive Officer
Date: April 23, 2008
Pursuant to the requirements of the Securities Exchange Act of 1934 and the Investment Company Act of 1940, this report has been signed below by the following persons on behalf of the registrant and in the capacities and on the dates indicated.
By: /s/ Keith F. Hartstein
-------------------------------------
Keith F. Hartstein
President and Chief Executive Officer
Date: April 23, 2008
By: /s/ Charles A. Rizzo
-------------------------------------
Charles A. Rizzo
Chief Financial Officer
Date: April 23, 2008