| |
| UNITED STATES |
| SECURITIES AND EXCHANGE COMMISSION |
| Washington, D.C. 20549 |
| |
| FORM N-CSR |
| |
| CERTIFIED SHAREHOLDER REPORT OF REGISTERED |
| MANAGEMENT INVESTMENT COMPANIES |
| |
| Investment Company Act file number 811- 5968 |
| |
| John Hancock Municipal Securities Trust |
| (Exact name of registrant as specified in charter) |
| |
| 601 Congress Street, Boston, Massachusetts 02210 |
| (Address of principal executive offices) (Zip code) |
| |
| Gordon M. Shone |
| Treasurer |
| |
| 601 Congress Street |
| |
| Boston, Massachusetts 02210 |
| |
| (Name and address of agent for service) |
| |
| Registrant's telephone number, including area code: 617-663-2168 |
| |
| Date of fiscal year end: | August 31 |
| |
| |
| Date of reporting period: | February 28, 2009 |
ITEM 1. REPORT TO SHAREHOLDERS.

A look at performance
For the period ended February 28, 2009
| | | | | | | | | | | |
| | | Average annual returns (%) | Cumulative total returns (%) | | SEC 30-
day yield
(%) as of
2-28-09 |
| | | with maximum sales charge (POP) | with maximum sales charge (POP) | |
| |
|
|
| | Inception | | | | Since | Six | | | | Since |
| Class | date | 1-year | 5-year | 10-year | inception | months | 1-year | 5-year | 10-year | inception |
|
| A | 1-5-90 | –2.87 | 1.37 | 2.94 | — | –7.10 | –2.87 | 7.06 | 33.61 | — | 4.33 |
|
| B | 12-31-91 | –3.94 | 1.21 | 2.79 | — | –7.86 | –3.94 | 6.17 | 31.73 | — | 3.77 |
|
| C | 4-1-99 | –0.06 | 1.54 | — | 2.64 | –4.06 | –0.06 | 7.95 | — | 29.48 | 3.76 |
|
Performance figures assume all distributions are reinvested. Public offering price (POP) figures reflect maximum sales charges on Class A shares of 4.5% and the applicable contingent deferred sales charge (CDSC) on Class B and Class C shares. The returns for Class C shares have been adjusted to reflect the elimination of the front-end sales charge effective July 15, 2004. The Class B shares’ CDSC declines annually between years 1 to 6 according to the following schedule: 5, 4, 3, 3, 2, 1%. No sales charge will be assessed after the sixth year. Class C shares held for less than one year are subject to a 1% CDSC.
The expense ratios of the Fund, both net (including any fee waivers or expense limitations) and gross (excluding any fee waivers or expense limitations), are set forth according to the most recent publicly available prospectus for the Fund and may differ from the expense ratios disclosed in the Financial Highlights tables in this report. The net expenses equal the gross expenses and are as follows: Class A — 1.02%, Class B — 1.77% and Class C — 1.77%. The Fund’s expenses for the current fiscal year may be higher than the expenses listed above, for some of the following reasons: i) a significant decrease in average net assets may result in a higher advisory fee rate; ii) a significant decrease in average net assets may result in an increase in the expense ratio; and iii) the termination or expiration of expense cap reimbursements.
The returns reflect past results and should not be considered indicative of future performance. The return and principal value of an investment will fluctuate so that shares, when redeemed, may be worth more or less than their original cost. Due to market volatility, the Fund’s current performance may be higher or lower than the performance shown. For current to the most recent month end performance data, please call 1–800–225–5291 or visit the Fund’s Web site at www.jhfunds.com.
The performance table above and the chart on the next page do not reflect the deduction of taxes that a shareholder would pay on fund distributions or the redemption of fund shares. Please note that a portion of the Fund’s income may be subject to taxes, and some investors may be subject to the Alternative Minimum Tax (AMT). Also note that capital gains are taxable.
The Fund’s performance results reflect any applicable expense reductions, without which the expenses would increase and results would have been less favorable.
| |
| 6 | Tax-Free Bond Fund | Semiannual report |
Growth of $10,000
This chart shows what happened to a hypothetical $10,000 investment in Tax-Free Bond Fund Class A shares for the period indicated. For comparison, we’ve shown the same investment in the Barclays Capital Municipal Bond Index.

| | | | |
| | | | With maximum | |
| Class | Period beginning | Without sales charge | sales charge | Index |
|
| B2 | 2-28-99 | $13,173 | $13,173 | $15,692 |
|
| C2 | 4-1-99 | 12,948 | 12,948 | 15,671 |
|
Assuming all distributions were reinvested for the period indicated, the table above shows the value of a $10,000 investment in the Fund’s Class B and Class C shares, respectively, as of February 28, 2009. The Class C shares investment with maximum sales charge has been adjusted to reflect the elimination of the front-end sales charge effective July 15, 2004. Performance of the classes will vary based on the difference in sales charges paid by shareholders investing in the different classes and the fee structure of those classes.
Barclays Capital Municipal Bond Index is an unmanaged index that includes municipal bonds and is commonly used as a measure of bond performance.
It is not possible to invest directly in an index. Index figures do not reflect sales charges, which would have resulted in lower values if they did.
1 NAV represents net asset value and POP represents public offering price.
2 No contingent deferred sales charge applicable.
3 Formerly named Lehman Brothers Municipal Bond Index.
| |
| Semiannual report | Tax-Free Bond Fund | 7 |
Your expenses
These examples are intended to help you understand your ongoing operating expenses.
Understanding fund expenses
As a shareholder of the Fund, you incur two types of costs:
▪ Transaction costs which include sales charges (loads) on purchases or redemptions (varies by share class), minimum account fee charge, etc.
▪ Ongoing operating expenses including management fees, distribution and service fees (if applicable), and other fund expenses.
We are going to present only your ongoing operating expenses here.
Actual expenses/actual returns
This example is intended to provide information about your fund’s actual ongoing operating expenses, and is based on your fund’s actual return. It assumes an account value of $1,000.00 on September 1, 2008 with the same investment held until February 28, 2009.
| | | |
| | Account value | Ending value | Expenses paid during |
| | on 9-1-08 | on 2-28-09 | period ended 2-28-091 |
|
| Class A | $1,000.00 | $972.50 | $4.84 |
|
| Class B | 1,000.00 | 968.90 | 8.49 |
|
| Class C | 1,000.00 | 968.90 | 8.49 |
|
Together with the value of your account, you may use this information to estimate the operating expenses that you paid over the period. Simply divide your account value at February 28, 2009, by $1,000.00, then multiply it by the “expenses paid” for your share class from the table above. For example, for an account value of $8,600.00, the operating expenses should be calculated as follows:

| |
| 8 | Tax-Free Bond Fund | Semiannual report |
Hypothetical example for comparison purposes
This table allows you to compare your fund’s ongoing operating expenses with those of any other fund. It provides an example of the Fund’s hypothetical account values and hypothetical expenses based on each class’s actual expense ratio and an assumed 5% annualized return before expenses (which is not your fund’s actual return). It assumes an account value of $1,000.00 on September 1, 2008, with the same investment held until February 28, 2009. Look in any other fund shareholder report to find its hypothetical example and you will be able to compare these expenses.
| | | |
| | Account value | Ending value | Expenses paid during |
| | on 9-1-08 | on 2-28-09 | period ended 2-28-091 |
|
| Class A | $1,000.00 | $1,019.90 | $4.96 |
|
| Class B | 1,000.00 | 1,016.20 | 8.70 |
|
| Class C | 1,000.00 | 1,016.20 | 8.70 |
|
Remember, these examples do not include any transaction costs, such as sales charges; therefore, these examples will not help you to determine the relative total costs of owning different funds. If transaction costs were included, your expenses would have been higher. See the prospectus for details regarding transaction costs.
1 Expenses are equal to the Fund’s annualized expense ratio of 0.99%, 1.74% and 1.74% for Class A, Class B and Class C, respectively, multiplied by the average account value over the period, multiplied by 181/365 (to reflect the one-half year period).
| |
| Semiannual report | Tax-Free Bond Fund | 9 |
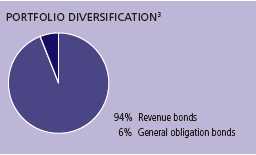
Portfolio summary
| | | | |
| Top 10 holdings1 | | | | |
|
| Foothill/Eastern Transportation Corridor Agency, 1-1-19, Zero | 4.8% |
|
| Foothill/Eastern Transportation Corridor Agency, 1-1-16, 6.000% | 4.2% |
|
| Puerto Rico, Commonwealth of, 7-1-11, 7.72% | | | 3.4% |
|
| Madera, County of, 3-15-15, 6.500% | | | | 3.4% |
|
| Alabama Pub. Sch. & College Auth., 12-1-15, 9.369% | 2.5% |
|
| San Bernardino, County of, 8-1-17, 5.500% | | | 2.2% |
|
| Massachusetts, Commonwealth of, 12-1-24, 5.500% | 2.1% |
|
| Triborough Bridge & Tunnel Auth., 11-15-33, 5.000% | 2.0% |
|
| San Joaquin Hills Transportation Corridor Agency, 1-15-17, 5.650% | 1.9% |
|
| Puerto Rico Aqueduct & Sewer Auth., 7-1-11, 7.470% | 1.8% |
|
| |
| Sector distribution2,3 | | | | |
|
| General obligation bonds | 6% | | Tobacco | 5% |
| |
|
| Revenue bonds | | | Industrial development | 3% |
| |
|
| Other revenue | 28% | | Water and sewer | 3% |
| |
|
| Transportation | 18% | | Economic development | 2% |
| |
|
| Health | 10% | | Special tax | 2% |
| |
|
| Electric | 9% | | Other | 6% |
| |
|
| Education | 8% | | | |
| | | |
| | |
| Quality distribution3 | | |
| |
| AAA | 27% | |
| |
| AA | 42% | |
| |
| A | 9% | |
| |
| BBB | 13% | |
| |
| BB | 5% | |
| |
| B | 1% | |
| |
| Other | 3% | |
| |
1 As a percentage of net assets on February 28, 2009, excluding cash and cash equivalents.
2 Sector investing is subject to greater risks than the market as a whole. Because the Fund may focus on particular sectors of the economy, its performance may depend on the performance of those sectors.
3 As a percentage of net assets on February 28, 2009.
| |
| 10 | Tax-Free Bond Fund | Semiannual report |
FINANCIAL STATEMENTS
Fund’s investments
Securities owned by the Fund on 2-28-09 (unaudited)
| | | | | | |
| | Interest | | Maturity | Credit | Par value | |
| State, issuer, description | rate | | date | rating (A) | (000) | Value |
|
| Tax-exempt long-term bonds 98.66% | | | | | $427,738,171 |
| (Cost $417,797,829) | | | | | | |
| | | | | | | |
| Alabama 2.49% | | | | | | 10,777,800 |
|
| Alabama Pub. Sch. & College Auth. Rev, | | | | | | |
| Drivers Ser. 2403 (P) | 9.369% | | 12-01-15 | AA | $10,000 | 10,777,800 |
| | | | | | | |
| Arizona 2.94% | | | | | | 12,729,880 |
|
| Arizona Health Facilities Auth, | | | | | | |
| Rev Ref Phoenix Memorial Hosp (G)(H) | 8.200 | | 06-01-21 | D | 2,150 | 2,150 |
|
| Phoenix Civic Improvement Corp District, | | | | | | |
| Rev Conv Cap Apprec Civic Plaza | | | | | | |
| Ser 2005B (Zero to 07-01-13 then | | | | | | |
| 5.50%) (D) | Zero | | 07-01-28 | AA | 1,000 | 801,440 |
|
| Salt River Project, | | | | | | |
| Agriculture Impt & Pwr Dist Elec Sys | | | | | | |
| Rev, Ser A | 5.000 | | 01-01-33 | AA | 7,000 | 6,980,190 |
| Agriculture Impt & Pwr Dist Elec Sys | | | | | | |
| Rev, Ser A | 5.000 | | 01-01-39 | AA | 5,000 | 4,946,100 |
| | | | | | | |
| California 23.32% | | | | | | 101,100,567 |
|
| Foothill Eastern Transportation | | | | | | |
| Corridor Agency, | | | | | | |
| Rev Ref Toll Rd Cap Apprec | Zero | | 01-15-25 | BBB– | 5,000 | 1,292,800 |
| Rev Toll Rd Cap Apprec Sr Lien | | | | | | |
| Ser 1995A | Zero | | 01-01-19 | AAA | 30,000 | 20,951,700 |
| Rev Toll Rd Sr Lien Ser 1995A | 6.000 | | 01-01-16 | AAA | 17,500 | 18,286,975 |
|
| Madera, County of, | | | | | | |
| Rev Cert of Part Valley Children’s | | | | | | |
| Hosp (D) | 6.500 | | 03-15-15 | AA– | 13,185 | 14,674,114 |
|
| Millbrae, City of, | | | | | | |
| Rev Magnolia of Millbrae Proj Ser | | | | | | |
| 1997A (G) | 7.375 | | 09-01-27 | BB | 1,750 | 1,431,343 |
|
| Sacramento City Financing Auth, | | | | | | |
| Rev Convention Ctr Hotel Sr Ser | | | | | | |
| 1999A (G) | 6.250 | | 01-01-30 | AA | 4,000 | 4,153,400 |
|
| San Bernardino, County of, | | | | | | |
| Rev Ref Cert of Part Med Ctr Fin | | | | | | |
| Proj (D) | 5.500 | | 08-01-17 | AA | 9,130 | 9,561,940 |
| Rev Ref Cert of Part Med Ctr Fin Proj | 5.500 | | 08-01-22 | A+ | 2,500 | 2,370,275 |
|
| San Diego Redevelopment Agency, | | | | | | |
| Rev Tax Alloc City Heights Proj Ser | | | | | | |
| 1999A (G) | 5.750 | | 09-01-23 | BB | 25 | 20,203 |
See notes to financial statements
| |
| Semiannual report | Tax-Free Bond Fund | 11 |
FINANCIAL STATEMENTS
| | | | | | |
| | Interest | | Maturity | Credit | Par value | |
| State, issuer, description | rate | | date | rating (A) | (000) | Value |
| | | | | | |
| California (continued) | | | | | | |
|
| San Joaquin Hills Transportation | | | | | | |
| Corridor Agency, | | | | | | |
| Rev Toll Rd Conv Cap Apprec | | | | | | |
| Ser 1997A | 5.650% | | 01-15-17 | BB– | $10,000 | $8,368,300 |
| Rev Toll Rd Jr Lien | Zero | | 01-01-10 | AAA | 6,250 | 6,191,312 |
| Rev Toll Rd Sr Lien | Zero | | 01-01-14 | AAA | 5,000 | 4,411,850 |
| Rev Toll Rd Sr Lien | Zero | | 01-01-17 | AAA | 4,900 | 3,808,035 |
| Rev Toll Rd Sr Lien | Zero | | 01-01-20 | AAA | 2,000 | 1,314,200 |
|
| Santa Ana Financing Auth., | | | | | | |
| Rev Lease Police Admin & Hldg Facil Ser | | | | | | |
| 1994A (D) | 6.250 | | 07-01-19 | AA– | 2,000 | 2,273,480 |
|
| Southern California Metropolitan | | | | | | |
| Wtr Dist, | | | | | | |
| Rev Wtrwks Auth Ser A | 5.000 | | 01-01-39 | AAA | 2,000 | 1,990,640 |
| Colorado 2.65% | | | | | | 11,490,050 |
|
| Colorado Springs, City of, | | | | | | |
| Rev Util Sys Imp Ser C | 5.250 | | 11-15-42 | AA | 2,825 | 2,729,543 |
|
| E-470 Public Highway Auth, | | | | | | |
| Rev Cap Apprec Sr Ser 2000B | Zero | | 09-01-34 | BBB– | 7,000 | 1,122,380 |
| Rev Cap Apprec Ser B1 (D) | 5.500 | | 09-01-24 | AA | 2,000 | 1,672,260 |
|
| Northwest Parkway Public Highway Auth, | | | | | | |
| Rev 1st Tier Sub Ser 2001D (G) | 7.125 | | 06-15-41 | AA | 2,900 | 3,098,737 |
|
| Public Auth for Colorado Energy | | | | | | |
| Gas, Rev | 6.250 | | 11-15-28 | A+ | 3,500 | 2,867,130 |
| | | | | | | |
| Connecticut 0.70% | | | | | | 3,042,630 |
|
| Connecticut State Health & Educational | | | | | | |
| Facility Authority Rev, | | | | | | |
| Yale University | 5.050 | | 07-01-42 | AAA | 3,000 | 3,042,630 |
| | | | | | | |
| Delaware 0.70% | | | | | | 3,042,450 |
|
| Charter MAC Equity Issuer Trust, | | | | | | |
| Preferred Tax Exempt Shares Ser | | | | | | |
| A–4-1 (S) | 5.750 | | 04-30-15 | Aaa | 3,000 | 3,042,450 |
| | | | | | | |
| District Of Columbia 0.69% | | | | | | 2,970,630 |
|
| District of Columbia University Rev, | | | | | | |
| Georgetown University | 5.500 | | 04-01-36 | A– | 3,000 | 2,970,630 |
| | | | | | | |
| Florida 6.12% | | | | | | 26,520,043 |
|
| Bonnet Creek Resort Community | | | | | | |
| Development District, | | | | | | |
| Rev Spec Assessment (G) | 7.375 | | 05-01-34 | BB+ | 1,500 | 1,133,160 |
| Rev Spec Assessment (G) | 7.250 | | 05-01-18 | BB+ | 1,000 | 847,200 |
|
| Capital Projects Finance Auth, | | | | | | |
| Rev Student Hsg Cap Projs Ln Prog Ser | | | | | | |
| 2000A (G) | 7.850 | | 08-15-31 | AA | 3,500 | 3,929,940 |
| Rev Student Hsg Cap Projs Ln Prog Ser | | | | | | |
| 2001G (G) | 9.125 | | 10-01-11 | BBB | 900 | 912,096 |
|
| Capital Trust Agency, | | | | | | |
| Rev Seminole Tribe Convention Ser | | | | | | |
| 2003A (S) | 8.950 | | 10-01-33 | AAA | 3,000 | 3,777,960 |
|
| Crossings at Fleming Island Community | | | | | | |
| Development District, | | | | | | |
| Rev Ref Spec Assessment Ser | | | | | | |
| 2000C (G) | 7.100 | | 05-01-30 | BBB– | 1,000 | 791,630 |
See notes to financial statements
| |
| 12 | Tax-Free Bond Fund | Semiannual report |
FINANCIAL STATEMENTS
| | | | | | |
| | Interest | | Maturity | Credit | Par value | |
| State, issuer, description | rate | | date | rating (A) | (000) | Value |
| | | | | | | |
| Florida (continued) | | | | | | |
|
| Florida Municipal Power Agency Rev, | | | | | | |
| All Requirements Pwr Ser A | 5.000% | | 10-01-28 | A1 | $2,500 | $2,472,175 |
| All Requirements Pwr Ser A | 5.000 | | 10-01-31 | A1 | 2,000 | 1,921,420 |
|
| Henando, County of, | | | | | | |
| Rev Criminal Justice Complex (D)(G) | 7.650 | | 07-01-16 | A | 500 | 615,295 |
|
| Orange County School Board, | | | | | | |
| Rev Ref Cert of Part Ser 1997A (D) | Zero | | 08-01-13 | A1 | 5,000 | 4,361,400 |
|
| Orlando Urban Community | | | | | | |
| Development District, | | | | | | |
| Rev Spec Assessment Cap Imp Ser | | | | | | |
| 2001A (G) | 6.950 | | 05-01-33 | AA | 2,500 | 2,774,025 |
|
| Orlando Utilities Commission, | | | | | | |
| Rev Ref Wtr & Elec Sys Sub Ser 1989D | 6.750 | | 10-01-17 | AA | 2,200 | 2,651,704 |
|
| Stoneybrook West Community | | | | | | |
| Development Dist, | | | | | | |
| Rev Spec Assessment Ser 2000A (G) | 7.000 | | 05-01-32 | BBB | 310 | 332,038 |
| | | | | | | |
| Georgia 5.27% | | | | | | 22,856,058 |
|
| Atlanta, City of, | | | | | | |
| Rev Tax Alloc Eastside Proj Ser | | | | | | |
| 2005B (G) | 5.600 | | 01-01-30 | BB+ | 1,000 | 671,990 |
|
| Georgia Municipal Electric Authority, | | | | | | |
| Refunded Ser Y MBIA IBC BNY (D) | 6.500 | | 01-01-17 | AA | 145 | 172,325 |
| Rev Preref Ser 1993Z (D) | 5.500 | | 01-01-20 | A+ | 150 | 170,058 |
| Rev Preref Ser 1998Y (D) | 6.500 | | 01-01-17 | AA | 60 | 72,221 |
| Rev Ref Pwr Ser 1993BB | 5.700 | | 01-01-19 | A+ | 1,000 | 1,112,190 |
| Rev Ref Pwr Ser 1993C (D) | 5.700 | | 01-01-19 | A+ | 5,000 | 5,560,950 |
| Rev Ref Pwr Ser 1994EE (D) | 7.250 | | 01-01-24 | A | 2,000 | 2,446,060 |
| Rev Ref Pwr Ser 1998Y (D) | 6.500 | | 01-01-17 | AA | 4,635 | 5,362,278 |
| Rev Unref Bal Ser 1993Z (D) | 5.500 | | 01-01-20 | A+ | 5,690 | 6,188,956 |
|
| Monroe County Development Auth, | | | | | | |
| Rev Ref Poll Control Oglethorpe Pwr | | | | | | |
| Corp Scherer Ser 1992A | 6.800 | | 01-01-12 | A | 1,000 | 1,099,030 |
| | | | | | | |
| Illinois 6.68% | | | | | | 28,948,294 |
|
| Chicago Board of Education, | | | | | | |
| GO Unltd Cap App City Colleges (D) | Zero | | 01-01-16 | AA | 2,850 | 2,252,070 |
| GO Unltd Cap App School Reform Ser | | | | | | |
| 1999A (D) | Zero | | 12-01-18 | AA | 5,440 | 3,512,880 |
| GO Unltd Ref Ser A (D) | 5.500 | | 12-01-30 | AA– | 3,650 | 3,915,318 |
|
| Chicago, City of, | | | | | | |
| GO Tax Alloc Jr Pilsen Redev Ser | | | | | | |
| 2004B (G) | 6.750 | | 06-01-22 | BBB+ | 3,000 | 2,684,010 |
|
| Illinois Finance Auth, | | | | | | |
| Rev Ref Commonwealth Edison Co Proj | | | | | | |
| (D) | 5.850 | | 01-15-14 | AA– | 3,000 | 3,191,550 |
| Rev Rush Univ Med Ctr Oblig Grp-A | 7.250 | | 11-01-38 | A– | 1,500 | 1,514,295 |
|
| Kane County Community Unit School | | | | | | |
| District No 304, | | | | | | |
| GO Unltd Cap Apprec Ser A (D) | Zero | | 01-01-17 | AA | 4,705 | 3,388,071 |
|
| Lake County Community Unit School | | | | | | |
| District No 24, | | | | | | |
| GO Unltd Cap Apprec Millburn (D) | Zero | | 01-01-22 | AA | 2,440 | 1,224,587 |
See notes to financial statements
| |
| Semiannual report | Tax-Free Bond Fund | 13 |
FINANCIAL STATEMENTS
| | | | | | |
| | Interest | | Maturity | Credit | Par value | |
| State, issuer, description | rate | | date | rating (A) | (000) | Value |
| | | | | | | |
| Illinois (continued) | | | | | | |
|
| Round Lake Beach, Village of, | | | | | | |
| Rev Spec Tax Lakewood Grove Spec | | | | | | |
| Serv Area No 1 | 6.700% | | 03-01-33 | AA | $1,000 | $1,170,170 |
|
| Will County Community Unit School | | | | | | |
| District No 365, | | | | | | |
| GO Cap Apprec Ser 1997B (D) | Zero | | 11-01-14 | AAA | 3,510 | 2,903,858 |
| GO Unltd Ref (D) | Zero | | 11-01-21 | AAA | 5,780 | 3,191,485 |
| | | | | | | |
| Kansas 0.23% | | | | | | 1,016,640 |
|
| Burlington Environmental Auth, | | | | | | |
| Rev Ref Kansas City Power & Light (D) | 5.375 | | 09-01-35 | A | 1,000 | 1,016,640 |
| | | | | | | |
| Kentucky 2.19% | | | | | | 9,516,504 |
|
| Kentucky Economic Development | | | | | | |
| Finance Auth, | | | | | | |
| Arena Rev Louisville Arena (D) | 6.000 | | 12-01-33 | AAA | 1,000 | 1,021,250 |
| Rev Prefer Norton Health Care Ser | | | | | | |
| 2000C (D) | 6.100 | | 10-01-21 | AA | 1,770 | 2,083,502 |
| Rev Unref Bond Balance Norton Ser | | | | | | |
| 2000C (D) | 6.100 | | 10-01-21 | AA– | 3,230 | 3,109,069 |
|
| Kentucky State Property & | | | | | | |
| Buildings Commission, | | | | | | |
| Rev Ref Proj No 93 (D) | 5.250 | | 02-01-29 | AAA | 3,250 | 3,302,683 |
| | | | | | | |
| Louisiana 0.49% | | | | | | 2,141,664 |
|
| Jefferson Parish Home Mortgage Auth, | | | | | | |
| Rev Ref Single Family Mtg Ser 1999B | 6.750 | | 06-01-30 | Aaa | 490 | 494,439 |
|
| Louisiana Local | | | | | | |
| Government Environmental, | | | | | | |
| Rev Westlake Chemical Corp | 6.750 | | 11-01-32 | BB+ | 2,500 | 1,647,225 |
| | | | | | | |
| Maryland 0.65% | | | | | | 2,799,920 |
|
| Municipal Mortgage & Equity, LLC, | | | | | | |
| Bond (S) | 6.875 | | 06-30-49 | A3 | 4,000 | 2,799,920 |
| | | | | | | |
| Massachusetts 4.37% | | | | | | 18,957,581 |
|
| Massachusetts Bay | | | | | | |
| Transportation Authority, | | | | | | |
| Rev Ref Cap Appr Ser 2007A–2 | Zero | | 07-01-26 | AAA | 13,595 | 5,251,477 |
|
| Massachusetts Health & Educational | | | | | | |
| Facilities Auth, | | | | | | |
| Rev Civic Investments, Inc. | | | | | | |
| Ser 2002B (G) | 9.200 | | 12-15-31 | AA | 3,500 | 4,454,590 |
| Rev Ref Partners Health Care | | | | | | |
| Ser 2001C | 5.750 | | 07-01-32 | AA | 85 | 84,992 |
|
| Massachusetts Wtr Pollution | | | | | | |
| Abatement Trust, | | | | | | |
| Rev Unref Bal Ser 1994A | 6.375 | | 02-01-15 | AAA | 75 | 75,322 |
|
| Massachusetts, Commonwealth of, | | | | | | |
| GO Unltd Ref Ser 2004C (D) | 5.500 | | 12-01-24 | AA | 8,000 | 9,091,200 |
| | | | | | | |
| Missouri 0.25% | | | | | | 1,089,426 |
|
| Fenton, City of, | | | | | | |
| Rev Ref Tax Increment Imp Gravois | | | | | | |
| Bluffs (F) | 7.000 | | 10-01-21 | AAA | 955 | 1,089,426 |
| | | | | | | |
| Nebraska 0.33% | | | | | | 1,434,024 |
|
| Omaha Public Power District, | | | | | | |
| Rev Ref Elec Imp Ser 1992B (G) | 6.200 | | 02-01-17 | AA | 1,200 | 1,434,024 |
See notes to financial statements
| |
| 14 | Tax-Free Bond Fund | Semiannual report |
FINANCIAL STATEMENTS
| | | | | | |
| | Interest | | Maturity | Credit | Par value | |
| State, issuer, description | rate | | date | rating (A) | (000) | Value |
| | | | | | | |
| Nevada 0.01% | | | | | | $25,122 |
|
| Nevada, State of, | | | | | | |
| GO Ltd Unref Bal Ser 1992A | 6.750% | | 07-01-09 | AA+ | $25 | 25,122 |
| | | | | | | |
| New Hampshire 0.70% | | | | | | 3,035,075 |
|
| New Hampshire Business Pollution | | | | | | |
| Control Auth, | | | | | | |
| Rev Ref Poll Control Pub Svc Co Prg Ser | | | | | | |
| C (D) | 5.450 | | 05-01-21 | AA– | 2,000 | 1,837,600 |
|
| New Hampshire Health & Education | | | | | | |
| Facilities Auth, | | | | | | |
| Rev Exeter Proj | 6.000 | | 10-01-24 | A+ | 1,250 | 1,197,475 |
| | | | | | | |
| New Jersey 3.55% | | | | | | 15,410,618 |
|
| New Jersey Economic | | | | | | |
| Development Auth, | | | | | | |
| Rev Ref Newark Airport Marriott Hotel | 7.000 | | 10-01-14 | Ba1 | 1,000 | 896,080 |
|
| New Jersey Health Care Facilities | | | | | | |
| Financing Auth, | | | | | | |
| Rev Care Institute Inc Cherry Hill | | | | | | |
| Proj (G) | 8.000 | | 07-01-27 | CCC– | 1,120 | 862,131 |
|
| Tobacco Settlement Financing Corp, | | | | | | |
| Rev Preref Asset Backed Bond | 6.750 | | 06-01-39 | AAA | 5,000 | 5,981,800 |
| Rev Preref Asset Backed Bond | 6.250 | | 06-01-43 | AAA | 4,000 | 4,704,000 |
| Rev Ser 1A | 4.500 | | 06-01-23 | BBB | 3,995 | 2,966,607 |
| | | | | | | |
| New Mexico 0.46% | | | | | | 1,976,380 |
|
| Farmington, City of, | | | | | | |
| Rev Ref Poll Control Tucson Elec Pwr | | | | | | |
| Co Ser 1997A | 6.950 | | 10-01-20 | BBB– | 2,000 | 1,976,380 |
| | | | | | | |
| New York 10.94% | | | | | | 47,438,859 |
|
| New York City Industrial | | | | | | |
| Development Agency, | | | | | | |
| Rev Liberty 7 World Trade Ctr Ser | | | | | | |
| 2005A (G) | 6.250�� | | 03-01-15 | BB+ | 2,000 | 1,699,260 |
| Rev Ref Terminal One Group Assn Proj | 5.500 | | 01-01-24 | BBB+ | 1,500 | 1,291,680 |
|
| New York City Municipal Water | | | | | | |
| Finance Auth, | | | | | | |
| Rev Preref Wtr & Swr Sys Ser 2000B | 6.000 | | 06-15-33 | AAA | 365 | 391,243 |
| Rev Unref Bal Wtr & Swr Sys Ser 2000B | 6.000 | | 06-15-33 | AAA | 375 | 397,470 |
| Rev Wtr & Swr Sys Ser EE | 5.250 | | 06-15-40 | AA+ | 3,000 | 3,005,670 |
|
| New York City Transitional Finance Auth, | | | | | | |
| Rev Bldg Aid Ser S3 | 5.375 | | 01-15-34 | AA– | 2,000 | 1,982,260 |
| Rev Bldg Aid Ser S3 | 5.250 | | 01-15-39 | AA– | 3,000 | 2,894,670 |
| Rev Ref Future Tax Sec Ser 2002A (Zero | | | | | | |
| to 11-1-11 then 14.00%) | Zero | | 11-01-29 | AAA | 5,000 | 4,684,350 |
|
| New York Liberty Development Corp, | | | | | | |
| Rev Goldman Sachs Group Inc | | | | | | |
| Headquarters | 5.250 | | 10-01-35 | A | 2,500 | 2,065,650 |
|
| New York State Dormitory Auth, | | | | | | |
| Rev City Univ Sys Consol 2nd | | | | | | |
| Generation Ser 1993A | 5.750 | | 07-01-09 | AA– | 515 | 523,528 |
| Rev Preref Ser B | 7.500 | | 05-15-11 | AA– | 160 | 167,898 |
| Rev State Univ Edl Facil Ser 1993A | 5.500 | | 05-15-19 | AA– | 1,000 | 1,145,500 |
| Rev Unref Bal Ser 1990B | 7.500 | | 05-15-11 | AA– | 145 | 160,664 |
|
| New York State Housing | | | | | | |
| Finance Agency, | | | | | | |
| Rev Ref State Univ Constr Ser 1986A | 8.000 | | 05-01-11 | AAA | 1,145 | 1,235,444 |
See notes to financial statements
| |
| Semiannual report | Tax-Free Bond Fund | 15 |
FINANCIAL STATEMENTS
| | | | | | |
| | Interest | | Maturity | Credit | Par value | |
| State, issuer, description | rate | | date | rating (A) | (000) | Value |
| | | | | | | |
| New York (continued) | | | | | | |
|
| Port Auth of New York & New Jersey, | | | | | | |
| Cons 144th | 5.000% | | 10-01-29 | AA– | $3,500 | $3,519,600 |
| Rev Ref Spec Proj KIAC Partners Ser 4 | | | | | | |
| (G) | 6.750 | | 10-01-19 | BBB– | 8,700 | 7,236,399 |
|
| Triborough Bridge & Tunnel Auth, | | | | | | |
| Rev Bond Ref Gen Purp | 5.000 | | 11-15-33 | AA– | 9,025 | 8,836,197 |
| Rev Ser 2006A | 5.000 | | 11-15-22 | AA– | 3,545 | 3,719,556 |
|
| Westchester Tobacco Asset | | | | | | |
| Securitization Corp, | | | | | | |
| Rev Asset Backed Bond. (Zero to | | | | | | |
| 07-15-09, then 6.95%) | Zero | | 07-15-39 | AAA | 2,000 | 2,481,820 |
| | | | | | | |
| North Carolina 0.47% | | | | | | 2,026,820 |
|
| North Carolina Capital Facilities | | | | | | |
| Finance Agency, | | | | | | |
| Rev Duke Univ Proj Ser B | 5.000 | | 10-01-38 | AA+ | 2,000 | 2,026,820 |
| | | | | | | |
| Ohio 1.49% | | | | | | 6,444,443 |
|
| Buckeye Tobacco Settlement | | | | | | |
| Financing Auth, | | | | | | |
| Rev Asset Backed Sr Bond Ser 2007A–2 | 5.875 | | 06-01-30 | BBB | 2,000 | 1,263,540 |
| Rev Asset Backed Sr Bond Ser 2007A–2 | 5.125 | | 06-01-24 | BBB | 5,775 | 4,199,753 |
|
| Ohio Air Quality Development Authority, | | | | | | |
| Rev Ref Pollution CTL- FirstEnergy | 7.250 | | 11-01-32 | BBB | 1,000 | 981,150 |
| | | | | | | |
| Oklahoma 0.39% | | | | | | 1,703,180 |
|
| Tulsa Municipal Airport Trust, | | | | | | |
| Rev Ref Ser 2000A (P) | 7.750 | | 06-01-35 | B– | 2,000 | 1,703,180 |
| | | | | | | |
| Oregon 0.85% | | | | | | 3,687,156 |
|
| Clackamas County School District | | | | | | |
| No. 12, | | | | | | |
| GO Unltd Ser 2007B (Zero to 6/15/11, | | | | | | |
| then 5.00%) (D) | Zero | | 06-15-28 | AAA | 3,130 | 2,737,592 |
|
| Western Generation Agency, | | | | | | |
| Rev Wauna Cogeneration Proj Ser | | | | | | |
| 2006B (G) | 5.000 | | 01-01-14 | BBB– | 1,100 | 949,564 |
| | | | | | | |
| Pennsylvania 4.63% | | | | | | 20,056,481 |
|
| Allegheny County Hospital | | | | | | |
| Development Auth, | | | | | | |
| Rev West Penn Hlth Sys Ser 2007A | 5.000 | | 11-15-28 | BB | 3,500 | 1,968,225 |
|
| Allegheny County Industrial | | | | | | |
| Development Auth, | | | | | | |
| Rev Ref Environmental Imp | 5.500 | | 11-01-16 | BB+ | 2,500 | 2,198,525 |
|
| Allegheny County Redevelopment Auth, | | | | | | |
| Rev Tax Alloc Pittsburgh Mills Proj (G) | 5.600 | | 07-01-23 | BB+ | 1,000 | 728,310 |
|
| Carbon County Industrial | | | | | | |
| Development Auth, | | | | | | |
| Rev Reg Resource Recovery Panther | | | | | | |
| Creek Parners Proj | 6.700 | | 05-01-12 | BBB– | 4,960 | 5,142,131 |
|
| Pennsylvania Turnpike Commission, | | | | | | |
| Rev Ser-C (D) | 5.000 | | 12-01-32 | AA | 3,120 | 3,085,555 |
|
| Philadelphia Industrial | | | | | | |
| Development Auth, | | | | | | |
| Rev Commercial Dev Marriott Hotel (G) | 7.750 | | 12-01-17 | BB | 3,250 | 2,760,095 |
|
| Philadelphia School District, | | | | | | |
| GO LTD Ser E | 6.000 | | 09-01-38 | A+ | 4,000 | 4,173,640 |
See notes to financial statements
| |
| 16 | Tax-Free Bond Fund | Semiannual report |
FINANCIAL STATEMENTS
| | | | | | |
| | Interest | | Maturity | Credit | Par value | |
| State, issuer, description | rate | | date | rating (A) | (000) | Value |
| | | | | | | |
| Puerto Rico 5.26% | | | | | | $22,803,600 |
|
| Puerto Rico Aqueduct & Sewer Auth, | | | | | | |
| Rev Ref Pars & Inflos (D) | 6.000% | | 07-01-11 | AA | $200 | 221,780 |
|
| Puerto Rico Aqueduct & Sewer Auth., | | | | | | |
| Rev Inverse Floater (D)(P) | 7.470 | | 07-01-11 | AA | 6,500 | 7,915,700 |
|
| Puerto Rico, Commonwealth of, | | | | | | |
| Rev Inverse Floater (D)(P) | 7.720 | | 07-01-11 | AA | 14,000 | 14,666,120 |
| | | | | | | |
| Rhode Island 0.20% | | | | | | 888,190 |
|
| Tiverton, Town of, | | | | | | |
| Rev Spec Oblig Tax Mount Hope Bay | | | | | | |
| Village Ser 2002A (G) | 6.875 | | 05-01-22 | BBB– | 1,000 | 888,190 |
| | | | | | | |
| South Carolina 1.27% | | | | | | 5,502,718 |
|
| Richland, County of, | | | | | | |
| Rev Environmental Imp International | | | | | | |
| Paper | 6.100 | | 04-01-23 | BBB | 3,325 | 2,413,318 |
|
| South Carolina State Public Service Auth, | | | | | | |
| Santee Cooper Ser A | 5.500 | | 01-01-38 | AA– | 3,000 | 3,089,400 |
| | | | | | | |
| South Dakota 1.61% | | | | | | 6,980,800 |
|
| South Dakota Educational Enhancement | | | | | | |
| Funding Corp, | | | | | | |
| Rev Ser B | 6.500 | | 06-01-32 | BBB | 10,000 | 6,980,800 |
| | | | | | | |
| Tennessee 0.78% | | | | | | 3,362,550 |
|
| Tennessee Energy Acquisition Corp, | | | | | | |
| Gas Rev., Ser A | 5.250 | | 09-01-26 | A | 5,000 | 3,362,550 |
| | | | | | | |
| Texas 4.15% | | | | | | 18,002,070 |
|
| Bexar County Health Facilities | | | | | | |
| Development Corp, | | | | | | |
| Rev Ref Army Retirement Residence | | | | | | |
| Proj (G) | 6.300 | | 07-01-32 | AA | 1,000 | 1,143,550 |
|
| Brazos River Authority, | | | | | | |
| Ref AMT TXU Elec Ser A | 8.250 | | 10-01-30 | CCC | 2,000 | 1,170,020 |
| Rev Ref Utilities Co Ser 1999A | 7.700 | | 04-01-33 | CCC | 1,500 | 825,000 |
|
| Dallas/Fort Worth International Airport, | | | | | | |
| Rev Ref JT Subser A–1 (D) | 6.100 | | 11-01-24 | AA– | 1,600 | 1,602,656 |
|
| Harris, County of, | | | | | | |
| GO Ltd Cap Apprec Ser 2002 (D) | Zero | | 08-15-19 | AAA | 3,000 | 1,958,100 |
|
| Houston Independent School District, | | | | | | |
| Rev Cap Apprec Cesar E Chavez Ser | | | | | | |
| 1998A (D) | Zero | | 09-15-16 | AA | 900 | 688,590 |
|
| Mission Economic Development Corp, | | | | | | |
| Rev Alllied Waste Inc Proj Ser A | 5.200 | | 04-01-18 | BBB | 1,000 | 865,130 |
|
| North Texas Thruway Auth, | | | | | | |
| Rev Ref Sys First Tier Ser A | 6.000 | | 01-01-25 | A– | 3,000 | 3,076,230 |
| Rev Ref Sys First Tier Ser K-2 | 6.000 | | 01-01-38 | A– | 4,000 | 3,898,000 |
|
| San Antonio, City of, | | | | | | |
| Rev Ref Elec & Gas Ser A | 5.250 | | 02-01-31 | AA | 1,000 | 1,015,430 |
|
| Texas, State of, | | | | | | |
| GO Unltd Wtr Finl Assistance | 5.750 | | 08-01-31 | AA | 1,700 | 1,759,364 |
See notes to financial statements
| |
| Semiannual report | Tax-Free Bond Fund | 17 |
FINANCIAL STATEMENTS
| | | | | | |
| | Interest | | Maturity | Credit | Par value | |
| State, issuer, description | rate | | date | rating (A) | (000) | Value |
| | | | | | | |
| Utah 0.38% | | | | | | $1,640,448 |
|
| Mountain Regional Water Special | | | | | | |
| Service District, | | | | | | |
| Rev Spec Assessment Spec Imp Dist No | | | | | | |
| 2002-1 (G) | 7.000% | | 12-01-18 | BB+ | $660 | 599,967 |
|
| Salt Lake City Hospital, | | | | | | |
| Rev Ref IHC Hosp Inc Ser 1998A | 8.125 | | 05-15-15 | AAA | 890 | 1,040,481 |
| | | | | | | |
| Washington 0.70% | | | | | | 3,052,920 |
|
| Washington Public Power Supply System, | | | | | | |
| Rev Ref Nuclear Proj No 1 Ser 1989B | 7.125 | | 07-01-16 | AA– | 1,500 | 1,892,640 |
|
| Washington, State of, | | | | | | |
| GO Unltd Ser 1990A | 6.750 | | 02-01-15 | AA+ | 1,000 | 1,160,280 |
| | | | | | | |
| West Virginia 0.75% | | | | | | 3,266,580 |
|
| West Virginia State Hospital Finance Auth, | | | | | | |
| Rev Preref Charleston Area Med Ctr | 6.750 | | 09-01-22 | A2 | 2,400 | 2,613,264 |
| Rev Unref Charleston Area Med Ctr | 6.750 | | 09-01-22 | A2 | 600 | 653,316 |
| |
| Total investments (Cost $417,797,829)† 98.66% | | | | | $427,738,171 |
|
| Other assets and liabilities, net 1.34% | | | | | $5,815,220 |
|
| Total net assets 100.00% | | | | | | $433,553,391 |
|
The percentage shown for each investment category is the total value of that category as a percentage of the net assets of the Fund.
AMT Alternative Minimum Tax
GO General Obligation
(A) Credit ratings are unaudited and are rated by Moody’s Investors Service where Standard & Poor’s ratings are not available unless indicated otherwise.
(D) Bond is insured by one of these companies:
| | | |
| Insurance coverage | As a % of total investments | | |
| | |
| Assured Guaranty Ltd. | 1.01 | | |
| Financial Security Assurance, Inc. | 2.07 | | |
| Financial Guaranty Insurance Company | 3.02 | | |
| Ambac Financial Group, Inc. | 3.77 | | |
| Municipal Bond Insurance Association | 20.95 | | |
(F) The credit rating for this security is rated by Fitch.
(G) Security rated internally by John Hancock Advisers, LLC. Unaudited.
(H) Non-income-producing issuer filed for protection under the Federal Bankruptcy Code or is in default of interest payment.
(P) Variable rate obligation. The coupon rate shown represents the rate at period end.
(S) These securities are exempt from registration under Rule 144A of the Securities Act of 1933. Such securities may be resold, normally to qualified institutional buyers, in transactions exempt from registration.
† At February 28, 2009, the aggregate cost of investment securities for federal income tax purposes was $415,666,535. Net unrealized appreciation aggregated $12,071,636, of which $32,448,121 related to appreciated investment securities and $20,376,485 related to depreciated investment securities.
See notes to financial statements
| |
| 18 | Tax-Free Bond Fund | Semiannual report |
FINANCIAL STATEMENTS
Financial statements
Statement of assets and liabilities 2-28-09 (unaudited)
This Statement of Assets and Liabilities is the Fund’s balance sheet. It shows the value of what the Fund owns, is due and owes. You’ll also find the net asset value and the maximum offering price per share.
| |
| Assets | |
|
| Investments at value (Cost $417,797,829) | $427,738,171 |
| Cash | 475,722 |
| Receivable for shares sold | 1,418,058 |
| Interest receivable | 5,562,788 |
| Receivable from affiliates | 95,597 |
| |
| Total assets | 435,290,336 |
| |
| Liabilities | |
|
| Payable for investments purchased | 1,015,350 |
| Payable for shares repurchased | 258,635 |
| Payable to affiliates | |
| Management fees | 175,771 |
| Distribution and service fees | 101,325 |
| Other | 103,763 |
| Other payables and accrued expenses | 82,101 |
| |
| Total liabilities | 1,736,945 |
| |
| Net assets | |
|
| Capital paid-in | 448,085,029 |
| Accumulated net realized loss on investments | (25,964,406) |
| Net unrealized appreciation of investments | 9,940,342 |
| Accumulated net investment income | 1,492,426 |
| | |
| Net assets | $433,553,391 |
| |
| Net asset value per share | |
| | |
| Based on net asset values and shares outstanding — the Fund has an | |
| unlimited number of shares authorized with no par value | |
| Class A ($399,489,894 ÷ 42,842,254 shares) | $9.32 |
| Class B ($11,423,699 ÷ 1,225,091 shares)1 | $9.32 |
| Class C ($22,639,798 ÷ 2,428,061 shares)1 | $9.32 |
| |
| Maximum offering price per share | |
|
| Class A ($9.32 ÷ 95.5%)2 | $9.76 |
1 Redemption price is equal to net asset value less any applicable contingent deferred sales charge.
2 On single retail sales of less than $100,000. On sales of $100,000 or more and on group sales the offering price is reduced.
See notes to financial statements
| |
| Semiannual report | Tax-Free Bond Fund | 19 |
FINANCIAL STATEMENTS
Statement of operations For the period ended 2-28-09 (unaudited)1
This Statement of Operations summarizes the Fund’s investment income earned and expenses incurred in operating the Fund. It also shows net gains (losses) for the period stated.
| |
| Investment income | |
|
| Interest | $12,517,693 |
| | |
| Total investment income | 12,517,693 |
| |
| Expenses | |
|
| Investment management fees (Note 5) | 1,147,277 |
| Distribution and service fees (Note 5) | 628,106 |
| Transfer agent fees (Note 5) | 177,788 |
| Accounting and legal services fees (Note 5) | 30,455 |
| Professional fees | 54,555 |
| Custodian fees | 39,985 |
| Registration fees | 25,521 |
| Printing fees | 14,703 |
| Trustees’ fees | 7,024 |
| Miscellaneous | 38,688 |
| | |
| Total expenses | 2,164,102 |
| Less expense reductions (Note 5) | (703) |
| | |
| Net expenses | 2,163,399 |
| | |
| Net investment income | 10,354,294 |
| |
| Realized and unrealized gain (loss) | |
|
| Net realized loss on investments | (8,132,747) |
| Change in net unrealized appreciation (depreciation) of investments | (15,408,872) |
| | |
| Net realized and unrealized loss | (23,541,619) |
| | |
| Decrease in net assets from operations | ($13,187,325) |
1 Semiannual period from 9-1-08 to 2-28-09.
See notes to financial statements
| |
| 20 | Tax-Free Bond Fund | Semiannual report |
FINANCIAL STATEMENTS
Statements of changes in net assets
These Statements of Changes in Net Assets show how the value of the Fund’s net assets has changed during the last two periods. The difference reflects earnings less expenses, any investment gains and losses, distributions, if any, paid to shareholders and the net of Fund share transactions.
| | |
| | Year | Period |
| | ended | ended |
| | 8-31-08 | 2-28-091 |
| |
| Increase (decrease) in net assets | | |
|
| From operations | | |
| Net investment income | $20,403,322 | $10,354,294 |
| Net realized loss | (1,960,315) | (8,132,747) |
| Change in net unrealized appreciation (depreciation) | (4,001,767) | (15,408,872) |
| | | |
| Increase (decrease) in net assets resulting from operations | 14,441,240 | (13,187,325) |
| | | |
| Distributions to shareholders | | |
| From net investment income | | |
| Class A | (19,028,985) | (9,501,788) |
| Class B | (534,537) | (234,038) |
| Class C | (336,964) | (353,620) |
| | (19,900,486) | (10,089,446) |
| From Fund share transactions (Note 6) | (9,106,347) | 13,756,018 |
| Total decrease | (14,565,593) | (9,520,753) |
| |
| Net assets | | |
|
| Beginning of period | 457,639,737 | 443,074,144 |
| | | |
| End of period2 | $443,074,144 | $433,553,391 |
1 Semiannual period from 9-1-08 to 2-28-09. Unaudited.
2 Includes accumulated net investment income of $1,227,578 and $1,492,426, respectively.
See notes to financial statements
| |
| Semiannual report | Tax-Free Bond Fund | 21 |
FINANCIAL STATEMENTS
Financial highlights
The Financial Highlights show how the Fund’s net asset value for a share has changed since the end of the previous period.
| | | | | | |
| CLASS A SHARES Period ended | 8-31-041 | 8-31-051 | 8-31-06 | 8-31-07 | 8-31-08 | 2-28-092 |
| |
| Per share operating performance | | | | | | |
|
| Net asset value, beginning of period | $9.96 | $10.22 | $10.41 | $10.24 | $9.95 | $9.82 |
| Net investment income3 | 0.49 | 0.48 | 0.47 | 0.45 | 0.45 | 0.23 |
| Net realized and unrealized gain | | | | | | |
| (loss) on investments | 0.26 | 0.19 | (0.18) | (0.29) | (0.13) | (0.51) |
| Total from investment operations | 0.75 | 0.67 | 0.29 | 0.16 | 0.32 | (0.28) |
| Less distributions | | | | | | |
| From net investment income | (0.49) | (0.48) | (0.46) | (0.45) | (0.45) | (0.22) |
| Net asset value, end of period | $10.22 | $10.41 | $10.24 | $9.95 | $9.82 | $9.32 |
| Total return (%)4 | 7.705 | 6.72 | 2.875 | 1.555 | 3.255 | (2.75)5,6 |
| |
| Ratios and supplemental data | | | | | | |
|
| Net assets, end of period | | | | | | |
| (in millions) | $492 | $487 | $459 | $434 | $417 | $399 |
| Ratios (as a percentage | | | | | | |
| of average net assets): | | | | | | |
| Expenses before reductions | 0.97 | 0.99 | 0.96 | 0.95 | 0.96 | 0.997 |
| Interest and fees8 | — | — | — | 0.08 | 0.06 | — |
| Expenses net of all fee waivers | 0.96 | 0.99 | 0.96 | 1.03 | 1.02 | 0.997 |
| Expenses net of all fee waivers | | | | | | |
| and credits | 0.96 | 0.99 | 0.96 | 1.03 | 1.02 | 0.997 |
| Net investment income | 4.87 | 4.71 | 4.54 | 4.45 | 4.53 | 5.027 |
| Portfolio turnover (%) | 49 | 32 | 54 | 40 | 36 | 21 |
| |
1 Audited by previous Independent Registered Public Accounting Firm.
2 Semiannual period from 9-1-08 to 2-28-09. Unaudited.
3 Based on the average of the shares outstanding.
4 Assumes dividend reinvestment and does not reflect the effect of sales charges.
5 Total returns would have been lower had certain expenses not been reduced during the periods shown.
6 Not annualized.
7 Annualized.
8 Interest expenses and fees are related to the Fund’s investment in inverse floater rate investments. Under accounting rules, the Fund recognizes additional income in an amount equal to these expenses.
See notes to financial statements
| |
| 22 | Tax-Free Bond Fund | Semiannual report |
FINANCIAL STATEMENTS
| | | | | | |
| CLASS B SHARES Period ended | 8-31-041 | 8-31-051 | 8-31-06 | 8-31-07 | 8-31-08 | 2-28-092 |
| |
| Per share operating performance | | | | | | |
|
| Net asset value, beginning of period | $9.96 | $10.22 | $10.41 | $10.24 | $9.95 | $9.82 |
| Net investment income3 | 0.42 | 0.41 | 0.39 | 0.38 | 0.38 | 0.20 |
| Net realized and unrealized gain | | | | | | |
| (loss) on investments | 0.26 | 0.18 | (0.18) | (0.30) | (0.14) | (0.51) |
| Total from investment operations | 0.68 | 0.59 | 0.21 | 0.08 | 0.24 | (0.31) |
| Less distributions | | | | | | |
| From net investment income | (0.42) | (0.40) | (0.38) | (0.37) | (0.37) | (0.19) |
| Net asset value, end of period | $10.22 | $10.41 | $10.24 | $9.95 | $9.82 | $9.32 |
| Total return (%)4 | 6.895 | 5.93 | 2.105 | 0.805 | 2.475 | (3.11)5,6 |
| |
| Ratios and supplemental data | | | | | | |
|
| Net assets, end of period | | | | | | |
| (in millions) | $39 | $32 | $21 | $16 | $13 | $11 |
| Ratios (as a percentage | | | | | | |
| of average net assets): | | | | | | |
| Expenses before reductions | 1.73 | 1.74 | 1.71 | 1.70 | 1.71 | 1.747 |
| Interest and fees8 | — | — | — | 0.08 | 0.06 | — |
| Expenses net of all fee waivers | 1.72 | 1.74 | 1.71 | 1.78 | 1.77 | 1.747 |
| Expenses net of all fee waivers | | | | | | |
| and credits | 1.72 | 1.74 | 1.71 | 1.78 | 1.77 | 1.747 |
| Net investment income | 4.11 | 3.96 | 3.79 | 3.69 | 3.77 | 4.267 |
| Portfolio turnover (%) | 49 | 32 | 54 | 40 | 36 | 21 |
| |
1 Audited by previous Independent Registered Public Accounting Firm.
2 Semiannual period from 9-1-08 to 2-28-09. Unaudited.
3 Based on the average of the shares outstanding.
4 Assumes dividend reinvestment and does not reflect the effect of sales charges.
5 Total returns would have been lower had certain expenses not been reduced during the periods shown.
6 Not annualized.
7 Annualized.
8 Interest expenses and fees are related to the Fund’s investment in inverse floater rate investments. Under accounting rules, the Fund recognizes additional income in an amount equal to these expenses.
See notes to financial statements
| |
| Semiannual report | Tax-Free Bond Fund | 23 |
FINANCIAL STATEMENTS
| | | | | | |
| CLASS C SHARES Period ended | 8-31-041 | 8-31-051 | 8-31-06 | 8-31-07 | 8-31-08 | 2-28-092 |
| |
| Per share operating performance | | | | | | |
|
| Net asset value, beginning of period | $9.96 | $10.22 | $10.41 | $10.24 | $9.95 | $9.82 |
| Net investment income3 | 0.42 | 0.41 | 0.39 | 0.37 | 0.38 | 0.20 |
| Net realized and unrealized gain | | | | | | |
| (loss) on investments | 0.26 | 0.18 | (0.18) | (0.29) | (0.14) | (0.51) |
| Total from investment operations | 0.68 | 0.59 | 0.21 | 0.08 | 0.24 | (0.31) |
| Less distributions | | | | | | |
| From net investment income | (0.42) | (0.40) | (0.38) | (0.37) | (0.37) | (0.19) |
| Net asset value, end of period | $10.22 | $10.41 | $10.24 | $9.95 | $9.82 | $9.32 |
| Total return (%)4 | 6.895 | 5.93 | 2.105 | 0.805 | 2.475 | (3.11)5,6 |
| |
| Ratios and supplemental data | | | | | | |
|
| Net assets, end of period | | | | | | |
| (in millions) | $8 | $7 | $7 | $7 | $13 | $23 |
| Ratios (as a percentage | | | | | | |
| of average net assets): | | | | | | |
| Expenses before reductions | 1.72 | 1.74 | 1.71 | 1.70 | 1.71 | 1.747 |
| Interest and fees8 | — | — | — | 0.08 | 0.06 | — |
| Expenses net of all fee waivers | 1.71 | 1.74 | 1.71 | 1.78 | 1.77 | 1.747 |
| Expenses net of all fee waivers | | | | | | |
| and credits | 1.71 | 1.74 | 1.71 | 1.78 | 1.77 | 1.747 |
| Net investment income | 4.11 | 3.96 | 3.79 | 3.70 | 3.78 | 4.277 |
| Portfolio turnover (%) | 49 | 32 | 54 | 40 | 36 | 21 |
| |
1 Audited by previous Independent Registered Public Accounting Firm.
2 Semiannual period from 9-1-08 to 2-28-09. Unaudited.
3 Based on the average of the shares outstanding.
4 Assumes dividend reinvestment and does not reflect the effect of sales charges.
5 Total returns would have been lower had certain expenses not been reduced during the periods shown.
6 Not annualized.
7 Annualized.
8 Interest expenses and fees are related to the Fund’s investment in inverse floater rate investments. Under accounting rules, the Fund recognizes additional income in an amount equal to these expenses.
See notes to financial statements
| |
| 24 | Tax-Free Bond Fund | Semiannual report |
Notes to financial statements (unaudited)
Note 1 Organization
John Hancock Tax-Free Bond Fund (the Fund) is a diversified series of John Hancock Municipal Securities Trust (the Trust), an open-end management investment company registered under the Investment Company Act of 1940, as amended (the 1940 Act). The investment objective of the Fund is to provide as high a level of interest income exempt from federal income taxes as is consistent with preservation of capital.
The Trustees have authorized the issuance of multiple classes of shares of the Fund, designated as Class A, Class B and Class C shares. The shares of each class represent an interest in the same portfolio of investments of the Fund and have equal rights as to voting, redemptions, dividends and liquidation, except that certain expenses, subject to the approval of the Trustees, may be applied differently to each class of shares in accordance with current regulations of the Securities and Exchange Commission and the Internal Revenue Service. Shareholders of a class that bears distribution and service expenses under the terms of a distribution plan have exclusive voting rights to that distribution plan. Class B shares will convert to Class A shares eight years after purchase.
Note 2
Significant accounting policies
The financial statements have been prepared in conformity with accounting principles generally accepted in the United States of America, which require management to make certain estimates and assumptions at the date of the financial statements. Actual results could differ from those estimates. The following summarizes the significant accounting policies of the Fund:
Security valuation
Investments are stated at value as of the close of the regular trading on New York Stock Exchange (NYSE), normally at 4:00 p.m., Eastern Time. Debt obligations are valued based on the evaluated prices provided by an independent pricing service, which utilizes both dealer-supplied and electronic data processing techniques, which take into account factors such as institutional-size trading in similar groups of securities, yield, quality, coupon rate, maturity, type of issue, trading characteristics and other market data. Securities traded only in the over-the-counter market are valued at the last bid price quoted by brokers making markets in the securities at the close of trading. Debt obligations, for which there are no prices available from an independent pricing service, are valued based on broker quotes or fair valued as described below. Short-term debt investments that have a remaining maturity of 60 days or less are valued at amortized cost, and thereafter assume a constant amortization to maturity of any discount or premium, which approximates market value.
Other portfolio securities and assets for which market quotations are not readily available are valued at fair value as determined in good faith by the Fund’s Pricing Committee in accordance with procedures adopted by the Board of Trustees.
Valuations change in response to many factors including tax receipts and budget disbursements of the municipalities, general economic conditions, interest rates, investor perceptions and market liquidity.
The Fund adopted Statement of Financial Accounting Standards No. 157 (FAS 157), Fair Value Measurements, effective with the beginning of the Fund’s fiscal year. FAS 157 established a three-tier hierarchy to prioritize the assumptions, referred to as inputs, used in valuation techniques to measure fair value. The three-tier hierarchy of inputs is summarized in the three broad levels listed below:
Level 1 – Quoted prices in active markets for identical securities.
Level 2 – Prices determined using other significant observable inputs. Observable inputs are inputs that other market participants would use in pricing a security. These may include quoted prices for similar securities, interest rates, prepayment speeds, credit risk and others.
| |
| Semiannual report | Tax-Free Bond Fund | 25 |
Level 3 – Prices determined using significant unobservable inputs. In situations where quoted prices or observable inputs are unavailable, such as when there is little or no market activity for an investment, unobservable inputs may be used. Unobservable inputs reflect the Fund’s own assumptions about the factors that market participants would use in pricing an investment and would be based on the best information available.
The inputs or methodology used for valuing securities are not necessarily an indication of the risk associated with investing in those securities.
The following is a summary of the inputs used to value the Fund’s net assets as of February 28, 2009:
| | |
| | INVESTMENTS IN | OTHER FINANCIAL |
| VALUATION INPUTS | SECURITIES | INSTRUMENTS* |
|
| Level 1 — Quoted Prices | — | — |
|
| Level 2 — Other Significant Observable Inputs | $427,738,171 | — |
|
| Level 3 — Significant Unobservable Inputs | — | — |
| Total | $427,738,171 | — |
*Other financial instruments are derivative instruments not reflected in the Portfolio of Investments, such as futures, forwards and swap contracts, which are valued at the unrealized appreciation/ depreciation on the instrument.
Security transactions and related investment income
Investment security transactions are accounted for on a trade date plus one basis for daily net asset value calculations. However, for financial reporting purposes, investment transactions are reported on trade date. Interest income is accrued as earned. Dividend income and distributions to shareholders are recorded on the ex-dividend date. Discounts/premiums are accreted/amortized for financial reporting purposes. Non-cash dividends are recorded at the fair market value of the securities received. Debt obligations may be placed in a non-accrual status and related interest income may be reduced by ceasing current accruals and writing off interest receivables when the collection of all or a portion of interest has become doubtful, based upon consistently applied procedures. The Fund use identified cost method for determining realized gain or loss on investments for both financial statement and federal income tax reporting purposes.
Class allocations
Income, common expenses and realized and unrealized gains (losses) are determined at the fund level and allocated daily to each class of shares based on the appropriate net asset value of the respective classes. Distribution and service fees, if any, and transfer agent fees for Class A, Class B and Class C shares are calculated daily at the class level based on the appropriate net asset value of each class and the specific expense rate(s) applicable to each class.
Expenses
The majority of expenses are directly identifiable to an individual fund. Trust expenses that are not readily identifiable to a specific fund are allocated in such a manner as deemed equitable, taking into consideration, among other things, the nature and type of expense and the relative size of the funds. Expense estimates are accrued in the period to which they relate and adjustments are made when actual amounts are known.
Bank borrowings
The Fund is permitted to have bank borrowings for temporary or emergency purposes, including the meeting of redemption requests that otherwise might require the untimely disposition of securities. The Fund has entered into a line of credit agreement with The Bank of New York Mellon (BNYM), the Swing Line Lender and Administrative Agent. This agreement enables the Fund to participate, with other funds managed by John Hancock Advisers LLC (the Adviser), an indirect wholly owned subsidiary of Manulife Financial Corporation (MFC), in an unsecured line of credit with BNYM,
| |
| 26 | Tax-Free Bond Fund | Semiannual report |
which permits borrowings of up to $150 million, collectively. Interest is charged to each fund based on its borrowing. In addition, a commitment fee is charged to each fund based on the average daily unused portion of the line of credit and is allocated among the participating funds. The Fund had no outstanding borrowings under the line of credit for the period ended February 28, 2009.
Pursuant to the custodian agreement, the Custodian may, in its discretion, advance funds to the Fund to make properly authorized payments. When such payments result in an overdraft, the Fund is obligated to repay the Custodian for any overdraft together with interest due thereon. The Custodian has a lien, security interest or security entitlement in any Fund property, that is not segregated, to the maximum extent permitted by law to the extent of any overdraft.
Federal income taxes
The Fund qualifies as a regulated investment company by complying with the applicable provisions of the Internal Revenue Code and will not be subject to federal income tax on taxable income that is distributed to shareholders. Therefore, no federal income tax provision is required.
For federal income tax purposes, the Fund has $14,735,589 of a capital loss carryforward available, to the extent provided by regulations, to offset future net realized capital gains. To the extent that such carryforward is used by the Fund, no capital gain distributions will be made. The loss carryforwards expire as follows: August 31, 2011 — $7,431,104, August 31, 2012 — $6,837,618, August 31, 2015 — $257,214 and August 31, 2016 —$209,653. Net capital losses of $2,084,270 that are attributable to security transactions incurred after October 31, 2007, are treated as arising on September 1, 2008, the first day of the Fund’s next taxable year.
As of February 28, 2009, the Fund had no uncertain tax positions that would require financial statement recognition, de-recognition, or disclosure. Each of the Fund’s federal tax returns filed in the 3-year period ended August 31, 2008 remains subject to examination by the Internal Revenue Service.
Distribution of income and gains
The Fund records distributions to shareholders from net investment income and net realized gains, if any, on the ex-dividend date. The Fund generally declares dividends daily and pays them monthly. Capital gains, if any, are distributed annually. During the year ended August 31, 2008, the tax character of distributions paid was as follows: ordinary income $180,250 and tax exempt income $19,720,236. Distributions paid by the Fund with respect to each class of shares are calculated in the same manner, at the same time and are in the same amount, except for the effect of expenses that may be applied differently to each class.
Such distributions, on a tax basis, are determined in conformity with income tax regulations, which may differ from accounting principles generally accepted in the United States of America. Distributions in excess of tax basis earnings and profits, if any, are reported in the Fund’s financial statements as a return of capital.
New accounting pronouncement
In March 2008, FASB No. 161 (FAS 161), Disclosures about Derivative Instruments and Hedging Activities, an amendment of FASB Statement No. 133 (FAS 133), was issued and is effective for fiscal years and interim periods beginning after November 15, 2008. FAS 161 amends and expands the disclosure requirements of FAS 133 in order to provide financial statement users an understanding of a company’s use of derivative instruments, how derivative instruments are accounted for under FAS 133 and related interpretations and how these instruments affect a company’s financial position, performance, and cash flows. FAS 161 requires companies to disclose information detailing the objectives and strategies for using derivative instruments, the level of derivative activity entered into by the company, and any credit risk-related contingent features of the agreements. As of February 28, 2009, management does n ot believe that the adoption of FAS 161 will have a material impact on the amounts reported in the financial statements.
| |
| Semiannual report | Tax-Free Bond Fund | 27 |
Note 3
Risk and uncertainties
State concentration risk
The Fund invests mainly in bonds from a single state and its performance is affected by local, state and regional factors. The risks may include economic or policy changes, erosion of the tax base, and state legislative changes (especially those regarding budgeting and taxes). Although the Fund invests mainly in investment-grade bonds, which generally have a relatively low level of credit risk, any factors that might lead to a credit decline statewide would be likely to cause widespread decline in the credit quality of the Fund’s holdings.
Insurance concentration risk
The Fund may hold insured municipal obligations which are insured as to their scheduled payment of principal and interest under an insurance policy obtained by the issuer or underwriter of the obligation at the time of its original issuance. Since there are a limited number of municipal obligation insurers, a Fund may have a concentration of investments covered by one insurer. Accordingly, the concentration may make the Fund’s value more volatile and investment values may rise and fall more rapidly. In addition, the credit quality of companies which provide the insurance may affect the value of those securities and insurance does not guarantee the market value of the insured obligation.
Municipal bond risk
The Fund generally invests in general obligation or revenue municipal bonds. The bonds are backed by the municipal issuer’s have the risk that the issuer’s credit quality will decline. General obligation bonds are backed by the municipal issuer’s ability to levy taxes. In extreme cases, a municipal issuer could declare bankruptcy or otherwise become unable to honor its commitments to bondholders which may be caused by many reasons, ranging from including fiscal mismanagement and erosion of the tax base. Revenue bonds are backed only by income associated with a specific facility. Any circumstance that reduces or threatens the economic viability of that particular facility can affect the bond’s credit quality.
Fixed income risk
Fixed income securities are subject to credit and interest rate risk and involve some risk of default in connection with principal and interest payments.
Note 4
Guarantees and indemnifications
Under the Fund’s organizational documents, its Officers and Trustees are indemnified against certain liability arising out of the performance of their duties to the Fund. Additionally, in the normal course of business, the Fund enters into contracts with service providers that contain general indemnification clauses. The Fund’s maximum exposure under these arrangements is unknown, as this would involve future claims that may be made against the Fund that have not yet occurred.
Note 5
Management fee and transactions with affiliates and others
The Fund has an investment management contract with the Adviser. Under the investment management contract, the Fund pays a monthly management fee to the Adviser equivalent, on an annual basis, to the sum of: (a) 0.55% of the first $500,000,000 of the Fund’s average daily net asset value, (b) 0.50% of the next $500,000,000 and (c) 0.45% of the Fund’s average daily net assets in excess of $1,000,000,000. The effective rate for the period ended February 28, 2009 is 0.55% of the Fund’s average daily net asset value. The Fund has a subadvisory agreement with MFC Global Investment Management (U.S.), LLC, a subsidiary of John Hancock Financial Services, Inc. The Fund is not responsible for payment of subadvisory fees.
The Fund has a Distribution Agreement with John Hancock Funds, LLC (JH Funds), a wholly owned subsidiary of the Adviser. The Fund has adopted Distribution Plans with respect to Class A, Class B and Class C, pursuant to Rule 12b-1 under the 1940 Act, to pay JH Funds for the services it provides as distributor of shares of the Fund. Accordingly, the Fund makes monthly payments to JH Funds at an annual rate not to exceed 0.25%, 1.00% and 1.00% of average daily net asset value of
| |
| 28 | Tax-Free Bond Fund | Semiannual report |
Class A, Class B and Class C, respectively. A maximum of 0.25% of such payments may be service fees, as defined by the Conduct Rules of the Financial Industry Regulatory Authority (formerly the National Association of Securities Dealers). Under the Conduct Rules, curtailment of a portion of the Fund’s 12b-1 payments could occur under certain circumstances.
The Fund has an agreement with its custodian bank, under which custody fees are reduced by balance credits applied during the period. Accordingly, the expense reductions related to custody fee offsets amounted to $624.
Class A shares are assessed up-front sales charges. During the period ended February 28, 2009, JH Funds received net up-front sales charges of $212,894 with regard to sales of Class A shares. Of this amount, $23,502 was retained and used for printing prospectuses, advertising, sales literature and other purposes, $170,689 was paid as sales commissions to unrelated broker-dealers and $18,703 was paid as sales commissions to sales personnel of Signator Investors, Inc. (Signator Investors), a related broker-dealer. The Adviser’s indirect parent, John Hancock Life Insurance Company (JHLICO), is the indirect sole shareholder of Signator Investors.
Class B shares that are redeemed within six years of purchase are subject to a contingent deferred sales charge (CDSC) at declining rates, beginning at 5.00% of the lesser of the current market value at the time of redemption or the original purchase cost of the shares being redeemed. Class C shares that are redeemed within one year of purchase are subject to a CDSC at a rate of 1.00% of the lesser of the current market value at the time of redemption or the original purchase cost of the shares being redeemed. Proceeds from the CDSCs are paid to JH Funds and are used in whole or in part to defray its expenses for providing distribution-related services to the Fund in connection with the sale of Class B and Class C shares. During the period ended February 28, 2009, CDSCs received by JH Funds amounted to $7,143 for Class B shares and $6,423 for Class C shares.
The Fund has a transfer agent agreement with John Hancock Signature Services, Inc. (Signature Services), an indirect subsidiary of JHLICO. The transfer agent fees are made up of three components:
• The Fund pays a monthly transfer agent fee at an annual rate of 0.01% for all classes based on each class’s average daily net assets.
• All classes of the Fund paid a monthly fee based on an annual rate of $17.50 per shareholder account.
• In addition, Signature Services is reimbursed for certain out-of-pocket expenses.
The Fund receives earnings credits from its transfer agent as a result of uninvested cash balances. These credits are used to reduce a portion of the Fund’s transfer agent fees and out-of-pocket expenses. During the period ended February 28, 2009, the Fund’s transfer agent fees and out-of-pocket expenses were reduced by $79 for transfer agent credits earned.
Class level expenses for the period ended February 28, 2009 were as follows:
| | |
| | Distribution and | Transfer |
| Share class | service fees | agent fees |
|
| Class A | $485,950 | $165,640 |
| Class B | 56,693 | 4,823 |
| Class C | 85,463 | 7,325 |
| Total | $628,106 | $177,788 |
The Fund has an agreement with the Adviser and affiliates to perform necessary tax, accounting, compliance, legal and other administrative services for the Fund. The compensation for the year amounted to $30,455 with an effective rate of 0.01% of the Fund’s average daily net asset value.
Mr. James R. Boyle is Chairman of the Adviser, as well as affiliated Trustee of the Fund, and is compensated by the Adviser and/ or its affiliates. The compensation of unaffiliated Trustees is borne by the Fund. The unaffiliated Trustees may elect to defer, for tax purposes, their receipt of this compensation under the John Hancock Group of Funds Deferred Compensation Plan. The Fund makes investments into other John Hancock funds,
| |
| Semiannual report | Tax-Free Bond Fund | 29 |
as applicable, to cover its liability for the deferred compensation. Investments to cover the Fund’s deferred compensation liability are recorded on the Fund’s books as an other asset. The deferred compensation liability and the related other asset are always equal and are marked to market on a periodic basis to reflect any income earned by the investments, as well as any unrealized gains or losses. The Deferred Compensation Plan investments had no impact on the operations of the Fund.
Note 6
Fund share transactions
This listing illustrates the number of Fund shares sold, reinvested and repurchased during the year ended August 31, 2008, and the period ended February 28, 2009, along with the corresponding dollar value.
| | | | |
| | | Year ended 8-31-08 | Period ended 2-28-091 |
| | Shares | Amount | Shares | Amount |
| Class A shares | | | | |
|
| Sold | 2,871,529 | $28,467,107 | 3,033,523 | $28,396,506 |
| Distributions reinvested | 1,419,271 | 14,057,101 | 761,398 | 7,005,581 |
| Repurchased | (5,517,877) | (54,881,160) | (3,370,358) | (30,841,945) |
| | | | | |
| Net increase (decrease) | (1,227,077) | ($12,356,952) | 424,563 | $4,560,142 |
| |
| Class B shares | | | | |
|
| Sold | 169,785 | $1,690,375 | 198,269 | $1,846,704 |
| Distributions reinvested | 34,446 | 341,308 | 15,783 | 145,185 |
| Repurchased | (500,005) | (4,984,103) | (296,990) | (2,724,007) |
| | | | | |
| Net decrease | (295,774) | ($2,952,420) | (82,938) | ($732,118) |
| |
| Class C shares | | | | |
|
| Sold | 733,348 | $7,224,800 | 1,234,775 | $11,529,259 |
| Distributions reinvested | 22,661 | 224,610 | 23,250 | 213,925 |
| Repurchased | (126,097) | (1,246,385) | (202,764) | (1,815,190) |
| | | | | |
| Net increase | 629,912 | $6,203,025 | 1,055,261 | $9,927,994 |
| |
| Net increase (decrease) | (892,939) | ($9,106,347) | 1,396,886 | $13,756,018 |
|
1Semiannual period from 9-1-08 to 2-28-09. Unaudited.
Note 7
Purchase and sale of securities
Purchases and proceeds from sales or maturities of securities, including purchase and sales of variable rate demand notes of $18,805,000 and $19,905,000, respectively, during the period ended February 28, 2009, aggregated $95,916,583 and $85,992,928, respectively. Short-term securities are excluded from these amounts.
Note 8
Change in fiscal year end
On March 12, 2009, the Board of Trustees approved to change the Fund’s fiscal year end from August 31, to May 31.
| |
| 30 | Tax-Free Bond Fund | Semiannual report |
Board Consideration of and
Continuation of Investment Advisory
Agreement and Subadvisory
Agreement: John Hancock
Tax-Free Bond Fund
The Investment Company Act of 1940 (the 1940 Act) requires the Board of Trustees (the Board) of John Hancock Tax-Exempt Series Fund (the Trust), including a majority of the Trustees who have no direct or indirect interest in the investment advisory agreement and are not “interested persons” of the Trust, as defined in the 1940 Act (the Independent Trustees), annually to meet in person to review and consider the continuation of: (i) the investment advisory agreement (the Advisory Agreement) with John Hancock Advisers, LLC (the Adviser) and (ii) the investment subadvisory agreement (the Subadvisory Agreement) with MFC Global Investment Management (U.S.), LLC (the Subadviser) for the John Hancock Tax-Free Bond Fund (the Fund). The Advisory Agreement and the Subadvisory Agreement are collectively referred to as the Advisory Agreements.
At meetings held on May 5–6 and June 9–10, 2008, the Board considered the factors and reached the conclusions described below relating to the selection of the Adviser and Subadviser and the continuation of the Advisory Agreements. During such meetings, the Board’s Contracts/Operations Committee and the Independent Trustees also met in executive sessions with their independent legal counsel.
In evaluating the Advisory Agreements, the Board, including the Contracts/Operations Committee and its Independent Trustees, reviewed a broad range of information requested for this purpose. This information included: (i) the investment performance of the Fund relative to a category of relevant funds (the Category) and a peer group of comparable funds (the Peer Group). The funds within each Category and Peer Group were selected by Morningstar Inc. (Morningstar), an independent provider of investment company data. Data covered a range of periods ended December 31, 2007, (ii) advisory and other fees incurred by, and the expense ratios of, the Fund relative to a Category and a Peer Group, (iii) the advisory fees of comparable portfolios of other clients of the Adviser and the Subadviser, (iv) the Adviser’s financial results and condition, including its and certain of its affiliates’ profitability from services performed for the Fund, (v) breakpoints in the Fund’s and the Peer Group’s fees, and information about economies of scale, (vi) the Adviser’s and Subadviser’s record of compliance with applicable laws and regulations, with the Fund’s investment policies and restrictions, and with the applicable Code of Ethics, and the structure and responsibilities of the Adviser’s and Subadviser’s compliance department, (vii) the background and experience of senior management and investment professionals, and (viii) the nature, cost and character of advisory and non-investment management services provided by the Adviser and its affiliates and by the Subadviser.
The Independent Trustees considered the legal advice of independent legal counsel and relied on their own business judgment in determining the factors to be considered in evaluating the materials that were presented to them and the weight to be given to each such factor. The Board’s review and conclusions were based on a comprehensive consideration of all information presented to the Board and not the result of any single controlling factor. The Board principally considered data on performance and other information provided by Morningstar as of December 31, 2007. The Board also considered updated performance information provided to it by the Adviser or Subadviser at its May and June 2008 meetings. Performance and other information may be quite different as of the date of this shareholders report. The key factors considered by the Board and the conclusions reached are described below.
Nature, extent and quality of services
The Board considered the ability of the Adviser and the Subadviser, based on their resources, reputation and other attributes, to attract and retain qualified investment professionals, including research, advisory, and supervisory personnel. The Board considered the investment philosophy, research and
| |
| Semiannual report | Tax-Free Bond Fund | 31 |
investment decision-making processes of the Adviser and Subadviser. The Board considered the Adviser’s execution of its oversight responsibilities. The Board further considered the culture of compliance, resources dedicated to compliance, compliance programs and compliance records of the Adviser and Subadviser. In addition, the Board took into account the administrative and other non-advisory services provided to the Fund by the Adviser and its affiliates.
Based on the above factors, together with those referenced below, the Board concluded that, within the context of its full deliberations, the nature, extent and quality of the investment advisory services provided to the Fund by the Adviser and Subadviser supported renewal of the Advisory Agreements.
Fund performance
The Board considered the performance results for the Fund over various time periods ended December 31, 2007. The Board also considered these results in comparison to the performance of the Category, as well as the Fund’s Peer Group and benchmark index. The Board reviewed with representatives of Morningstar the methodology used by Morningstar to select the funds in the Category and the Peer Group.
The Board noted that, for the 1- and 10-year periods under review, the Fund’s performance was lower than the performance of its benchmark index, the Lehman Brothers Municipal Bond Index. The Board also noted that the Fund’s performance for the 3- and 5-year periods was generally in line with its benchmark index. The Board also noted that the Fund’s performance for the 1- and 10-year periods was generally in line with the performance of the Peer Group and Category medians. The Board viewed favorably that the Fund’s performance during the 3- and 5-year periods under review was higher than the performance of the Peer Group and Category medians.
Investment advisory fee and subadvisory fee rates and expenses
The Board reviewed and considered the contractual investment advisory fee rate payable by the Fund to the Adviser for investment advisory services (the Advisory Agreement Rate). The Board received and considered information comparing the Advisory Agreement Rate with the advisory fees for the Peer Group and Category. The Board noted that the Advisory Agreement Rate was not appreciably higher than the median rates of the Peer Group and Category.
The Board received and considered expense information regarding the Fund’s various components, including advisory fees, distribution and fees other than advisory and distribution fees, including transfer agent fees, custodian fees, and other miscellaneous fees (e.g., fees for accounting and legal services). The Board considered comparisons of these expenses to the Peer Group median. The Board also received and considered expense information regarding the Fund’s total operating expense ratio (Expense Ratio). The Board noted that, unlike the Fund, several funds in the Peer Group employed fee waivers or reimbursements. The Board received and considered information comparing the Expense Ratio of the Fund to that of the Peer Group and Category medians before the application of fee waivers and reimbursements (Gross Expense Ratio) and after the application of such waivers and reimbursement (Net Expen se Ratio). The Board noted that the Fund’s Gross Expense Ratio was not appreciably higher than the Category median and was lower than the Peer Group median. The Board also noted that the Fund’s Net Expense Ratio was higher than the Category and Peer Group medians.
The Adviser also discussed the Morningstar data and rankings, and other relevant information, for the Fund. Based on the above-referenced considerations and other factors, the Board concluded that the Fund’s overall performance and expenses supported the re-approval of the Advisory Agreements.
The Board also received information about the investment subadvisory fee rate (the Subadvisory Agreement Rate) payable by the Adviser to the Subadviser for investment subadvisory services. The Board concluded that the Subadvisory Agreement Rate was fair and equitable, based on its consideration of the factors described here.
| |
| 32 | Tax-Free Bond Fund | Semiannual report |
Profitability
The Board received and considered a detailed profitability analysis of the Adviser based on the Advisory Agreements, as well as on other relationships between the Fund and the Adviser and its affiliates, including the Subadviser. The Board also considered a comparison of the Adviser’s profitability to that of other similar investment advisers whose profit-ability information is publicly available. The Board concluded that, in light of the costs of providing investment management and other services to the Fund, the profits and other ancillary benefits reported by the Adviser were not unreasonable.
Economies of scale
The Board received and considered general information regarding economies of scale with respect to the management of the Fund, including the Fund’s ability to appropriately benefit from economies of scale under the Fund’s fee structure. The Board recognized the inherent limitations of any analysis of economies of scale, stemming largely from the Board’s understanding that most of the Adviser’s costs are not specific to individual Funds, but rather are incurred across a variety of products and services.
To the extent the Board and the Adviser were able to identify actual or potential economies of scale from Fund-specific or allocated expenses, in order to ensure that any such economies continue to be reasonably shared with the Fund as its assets increase, the Adviser and the Board agreed to continue the existing breakpoints to the Advisory Agreement Rate.
Information about services to other clients
The Board also received information about the nature, extent and quality of services and fee rates offered by the Adviser and Subadviser to their other clients, including other registered investment companies, institutional investors and separate accounts. The Board concluded that the Advisory Agreement Rate and the Subadvisory Agreement Rate were not unreasonable, taking into account fee rates offered to others by the Adviser and Subadviser, respectively, after giving effect to differences in services.
Other benefits to the Adviser
The Board received information regarding potential “fall-out” or ancillary benefits received by the Adviser and its affiliates, including the Subadviser, as a result of their relationship with the Fund. Such benefits could include, among others, benefits directly attributable to the relationship of the Adviser and Subadviser with the Fund and benefits potentially derived from an increase in business as a result of their relationship with the Fund (such as the ability to market to shareholders other financial products offered by the Adviser and its affiliates).
The Board also considered the effectiveness of the Adviser’s, Subadviser’s and Fund’s policies and procedures for complying with the requirements of the federal securities laws, including those relating to best execution of portfolio transactions and brokerage allocation.
Other factors and broader review
As discussed above, the Board reviewed detailed materials received from the Adviser and Subadviser as part of the annual re-approval process. The Board also regularly reviews and assesses the quality of the services that the Fund receives throughout the year. In this regard, the Board reviews reports of the Adviser at least quarterly, which include, among other things, fund performance reports and compliance reports. In addition, the Board meets with portfolio managers and senior investment officers at various times throughout the year.
After considering the above-described factors and based on its deliberations and its evaluation of the information described above, the Board concluded that approval of the continuation of the Advisory Agreements for the Fund was in the best interest of the Fund and its shareholders. Accordingly, the Board unanimously approved the continuation of the Advisory Agreements.
| |
| Semiannual report | Tax-Free Bond Fund | 33 |
More information
| |
| Trustees | Investment adviser |
| Patti McGill Peterson, Chairperson | John Hancock Advisers, LLC |
| James R. Boyle† | |
| James F. Carlin | Subadviser |
| William H. Cunningham* | MFC Global Investment |
| Deborah C. Jackson* | Management (U.S.), LLC |
| Charles L. Ladner | |
| Stanley Martin* | Principal distributor |
| Dr. John A. Moore | John Hancock Funds, LLC |
| Steven R. Pruchansky | |
| *Member of the Audit Committee | Custodian |
| †Non-Independent Trustee | State Street Bank and Trust Company |
| |
| Officers | Transfer agent |
| Keith F. Hartstein | John Hancock Signature Services, Inc. |
| President and Chief Executive Officer | |
| Legal counsel |
| Thomas M. Kinzler | K&L Gates LLP |
| Secretary and Chief Legal Officer | |
| | |
| Francis V. Knox, Jr. | |
| Chief Compliance Officer | |
| | |
| Charles A. Rizzo | |
| Chief Financial Officer | |
| | |
| Gordon M. Shone | |
| Treasurer | |
| | |
| John G. Vrysen | |
| Chief Operating Officer | |
Additional information about your fund is available without charge in several ways. As required by the SEC, you can access proxy voting information and quarterly portfolio information on your fund. The proxy voting information includes a description of proxy voting policies, procedures and information regarding how the fund voted proxies relating to portfolio securities during the most recent twelve-month period ended June 30. The quarterly portfolio information that includes a complete list of the fund’s holdings for the first and third quarters of the fund’s fiscal period is filed on Form N-Q. You have access to this information:
| | | |
| By phone | On the fund’s Website | At the SEC |
| 1-800-225-5291 | www.jhfunds.com | www.sec.gov |
| | | | 1-800-SEC-0330 |
| | | | SEC Public Reference Room |
|
| |
| You can also contact us: | | | |
| Regular mail: | | Express mail: | |
| John Hancock Signature Services, Inc. | John Hancock Signature Services, Inc. |
| P.O. Box 9510 | | Mutual Fund Image Operations |
| Portsmouth, NH 03802-9510 | | 164 Corporate Drive | |
| | | Portsmouth, NH 03801 | |
|
Month-end portfolio holdings are available at www.jhfunds.com.
| |
| 34 | Tax-Free Bond Fund | Semiannual report |

1-800-225-5291
1-800-554-6713 TDD
1-800-338-8080 EASI-Line
www.jhfunds. com
Now available: electronic delivery
www.jhfunds.com/edelivery
| |
| This report is for the information of the shareholders of John Hancock Tax-Free Bond Fund. | 520SA 2/09 |
| It is not authorized for distribution to prospective investors unless preceded or accompanied by a prospectus. | 4/09 |

A look at performance
| | | | | | | | | | | | | | |
| | | | | | | | | | | | | |
| For the period ended February 28, 2009 | | | | | | | |
| |
| | | | Average annual returns (%) | | Cumulative total returns (%) | | | SEC 30- |
| | | | with maximum sales charge (POP) | | with maximum sales charge (POP) | | | day yield |
| | Inception | | | | | Since | | Six | | | | Since | | (%) as of |
| Class | date | | 1-year | 5-year | 10-year | inception | | months | 1-year | 5-year | 10-year | inception | | 2-28-09 |
|
| A | 12-31-93 | | –11.22 | 0.41 | 1.99 | — | | –13.96 | –11.22 | 2.09 | 21.74 | — | 5.25 |
|
| B | 8-25-86 | | –12.19 | 0.27 | 1.86 | — | | –14.59 | –12.19 | 1.37 | 20.18 | — | 4.74 |
|
| C | 4-1-99 | | –8.67 | 0.60 | — | 1.72 | | –11.09 | –8.67 | 3.01 | — | 18.37 | 4.73 |
|
Performance figures assume all distributions are reinvested. Public offering price (POP) figures reflect maximum sales charges on Class A shares of 4.5% and the applicable contingent deferred sales charge (CDSC) on Class B and Class C shares. The returns for Class C shares have been adjusted to reflect the elimination of the front-end sales charge, effective July 15, 2004. The Class B shares’ CDSC declines annually between years 1 to 6 according to the following schedule: 5, 4, 3, 3, 2, 1%. No sales charge will be assessed after the sixth year. Class C shares held for less than one year are subject to a 1% CDSC.
The expense ratios of the Fund, both net (including any fee waivers or expense limitations) and gross (excluding any fee waivers or expense limitations), are set forth according to the most recent publicly available prospectus for the Fund and may differ from the expense ratios disclosed in the Financial Highlights tables in this report. The net expenses equal the gross expenses and are as follows: Class A — 1.25%, Class B — 2.00% and Class C — 2.00%. The Fund’s expenses for the current fiscal year may be higher than the expenses listed above, for some of the following reasons: i) a significant decrease in average net assets may result in a higher advisory fee rate; ii) a significant decrease in average net assets may result in an increase in the expense ratio; and iii) the termination or expiration of expense cap reimbursements.
The returns reflect past results and should not be considered indicative of future performance. The return and principal value of an investment will fluctuate so that shares, when redeemed, may be worth more or less than their original cost. Due to market volatility, the Fund’s current performance may be higher or lower than the performance shown. For current to the most recent month end performance data, please call 1–800–225–5291 or visit the Fund’s Web site at www.jhfunds.com.
The performance table above and the chart on the next page do not reflect the deduction of taxes that a shareholder would pay on fund distributions or the redemption of fund shares. Please note that a portion of the Fund’s income may be subject to taxes, and some investors may be subject to the Alternative Minimum Tax (AMT). Also note that capital gains are taxable.
The Fund’s performance results reflect any applicable expense reductions, without which the expenses would increase and results would have been less favorable.
| |
| 6 | High Yield Municipal Bond Fund | Semiannual report |
Growth of $10,000
This chart shows what happened to a hypothetical $10,000 investment in High Yield
Municipal Bond Fund Class A shares for the period indicated. For comparison, we’ve
shown the same investment in the Barclays Capital Municipal Bond Index.
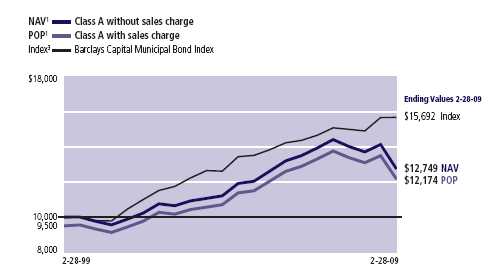
| | | | |
| | | | With maximum | |
| Class | Period beginning | Without sales charge | sales charge | Index |
|
| B2 | 2-28-99 | $12,018 | $12,018 | $15,692 |
|
| C2 | 4-1-99 | 11,837 | 11,837 | 15,671 |
|
Assuming all distributions were reinvested for the period indicated, the table above shows the value of a $10,000 investment in the Fund’s Class B and Class C shares, respectively, as of February 28, 2009. The Class C shares investment with maximum sales charge has been adjusted to reflect the elimination of the front-end sales charge, effective July 15, 2004. Performance of the classes will vary based on the difference in sales charges paid by shareholders investing in the different classes and the fee structure of those classes.
Barclays Capital Municipal Bond Index is an unmanaged index that includes municipal bonds and is commonly used as a measure of bond performance.
It is not possible to invest directly in an index. Index figures do not reflect sales charges, which would have resulted in lower values if they did.
1 NAV represents net asset value and POP represents public offering price.
2 No contingent deferred sales charge applicable.
3 Formerly named Lehman Brothers Municipal Bond Index.
| |
| Semiannual report | High Yield Municipal Bond Fund | 7 |
Your expenses
These examples are intended to help you understand your ongoing operating expenses.
Understanding fund expenses
As a shareholder of the Fund, you incur two types of costs:
■ Transaction costs which include sales charges (loads) on purchases or redemptions (varies by share class), minimum account fee charge, etc.
■ Ongoing operating expenses including management fees, distribution and service fees (if applicable), and other fund expenses.
We are going to present only your ongoing operating expenses here.
Actual expenses/actual returns
This example is intended to provide information about your fund’s actual ongoing operating expenses, and is based on your fund’s actual return. It assumes an account value of $1,000.00 on September 1, 2008 with the same investment held until February 28, 2009.
| | | |
| | Account value | Ending value | Expenses paid during |
| | on 9-1-08 | on 2-28-09 | period ended 2-28-091 |
|
| Class A | $1,000.00 | $901.30 | $5.42 |
|
| Class B | 1,000.00 | 897.90 | 8.94 |
|
| Class C | 1,000.00 | 897.90 | 8.94 |
|
Together with the value of your account, you may use this information to estimate the operating expenses that you paid over the period. Simply divide your account value at February 28, 2009, by $1,000.00, then multiply it by the “expenses paid” for your share class from the table above. For example, for an account value of $8,600.00, the operating expenses should be calculated as follows:
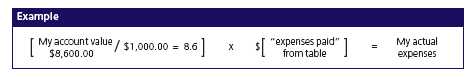
| |
| 8 | High Yield Municipal Bond Fund | Semiannual report |
Hypothetical example for comparison purposes
This table allows you to compare your fund’s ongoing operating expenses with those of any other fund. It provides an example of the Fund’s hypothetical account values and hypothetical expenses based on each class’s actual expense ratio and an assumed 5% annualized return before expenses (which is not your fund’s actual return). It assumes an account value of $1,000.00 on September 1, 2008, with the same investment held until February 28, 2009. Look in any other fund shareholder report to find its hypothetical example and you will be able to compare these expenses.
| | | |
| | Account value | Ending value | Expenses paid during |
| | on 9-1-08 | on 2-28-09 | period ended 2-28-091 |
|
| Class A | $1,000.00 | $1,019.10 | $5.76 |
|
| Class B | 1,000.00 | 1,015.40 | 9.49 |
|
| Class C | 1,000.00 | 1,015.40 | 9.49 |
|
Remember, these examples do not include any transaction costs, such as sales charges; therefore, these examples will not help you to determine the relative total costs of owning different funds. If transaction costs were included, your expenses would have been higher. See the prospectus for details regarding transaction costs.
1 Expenses are equal to the Fund’s annualized expense ratio of 1.15%, 1.90% and 1.90% for Class A, Class B and Class C, respectively, multiplied by the average account value over the period, multiplied by 181/365 (to reflect the one-half year period).
| |
| Semiannual report | High Yield Municipal Bond Fund | 9 |
Portfolio summary
| |
| Top 10 holdings1 | |
|
| Atlanta, City of, 11-1-19, 5.000% | 7.8% |
|
| Foothill Eastern Transportation Corridor Agency, 1-1-18, Zero | 4.4% |
|
| Golden State Tobacco Securitization Corp., 6-1-27, 4.500% | 3.5% |
|
| Massachusetts Health & Educational Facilities Auth, 12-15-31, 9.200% | 2.4% |
|
| Buckeye Tobacco Settlement Financing Auth, 6-1-24, 5.125% | 2.3% |
|
| San Bernardino, County of, 8-1-17, 5.500% | 1.9% |
|
| E–470 Public Highway Authority, 9-1-35, Zero | 1.7% |
|
| Capital Projects Finance Auth, 8-15-31, 7.850% | 1.7% |
|
| California, State of, 7-1-23, 0.850% | 1.6% |
|
| New York Liberty Development Corp, 10-1-35, 5.250% | 1.5% |
|
| | | | |
| Sector distribution2,3 | | | | |
|
| General obligation bonds | 2% | | Pollution | 4% |
| |
|
| Revenue bonds | | | Education | 3% |
| |
|
| Other revenue | 44% | | Water & sewer | 3% |
| |
|
| Health | 12% | | Economic development | 3% |
| |
|
| Transportation | 9% | | Housing | 2% |
| |
|
| Electric | 5% | | Tobacco | 2% |
| |
|
| Industrial development | 4% | | Other | 3% |
| |
|
| Special tax | 4% | | | |
| | | |
| | |
| |
| Quality distribution3 | | | | |
|
| AAA | 17% | | BB | 8% |
| |
|
| AA | 7% | | B | 2% |
| |
|
| A | 24% | | Other | 2% |
| |
|
| BBB | 40% | | | |
| | | |
| | |

1 As a percentage of net assets on February 28, 2009, excluding cash and cash equivalents.
2 Sector investing is subject to greater risks than the market as a whole. Because the Fund may focus on particular sectors of the economy, its performance may depend on the performance of those sectors.
3 As a percentage of net assets on February 28, 2009.
| |
| 10 | High Yield Municipal Bond Fund | Semiannual report |
FINANCIAL STATEMENTS
Fund’s investments
Securities owned by the Fund on 2-28-09 (unaudited)
| | | | | | |
| | Interest | | Maturity | Credit | Par value | |
| State, issuer, description | rate | | date | rating (A) | (000) | Value |
|
| Tax-exempt long-term bonds 97.71% | | | | | $131,469,045 |
|
| (Cost $140,633,904) | | | | | | |
| | | | | | | |
| Alabama 0.92% | | | | | | 1,237,000 |
|
| Courtland Industrial Development Board, | | | | | | |
| Rev Ref AMT Intl Paper Co Projs-A | 5.200% | | 06-01-25 | BBB | $2,000 | 1,237,000 |
| | | | | | | |
| California 14.81% | | | | | | 19,932,738 |
|
| California GO Unltd, | | | | | | |
| Daily Kindergarten Univ Ser A-4 (V) | 0.400 | | 05-01-34 | AA | 540 | 540,000 |
|
| California Pollution Control | | | | | | |
| Financing Authority, | | | | | | |
| Rev Solid Waste Disp Browing Ferris | | | | | | |
| Inds Inc | 6.750 | | 09-01-19 | BBB | 1,000 | 960,100 |
|
| California Statewide Communities | | | | | | |
| Development Authority, | | | | | | |
| Rev Thomas Jefferson Sch Law Ser A | 7.250 | | 10-01-38 | BB+ | 1,000 | 738,000 |
|
| California, State of, | | | | | | |
| GO Unltd Ser C–5 (V) | 0.850 | | 07-01-23 | A+ | 2,200 | 2,200,000 |
|
| Foothill Eastern Transportation | | | | | | |
| Corridor Agency, | | | | | | |
| Rev Ref Toll Rd Cap Apprec | Zero | | 01-15-36 | BBB– | 4,000 | 375,200 |
| Rev Toll Rd Cap Apprec Sr Lien | | | | | | |
| Ser 1995A | Zero | | 01-01-18 | AAA | 7,950 | 5,869,485 |
|
| Golden State Tobacco | | | | | | |
| Securitization Corp., | | | | | | |
| Rev Asset Backed Sr Bond | | | | | | |
| Ser 2007 A–1 | 4.500 | | 06-01-27 | BBB | 6,420 | 4,767,428 |
|
| Millbrae, City of, | | | | | | |
| Rev Magnolia of Millbrae Proj Ser | | | | | | |
| 1997A (G) | 7.375 | | 09-01-27 | BB | 1,000 | 817,910 |
|
| San Bernardino, County of, | | | | | | |
| Rev Ref Cert of Part Med Ctr Fin | | | | | | |
| Proj (D) | 5.500 | | 08-01-17 | AA | 2,500 | 2,618,275 |
|
| Southern California Public | | | | | | |
| Power Authority, | | | | | | |
| Rev Natural Gas Proj No. 1 Ser 2007A | 5.250 | | 11-01-26 | A | 1,500 | 1,046,340 |
| | | | | | | |
| Colorado 4.37% | | | | | | 5,885,290 |
|
| Colorado Health Facilities Authority, | | | | | | |
| Rev Christian Living Cmnty Ser A (G) | 9.000 | | 01-01-34 | BB+ | 750 | 749,100 |
| Rev Ref Christian Living Cmnty Proj Ser | | | | | | |
| 2006A (G) | 5.750 | | 01-01-26 | BB+ | 1,000 | 755,220 |
See notes to financial statements
| |
| Semiannual report | High Yield Municipal Bond Fund | 11 |
FINANCIAL STATEMENTS
| | | | | | |
| | Interest | | Maturity | Credit | Par value | |
| State, issuer, description | rate | | date | rating (A) | (000) | Value |
| Colorado (continued) | | | | | | |
|
| E-470 Public Highway Authority, | | | | | | |
| Rev Cap Apprec Sr Ser 2000B | Zero | | 09-01-35 | BBB– | $15,700 | $2,333,020 |
|
| Public Auth for Colorado Energy, | | | | | | |
| Rev Natural Gas | 6.250% | | 11-15-28 | A+ | 2,500 | 2,047,950 |
| | | | | | | |
| Delaware 0.75% | | | | | | 1,012,490 |
|
| Charter MAC Equity Trust, | | | | | | |
| Bond (S) | 6.000 | | 04-30-19 | Aaa | 1,000 | 1,012,490 |
| | | | | | | |
| District of Columbia 1.47% | | | | | | 1,980,420 |
|
| District of Columbia University Rev, | | | | | | |
| Georgetown University | 5.500 | | 04-01-36 | A– | 2,000 | 1,980,420 |
| | | | | | | |
| Florida 16.47% | | | | | | 22,155,331 |
|
| Bonnet Creek Resort Community | | | | | | |
| Development District, | | | | | | |
| Rev Spec Assessment (G) | 7.375 | | 05-01-34 | BB+ | 1,055 | 796,989 |
| Rev Spec Assessment (G) | 7.250 | | 05-01-18 | BB+ | 1,445 | 1,224,204 |
|
| Capital Projects Finance Auth, | | | | | | |
| Rev Student Hsg Cap Projs Ln Prog Ser | | | | | | |
| 2000A (G) | 7.850 | | 08-15-31 | AA | 2,000 | 2,245,680 |
| Rev Student Hsg Cap Projs Ln Prog Ser | | | | | | |
| 2001G (G) | 9.125 | | 10-01-11 | BBB | 985 | 998,238 |
|
| Capital Region Community Development, | | | | | | |
| District FL (G) | 7.000 | | 05-01-39 | BBB– | 1,250 | 872,813 |
|
| Capital Trust Agency, | | | | | | |
| Rev Seminole Tribe Convention Ser | | | | | | |
| 2003A (S) | 8.950 | | 10-01-33 | AAA | 1,000 | 1,259,320 |
|
| Crossings at Fleming Island Community | | | | | | |
| Development District, | | | | | | |
| Rev Ref Spec Assessment Ser | | | | | | |
| 2000C (G) | 7.100 | | 05-01-30 | BBB– | 1,000 | 791,630 |
|
| Florida Municipal Power Agency, | | | | | | |
| Rev All Requirements Pwr Ser A | 5.000 | | 10-01-31 | AAA | 2,000 | 1,921,420 |
|
| Heritage Harbour North | | | | | | |
| Community Development, | | | | | | |
| Rev Spec Assessment Cap Imp (G) | 6.375 | | 05-01-38 | BB+ | 1,250 | 824,588 |
|
| Miami Beach Health Facilities Authority, | | | | | | |
| Rev Ref Hosp Mt Sinai Medical Ctr Ser | | | | | | |
| 2001A | 6.125 | | 11-15-11 | BB | 565 | 526,642 |
|
| Miami-Dade Cnty Aviation, | | | | | | |
| Rev AMT Miami Intl Ser A (D) | 5.000 | | 10-01-38 | A– | 2,000 | 1,554,060 |
|
| Orlando Urban Community | | | | | | |
| Development District, | | | | | | |
| Rev Spec Assessment Cap Imp (G) | 6.000 | | 05-01-20 | BB+ | 645 | 498,508 |
| Rev Spec Assessment Cap Imp (G) | 6.250 | | 05-01-34 | BB+ | 1,000 | 668,150 |
|
| Pensacola Airport, | | | | | | |
| Rev AMT | 6.000 | | 10-01-28 | BBB+ | 2,000 | 1,896,280 |
|
| Poinciana Community | | | | | | |
| Development District, | | | | | | |
| Rev Spec Assessment Ser 2000A (G) | 7.125 | | 05-01-31 | BB+ | 1,300 | 1,124,981 |
|
| Seminole Tribe, | | | | | | |
| Rev Spec Oblig Ser 2007A (S) | 5.250 | | 10-01-27 | BBB | 1,000 | 681,290 |
|
| South Kendall Community | | | | | | |
| Development District, | | | | | | |
| Rev Spec Assessment Ser 2000A (G) | 5.900 | | 05-01-35 | BBB– | 960 | 716,918 |
See notes to financial statements
| |
| 12 | High Yield Municipal Bond Fund | Semiannual report |
FINANCIAL STATEMENTS
| | | | | | |
| | Interest | | Maturity | Credit | Par value | |
| State, issuer, description | rate | | date | rating (A) | (000) | Value |
| Florida (continued) | | | | | | |
|
| Tolomato Community | | | | | | |
| Development District, | | | | | | |
| Rev Spec Assessment (G) | 6.450% | | 05-01-23 | BB+ | $1,000 | $721,300 |
| Rev Spec Assessment (G) | 6.650 | | 05-01-40 | BB+ | 1,000 | 632,980 |
|
| Village Community Development, | | | | | | |
| Spl Assmt Rev (G) | 6.375 | | 05-01-38 | BB | 1,000 | 791,350 |
| Spl Assmt Rev (G) | 6.500 | | 05-01-33 | A | 1,500 | 1,407,990 |
| | | | | | | |
| Georgia 10.52% | | | | | | 14,160,090 |
|
| Atlanta, City of, | | | | | | |
| Rev Tax Alloc Eastside Proj | | | | | | |
| Ser 2005B (G) | 5.600 | | 01-01-30 | BB+ | 1,500 | 1,007,985 |
| Rev Wtr & Waste Wtr (D)(P) | 5.000 | | 11-01-19 | AAA | 10,000 | 10,552,800 |
|
| Marietta Development Auth Rev Ref, | | | | | | |
| Life Univ | 7.000 | | 06-15-30 | Ba3 | 1,500 | 1,069,785 |
|
| Municipal Electric Authority of Georgia, | | | | | | |
| Gen Resolution Projs Sub Ser D | 5.500 | | 01-01-26 | A | 1,500 | 1,529,520 |
| | | | | | | |
| Illinois 2.70% | | | | | | 3,638,190 |
|
| Chicago, City of, | | | | | | |
| GO Tax Alloc Jr Pilsen Redev Ser | | | | | | |
| 2004B (G) | 6.750 | | 06-01-22 | BBB+ | 2,000 | 1,789,340 |
|
| Illinois Development Finance | | | | | | |
| Auth Pollution, | | | | | | |
| Auth Pollution Ctl Rev Ref Ser C1 | 5.950 | | 08-15-26 | BBB– | 1,000 | 839,320 |
|
| Illinois Finance Authority, | | | | | | |
| Rev Rush Univ Med Ctr Oblig Grp-A | 7.250 | | 11-01-38 | A– | 1,000 | 1,009,530 |
| | | | | | | |
| Indiana 0.35% | | | | | | 474,925 |
|
| St. Joseph, County of, | | | | | | |
| Rev Econ Dev Holy Cross Village Notre | | | | | | |
| Dame Proj Ser 2006A (G) | 6.000 | | 05-15-26 | BB+ | 230 | 167,909 |
| Rev Econ Dev Holy Cross Village Notre | | | | | | |
| Dame Proj Ser 2006A (G) | 6.000 | | 05-15-38 | BB+ | 475 | 307,016 |
| | | | | | | |
| Iowa 0.81% | | | | | | 1,093,821 |
|
| Altoona Urban Renewal Rev, | | | | | | |
| Annual Appropriation | 6.000 | | 06-01-34 | BBB+ | 1,000 | 874,690 |
|
| Iowa Finance Authority, | | | | | | |
| Rev Ref Health Care Initiatives Proj | 9.250 | | 07-01-25 | AAA | 185 | 219,131 |
| | | | | | | |
| Kansas 1.13% | | | | | | 1,524,960 |
|
| Burlington Environmental Auth, | | | | | | |
| Rev Ref Kansas City Power & Light (D) | 5.375 | | 09-01-35 | A | 1,500 | 1,524,960 |
| | | | | | | |
| Louisiana 2.34% | | | | | | 3,145,205 |
|
| Louisiana Local | | | | | | |
| Government Environmental, | | | | | | |
| Rev Westlake Chemical Corp | 6.750 | | 11-01-32 | BB+ | 2,000 | 1,317,780 |
|
| St. John the Baptist Parish, | | | | | | |
| Rev Marathon Oil Corp Ser 2007A | 5.125 | | 06-01-37 | BBB+ | 2,500 | 1,827,425 |
| | | | | | | |
| Maryland 1.34% | | | | | | 1,801,850 |
|
| Baltimore, City of, | | | | | | |
| Rev Spec Oblig Ser 2008A (G) | 7.000 | | 09-01-38 | BB+ | 1,000 | 739,380 |
|
| Prince Georges, County of, | | | | | | |
| Rev Spec Tax Dist Victoria Falls Proj (G) | 5.250 | | 07-01-35 | BB+ | 1,000 | 515,630 |
| Spec Oblig National Harbor Proj (G) | 5.200 | | 07-01-34 | BBB | 1,000 | 546,840 |
See notes to financial statements
| |
| Semiannual report | High Yield Municipal Bond Fund | 13 |
FINANCIAL STATEMENTS
| | | | | | |
| | Interest | | Maturity | Credit | Par value | |
| State, issuer, description | rate | | date | rating (A) | (000) | Value |
| Massachusetts 6.17% | | | | | | $8,297,503 |
|
| Massachusetts Development | | | | | | |
| Finance Agency, | | | | | | |
| Haverhill Proj Ser 1998B | 5.500% | | 12-01-19 | BBB | $1,700 | 1,361,258 |
| Rev Linden Ponds Facil Ser 2007A (G) | 5.750 | | 11-15-42 | BB+ | 1,500 | 817,770 |
|
| Massachusetts Health & Educational | | | | | | |
| Facilities Auth, | | | | | | |
| Rev Caregroup Ser 2008E-1 | 5.125 | | 07-01-33 | BBB+ | 1,000 | 748,500 |
| Rev Preref Civic Investments, Inc. | | | | | | |
| Ser 2002B (G) | 9.200 | | 12-15-31 | AA | 2,500 | 3,181,850 |
| Rev Jordan Hosp Ser 2003E | 6.750 | | 10-01-33 | BB– | 1,000 | 716,130 |
|
| Massachusetts State College Bldg Auth, | | | | | | |
| Proj Rev Ser A | 5.500 | | 05-01-49 | A+ | 1,500 | 1,471,995 |
| | | | | | | |
| Minnesota 0.58% | | | | | | 779,170 |
|
| North Oaks Senior Housing, | | | | | | |
| Rev Presbyterian Homes (G) | 6.000 | | 10-01-27 | BB– | 1,000 | 779,170 |
| | | | | | | |
| Mississippi 0.61% | | | | | | 818,140 |
|
| Mississippi Business Finance Corp, | | | | | | |
| Rev Sys Energy Res Inc Proj | 5.875 | | 04-01-22 | BBB | 1,000 | 818,140 |
| | | | | | | |
| Nevada 0.53% | | | | | | 707,620 |
|
| Sparks Tourism Improvement Rev, | | | | | | |
| Sr Sales Tax Ser A (S) | 6.750 | | 06-15-28 | Ba2 | 1,000 | 707,620 |
| | | | | | | |
| New Hampshire 0.87% | | | | | | 1,171,785 |
|
| New Hampshire Business | | | | | | |
| Finance Authority, | | | | | | |
| Rev AMT Public Service Co Proj Ser | | | | | | |
| 2006B (D) | 4.750 | | 05-01-21 | AA– | 1,500 | 1,171,785 |
| | | | | | | |
| New Jersey 2.81% | | | | | | 3,786,297 |
|
| New Jersey Health Care Facilities | | | | | | |
| Financing Auth, | | | | | | |
| Rev Care Institute Inc Cherry Hill | | | | | | |
| Proj (G) | 8.000 | | 07-01-27 | CCC– | 1,250 | 962,200 |
| Rev Ref St Peters Univ Hosp Ser 2000A | 6.875 | | 07-01-30 | BBB– | 1,000 | 909,230 |
|
| New Jersey Tobacco Settlement | | | | | | |
| Financing Corp, | | | | | | |
| Rev Asset Backed Bond | 6.250 | | 06-01-43 | AAA | 1,000 | 1,176,000 |
| Rev Ser 1A | 4.500 | | 06-01-23 | BBB | 995 | 738,867 |
| | | | | | | |
| New York 4.89% | | | | | | 6,576,395 |
|
| Long Island Power Auth, | | | | | | |
| Rev Gen Elec Sys Ser C | 5.250 | | 09-01-29 | A3 | 1,475 | 1,445,957 |
| Rev Ser A | 5.750 | | 04-01-39 | A– | 1,000 | 1,028,710 |
|
| New York City Industrial | | | | | | |
| Development Agency, | | | | | | |
| Rev Liberty 7 World Trade Ctr Ser | | | | | | |
| 2005A (G) | 6.250 | | 03-01-15 | BB+ | 1,500 | 1,274,445 |
|
| New York City Municipal Water | | | | | | |
| Finance Auth, | | | | | | |
| Rev Wtr & Swr Sys Ser F Sub Ser F-2 (V) | 0.450 | | 06-15-35 | AAA | 300 | 300,000 |
|
| New York Liberty Development Corp, | | | | | | |
| Rev Goldman Sachs Group Inc | | | | | | |
| Headquarters | 5.250 | | 10-01-35 | A | 2,500 | 2,065,650 |
|
| Port Auth of New York & New Jersey, | | | | | | |
| Rev Ref Spec Proj KIAC Partners | | | | | | |
| Ser 4 (G) | 6.750 | | 10-01-19 | BBB– | 555 | 461,633 |
See notes to financial statements
| |
| 14 | High Yield Municipal Bond Fund | Semiannual report |
FINANCIAL STATEMENTS
| | | | | | |
| | Interest | | Maturity | Credit | Par value | |
| State, issuer, description | rate | | date | rating (A) | (000) | Value |
| North Carolina 0.78% | | | | | | $1,045,970 |
|
| North Carolina Eastern Municipal | | | | | | |
| Power Agency, | | | | | | |
| Rev Pwr Sys Ser C | 6.750% | | 01-01-24 | BBB+ | $1,000 | 1,045,970 |
| Ohio 3.51% | | | | | | 4,727,814 |
|
| Buckeye Tobacco Settlement | | | | | | |
| Financing Auth, | | | | | | |
| Rev Asset Backed Sr Bond Ser | | | | | | |
| 2007A–2 | 5.125 | | 06-01-24 | BBB | 4,190 | 3,047,094 |
|
| Hickory Chase Community Authority, | | | | | | |
| Rev infrastructure Impt Proj (G) | 7.000 | | 12-01-38 | BB | 1,000 | 699,570 |
|
| Ohio Air Quality Development Authority, | | | | | | |
| Rev Ref Pollution CTL- FirstEnergy | 7.250 | | 11-01-32 | BBB | 1,000 | 981,150 |
| | | | | | | |
| Oklahoma 2.65% | | | | | | 3,562,210 |
|
| Oklahoma Municipal Power Authority, | | | | | | |
| OK MUN PWR-A | 6.000 | | 01-01-38 | A | 1,685 | 1,769,722 |
|
| Tulsa Municipal Airport Trust, | | | | | | |
| Rev American Airlines Proj | 6.250 | | 06-01-20 | B– | 1,375 | 940,898 |
| Rev Ref Ser 2000A | 7.750 | | 06-01-35 | B– | 1,000 | 851,590 |
| | | | | | | |
| Oregon 1.01% | | | | | | 1,363,270 |
|
| Western Generation Agency, | | | | | | |
| Rev Wauna Cogeneration Proj Ser | | | | | | |
| 2006B (G) | 5.000 | | 01-01-14 | BBB– | 1,105 | 953,880 |
| Rev Wauna Cogeneration Proj Ser | | | | | | |
| 2006B (G) | 5.000 | | 01-01-16 | BBB– | 500 | 409,390 |
| | | | | | | |
| Pennsylvania 1.07% | | | | | | 1,441,760 |
|
| Allegheny County Hospital | | | | | | |
| Development Auth, | | | | | | |
| Rev West Penn Hlth Sys Ser 2007A | 5.000 | | 11-15-28 | BB | 1,000 | 562,350 |
|
| Allegheny County Industrial | | | | | | |
| Development Auth, | | | | | | |
| Rev Ref Environmental Imp | 5.500 | | 11-01-16 | BB+ | 1,000 | 879,410 |
| | | | | | | |
| Puerto Rico 2.24% | | | | | | 3,009,265 |
|
| Puerto Rico Aqueduct & Sewer Auth, | | | | | | |
| Rev Sr Lien Ser 2008A | 6.000 | | 07-01-38 | BBB– | 1,000 | 899,940 |
| Rev Sr Lien Ser 2008A (Zero to 7-1-11 | | | | | | |
| then 6.125%) | Zero | | 07-01-24 | BBB– | 1,500 | 1,107,615 |
|
| Puerto Rico Housing Finance | | | | | | |
| Authority Rev, | | | | | | |
| Vivienda Modernization | 4.750 | | 10-01-11 | BBB | 1,000 | 1,001,710 |
| | | | | | | |
| Rhode Island 0.40% | | | | | | 530,906 |
|
| Tiverton, Town of, | | | | | | |
| Rev Spec Oblig Tax Mount Hope Bay | | | | | | |
| Village Ser 2002A (G) | 6.875 | | 05-01-22 | BBB– | 345 | 306,426 |
|
| Tobacco Settlement Financing Corp, | | | | | | |
| Rev Asset Bkd Ser 2002A | 6.000 | | 06-01-23 | BBB | 250 | 224,480 |
| | | | | | | |
| South Carolina 1.08% | | | | | | 1,446,766 |
|
| Lancaster, County of, | | | | | | |
| Rev Assessment Edenmoor Imp Dist | | | | | | |
| Ser 2006A (G) | 5.750 | | 12-01-37 | BB | 985 | 496,686 |
|
| Tobacco Settlement Revenue | | | | | | |
| Management Authority, | | | | | | |
| Rev Ref Tobacco Settlement | 5.000 | | 06-01-18 | BBB | 1,000 | 950,080 |
See notes to financial statements
| |
| Semiannual report | High Yield Municipal Bond Fund | 15 |
FINANCIAL STATEMENTS
| | | | | | |
| | Interest | | Maturity | Credit | Par value | |
| State, issuer, description | rate | | date | rating (A) | (000) | Value |
| Tennessee 0.85% | | | | | | $1,141,170 |
|
| Johnson City Health & Educational | | | | | | |
| Facilities Board, | | | | | | |
| Rev Ref Hosp 1st Mtg States Hlth Ser | | | | | | |
| 2000A MTN | 7.500% | | 07-01-33 | A2 | $1,000 | 1,141,170 |
| | | | | | | |
| Texas 8.63% | | | | | | 11,605,874 |
|
| Bexar County Health Facilities | | | | | | |
| Development Corp, | | | | | | |
| Rev Ref Army Retirement Residence | | | | | | |
| Proj (G) | 6.300 | | 07-01-32 | AA | 150 | 171,533 |
|
| Brazos Harbor Industrial | | | | | | |
| Development Corp, | | | | | | |
| Rev Ref Dow ChemEnvironmental | | | | | | |
| Facs Proj | 5.900 | | 05-01-38 | BBB | 1,500 | 997,545 |
|
| Brazos River Authority, | | | | | | |
| Rev Ref Utilities Co Ser 1999A | 7.700 | | 04-01-33 | CCC | 1,000 | 550,000 |
|
| Guadalupe-blanco River Authority, | | | | | | |
| Rev E I Du Pont De Nemours & Co Proj | 6.400 | | 04-01-26 | A | 1,000 | 930,300 |
|
| Gulf Coast Industrial | | | | | | |
| Development Authority, | | | | | | |
| Rev Solid Waste Disposal Citgo | | | | | | |
| Petroleum Proj | 8.000 | | 04-01-28 | Baa3 | 2,100 | 1,942,605 |
|
| Gulf Coast Waste Disposal Authority, | | | | | | |
| Rev Ref Ser 2002A | 6.100 | | 08-01-24 | BBB | 1,500 | 1,060,200 |
|
| Harris County Health Facilities | | | | | | |
| Development Corp, | | | | | | |
| Rev Ref Memory of Hermann | | | | | | |
| Healthcare Sys B | 7.250 | | 12-01-35 | A | 1,000 | 1,046,090 |
|
| Metro Health Facilities | | | | | | |
| Development Corp, | | | | | | |
| Rev Wilson N Jones Mem Hosp Proj | 7.250 | | 01-01-31 | Ba3 | 1,000 | 771,800 |
|
| Mission Economic Development Corp, | | | | | | |
| Rev Alllied Waste Inc Proj Ser A | 5.200 | | 04-01-18 | BBB | 1,000 | 865,130 |
| Rev Waste Mgmt Inc Proj | 6.000 | | 08-01-20 | BBB | 975 | 933,016 |
|
| North Texas Thruway Auth, | | | | | | |
| Rev Ref Sys First Tier Ser K-2 | 6.000 | | 01-01-38 | A– | 1,000 | 974,500 |
|
| North Texas Tollway Authority Rev, | | | | | | |
| Toll 2nd Tier Ref Ser F | 5.750 | | 01-01-38 | BBB+ | 1,500 | 1,363,155 |
| | | | | | | |
| Wyoming 1.05% | | | | | | 1,414,820 |
|
| Sweetwater County of, | | | | | | |
| Rev Ref Solid Waste Disposal FMC | | | | | | |
| Corp Proj | 5.600 | | 12-01-35 | BBB | 2,000 | 1,414,820 |
|
| |
| Total investments (Cost $140,633,904)† 97.71% | | | | | $131,469,045 |
|
| |
| Other assets and liabilities, net 2.29% | | | | | $3,086,352 |
|
| |
| Total net assets 100.00% | | | | | | $134,555,397 |
|
The percentage shown for each investment category is the total value of that category as a percentage of the net assets of the Fund.
See notes to financial statements
| |
| 16 | High Yield Municipal Bond Fund | Semiannual report |
FINANCIAL STATEMENTS
Notes to Schedule of Investments
AMT Alternative Minimum Tax
MTN Medium-Term Note
(A) Credit ratings are unaudited and are rated by Moody’s Investors Service where Standard & Poor’s ratings are not available unless indicated otherwise.
(D) Bond is insured by one of these companies:
| | |
| Insurance coverage | As a % of total investments | |
| |
| CIFG Holding Limited | 2.28 | |
| Financial Guaranty Insurance Company | 1.16 | |
| Financial Security Assurance, Inc. | 8.03 | |
| Municipal Bond Insurance Association | 2.88 | |
(G) Security rated internally by John Hancock Advisers, LLC. Unaudited.
(P) Variable rate obligation. The coupon rate shown represents the rate at period end.
(S) These securities are exempt from registration under Rule 144A of the Securities Act of 1933. Such securities may be resold, normally to qualified institutional buyers, in transactions exempt from registration.
(V) Variable rate demand notes are securities whose interest rates are reset periodically at market levels. These securities are often payable on demand and are shown at their current rates as of February 28, 2009.
† At February 28, 2009, the aggregate cost of investment securities for federal income tax purposes was $140,020,934. Net unrealized depreciation aggregated $8,551,889, of which $5,634,223 related to appreciated investment securities and $14,186,112 related to depreciated investment securities.
See notes to financial statements
| |
| Semiannual report | High Yield Municipal Bond Fund | 17 |
FINANCIAL STATEMENTS
Financial statements
Statement of assets and liabilities 2-28-09 (unaudited)
This Statement of Assets and Liabilities is the Fund’s balance sheet. It shows the value of what the Fund owns, is due and owes. You’ll also find the net asset value and the maximum offering price per share.
| |
| Assets | |
|
| Investments at value (Cost $140,633,904) | $131,469,045 |
| Cash | 69,128 |
| Receivable for shares sold | 1,987,905 |
| Interest receivable | 2,404,116 |
| Receivable from affiliates | 20,064 |
| | |
| Total assets | 135,950,258 |
| |
| Liabilities | |
|
| Payable for investments purchased | 1,079,274 |
| Payable for shares repurchased | 171,201 |
| Dividends payable | 102 |
| Payable to affiliates | |
| Management fees | 57,761 |
| Distribution and service fees | 39,597 |
| Other | 27,816 |
| Other payables and accrued expenses | 19,110 |
| | |
| Total liabilities | 1,394,861 |
| |
| Net assets | |
|
| Capital paid-in | 160,174,242 |
| Accumulated net realized loss on investments | (16,741,397) |
| Net unrealized depreciation of investments | (9,164,859) |
| Accumulated net investment income | 287,411 |
| | |
| Net assets | $134,555,397 |
| |
| Net asset value per share | |
|
| Based on net asset values and shares outstanding — the Fund has an | |
| unlimited number of shares authorized with no par value | |
| Class A ($104,320,066 ÷ 14,908,208 shares) | $7.00 |
| Class B ($7,095,835 ÷ 1,014,075 shares)1 | $7.00 |
| Class C ($23,139,496 ÷ 3,307,078 shares)1 | $7.00 |
| |
| Maximum offering price per share | |
|
| Class A ($7.00 ÷ 95.5%)2 | $7.33 |
1 Redemption price is equal to net asset value less any applicable contingent deferred sales charge.
2 On single retail sales of less than $100,000. On sales of $100,000 or more and on group sales the offering price is reduced.
See notes to financial statements
| |
| 18 | High Yield Municipal Bond Fund | Semiannual report |
FINANCIAL STATEMENTS
Statement of operations For the period ended 2-28-09 (unaudited)1
This Statement of Operations summarizes the Fund’s investment income earned and expenses incurred in operating the Fund. It also shows net gains (losses) for the period stated.
| |
| Investment income | |
|
| Interest | $4,218,567 |
| | |
| Total investment income | 4,218,567 |
|
| Expenses | |
|
| Investment management fees (Note 5) | 349,694 |
| Distribution and service fees (Note 5) | 248,793 |
| Transfer agent fees (Note 5) | 34,968 |
| Accounting and legal services fees (Note 5) | 8,473 |
| Professional fees | 43,376 |
| Printing fees | 22,021 |
| Registration fees | 20,803 |
| Custodian fees | 19,940 |
| Trustees’ fees | 1,682 |
| Miscellaneous | 18,898 |
| | |
| Total expenses | 768,648 |
| Less expense reductions (Note 5) | (147) |
| | |
| Net expenses | 768,501 |
| Net investment income | 3,450,066 |
| |
| Realized and unrealized gain (loss) | |
|
| Net realized loss on investments | (5,142,455) |
| Change in net unrealized appreciation (depreciation) of investments | (10,708,069) |
| | |
| Net realized and unrealized loss | (15,850,524) |
| | |
| Decrease in net assets from operations | ($12,400,458) |
1 Semiannual period from 9-1-08 to 2-28-09. Unaudited.
See notes to financial statements
| |
| Semiannual report | High Yield Municipal Bond Fund | 19 |
FINANCIAL STATEMENTS
Statements of changes in net assets
These Statements of Changes in Net Assets show how the value of the Fund’s net assets has changed during the last two periods. The difference reflects earnings less expenses, any investment gains and losses, distributions, if any, paid to shareholders and the net of Fund share transactions.
| | |
| | Year | Period |
| | ended | ended |
| | 8-31-08 | 2-28-091 |
|
| Increase (decrease) in net assets | | |
|
| From operations | | |
| Net investment income | $4,765,634 | $3,450,066 |
| Net realized loss | (2,343,261) | (5,142,455) |
| Change in net unrealized appreciation (depreciation) | (1,963,817) | (10,708,069) |
| | | |
| Increase (decrease) in net assets resulting from operations | 458,556 | (12,400,458) |
| | | |
| Distributions to shareholders | | |
| From net investment income | | |
| Class A | (3,699,573) | (2,485,849) |
| Class B | (387,707) | (174,088) |
| Class C | (626,760) | (498,644) |
| | (4,714,040) | (3,158,581) |
| From Fund share transactions (Note 6) | 38,375,589 | 25,471,606 |
| | | |
| Total increase | 34,120,105 | 9,912,567 |
|
| Net assets | | |
|
| Beginning of period | 90,522,725 | 124,642,830 |
| End of period2 | $124,642,830 | $134,555,397 |
1 Semiannual period from 9-1-08 to 2-28-09. Unaudited.
2 Includes accumulated (distributions in excess of) net investment income of ($4,074) and $287,411, respectively.
See notes to financial statements
| |
| 20 | High Yield Municipal Bond Fund | Semiannual report |
FINANCIAL STATEMENTS
Financial highlights
The Financial Highlights show how the Fund’s net asset value for a share has changed since the end of the previous period.
| | | | | | |
| CLASS A SHARES Period ended | 8-31-041 | 8-31-051 | 8-31-06 | 8-31-07 | 8-31-08 | 2-28-092 |
|
| Per share operating performance | | | | | | |
|
| Net asset value, beginning of period | $8.14 | $8.27 | $8.62 | $8.68 | $8.33 | $7.99 |
| Net investment income3 | 0.47 | 0.43 | 0.42 | 0.41 | 0.41 | 0.22 |
| Net realized and unrealized gain | | | | | | |
| (loss) on investments | 0.12 | 0.35 | 0.05 | (0.35) | (0.34) | (1.01) |
| Total from investment operations | 0.59 | 0.78 | 0.47 | 0.06 | 0.07 | (0.79) |
| Less distributions | | | | | | |
| From net investment income | (0.46) | (0.43) | (0.41) | (0.41) | (0.41) | (0.20) |
| Net asset value, end of period | $8.27 | $8.62 | $8.68 | $8.33 | $7.99 | $7.00 |
| Total return (%)4 | 7.415 | 9.64 | 5.615 | 0.605 | 0.815 | (9.87)5,6 |
|
| Ratios and supplemental data | | | | | | |
|
| Net assets, end of period | | | | | | |
| (in millions) | $69 | $72 | $72 | $71 | $94 | $104 |
| Ratios (as a percentage | | | | | | |
| of average net assets): | | | | | | |
| Expenses before reductions | 1.10 | 1.14 | 1.09 | 1.13 | 1.09 | 1.157 |
| Interest and fees8 | — | — | — | 0.20 | 0.16 | — |
| Expenses net of all fee waivers | 1.09 | 1.14 | 1.09 | 1.33 | 1.25 | 1.157 |
| Expenses net of all fee waivers | | | | | | |
| and credits | 1.09 | 1.14 | 1.09 | 1.33 | 1.25 | 1.157 |
| Net investment income | 5.67 | 5.09 | 4.71 | 4.77 | 4.85 | 6.137 |
| Portfolio turnover (%) | 57 | 65 | 52 | 63 | 75 | 41 |
| |
1 Audited by previous Independent Registered Public Accounting Firm.
2 Semiannual period from 9-1-08 to 2-28-09. Unaudited.
3 Based on the average of the shares outstanding.
4 Assumes dividend reinvestment and does not reflect the effect of sales charges.
5 Total returns would have been lower had certain expenses not been reduced during the periods shown.
6 Not annualized.
7 Annualized.
8 Interest expenses and fees are related to the Fund’s investment in inverse floater rate investments. Under accounting rules, the Fund recognizes additional income in an amount equal to these expenses.
See notes to financial statements
| |
| Semiannual report | High Yield Municipal Bond Fund | 21 |
FINANCIAL STATEMENTS
| | | | | | |
| CLASS B SHARES Period ended | 8-31-041 | 8-31-051 | 8-31-06 | 8-31-07 | 8-31-08 | 2-28-092 |
|
| Per share operating performance | | | | | | |
|
| Net asset value, beginning of period | $8.14 | $8.27 | $8.62 | $8.68 | $8.33 | $7.99 |
| Net investment income3 | 0.41 | 0.37 | 0.36 | 0.35 | 0.35 | 0.19 |
| Net realized and unrealized gain | | | | | | |
| (loss) on investments | 0.12 | 0.35 | 0.04 | (0.36) | (0.34) | (1.01) |
| Total from investment operations | 0.53 | 0.72 | 0.40 | (0.01) | 0.01 | (0.82) |
| Less distributions | | | | | | |
| From net investment income | (0.40) | (0.37) | (0.34) | (0.34) | (0.35) | (0.17) |
| Net asset value, end of period | $8.27 | $8.62 | $8.68 | $8.33 | $7.99 | $7.00 |
| Total return (%)4 | 6.625 | 8.84 | 4.835 | (0.15)5 | 0.065 | (10.21)5,6 |
|
| Ratios and supplemental data | | | | | | |
|
| Net assets, end of period | | | | | | |
| (in millions) | $31 | $24 | $16 | $11 | $8 | $7 |
| Ratios (as a percentage | | | | | | |
| of average net assets): | | | | | | |
| Expenses before reductions | 1.84 | 1.87 | 1.84 | 1.88 | 1.84 | 1.907 |
| Interest and fees8 | — | — | — | 0.20 | 0.16 | — |
| Expenses net of all fee waivers | 1.83 | 1.87 | 1.84 | 2.08 | 2.00 | 1.907 |
| Expenses net of all fee waivers | | | | | | |
| and credits | 1.83 | 1.87 | 1.84 | 2.08 | 2.00 | 1.907 |
| Net investment income | 4.93 | 4.35 | 4.11 | 4.05 | 4.09 | 5.387 |
| Portfolio turnover (%) | 57 | 65 | 52 | 63 | 75 | 41 |
| |
1 Audited by previous Independent Registered Public Accounting Firm.
2 Semiannual period from 9-1-08 to 2-28-09. Unaudited.
3 Based on the average of the shares outstanding.
4 Assumes dividend reinvestment and does not reflect the effect of sales charges.
5 Total returns would have been lower had certain expenses not been reduced during the periods shown.
6 Not annualized.
7 Annualized.
8 Interest expenses and fees are related to the Fund’s investment in inverse floater rate investments. Under accounting rules, the Fund recognizes additional income in an amount equal to these expenses.
See notes to financial statements
| |
| 22 | High Yield Municipal Bond Fund | Semiannual report |
FINANCIAL STATEMENTS
| | | | | | |
| CLASS C SHARES Period ended | 8-31-041 | 8-31-051 | 8-31-06 | 8-31-07 | 8-31-08 | 2-28-092 |
|
| Per share operating performance | | | | | | |
|
| Net asset value, beginning of period | $8.14 | $8.27 | $8.62 | $8.68 | $8.33 | $7.99 |
| Net investment income3 | 0.40 | 0.36 | 0.35 | 0.34 | 0.34 | 0.19 |
| Net realized and unrealized gain | | | | | | |
| (loss) on investments | 0.13 | 0.36 | 0.05 | (0.35) | (0.33) | (1.01) |
| Total from investment operations | 0.53 | 0.72 | 0.40 | (0.01) | 0.01 | (0.82) |
| Less distributions | | | | | | |
| From net investment income | (0.40) | (0.37) | (0.34) | (0.34) | (0.35) | (0.17) |
| Net asset value, end of period | $8.27 | $8.62 | $8.68 | $8.33 | $7.99 | $7.00 |
| Total return (%)4 | 6.615 | 8.82 | 4.835 | (0.15)5 | 0.065 | (10.21)5,6 |
|
| Ratios and supplemental data | | | | | | |
|
| Net assets, end of period | | | | | | |
| (in millions) | $8 | $8 | $9 | $9 | $23 | $23 |
| Ratios (as a percentage | | | | | | |
| of average net assets): | | | | | | |
| Expenses before reductions | 1.84 | 1.89 | 1.84 | 1.88 | 1.84 | 1.907 |
| Interest and fees8 | — | — | — | 0.20 | 0.16 | — |
| Expenses net of all fee waivers | 1.83 | 1.89 | 1.84 | 2.08 | 2.00 | 1.907 |
| Expenses net of all fee waivers | | | | | | |
| and credits | 1.83 | 1.89 | 1.84 | 2.08 | 2.00 | 1.907 |
| Net investment income | 4.88 | 4.33 | 4.09 | 4.02 | 4.11 | 5.367 |
| Portfolio turnover (%) | 57 | 65 | 52 | 63 | 75 | 41 |
| |
1 Audited by previous Independent Registered Public Accounting Firm.
2 Semiannual period from 9-1-08 to 2-28-09. Unaudited.
3 Based on the average of the shares outstanding.
4 Assumes dividend reinvestment and does not reflect the effect of sales charges.
5 Total returns would have been lower had certain expenses not been reduced during the periods shown.
6 Not annualized.
7 Annualized.
8 Interest expenses and fees are related to the Fund’s investment in inverse floater rate investments. Under accounting rules, the Fund recognizes additional income in an amount equal to these expenses.
See notes to financial statements
| |
| Semiannual report | High Yield Municipal Bond Fund | 23 |
Notes to financial statements (unaudited)
Note 1
Organization
John Hancock High Yield Municipal Bond Fund (the Fund) is a non-diversified series of John Hancock Municipal Securities Trust (the Trust), an open-end management investment company registered under the Investment Company Act of 1940, as amended (the 1940 Act). The investment objective of the Fund is to seek a high level of current income that is largely exempt from federal income tax, consistent with preservation of capital.
The Trustees have authorized the issuance of multiple classes of shares of the Fund, designated as Class A, Class B and Class C shares. The shares of each class represent an interest in the same portfolio of investments of the Fund and have equal rights as to voting, redemptions, dividends and liquidation, except that certain expenses, subject to the approval of the Trustees, may be applied differently to each class of shares in accordance with current regulations of the Securities and Exchange Commission and the Internal Revenue Service. Shareholders of a class that bears distribution and service expenses under the terms of a distribution plan have exclusive voting rights to that distribution plan. Class B shares will convert to Class A shares eight years after purchase.
Note 2
Significant accounting policies
The financial statements have been prepared in conformity with accounting principles generally accepted in the United States of America, which require management to make certain estimates and assumptions at the date of the financial statements. Actual results could differ from those estimates. The following summarizes the significant accounting policies of the Fund:
Security valuation
Investments are stated at value as of the close of the regular trading on New York Stock Exchange (NYSE), normally at 4:00 P.M., Eastern Time. Debt obligations are valued based on the evaluated prices provided by an independent pricing service, which utilizes both dealer-supplied and electronic data processing techniques, which take into account factors such as institutional-size trading in similar groups of securities, yield, quality, coupon rate, maturity, type of issue, trading characteristics and other market data. Securities traded only in the over-the-counter market are valued at the last bid price quoted by brokers making markets in the securities at the close of trading. Debt obligations, for which there are no prices available from an independent pricing service, are valued based on broker quotes or fair valued as described below. Short-term debt investments that have a remaining maturity of 60 days or less are valued at amortized cost, and thereafter assume a constant amortization to maturity of any discount or premium, which approximates market value.
Other portfolio securities and assets for which market quotations are not readily available are valued at fair value as determined in good faith by the Fund’s Pricing Committee in accordance with procedures adopted by the Board of Trustees.
Valuations change in response to many factors including tax receipts and budget disbursements of the municipalities, general economic conditions, interest rates, investor perceptions and market liquidity.
The Fund adopted Statement of Financial Accounting Standards No. 157 (FAS 157), Fair Value Measurements, effective with the beginning of the Fund’s fiscal year. FAS 157 established a three-tier hierarchy to prioritize the assumptions, referred to as inputs, used in valuation techniques to measure fair value. The three-tier hierarchy of inputs is summarized in the three broad levels listed below:
Level 1 – Quoted prices in active markets for identical securities.
Level 2 – Prices determined using other significant observable inputs. Observable inputs are inputs that other market participants would use in pricing a security. These may include quoted prices for similar
| |
| 24 | High Yield Municipal Bond Fund | Semiannual report |
securities, interest rates, prepayment speeds, credit risk and others.
Level 3 – Prices determined using significant unobservable inputs. In situations where quoted prices or observable inputs are unavailable, such as when there is little or no market activity for an investment, unobservable inputs may be used. Unobservable inputs reflect the Fund’s own assumptions about the factors that market participants would use in pricing an investment and would be based on the best information available.
The inputs or methodology used for valuing securities are not necessarily an indication of the risk associated with investing in those securities.
The following is a summary of the inputs used to value the Fund’s net assets as of February 28, 2009:
| | |
| | INVESTMENTS IN | OTHER FINANCIAL |
| VALUATION INPUTS | SECURITIES | INSTRUMENTS* |
|
| Level 1 — Quoted Prices | — | — |
| Level 2 — Other Significant Observable Inputs | $131,469,045 | — |
| Level 3 — Significant Unobservable Inputs | — | — |
| Total | $131,469,045 | — |
*Other financial instruments are derivative instruments not reflected in the Portfolio of Investments, such as futures, forwards and swap contracts, which are valued at the unrealized appreciation/ depreciation on the instrument.
Security transactions and related
investment income
Investment security transactions are accounted for on a trade date plus one basis for daily net asset value calculations. However, for financial reporting purposes, investment transactions are reported on trade date. Interest income is accrued as earned. Dividend income and distributions to shareholders are recorded on the ex-dividend date. Discounts/premiums are accreted/amortized for financial reporting purposes. Non-cash dividends are recorded at the fair market value of the securities received. Debt obligations may be placed in a non-accrual status and related interest income may be reduced by ceasing current accruals and writing off interest receivables when the collection of all or a portion of interest has become doubtful, based upon consistently applied procedures. The Fund use identified cost method for determining realized gain or loss on investments for both financial statement and federal income tax reporting purposes.
Class allocations
Income, common expenses and realized and unrealized gains (losses) are determined at the fund level and allocated daily to each class of shares based on the appropriate net asset value of the respective classes. Distribution and service fees, if any, and transfer agent fees for Class A, Class B and Class C shares are calculated daily at the class level based on the appropriate net asset value of each class and the specific expense rate(s) applicable to each class.
Expenses
The majority of expenses are directly identifi-able to an individual fund. Trust expenses that are not readily identifiable to a specific fund are allocated in such a manner as deemed equitable, taking into consideration, among other things, the nature and type of expense and the relative size of the funds. Expense estimates are accrued in the period to which they relate and adjustments are made when actual amounts are known.
Bank borrowings
The Fund is permitted to have bank borrowings for temporary or emergency purposes, including the meeting of redemption requests that otherwise might require the untimely disposition of securities. The Fund has entered into a line of credit agreement with The Bank of New York Mellon (BNYM), the Swing Line Lender and Administrative Agent. This agreement enables the Fund to participate, with other funds managed by John Hancock Advisers LLC (the Adviser), an indirect wholly
| |
| Semiannual report | High Yield Municipal Bond Fund | 25 |
owned subsidiary of Manulife Financial Corporation (MFC), in an unsecured line of credit with BNYM, which permits borrowings of up to $150 million, collectively. Interest is charged to each fund based on its borrowing. In addition, a commitment fee is charged to each fund based on the average daily unused portion of the line of credit and is allocated among the participating funds. The Fund had no outstanding borrowings under the line of credit for the period ended February 28, 2009.
Pursuant to the custodian agreement, the Custodian may, in its discretion, advance funds to the Fund to make properly authorized payments. When such payments result in an overdraft, the Fund is obligated to repay the Custodian for any overdraft together with interest due thereon. The Custodian has a lien, security interest or security entitlement in any Fund property, that is not segregated, to the maximum extent permitted by law to the extent of any overdraft.
Federal income taxes
The Fund qualifies as a regulated investment company by complying with the applicable provisions of the Internal Revenue Code and will not be subject to federal income tax on taxable income that is distributed to shareholders. Therefore, no federal income tax provision is required.
For federal income tax purposes, the Fund has $10,064,061 of a capital loss carryforward available, to the extent provided by regulations, to offset future net realized capital gains. To the extent that such carryforward is used by the Fund, no capital gain distributions will be made. The loss carryforwards expire as follows: August 31, 2010 — $1,227,272, August 31, 2011 — $2,540,698, August 31, 2012 —$2,816,241, August 31, 2013 — $1,681,342, August 31, 2014 — $119,574, August 31, 2015 — $1,176,656 and August 31, 2016 —$502,278. Net capital losses of $1,816,118 that are attributable to security transactions incurred after October 31, 2007, are treated as arising on September 1, 2008, the first day of the Fund’s next taxable year.
As of February 28, 2009, the Fund had no uncertain tax positions that would require financial statement recognition, de-recognition, or disclosure. Each of the Fund’s federal tax returns filed in the 3-year period ended August 31, 2008 remains subject to examination by the Internal Revenue Service.
Distribution of income and gains
The Fund records distributions to shareholders from net investment income and net realized gains, if any, on the ex-dividend date. The Fund generally declares dividends daily and pays them monthly. Capital gains, if any, are distributed annually. During the year ended August 31, 2008, the tax character of distributions paid was as follows: ordinary income $85,708 and tax exempt income $4,648,369. Distributions paid by the Fund with respect to each class of shares are calculated in the same manner, at the same time and are in the same amount, except for the effect of expenses that may be applied differently to each class.
Such distributions, on a tax basis, are determined in conformity with income tax regulations, which may differ from accounting principles generally accepted in the United States of America. Distributions in excess of tax basis earnings and profits, if any, are reported in the Fund’s financial statements as a return of capital.
New accounting pronouncement
In March 2008, FASB No. 161 (FAS 161), Disclosures about Derivative Instruments and Hedging Activities, an amendment of FASB Statement No. 133 (FAS 133), was issued and is effective for fiscal years and interim periods beginning after November 15, 2008. FAS 161 amends and expands the disclosure requirements of FAS 133 in order to provide financial statement users an understanding of a company’s use of derivative instruments, how derivative instruments are accounted for under FAS 133 and related interpretations and how these instruments affect a company’s financial position, performance, and cash flows. FAS 161 requires companies to disclose information detailing the objectives and strategies for using derivative instruments, the level of derivative activity entered into by the company, and any credit risk-related
| |
| 26 | High Yield Municipal Bond Fund | Semiannual report |
contingent features of the agreements. As of February 28, 2009, management does not believe that the adoption of FAS 161 will have a material impact on the amounts reported in the financial statements.
Note 3
Risk and uncertainties
Investing in high yield securities
Investing in high yield securities may involve greater risks and considerations not typically associated with investing in U.S. government bonds and other high quality fixed-income securities. These securities are non-investment grade securities, often referred to as “junk bonds.” Economic downturns may disrupt the high yield market and impair the ability of issuers to repay principal and interest. Also, an increase in interest rates would likely have an adverse impact on the value of such obligations. Moreover, high yield securities may be less liquid due to the extent that there is no established retail secondary market and because of a decline in the value of such securities. The Fund may not be able to sell bonds at desired prices and that large purchases or sales of certain high-yield bond issues may cause substantial fluctuations in share price, yield and total return.
State concentration risk
The Fund invests mainly in bonds from a single state and its performance is affected by local, state and regional factors. The risks may include economic or policy changes, erosion of the tax base, and state legislative changes (especially those regarding budgeting and taxes). Although the Fund invests mainly in investment-grade bonds, which generally have a relatively low level of credit risk, any factors that might lead to a credit decline statewide would be likely to cause widespread decline in the credit quality of the Fund’s holdings.
Insurance concentration risk
The Fund may hold insured municipal obligations which are insured as to their scheduled payment of principal and interest under an insurance policy obtained by the issuer or underwriter of the obligation at the time of its original issuance. Since there are a limited number of municipal obligation insurers, a Fund may have a concentration of investments covered by one insurer. Accordingly, the concentration may make the Fund’s value more volatile and investment values may rise and fall more rapidly. In addition, the credit quality of companies which provide the insurance may affect the value of those securities and insurance does not guarantee the market value of the insured obligation.
Municipal bond risk
The Fund generally invests in general obligation or revenue municipal bonds. The bonds are backed by the municipal issuer’s have the risk that the issuer’s credit quality will decline. General obligation bonds are backed by the municipal issuer’s ability to levy taxes. In extreme cases, a municipal issuer could declare bankruptcy or otherwise become unable to honor its commitments to bondholders which may be caused by many reasons, ranging from including fiscal mismanagement and erosion of the tax base. Revenue bonds are backed only by income associated with a specific facility. Any circumstance that reduces or threatens the economic viability of that particular facility can affect the bond’s credit quality.
Fixed income risk
Fixed income securities are subject to credit and interest rate risk and involve some risk of default in connection with principal and interest payments.
Note 4
Guarantees and indemnifications
Under the Fund’s organizational documents, its Officers and Trustees are indemnified against certain liability arising out of the performance of their duties to the Fund. Additionally, in the normal course of business, the Fund enters into contracts with service providers that contain general indemnification clauses. The Fund’s maximum exposure under these arrangements is unknown, as this would involve future claims that may be made against the Fund that have not yet occurred.
Note 5
Management fee and transactions with
affiliates and others
The Fund has an investment management contract with the Adviser. Under the investment management contract, the Fund pays a monthly
| |
| Semiannual report | High Yield Municipal Bond Fund | 27 |
management fee to the Adviser equivalent, on an annual basis, to the sum of: (a) 0.625% of the first $75,000,000 of the Fund’s average daily net asset value, (b) 0.5625% of the next 75,000,000 and (c) 0.50% of the Fund’s average daily net asset value in excess of $150,000,000. The effective rate for the period ended February 28, 2009 is 0.60% of the Fund’s average daily net asset value. The Fund has a subadvisory agreement with MFC Global Investment Management (U.S.), LLC, a subsidiary of John Hancock Financial Services, Inc. The Fund is not responsible for payment of subadvisory fees.
The Fund has a Distribution Agreement with John Hancock Funds, LLC (JH Funds), a wholly owned subsidiary of the Adviser. The Fund has adopted Distribution Plans with respect to Class A, Class B and Class C, pursuant to Rule 12b-1 under the 1940 Act, to pay JH Funds for the services it provides as distributor of shares of the Fund. Accordingly, the Fund makes monthly payments to JH Funds at an annual rate not to exceed 0.25%, 1.00% and 1.00% of average daily net asset value of Class A, Class B and Class C, respectively. A maximum of 0.25% of such payments may be service fees, as defined by the Conduct Rules of the Financial Industry Regulatory Authority (formerly the National Association of Securities Dealers). Under the Conduct Rules, curtailment of a portion of the Fund’s 12b-1 payments could occur under certain circumstances.
The Fund has an agreement with its custodian bank, under which custody fees are reduced by balance credits applied during the period. Accordingly, the expense reductions related to custody fee offsets amounted to $133.
Class A shares are assessed up-front sales charges. During the period ended February 28, 2009, JH Funds received net up-front sales charges of $302,415 with regard to sales of Class A shares. Of this amount, $35,146 was retained and used for printing prospectuses, advertising, sales literature and other purposes, $267,241 was paid as sales commissions to unrelated broker-dealers and $28 was paid as sales commissions to sales personnel of Signator Investors, Inc. (Signator Investors), a related broker-dealer. The Adviser’s indirect parent, John Hancock Life Insurance Company (JHLICO), is the indirect sole shareholder of Signator Investors.
Class B shares that are redeemed within six years of purchase are subject to a contingent deferred sales charge (CDSC) at declining rates, beginning at 5.00% of the lesser of the current market value at the time of redemption or the original purchase cost of the shares being redeemed. Class C shares that are redeemed within one year of purchase are subject to a CDSC at a rate of 1.00% of the lesser of the current market value at the time of redemption or the original purchase cost of the shares being redeemed. Proceeds from the CDSCs are paid to JH Funds and are used in whole or in part to defray its expenses for providing distribution-related services to the Fund in connection with the sale of Class B and Class C shares. During the period ended February 28, 2009, CDSCs received by JH Funds amounted to $174,821 for Class B shares and $30,231 for Class C shares.
The Fund has a transfer agent agreement with John Hancock Signature Services, Inc. (Signature Services), an indirect subsidiary of JHLICO. The transfer agent fees are made up of three components:
• The Fund pays a monthly transfer agent fee at an annual rate of 0.01% for all classes based on each class’s average daily net assets.
• All classes of the Fund paid a monthly fee based on an annual rate of $17.50 per shareholder account.
• In addition, Signature Services is reimbursed for certain out-of-pocket expenses.
The Fund receives earnings credits from its transfer agent as a result of uninvested cash balances. These credits are used to reduce a portion of the Fund’s transfer agent fees and out-of-pocket expenses. During the period ended February 28, 2009, the Fund’s transfer agent fees and out-of-pocket expenses were reduced by $14 for transfer agent credits earned.
Class level expenses for the period ended February 28, 2009 were as follows:
| | | |
| | Distribution and | Transfer | |
| Share class | service fees | agent fees | |
| |
| Class A | $110,520 | $26,638 | |
| Class B | 35,680 | 2,150 | |
| Class C | 102,593 | 6,180 | |
| Total | $248,793 | $34,968 | |
| |
| 28 | High Yield Municipal Bond Fund | Semiannual report |
The Fund has an agreement with the Adviser and affiliates to perform necessary tax, accounting, compliance, legal and other administrative services for the Fund. The compensation for the year amounted to $8,473 with an effective rate of 0.01% of the Fund’s average daily net asset value.
Mr. James R. Boyle is Chairman of the Adviser, as well as affiliated Trustee of the Fund, and is compensated by the Adviser and/or its affiliates. The compensation of unaffiliated Trustees is borne by the Fund. The unaffiliated Trustees may elect to defer, for tax purposes, their receipt of this compensation under the John Hancock Group of Funds Deferred Compensation Plan. The Fund makes investments into other John Hancock funds, as applicable, to cover its liability for the deferred compensation. Investments to cover the Fund’s deferred compensation liability are recorded on the Fund’s books as an other asset. The deferred compensation liability and the related other asset are always equal and are marked to market on a periodic basis to reflect any income earned by the investments, as well as any unrealized gains or losses. The Deferred Compensation Plan investments had no impact on the operations of the Fund.
Note 6
Fund share transactions
This listing illustrates the number of Fund shares sold, reinvested and repurchased during the year ended August 31, 2008, and the period ended February 28, 2009, along with the corresponding dollar value.
| | | | |
| | | Year ended 8-31-08 | Period ended 2-28-091 |
| | Shares | Amount | Shares | Amount |
| Class A shares | | | | |
|
| Sold | 4,915,022 | $39,839,099 | 4,992,692 | $35,178,893 |
| Distributions reinvested | 250,989 | 2,041,557 | 235,573 | 1,648,583 |
| Repurchased | (1,894,507) | (15,471,342) | (2,055,165) | (14,592,468) |
| Net increase | 3,271,504 | $26,409,314 | 3,173,100 | $22,235,008 |
| |
| Class B shares | | | | |
|
| Sold | 211,312 | $1,716,618 | 164,058 | $1,167,573 |
| Distributions reinvested | 21,935 | 179,122 | 12,012 | 84,105 |
| Repurchased | (458,316) | (3,769,732) | (210,611) | (1,490,732) |
| Net decrease | (225,069) | ($1,873,992) | (34,541) | ($239,054) |
| |
| Class C shares | | | | |
|
| Sold | 2,153,756 | $17,641,134 | 1,254,524 | $8,883,863 |
| Distributions reinvested | 41,481 | 336,595 | 44,804 | 313,297 |
| Repurchased | (502,921) | (4,137,462) | (812,538) | (5,721,508) |
| Net increase | 1,692,316 | $13,840,267 | 486,790 | $3,475,652 |
| |
| Net increase | 4,738,751 | $38,375,589 | 3,625,349 | $25,471,606 |
|
1Semiannual period from 9-1-08 to 2-28-09. Unaudited.
Note 7
Purchase and sale of securities
Purchases and proceeds from sales or maturities of securities, including purchase and sales of variable rate demand notes of $10,390,000 and $10,590,000, respectively, during the period ended February 28, 2009, aggregated $72,286,792 and $48,324,992, respectively. Short-term securities are excluded from these amounts.
Note 8
Subsequent event
On March 12, 2009, the Board of Trustees approved to change the Fund’s fiscal year end from August 31 to May 31.
| |
| Semiannual report | High Yield Municipal Bond Fund | 29 |
Board Consideration of and
Continuation of Investment Advisory
Agreement and Subadvisory
Agreement: John Hancock
High Yield Municipal Bond Fund
The Investment Company Act of 1940 (the 1940 Act) requires the Board of Trustees (the Board) of John Hancock Tax-Exempt Series Fund (the Trust), including a majority of the Trustees who have no direct or indirect interest in the investment advisory agreement and are not “interested persons” of the Trust, as defined in the 1940 Act (the Independent Trustees), annually to meet in person to review and consider the continuation of: (i) the investment advisory agreement (the Advisory Agreement) with John Hancock Advisers, LLC (the Adviser) and (ii) the investment subadvisory agreement (the Subadvisory Agreement) with MFC Global Investment Management (U.S.), LLC (the Subadviser) for the John Hancock High Yield Municipal Bond Fund (the Fund). The Advisory Agreement and the Subadvisory Agreement are collectively referred to as the Advisory Agreements.
At meetings held on May 5–6 and June 9–10, 2008, the Board considered the factors and reached the conclusions described below relating to the selection of the Adviser and Subadviser and the continuation of the Advisory Agreements. During such meetings, the Board’s Contracts/Operations Committee and the Independent Trustees also met in executive sessions with their independent legal counsel.
In evaluating the Advisory Agreements, the Board, including the Contracts/Operations Committee and its Independent Trustees, reviewed a broad range of information requested for this purpose. This information included: (i) the investment performance of the Fund relative to a category of relevant funds (the Category) and a peer group of comparable funds (the Peer Group). The funds within each Category and Peer Group were selected by Morningstar Inc. (Morningstar), an independent provider of investment company data. Data covered a range of periods ended December 31, 2007, (ii) advisory and other fees incurred by, and the expense ratios of, the Fund relative to a Category and a Peer Group, (iii) the advisory fees of comparable portfolios of other clients of the Adviser and the Subadviser, (iv) the Adviser’s financial results and condition, including its and certain of its affiliates’ profitability from services performed for the Fund, (v) breakpoints in the Fund’s and the Peer Group’s fees, and information about economies of scale, (vi) the Adviser’s and Subadviser’s record of compliance with applicable laws and regulations, with the Fund’s investment policies and restrictions, and with the applicable Code of Ethics, and the structure and responsibilities of the Adviser’s and Subadviser’s compliance department, (vii) the background and experience of senior management and investment professionals, and (viii) the nature, cost and character of advisory and non-investment management services provided by the Adviser and its affiliates and by the Subadviser.
The Independent Trustees considered the legal advice of independent legal counsel and relied on their own business judgment in determining the factors to be considered in evaluating the materials that were presented to them and the weight to be given to each such factor. The Board’s review and conclusions were based on a comprehensive consideration of all information presented to the Board and not the result of any single controlling factor. The Board principally considered data on performance and other information provided by Morningstar as of December 31, 2007. The Board also considered updated performance information provided to it by the Adviser or Subadviser at its May and June 2008 meetings. Performance and other information may be quite different as of the date of this shareholders report. The key factors considered by the Board and the conclusions reached are described below.
Nature, extent and quality of services
The Board considered the ability of the Adviser and the Subadviser, based on their resources, reputation and other attributes, to attract and retain qualified investment professionals, including research, advisory, and supervisory personnel. The Board considered the investment philosophy, research and
| |
| 30 | High Yield Municipal Bond Fund | Semiannual report |
investment decision-making processes of the Adviser and Subadviser. The Board considered the Adviser’s execution of its oversight responsibilities. The Board further considered the culture of compliance, resources dedicated to compliance, compliance programs and compliance records of the Adviser and Subadviser. In addition, the Board took into account the administrative and other non-advisory services provided to the Fund by the Adviser and its affiliates.
Based on the above factors, together with those referenced below, the Board concluded that, within the context of its full deliberations, the nature, extent and quality of the investment advisory services provided to the Fund by the Adviser and Subadviser supported renewal of the Advisory Agreements.
Fund performance
The Board considered the performance results for the Fund over various time periods ended December 31, 2007. The Board also considered these results in comparison to the performance of the Category, as well as the Fund’s Peer Group and benchmark index. The Board reviewed with representatives of Morningstar the methodology used by Morningstar to select the funds in the Category and the Peer Group.
The Board noted that the Fund’s performance for the 1- and 10-year periods was lower than the performance of its benchmark index, the Lehman Brothers Municipal Bond Index, as was the Category and Peer Group medians. The Board also noted that the Fund’s performance was higher than the benchmark index for the 3- and 5-year periods. The Board favorably viewed that the Fund’s performance has higher than the Category and Peer Group medians for the 1-, 3- and 5-year periods.
Investment advisory fee and subadvisory
fee rates and expenses
The Board reviewed and considered the contractual investment advisory fee rate payable by the Fund to the Adviser for investment advisory services (the Advisory Agreement Rate). The Board received and considered information comparing the Advisory Agreement Rate with the advisory fees for the Peer Group and Category. The Board noted that the Advisory Agreement Rate was not appreciably higher than the median rates of the Peer Group and Category.
The Board received and considered expense information regarding the Fund’s various components, including advisory fees, distribution and fees other than advisory and distribution fees, including transfer agent fees, custodian fees, and other miscellaneous fees (e.g., fees for accounting and legal services). The Board considered comparisons of these expenses to the Peer Group median. The Board also received and considered expense information regarding the Fund’s total operating expense ratio (Expense Ratio). The Board noted that, unlike the Fund, several funds in the Peer Group employed fee waivers or reimbursements. The Board received and considered information comparing the Expense Ratio of the Fund to that of the Peer Group and Category medians before the application of fee waivers and reimbursements (Gross Expense Ratio) and after the application of such waivers and reimbursement (Net Expen se Ratio). The Board noted that the Fund’s Gross Expense Ratio and Net Expense Ratio were higher than the Category and Peer Group medians.
The Adviser also discussed the Morningstar data and rankings, and other relevant information, for the Fund. Based on the above-referenced considerations and other factors, the Board concluded that the Fund’s overall expense results and performance supported the re-approval of the Advisory Agreements.
The Board also received information about the investment subadvisory fee rate (the Subadvisory Agreement Rate) payable by the Adviser to the Subadviser for investment subadvisory services. The Board concluded that the Subadvisory Agreement Rate was fair and equitable, based on its consideration of the factors described here.
Profitability
The Board received and considered a detailed profitability analysis of the Adviser based on the Advisory Agreements, as well as on other relationships between the Fund and the Adviser and its affiliates, including the
| |
| Semiannual report | High Yield Municipal Bond Fund | 31 |
Subadviser. The Board also considered a comparison of the Adviser’s profitability to that of other similar investment advisers whose profitability information is publicly available. The Board concluded that, in light of the costs of providing investment management and other services to the Fund, the profits and other ancillary benefits reported by the Adviser were not unreasonable.
Economies of scale
The Board received and considered general information regarding economies of scale with respect to the management of the Fund, including the Fund’s ability to appropriately benefit from economies of scale under the Fund’s fee structure. The Board recognized the inherent limitations of any analysis of economies of scale, stemming largely from the Board’s understanding that most of the Adviser’s costs are not specific to individual Funds, but rather are incurred across a variety of products and services.
To the extent the Board and the Adviser were able to identify actual or potential economies of scale from Fund-specific or allocated expenses, in order to ensure that any such economies continue to be reasonably shared with the Fund as its assets increase, the Adviser and the Board agreed to continue the existing breakpoints to the Advisory Agreement Rate.
Information about services to other clients
The Board also received information about the nature, extent and quality of services and fee rates offered by the Adviser and Subadviser to their other clients, including other registered investment companies, institutional investors and separate accounts. The Board concluded that the Advisory Agreement Rate and the Subadvisory Agreement Rate were not unreasonable, taking into account fee rates offered to others by the Adviser and Subadviser, respectively, after giving effect to differences in services.
Other benefits to the Adviser
The Board received information regarding potential “fall-out” or ancillary benefits received by the Adviser and its affiliates, including the Subadviser, as a result of their relationship with the Fund. Such benefits could include, among others, benefits directly attributable to the relationship of the Adviser and Subadviser with the Fund and benefits potentially derived from an increase in business as a result of their relationship with the Fund (such as the ability to market to shareholders other financial products offered by the Adviser and its affiliates).
The Board also considered the effectiveness of the Adviser’s, Subadviser’s and Fund’s policies and procedures for complying with the requirements of the federal securities laws, including those relating to best execution of portfolio transactions and brokerage allocation.
Other factors and broader review
As discussed above, the Board reviewed detailed materials received from the Adviser and Subadviser as part of the annual re-approval process. The Board also regularly reviews and assesses the quality of the services that the Fund receives throughout the year. In this regard, the Board reviews reports of the Adviser at least quarterly, which include, among other things, fund performance reports and compliance reports. In addition, the Board meets with portfolio managers and senior investment officers at various times throughout the year.
After considering the above-described factors and based on its deliberations and its evaluation of the information described above, the Board concluded that approval of the continuation of the Advisory Agreements for the Fund was in the best interest of the Fund and its shareholders. Accordingly, the Board unanimously approved the continuation of the Advisory Agreements.
| |
| 32 | High Yield Municipal Bond Fund | Semiannual report |
More information
| |
| Trustees | Investment adviser |
| Patti McGill Peterson, Chairperson | John Hancock Advisers, LLC |
| James R. Boyle† | |
| James F. Carlin | Subadviser |
| William H. Cunningham* | MFC Global Investment |
| Deborah C. Jackson* | Management (U.S.), LLC |
| Charles L. Ladner | |
| Stanley Martin* | Principal distributor |
| Dr. John A. Moore | John Hancock Funds, LLC |
| Steven R. Pruchansky | |
| Custodian |
| *Member of the Audit Committee | State Street Bank and Trust Company |
| †Non-Independent Trustee | |
| Transfer agent |
| Officers | John Hancock Signature Services, Inc. |
| |
| Keith F. Hartstein | Legal counsel |
| President and Chief Executive Officer | K&L Gates LLP |
| | |
| Thomas M. Kinzler | |
| Secretary and Chief Legal Officer | |
| | |
| Francis V. Knox, Jr. | |
| Chief Compliance Officer | |
| | |
| Charles A. Rizzo | |
| Chief Financial Officer | |
| | |
| Gordon M. Shone | |
| Treasurer | |
| | |
| John G. Vrysen | |
| Chief Operating Officer | |
Additional information about your fund is available without charge in several ways. As required by the SEC, you can access proxy voting information and quarterly portfolio information on your fund. The proxy voting information includes a description of proxy voting policies, procedures and information regarding how the fund voted proxies relating to portfolio securities during the most recent twelve-month period ended June 30. The quarterly portfolio information that includes a complete list of the fund’s holdings for the first and third quarters of the fund’s fiscal period is filed on Form N-Q. You have access to this information:
| | | |
| By phone | On the fund’s Website | At the SEC |
| 1-800-225-5291 | www.jhfunds.com | www.sec.gov |
| | | | 1-800-SEC-0330 |
| | | | SEC Public Reference Room |
|
| |
| You can also contact us: | | | |
| Regular mail: | | Express mail: | |
| John Hancock Signature Services, Inc. | John Hancock Signature Services, Inc. |
| P.O. Box 9510 | | Mutual Fund Image Operations |
| Portsmouth, NH 03802-9510 | | 164 Corporate Drive | |
| | | Portsmouth, NH 03801 | |
|
Month-end portfolio holdings are available at www.jhfunds.com.
| |
| Semiannual report | High Yield Municipal Bond Fund | 33 |

1-800-225-5291
1-800-554-6713 TDD
1-800-338-8080 EASI-Line
www.jhfunds.com
Now available: electronic delivery
www.jhfunds.com/edelivery
| |
| This report is for the information of the shareholders of John Hancock High Yield Municipal Bond Fund. | 590SA 2/09 |
| It is not authorized for distribution to prospective investors unless preceded or accompanied by a prospectus. | 4/09 |
ITEM 2. CODE OF ETHICS.
Not applicable at this time.
ITEM 3. AUDIT COMMITTEE FINANCIAL EXPERT.
Not applicable at this time.
ITEM 4. PRINCIPAL ACCOUNTANT FEES AND SERVICES.
Not applicable at this time.
ITEM 5. AUDIT COMMITTEE OF LISTED REGISTRANTS.
Not applicable at this time.
ITEM 6. SCHEDULE OF INVESTMENTS.
(a) Not applicable.
(b) Not applicable.
ITEM 7. DISCLOSURE OF PROXY VOTING POLICIES AND PROCEDURES FOR CLOSED-END MANAGEMENT INVESTMENT COMPANIES.
Not applicable.
ITEM 8. PORTFOLIO MANAGERS OF CLOSED-END MANAGEMENT INVESTMENT COMPANIES.
Not applicable.
ITEM 9. PURCHASES OF EQUITY SECURITIES BY CLOSED-END MANAGEMENT INVESTMENT COMPANY AND AFFILIATED PURCHASERS.
Not applicable.
ITEM 10. SUBMISSION OF MATTERS TO A VOTE OF SECURITY HOLDERS.
There were no material changes to previously disclosed John Hancock Funds – Governance Committee Charter.
ITEM 11. CONTROLS AND PROCEDURES.
(a) Based upon their evaluation of the registrant's disclosure controls and procedures as conducted within 90 days of the filing date of this Form N-CSR, the registrant's principal executive officer and principal financial officer have concluded that those disclosure controls and procedures provide reasonable assurance that the material information required to be disclosed by the registrant on this report is recorded, processed, summarized and reported within the time periods specified in the Securities and Exchange Commission's rules and forms.
(b) There were no changes in the registrant's internal control over financial reporting that occurred during the registrant's most recent fiscal half-year (the registrant's second fiscal half-year in the case of an annual report) that have materially affected, or are reasonably likely to materially affect, the registrant's internal control over financial reporting.
ITEM 12. EXHIBITS.
(a) Separate certifications for the registrant's principal executive officer and principal financial officer, as required by Section 302 of the Sarbanes-Oxley Act of 2002 and Rule 30a-2(a) under the Investment Company Act of 1940, are attached.
(b) Separate certifications for the registrant's principal executive officer and principal financial officer, as required by 18 U.S.C. Section 1350, as adopted pursuant to Section 906 of the Sarbanes-Oxley Act of 2002, and Rule 30a-2(b) under the Investment Company Act of 1940, are attached. The certifications furnished pursuant to this paragraph are not deemed to be "filed" for purposes of Section 18 of the Securities Exchange Act of 1934, or otherwise subject to the liability of that section. Such certifications are not deemed to be incorporated by reference into any filing under the Securities Act of 1933 or the Securities Exchange Act of 1934, except to the extent that the Registrant specifically incorporates them by reference.
(c)(1) Submission of Matters to a Vote of Security Holders is attached. See attached “John Hancock Funds – Governance Committee Charter”.
(c)(2) Contact person at the registrant.
SIGNATURES
Pursuant to the requirements of the Securities Exchange Act of 1934 and the Investment Company Act of 1940, the registrant has duly caused this report to be signed on its behalf by the undersigned, thereunto duly authorized.
John Hancock Municipal Series Trust
By: /s/ Keith F. Hartstein
-------------------------------------
Keith F. Hartstein
President and Chief Executive Officer
Date: April 27, 2009
Pursuant to the requirements of the Securities Exchange Act of 1934 and the Investment Company Act of 1940, this report has been signed below by the following persons on behalf of the registrant and in the capacities and on the dates indicated.
By: /s/ Keith F. Hartstein
-------------------------------------
Keith F. Hartstein
President and Chief Executive Officer
Date: April 27, 2009
By: /s/ Charles A. Rizzo
-------------------------------------
Charles A. Rizzo
Chief Financial Officer
Date: April 27, 2009