UNITED STATES
SECURITIES AND EXCHANGE COMMISSION
Washington, D.C. 20549
FORM N-CSR
Certified Shareholder Report of
Registered Management Investment Companies
Investment Company Act File Number: 811-05888
SMALLCAP World Fund, Inc.
(Exact Name of Registrant as Specified in Charter)
6455 Irvine Center Drive
Irvine, California 92618
(Address of Principal Executive Offices)
Registrant's telephone number, including area code: (213) 486-9200
Date of fiscal year end: September 30
Date of reporting period: March 31, 2016
Michael W. Stockton
SMALLCAP World Fund, Inc.
333 South Hope Street
Los Angeles, California 90071
(Name and Address of Agent for Service)
ITEM 1 – Reports to Stockholders

 | | SMALLCAP World Fund®
Semi-annual report
for the six months ended
March 31, 2016 |
SMALLCAP World Fund seeks to provide you with long-term growth of capital.
This fund is one of more than 40 offered by one of the nation’s largest mutual fund families, American Funds, from Capital Group. For more than 80 years, Capital has invested with a long-term focus based on thorough research and attention to risk.
Fund results shown in this report, unless otherwise indicated, are for Class A shares at net asset value. If a sales charge (maximum 5.75%) had been deducted, the results would have been lower. Results are for past periods and are not predictive of results for future periods. Current and future results may be lower or higher than those shown. Share prices and returns will vary, so investors may lose money. Investing for short periods makes losses more likely. Investments are not FDIC-insured, nor are they deposits of or guaranteed by a bank or any other entity, so they may lose value. For current information and month-end results, visit americanfunds.com.
Here are the average annual total returns on a $1,000 investment with all distributions reinvested for periods ended March 31, 2016:
| Class A shares | 1 year | 5 years | 10 years |
| | | | |
| Reflecting 5.75% maximum sales charge | –10.88% | 4.69% | 4.87% |
For other share class results, visit americanfunds.com and americanfundsretirement.com.
The total annual fund operating expense ratio was 1.07% for Class A shares as of the prospectus dated December 1, 2015.
Investment results assume all distributions are reinvested and reflect applicable fees and expenses. When applicable, investment results reflect fee waivers, without which results would have been lower. Visit americanfunds.com for more information.
Investing outside the United States may be subject to risks, such as currency fluctuations and political instability. These risks may be heightened in connection with investments in developing countries. Investing in small-capitalization stocks can involve greater risk than is customarily associated with investing in stocks of larger, more established companies. Refer to the fund prospectus and the Risk Factors section of this report for more information on these and other risks associated with investing in the fund.

Fellow investors:
Heightened volatility in global equity markets, with concerns about the Chinese economy a foremost factor, muted total returns for SMALLCAP World Fund in the first six months of its current fiscal year. For the six-month period ended March 31, 2016, the fund returned 0.22%. This figure includes the reinvestment of a one-time capital gain payment, made on December 23, 2015, of $2.83 a share.
By way of comparison, the MSCI All Country World Small Cap Index — an unmanaged index of global small-cap equities that does not include fees or expenses — gained 4.87% for the same period, while the Lipper Global Small-/Mid-Cap Funds Average, a measure of the fund’s peer group, returned 3.11%.
While we are not pleased with these short-term results, it’s worth remembering that we invest for the long term. We have always felt that volatility measured in weeks or months is a secondary concern to finding investments with long-term potential. As you can see in the table below, this approach has benefitted the fund’s shareholders,
Results at a glance
For periods ended March 31, 2016, with all distributions reinvested
| | | Cumulative total returns | | Average annual total returns |
| | | 6 months | | 1 year | | 5 years | | 10 years | | Lifetime
(since 4/30/90) |
| | | | | | | | | | | |
| SMALLCAP World Fund (Class A shares) | | | 0.22 | % | | | –5.45 | % | | | 5.93 | % | | | 5.49 | % | | | 9.23 | % |
| MSCI All Country World Small Cap Index* | | | 4.87 | | | | –4.50 | | | | 5.39 | | | | 5.45 | | | | n/a | |
| Lipper Global Small-/Mid-Cap Funds Average† | | | 3.11 | | | | –5.82 | | | | 4.79 | | | | 4.34 | | | | 8.91 | |
| * | The market index is unmanaged and, therefore, has no expenses. Investors cannot invest directly in an index. The market index is a free float-adjusted market capitalization weighted index that is designed to measure equity market results of smaller capitalization companies in both developed and emerging markets. Results reflect dividends net of withholding taxes. This index was not in existence when the fund’s Class A shares were first sold; therefore, lifetime results are not available. |
| † | Lipper averages reflect the current composition of all eligible mutual funds (all share classes) within a given category. |
as the fund’s returns have surpassed those of its peers and benchmarks over longer periods. The fund’s Class R-5 shares were recently recognized by Lipper as offering the best 10-year returns in the Lipper Global Small-/Mid-Cap Funds category, our third straight year for this honor.
Market overview
The first half of the fund’s fiscal year was marked with deep uncertainty on a number of fronts. Foremost in many investors’ minds were concerns about weakness in the Chinese economy. A continued decline in oil prices also hurt many oil exporting economies in emerging markets.
These concerns were amplified by mixed economic data regarding the U.S. economy, as well as a particularly heated presidential campaign season. There were also concerns that the Federal Reserve would move ahead with a program of interest rate hikes through 2016.
All of this led to a sharp decline in global stocks in the first few months of the 2016 calendar year. However, this was quickly followed by gains in major equity markets. This sort of volatility is the mark of investor uncertainty, which may continue through the rest of the fund’s fiscal year.
The fund’s holdings
Overall, the fund had roughly 41% of its total portfolio in U.S.-based equities — less than the MSCI index, though returns from the fund’s U.S. equity holdings were largely negative during the period. Despite the uncertainty around China’s economy, the fund’s careful selection of Chinese stocks benefitted the fund on both an absolute and relative basis, as did holdings in Brazilian companies.
Where the fund’s assets are invested (by country of domicile)
| | | | |
| | As of March 31, 2016 | Percent of net assets |
| ▀ | United States | 41.5 | % |
| ▀ | Asia & Pacific Basin | 22.3 | |
| ▀ | Europe | 19.9 | |
| ▀ | Other (including Canada & Latin America) | 6.3 | |
| ▀ | Short-term securities & other assets less liabilities | 10.0 | |
| | As of September 30, 2015 | Percent of net assets |
| ▀ | United States | 44.2 | % |
| ▀ | Asia & Pacific Basin | 21.2 | |
| ▀ | Europe | 20.1 | |
| ▀ | Other (including Canada & Latin America) | 4.3 | |
| ▀ | Short-term securities & other assets less liabilities | 10.2 | |
The fund’s health care holdings, which had long benefitted shareholders during this economic cycle, were detrimental to returns during this six-month period, and may signal a shift away from the leading role this industry had in the market. The fund’s holdings in information technology, materials and consumer stocks generally helped returns.
At the end of the six-month period, the fund held roughly 10% of the portfolio in cash and short-term securities. In volatile markets, cash not only can provide a buffer against volatility, but also can allow portfolio managers to take advantage of sudden price shifts by purchasing stocks at attractive valuations. Each individual portfolio manager determines how much cash he or she wishes to have on hand.
Looking ahead
There are reasons to be optimistic as we look to the remainder of the fund’s fiscal year. The Federal Reserve has signaled it will ease back on further rate hikes until the economy shows more signs of stability. In that vein, U.S. economic data has improved modestly. We expect the domestic economy to continue growing slowly — but grow nonetheless. Meanwhile the Chinese economy will remain challenged with the buildup of considerable debt.
While investor caution and uncertainty contributed to a lack of initial public offerings in the U.S. in the first quarter of 2016, we believe that merger and acquisition activity will become a more important factor for small-cap equities in the months ahead.
Despite all the uncertainties in the world, we will remain relentlessly focused on discovering potential investments for the fund. We have a steady flow of new investment ideas from our global research team, and the competition to discover SMALLCAP investment opportunities, and to uncover the latest insights into current holdings, remains intense and healthy.
In summary, we remain committed to our bottom-up research effort and our long-term orientation. We thank you for the continued trust you’ve placed in us, and look forward to reporting to you again in six months.
Cordially,

Jonathan Knowles
Vice Chairman of the Board

Gregory W. Wendt
President
May 13, 2016
For current information about the fund, visit americanfunds.com.
| Summary investment portfolio March 31, 2016 | unaudited |
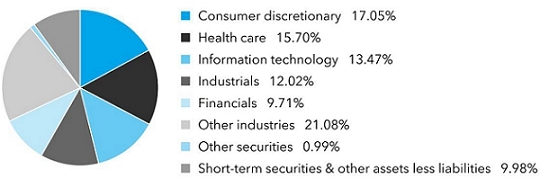
| Industry sector diversification | Percent of net assets |
| Country diversification by domicile | | Percent of
net assets |
| United States | | | 41.53 | % |
| United Kingdom | | | 8.25 | |
| Euro zone* | | | 7.01 | |
| Japan | | | 5.80 | |
| India | | | 4.31 | |
| China | | | 3.51 | |
| Canada | | | 3.09 | |
| Hong Kong | | | 1.94 | |
| Taiwan | | | 1.91 | |
| Other countries | | | 12.67 | |
| Short-term securities & other assets less liabilities | | | 9.98 | |
| * | Countries using the euro as a common currency; those represented in the fund’s portfolio are Austria, Belgium, Finland, France, Germany, Greece, Ireland, Italy, the Netherlands, Portugal, Slovenia and Spain. |
| | | | | | | | Value | |
| Common stocks 89.03% | | | Shares | | | | (000) | |
| Consumer discretionary 17.05% | | | | | | | | |
| Domino’s Pizza, Inc.1 | | | 2,828,769 | | | $ | 373,001 | |
| Lions Gate Entertainment Corp.1 | | | 8,102,000 | | | | 177,029 | |
| Dollarama Inc. | | | 2,005,000 | | | | 141,087 | |
| Ted Baker PLC1 | | | 3,167,993 | | | | 123,897 | |
| Paddy Power Betfair PLC | | | 886,051 | | | | 123,610 | |
| GVC Holdings PLC1 | | | 16,741,307 | | | | 121,426 | |
| BCA Marketplace PLC1 | | | 42,870,000 | | | | 112,369 | |
| YOOX Net-A-Porter Group SPA2 | | | 3,288,469 | | | | 100,920 | |
| Other securities | | | | | | | 3,292,078 | |
| | | | | | | | 4,565,417 | |
| | | | | | | | | |
| Health care 15.70% | | | | | | | | |
| Molina Healthcare, Inc.1,2 | | | 4,340,630 | | | | 279,927 | |
| Incyte Corp.2 | | | 3,497,991 | | | | 253,499 | |
| China Biologic Products, Inc.1,2 | | | 1,774,423 | | | | 203,136 | |
| Myriad Genetics, Inc.1,2 | | | 5,263,377 | | | | 197,008 | |
| Hikma Pharmaceuticals PLC | | | 4,794,253 | | | | 136,338 | |
| | | | | | Value | |
| | | | Shares | | | | (000) | |
| athenahealth, Inc.2 | | | 929,371 | | | $ | 128,978 | |
| Insulet Corp.1,2 | | | 3,884,000 | | | | 128,793 | |
| GW Pharmaceuticals PLC (ADR)1,2 | | | 1,652,700 | | | | 119,242 | |
| Centene Corp.2 | | | 1,709,439 | | | | 105,250 | |
| Sysmex Corp. | | | 1,643,000 | | | | 102,774 | |
| Spire Healthcare Group PLC | | | 17,800,000 | | | | 91,779 | |
| CONMED Corp.1 | | | 2,141,654 | | | | 89,821 | |
| Other securities | | | | | | | 2,368,487 | |
| | | | | | | | 4,205,032 | |
| | | | | | | | | |
| Information technology 13.47% | | | | | | | | |
| Qorvo, Inc.2 | | | 3,884,370 | | | | 195,811 | |
| AAC Technologies Holdings Inc. | | | 23,966,500 | | | | 183,209 | |
| Kakaku.com, Inc. | | | 7,074,000 | | | | 131,367 | |
| Vanguard International Semiconductor Corp. | | | 81,256,386 | | | | 126,995 | |
| Zynga Inc., Class A2 | | | 54,170,000 | | | | 123,508 | |
| DeNA Co., Ltd. | | | 5,887,700 | | | | 101,437 | |
| Demandware, Inc.1,2 | | | 2,536,456 | | | | 99,175 | |
| EPAM Systems, Inc.2 | | | 1,275,400 | | | | 95,234 | |
| Finisar Corp.2 | | | 4,901,000 | | | | 89,394 | |
| Other securities | | | | | | | 2,459,985 | |
| | | | | | | | 3,606,115 | |
| | | | | | | | | |
| Industrials 12.02% | | | | | | | | |
| Hoshizaki Electric Co., Ltd. | | | 2,334,600 | | | | 194,783 | |
| ITT Corp. | | | 3,580,000 | | | | 132,066 | |
| Loomis AB, Class B | | | 3,769,042 | | | | 106,549 | |
| MonotaRO Co., Ltd. | | | 3,396,800 | | | | 100,958 | |
| Oshkosh Corp. | | | 2,385,600 | | | | 97,499 | |
| AA PLC | | | 24,237,138 | | | | 92,178 | |
| NIBE Industrier AB, Class B | | | 2,670,000 | | | | 91,530 | |
| Other securities | | | | | | | 2,404,250 | |
| | | | | | | | 3,219,813 | |
| | | | | | | | | |
| Financials 9.71% | | | | | | | | |
| Kotak Mahindra Bank Ltd. | | | 20,057,040 | | | | 206,151 | |
| Validus Holdings, Ltd. | | | 2,863,000 | | | | 135,105 | |
| Umpqua Holdings Corp. | | | 7,004,541 | | | | 111,092 | |
| GT Capital Holdings, Inc. | | | 3,485,200 | | | | 105,211 | |
| VZ Holding AG | | | 363,400 | | | | 95,995 | |
| Financial Engines, Inc. | | | 2,865,947 | | | | 90,077 | |
| Other securities | | | | | | | 1,856,910 | |
| | | | | | | | 2,600,541 | |
| | | | | | | | | |
| Consumer staples 6.93% | | | | | | | | |
| Sprouts Farmers Market, Inc.2 | | | 5,312,600 | | | | 154,278 | |
| Emmi AG | | | 263,500 | | | | 144,006 | |
| Raia Drogasil SA, ordinary nominative | | | 8,267,574 | | | | 120,025 | |
| Pinnacle Foods Inc. | | | 2,389,050 | | | | 106,743 | |
| Other securities | | | | | | | 1,330,730 | |
| | | | | | | | 1,855,782 | |
| Common stocks (continued) | | Shares | | | Value
(000) | |
| Materials 4.50% | | | | | | | | |
| Chr. Hansen Holding A/S | | | 2,593,200 | | | $ | 174,081 | |
| James Hardie Industries PLC (CDI) | | | 6,855,000 | | | | 93,849 | |
| Other securities | | | | | | | 937,390 | |
| | | | | | | | 1,205,320 | |
| | | | | | | | | |
| Energy 3.11% | | | | | | | | |
| Other securities | | | | | | | 833,805 | |
| | | | | | | | 833,805 | |
| | | | | | | | | |
| Telecommunication services 0.98% | | | | | | | | |
| Other securities | | | | | | | 262,920 | |
| | | | | | | | 262,920 | |
| Utilities 0.71% | | | | | | | | |
| ENN Energy Holdings Ltd. | | | 19,994,000 | | | | 109,670 | |
| Other securities | | | | | | | 80,438 | |
| | | | | | | | 190,108 | |
| | | | | | | | | |
| Miscellaneous 4.85% | | | | | | | | |
| Other common stocks in initial period of acquisition | | | | | | | 1,298,358 | |
| | | | | | | | | |
| Total common stocks (cost: $19,201,730,000) | | | | | | | 23,843,211 | |
| | | | | | | | | |
| Preferred securities 0.00% | | | | | | | | |
| Consumer staples 0.00% | | | | | | | | |
| Other securities | | | | | | | 119 | |
| | | | | | | | | |
| Total preferred securities (cost: $185,000) | | | | | | | 119 | |
| | | | | | | | | |
| Rights & warrants 0.01% | | | | | | | | |
| Other 0.01% | | | | | | | | |
| Other securities | | | | | | | 3,962 | |
| | | | | | | | | |
| Total rights & warrants (cost: $926,000) | | | | | | | 3,962 | |
| | | | | | | | | |
| Convertible stocks 0.38% | | | | | | | | |
| Other 0.38% | | | | | | | | |
| Other securities | | | | | | | 100,659 | |
| | | | | | | | | |
| Total convertible stocks (cost: $112,587,000) | | | | | | | 100,659 | |
| | | | | | | | | |
| Bonds, notes & other debt instruments 0.60% | | Principal amount
(000) | | | | | |
| Other bonds & notes 0.60% | | | | | | | | |
| Other securities | | | | | | | 160,503 | |
| | | | | | | | | |
| Total bonds, notes & other debt instruments (cost: $156,357,000) | | | | | | | 160,503 | |
| Short-term securities 9.80% | | Principal amount
(000) | | | Value
(000) | |
| Bank of Nova Scotia 0.50%–0.92% due 5/2/2016–10/14/20163 | | $ | 64,500 | | | $ | 64,417 | |
| Bank of Tokyo-Mitsubishi UFJ, Ltd. 0.39% due 4/14/2016 | | | 46,300 | | | | 46,293 | |
| BNP Paribas Finance Inc. 0.45%–0.59% due 4/4/2016–6/3/2016 | | | 125,200 | | | | 125,153 | |
| Federal Home Loan Bank 0.26%–0.60% due 4/6/2016–8/1/2016 | | | 320,200 | | | | 320,088 | |
| KfW 0.55% due 5/27/20163 | | | 102,300 | | | | 102,233 | |
| Liberty Street Funding Corp. 0.58% due 5/23/20163 | | | 48,200 | | | | 48,165 | |
| Mitsubishi UFJ Trust and Banking Corp. 0.47%–0.49% due 4/11/2016–5/24/20163 | | | 173,800 | | | | 173,717 | |
| Mizuho Bank, Ltd. 0.60%–0.61% due 6/8/2016–6/20/20163 | | | 160,200 | | | | 160,019 | |
| Nordea Bank AB 0.61%–0.64% due 6/2/2016–7/8/20163 | | | 178,700 | | | | 178,489 | |
| Rabobank Nederland NV 0.64% due 5/3/2016 | | | 100,200 | | | | 100,163 | |
| Royal Bank of Canada 0.71% due 6/13/2016 | | | 100,000 | | | | 99,907 | |
| Sumitomo Mitsui Banking Corp. 0.35%–0.61% due 4/12/2016–5/13/20163 | | | 162,500 | | | | 162,438 | |
| Svenska Handelsbanken Inc. 0.56%–0.64% due 6/6/2016–7/11/20163 | | | 139,100 | | | | 138,890 | |
| Thunder Bay Funding, LLC 0.53%–0.82% due 4/14/2016–8/8/20163 | | | 91,500 | | | | 91,363 | |
| Total Capital Canada Ltd. 0.58%–0.59% due 4/14/2016–4/25/20163 | | | 140,200 | | | | 140,172 | |
| Toyota Credit Canada Inc. 0.55%–0.68% due 6/3/2016–7/19/2016 | | | 50,000 | | | | 49,930 | |
| Toyota Motor Credit Corp. 0.40% due 4/5/2016 | | | 50,000 | | | | 49,997 | |
| Westpac Banking Corp. 0.47%–0.86% due 5/9/2016–9/26/20163 | | | 126,200 | | | | 125,868 | |
| Other securities | | | | | | | 447,272 | |
| | | | | | | | | |
| Total short-term securities (cost: $2,624,150,000) | | | | | | | 2,624,574 | |
| Total investment securities 99.82% (cost: $22,095,935,000) | | | | | | | 26,733,028 | |
| Other assets less liabilities 0.18% | | | | | | | 49,434 | |
| | | | | | | | | |
| Net assets 100.00% | | | | | | $ | 26,782,462 | |
This summary investment portfolio is designed to streamline the report and help investors better focus on the fund’s principal holdings. See the inside back cover for details on how to obtain a complete schedule of portfolio holdings.
As permitted by U.S. Securities and Exchange Commission regulations, “Miscellaneous” securities include holdings in their first year of acquisition that have not previously been publicly disclosed.
“Other securities” includes all issues that are not disclosed separately in the summary investment portfolio. Some of these securities in “Other securities” (with an aggregate value of $127,033,000, an aggregate cost of $130,978,000, and which represented .46% of the net assets of the fund) were acquired from 12/3/2013 to 5/7/2015 through private placement transactions exempt from registration under the Securities Act of 1933, which may subject them to legal or contractual restrictions on resale. “Other securities“ also includes securities which were pledged as collateral. The total value of pledged collateral was $9,102,000, which represented .03% of the net assets of the fund.
Forward currency contracts
The fund has entered into forward currency contracts as shown in the following table. The average month-end notional amount of open forward currency contracts while held was $533,566,000.
| | | | | | | | | | | Unrealized | |
| | | | | | | | | | | (depreciation) | |
| | | | | | | Contract amount | | appreciation | |
| | | | | | | Receive | | Deliver | | at 3/31/2016 | |
| | | Settlement date | | Counterparty | | (000) | | (000) | | (000) | |
| Sales: | | | | | | | | | | | | |
| Australian dollars | | 4/8/2016 | | Barclays Bank PLC | | $1,028 | | A$1,450 | | $ | (84 | ) |
| Australian dollars | | 4/13/2016 | | HSBC Bank | | $39,115 | | A$53,150 | | | (1,603 | ) |
| Australian dollars | | 5/27/2016 | | UBS AG | | $1,518 | | A$2,000 | | | (11 | ) |
| British pounds | | 4/5/2016 | | UBS AG | | $53,869 | | £38,626 | | | (1,608 | ) |
| British pounds | | 4/7/2016 | | JPMorgan Chase | | $27,359 | | £19,503 | | | (654 | ) |
| British pounds | | 4/8/2016 | | Citibank | | $49,264 | | £34,459 | | | (229 | ) |
| British pounds | | 4/11/2016 | | Barclays Bank PLC | | $17,293 | | £12,465 | | | (610 | ) |
| British pounds | | 4/12/2016 | | Bank of America, N.A. | | $67,684 | | £46,673 | | | 649 | |
| British pounds | | 4/12/2016 | | Barclays Bank PLC | | $5,975 | | £4,122 | | | 54 | |
| British pounds | | 5/11/2016 | | Citibank | | $67,343 | | £47,310 | | | (614 | ) |
| Canadian dollars | | 4/7/2016 | | UBS AG | | $24,125 | | C$34,000 | | | (2,055 | ) |
| Euros | | 4/13/2016 | | HSBC Bank | | $12,413 | | €11,315 | | | (467 | ) |
| Euros | | 4/14/2016 | | Citibank | | $1,795 | | €1,650 | | | (83 | ) |
| Japanese yen | | 4/13/2016 | | JPMorgan Chase | | $19,480 | | ¥2,208,500 | | | (151 | ) |
| Japanese yen | | 4/18/2016 | | HSBC Bank | | $24,913 | | ¥2,842,000 | | | (354 | ) |
| Japanese yen | | 4/22/2016 | | UBS AG | | $59,440 | | ¥6,685,000 | | | 1 | |
| Japanese yen | | 4/25/2016 | | JPMorgan Chase | | $7,324 | | ¥826,910 | | | (29 | ) |
| Japanese yen | | 4/28/2016 | | UBS AG | | $5,891 | | ¥669,165 | | | (60 | ) |
| Japanese yen | | 5/18/2016 | | Bank of New York Mellon | | $2,984 | | ¥339,900 | | | (41 | ) |
| Japanese yen | | 6/6/2016 | | HSBC Bank | | $10,684 | | ¥1,200,000 | | | 1 | |
| Singapore dollars | | 5/26/2016 | | Barclays Bank PLC | | $14,469 | | S$20,302 | | | (589 | ) |
| Thai baht | | 5/9/2016 | | JPMorgan Chase | | $4,817 | | THB171,650 | | | (58 | ) |
| | | | | | | | | | | $ | (8,595 | ) |
Investments in affiliates
A company is an affiliate of the fund under the Investment Company Act of 1940 if the fund’s holdings in that company represent 5% or more of the outstanding voting shares. The value of the fund’s affiliated-company holdings is either shown in the summary investment portfolio or included in the value of “Other securities” under the respective industry sectors. Further details on such holdings and related transactions during the six months ended March 31, 2016, appear below.
| | | | | | | | | | | | | | Value of | |
| | | | | | | | | | | Dividend | | | affiliates at | |
| | | Beginning | | | | | | Ending | | income | | | 3/31/2016 | |
| | | shares | | Additions | | Reductions | | shares | | (000) | | | (000) | |
| Domino’s Pizza, Inc. | | 3,125,769 | | — | | 297,000 | | 2,828,769 | | $ | 2,157 | | | $ | 373,001 | |
| Molina Healthcare, Inc.2 | | 3,898,100 | | 442,530 | | — | | 4,340,630 | | | — | | | | 279,927 | |
| China Biologic Products, Inc.2 | | 283,500 | | 1,490,923 | | — | | 1,774,423 | | | — | | | | 203,136 | |
| Myriad Genetics, Inc.2 | | 5,766,556 | | — | | 503,179 | | 5,263,377 | | | — | | | | 197,008 | |
| Lions Gate Entertainment Corp. | | 6,877,000 | | 1,543,000 | | 318,000 | | 8,102,000 | | | 1,320 | | | | 177,029 | |
| Insulet Corp.2 | | 2,374,000 | | 1,510,000 | | — | | 3,884,000 | | | — | | | | 128,793 | |
| Ted Baker PLC | | 3,167,993 | | — | | — | | 3,167,993 | | | 648 | | | | 123,897 | |
| GVC Holdings PLC | | 1,663,694 | | 15,077,613 | | — | | 16,741,307 | | | 267 | | | | 121,426 | |
| GW Pharmaceuticals PLC (ADR)2 | | 1,652,700 | | — | | — | | 1,652,700 | | | — | | | | 119,242 | |
| BCA Marketplace PLC | | 42,870,000 | | — | | — | | 42,870,000 | | | 1,302 | | | | 112,369 | |
| Demandware, Inc.2 | | 2,529,356 | | 7,100 | | — | | 2,536,456 | | | — | | | | 99,175 | |
| CONMED Corp. | | 2,141,654 | | — | | — | | 2,141,654 | | | 857 | | | | 89,821 | |
| Zeltiq Aesthetics, Inc.2 | | 3,002,044 | | 120,000 | | — | | 3,122,044 | | | — | | | | 84,795 | |
| Zoopla Property Group PLC | | 23,421,100 | | 150,629 | | — | | 23,571,729 | | | 878 | | | | 84,637 | |
| Globant SA2 | | 2,467,480 | | 250,030 | | — | | 2,717,510 | | | — | | | | 83,862 | |
| Inphi Corp.2 | | 2,437,199 | | 22,000 | | — | | 2,459,199 | | | — | | | | 81,990 | |
| King Slide Works Co., Ltd. | | 6,683,000 | | 332,000 | | — | | 7,015,000 | | | — | | | | 80,974 | |
| U.S. Silica Holdings, Inc. | | — | | 3,485,000 | | — | | 3,485,000 | | | 310 | | | | 79,179 | |
| WHA Corp. PCL2 | | 677,141,200 | | 183,467,700 | | — | | 860,608,900 | | | — | | �� | | 76,325 | |
| WHA Corp. PCL, warrants, expire 20202 | | 6,909,830 | | — | | — | | 6,909,830 | | | — | | | | 1,503 | |
| zooplus AG, non-registered shares2 | | 527,778 | | — | | — | | 527,778 | | | — | | | | 72,367 | |
| Quotient Technology Inc.2,4 | | 4,881,613 | | 1,830,000 | | — | | 6,711,613 | | | — | | | | 71,143 | |
| eMemory Technology Inc. | | 6,146,000 | | — | | — | | 6,146,000 | | | — | | | | 71,039 | |
| POYA International Co., Ltd. | | 5,588,216 | | 1,081,000 | | — | | 6,669,216 | | | — | | | | 70,870 | |
| HKBN Ltd. | | 60,888,000 | | — | | 5,416,500 | | 55,471,500 | | | 1,571 | | | | 68,505 | |
| Tele Columbus AG2 | | 2,976,000 | | 3,720,000 | | — | | 6,696,000 | | | — | | | | 68,445 | |
| Continental Building Products, Inc.2 | | 3,035,700 | | 200,000 | | — | | 3,235,700 | | | — | | | | 60,055 | |
| Entertainment One Ltd. | | 15,254,082 | | 9,896,549 | | — | | 25,150,631 | | | — | | | | 54,798 | |
| TechnoPro Holdings, Inc. | | 1,845,000 | | — | | — | | 1,845,000 | | | 767 | | | | 54,754 | |
| Genomma Lab Internacional, SAB de CV, Series B2 | | 36,988,000 | | 30,495,000 | | — | | 67,483,000 | | | — | | | | 52,183 | |
| NCC Group PLC | | 13,350,000 | | 1,036,000 | | — | | 14,386,000 | | | 307 | | | | 51,758 | |
| Iridium Communications Inc.2 | | 4,889,615 | | 181,000 | | — | | 5,070,615 | | | — | | | | 39,906 | |
| Iridium Communications Inc., Series A, convertible preferred3 | | 60,000 | | — | | — | | 60,000 | | | 525 | | | | 5,584 | |
| | | | | | | | | | | | | | Value of | |
| | | | | | | | | | | Dividend | | | affiliates at | |
| | | Beginning | | | | | | Ending | | income | | | 3/31/2016 | |
| | | shares | | Additions | | Reductions | | shares | | (000) | | | (000) | |
| Installed Building Products, Inc.2 | | 1,704,039 | | — | | — | | 1,704,039 | | $ | — | | | $ | 45,344 | |
| Lands’ End, Inc.2 | | 1,704,000 | | — | | — | | 1,704,000 | | | — | | | | 43,469 | |
| Super Group Ltd. | | 59,000,000 | | — | | — | | 59,000,000 | | | — | | | | 43,336 | |
| Takeuchi Mfg. Co., Ltd. | | 3,770,400 | | 149,500 | | 931,900 | | 2,988,000 | | | 480 | | | | 43,116 | |
| CenterState Banks, Inc. | | 1,802,399 | | 956,000 | | — | | 2,758,399 | | | 152 | | | | 41,072 | |
| Poundland Group PLC | | 15,898,506 | | 1,545,000 | | — | | 17,443,506 | | | 415 | | | | 39,083 | |
| Sirius Minerals Plc2 | | 153,077,760 | | 26,600,000 | | — | | 179,677,760 | | | — | | | | 38,064 | |
| Sirius Minerals Plc, warrants, expire 20153,5 | | 26,600,000 | | — | | 26,600,000 | | — | | | — | | | | — | |
| Natera, Inc.2,6 | | 1,795,567 | | 2,593,996 | | 391,760 | | 3,997,803 | | | — | | | | 38,059 | |
| Adaptimmune Therapeutics PLC (ADR)2 | | 1,713,918 | | 2,887,082 | | — | | 4,601,000 | | | — | | | | 37,406 | |
| Adaptimmune Therapeutics PLC3,5 | | 16,938,900 | | — | | 16,938,900 | | — | | | — | | | | — | |
| Sleep Country Canada Holdings Inc.6 | | 1,736,300 | | 637,888 | | — | | 2,374,188 | | | 332 | | | | 35,665 | |
| RIB Software AG | | 2,476,356 | | 428,637 | | — | | 2,904,993 | | | — | | | | 30,180 | |
| Century Communities, Inc.2 | | 1,716,000 | | — | | — | | 1,716,000 | | | — | | | | 29,292 | |
| Mothercare PLC2 | | 10,810,000 | | 290,000 | | — | | 11,100,000 | | | — | | | | 29,015 | |
| Stock Spirits Group PLC | | 15,474,743 | | — | | 1,807,284 | | 13,667,459 | | | — | | | | 28,807 | |
| CPI Card Group Inc. | | — | | 3,450,000 | | — | | 3,450,000 | | | 155 | | | | 28,428 | |
| CCL Products (India) Ltd. | | 7,278,328 | | 1,562,944 | | — | | 8,841,272 | | | 197 | | | | 25,794 | |
| Regulus Therapeutics Inc.2 | | 2,015,000 | | 1,520,000 | | — | | 3,535,000 | | | — | | | | 24,498 | |
| Sonus Networks, Inc.2 | | 2,938,000 | | 287,000 | | — | | 3,225,000 | | | — | | | | 24,284 | |
| Cox & Kings Ltd. | | 10,130,825 | | 330,000 | | 1,592,000 | | 8,868,825 | | | — | | | | 24,167 | |
| Cox & Kings Ltd. (GDR)5 | | 330,000 | | — | | 330,000 | | — | | | — | | | | — | |
| Actua Corp2 | | 2,602,000 | | — | | — | | 2,602,000 | | | — | | | | 23,548 | |
| Zegona Communications PLC2,5 | | 12,305,654 | | — | | — | | 12,305,654 | | | — | | | | 23,241 | |
| Beauty Community PCL | | 150,000,000 | | — | | — | | 150,000,000 | | | — | | | | 23,024 | |
| Trupanion, Inc.2 | | 2,155,668 | | 101,832 | | — | | 2,257,500 | | | — | | | | 22,236 | |
| Neovasc Inc. (CAD denominated)2 | | 4,246,900 | | 333,557 | | — | | 4,580,457 | | | — | | | | 19,292 | |
| Neovasc Inc.2 | | 503,836 | | — | | — | | 503,836 | | | — | | | | 2,151 | |
| Ocular Therapeutix, Inc.2 | | 1,955,700 | | 21,878 | | — | | 1,977,578 | | | — | | | | 19,103 | |
| KEYW Holding Corp.2 | | 2,836,400 | | — | | — | | 2,836,400 | | | — | | | | 18,834 | |
| Tidewater Midstream and Infrastructure Ltd.3 | | 12,444,000 | | — | | — | | 12,444,000 | | | 184 | | | | 13,414 | |
| Tidewater Midstream and Infrastructure Ltd. | | — | | 4,490,000 | | — | | 4,490,000 | | | 34 | | | | 4,840 | |
| J. Kumar Infraprojects Ltd. | | 1,780,000 | | 2,312,000 | | — | | 4,092,000 | | | — | | | | 16,977 | |
| Flexion Therapeutics, Inc.2 | | 1,703,194 | | 160,000 | | 140,143 | | 1,723,051 | | | — | | | | 15,852 | |
| Papa Murphy’s Holdings, Inc.2 | | 1,202,000 | | — | | — | | 1,202,000 | | | — | | | | 14,364 | |
| Mahindra Lifespace Developers Ltd. | | 2,157,380 | | — | | — | | 2,157,380 | | | — | | | | 13,728 | |
| TravelCenters of America LLC2 | | 2,023,750 | | — | | — | | 2,023,750 | | | — | | | | 13,701 | |
| MagnaChip Semiconductor Corp.2 | | 2,355,000 | | — | | — | | 2,355,000 | | | — | | | | 12,811 | |
| GoldMoney Inc.2,3,5 | | — | | 3,531,100 | | — | | 3,531,100 | | | — | | | | 9,855 | |
| Mytrah Energy Ltd.2 | | 10,418,000 | | — | | — | | 10,418,000 | | | — | | | | 7,706 | |
| Xenon Pharmaceuticals Inc.2 | | 1,030,000 | | — | | — | | 1,030,000 | | | — | | | | 7,200 | |
| | | | | | | | | | | | | | Value of | |
| | | | | | | | | | | Dividend | | | affiliates at | |
| | | Beginning | | | | | | Ending | | income | | | 3/31/2016 | |
| | | shares | | Additions | | Reductions | | shares | | (000) | | | (000) | |
| Talwalkars Better Value Fitness Ltd. | | 2,389,000 | | — | | — | | 2,389,000 | | $ | — | | | $ | 6,833 | |
| Kennady Diamonds Inc.2 | | 372,952 | | 2,185,000 | | — | | 2,557,952 | | | — | | | | 6,657 | |
| ITT Educational Services, Inc.2 | | 1,869,000 | | — | | — | | 1,869,000 | | | — | | | | 5,775 | |
| Lekoil Ltd. (CDI)2 | | 19,430,400 | | 5,778,000 | | — | | 25,208,400 | | | — | | | | 5,431 | |
| Savannah Petroleum PLC2,5 | | 10,844,000 | | — | | — | | 10,844,000 | | | — | | | | 3,680 | |
| BNK Petroleum Inc.2 | | 12,804,914 | | — | | — | | 12,804,914 | | | — | | | | 3,500 | |
| San Leon Energy PLC2,5 | | 4,003,000 | | — | | — | | 4,003,000 | | | — | | | | 1,674 | |
| Greenko Group PLC5 | | 9,748,155 | | — | | — | | 9,748,155 | | | 14,064 | | | | 141 | |
| Altisource Asset Management Corp.2,7 | | 116,926 | | 11,050 | | 98,344 | | 29,632 | | | — | | | | — | |
| ARC Document Solutions, Inc.2,7 | | 3,760,323 | | — | | 3,760,323 | | — | | | — | | | | — | |
| ChemoCentryx, Inc.2,7 | | 3,467,240 | | — | | 1,977,392 | | 1,489,848 | | | — | | | | — | |
| Delphi Energy Corp.2,7 | | 10,178,500 | | — | | 10,178,500 | | — | | | — | | | | — | |
| Emmi AG7 | | 290,775 | | — | | 27,275 | | 263,500 | | | — | | | | — | |
| EVINE Live Inc., Class A2,7 | | 3,987,540 | | — | | 3,987,540 | | — | | | — | | | | — | |
| EXACT Sciences Corp.2,7 | | 6,801,000 | | 800,000 | | 4,163,438 | | 3,437,562 | | | — | | | | — | |
| Finisar Corp.2,7 | | 5,386,000 | | — | | 485,000 | | 4,901,000 | | | �� | | | | — | |
| Northgate PLC5,7 | | 6,908,399 | | — | | 6,908,399 | | — | | | 512 | | | | — | |
| Novadaq Technologies Inc.2,7 | | 3,084,948 | | — | | 444,082 | | 2,640,866 | | | — | | | | — | |
| RMP Energy Inc.7 | | 6,670,300 | | — | | 6,670,300 | | — | | | — | | | | — | |
| Sinmag Equipment Corp.5,7 | | 3,877,020 | | — | | 3,877,020 | | — | | | — | | | | — | |
| Spire Healthcare Group PLC7 | | 22,412,000 | | — | | 4,612,000 | | 17,800,000 | | | 444 | | | | — | |
| Suprema Inc.5,7 | | 868,200 | | — | | 868,200 | | — | | | — | | | | — | |
| Talmer Bancorp, Inc., Class A7 | | 3,434,028 | | — | | 924,028 | | 2,510,000 | | | 189 | | | | — | |
| Tribhovandas Bhimji Zaveri Ltd.5,7 | | 4,335,732 | | — | | 4,335,732 | | — | | | — | | | | — | |
| Twelve, Inc., Series C, convertible preferred5,7 | | 3,475,770 | | — | | 3,475,770 | | — | | | — | | | | — | |
| | | | | | | | | | | $ | 28,067 | | | $ | 4,304,143 | |
The following footnotes apply to either the individual securities noted or one or more of the securities aggregated and listed as a single line item.
| 1 | Represents an affiliated company as defined under the Investment Company Act of 1940. |
| 2 | Security did not produce income during the last 12 months. |
| 3 | Acquired in a transaction exempt from registration under Rule 144A or Section 4(2) of the Securities Act of 1933. May be resold in the U.S. in transactions exempt from registration, normally to qualified institutional buyers. The total value of all such securities, including those in “Other securities,“ was $1,738,618,000, which represented 6.49% of the net assets of the fund. |
| 4 | This security changed its name during the reporting period. |
| 5 | Valued under fair value procedures adopted by authority of the board of directors. The total value of all such securities, including those in “Other securities,“ was $228,863,000, which represented .85% of the net assets of the fund. |
| 6 | This security was an unaffiliated issuer in its initial period of acquisition at 9/30/2015; it was not publicly disclosed. |
| 7 | Unaffiliated issuer at 3/31/2016. |
Key to abbreviations and symbols
ADR = American Depositary Receipts
CDI = CREST Depository Interest
GDR = Global Depositary Receipts
A$ = Australian dollars
CAD/C$ = Canadian dollars
€= Euros
£ = British pounds
¥ = Japanese yen
S$ = Singapore dollars
THB = Thai baht
See Notes to Financial Statements
Financial statements
Statement of assets and liabilities
at March 31, 2016 | unaudited
(dollars in thousands) |
| | | | |
| Assets: | | | |
| Investment securities, at value: | | | | | | | | |
| Unaffiliated issuers (cost: $18,314,741) | | $ | 22,428,885 | | | | | |
| Affiliated issuers (cost: $3,781,194) | | | 4,304,143 | | | $ | 26,733,028 | |
| Cash denominated in currencies other than U.S. dollars (cost: $113) | | | | | | | 112 | |
| Cash | | | | | | | 5,375 | |
| Unrealized appreciation on open forward currency contracts | | | | | | | 705 | |
| Receivables for: | | | | | | | | |
| Sales of investments | | | 115,107 | | | | | |
| Sales of fund’s shares | | | 42,584 | | | | | |
| Dividends and interest | | | 31,232 | | | | | |
| Other | | | 1,078 | | | | 190,001 | |
| | | | | | | | 26,929,221 | |
| Liabilities: | | | | | | | | |
| Unrealized depreciation on open forward currency contracts | | | | | | | 9,300 | |
| Payables for: | | | | | | | | |
| Purchases of investments | | | 56,928 | | | | | |
| Repurchases of fund’s shares | | | 32,913 | | | | | |
| Closed forward currency contracts | | | 869 | | | | | |
| Investment advisory services | | | 13,872 | | | | | |
| Services provided by related parties | | | 5,937 | | | | | |
| Directors’ deferred compensation | | | 3,064 | | | | | |
| Other | | | 23,876 | | | | 137,459 | |
| Net assets at March 31, 2016 | | | | | | $ | 26,782,462 | |
| | | | | | | | | |
| Net assets consist of: | | | | | | | | |
| Capital paid in on shares of capital stock | | | | | | $ | 22,474,174 | |
| Accumulated net investment loss | | | | | | | (199,681 | ) |
| Accumulated net realized loss | | | | | | | (99,761 | ) |
| Net unrealized appreciation | | | | | | | 4,607,730 | |
| Net assets at March 31, 2016 | | | | | | $ | 26,782,462 | |
See Notes to Financial Statements
(dollars and shares in thousands, except per-share amounts)
Total authorized capital stock — 1,000,000 shares,
$.01 par value (636,065 total shares outstanding)
| | | Net assets | | | Shares
outstanding | | | Net asset value
per share | |
| Class A | | $ | 17,047,014 | | | | 402,267 | | | | $42.38 | |
| Class B | | | 41,083 | | | | 1,067 | | | | 38.49 | |
| Class C | | | 805,115 | | | | 21,245 | | | | 37.90 | |
| Class F-1 | | | 662,717 | | | | 15,805 | | | | 41.93 | |
| Class F-2 | | | 1,621,796 | | | | 37,876 | | | | 42.82 | |
| Class 529-A | | | 945,825 | | | | 22,551 | | | | 41.94 | |
| Class 529-B | | | 6,181 | | | | 159 | | | | 38.84 | |
| Class 529-C | | | 269,226 | | | | 6,975 | | | | 38.60 | |
| Class 529-E | | | 49,482 | | | | 1,210 | | | | 40.90 | |
| Class 529-F-1 | | | 82,032 | | | | 1,938 | | | | 42.34 | |
| Class R-1 | | | 32,222 | | | | 826 | | | | 39.02 | |
| Class R-2 | | | 598,742 | | | | 15,343 | | | | 39.02 | |
| Class R-2E | | | 3,154 | | | | 75 | | | | 42.31 | |
| Class R-3 | | | 743,815 | | | | 18,220 | | | | 40.82 | |
| Class R-4 | | | 712,197 | | | | 16,935 | | | | 42.06 | |
| Class R-5E | | | 9 | | | | — | * | | | 42.40 | |
| Class R-5 | | | 492,951 | | | | 11,372 | | | | 43.35 | |
| Class R-6 | | | 2,668,901 | | | | 62,201 | | | | 42.91 | |
| * | Amount less than one thousand. |
See Notes to Financial Statements
Statement of operations
for the six months ended March 31, 2016 | unaudited
(dollars in thousands) |
| | | | |
| Investment income: | | | | | | | | |
| Income: | | | | | | | | |
| Dividends (net of non-U.S. taxes of $3,120; also includes $28,067 from affiliates) | | $ | 120,881 | | | | | |
| Interest | | | 5,770 | | | $ | 126,651 | |
| | | | | | | | | |
| Fees and expenses*: | | | | | | | | |
| Investment advisory services | | | 82,529 | | | | | |
| Distribution services | | | 32,662 | | | | | |
| Transfer agent services | | | 21,771 | | | | | |
| Administrative services | | | 3,186 | | | | | |
| Reports to shareholders | | | 855 | | | | | |
| Registration statement and prospectus | | | 815 | | | | | |
| Directors’ compensation | | | (7 | ) | | | | |
| Auditing and legal | | | 458 | | | | | |
| Custodian | | | 1,814 | | | | | |
| State and local taxes | | | 1 | | | | | |
| Other | | | 704 | | | | 144,788 | |
| Net investment loss | | | | | | | (18,137 | ) |
| | | | | | | | | |
| Net realized loss and unrealized appreciation: | | | | | | | | |
| Net realized (loss) gain on: | | | | | | | | |
| Investments (net of non-U.S. taxes of $211; also includes $170,856 net gain from affiliates) | | | (261,339 | ) | | | | |
| Forward currency contracts | | | 17,108 | | | | | |
| Currency transactions | | | (239 | ) | | | (244,470 | ) |
| Net unrealized appreciation (depreciation) on: | | | | | | | | |
| Investments (net of non-U.S. taxes of $21,820) | | | 354,149 | | | | | |
| Forward currency contracts | | | (19,025 | ) | | | | |
| Currency translations | | | 736 | | | | 335,860 | |
| Net realized loss and unrealized appreciation | | | | | | | 91,390 | |
| Net increase in net assets resulting from operations | | | | | | $ | 73,253 | |
| * | Additional information related to class-specific fees and expenses is included in the Notes to Financial Statements. |
See Notes to Financial Statements
Statements of changes in net assets
(dollars in thousands)
| | | Six months ended | | | Year ended | |
| | | March 31, 2016* | | | September 30, 2015 | |
| Operations: | | | | | | | | |
| Net investment (loss) income | | $ | (18,137 | ) | | $ | 15,445 | |
| Net realized (loss) gain | | | (244,470 | ) | | | 1,912,240 | |
| Net unrealized appreciation (depreciation) | | | 335,860 | | | | (1,435,307 | ) |
| Net increase in net assets resulting from operations | | | 73,253 | | | | 492,378 | |
| | | | | | | | | |
| Distributions paid to shareholders from net realized gain on investments | | | (1,672,931 | ) | | | (2,489,781 | ) |
| | | | | | | | | |
| Net capital share transactions | | | 2,177,968 | | | | 2,563,419 | |
| | | | | | | | | |
| Total increase in net assets | | | 578,290 | | | | 566,016 | |
| | | | | | | | | |
| Net assets: | | | | | | | | |
| Beginning of period | | | 26,204,172 | | | | 25,638,156 | |
| End of period (including accumulated net investment loss: $(199,681) and $(181,544), respectively) | | $ | 26,782,462 | | | $ | 26,204,172 | |
See Notes to Financial Statements
| Notes to financial statements | unaudited |
1. Organization
SMALLCAP World Fund, Inc. (the “fund”) is registered under the Investment Company Act of 1940 as an open-end, diversified management investment company. The fund seeks to provide long-term growth of capital. Shareholders approved a proposal to reorganize the fund from a Maryland corporation to a Delaware statutory trust. The reorganization may be completed in the next year; however, the fund reserves the right to delay the implementation.
The fund has 18 share classes consisting of five retail share classes (Classes A, B and C, as well as two F share classes, F-1 and F-2), five 529 college savings plan share classes (Classes 529-A, 529-B, 529-C, 529-E and 529-F-1) and eight retirement plan share classes (Classes R-1, R-2, R-2E, R-3, R-4, R-5E, R-5 and R-6). The 529 college savings plan share classes can be used to save for college education. The retirement plan share classes are generally offered only through eligible employer-sponsored retirement plans. The fund’s share classes are described further in the following table:
| Share class | | Initial sales charge | | Contingent deferred sales
charge upon redemption | | Conversion feature |
| Classes A and 529-A | | Up to 5.75% | | None (except 1% for certain redemptions within one year of purchase without an initial sales charge) | | None |
| Classes B and 529-B* | | None | | Declines from 5% to 0% for redemptions within six years of purchase | | Classes B and 529-B convert to Classes A and 529-A, respectively, after eight years |
| Class C | | None | | 1% for redemptions within one year of purchase | | Class C converts to Class F-1 after 10 years |
| Class 529-C | | None | | 1% for redemptions within one year of purchase | | None |
| Class 529-E | | None | | None | | None |
| Classes F-1, F-2 and 529-F-1 | | None | | None | | None |
| Classes R-1, R-2, R-2E, R-3, R-4, R-5E, R-5 and R-6 | | None | | None | | None |
| * | Class B and 529-B shares of the fund are not available for purchase. |
On November 20, 2015, the fund made an additional retirement plan share class (Class R-5E) available for sale pursuant to an amendment to its registration statement filed with the U.S. Securities and Exchange Commission. Refer to the fund’s prospectus for more details.
Holders of all share classes have equal pro rata rights to the assets, dividends and liquidation proceeds of the fund. Each share class has identical voting rights, except for the exclusive right to vote on matters affecting only its class. Share classes have different fees and expenses (“class-specific fees and expenses”), primarily due to different
arrangements for distribution, transfer agent and administrative services. Differences in class-specific fees and expenses will result in differences in net investment income and, therefore, the payment of different per-share dividends by each share class.
2. Significant accounting policies
The fund is an investment company that applies the accounting and reporting guidance issued in Topic 946 by the U.S. Financial Accounting Standards Board. The fund’s financial statements have been prepared to comply with U.S. generally accepted accounting principles (“U.S. GAAP“). These principles require the fund’s investment adviser to make estimates and assumptions that affect reported amounts and disclosures. Actual results could differ from those estimates. Subsequent events, if any, have been evaluated through the date of issuance in the preparation of the financial statements. The fund follows the significant accounting policies described in this section, as well as the valuation policies described in the next section on valuation.
Security transactions and related investment income — Security transactions are recorded by the fund as of the date the trades are executed with brokers. Realized gains and losses from security transactions are determined based on the specific identified cost of the securities. In the event a security is purchased with a delayed payment date, the fund will segregate liquid assets sufficient to meet its payment obligations. Dividend income is recognized on the ex-dividend date and interest income is recognized on an accrual basis. Market discounts, premiums and original issue discounts on fixed-income securities are amortized daily over the expected life of the security.
Class allocations — Income, fees and expenses (other than class-specific fees and expenses) and realized and unrealized gains and losses are allocated daily among the various share classes based on their relative net assets. Class-specific fees and expenses, such as distribution, transfer agent and administrative services, are charged directly to the respective share class.
Dividends and distributions to shareholders — Dividends and distributions to shareholders are recorded on the ex-dividend date.
Currency translation — Assets and liabilities, including investment securities, denominated in currencies other than U.S. dollars are translated into U.S. dollars at the exchange rates supplied by one or more pricing vendors on the valuation date. Purchases and sales of investment securities and income and expenses are translated into U.S. dollars at the exchange rates on the dates of such transactions. The effects of changes in exchange rates on investment securities are included with the net realized gain or loss and net unrealized appreciation or depreciation on investments in the fund’s statement of operations. The realized gain or loss and unrealized appreciation or depreciation resulting from all other transactions denominated in currencies other than U.S. dollars are disclosed separately.
3. Valuation
Capital Research and Management Company (“CRMC”), the fund’s investment adviser, values the fund’s investments at fair value as defined by U.S. GAAP. The net asset value of each share class of the fund is generally determined as of approximately 4:00 p.m. New York time each day the New York Stock Exchange is open.
Methods and inputs — The fund’s investment adviser uses the following methods and inputs to establish the fair value of the fund’s assets and liabilities. Use of particular methods and inputs may vary over time based on availability and relevance as market and economic conditions evolve.
Equity securities are generally valued at the official closing price of, or the last reported sale price on, the exchange or market on which such securities are traded, as of the close of business on the day the securities are being valued or, lacking any sales, at the last available bid price. Prices for each security are taken from the principal exchange or market on which the security trades.
Fixed-income securities, including short-term securities, are generally valued at prices obtained from one or more pricing vendors. Vendors value such securities based on one or more of the inputs described in the following table. The table provides examples of inputs that are commonly relevant for valuing particular classes of fixed-income securities in which the fund is authorized to invest. However, these classifications are not exclusive, and any of the inputs may be used to value any other class of fixed-income security.
| Fixed-income class | | Examples of standard inputs |
| All | | Benchmark yields, transactions, bids, offers, quotations from dealers and trading systems, new issues, spreads and other relationships observed in the markets among comparable securities; and proprietary pricing models such as yield measures calculated using factors such as cash flows, financial or collateral performance and other reference data (collectively referred to as “standard inputs”) |
| Corporate bonds & notes; convertible securities | | Standard inputs and underlying equity of the issuer |
| Bonds & notes of governments & government agencies | | Standard inputs and interest rate volatilities |
When the fund’s investment adviser deems it appropriate to do so (such as when vendor prices are unavailable or deemed to be not representative), fixed-income securities will be valued in good faith at the mean quoted bid and ask prices that are reasonably and timely available (or bid prices, if ask prices are not available) or at prices for securities of comparable maturity, quality and type.
Securities with both fixed-income and equity characteristics, or equity securities traded principally among fixed-income dealers, are generally valued in the manner described for either equity or fixed-income securities, depending on which method is deemed most
appropriate by the fund’s investment adviser. Forward currency contracts are valued at the mean of representative quoted bid and ask prices, generally based on prices supplied by one or more pricing vendors.
Securities and other assets for which representative market quotations are not readily available or are considered unreliable by the fund’s investment adviser are fair valued as determined in good faith under fair valuation guidelines adopted by authority of the fund’s board of directors as further described. The investment adviser follows fair valuation guidelines, consistent with U.S. Securities and Exchange Commission rules and guidance, to consider relevant principles and factors when making fair value determinations. The investment adviser considers relevant indications of value that are reasonably and timely available to it in determining the fair value to be assigned to a particular security, such as the type and cost of the security; contractual or legal restrictions on resale of the security; relevant financial or business developments of the issuer; actively traded similar or related securities; conversion or exchange rights on the security; related corporate actions; significant events occurring after the close of trading in the security; and changes in overall market conditions. In addition, the closing prices of equity securities that trade in markets outside U.S. time zones may be adjusted to reflect significant events that occur after the close of local trading but before the net asset value of each share class of the fund is determined. Fair valuations and valuations of investments that are not actively trading involve judgment and may differ materially from valuations that would have been used had greater market activity occurred.
Processes and structure — The fund’s board of directors has delegated authority to the fund’s investment adviser to make fair value determinations, subject to board oversight. The investment adviser has established a Joint Fair Valuation Committee (the “Fair Valuation Committee”) to administer, implement and oversee the fair valuation process, and to make fair value decisions. The Fair Valuation Committee regularly reviews its own fair value decisions, as well as decisions made under its standing instructions to the investment adviser’s valuation teams. The Fair Valuation Committee reviews changes in fair value measurements from period to period and may, as deemed appropriate, update the fair valuation guidelines to better reflect the results of back testing and address new or evolving issues. The Fair Valuation Committee reports any changes to the fair valuation guidelines to the board of directors with supplemental information to support the changes. The fund’s board and audit committee also regularly review reports that describe fair value determinations and methods.
The fund’s investment adviser has also established a Fixed-Income Pricing Review Group to administer and oversee the fixed-income valuation process, including the use of fixed-income pricing vendors. This group regularly reviews pricing vendor information and market data. Pricing decisions, processes and controls over security valuation are also subject to additional internal reviews, including an annual control self-evaluation program facilitated by the investment adviser’s compliance group.
Classifications — The fund’s investment adviser classifies the fund’s assets and liabilities into three levels based on the inputs used to value the assets or liabilities. Level 1 values are based on quoted prices in active markets for identical securities. Level 2 values are based on significant observable market inputs, such as quoted prices for similar securities and quoted prices in inactive markets. Certain securities trading outside the U.S. may transfer between Level 1 and Level 2 due to valuation adjustments resulting from significant market movements following the close of local trading. Level 3 values are based on significant unobservable inputs that reflect the investment adviser’s determination of assumptions that market participants might reasonably use in valuing the securities. The valuation levels are not necessarily an indication of the risk or liquidity associated with the underlying investment. For example, U.S. government securities are reflected as Level 2 because the inputs used to determine fair value may not always be quoted prices in an active market. The following tables present the fund’s valuation levels as of March 31, 2016 (dollars in thousands):
| | | Investment securities |
| | | Level 1* | | | Level 2 | | | Level 3 | | | Total | |
| Assets: | | | | | | | | | | | | | | | | |
| Common stocks: | | | | | | | | | | | | | | | | |
| Consumer discretionary | | $ | 4,564,709 | | | $ | — | | | $ | 708 | | | $ | 4,565,417 | |
| Health care | | | 4,187,072 | | | | — | | | | 17,960 | | | | 4,205,032 | |
| Information technology | | | 3,596,260 | | | | 9,855 | | | | — | | | | 3,606,115 | |
| Industrials | | | 3,219,813 | | | | — | | | | — | | | | 3,219,813 | |
| Financials | | | 2,582,450 | | | | 18,091 | | | | — | | | | 2,600,541 | |
| Consumer staples | | | 1,855,782 | | | | — | | | | — | | | | 1,855,782 | |
| Materials | | | 1,205,320 | | | | — | | | | — | | | | 1,205,320 | |
| Energy | | | 772,472 | | | | 43,259 | | | | 18,074 | | | | 833,805 | |
| Telecommunication services | | | 239,679 | | | | — | | | | 23,241 | | | | 262,920 | |
| Utilities | | | 189,967 | | | | — | | | | 141 | | | | 190,108 | |
| Miscellaneous | | | 1,298,358 | | | | — | | | | — | | | | 1,298,358 | |
| Preferred securities | | | 119 | | | | — | | | | — | | | | 119 | |
| Rights & warrants | | | 1,503 | | | | 1,181 | | | | 1,278 | | | | 3,962 | |
| Convertible stocks | | | — | | | | 5,584 | | | | 95,075 | | | | 100,659 | |
| Bonds, notes & other debt instruments | | | — | | | | 160,503 | | | | — | | | | 160,503 | |
| Short-term securities | | | — | | | | 2,624,574 | | | | — | | | | 2,624,574 | |
| Total | | $ | 23,713,504 | | | $ | 2,863,047 | | | $ | 156,477 | | | $ | 26,733,028 | |
See the following page for footnote.
| | | Other investments† |
| | | Level 1 | | | Level 2 | | | Level 3 | | | Total | |
| Assets: | | | | | | | | | | | | | | | | |
| Unrealized appreciation on open forward currency contracts | | $ | — | | | $ | 705 | | | $ | — | | | $ | 705 | |
| Liabilities: | | | | | | | | | | | | | | | | |
| Unrealized depreciation on open forward currency contracts | | | — | | | | (9,300 | ) | | | — | | | | (9,300 | ) |
| Total | | $ | — | | | $ | (8,595 | ) | | $ | — | | | $ | (8,595 | ) |
| * | Securities with a value of $9,643,289,000, which represented 36.01% of the net assets of the fund, transferred from Level 2 to Level 1 since the prior fiscal year-end, primarily due to a lack of significant market movements following the close of local trading. |
| † | Forward currency contracts are not included in the investment portfolio. |
4. Risk factors
Investing in the fund may involve certain risks including, but not limited to, those described below.
Market conditions — The prices of, and the income generated by, the securities held by the fund may decline – sometimes rapidly or unpredictably – due to various factors, including events or conditions affecting the general economy or particular industries; overall market changes; local, regional or global political, social or economic instability; governmental or governmental agency responses to economic conditions; and currency exchange rate, interest rate and commodity price fluctuations.
Issuer risks — The prices of, and the income generated by, securities held by the fund may decline in response to various factors directly related to the issuers of such securities, including reduced demand for an issuer’s goods or services, poor management performance and strategic initiatives such as mergers, acquisitions or dispositions and the market response to any such initiatives.
Investing in growth-oriented stocks — Growth-oriented common stocks and other equity-type securities (such as preferred stocks, convertible preferred stocks and convertible bonds) may involve larger price swings and greater potential for loss than other types of investments. These risks may be even greater in the case of smaller capitalization stocks.
Investing in small companies — Investing in smaller companies may pose additional risks. For example, it is often more difficult to value or dispose of small company stocks and more difficult to obtain information about smaller companies than about larger companies. Furthermore, smaller companies often have limited product lines, operating histories, markets and/or financial resources, may be dependent on one or a few key persons for management, and can be more susceptible to losses. Moreover, the prices of their stocks may be more volatile than stocks of larger, more established companies.
Investing outside the U.S. — Securities of issuers domiciled outside the U.S., or with significant operations or revenues outside the U.S., may lose value because of adverse political, social, economic or market developments (including social instability, regional conflicts, terrorism and war) in the countries or regions in which the issuers operate or generate revenue. These securities may also lose value due to changes in foreign currency exchange rates against the U.S. dollar and/or currencies of other countries. Issuers of these securities may be more susceptible to actions of foreign governments, such as the imposition of price controls or punitive taxes, that could adversely impact revenues. Securities markets in certain countries may be more volatile and/or less liquid than those in the U.S. Investments outside the U.S. may also be subject to different accounting practices and different regulatory, legal and reporting standards and practices, and may be more difficult to value, than those in the U.S. In addition, the value of investments outside the U.S. may be reduced by foreign taxes, including foreign withholding taxes on interest and dividends. Further, there may be increased risks of delayed settlement of securities purchased or sold by the fund. The risks of investing outside the U.S. may be heightened in connection with investments in emerging markets.
Investing in emerging markets — Investing in emerging markets may involve risks in addition to and greater than those generally associated with investing in the securities markets of developed countries. For instance, developing countries may have less developed legal and accounting systems than those in developed countries. The governments of these countries may be less stable and more likely to impose capital controls, nationalize a company or industry, place restrictions on foreign ownership and on withdrawing sale proceeds of securities from the country, and/or impose punitive taxes that could adversely affect the prices of securities. In addition, the economies of these countries may be dependent on relatively few industries that are more susceptible to local and global changes. Securities markets in these countries can also be relatively small and have substantially lower trading volumes. As a result, securities issued in these countries may be more volatile and less liquid, and may be more difficult to value, than securities issued in countries with more developed economies and/or markets. Less certainty with respect to security valuations may lead to additional challenges and risks in calculating the fund’s net asset value. Additionally, there may be increased settlement risks for transactions in local securities.
Management — The investment adviser to the fund actively manages the fund’s investments. Consequently, the fund is subject to the risk that the methods and analyses employed by the investment adviser in this process may not produce the desired results. This could cause the fund to lose value or its investment results to lag relevant benchmarks or other funds with similar objectives.
5. Certain investment techniques
Forward currency contracts — The fund has entered into forward currency contracts, which represent agreements to exchange currencies on specific future dates at predetermined rates. The fund’s investment adviser uses forward currency contracts to
manage the fund’s exposure to changes in exchange rates. Upon entering into these contracts, risks may arise from the potential inability of counterparties to meet the terms of their contracts and from possible movements in exchange rates.
On a daily basis, the fund’s investment adviser values forward currency contracts and records unrealized appreciation or depreciation for open forward currency contracts in the fund’s statement of assets and liabilities. Realized gains or losses are recorded at the time the forward currency contract is closed or offset by another contract with the same broker for the same settlement date and currency.
Closed forward currency contracts that have not reached their settlement date are included in the respective receivables or payables for closed forward currency contracts in the fund’s statement of assets and liabilities. Net realized gains or losses from closed forward currency contracts and net unrealized appreciation or depreciation from open forward currency contracts are recorded in the fund’s statement of operations.
The following tables present the financial statement impacts resulting from the fund’s use of forward currency contracts as of, or for the six months ended, March 31, 2016 (dollars in thousands):
| | | | | Assets | | Liabilities |
| | | | | Location on statement of | | | | Location on statement of | | |
| Contract | | Risk type | | assets and liabilities | | Value | | assets and liabilities | | Value |
| Forward currency | | Currency | | Unrealized appreciation on open forward currency contracts | | $ | 705 | | Unrealized depreciation on open forward currency contracts | | $ | 9,300 |
| Forward currency | | Currency | | Receivables for closed forward currency contracts | | | — | | Payables for closed forward currency contracts | | | 869 |
| | | | | | | $ | 705 | | | | $ | 10,169 |
| | | | | Net realized gain | | Net unrealized depreciation |
| Contract | | Risk type | | Location on statement of
operations | | Value | | Location on statement of
operations | | Value |
| Forward currency | | Currency | | Net realized gain on forward currency contracts | | $ | 17,108 | | Net unrealized depreciation on forward currency contracts | | $ | (19,025) |
Collateral — The fund participates in a collateral program due to its use of forward currency contracts. The program calls for the fund to either receive or pledge collateral based on the net gain or loss on unsettled forward currency contracts by counterparty. The purpose of the collateral is to cover potential losses that could occur in the event that either party cannot meet its contractual obligations.
Rights of offset — The fund has entered into enforceable master netting agreements with certain counterparties for forward currency contracts, where on any date amounts payable by each party to the other (in the same currency with respect to the same
transaction) may be closed or offset by each party’s payment obligation. If an early termination date occurs under these agreements following an event of default or termination event, all obligations of each party to its counterparty are settled net through a single payment in a single currency (“close-out netting”). For financial reporting purposes, the fund does not offset financial assets and financial liabilities that are subject to these master netting arrangements in the statement of assets and liabilities.
The following table presents the fund’s forward currency contracts by counterparty that are subject to master netting agreements but that are not offset in the fund’s statement of assets and liabilities. The net amount column shows the impact of offsetting on the fund’s statement of assets and liabilities as of March 31, 2016 (dollars in thousands) if close-out netting was exercised:
| | | | | | Gross amounts not offset in the | | | | |
| | | Gross amounts | | | statement of assets and liabilities and | | | | |
| | | recognized in the | | | subject to a master netting agreement | | | | |
| | | statement of assets | | | Available | | | Non-cash | | | Cash | | | Net | |
| Counterparty | | and liabilities | | | to offset | | | collateral* | | | collateral | | | amount | |
| Assets: | | | | | | | | | | | | | | | | | | | | |
| Bank of America, N.A. | | $ | 649 | | | $ | — | | | $ | (622 | ) | | $ | — | | | $ | 27 | |
| Barclays Bank PLC | | | 54 | | | | (54 | ) | | | — | | | | — | | | | — | |
| HSBC Bank | | | 1 | | | | (1 | ) | | | — | | | | — | | | | — | |
| UBS AG | | | 1 | | | | (1 | ) | | | — | | | | — | | | | — | |
| Total | | $ | 705 | | | $ | (56 | ) | | $ | (622 | ) | | $ | — | | | $ | 27 | |
| Liabilities: | | | | | | | | | | | | | | | | | | | | |
| Bank of New York Mellon | | $ | 41 | | | $ | — | | | $ | (41 | ) | | $ | — | | | $ | — | |
| Barclays Bank PLC | | | 1,283 | | | | (54 | ) | | | (1,181 | ) | | | — | | | | 48 | |
| Citibank | | | 925 | | | | — | | | | — | | | | — | | | | 925 | |
| HSBC Bank | | | 3,162 | | | | (1 | ) | | | (2,857 | ) | | | — | | | | 304 | |
| JPMorgan Chase | | | 892 | | | | — | | | | (855 | ) | | | — | | | | 37 | |
| UBS AG | | | 3,866 | | | | (1 | ) | | | (3,630 | ) | | | — | | | | 235 | |
| Total | | $ | 10,169 | | | $ | (56 | ) | | $ | (8,564 | ) | | $ | — | | | $ | 1,549 | |
| * | Non-cash collateral is shown on a settlement basis. |
6. Taxation and distributions
Federal income taxation — The fund complies with the requirements under Subchapter M of the Internal Revenue Code applicable to mutual funds and intends to distribute substantially all of its net taxable income and net capital gains each year. The fund is not subject to income taxes to the extent such distributions are made. Therefore, no federal income tax provision is required.
As of and during the period ended March 31, 2016, the fund did not have a liability for any unrecognized tax benefits. The fund recognizes interest and penalties, if any, related to unrecognized tax benefits as income tax expense in the statement of operations. During the period, the fund did not incur any interest or penalties.
The fund is not subject to examination by U.S. federal tax authorities for tax years before 2011, by state tax authorities for tax years before 2010 and by tax authorities outside the U.S. for tax years before 2008.
Non-U.S. taxation — Dividend income is recorded net of non-U.S. taxes paid. The fund may file withholding tax reclaims in certain jurisdictions to recover a portion of amounts previously withheld. As a result of rulings from European courts, the fund filed for additional reclaims related to prior years. These reclaims are recorded when the amount is known and there are no significant uncertainties on collectability. Gains realized by the fund on the sale of securities in certain countries are subject to non-U.S. taxes. The fund records a liability based on unrealized gains to provide for potential non-U.S. taxes payable upon the sale of these securities.
Distributions — Distributions paid to shareholders are based on net investment income and net realized gains determined on a tax basis, which may differ from net investment income and net realized gains for financial reporting purposes. These differences are due primarily to different treatment for items such as currency gains and losses; short-term capital gains and losses; capital losses related to sales of certain securities within 30 days of purchase; unrealized appreciation of certain investments in securities outside the U.S; deferred expenses; cost of investments sold; and income on certain investments . The fiscal year in which amounts are distributed may differ from the year in which the net investment income and net realized gains are recorded by the fund for financial reporting purposes.
The components of distributable earnings on a tax basis are reported as of the fund’s most recent year-end. As of September 30, 2015, the components of distributable earnings on a tax basis were as follows (dollars in thousands):
| Undistributed long-term capital gains | | $ | 1,671,404 | |
As of March 31, 2016, the tax basis unrealized appreciation (depreciation) and cost of investment securities were as follows (dollars in thousands):
| Gross unrealized appreciation on investment securities | | $ | 6,974,311 | |
| Gross unrealized depreciation on investment securities | | | (2,349,120 | ) |
| Net unrealized appreciation on investment securities | | | 4,625,191 | |
| Cost of investment securities | | | 22,107,837 | |
No distributions from ordinary income were paid to shareholders during the six months ended March 31, 2016, or for the year ended September 30, 2015. Tax-basis distributions paid to shareholders from long-term capital gains were as follows (dollars in thousands):
| | | Six months ended | | | Year ended | |
| | | March 31, | | | September 30, | |
| Share class | | 2016 | | | 2015 | |
| Class A | | $ | 1,064,711 | | | $ | 1,620,300 | |
| Class B | | | 3,676 | | | | 11,193 | |
| Class C | | | 58,177 | | | | 91,765 | |
| Class F-1 | | | 42,143 | | | | 60,501 | |
| Class F-2 | | | 96,780 | | | | 118,437 | |
| Class 529-A | | | 59,858 | | | | 91,365 | |
| Class 529-B | | | 551 | | | | 1,553 | |
| Class 529-C | | | 18,639 | | | | 28,795 | |
| Class 529-E | | | 3,219 | | | | 4,863 | |
| Class 529-F-1 | | | 5,125 | | | | 7,765 | |
| Class R-1 | | | 2,210 | | | | 3,940 | |
| Class R-2 | | | 41,660 | | | | 69,423 | |
| Class R-2E | | | 77 | | | | 1 | |
| Class R-3 | | | 49,451 | | | | 78,623 | |
| Class R-4 | | | 45,110 | | | | 69,525 | |
| Class R-5E* | | | 1 | | | | | |
| Class R-5 | | | 29,273 | | | | 43,654 | |
| Class R-6 | | | 152,270 | | | | 188,078 | |
| Total | | $ | 1,672,931 | | | $ | 2,489,781 | |
| * | Class R-5E shares were offered beginning November 20, 2015. |
7. Fees and transactions with related parties
CRMC, the fund’s investment adviser, is the parent company of American Funds Distributors,® Inc. (“AFD”), the principal underwriter of the fund’s shares, and American Funds Service Company® (“AFS”), the fund’s transfer agent. CRMC, AFD and AFS are considered related parties to the fund.
Investment advisory services — The fund has an investment advisory and service agreement with CRMC that provides for monthly fees accrued daily. These fees are based on a series of decreasing annual rates beginning with 0.800% on the first $1 billion of daily net assets and decreasing to 0.595% on such assets in excess of $27 billion. For the six months ended March 31, 2016, the investment advisory services fee was $82,529,000, which was equivalent to an annualized rate of 0.630% of average daily net assets.
Class-specific fees and expenses — Expenses that are specific to individual share classes are accrued directly to the respective share class. The principal class-specific fees and expenses are further described below:
Distribution services — The fund has plans of distribution for all share classes, except Class F-2, R-5E, R-5 and R-6 shares. Under the plans, the board of directors approves certain categories of expenses that are used to finance activities primarily intended to sell fund shares and service existing accounts. The plans provide for payments, based on an annualized percentage of average daily net assets, ranging from 0.30% to 1.00% as noted in this section. In some cases, the board of directors has limited the amounts that may be paid to less than the maximum allowed by the plans. All share classes with a plan may use up to 0.25% of average daily net assets to pay service fees, or to compensate AFD for paying service fees, to firms that have entered into agreements with AFD to provide certain shareholder services. The remaining amounts available to be paid under each plan are paid to dealers to compensate them for their sales activities.
For Class A and 529-A shares, distribution-related expenses include the reimbursement of dealer and wholesaler commissions paid by AFD for certain shares sold without a sales charge. These share classes reimburse AFD for amounts billed within the prior 15 months but only to the extent that the overall annual expense limit of 0.25% is not exceeded. As of March 31, 2016, there were no unreimbursed expenses subject to reimbursement for Class A or 529-A shares.
| | Share class | | Currently approved limits | | Plan limits |
| | Class A | | | 0.30 | % | | | 0.30 | % |
| | Class 529-A | | | 0.30 | | | | 0.50 | |
| | Classes B and 529-B | | | 1.00 | | | | 1.00 | |
| | Classes C, 529-C and R-1 | | | 1.00 | | | | 1.00 | |
| | Class R-2 | | | 0.75 | | | | 1.00 | |
| | Class R-2E | | | 0.60 | | | | 0.85 | |
| | Classes 529-E and R-3 | | | 0.50 | | | | 0.75 | |
| | Classes F-1, 529-F-1 and R-4 | | | 0.25 | | | | 0.50 | |
Transfer agent services — The fund has a shareholder services agreement with AFS under which the fund compensates AFS for providing transfer agent services to each of the fund’s share classes. These services include recordkeeping, shareholder communications and transaction processing. In addition, the fund reimburses AFS for amounts paid to third parties for performing transfer agent services on behalf of fund shareholders.
Administrative services — The fund has an administrative services agreement with CRMC under which the fund compensates CRMC for providing administrative services to Class A, C, F, 529 and R shares. These services include, but are not limited to, coordinating, monitoring, assisting and overseeing third parties that provide
services to fund shareholders. Under the agreement, Class A shares pay an annual fee of 0.01% and Class C, F, 529 and R shares pay an annual fee of 0.05% of their respective average daily net assets.
529 plan services — Each 529 share class is subject to service fees to compensate the Virginia College Savings Plan (“Virginia529”) for its oversight and administration of the 529 college savings plan. The quarterly fee is based on a series of decreasing annual rates beginning with 0.10% on the first $30 billion of the net assets invested in Class 529 shares of the American Funds and decreasing to 0.05% on such assets in excess of $70 billion. The fee for any given calendar quarter is accrued and calculated on the basis of the average net assets of Class 529 shares of the American Funds for the last month of the prior calendar quarter. The fee is included in other expenses in the fund’s statement of operations. Virginia529 is not considered a related party to the fund.
For the six months ended March 31, 2016, class-specific expenses under the agreements were as follows (dollars in thousands):
| | | | Distribution | | | Transfer agent | | | Administrative | | | 529 plan |
| | Share class | | services | | | services | | | services | | | services |
| | Class A | | | $19,832 | | | | $15,902 | | | | $839 | | | Not applicable |
| | Class B | | | 260 | | | | 56 | | | | Not applicable | | | Not applicable |
| | Class C | | | 4,094 | | | | 790 | | | | 206 | | | Not applicable |
| | Class F-1 | | | 815 | | | | 477 | | | | 163 | | | Not applicable |
| | Class F-2 | | | Not applicable | | | | 872 | | | | 385 | | | Not applicable |
| | Class 529-A | | | 989 | | | | 803 | | | | 234 | | | $416 |
| | Class 529-B | | | 39 | | | | 9 | | | | 2 | | | 3 |
| | Class 529-C | | | 1,330 | | | | 245 | | | | 67 | | | 120 |
| | Class 529-E | | | 122 | | | | 23 | | | | 12 | | | 22 |
| | Class 529-F-1 | | | — | | | | 70 | | | | 20 | | | 36 |
| | Class R-1 | | | 164 | | | | 24 | | | | 8 | | | Not applicable |
| | Class R-2 | | | 2,259 | | | | 1,256 | | | | 152 | | | Not applicable |
| | Class R-2E | | | 5 | | | | 1 | | | | — | * | | Not applicable |
| | Class R-3 | | | 1,870 | | | | 721 | | | | 188 | | | Not applicable |
| | Class R-4 | | | 883 | | | | 386 | | | | 177 | | | Not applicable |
| | Class R-5E† | | | Not applicable | | | | — | * | | | — | * | | Not applicable |
| | Class R-5 | | | Not applicable | | | | 128 | | | | 119 | | | Not applicable |
| | Class R-6 | | | Not applicable | | | | 8 | | | | 614 | | | Not applicable |
| | Total class-specific expenses | | | $32,662 | | | | $21,771 | | | | $3,186 | | | $597 |
| | * | Amount less than one thousand. |
| | † | Class R-5E shares were offered beginning November 20, 2015. |
Directors’ deferred compensation — Directors who are unaffiliated with CRMC may elect to defer the cash payment of part or all of their compensation. These deferred amounts, which remain as liabilities of the fund, are treated as if invested in shares of the fund or other American Funds. These amounts represent general, unsecured liabilities of the fund and vary according to the total returns of the selected funds. Directors’ compensation of $(7,000) in the fund’s statement of operations reflects $217,000 in current fees (either paid in cash or deferred) and a net decrease of $224,000 in the value of the deferred amounts.
Affiliated officers and directors — Officers and certain directors of the fund are or may be considered to be affiliated with CRMC, AFD and AFS. No affiliated officers or directors received any compensation directly from the fund.
8. Committed line of credit
Effective April 29, 2016, the fund will participate with other funds managed by CRMC in a $500 million credit facility (the “line of credit”) to be utilized for temporary purposes to fund shareholder redemptions. The fund has agreed to pay commitment fees on its pro-rata portion of the line of credit, which will be reflected in other expenses in the fund’s statement of operations.
9. Capital share transactions
Capital share transactions in the fund were as follows (dollars and shares in thousands):
| | | Sales1 | | | Reinvestments of
distributions | | | Repurchases1 | | | Net increase
(decrease) | |
| Share class | | Amount | | | Shares | | | Amount | | | Shares | | | Amount | | | Shares | | | Amount | | | Shares | |
| | | | | | | | | | | | | | | | | | | | | | |
| Six months ended March 31, 2016 | | | | | | | | | | | | | | | | | | |
| | | | | | | | | | | | | | | | | | | |
| Class A | | $ | 1,240,867 | | | | 29,055 | | | $ | 1,047,382 | | | | 24,178 | | | $ | (1,100,872 | ) | | | (25,759 | ) | | $ | 1,187,377 | | | | 27,474 | |
| Class B | | | 706 | | | | 18 | | | | 3,663 | | | | 93 | | | | (23,709 | ) | | | (609 | ) | | | (19,340 | ) | | | (498 | ) |
| Class C | | | 66,125 | | | | 1,703 | | | | 57,696 | | | | 1,486 | | | | (104,302 | ) | | | (2,740 | ) | | | 19,519 | | | | 449 | |
| Class F-1 | | | 97,186 | | | | 2,304 | | | | 41,681 | | | | 973 | | | | (97,389 | ) | | | (2,306 | ) | | | 41,478 | | | | 971 | |
| Class F-2 | | | 334,557 | | | | 7,728 | | | | 93,181 | | | | 2,130 | | | | (202,689 | ) | | | (4,728 | ) | | | 225,049 | | | | 5,130 | |
| Class 529-A | | | 54,607 | | | | 1,285 | | | | 59,840 | | | | 1,396 | | | | (53,735 | ) | | | (1,264 | ) | | | 60,712 | | | | 1,417 | |
| Class 529-B | | | 50 | | | | 1 | | | | 551 | | | | 14 | | | | (3,471 | ) | | | (89 | ) | | | (2,870 | ) | | | (74 | ) |
| Class 529-C | | | 15,054 | | | | 383 | | | | 18,632 | | | | 471 | | | | (19,794 | ) | | | (504 | ) | | | 13,892 | | | | 350 | |
| Class 529-E | | | 2,637 | | | | 63 | | | | 3,219 | | | | 77 | | | | (2,549 | ) | | | (61 | ) | | | 3,307 | | | | 79 | |
| Class 529-F-1 | | | 8,062 | | | | 187 | | | | 5,127 | | | | 119 | | | | (9,095 | ) | | | (208 | ) | | | 4,094 | | | | 98 | |
| Class R-1 | | | 3,431 | | | | 87 | | | | 2,204 | | | | 55 | | | | (7,144 | ) | | | (173 | ) | | | (1,509 | ) | | | (31 | ) |
| Class R-2 | | | 66,426 | | | | 1,681 | | | | 41,614 | | | | 1,041 | | | | (98,698 | ) | | | (2,475 | ) | | | 9,342 | | | | 247 | |
| Class R-2E | | | 3,226 | | | | 75 | | | | 76 | | | | 2 | | | | (130 | ) | | | (3 | ) | | | 3,172 | | | | 74 | |
| Class R-3 | | | 84,760 | | | | 2,044 | | | | 49,429 | | | | 1,184 | | | | (117,421 | ) | | | (2,823 | ) | | | 16,768 | | | | 405 | |
| Class R-4 | | | 81,947 | | | | 1,918 | | | | 45,104 | | | | 1,049 | | | | (86,360 | ) | | | (2,018 | ) | | | 40,691 | | | | 949 | |
| Class R-5E2 | | | 10 | | | | — | 3 | | | — | | | | — | | | | — | | | | — | | | | 10 | | | | — | 3 |
| Class R-5 | | | 61,163 | | | | 1,419 | | | | 29,262 | | | | 661 | | | | (45,185 | ) | | | (1,032 | ) | | | 45,240 | | | | 1,048 | |
| Class R-6 | | | 489,481 | | | | 11,375 | | | | 152,259 | | | | 3,475 | | | | (110,704 | ) | | | (2,544 | ) | | | 531,036 | | | | 12,306 | |
| Total net increase (decrease) | | $ | 2,610,295 | | | | 61,326 | | | $ | 1,650,920 | | | | 38,404 | | | $ | (2,083,247 | ) | | | (49,336 | ) | | $ | 2,177,968 | | | | 50,394 | |
| | | Sales1 | | | Reinvestments of
distributions | | | Repurchases1 | | | Net increase
(decrease) | |
| Share class | | Amount | | | Shares | | | Amount | | | Shares | | | Amount | | | Shares | | | Amount | | | Shares | |
| | | | | | | | | | | | | | | | | | | | | | | | | |
| Year ended September 30, 2015 | | | | | | | | | | | | | | | | | | |
| | | | | | | | | | | | | | | | | | | |
| Class A | | $ | 1,839,672 | | | | 37,984 | | | $ | 1,593,438 | | | | 35,036 | | | $ | (2,142,761 | ) | | | (44,637 | ) | | $ | 1,290,349 | | | | 28,383 | |
| Class B | | | 1,779 | | | | 40 | | | | 11,120 | | | | 265 | | | | (62,586 | ) | | | (1,409 | ) | | | (49,687 | ) | | | (1,104 | ) |
| Class C | | | 148,950 | | | | 3,381 | | | | 90,963 | | | | 2,199 | | | | (206,045 | ) | | | (4,711 | ) | | | 33,868 | | | | 869 | |
| Class F-1 | | | 197,926 | | | | 4,099 | | | | 59,775 | | | | 1,327 | | | | (167,562 | ) | | | (3,535 | ) | | | 90,139 | | | | 1,891 | |
| Class F-2 | | | 551,145 | | | | 11,287 | | | | 113,364 | | | | 2,477 | | | | (274,668 | ) | | | (5,705 | ) | | | 389,841 | | | | 8,059 | |
| Class 529-A | | | 106,546 | | | | 2,226 | | | | 91,346 | | | | 2,027 | | | | (116,697 | ) | | | (2,445 | ) | | | 81,195 | | | | 1,808 | |
| Class 529-B | | | 341 | | | | 7 | | | | 1,551 | | | | 37 | | | | (8,171 | ) | | | (182 | ) | | | (6,279 | ) | | | (138 | ) |
| Class 529-C | | | 32,830 | | | | 734 | | | | 28,787 | | | | 683 | | | | (42,251 | ) | | | (947 | ) | | | 19,366 | | | | 470 | |
| Class 529-E | | | 6,186 | | | | 132 | | | | 4,861 | | | | 110 | | | | (6,858 | ) | | | (147 | ) | | | 4,189 | | | | 95 | |
| Class 529-F-1 | | | 17,050 | | | | 353 | | | | 7,763 | | | | 171 | | | | (15,780 | ) | | | (327 | ) | | | 9,033 | | | | 197 | |
| Class R-1 | | | 8,027 | | | | 178 | | | | 3,930 | | | | 93 | | | | (12,360 | ) | | | (275 | ) | | | (403 | ) | | | (4 | ) |
| Class R-2 | | | 148,953 | | | | 3,305 | | | | 69,391 | | | | 1,633 | | | | (218,478 | ) | | | (4,872 | ) | | | (134 | ) | | | 66 | |
| Class R-2E | | | 73 | | | | 1 | | | | — | | | | — | | | | (10 | ) | | | — | 3 | | | 63 | | | | 1 | |
| Class R-3 | | | 198,149 | | | | 4,222 | | | | 78,595 | | | | 1,783 | | | | (248,364 | ) | | | (5,318 | ) | | | 28,380 | | | | 687 | |
| Class R-4 | | | 180,779 | | | | 3,752 | | | | 69,524 | | | | 1,540 | | | | (207,906 | ) | | | (4,354 | ) | | | 42,397 | | | | 938 | |
| Class R-5 | | | 122,897 | | | | 2,496 | | | | 43,649 | | | | 943 | | | | (110,861 | ) | | | (2,273 | ) | | | 55,685 | | | | 1,166 | |
| Class R-6 | | | 611,527 | | | | 12,665 | | | | 188,059 | | | | 4,106 | | | | (224,169 | ) | | | (4,871 | ) | | | 575,417 | | | | 11,900 | |
| Total net increase (decrease) | | $ | 4,172,830 | | | | 86,862 | | | $ | 2,456,116 | | | | 54,430 | | | $ | (4,065,527 | ) | | | (86,008 | ) | | $ | 2,563,419 | | | | 55,284 | |
| | |
| 1 | Includes exchanges between share classes of the fund. |
| 2 | Class R-5E shares were offered beginning November 20, 2015. |
| 3 | Amount less than one thousand. |
10. Investment transactions
The fund made purchases and sales of investment securities, excluding short-term securities and U.S. government obligations, if any, of $4,012,293,000 and $3,566,806,000, respectively, during the six months ended March 31, 2016.
Financial highlights
| | | | | | Income (loss) from investment operations1 | |
| | | Net asset
value,
beginning
of period | | | Net
investment
(loss)
income | | | Net gains
(losses) on
securities (both
realized and
unrealized) | | | Total from
investment
operations | |
| Class A: | | | | | | | | | | | | | | | | |
| Six months ended 3/31/20163,4 | | $ | 45.04 | | | $ | (.03 | ) | | $ | .20 | | | $ | .17 | |
| Year ended 9/30/2015 | | | 48.66 | | | | .04 | | | | 1.09 | | | | 1.13 | |
| Year ended 9/30/2014 | | | 48.91 | | | | .01 | | | | 2.17 | | | | 2.18 | |
| Year ended 9/30/2013 | | | 39.27 | | | | .06 | | | | 10.12 | | | | 10.18 | |
| Year ended 9/30/2012 | | | 31.45 | | | | .08 | | | | 7.85 | | | | 7.93 | |
| Year ended 9/30/2011 | | | 35.82 | | | | .09 | | | | (3.94 | ) | | | (3.85 | ) |
| Class B: | | | | | | | | | | | | | | | | |
| Six months ended 3/31/20163,4 | | | 41.32 | | | | (.18 | ) | | | .18 | | | | — | |
| Year ended 9/30/2015 | | | 45.33 | | | | (.32 | ) | | | 1.06 | | | | .74 | |
| Year ended 9/30/2014 | | | 46.06 | | | | (.36 | ) | | | 2.06 | | | | 1.70 | |
| Year ended 9/30/2013 | | | 36.95 | | | | (.26 | ) | | | 9.56 | | | | 9.30 | |
| Year ended 9/30/2012 | | | 29.72 | | | | (.20 | ) | | | 7.43 | | | | 7.23 | |
| Year ended 9/30/2011 | | | 33.87 | | | | (.20 | ) | | | (3.71 | ) | | | (3.91 | ) |
| Class C: | | | | | | | | | | | | | | | | |
| Six months ended 3/31/20163,4 | | | 40.73 | | | | (.18 | ) | | | .18 | | | | — | |
| Year ended 9/30/2015 | | | 44.77 | | | | (.32 | ) | | | 1.03 | | | | .71 | |
| Year ended 9/30/2014 | | | 45.54 | | | | (.36 | ) | | | 2.02 | | | | 1.66 | |
| Year ended 9/30/2013 | | | 36.60 | | | | (.26 | ) | | | 9.45 | | | | 9.19 | |
| Year ended 9/30/2012 | | | 29.44 | | | | (.19 | ) | | | 7.35 | | | | 7.16 | |
| Year ended 9/30/2011 | | | 33.61 | | | | (.19 | ) | | | (3.69 | ) | | | (3.88 | ) |
| Class F-1: | | | | | | | | | | | | | | | | |
| Six months ended 3/31/20163,4 | | | 44.60 | | | | (.03 | ) | | | .19 | | | | .16 | |
| Year ended 9/30/2015 | | | 48.23 | | | | .04 | | | | 1.08 | | | | 1.12 | |
| Year ended 9/30/2014 | | | 48.51 | | | | — | | | | 2.15 | | | | 2.15 | |
| Year ended 9/30/2013 | | | 38.94 | | | | .09 | | | | 10.03 | | | | 10.12 | |
| Year ended 9/30/2012 | | | 31.18 | | | | .09 | | | | 7.78 | | | | 7.87 | |
| Year ended 9/30/2011 | | | 35.53 | | | | .10 | | | | (3.92 | ) | | | (3.82 | ) |
| Class F-2: | | | | | | | | | | | | | | | | |
| Six months ended 3/31/20163,4 | | | 45.42 | | | | .03 | | | | .20 | | | | .23 | |
| Year ended 9/30/2015 | | | 48.92 | | | | .17 | | | | 1.08 | | | | 1.25 | |
| Year ended 9/30/2014 | | | 49.03 | | | | .15 | | | | 2.17 | | | | 2.32 | |
| Year ended 9/30/2013 | | | 39.38 | | | | .21 | | | | 10.12 | | | | 10.33 | |
| Year ended 9/30/2012 | | | 31.54 | | | | .20 | | | | 7.86 | | | | 8.06 | |
| Year ended 9/30/2011 | | | 35.93 | | | | .20 | | | | (3.96 | ) | | | (3.76 | ) |
| Class 529-A: | | | | | | | | | | | | | | | | |
| Six months ended 3/31/20163,4 | | | 44.63 | | | | (.05 | ) | | | .19 | | | | .14 | |
| Year ended 9/30/2015 | | | 48.29 | | | | — | | | | 1.09 | | | | 1.09 | |
| Year ended 9/30/2014 | | | 48.59 | | | | (.03 | ) | | | 2.16 | | | | 2.13 | |
| Year ended 9/30/2013 | | | 39.03 | | | | .04 | | | | 10.05 | | | | 10.09 | |
| Year ended 9/30/2012 | | | 31.27 | | | | .07 | | | | 7.80 | | | | 7.87 | |
| Year ended 9/30/2011 | | | 35.63 | | | | .08 | | | | (3.92 | ) | | | (3.84 | ) |
| Dividends and distributions | | | | | | | | | | | | | | | | |
Dividends
(from net
investment
income) | | | Distributions
(from capital
gains) | | | Total
dividends
and
distributions | | | Net asset
value, end
of period | | | Total
return2 | | | Net assets,
end of period
(in millions) | | | Ratio of
expenses
to average
net assets | | | Ratio of net
(loss) income
to average
net assets | |
| $ | — | | | $ | (2.83 | ) | | $ | (2.83 | ) | | $ | 42.38 | | | | .22 | %5 | | $ | 17,047 | | | | 1.10 | %6 | | | (.13 | )%6 |
| | — | | | | (4.75 | ) | | | (4.75 | ) | | | 45.04 | | | | 2.25 | | | | 16,882 | | | | 1.07 | | | | .08 | |
| | — | | | | (2.43 | ) | | | (2.43 | ) | | | 48.66 | | | | 4.43 | | | | 16,857 | | | | 1.07 | | | | .02 | |
| | (.54 | ) | | | — | | | | (.54 | ) | | | 48.91 | | | | 26.29 | | | | 16,454 | | | | 1.13 | | | | .15 | |
| | (.11 | ) | | | — | | | | (.11 | ) | | | 39.27 | | | | 25.26 | | | | 13,557 | | | | 1.14 | | | | .23 | |
| | (.52 | ) | | | — | | | | (.52 | ) | | | 31.45 | | | | (11.01 | ) | | | 11,926 | | | | 1.09 | | | | .23 | |
| | — | | | | (2.83 | ) | | | (2.83 | ) | | | 38.49 | | | | (.19 | )5 | | | 41 | | | | 1.87 | 6 | | | (.92 | )6 |
| | — | | | | (4.75 | ) | | | (4.75 | ) | | | 41.32 | | | | 1.49 | | | | 65 | | | | 1.83 | | | | (.72 | ) |
| | — | | | | (2.43 | ) | | | (2.43 | ) | | | 45.33 | | | | 3.66 | | | | 121 | | | | 1.83 | | | | (.77 | ) |
| | (.19 | ) | | | — | | | | (.19 | ) | | | 46.06 | | | | 25.29 | | | | 185 | | | | 1.89 | | | | (.63 | ) |
| | — | | | | — | | | | — | | | | 36.95 | | | | 24.33 | | | | 214 | | | | 1.90 | | | | (.58 | ) |
| | (.24 | ) | | | — | | | | (.24 | ) | | | 29.72 | | | | (11.68 | ) | | | 266 | | | | 1.86 | | | | (.55 | ) |
| | — | | | | (2.83 | ) | | | (2.83 | ) | | | 37.90 | | | | (.19 | )5 | | | 805 | | | | 1.90 | 6 | | | (.93 | )6 |
| | — | | | | (4.75 | ) | | | (4.75 | ) | | | 40.73 | | | | 1.45 | | | | 847 | | | | 1.87 | | | | (.73 | ) |
| | — | | | | (2.43 | ) | | | (2.43 | ) | | | 44.77 | | | | 3.61 | | | | 892 | | | | 1.87 | | | | (.79 | ) |
| | (.25 | ) | | | — | | | | (.25 | ) | | | 45.54 | | | | 25.26 | | | | 920 | | | | 1.93 | | | | (.65 | ) |
| | — | | | | — | | | | — | | | | 36.60 | | | | 24.32 | | | | 779 | | | | 1.93 | | | | (.56 | ) |
| | (.29 | ) | | | — | | | | (.29 | ) | | | 29.44 | | | | (11.70 | ) | | | 725 | | | | 1.86 | | | | (.53 | ) |
| | — | | | | (2.83 | ) | | | (2.83 | ) | | | 41.93 | | | | .20 | 5 | | | 663 | | | | 1.11 | 6 | | | (.14 | )6 |
| | — | | | | (4.75 | ) | | | (4.75 | ) | | | 44.60 | | | | 2.25 | | | | 662 | | | | 1.07 | | | | .08 | |
| | — | | | | (2.43 | ) | | | (2.43 | ) | | | 48.23 | | | | 4.42 | | | | 624 | | | | 1.09 | | | | — | |
| | (.55 | ) | | | — | | | | (.55 | ) | | | 48.51 | | | | 26.33 | | | | 868 | | | | 1.07 | | | | .21 | |
| | (.11 | ) | | | — | | | | (.11 | ) | | | 38.94 | | | | 25.30 | | | | 655 | | | | 1.12 | | | | .25 | |
| | (.53 | ) | | | — | | | | (.53 | ) | | | 31.18 | | | | (11.02 | ) | | | 583 | | | | 1.08 | | | | .25 | |
| | — | | | | (2.83 | ) | | | (2.83 | ) | | | 42.82 | | | | .36 | 5 | | | 1,622 | | | | .82 | 6 | | | .15 | 6 |
| | — | | | | (4.75 | ) | | | (4.75 | ) | | | 45.42 | | | | 2.50 | | | | 1,487 | | | | .82 | | | | .35 | |
| | — | | | | (2.43 | ) | | | (2.43 | ) | | | 48.92 | | | | 4.72 | | | | 1,208 | | | | .81 | | | | .31 | |
| | (.68 | ) | | | — | | | | (.68 | ) | | | 49.03 | | | | 26.68 | | | | 629 | | | | .82 | | | | .48 | |
| | (.22 | ) | | | — | | | | (.22 | ) | | | 39.38 | | | | 25.69 | | | | 344 | | | | .83 | | | | .55 | |
| | (.63 | ) | | | — | | | | (.63 | ) | | | 31.54 | | | | (10.79 | ) | | | 266 | | | | .82 | | | | .53 | |
| | — | | | | (2.83 | ) | | | (2.83 | ) | | | 41.94 | | | | .17 | 5 | | | 946 | | | | 1.18 | 6 | | | (.22 | )6 |
| | — | | | | (4.75 | ) | | | (4.75 | ) | | | 44.63 | | | | 2.16 | | | | 943 | | | | 1.15 | | | | — | |
| | — | | | | (2.43 | ) | | | (2.43 | ) | | | 48.29 | | | | 4.37 | | | | 933 | | | | 1.15 | | | | (.05 | ) |
| | (.53 | ) | | | — | | | | (.53 | ) | | | 48.59 | | | | 26.18 | | | | 884 | | | | 1.19 | | | | .09 | |
| | (.11 | ) | | | — | | | | (.11 | ) | | | 39.03 | | | | 25.22 | | | | 689 | | | | 1.19 | | | | .19 | |
| | (.52 | ) | | | — | | | | (.52 | ) | | | 31.27 | | | | (11.05 | ) | | | 541 | | | | 1.14 | | | | .20 | |
See page 38 for footnotes.
Financial highlights (continued)
| | | | | | Income (loss) from investment operations1 | |
| | | Net asset
value,
beginning
of period | | | Net
investment
(loss)
income | | | Net gains
(losses) on
securities (both
realized and
unrealized) | | | Total from
investment
operations | |
| Class 529-B: | | | | | | | | | | | | | | | | |
| Six months ended 3/31/20163,4 | | $ | 41.70 | | | $ | (.21 | ) | | $ | .18 | | | $ | (.03 | ) |
| Year ended 9/30/2015 | | | 45.75 | | | | (.37 | ) | | | 1.07 | | | | .70 | |
| Year ended 9/30/2014 | | | 46.52 | | | | (.42 | ) | | | 2.08 | | | | 1.66 | |
| Year ended 9/30/2013 | | | 37.30 | | | | (.30 | ) | | | 9.66 | | | | 9.36 | |
| Year ended 9/30/2012 | | | 30.03 | | | | (.23 | ) | | | 7.50 | | | | 7.27 | |
| Year ended 9/30/2011 | | | 34.23 | | | | (.23 | ) | | | (3.76 | ) | | | (3.99 | ) |
| Class 529-C: | | | | | | | | | | | | | | | | |
| Six months ended 3/31/20163,4 | | | 41.45 | | | | (.20 | ) | | | .18 | | | | (.02 | ) |
| Year ended 9/30/2015 | | | 45.50 | | | | (.35 | ) | | | 1.05 | | | | .70 | |
| Year ended 9/30/2014 | | | 46.27 | | | | (.40 | ) | | | 2.06 | | | | 1.66 | |
| Year ended 9/30/2013 | | | 37.20 | | | | (.29 | ) | | | 9.60 | | | | 9.31 | |
| Year ended 9/30/2012 | | | 29.95 | | | | (.21 | ) | | | 7.46 | | | | 7.25 | |
| Year ended 9/30/2011 | | | 34.19 | | | | (.22 | ) | | | (3.76 | ) | | | (3.98 | ) |
| Class 529-E: | | | | | | | | | | | | | | | | |
| Six months ended 3/31/20163,4 | | | 43.63 | | | | (.09 | ) | | | .19 | | | | .10 | |
| Year ended 9/30/2015 | | | 47.41 | | | | (.11 | ) | | | 1.08 | | | | .97 | |
| Year ended 9/30/2014 | | | 47.87 | | | | (.14 | ) | | | 2.11 | | | | 1.97 | |
| Year ended 9/30/2013 | | | 38.45 | | | | (.06 | ) | | | 9.91 | | | | 9.85 | |
| Year ended 9/30/2012 | | | 30.79 | | | | (.03 | ) | | | 7.70 | | | | 7.67 | |
| Year ended 9/30/2011 | | | 35.11 | | | | (.03 | ) | | | (3.87 | ) | | | (3.90 | ) |
| Class 529-F-1: | | | | | | | | | | | | | | | | |
| Six months ended 3/31/20163,4 | | | 44.98 | | | | — | 7 | | | .19 | | | | .19 | |
| Year ended 9/30/2015 | | | 48.53 | | | | .11 | | | | 1.09 | | | | 1.20 | |
| Year ended 9/30/2014 | | | 48.73 | | | | .08 | | | | 2.15 | | | | 2.23 | |
| Year ended 9/30/2013 | | | 39.14 | | | | .13 | | | | 10.07 | | | | 10.20 | |
| Year ended 9/30/2012 | | | 31.35 | | | | .14 | | | | 7.83 | | | | 7.97 | |
| Year ended 9/30/2011 | | | 35.72 | | | | .15 | | | | (3.94 | ) | | | (3.79 | ) |
| Class R-1: | | | | | | | | | | | | | | | | |
| Six months ended 3/31/20163,4 | | | 41.85 | | | | (.18 | ) | | | .18 | | | | — | |
| Year ended 9/30/2015 | | | 45.85 | | | | (.31 | ) | | | 1.06 | | | | .75 | |
| Year ended 9/30/2014 | | | 46.56 | | | | (.35 | ) | | | 2.07 | | | | 1.72 | |
| Year ended 9/30/2013 | | | 37.40 | | | | (.23 | ) | | | 9.66 | | | | 9.43 | |
| Year ended 9/30/2012 | | | 30.07 | | | | (.17 | ) | | | 7.50 | | | | 7.33 | |
| Year ended 9/30/2011 | | | 34.32 | | | | (.19 | ) | | | (3.77 | ) | | | (3.96 | ) |
| Class R-2: | | | | | | | | | | | | | | | | |
| Six months ended 3/31/20163,4 | | | 41.85 | | | | (.18 | ) | | | .18 | | | | — | |
| Year ended 9/30/2015 | | | 45.84 | | | | (.29 | ) | | | 1.05 | | | | .76 | |
| Year ended 9/30/2014 | | | 46.56 | | | | (.35 | ) | | | 2.06 | | | | 1.71 | |
| Year ended 9/30/2013 | | | 37.39 | | | | (.23 | ) | | | 9.67 | | | | 9.44 | |
| Year ended 9/30/2012 | | | 30.07 | | | | (.18 | ) | | | 7.50 | | | | 7.32 | |
| Year ended 9/30/2011 | | | 34.30 | | | | (.20 | ) | | | (3.76 | ) | | | (3.96 | ) |
| Dividends and distributions | | | | | | | | | | | | | | | | |
Dividends
(from net
investment
income) | | | Distributions
(from capital
gains) | | | Total
dividends
and
distributions | | | Net asset
value, end
of period | | | Total
return2 | | | Net assets,
end of period
(in millions) | | | Ratio of
expenses
to average
net assets | | | Ratio of net
(loss) income
to average
net assets | |
| $ | — | | | $ | (2.83 | ) | | $ | (2.83 | ) | | $ | 38.84 | | | | (.23 | )%5 | | $ | 6 | | | | 2.01 | %6 | | | (1.06 | )%6 |
| | — | | | | (4.75 | ) | | | (4.75 | ) | | | 41.70 | | | | 1.36 | | | | 10 | | | | 1.94 | | | | (.83 | ) |
| | — | | | | (2.43 | ) | | | (2.43 | ) | | | 45.75 | | | | 3.53 | | | | 17 | | | | 1.95 | | | | (.89 | ) |
| | (.14 | ) | | | — | | | | (.14 | ) | | | 46.52 | | | | 25.17 | | | | 25 | | | | 1.99 | | | | (.73 | ) |
| | — | | | | — | | | | — | | | | 37.30 | | | | 24.21 | | | | 30 | | | | 2.01 | | | | (.68 | ) |
| | (.21 | ) | | | — | | | | (.21 | ) | | | 30.03 | | | | (11.78 | ) | | | 36 | | | | 1.95 | | | | (.63 | ) |
| | — | | | | (2.83 | ) | | | (2.83 | ) | | | 38.60 | | | | (.21 | )5 | | | 269 | | | | 1.97 | 6 | | | (1.00 | )6 |
| | — | | | | (4.75 | ) | | | (4.75 | ) | | | 41.45 | | | | 1.37 | | | | 274 | | | | 1.93 | | | | (.78 | ) |
| | — | | | | (2.43 | ) | | | (2.43 | ) | | | 45.50 | | | | 3.53 | | | | 280 | | | | 1.94 | | | | (.85 | ) |
| | (.24 | ) | | | — | | | | (.24 | ) | | | 46.27 | | | | 25.21 | | | | 273 | | | | 1.98 | | | | (.70 | ) |
| | — | | | | — | | | | — | | | | 37.20 | | | | 24.21 | | | | 222 | | | | 2.00 | | | | (.62 | ) |
| | (.26 | ) | | | — | | | | (.26 | ) | | | 29.95 | | | | (11.77 | ) | | | 186 | | | | 1.94 | | | | (.61 | ) |
| | — | | | | (2.83 | ) | | | (2.83 | ) | | | 40.90 | | | | .06 | 5 | | | 49 | | | | 1.39 | 6 | | | (.43 | )6 |
| | — | | | | (4.75 | ) | | | (4.75 | ) | | | 43.63 | | | | 1.95 | | | | 49 | | | | 1.38 | | | | (.23 | ) |
| | — | | | | (2.43 | ) | | | (2.43 | ) | | | 47.41 | | | | 4.10 | | | | 49 | | | | 1.39 | | | | (.30 | ) |
| | (.43 | ) | | | — | | | | (.43 | ) | | | 47.87 | | | | 25.90 | | | | 48 | | | | 1.43 | | | | (.15 | ) |
| | (.01 | ) | | | — | | | | (.01 | ) | | | 38.45 | | | | 24.90 | | | | 38 | | | | 1.45 | | | | (.07 | ) |
| | (.42 | ) | | | — | | | | (.42 | ) | | | 30.79 | | | | (11.32 | ) | | | 31 | | | | 1.43 | | | | (.08 | ) |
| | — | | | | (2.83 | ) | | | (2.83 | ) | | | 42.34 | | | | .27 | 5 | | | 82 | | | | .97 | 6 | | | (.01 | )6 |
| | — | | | | (4.75 | ) | | | (4.75 | ) | | | 44.98 | | | | 2.42 | | | | 83 | | | | .93 | | | | .22 | |
| | — | | | | (2.43 | ) | | | (2.43 | ) | | | 48.53 | | | | 4.57 | | | | 80 | | | | .94 | | | | .16 | |
| | (.61 | ) | | | — | | | | (.61 | ) | | | 48.73 | | | | 26.43 | | | | 73 | | | | .98 | | | | .30 | |
| | (.18 | ) | | | — | | | | (.18 | ) | | | 39.14 | | | | 25.51 | | | | 53 | | | | .99 | | | | .39 | |
| | (.58 | ) | | | — | | | | (.58 | ) | | | 31.35 | | | | (10.90 | ) | | | 43 | | | | .94 | | | | .40 | |
| | — | | | | (2.83 | ) | | | (2.83 | ) | | | 39.02 | | | | (.16 | )5 | | | 32 | | | | 1.85 | 6 | | | (.90 | )6 |
| | — | | | | (4.75 | ) | | | (4.75 | ) | | | 41.85 | | | | 1.48 | | | | 36 | | | | 1.82 | | | | (.68 | ) |
| | — | | | | (2.43 | ) | | | (2.43 | ) | | | 45.85 | | | | 3.66 | | | | 39 | | | | 1.82 | | | | (.74 | ) |
| | (.27 | ) | | | — | | | | (.27 | ) | | | 46.56 | | | | 25.37 | | | | 42 | | | | 1.84 | | | | (.57 | ) |
| | — | | | | — | | | | — | | | | 37.40 | | | | 24.38 | | | | 37 | | | | 1.86 | | | | (.50 | ) |
| | (.29 | ) | | | — | | | | (.29 | ) | | | 30.07 | | | | (11.68 | ) | | | 35 | | | | 1.84 | | | | (.52 | ) |
| | — | | | | (2.83 | ) | | | (2.83 | ) | | | 39.02 | | | | (.18 | )5 | | | 599 | | | | 1.87 | 6 | | | (.91 | )6 |
| | — | | | | (4.75 | ) | | | (4.75 | ) | | | 41.85 | | | | 1.53 | | | | 632 | | | | 1.79 | | | | (.65 | ) |
| | — | | | | (2.43 | ) | | | (2.43 | ) | | | 45.84 | | | | 3.64 | | | | 689 | | | | 1.83 | | | | (.75 | ) |
| | (.27 | ) | | | — | | | | (.27 | ) | | | 46.56 | | | | 25.41 | | | | 736 | | | | 1.83 | | | | (.55 | ) |
| | — | | | | — | | | | — | | | | 37.39 | | | | 24.34 | | | | 647 | | | | 1.89 | | | | (.52 | ) |
| | (.27 | ) | | | — | | | | (.27 | ) | | | 30.07 | | | | (11.72 | ) | | | 581 | | | | 1.86 | | | | (.54 | ) |
See page 38 for footnotes.
Financial highlights (continued)
| | | | | | Income (loss) from investment operations1 | |
| | | Net asset
value,
beginning
of period | | | Net
investment
(loss)
income | | | Net gains
(losses) on
securities (both
realized and
unrealized) | | | Total from
investment
operations | |
| Class R-2E: | | | | | | | | | | | | | | | | |
| Six months ended 3/31/20163,4 | | $ | 45.04 | | | $ | (.06 | ) | | $ | .16 | | | $ | .10 | |
| Year ended 9/30/2015 | | | 48.67 | | | | .01 | | | | 1.11 | | | | 1.12 | |
| Period from 8/29/2014 to 9/30/20144,10 | | | 50.83 | | | | (.01 | ) | | | (2.15 | ) | | | (2.16 | ) |
| Class R-3: | | | | | | | | | | | | | | | | |
| Six months ended 3/31/20163,4 | | | 43.56 | | | | (.09 | ) | | | .18 | | | | .09 | |
| Year ended 9/30/2015 | | | 47.34 | | | | (.10 | ) | | | 1.07 | | | | .97 | |
| Year ended 9/30/2014 | | | 47.79 | | | | (.14 | ) | | | 2.12 | | | | 1.98 | |
| Year ended 9/30/2013 | | | 38.39 | | | | (.05 | ) | | | 9.89 | | | | 9.84 | |
| Year ended 9/30/2012 | | | 30.73 | | | | (.02 | ) | | | 7.68 | | | | 7.66 | |
| Year ended 9/30/2011 | | | 35.03 | | | | (.03 | ) | | | (3.84 | ) | | | (3.87 | ) |
| Class R-4: | | | | | | | | | | | | | | | | |
| Six months ended 3/31/20163,4 | | | 44.71 | | | | (.02 | ) | | | .20 | | | | .18 | |
| Year ended 9/30/2015 | | | 48.33 | | | | .05 | | | | 1.08 | | | | 1.13 | |
| Year ended 9/30/2014 | | | 48.59 | | | | .02 | | | | 2.15 | | | | 2.17 | |
| Year ended 9/30/2013 | | | 39.03 | | | | .09 | | | | 10.04 | | | | 10.13 | |
| Year ended 9/30/2012 | | | 31.25 | | | | .11 | | | | 7.80 | | | | 7.91 | |
| Year ended 9/30/2011 | | | 35.60 | | | | .10 | | | | (3.91 | ) | | | (3.81 | ) |
| Class R-5E: | | | | | | | | | | | | | | | | |
| Period from 11/20/2015 to 3/31/20163,4,11 | | | 47.09 | | | | .03 | | | | (1.89 | ) | | | (1.86 | ) |
| Class R-5: | | | | | | | | | | | | | | | | |
| Six months ended 3/31/20163,4 | | | 45.94 | | | | .04 | | | | .20 | | | | .24 | |
| Year ended 9/30/2015 | | | 49.39 | | | | .20 | | | | 1.10 | | | | 1.30 | |
| Year ended 9/30/2014 | | | 49.46 | | | | .15 | | | | 2.21 | | | | 2.36 | |
| Year ended 9/30/2013 | | | 39.71 | | | | .22 | | | | 10.22 | | | | 10.44 | |
| Year ended 9/30/2012 | | | 31.80 | | | | .22 | | | | 7.93 | | | | 8.15 | |
| Year ended 9/30/2011 | | | 36.21 | | | | .22 | | | | (3.99 | ) | | | (3.77 | ) |
| Class R-6: | | | | | | | | | | | | | | | | |
| Six months ended 3/31/20163,4 | | | 45.49 | | | | .06 | | | | .19 | | | | .25 | |
| Year ended 9/30/2015 | | | 48.93 | | | | .22 | | | | 1.09 | | | | 1.31 | |
| Year ended 9/30/2014 | | | 49.00 | | | | .21 | | | | 2.15 | | | | 2.36 | |
| Year ended 9/30/2013 | | | 39.34 | | | | .25 | | | | 10.12 | | | | 10.37 | |
| Year ended 9/30/2012 | | | 31.52 | | | | .24 | | | | 7.84 | | | | 8.08 | |
| Year ended 9/30/2011 | | | 35.89 | | | | .24 | | | | (3.96 | ) | | | (3.72 | ) |
| | | Six months ended
March 31, | | Year ended September 30 |
| | | 20163,4,5 | | 2015 | | 2014 | | 2013 | | 2012 | | 2011 |
| Portfolio turnover rate for all share classes | | | 15% | | | 33% | | 38% | | 37% | | 35% | | 39% |
| | | | | | | | | | | | | | | | | | | | | | | | | |
See Notes to Financial Statements
| Dividends and distributions | | | | | | | | | | | | | | | | |
Dividends
(from net
investment
income) | | | Distributions
(from capital
gains) | | | Total
dividends
and
distributions | | | Net asset
value, end
of period | | | Total
return2 | | | Net assets,
end of period
(in millions) | | | Ratio of
expenses
to average
net assets | | | Ratio of net
(loss) income
to average
net assets | |
| $ | — | | | $ | (2.83 | ) | | $ | (2.83 | ) | | $ | 42.31 | | | | .06 | %5 | | $ | 3 | | | | 1.41 | %6 | | | (.29 | )%6 |
| | — | | | | (4.75 | ) | | | (4.75 | ) | | | 45.04 | | | | 2.23 | 8 | | | — | 9 | | | 1.26 | 8 | | | .01 | 8 |
| | | | | | | | | | | | | | | | | | | | | | | | | | | | | | | |
| | — | | | | — | | | | — | | | | 48.67 | | | | (4.25 | )5,8 | | | — | 9 | | | .08 | 5,8 | | | (.01 | )5,8 |
| | — | | | | (2.83 | ) | | | (2.83 | ) | | | 40.82 | | | | .06 | 5 | | | 744 | | | | 1.40 | 6 | | | (.44 | )6 |
| | — | | | | (4.75 | ) | | | (4.75 | ) | | | 43.56 | | | | 1.93 | | | | 776 | | | | 1.37 | | | | (.22 | ) |
| | — | | | | (2.43 | ) | | | (2.43 | ) | | | 47.34 | | | | 4.12 | | | | 811 | | | | 1.39 | | | | (.30 | ) |
| | (.44 | ) | | | — | | | | (.44 | ) | | | 47.79 | | | | 25.90 | | | | 836 | | | | 1.40 | | | | (.12 | ) |
| | — | | | | — | | | | — | | | | 38.39 | | | | 24.92 | | | | 694 | | | | 1.42 | | | | (.05 | ) |
| | (.43 | ) | | | — | | | | (.43 | ) | | | 30.73 | | | | (11.28 | ) | | | 586 | | | | 1.41 | | | | (.08 | ) |
| | — | | | | (2.83 | ) | | | (2.83 | ) | | | 42.06 | | | | .25 | 5 | | | 712 | | | | 1.07 | 6 | | | (.10 | )6 |
| | — | | | | (4.75 | ) | | | (4.75 | ) | | | 44.71 | | | | 2.27 | | | | 715 | | | | 1.05 | | | | .10 | |
| | — | | | | (2.43 | ) | | | (2.43 | ) | | | 48.33 | | | | 4.46 | | | | 727 | | | | 1.06 | | | | .03 | |
| | (.57 | ) | | | — | | | | (.57 | ) | | | 48.59 | | | | 26.31 | | | | 712 | | | | 1.07 | | | | .21 | |
| | (.13 | ) | | | — | | | | (.13 | ) | | | 39.03 | | | | 25.38 | | | | 550 | | | | 1.08 | | | | .30 | |
| | (.54 | ) | | | — | | | | (.54 | ) | | | 31.25 | | | | (10.98 | ) | | | 441 | | | | 1.07 | | | | .26 | |
| | — | | | | (2.83 | ) | | | (2.83 | ) | | | 42.40 | | | | (4.07 | )5 | | | — | 9 | | | .33 | 5 | | | .07 | 5 |
| | — | | | | (2.83 | ) | | | (2.83 | ) | | | 43.35 | | | | .40 | 5 | | | 493 | | | | .76 | 6 | | | .20 | 6 |
| | — | | | | (4.75 | ) | | | (4.75 | ) | | | 45.94 | | | | 2.57 | | | | 474 | | | | .75 | | | | .40 | |
| | — | | | | (2.43 | ) | | | (2.43 | ) | | | 49.39 | | | | 4.78 | | | | 452 | | | | .76 | | | | .29 | |
| | (.69 | ) | | | — | | | | (.69 | ) | | | 49.46 | | | | 26.72 | | | | 550 | | | | .77 | | | | .51 | |
| | (.24 | ) | | | — | | | | (.24 | ) | | | 39.71 | | | | 25.77 | | | | 384 | | | | .78 | | | | .60 | |
| | (.64 | ) | | | — | | | | (.64 | ) | | | 31.80 | | | | (10.74 | ) | | | 314 | | | | .77 | | | | .56 | |
| | — | | | | (2.83 | ) | | | (2.83 | ) | | | 42.91 | | | | .40 | 5 | | | 2,669 | | | | .71 | 6 | | | .26 | 6 |
| | — | | | | (4.75 | ) | | | (4.75 | ) | | | 45.49 | | | | 2.63 | | | | 2,269 | | | | .71 | | | | .45 | |
| | — | | | | (2.43 | ) | | | (2.43 | ) | | | 48.93 | | | | 4.82 | | | | 1,859 | | | | .71 | | | | .41 | |
| | (.71 | ) | | | — | | | | (.71 | ) | | | 49.00 | | | | 26.80 | | | | 1,206 | | | | .72 | | | | .57 | |
| | (.26 | ) | | | — | | | | (.26 | ) | | | 39.34 | | | | 25.79 | | | | 768 | | | | .73 | | | | .67 | |
| | (.65 | ) | | | — | | | | (.65 | ) | | | 31.52 | | | | (10.68 | ) | | | 494 | | | | .72 | | | | .64 | |
See page 38 for footnotes.
Financial highlights (continued)
| 1 | Based on average shares outstanding. |
| 2 | Total returns exclude any applicable sales charges, including contingent deferred sales charges. |
| 3 | Unaudited. |
| 4 | Based on operations for the period shown and, accordingly, is not representative of a full year. |
| 5 | Not annualized. |
| 6 | Annualized. |
| 7 | Amount less than $.01. |
| 8 | All or a significant portion of assets in this class consisted of seed capital invested by CRMC and/or its affiliates. Fees for distribution services are not charged or accrued on these seed capital assets. If such fees were paid by the fund on seed capital assets, fund expenses would have been higher and net income and total return would have been lower. |
| 9 | Amount less than $1 million. |
| 10 | Class R-2E shares were offered beginning August 29, 2014. |
| 11 | Class R-5E shares were offered beginning November 20, 2015. |
As a fund shareholder, you incur two types of costs: (1) transaction costs, such as initial sales charges on purchase payments and contingent deferred sales charges on redemptions (loads), and (2) ongoing costs, including management fees, distribution and service (12b-1) fees, and other expenses. This example is intended to help you understand your ongoing costs (in dollars) of investing in the fund so you can compare these costs with the ongoing costs of investing in other mutual funds. The example is based on an investment of $1,000 invested at the beginning of the period and held for the entire six-month period (October 1, 2015, through March 31, 2016).
Actual expenses:
The first line of each share class in the table on the following page provides information about actual account values and actual expenses. You may use the information in this line, together with the amount you invested, to estimate the expenses that you paid over the period. Simply divide your account value by $1,000 (for example, an $8,600 account value divided by $1,000 = 8.6), then multiply the result by the number in the first line under the heading entitled “Expenses paid during period” to estimate the expenses you paid on your account during this period.
Hypothetical example for comparison purposes:
The second line of each share class in the table on the following page provides information about hypothetical account values and hypothetical expenses based on the actual expense ratio for the share class and an assumed rate of return of 5.00% per year before expenses, which is not the actual return of the share class. The hypothetical account values and expenses may not be used to estimate the actual ending account balance or expenses you paid for the period. You may use this information to compare the ongoing costs of investing in the fund and other funds. To do so, compare this 5.00% hypothetical example with the 5.00% hypothetical examples that appear in the shareholder reports of the other funds.
Notes:
Retirement plan participants may be subject to certain fees charged by the plan sponsor, and Class F-1, F-2 and 529-F-1 shareholders may be subject to fees charged by financial intermediaries, typically ranging from 0.75% to 1.50% of assets annually depending on services offered. You can estimate the impact of these fees by adding the amount of the fees to the total estimated expenses you paid on your account during the period as calculated above. In addition, your ending account value would be lower by the amount of these fees.
Note that the expenses shown in the table on the following page are meant to highlight your ongoing costs only and do not reflect any transactional costs, such as sales charges (loads). Therefore, the second line of each share class in the table is useful in comparing ongoing costs only and will not help you determine the relative total costs of owning different funds. In addition, if these transactional costs were included, your costs would have been higher.
| | | Beginning | | | Ending | | | | | | | |
| | | account value | | | account value | | | Expenses paid | | | Annualized | |
| | | 10/1/2015 | | | 3/31/2016 | | | during period* | | | expense ratio | |
| Class A - actual return | | $ | 1,000.00 | | | $ | 1,002.24 | | | $ | 5.51 | | | | 1.10 | % |
| Class A - assumed 5% return | | | 1,000.00 | | | | 1,019.50 | | | | 5.55 | | | | 1.10 | |
| Class B - actual return | | | 1,000.00 | | | | 998.12 | | | | 9.34 | | | | 1.87 | |
| Class B - assumed 5% return | | | 1,000.00 | | | | 1,015.65 | | | | 9.42 | | | | 1.87 | |
| Class C - actual return | | | 1,000.00 | | | | 998.13 | | | | 9.49 | | | | 1.90 | |
| Class C - assumed 5% return | | | 1,000.00 | | | | 1,015.50 | | | | 9.57 | | | | 1.90 | |
| Class F-1 - actual return | | | 1,000.00 | | | | 1,002.00 | | | | 5.56 | | | | 1.11 | |
| Class F-1 - assumed 5% return | | | 1,000.00 | | | | 1,019.45 | | | | 5.60 | | | | 1.11 | |
| Class F-2 - actual return | | | 1,000.00 | | | | 1,003.57 | | | | 4.11 | | | | .82 | |
| Class F-2 - assumed 5% return | | | 1,000.00 | | | | 1,020.90 | | | | 4.14 | | | | .82 | |
| Class 529-A - actual return | | | 1,000.00 | | | | 1,001.74 | | | | 5.91 | | | | 1.18 | |
| Class 529-A - assumed 5% return | | | 1,000.00 | | | | 1,019.10 | | | | 5.96 | | | | 1.18 | |
| Class 529-B - actual return | | | 1,000.00 | | | | 997.68 | | | | 10.04 | | | | 2.01 | |
| Class 529-B - assumed 5% return | | | 1,000.00 | | | | 1,014.95 | | | | 10.13 | | | | 2.01 | |
| Class 529-C - actual return | | | 1,000.00 | | | | 997.89 | | | | 9.84 | | | | 1.97 | |
| Class 529-C - assumed 5% return | | | 1,000.00 | | | | 1,015.15 | | | | 9.92 | | | | 1.97 | |
| Class 529-E - actual return | | | 1,000.00 | | | | 1,000.62 | | | | 6.95 | | | | 1.39 | |
| Class 529-E - assumed 5% return | | | 1,000.00 | | | | 1,018.05 | | | | 7.01 | | | | 1.39 | |
| Class 529-F-1 - actual return | | | 1,000.00 | | | | 1,002.70 | | | | 4.86 | | | | .97 | |
| Class 529-F-1 - assumed 5% return | | | 1,000.00 | | | | 1,020.15 | | | | 4.90 | | | | .97 | |
| Class R-1 - actual return | | | 1,000.00 | | | | 998.40 | | | | 9.24 | | | | 1.85 | |
| Class R-1 - assumed 5% return | | | 1,000.00 | | | | 1,015.75 | | | | 9.32 | | | | 1.85 | |
| Class R-2 - actual return | | | 1,000.00 | | | | 998.17 | | | | 9.34 | | | | 1.87 | |
| Class R-2 - assumed 5% return | | | 1,000.00 | | | | 1,015.65 | | | | 9.42 | | | | 1.87 | |
| Class R-2E - actual return | | | 1,000.00 | | | | 1,000.63 | | | | 7.05 | | | | 1.41 | |
| Class R-2E - assumed 5% return | | | 1,000.00 | | | | 1,017.95 | | | | 7.11 | | | | 1.41 | |
| Class R-3 - actual return | | | 1,000.00 | | | | 1,000.62 | | | | 7.00 | | | | 1.40 | |
| Class R-3 - assumed 5% return | | | 1,000.00 | | | | 1,018.00 | | | | 7.06 | | | | 1.40 | |
| Class R-4 - actual return | | | 1,000.00 | | | | 1,002.46 | | | | 5.36 | | | | 1.07 | |
| Class R-4 - assumed 5% return | | | 1,000.00 | | | | 1,019.65 | | | | 5.40 | | | | 1.07 | |
| Class R-5E - actual return† | | | 1,000.00 | | | | 959.26 | | | | 3.25 | | | | .92 | |
| Class R-5E - assumed 5% return† | | | 1,000.00 | | | | 1,020.40 | | | | 4.65 | | | | .92 | |
| Class R-5 - actual return | | | 1,000.00 | | | | 1,003.99 | | | | 3.81 | | | | .76 | |
| Class R-5 - assumed 5% return | | | 1,000.00 | | | | 1,021.20 | | | | 3.84 | | | | .76 | |
| Class R-6 - actual return | | | 1,000.00 | | | | 1,004.01 | | | | 3.56 | | | | .71 | |
| Class R-6 - assumed 5% return | | | 1,000.00 | | | | 1,021.45 | | | | 3.59 | | | | .71 | |
| | |
| * | The “expenses paid during period” are equal to the “annualized expense ratio,” multiplied by the average account value over the period, multiplied by the number of days in the period, and divided by 366 (to reflect the one-half year period). |
| † | The period for the “annualized expense ratio” and “actual return” line is based on the number of days since the initial sale of the share class on November 20, 2015. The “assumed 5% return” line is based on 183 days. |
| | |
This page was intentionally left blank.
This page was intentionally left blank.
This page was intentionally left blank.
Offices of the fund and of the investment adviser
Capital Research and Management Company
333 South Hope Street
Los Angeles, CA 90071-1406
6455 Irvine Center Drive
Irvine, CA 92618-4518
Transfer agent for shareholder accounts
American Funds Service Company
(Write to the address near you.)
P.O. Box 6007
Indianapolis, IN 46206-6007
P.O. Box 2280
Norfolk, VA 23501-2280
Custodian of assets
State Street Bank and Trust Company
One Lincoln Street
Boston, MA 02111
Counsel
Dechert LLP
One Bush Street, Suite 1600
San Francisco, CA 94104-4446
Independent registered public accounting firm
Deloitte & Touche LLP
695 Town Center Drive
Suite 1200
Costa Mesa, CA 92626-7188
Principal underwriter
American Funds Distributors, Inc.
333 South Hope Street
Los Angeles, CA 90071-1406
Investors should carefully consider investment objectives, risks, charges and expenses. This and other important information is contained in the fund prospectus and summary prospectus, which can be obtained from your financial professional and should be read carefully before investing. You may also call American Funds Service Company (AFS) at (800) 421-4225 or visit the American Funds website at americanfunds.com.
“American Funds Proxy Voting Procedures and Principles” — which describes how we vote proxies relating to portfolio securities — is available on the American Funds website or upon request by calling AFS. The fund files its proxy voting record with the U.S. Securities and Exchange Commission (SEC) for the 12 months ended June 30 by August 31. The proxy voting record is available free of charge on the SEC website at sec.gov and on the American Funds website.
A complete March 31, 2016, portfolio of SMALLCAP World Fund’s investments is available free of charge by calling AFS or visiting the SEC website (where it is part of Form N-CSR).
SMALLCAP World Fund files a complete list of its portfolio holdings with the SEC for the first and third quarters of each fiscal year on Form N-Q. This filing is available free of charge on the SEC website. You may also review or, for a fee, copy this filing at the SEC’s Public Reference Room in Washington, D.C. Additional information regarding the operation of the Public Reference Room may be obtained by calling the SEC’s Office of Investor Education and Advocacy at (800) SEC-0330. Additionally, the list of portfolio holdings is available by calling AFS.
This report is for the information of shareholders of SMALLCAP World Fund, but it also may be used as sales literature when preceded or accompanied by the current prospectus or summary prospectus, which gives details about charges, expenses, investment objectives and operating policies of the fund. If used as sales material after June 30, 2016, this report must be accompanied by an American Funds statistical update for the most recently completed calendar quarter.
The American Funds AdvantageSM
Since 1931, American Funds, part of Capital Group, has helped investors pursue long-term investment success. Our consistent approach — in combination with The Capital SystemSM — has resulted in a superior long-term track record.
| | Aligned with investor success |
| | We base our decisions on a long-term perspective, which we believe aligns our goals with the interests of our clients. Our portfolio managers average 27 years of investment experience, including 22 years at our company, reflecting a career commitment to our long-term approach.1 |
| | |
| | The Capital SystemSM |
| | The Capital System combines individual accountability with teamwork. Funds using The Capital System are divided into portions that are managed independently by investment professionals with diverse backgrounds, ages and investment approaches. An extensive global research effort is the backbone of our system. |
| | |
| | Superior long-term track record |
| | Our equity funds have beaten their Lipper peer indexes in 91% of 10-year periods and 95% of 20-year periods. Our fixed-income funds have beaten their Lipper indexes in 58% of 10-year periods and 58% of 20-year periods.2 Our fund management fees have been among the lowest in the industry.3 |
| | 1 | Portfolio manager experience as of December 31, 2015. |
| | 2 | Based on Class A share results for rolling periods through December 31, 2015. Periods covered are the shorter of the fund’s lifetime or since the comparable Lipper index inception date (except Capital Income Builder and SMALLCAP World Fund, for which the Lipper average was used). |
| | 3 | On average, our management fees were in the lowest quintile 68% of the time, based on the 20-year period ended December 31, 2015, versus comparable Lipper categories, excluding funds of funds. |

ITEM 2 – Code of Ethics
Not applicable for filing of semi-annual reports to shareholders.
ITEM 3 – Audit Committee Financial Expert
Not applicable for filing of semi-annual reports to shareholders.
ITEM 4 – Principal Accountant Fees and Services
Not applicable for filing of semi-annual reports to shareholders.
ITEM 5 – Audit Committee of Listed Registrants
Not applicable to this Registrant, insofar as the Registrant is not a listed issuer as defined in Rule 10A-3 under the Securities Exchange Act of 1934.
ITEM 6 – Schedule of Investments
SMALLCAP World Fund®
Investment portfolio
March 31, 2016
Common stocks 89.03%
Consumer discretionary 17.05% | Shares | Value
(000) |
| Domino’s Pizza, Inc.1 | 2,828,769 | $373,001 |
| Lions Gate Entertainment Corp.1 | 8,102,000 | 177,029 |
| Dollarama Inc. | 2,005,000 | 141,087 |
| Ted Baker PLC1 | 3,167,993 | 123,897 |
| Paddy Power Betfair PLC | 886,051 | 123,610 |
| GVC Holdings PLC1 | 16,741,307 | 121,426 |
| BCA Marketplace PLC1 | 42,870,000 | 112,369 |
| YOOX Net-A-Porter Group SPA2 | 3,288,469 | 100,920 |
| Domino’s Pizza Enterprises Ltd. | 1,969,956 | 86,799 |
| Jarden Corp.2 | 1,293,750 | 76,267 |
| Cedar Fair, LP | 1,240,000 | 73,718 |
| zooplus AG, non-registered shares1,2 | 527,778 | 72,367 |
| Mr Price Group Ltd. | 5,974,626 | 71,803 |
| POYA International Co., Ltd.1 | 6,669,216 | 70,870 |
| Tesla Motors, Inc.2 | 303,200 | 69,666 |
| ASOS PLC2 | 1,491,551 | 69,623 |
| Tele Columbus AG1,2 | 6,696,000 | 68,445 |
| Greene King PLC | 4,931,618 | 61,729 |
| Gentex Corp. | 3,909,134 | 61,334 |
| Five Below, Inc.2 | 1,477,000 | 61,059 |
| Jumbo SA2 | 4,487,964 | 60,772 |
| Ladbrokes PLC | 33,707,600 | 56,497 |
| Matahari Department Store Tbk PT | 40,820,000 | 56,489 |
| ASKUL Corp. | 1,355,000 | 55,141 |
| Entertainment One Ltd.1 | 25,150,631 | 54,798 |
| Evolution Gaming Group AB2 | 1,545,000 | 53,953 |
| Brinker International, Inc. | 1,162,500 | 53,417 |
| TopBuild Corp.2 | 1,745,000 | 51,896 |
| Penske Automotive Group, Inc. | 1,342,500 | 50,881 |
| TOD’S SpA | 707,500 | 50,397 |
| Melco International Development Ltd. | 35,782,844 | 49,818 |
| Tiffany & Co. | 667,000 | 48,944 |
| Planet Fitness, Inc., Class A2 | 2,926,286 | 47,523 |
| Installed Building Products, Inc.1,2 | 1,704,039 | 45,344 |
| Cie. Plastic Omnium SA | 1,295,995 | 44,573 |
| Eclat Textile Co., Ltd. | 3,381,840 | 44,501 |
| Lands’ End, Inc.1,2 | 1,704,000 | 43,469 |
| Ctrip.com International, Ltd. (ADR)2 | 918,500 | 40,653 |
| Brunello Cucinelli SpA | 2,117,281 | 40,090 |
| Belmond Ltd., Class A2 | 4,217,000 | 40,019 |
| Nord Anglia Education, Inc.2 | 1,910,000 | 39,900 |
| Poundland Group PLC1 | 17,443,506 | 39,083 |
| Jubilant FoodWorks Ltd. | 1,960,788 | 37,806 |
| Sleep Country Canada Holdings Inc.1 | 2,374,188 | 35,665 |
| Stella International Holdings Ltd. | 15,079,500 | 35,457 |
| Kyoritsu Maintenance Co.,Ltd. | 409,700 | 35,348 |
| Moncler SpA | 2,056,400 | 34,749 |
SMALLCAP World Fund — Page 1 of 15
Common stocks
Consumer discretionary (continued) | Shares | Value
(000) |
| Ace Hardware Indonesia Tbk PT | 488,535,200 | $32,974 |
| Pacific Textiles Holdings Ltd. | 22,275,000 | 32,160 |
| Inchcape PLC | 2,899,460 | 30,129 |
| Page Industries Ltd. | 162,500 | 29,733 |
| Daily Mail and General Trust PLC, Class A, nonvoting | 2,971,000 | 29,699 |
| John Wiley & Sons, Inc., Class A | 604,800 | 29,569 |
| Century Communities, Inc.1,2 | 1,716,000 | 29,292 |
| Mothercare PLC1,2 | 11,100,000 | 29,015 |
| ServiceMaster Global Holdings, Inc.2 | 753,000 | 28,373 |
| Six Flags Entertainment Corp. | 500,000 | 27,745 |
| Ocado Group PLC2 | 6,533,708 | 27,223 |
| CalAtlantic Group, Inc. | 750,800 | 25,092 |
| TAKKT AG | 1,302,278 | 25,014 |
| Cox & Kings Ltd.1 | 8,868,825 | 24,167 |
| Chow Sang Sang Holdings International Ltd. | 15,940,000 | 24,041 |
| KB Home | 1,627,000 | 23,234 |
| Whistler Blackcomb Holdings Inc. | 1,124,442 | 23,168 |
| Beauty Community PCL1 | 150,000,000 | 23,024 |
| Boyd Gaming Corp.2 | 1,049,000 | 21,672 |
| ClubCorp Holdings, Inc. | 1,541,000 | 21,636 |
| Eros International PLC, Class A2 | 1,871,666 | 21,543 |
| Estácio Participações SA, ordinary nominative | 6,425,000 | 21,121 |
| Hathway Cable and Datacom Ltd.2 | 35,876,000 | 20,993 |
| DO & CO AG, non-registered shares | 172,755 | 20,837 |
| World Wrestling Entertainment, Inc., Class A | 1,140,000 | 20,132 |
| Texas Roadhouse, Inc. | 460,000 | 20,047 |
| M.D.C. Holdings, Inc. | 790,000 | 19,797 |
| Titan Co. Ltd. | 3,760,000 | 19,254 |
| Cosmo Lady (China) Holdings Co. Ltd. | 23,804,000 | 19,240 |
| Cavco Industries, Inc.2 | 204,000 | 19,066 |
| Lennar Corp., Class A | 394,000 | 19,054 |
| Chipotle Mexican Grill, Inc.2 | 39,890 | 18,787 |
| GfK SE | 463,000 | 17,418 |
| Mattress Firm Holding Corp.2 | 400,000 | 16,956 |
| Grand Canyon Education Inc.2 | 393,000 | 16,797 |
| B2W - Cia. Digital, ordinary nominative2 | 3,911,100 | 15,555 |
| D.R. Horton, Inc. | 490,000 | 14,813 |
| Topps Tiles PLC | 6,975,828 | 14,728 |
| Tarena International, Inc., Class A (ADR)2 | 1,343,520 | 14,523 |
| Papa Murphy’s Holdings, Inc.1,2 | 1,202,000 | 14,364 |
| Techtronic Industries Co. Ltd. | 3,570,000 | 14,105 |
| Toll Brothers, Inc.2 | 471,800 | 13,923 |
| I.T Limited | 57,710,000 | 13,912 |
| TravelCenters of America LLC1,2 | 2,023,750 | 13,701 |
| Cabela’s Inc.2 | 279,000 | 13,584 |
| Valeo SA, non-registered shares | 86,000 | 13,387 |
| Melco Crown Entertainment Ltd. (ADR) | 800,000 | 13,208 |
| Mulberry Group PLC | 931,173 | 13,173 |
| Wowprime Corp. | 2,928,000 | 12,691 |
| Playmates Toys Ltd. | 57,268,000 | 11,886 |
| Hankook Tire Co., Ltd. | 233,473 | 11,106 |
| Zhongsheng Group Holdings Ltd. | 22,854,000 | 11,077 |
| Skechers USA, Inc., Class A2 | 360,000 | 10,962 |
| William Hill PLC | 2,047,800 | 9,618 |
| PT Multipolar Tbk | 317,486,000 | 9,242 |
SMALLCAP World Fund — Page 2 of 15
Common stocks
Consumer discretionary (continued) | Shares | Value
(000) |
| DSW Inc., Class A | 320,000 | $8,845 |
| OSIM International Ltd | 8,580,000 | 8,721 |
| SHW AG, non-registered shares | 300,000 | 8,476 |
| Major Cineplex Group PCL | 9,201,000 | 7,912 |
| American Axle & Manufacturing Holdings, Inc.2 | 505,000 | 7,772 |
| Samsonite International SA | 2,175,000 | 7,290 |
| POLYTEC Holding AG, non-registered shares | 834,369 | 7,187 |
| Talwalkars Better Value Fitness Ltd.1 | 2,389,000 | 6,833 |
| GAEC Educação SA, ordinary nominative2 | 2,177,900 | 6,027 |
| ITT Educational Services, Inc.1,2 | 1,869,000 | 5,775 |
| Sitoy Group Holdings Ltd. | 18,291,800 | 5,754 |
| L’Occitane International SA | 3,212,051 | 5,731 |
| Central European Media Enterprises Ltd., Class A2 | 2,220,000 | 5,661 |
| Mando Corp. | 37,879 | 5,184 |
| NagaCorp Ltd. | 7,330,000 | 4,696 |
| SSI Group, Inc.2 | 54,000,000 | 4,198 |
| Jimmy Choo PLC2 | 1,500,000 | 2,760 |
| China Zenix Auto International Ltd. (ADR)2 | 2,152,000 | 2,475 |
| Ripley Corp SA | 3,613,093 | 1,641 |
| Phorm Corp. Ltd.2,3 | 43,390,000 | 623 |
| Dick Smith Holdings Ltd.3 | 10,890,940 | 83 |
| Ten Alps PLC2 | 343,900 | 9 |
| Five Star Travel Corp.2,3,4 | 96,033 | 2 |
| | | 4,565,417 |
| Health care 15.70% | | |
| Molina Healthcare, Inc.1,2 | 4,340,630 | 279,927 |
| Incyte Corp.2 | 3,497,991 | 253,499 |
| China Biologic Products, Inc.1,2 | 1,774,423 | 203,136 |
| Myriad Genetics, Inc.1,2 | 5,263,377 | 197,008 |
| Hikma Pharmaceuticals PLC | 4,794,253 | 136,338 |
| athenahealth, Inc.2 | 929,371 | 128,978 |
| Insulet Corp.1,2 | 3,884,000 | 128,793 |
| GW Pharmaceuticals PLC (ADR)1,2 | 1,652,700 | 119,242 |
| Centene Corp.2 | 1,709,439 | 105,250 |
| Sysmex Corp. | 1,643,000 | 102,774 |
| Spire Healthcare Group PLC | 17,800,000 | 91,779 |
| CONMED Corp.1 | 2,141,654 | 89,821 |
| Zeltiq Aesthetics, Inc.1,2 | 3,122,044 | 84,795 |
| NuVasive, Inc.2 | 1,684,000 | 81,927 |
| Intuitive Surgical, Inc.2 | 135,000 | 81,142 |
| Brookdale Senior Living Inc.2 | 5,100,920 | 81,003 |
| Juno Therapeutics, Inc.2 | 2,017,501 | 76,847 |
| bluebird bio, Inc.2 | 1,804,352 | 76,685 |
| WellCare Health Plans, Inc.2 | 825,000 | 76,519 |
| Teleflex Inc. | 460,700 | 72,335 |
| Illumina, Inc.2 | 435,800 | 70,648 |
| Kite Pharma, Inc.2 | 1,522,562 | 69,901 |
| Endo International PLC2 | 2,106,581 | 59,300 |
| Dechra Pharmaceuticals PLC | 3,360,700 | 58,211 |
| Prothena Corp. PLC2 | 1,323,114 | 54,459 |
| Ultragenyx Pharmaceutical Inc.2 | 835,807 | 52,915 |
| Genomma Lab Internacional, SAB de CV, Series B1,2 | 67,483,000 | 52,183 |
| Hologic, Inc.2 | 1,465,000 | 50,542 |
| INC Research Holdings, Inc., Class A2 | 1,216,000 | 50,111 |
SMALLCAP World Fund — Page 3 of 15
Common stocks
Health care (continued) | Shares | Value
(000) |
| Neurocrine Biosciences, Inc.2 | 1,166,000 | $46,115 |
| Sawai Pharmaceutical Co., Ltd. | 711,400 | 44,563 |
| Vitrolife AB | 1,056,771 | 44,454 |
| BioMarin Pharmaceutical Inc.2 | 531,500 | 43,838 |
| Alnylam Pharmaceuticals, Inc.2 | 647,603 | 40,650 |
| Fisher & Paykel Healthcare Corp. Ltd. | 5,993,670 | 40,600 |
| Galapagos NV2 | 955,735 | 40,228 |
| Diplomat Pharmacy, Inc.2 | 1,391,600 | 38,130 |
| Natera, Inc.1,2 | 3,997,803 | 38,059 |
| Fleury SA, ordinary nominative | 6,325,000 | 37,908 |
| Adaptimmune Therapeutics PLC (ADR)1,2 | 4,601,000 | 37,406 |
| Team Health Holdings, Inc.2 | 832,700 | 34,815 |
| Inovalon Holdings Inc., Class A2 | 1,805,785 | 33,443 |
| Axovant Sciences Ltd.2 | 2,894,800 | 33,232 |
| Sartorius AG, non-registered shares, nonvoting preferred | 129,343 | 32,961 |
| Virbac SA | 169,500 | 29,462 |
| Novadaq Technologies Inc.2 | 2,640,866 | 29,287 |
| ACADIA Pharmaceuticals Inc.2 | 1,023,000 | 28,603 |
| Tong Ren Tang Technologies Co., Ltd., Class H | 16,820,000 | 27,017 |
| Regulus Therapeutics Inc.1,2 | 3,535,000 | 24,498 |
| Agios Pharmaceuticals, Inc.2 | 603,000 | 24,482 |
| Gerresheimer AG, non-registered shares | 310,000 | 24,315 |
| Healthscope Ltd. | 11,365,000 | 23,173 |
| EXACT Sciences Corp.2 | 3,437,562 | 23,169 |
| Genmab A/S2 | 165,000 | 22,866 |
| Capio AB2 | 4,263,608 | 22,583 |
| Trupanion, Inc.1,2 | 2,257,500 | 22,236 |
| Intercept Pharmaceuticals, Inc.2 | 172,137 | 22,114 |
| Eurofins Scientific SE, non-registered shares | 59,500 | 21,825 |
| QIAGEN NV2 | 968,751 | 21,584 |
| Neovasc Inc. (CAD denominated)1,2 | 4,580,457 | 19,292 |
| Neovasc Inc.1,2 | 503,836 | 2,151 |
| Nakanishi Inc. | 638,500 | 20,282 |
| Ocular Therapeutix, Inc.1,2 | 1,977,578 | 19,103 |
| Press Ganey Holdings, Inc.2 | 600,000 | 18,048 |
| Acerta Pharma BV2,3,5 | 195,556,815 | 17,960 |
| Mitra Keluarga Karyasehat Tbk PT | 91,801,943 | 16,789 |
| Divi’s Laboratories Ltd. | 1,124,952 | 16,771 |
| Krka, dd, Novo mesto | 231,262 | 16,184 |
| Flexion Therapeutics, Inc.1,2 | 1,723,051 | 15,852 |
| Grifols, SA, Class B (ADR) | 616,400 | 9,536 |
| Grifols, SA, Class A, non-registered shares | 270,000 | 6,012 |
| NantKwest, Inc.2 | 1,887,290 | 15,514 |
| Wright Medical Group, Inc.2 | 879,857 | 14,606 |
| HeartWare International, Inc.2 | 443,000 | 13,919 |
| Mesoblast Ltd.2 | 6,200,000 | 12,214 |
| Mesoblast Ltd. (ADR)2 | 80,000 | 770 |
| Spark Therapeutics, Inc.2 | 403,020 | 11,893 |
| Xenon Pharmaceuticals Inc.1,2 | 1,030,000 | 7,200 |
| Circassia Pharmaceuticals PLC2 | 1,219,930 | 4,748 |
| ChemoCentryx, Inc.2 | 1,489,848 | 3,710 |
| OTCPharm PJSC2 | 924,610 | 2,794 |
| | | 4,205,032 |
SMALLCAP World Fund — Page 4 of 15
Common stocks
Information technology 13.47% | Shares | Value
(000) |
| Qorvo, Inc.2 | 3,884,370 | $195,811 |
| AAC Technologies Holdings Inc. | 23,966,500 | 183,209 |
| Kakaku.com, Inc. | 7,074,000 | 131,367 |
| Vanguard International Semiconductor Corp. | 81,256,386 | 126,995 |
| Zynga Inc., Class A2 | 54,170,000 | 123,508 |
| DeNA Co., Ltd. | 5,887,700 | 101,437 |
| Demandware, Inc.1,2 | 2,536,456 | 99,175 |
| EPAM Systems, Inc.2 | 1,275,400 | 95,234 |
| Finisar Corp.2 | 4,901,000 | 89,394 |
| Halma PLC | 6,749,967 | 88,367 |
| CDW Corp. | 2,060,000 | 85,490 |
| Zoopla Property Group PLC1 | 23,571,729 | 84,637 |
| Globant SA1,2 | 2,717,510 | 83,862 |
| Inphi Corp.1,2 | 2,459,199 | 81,990 |
| Zebra Technologies Corp., Class A2 | 1,113,900 | 76,859 |
| Quotient Technology Inc.1,2 | 6,711,613 | 71,143 |
| eMemory Technology Inc.1 | 6,146,000 | 71,039 |
| Palo Alto Networks, Inc.2 | 411,300 | 67,099 |
| Dolby Laboratories, Inc., Class A | 1,471,900 | 63,969 |
| Topcon Corp. | 4,363,110 | 57,531 |
| Nemetschek AG | 1,117,072 | 53,959 |
| Hamamatsu Photonics KK | 1,916,930 | 52,886 |
| VTech Holdings Ltd. | 4,447,000 | 52,797 |
| NCC Group PLC1 | 14,386,000 | 51,758 |
| Cray Inc.2 | 1,233,127 | 51,680 |
| Syntel, Inc.2 | 987,043 | 49,283 |
| Sunny Optical Technology (Group) Co., Ltd. | 17,319,000 | 48,670 |
| Cypress Semiconductor Corp. | 5,361,000 | 46,426 |
| Rightmove PLC | 763,000 | 46,147 |
| Hermes Microvision Inc. | 1,551,364 | 44,347 |
| MercadoLibre, Inc. | 336,000 | 39,598 |
| QLogic Corp.2 | 2,825,719 | 37,978 |
| Cognex Corp. | 967,202 | 37,673 |
| Auto Trader Group plc | 6,674,700 | 37,387 |
| Silicon Laboratories Inc.2 | 829,333 | 37,287 |
| Interactive Intelligence Group, Inc.2 | 991,000 | 36,092 |
| ON Semiconductor Corp.2 | 3,604,851 | 34,571 |
| Ellie Mae, Inc.2 | 375,000 | 33,990 |
| 58.com Inc., Class A (ADR)2 | 610,000 | 33,946 |
| Semiconductor Manufacturing International Corp.2 | 378,160,068 | 33,637 |
| OBIC Co., Ltd. | 632,500 | 33,439 |
| TravelSky Technology Ltd., Class H | 19,960,000 | 32,678 |
| Autodesk, Inc.2 | 530,000 | 30,904 |
| Wix.com Ltd.2 | 1,500,000 | 30,405 |
| RIB Software AG1 | 2,904,993 | 30,180 |
| Mail.Ru Group Ltd. (GDR)2 | 1,377,171 | 29,885 |
| YY Inc., Class A (ADR)2 | 482,000 | 29,686 |
| ASM Pacific Technology Ltd. | 3,720,000 | 29,204 |
| CPI Card Group Inc.1 | 3,450,000 | 28,428 |
| SUNeVision Holdings Ltd. | 89,298,000 | 28,088 |
| National Instruments Corp. | 914,000 | 27,521 |
| Criteo SA (ADR)2 | 635,000 | 26,302 |
| QIWI PLC, Class B (ADR) | 1,788,000 | 25,908 |
| Hana Microelectronics PCL | 23,935,000 | 24,323 |
| Sonus Networks, Inc.1,2 | 3,225,000 | 24,284 |
SMALLCAP World Fund — Page 5 of 15
Common stocks
Information technology (continued) | Shares | Value
(000) |
| Actua Corp1,2 | 2,602,000 | $23,548 |
| Gogo Inc.2 | 2,115,000 | 23,286 |
| RingCentral, Inc., Class A2 | 1,435,000 | 22,601 |
| Viavi Solutions Inc.2 | 3,184,000 | 21,842 |
| Trimble Navigation Ltd.2 | 840,000 | 20,832 |
| Nokia Corp.2 | 3,449,342 | 20,414 |
| carsales.com Ltd. | 2,223,000 | 20,040 |
| CoStar Group, Inc.2 | 100,000 | 18,817 |
| Lumentum Holdings Inc.2 | 687,100 | 18,531 |
| Alten SA, non-registered shares | 250,000 | 15,345 |
| Semtech Corp.2 | 620,000 | 13,634 |
| MagnaChip Semiconductor Corp.1,2 | 2,355,000 | 12,811 |
| Zillow Group, Inc., Class C, nonvoting2 | 525,000 | 12,458 |
| Computer Modelling Group Ltd. | 1,574,400 | 12,292 |
| Veeco Instruments Inc.2 | 600,000 | 11,688 |
| Ultimate Software Group, Inc.2 | 55,700 | 10,778 |
| GoldMoney Inc.1,2,3,4 | 3,531,100 | 9,855 |
| GrubHub Inc.2 | 342,625 | 8,610 |
| Yelp Inc., Class A2 | 410,000 | 8,151 |
| Ixia2 | 648,000 | 8,074 |
| SciQuest, Inc.2 | 516,814 | 7,173 |
| M/A-COM Technology Solutions Holdings, Inc.2 | 123,518 | 5,409 |
| Pandora Media, Inc.2 | 405,000 | 3,625 |
| GoDaddy Inc., Class A2 | 111,600 | 3,608 |
| Goldpac Group Ltd. | 4,765,000 | 2,021 |
| iEnergizer Ltd.2 | 7,650,500 | 1,209 |
| | | 3,606,115 |
| Industrials 12.02% | | |
| Hoshizaki Electric Co., Ltd. | 2,334,600 | 194,783 |
| ITT Corp. | 3,580,000 | 132,066 |
| Loomis AB, Class B | 3,769,042 | 106,549 |
| MonotaRO Co., Ltd. | 3,396,800 | 100,958 |
| Oshkosh Corp. | 2,385,600 | 97,499 |
| AA PLC | 24,237,138 | 92,178 |
| NIBE Industrier AB, Class B | 2,670,000 | 91,530 |
| PARK24 Co., Ltd. | 2,938,200 | 82,237 |
| King Slide Works Co., Ltd.1 | 7,015,000 | 80,974 |
| Havells India Ltd. | 16,048,000 | 77,874 |
| IDEX Corp. | 875,000 | 72,520 |
| IMCD Group BV | 1,788,484 | 66,894 |
| IMCD NV | 60,000 | 2,244 |
| Moog Inc., Class A2 | 1,473,800 | 67,323 |
| NORMA Group SE, non-registered shares | 1,094,339 | 61,304 |
| Continental Building Products, Inc.1,2 | 3,235,700 | 60,055 |
| BELIMO Holding AG | 20,980 | 56,882 |
| ABM Industries Inc. | 1,720,446 | 55,588 |
| Clean Harbors, Inc.2 | 1,119,500 | 55,236 |
| TechnoPro Holdings, Inc.1 | 1,845,000 | 54,754 |
| Exponent, Inc. | 1,070,000 | 54,581 |
| Generac Holdings Inc.2 | 1,449,300 | 53,972 |
| Gujarat Pipavav Port Ltd.2 | 19,559,000 | 52,130 |
| Masco Corp. | 1,625,000 | 51,106 |
| Johnson Electric Holdings Ltd. | 15,754,875 | 48,642 |
| Watsco, Inc. | 350,000 | 47,159 |
SMALLCAP World Fund — Page 6 of 15
Common stocks
Industrials (continued) | Shares | Value
(000) |
| Grupo Aeroportuario del Pacífico SAB de CV | 5,094,455 | $45,451 |
| Landstar System, Inc. | 691,000 | 44,646 |
| Takeuchi Mfg. Co., Ltd.1 | 2,988,000 | 43,116 |
| TransDigm Group Inc.2 | 190,000 | 41,865 |
| Wizz Air Holdings PLC2 | 1,565,985 | 41,407 |
| Grupo Aeroportuario del Centro Norte, SAB de CV, Series B | 7,234,000 | 41,301 |
| Boyd Group Income Fund | 654,500 | 38,476 |
| Dätwyler Holding Inc., non-registered shares | 247,200 | 36,840 |
| Waste Connections, Inc. | 560,000 | 36,170 |
| American Airlines Group Inc. | 872,000 | 35,761 |
| Univar Inc.2 | 2,076,000 | 35,666 |
| SEEK Ltd. | 2,800,000 | 34,728 |
| Orbital ATK, Inc. | 399,000 | 34,689 |
| Kirby Corp.2 | 555,000 | 33,461 |
| LT Group, Inc. | 98,744,600 | 33,455 |
| Rheinmetall AG | 411,000 | 32,840 |
| Rockwool International A/S, Class B | 188,600 | 29,953 |
| Amara Raja Batteries Ltd. | 2,173,886 | 28,809 |
| Cía. de Distribución Integral Logista Holdings, SA, non-registered shares | 1,200,000 | 27,118 |
| AKR Corporindo Tbk PT | 47,774,300 | 25,040 |
| Alliance Global Group, Inc. | 66,295,000 | 23,756 |
| Graco Inc. | 275,000 | 23,089 |
| Flughafen Zürich AG | 24,800 | 22,207 |
| Stabilus SA, non-registered shares2 | 449,000 | 21,640 |
| Carborundum Universal Ltd. | 7,985,000 | 21,155 |
| WageWorks, Inc.2 | 400,000 | 20,244 |
| CIMC Enric Holdings Ltd. | 35,822,000 | 19,025 |
| KEYW Holding Corp.1,2 | 2,836,400 | 18,834 |
| Spirax-Sarco Engineering PLC | 351,000 | 18,350 |
| Talgo SA2 | 3,206,700 | 18,062 |
| Teleperformance SA | 204,247 | 17,956 |
| Regus PLC | 3,888,000 | 17,685 |
| Unique Engineering and Construction PCL | 33,852,000 | 17,609 |
| The Brink’s Co. | 521,000 | 17,500 |
| Virgin America Inc.2 | 450,000 | 17,352 |
| Meggitt PLC | 2,950,000 | 17,227 |
| USG Corp.2 | 689,912 | 17,117 |
| J. Kumar Infraprojects Ltd.1 | 4,092,000 | 16,977 |
| COSCO International Holdings Ltd. | 32,736,000 | 16,838 |
| Valmont Industries, Inc. | 135,000 | 16,718 |
| Chart Industries, Inc.2 | 745,700 | 16,197 |
| Alaska Air Group, Inc. | 197,000 | 16,158 |
| Robert Half International Inc. | 337,000 | 15,697 |
| Geberit AG | 41,000 | 15,320 |
| PayPoint PLC | 1,220,000 | 13,107 |
| Pegasus Hava Tasimaciligi AS2 | 2,050,000 | 12,506 |
| Aida Engineering, Ltd. | 1,397,000 | 12,140 |
| Briggs & Stratton Corp. | 500,000 | 11,960 |
| Summit Ascent Holdings Ltd.2 | 51,620,000 | 11,911 |
| Boer Power Holdings Ltd. | 14,750,000 | 11,637 |
| CAE Inc. | 945,000 | 10,929 |
| Stock Building Supply Holdings, Inc.2 | 579,222 | 9,627 |
| Bossard Holding AG | 77,500 | 8,165 |
| Nabtesco Corp. | 350,000 | 7,856 |
| SolarCity Corp.2 | 245,000 | 6,022 |
SMALLCAP World Fund — Page 7 of 15
Common stocks
Industrials (continued) | Shares | Value
(000) |
| Orient Overseas (International) Ltd. | 1,354,000 | $5,228 |
| Shanghai Industrial Holdings Ltd. | 2,105,000 | 4,960 |
| Jungheinrich AG, nonvoting preferred | 51,000 | 4,652 |
| TD Power Systems Ltd. | 1,009,087 | 3,184 |
| COSCO Pacific Ltd. | 1,638,000 | 2,145 |
| Japan Airport Terminal Co. Ltd. | 56,000 | 1,990 |
| Mills Estruturas e Serviços de Engenharia SA, ordinary nominative2 | 1,346,401 | 1,251 |
| | | 3,219,813 |
| Financials 9.71% | | |
| Kotak Mahindra Bank Ltd. | 20,057,040 | 206,151 |
| Validus Holdings, Ltd. | 2,863,000 | 135,105 |
| Umpqua Holdings Corp. | 7,004,541 | 111,092 |
| GT Capital Holdings, Inc. | 3,485,200 | 105,211 |
| VZ Holding AG | 363,400 | 95,995 |
| Financial Engines, Inc. | 2,865,947 | 90,077 |
| WHA Corp. PCL1,2 | 860,608,900 | 76,325 |
| First Republic Bank | 1,141,825 | 76,091 |
| Indiabulls Housing Finance Ltd. | 7,725,000 | 75,812 |
| Shriram Transport Finance Co. Ltd. | 4,928,739 | 70,940 |
| Essent Group Ltd.2 | 3,297,925 | 68,597 |
| SVB Financial Group2 | 652,500 | 66,588 |
| Bajaj Finance Ltd. | 608,716 | 63,647 |
| Outfront Media Inc. | 2,707,035 | 57,118 |
| Avanza Bank Holding AB2 | 1,270,768 | 56,665 |
| Kemper Corp. | 1,884,000 | 55,710 |
| Bank of the Ozarks, Inc. | 1,240,000 | 52,043 |
| Cathay General Bancorp, Inc. | 1,788,000 | 50,654 |
| Capitec Bank Holdings Ltd. | 1,291,983 | 50,146 |
| PacWest Bancorp | 1,263,491 | 46,939 |
| Talmer Bancorp, Inc., Class A | 2,510,000 | 45,406 |
| Great Western Bancorp, Inc. | 1,617,000 | 44,096 |
| CenterState Banks, Inc.1 | 2,758,399 | 41,072 |
| Janus Capital Group Inc. | 2,543,000 | 37,204 |
| Fibra Uno Administración, SA de CV | 15,355,891 | 35,694 |
| Endurance Specialty Holdings Ltd. | 524,000 | 34,238 |
| Redwood Trust, Inc. | 2,562,000 | 33,511 |
| Land and Houses PCL, nonvoting depository receipt | 112,870,000 | 28,715 |
| City Union Bank Ltd. | 19,813,000 | 28,363 |
| Inversiones La Construcción SA | 2,477,000 | 28,149 |
| Mercury General Corp. | 500,000 | 27,750 |
| Texas Capital Bancshares, Inc.2 | 687,500 | 26,386 |
| GRUH Finance Ltd. | 6,900,000 | 24,928 |
| Gaming and Leisure Properties, Inc. | 800,000 | 24,736 |
| RenaissanceRe Holdings Ltd. | 205,000 | 24,565 |
| Onex Corp. | 400,000 | 24,380 |
| Altisource Residential Corp. | 2,021,650 | 24,260 |
| BR MALLS Participações SA, ordinary nominative | 5,670,000 | 23,259 |
| LendingClub Corp.2 | 2,710,869 | 22,500 |
| Signature Bank2 | 157,800 | 21,480 |
| Eurobank Ergasias SA2 | 23,886,819 | 21,174 |
| East West Bancorp, Inc. | 638,166 | 20,728 |
| Cerved Information Solutions SPA, non-registered shares | 2,458,010 | 20,222 |
| Greenhill & Co., Inc. | 885,500 | 19,658 |
| Moelis & Co., Class A | 686,900 | 19,391 |
SMALLCAP World Fund — Page 8 of 15
Common stocks
Financials (continued) | Shares | Value
(000) |
| WisdomTree Investments, Inc. | 1,620,000 | $18,517 |
| Multi Commodity Exchange of India Ltd.3 | 1,250,000 | 18,091 |
| ICRA Ltd. | 295,325 | 17,368 |
| LSL Property Services PLC | 4,166,350 | 17,204 |
| Chailease Holding Co. Ltd. | 9,689,680 | 16,890 |
| GRIVALIA PROPERTIES Real Estate Investments Co. | 1,950,348 | 16,356 |
| Numis Corp. PLC | 5,514,282 | 15,840 |
| K. Wah International Holdings Ltd. | 35,337,431 | 15,579 |
| CRISIL Ltd. | 570,000 | 15,484 |
| PSG Group Ltd. | 1,075,000 | 14,599 |
| Cascade Bancorp2 | 2,450,962 | 13,995 |
| Mahindra Lifespace Developers Ltd.1 | 2,157,380 | 13,728 |
| Bank of Ireland2 | 45,456,798 | 13,190 |
| EFG International AG | 2,225,378 | 12,729 |
| Clifton Bancorp Inc. | 816,606 | 12,347 |
| Macquarie Mexican REIT | 8,661,000 | 11,675 |
| BankUnited, Inc. | 261,000 | 8,989 |
| National Bank of Pakistan | 16,845,000 | 8,309 |
| Soundwill Holdings Ltd. | 5,690,000 | 6,719 |
| Old Republic International Corp. | 364,700 | 6,667 |
| Premium Leisure Corp. | 242,500,000 | 4,740 |
| Repco Home Finance Ltd. | 533,960 | 4,670 |
| Golden Wheel Tiandi Holdings Co. Ltd. | 45,266,000 | 3,734 |
| Altisource Asset Management Corp.2 | 29,632 | 350 |
| | | 2,600,541 |
| Consumer staples 6.93% | | |
| Sprouts Farmers Market, Inc.2 | 5,312,600 | 154,278 |
| Emmi AG | 263,500 | 144,006 |
| Raia Drogasil SA, ordinary nominative | 8,267,574 | 120,025 |
| Pinnacle Foods Inc. | 2,389,050 | 106,743 |
| Lion Corp. | 7,637,000 | 86,111 |
| Emami Ltd. | 5,732,649 | 80,706 |
| COSMOS Pharmaceutical Corp. | 450,200 | 74,843 |
| Puregold Price Club, Inc. | 92,261,300 | 72,935 |
| Glanbia PLC | 3,550,200 | 72,473 |
| Hypermarcas SA, ordinary nominative2 | 8,592,600 | 67,199 |
| Coca-Cola Icecek AS, Class C | 3,877,512 | 56,529 |
| TreeHouse Foods, Inc.2 | 625,000 | 54,219 |
| Refresco Gerber NV2 | 2,945,402 | 52,620 |
| Greencore Group PLC | 8,915,000 | 48,016 |
| Super Group Ltd.1 | 59,000,000 | 43,336 |
| Herbalife Ltd.2 | 685,000 | 42,169 |
| PZ Cussons PLC | 8,978,670 | 38,958 |
| Treasury Wine Estates Ltd. | 5,236,087 | 38,692 |
| SalMar ASA | 1,432,000 | 35,131 |
| Fresh Del Monte Produce Inc. | 750,000 | 31,552 |
| Davide Campari-Milano SpA | 3,150,000 | 31,489 |
| Ariake Japan Co., Ltd. | 523,000 | 30,670 |
| Stock Spirits Group PLC1 | 13,667,459 | 28,807 |
| Scandinavian Tobacco Group A/S2 | 1,644,000 | 26,410 |
| CCL Products (India) Ltd.1 | 8,841,272 | 25,794 |
| Ezaki Glico Co., Ltd. | 488,000 | 25,019 |
| BGFretail Co., Ltd. | 168,000 | 24,092 |
| Kernel Holding SA | 1,642,578 | 23,469 |
SMALLCAP World Fund — Page 9 of 15
Common stocks
Consumer staples (continued) | Shares | Value
(000) |
| Karex Bhd. | 23,363,250 | $22,755 |
| Emperador Inc. | 135,870,000 | 22,367 |
| Hyundai Department Store Co., Ltd. | 186,000 | 22,364 |
| Milbon Co., Ltd. | 535,000 | 21,629 |
| Petra Foods Ltd. | 9,183,000 | 19,077 |
| Lenta Ltd. (GDR)2 | 2,422,000 | 15,235 |
| Lenta Ltd. (GDR)2,4 | 530,900 | 3,339 |
| Philip Morris CR as | 32,000 | 17,770 |
| Pigeon Corp. | 640,007 | 16,702 |
| Del Monte Pacific Ltd. | 66,733,314 | 16,551 |
| VST Industries Ltd. | 620,000 | 15,498 |
| Eurocash SA | 892,000 | 12,754 |
| HITEJINRO Co., Ltd. | 348,679 | 8,811 |
| R.E.A. Holdings PLC | 800,000 | 3,275 |
| Real Nutriceutical Group Ltd. | 13,926,000 | 1,364 |
| | | 1,855,782 |
| Materials 4.50% | | |
| Chr. Hansen Holding A/S | 2,593,200 | 174,081 |
| James Hardie Industries PLC (CDI) | 6,855,000 | 93,849 |
| AptarGroup, Inc. | 1,060,000 | 83,115 |
| PolyOne Corp. | 2,594,600 | 78,487 |
| Platform Specialty Products Corp.2 | 7,265,000 | 62,479 |
| Lundin Mining Corp.2 | 18,610,000 | 58,606 |
| Stillwater Mining Co.2 | 4,765,000 | 50,747 |
| Sirius Minerals Plc1,2 | 179,677,760 | 38,064 |
| CCL Industries Inc., Class B, non-voting | 200,000 | 37,960 |
| Stella-Jones Inc. | 1,040,000 | 37,236 |
| United States Steel Corp. | 2,292,000 | 36,787 |
| SK Kaken Co.,Ltd. | 428,000 | 35,481 |
| Mayr-Melnhof Karton AG, non-registered shares | 292,300 | 35,090 |
| Buzzi Unicem SPA | 2,015,558 | 34,838 |
| Supreme Industries Ltd. | 2,775,000 | 30,994 |
| Huhtamäki Oyj | 724,000 | 26,882 |
| Valspar Corp. | 249,400 | 26,691 |
| HudBay Minerals Inc. | 7,265,000 | 26,627 |
| Arkema SA | 345,000 | 25,902 |
| Silgan Holdings Inc. | 467,300 | 24,846 |
| Lenzing AG | 305,026 | 24,147 |
| UPL Ltd. | 2,950,000 | 21,280 |
| CPMC Holdings Ltd. | 42,795,000 | 21,129 |
| Mountain Province Diamonds Inc.2 | 4,964,264 | 18,577 |
| Croda International PLC | 422,000 | 18,419 |
| Nampak Ltd. | 11,858,075 | 17,108 |
| Symrise AG | 227,500 | 15,273 |
| Synthomer PLC | 2,410,000 | 12,610 |
| LANXESS AG | 213,040 | 10,240 |
| Greatview Aseptic Packaging Co. Ltd. | 16,320,000 | 7,763 |
| Kennady Diamonds Inc.1,2 | 2,557,952 | 6,657 |
| ArtGo Holdings Ltd.2 | 40,427,000 | 5,107 |
| Platinum Group Metals Ltd.2 | 1,347,500 | 5,105 |
| Kenmare Resources PLC2 | 109,972,782 | 1,575 |
| Rusoro Mining Ltd.2 | 21,437,000 | 1,568 |
| | | 1,205,320 |
SMALLCAP World Fund — Page 10 of 15
Common stocks
Energy 3.11% | Shares | Value
(000) |
| Diamondback Energy, Inc.2 | 1,080,950 | $83,428 |
| U.S. Silica Holdings, Inc.1 | 3,485,000 | 79,179 |
| InterOil Corp.2 | 2,344,500 | 74,625 |
| Seven Generations Energy Ltd., Class A2,3,4 | 3,025,000 | 43,259 |
| Seven Generations Energy Ltd., Class A2 | 1,836,000 | 27,637 |
| Laredo Petroleum, Inc.2 | 7,752,000 | 61,473 |
| Oil States International, Inc.2 | 1,820,000 | 57,366 |
| Peyto Exploration & Development Corp. | 2,496,900 | 55,542 |
| Petronet LNG Ltd. | 10,460,000 | 39,607 |
| Pason Systems Inc. | 2,697,000 | 34,264 |
| Parsley Energy, Inc., Class A2 | 1,467,200 | 33,159 |
| Keyera Corp. | 952,400 | 28,908 |
| Concho Resources Inc.2 | 279,500 | 28,241 |
| Carrizo Oil & Gas, Inc.2 | 615,407 | 19,028 |
| WorleyParsons Ltd. | 4,454,184 | 18,369 |
| Tidewater Midstream and Infrastructure Ltd.1,4 | 12,444,000 | 13,414 |
| Tidewater Midstream and Infrastructure Ltd.1 | 4,490,000 | 4,840 |
| Memorial Resource Development Corp.2 | 1,275,000 | 12,980 |
| Venture Global LNG, Inc., Class C2,3,4,5 | 4,240 | 12,720 |
| Ophir Energy PLC2 | 11,100,000 | 12,276 |
| Oasis Petroleum Inc.2 | 1,671,400 | 12,168 |
| Veresen Inc. | 1,623,400 | 10,962 |
| Amerisur Resources PLC2 | 25,458,400 | 10,604 |
| Tourmaline Oil Corp.2 | 410,000 | 8,681 |
| Subsea 7 SA2 | 1,030,000 | 7,798 |
| Nostrum Oil & Gas PLC | 1,758,495 | 6,011 |
| Lekoil Ltd. (CDI)1,2 | 25,208,400 | 5,431 |
| Core Laboratories NV | 40,000 | 4,496 |
| Africa Oil Corp. (SEK denominated)2 | 2,683,000 | 4,488 |
| Gulf Marine Services PLC | 3,920,000 | 3,702 |
| Savannah Petroleum PLC1,2,3 | 10,844,000 | 3,680 |
| BNK Petroleum Inc.1,2 | 12,804,914 | 3,500 |
| Rockhopper Exploration PLC2 | 7,250,542 | 2,968 |
| Genel Energy PLC2 | 2,224,800 | 2,796 |
| Gulf Keystone Petroleum Ltd.2,4 | 15,715,000 | 1,788 |
| San Leon Energy PLC1,2,3 | 4,003,000 | 1,674 |
| Clayton Williams Energy, Inc.2 | 128,498 | 1,146 |
| Tethys Petroleum Ltd.2 | 16,808,487 | 582 |
| African Petroleum Corp. Ltd.2 | 1,445,890 | 531 |
| Borders & Southern Petroleum PLC2 | 20,265,000 | 451 |
| Esrey Energy Ltd.2 | 650,000 | 33 |
| | | 833,805 |
| Telecommunication services 0.98% | | |
| HKBN Ltd.1 | 55,471,500 | 68,505 |
| Indosat Tbk PT2 | 96,888,700 | 45,120 |
| Cogent Communications Holdings, Inc. | 1,135,000 | 44,299 |
| Iridium Communications Inc.1,2 | 5,070,615 | 39,906 |
| Reliance Communications Ltd.2 | 31,945,000 | 24,119 |
| Zegona Communications PLC1,2,3 | 12,305,654 | 23,241 |
| Hutchison Telecommunications Hong Kong Holdings Ltd. | 28,662,000 | 10,087 |
| Total Access Communication PCL | 6,518,100 | 7,643 |
SMALLCAP World Fund — Page 11 of 15
Common stocks
Telecommunication services (continued) | Shares | Value
(000) |
| NewSat Ltd.2,3 | 26,555,563 | $— |
| Let’s GOWEX, SA, non-registered shares2,3 | 106,245 | — |
| | | 262,920 |
| Utilities 0.71% | | |
| ENN Energy Holdings Ltd. | 19,994,000 | 109,670 |
| Ratchaburi Electricity Generating Holding PCL | 12,397,200 | 17,884 |
| Ratchaburi Electricity Generating Holding PCL, nonvoting depository receipts | 7,945,000 | 11,461 |
| CT Environmental Group Ltd. | 64,072,000 | 18,832 |
| Huadian Fuxin Energy Corp. Ltd., Class H | 47,270,000 | 11,029 |
| Energy World Corp. Ltd.2 | 50,606,000 | 9,310 |
| Mytrah Energy Ltd.1,2 | 10,418,000 | 7,706 |
| NRG Yield, Inc., Class C | 146,523 | 2,087 |
| NRG Yield, Inc., Class A | 146,523 | 1,988 |
| Greenko Group PLC1,3 | 9,748,155 | 141 |
| | | 190,108 |
| Miscellaneous 4.85% | | |
| Other common stocks in initial period of acquisition | | 1,298,358 |
| Total common stocks (cost: $19,201,730,000) | | 23,843,211 |
Preferred securities 0.00%
Consumer staples 0.00% | | |
| R.E.A. Holdings PLC 9.00% | 96,000 | 119 |
| Total preferred securities (cost: $185,000) | | 119 |
Rights & warrants 0.01%
Financials 0.01% | | |
| WHA Corp. PCL, warrants, expire 20201,2 | 6,909,830 | 1,503 |
| Information technology 0.00% | | |
| Foursquare Labs, Inc., warrants, expire 20332,3,5 | 1,163,990 | 1,278 |
| Consumer discretionary 0.00% | | |
| Central European Media Enterprises Ltd., warrants, expire 20182,3 | 751,800 | 1,181 |
| Total rights & warrants (cost: $926,000) | | 3,962 |
Convertible stocks 0.38%
Health care 0.18% | | |
| Proteus Digital Health, Inc., Series G, convertible preferred3,5 | 3,044,139 | 40,000 |
| Stemcentrx, Inc., Series F-1, convertible preferred3,5 | 332,000 | 7,649 |
| | | 47,649 |
| Information technology 0.18% | | |
| Domo, Inc., Series D-2, convertible preferred3,5 | 2,965,036 | 25,000 |
| DocuSign, Inc., Series E, convertible preferred3,5 | 1,236,304 | 14,613 |
| DocuSign, Inc., Series B, convertible preferred3,5 | 66,593 | 787 |
SMALLCAP World Fund — Page 12 of 15
Convertible stocks
Information technology (continued) | Shares | Value
(000) |
| DocuSign, Inc., Series D, convertible preferred3,5 | 47,810 | $565 |
| DocuSign, Inc., Series B1, convertible preferred3,5 | 19,947 | 236 |
| Foursquare Labs, Inc., Series D, convertible preferred3,5 | 1,551,988 | 6,225 |
| | | 47,426 |
| Telecommunication services 0.02% | | |
| Iridium Communications Inc., Series A, convertible preferred1,4 | 60,000 | 5,584 |
| Total convertible stocks (cost: $112,587,000) | | 100,659 |
Bonds, notes & other debt instruments 0.60%
U.S. Treasury bonds & notes 0.52%
U.S. Treasury 0.52% | Principal amount
(000) | |
| U.S. Treasury 1.625% 20266 | $78,080 | 77,013 |
| U.S. Treasury 2.50% 2046 | 64,965 | 63,367 |
| Total U.S. Treasury bonds & notes | | 140,380 |
Corporate bonds & notes 0.08%
Energy 0.06% | | |
| Denbury Resources Inc. 6.375% 2021 | 1,175 | 558 |
| Denbury Resources Inc. 5.50% 2022 | 700 | 319 |
| Denbury Resources Inc. 4.625% 2023 | 14,850 | 6,311 |
| SM Energy Co. 5.625% 2025 | 12,050 | 8,431 |
| | | 15,619 |
| Consumer discretionary 0.02% | | |
| Central European Media Enterprises Ltd., First Lien, 15.00% 20177 | 4,497 | 4,504 |
| Total corporate bonds & notes | | 20,123 |
| Total bonds, notes & other debt instruments (cost: $156,357,000) | | 160,503 |
| Short-term securities 9.80% | | |
| Bank of Nova Scotia 0.50%–0.92% due 5/2/2016–10/14/20164 | 64,500 | 64,417 |
| Bank of Tokyo-Mitsubishi UFJ, Ltd. 0.39% due 4/14/2016 | 46,300 | 46,293 |
| BNP Paribas Finance Inc. 0.45%–0.59% due 4/4/2016–6/3/2016 | 125,200 | 125,153 |
| Electricité de France 0.48% due 4/1/20164 | 88,300 | 88,300 |
| Export Development Canada 0.57% due 6/20/2016 | 52,100 | 52,050 |
| Federal Home Loan Bank 0.26%–0.60% due 4/6/2016–8/1/2016 | 320,200 | 320,088 |
| Freddie Mac 0.46%–0.51% due 4/13/2016–4/26/2016 | 55,600 | 55,595 |
| Jupiter Securitization Co., LLC 0.60% due 7/21/20164 | 25,000 | 24,948 |
| Kells Funding, LLC 0.58% due 5/11/20164 | 56,100 | 56,072 |
| KfW 0.55% due 5/27/20164 | 102,300 | 102,233 |
| Liberty Street Funding Corp. 0.58% due 5/23/20164 | 48,200 | 48,165 |
| Mitsubishi UFJ Trust and Banking Corp. 0.47%–0.49% due 4/11/2016–5/24/20164 | 173,800 | 173,717 |
| Mizuho Bank, Ltd. 0.60%–0.61% due 6/8/2016–6/20/20164 | 160,200 | 160,019 |
| National Australia Bank Ltd. 0.89% due 11/1/20164 | 15,500 | 15,423 |
| Nestlé Finance International Ltd. 0.60% due 7/27/2016 | 32,500 | 32,438 |
| Nordea Bank AB 0.61%–0.64% due 6/2/2016–7/8/20164 | 178,700 | 178,489 |
| Rabobank Nederland NV 0.64% due 5/3/2016 | 100,200 | 100,163 |
| Royal Bank of Canada 0.71% due 6/13/2016 | 100,000 | 99,907 |
| Sumitomo Mitsui Banking Corp. 0.35%–0.61% due 4/12/2016–5/13/20164 | 162,500 | 162,438 |
| Svenska Handelsbanken Inc. 0.56%–0.64% due 6/6/2016–7/11/20164 | 139,100 | 138,890 |
| Thunder Bay Funding, LLC 0.53%–0.82% due 4/14/2016–8/8/20164 | 91,500 | 91,363 |
SMALLCAP World Fund — Page 13 of 15
| Short-term securities | Principal amount
(000) | Value
(000) |
| Toronto-Dominion Holdings USA Inc. 0.49% due 5/19/20164 | $72,500 | $72,457 |
| Total Capital Canada Ltd. 0.58%–0.59% due 4/14/2016–4/25/20164 | 140,200 | 140,172 |
| Toyota Credit Canada Inc. 0.55%–0.68% due 6/3/2016–7/19/2016 | 50,000 | 49,930 |
| Toyota Motor Credit Corp. 0.40% due 4/5/2016 | 50,000 | 49,997 |
| U.S. Treasury Bills 0.42% due 5/19/2016 | 50,000 | 49,989 |
| Westpac Banking Corp. 0.47%–0.86% due 5/9/2016–9/26/20164 | 126,200 | 125,868 |
| Total short-term securities (cost: $2,624,150,000) | | 2,624,574 |
| Total investment securities 99.82% (cost: $22,095,935,000) | | 26,733,028 |
| Other assets less liabilities 0.18% | | 49,434 |
| Net assets 100.00% | | $26,782,462 |
As permitted by U.S. Securities and Exchange Commission regulations, “Miscellaneous” securities include holdings in their first year of acquisition that have not previously been publicly disclosed.
Forward currency contracts
The fund has entered into forward currency contracts as shown in the following table. The average month-end notional amount of open forward currency contracts while held was $533,566,000.
| | Settlement
date | Counterparty | Contract amount | Unrealized
(depreciation)
appreciation
at 3/31/2016
(000) |
Receive
(000) | Deliver
(000) |
| Sales: | | | | | |
| Australian dollars | 4/8/2016 | Barclays Bank PLC | $1,028 | A$1,450 | $(84) |
| Australian dollars | 4/13/2016 | HSBC Bank | $39,115 | A$53,150 | (1,603) |
| Australian dollars | 5/27/2016 | UBS AG | $1,518 | A$2,000 | (11) |
| British pounds | 4/5/2016 | UBS AG | $53,869 | £38,626 | (1,608) |
| British pounds | 4/7/2016 | JPMorgan Chase | $27,359 | £19,503 | (654) |
| British pounds | 4/8/2016 | Citibank | $49,264 | £34,459 | (229) |
| British pounds | 4/11/2016 | Barclays Bank PLC | $17,293 | £12,465 | (610) |
| British pounds | 4/12/2016 | Bank of America, N.A. | $67,684 | £46,673 | 649 |
| British pounds | 4/12/2016 | Barclays Bank PLC | $5,975 | £4,122 | 54 |
| British pounds | 5/11/2016 | Citibank | $67,343 | £47,310 | (614) |
| Canadian dollars | 4/7/2016 | UBS AG | $24,125 | C$34,000 | (2,055) |
| Euros | 4/13/2016 | HSBC Bank | $12,413 | €11,315 | (467) |
| Euros | 4/14/2016 | Citibank | $1,795 | €1,650 | (83) |
| Japanese yen | 4/13/2016 | JPMorgan Chase | $19,480 | ¥2,208,500 | (151) |
| Japanese yen | 4/18/2016 | HSBC Bank | $24,913 | ¥2,842,000 | (354) |
| Japanese yen | 4/22/2016 | UBS AG | $59,440 | ¥6,685,000 | 1 |
| Japanese yen | 4/25/2016 | JPMorgan Chase | $7,324 | ¥826,910 | (29) |
| Japanese yen | 4/28/2016 | UBS AG | $5,891 | ¥669,165 | (60) |
| Japanese yen | 5/18/2016 | Bank of New York Mellon | $2,984 | ¥339,900 | (41) |
| Japanese yen | 6/6/2016 | HSBC Bank | $10,684 | ¥1,200,000 | 1 |
| Singapore dollars | 5/26/2016 | Barclays Bank PLC | $14,469 | S$20,302 | (589) |
| Thai baht | 5/9/2016 | JPMorgan Chase | $4,817 | THB171,650 | (58) |
| | | | | | $(8,595) |
SMALLCAP World Fund — Page 14 of 15
| 1 | Represents an affiliated company as defined under the Investment Company Act of 1940. |
| 2 | Security did not produce income during the last 12 months. |
| 3 | Valued under fair value procedures adopted by authority of the board of directors. The total value of all such securities was $228,863,000, which represented .85% of the net assets of the fund. |
| 4 | Acquired in a transaction exempt from registration under Rule 144A or Section 4(2) of the Securities Act of 1933. May be resold in the U.S. in transactions exempt from registration, normally to qualified institutional buyers. The total value of all such securities was $1,738,618,000, which represented 6.49% of the net assets of the fund. |
| 5 | Acquired through a private placement transaction exempt from registration under the Securities Act of 1933. May be subject to legal or contractual restrictions on resale. Further details on these holdings appear below. |
| 6 | A portion of this security was pledged as collateral. The total value of pledged collateral was $9,102,000, which represented .03% of the net assets of the fund. |
| 7 | Payment in kind; the issuer has the option of paying additional securities in lieu of cash. |
| Private placement securities | Acquisition
date(s) | Cost
(000) | Value
(000) | Percent
of net
assets |
| Proteus Digital Health, Inc., Series G, convertible preferred | 5/6/2014-7/23/2014 | $40,000 | $40,000 | .15% |
| Domo, Inc., Series D-2, convertible preferred | 3/31/2015 | 25,000 | 25,000 | .09 |
| Acerta Pharma BV | 5/7/2015 | 11,250 | 17,960 | .07 |
| DocuSign, Inc., Series E, convertible preferred | 2/28/2014 | 16,236 | 14,613 | .06 |
| DocuSign, Inc., Series B, convertible preferred | 2/28/2014 | 875 | 787 | .00 |
| DocuSign, Inc., Series D, convertible preferred | 2/28/2014 | 628 | 565 | .00 |
| DocuSign, Inc., Series B1, convertible preferred | 2/28/2014 | 262 | 236 | .00 |
| Venture Global LNG, Inc., Class C | 5/1/2015 | 12,720 | 12,720 | .05 |
| Stemcentrx, Inc., Series F-1, convertible preferred | 6/10/2014 | 4,007 | 7,649 | .03 |
| Foursquare Labs, Inc., Series D, convertible preferred | 12/3/2013 | 20,000 | 6,225 | .02 |
| Foursquare Labs, Inc., warrants, expire 2033 | 12/3/2013 | — | 1,278 | .01 |
| Total private placement securities | | $130,978 | $127,033 | .46% |
| Key to abbreviations and symbols |
| ADR = American Depositary Receipts |
| CDI = CREST Depository Interest |
| GDR = Global Depositary Receipts |
| A$ = Australian dollars |
| CAD/C$ = Canadian dollars |
| €= Euros |
| £ = British pounds |
| ¥ = Japanese yen |
| SEK = Swedish kronor |
| S$ = Singapore dollars |
| THB = Thai baht |
Investments are not FDIC-insured, nor are they deposits of or guaranteed by a bank or any other entity, so they may lose value.
Investors should carefully consider investment objectives, risks, charges and expenses. This and other important information is contained in the fund prospectus and summary prospectus, which can be obtained from your financial professional and should be read carefully before investing. You may also call American Funds Service Company (AFS) at (800) 421-4225 or visit the American Funds website at americanfunds.com.
| MFGEFPX-035-0516O-S49212 | SMALLCAP World Fund — Page 15 of 15 |
ITEM 7 – Disclosure of Proxy Voting Policies and Procedures for Closed-End Management Investment Companies
Not applicable to this Registrant, insofar as the Registrant is not a closed-end management investment company.
ITEM 8 – Portfolio Managers of Closed-End Management Investment Companies
Not applicable to this Registrant, insofar as the Registrant is not a closed-end management investment company.
ITEM 9 – Purchases of Equity Securities by Closed-End Management Investment Company and Affiliated Purchasers
Not applicable to this Registrant, insofar as the Registrant is not a closed-end management investment company.
ITEM 10 – Submission of Matters to a Vote of Security Holders
There have been no material changes to the procedures by which shareholders may recommend nominees to the Registrant’s board of directors since the Registrant last submitted a proxy statement to its shareholders. The procedures are as follows. The Registrant has a nominating and governance committee comprised solely of persons who are not considered ‘‘interested persons’’ of the Registrant within the meaning of the Investment Company Act of 1940, as amended. The committee periodically reviews such issues as the board’s composition, responsibilities, committees, compensation and other relevant issues, and recommends any appropriate changes to the full board of directors. While the committee normally is able to identify from its own resources an ample number of qualified candidates, it will consider shareholder suggestions of persons to be considered as nominees to fill future vacancies on the board. Such suggestions must be sent in writing to the nominating and governance committee of the Registrant, c/o the Registrant’s Secretary, and must be accompanied by complete biographical and occupational data on the prospective nominee, along with a written consent of the prospective nominee for consideration of his or her name by the nominating and governance committee.
ITEM 11 – Controls and Procedures
| (a) | The Registrant’s Principal Executive Officer and Principal Financial Officer have concluded, based on their evaluation of the Registrant’s disclosure controls and procedures (as such term is defined in Rule 30a-3 under the Investment Company Act of 1940), that such controls and procedures are adequate and reasonably designed to achieve the purposes described in paragraph (c) of such rule. |
| | |
| (b) | There were no changes in the Registrant’s internal controls over financial reporting (as defined in Rule 30a-3(d) under the Investment Company Act of 1940) that occurred during the Registrant’s second fiscal quarter of the period covered by this report that has materially affected, or is reasonably likely to materially affect, the Registrant’s internal control over financial reporting. |
ITEM 12 – Exhibits
| (a)(1) | Not applicable for filing of semi-annual reports to shareholders. |
| | |
| (a)(2) | The certifications required by Rule 30a-2 of the Investment Company Act of 1940 and Sections 302 and 906 of the Sarbanes-Oxley Act of 2002 are attached as exhibits hereto. |
SIGNATURES
Pursuant to the requirements of the Securities Exchange Act of 1934 and the Investment Company Act of 1940, the Registrant has duly caused this report to be signed on its behalf by the undersigned, thereunto duly authorized.
| | SMALLCAP WORLD FUND, INC. |
| | |
| | By /s/ Paul F. Roye |
| | Paul F. Roye, Executive Vice President and Principal Executive Officer |
| | |
| | Date: May 31, 2016 |
Pursuant to the requirements of the Securities Exchange Act of 1934 and the Investment Company Act of 1940, this report has been signed below by the following persons on behalf of the Registrant and in the capacities and on the dates indicated.
| By /s/ Paul F. Roye |
Paul F. Roye, Executive Vice President and Principal Executive Officer |
| |
| Date: May 31, 2016 |
| By /s/ Kimberley H. Monasterio |
Kimberley H. Monasterio, Treasurer and Principal Financial Officer |
| |
| Date: May 31, 2016 |