UNITED STATES
SECURITIES AND EXCHANGE COMMISSION
Washington, D.C. 20549
FORM N-CSR
Certified Shareholder Report of
Registered Management Investment Companies
Investment Company Act File Number: 811-05888
SMALLCAP World Fund, Inc.
(Exact Name of Registrant as Specified in Charter)
6455 Irvine Center Drive
Irvine, California 92618
(Address of Principal Executive Offices)
Registrant's telephone number, including area code: (213) 486-9200
Date of fiscal year end: September 30
Date of reporting period: March 31, 2019
Brian D. Bullard
SMALLCAP World Fund, Inc.
333 South Hope Street
Los Angeles, California 90071
(Name and Address of Agent for Service)
ITEM 1 – Reports to Stockholders
SMALLCAP World Fund® Semi-annual report for the six months ended March 31, 2019 |  |

We believe global
small companies can
provide opportunities
for investors.
| | Beginning January 1, 2021, as permitted by regulations adopted by the U.S. Securities and Exchange Commission, we intend to no longer mail paper copies of the fund’s shareholder reports, unless specifically requested from American Funds or your financial intermediary, such as a broker-dealer or bank. Instead, the reports will be made available on the American Funds website (americanfunds.com); you will be notified by mail and provided with a website link to access the report each time a report is posted. If you have already elected to receive shareholder reports electronically, you will not be affected by this change and do not need to take any action. If you prefer to receive shareholder reports and other communications electronically, you may update your mailing preferences with your financial intermediary, or enroll in e-delivery at americanfunds.com (for accounts held directly with the fund). | |
| | | |
| | You may elect to receive paper copies of all future reports free of charge. If you invest through a financial intermediary, you may contact your financial intermediary to request that you continue to receive paper copies of your shareholder reports. If you invest directly with the fund, you may inform American Funds that you wish to continue receiving paper copies of your shareholder reports by contacting us at (800) 421-4225. Your election to receive paper reports will apply to all funds held with American Funds or through your financial intermediary. | |
SMALLCAP World Fund seeks to provide you with long-term growth of capital.
This fund is one of more than 40 offered by Capital Group, home of American Funds, one of the nation’s largest mutual fund families. For more than 85 years, Capital Group has invested with a long-term focus based on thorough research and attention to risk.
Fund results shown in this report, unless otherwise indicated, are for Class A shares at net asset value. If a sales charge (maximum 5.75%) had been deducted, the results would have been lower. Results are for past periods and are not predictive of results for future periods. Current and future results may be lower or higher than those shown. Share prices and returns will vary, so investors may lose money. Investing for short periods makes losses more likely. For current information and month-end results, visit americanfunds.com.
Here are the average annual total returns on a $1,000 investment with all distributions reinvested for periods ended March 31, 2019:
| Class A shares | | 1 year | | 5 years | | 10 years |
| | | | | | | |
| Reflecting 5.75% maximum sales charge | | | –3.00% | | | | 6.35% | | | | 14.27% | |
For other share class results, visit americanfunds.com and americanfundsretirement.com.
The total annual fund operating expense ratio was 1.04% for Class A shares as of the prospectus dated December 1, 2018 (as supplemented to date).
Investment results assume all distributions are reinvested and reflect applicable fees and expenses. When applicable, investment results reflect fee waivers, without which results would have been lower. Visit americanfunds.com for more information.
Investing outside the United States may be subject to risks, such as currency fluctuations and political instability. These risks may be heightened in connection with investments in developing countries. Investing in small-capitalization stocks can involve greater risk than is customarily associated with investing in stocks of larger, more established companies. Refer to the fund prospectus and the Risk Factors section of this report for more information on these and other risks associated with investing in the fund.
Investments are not FDIC-insured, nor are they deposits of or guaranteed by a bank or any other entity, so they may lose value.
Fellow investors:
The first six months of SMALLCAP World Fund’s fiscal year were marked by a sharp downturn — and subsequent recovery — in equity markets around the world, and continued volatility in many international markets. As a result, the fund produced a total return of –3.30% during the six-month period. This includes a capital gain distribution of $3.31 a share made on December 24, 2018.
The fund’s loss for the period was less than that of its primary benchmark index and peer groups. The unmanaged MSCI All Country World Small Cap Index benchmark, which does not include fees or expenses, declined 5.85% for the same period, while the Lipper Global Small-/Mid-Cap Funds Average lost 5.62%.
Results at a glance
For periods ended March 31, 2019, with all distributions reinvested
| | | Cumulative total returns | | Average annual total returns |
| | | Lifetime |
| | | 6 months | | 1 year | | 5 years | | 10 years | | (since 4/30/90) |
| | | | | | | | | | | |
| SMALLCAP World Fund (Class A shares) | | | –3.30 | % | | | 2.92 | % | | | 7.62 | % | | | 14.95 | % | | | 9.61 | % |
| MSCI All Country World Small Cap Index* | | | –5.85 | | | | –2.72 | | | | 5.54 | | | | 14.29 | | | | 8.02 | |
| Lipper Global Small-/Mid-Cap Funds Average† | | | –5.62 | | | | –2.49 | | | | 5.32 | | | | 13.95 | | | | 8.53 | |
| * | The MSCI All Country World Small Cap Index is unmanaged and, therefore, has no expenses. Investors cannot invest directly in an index. Results reflect dividends net of withholding taxes. Because the index was not in existence when the fund’s Class A shares were first sold, cumulative returns through May 31, 1994, reflect the returns of the S&P Developed <$1.2 Billion Index. MSCI source: MSCI. S&P source: S&P Dow Jones Indices LLC. |
| † | Source: Thomson Reuters Lipper. Lipper averages reflect the current composition of all eligible mutual funds (all share classes) within a given category. Lipper categories are dynamic and averages may have few funds, especially over longer periods. To see the number of funds included in the Lipper category for each fund’s lifetime, please see the Quarterly Statistical Update available on our website. |
While periods of volatility can result in short-term losses, we believe the fund’s value lies in its return over longer periods. We are gratified that the fund’s returns have surpassed its peers and benchmarks over five and 10 years, as well as its lifetime. We believe this represents the results of our intensive global research effort and disciplined approach to investing.
Market overview
Equity markets saw a sharp decline over the course of the first three months of the fund’s fiscal year. This was prompted by a variety of concerns — slower job growth, higher interest rates from the U.S. Federal Reserve, ongoing trade disputes between the United States and China, and the ongoing disruption around the United Kingdom’s still-pending exit from the European Union.
Since late December, however, most markets resumed an upward trend. Much of this was fueled by investor sentiment, which changed course after the Federal Reserve’s more recent statements on the economy — leading many investors to believe further rate hikes were on hold for the moment.
The U.S. gross domestic product grew 2.2% annually during the fourth quarter of 2018 — slower than in previous quarters, while the unemployment rate remained at a low 3.9%. Overseas, GDP in the European Union grew 1.4% in the fourth quarter of 2018, while unemployment there fell to 6.5% in February, down from 7.1% the year prior.
In Japan, the economy grew 0.5% in the fourth quarter of 2018, reversing a decline in the previous quarter, and unemployment fell to 2.3% in February, from 2.5% the month prior. In China, annualized GDP growth fell to 6.4% in the fourth quarter of 2018, down from 6.7% the year prior.
Overall, corporate earnings around the world generally have been sound, with volatility stemming from trade issues and geopolitical activity rather than any particular business trends.
The fund’s holdings
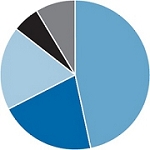
As of March 31, domestic equities made up 46.9% of the fund’s total portfolio, slightly up from six months prior, while the fund’s holdings in European shares represented 20.7% of the portfolio, slightly higher from when the year began. The fund also added to its holdings in Asia & Pacific basin equities and other markets as well.
The fund’s holdings in information technology, industrials, financials, consumer staples and consumer discretionary stocks were additive to the fund’s return relative to its benchmark index, while real estate, health care, utilities, energy and materials companies detracted from relative returns.
While we provide a breakdown of geography and industry when we report to you, our investment process does not involve a top-down requirement for specific geographies or sectors. Rather, we encourage you to view these breakdowns as a result of our bottom-up approach to evaluating potential investments, no matter their domicile or industry.
Where the fund’s assets are invested(by country of domicile)
| | As of March 31, 2019 | Percent of
net assets |
| n | United States | | 46.9 | % |
| n | Europe | | 20.7 | |
| n | Asia & Pacific Basin | | 18.0 | |
| n | Other (including Canada & Latin America) | | 5.8 | |
| n | Short-term securities & other assets less liabilities | | 8.6 | |
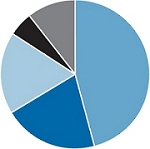
| | As of September 30, 2018 | Percent of
net assets |
| n | United States | | 46.1 | % |
| n | Europe | | 20.5 | |
| n | Asia & Pacific Basin | | 17.7 | |
| n | Other (including Canada & Latin America) | | 5.4 | |
| n | Short-term securities & other assets less liabilities | | 10.3 | |
Seven of the fund’s top-ten holdings by assets saw positive returns for the six-month period, led by software companies MongoDB, which gained 80.3%, and Alteryx, up 46.6%. Among those that fell, healthcare company Insulet dropped 10.3%, while Molina Healthcare lost 4.5%.
The fund retained 8.6% of its holdings in cash and other short-term assets, less liabilities, down from 10.3% of the portfolio when the fiscal year began. As can be expected when stocks decline, some portfolio managers took advantage of the downturn to make investments at lower prices.
Looking ahead
There are both signs of worry and encouragement to consider when looking ahead. Currently, geopolitical and trade issues have drawn our attention, particularly the state of trade between China and the United States, and China’s recent overtures to Russia. Also, mounting debt among many nations, including the United States, could prove problematic should the economy worsen.
However, there are notable positive signs for the markets. The Federal Reserve has indeed paused in raising interest rates and credit markets are improving. The Chinese economy is showing signs of improvement as well, and the United Kingdom has, at least temporarily staved off a disorderly Brexit.
While valuations of stocks in certain sectors and geographies are no longer cheap, the overall markets remain on sound footing, and we continue to find excellent companies to invest in. We are struck by the pace of innovation, particularly in the United States but also around the globe. Companies continue to disrupt entire sectors of the economy with innovations, and the economy has adjusted, adapted and thrived.
We remain confident in our ability to deeply research individual companies around the globe and identify potential investments that may help the fund’s investors reach their financial goals, no matter the economic environment. Indeed, we have invested heavily in the fund’s research efforts over the past year and will continue to do so, providing our investors with what we believe to be greater opportunities for long-term success.
Thank you for your support of SMALLCAP World Fund. We look forward to reporting to you again in six months.
Cordially,

Gregory W. Wendt
Co-President

Jonathan Knowles
Co-President

Julian N. Abdey
Co-President
May 9, 2019
For current information about the fund, visit americanfunds.com.
| Summary investment portfolio March 31, 2019 | unaudited |
| | |
| Industry sector diversification | Percent of net assets |

| Country diversification by domicile | | Percent of
net assets |
| United States | | | 46.89 | % |
| Eurozone* | | | 7.58 | |
| United Kingdom | | | 6.54 | |
| India | | | 4.90 | |
| Japan | | | 4.37 | |
| China | | | 2.68 | |
| Sweden | | | 2.66 | |
| Canada | | | 2.33 | |
| Switzerland | | | 1.60 | |
| Other countries | | | 11.80 | |
| Short-term securities & other assets less liabilities | | | 8.65 | |
| * | Countries using the euro as a common currency; those represented in the fund’s portfolio are Austria, Belgium, Finland, France, Germany, Greece, Ireland, Italy, the Netherlands, Slovenia and Spain. |
| Common stocks 91.02% | | Shares | | | Value
(000) | |
| Information technology 20.88% | | | | | | | | |
| RingCentral, Inc., Class A1 | | | 4,741,200 | | | $ | 511,101 | |
| MongoDB, Inc., Class A1,2 | | | 3,209,522 | | | | 471,864 | |
| Paycom Software, Inc.1 | | | 2,430,134 | | | | 459,611 | |
| Alteryx, Inc., Class A1 | | | 3,425,833 | | | | 287,325 | |
| DocuSign, Inc.1 | | | 3,621,737 | | | | 187,751 | |
| Square, Inc., Class A1 | | | 2,450,730 | | | | 183,609 | |
| SimCorp AS | | | 1,865,843 | | | | 180,125 | |
| EPAM Systems, Inc.1 | | | 1,062,494 | | | | 179,700 | |
| WiseTech Global Ltd. | | | 10,762,887 | | | | 176,687 | |
| Yext, Inc.1,3 | | | 8,025,874 | | | | 175,446 | |
| Alarm.Com Holdings, Inc.1,3 | | | 2,695,700 | | | | 174,951 | |
| Smartsheet Inc., Class A1,2 | | | 3,905,000 | | | | 159,285 | |
| Ceridian HCM Holding Inc.1 | | | 2,901,471 | | | | 148,845 | |
| Halma PLC | | | 6,749,967 | | | | 146,994 | |
| HubSpot, Inc.1 | | | 874,748 | | | | 145,392 | |
| Bottomline Technologies, Inc.1,3 | | | 2,848,000 | | | | 142,656 | |
| Other securities | | | | | | | 5,180,499 | |
| | | | | | | | 8,911,841 | |
| | | Shares | | | Value
(000) | |
| Health care 16.02% | | | | | | | | |
| Molina Healthcare, Inc.1,3 | | | 3,390,512 | | | $ | 481,317 | |
| Insulet Corp.1,3 | | | 4,742,319 | | | | 450,947 | |
| GW Pharmaceuticals PLC (ADR)1,2,3 | | | 2,412,980 | | | | 406,756 | |
| Bluebird Bio, Inc.1,2 | | | 1,967,720 | | | | 309,581 | |
| NovoCure Ltd.1 | | | 3,780,597 | | | | 182,111 | |
| CONMED Corp.3 | | | 2,049,162 | | | | 170,449 | |
| Notre Dame Intermédica Participações S.A. | | | 19,261,749 | | | | 161,361 | |
| Allogene Therapeutics, Inc.1,2 | | | 4,786,670 | | | | 138,383 | |
| Allogene Therapeutics, Inc.1,4,5 | | | 653,594 | | | | 18,328 | |
| Centene Corp.1 | | | 2,918,878 | | | | 154,992 | |
| Integra LifeSciences Holdings Corp.1 | | | 2,748,275 | | | | 153,134 | |
| Other securities | | | | | | | 4,213,184 | |
| | | | | | | | 6,840,543 | |
| | | | | | | | | |
| Consumer discretionary 15.87% | | | | | | | | |
| Ocado Group PLC1 | | | 14,078,000 | | | | 251,293 | |
| Takeaway.com NV1,3 | | | 3,139,600 | | | | 238,429 | |
| ServiceMaster Global Holdings, Inc.1 | | | 4,805,000 | | | | 224,393 | |
| Evolution Gaming Group AB3 | | | 2,830,274 | | | | 222,987 | |
| Five Below, Inc.1 | | | 1,486,702 | | | | 184,723 | |
| Domino’s Pizza, Inc. | | | 691,161 | | | | 178,389 | |
| Strategic Education, Inc.3 | | | 1,291,720 | | | | 169,616 | |
| Floor & Decor Holdings, Inc., Class A1 | | | 4,048,600 | | | | 166,883 | |
| Dollarama Inc. | | | 6,015,000 | | | | 160,463 | |
| Mattel, Inc.1,2 | | | 12,260,000 | | | | 159,380 | |
| Grand Canyon Education, Inc.1 | | | 1,309,000 | | | | 149,894 | |
| Other securities | | | | | | | 4,669,816 | |
| | | | | | | | 6,776,266 | |
| | | | | | | | | |
| Industrials 13.72% | | | | | | | | |
| Spirax-Sarco Engineering PLC | | | 2,028,028 | | | | 189,917 | |
| MonotaRO Co., Ltd. | | | 8,371,900 | | | | 185,900 | |
| Nihon M&A Center Inc.2 | | | 6,264,980 | | | | 171,279 | |
| NIBE Industrier AB, Class B | | | 12,762,000 | | | | 163,415 | |
| IMCD NV | | | 2,053,000 | | | | 156,255 | |
| Bravida Holding AB3 | | | 16,173,198 | | | | 142,557 | |
| Rheinmetall AG | | | 1,363,840 | | | | 142,096 | |
| Other securities | | | | | | | 4,703,104 | |
| | | | | | | | 5,854,523 | |
| | | | | | | | | |
| Financials 9.38% | | | | | | | | |
| Kotak Mahindra Bank Ltd. | | | 18,292,040 | | | | 352,374 | |
| Essent Group Ltd.1 | | | 3,797,535 | | | | 165,003 | |
| MarketAxess Holdings Inc. | | | 660,000 | | | | 162,413 | |
| Webster Financial Corp. | | | 3,200,000 | | | | 162,144 | |
| RenaissanceRe Holdings Ltd. | | | 1,058,600 | | | | 151,909 | |
| Bajaj Finance Ltd. | | | 3,257,000 | | | | 142,222 | |
| Other securities | | | | | | | 2,869,910 | |
| | | | | | | | 4,005,975 | |
| Common stocks (continued) | | Shares | | | Value
(000) | |
| Consumer staples 3.98% | | | | | | | | |
| Emmi AG3 | | | 311,300 | | | $ | 273,863 | |
| Other securities | | | | | | | 1,426,383 | |
| | | | | | | | 1,700,246 | |
| | | | | | | | | |
| Materials 3.91% | | | | | | | | |
| Allegheny Technologies Inc.1,3 | | | 9,997,788 | | | | 255,643 | |
| Other securities | | | | | | | 1,414,331 | |
| | | | | | | | 1,669,974 | |
| | | | | | | | | |
| Communication services 3.16% | | | | | | | | |
| Iridium Communications Inc.1,3 | | | 7,666,388 | | | | 202,699 | |
| Iridium Communications Inc.1,3,5 | | | 636,132 | | | | 16,819 | |
| Other securities | | | | | | | 1,127,338 | |
| | | | | | | | 1,346,856 | |
| | | | | | | | | |
| Other 4.10% | | | | | | | | |
| Other securities | | | | | | | 1,747,630 | |
| | | | | | | | | |
| Total common stocks (cost: $27,201,807,000) | | | | | | | 38,853,854 | |
| | | | | | | | | |
| Preferred securities 0.10% | | | | | | | | |
| Other 0.10% | | | | | | | | |
| Other securities | | | | | | | 41,786 | |
| | | | | | | | | |
| Total preferred securities (cost: $41,513,000) | | | | | | | 41,786 | |
| | | | | | | | | |
| Rights & warrants 0.00% | | | | | | | | |
| Other 0.00% | | | | | | | | |
| Other securities | | | | | | | 1,272 | |
| | | | | | | | | |
| Total rights & warrants (cost: $0) | | | | | | | 1,272 | |
| | | | | | | | | |
| Convertible stocks 0.21% | | | | | | | | |
| Other 0.21% | | | | | | | | |
| Other securities | | | | | | | 89,564 | |
| | | | | | | | | |
| Total convertible stocks (cost: $94,000,000) | | | | | | | 89,564 | |
| | | | | | | | | |
| Convertible bonds 0.02% | | Principal amount
(000) | | | | | |
| Consumer discretionary 0.02% | | | | | | | | |
| Other securities | | | | | | | 9,901 | |
| | | | | | | | | |
| Total convertible bonds (cost: $13,315,000) | | | | | | | 9,901 | |
| Short-term securities 9.55% | | Shares | | | Value
(000) | |
| Money market investments 9.55% | | | | | | | | |
| Capital Group Central Cash Fund | | | 37,078,827 | | | $ | 3,707,141 | |
| Goldman Sachs Financial Square Government Fund6 | | | 130,000,000 | | | | 130,000 | |
| Blackrock FedFund6 | | | 110,000,000 | | | | 110,000 | |
| Morgan Stanley Institutional Liquidity Funds - Government Portfolio6 | | | 100,000,000 | | | | 100,000 | |
| Invesco - Short-term Investments Trust - Government & Agency Portfolio6 | | | 23,967,684 | | | | 23,968 | |
| Fidelity Institutional Money Market Funds - Government Portfolio6 | | | 5,000,000 | | | | 5,000 | |
| | | | | | | | 4,076,109 | |
| | | | | | | | | |
| Total short-term securities (cost: $4,076,476,000) | | | | | | | 4,076,109 | |
| Total investment securities 100.90% (cost: $31,427,111,000) | | | | | | | 43,072,486 | |
| Other assets less liabilities (0.90)% | | | | | | | (384,455 | ) |
| | | | | | | | | |
| Net assets 100.00% | | | | | | $ | 42,688,031 | |
This summary investment portfolio is designed to streamline the report and help investors better focus on the fund’s principal holdings. See the inside back cover for details on how to obtain a complete schedule of portfolio holdings.
“Other securities” includes all issues that are not disclosed separately in the summary investment portfolio.
Investments in affiliates
A company is an affiliate of the fund under the Investment Company Act of 1940 if the fund’s holdings in that company represent 5% or more of the outstanding voting shares. The value of the fund’s affiliated-company holdings is either shown in the summary investment portfolio or included in the value of “Other securities” under the respective industry sectors. Further details on these holdings and related transactions during the six months ended March 31, 2019, appear below.
| | | Beginning
shares | | | Additions | | | Reductions | | | Ending
shares | |
| Common stocks 17.88% | | | | | | | | | | | | | | | | |
| Information technology 3.33% | | | | | | | | | | | | | | | | |
| Yext, Inc.1 | | | 7,625,428 | | | | 1,335,446 | | | | 935,000 | | | | 8,025,874 | |
| Alarm.Com Holdings, Inc.1 | | | 3,249,000 | | | | — | | | | 553,300 | | | | 2,695,700 | |
| Bottomline Technologies, Inc.1 | | | 2,808,000 | | | | 40,000 | | | | — | | | | 2,848,000 | |
| Acacia Communications, Inc.1 | | | 2,585,240 | | | | — | | | | 178,899 | | | | 2,406,341 | |
| Jenoptik AG | | | 1,295,000 | | | | 2,333,640 | | | | — | | | | 3,628,640 | |
| Netcompany Group AS, non-registered shares1 | | | 2,631,826 | | | | 678,087 | | | | — | | | | 3,309,913 | |
| Inphi Corp.1,2 | | | 2,532,699 | | | | 428,000 | | | | 542,867 | | | | 2,417,832 | |
| Carel Industries SpA1 | | | 7,370,849 | | | | 450,000 | | | | — | | | | 7,820,849 | |
| Douzone Bizon Co., Ltd. | | | 1,636,408 | | | | 206,000 | | | | — | | | | 1,842,408 | |
| Endurance International Group Holdings, Inc.1 | | | 6,992,277 | | | | 2,469,322 | | | | — | | | | 9,461,599 | |
| Bravura Solutions Ltd. | | | 17,125,000 | | | | — | | | | — | | | | 17,125,000 | |
| eMemory Technology Inc. | | | 5,992,000 | | | | — | | | | 1,967,666 | | | | 4,024,334 | |
| Megaport Ltd.1,2 | | | 7,476,000 | | | | 3,045,178 | | | | — | | | | 10,521,178 | |
| Faraday Technology Corp.7 | | | 9,733,000 | | | | 5,632,000 | | | | — | | | | 15,365,000 | |
| accesso Technology Group PLC1,2 | | | — | | | | 1,935,612 | | | | — | | | | 1,935,612 | |
| Humanica PCL | | | 34,600,000 | | | | 16,240,900 | | | | — | | | | 50,840,900 | |
| Datalex PLC | | | 6,106,000 | | | | — | | | | 701,000 | | | | 5,405,000 | |
Investments in affiliates(continued)
| | | Beginning
shares | | | Additions | | | Reductions | | | Ending
shares | |
| MACOM Technology Solutions Holdings, Inc.1,2,8 | | | 925,000 | | | | 2,743,000 | | | | 1,193,000 | | | | 2,475,000 | |
| SPS Commerce, Inc.1,8 | | | 1,159,000 | | | | — | | | | 885,631 | | | | 273,369 | |
| Talend SA (ADR)1,8 | | | 2,216,455 | | | | 216,800 | | | | 2,351,755 | | | | 81,500 | |
| Health care 5.16% | | | | | | | | | | | | | | | | |
| Molina Healthcare, Inc.1 | | | 4,022,587 | | | | — | | | | 632,075 | | | | 3,390,512 | |
| Insulet Corp.1 | | | 3,633,423 | | | | 1,108,896 | | | | — | | | | 4,742,319 | |
| GW Pharmaceuticals PLC (ADR)1,2 | | | 2,250,346 | | | | 162,634 | | | | — | | | | 2,412,980 | |
| CONMED Corp. | | | 1,920,000 | | | | 260,000 | | | | 130,838 | | | | 2,049,162 | |
| Allakos Inc.1,2 | | | 1,124,660 | | | | 2,319,709 | | | | — | | | | 3,444,369 | |
| Allakos Inc.1,5,8 | | | 2,018,188 | | | | — | | | | 2,018,188 | | | | — | |
| iRhythm Technologies, Inc.1 | | | 1,571,200 | | | | 34,000 | | | | 148,750 | | | | 1,456,450 | |
| CryoLife, Inc.1 | | | 2,157,251 | | | | 592,748 | | | | 193,077 | | | | 2,556,922 | |
| Osstem Implant Co., Ltd.1 | | | 1,142,821 | | | | — | | | | — | | | | 1,142,821 | |
| CellaVision AB, non-registered shares | | | 1,908,123 | | | | — | | | | 288,000 | | | | 1,620,123 | |
| Cansino Biologics Inc., Class H1 | | | — | | | | 9,920,400 | | | | — | | | | 9,920,400 | |
| NuCana PLC (ADR)1,2 | | | 2,542,628 | | | | — | | | | — | | | | 2,542,628 | |
| Diplomat Pharmacy, Inc.1 | | | 5,930,624 | | | | 21,936 | | | | 373,004 | | | | 5,579,556 | |
| Flexion Therapeutics, Inc.1,2 | | | 3,002,700 | | | | 158,000 | | | | 650,000 | | | | 2,510,700 | |
| Adaptimmune Therapeutics PLC (ADR)1,2 | | | 7,186,700 | | | | — | | | | — | | | | 7,186,700 | |
| Revenio Group OYJ, non-registered shares7 | | | 803,464 | | | | 498,940 | | | | — | | | | 1,302,404 | |
| Neuronetics, Inc.1,7 | | | 474,644 | | | | 969,656 | | | | — | | | | 1,444,300 | |
| Xenon Pharmaceuticals Inc.1 | | | 1,900,900 | | | | 118,326 | | | | — | | | | 2,019,226 | |
| Corindus Vascular Robotics, Inc.1,4,5,9 | | | — | | | | 10,872,716 | | | | — | | | | 10,872,716 | |
| Neovasc Inc.1 | | | 1,346,592 | | | | 3,595,454 | | | | — | | | | 4,942,046 | |
| Neovasc Inc. (CAD denominated)1 | | | 62,946 | | | | — | | | | 62,946 | | | | — | |
| Evolent Health, Inc., Class A1,8 | | | 4,505,000 | | | | — | | | | 2,134,455 | | | | 2,370,545 | |
| Fleury SA, ordinary nominative8 | | | 16,147,000 | | | | 1,171,000 | | | | 3,625,000 | | | | 13,693,000 | |
| Glaukos Corp.1,8 | | | 2,820,000 | | | | — | | | | 1,669,678 | | | | 1,150,322 | |
| Natera, Inc.1,8 | | | 3,215,580 | | | | — | | | | 500,000 | | | | 2,715,580 | |
| Pacific Biosciences of California, Inc.1,8 | | | 8,843,303 | | | | — | | | | 8,843,303 | | | | — | |
| Consumer discretionary 3.20% | | | | | | | | | | | | | | | | |
| Takeaway.com NV1 | | | 1,422,100 | | | | 1,717,500 | | | | — | | | | 3,139,600 | |
| Evolution Gaming Group AB | | | 2,652,021 | | | | 178,253 | | | | — | | | | 2,830,274 | |
| Strategic Education, Inc. | | | 1,068,970 | | | | 222,750 | | | | — | | | | 1,291,720 | |
| Nien Made Enterprise Co., Ltd. | | | 13,493,000 | | | | 1,722,000 | | | | — | | | | 15,215,000 | |
| TopBuild Corp.1 | | | 1,682,000 | | | | 101,200 | | | | — | | | | 1,783,200 | |
| Domino’s Pizza Group PLC | | | 22,017,815 | | | | 5,290,000 | | | | — | | | | 27,307,815 | |
| At Home Group Inc.1 | | | 3,878,873 | | | | 715,000 | | | | — | | | | 4,593,873 | |
| Delta Corp Ltd. | | | 21,407,238 | | | | — | | | | — | | | | 21,407,238 | |
| Garrett Motion Inc.1 | | | — | | | | 3,825,559 | | | | — | | | | 3,825,559 | |
| Party City Holdco Inc.1,2 | | | — | | | | 5,332,459 | | | | — | | | | 5,332,459 | |
| Lands’ End, Inc.1 | | | 2,061,232 | | | | 17,000 | | | | — | | | | 2,078,232 | |
| Hoteles City Express, SAB de CV1 | | | — | | | | 24,121,157 | | | | — | | | | 24,121,157 | |
| MIPS AB1 | | | 1,396,751 | | | | — | | | | — | | | | 1,396,751 | |
| Beazer Homes USA, Inc. (USA)1,7 | | | 1,659,813 | | | | — | | | | — | | | | 1,659,813 | |
| Hostelworld Group PLC | | | 7,645,662 | | | | — | | | | — | | | | 7,645,662 | |
| Tile Shop Holdings, Inc. | | | 3,158,000 | | | | — | | | | — | | | | 3,158,000 | |
| BNN Technology PLC1,4,10 | | | 19,007,000 | | | | — | | | | — | | | | 19,007,000 | |
| Maisons du Monde SA8 | | | 2,374,914 | | | | — | | | | 1,195,401 | | | | 1,179,513 | |
| Quotient Technology Inc.1,8 | | | 5,311,667 | | | | — | | | | 3,311,667 | | | | 2,000,000 | |
| Seria Co., Ltd.2,8 | | | 4,138,791 | | | | 88,100 | | | | 1,092,000 | | | | 3,134,891 | |
| MakeMyTrip Ltd., non-registered shares1,8,9 | | | 92,000 | | | | — | | | | 92,000 | | | | — | |
| MakeMyTrip Ltd., non-registered shares1,8 | | | 3,592,051 | | | | 143,601 | | | | 1,061,501 | | | | 2,674,151 | |
| Sleep Country Canada Holdings Inc.8 | | | 3,011,968 | | | | — | | | | 3,011,968 | | | | — | |
| Tailored Brands, Inc.8 | | | 3,981,850 | | | | — | | | | 3,263,000 | | | | 718,850 | |
| | | Beginning
shares | | | Additions | | | Reductions | | | Ending
shares | |
| Taiwan Paiho Ltd.8 | | | 20,561,000 | | | | — | | | | 20,561,000 | | | | — | |
| zooplus AG, non-registered shares1,2,8 | | | 560,634 | | | | 10,780 | | | | 293,158 | | | | 278,256 | |
| Industrials 2.27% | | | | | | | | | | | | | | | | |
| Bravida Holding AB | | | 16,173,198 | | | | — | | | | — | | | | 16,173,198 | |
| Rexnord Corp.1 | | | 5,005,000 | | | | 503,000 | | | | — | | | | 5,508,000 | |
| VARTA AG, non-registered shares1 | | | 2,157,755 | | | | 1,068,245 | | | | 170,000 | | | | 3,056,000 | |
| Advanced Disposal Services, Inc.1 | | | 4,710,502 | | | | 75,000 | | | | 150,000 | | | | 4,635,502 | |
| Continental Building Products, Inc.1 | | | 3,080,700 | | | | — | | | | 300,000 | | | | 2,780,700 | |
| Coor Service Management Holding AB | | | 4,502,788 | | | | 1,375,842 | | | | — | | | | 5,878,630 | |
| Barrett Business Services, Inc. | | | 580,000 | | | | 295,786 | | | | 290,000 | | | | 585,786 | |
| Tsubaki Nakashima Co., Ltd. | | | 2,821,800 | | | | 413,500 | | | | 794,200 | | | | 2,441,100 | |
| Avon Rubber PLC | | | 2,248,000 | | | | 233,863 | | | | — | | | | 2,481,863 | |
| Trust Tech Inc. | | | 622,000 | | | | 582,900 | | | | — | | | | 1,204,900 | |
| Instalco Intressenter AB (publ) | | | 2,934,000 | | | | 897,789 | | | | — | | | | 3,831,789 | |
| Greaves Cotton Ltd. | | | 15,200,000 | | | | 1,000,000 | | | | — | | | | 16,200,000 | |
| KeyW Holding Corp.1 | | | 2,536,400 | | | | — | | | | — | | | | 2,536,400 | |
| R.R. Donnelley & Sons Co. | | | 5,631,489 | | | | — | | | | 1,269,065 | | | | 4,362,424 | |
| Alfen NV1,2 | | | 1,275,000 | | | | — | | | | — | | | | 1,275,000 | |
| J. Kumar Infraprojects Ltd. | | | 4,450,500 | | | | — | | | | — | | | | 4,450,500 | |
| Fluence Corp. Ltd.1,8 | | | 14,826,347 | | | | 14,290,437 | | | | 29,116,784 | | | | — | |
| King Slide Works Co., Ltd.8 | | | 7,190,765 | | | | — | | | | 5,007,765 | | | | 2,183,000 | |
| Kratos Defense & Security Solutions, Inc.1,8 | | | 8,262,000 | | | | — | | | | 5,360,600 | | | | 2,901,400 | |
| va-Q-tec AG1,2,8 | | | 781,221 | | | | — | | | | 175,907 | | | | 605,314 | |
| XP Power Ltd.8 | | | 1,295,000 | | | | — | | | | 780,000 | | | | 515,000 | |
| Financials 0.95% | | | | | | | | | | | | | | | | |
| Cannae Holdings, Inc.1 | | | 4,895,000 | | | | 242,578 | | | | — | | | | 5,137,578 | |
| NMI Holdings, Inc.1 | | | 5,036,127 | | | | — | | | | 261,000 | | | | 4,775,127 | |
| Trupanion, Inc.1,2 | | | 2,640,200 | | | | 33,394 | | | | — | | | | 2,673,594 | |
| HUB24 Ltd.2 | | | 4,298,000 | | | | 79,158 | | | | — | | | | 4,377,158 | |
| Greenhill & Co., Inc. | | | 1,169,700 | | | | — | | | | — | | | | 1,169,700 | |
| CenterState Bank Corp.8 | | | 6,069,250 | | | | 118,000 | | | | 3,160,317 | | | | 3,026,933 | |
| GoldMoney Inc.1,8 | | | 4,931,100 | | | | — | | | | 4,931,100 | | | | — | |
| M&A Capital Partners Co., Ltd.1,8 | | | 1,133,400 | | | | — | | | | 1,133,400 | | | | — | |
| Third Point Reinsurance Ltd.1,8 | | | 6,147,821 | | | | — | | | | 5,226,353 | | | | 921,468 | |
| Consumer staples 0.76% | | | | | | | | | | | | | | | | |
| Emmi AG | | | 311,300 | | | | — | | | | — | | | | 311,300 | |
| CCL Products (India) Ltd. | | | 10,642,173 | | | | — | | | | — | | | | 10,642,173 | |
| R.E.A. Holdings PLC1 | | | 2,162,000 | | | | — | | | | — | | | | 2,162,000 | |
| Ariake Japan Co., Ltd.8 | | | 1,754,000 | | | | 74,200 | | | | 1,828,200 | | | | — | |
| Simply Good Foods Co., Class A1,8 | | | 4,420,000 | | | | — | | | | 485,000 | | | | 3,935,000 | |
| Materials 1.09% | | | | | | | | | | | | | | | | |
| Allegheny Technologies Inc.1 | | | 6,615,300 | | | | 3,412,488 | | | | 30,000 | | | | 9,997,788 | |
| Loma Negra Compania Industrial Argentina SA (ADR)1,7 | | | 577,695 | | | | 7,554,003 | | | | — | | | | 8,131,698 | |
| Scapa Group PLC | | | 12,183,326 | | | | 170,000 | | | | — | | | | 12,353,326 | |
| Navin Fluorine International Ltd. | | | 3,202,000 | | | | — | | | | — | | | | 3,202,000 | |
| Mayur Uniquoters Ltd. | | | 3,660,000 | | | | — | | | | 214,328 | | | | 3,445,672 | |
| Excelsior Mining Corp.1,2 | | | 12,868,000 | | | | — | | | | — | | | | 12,868,000 | |
| Danakali Ltd.1 | | | 16,700,000 | | | | — | | | | 2,638,198 | | | | 14,061,802 | |
| Hummingbird Resources PLC1 | | | 27,459,300 | | | | — | | | | 7,100,000 | | | | 20,359,300 | |
| Bacanora Lithium PLC1,8 | | | 8,573,925 | | | | — | | | | 6,135,000 | | | | 2,438,925 | |
| BlueJay Mining PLC1,2,8 | | | 45,009,091 | | | | — | | | | 27,487,700 | | | | 17,521,391 | |
| Kenmare Resources PLC1,8 | | | 7,124,863 | | | | — | | | | 2,087,527 | | | | 5,037,336 | |
| Nevada Copper Corp.1,2,8 | | | 48,480,000 | | | | — | | | | 22,280,000 | | | | 26,200,000 | |
| Sirius Minerals PLC1,2,8 | | | 247,367,560 | | | | — | | | | 55,515,711 | | | | 191,851,849 | |
Investments in affiliates(continued)
| | | Beginning
shares | | | Additions | | | Reductions | | | Ending
shares | |
| Communication services 0.63% | | | | | | | | | | | | | | | | |
| Iridium Communications Inc.1 | | | 7,666,388 | | | | — | | | | — | | | | 7,666,388 | |
| Iridium Communications Inc.1,5 | | | 636,132 | | | | — | | | | — | | | | 636,132 | |
| Care.com, Inc.1 | | | 1,642,963 | | | | 900,037 | | | | — | | | | 2,543,000 | |
| Entertainment One Ltd.8 | | | 21,220,339 | | | | 2,142,661 | | | | 1,000,000 | | | | 22,363,000 | |
| Zegona Communications PLC8 | | | 7,911,786 | | | | 980,781 | | | | 5,592,263 | | | | 3,300,304 | |
| Real estate 0.34% | | | | | | | | | | | | | | | | |
| WHA Corp. PCL | | | 1,106,071,920 | | | | — | | | | 115,000,000 | | | | 991,071,920 | |
| Foxtons Group PLC | | | 17,881,785 | | | | — | | | | — | | | | 17,881,785 | |
| MGM Growth Properties LLC REIT, Class A8 | | | 4,017,887 | | | | — | | | | 1,277,887 | | | | 2,740,000 | |
| Purplebricks Group PLC1,8 | | | 17,905,676 | | | | — | | | | 17,905,676 | | | | — | |
| Energy 0.15% | | | | | | | | | | | | | | | | |
| Nine Energy Service, Inc.1 | | | 1,504,000 | | | | 300,000 | | | | — | | | | 1,804,000 | |
| Savannah Petroleum PLC1 | | | 65,357,000 | | | | — | | | | 18,354,145 | | | | 47,002,855 | |
| PetroTal Corp.1 | | | 34,775,000 | | | | — | | | | — | | | | 34,775,000 | |
| Lekoil Ltd. (CDI)1 | | | 42,922,391 | | | | — | | | | 2,112,354 | | | | 40,810,037 | |
| BNK Petroleum Inc.1,8 | | | 12,804,914 | | | | — | | | | 12,804,914 | | | | — | |
| Independence Contract Drilling, Inc.1,8 | | | 2,908,057 | | | | — | | | | 1,957,927 | | | | 950,130 | |
| Providence Resources PLC1,8 | | | 35,235,000 | | | | — | | | | 35,235,000 | | | | — | |
| San Leon Energy PLC1,8 | | | 32,348,000 | | | | — | | | | 32,348,000 | | | | — | |
| Utilities 0.00% | | | | | | | | | | | | | | | | |
| Mytrah Energy Ltd.1,4,10 | | | 10,418,000 | | | | — | | | | — | | | | 10,418,000 | |
| Preferred securities 0.00% | | | | | | | | | | | | | | | | |
| Consumer staples 0.00% | | | | | | | | | | | | | | | | |
| R.E.A. Holdings PLC 9.00%, preferred shares | | | 96,000 | | | | — | | | | — | | | | 96,000 | |
| Rights & warrants 0.00% | | | | | | | | | | | | | | | | |
| Health care 0.00% | | | | | | | | | | | | | | | | |
| Neovasc Inc., Class A, warrants, expire 20221 | | | 28,290 | | | | — | | | | 28,290 | | | | — | |
| Energy 0.00% | | | | | | | | | | | | | | | | |
| Savannah Petroleum PLC, warrants, expire 20191,8 | | | 21,698,000 | | | | — | | | | 21,698,000 | | | | — | |
| Convertible stocks 0.04% | | | | | | | | | | | | | | | | |
| Health care 0.04% | | | | | | | | | | | | | | | | |
| Cortexyme, Inc., Series B, 8.00% noncumulative convertible preferred4,9,10 | | | 4,244,602 | | | | — | | | | — | | | | 4,244,602 | |
| | | Net
realized
gain (loss)
(000) | | | Net
unrealized
(depreciation)
appreciation
(000) | | | Dividend
income
(000) | | | Value of
affiliates at
3/31/2019
(000) | |
| Common stocks 17.88% | | | | | | | | | | | | | | | | |
| Information technology 3.33% | | | | | | | | | | | | | | | | |
| Yext, Inc.1 | | $ | 5,813 | | | $ | (18,656 | ) | | $ | — | | | $ | 175,446 | |
| Alarm.Com Holdings, Inc.1 | | | 11,134 | | | | 11,951 | | | | — | | | | 174,951 | |
| Bottomline Technologies, Inc.1 | | | — | | | | (63,520 | ) | | | — | | | | 142,656 | |
| Acacia Communications, Inc.1 | | | (1,515 | ) | | | 40,080 | | | | — | | | | 138,004 | |
| Jenoptik AG | | | — | | | | 11,261 | | | | — | | | | 135,138 | |
| Netcompany Group AS, non-registered shares1 | | | — | | | | 384 | | | | — | | | | 118,513 | |
| Inphi Corp.1,2 | | | 2,947 | | | | 11,367 | | | | — | | | | 105,756 | |
| Carel Industries SpA1 | | | — | | | | (3,424 | ) | | | — | | | | 85,985 | |
| Douzone Bizon Co., Ltd. | | | — | | | | 19,786 | | | | 582 | | | | 75,638 | |
| Endurance International Group Holdings, Inc.1 | | | — | | | | (13,571 | ) | | | — | | | | 68,597 | |
| Bravura Solutions Ltd. | | | — | | | | 11,923 | | | | 642 | | | | 66,513 | |
| | | Net
realized
gain (loss)
(000) | | | Net
unrealized
(depreciation)
appreciation
(000) | | | Dividend
income
(000) | | | Value of
affiliates at
3/31/2019
(000) | |
| eMemory Technology Inc. | | $ | (6,357 | ) | | $ | 8,213 | | | $ | — | | | $ | 42,045 | |
| Megaport Ltd.1,2 | | | — | | | | 2,007 | | | | — | | | | 30,555 | |
| Faraday Technology Corp.7 | | | — | | | | (6,582 | ) | | | — | | | | 22,210 | |
| accesso Technology Group PLC1,2 | | | — | | | | 934 | | | | — | | | | 21,832 | |
| Humanica PCL | | | — | | | | (1,907 | ) | | | — | | | | 14,979 | |
| Datalex PLC | | | (2,600 | ) | | | (9,083 | ) | | | — | | | | 4,887 | |
| MACOM Technology Solutions Holdings, Inc.1,2,8 | | | (4,761 | ) | | | 7,963 | | | | — | | | | — | |
| SPS Commerce, Inc.1,8 | | | 21,428 | | | | (32,008 | ) | | | — | | | | — | |
| Talend SA (ADR)1,8 | | | 12,842 | | | | (90,601 | ) | | | — | | | | — | |
| | | | | | | | | | | | | | | | 1,423,705 | |
| Health care 5.16% | | | | | | | | | | | | | | | | |
| Molina Healthcare, Inc.1 | | | 43,986 | | | | (73,903 | ) | | | — | | | | 481,317 | |
| Insulet Corp.1 | | | — | | | | (24,364 | ) | | | — | | | | 450,947 | |
| GW Pharmaceuticals PLC (ADR)1,2 | | | — | | | | (7,358 | ) | | | — | | | | 406,756 | |
| CONMED Corp. | | | (938 | ) | | | 8,003 | | | | 768 | | | | 170,449 | |
| Allakos Inc.1,2 | | | — | | | | 55,926 | | | | — | | | | 139,497 | |
| Allakos Inc.1,5,8 | | | — | | | | (61,718 | ) | | | — | | | | — | |
| iRhythm Technologies, Inc.1 | | | 6,510 | | | | (37,414 | ) | | | — | | | | 109,175 | |
| CryoLife, Inc.1 | | | 1,693 | | | | (14,843 | ) | | | — | | | | 74,585 | |
| Osstem Implant Co., Ltd.1 | | | — | | | | (9,592 | ) | | | — | | | | 54,468 | |
| CellaVision AB, non-registered shares | | | 2,312 | | | | (3,995 | ) | | | — | | | | 48,618 | |
| Cansino Biologics Inc., Class H1 | | | — | | | | 10,488 | | | | — | | | | 43,726 | |
| NuCana PLC (ADR)1,2 | | | — | | | | (20,138 | ) | | | — | | | | 43,225 | |
| Diplomat Pharmacy, Inc.1 | | | (5,347 | ) | | | (74,652 | ) | | | — | | | | 32,417 | |
| Flexion Therapeutics, Inc.1,2 | | | (5,092 | ) | | | (11,445 | ) | | | — | | | | 31,334 | |
| Adaptimmune Therapeutics PLC (ADR)1,2 | | | — | | | | (66,549 | ) | | | — | | | | 30,903 | |
| Revenio Group OYJ, non-registered shares7 | | | — | | | | (554 | ) | | | 417 | | | | 22,441 | |
| Neuronetics, Inc.1,7 | | | — | | | | (13,024 | ) | | | — | | | | 22,026 | |
| Xenon Pharmaceuticals Inc.1 | | | — | | | | (5,552 | ) | | | — | | | | 20,515 | |
| Corindus Vascular Robotics, Inc.1,4,5,9 | | | — | | | | 3,540 | | | | — | | | | 18,540 | |
| Neovasc Inc.1 | | | — | | | | (25,196 | ) | | | — | | | | 2,079 | |
| Neovasc Inc. (CAD denominated)1 | | | — | | | | 21,860 | | | | — | | | | — | |
| Evolent Health, Inc., Class A1,8 | | | 728 | | | | (65,112 | ) | | | — | | | | — | |
| Fleury SA, ordinary nominative8 | | | (6,702 | ) | | | 6,307 | | | | 3,033 | | | | — | |
| Glaukos Corp.1,8 | | | 60,192 | | | | (37,309 | ) | | | — | | | | — | |
| Natera, Inc.1,8 | | | 198 | | | | (13,060 | ) | | | — | | | | — | |
| Pacific Biosciences of California, Inc.1,8 | | | 39,261 | | | | (21,939 | ) | | | — | | | | — | |
| | | | | | | | | | | | | | | | 2,203,018 | |
| Consumer discretionary 3.20% | | | | | | | | | | | | | | | | |
| Takeaway.com NV1 | | | — | | | | 35,071 | | | | — | | | | 238,429 | |
| Evolution Gaming Group AB | | | — | | | | 22,121 | | | | — | | | | 222,987 | |
| Strategic Education, Inc. | | | — | | | | (3,874 | ) | | | 1,180 | | | | 169,616 | |
| Nien Made Enterprise Co., Ltd. | | | — | | | | 14,737 | | | | — | | | | 134,030 | |
| TopBuild Corp.1 | | | — | | | | 13,692 | | | | — | | | | 115,587 | |
| Domino’s Pizza Group PLC | | | — | | | | (11,619 | ) | | | 1,965 | | | | 86,072 | |
| At Home Group Inc.1 | | | — | | | | (54,348 | ) | | | — | | | | 82,047 | |
| Delta Corp Ltd. | | | — | | | | 16,840 | | | | 181 | | | | 78,738 | |
| Garrett Motion Inc.1 | | | — | | | | 5,765 | | | | — | | | | 56,350 | |
| Party City Holdco Inc.1,2 | | | — | | | | (16,859 | ) | | | — | | | | 42,340 | |
| Lands’ End, Inc.1 | | | — | | | | (1,871 | ) | | | — | | | | 34,519 | |
| Hoteles City Express, SAB de CV1 | | | — | | | | (1,768 | ) | | | — | | | | 25,774 | |
| MIPS AB1 | | | — | | | | 3,061 | | | | — | | | | 20,191 | |
Investments in affiliates(continued)
| | | Net
realized
gain (loss)
(000) | | | Net
unrealized
(depreciation)
appreciation
(000) | | | Dividend
income
(000) | | | Value of
affiliates at
3/31/2019
(000) | |
| Beazer Homes USA, Inc. (USA)1,7 | | $ | — | | | $ | 1,676 | | | $ | — | | | $ | 19,104 | |
| Hostelworld Group PLC | | | — | | | | (3,701 | ) | | | — | | | | 18,422 | |
| Tile Shop Holdings, Inc. | | | — | | | | (4,705 | ) | | | 316 | | | | 17,874 | |
| BNN Technology PLC1,4,10 | | | — | | | | (5,161 | ) | | | — | | | | 3,609 | |
| Maisons du Monde SA8 | | | (15,995 | ) | | | (3,878 | ) | | | — | | | | — | |
| Quotient Technology Inc.1,8 | | | (12,310 | ) | | | (17,425 | ) | | | — | | | | — | |
| Seria Co., Ltd.2,8 | | | (11,275 | ) | | | 14,229 | | | | 842 | | | | — | |
| MakeMyTrip Ltd., non-registered shares1,8,9 | | | — | | | | 787 | | | | — | | | | — | |
| MakeMyTrip Ltd., non-registered shares1,8 | | | (9,981 | ) | | | 7,726 | | | | — | | | | — | |
| Sleep Country Canada Holdings Inc.8 | | | 6,809 | | | | (23,564 | ) | | | 289 | | | | — | |
| Tailored Brands, Inc.8 | | | (27,333 | ) | | | (29,133 | ) | | | 846 | | | | — | |
| Taiwan Paiho Ltd.8 | | | (16,803 | ) | | | — | | | | — | | | | — | |
| zooplus AG, non-registered shares1,2,8 | | | 4,733 | | | | (34,749 | ) | | | — | | | | — | |
| | | | | | | | | | | | | | | | 1,365,689 | |
| Industrials 2.27% | | | | | | | | | | | | | | | | |
| Bravida Holding AB | | | — | | | | 9,894 | | | | — | | | | 142,557 | |
| Rexnord Corp.1 | | | — | | | | (27,728 | ) | | | — | | | | 138,471 | |
| VARTA AG, non-registered shares1 | | | 4 | | | | 25,745 | | | | — | | | | 130,404 | |
| Advanced Disposal Services, Inc.1 | | | 155 | | | | 4,245 | | | | — | | | | 129,794 | |
| Continental Building Products, Inc.1 | | | 3,893 | | | | (40,850 | ) | | | — | | | | 68,934 | |
| Coor Service Management Holding AB | | | — | | | | 6,374 | | | | — | | | | 52,354 | |
| Barrett Business Services, Inc. | | | 421 | | | | 1,335 | | | | 280 | | | | 45,299 | |
| Tsubaki Nakashima Co., Ltd. | | | (3,689 | ) | | | (4,063 | ) | | | 1,028 | | | | 43,765 | |
| Avon Rubber PLC | | | — | | | | 347 | | | | 321 | | | | 42,023 | |
| Trust Tech Inc. | | | — | | | | 3,333 | | | | 301 | | | | 39,844 | |
| Instalco Intressenter AB (publ) | | | — | | | | 1,814 | | | | — | | | | 32,559 | |
| Greaves Cotton Ltd. | | | — | | | | 3,013 | | | | 915 | | | | 32,552 | |
| KeyW Holding Corp.1 | | | — | | | | (101 | ) | | | — | | | | 21,864 | |
| R.R. Donnelley & Sons Co. | | | (10,162 | ) | | | 6,485 | | | | 338 | | | | 20,591 | |
| Alfen NV1,2 | | | — | | | | (2,720 | ) | | | — | | | | 16,539 | |
| J. Kumar Infraprojects Ltd. | | | — | | | | (2,155 | ) | | | — | | | | 10,321 | |
| Fluence Corp. Ltd.1,8 | | | (6,545 | ) | | | 5,440 | | | | — | | | | — | |
| King Slide Works Co., Ltd.8 | | | (7,948 | ) | | | 7,398 | | | | — | | | | — | |
| Kratos Defense & Security Solutions, Inc.1,8 | | | 20,242 | | | | (17,164 | ) | | | — | | | | — | |
| va-Q-tec AG1,2,8 | | | (2,539 | ) | | | 897 | | | | — | | | | — | |
| XP Power Ltd.8 | | | 303 | | | | (11,841 | ) | | | 504 | | | | — | |
| | | | | | | | | | | | | | | | 967,871 | |
| Financials 0.95% | | | | | | | | | | | | | | | | |
| Cannae Holdings, Inc.1 | | | — | | | | 17,178 | | | | — | | | | 124,638 | |
| NMI Holdings, Inc.1 | | | 15 | | | | 14,234 | | | | — | | | | 123,533 | |
| Trupanion, Inc.1,2 | | | — | | | | (7,737 | ) | | | — | | | | 87,533 | |
| HUB24 Ltd.2 | | | — | | | | 2,823 | | | | 62 | | | | 43,046 | |
| Greenhill & Co., Inc. | | | — | | | | (5,661 | ) | | | 117 | | | | 25,160 | |
| CenterState Bank Corp.8 | | | (14,788 | ) | | | (14,822 | ) | | | 801 | | | | — | |
| GoldMoney Inc.1,8 | | | (8,762 | ) | | | 5,361 | | | | — | | | | — | |
| M&A Capital Partners Co., Ltd.1,8 | | | (11,967 | ) | | | — | | | | — | | | | — | |
| Third Point Reinsurance Ltd.1,8 | | | (11,287 | ) | | | (3,048 | ) | | | — | | | | — | |
| | | | | | | | | | | | | | | | 403,910 | |
| Consumer staples 0.76% | | | | | | | | | | | | | | | | |
| Emmi AG | | | — | | | | 41,514 | | | | — | | | | 273,863 | |
| CCL Products (India) Ltd. | | | — | | | | 6,867 | | | | — | | | | 43,782 | |
| R.E.A. Holdings PLC1 | | | — | | | | (2,329 | ) | | | — | | | | 5,674 | |
| | | Net
realized
gain (loss)
(000) | | | Net
unrealized
(depreciation)
appreciation
(000) | | | Dividend
income
(000) | | | Value of
affiliates at
3/31/2019
(000) | |
| Ariake Japan Co., Ltd.8 | | $ | 12,831 | | | $ | — | | | $ | — | | | $ | — | |
| Simply Good Foods Co., Class A1,8 | | | 3,481 | | | | 890 | | | | — | | | | — | |
| | | | | | | | | | | | | | | | 323,319 | |
| Materials 1.09% | | | | | | | | | | | | | | | | |
| Allegheny Technologies Inc.1 | | | (144 | ) | | | (24,976 | ) | | | — | | | | 255,643 | |
| Loma Negra Compania Industrial Argentina SA (ADR)1,7 | | | — | | | | (5,270 | ) | | | — | | | | 89,042 | |
| Scapa Group PLC | | | — | | | | (26,593 | ) | | | — | | | | 45,694 | |
| Navin Fluorine International Ltd. | | | — | | | | 2,219 | | | | 167 | | | | 32,706 | |
| Mayur Uniquoters Ltd. | | | (703 | ) | | | 442 | | | | 128 | | | | 17,245 | |
| Excelsior Mining Corp.1,2 | | | — | | | | 557 | | | | — | | | | 9,822 | |
| Danakali Ltd.1 | | | 224 | | | | (1,378 | ) | | | — | | | | 7,788 | |
| Hummingbird Resources PLC1 | | | (158 | ) | | | (1,042 | ) | | | — | | | | 5,502 | |
| Bacanora Lithium PLC1,8 | | | (4,952 | ) | | | 3,663 | | | | — | | | | — | |
| BlueJay Mining PLC1,2,8 | | | (2,797 | ) | | | 645 | | | | — | | | | — | |
| Kenmare Resources PLC1,8 | | | (28,148 | ) | | | 24,305 | | | | — | | | | — | |
| Nevada Copper Corp.1,2,8 | | | (3,803 | ) | | | (2,078 | ) | | | — | | | | — | |
| Sirius Minerals PLC1,2,8 | | | 274 | | | | (25,476 | ) | | | — | | | | — | |
| | | | | | | | | | | | | | | | 463,442 | |
| Communication services 0.63% | | | | | | | | | | | | | | | | |
| Iridium Communications Inc.1 | | | — | | | | 30,206 | | | | — | | | | 202,699 | |
| Iridium Communications Inc.1,5 | | | — | | | | 2,506 | | | | — | | | | 16,819 | |
| Care.com, Inc.1 | | | — | | | | (3,435 | ) | | | — | | | | 50,250 | |
| Entertainment One Ltd.8 | | | 521 | | | | 10,508 | | | | — | | | | — | |
| Zegona Communications PLC8 | | | (4,765 | ) | | | 4,423 | | | | 158 | | | | — | |
| | | | | | | | | | | | | | | | 269,768 | |
| Real estate 0.34% | | | | | | | | | | | | | | | | |
| WHA Corp. PCL | | | 3,912 | | | | (6,369 | ) | | | — | | | | 131,789 | |
| Foxtons Group PLC | | | — | | | | 2,436 | | | | — | | | | 14,836 | |
| MGM Growth Properties LLC REIT, Class A8 | | | 1,288 | | | | 4,032 | | | | 2,500 | | | | — | |
| Purplebricks Group PLC1,8 | | | (9,102 | ) | | | 2,927 | | | | — | | | | — | |
| | | | | | | | | | | | | | | | 146,625 | |
| Energy 0.15% | | | | | | | | | | | | | | | | |
| Nine Energy Service, Inc.1 | | | — | | | | (15,091 | ) | | | — | | | | 40,861 | |
| Savannah Petroleum PLC1 | | | (6,077 | ) | | | 571 | | | | — | | | | 15,366 | |
| PetroTal Corp.1 | | | — | | | | (2,222 | ) | | | — | | | | 5,855 | |
| Lekoil Ltd. (CDI)1 | | | (2,149 | ) | | | (2,661 | ) | | | — | | | | 3,880 | |
| BNK Petroleum Inc.1,8 | | | (15,654 | ) | | | 13,635 | | | | — | | | | — | |
| Independence Contract Drilling, Inc.1,8 | | | (397 | ) | | | (4,808 | ) | | | — | | | | — | |
| Providence Resources PLC1,8 | | | 102 | | | | (2,183 | ) | | | — | | | | — | |
| San Leon Energy PLC1,8 | | | (17,713 | ) | | | 21,025 | | | | — | | | | — | |
| | | | | | | | | | | | | | | | 65,962 | |
| Utilities 0.00% | | | | | | | | | | | | | | | | |
| Mytrah Energy Ltd.1,4,10 | | | — | | | | (5,089 | ) | | | — | | | | 136 | |
| Total common stocks | | | | | | | | | | | | | | | 7,633,445 | |
| Preferred securities 0.00% | | | | | | | | | | | | | | | | |
| Consumer staples 0.00% | | | | | | | | | | | | | | | | |
| R.E.A. Holdings PLC 9.00%, preferred shares | | | — | | | | (13 | ) | | | 6 | | | | 119 | |
Investments in affiliates(continued)
| | | Net
realized
gain (loss)
(000) | | | Net
unrealized
(depreciation)
appreciation
(000) | | | Dividend
income
(000) | | | Value of
affiliates at
3/31/2019
(000) | |
| Rights & warrants 0.00% | | | | | | | | | | | | | | | | |
| Health care 0.00% | | | | | | | | | | | | | | | | |
| Neovasc Inc., Class A, warrants, expire 20221 | | $ | — | | | $ | — | | | $ | — | | | $ | — | |
| Energy 0.00% | | | | | | | | | | | | | | | | |
| Savannah Petroleum PLC, warrants, expire 20191,8 | | | — | | | | (523 | ) | | | — | | | | — | |
| Total rights & warrants | | | | | | | | | | | | | | | — | |
| Convertible stocks 0.04% | | | | | | | | | | | | | | | | |
| Health care 0.04% | | | | | | | | | | | | | | | | |
| Cortexyme, Inc., Series B, 8.00% noncumulative convertible preferred4,9,10 | | | — | | | | — | | | | — | | | | 15,000 | |
| Total 17.92% | | $ | (33,006 | ) | | $ | (652,165 | ) | | $ | 18,687 | | | $ | 7,648,564 | |
| 1 | Security did not produce income during the last 12 months. |
| 2 | All or a portion of this security was on loan. The total value of all such securities, including those in “Other securities,” was $1,447,802,000, which represented 3.39% of the net assets of the fund. Refer to Note 5 for more information on securities lending. |
| 3 | Represents an affiliated company as defined under the Investment Company Act of 1940. |
| 4 | Valued under fair value procedures adopted by authority of the board of directors. The total value of all such securities, including those in “Other securities,” was $361,507,000, which represented .85% of the net assets of the fund. |
| 5 | Acquired in a transaction exempt from registration under Rule 144A of the Securities Act of 1933. May be resold in the U.S. in transactions exempt from registration, normally to qualified institutional buyers. The total value of all such securities, including those in “Other securities,” was $223,938,000, which represented .52% of the net assets of the fund. |
| 6 | Security purchased with cash collateral from securities on loan. Refer to Note 5 for more information on securities lending. |
| 7 | This security was an unaffiliated issuer in its initial period of acquisition at 9/30/2018; it was not publicly disclosed. |
| 8 | Unaffiliated issuer at 3/31/2019. |
| 9 | Acquired through a private placement transaction exempt from registration under the Securities Act of 1933. May be subject to legal or contractual restrictions on resale. Further details on these holdings appear below. |
| 10 | Value determined using significant unobservable inputs. |
| Private placement securities | | Acquisition
date(s) | | Cost
(000) | | | Value
(000) | | | Percent
of net
assets | |
| Corindus Vascular Robotics, Inc. | | 2/26/2019 | | $ | 15,000 | | | $ | 18,540 | | | | .04 | % |
| Cortexyme, Inc., Series B, 8.00% noncumulative convertible preferred | | 5/23/2018 | | | 15,000 | | | | 15,000 | | | | .04 | |
| Other private placement securities | | 12/3/2013-1/4/2019 | | | 189,115 | | | | 210,068 | | | | .48 | |
| Total private placement securities | | | | $ | 219,115 | | | $ | 243,608 | | | | .56 | % |
Key to abbreviations
ADR = American Depositary Receipts
CAD = Canadian dollars
CDI = CREST Depository Interest
See notes to financial statements
Financial statements
Statement of assets and liabilities
at March 31, 2019 | unaudited
(dollars in thousands) |
| | |
| Assets: | | | | | | | | |
| Investment securities, at value: | | | | | | | | |
| Unaffiliated issuers (cost: $25,743,642) | | $ | 35,423,922 | | | | | |
| Affiliated issuers (cost: $5,683,469) | | | 7,648,564 | | | $ | 43,072,486 | |
| Cash | | | | | | | 35,352 | |
Cash denominated in currencies other than U.S. dollars
(cost: $9,263) | | | | | | | 9,265 | |
| Receivables for: | | | | | | | | |
| Sales of investments | | | 81,815 | | | | | |
| Sales of fund’s shares | | | 41,798 | | | | | |
| Dividends and interest | | | 39,930 | | | | | |
| Securities lending income | | | 1,874 | | | | | |
| Other | | | 2,139 | | | | 167,556 | |
| | | | | | | | 43,284,659 | |
| Liabilities: | | | | | | | | |
| Collateral for securities on loan | | | | | | | 368,968 | |
| Payables for: | | | | | | | | |
| Purchases of investments | | | 116,436 | | | | | |
| Repurchases of fund’s shares | | | 47,494 | | | | | |
| Investment advisory services | | | 22,115 | | | | | |
| Services provided by related parties | | | 9,597 | | | | | |
| Directors’ deferred compensation | | | 4,380 | | | | | |
| Non-U.S. taxes | | | 25,027 | | | | | |
| Other | | | 2,611 | | | | 227,660 | |
| Net assets at March 31, 2019 | | | | | | $ | 42,688,031 | |
| | | | | | | | | |
| Net assets consist of: | | | | | | | | |
| Capital paid in on shares of capital stock | | | | | | $ | 30,582,452 | |
| Total distributable earnings | | | | | | | 12,105,579 | |
| Net assets at March 31, 2019 | | | | | | $ | 42,688,031 | |
See notes to financial statements
(dollars and shares in thousands, except per-share amounts)
Total authorized capital stock — 2,000,000 shares,
$.01 par value (788,657 total shares outstanding)
| | | Net assets | | | Shares
outstanding | | | Net asset value
per share | |
| Class A | | $ | 22,946,579 | | | | 423,686 | | | $ | 54.16 | |
| Class C | | | 708,531 | | | | 15,182 | | | | 46.67 | |
| Class T | | | 11 | | | | — | * | | | 54.39 | |
| Class F-1 | | | 719,066 | | | | 13,452 | | | | 53.45 | |
| Class F-2 | | | 4,627,493 | | | | 84,006 | | | | 55.09 | |
| Class F-3 | | | 1,969,669 | | | | 36,072 | | | | 54.60 | |
| Class 529-A | | | 1,356,639 | | | | 25,379 | | | | 53.45 | |
| Class 529-C | | | 202,556 | | | | 4,256 | | | | 47.59 | |
| Class 529-E | | | 59,587 | | | | 1,152 | | | | 51.72 | |
| Class 529-T | | | 12 | | | | — | * | | | 54.34 | |
| Class 529-F-1 | | | 143,737 | | | | 2,648 | | | | 54.28 | |
| Class R-1 | | | 26,145 | | | | 541 | | | | 48.30 | |
| Class R-2 | | | 563,968 | | | | 11,668 | | | | 48.34 | |
| Class R-2E | | | 24,728 | | | | 463 | | | | 53.40 | |
| Class R-3 | | | 780,838 | | | | 15,137 | | | | 51.58 | |
| Class R-4 | | | 823,261 | | | | 15,330 | | | | 53.70 | |
| Class R-5E | | | 25,463 | | | | 469 | | | | 54.29 | |
| Class R-5 | | | 392,099 | | | | 7,009 | | | | 55.95 | |
| Class R-6 | | | 7,317,649 | | | | 132,207 | | | | 55.35 | |
| | |
| * | Amount less than one thousand. |
See notes to financial statements
Statement of operations
for the six months ended March 31, 2019 | unaudited
(dollars in thousands) |
| | |
| Investment income: | | | | | | | | |
| Income: | | | | | | | | |
| Dividends (net of non-U.S. taxes of $5,328; also includes $18,687 from affiliates) | | $ | 128,220 | | | | | |
| Interest (net of non-U.S. taxes of $34) | | | 46,461 | | | | | |
| Securities lending income (net of fees) | | | 10,561 | | | $ | 185,242 | |
| Fees and expenses*: | | | | | | | | |
| Investment advisory services | | | 123,273 | | | | | |
| Distribution services | | | 40,436 | | | | | |
| Transfer agent services | | | 22,796 | | | | | |
| Administrative services | | | 5,666 | | | | | |
| Reports to shareholders | | | 1,085 | | | | | |
| Registration statement and prospectus | | | 2,554 | | | | | |
| Directors’ compensation | | | 49 | | | | | |
| Auditing and legal | | | 56 | | | | | |
| Custodian | | | 2,097 | | | | | |
| State and local taxes | | | 1 | | | | | |
| Other | | | 1,396 | | | | | |
| Total fees and expenses before reimbursements | | | 199,409 | | | | | |
| Less transfer agent services reimbursements | | | 16 | | | | | |
| Total fees and expenses after reimbursements | | | | | | | 199,393 | |
| Net investment loss | | | | | | | (14,151 | ) |
| | | | | | | | | |
| Net realized gain and unrealized depreciation: | | | | | | | | |
| Net realized gain (loss) on: | | | | | | | | |
| Investments (net of non-U.S. taxes of $4,242): | | | | | | | | |
| Unaffiliated issuers | | | 607,572 | | | | | |
| Affiliated issuers | | | (33,006 | ) | | | | |
| Forward currency contracts | | | (545 | ) | | | | |
| Currency transactions | | | (652 | ) | | | 573,369 | |
| Net unrealized (depreciation) appreciation on: | | | | | | | | |
| Investments (net of non-U.S. taxes of $24,880): | | | | | | | | |
| Unaffiliated issuers | | | (1,362,838 | ) | | | | |
| Affiliated issuers | | | (652,165 | ) | | | | |
| Forward currency contracts | | | 923 | | | | | |
| Currency translations | | | (520 | ) | | | (2,014,600 | ) |
| Net realized gain and unrealized depreciation | | | | | | | (1,441,231 | ) |
| | | | | | | | | |
| Net decrease in net assets resulting from operations | | | | | | $ | (1,455,382 | ) |
| | |
| * | Additional information related to class-specific fees and expenses is included in the notes to financial statements. |
See notes to financial statements
Statements of changes in net assets
(dollars in thousands)
| | | Six months ended
March 31, 2019* | | | Year ended
September 30, 2018 | |
| Operations: | | | | | | | | |
| Net investment (loss) income | | $ | (14,151 | ) | | $ | 46,991 | |
| Net realized gain | | | 573,369 | | | | 2,346,244 | |
| Net unrealized (depreciation) appreciation | | | (2,014,600 | ) | | | 2,561,220 | |
| Net (decrease) increase in net assets resulting from operations | | | (1,455,382 | ) | | | 4,954,455 | |
| | | | | | | | | |
| Distributions paid to shareholders | | | (2,434,862 | ) | | | (1,678,270 | ) |
| | | | | | | | | |
| Net capital share transactions | | | 2,701,227 | | | | 3,711,671 | |
| | | | | | | | | |
| Total (decrease) increase in net assets | | | (1,189,017 | ) | | | 6,987,856 | |
| | | | | | | | | |
| Net assets: | | | | | | | | |
| Beginning of period | | | 43,877,048 | | | | 36,889,192 | |
| End of period | | $ | 42,688,031 | | | $ | 43,877,048 | |
See notes to financial statements
| Notes to financial statements | unaudited |
1. Organization
SMALLCAP World Fund, Inc. (the “fund”) is registered under the Investment Company Act of 1940 as an open-end, diversified management investment company. The fund seeks to provide long-term growth of capital. Shareholders approved a proposal to reorganize the fund from a Maryland corporation to a Delaware statutory trust. The reorganization may be completed in the next year; however, the fund reserves the right to delay the implementation.
The fund has 19 share classes consisting of six retail share classes (Classes A, C, T, F-1, F-2 and F-3), five 529 college savings plan share classes (Classes 529-A, 529-C, 529-E, 529-T and 529-F-1) and eight retirement plan share classes (Classes R-1, R-2, R-2E, R-3, R-4, R-5E, R-5 and R-6). The 529 college savings plan share classes can be used to save for college education. The retirement plan share classes are generally offered only through eligible employer-sponsored retirement plans. The fund’s share classes are described further in the following table:
| Share class | | Initial sales
charge | | Contingent deferred sales
charge upon redemption | | Conversion feature |
| Classes A and 529-A | | Up to 5.75% | | None (except 1% for certain redemptions within 18 months of purchase without an initial sales charge) | | None |
| Class C | | None | | 1% for redemptions within one year of purchase | | Class C converts to Class F-1 after 10 years |
| Class 529-C | | None | | 1% for redemptions within one year of purchase | | Class 529-C converts to Class 529-A after 10 years |
| Class 529-E | | None | | None | | None |
| Classes T and 529-T* | | Up to 2.50% | | None | | None |
| Classes F-1, F-2, F-3 and 529-F-1 | | None | | None | | None |
| Classes R-1, R-2, R-2E, R-3, R-4, R-5E, R-5 and R-6 | | None | | None | | None |
| * | Class T and 529-T shares are not available for purchase. |
Holders of all share classes have equal pro rata rights to the assets, dividends and liquidation proceeds of the fund. Each share class has identical voting rights, except for the exclusive right to vote on matters affecting only its class. Share classes have different fees and expenses (“class-specific fees and expenses”), primarily due to different arrangements for distribution, transfer agent and administrative services. Differences in class-specific fees and expenses will result in differences in net investment income and, therefore, the payment of different per-share dividends by each share class.
2. Significant accounting policies
The fund is an investment company that applies the accounting and reporting guidance issued in Topic 946 by the U.S. Financial Accounting Standards Board. The fund’s financial statements have been prepared to comply with U.S. generally accepted accounting principles (“U.S. GAAP”). These principles require the fund’s investment adviser to make estimates and assumptions that affect reported amounts and disclosures. Actual results could differ from those estimates. Subsequent events, if any, have been evaluated through the date of issuance in the preparation of the financial statements. The fund follows the significant accounting policies described in this section, as well as the valuation policies described in the next section on valuation.
Security transactions and related investment income— Security transactions are recorded by the fund as of the date the trades are executed with brokers. Realized gains and losses from security transactions are determined based on the specific identified cost of the securities. In the event a security is purchased with a delayed payment date, the fund will segregate liquid assets sufficient to meet its payment obligations. Dividend income is recognized on the ex-dividend date and interest income is recognized on an accrual basis. Market discounts, premiums and original issue discounts on fixed-income securities are amortized daily over the expected life of the security.
Class allocations— Income, fees and expenses (other than class-specific fees and expenses) and realized and unrealized gains and losses are allocated daily among the various share classes based on their relative net assets. Class-specific fees and expenses, such as distribution, transfer agent and administrative services, are charged directly to the respective share class.
Distributions paid to shareholders— Income dividends and capital gain distributions are recorded on the ex-dividend date.
Currency translation— Assets and liabilities, including investment securities, denominated in currencies other than U.S. dollars are translated into U.S. dollars at the exchange rates supplied by one or more pricing vendors on the valuation date. Purchases and sales of investment securities and income and expenses are translated into U.S. dollars at the exchange rates on the dates of such transactions. The effects of changes in exchange rates on investment securities are included with the net realized gain or loss and net unrealized appreciation or depreciation on investments in the fund’s statement of operations. The realized gain or loss and unrealized appreciation or depreciation resulting from all other transactions denominated in currencies other than U.S. dollars are disclosed separately.
3. Valuation
Capital Research and Management Company (“CRMC”), the fund’s investment adviser, values the fund’s investments at fair value as defined by U.S. GAAP. The net asset value of each share class of the fund is generally determined as of approximately 4:00 p.m. New York time each day the New York Stock Exchange is open.
Methods and inputs— The fund’s investment adviser uses the following methods and inputs to establish the fair value of the fund’s assets and liabilities. Use of particular methods and inputs may vary over time based on availability and relevance as market and economic conditions evolve.
Equity securities are generally valued at the official closing price of, or the last reported sale price on, the exchange or market on which such securities are traded, as of the close of business on the day the securities are being valued or, lacking any sales, at the last available bid price. Prices for each security are taken from the principal exchange or market on which the security trades.
Fixed-income securities, including short-term securities, are generally valued at prices obtained from one or more pricing vendors. Vendors value such securities based on one or more of the inputs described in the following table. The table provides examples of inputs that are commonly relevant for valuing particular classes of fixed-income securities in which the fund is authorized to invest. However, these classifications are not exclusive, and any of the inputs may be used to value any other class of fixed-income security.
| Fixed-income class | | Examples of standard inputs |
| All | | Benchmark yields, transactions, bids, offers, quotations from dealers and trading systems, new issues, spreads and other relationships observed in the markets among comparable securities; and proprietary pricing models such as yield measures calculated using factors such as cash flows, financial or collateral performance and other reference data (collectively referred to as “standard inputs”) |
| Corporate bonds & notes; convertible securities | | Standard inputs and underlying equity of the issuer |
| Bonds & notes of governments & government agencies | | Standard inputs and interest rate volatilities |
When the fund’s investment adviser deems it appropriate to do so (such as when vendor prices are unavailable or deemed to be not representative), fixed-income securities will be valued in good faith at the mean quoted bid and ask prices that are reasonably and timely available (or bid prices, if ask prices are not available) or at prices for securities of comparable maturity, quality and type.
Securities with both fixed-income and equity characteristics, or equity securities traded principally among fixed-income dealers, are generally valued in the manner described for either equity or fixed-income securities, depending on which method is deemed most appropriate by the fund’s investment adviser. The Capital Group Central Cash Fund (“CCF”) is valued based on the policies and procedures in CCF’s statement of additional information. Forward currency contracts are valued at the mean of representative quoted bid and ask prices, generally based on prices supplied by one or more pricing vendors.
Securities and other assets for which representative market quotations are not readily available or are considered unreliable by the fund’s investment adviser are fair valued as determined in good faith under fair valuation guidelines adopted by authority of the fund’s board of directors as further described. The investment adviser follows fair valuation guidelines, consistent with U.S. Securities and Exchange Commission rules and guidance, to consider relevant principles and factors when making fair value determinations. The investment adviser considers relevant indications of value that are reasonably and timely available to it in determining the fair value to be assigned to a particular security, such as the type and cost of the security; contractual or legal restrictions on resale of the security; relevant financial or business developments of the issuer; actively traded similar or related securities; conversion or exchange rights on the security; related corporate actions; significant events occurring after the close of trading in the security; and changes in overall market conditions. In addition, the closing prices of equity securities that trade in markets outside U.S. time zones may be adjusted to reflect significant events that occur after the close of local trading but before the net asset value of each share class of the fund is determined. Fair valuations and valuations of investments that are not actively trading involve judgment and may differ materially from valuations that would have been used had greater market activity occurred.
Processes and structure— The fund’s board of directors has delegated authority to the fund’s investment adviser to make fair value determinations, subject to board oversight. The investment adviser has established a Joint Fair Valuation Committee (the “Fair Valuation Committee”) to administer, implement and oversee the fair valuation process, and to make fair value decisions. The Fair Valuation Committee regularly reviews its own fair value decisions, as well as decisions made under its standing instructions to the investment adviser’s valuation teams. The Fair Valuation Committee reviews changes in fair value measurements from period to period and may, as deemed appropriate, update the fair valuation guidelines to better reflect the results of back testing and address new or evolving issues. The Fair Valuation Committee reports any changes to the fair valuation guidelines to the board of directors. The fund’s board and audit committee also regularly review reports that describe fair value determinations and methods.
The fund’s investment adviser has also established a Fixed-Income Pricing Review Group to administer and oversee the fixed-income valuation process, including the use of fixed-income pricing vendors. This group regularly reviews pricing vendor information and market data. Pricing decisions, processes and controls over security valuation are also subject to additional internal reviews, including an annual control self-evaluation program facilitated by the investment adviser’s compliance group.
Classifications— The fund’s investment adviser classifies the fund’s assets and liabilities into three levels based on the inputs used to value the assets or liabilities. Level 1 values are based on quoted prices in active markets for identical securities. Level 2 values are based on significant observable market inputs, such as quoted prices for similar securities and quoted prices in inactive markets. Certain securities trading outside the U.S. may transfer between Level 1 and Level 2 due to valuation adjustments resulting from significant market movements following the close of local trading. Level 3 values are
based on significant unobservable inputs that reflect the investment adviser’s determination of assumptions that market participants might reasonably use in valuing the securities. The valuation levels are not necessarily an indication of the risk or liquidity associated with the underlying investment. For example, U.S. government securities are reflected as Level 2 because the inputs used to determine fair value may not always be quoted prices in an active market. The following table presents the fund’s valuation levels as of March 31, 2019 (dollars in thousands):
| | | Investment securities | |
| | | Level 1 | | | Level 2 | | | Level 3 | | | Total | |
| Assets: | | | | | | | | | | | | | | | | |
| Common stocks: | | | | | | | | | | | | | | | | |
| Information technology | | $ | 8,911,841 | | | $ | — | | | $ | — | | | $ | 8,911,841 | |
| Health care | | | 6,736,252 | | | | 36,868 | | | | 67,423 | | | | 6,840,543 | |
| Consumer discretionary | | | 6,772,657 | | | | — | | | | 3,609 | | | | 6,776,266 | |
| Industrials | | | 5,854,523 | | | | — | | | | — | | | | 5,854,523 | |
| Financials | | | 4,005,487 | | | | — | | | | 488 | | | | 4,005,975 | |
| Consumer staples | | | 1,700,246 | | | | — | | | | — | | | | 1,700,246 | |
| Materials | | | 1,669,974 | | | | — | | | | — | | | | 1,669,974 | |
| Communication services | | | 1,346,856 | | | | — | | | | — | | | | 1,346,856 | |
| Other | | | 1,626,716 | | | | — | | | | 120,914 | | | | 1,747,630 | |
| Preferred securities | | | 119 | | | | — | | | | 41,667 | | | | 41,786 | |
| Rights & warrants | | | 298 | | | | — | | | | 974 | | | | 1,272 | |
| Convertible stocks | | | — | | | | — | | | | 89,564 | | | | 89,564 | |
| Convertible bonds | | | — | | | | 9,901 | | | | — | | | | 9,901 | |
| Short-term securities | | | 4,076,109 | | | | — | | | | — | | | | 4,076,109 | |
| Total | | $ | 42,701,078 | | | $ | 46,769 | | | $ | 324,639 | | | $ | 43,072,486 | |
4. Risk factors
Investing in the fund may involve certain risks including, but not limited to, those described below.
Market conditions— The prices of, and the income generated by, the securities held by the fund may decline – sometimes rapidly or unpredictably – due to various factors, including events or conditions affecting the general economy or particular industries; overall market changes; local, regional or global political, social or economic instability; governmental or governmental agency responses to economic conditions; and currency exchange rate, interest rate and commodity price fluctuations.
Issuer risks —The prices of, and the income generated by, securities held by the fund may decline in response to various factors directly related to the issuers of such securities, including reduced demand for an issuer’s goods or services, poor management performance and strategic initiatives such as mergers, acquisitions or dispositions and the market response to any such initiatives.
Investing in growth-oriented stocks— Growth-oriented common stocks and other equity-type securities (such as preferred stocks, convertible preferred stocks and convertible bonds) may involve larger price swings and greater potential for loss than other types of investments. These risks may be even greater in the case of smaller capitalization stocks.
Investing in small companies— Investing in smaller companies may pose additional risks. For example, it is often more difficult to value or dispose of small company stocks and more difficult to obtain information about smaller companies than about larger companies. Furthermore, smaller companies often have limited product lines, operating histories, markets and/or financial resources, may be dependent on one or a few key persons for management, and can be more susceptible to losses. Moreover, the prices of their stocks may be more volatile than stocks of larger, more established companies.
Investing outside the U.S.— Securities of issuers domiciled outside the U.S., or with significant operations or revenues outside the U.S., may lose value because of adverse political, social, economic or market developments (including social instability, regional conflicts, terrorism and war) in the countries or regions in which the issuers operate or generate revenue. These securities may also lose value due to changes in foreign currency exchange rates against the U.S. dollar and/or currencies of other countries. Issuers of these securities may be more susceptible to actions of foreign governments, such as the imposition of price controls or punitive taxes, that could adversely impact the value of these securities. Securities markets in certain countries may be more volatile and/or less liquid than those in the U.S. Investments outside the U.S. may also be subject to different accounting practices and different regulatory, legal and reporting standards and practices, and may be more difficult to value, than those in the U.S. In addition, the value of investments outside the U.S. may be reduced by foreign taxes, including foreign withholding taxes on interest and dividends. Further, there may be increased risks of delayed settlement of securities purchased or sold by the fund. The risks of investing outside the U.S. may be heightened in connection with investments in emerging markets.
Investing in emerging markets— Investing in emerging markets may involve risks in addition to and greater than those generally associated with investing in the securities markets of developed countries. For instance, developing countries may have less developed legal and accounting systems than those in developed countries. The governments of these countries may be less stable and more likely to impose capital controls, nationalize a company or industry, place restrictions on foreign ownership and on withdrawing sale proceeds of securities from the country, and/or impose punitive taxes that could adversely affect the prices of securities. In addition, the economies of these countries may be dependent on relatively few industries that are more susceptible to local and global changes. Securities markets in these countries can also be relatively small and have substantially lower trading volumes. As a result, securities issued in these countries may be more volatile and less liquid, and may be more difficult to value, than securities issued in countries with more developed economies and/or markets. Less certainty with respect to security valuations may lead to additional challenges and risks in calculating the fund’s net asset value. Additionally, there may be increased settlement risks for transactions in local securities.
Management— The investment adviser to the fund actively manages the fund’s investments. Consequently, the fund is subject to the risk that the methods and analyses employed by the investment adviser in this process may not produce the desired results. This could cause the fund to lose value or its investment results to lag relevant benchmarks or other funds with similar objectives.
5. Certain investment techniques
Securities lending— The fund has entered into securities lending transactions in which the fund earns income by lending investment securities to brokers, dealers or other institutions. Each transaction involves three parties: the fund, acting as the lender of the securities, a borrower, and a lending agent that acts as an intermediary.
Securities lending transactions are entered into by the fund under a securities lending agent agreement with the lending agent. The lending agent facilitates the exchange of securities between the lender and approved borrowers, ensures that securities loans are properly coordinated and documented, marks-to-market the value of collateral daily, secures additional collateral from a borrower if it falls below preset terms, and may reinvest cash collateral on behalf of the fund according to agreed parameters. The lending agent provides indemnification to the fund against losses resulting from a borrower default. Although risk is mitigated by the collateral and indemnification, the fund could experience a delay in recovering its securities and a potential loss of income or value if a borrower fails to return securities, collateral investments decline in value or the lending agent fails to perform.
The borrower is required to post highly liquid assets, such as cash or U.S. government securities, as collateral for the loan in an amount at least equal to the value of the securities loaned. Investments made with cash collateral are recognized as assets in the fund’s investment portfolio. The same amount is recorded as a liability in the fund’s statement of assets and liabilities. While securities are on loan, the fund will continue to receive the equivalent of the interest, dividends or other distributions paid by the issuer, as well as a portion of the interest on the investment of the collateral. Additionally, although the fund does not have the right to vote on securities while they are on loan, the fund has a right to consent on corporate actions and a right to recall loaned securities to vote. A borrower is obligated to return loaned securities at the conclusion of a loan or, during the pendency of a loan, on demand from the fund.
As of March 31, 2018, the total value of securities on loan was $1,447,802,000, and the total value of collateral received was $1,527,093,000. Investment securities purchased from cash collateral of $368,968,000 are disclosed in the summary investment portfolio as short-term securities. Securities received as collateral, if any, are not recognized as fund assets. The contractual maturity of cash collateral received under the securities lending agreement is classified as overnight and continuous.
Short-term securities— The fund holds shares of CCF, an institutional prime money market fund managed by CRMC. CCF invests in high-quality, short-term money market instruments. CCF is used as the primary investment vehicle for the fund’s short-term
investments. CCF shares are only available for purchase by CRMC, its affiliates, and other funds managed by CRMC and are not available to the public.
Forward currency contracts— The fund has entered into forward currency contracts, which represent agreements to exchange currencies on specific future dates at predetermined rates. The fund’s investment adviser uses forward currency contracts to manage the fund’s exposure to changes in exchange rates. Upon entering into these contracts, risks may arise from the potential inability of counterparties to meet the terms of their contracts and from possible movements in exchange rates.
On a daily basis, the fund’s investment adviser values forward currency contracts and records unrealized appreciation or depreciation for open forward currency contracts in the fund’s statement of assets and liabilities. Realized gains or losses are recorded at the time the forward currency contract is closed or offset by another contract with the same broker for the same settlement date and currency.
Closed forward currency contracts that have not reached their settlement date are included in the respective receivables or payables for closed forward currency contracts in the fund’s statement of assets and liabilities. Net realized gains or losses from closed forward currency contracts and net unrealized appreciation or depreciation from open forward currency contracts are recorded in the fund’s statement of operations. As of March 31, 2019, the fund did not have any open forward currency contracts. The average month-end notional amount of open forward currency contracts while held was $138,386,000.
The following table identifies the effect on the fund’s statement of operations resulting from the fund’s use of forward currency contracts as of, or for the six months ended, March 31, 2019 (dollars in thousands):
| | | | | Net realized loss | | | Net unrealized appreciation | |
| Contracts | | Risk type | | Location on statement of
operations | | Value | | | Location on statement of
operations | | Value | |
| Forward currency | | Currency | | Net realized loss on forward currency contracts | | $ | (545 | ) | | Net unrealized appreciation on forward currency contracts | | $ | 923 | |
Collateral— The fund participates in a collateral program due to securities lending and its use of forward currency contracts. For securities lending, the fund receives highly liquid assets, such as cash or U.S. government securities, as collateral in exchange for lending investment securities. The purpose of the collateral is to cover potential losses that could occur in the event that the borrower cannot meet its contractual obligation. The lending agent may reinvest collateral from securities lending transactions according to agreed parameters. Cash collateral reinvested by the lending agent, if any, is disclosed in the fund’s summary investment portfolio. For forward currency contracts, the program calls for the fund to either receive or pledge highly liquid assets as collateral based on the net gain or loss on unsettled forward currency contracts by counterparty. The purpose of the collateral is to cover potential losses that could occur in the event that either party cannot
meet its contractual obligation. Non-cash collateral pledged by the fund, if any, is disclosed in the fund’s investment portfolio, and cash collateral pledged by the fund, if any, is held in a segregated account with the fund’s custodian, which is reflected as pledged cash in the fund’s statement of assets and liabilities.
6. Taxation and distributions
Federal income taxation— The fund complies with the requirements under Subchapter M of the Internal Revenue Code applicable to mutual funds and intends to distribute substantially all of its net taxable income and net capital gains each year. The fund is not subject to income taxes to the extent such distributions are made. Therefore, no federal income tax provision is required.
As of and during the period ended March 31, 2019, the fund did not have a liability for any unrecognized tax benefits. The fund recognizes interest and penalties, if any, related to unrecognized tax benefits as income tax expense in the statement of operations. During the period, the fund did not incur any significant interest or penalties.
The fund’s tax returns are not subject to examination by federal, state and, if applicable, non-U.S. tax authorities after the expiration of each jurisdiction’s statute of limitations, which is generally three years after the date of filing but can be extended in certain jurisdictions.
Non-U.S. taxation— Dividend and interest income are recorded net of non-U.S. taxes paid. The fund may file withholding tax reclaims in certain jurisdictions to recover a portion of amounts previously withheld. As a result of rulings from European courts, the fund filed for additional reclaims related to prior years. These reclaims are recorded when the amount is known and there are no significant uncertainties on collectability. Gains realized by the fund on the sale of securities in certain countries, if any, may be subject to non-U.S. taxes. If applicable, the fund records an estimated deferred tax liability based on unrealized gains to provide for potential non-U.S. taxes payable upon the sale of these securities.
Distributions— Distributions paid to shareholders are based on net investment income and net realized gains determined on a tax basis, which may differ from net investment income and net realized gains for financial reporting purposes. These differences are due primarily to different treatment for items such as currency gains and losses; short-term capital gains and losses; capital losses related to sales of certain securities within 30 days of purchase; unrealized appreciation of certain investments in securities outside the U.S.; deferred expenses; cost of investments sold; non-U.S. taxes on capital gains and income on certain investments. The fiscal year in which amounts are distributed may differ from the year in which the net investment income and net realized gains are recorded by the fund for financial reporting purposes.
The components of distributable earnings on a tax basis are reported as of the fund’s most recent year-end. As of September 30, 2018, the components of distributable earnings on a tax basis were as follows (dollars in thousands):
| Undistributed long-term capital gains | | $ | 2,433,091 | |
| Post-October capital loss deferral* | | | (80,354 | ) |
| | |
| * | This deferral is considered incurred in the subsequent year. |
As of March 31, 2019, the tax basis unrealized appreciation (depreciation) and cost of investments were as follows (dollars in thousands):
| Gross unrealized appreciation on investments | | $ | 13,581,480 | |
| Gross unrealized depreciation on investments | | | (1,891,769 | ) |
| Net unrealized appreciation on investments | | | 11,689,711 | |
| Cost of investments | | | 31,013,807 | |
Distributions paid were characterized for tax purposes as follows (dollars in thousands):
| | | Six months ended March 31, 2019 | | | Year ended September 30, 2018 | |
| Share class | | Ordinary
income | | | Long-term
capital gains | | | Total
distributions
paid | | | Ordinary
income | | | Long-term
capital gains | | | Total
distributions
paid | |
| Class A | | $ | — | | | $ | 1,312,884 | | | $ | 1,312,884 | | | $ | — | | | $ | 958,172 | | | $ | 958,172 | |
| Class C | | | — | | | | 48,829 | | | | 48,829 | | | | — | | | | 39,880 | | | | 39,880 | |
| Class T | | | — | | | | 1 | | | | 1 | | | | — | | | | 1 | | | | 1 | |
| Class F-1 | | | — | | | | 41,462 | | | | 41,462 | | | | — | | | | 34,715 | | | | 34,715 | |
| Class F-2 | | | — | | | | 255,099 | | | | 255,099 | | | | — | | | | 135,936 | | | | 135,936 | |
| Class F-3 | | | — | | | | 101,976 | | | | 101,976 | | | | — | | | | 59,643 | | | | 59,643 | |
| Class 529-A | | | — | | | | 78,608 | | | | 78,608 | | | | — | | | | 57,869 | | | | 57,869 | |
| Class 529-C | | | — | | | | 13,748 | | | | 13,748 | | | | — | | | | 11,429 | | | | 11,429 | |
| Class 529-E | | | — | | | | 3,645 | | | | 3,645 | | | | — | | | | 2,707 | | | | 2,707 | |
| Class 529-T | | | — | | | | 1 | | | | 1 | | | | — | | | | 1 | | | | 1 | |
| Class 529-F-1 | | | — | | | | 8,185 | | | | 8,185 | | | | — | | | | 5,141 | | | | 5,141 | |
| Class R-1 | | | — | | | | 1,729 | | | | 1,729 | | | | — | | | | 1,387 | | | | 1,387 | |
| Class R-2 | | | — | | | | 36,397 | | | | 36,397 | | | | — | | | | 29,788 | | | | 29,788 | |
| Class R-2E | | | — | | | | 1,360 | | | | 1,360 | | | | — | | | | 810 | | | | 810 | |
| Class R-3 | | | — | | | | 47,684 | | | | 47,684 | | | | — | | | | 38,410 | | | | 38,410 | |
| Class R-4 | | | — | | | | 48,314 | | | | 48,314 | | | | — | | | | 38,552 | | | | 38,552 | |
| Class R-5E | | | — | | | | 1,677 | | | | 1,677 | | | | — | | | | 546 | | | | 546 | |
| Class R-5 | | | — | | | | 22,369 | | | | 22,369 | | | | — | | | | 14,962 | | | | 14,962 | |
| Class R-6 | | | — | | | | 410,894 | | | | 410,894 | | | | — | | | | 248,321 | | | | 248,321 | |
| Total | | $ | — | | | $ | 2,434,862 | | | $ | 2,434,862 | | | $ | — | | | $ | 1,678,270 | | | $ | 1,678,270 | |
7. Fees and transactions with related parties
CRMC, the fund’s investment adviser, is the parent company of American Funds Distributors,® Inc. (“AFD”), the principal underwriter of the fund’s shares, and American Funds Service Company® (“AFS”), the fund’s transfer agent. CRMC, AFD and AFS are considered related parties to the fund.
Investment advisory services— The fund has an investment advisory and service agreement with CRMC that provides for monthly fees accrued daily. At the beginning of the year, these fees were based on a series of decreasing annual rates beginning with 0.800% on the first $1 billion of daily net assets and decreasing to 0.592% on such assets in excess of $34 billion. On August 30, 2018, the fund’s board of directors approved an amended investment advisory and service agreement effective December 1, 2018, decreasing the annual rate to 0.589% on average daily net assets in excess of $44 billion. For the six months ended March 31, 2019, the investment advisory services fee was $123,273,000, which was equivalent to an annualized rate of 0.617% of average daily net assets.
Class-specific fees and expenses— Expenses that are specific to individual share classes are accrued directly to the respective share class. The principal class-specific fees and expenses are further described below:
| | Distribution services— The fund has plans of distribution for all share classes, except Class F-2, F-3, R-5E, R-5 and R-6 shares. Under the plans, the board of directors approves certain categories of expenses that are used to finance activities primarily intended to sell fund shares and service existing accounts. The plans provide for payments, based on an annualized percentage of average daily net assets, ranging from 0.30% to 1.00% as noted in this section. In some cases, the board of directors has limited the amounts that may be paid to less than the maximum allowed by the plans. All share classes with a plan may use up to 0.25% of average daily net assets to pay service fees, or to compensate AFD for paying service fees, to firms that have entered into agreements with AFD to provide certain shareholder services. The remaining amounts available to be paid under each plan are paid to dealers to compensate them for their sales activities. |
| | | | | | | | | | |
| | Share class | | Currently approved limits | | Plan limits |
| | Class A | | | 0.30 | % | | | 0.30 | % |
| | Class 529-A | | | 0.30 | | | | 0.50 | |
| | Classes C, 529-C and R-1 | | | 1.00 | | | | 1.00 | |
| | Class R-2 | | | 0.75 | | | | 1.00 | |
| | Class R-2E | | | 0.60 | | | | 0.85 | |
| | Classes 529-E and R-3 | | | 0.50 | | | | 0.75 | |
| | Classes T, F-1, 529-T, 529-F-1 and R-4 | | | 0.25 | | | | 0.50 | |
| | For Class A and 529-A shares, distribution-related expenses include the reimbursement of dealer and wholesaler commissions paid by AFD for certain shares sold without a sales charge. These share classes reimburse AFD for amounts billed within the prior 15 months but only to the extent that the overall annual expense limits are not exceeded. As of March 31, 2019, there were no unreimbursed expenses subject to reimbursement for Class A or 529-A shares. |
| | |
| | Transfer agent services— The fund has a shareholder services agreement with AFS under which the fund compensates AFS for providing transfer agent services to each of the fund’s share classes. These services include recordkeeping, shareholder communications and transaction processing. In addition, the fund reimburses AFS for amounts paid to third parties for performing transfer agent services on behalf of fund shareholders. |
| | |
| | Administrative services— The fund has an administrative services agreement with CRMC under which the fund compensates CRMC for providing administrative services to Class A, C, T, F, 529 and R shares. Administrative services are provided by CRMC to help assist third parties providing non-distribution services to fund shareholders. These services include providing in depth information on the fund and market developments that impact fund investments. Administrative services also include, but are not limited to, coordinating, monitoring and overseeing third parties that provide services to fund shareholders. The agreement between the fund and the investment adviser provides the fund the ability to charge an administrative services fee of 0.05% of average daily net assets for all share classes. Currently Class A shares pay an annual fee of 0.01% of average daily net assets (which could be increased as noted above) and Class C, T, F, 529 and R shares pay an annual fee of 0.05% of their respective average daily net assets. |
| | |
| | 529 plan services— Each 529 share class is subject to service fees to compensate the Virginia College Savings Plan (“Virginia529”) for its oversight and administration of the CollegeAmerica 529 college savings plan. The fee is based on the combined net assets invested in Class 529 and ABLE shares of the American Funds. Class ABLE shares are offered on other American Funds by Virginia529 through ABLEAmerica, a tax-advantaged savings program for individuals with disabilities. The quarterly fee is based on a series of decreasing annual rates beginning with 0.10% on the first $20 billion of the combined net assets invested in the American Funds and decreasing to 0.03% on such assets in excess of $100 billion. The fee for any given calendar quarter is accrued and calculated on the basis of the average net assets of Class 529 and ABLE shares of the American Funds for the last month of the prior calendar quarter. The fee is included in other expenses in the fund’s statement of operations. Virginia529 is not considered a related party to the fund. |
| | |
| | For the six months ended March 31, 2019, class-specific expenses under the agreements were as follows (dollars in thousands): |
| | |
| | Share class | | Distribution
services | | Transfer agent
services | | Administrative
services | | 529 plan
services | |
| | Class A | | $28,495 | | $15,984 | | $1,079 | | Not applicable | |
| | Class C | | 3,456 | | 515 | | 175 | | Not applicable | |
| | Class T | | — | | — | * | — | * | Not applicable | |
| | Class F-1 | | 839 | | 589 | | 169 | | Not applicable | |
| | Class F-2 | | Not applicable | | 2,253 | | 1,063 | | Not applicable | |
| | Class F-3 | | Not applicable | | 138 | | 430 | | Not applicable | |
| | Class 529-A | | 1,475 | | 860 | | 319 | | $422 | |
| | Class 529-C | | 973 | | 134 | | 50 | | 66 | |
| | Class 529-E | | 142 | | 19 | | 14 | | 19 | |
| | Class 529-T | | — | | — | * | — | * | — | * |
| | Class 529-F-1 | | — | | 88 | | 34 | | 44 | |
| | Class R-1 | | 128 | | 17 | | 6 | | Not applicable | |
| | Class R-2 | | 2,016 | | 998 | | 134 | | Not applicable | |
| | Class R-2E | | 67 | | 25 | | 6 | | Not applicable | |
| | Class R-3 | | 1,863 | | 611 | | 187 | | Not applicable | |
| | Class R-4 | | 982 | | 422 | | 197 | | Not applicable | |
| | Class R-5E | | Not applicable | | 20 | | 6 | | Not applicable | |
| | Class R-5 | | Not applicable | | 104 | | 95 | | Not applicable | |
| | Class R-6 | | Not applicable | | 19 | | 1,702 | | Not applicable | |
| | Total class-specific expenses | | $40,436 | | $22,796 | | $5,666 | | $551 | |
| | | |
| | * | Amount less than one thousand. |
Directors’ deferred compensation— Directors who are unaffiliated with CRMC may elect to defer the cash payment of part or all of their compensation. These deferred amounts, which remain as liabilities of the fund, are treated as if invested in shares of the fund or other American Funds. These amounts represent general, unsecured liabilities of the fund and vary according to the total returns of the selected funds. Directors’ compensation of $49,000 in the fund’s statement of operations reflects $224,000 in current fees (either paid in cash or deferred) and a net decrease of $175,000 in the value of the deferred amounts.
Affiliated officers and directors— Officers and certain directors of the fund are or may be considered to be affiliated with CRMC, AFD and AFS. No affiliated officers or directors received any compensation directly from the fund.
Security transactions with related funds— The fund has purchased from, and sold securities to, other funds managed by CRMC (or funds managed by certain affiliates of CRMC) under procedures adopted by the fund’s board of directors. The funds involved in such transactions are considered related by virtue of having a common investment adviser (or affiliated investment advisers), common directors and/or common officers. Each transaction was executed at the current market price of the security and no brokerage commissions or fees were paid in accordance with Rule 17a-7 of the 1940 Act.
During the six months ended March 31, 2019, the fund engaged in such purchase and sale transactions with related funds in the amounts of $190,570,000 and $771,103,000, respectively, which generated $86,951,000 of net realized gains from such sales.
Interfund lending— Pursuant to an exemptive order issued by the SEC, the fund, along with other CRMC-managed funds (or funds managed by certain affiliates of CRMC), may participate in an interfund lending program. The program provides an alternate credit facility that permits the funds to lend or borrow cash for temporary purposes directly to or from one another, subject to the conditions of the exemptive order. The fund did not lend or borrow cash through the interfund lending program at any time during the six months ended March 31, 2019.
8. Committed line of credit
The fund participates with other funds managed by CRMC (or funds managed by certain affiliates of CRMC) in a $1.5 billion credit facility (the “line of credit”) to be utilized for temporary purposes to support shareholder redemptions. The fund has agreed to pay commitment fees on its pro-rata portion of the line of credit, which are reflected in other expenses in the fund’s statement of operations. The fund did not borrow on this line of credit at any time during the six months ended March 31, 2019.
9. Capital share transactions
Capital share transactions in the fund were as follows (dollars and shares in thousands):
| | | Sales* | | | Reinvestments of
distributions | | | Repurchases* | | | Net increase
(decrease) | |
| Share class | | Amount | | | Shares | | | Amount | | | Shares | | | Amount | | | Shares | | | Amount | | | Shares | |
| | | | | | | | | | | | | | | | | | | | | | | | | | | | | | | | | |
| Six months ended March 31, 2019 | | | | | | | | | | | | | | | | | | | | | | | |
| | | | | | | | | | | | | | | | | | | | | | | | | | | | | | | | | |
| Class A | | $ | 1,171,804 | | | | 22,396 | | | $ | 1,295,477 | | | | 29,112 | | | $ | (1,559,033 | ) | | | (29,958 | ) | | $ | 908,248 | | | | 21,550 | |
| Class C | | | 42,773 | | | | 944 | | | | 48,619 | | | | 1,265 | | | | (106,957 | ) | | | (2,359 | ) | | | (15,565 | ) | | | (150 | ) |
| Class T | | | — | | | | — | | | | — | | | | — | | | | — | | | | — | | | | — | | | | — | |
| Class F-1 | | | 72,400 | | | | 1,403 | | | | 41,002 | | | | 933 | | | | (93,975 | ) | | | (1,825 | ) | | | 19,427 | | | | 511 | |
| Class F-2 | | | 929,593 | | | | 17,264 | | | | 247,799 | | | | 5,478 | | | | (614,833 | ) | | | (11,753 | ) | | | 562,559 | | | | 10,989 | |
| Class F-3 | | | 370,923 | | | | 7,048 | | | | 99,562 | | | | 2,221 | | | | (203,406 | ) | | | (3,860 | ) | | | 267,079 | | | | 5,409 | |
| Class 529-A | | | 76,057 | | | | 1,474 | | | | 78,589 | | | | 1,789 | | | | (99,824 | ) | | | (1,934 | ) | | | 54,822 | | | | 1,329 | |
| Class 529-C | | | 11,693 | | | | 252 | | | | 13,745 | | | | 351 | | | | (29,657 | ) | | | (643 | ) | | | (4,219 | ) | | | (40 | ) |
| Class 529-E | | | 2,988 | | | | 59 | | | | 3,643 | | | | 86 | | | | (5,245 | ) | | | (106 | ) | | | 1,386 | | | | 39 | |
| Class 529-T | | | — | | | | — | | | | 1 | | | | — | † | | | — | | | | — | | | | 1 | | | | — | † |
| Class 529-F-1 | | | 23,077 | | | | 429 | | | | 8,167 | | | | 183 | | | | (11,956 | ) | | | (230 | ) | | | 19,288 | | | | 382 | |
| Class R-1 | | | 1,839 | | | | 39 | | | | 1,728 | | | | 44 | | | | (4,186 | ) | | | (88 | ) | | | (619 | ) | | | (5 | ) |
| Class R-2 | | | 57,410 | | | | 1,229 | | | | 36,387 | | | | 914 | | | | (87,522 | ) | | | (1,859 | ) | | | 6,275 | | | | 284 | |
| Class R-2E | | | 4,406 | | | | 84 | | | | 1,360 | | | | 31 | | | | (2,626 | ) | | | (51 | ) | | | 3,140 | | | | 64 | |
| Class R-3 | | | 77,554 | | | | 1,549 | | | | 47,646 | | | | 1,123 | | | | (115,839 | ) | | | (2,326 | ) | | | 9,361 | | | | 346 | |
| Class R-4 | | | 64,598 | | | | 1,241 | | | | 48,251 | | | | 1,093 | | | | (102,972 | ) | | | (1,987 | ) | | | 9,877 | | | | 347 | |
| Class R-5E | | | 11,509 | | | | 223 | | | | 1,676 | | | | 38 | | | | (12,051 | ) | | | (250 | ) | | | 1,134 | | | | 11 | |
| Class R-5 | | | 26,027 | | | | 483 | | | | 22,355 | | | | 487 | | | | (53,923 | ) | | | (994 | ) | | | (5,541 | ) | | | (24 | ) |
| Class R-6 | | | 881,420 | | | | 16,321 | | | | 410,894 | | | | 9,043 | | | | (427,740 | ) | | | (7,965 | ) | | | 864,574 | | | | 17,399 | |
| Total net increase (decrease) | | $ | 3,826,071 | | | | 72,438 | | | $ | 2,406,901 | | | | 54,191 | | | $ | (3,531,745 | ) | | | (68,188 | ) | | $ | 2,701,227 | | | | 58,441 | |
| | | Sales* | | | Reinvestments of
distributions | | | Repurchases* | | | Net increase
(decrease) | |
| Share class | | Amount | | | Shares | | | Amount | | | Shares | | | Amount | | | Shares | | | Amount | | | Shares | |
| | | | | | | | | | | | | | | | | | | | | | | | | | | | | | | | | |
| Year ended September 30, 2018 | | | | | | | | | | | | | | | | | | | | | | | | |
| | | | | | | | | | | | | | | | | | | | | | | | | | | | | | | | | |
| Class A | | $ | 2,648,854 | | | | 45,761 | | | $ | 943,781 | | | | 17,036 | | | $ | (2,611,319 | ) | | | (45,260 | ) | | $ | 981,316 | | | | 17,537 | |
| Class C | | | 124,431 | | | | 2,448 | | | | 39,653 | | | | 813 | | | | (221,176 | ) | | | (4,360 | ) | | | (57,092 | ) | | | (1,099 | ) |
| Class T | | | — | | | | — | | | | — | | | | — | | | | — | | | | — | | | | — | | | | — | |
| Class F-1 | | | 193,896 | | | | 3,389 | | | | 34,362 | | | | 627 | | | | (315,286 | ) | | | (5,478 | ) | | | (87,028 | ) | | | (1,462 | ) |
| Class F-2 | | | 1,785,354 | | | | 30,344 | | | | 131,832 | | | | 2,350 | | | | (652,645 | ) | | | (11,141 | ) | | | 1,264,541 | | | | 21,553 | |
| Class F-3 | | | 746,957 | | | | 12,889 | | | | 58,070 | | | | 1,045 | | | | (301,309 | ) | | | (5,178 | ) | | | 503,718 | | | | 8,756 | |
| Class 529-A | | | 245,127 | | | | 4,301 | | | | 57,829 | | | | 1,056 | | | | (174,163 | ) | | | (3,039 | ) | | | 128,793 | | | | 2,318 | |
| Class 529-C | | | 27,941 | | | | 540 | | | | 11,426 | | | | 230 | | | | (141,138 | ) | | | (2,728 | ) | | | (101,771 | ) | | | (1,958 | ) |
| Class 529-E | | | 6,922 | | | | 125 | | | | 2,705 | | | | 51 | | | | (9,233 | ) | | | (166 | ) | | | 394 | | | | 10 | |
| Class 529-T | | | — | | | | — | | | | 1 | | | | — | † | | | — | | | | — | | | | 1 | | | | — | † |
| Class 529-F-1 | | | 29,924 | | | | 517 | | | | 5,129 | | | | 92 | | | | (21,261 | ) | | | (368 | ) | | | 13,792 | | | | 241 | |
| Class R-1 | | | 5,558 | | | | 105 | | | | 1,387 | | | | 28 | | | | (9,278 | ) | | | (177 | ) | | | (2,333 | ) | | | (44 | ) |
| Class R-2 | | | 127,612 | | | | 2,431 | | | | 29,747 | | | | 591 | | | | (208,083 | ) | | | (3,991 | ) | | | (50,724 | ) | | | (969 | ) |
| Class R-2E | | | 11,863 | | | | 209 | | | | 810 | | | | 15 | | | | (6,222 | ) | | | (109 | ) | | | 6,451 | | | | 115 | |
| Class R-3 | | | 179,101 | | | | 3,246 | | | | 38,386 | | | | 722 | | | | (273,503 | ) | | | (4,954 | ) | | | (56,016 | ) | | | (986 | ) |
| Class R-4 | | | 171,216 | | | | 2,998 | | | | 38,492 | | | | 700 | | | | (250,946 | ) | | | (4,399 | ) | | | (41,238 | ) | | | (701 | ) |
| Class R-5E | | | 16,357 | | | | 284 | | | | 545 | | | | 10 | | | | (2,662 | ) | | | (46 | ) | | | 14,240 | | | | 248 | |
| Class R-5 | | | 147,243 | | | | 2,497 | | | | 14,957 | | | | 263 | | | | (186,528 | ) | | | (3,176 | ) | | | (24,328 | ) | | | (416 | ) |
| Class R-6 | | | 1,339,754 | | | | 22,944 | | | | 248,310 | | | | 4,411 | | | | (369,109 | ) | | | (6,319 | ) | | | 1,218,955 | | | | 21,036 | |
| Total net increase (decrease) | | $ | 7,808,110 | | | | 135,028 | | | $ | 1,657,422 | | | | 30,040 | | | $ | (5,753,861 | ) | | | (100,889 | ) | | $ | 3,711,671 | | | | 64,179 | |
| | |
| * | Includes exchanges between share classes of the fund. |
| † | Amount less than one thousand. |
10. Investment transactions
The fund made purchases and sales of investment securities, excluding short-term securities and U.S. government obligations, if any, of $11,995,556,000 and $7,222,312,000, respectively, during the six months ended March 31, 2019.
Financial highlights
| | | | | (Loss) income from investment operations1 |
| Period ended | | Net asset
value,
beginning
of period | | Net
investment
(loss)
income | | Net (losses)
gains on
securities (both
realized and
unrealized) | | Total from
investment
operations |
| Class A: | | | | | | | | | | | | | | | | |
| 3/31/20194,5 | | $ | 60.19 | | | $ | (.04 | ) | | $ | (2.68 | ) | | $ | (2.72 | ) |
| 9/30/2018 | | | 55.60 | | | | .04 | | | | 7.05 | | | | 7.09 | |
| 9/30/2017 | | | 47.24 | | | | .07 | | | | 8.45 | | | | 8.52 | |
| 9/30/2016 | | | 45.04 | | | | .04 | | | | 4.99 | | | | 5.03 | |
| 9/30/2015 | | | 48.66 | | | | .04 | | | | 1.09 | | | | 1.13 | |
| 9/30/2014 | | | 48.91 | | | | .01 | | | | 2.17 | | | | 2.18 | |
| Class C: | | | | | | | | | | | | | | | | |
| 3/31/20194,5 | | | 52.63 | | | | (.21 | ) | | | (2.44 | ) | | | (2.65 | ) |
| 9/30/2018 | | | 49.30 | | | | (.38 | ) | | | 6.21 | | | | 5.83 | |
| 9/30/2017 | | | 42.08 | | | | (.29 | ) | | | 7.51 | | | | 7.22 | |
| 9/30/2016 | | | 40.73 | | | | (.29 | ) | | | 4.47 | | | | 4.18 | |
| 9/30/2015 | | | 44.77 | | | | (.32 | ) | | | 1.03 | | | | .71 | |
| 9/30/2014 | | | 45.54 | | | | (.36 | ) | | | 2.02 | | | | 1.66 | |
| Class T: | | | | | | | | | | | | | | | | |
| 3/31/20194,5 | | | 60.35 | | | | .02 | | | | (2.67 | ) | | | (2.65 | ) |
| 9/30/2018 | | | 55.64 | | | | .15 | | | | 7.06 | | | | 7.21 | |
| 9/30/20174,10 | | | 49.61 | | | | .13 | | | | 5.90 | | | | 6.03 | |
| Class F-1: | | | | | | | | | | | | | | | | |
| 3/31/20194,5 | | | 59.47 | | | | (.05 | ) | | | (2.66 | ) | | | (2.71 | ) |
| 9/30/2018 | | | 55.00 | | | | — | 11 | | | 6.97 | | | | 6.97 | |
| 9/30/2017 | | | 46.74 | | | | .05 | | | | 8.36 | | | | 8.41 | |
| 9/30/2016 | | | 44.60 | | | | .03 | | | | 4.94 | | | | 4.97 | |
| 9/30/2015 | | | 48.23 | | | | .04 | | | | 1.08 | | | | 1.12 | |
| 9/30/2014 | | | 48.51 | | | | — | | | | 2.15 | | | | 2.15 | |
| Class F-2: | | | | | | | | | | | | | | | | |
| 3/31/20194,5 | | | 61.07 | | | | .03 | | | | (2.70 | ) | | | (2.67 | ) |
| 9/30/2018 | | | 56.24 | | | | .20 | | | | 7.13 | | | | 7.33 | |
| 9/30/2017 | | | 47.80 | | | | .19 | | | | 8.54 | | | | 8.73 | |
| 9/30/2016 | | | 45.42 | | | | .16 | | | | 5.05 | | | | 5.21 | |
| 9/30/2015 | | | 48.92 | | | | .17 | | | | 1.08 | | | | 1.25 | |
| 9/30/2014 | | | 49.03 | | | | .15 | | | | 2.17 | | | | 2.32 | |
| Class F-3: | | | | | | | | | | | | | | | | |
| 3/31/20194,5 | | | 60.54 | | | | .06 | | | | (2.69 | ) | | | (2.63 | ) |
| 9/30/2018 | | | 55.74 | | | | .24 | | | | 7.06 | | | | 7.30 | |
| 9/30/20174,12 | | | 47.93 | | | | .25 | | | | 7.56 | | | | 7.81 | |
| Dividends and distributions | | | | | | | | | | | | | | | | | | | |
Dividends
(from net
investment
income) | | | Distributions
(from capital
gains) | | | Total
dividends
and
distributions | | | Net asset
value, end
of period | | | Total return2,3 | | | Net assets,
end of
period
(in
millions) | | | Ratio of
expenses to
average net
assets before
reimburse-
ments | | | Ratio of
expenses to
average net
assets after
reimburse-
ments3 | | | Ratio of net
(loss) income
to average
net assets3 | |
| | | | | | | | | | | | | | | | | | | | | | | | | | | | | | | | | | | |
| $ | — | | | $ | (3.31 | ) | | $ | (3.31 | ) | | $ | 54.16 | | | | (3.30 | )%6 | | $ | 22,947 | | | | 1.07 | %7 | | | 1.07 | %7 | | | (.15 | )%7 |
| | — | | | | (2.50 | ) | | | (2.50 | ) | | | 60.19 | | | | 13.13 | | | | 24,203 | | | | 1.04 | | | | 1.04 | | | | .06 | |
| | (.16 | ) | | | — | | | | (.16 | ) | | | 55.60 | | | | 18.11 | | | | 21,383 | | | | 1.07 | | | | 1.07 | | | | .14 | |
| | — | | | | (2.83 | ) | | | (2.83 | ) | | | 47.24 | | | | 11.72 | | | | 18,762 | | | | 1.10 | | | | 1.10 | | | | .08 | |
| | — | | | | (4.75 | ) | | | (4.75 | ) | | | 45.04 | | | | 2.25 | | | | 16,882 | | | | 1.07 | | | | 1.07 | | | | .08 | |
| | — | | | | (2.43 | ) | | | (2.43 | ) | | | 48.66 | | | | 4.43 | | | | 16,857 | | | | 1.07 | | | | 1.07 | | | | .02 | |
| | | | | | | | | | | | | | | | | | | | | | | | | | | | | | | | | | | |
| | — | | | | (3.31 | ) | | | (3.31 | ) | | | 46.67 | | | | (3.68 | )6 | | | 708 | | | | 1.84 | 7 | | | 1.84 | 7 | | | (.92 | )7 |
| | — | | | | (2.50 | ) | | | (2.50 | ) | | | 52.63 | | | | 12.23 | | | | 807 | | | | 1.83 | | | | 1.83 | | | | (.74 | ) |
| | — | | | | — | | | | — | | | | 49.30 | | | | 17.16 | | | | 810 | | | | 1.87 | | | | 1.87 | | | | (.66 | ) |
| | — | | | | (2.83 | ) | | | (2.83 | ) | | | 42.08 | | | | 10.82 | | | | 824 | | | | 1.90 | | | | 1.90 | | | | (.73 | ) |
| | — | | | | (4.75 | ) | | | (4.75 | ) | | | 40.73 | | | | 1.45 | | | | 847 | | | | 1.87 | | | | 1.87 | | | | (.73 | ) |
| | — | | | | (2.43 | ) | | | (2.43 | ) | | | 44.77 | | | | 3.61 | | | | 892 | | | | 1.87 | | | | 1.87 | | | | (.79 | ) |
| | | | | | | | | | | | | | | | | | | | | | | | | | | | | | | | | | | |
| | — | | | | (3.31 | ) | | | (3.31 | ) | | | 54.39 | | | | (3.19 | )6,8 | | | — | 9 | | | .83 | 7,8 | | | .83 | 7,8 | | | .09 | 7,8 |
| | — | | | | (2.50 | ) | | | (2.50 | ) | | | 60.35 | | | | 13.36 | 8 | | | — | 9 | | | .85 | 8 | | | .85 | 8 | | | .25 | 8 |
| | — | | | | — | | | | — | | | | 55.64 | | | | 12.15 | 6,8 | | | — | 9 | | | .42 | 6,8 | | | .42 | 6,8 | | | .25 | 6,8 |
| | | | | | | | | | | | | | | | | | | | | | | | | | | | | | | | | | | |
| | — | | | | (3.31 | ) | | | (3.31 | ) | | | 53.45 | | | | (3.35 | )6 | | | 719 | | | | 1.12 | 7 | | | 1.12 | 7 | | | (.20 | )7 |
| | — | | | | (2.50 | ) | | | (2.50 | ) | | | 59.47 | | | | 13.06 | | | | 770 | | | | 1.09 | | | | 1.09 | | | | .01 | |
| | (.15 | ) | | | — | | | | (.15 | ) | | | 55.00 | | | | 18.06 | | | | 792 | | | | 1.10 | | | | 1.10 | | | | .11 | |
| | — | | | | (2.83 | ) | | | (2.83 | ) | | | 46.74 | | | | 11.69 | | | | 718 | | | | 1.11 | | | | 1.11 | | | | .07 | |
| | — | | | | (4.75 | ) | | | (4.75 | ) | | | 44.60 | | | | 2.25 | | | | 662 | | | | 1.07 | | | | 1.07 | | | | .08 | |
| | — | | | | (2.43 | ) | | | (2.43 | ) | | | 48.23 | | | | 4.42 | | | | 624 | | | | 1.09 | | | | 1.09 | | | | — | |
| | | | | | | | | | | | | | | | | | | | | | | | | | | | | | | | | | | |
| | — | | | | (3.31 | ) | | | (3.31 | ) | | | 55.09 | | | | (3.17 | )6 | | | 4,627 | | | | .81 | 7 | | | .81 | 7 | | | .12 | 7 |
| | — | | | | (2.50 | ) | | | (2.50 | ) | | | 61.07 | | | | 13.41 | | | | 4,459 | | | | .78 | | | | .78 | | | | .34 | |
| | (.29 | ) | | | — | | | | (.29 | ) | | | 56.24 | | | | 18.40 | | | | 2,894 | | | | .82 | | | | .82 | | | | .38 | |
| | — | | | | (2.83 | ) | | | (2.83 | ) | | | 47.80 | | | | 12.03 | | | | 2,118 | | | | .82 | | | | .82 | | | | .36 | |
| | — | | | | (4.75 | ) | | | (4.75 | ) | | | 45.42 | | | | 2.50 | | | | 1,487 | | | | .82 | | | | .82 | | | | .35 | |
| | — | | | | (2.43 | ) | | | (2.43 | ) | | | 48.92 | | | | 4.72 | | | | 1,208 | | | | .81 | | | | .81 | | | | .31 | |
| | | | | | | | | | | | | | | | | | | | | | | | | | | | | | | | | | | |
| | — | | | | (3.31 | ) | | | (3.31 | ) | | | 54.60 | | | | (3.15 | )6 | | | 1,970 | | | | .72 | 7 | | | .72 | 7 | | | .22 | 7 |
| | — | | | | (2.50 | ) | | | (2.50 | ) | | | 60.54 | | | | 13.49 | | | | 1,856 | | | | .71 | | | | .71 | | | | .41 | |
| | — | | | | — | | | | — | | | | 55.74 | | | | 16.30 | 6 | | | 1,221 | | | | .71 | 7 | | | .71 | 7 | | | .70 | 7 |
See end of table for footnotes.
Financial highlights(continued)
| | | | | | (Loss) income from investment operations1 | |
| Period ended | | Net asset
value,
beginning
of period | | | Net
investment
(loss)
income | | | Net (losses)
gains on
securities (both
realized and
unrealized) | | | Total from
investment
operations | |
| Class 529-A: | | | | | | | | | | | | | | | | |
| 3/31/20194,5 | | $ | 59.47 | | | $ | (.05 | ) | | $ | (2.66 | ) | | $ | (2.71 | ) |
| 9/30/2018 | | | 55.01 | | | | — | 11 | | | 6.96 | | | | 6.96 | |
| 9/30/2017 | | | 46.74 | | | | .04 | | | | 8.36 | | | | 8.40 | |
| 9/30/2016 | | | 44.63 | | | | — | 11 | | | 4.94 | | | | 4.94 | |
| 9/30/2015 | | | 48.29 | | | | — | | | | 1.09 | | | | 1.09 | |
| 9/30/2014 | | | 48.59 | | | | (.03 | ) | | | 2.16 | | | | 2.13 | |
| Class 529-C: | | | | | | | | | | | | | | | | |
| 3/31/20194,5 | | | 53.60 | | | | (.22 | ) | | | (2.48 | ) | | | (2.70 | ) |
| 9/30/2018 | | | 50.18 | | | | (.42 | ) | | | 6.34 | | | | 5.92 | |
| 9/30/2017 | | | 42.85 | | | | (.32 | ) | | | 7.65 | | | | 7.33 | |
| 9/30/2016 | | | 41.45 | | | | (.31 | ) | | | 4.54 | | | | 4.23 | |
| 9/30/2015 | | | 45.50 | | | | (.35 | ) | | | 1.05 | | | | .70 | |
| 9/30/2014 | | | 46.27 | | | | (.40 | ) | | | 2.06 | | | | 1.66 | |
| Class 529-E: | | | | | | | | | | | | | | | | |
| 3/31/20194,5 | | | 57.73 | | | | (.10 | ) | | | (2.60 | ) | | | (2.70 | ) |
| 9/30/2018 | | | 53.57 | | | | (.12 | ) | | | 6.78 | | | | 6.66 | |
| 9/30/2017 | | | 45.53 | | | | (.06 | ) | | | 8.14 | | | | 8.08 | |
| 9/30/2016 | | | 43.63 | | | | (.09 | ) | | | 4.82 | | | | 4.73 | |
| 9/30/2015 | | | 47.41 | | | | (.11 | ) | | | 1.08 | | | | .97 | |
| 9/30/2014 | | | 47.87 | | | | (.14 | ) | | | 2.11 | | | | 1.97 | |
| Class 529-T: | | | | | | | | | | | | | | | | |
| 3/31/20194,5 | | | 60.32 | | | | .01 | | | | (2.68 | ) | | | (2.67 | ) |
| 9/30/2018 | | | 55.63 | | | | .13 | | | | 7.06 | | | | 7.19 | |
| 9/30/20174,10 | | | 49.61 | | | | .12 | | | | 5.90 | | | | 6.02 | |
| Class 529-F-1: | | | | | | | | | | | | | | | | |
| 3/31/20194,5 | | | 60.26 | | | | .01 | | | | (2.68 | ) | | | (2.67 | ) |
| 9/30/2018 | | | 55.58 | | | | .13 | | | | 7.05 | | | | 7.18 | |
| 9/30/2017 | | | 47.23 | | | | .15 | | | | 8.43 | | | | 8.58 | |
| 9/30/2016 | | | 44.98 | | | | .09 | | | | 4.99 | | | | 5.08 | |
| 9/30/2015 | | | 48.53 | | | | .11 | | | | 1.09 | | | | 1.20 | |
| 9/30/2014 | | | 48.73 | | | | .08 | | | | 2.15 | | | | 2.23 | |
| Class R-1: | | | | | | | | | | | | | | | | |
| 3/31/20194,5 | | | 54.32 | | | | (.21 | ) | | | (2.50 | ) | | | (2.71 | ) |
| 9/30/2018 | | | 50.79 | | | | (.38 | ) | | | 6.41 | | | | 6.03 | |
| 9/30/2017 | | | 43.34 | | | | (.29 | ) | | | 7.74 | | | | 7.45 | |
| 9/30/2016 | | | 41.85 | | | | (.28 | ) | | | 4.60 | | | | 4.32 | |
| 9/30/2015 | | | 45.85 | | | | (.31 | ) | | | 1.06 | | | | .75 | |
| 9/30/2014 | | | 46.56 | | | | (.35 | ) | | | 2.07 | | | | 1.72 | |
| Dividends and distributions | | | | | | | | | | | | | | | | | | | |
Dividends
(from net
Investment
income) | | | Distributions
(from capital
gains) | | | Total
dividends
and
distributions | | | Net asset
value, end
of period | | | Total return2,3 | | | Net assets,
end of
period
(in
millions) | | | Ratio of
expenses to
average net
assets before
reimburse-
ments | | | Ratio of
expenses to
average net
assets after
reimburse-
ments3 | | | Ratio of net
(loss) income
to average
net assets3 | |
| | | | | | | | | | | | | | | | | | | | | | | | | | | | | | | | | | | |
| $ | — | | | $ | (3.31 | ) | | $ | (3.31 | ) | | $ | 53.45 | | | | (3.35 | )%6 | | $ | 1,357 | | | | 1.13 | %7 | | | 1.13 | %7 | | | (.21 | )%7 |
| | — | | | | (2.50 | ) | | | (2.50 | ) | | | 59.47 | | | | 13.05 | | | | 1,430 | | | | 1.11 | | | | 1.11 | | | | — | 13 |
| | (.13 | ) | | | — | | | | (.13 | ) | | | 55.01 | | | | 18.03 | | | | 1,195 | | | | 1.13 | | | | 1.13 | | | | .08 | |
| | — | | | | (2.83 | ) | | | (2.83 | ) | | | 46.74 | | | | 11.64 | | | | 1,024 | | | | 1.17 | | | | 1.17 | | | | — | 13 |
| | — | | | | (4.75 | ) | | | (4.75 | ) | | | 44.63 | | | | 2.16 | | | | 943 | | | | 1.15 | | | | 1.15 | | | | — | |
| | — | | | | (2.43 | ) | | | (2.43 | ) | | | 48.29 | | | | 4.37 | | | | 933 | | | | 1.15 | | | | 1.15 | | | | (.05 | ) |
| | | | | | | | | | | | | | | | | | | | | | | | | | | | | | | | | | | |
| | — | | | | (3.31 | ) | | | (3.31 | ) | | | 47.59 | | | | (3.71 | )6 | | | 202 | | | | 1.88 | 7 | | | 1.88 | 7 | | | (.95 | )7 |
| | — | | | | (2.50 | ) | | | (2.50 | ) | | | 53.60 | | | | 12.19 | | | | 230 | | | | 1.88 | | | | 1.88 | | | | (.81 | ) |
| | — | | | | — | | | | — | | | | 50.18 | | | | 17.11 | | | | 314 | | | | 1.91 | | | | 1.91 | | | | (.70 | ) |
| | — | | | | (2.83 | ) | | | (2.83 | ) | | | 42.85 | | | | 10.78 | | | | 286 | | | | 1.96 | | | | 1.96 | | | | (.78 | ) |
| | — | | | | (4.75 | ) | | | (4.75 | ) | | | 41.45 | | | | 1.37 | | | | 274 | | | | 1.93 | | | | 1.93 | | | | (.78 | ) |
| | — | | | | (2.43 | ) | | | (2.43 | ) | | | 45.50 | | | | 3.53 | | | | 280 | | | | 1.94 | | | | 1.94 | | | | (.85 | ) |
| | | | | | | | | | | | | | | | | | | | | | | | | | | | | | | | | | | |
| | — | | | | (3.31 | ) | | | (3.31 | ) | | | 51.72 | | | | (3.43 | )6 | | | 60 | | | | 1.33 | 7 | | | 1.33 | 7 | | | (.40 | )7 |
| | — | | | | (2.50 | ) | | | (2.50 | ) | | | 57.73 | | | | 12.82 | | | | 64 | | | | 1.32 | | | | 1.32 | | | | (.22 | ) |
| | (.04 | ) | | | — | | | | (.04 | ) | | | 53.57 | | | | 17.77 | | | | 59 | | | | 1.35 | | | | 1.35 | | | | (.13 | ) |
| | — | | | | (2.83 | ) | | | (2.83 | ) | | | 45.53 | | | | 11.39 | | | | 53 | | | | 1.38 | | | | 1.38 | | | | (.21 | ) |
| | — | | | | (4.75 | ) | | | (4.75 | ) | | | 43.63 | | | | 1.95 | | | | 49 | | | | 1.38 | | | | 1.38 | | | | (.23 | ) |
| | — | | | | (2.43 | ) | | | (2.43 | ) | | | 47.41 | | | | 4.10 | | | | 49 | | | | 1.39 | | | | 1.39 | | | | (.30 | ) |
| | | | | | | | | | | | | | | | | | | | | | | | | | | | | | | | | | | |
| | — | | | | (3.31 | ) | | | (3.31 | ) | | | 54.34 | | | | (3.22 | )6,8 | | | — | 9 | | | .89 | 7,8 | | | .89 | 7,8 | | | .04 | 7,8 |
| | — | | | | (2.50 | ) | | | (2.50 | ) | | | 60.32 | | | | 13.30 | 8 | | | — | 9 | | | .88 | 8 | | | .88 | 8 | | | .22 | 8 |
| | — | | | | — | | | | — | | | | 55.63 | | | | 12.13 | 6,8 | | | — | 9 | | | .45 | 6,8 | | | .45 | 6,8 | | | .22 | 6,8 |
| | | | | | | | | | | | | | | | | | | | | | | | | | | | | | | | | | | |
| | — | | | | (3.31 | ) | | | (3.31 | ) | | | 54.28 | | | | (3.23 | )6 | | | 144 | | | | .90 | 7 | | | .90 | 7 | | | .03 | 7 |
| | — | | | | (2.50 | ) | | | (2.50 | ) | | | 60.26 | | | | 13.31 | | | | 136 | | | | .89 | | | | .89 | | | | .22 | |
| | (.23 | ) | | | — | | | | (.23 | ) | | | 55.58 | | | | 18.26 | | | | 113 | | | | .92 | | | | .92 | | | | .30 | |
| | — | | | | (2.83 | ) | | | (2.83 | ) | | | 47.23 | | | | 11.85 | | | | 90 | | | | .96 | | | | .96 | | | | .22 | |
| | — | | | | (4.75 | ) | | | (4.75 | ) | | | 44.98 | | | | 2.42 | | | | 83 | | | | .93 | | | | .93 | | | | .22 | |
| | — | | | | (2.43 | ) | | | (2.43 | ) | | | 48.53 | | | | 4.57 | | | | 80 | | | | .94 | | | | .94 | | | | .16 | |
| | | | | | | | | | | | | | | | | | | | | | | | | | | | | | | | | | | |
| | — | | | | (3.31 | ) | | | (3.31 | ) | | | 48.30 | | | | (3.68 | )6 | | | 26 | | | | 1.83 | 7 | | | 1.83 | 7 | | | (.91 | )7 |
| | — | | | | (2.50 | ) | | | (2.50 | ) | | | 54.32 | | | | 12.26 | | | | 30 | | | | 1.81 | | | | 1.81 | | | | (.72 | ) |
| | — | | | | — | | | | — | | | | 50.79 | | | | 17.19 | | | | 30 | | | | 1.83 | | | | 1.83 | | | | (.63 | ) |
| | — | | | | (2.83 | ) | | | (2.83 | ) | | | 43.34 | | | | 10.89 | | | | 33 | | | | 1.85 | | | | 1.85 | | | | (.68 | ) |
| | — | | | | (4.75 | ) | | | (4.75 | ) | | | 41.85 | | | | 1.48 | | | | 36 | | | | 1.82 | | | | 1.82 | | | | (.68 | ) |
| | — | | | | (2.43 | ) | | | (2.43 | ) | | | 45.85 | | | | 3.66 | | | | 39 | | | | 1.82 | | | | 1.82 | | | | (.74 | ) |
See end of table for footnotes.
Financial highlights(continued)
| | | | (Loss) income from investment operations1 | |
| Period ended | | Net asset
value,
beginning
of period | | | Net
investment
(loss)
income | | | Net (losses)
gains on
securities (both
realized and
unrealized) | | | Total from
investment
operations | |
| Class R-2: | | | | | | | | | | | | | | | | |
| 3/31/20194,5 | | $ | 54.36 | | | $ | (.21 | ) | | $ | (2.50 | ) | | $ | (2.71 | ) |
| 9/30/2018 | | | 50.82 | | | | (.37 | ) | | | 6.41 | | | | 6.04 | |
| 9/30/2017 | | | 43.35 | | | | (.27 | ) | | | 7.74 | | | | 7.47 | |
| 9/30/2016 | | | 41.85 | | | | (.27 | ) | | | 4.60 | | | | 4.33 | |
| 9/30/2015 | | | 45.84 | | | | (.29 | ) | | | 1.05 | | | | .76 | |
| 9/30/2014 | | | 46.56 | | | | (.35 | ) | | | 2.06 | | | | 1.71 | |
| Class R-2E: | | | | | | | | | | | | | | | | |
| 3/31/20194,5 | | | 59.52 | | | | (.15 | ) | | | (2.66 | ) | | | (2.81 | ) |
| 9/30/2018 | | | 55.26 | | | | (.22 | ) | | | 6.98 | | | | 6.76 | |
| 9/30/2017 | | | 47.07 | | | | (.14 | ) | | | 8.40 | | | | 8.26 | |
| 9/30/2016 | | | 45.04 | | | | (.08 | ) | | | 4.94 | | | | 4.86 | |
| 9/30/2015 | | | 48.67 | | | | .01 | | | | 1.11 | | | | 1.12 | |
| 9/30/20144,14 | | | 50.83 | | | | (.01 | ) | | | (2.15 | ) | | | (2.16 | ) |
| Class R-3: | | | | | | | | | | | | | | | | |
| 3/31/20194,5 | | | 57.60 | | | | (.11 | ) | | | (2.60 | ) | | | (2.71 | ) |
| 9/30/2018 | | | 53.47 | | | | (.14 | ) | | | 6.77 | | | | 6.63 | |
| 9/30/2017 | | | 45.45 | | | | (.07 | ) | | | 8.13 | | | | 8.06 | |
| 9/30/2016 | | | 43.56 | | | | (.09 | ) | | | 4.81 | | | | 4.72 | |
| 9/30/2015 | | | 47.34 | | | | (.10 | ) | | | 1.07 | | | | .97 | |
| 9/30/2014 | | | 47.79 | | | | (.14 | ) | | | 2.12 | | | | 1.98 | |
| Class R-4: | | | | | | | | | | | | | | | | |
| 3/31/20194,5 | | | 59.71 | | | | (.03 | ) | | | (2.67 | ) | | | (2.70 | ) |
| 9/30/2018 | | | 55.18 | | | | .03 | | | | 7.00 | | | | 7.03 | |
| 9/30/2017 | | | 46.89 | | | | .08 | | | | 8.38 | | | | 8.46 | |
| 9/30/2016 | | | 44.71 | | | | .04 | | | | 4.97 | | | | 5.01 | |
| 9/30/2015 | | | 48.33 | | | | .05 | | | | 1.08 | | | | 1.13 | |
| 9/30/2014 | | | 48.59 | | | | .02 | | | | 2.15 | | | | 2.17 | |
| Class R-5E: | | | | | | | | | | | | | | | | |
| 3/31/20194,5 | | | 60.26 | | | | .02 | | | | (2.68 | ) | | | (2.66 | ) |
| 9/30/2018 | | | 55.55 | | | | .18 | | | | 7.03 | | | | 7.21 | |
| 9/30/2017 | | | 47.30 | | | | .18 | | | | 8.42 | | | | 8.60 | |
| 9/30/20164,15 | | | 47.09 | | | | .12 | | | | 2.92 | | | | 3.04 | |
| Class R-5: | | | | | | | | | | | | | | | | |
| 3/31/20194,5 | | | 61.94 | | | | .05 | | | | (2.73 | ) | | | (2.68 | ) |
| 9/30/2018 | | | 56.99 | | | | .21 | | | | 7.24 | | | | 7.45 | |
| 9/30/2017 | | | 48.40 | | | | .24 | | | | 8.64 | | | | 8.88 | |
| 9/30/2016 | | | 45.94 | | | | .18 | | | | 5.11 | | | | 5.29 | |
| 9/30/2015 | | | 49.39 | | | | .20 | | | | 1.10 | | | | 1.30 | |
| 9/30/2014 | | | 49.46 | | | | .15 | | | | 2.21 | | | | 2.36 | |
| Dividends and distributions | | | | | | | | | | | | | |
Dividends
(from net
investment
income) | | | Distributions
(from capital
gains) | | | Total
dividends
and
distributions | | | Net asset
value, end
of period | | | Total return2,3 | | | Net assets,
end of
period
(in
millions) | | | Ratio of
expenses to
average net
assets before
reimburse-
ments | | | Ratio of
expenses to
average net
assets after
reimburse-
ments3 | | | Ratio of net
(loss) income
to average
net assets3 | |
| | | | | | | | | | | | | | | | | | | | | | | | | | | | | | | | | | | |
| $ | — | | | $ | (3.31 | ) | | $ | (3.31 | ) | | $ | 48.34 | | | | (3.67 | )%6 | | $ | 564 | | | | 1.82 | %7 | | | 1.82 | %7 | | | (.90 | )%7 |
| | — | | | | (2.50 | ) | | | (2.50 | ) | | | 54.36 | | | | 12.28 | | | | 619 | | | | 1.79 | | | | 1.79 | | | | (.70 | ) |
| | — | | | | — | | | | — | | | | 50.82 | | | | 17.23 | | | | 628 | | | | 1.80 | | | | 1.80 | | | | (.60 | ) |
| | — | | | | (2.83 | ) | | | (2.83 | ) | | | 43.35 | | | | 10.89 | | | | 616 | | | | 1.84 | | | | 1.84 | | | | (.67 | ) |
| | — | | | | (4.75 | ) | | | (4.75 | ) | | | 41.85 | | | | 1.53 | | | | 632 | | | | 1.79 | | | | 1.79 | | | | (.65 | ) |
| | — | | | | (2.43 | ) | | | (2.43 | ) | | | 45.84 | | | | 3.64 | | | | 689 | | | | 1.83 | | | | 1.83 | | | | (.75 | ) |
| | | | | | | | | | | | | | | | | | | | | | | | | | | | | | | | | | | |
| | — | | | | (3.31 | ) | | | (3.31 | ) | | | 53.40 | | | | (3.52 | )6 | | | 25 | | | | 1.52 | 7 | | | 1.52 | 7 | | | (.59 | )7 |
| | — | | | | (2.50 | ) | | | (2.50 | ) | | | 59.52 | | | | 12.61 | | | | 24 | | | | 1.50 | | | | 1.50 | | | | (.38 | ) |
| | (.07 | ) | | | — | | | | (.07 | ) | | | 55.26 | | | | 17.57 | | | | 16 | | | | 1.51 | | | | 1.51 | | | | (.27 | ) |
| | — | | | | (2.83 | ) | | | (2.83 | ) | | | 47.07 | | | | 11.32 | | | | 6 | | | | 1.51 | | | | 1.51 | | | | (.20 | ) |
| | — | | | | (4.75 | ) | | | (4.75 | ) | | | 45.04 | | | | 2.23 | 8 | | | — | 9 | | | 1.26 | 8 | | | 1.26 | 8 | | | .01 | 8 |
| | — | | | | — | | | | — | | | | 48.67 | | | | (4.25 | )6,8 | | | — | 9 | | | .08 | 6,8 | | | .08 | 6,8 | | | (.01 | )6,8 |
| | | | | | | | | | | | | | | | | | | | | | | | | | | | | | | | | | | |
| | — | | | | (3.31 | ) | | | (3.31 | ) | | | 51.58 | | | | (3.46 | )6 | | | 781 | | | | 1.36 | 7 | | | 1.36 | 7 | | | (.44 | )7 |
| | — | | | | (2.50 | ) | | | (2.50 | ) | | | 57.60 | | | | 12.79 | | | | 852 | | | | 1.35 | | | | 1.35 | | | | (.25 | ) |
| | (.04 | ) | | | — | | | | (.04 | ) | | | 53.47 | | | | 17.74 | | | | 844 | | | | 1.35 | | | | 1.35 | | | | (.14 | ) |
| | — | | | | (2.83 | ) | | | (2.83 | ) | | | 45.45 | | | | 11.41 | | | | 783 | | | | 1.39 | | | | 1.39 | | | | (.22 | ) |
| | — | | | | (4.75 | ) | | | (4.75 | ) | | | 43.56 | | | | 1.93 | | | | 776 | | | | 1.37 | | | | 1.37 | | | | (.22 | ) |
| | — | | | | (2.43 | ) | | | (2.43 | ) | | | 47.34 | | | | 4.12 | | | | 811 | | | | 1.39 | | | | 1.39 | | | | (.30 | ) |
| | | | | | | | | | | | | | | | | | | | | | | | | | | | | | | | | | | |
| | — | | | | (3.31 | ) | | | (3.31 | ) | | | 53.70 | | | | (3.31 | )6 | | | 823 | | | | 1.06 | 7 | | | 1.06 | 7 | | | (.13 | )7 |
| | — | | | | (2.50 | ) | | | (2.50 | ) | | | 59.71 | | | | 13.13 | | | | 894 | | | | 1.04 | | | | 1.04 | | | | .05 | |
| | (.17 | ) | | | — | | | | (.17 | ) | | | 55.18 | | | | 18.12 | | | | 865 | | | | 1.05 | | | | 1.05 | | | | .17 | |
| | — | | | | (2.83 | ) | | | (2.83 | ) | | | 46.89 | | | | 11.76 | | | | 764 | | | | 1.07 | | | | 1.07 | | | | .10 | |
| | — | | | | (4.75 | ) | | | (4.75 | ) | | | 44.71 | | | | 2.27 | | | | 715 | | | | 1.05 | | | | 1.05 | | | | .10 | |
| | — | | | | (2.43 | ) | | | (2.43 | ) | | | 48.33 | | | | 4.46 | | | | 727 | | | | 1.06 | | | | 1.06 | | | | .03 | |
| | | | | | | | | | | | | | | | | | | | | | | | | | | | | | | | | | | |
| | — | | | | (3.31 | ) | | | (3.31 | ) | | | 54.29 | | | | (3.21 | )6 | | | 25 | | | | .86 | 7 | | | .86 | 7 | | | .08 | 7 |
| | — | | | | (2.50 | ) | | | (2.50 | ) | | | 60.26 | | | | 13.38 | | | | 28 | | | | .84 | | | | .84 | | | | .31 | |
| | (.35 | ) | | | — | | | | (.35 | ) | | | 55.55 | | | | 18.33 | | | | 12 | | | | .84 | | | | .84 | | | | .36 | |
| | — | | | | (2.83 | ) | | | (2.83 | ) | | | 47.30 | | | | 7.01 | 6 | | | — | 9 | | | .96 | 7 | | | .95 | 7 | | | .32 | 7 |
| | | | | | | | | | | | | | | | | | | | | | | | | | | | | | | | | | | |
| | — | | | | (3.31 | ) | | | (3.31 | ) | | | 55.95 | | | | (3.16 | )6 | | | 392 | | | | .76 | 7 | | | .76 | 7 | | | .17 | 7 |
| | — | | | | (2.50 | ) | | | (2.50 | ) | | | 61.94 | | | | 13.46 | | | | 436 | | | | .75 | | | | .75 | | | | .36 | |
| | (.29 | ) | | | — | | | | (.29 | ) | | | 56.99 | | | | 18.48 | | | | 424 | | | | .75 | | | | .75 | | | | .47 | |
| | — | | | | (2.83 | ) | | | (2.83 | ) | | | 48.40 | | | | 12.09 | | | | 359 | | | | .77 | | | | .77 | | | | .41 | |
| | — | | | | (4.75 | ) | | | (4.75 | ) | | | 45.94 | | | | 2.57 | | | | 474 | | | | .75 | | | | .75 | | | | .40 | |
| | — | | | | (2.43 | ) | | | (2.43 | ) | | | 49.39 | | | | 4.78 | | | | 452 | | | | .76 | | | | .76 | | | | .29 | |
See end of table for footnotes.
Financial highlights(continued)
| | | | | (Loss) income from investment operations1 | |
| Period ended | | Net asset
value,
beginning
of period | | Net
investment
(loss)
income | | | Net (losses)
gains on
securities (both
realized and
unrealized) | | | Total from
investment
operations | |
| Class R-6: | | | | | | | | | | | | | | | | |
| 3/31/20194,5 | | $ | 61.31 | | | $ | .06 | | | $ | (2.71 | ) | | $ | (2.65 | ) |
| 9/30/2018 | | | 56.40 | | | | .25 | | | | 7.16 | | | | 7.41 | |
| 9/30/2017 | | | 47.93 | | | | .26 | | | | 8.54 | | | | 8.80 | |
| 9/30/2016 | | | 45.49 | | | | .21 | | | | 5.06 | | | | 5.27 | |
| 9/30/2015 | | | 48.93 | | | | .22 | | | | 1.09 | | | | 1.31 | |
| 9/30/2014 | | | 49.00 | | | | .21 | | | | 2.15 | | | | 2.36 | |
| | Six months ended | Year ended September 30 |
| | March 31, 20194,5,6 | 2018 | 2017 | 2016 | 2015 | 2014 |
| Portfolio turnover rate for all share classes | 19% | 35% | 32% | 29% | 33% | 38% |
See notes to financial statements
| Dividends and distributions | | | | | | | | | | | | | | | | | | | |
Dividends
(from net
investment
income) | | | Distributions
(from capital
gains) | | | Total
dividends
and
distributions | | | Net asset
value, end
of period | | | Total return2,3 | | | Net assets,
end of
period
(in
millions) | | | Ratio of
expenses to
average net
assets before
reimburse-
ments | | | Ratio of
expenses to
average net
assets after
reimburse-
ments3 | | | Ratio of net
(loss) income
to average
net assets3 | |
| | | | | | | | | | | | | | | | | | | | | | | | | | | | | | | | | | | |
| $ | — | | | $ | (3.31 | ) | | $ | (3.31 | ) | | $ | 55.35 | | | | (3.14 | )%6 | | $ | 7,318 | | | | .70 | %7 | | | .70 | %7 | | | .23 | %7 |
| | — | | | | (2.50 | ) | | | (2.50 | ) | | | 61.31 | | | | 13.53 | | | | 7,039 | | | | .69 | | | | .69 | | | | .42 | |
| | (.33 | ) | | | — | | | | (.33 | ) | | | 56.40 | | | | 18.51 | | | | 5,289 | | | | .70 | | | | .70 | | | | .51 | |
| | — | | | | (2.83 | ) | | | (2.83 | ) | | | 47.93 | | | | 12.15 | | | | 3,403 | | | | .71 | | | | .71 | | | | .48 | |
| | — | | | | (4.75 | ) | | | (4.75 | ) | | | 45.49 | | | | 2.63 | | | | 2,269 | | | | .71 | | | | .71 | | | | .45 | |
| | — | | | | (2.43 | ) | | | (2.43 | ) | | | 48.93 | | | | 4.82 | | | | 1,859 | | | | .71 | | | | .71 | | | | .41 | |
| 1 | Based on average shares outstanding. |
| 2 | Total returns exclude any applicable sales charges, including contingent deferred sales charges. |
| 3 | This column reflects the impact, if any, of certain reimbursements from CRMC. During one of the periods shown, CRMC paid a portion of the fund’s transfer agent fees for certain retirement plan share classes. |
| 4 | Based on operations for a period that is less than a full year. |
| 5 | Unaudited. |
| 6 | Not annualized. |
| 7 | Annualized. |
| 8 | All or a significant portion of assets in this class consisted of seed capital invested by CRMC and/or its affiliates. Fees for distribution services are not charged or accrued on these seed capital assets. If such fees were paid by the fund on seed capital assets, fund expenses would have been higher and net income and total return would have been lower. |
| 9 | Amount less than $1 million. |
| 10 | Class T and 529-T shares began investment operations on April 7, 2017. |
| 11 | Amount less than $.01. |
| 12 | Class F-3 shares began investment operations on January 27, 2017. |
| 13 | Amount less than .01%. |
| 14 | Class R-2E shares began investment operations on August 29, 2014. |
| 15 | Class R-5E shares began investment operations on November 20, 2015. |
As a fund shareholder, you incur two types of costs: (1) transaction costs, such as initial sales charges on purchase payments and contingent deferred sales charges on redemptions (loads), and (2) ongoing costs, including management fees, distribution and service (12b-1) fees, and other expenses. This example is intended to help you understand your ongoing costs (in dollars) of investing in the fund so you can compare these costs with the ongoing costs of investing in other mutual funds. The example is based on an investment of $1,000 invested at the beginning of the period and held for the entire six-month period (October 1, 2018, through March 31, 2019).
Actual expenses:
The first line of each share class in the table on the following page provides information about actual account values and actual expenses. You may use the information in this line, together with the amount you invested, to estimate the expenses that you paid over the period. Simply divide your account value by $1,000 (for example, an $8,600 account value divided by $1,000 = 8.6), then multiply the result by the number in the first line under the heading titled “Expenses paid during period” to estimate the expenses you paid on your account during this period.
Hypothetical example for comparison purposes:
The second line of each share class in the table on the following page provides information about hypothetical account values and hypothetical expenses based on the actual expense ratio for the share class and an assumed rate of return of 5.00% per year before expenses, which is not the actual return of the share class. The hypothetical account values and expenses may not be used to estimate the actual ending account balance or expenses you paid for the period. You may use this information to compare the ongoing costs of investing in the fund and other funds. To do so, compare this 5.00% hypothetical example with the 5.00% hypothetical examples that appear in the shareholder reports of the other funds.
Notes:
Retirement plan participants may be subject to certain fees charged by the plan sponsor, and Class F-1, F-2, F-3 and 529-F-1 shareholders may be subject to fees charged by financial intermediaries, typically ranging from 0.75% to 1.50% of assets annually depending on services offered. You can estimate the impact of these fees by adding the amount of the fees to the total estimated expenses you paid on your account during the period as calculated above. In addition, your ending account value would be lower by the amount of these fees.
Note that the expenses shown in the table on the following page are meant to highlight your ongoing costs only and do not reflect any transactional costs, such as sales charges (loads). Therefore, the second line of each share class in the table is useful in comparing ongoing costs only and will not help you determine the relative total costs of owning different funds. In addition, if these transactional costs were included, your costs would have been higher.
| | | Beginning
account value
10/1/2018 | | | Ending
account value
3/31/2019 | | | Expenses paid
during period* | | | Annualized
expense ratio | |
| Class A – actual return | | $ | 1,000.00 | | | $ | 966.97 | | | $ | 5.25 | | | | 1.07 | % |
| Class A – assumed 5% return | | | 1,000.00 | | | | 1,019.60 | | | | 5.39 | | | | 1.07 | |
| Class C – actual return | | | 1,000.00 | | | | 963.22 | | | | 9.01 | | | | 1.84 | |
| Class C – assumed 5% return | | | 1,000.00 | | | | 1,015.76 | | | | 9.25 | | | | 1.84 | |
| Class T – actual return | | | 1,000.00 | | | | 968.09 | | | | 4.07 | | | | .83 | |
| Class T – assumed 5% return | | | 1,000.00 | | | | 1,020.79 | | | | 4.18 | | | | .83 | |
| Class F-1 – actual return | | | 1,000.00 | | | | 966.54 | | | | 5.49 | | | | 1.12 | |
| Class F-1 – assumed 5% return | | | 1,000.00 | | | | 1,019.35 | | | | 5.64 | | | | 1.12 | |
| Class F-2 – actual return | | | 1,000.00 | | | | 968.26 | | | | 3.97 | | | | .81 | |
| Class F-2 – assumed 5% return | | | 1,000.00 | | | | 1,020.89 | | | | 4.08 | | | | .81 | |
| Class F-3 – actual return | | | 1,000.00 | | | | 968.49 | | | | 3.53 | | | | .72 | |
| Class F-3 – assumed 5% return | | | 1,000.00 | | | | 1,021.34 | | | | 3.63 | | | | .72 | |
| Class 529-A – actual return | | | 1,000.00 | | | | 966.54 | | | | 5.54 | | | | 1.13 | |
| Class 529-A – assumed 5% return | | | 1,000.00 | | | | 1,019.30 | | | | 5.69 | | | | 1.13 | |
| Class 529-C – actual return | | | 1,000.00 | | | | 962.94 | | | | 9.20 | | | | 1.88 | |
| Class 529-C – assumed 5% return | | | 1,000.00 | | | | 1,015.56 | | | | 9.45 | | | | 1.88 | |
| Class 529-E – actual return | | | 1,000.00 | | | | 965.66 | | | | 6.52 | | | | 1.33 | |
| Class 529-E – assumed 5% return | | | 1,000.00 | | | | 1,018.30 | | | | 6.69 | | | | 1.33 | |
| Class 529-T – actual return | | | 1,000.00 | | | | 967.85 | | | | 4.37 | | | | .89 | |
| Class 529-T – assumed 5% return | | | 1,000.00 | | | | 1,020.49 | | | | 4.48 | | | | .89 | |
| Class 529-F-1 – actual return | | | 1,000.00 | | | | 967.70 | | | | 4.42 | | | | .90 | |
| Class 529-F-1 – assumed 5% return | | | 1,000.00 | | | | 1,020.44 | | | | 4.53 | | | | .90 | |
| Class R-1 – actual return | | | 1,000.00 | | | | 963.20 | | | | 8.96 | | | | 1.83 | |
| Class R-1 – assumed 5% return | | | 1,000.00 | | | | 1,015.81 | | | | 9.20 | | | | 1.83 | |
| Class R-2 – actual return | | | 1,000.00 | | | | 963.27 | | | | 8.91 | | | | 1.82 | |
| Class R-2 – assumed 5% return | | | 1,000.00 | | | | 1,015.86 | | | | 9.15 | | | | 1.82 | |
| Class R-2E – actual return | | | 1,000.00 | | | | 964.83 | | | | 7.45 | | | | 1.52 | |
| Class R-2E – assumed 5% return | | | 1,000.00 | | | | 1,017.35 | | | | 7.64 | | | | 1.52 | |
| Class R-3 – actual return | | | 1,000.00 | | | | 965.37 | | | | 6.66 | | | | 1.36 | |
| Class R-3 – assumed 5% return | | | 1,000.00 | | | | 1,018.15 | | | | 6.84 | | | | 1.36 | |
| Class R-4 – actual return | | | 1,000.00 | | | | 966.87 | | | | 5.20 | | | | 1.06 | |
| Class R-4 – assumed 5% return | | | 1,000.00 | | | | 1,019.65 | | | | 5.34 | | | | 1.06 | |
| Class R-5E – actual return | | | 1,000.00 | | | | 967.88 | | | | 4.22 | | | | .86 | |
| Class R-5E – assumed 5% return | | | 1,000.00 | | | | 1,020.64 | | | | 4.33 | | | | .86 | |
| Class R-5 – actual return | | | 1,000.00 | | | | 968.44 | | | | 3.73 | | | | .76 | |
| Class R-5 – assumed 5% return | | | 1,000.00 | | | | 1,021.14 | | | | 3.83 | | | | .76 | |
| Class R-6 – actual return | | | 1,000.00 | | | | 968.63 | | | | 3.44 | | | | .70 | |
| Class R-6 – assumed 5% return | | | 1,000.00 | | | | 1,021.44 | | | | 3.53 | | | | .70 | |
| | |
| * | The “expenses paid during period” are equal to the “annualized expense ratio,” multiplied by the average account value over the period, multiplied by the number of days in the period, and divided by 365 (to reflect the one-half year period). |
| | |
This page was intentionally left blank.
This page was intentionally left blank.
This page was intentionally left blank.
This page was intentionally left blank.
This page was intentionally left blank.
Results of special meeting of shareholders
Held November 28, 2018
Shares outstanding (all classes) on August 31, 2018 (record date)
727,749,799
Total shares voting on November 28, 2018
621,652,120 (85.4% of shares outstanding)
The proposal: to elect board members
| | | Votes for | | Percent
of shares
voting for | | Votes withheld | | Percent
of shares
withheld |
| Joseph C. Berenato | | | 605,574,526 | | | | 97.4 | % | | | 16,077,594 | | | | 2.6 | % |
| Joseph Bonner | | | 607,057,085 | | | | 97.7 | | | | 14,595,035 | | | | 2.3 | |
| Louise H. Bryson | | | 606,707,733 | | | | 97.6 | | | | 14,944,387 | | | | 2.4 | |
| Mary Anne Dolan | | | 606,744,643 | | | | 97.6 | | | | 14,907,477 | | | | 2.4 | |
| Brady L. Enright | | | 606,654,099 | | | | 97.6 | | | | 14,998,021 | | | | 2.4 | |
| John G. Freund | | | 605,960,738 | | | | 97.5 | | | | 15,691,382 | | | | 2.5 | |
| Yvonne Greenstreet | | | 566,286,186 | | | | 91.1 | | | | 55,365,934 | | | | 8.9 | |
| Linda Griego | | | 606,938,860 | | | | 97.6 | | | | 14,713,260 | | | | 2.4 | |
| Leonade D. Jones | | | 605,499,439 | | | | 97.4 | | | | 16,152,681 | | | | 2.6 | |
| Sharon I. Meers | | | 607,864,160 | | | | 97.8 | | | | 13,787,960 | | | | 2.2 | |
| Anne-Marie Peterson | | | 607,578,915 | | | | 97.7 | | | | 14,073,205 | | | | 2.3 | |
| Kenneth M. Simril | | | 606,866,426 | | | | 97.6 | | | | 14,785,694 | | | | 2.4 | |
| Christopher E. Stone | | | 578,199,239 | | | | 93.0 | | | | 43,452,882 | | | | 7.0 | |
Offices of the fund and of the investment adviser
Capital Research and Management Company
333 South Hope Street
Los Angeles, CA 90071-1406
6455 Irvine Center Drive
Irvine, CA 92618-4518
Transfer agent for shareholder accounts
American Funds Service Company
(Write to the address near you.)
P.O. Box 6007
Indianapolis, IN 46206-6007
P.O. Box 2280
Norfolk, VA 23501-2280
Custodian of assets
State Street Bank and Trust Company
One Lincoln Street
Boston, MA 02111
Counsel
Dechert LLP
One Bush Street, Suite 1600
San Francisco, CA 94104-4446
Independent registered public accounting firm
Deloitte & Touche LLP
695 Town Center Drive
Suite 700
Costa Mesa, CA 92626-7188
Principal underwriter
American Funds Distributors, Inc.
333 South Hope Street
Los Angeles, CA 90071-1406
Investors should carefully consider investment objectives, risks, charges and expenses. This and other important information is contained in the fund prospectus and summary prospectus, which can be obtained from your financial professional and should be read carefully before investing. You may also call American Funds Service Company (AFS) at (800) 421-4225 or visit the American Funds website at americanfunds.com. Fund shares offered through American Funds Distributors, Inc.
“American Funds Proxy Voting Procedures and Principles” — which describes how we vote proxies relating to portfolio securities — is available on the American Funds website or upon request by calling AFS. The fund files its proxy voting record with the U.S. Securities and Exchange Commission (SEC) for the 12 months ended June 30 by August 31. The proxy voting record is available free of charge on the SEC website at sec.gov and on the American Funds website.
A complete March 31, 2019, portfolio of SMALLCAP World Fund’s investments is available free of charge by calling AFS or visiting the SEC website (where it is part of Form N-CSR).
SMALLCAP World Fund files a complete list of its portfolio holdings with the SEC for the first and third quarters of each fiscal year on Form N-PORT-EX. This filing is available free of charge on the SEC website. Additionally, the list of portfolio holdings is available by calling AFS.
This report is for the information of shareholders of SMALLCAP World Fund, but it also may be used as sales literature when preceded or accompanied by the current prospectus or summary prospectus, which gives details about charges, expenses, investment objectives and operating policies of the fund. If used as sales material after June 30, 2019, this report must be accompanied by an American Funds statistical update for the most recently completed calendar quarter.
MCSI has not approved, reviewed or produced this report, makes no express or implied warranties or representations and is not liable whatsoever for any data in the report. You may not redistribute the MSCI data or use it as a basis for other indices or investment products.
The Capital Advantage®
Since 1931, Capital Group, home of American Funds, has helped investors pursue long-term investment success. Our consistent approach — in combination with The Capital SystemSM— has resulted in superior outcomes.
| | Aligned with investor success |
| | We base our decisions on a long-term perspective, which we believe aligns our goals with the interests of our clients. Our portfolio managers average 27 years of investment experience, including 20 years at our company, reflecting a career commitment to our long-term approach.1 |
| | |
| | The Capital System |
| | The Capital System combines individual accountability with teamwork. Funds using The Capital System are divided into portions that are managed independently by investment professionals with diverse backgrounds, ages and investment approaches. An extensive global research effort is the backbone of our system. |
| | |
| | American Funds’ superior outcomes |
| | Equity funds have beaten their Lipper peer indexes in 92% of 10-year periods and 99% of 20-year periods.2Fixed income funds have helped investors achieve diversification through attention to correlation between bonds and equities.3Fund management fees have been among the lowest in the industry.4 |
| | |
| | 1 | Portfolio manager experience as of December 31, 2018. |
| | 2 | Based on Class F-2 share results for rolling periods through December 31, 2018. Periods covered are the shorter of the fund’s lifetime or since the comparable Lipper index inception date (except Capital Income Builder and SMALLCAP World Fund, for which the Lipper average was used). Expenses differ for each share class, so results will vary. |
| | 3 | Based on Class F-2 share results, as of December 31, 2018. Fourteen of our 15 American Funds fixed income funds that have been in existence for the three-year period showed a three-year correlation below 0.2. Standard & Poor’s 500 Composite Index was used as an equity market proxy. Correlation based on monthly total returns. Correlation is a statistical measure of how two securities move in relation to each other. A correlation ranges from –1 to 1. A positive correlation close to 1 implies that as one security moves, either up or down, the other security will move in “lockstep,” in the same direction. A negative correlation close to –1 indicates that the securities have moved in the opposite direction. |
| | 4 | On average, our management fees were in the lowest quintile 70% of the time, based on the 20-year period ended December 31, 2018, versus comparable Lipper categories, excluding funds of funds. |
| | | |
| | | Class F-2 shares were first offered on August 1, 2008. Class F-2 share results prior to the date of first sale are hypothetical based on Class A share results without a sales charge, adjusted for typical estimated expenses. Results for certain funds with an inception date after August 1, 2008, also include hypothetical returns because those funds’ Class F-2 shares sold after the funds’ date of first offering. Please see americanfunds.com for more information on specific expense adjustments and the actual dates of first sale. |
| | | |
| | | All Capital Group trademarks referenced are registered trademarks owned by The Capital Group Companies, Inc. or an affiliated company. All other company and product names mentioned are the trademarks or registered trademarks of their respective companies. |

ITEM 2 – Code of Ethics
Not applicable for filing of semi-annual reports to shareholders.
ITEM 3 – Audit Committee Financial Expert
Not applicable for filing of semi-annual reports to shareholders.
ITEM 4 – Principal Accountant Fees and Services
Not applicable for filing of semi-annual reports to shareholders.
ITEM 5 – Audit Committee of Listed Registrants
Not applicable to this Registrant, insofar as the Registrant is not a listed issuer as defined in Rule 10A-3 under the Securities Exchange Act of 1934.
ITEM 6 – Schedule of Investments

SMALLCAP World Fund®
Investment portfolio
March 31, 2019
unaudited
Common stocks 91.02%
Information technology 20.88% | Shares | Value
(000) |
| RingCentral, Inc., Class A1 | 4,741,200 | $511,101 |
| MongoDB, Inc., Class A1,2 | 3,209,522 | 471,864 |
| Paycom Software, Inc.1 | 2,430,134 | 459,611 |
| Alteryx, Inc., Class A1 | 3,425,833 | 287,325 |
| DocuSign, Inc.1 | 3,621,737 | 187,751 |
| Square, Inc., Class A1 | 2,450,730 | 183,609 |
| SimCorp AS | 1,865,843 | 180,125 |
| EPAM Systems, Inc.1 | 1,062,494 | 179,700 |
| WiseTech Global Ltd. | 10,762,887 | 176,687 |
| Yext, Inc.1,3 | 8,025,874 | 175,446 |
| Alarm.Com Holdings, Inc.1,3 | 2,695,700 | 174,951 |
| Smartsheet Inc., Class A1,2 | 3,905,000 | 159,285 |
| Ceridian HCM Holding Inc.1 | 2,901,471 | 148,845 |
| Halma PLC | 6,749,967 | 146,994 |
| HubSpot, Inc.1 | 874,748 | 145,392 |
| Bottomline Technologies, Inc.1,3 | 2,848,000 | 142,656 |
| Acacia Communications, Inc.1,3 | 2,406,341 | 138,004 |
| Cree, Inc.1 | 2,369,014 | 135,555 |
| Jenoptik AG3 | 3,628,640 | 135,138 |
| Wix.com Ltd.1 | 1,036,000 | 125,180 |
| Qorvo, Inc.1 | 1,712,104 | 122,809 |
| Netcompany Group AS, non-registered shares1,3 | 3,309,913 | 118,513 |
| Inphi Corp.1,2,3 | 2,417,832 | 105,756 |
| Net One Systems Co., Ltd. | 4,185,646 | 105,255 |
| Euronet Worldwide, Inc.1 | 735,490 | 104,874 |
| Bechtle AG, non-registered shares | 1,126,746 | 104,337 |
| Kingdee International Software Group Co. Ltd.2 | 83,310,210 | 96,365 |
| InterXion Holding NV, non-registered shares1 | 1,440,000 | 96,091 |
| Everbridge, Inc.1 | 1,271,100 | 95,345 |
| Globant SA1 | 1,320,800 | 94,305 |
| Vanguard International Semiconductor Corp. | 42,643,575 | 92,010 |
| SUNeVision Holdings Ltd.2 | 107,954,000 | 92,002 |
| LiveRamp Holdings, Inc.1 | 1,607,100 | 87,699 |
| Hamamatsu Photonics KK | 2,257,480 | 87,179 |
| AAC Technologies Holdings Inc. | 14,562,500 | 86,170 |
| Carel Industries SpA1,3 | 7,820,849 | 85,985 |
| CDW Corp. | 850,000 | 81,914 |
| Avalara, Inc.1 | 1,448,000 | 80,784 |
| Viavi Solutions Inc.1 | 6,170,050 | 76,385 |
| Douzone Bizon Co., Ltd.3 | 1,842,408 | 75,638 |
| Elastic NV, non-registered shares1,2 | 944,200 | 75,413 |
| SVMK Inc.1 | 4,123,230 | 75,084 |
| Nuance Communications, Inc.1 | 4,273,000 | 72,342 |
| Versum Materials, Inc. | 1,429,190 | 71,903 |
| Mellanox Technologies, Ltd.1 | 600,000 | 71,016 |
| Endurance International Group Holdings, Inc.1,3 | 9,461,599 | 68,597 |
| Zebra Technologies Corp., Class A1 | 324,920 | 68,080 |
SMALLCAP World Fund — Page 1 of 17
unaudited
Common stocks (continued)
Information technology (continued) | Shares | Value
(000) |
| Bravura Solutions Ltd.3 | 17,125,000 | $66,513 |
| Coupa Software Inc.1 | 708,000 | 64,414 |
| Topcon Corp. | 5,096,510 | 60,056 |
| BE Semiconductor Industries, NV | 2,108,301 | 56,097 |
| CANCOM SE, non-registered shares | 1,215,231 | 54,773 |
| Anaplan, Inc.1 | 1,385,872 | 54,548 |
| WIN Semiconductors Corp. | 7,271,358 | 51,314 |
| Dolby Laboratories, Inc., Class A | 800,000 | 50,376 |
| Kinaxis Inc.1 | 855,900 | 49,938 |
| Autodesk, Inc.1 | 310,000 | 48,304 |
| Okta, Inc., Class A1 | 581,800 | 48,132 |
| 2U, Inc.1,2 | 635,000 | 44,990 |
| Cision Ltd.1 | 3,247,000 | 44,711 |
| Money Forward, Inc.1 | 1,059,052 | 44,195 |
| VTech Holdings Ltd. | 4,225,000 | 43,192 |
| eMemory Technology Inc.3 | 4,024,334 | 42,045 |
| Yangtze Optical Fibre and Cable Joint Stock Ltd. Co., Class H2 | 15,540,500 | 41,673 |
| MACOM Technology Solutions Holdings, Inc.1,2 | 2,475,000 | 41,357 |
| Teradata Corp.1 | 935,800 | 40,848 |
| Cognex Corp. | 800,000 | 40,688 |
| Blackbaud, Inc. | 503,000 | 40,104 |
| RealPage, Inc.1 | 658,810 | 39,983 |
| Temenos AG | 270,000 | 39,805 |
| Avast PLC | 10,754,000 | 39,681 |
| Maxlinear, Inc.1 | 1,500,000 | 38,295 |
| MKS Instruments, Inc. | 403,484 | 37,544 |
| Verint Systems Inc.1 | 603,000 | 36,096 |
| Lumentum Holdings Inc.1 | 624,000 | 35,281 |
| Tenable Holdings, Inc.1 | 1,083,633 | 34,308 |
| Trimble Inc.1 | 840,000 | 33,936 |
| Cypress Semiconductor Corp. | 2,200,000 | 32,824 |
| ASM Pacific Technology Ltd. | 2,902,300 | 32,369 |
| Nemetschek SE | 189,800 | 32,362 |
| Sabre Corp. | 1,512,000 | 32,342 |
| Integrated Device Technology, Inc.1 | 650,000 | 31,844 |
| Semtech Corp.1 | 620,000 | 31,564 |
| Megaport Ltd.1,3 | 9,491,978 | 27,566 |
| Megaport Ltd.1,2,3 | 1,029,200 | 2,989 |
| Kingboard Holdings Ltd. | 8,260,000 | 29,305 |
| SPS Commerce, Inc.1 | 273,369 | 28,994 |
| Silicon Laboratories Inc.1 | 341,000 | 27,573 |
| BlackLine, Inc.1 | 595,000 | 27,560 |
| Atea ASA | 1,888,659 | 27,416 |
| Endava PLC, Class A (ADR)1 | 959,598 | 26,389 |
| TravelSky Technology Ltd., Class H | 9,960,000 | 26,328 |
| Venustech Group Inc., Class A | 5,997,208 | 26,308 |
| Siltronic AG | 294,000 | 25,935 |
| X-FAB Silicon Foundries SE1,2 | 5,236,519 | 25,464 |
| Renishaw PLC | 525,000 | 25,341 |
| Zendesk, Inc.1 | 273,000 | 23,205 |
| Faraday Technology Corp.3 | 15,365,000 | 22,210 |
| AIXTRON SE1,2 | 2,434,518 | 21,880 |
| accesso Technology Group PLC1,2,3 | 1,935,612 | 21,832 |
| TOTVS SA, ordinary nominative | 2,000,000 | 20,126 |
| Fair Isaac Corp.1 | 71,900 | 19,530 |
SMALLCAP World Fund — Page 2 of 17
unaudited
Common stocks (continued)
Information technology (continued) | Shares | Value
(000) |
| Ultimate Software Group, Inc.1 | 55,700 | $18,388 |
| Finisar Corp.1 | 755,000 | 17,493 |
| Instructure, Inc.1 | 354,000 | 16,680 |
| Veeco Instruments Inc.1 | 1,490,000 | 16,152 |
| CoreLogic, Inc.1 | 415,000 | 15,463 |
| Nordic Semiconductor ASA1,2 | 3,589,770 | 15,025 |
| Humanica PCL3 | 50,840,900 | 14,979 |
| iEnergizer Ltd.1 | 7,650,500 | 14,448 |
| j2 Global, Inc. | 160,000 | 13,856 |
| WANdisco PLC1 | 1,615,173 | 13,127 |
| Nohmi Bosai Ltd. | 636,600 | 10,391 |
| INFICON Holding AG | 14,778 | 8,229 |
| StoneCo Ltd., Class A1,2 | 200,000 | 8,222 |
| Domo, Inc., Class B1 | 197,669 | 7,972 |
| oRo Co., Ltd.2 | 133,300 | 7,637 |
| Lightspeed POS Inc., subordinate voting shares1 | 463,700 | 7,151 |
| Diebold Nixdorf, Inc. | 528,456 | 5,850 |
| Double Standard Inc.2 | 114,000 | 5,575 |
| Maruwa Co Ltd | 111,600 | 5,256 |
| Datalex PLC3 | 5,405,000 | 4,887 |
| Talend SA (ADR)1 | 81,500 | 4,121 |
| Disco Corp. (Japan) | 24,800 | 3,529 |
| Catcher Technology Co., Ltd. | 407,000 | 3,130 |
| AGTech Holdings Ltd.1,2 | 42,420,000 | 2,756 |
| Net 1 UEPS Technologies, Inc.1 | 557,349 | 2,001 |
| | | 8,911,841 |
| Health care 16.02% | | |
| Molina Healthcare, Inc.1,3 | 3,390,512 | 481,317 |
| Insulet Corp.1,3 | 4,742,319 | 450,947 |
| GW Pharmaceuticals PLC (ADR)1,2,3 | 2,412,980 | 406,756 |
| Bluebird Bio, Inc.1,2 | 1,967,720 | 309,581 |
| NovoCure Ltd.1 | 3,780,597 | 182,111 |
| CONMED Corp.3 | 2,049,162 | 170,449 |
| Notre Dame Intermédica Participações S.A. | 19,261,749 | 161,361 |
| Allogene Therapeutics, Inc.1,2 | 4,786,670 | 138,383 |
| Allogene Therapeutics, Inc.1,4,5 | 653,594 | 18,328 |
| Centene Corp.1 | 2,918,878 | 154,992 |
| Integra LifeSciences Holdings Corp.1 | 2,748,275 | 153,134 |
| Allakos Inc.1,2,3 | 3,444,369 | 139,497 |
| Fisher & Paykel Healthcare Corp. Ltd. | 12,901,435 | 137,938 |
| Ultragenyx Pharmaceutical Inc.1 | 1,933,070 | 134,078 |
| Vitrolife AB | 5,002,795 | 113,887 |
| DexCom, Inc.1 | 940,600 | 112,025 |
| WellCare Health Plans, Inc.1 | 413,000 | 111,407 |
| Wright Medical Group NV1 | 3,501,557 | 110,124 |
| iRhythm Technologies, Inc.1,3 | 1,456,450 | 109,175 |
| PRA Health Sciences, Inc.1 | 982,200 | 108,327 |
| Haemonetics Corp.1 | 1,169,325 | 102,293 |
| Galapagos NV1 | 840,989 | 98,017 |
| LivaNova PLC1 | 980,967 | 95,399 |
| Madrigal Pharmaceuticals, Inc.1,2 | 732,647 | 91,771 |
| Glaukos Corp.1 | 1,150,322 | 90,151 |
| Nakanishi Inc. | 4,312,700 | 84,168 |
| China Biologic Products Holdings, Inc.1 | 876,600 | 79,990 |
SMALLCAP World Fund — Page 3 of 17
unaudited
Common stocks (continued)
Health care (continued) | Shares | Value
(000) |
| Exact Sciences Corp.1 | 890,000 | $77,092 |
| CryoLife, Inc.1,3 | 2,556,922 | 74,585 |
| Fleury SA, ordinary nominative | 13,693,000 | 71,344 |
| Sartorius AG, nonvoting preferred, non-registered shares | 395,000 | 67,749 |
| AnaptysBio, Inc.1 | 915,200 | 66,855 |
| NuVasive, Inc.1 | 1,166,000 | 66,217 |
| Amplifon SpA | 3,246,623 | 63,187 |
| Rubius Therapeutics, Inc.1 | 2,306,000 | 41,739 |
| Rubius Therapeutics, Inc.1,2 | 1,172,792 | 21,227 |
| Hikma Pharmaceuticals PLC | 2,641,100 | 61,626 |
| Natera, Inc.1 | 2,715,580 | 55,995 |
| Incyte Corp.1 | 640,000 | 55,046 |
| Osstem Implant Co., Ltd.1,3 | 1,142,821 | 54,468 |
| Sysmex Corp. | 859,000 | 51,852 |
| Dechra Pharmaceuticals PLC | 1,403,000 | 49,302 |
| Gossamer Bio, Inc.1 | 2,262,851 | 49,036 |
| CellaVision AB, non-registered shares3 | 1,620,123 | 48,618 |
| OdontoPrev SA, ordinary nominative | 11,606,500 | 48,615 |
| BioMarin Pharmaceutical Inc.1 | 531,500 | 47,213 |
| Editas Medicine, Inc.1 | 1,930,000 | 47,188 |
| Encompass Health Corp. | 801,400 | 46,802 |
| MorphoSys AG, non-registered shares1 | 510,875 | 46,505 |
| Agilon Health TopCo, Inc.1,4,6,7 | 118,513 | 44,817 |
| Cansino Biologics Inc., Class H1,3 | 9,920,400 | 43,726 |
| NuCana PLC (ADR)1,2,3 | 2,542,628 | 43,225 |
| Penumbra, Inc.1 | 265,244 | 38,994 |
| Hologic, Inc.1 | 800,000 | 38,720 |
| Divi’s Laboratories Ltd. | 1,500,000 | 36,877 |
| Cellectis SA (ADR)1 | 1,114,391 | 20,438 |
| Cellectis SA, non-registered shares1,2 | 863,506 | 15,605 |
| Abcam PLC | 2,420,000 | 35,774 |
| Autolus Therapeutics PLC (ADR)1,2 | 1,100,000 | 34,617 |
| Diplomat Pharmacy, Inc.1,3 | 5,579,556 | 32,417 |
| Revance Therapeutics, Inc.1 | 2,010,000 | 31,678 |
| Flexion Therapeutics, Inc.1,2,3 | 2,510,700 | 31,334 |
| Adaptimmune Therapeutics PLC (ADR)1,2,3 | 7,186,700 | 30,903 |
| Carl Zeiss Meditec AG, non-registered shares | 368,406 | 30,767 |
| Teladoc Health, Inc.1,2 | 540,000 | 30,024 |
| Hypera SA, ordinary nominative | 4,511,683 | 29,845 |
| Evolent Health, Inc., Class A1 | 2,370,545 | 29,821 |
| Genmab A/S1 | 165,000 | 28,635 |
| Ironwood Pharmaceuticals, Inc., Class A1 | 2,030,000 | 27,466 |
| Ambu AS, Class B, non-registered shares | 1,036,500 | 27,425 |
| Bausch Health Companies Inc.1 | 1,100,000 | 27,170 |
| Spark Therapeutics, Inc.1,2 | 238,020 | 27,106 |
| WuXi Biologics (Cayman) Inc.1 | 2,672,000 | 25,988 |
| Genomma Lab Internacional, SAB de CV, Series B1 | 35,953,000 | 25,876 |
| Piramal Enterprises Ltd. | 638,707 | 25,477 |
| Intercept Pharmaceuticals, Inc.1,2 | 213,137 | 23,841 |
| Gerresheimer AG, non-registered shares | 310,000 | 23,299 |
| Vocera Communications, Inc.1 | 734,241 | 23,224 |
| Neurocrine Biosciences, Inc.1 | 258,000 | 22,730 |
| Acerta Pharma BV1,4,6,7 | 195,556,815 | 22,606 |
| Revenio Group OYJ, non-registered shares3 | 1,302,404 | 22,441 |
| Neuronetics, Inc.1,3 | 1,444,300 | 22,026 |
SMALLCAP World Fund — Page 4 of 17
unaudited
Common stocks (continued)
Health care (continued) | Shares | Value
(000) |
| Krka, dd, Novo mesto | 335,262 | $21,813 |
| Xenon Pharmaceuticals Inc.1,3 | 2,019,226 | 20,515 |
| Grifols, SA, Class B (ADR) | 616,400 | 12,396 |
| Grifols, SA, Class A, non-registered shares | 270,000 | 7,559 |
| Agios Pharmaceuticals, Inc.1,2 | 283,400 | 19,112 |
| Mani, Inc. | 387,100 | 18,896 |
| Corindus Vascular Robotics, Inc.1,3,4,5,7 | 10,872,716 | 18,540 |
| Hutchison China MediTech Ltd. (ADR)1 | 588,488 | 17,996 |
| Hua Medicine1 | 17,799,000 | 17,504 |
| Guardant Health, Inc.1,2 | 213,033 | 16,340 |
| Clovis Oncology, Inc.1,2 | 652,000 | 16,183 |
| Tabula Rasa HealthCare, Inc.1 | 271,210 | 15,302 |
| Unity Biotechnology, Inc.1,2 | 1,835,000 | 14,882 |
| Alnylam Pharmaceuticals, Inc.1 | 137,700 | 12,868 |
| Precision Biosciences, Inc.1 | 625,000 | 11,219 |
| Shockwave Medical, Inc.1,2 | 300,000 | 10,041 |
| Nevro Corp.1 | 160,000 | 10,002 |
| Global Blood Therapeutics, Inc.1 | 160,000 | 8,469 |
| AddLife AB, Class B | 288,143 | 7,283 |
| Asahi Intecc Co., Ltd. | 130,900 | 6,142 |
| Hugel, Inc.1 | 18,122 | 6,035 |
| Genus PLC | 191,000 | 5,523 |
| CRISPR Therapeutics AG1,2 | 138,000 | 4,929 |
| Paramount Bed Holdings Co., Ltd. | 107,500 | 4,762 |
| Neovasc Inc.1,3 | 4,942,046 | 2,079 |
| G1 Therapeutics, Inc.1 | 55,600 | 923 |
| WIN-Partners Co., Ltd. | 41,400 | 471 |
| | | 6,840,543 |
| Consumer discretionary 15.87% | | |
| Ocado Group PLC1 | 14,078,000 | 251,293 |
| Takeaway.com NV1,3 | 3,139,600 | 238,429 |
| ServiceMaster Global Holdings, Inc.1 | 4,805,000 | 224,393 |
| Evolution Gaming Group AB3 | 2,830,274 | 222,987 |
| Five Below, Inc.1 | 1,486,702 | 184,723 |
| Domino’s Pizza, Inc. | 691,161 | 178,389 |
| Strategic Education, Inc.3 | 1,291,720 | 169,616 |
| Floor & Decor Holdings, Inc., Class A1 | 4,048,600 | 166,883 |
| Dollarama Inc. | 6,015,000 | 160,463 |
| Mattel, Inc.1,2 | 12,260,000 | 159,380 |
| Grand Canyon Education, Inc.1 | 1,309,000 | 149,894 |
| Nien Made Enterprise Co., Ltd.3 | 15,215,000 | 134,030 |
| Hilton Grand Vacations Inc.1 | 4,192,886 | 129,351 |
| MercadoLibre, Inc.1 | 238,100 | 120,891 |
| GVC Holdings PLC | 15,918,489 | 115,898 |
| TopBuild Corp.1,3 | 1,783,200 | 115,587 |
| Melco International Development Ltd. | 46,191,000 | 108,270 |
| Seria Co., Ltd.2 | 3,134,891 | 107,909 |
| Ace Hardware Indonesia Tbk PT | 855,750,000 | 106,969 |
| Pool Corp. | 594,000 | 97,992 |
| ASOS PLC1,2 | 2,191,775 | 91,350 |
| KB Home | 3,712,000 | 89,719 |
| Endurance Technologies Ltd. | 5,180,990 | 86,819 |
| Domino’s Pizza Group PLC3 | 27,307,815 | 86,072 |
| Jumbo SA | 5,124,161 | 85,646 |
SMALLCAP World Fund — Page 5 of 17
unaudited
Common stocks (continued)
Consumer discretionary (continued) | Shares | Value
(000) |
| Moncler SpA | 2,120,000 | $85,422 |
| At Home Group Inc.1,3 | 4,593,873 | 82,047 |
| Gentex Corp. | 3,909,134 | 80,841 |
| Delta Corp Ltd.3 | 21,407,238 | 78,738 |
| Ollie’s Bargain Outlet Holdings, Inc.1 | 882,000 | 75,261 |
| MakeMyTrip Ltd., non-registered shares1 | 2,674,151 | 73,807 |
| Cedar Fair, LP | 1,346,000 | 70,827 |
| Vivo Energy PLC | 41,147,006 | 68,769 |
| Dine Brands Global, Inc. | 741,799 | 67,719 |
| Canada Goose Holdings Inc., subordinate voting shares (CAD denominated)1 | 1,172,000 | 56,287 |
| Canada Goose Holdings Inc., subordinate voting shares1,2 | 167,000 | 8,019 |
| Wyndham Hotels & Resorts, Inc. | 1,277,400 | 63,857 |
| Tongcheng-Elong Holdings Ltd.1 | 27,964,000 | 62,056 |
| MGM China Holdings, Ltd.2 | 27,451,200 | 57,421 |
| Garrett Motion Inc.1,3 | 3,825,559 | 56,350 |
| Casio Computer Co., Ltd.2 | 4,280,100 | 55,804 |
| Spin Master Corp., subordinate voting shares1 | 1,982,400 | 55,481 |
| Brunello Cucinelli SpA | 1,608,281 | 55,295 |
| Adtalem Global Education Inc.1 | 1,157,000 | 53,592 |
| Lennar Corp., Class A | 1,058,458 | 51,960 |
| Lennar Corp., Class B | 21,169 | 828 |
| Xinyi Glass Holdings Ltd. | 44,311,000 | 50,803 |
| Cie. Plastic Omnium SA | 1,869,195 | 49,756 |
| Momo.com Inc. | 5,642,000 | 46,589 |
| Toll Brothers, Inc. | 1,272,000 | 46,046 |
| Party City Holdco Inc.1,2,3 | 5,332,459 | 42,340 |
| Signet Jewelers Ltd. | 1,500,000 | 40,740 |
| Etsy, Inc.1 | 580,000 | 38,988 |
| Brembo SpA | 3,262,000 | 36,994 |
| Moneysupermarket.com Group PLC | 7,495,500 | 36,326 |
| CVC Brasil Operadora e Agência de Viagens SA, ordinary nominative | 2,571,000 | 35,951 |
| Lands’ End, Inc.1,3 | 2,078,232 | 34,519 |
| Thor Industries, Inc. | 545,600 | 34,029 |
| zooplus AG, non-registered shares1,2 | 278,256 | 31,713 |
| Kindred Group PLC (SDR) | 3,155,000 | 31,593 |
| Greggs PLC | 1,267,274 | 30,354 |
| Samsonite International SA | 9,369,260 | 30,018 |
| Man Wah Holdings Ltd.2 | 49,632,000 | 29,084 |
| M.D.C. Holdings, Inc. | 967,528 | 28,116 |
| Zhongsheng Group Holdings Ltd.2 | 11,153,500 | 27,678 |
| Mercari, Inc.1,2 | 873,797 | 26,806 |
| Aritzia Inc., subordinate voting shares1 | 1,977,000 | 26,274 |
| WH Smith PLC | 935,000 | 25,842 |
| Hoteles City Express, SAB de CV1,3 | 24,121,157 | 25,774 |
| Vail Resorts, Inc. | 116,753 | 25,370 |
| William Hill PLC | 12,008,000 | 25,110 |
| Six Flags Entertainment Corp. | 500,000 | 24,675 |
| Varroc Engineering Ltd.1 | 2,836,422 | 23,707 |
| Shop Apotheke Europe NV, non-registered shares1 | 572,857 | 23,584 |
| Maisons du Monde SA | 1,179,513 | 22,784 |
| Hyundai Wia Corp. | 632,000 | 22,550 |
| Cairn Homes PLC1 | 13,905,000 | 22,305 |
| National Vision Holdings, Inc.1 | 702,500 | 22,080 |
| POYA International Co., Ltd. | 1,855,527 | 21,944 |
| Century Communities, Inc.1 | 911,000 | 21,837 |
SMALLCAP World Fund — Page 6 of 17
unaudited
Common stocks (continued)
Consumer discretionary (continued) | Shares | Value
(000) |
| Caesars Entertainment Corp.1,2 | 2,500,000 | $21,725 |
| Page Industries Ltd. | 60,000 | 21,629 |
| B2W - Cia. Digital, ordinary nominative1 | 2,005,000 | 21,620 |
| Harley-Davidson, Inc. | 592,000 | 21,111 |
| D.R. Horton, Inc. | 490,000 | 20,276 |
| Ctrip.com International, Ltd. (ADR)1 | 464,000 | 20,272 |
| Winnebago Industries, Inc. | 650,000 | 20,247 |
| MIPS AB1,3 | 1,396,751 | 20,191 |
| Chow Sang Sang Holdings International Ltd. | 12,990,000 | 20,188 |
| Nifco Inc. | 788,700 | 20,068 |
| Quotient Technology Inc.1 | 2,000,000 | 19,740 |
| Bright Horizons Family Solutions Inc.1 | 155,000 | 19,702 |
| Gourmet Master Co., Ltd. | 2,930,000 | 19,489 |
| Gestamp Automocion SA, non-registered shares2 | 3,350,000 | 19,334 |
| Dalata Hotel Group PLC | 2,929,000 | 19,319 |
| Relaxo Footwears Ltd. | 1,727,000 | 19,215 |
| Beazer Homes USA, Inc. (USA)1,3 | 1,659,813 | 19,104 |
| Just Eat PLC1 | 1,950,000 | 19,074 |
| Planet Fitness, Inc., Class A1 | 275,700 | 18,946 |
| Texas Roadhouse, Inc. | 300,000 | 18,657 |
| Hostelworld Group PLC3 | 7,645,662 | 18,422 |
| Cooper Tire & Rubber Co. | 616,000 | 18,412 |
| Melco Resorts & Entertainment Ltd. (ADR) | 800,000 | 18,072 |
| Tile Shop Holdings, Inc.3 | 3,158,000 | 17,874 |
| Cyrela Brazil Realty SA, ordinary nominative | 4,230,900 | 17,581 |
| Cuckoo Homesys Co., Ltd. | 99,789 | 17,143 |
| Graham Holdings Co., Class B | 25,000 | 17,079 |
| Countryside Properties PLC | 4,034,745 | 17,068 |
| NAN LIU Enterprise Co., Ltd. | 3,090,000 | 16,593 |
| Cavco Industries, Inc.1 | 135,014 | 15,868 |
| BCA Marketplace PLC | 6,139,300 | 15,800 |
| Cox & Kings Ltd. | 7,500,000 | 15,141 |
| Viomi Technology Co., Ltd. (ADR)2 | 1,348,200 | 14,925 |
| Cuckoo Holdings Co., Ltd. | 118,210 | 14,632 |
| Del Taco Restaurants, Inc.1 | 1,438,200 | 14,468 |
| Ryohin Keikaku Co., Ltd. | 57,000 | 14,421 |
| China MeiDong Auto Holdings Ltd. | 28,100,000 | 13,638 |
| HUGO BOSS AG | 195,848 | 13,375 |
| Arco Platform Ltd., Class A1 | 404,332 | 13,056 |
| Thule Group AB | 529,000 | 11,949 |
| Bygghemma Group First AB1,2 | 2,980,102 | 11,732 |
| Paltac Corp. | 185,100 | 10,054 |
| Glenveagh Properties PLC1 | 9,955,000 | 9,860 |
| Williams-Sonoma, Inc.2 | 175,000 | 9,847 |
| TVS Motor Co Ltd. | 1,421,547 | 9,663 |
| Tiffany & Co. | 90,000 | 9,499 |
| TAKKT AG | 500,500 | 8,231 |
| Bloomberry Resorts Corp. | 33,894,100 | 7,746 |
| ElringKlinger AG2 | 1,077,982 | 7,328 |
| POLYTEC Holding AG, non-registered shares2 | 763,618 | 7,255 |
| Piaggio & C. SpA | 2,650,000 | 6,463 |
| Dustin Group AB | 683,989 | 6,415 |
| AA PLC | 5,250,799 | 6,223 |
| DFS Furniture PLC | 1,805,000 | 5,889 |
| Greene King PLC | 670,000 | 5,807 |
SMALLCAP World Fund — Page 7 of 17
unaudited
Common stocks (continued)
Consumer discretionary (continued) | Shares | Value
(000) |
| Sonos, Inc.1,2 | 550,000 | $5,659 |
| Tailored Brands, Inc. | 718,850 | 5,636 |
| Detsky Mir PJSC | 3,650,660 | 4,945 |
| Sabina PCL | 6,000,000 | 4,868 |
| Stamps.com Inc.1 | 57,100 | 4,649 |
| BNN Technology PLC1,3,4,6 | 19,007,000 | 3,609 |
| WE Solutions Ltd.1 | 24,176,000 | 1,524 |
| China Zenix Auto International Ltd. (ADR)1 | 2,152,000 | 1,291 |
| Lojas Americanas SA, ordinary nominative | 306,900 | 1,036 |
| | | 6,776,266 |
| Industrials 13.72% | | |
| Spirax-Sarco Engineering PLC | 2,028,028 | 189,917 |
| MonotaRO Co., Ltd. | 8,371,900 | 185,900 |
| Nihon M&A Center Inc.2 | 6,264,980 | 171,279 |
| NIBE Industrier AB, Class B | 12,762,000 | 163,415 |
| IMCD NV | 2,053,000 | 156,255 |
| Bravida Holding AB3 | 16,173,198 | 142,557 |
| Rheinmetall AG | 1,363,840 | 142,096 |
| Rexnord Corp.1,3 | 5,508,000 | 138,471 |
| IDEX Corp. | 875,000 | 132,772 |
| BELIMO Holding AG | 26,118 | 130,492 |
| VARTA AG, non-registered shares1,3 | 3,056,000 | 130,404 |
| Advanced Disposal Services, Inc.1,3 | 4,635,502 | 129,794 |
| Aalberts Industries NV, non-registered shares | 3,578,100 | 123,743 |
| Havells India Ltd. | 10,934,273 | 121,930 |
| Marel hf., non-registered shares | 28,173,726 | 121,881 |
| frontdoor, inc.1 | 3,283,700 | 113,025 |
| TechnoPro Holdings, Inc. | 1,786,100 | 106,363 |
| Aerojet Rocketdyne Holdings, Inc.1 | 2,958,046 | 105,099 |
| Wizz Air Holdings PLC1 | 2,630,000 | 103,106 |
| Watsco, Inc. | 680,000 | 97,383 |
| Diploma PLC | 5,043,082 | 95,767 |
| TransDigm Group Inc.1 | 190,000 | 86,258 |
| Harmonic Drive Systems Inc.2 | 2,402,000 | 82,140 |
| Tomra Systems ASA | 2,660,900 | 79,288 |
| Nolato AB, Class B | 1,883,840 | 78,313 |
| VAT Group AG | 721,057 | 75,817 |
| Waste Connections, Inc. | 840,000 | 74,416 |
| Boyd Group Income Fund | 712,882 | 73,355 |
| Spirit Airlines, Inc.1 | 1,382,000 | 73,052 |
| Curtiss-Wright Corp. | 633,000 | 71,744 |
| Continental Building Products, Inc.1,3 | 2,780,700 | 68,934 |
| Azul SA, preference shares (ADR)1 | 2,077,150 | 60,674 |
| Azul SA, preference shares1 | 771,000 | 7,536 |
| Graco Inc. | 1,374,000 | 68,040 |
| Oshkosh Corp. | 887,207 | 66,656 |
| Matson, Inc. | 1,829,000 | 66,009 |
| International Container Terminal Services, Inc. | 25,753,786 | 64,102 |
| Masco Corp. | 1,625,000 | 63,879 |
| Grafton Group PLC, units | 6,031,000 | 63,587 |
| Nabtesco Corp. | 2,014,361 | 58,615 |
| Meggitt PLC | 8,272,134 | 54,172 |
| Loomis AB, Class B | 1,545,000 | 53,177 |
| Coor Service Management Holding AB3 | 5,878,630 | 52,354 |
SMALLCAP World Fund — Page 8 of 17
unaudited
Common stocks (continued)
Industrials (continued) | Shares | Value
(000) |
| ABM Industries Inc. | 1,300,000 | $47,255 |
| CoStar Group, Inc.1 | 100,000 | 46,642 |
| Johnson Electric Holdings Ltd. | 20,125,875 | 46,610 |
| Kratos Defense & Security Solutions, Inc.1 | 2,901,400 | 45,349 |
| Barrett Business Services, Inc.3 | 585,786 | 45,299 |
| ManpowerGroup Inc. | 533,000 | 44,074 |
| Tsubaki Nakashima Co., Ltd.3 | 2,441,100 | 43,765 |
| SiteOne Landscape Supply, Inc.1 | 759,000 | 43,377 |
| Avon Rubber PLC3 | 2,481,863 | 42,023 |
| Grupo Aeroportuario del Pacífico SAB de CV | 4,659,553 | 41,366 |
| Trust Tech Inc.3 | 1,204,900 | 39,844 |
| NORMA Group SE, non-registered shares | 813,839 | 39,493 |
| Air Lease Corp., Class A | 1,089,700 | 37,431 |
| I.M.A. Industria Macchine Automatiche SpA | 492,216 | 36,745 |
| Guangzhou Baiyun International Airport Co. Ltd., Class A | 16,519,892 | 36,333 |
| Rockwool International A/S, Class B | 146,600 | 34,340 |
| Kingspan Group PLC | 724,000 | 33,509 |
| Cía. de Distribución Integral Logista Holdings, SA, non-registered shares | 1,402,880 | 33,047 |
| Armstrong World Industries, Inc. | 411,800 | 32,705 |
| Instalco Intressenter AB (publ)3 | 3,831,789 | 32,559 |
| Greaves Cotton Ltd.3 | 16,200,000 | 32,552 |
| Lifco AB, Class B | 789,000 | 32,163 |
| Altra Industrial Motion Corp. | 1,000,000 | 31,050 |
| USG Corp. | 689,912 | 29,873 |
| PayPoint PLC | 2,649,000 | 29,568 |
| American Airlines Group Inc. | 872,000 | 27,695 |
| Carborundum Universal Ltd. | 4,365,000 | 25,856 |
| Europcar Mobility Group SA | 3,061,000 | 24,825 |
| King Slide Works Co., Ltd. | 2,183,000 | 24,330 |
| BWX Technologies, Inc. | 487,233 | 24,157 |
| Kornit Digital Ltd.1,2 | 1,000,000 | 23,800 |
| Middleby Corp.1 | 168,500 | 21,910 |
| KeyW Holding Corp.1,3 | 2,536,400 | 21,864 |
| Generac Holdings Inc.1 | 420,900 | 21,563 |
| R.R. Donnelley & Sons Co.3 | 4,362,424 | 20,591 |
| Befesa SA | 430,000 | 18,739 |
| Nexans SA2 | 581,358 | 17,301 |
| Fluidra, SA, non-registered shares1 | 1,490,698 | 17,123 |
| XP Power Ltd. | 515,000 | 16,769 |
| Alfen NV1,2,3 | 1,275,000 | 16,539 |
| Sunny Friend Environmental Technology Co., Ltd. | 2,115,000 | 16,538 |
| Teleperformance SE | 92,000 | 16,533 |
| Avis Budget Group, Inc.1 | 462,000 | 16,105 |
| Amara Raja Batteries Ltd. | 1,542,705 | 16,033 |
| Briggs & Stratton Corp. | 1,331,000 | 15,746 |
| Klingelnberg AG1 | 441,000 | 14,903 |
| Embraer SA, ordinary nominative | 3,085,000 | 14,537 |
| JELD-WEN Holding, Inc.1 | 815,000 | 14,393 |
| PageGroup PLC | 2,243,300 | 13,732 |
| Hertz Global Holdings Inc.1 | 671,857 | 11,670 |
| Japan Elevator Service Holdings Co., Ltd.2 | 574,400 | 11,656 |
| Upwork Inc.1,2 | 564,720 | 10,809 |
| J. Kumar Infraprojects Ltd.3 | 4,450,500 | 10,321 |
| Sweco AB, Class B, non-registered shares | 425,000 | 10,239 |
| BMC Stock Holdings, Inc.1 | 579,222 | 10,235 |
SMALLCAP World Fund — Page 9 of 17
unaudited
Common stocks (continued)
Industrials (continued) | Shares | Value
(000) |
| OSRAM Licht AG2 | 293,000 | $10,084 |
| JGC Corp. | 752,500 | 9,988 |
| KCC Corp. | 33,000 | 9,260 |
| Daifuku Co., Ltd.2 | 172,400 | 8,960 |
| Indutrade AB | 310,000 | 8,823 |
| Troax Group AB | 275,000 | 8,785 |
| Elis SA | 450,000 | 7,234 |
| Grace Technology, Inc.2 | 386,000 | 7,028 |
| CKD Corp. | 752,800 | 6,779 |
| Sakai Moving Service Co., Ltd. | 96,600 | 6,119 |
| DKSH Holding AG | 105,741 | 6,095 |
| Elementia, SAB de CV1 | 10,471,270 | 5,967 |
| Prosegur Compañía de Seguridad, SA | 1,038,326 | 5,626 |
| Fjord1 ASA2 | 1,110,000 | 5,444 |
| Greentown Service Group Co., Ltd. | 5,598,000 | 4,963 |
| Takeuchi Mfg. Co., Ltd. | 275,000 | 4,831 |
| va-Q-tec AG1,2 | 605,314 | 4,305 |
| Stericycle, Inc.1 | 66,000 | 3,592 |
| Addtech AB, Class B | 163,259 | 3,389 |
| | | 5,854,523 |
| Financials 9.38% | | |
| Kotak Mahindra Bank Ltd. | 18,292,040 | 352,374 |
| Essent Group Ltd.1 | 3,797,535 | 165,003 |
| MarketAxess Holdings Inc. | 660,000 | 162,413 |
| Webster Financial Corp. | 3,200,000 | 162,144 |
| RenaissanceRe Holdings Ltd. | 1,058,600 | 151,909 |
| Bajaj Finance Ltd. | 3,257,000 | 142,222 |
| SVB Financial Group1 | 606,500 | 134,861 |
| Cannae Holdings, Inc.1,3 | 5,137,578 | 124,638 |
| NMI Holdings, Inc.1,3 | 4,775,127 | 123,533 |
| Ares Management Corp., Class A | 5,129,106 | 119,047 |
| First Republic Bank | 1,141,825 | 114,708 |
| Bharat Financial Inclusion Ltd.1 | 6,921,279 | 112,918 |
| Capitec Bank Holdings Ltd. | 1,123,983 | 105,163 |
| Trupanion, Inc.1,2,3 | 2,673,594 | 87,533 |
| L&T Finance Holdings Ltd. | 36,176,853 | 79,665 |
| The Bank of N.T. Butterfield & Son Ltd. | 2,082,958 | 74,737 |
| Green Dot Corp., Class A1 | 1,230,000 | 74,599 |
| CenterState Bank Corp. | 3,026,933 | 72,071 |
| Enstar Group Ltd.1 | 360,000 | 62,640 |
| Close Brothers Group PLC | 3,290,562 | 62,358 |
| Noah Holdings Ltd., Class A (ADR)1,2 | 1,250,797 | 60,614 |
| Seacoast Banking Corp. of Florida1 | 2,270,916 | 59,839 |
| VZ Holding AG | 224,647 | 58,770 |
| City Union Bank Ltd. | 19,845,727 | 58,685 |
| Shriram Transport Finance Co. Ltd. | 3,179,060 | 58,620 |
| AJ Bell PLC1,2 | 13,390,000 | 56,156 |
| Moelis & Co., Class A | 1,343,000 | 55,882 |
| HDFC Asset Management Co., Ltd. | 2,292,103 | 50,752 |
| Radian Group Inc. | 2,314,700 | 48,007 |
| White Mountains Insurance Group, Ltd. | 51,800 | 47,940 |
| HUB24 Ltd.2,3 | 4,377,158 | 43,046 |
| EFG International AG | 6,785,929 | 42,934 |
| Avanza Bank Holding AB | 951,619 | 40,839 |
SMALLCAP World Fund — Page 10 of 17
unaudited
Common stocks (continued)
Financials (continued) | Shares | Value
(000) |
| Bolsa Mexicana de Valores, SAB de CV, Series A | 19,701,110 | $40,762 |
| Netwealth Group Ltd.2 | 6,845,000 | 40,049 |
| Uzabase, Inc.1,2 | 1,390,300 | 37,884 |
| Indian Energy Exchange Ltd. | 15,103,655 | 35,974 |
| Focus Financial Partners Inc., Class A1 | 985,700 | 35,130 |
| Euronext NV | 540,039 | 34,227 |
| Cholamandalam Investment and Finance Co., Ltd. | 1,573,000 | 32,979 |
| Waddell & Reed Financial, Inc., Class A | 1,850,000 | 31,986 |
| Janus Henderson Group PLC | 1,200,041 | 29,977 |
| Umpqua Holdings Corp. | 1,785,500 | 29,461 |
| Sabre Insurance Group PLC | 7,780,000 | 28,981 |
| Fanhua Inc. (ADR)2 | 1,017,549 | 26,721 |
| Texas Capital Bancshares, Inc.1 | 482,054 | 26,315 |
| Greenhill & Co., Inc.3 | 1,169,700 | 25,160 |
| Legg Mason Partners Equity Fund | 915,285 | 25,051 |
| Transaction Capital Ltd. | 17,681,547 | 21,813 |
| Boston Private Financial Holdings, Inc. | 1,978,177 | 21,681 |
| Türkiye Garanti Bankasi AS | 14,352,206 | 21,468 |
| AURELIUS Equity Opportunities SE & Co. KGaA, non-registered shares2 | 465,169 | 21,175 |
| TMX Group Ltd. | 323,800 | 20,855 |
| MGIC Investment Corp.1 | 1,509,039 | 19,904 |
| TCS Group Holding PLC (GDR) | 994,736 | 17,647 |
| TCS Group Holding PLC (GDR)5 | 83,000 | 1,472 |
| Onex Corp. | 333,700 | 18,823 |
| PRA Group, Inc.1 | 670,000 | 17,963 |
| Artisan Partners Asset Management Inc., Class A | 705,000 | 17,745 |
| Luther Burbank Corp. | 1,750,000 | 17,675 |
| Nova Ljubljanska banka dd (GDR)1 | 1,253,700 | 17,157 |
| Hilltop Holdings Inc. | 900,000 | 16,425 |
| Hiscox Ltd. | 735,500 | 14,944 |
| Flow Traders NV, non-registered shares | 484,026 | 13,357 |
| First Hawaiian, Inc. | 456,500 | 11,892 |
| Third Point Reinsurance Ltd.1 | 921,468 | 9,565 |
| CIT Group Inc. | 195,000 | 9,354 |
| Cowen Inc., Class A1 | 640,000 | 9,274 |
| Eagle Bancorp, Inc.1 | 184,000 | 9,237 |
| Bank of Ireland Group PLC | 1,515,227 | 9,008 |
| TISCO Financial Group PCL, foreign registered | 1,965,750 | 5,466 |
| Habib Bank Ltd. | 5,000,000 | 4,707 |
| Permanent TSB Group Holdings PLC1 | 2,580,000 | 3,728 |
| Synovus Financial Corp. | 105,500 | 3,625 |
| IIFL Holdings Ltd. | 363,316 | 2,250 |
| Cox & Kings Financial Service Ltd.1,4,6 | 2,500,000 | 488 |
| | | 4,005,975 |
| Consumer staples 3.98% | | |
| Emmi AG3 | 311,300 | 273,863 |
| Raia Drogasil SA, ordinary nominative | 7,866,992 | 131,205 |
| Chongqing Fuling Zhacai Group Co., Ltd., Class A | 23,705,771 | 109,424 |
| a2 Milk Co., Ltd.1 | 10,678,000 | 103,266 |
| Lion Corp. | 4,761,000 | 100,091 |
| Varun Beverages Ltd. | 7,114,568 | 89,005 |
| Simply Good Foods Co., Class A1 | 3,935,000 | 81,022 |
| Dis-Chem Pharmacies Ltd. | 37,437,846 | 62,895 |
| GRUMA, SAB de CV, Series B | 5,353,120 | 54,661 |
SMALLCAP World Fund — Page 11 of 17
unaudited
Common stocks (continued)
Consumer staples (continued) | Shares | Value
(000) |
| Milbon Co., Ltd. | 1,118,200 | $51,960 |
| Treasury Wine Estates Ltd. | 4,840,000 | 51,309 |
| Davide Campari-Milano SpA | 4,700,000 | 46,132 |
| CCL Products (India) Ltd.3 | 10,642,173 | 43,782 |
| Fresh Del Monte Produce Inc. | 1,585,700 | 42,861 |
| COSMOS Pharmaceutical Corp. | 222,153 | 38,365 |
| Primo Water Corp.1 | 1,905,382 | 29,457 |
| Glanbia PLC | 1,500,000 | 29,345 |
| Century Pacific Food, Inc. | 94,597,400 | 28,176 |
| Masan Group Corp.1 | 6,993,490 | 25,407 |
| BGFretail Co., Ltd. | 131,000 | 25,217 |
| Kernel Holding SA | 1,642,578 | 21,049 |
| Emperador Inc. | 135,870,000 | 19,096 |
| HITEJINRO Co., Ltd. | 1,066,000 | 17,374 |
| TCI Co., Ltd. | 1,204,000 | 16,485 |
| PT Nippon Indosari Corpindo Tbk | 173,735,100 | 16,044 |
| Bakkafrost P/F | 321,000 | 15,884 |
| Osotspa PCL, foreign registered | 16,660,000 | 14,437 |
| United Spirits Ltd.1 | 1,780,114 | 14,233 |
| PriceSmart, Inc. | 225,314 | 13,267 |
| Prataap Snacks Ltd. | 943,900 | 12,490 |
| Pola Orbis Holdings Inc. | 359,500 | 11,450 |
| Sligro Food Group NV, non-registered shares | 307,304 | 11,014 |
| PZ Cussons PLC | 4,096,400 | 10,468 |
| Coca-Cola Icecek AS, Class C | 1,903,000 | 10,355 |
| Pigeon Corp. | 244,900 | 9,999 |
| Avenue Supermarts Ltd.1 | 417,313 | 8,862 |
| Nomad Foods Ltd.1 | 400,000 | 8,180 |
| Morinaga & Co., Ltd. | 178,400 | 7,734 |
| Avon Products, Inc.1 | 2,625,000 | 7,718 |
| Bid Corp. Ltd.2 | 330,857 | 6,833 |
| R.E.A. Holdings PLC1,3 | 2,162,000 | 5,674 |
| Ontex Group NV | 235,000 | 5,288 |
| Colgate-Palmolive (India) Ltd. | 267,378 | 4,856 |
| MTG Co., Ltd.2 | 233,209 | 4,840 |
| S Foods Inc. | 129,400 | 4,729 |
| Philip Morris CR AS | 6,472 | 4,444 |
| | | 1,700,246 |
| Materials 3.91% | | |
| Allegheny Technologies Inc.1,3 | 9,997,788 | 255,643 |
| Stella-Jones Inc. | 3,302,684 | 111,609 |
| Loma Negra Compania Industrial Argentina SA (ADR)1,3 | 8,131,698 | 89,042 |
| Valvoline Inc. | 4,001,382 | 74,266 |
| Royal Gold, Inc. | 784,000 | 71,289 |
| UPL Ltd. | 4,561,219 | 63,133 |
| Chr. Hansen Holding A/S | 622,000 | 63,047 |
| Lundin Mining Corp.2 | 12,651,000 | 58,694 |
| ACC Ltd. | 2,120,000 | 50,993 |
| Sirius Minerals PLC1,2 | 191,851,849 | 50,075 |
| Hudbay Minerals Inc. | 6,602,000 | 47,180 |
| Scapa Group PLC3 | 12,353,326 | 45,694 |
| Taiyo Nippon Sanso Corp. | 2,945,700 | 44,811 |
| CCL Industries Inc., Class B, nonvoting shares | 1,008,100 | 40,811 |
| Cleveland-Cliffs Inc.2 | 3,900,000 | 38,961 |
SMALLCAP World Fund — Page 12 of 17
unaudited
Common stocks (continued)
Materials (continued) | Shares | Value
(000) |
| PolyOne Corp. | 1,209,000 | $35,436 |
| Navin Fluorine International Ltd.3 | 3,202,000 | 32,706 |
| SIG Combibloc Group AG1 | 3,080,697 | 31,557 |
| Ingevity Corp.1 | 272,000 | 28,726 |
| LANXESS AG | 453,040 | 24,160 |
| Boral Ltd. | 6,965,000 | 22,700 |
| OCI NV1 | 804,000 | 22,096 |
| Symrise AG | 227,500 | 20,498 |
| Croda International PLC | 311,000 | 20,407 |
| Wienerberger AG | 870,700 | 18,489 |
| Arkema SA | 182,500 | 17,373 |
| Mayur Uniquoters Ltd.3 | 3,445,672 | 17,245 |
| Gulf Oil Lubricants India Ltd. | 1,400,337 | 17,017 |
| Indorama Ventures PCL, foreign registered | 10,114,000 | 15,855 |
| Steel Dynamics, Inc. | 443,700 | 15,649 |
| Mayr-Melnhof Karton AG, non-registered shares | 122,600 | 15,376 |
| Vidrala, SA, non-registered shares | 171,500 | 14,986 |
| Labrador Iron Ore Royalty Corp. | 681,000 | 14,972 |
| Kansai Paint Co., Ltd. | 773,200 | 14,727 |
| Aarti Industries Ltd. | 643,800 | 14,662 |
| Kenmare Resources PLC1 | 5,037,336 | 13,187 |
| CPMC Holdings Ltd.2 | 31,700,000 | 12,721 |
| China BlueChemical Ltd., Class H | 37,000,000 | 12,019 |
| Buzzi Unicem SpA | 560,058 | 11,456 |
| Elkem ASA1 | 3,195,000 | 11,321 |
| Fufeng Group Ltd.2 | 19,385,000 | 10,174 |
| Excelsior Mining Corp.1,2,3 | 12,868,000 | 9,822 |
| Venator Materials PLC1 | 1,538,000 | 8,644 |
| Tokai Carbon Co., Ltd.2 | 672,000 | 8,380 |
| Danakali Ltd.1,3 | 14,061,802 | 7,788 |
| Nevada Copper Corp.1,2 | 26,200,000 | 7,646 |
| Sandstorm Gold Ltd.1 | 1,361,300 | 7,460 |
| Wacker Chemie AG | 73,500 | 6,332 |
| Mountain Province Diamonds Inc.2 | 6,872,022 | 6,017 |
| Ardagh Group SA, Class A | 450,000 | 5,850 |
| Hummingbird Resources PLC1,3 | 20,359,300 | 5,502 |
| Gerdau SA (ADR) | 785,488 | 3,048 |
| BlueJay Mining PLC1,2 | 17,521,391 | 2,031 |
| Bacanora Lithium PLC1 | 2,438,925 | 691 |
| | | 1,669,974 |
| Communication services 3.16% | | |
| Iridium Communications Inc.1,3 | 7,666,388 | 202,699 |
| Iridium Communications Inc.1,3,5 | 636,132 | 16,819 |
| Entertainment One Ltd. | 22,363,000 | 130,138 |
| HUYA, Inc. (ADR)1,2 | 3,571,100 | 100,455 |
| Nexstar Media Group, Inc. | 825,000 | 89,405 |
| YY Inc., Class A (ADR)1 | 943,000 | 79,221 |
| Vonage Holdings Corp.1 | 6,216,999 | 62,419 |
| Lions Gate Entertainment Corp., Class A2 | 2,423,568 | 37,905 |
| Lions Gate Entertainment Corp., Class B | 1,522,277 | 22,986 |
| World Wrestling Entertainment, Inc., Class A | 672,000 | 58,316 |
| Yandex NV, Class A1 | 1,530,000 | 52,540 |
| Care.com, Inc.1,3 | 2,543,000 | 50,250 |
| Bandwidth Inc., Class A1 | 619,495 | 41,481 |
SMALLCAP World Fund — Page 13 of 17
unaudited
Common stocks (continued)
Communication services (continued) | Shares | Value
(000) |
| Eros International PLC, Class A1,2 | 4,130,711 | $37,755 |
| Entercom Communications Corp., Class A2 | 5,860,000 | 30,765 |
| Cogent Communications Holdings, Inc. | 565,000 | 30,651 |
| Megacable Holdings, SAB de CV, ordinary participation certificates | 5,611,175 | 26,038 |
| Daily Mail and General Trust PLC, Class A, nonvoting shares | 2,971,000 | 24,978 |
| Cable One, Inc. | 25,321 | 24,850 |
| VGI Global Media PCL, foreign registered | 81,538,000 | 23,253 |
| Altice Europe NV, Class A1,2 | 8,315,000 | 21,835 |
| CarGurus, Inc., Class A1 | 520,000 | 20,831 |
| Elang Mahkota Teknologi Tbk PT | 34,046,200 | 19,127 |
| Zillow Group, Inc., Class C, nonvoting shares1 | 525,000 | 18,239 |
| ProSiebenSat.1 Media SE | 990,000 | 14,126 |
| GCI Liberty, Inc., Class A1 | 232,600 | 12,935 |
| Eventbrite, Inc., Class A1,2 | 667,600 | 12,798 |
| Sharingtechnology Inc.1,2 | 903,500 | 12,432 |
| Euskaltel, SA, non-registered shares | 1,330,000 | 12,391 |
| Nordic Entertainment Group AB, Class B1 | 509,308 | 11,942 |
| HKBN Ltd. | 7,168,500 | 11,415 |
| THQ Nordic AB, Class B1,2 | 502,798 | 11,222 |
| Modern Times Group MTG AB, Class B | 509,308 | 6,524 |
| Gogo Inc.1,2 | 1,205,000 | 5,410 |
| Zegona Communications PLC | 3,300,304 | 4,406 |
| IMAX China Holding, Inc.2 | 1,706,400 | 4,243 |
| Tele Columbus AG1 | 2,232,000 | 4,056 |
| | | 1,346,856 |
| Energy 2.37% | | |
| Diamondback Energy, Inc. | 947,000 | 96,149 |
| Saipem SpA, Class S1 | 13,449,000 | 71,132 |
| Centennial Resource Development, Inc., Class A1,2 | 7,465,643 | 65,623 |
| Cactus, Inc., Class A1 | 1,700,399 | 60,534 |
| WorleyParsons Ltd. | 5,701,172 | 57,321 |
| SM Energy Co. | 3,246,000 | 56,772 |
| Altus Midstream Co., Class A1 | 9,033,655 | 53,299 |
| Magnolia Oil & Gas Corp., Class A1,5 | 4,000,000 | 48,000 |
| Petronet LNG Ltd. | 12,920,000 | 46,915 |
| Concho Resources Inc. | 407,500 | 45,216 |
| Whitecap Resources Inc.2 | 12,550,954 | 43,297 |
| Seven Generations Energy Ltd., Class A1 | 5,715,600 | 41,273 |
| Nine Energy Service, Inc.1,3 | 1,804,000 | 40,861 |
| Parsley Energy, Inc., Class A1 | 1,707,200 | 32,949 |
| Venture Global LNG, Inc., Series C1,4,5,6,7 | 4,240 | 25,440 |
| Peyto Exploration & Development Corp.2 | 4,595,000 | 24,035 |
| Keyera Corp.2 | 952,400 | 22,457 |
| Tellurian Inc.1,2 | 2,000,000 | 22,400 |
| Mullen Group Ltd. | 2,481,000 | 22,241 |
| Equitrans Midstream Corp. | 900,400 | 19,611 |
| Solaris Oilfield Infrastructure, Inc., Class A | 1,175,000 | 19,317 |
| NuVista Energy Ltd.1 | 5,965,000 | 19,194 |
| New Fortress Energy LLC, Class A1 | 1,600,000 | 18,688 |
| Savannah Petroleum PLC1,3 | 47,002,855 | 15,366 |
| Cosan Ltd., Class A | 1,145,000 | 13,271 |
| PetroTal Corp.1,3 | 34,775,000 | 5,855 |
| China Oilfield Services Ltd., Class H | 5,156,000 | 5,570 |
| Golar LNG Ltd. | 224,000 | 4,724 |
SMALLCAP World Fund — Page 14 of 17
unaudited
Common stocks (continued)
Energy (continued) | Shares | Value
(000) |
| Lekoil Ltd. (CDI)1,3 | 40,810,037 | $3,880 |
| Ensco PLC, Class A | 834,500 | 3,280 |
| Independence Contract Drilling, Inc.1 | 950,130 | 2,632 |
| Extraction Oil & Gas, Inc.1 | 410,000 | 1,734 |
| Victoria Oil & Gas PLC1 | 5,889,000 | 989 |
| | | 1,010,025 |
| Real estate 1.63% | | |
| WHA Corp. PCL3 | 991,071,920 | 131,789 |
| Embassy Office Parks REIT1,4,5,6 | 22,015,200 | 95,338 |
| MGM Growth Properties LLC REIT, Class A | 2,740,000 | 88,365 |
| Relo Group, Inc. | 2,328,500 | 65,340 |
| KKR Real Estate Finance Trust Inc. REIT | 2,118,600 | 42,414 |
| Redwood Trust, Inc. REIT | 2,562,000 | 41,376 |
| DoubleDragon Properties Corp.1 | 83,289,100 | 36,164 |
| Gaming and Leisure Properties, Inc. REIT | 800,000 | 30,856 |
| Hibernia REIT PLC | 16,260,000 | 24,368 |
| K. Wah International Holdings Ltd. | 33,743,028 | 20,805 |
| OUTFRONT Media Inc. REIT | 860,153 | 20,128 |
| Shurgard Self Storage SA1 | 555,000 | 18,326 |
| Tier REIT, Inc. | 638,299 | 18,294 |
| Metrovacesa, SA, non-registered shares1 | 1,263,000 | 15,301 |
| Foxtons Group PLC3 | 17,881,785 | 14,836 |
| São Carlos Empreendimentos e Participações S.A1 | 1,270,300 | 10,966 |
| BR Malls Participacoes SA, ordinary nominative | 2,173,500 | 6,978 |
| Instone Real Estate Group AG, non-registered shares1 | 237,771 | 5,335 |
| Soundwill Holdings Ltd. | 3,288,000 | 5,026 |
| Morguard Corp. | 23,400 | 3,480 |
| | | 695,485 |
| Utilities 0.10% | | |
| ENN Energy Holdings Ltd. | 3,825,000 | 36,983 |
| Pampa Energía SA (ADR)1 | 181,400 | 5,001 |
| Mytrah Energy Ltd.1,3,4,6 | 10,418,000 | 136 |
| | | 42,120 |
| Total common stocks(cost: $27,201,807,000) | | 38,853,854 |
Preferred securities 0.10%
Consumer discretionary 0.10% | | |
| Made.com Design Ltd., Series C-4, preferred shares1,4,6,7 | 2,067,967 | 41,667 |
| Consumer staples 0.00% | | |
| R.E.A. Holdings PLC 9.00%, preferred shares3 | 96,000 | 119 |
| Total preferred securities(cost: $41,513,000) | | 41,786 |
Rights & warrants 0.00%
Information technology 0.00% | | |
| Foursquare Labs, Inc., warrants, expire 20331,4,6,7 | 1,163,990 | 974 |
SMALLCAP World Fund — Page 15 of 17
unaudited
Rights & warrants (continued)
Communication services 0.00% | Shares | Value
(000) |
| VGI Global Media PCL FR W2, warrants, expire 20221 | 16,307,600 | $298 |
| Total rights & warrants(cost: $0) | | 1,272 |
Convertible stocks 0.21%
Health care 0.15% | | |
| Proteus Digital Health, Inc., Series G, 6.50% noncumulative convertible preferred4,6,7 | 3,044,139 | 48,097 |
| Cortexyme, Inc., Series B, 8.00% noncumulative convertible preferred3,4,6,7 | 4,244,602 | 15,000 |
| | | 63,097 |
| Information technology 0.06% | | |
| RealSelf, Inc., Series C, convertible preferred4,6,7 | 3,468,862 | 20,570 |
| Foursquare Labs, Inc., Series D, convertible preferred4,6,7 | 1,551,988 | 5,897 |
| | | 26,467 |
| Total convertible stocks(cost: $94,000,000) | | 89,564 |
Convertible bonds 0.02%
Consumer discretionary 0.02% | Principal amount
(000) | |
| Caesars Entertainment Corp., convertible notes, 5.00% 2024 | $6,954 | 9,901 |
| Total convertible bonds(cost: $13,315,000) | | 9,901 |
Short-term securities 9.55%
Money market investments 9.55% | Shares | |
| Capital Group Central Cash Fund | 37,078,827 | 3,707,141 |
| Goldman Sachs Financial Square Government Fund8 | 130,000,000 | 130,000 |
| Blackrock FedFund8 | 110,000,000 | 110,000 |
| Morgan Stanley Institutional Liquidity Funds - Government Portfolio8 | 100,000,000 | 100,000 |
| Invesco - Short-term Investments Trust - Government & Agency Portfolio8 | 23,967,684 | 23,968 |
| Fidelity Institutional Money Market Funds - Government Portfolio8 | 5,000,000 | 5,000 |
| | | 4,076,109 |
| Total short-term securities(cost: $4,076,476,000) | | 4,076,109 |
| Total investment securities 100.90%(cost: $31,427,111,000) | | 43,072,486 |
| Other assets less liabilities (0.90)% | | (384,455) |
| Net assets 100.00% | | $42,688,031 |
| 1 | Security did not produce income during the last 12 months. |
| 2 | All or a portion of this security was on loan. The total value of all such securities was $1,447,802,000, which represented 3.39% of the net assets of the fund. |
| 3 | Represents an affiliated company as defined under the Investment Company Act of 1940. |
| 4 | Valued under fair value procedures adopted by authority of the board of directors. The total value of all such securities was $361,507,000, which represented .85% of the net assets of the fund. |
| 5 | Acquired in a transaction exempt from registration under Rule 144A of the Securities Act of 1933. May be resold in the U.S. in transactions exempt from registration, normally to qualified institutional buyers. The total value of all such securities was $223,938,000, which represented .52% of the net assets of the fund. |
| 6 | Value determined using significant unobservable inputs. |
| 7 | Acquired through a private placement transaction exempt from registration under the Securities Act of 1933. May be subject to legal or contractual restrictions on resale. Further details on these holdings appear below. |
| 8 | Security purchased with cash collateral from securities on loan. |
SMALLCAP World Fund — Page 16 of 17
unaudited
| Private placement securities | Acquisition
date(s) | Cost
(000) | Value
(000) | Percent
of net
assets |
| Proteus Digital Health, Inc., Series G, 6.50% noncumulative convertible preferred | 5/6/2014-7/23/2014 | $40,000 | $48,097 | .11% |
| Agilon Health TopCo, Inc. | 1/4/2019 | 44,817 | 44,817 | .10 |
| Made.com Design Ltd., Series C-4, preferred shares | 3/2/2018 | 41,328 | 41,667 | .10 |
| Venture Global LNG, Inc., Series C | 5/1/2015 | 12,720 | 25,440 | .06 |
| Acerta Pharma BV | 5/7/2014 | 11,250 | 22,606 | .05 |
| RealSelf, Inc., Series C, convertible preferred | 4/18/2018 | 19,000 | 20,570 | .05 |
| Corindus Vascular Robotics, Inc. | 2/26/2019 | 15,000 | 18,540 | .04 |
| Cortexyme, Inc., Series B, 8.00% noncumulative convertible preferred | 5/23/2018 | 15,000 | 15,000 | .04 |
| Foursquare Labs, Inc., Series D, convertible preferred | 12/3/2013 | 20,000 | 5,897 | .01 |
| Foursquare Labs, Inc., warrants, expire 2033 | 12/3/2013 | — | 974 | .00 |
| Total private placement securities | | $ 219,115 | $ 243,608 | .56% |
| Key to abbreviations |
| ADR = American Depositary Receipts |
| CAD = Canadian dollars |
| CDI = CREST Depository Interest |
| GDR = Global Depositary Receipts |
| SDR = Swedish Depositary Receipts |
Additional financial disclosures are included in the fund’s current shareholder report and should be read in conjunction with this report.
Investments are not FDIC-insured, nor are they deposits of or guaranteed by a bank or any other entity, so they may lose value.
Investors should carefully consider investment objectives, risks, charges and expenses. This and other important information is contained in the fund prospectus and summary prospectus, which can be obtained from your financial professional and should be read carefully before investing. You may also call American Funds Service Company (AFS) at (800) 421-4225 or visit the American Funds website at americanfunds.com. Fund shares offered through American Funds Distributors, Inc.
All Capital Group trademarks mentioned are owned by The Capital Group Companies, Inc., an affiliated company or fund. All other company and product names mentioned are the property of their respective companies.
© 2019 Capital Group. All rights reserved.
| MFGEFPX-035-0519O-S66065 | SMALLCAP World Fund — Page 17 of 17 |
ITEM 7 – Disclosure of Proxy Voting Policies and Procedures for Closed-End Management Investment Companies
Not applicable to this Registrant, insofar as the Registrant is not a closed-end management investment company.
ITEM 8 – Portfolio Managers of Closed-End Management Investment Companies
Not applicable to this Registrant, insofar as the Registrant is not a closed-end management investment company.
ITEM 9 – Purchases of Equity Securities by Closed-End Management Investment Company and Affiliated Purchasers
Not applicable to this Registrant, insofar as the Registrant is not a closed-end management investment company.
ITEM 10 – Submission of Matters to a Vote of Security Holders
There have been no material changes to the procedures by which shareholders may recommend nominees to the Registrant’s board of directors since the Registrant last submitted a proxy statement to its shareholders. The procedures are as follows. The Registrant has a nominating and governance committee comprised solely of persons who are not considered ‘‘interested persons’’ of the Registrant within the meaning of the Investment Company Act of 1940, as amended. The committee periodically reviews such issues as the board’s composition, responsibilities, committees, compensation and other relevant issues, and recommends any appropriate changes to the full board of directors. While the committee normally is able to identify from its own resources an ample number of qualified candidates, it will consider shareholder suggestions of persons to be considered as nominees to fill future vacancies on the board. Such suggestions must be sent in writing to the nominating and governance committee of the Registrant, c/o the Registrant’s Secretary, and must be accompanied by complete biographical and occupational data on the prospective nominee, along with a written consent of the prospective nominee for consideration of his or her name by the nominating and governance committee.
ITEM 11 – Controls and Procedures
| (a) | The Registrant’s Principal Executive Officer and Principal Financial Officer have concluded, based on their evaluation of the Registrant’s disclosure controls and procedures (as such term is defined in Rule 30a-3 under the Investment Company Act of 1940), that such controls and procedures are adequate and reasonably designed to achieve the purposes described in paragraph (c) of such rule. |
| | |
| (b) | There were no changes in the Registrant’s internal controls over financial reporting (as defined in Rule 30a-3(d) under the Investment Company Act of 1940) that occurred during the Registrant’s semi-annual period covered by this report that has materially affected, or is reasonably likely to materially affect, the Registrant’s internal control over financial reporting. |
ITEM 12 – Exhibits
| (a)(1) | Not applicable for filing of semi-annual reports to shareholders. |
| | |
| (a)(2) | The certifications required by Rule 30a-2 of the Investment Company Act of 1940 and Sections 302 and 906 of the Sarbanes-Oxley Act of 2002 are attached as exhibits hereto. |
SIGNATURES
Pursuant to the requirements of the Securities Exchange Act of 1934 and the Investment Company Act of 1940, the Registrant has duly caused this report to be signed on its behalf by the undersigned, thereunto duly authorized.
| | SMALLCAP WORLD FUND, INC. |
| | |
| | By__/s/ Paul F. Roye____________________ |
| | Paul F. Roye, Executive Vice President and Principal Executive Officer |
| | |
| | Date: May 31, 2019 |
Pursuant to the requirements of the Securities Exchange Act of 1934 and the Investment Company Act of 1940, this report has been signed below by the following persons on behalf of the Registrant and in the capacities and on the dates indicated.
| By__/s/ Paul F. Roye_________________ |
Paul F. Roye, Executive Vice President and Principal Executive Officer |
| |
| Date: May 31, 2019 |
| By ___/s/ Brian D. Bullard __________ |
Brian D. Bullard, Treasurer and Principal Financial Officer |
| |
| Date: May 31, 2019 |