UNITED STATES
SECURITIES AND EXCHANGE COMMISSION
Washington, D.C. 20549
FORM N-CSR
Certified Shareholder Report of
Registered Management Investment Companies
Investment Company Act File Number: 811-05888
SMALLCAP World Fund, Inc.
(Exact Name of Registrant as Specified in Charter)
6455 Irvine Center Drive
Irvine, California 92618
(Address of Principal Executive Offices)
Registrant's telephone number, including area code: (949) 975-5000
Date of fiscal year end: September 30
Date of reporting period: March 31, 2020
Hong T. Le
SMALLCAP World Fund, Inc.
6455 Irvine Center Drive
Los Angeles, California 90071
(Name and Address of Agent for Service)
ITEM 1 – Reports to Stockholders
SMALLCAP World Fund® Semi-annual report
for the six months ended
March 31, 2020 |  |

We believe small
companies around
the world can provide
opportunities for
investors
Beginning January 1, 2021, as permitted by regulations adopted by the U.S. Securities and Exchange Commission, we intend to no longer mail paper copies of the fund’s shareholder reports, unless specifically requested from American Funds or your financial intermediary, such as a broker-dealer or bank. Instead, the reports will be made available on the Capital Group website (capitalgroup.com); you will be notified by mail and provided with a website link to access the report each time a report is posted. If you have already elected to receive shareholder reports electronically, you will not be affected by this change and do not need to take any action. If you prefer to receive shareholder reports and other communications electronically, you may update your mailing preferences with your financial intermediary, or enroll in e-delivery at capitalgroup.com (for accounts held directly with the fund).
You may elect to receive paper copies of all future reports free of charge. If you invest through a financial intermediary, you may contact your financial intermediary to request that you continue to receive paper copies of your shareholder reports. If you invest directly with the fund, you may inform American Funds that you wish to continue receiving paper copies of your shareholder reports by contacting us at (800) 421-4225. Your election to receive paper reports will apply to all funds held with American Funds or through your financial intermediary.
SMALLCAP World Fund seeks to provide you with long-term growth of capital.
This fund is one of more than 40 offered by Capital Group, home of American Funds, one of the nation’s largest mutual fund families. For nearly 90 years, Capital Group has invested with a long-term focus based on thorough research and attention to risk.
Fund results shown in this report, unless otherwise indicated, are for Class A shares at net asset value. If a sales charge (maximum 5.75%) had been deducted, the results would have been lower. Results are for past periods and are not predictive of results for future periods. Current and future results may be lower or higher than those shown. Prices and returns will vary, so investors may lose money. Investing for short periods makes losses more likely. For current information and month-end results, visit capitalgroup.com.
Here are the average annual total returns on a $1,000 investment with all distributions reinvested for periods ended March 31, 2020:
| Class A shares | 1 year | 5 years | 10 years |
| | | | |
| Reflecting 5.75% maximum sales charge | –17.35% | 2.39% | 6.66% |
For other share class results, visit capitalgroup.com and americanfundsretirement.com.
The total annual fund operating expense ratio is 1.08% for Class A shares as of the prospectus dated December 1, 2019. The expense ratio is restated to reflect current fees.
Investment results assume all distributions are reinvested and reflect applicable fees and expenses. When applicable, investment results reflect fee waivers, without which results would have been lower. Visit capitalgroup.com for more information.
Investing outside the United States may be subject to risks, such as currency fluctuations and political instability. These risks may be heightened in connection with investments in developing countries. Investing in small-capitalization stocks can involve greater risk than is customarily associated with investing in stocks of larger, more established companies. Refer to the fund prospectus and the Risk Factors section of this report for more information on these and other risks associated with investing in the fund.
Investments are not FDIC-insured, nor are they deposits of or guaranteed by a bank or any other entity, so they may lose value.
Fellow investors:
Shown in the table below are SMALLCAP World Fund’s results for the six months ended March 31, 2020. Also shown are the results of its primary benchmark and peer group.
For additional information about the fund, its investment results, holdings and portfolio managers, visit capitalgroup.com/individual/investments/fund/smcwx. You can also access information about Capital Group’s American Funds and read our insights about the markets, retirement, saving for college, investing fundamentals and more atcapitalgroup.com.
Results at a glance
For periods ended March 31, 2020, with all distributions reinvested
| | | Cumulative
total returns | | Average annual total returns |
| | | 6 months | | 1 year | | 5 years | | 10 years | | Lifetime
(since 4/30/90) |
| | | | | | | | | | | |
| SMALLCAP World Fund (Class A shares) | | | –14.03 | % | | | –12.32 | % | | | 3.61 | % | | | 7.30 | % | | | 8.79 | % |
| MSCI All Country World Small Cap Index* | | | –23.39 | | | | –23.06 | | | | –0.49 | | | | 5.10 | | | | 6.80 | |
| Lipper Global Small-/Mid-Cap Funds Average† | | | –19.29 | | | | –18.24 | | | | 1.08 | | | | 5.72 | | | | 7.94 | |
| | |
| * | The MSCI All Country World Small Cap Index is unmanaged and, therefore, has no expenses. Investors cannot invest directly in an index. Results reflect dividends net of withholding taxes. Because the index was not in existence when the fund’s Class A shares were first sold, cumulative returns through May 31, 1994, reflect the returns of the S&P Developed <$1.2 Billion Index. MSCI source: MSCI. S&P source: S&P Dow Jones Indices LLC. |
| † | Source: Refinitiv Lipper. Lipper averages reflect the current composition of all eligible mutual funds (all share classes) within a given category. Lipper categories are dynamic and averages may have few funds, especially over longer periods. To see the number of funds included in the Lipper category for each fund’s lifetime, please see the Quarterly Statistical Update available on our website. |
| Summary investment portfolio March 31, 2020 | unaudited |
| | |
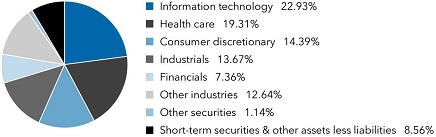
| Industry sector diversification | Percent of net assets |
| Country diversification by domicile | | Percent of
net assets |
| United States | | | 44.94 | % |
| Eurozone* | | | 8.80 | |
| United Kingdom | | | 6.65 | |
| Japan | | | 5.68 | |
| China | | | 3.82 | |
| India | | | 3.80 | |
| Sweden | | | 3.73 | |
| Brazil | | | 2.25 | |
| Switzerland | | | 2.12 | |
| Other countries | | | 9.65 | |
| Short-term securities & other assets less liabilities | | | 8.56 | |
| * | Countries using the euro as a common currency; those represented in the fund’s portfolio are Belgium, Finland, France, Germany, Greece, Ireland, Italy, the Netherlands, Slovenia and Spain. |
| Common stocks 90.30% | | Shares | | | Value
(000) | |
| Information technology 22.93% | | | | | | | | |
| RingCentral, Inc., Class A1 | | | 4,552,084 | | | $ | 964,632 | |
| MongoDB, Inc., Class A1 | | | 2,983,206 | | | | 407,327 | |
| DocuSign, Inc.1 | | | 2,880,937 | | | | 266,199 | |
| Smartsheet Inc., Class A1,2 | | | 5,990,800 | | | | 248,678 | |
| Alteryx, Inc., Class A1 | | | 2,244,100 | | | | 213,571 | |
| Paycom Software, Inc.1 | | | 982,669 | | | | 198,509 | |
| SimCorp AS2,3 | | | 2,337,850 | | | | 196,763 | |
| Network International Holdings PLC1,2,3 | | | 37,313,163 | | | | 183,121 | |
| TeamViewer AG1,3 | | | 4,461,586 | | | | 178,530 | |
| Cree, Inc.1 | | | 4,988,138 | | | | 176,879 | |
| Netcompany Group AS, non-registered shares1,2,3 | | | 3,279,837 | | | | 152,760 | |
| EPAM Systems, Inc.1 | | | 817,200 | | | | 151,721 | |
| Net One Systems Co., Ltd.2,3 | | | 6,879,958 | | | | 143,109 | |
| Ceridian HCM Holding Inc.1 | | | 2,851,343 | | | | 142,767 | |
| Inphi Corp.1 | | | 1,718,754 | | | | 136,074 | |
| Alarm.Com Holdings, Inc.1,2 | | | 3,208,000 | | | | 124,823 | |
| CANCOM SE, non-registered shares2,3 | | | 2,878,806 | | | | 123,498 | |
| Square, Inc., Class A1 | | | 2,274,730 | | | | 119,150 | |
| | | Shares | | | Value
(000) | |
| Kingdee International Software Group Co. Ltd.3 | | | 86,321,093 | | | $ | 114,597 | |
| Bottomline Technologies, Inc.1,2 | | | 3,112,000 | | | | 114,055 | |
| WiseTech Global Ltd.3,4 | | | 10,863,808 | | | | 113,285 | |
| Avalara, Inc.1 | | | 1,506,299 | | | | 112,370 | |
| Other securities | | | | | | | 3,994,847 | |
| | | | | | | | 8,577,265 | |
| | | | | | | | | |
| Health care 19.31% | | | | | | | | |
| Insulet Corp.1,2 | | | 3,878,435 | | | | 642,579 | |
| Molina Healthcare, Inc.1 | | | 2,579,100 | | | | 360,326 | |
| Haemonetics Corp.1,2 | | | 2,524,222 | | | | 251,564 | |
| Centene Corp.1 | | | 3,969,978 | | | | 235,856 | |
| NovoCure Ltd.1 | | | 3,480,597 | | | | 234,383 | |
| Notre Dame Intermédica Participações SA | | | 26,440,629 | | | | 228,781 | |
| Fisher & Paykel Healthcare Corp. Ltd.3 | | | 11,321,435 | | | | 205,232 | |
| DexCom, Inc.1 | | | 720,300 | | | | 193,955 | |
| Cansino Biologics Inc., Class H1,2,3,4 | | | 10,552,600 | | | | 169,768 | |
| Allakos Inc.1,2,4 | | | 3,802,533 | | | | 169,175 | |
| Mani, Inc.2,3 | | | 6,830,382 | | | | 167,445 | |
| GW Pharmaceuticals PLC (ADR)1,2,4 | | | 1,703,090 | | | | 149,140 | |
| Amplifon SpA3 | | | 6,641,200 | | | | 136,269 | |
| Teladoc Health, Inc.1,4 | | | 770,000 | | | | 119,358 | |
| Integra LifeSciences Holdings Corp.1 | | | 2,632,175 | | | | 117,579 | |
| Other securities | | | | | | | 3,841,381 | |
| | | | | | | | 7,222,791 | |
| | | | | | | | | |
| Consumer discretionary 14.39% | | | | | | | | |
| Evolution Gaming Group AB2,3 | | | 10,849,830 | | | | 369,410 | |
| Just Eat Takeaway (EUR denominated)1,3 | | | 2,858,900 | | | | 215,519 | |
| Ocado Group PLC1,3 | | | 11,903,000 | | | | 179,737 | |
| Dollarama Inc. | | | 6,015,000 | | | | 166,862 | |
| frontdoor, inc.1,2 | | | 4,742,274 | | | | 164,936 | |
| Trainline PLC1,2,3 | | | 38,454,440 | | | | 160,843 | |
| Helen of Troy Ltd.1 | | | 983,400 | | | | 141,639 | |
| Floor & Decor Holdings, Inc., Class A1 | | | 4,356,200 | | | | 139,790 | |
| Luckin Coffee Inc., Class A (ADR)1,2,4 | | | 5,080,724 | | | | 138,145 | |
| Strategic Education, Inc. | | | 864,000 | | | | 120,753 | |
| TopBuild Corp.1 | | | 1,593,600 | | | | 114,166 | |
| Other securities | | | | | | | 3,470,839 | |
| | | | | | | | 5,382,639 | |
| | | | | | | | | |
| Industrials 13.67% | | | | | | | | |
| IMCD NV2,3 | | | 3,290,469 | | | | 234,011 | |
| BELIMO Holding AG3 | | | 30,114 | | | | 195,358 | |
| Spirax-Sarco Engineering PLC3 | | | 1,769,028 | | | | 178,703 | |
| Nihon M&A Center Inc.3 | | | 6,387,180 | | | | 174,659 | |
| NIBE Industrier AB, Class B3 | | | 11,926,808 | | | | 173,659 | |
| BWX Technologies, Inc. | | | 3,330,650 | | | | 162,236 | |
| Harmonic Drive Systems Inc.3,4 | | | 3,146,300 | | | | 137,464 | |
| MonotaRO Co., Ltd.3 | | | 5,140,700 | | | | 136,596 | |
| Meggitt PLC3 | | | 37,003,226 | | | | 134,049 | |
| Rexnord Corp. | | | 5,833,000 | | | | 132,234 | |
| Marel hf. (ISK denominated)3 | | | 30,252,308 | | | | 118,722 | |
| Common stocks (continued) | | Shares | | | Value
(000) | |
| Industrials (continued) | | | | | | | | |
| Marel hf. (EUR denominated)3 | | | 1,166,667 | | | $ | 4,501 | |
| VAT Group AG3 | | | 872,000 | | | | 120,809 | |
| I.M.A. Industria Macchine Automatiche SpA3,4 | | | 1,994,005 | | | | 116,853 | |
| Other securities | | | | | | | 3,095,695 | |
| | | | | | | | 5,115,549 | |
| | | | | | | | | |
| Financials 7.36% | | | | | | | | |
| Kotak Mahindra Bank Ltd.3 | | | 15,337,852 | | | | 259,569 | |
| Cannae Holdings, Inc.1,2 | | | 6,211,271 | | | | 208,015 | |
| Ares Management Corp., Class A | | | 5,174,776 | | | | 160,056 | |
| RenaissanceRe Holdings Ltd. | | | 1,058,600 | | | | 158,070 | |
| Other securities | | | | | | | 1,967,275 | |
| | | | | | | | 2,752,985 | |
| | | | | | | | | |
| Consumer staples 4.37% | | | | | | | | |
| Emmi AG2,3 | | | 317,072 | | | | 289,878 | |
| Grocery Outlet Holding Corp.1,2 | | | 5,059,382 | | | | 173,739 | |
| Raia Drogasil SA, ordinary nominative | | | 6,681,392 | | | | 130,964 | |
| Simply Good Foods Co., Class A1,2 | | | 6,151,000 | | | | 118,468 | |
| Other securities | | | | | | | 923,550 | |
| | | | | | | | 1,636,599 | |
| | | | | | | | | |
| Communication services 3.38% | | | | | | | | |
| Iridium Communications Inc.1,2 | | | 7,201,932 | | | | 160,819 | |
| Iridium Communications Inc.1,2,5 | | | 636,132 | | | | 14,205 | |
| New York Times Co., Class A | | | 4,015,100 | | | | 123,304 | |
| Bandwidth Inc., Class A1,4 | | | 1,806,971 | | | | 121,591 | |
| Other securities | | | | | | | 845,789 | |
| | | | | | | | 1,265,708 | |
| | | | | | | | | |
| Materials 2.01% | | | | | | | | |
| Other securities | | | | | | | 751,491 | |
| | | | | | | | | |
| Real estate 1.98% | | | | | | | | |
| Embassy Office Parks REIT3 | | | 30,015,600 | | | | 138,932 | |
| Other securities | | | | | | | 601,042 | |
| | | | | | | | 739,974 | |
| | | | | | | | | |
| Other 0.90% | | | | | | | | |
| Other securities | | | | | | | 335,220 | |
| | | | | | | | | |
| Total common stocks (cost: $28,249,818,000) | | | | | | | 33,780,221 | |
| | | | | | | | | |
| Preferred securities 0.93% | | | | | | | | |
| Other 0.93% | | | | | | | | |
| Other securities | | | | | | | 349,972 | |
| | | | | | | | | |
| Total preferred securities (cost: $286,158,000) | | | | | | | 349,972 | |
| Rights & warrants 0.00% | | Shares | | | Value
(000) | |
| Other 0.00% | | | | | | | | |
| Other securities | | | | | | $ | 896 | |
| | | | | | | | | |
| Total rights & warrants (cost: $0) | | | | | | | 896 | |
| | | | | | | | | |
| Convertible stocks 0.20% | | | | | | | | |
| Other 0.20% | | | | | | | | |
| Other securities | | | | | | | 73,164 | |
| | | | | | | | | |
| Total convertible stocks (cost: $120,234,000) | | | | | | | 73,164 | |
| | | | | | | | | |
| Bonds, notes & other debt instruments 0.01% | | Principal amount
(000) | | | | | |
| Corporate bonds & notes 0.01% | | | | | | | | |
| Other securities | | | | | | | 3,109 | |
| | | | | | | | | |
| Total bonds, notes & other debt instruments (cost: $5,023,000) | | | | | | | 3,109 | |
| | | | | | | | | |
| Short-term securities 9.36% | | Shares | | | | | |
| Money market investments 9.36% | | | | | | | | |
| Capital Group Central Cash Fund 1.00%6 | | | 30,929,807 | | | | 3,094,218 | |
| Goldman Sachs Financial Square Government Fund 0.34%6,7 | | | 250,000,000 | | | | 250,000 | |
| Blackrock FedFund 0.33%6,7 | | | 70,000,000 | | | | 70,000 | |
| RBC U.S. Government Money Market Fund 0.82%6,7 | | | 44,000,000 | | | | 44,000 | |
| Morgan Stanley Institutional Liquidity Funds - Government Portfolio 0.25%6,7 | | | 19,500,000 | | | | 19,500 | |
| Invesco Short-term Investments Trust - Government & Agency Portfolio 0.43%6,7 | | | 18,121,645 | | | | 18,122 | |
| State Street Institutional U.S. Government Money Market Fund 0.32%6,7 | | | 5,000,000 | | | | 5,000 | |
| Fidelity Institutional Money Market Funds - Government Portfolio 0.30%6,7 | | | 500,000 | | | | 500 | |
| | | | | | | | 3,501,340 | |
| | | | | | | | | |
| Total short-term securities (cost: $3,500,017,000) | | | | | | | 3,501,340 | |
| Total investment securities 100.80% (cost: $32,161,250,000) | | | | | | | 37,708,702 | |
| Other assets less liabilities (0.80)% | | | | | | | (298,191 | ) |
| | | | | | | | | |
| Net assets 100.00% | | | | | | $ | 37,410,511 | |
This summary investment portfolio is designed to streamline the report and help investors better focus on the fund’s principal holdings. See the inside back cover for details on how to obtain a complete schedule of portfolio holdings.
“Other securities” includes all issues that are not disclosed separately in the summary investment portfolio.
Investments in affiliates
A company is an affiliate of the fund under the Investment Company Act of 1940 if the fund’s holdings represent 5% or more of the outstanding voting shares of that company. The value of the fund’s affiliated-company holdings is either shown in the summary investment portfolio or included in the value of “Other securities” under the respective industry sectors. Further details on these holdings and related transactions during the six months ended March 31, 2020, appear below.
| | | Beginning
shares | | | Additions | | | Reductions | | | Ending
shares | |
| Common stocks 20.57% | | | | | | | | | | | | | | | | |
| Information technology 4.86% | | | | | | | | | | | | | | | | |
| Smartsheet Inc., Class A1 | | | 3,905,000 | | | | 2,085,800 | | | | — | | | | 5,990,800 | |
| SimCorp AS3 | | | 2,199,151 | | | | 150,000 | | | | 11,301 | | | | 2,337,850 | |
| Network International Holdings PLC1,3 | | | 34,351,542 | | | | 2,961,621 | | | | — | | | | 37,313,163 | |
| Netcompany Group AS, non-registered shares1,3 | | | 3,199,913 | | | | 225,000 | | | | 145,076 | | | | 3,279,837 | |
| Net One Systems Co., Ltd.3 | | | 5,194,958 | | | | 1,685,000 | | | | — | | | | 6,879,958 | |
| Alarm.Com Holdings, Inc.1 | | | 2,520,700 | | | | 687,300 | | | | — | | | | 3,208,000 | |
| CANCOM SE, non-registered shares3 | | | 1,989,634 | | | | 1,012,931 | | | | 123,759 | | | | 2,878,806 | |
| Bottomline Technologies, Inc.1 | | | 2,648,000 | | | | 464,000 | | | | — | | | | 3,112,000 | |
| Carel Industries SpA3 | | | 7,820,849 | | | | 179,151 | | | | — | | | | 8,000,000 | |
| Yext, Inc.1 | | | 8,661,274 | | | | — | | | | — | | | | 8,661,274 | |
| Fortnox AB3 | | | 4,550,903 | | | | 646,459 | | | | 414,616 | | | | 4,782,746 | |
| Megaport Ltd.1,3 | | | 10,773,000 | | | | 2,885,000 | | | | 3,130,000 | | | | 10,528,000 | |
| SHIFT Inc.1,3,4 | | | — | | | | 846,500 | | | | — | | | | 846,500 | |
| Cardtronics PLC, Class A1 | | | 1,275,000 | | | | 1,027,000 | | | | — | | | | 2,302,000 | |
| Bravura Solutions Ltd.3 | | | 19,125,000 | | | | — | | | | — | | | | 19,125,000 | |
| eMemory Technology Inc.3 | | | 4,024,334 | | | | — | | | | — | | | | 4,024,334 | |
| Faraday Technology Corp.3 | | | 15,370,000 | | | | — | | | | — | | | | 15,370,000 | |
| Douzone Bizon Co., Ltd.3,8 | | | 2,015,058 | | | | — | | | | 621,200 | | | | 1,393,858 | |
| Endurance International Group Holdings, Inc.1,8 | | | 9,707,399 | | | | — | | | | 5,522,979 | | | | 4,184,420 | |
| SUNeVision Holdings Ltd.3,8 | | | 128,214,000 | | | | — | | | | 40,000,000 | | | | 88,214,000 | |
| Humanica PCL8 | | | 44,000,400 | | | | — | | | | 44,000,400 | | | | — | |
| Jenoptik AG3,8 | | | 4,561,200 | | | | — | | | | 4,070,349 | | | | 490,851 | |
| Accesso Technology Group PLC1,3,8 | | | 2,185,500 | | | | 25,925 | | | | 2,211,425 | | | | — | |
| Sansan, Inc.1,3,8 | | | 1,596,800 | | | | — | | | | 1,026,400 | | | | 570,400 | |
| Tri Chemical Laboratories Inc.3,4,8 | | | — | | | | 440,200 | | | | 143,800 | | | | 296,400 | |
| Health care 6.39% | | | | | | | | | | | | | | | | |
| Insulet Corp.1 | | | 4,456,019 | | | | — | | | | 577,584 | | | | 3,878,435 | |
| Haemonetics Corp.1 | | | 1,974,000 | | | | 550,222 | | | | — | | | | 2,524,222 | |
| Cansino Biologics Inc., Class H1,3,4 | | | 10,370,800 | | | | 181,800 | | | | — | | | | 10,552,600 | |
| Allakos Inc.1,4 | | | 3,859,959 | | | | 32,974 | | | | 90,400 | | | | 3,802,533 | |
| Mani, Inc.3 | | | 4,889,800 | | | | 1,940,582 | | | | — | | | | 6,830,382 | |
| GW Pharmaceuticals PLC (ADR)1,4 | | | 1,915,345 | | | | 126,000 | | | | 338,255 | | | | 1,703,090 | |
| Cortexyme, Inc.1,4 | | | 512,157 | | | | 1,739,145 | | | | — | | | | 2,251,302 | |
| Cortexyme, Inc.1,3,9 | | | — | | | | 76,528 | | | | — | | | | 76,528 | |
| Cortexyme, Inc.1,3,5 | | | 1,560,515 | | | | — | | | | 1,560,515 | | | | — | |
| Fagron NV3 | | | 2,630,255 | | | | 1,834,729 | | | | — | | | | 4,464,984 | |
| New Frontier Health Corp., Class A1,5 | | | — | | | | 9,313,186 | | | | — | | | | 9,313,186 | |
| Nakanishi Inc.3 | | | 5,332,700 | | | | — | | | | — | | | | 5,332,700 | |
| Silk Road Medical, Inc.1 | | | — | | | | 2,085,600 | | | | — | | | | 2,085,600 | |
| Revance Therapeutics, Inc.1 | | | 2,010,000 | | | | 1,281,900 | | | | — | | | | 3,291,900 | |
| Metropolis Healthcare Ltd.3 | | | 2,809,350 | | | | 67,770 | | | | 96,374 | | | | 2,780,746 | |
| CryoLife, Inc.1 | | | 1,125,904 | | | | 1,544,010 | | | | — | | | | 2,669,914 | |
| CellaVision AB, non-registered shares3 | | | 1,221,000 | | | | 329,300 | | | | — | | | | 1,550,300 | |
| Pacific Biosciences of California, Inc.1 | | | — | | | | 12,242,300 | | | | — | | | | 12,242,300 | |
| Revenio Group Oyj, non-registered shares1,3 | | | 1,713,820 | | | | — | | | | 308,000 | | | | 1,405,820 | |
| Cellectis SA (ADR)1 | | | 1,529,736 | | | | 684,600 | | | | — | | | | 2,214,336 | |
| | | Beginning
shares | | | Additions | | | Reductions | | | Ending
shares | |
| Cellectis SA, non-registered shares1,3,4 | | | 1,181,240 | | | | — | | | | — | | | | 1,181,240 | |
| Adaptimmune Therapeutics PLC (ADR)1,4 | | | 7,419,700 | | | | 1,904,200 | | | | — | | | | 9,323,900 | |
| Autolus Therapeutics PLC (ADR)1,4 | | | 2,377,718 | | | | 1,800,776 | | | | — | | | | 4,178,494 | |
| Precision BioSciences, Inc.1 | | | 625,000 | | | | 3,437,000 | | | | — | | | | 4,062,000 | |
| Xenon Pharmaceuticals Inc.1,4 | | | 2,019,226 | | | | — | | | | — | | | | 2,019,226 | |
| Flexion Therapeutics, Inc.1,4 | | | 2,510,700 | | | | — | | | | — | | | | 2,510,700 | |
| WIN-Partners Co., Ltd.3 | | | 1,817,600 | | | | 118,400 | | | | — | | | | 1,936,000 | |
| NuCana PLC (ADR)1,4 | | | 2,574,816 | | | | — | | | | — | | | | 2,574,816 | |
| Neovasc Inc.1 | | | 577,857 | | | | 312,745 | | | | — | | | | 890,602 | |
| CONMED Corp.8 | | | 2,258,462 | | | | — | | | | 1,165,462 | | | | 1,093,000 | |
| Diplomat Pharmacy, Inc.1,8 | | | 4,334,441 | | | | — | | | | 4,334,441 | | | | — | |
| Natera, Inc.1,8 | | | 4,770,580 | | | | — | | | | 2,675,000 | | | | 2,095,580 | |
| iRhythm Technologies, Inc.1,8 | | | 1,456,450 | | | | 134,000 | | | | 559,800 | | | | 1,030,650 | |
| Osstem Implant Co., Ltd.1,8 | | | 1,134,274 | | | | — | | | | 1,134,274 | | | | — | |
| Clovis Oncology, Inc.1,4,8 | | | 3,562,000 | | | | — | | | | 3,443,000 | | | | 119,000 | |
| Neuronetics, Inc.1,8 | | | 1,464,300 | | | | — | | | | 1,464,300 | | | | — | |
| Rubius Therapeutics, Inc.1,8 | | | 3,478,792 | | | | 2,114,604 | | | | 3,414,402 | | | | 2,178,994 | |
| Corindus Vascular Robotics, Inc.1,8 | | | 10,872,716 | | | | — | | | | 10,872,716 | | | | — | |
| Consumer discretionary 3.36% | | | | | | | | | | | | | | | | |
| Evolution Gaming Group AB3 | | | 8,937,960 | | | | 3,336,883 | | | | 1,425,013 | | | | 10,849,830 | |
| frontdoor, inc.1 | | | 4,379,000 | | | | 453,000 | | | | 89,726 | | | | 4,742,274 | |
| Trainline PLC1,3 | | | 33,352,068 | | | | 8,083,372 | | | | 2,981,000 | | | | 38,454,440 | |
| Luckin Coffee Inc., Class A (ADR)1,4 | | | 4,835,924 | | | | 244,800 | | | | — | | | | 5,080,724 | |
| YETI Holdings, Inc.1 | | | 1,152,200 | | | | 3,637,949 | | | | — | | | | 4,790,149 | |
| Domino’s Pizza Group PLC3 | | | 27,307,815 | | | | 3,035,000 | | | | 4,000,000 | | | | 26,342,815 | |
| zooplus AG, non-registered shares1,3,4 | | | 505,688 | | | | 65,856 | | | | — | | | | 571,544 | |
| Shop Apotheke Europe NV, non-registered shares1,3,4 | | | 804,857 | | | | — | | | | — | | | | 804,857 | |
| Bygghemma Group First AB1,3,4 | | | 2,980,102 | | | | 3,689,898 | | | | — | | | | 6,670,000 | |
| AcadeMedia AB3 | | | 4,955,083 | | | | 2,942,292 | | | | — | | | | 7,897,375 | |
| Musti Group Oyj1,3 | | | — | | | | 2,179,804 | | | | — | | | | 2,179,804 | |
| Lands’ End, Inc.1 | | | 2,200,000 | | | | 25,000 | | | | — | | | | 2,225,000 | |
| Beazer Homes USA, Inc.1 | | | 1,659,813 | | | | — | | | | — | | | | 1,659,813 | |
| BNN Technology PLC1,3,10 | | | 19,007,000 | | | | — | | | | — | | | | 19,007,000 | |
| Dine Brands Global, Inc.8 | | | 615,599 | | | | 240,000 | | | | 675,599 | | | | 180,000 | |
| TopBuild Corp.1,8 | | | 1,783,600 | | | | — | | | | 190,000 | | | | 1,593,600 | |
| Hostelworld Group PLC8 | | | 6,518,763 | | | | — | | | | 6,518,763 | | | | — | |
| MIPS AB3,8 | | | 1,396,751 | | | | — | | | | 201,751 | | | | 1,195,000 | |
| Delta Corp. Ltd.3,8 | | | 14,022,238 | | | | 3,700,000 | | | | 11,535,287 | | | | 6,186,951 | |
| Tile Shop Holdings, Inc.8 | | | 3,158,000 | | | | — | | | | 3,158,000 | | | | — | |
| Del Taco Restaurants, Inc.1,8 | | | 2,939,200 | | | | — | | | | 1,501,000 | | | | 1,438,200 | |
| Hoteles City Express, SAB de CV1,8 | | | 22,037,148 | | | | — | | | | 22,037,148 | | | | — | |
| Party City Holdco Inc.1,8 | | | 7,489,459 | | | | — | | | | 7,489,459 | | | | — | |
| Industrials 1.84% | | | | | | | | | | | | | | | | |
| IMCD NV3 | | | 3,332,269 | | | | 40,200 | | | | 82,000 | | | | 3,290,469 | |
| Boyd Group Services Inc. | | | 951,051 | | | | 340,300 | | | | 252,500 | | | | 1,038,851 | |
| Avon Rubber PLC3 | | | 2,481,863 | | | | — | | | | 93,900 | | | | 2,387,963 | |
| Bingo Industries Ltd.3,4 | | | 37,574,800 | | | | 3,198,355 | | | | — | | | | 40,773,155 | |
| Japan Elevator Service Holdings Co., Ltd.3 | | | 416,400 | | | | 1,623,400 | | | | — | | | | 2,039,800 | |
| Instalco AB3 | | | 3,831,789 | | | | — | | | | — | | | | 3,831,789 | |
| Upwork Inc.1 | | | 2,796,036 | | | | 3,991,700 | | | | 442,000 | | | | 6,345,736 | |
| Coor Service Management Holding AB3 | | | 5,878,630 | | | | 576,620 | | | | 254,000 | | | | 6,201,250 | |
| Alfen NV1,3 | | | 1,275,000 | | | | — | | | | — | | | | 1,275,000 | |
| Barrett Business Services, Inc. | | | 590,000 | | | | — | | | | — | | | | 590,000 | |
| Greaves Cotton Ltd.3 | | | 16,200,000 | | | | — | | | | — | | | | 16,200,000 | |
| BELIMO Holding AG3,8 | | | 33,323 | | | | — | | | | 3,209 | | | | 30,114 | |
Investments in affiliates(continued)
| | | Beginning
shares | | | Additions | | | Reductions | | | Ending
shares | |
| J. Kumar Infraprojects Ltd.3,8 | | | 4,450,500 | | | | — | | | | 4,181,357 | | | | 269,143 | |
| Continental Building Products, Inc.1,8 | | | 2,780,700 | | | | — | | | | 2,780,700 | | | | — | |
| TechnoPro Holdings, Inc.3,8 | | | 1,873,600 | | | | — | | | | 102,600 | | | | 1,771,000 | |
| Bravida Holding AB3,8 | | | 16,173,198 | | | | — | | | | 8,372,784 | | | | 7,800,414 | |
| Tsubaki Nakashima Co., Ltd.3,8 | | | 2,920,100 | | | | — | | | | 2,920,100 | | | | — | |
| Rexnord Corp.8 | | | 5,708,000 | | | | 125,000 | | | | — | | | | 5,833,000 | |
| VARTA AG, non-registered shares1,3,4,8 | | | 2,493,496 | | | | 435,189 | | | | 1,638,450 | | | | 1,290,235 | |
| BeNEXT Group Inc.3,8,11 | | | 2,876,200 | | | | — | | | | 2,342,700 | | | | 533,500 | |
| Diploma PLC3,8 | | | 5,676,000 | | | | — | | | | 50,000 | | | | 5,626,000 | |
| Financials 0.96% | | | | | | | | | | | | | | | | |
| Cannae Holdings, Inc.1 | | | 5,137,578 | | | | 1,073,693 | | | | — | | | | 6,211,271 | |
| Trupanion, Inc.1,4 | | | 2,689,094 | | | | 385,307 | | | | 278,894 | | | | 2,795,507 | |
| Seacoast Banking Corp. of Florida1 | | | 3,031,901 | | | | 550,000 | | | | — | | | | 3,581,901 | |
| Greenhill & Co., Inc. | | | 1,169,700 | | | | — | | | | — | | | | 1,169,700 | |
| HUB24 Ltd.3,8 | | | 4,377,158 | | | | — | | | | 4,377,158 | | | | — | |
| Consumer staples 1.63% | | | | | | | | | | | | | | | | |
| Emmi AG3 | | | 317,072 | | | | — | | | | — | | | | 317,072 | |
| Grocery Outlet Holding Corp.1 | | | 1,416,700 | | | | 3,801,082 | | | | 158,400 | | | | 5,059,382 | |
| Simply Good Foods Co., Class A1 | | | 2,788,000 | | | | 3,363,000 | | | | — | | | | 6,151,000 | |
| Hotel Chocolat Group PLC3,4 | | | 3,619,763 | | | | 3,866,237 | | | | — | | | | 7,486,000 | |
| R.E.A. Holdings PLC1,3,8 | | | 2,162,000 | | | | — | | | | 10,000 | | | | 2,152,000 | |
| CCL Products (India) Ltd.3,8 | | | 10,642,173 | | | | — | | | | 10,642,173 | | | | — | |
| Primo Water Operations Inc.8 | | | 3,123,557 | | | | — | | | | 3,123,557 | | | | — | |
| TCI Co., Ltd.3,8 | | | 6,635,058 | | | | — | | | | 3,484,840 | | | | 3,150,218 | |
| Communication services 0.56% | | | | | | | | | | | | | | | | |
| Iridium Communications Inc.1 | | | 6,801,932 | | | | 400,000 | | | | — | | | | 7,201,932 | |
| Iridium Communications Inc.1,5 | | | 636,132 | | | | — | | | | — | | | | 636,132 | |
| Kamakura Shinsho, Ltd.3,4 | | | 2,135,000 | | | | 162,900 | | | | — | | | | 2,297,900 | |
| The Pebble Group PLC1,3 | | | — | | | | 10,884,000 | | | | — | | | | 10,884,000 | |
| Materials 0.35% | | | | | | | | | | | | | | | | |
| Navin Fluorine International Ltd.3 | | | 3,202,000 | | | | 283,500 | | | | — | | | | 3,485,500 | |
| JCU Corp.3 | | | 1,687,000 | | | | 517,600 | | | | 199,900 | | | | 2,004,700 | |
| Loma Negra Compania Industrial Argentina SA (ADR)1 | | | 7,110,500 | | | | — | | | | 317,510 | | | | 6,792,990 | |
| Nevada Copper Corp.1,4 | | | 47,090,000 | | | | — | | | | 744,500 | | | | 46,345,500 | |
| Excelsior Mining Corp.1,4 | | | 12,868,000 | | | | — | | | | — | | | | 12,868,000 | |
| Allegheny Technologies Inc.1,8 | | | 10,087,124 | | | | 447,000 | | | | 6,199,765 | | | | 4,334,359 | |
| Mayur Uniquoters Ltd.3,8 | | | 2,402,934 | | | | — | | | | 2,402,934 | | | | — | |
| Real estate 0.58% | | | | | | | | | | | | | | | | |
| Altus Group Ltd.4 | | | 3,014,100 | | | | 198,600 | | | | — | | | | 3,212,700 | |
| WHA Corp. PCL3 | | | 751,320,200 | | | | 218,355,000 | | | | 76,422,876 | | | | 893,252,324 | |
| JHSF Participacoes SA | | | — | | | | 40,035,711 | | | | — | | | | 40,035,711 | |
| Cyrela Commercial Properties SA, ordinary nominative1 | | | — | | | | 8,557,663 | | | | — | | | | 8,557,663 | |
| Mitre Realty Empreendimentos E Participações SA1 | | | — | | | | 6,168,863 | | | | — | | | | 6,168,863 | |
| Foxtons Group PLC3 | | | 17,881,785 | | | | — | | | | — | | | | 17,881,785 | |
| Energy 0.04% | | | | | | | | | | | | | | | | |
| Savannah Petroleum PLC1,3 | | | 52,160,179 | | | | 12,438,923 | | | | — | | | | 64,599,102 | |
| NuVista Energy Ltd.1,4 | | | 15,965,000 | | | | — | | | | — | | | | 15,965,000 | |
| Nine Energy Service, Inc.1,4 | | | 2,453,000 | | | | — | | | | 85,304 | | | | 2,367,696 | |
| Utilities 0.00% | | | | | | | | | | | | | | | | |
| Mytrah Energy Ltd.1,3,10 | | | 10,418,000 | | | | — | | | | — | | | | 10,418,000 | |
| | | Beginning
shares | | | Additions | | | Reductions | | | Ending
shares | |
| Preferred securities 0.40% | | | | | | | | | | | | | | | | |
| Information technology 0.28% | | | | | | | | | | | | | | | | |
| Avidxchange, Inc., Series F, preferred shares1,3,9,10 | | | — | | | | 2,159,548 | | | | — | | | | 2,159,548 | |
| Consumer discretionary 0.12% | | | | | | | | | | | | | | | | |
| Made.com Design Ltd., Series C-4, preferred shares1,3,9,10 | | | 2,067,967 | | | | — | | | | — | | | | 2,067,967 | |
| Consumer staples 0.00% | | | | | | | | | | | | | | | | |
| R.E.A. Holdings PLC 9.00% cumulative, preferred shares1,8 | | | 96,000 | | | | — | | | | — | | | | 96,000 | |
| Convertible stocks 0.04% | | | | | | | | | | | | | | | | |
| Information technology 0.04% | | | | | | | | | | | | | | | | |
| RealSelf, Inc., Series C, convertible preferred shares3,9,10 | | | 3,468,862 | | | | — | | | | — | | | | 3,468,862 | |
| | | Net
realized
gain (loss)
(000) | | | Net
unrealized
appreciation
(depreciation)
(000) | | | Dividend
income
(000) | | | Value of
affiliates at
3/31/2020
(000) | |
| Common stocks 20.57% | | | | | | | | | | | | | | | | |
| Information technology 4.86% | | | | | | | | | | | | | | | | |
| Smartsheet Inc., Class A1 | | $ | — | | | $ | 24,270 | | | $ | — | | | $ | 248,678 | |
| SimCorp AS3 | | | 291 | | | | (11,843 | ) | | | 2,530 | | | | 196,763 | |
| Network International Holdings PLC1,3 | | | — | | | | (61,756 | ) | | | — | | | | 183,121 | |
| Netcompany Group AS, non-registered shares1,3 | | | 341 | | | | 20,719 | | | | — | | | | 152,760 | |
| Net One Systems Co., Ltd.3 | | | — | | | | (28,100 | ) | | | 1,339 | | | | 143,109 | |
| Alarm.Com Holdings, Inc.1 | | | — | | | | (21,619 | ) | | | — | | | | 124,823 | |
| CANCOM SE, non-registered shares3 | | | (1,056 | ) | | | (32,969 | ) | | | — | | | | 123,498 | |
| Bottomline Technologies, Inc.1 | | | — | | | | (7,713 | ) | | | — | | | | 114,055 | |
| Carel Industries SpA3 | | | — | | | | (16,748 | ) | | | — | | | | 101,748 | |
| Yext, Inc.1 | | | — | | | | (49,369 | ) | | | — | | | | 88,258 | |
| Fortnox AB3 | | | (805 | ) | | | (2,529 | ) | | | 241 | | | | 79,038 | |
| Megaport Ltd.1,3 | | | 3,797 | | | | 527 | | | | — | | | | 65,928 | |
| SHIFT Inc.1,3,4 | | | — | | | | 2,742 | | | | — | | | | 54,963 | |
| Cardtronics PLC, Class A1 | | | — | | | | (29,744 | ) | | | — | | | | 48,158 | |
| Bravura Solutions Ltd.3 | | | — | | | | (8,424 | ) | | | 686 | | | | 45,017 | |
| eMemory Technology Inc.3 | | | — | | | | (11,204 | ) | | | — | | | | 31,283 | |
| Faraday Technology Corp.3 | | | — | | | | (10,058 | ) | | | — | | | | 18,455 | |
| Douzone Bizon Co., Ltd.3,8 | | | 20,787 | | | | 7,451 | | | | 815 | | | | — | |
| Endurance International Group Holdings, Inc.1,8 | | | (31,424 | ) | | | 19,008 | | | | — | | | | — | |
| SUNeVision Holdings Ltd.3,8 | | | (5,238 | ) | | | (14,370 | ) | | | 2,685 | | | | — | |
| Humanica PCL8 | | | (3,843 | ) | | | 3,222 | | | | — | | | | — | |
| Jenoptik AG3,8 | | | (46,313 | ) | | | 42,427 | | | | — | | | | — | |
| Accesso Technology Group PLC1,3,8 | | | (19,277 | ) | | | 519 | | | | — | | | | — | |
| Sansan, Inc.1,3,8 | | | (10,625 | ) | | | 10,823 | | | | — | | | | — | |
| Tri Chemical Laboratories Inc.3,4,8 | | | (1,118 | ) | | | (1,459 | ) | | | 234 | | | | — | |
| | | | | | | | | | | | | | | | 1,819,655 | |
| Health care 6.39% | | | | | | | | | | | | | | | | |
| Insulet Corp.1 | | | 52,980 | | | | (41,805 | ) | | | — | | | | 642,579 | |
| Haemonetics Corp.1 | | | — | | | | (55,716 | ) | | | — | | | | 251,564 | |
| Cansino Biologics Inc., Class H1,3,4 | | | — | | | | 124,169 | | | | — | | | | 169,768 | |
| Allakos Inc.1,4 | | | (740 | ) | | | (129,205 | ) | | | — | | | | 169,175 | |
Investments in affiliates(continued)
| | | Net
realized
gain (loss)
(000) | | | Net
unrealized
appreciation
(depreciation)
(000) | | | Dividend
income
(000) | | | Value of
affiliates at
3/31/2020
(000) | |
| Mani, Inc.3 | | $ | — | | | $ | (5,897 | ) | | $ | 628 | | | $ | 167,445 | |
| GW Pharmaceuticals PLC (ADR)1,4 | | | (8,752 | ) | | | (38,576 | ) | | | — | | | | 149,140 | |
| Cortexyme, Inc.1,4 | | | — | | | | 68,605 | | | | — | | | | 102,682 | |
| Cortexyme, Inc.1,3,9 | | | — | | | | (476 | ) | | | — | | | | 3,351 | |
| Cortexyme, Inc.1,3,5 | | | — | | | | (23,126 | ) | | | — | | | | — | |
| Fagron NV3 | | | — | | | | (2,415 | ) | | | — | | | | 88,205 | |
| New Frontier Health Corp., Class A1,5 | | | — | | | | (16,298 | ) | | | — | | | | 76,834 | |
| Nakanishi Inc.3 | | | — | | | | (13,089 | ) | | | 780 | | | | 70,902 | |
| Silk Road Medical, Inc.1 | | | — | | | | (23,496 | ) | | | — | | | | 65,655 | |
| Revance Therapeutics, Inc.1 | | | — | | | | 2,653 | | | | — | | | | 48,720 | |
| Metropolis Healthcare Ltd.3 | | | 1,151 | | | | (3,619 | ) | | | 315 | | | | 46,670 | |
| CryoLife, Inc.1 | | | — | | | | (27,062 | ) | | | — | | | | 45,175 | |
| CellaVision AB, non-registered shares3 | | | — | | | | (19,972 | ) | | | — | | | | 38,293 | |
| Pacific Biosciences of California, Inc.1 | | | — | | | | (19,963 | ) | | | — | | | | 37,461 | |
| Revenio Group Oyj, non-registered shares1,3 | | | 1,584 | | | | 4,822 | | | | — | | | | 35,135 | |
| Cellectis SA (ADR)1 | | | — | | | | (6,378 | ) | | | — | | | | 20,372 | |
| Cellectis SA, non-registered shares1,3,4 | | | — | | | | (1,246 | ) | | | — | | | | 10,907 | |
| Adaptimmune Therapeutics PLC (ADR)1,4 | | | — | | | | 6,378 | | | | — | | | | 25,361 | |
| Autolus Therapeutics PLC (ADR)1,4 | | | — | | | | (24,726 | ) | | | — | | | | 25,029 | |
| Precision BioSciences, Inc.1 | | | — | | | | (27,297 | ) | | | — | | | | 24,494 | |
| Xenon Pharmaceuticals Inc.1,4 | | | — | | | | 4,705 | | | | — | | | | 22,898 | |
| Flexion Therapeutics, Inc.1,4 | | | — | | | | (14,650 | ) | | | — | | | | 19,759 | |
| WIN-Partners Co., Ltd.3 | | | — | | | | (2,555 | ) | | | 592 | | | | 17,576 | |
| NuCana PLC (ADR)1,4 | | | — | | | | (3,630 | ) | | | — | | | | 15,011 | |
| Neovasc Inc.1 | | | — | | | | (1,790 | ) | | | — | | | | 1,300 | |
| CONMED Corp.8 | | | 27,474 | | | | (75,726 | ) | | | 662 | | | | — | |
| Diplomat Pharmacy, Inc.1,8 | | | (69,631 | ) | | | 64,784 | | | | — | | | | — | |
| Natera, Inc.1,8 | | | 7,462 | | | | (31,268 | ) | | | — | | | | — | |
| iRhythm Technologies, Inc.1,8 | | | 21,884 | | | | (6,953 | ) | | | — | | | | — | |
| Osstem Implant Co., Ltd.1,8 | | | (29,371 | ) | | | 23,985 | | | | — | | | | — | |
| Clovis Oncology, Inc.1,4,8 | | | (61,765 | ) | | | 63,929 | | | | — | | | | — | |
| Neuronetics, Inc.1,8 | | | (24,130 | ) | | | 17,580 | | | | — | | | | — | |
| Rubius Therapeutics, Inc.1,8 | | | (51,075 | ) | | | 29,337 | | | | — | | | | — | |
| Corindus Vascular Robotics, Inc.1,8 | | | 31,399 | | | | (31,535 | ) | | | — | | | | — | |
| | | | | | | | | | | | | | | | 2,391,461 | |
| Consumer discretionary 3.36% | | | | | | | | | | | | | | | | |
| Evolution Gaming Group AB3 | | | 5,354 | | | | 141,414 | | | | — | | | | 369,410 | |
| frontdoor, inc.1 | | | (1,000 | ) | | | (63,729 | ) | | | — | | | | 164,936 | |
| Trainline PLC1,3 | | | — | | | | (40,676 | ) | | | — | | | | 160,843 | |
| Luckin Coffee Inc., Class A (ADR)1,4 | | | — | | | | 41,178 | | | | — | | | | 138,145 | |
| YETI Holdings, Inc.1 | | | — | | | | (44,704 | ) | | | — | | | | 93,504 | |
| Domino’s Pizza Group PLC3 | | | (2,705 | ) | | | 15,814 | | | | — | | | | 92,793 | |
| zooplus AG, non-registered shares1,3,4 | | | — | | | | 2,773 | | | | — | | | | 70,861 | |
| Shop Apotheke Europe NV, non-registered shares1,3,4 | | | — | | | | 13,742 | | | | — | | | | 45,016 | |
| Bygghemma Group First AB1,3,4 | | | — | | | | 6,167 | | | | — | | | | 41,358 | |
| AcadeMedia AB3 | | | — | | | | 2,538 | | | | 1,000 | | | | 38,916 | |
| Musti Group Oyj1,3 | | | — | | | | (1,664 | ) | | | — | | | | 19,954 | |
| Lands’ End, Inc.1 | | | — | | | | (13,489 | ) | | | — | | | | 11,881 | |
| Beazer Homes USA, Inc.1 | | | — | | | | (14,042 | ) | | | — | | | | 10,689 | |
| BNN Technology PLC1,3,10 | | | — | | | | (783 | ) | | | — | | | | 236 | |
| Dine Brands Global, Inc.8 | | | (25,686 | ) | | | (9,043 | ) | | | 967 | | | | — | |
| TopBuild Corp.1,8 | | | 15,231 | | | | (53,469 | ) | | | — | | | | — | |
| Hostelworld Group PLC8 | | | (8,602 | ) | | | 8,044 | | | | — | | | | — | |
| | | Net
realized
gain (loss)
(000) | | | Net
unrealized
appreciation
(depreciation)
(000) | | | Dividend
income
(000) | | | Value of
affiliates at
3/31/2020
(000) | |
| MIPS AB3,8 | | $ | 2,702 | | | $ | 5,548 | | | $ | — | | | $ | — | |
| Delta Corp. Ltd.3,8 | | | (31,634 | ) | | | 10,074 | | | | 304 | | | | — | |
| Tile Shop Holdings, Inc.8 | | | (20,659 | ) | | | 14,990 | | | | — | | | | — | |
| Del Taco Restaurants, Inc.1,8 | | | (6,092 | ) | | | (7,372 | ) | | | — | | | | — | |
| Hoteles City Express, SAB de CV1,8 | | | (9,896 | ) | | | 6,071 | | | | — | | | | — | |
| Party City Holdco Inc.1,8 | | | (56,244 | ) | | | 32,601 | | | | — | | | | — | |
| | | | | | | | | | | | | | | | 1,258,542 | |
| Industrials 1.84% | | | | | | | | | | | | | | | | |
| IMCD NV3 | | | 1,123 | | | | (9,671 | ) | | | — | | | | 234,011 | |
| Boyd Group Services Inc. | | | (746 | ) | | | (30,707 | ) | | | 217 | | | �� | 108,144 | |
| Avon Rubber PLC3 | | | 1,105 | | | | 19,264 | | | | 430 | | | | 68,160 | |
| Bingo Industries Ltd.3,4 | | | — | | | | (11,044 | ) | | | 545 | | | | 48,754 | |
| Japan Elevator Service Holdings Co., Ltd.3 | | | — | | | | 2,182 | | | | 303 | | | | 46,871 | |
| Instalco AB3 | | | — | | | | 4,217 | | | | — | | | | 43,531 | |
| Upwork Inc.1 | | | (2,774 | ) | | | (26,623 | ) | | | — | | | | 40,930 | |
| Coor Service Management Holding AB3 | | | 271 | | | | (23,427 | ) | | | — | | | | 30,362 | |
| Alfen NV1,3 | | | — | | | | 11,541 | | | | — | | | | 29,384 | |
| Barrett Business Services, Inc. | | | — | | | | (29,016 | ) | | | 354 | | | | 23,388 | |
| Greaves Cotton Ltd.3 | | | — | | | | (18,495 | ) | | | — | | | | 14,891 | |
| BELIMO Holding AG3,8 | | | 3,829 | | | | 30,868 | | | | — | | | | — | |
| J. Kumar Infraprojects Ltd.3,8 | | | (3,795 | ) | | | 4,805 | | | | — | | | | — | |
| Continental Building Products, Inc.1,8 | | | 58,478 | | | | (33,959 | ) | | | — | | | | — | |
| TechnoPro Holdings, Inc.3,8 | | | 555 | | | | (22,535 | ) | | | 854 | | | | — | |
| Bravida Holding AB3,8 | | | 18,844 | | | | (30,705 | ) | | | — | | | | — | |
| Tsubaki Nakashima Co., Ltd.3,8 | | | (17,760 | ) | | | 12,783 | | | | 627 | | | | — | |
| Rexnord Corp.8 | | | — | | | | (25,009 | ) | | | 457 | | | | — | |
| VARTA AG, non-registered shares1,3,4,8 | | | 104,578 | | | | (125,303 | ) | | | — | | | | — | |
| BeNEXT Group Inc.3,8,11 | | | (18,886 | ) | | | 5,159 | | | | 393 | | | | — | |
| Diploma PLC3,8 | | | (2 | ) | | | (2,796 | ) | | | 1,502 | | | | — | |
| | | | | | | | | | | | | | | | 688,426 | |
| Financials 0.96% | | | | | | | | | | | | | | | | |
| Cannae Holdings, Inc.1 | | | — | | | | 33,019 | | | | — | | | | 208,015 | |
| Trupanion, Inc.1,4 | | | 4,877 | | | | (5,792 | ) | | | — | | | | 72,767 | |
| Seacoast Banking Corp. of Florida1 | | | — | | | | (24,669 | ) | | | — | | | | 65,585 | |
| Greenhill & Co., Inc. | | | — | | | | (3,837 | ) | | | 117 | | | | 11,510 | |
| HUB24 Ltd.3,8 | | | (18,265 | ) | | | 6,489 | | | | — | | | | — | |
| | | | | | | | | | | | | | | | 357,877 | |
| Consumer staples 1.63% | | | | | | | | | | | | | | | | |
| Emmi AG3 | | | — | | | | 31,277 | | | | — | | | | 289,878 | |
| Grocery Outlet Holding Corp.1 | | | (343 | ) | | | 3,341 | | | | — | | | | 173,739 | |
| Simply Good Foods Co., Class A1 | | | — | | | | (46,075 | ) | | | — | | | | 118,468 | |
| Hotel Chocolat Group PLC3,4 | | | — | | | | (11,746 | ) | | | 174 | | | | 26,000 | |
| R.E.A. Holdings PLC1,3,8 | | | (40 | ) | | | (1,357 | ) | | | — | | | | — | |
| CCL Products (India) Ltd.3,8 | | | (3,101 | ) | | | (2,592 | ) | | | — | | | | — | |
| Primo Water Operations Inc.8 | | | 1,090 | | | | 6,846 | | | | — | | | | — | |
| TCI Co., Ltd.3,8 | | | (10,926 | ) | | | (5,036 | ) | | | — | | | | — | |
| | | | | | | | | | | | | | | | 608,085 | |
| Communication services 0.56% | | | | | | | | | | | | | | | | |
| Iridium Communications Inc.1 | | | — | | | | 7,710 | | | | — | | | | 160,819 | |
| Iridium Communications Inc.1,5 | | | — | | | | 668 | | | | — | | | | 14,205 | |
| Kamakura Shinsho, Ltd.3,4 | | | — | | | | (8,258 | ) | | | 59 | | | | 22,420 | |
Investments in affiliates(continued)
| | | Net
realized
gain (loss)
(000) | | | Net
unrealized
appreciation
(depreciation)
(000) | | | Dividend
income
(000) | | | Value of
affiliates at
3/31/2020
(000) | |
| The Pebble Group PLC1,3 | | $ | — | | | $ | (3,924 | ) | | $ | — | | | $ | 11,438 | |
| | | | | | | | | | | | | | | | 208,882 | |
| Materials 0.35% | | | | | | | | | | | | | | | | |
| Navin Fluorine International Ltd.3 | | | — | | | | 15,949 | | | | 371 | | | | 55,175 | |
| JCU Corp.3 | | | (1,174 | ) | | | 1,556 | | | | 465 | | | | 41,724 | |
| Loma Negra Compania Industrial Argentina SA (ADR)1 | | | (2,972 | ) | | | (12,640 | ) | | | — | | | | 24,115 | |
| Nevada Copper Corp.1,4 | | | (207 | ) | | | (1,743 | ) | | | — | | | | 6,092 | |
| Excelsior Mining Corp.1,4 | | | — | | | | (6,175 | ) | | | — | | | | 4,023 | |
| Allegheny Technologies Inc.1,8 | | | (88,068 | ) | | | (15,872 | ) | | | — | | | | — | |
| Mayur Uniquoters Ltd.3,8 | | | (11,404 | ) | | | 11,135 | | | | 26 | | | | — | |
| | | | | | | | | | | | | | | | 131,129 | |
| Real estate 0.58% | | | | | | | | | | | | | | | | |
| Altus Group Ltd.4 | | | — | | | | (13,322 | ) | | | 713 | | | | 83,325 | |
| WHA Corp. PCL3 | | | 5,660 | | | | (71,428 | ) | | | 1,822 | | | | 60,556 | |
| JHSF Participacoes SA | | | — | | | | (20,772 | ) | | | 110 | | | | 26,967 | |
| Cyrela Commercial Properties SA, ordinary nominative1 | | | — | | | | (18,230 | ) | | | — | | | | 22,645 | |
| Mitre Realty Empreendimentos E Participações SA1 | | | — | | | | (15,427 | ) | | | — | | | | 13,059 | |
| Foxtons Group PLC3 | | | — | | | | (2,010 | ) | | | — | | | | 8,983 | |
| | | | | | | | | | | | | | | | 215,535 | |
| Energy 0.04% | | | | | | | | | | | | | | | | |
| Savannah Petroleum PLC1,3 | | | — | | | | (10,807 | ) | | | — | | | | 6,363 | |
| NuVista Energy Ltd.1,4 | | | — | | | | (24,383 | ) | | | — | | | | 5,502 | |
| Nine Energy Service, Inc.1,4 | | | (2,890 | ) | | | (10,157 | ) | | | — | | | | 1,914 | |
| | | | | | | | | | | | | | | | 13,779 | |
| Utilities 0.00% | | | | | | | | | | | | | | | | |
| Mytrah Energy Ltd.1,3,10 | | | — | | | | 1 | | | | — | | | | 129 | |
| Total common stocks | | | | | | | | | | | | | | | 7,693,500 | |
| Preferred securities 0.40% | | | | | | | | | | | | | | | | |
| Information technology 0.28% | | | | | | | | | | | | | | | | |
| Avidxchange, Inc., Series F, preferred shares1,3,9,10 | | | — | | | | — | | | | — | | | | 105,844 | |
| Consumer discretionary 0.12% | | | | | | | | | | | | | | | | |
| Made.com Design Ltd., Series C-4, preferred shares1,3,9,10 | | | — | | | | 3,309 | | | | — | | | | 43,101 | |
| Consumer staples 0.00% | | | | | | | | | | | | | | | | |
| R.E.A. Holdings PLC 9.00% cumulative, preferred shares1,8 | | | — | | | | (14 | ) | | | — | | | | — | |
| Total preferred securities | | | | | | | | | | | | | | | 148,945 | |
| Convertible stocks 0.04% | | | | | | | | | | | | | | | | |
| Information technology 0.04% | | | | | | | | | | | | | | | | |
| RealSelf, Inc., Series C, convertible preferred shares3,9,10 | | | — | | | | (8,603 | ) | | | — | | | | 15,714 | |
| Total convertible stocks | | | | | | | | | | | | | | | 15,714 | |
| Total 21.01% | | $ | (318,187 | ) | | $ | (883,776 | ) | | $ | 23,317 | | | $ | 7,858,159 | |
| 1 | Security did not produce income during the last 12 months. |
| 2 | Represents an affiliated company as defined under the Investment Company Act of 1940. |
| 3 | Valued under fair value procedures adopted by authority of the board of directors. The total value of all such securities, including those in “Other securities,” was $15,119,460,000, which represented 40.42% of the net assets of the fund. This amount includes $14,589,195,000 related to certain securities trading outside the U.S. whose values were adjusted as a result of significant market movements following the close of local trading. |
| 4 | All or a portion of this security was on loan. The total value of all such securities, including those in “Other securities,” was $632,192,000, which represented 1.69% of the net assets of the fund. Refer to Note 5 for more information on securities lending. |
| 5 | Acquired in a transaction exempt from registration under Rule 144A or Section 4(2) of the Securities Act of 1933. May be resold in the U.S. in transactions exempt from registration, normally to qualified institutional buyers. The total value of all such securities, including those in “Other securities,” was $114,697,000, which represented .31% of the net assets of the fund. |
| 6 | Rate represents the seven-day yield at 3/31/2020. |
| 7 | Security purchased with cash collateral from securities on loan. Refer to Note 5 for more information on securities lending. |
| 8 | Unaffiliated issuer at 3/31/2020. |
| 9 | Acquired through a private placement transaction exempt from registration under the Securities Act of 1933. May be subject to legal or contractual restrictions on resale. Further details on these holdings appear below. |
| 10 | Value determined using significant unobservable inputs. |
| 11 | This security changed its name during the reporting period. |
| Private placement securities | | Acquisition
date(s) | | Cost
(000) | | | Value
(000) | | | Percent
of net
assets | |
| Avidxchange, Inc., series F, preferred shares | | 12/26/2019 | | $ | 105,844 | | | $ | 105,844 | | | | .28 | % |
| Made.com Design Ltd., Series C-4, preferred shares | | 3/2/2018 | | | 41,328 | | | | 43,101 | | | | .12 | |
| RealSelf, Inc., Series C, convertible preferred shares | | 4/18/2018 | | | 19,000 | | | | 15,714 | | | | .04 | |
| Cortexyme, Inc. | | 2/6/2020 | | | 3,826 | | | | 3,351 | | | | .01 | |
| Other private placement securities | | 12/3/2013-3/30/2020 | | | 301,497 | | | | 251,720 | | | | .67 | |
| Total private placement securities | | | | $ | 471,495 | | | $ | 419,730 | | | | 1.12 | % |
Key to abbreviations
ADR = American Depositary Receipts
EUR = Euros
ISK = Icelandic kronor
See notes to financial statements.
Financial statements
| Statement of assets and liabilities | unaudited |
| at March 31, 2020 | (dollars in thousands) |
| Assets: | | | | | | |
| Investment securities, at value: | | | | | | | | |
| Unaffiliated issuers (cost: $25,143,198) | | $ | 29,850,543 | | | | | |
| Affiliated issuers (cost: $7,018,052) | | | 7,858,159 | | | $ | 37,708,702 | |
| Cash | | | | | | | 1,560 | |
| Cash denominated in currencies other than U.S. dollars (cost: $23,853) | | | | | | | 23,818 | |
| Receivables for: | | | | | | | | |
| Sales of investments | | | 223,890 | | | | | |
| Sales of fund’s shares | | | 72,442 | | | | | |
| Dividends and interest | | | 45,145 | | | | | |
| Securities lending income | | | 2,573 | | | | | |
| Other | | | 1 | | | | 344,051 | |
| | | | | | | | 38,078,131 | |
| Liabilities: | | | | | | | | |
| Collateral for securities on loan | | | | | | | 407,122 | |
| Payables for: | | | | | | | | |
| Purchases of investments | | | 183,085 | | | | | |
| Repurchases of fund’s shares | | | 40,494 | | | | | |
| Investment advisory services | | | 20,558 | | | | | |
| Services provided by related parties | | | 7,961 | | | | | |
| Directors’ deferred compensation | | | 4,002 | | | | | |
| Other | | | 4,398 | | | | 260,498 | |
| Net assets at March 31, 2020 | | | | | | $ | 37,410,511 | |
| | | | | | | | | |
| Net assets consist of: | | | | | | | | |
| Capital paid in on shares of capital stock | | | | | | $ | 32,611,030 | |
| Total distributable earnings | | | | | | | 4,799,481 | |
| Net assets at March 31, 2020 | | | | | | $ | 37,410,511 | |
See notes to financial statements.
(dollars and shares in thousands, except per-share amounts)
Total authorized capital stock — 2,000,000 shares,
$.01 par value (819,554 total shares outstanding)
| | | Net assets | | | Shares
outstanding | | | Net asset value
per share | |
| Class A | | $ | 19,356,014 | | | | 424,906 | | | $ | 45.55 | |
| Class C | | | 512,233 | | | | 13,241 | | | | 38.69 | |
| Class T | | | 9 | | | | — | * | | | 45.87 | |
| Class F-1 | | | 563,072 | | | | 12,534 | | | | 44.92 | |
| Class F-2 | | | 4,153,940 | | | | 89,347 | | | | 46.49 | |
| Class F-3 | | | 1,936,174 | | | | 41,982 | | | | 46.12 | |
| Class 529-A | | | 1,120,327 | | | | 24,942 | | | | 44.92 | |
| Class 529-C | | | 141,646 | | | | 3,588 | | | | 39.47 | |
| Class 529-E | | | 46,493 | | | | 1,074 | | | | 43.30 | |
| Class 529-T | | | 11 | | | | — | * | | | 45.81 | |
| Class 529-F-1 | | | 125,476 | | | | 2,743 | | | | 45.74 | |
| Class R-1 | | | 19,185 | | | | 478 | | | | 40.10 | |
| Class R-2 | | | 428,178 | | | | 10,666 | | | | 40.14 | |
| Class R-2E | | | 24,243 | | | | 543 | | | | 44.68 | |
| Class R-3 | | | 591,009 | | | | 13,690 | | | | 43.17 | |
| Class R-4 | | | 609,123 | | | | 13,487 | | | | 45.17 | |
| Class R-5E | | | 49,415 | | | | 1,079 | | | | 45.78 | |
| Class R-5 | | | 300,038 | | | | 6,346 | | | | 47.28 | |
| Class R-6 | | | 7,433,925 | | | | 158,908 | | | | 46.78 | |
| * | Amount less than one thousand. |
See notes to financial statements.
| Statement of operations | unaudited |
| for the six months ended March 31, 2020 | (dollars in thousands) |
| Investment income: | | | | | | | | |
| Income: | | | | | | | | |
| Dividends (net of non-U.S. taxes of $6,731; also includes $23,317 from affiliates) | | $ | 177,372 | | | | | |
| Securities lending income (net of fees) | | | 24,284 | | | | | |
| Interest (net of non-U.S. taxes of $100) | | | 2,471 | | | $ | 204,127 | |
| Fees and expenses*: | | | | | | | | |
| Investment advisory services | | | 141,288 | | | | | |
| Distribution services | | | 42,331 | | | | | |
| Transfer agent services | | | 24,155 | | | | | |
| Administrative services | | | 6,904 | | | | | |
| Reports to shareholders | | | 1,194 | | | | | |
| Registration statement and prospectus | | | 890 | | | | | |
| Directors’ compensation | | | 506 | | | | | |
| Auditing and legal | | | 228 | | | | | |
| Custodian | | | 3,419 | | | | | |
| State and local taxes | | | 1 | | | | | |
| Other | | | 1,158 | | | | 222,074 | |
| Net investment loss | | | | | | | (17,947 | ) |
| | | | | | | | | |
| Net realized loss and unrealized depreciation: | | | | | | | | |
| Net realized (loss) gain on: | | | | | | | | |
| Investments: | | | | | | | | |
| Unaffiliated issuers | | | (19,816 | ) | | | | |
| Affiliated issuers | | | (318,187 | ) | | | | |
| Currency transactions | | | 633 | | | | (337,370 | ) |
| Net unrealized depreciation on: | | | | | | | | |
| Investments: | | | | | | | | |
| Unaffiliated issuers | | | (4,874,936 | ) | | | | |
| Affiliated issuers | | | (883,776 | ) | | | | |
| Currency translations | | | (2,281 | ) | | | (5,760,993 | ) |
| Net realized loss and unrealized depreciation | | | | | | | (6,098,363 | ) |
| | | | | | | | | |
| Net decrease in net assets resulting from operations | | | | | | $ | (6,116,310 | ) |
| * | Additional information related to class-specific fees and expenses is included in the notes to financial statements. |
See notes to financial statements.
Statements of changes in net assets
(dollars in thousands)
| | | Six months ended
March 31,
2020* | | | Year ended
September 30,
2019 | |
| Operations: | | | | | | |
| Net investment (loss) income | | $ | (17,947 | ) | | $ | 71,642 | |
| Net realized (loss) gain | | | (337,370 | ) | | | 1,673,682 | |
| Net unrealized depreciation | | | (5,760,993 | ) | | | (2,329,202 | ) |
| Net decrease in net assets resulting from operations | | | (6,116,310 | ) | | | (583,878 | ) |
| | | | | | | | | |
| Distributions paid to shareholders | | | (1,983,017 | ) | | | (2,434,865 | ) |
| | | | | | | | | |
| Net capital share transactions | | | 1,554,439 | | | | 3,097,094 | |
| | | | | | | | | |
| Total (decrease) increase in net assets | | | (6,544,888 | ) | | | 78,351 | |
| | | | | | | | | |
| Net assets: | | | | | | | | |
| Beginning of period | | | 43,955,399 | | | | 43,877,048 | |
| End of period | | $ | 37,410,511 | | | $ | 43,955,399 | |
See notes to financial statements.
| Notes to financial statements | unaudited |
1. Organization
SMALLCAP World Fund, Inc. (the “fund”) is registered under the Investment Company Act of 1940 as an open-end, diversified management investment company. The fund seeks to provide long-term growth of capital. Shareholders approved a proposal to reorganize the fund from a Maryland corporation to a Delaware statutory trust. The reorganization may be completed in the next year; however, the fund reserves the right to delay the implementation.
The fund has 19 share classes consisting of six retail share classes (Classes A, C, T, F-1, F-2 and F-3), five 529 college savings plan share classes (Classes 529-A, 529-C, 529-E, 529-T and 529-F-1) and eight retirement plan share classes (Classes R-1, R-2, R-2E, R-3, R-4, R-5E, R-5 and R-6). The 529 college savings plan share classes can be used to save for college education. The retirement plan share classes are generally offered only through eligible employer-sponsored retirement plans. The fund’s share classes are described further in the following table:
| Share class | | Initial sales charge | | Contingent deferred sales
charge upon redemption | | Conversion feature |
| Classes A and 529-A | | Up to 5.75% | | None (except 1% for certain redemptions within 18 months of purchase without an initial sales charge) | | None |
| Class C | | None | | 1% for redemptions within one year of purchase | | Class C converts to Class F-1 after 10 years |
| Class 529-C | | None | | 1% for redemptions within one year of purchase | | Class 529-C converts to Class 529-A after 10 years |
| Class 529-E | | None | | None | | None |
| Classes T and 529-T* | | Up to 2.50% | | None | | None |
| Classes F-1, F-2, F-3 and 529-F-1 | | None | | None | | None |
| Classes R-1, R-2, R-2E, R-3, R-4, R-5E, R-5 and R-6 | | None | | None | | None |
| * | Class T and 529-T shares are not available for purchase. |
Holders of all share classes have equal pro rata rights to the assets, dividends and liquidation proceeds of the fund. Each share class has identical voting rights, except for the exclusive right to vote on matters affecting only its class. Share classes have different fees and expenses (“class-specific fees and expenses”), primarily due to different arrangements for distribution, transfer agent and administrative services. Differences in class-specific fees and expenses will result in differences in net investment income and, therefore, the payment of different per-share dividends by each share class.
2. Significant accounting policies
The fund is an investment company that applies the accounting and reporting guidance issued in Topic 946 by the U.S. Financial Accounting Standards Board. The fund’s financial statements have been prepared to comply with U.S. generally accepted accounting principles (“U.S. GAAP”). These principles require the fund’s investment adviser to make estimates and assumptions that affect reported amounts and disclosures. Actual results could differ from those estimates. Subsequent events, if any, have been evaluated through the date of issuance in the preparation of the financial statements. The fund follows the significant accounting policies described in this section, as well as the valuation policies described in the next section on valuation.
Security transactions and related investment income— Security transactions are recorded by the fund as of the date the trades are executed with brokers. Realized gains and losses from security transactions are determined based on the specific identified cost of the securities. In the event a security is purchased with a delayed payment date, the fund will segregate liquid assets sufficient to meet its payment obligations. Dividend income is recognized on the ex-dividend date and interest income is recognized on an accrual basis. Market discounts, premiums and original issue discounts on fixed-income securities are amortized daily over the expected life of the security.
Class allocations— Income, fees and expenses (other than class-specific fees and expenses) and realized and unrealized gains and losses are allocated daily among the various share classes based on their relative net assets. Class-specific fees and expenses, such as distribution, transfer agent and administrative services, are charged directly to the respective share class.
Distributions paid to shareholders— Income dividends and capital gain distributions are recorded on the ex-dividend date.
Currency translation— Assets and liabilities, including investment securities, denominated in currencies other than U.S. dollars are translated into U.S. dollars at the exchange rates supplied by one or more pricing vendors on the valuation date. Purchases and sales of investment securities and income and expenses are translated into U.S. dollars at the exchange rates on the dates of such transactions. The effects of changes in exchange rates on investment securities are included with the net realized gain or loss and net unrealized appreciation or depreciation on investments in the fund’s statement of operations. The realized gain or loss and unrealized appreciation or depreciation resulting from all other transactions denominated in currencies other than U.S. dollars are disclosed separately.
3. Valuation
Capital Research and Management Company (“CRMC”), the fund’s investment adviser, values the fund’s investments at fair value as defined by U.S. GAAP. The net asset value of each share class of the fund is generally determined as of approximately 4:00 p.m. New York time each day the New York Stock Exchange is open.
Methods and inputs— The fund’s investment adviser uses the following methods and inputs to establish the fair value of the fund’s assets and liabilities. Use of particular methods and inputs may vary over time based on availability and relevance as market and economic conditions evolve.
Equity securities are generally valued at the official closing price of, or the last reported sale price on, the exchange or market on which such securities are traded, as of the close of business on the day the securities are being valued or, lacking any sales, at the last available bid price. Prices for each security are taken from the principal exchange or market on which the security trades.
Fixed-income securities, including short-term securities, are generally valued at prices obtained from one or more pricing vendors. Vendors value such securities based on one or more of the inputs described in the following table. The table provides examples of inputs that are commonly relevant for valuing particular classes of fixed-income securities in which the fund is authorized to invest. However, these classifications are not exclusive, and any of the inputs may be used to value any other class of fixed-income security.
| Fixed-income class | | Examples of standard inputs |
| All | | Benchmark yields, transactions, bids, offers, quotations from dealers and trading systems, new issues, spreads and other relationships observed in the markets among comparable securities; and proprietary pricing models such as yield measures calculated using factors such as cash flows, financial or collateral performance and other reference data (collectively referred to as “standard inputs”) |
| Corporate bonds & notes; convertible securities | | Standard inputs and underlying equity of the issuer |
| Bonds & notes of governments & government agencies | | Standard inputs and interest rate volatilities |
When the fund’s investment adviser deems it appropriate to do so (such as when vendor prices are unavailable or deemed to be not representative), fixed-income securities will be valued in good faith at the mean quoted bid and ask prices that are reasonably and timely available (or bid prices, if ask prices are not available) or at prices for securities of comparable maturity, quality and type.
Securities with both fixed-income and equity characteristics, or equity securities traded principally among fixed-income dealers, are generally valued in the manner described for either equity or fixed-income securities, depending on which method is deemed most appropriate by the fund’s investment adviser. The Capital Group Central Cash Fund (“CCF”), a fund within the Capital Group Central Fund Series (“Central Funds”), is valued based upon a floating net asset value, which fluctuates with changes in the value of CCF’s portfolio securities. The underlying securities are valued based on the policies and procedures in CCF’s statement of additional information.
Securities and other assets for which representative market quotations are not readily available or are considered unreliable by the fund’s investment adviser are fair valued as determined in good faith under fair valuation guidelines adopted by authority of the fund’s board of directors as further described. The investment adviser follows fair valuation guidelines, consistent with U.S. Securities and Exchange Commission rules and guidance, to consider relevant principles and factors when making fair value determinations. The investment adviser considers relevant indications of value that are reasonably and timely available to it in determining the fair value to be assigned to a particular security, such as the type and cost of the security; contractual or legal restrictions on resale of the security; relevant financial or business developments of the issuer; actively traded similar or related securities; conversion or exchange rights on the security; related corporate actions; significant events occurring after the close of trading in the security; and changes in overall market conditions. In addition, the closing prices of equity securities that trade in markets outside U.S. time zones may be adjusted to reflect significant events that occur after the close of local trading but before the net asset value of each share class of the fund is determined. Fair valuations and valuations of investments that are not actively trading involve judgment and may differ materially from valuations that would have been used had greater market activity occurred.
Processes and structure— The fund’s board of directors has delegated authority to the fund’s investment adviser to make fair value determinations, subject to board oversight. The investment adviser has established a Joint Fair Valuation Committee (the “Fair Valuation Committee”) to administer, implement and oversee the fair valuation process, and to make fair value decisions. The Fair Valuation Committee regularly reviews its own fair value decisions, as well as decisions made under its standing instructions to the investment adviser’s valuation teams. The Fair Valuation Committee reviews changes in fair value measurements from period to period and may, as deemed appropriate, update the fair valuation guidelines to better reflect the results of back testing and address new or evolving issues. The Fair Valuation Committee reports any changes to the fair valuation guidelines to the board of directors. The fund’s board and audit committee also regularly review reports that describe fair value determinations and methods.
The fund’s investment adviser has also established a Fixed-Income Pricing Review Group to administer and oversee the fixed-income valuation process, including the use of fixed-income pricing vendors. This group regularly reviews pricing vendor information and market data. Pricing decisions, processes and controls over security valuation are also subject to additional internal reviews, including an annual control self-evaluation program facilitated by the investment adviser’s compliance group.
Classifications— The fund’s investment adviser classifies the fund’s assets and liabilities into three levels based on the inputs used to value the assets or liabilities. Level 1 values are based on quoted prices in active markets for identical securities. Level 2 values are based on significant observable market inputs, such as quoted prices for similar securities and quoted prices in inactive markets. Certain securities trading outside the U.S. may transfer between Level 1 and Level 2 due to valuation adjustments resulting from significant market movements following the close of local trading. Level 3 values are based on significant unobservable inputs that reflect the investment adviser’s determination of assumptions that market participants might reasonably use in valuing the securities. The valuation levels are not necessarily an indication of the risk or liquidity associated with the underlying investment. For example, U.S. government securities are reflected as Level 2 because the inputs used to determine fair value may not always be quoted prices in an active market.
The following table presents the fund’s valuation levels as of March 31, 2020 (dollars in thousands):
| | | Investment securities | |
| | | Level 1 | | | Level 2 | | | Level 3 | | | Total | |
| Assets: | | | | | | | | | | | | | | | | |
| Common stocks: | | | | | | | | | | | | | | | | |
| Information technology | | $ | 5,312,324 | | | $ | 3,240,037 | | | $ | 24,904 | | | $ | 8,577,265 | |
| Health care | | | 5,105,410 | | | | 2,037,272 | | | | 80,109 | | | | 7,222,791 | |
| Consumer discretionary | | | 2,814,341 | | | | 2,568,062 | | | | 236 | | | | 5,382,639 | |
| Industrials | | | 1,835,427 | | | | 3,280,122 | | | | — | | | | 5,115,549 | |
| Financials | | | 1,736,082 | | | | 1,016,903 | | | | — | | | | 2,752,985 | |
| Consumer staples | | | 596,622 | | | | 1,039,977 | | | | — | | | | 1,636,599 | |
| Communication services | | | 832,093 | | | | 433,615 | | | | — | | | | 1,265,708 | |
| Materials | | | 286,460 | | | | 464,940 | | | | 91 | | | | 751,491 | |
| Real estate | | | 358,803 | | | | 381,171 | | | | — | | | | 739,974 | |
| Other | | | 180,489 | | | | 142,448 | | | | 12,283 | | | | 335,220 | |
| Preferred securities | | | 26,440 | | | | 96,542 | | | | 226,990 | | | | 349,972 | |
| Rights & warrants | | | 302 | | | | — | | | | 594 | | | | 896 | |
| Convertible stocks | | | — | | | | — | | | | 73,164 | | | | 73,164 | |
| Bonds, notes & other debt instruments | | | — | | | | 3,109 | | | | — | | | | 3,109 | |
| Short-term securities | | | 3,501,340 | | | | — | | | | — | | | | 3,501,340 | |
| Total | | $ | 22,586,133 | | | $ | 14,704,198 | | | $ | 418,371 | | | $ | 37,708,702 | |
The following table reconciles the valuation of the fund’s Level 3 investment securities and related transactions for the six months ended March 31, 2020 (dollars in thousands):
| Beginning | | | Transfers | | | | | | | | | Net | | | | | | Transfers | | | Ending | |
| value at | | | into | | | | | | | | | realized | | | Unrealized | | | out of | | | value at | |
| 10/1/2019 | | | Level 3* | | | Purchases | | | Sales | | | gain† | | | depreciation† | | | Level 3* | | | 3/31/2020 | |
| $ | 266,785 | | | $ | 3,643 | | | $ | 240,235 | | | $ | — | | | $ | — | | | $ | (92,292 | ) | | $ | — | | | $ | 418,371 | |
| Net unrealized depreciation during the period on Level 3 investment securities held at March 31, 2020 | | | | | | | $ | (92,292 | ) |
| * | Transfers into or out of Level 3 are based on the beginning market value of the quarter in which they occurred. |
| † | Net realized gain and unrealized depreciation are included in the related amounts on investments in the statement of operations. |
Unobservable inputs— Valuation of the fund’s Level 3 securities is based on significant unobservable inputs that reflect the investment adviser’s determination of assumptions that market participants might reasonably use in valuing the securities. The following table provides additional information used by the fund’s investment adviser to fair value the fund’s Level 3 securities (dollars in thousands):
| | | Value at
3/31/2020 | | Valuation
techniques | | Unobservable
inputs | | Single input
or range | | Weighted
average | | Impact to
valuation from
an increase in
input* |
| Common stocks | | $117,623 | | Liquidation value | | N/A | | N/A | | N/A | | N/A |
| | | | Expected proceeds | | Discount rate | | 10% | | 10% | | Decrease |
| | | | | Inputs to market comparables and transaction price | | Weight ascribed to transaction price | | 50% | | N/A | | N/A |
| | | | | | Weight ascribed to market comparables | | 50% | | N/A | | N/A |
| | | | | Market Comparables | | Price/Sales multiple | | 1.54x | | 1.54x | | Increase |
| | | | | | Transaction point multiple discount | | 10% | | 10% | | Decrease |
| | | | | | | Price/Cash flow multiple | | 5.58x | | 5.58x | | Increase |
| | | | | | | DLOM | | 20% | | 20% | | Decrease |
| | | | | | | $ per one billion Btu | | $2.25 | | $2.25 | | Increase |
| | | | | | | Million metric tonnes per annum | | 10 MMTPA | | 10 MMTPA | | Increase |
| | | | | Third party pricing | | N/A | | N/A | | N/A | | N/A |
| | | | | Recent market information | | Adjustment based on proxy (decrease) | | 32% | | 32% | | Decrease |
| | | | | | | Discount for lack of uncertainty and/or lack of marketability | | 23% - 50% | | 25% | | Decrease |
| | | Value at
3/31/2020 | | Valuation
techniques | | Unobservable
inputs | | Single input
or range | | Weighted
average | | Impact to
valuation from
an increase in
input* |
| Preferred securities | | 226,990 | | Cost | | N/A | | N/A | | N/A | | N/A |
| | | | Transaction price | | N/A | | N/A | | N/A | | N/A |
| | | | | Inputs to market comparables and discounted cash flow | | Weight ascribed to market comparables | | 67% | | N/A | | N/A |
| | | | | | Weight ascribed to discounted cash flow | | 33% | | N/A | | N/A |
| | | | | Market comparables | | Adjustment based on market comparables (decrease) | | 9% | | 9% | | Decrease |
| | | | | | Enterprise value/Sales multiple | | 3.57x | | 3.57x | | Increase |
| | | | | | | DLOM | | 25% | | 25% | | Decrease |
| | | | | Discounted cash flow | | Weighted average cost of capital | | 10.5% | | 10.5% | | Decrease |
| | | | | | | Revenue CAGR | | 25.1% | | 25.1% | | Increase |
| | | | | | | DLOM | | 25% | | 25% | | Decrease |
| Rights & warrants | | 594 | | Black-Scholes | | Underlying share price | | N/A | | N/A | | N/A |
| | | | | | Implied volatility | | 30% | | 30% | | Increase |
| Convertible stocks | | 73,164 | | Transaction price | | N/A | | N/A | | N/A | | N/A |
| | | | | Estimated liquidation value | | N/A | | N/A | | N/A | | N/A |
| | | | | Inputs to market comparables and transaction price | | Weight ascribed to transaction price | | 50% | | N/A | | N/A |
| | | | | | Weight ascribed to market comparables | | 50% | | N/A | | N/A |
| | | | | Market comparables | | Enterprise value/Sales multiple | | 6.08x - 9.22x | | 7.28x | | Increase |
| | | | | | | Transaction point multiple discount | | 2% | | 2% | | Decrease |
| | | | | | | Market comparables discount | | 30% | | 30% | | Decrease |
| | | | | | | DLOM | | 16% | | 16% | | Decrease |
| | | $418,371 | | | | | | | | | | |
| * | This column represents the directional change in fair value of the Level 3 securities that would result in an increase from the corresponding input. A decrease to the unobservable input would have the opposite effect. Significant increases and decreases in these inputs in isolation could result in significantly higher or lower fair value measurements. |
Key to abbreviations
Btu = British thermal unit
CAGR = Compound annual growth rate
DLOM = Discount for lack of marketability
4. Risk factors
Investing in the fund may involve certain risks including, but not limited to, those described below.
Market conditions— The prices of, and the income generated by, the securities held by the fund may decline – sometimes rapidly or unpredictably – due to various factors, including events or conditions affecting the general economy or particular industries; overall market changes; local, regional or global political, social or economic instability; governmental, governmental agency or central bank responses to economic conditions; and currency exchange rate, interest rate and commodity price fluctuations.
Issuer risks— The prices of, and the income generated by, securities held by the fund may decline in response to various factors directly related to the issuers of such securities, including reduced demand for an issuer’s goods or services, poor management performance, major litigation related to the issuer, changes in government regulations affecting the issuer or its competitive environment and strategic initiatives such as mergers, acquisitions or dispositions and the market response to any such initiatives.
Investing in growth-oriented stocks— Growth-oriented common stocks and other equity-type securities (such as preferred stocks, convertible preferred stocks and convertible bonds) may involve larger price swings and greater potential for loss than other types of investments. These risks may be even greater in the case of smaller capitalization stocks.
Investing in small companies— Investing in smaller companies may pose additional risks. For example, it is often more difficult to value or dispose of small company stocks and more difficult to obtain information about smaller companies than about larger companies. Furthermore, smaller companies often have limited product lines, operating histories, markets and/or financial resources, may be dependent on one or a few key persons for management, and can be more susceptible to losses. Moreover, the prices of their stocks may be more volatile than stocks of larger, more established companies, particularly during times of market turmoil.
Investing outside the U.S.— Securities of issuers domiciled outside the U.S., or with significant operations or revenues outside the U.S., may lose value because of adverse political, social, economic or market developments (including social instability, regional conflicts, terrorism and war) in the countries or regions in which the issuers operate or generate revenue. These securities may also lose value due to changes in foreign currency exchange rates against the U.S. dollar and/or currencies of other countries. Issuers of these securities may be more susceptible to actions of foreign governments, such as nationalization, currency blockage or the imposition of price controls or punitive taxes, each of which could adversely impact the value of these securities. Securities markets in certain countries may be more volatile and/or less liquid than those in the U.S. Investments outside the U.S. may also be subject to different accounting practices and different regulatory, legal and reporting standards and practices, and may be more difficult to value, than those in the U.S. In addition, the value of investments outside the U.S. may be reduced by foreign taxes, including foreign withholding taxes on interest and
dividends. Further, there may be increased risks of delayed settlement of securities purchased or sold by the fund. The risks of investing outside the U.S. may be heightened in connection with investments in emerging markets.
Investing in emerging markets— Investing in emerging markets may involve risks in addition to and greater than those generally associated with investing in the securities markets of developed countries. For instance, emerging market countries may have less developed legal and accounting systems than those in developed countries. The governments of these countries may be less stable and more likely to impose capital controls, nationalize a company or industry, place restrictions on foreign ownership and on withdrawing sale proceeds of securities from the country, and/or impose punitive taxes that could adversely affect the prices of securities. In addition, the economies of these countries may be dependent on relatively few industries that are more susceptible to local and global changes. Securities markets in these countries can also be relatively small and have substantially lower trading volumes. As a result, securities issued in these countries may be more volatile and less liquid, and may be more difficult to value, than securities issued in countries with more developed economies and/or markets. Less certainty with respect to security valuations may lead to additional challenges and risks in calculating the fund’s net asset value. Additionally, emerging markets are more likely to experience problems with the clearing and settling of trades and the holding of securities by banks, agents and depositories that are less established than those in developed countries.
Liquidity risk— Certain fund holdings may be or may become difficult or impossible to sell, particularly during times of market turmoil. Liquidity may be impacted by the lack of an active market for a holding, legal or contractual restrictions on resale, or the reduced number and capacity of market participants to make a market in such holding. Market prices for less liquid or illiquid holdings may be volatile, and reduced liquidity may have an adverse impact on the market price of such holdings. Additionally, the sale of less liquid or illiquid holdings may involve substantial delays (including delays in settlement) and additional costs and the fund may be unable to sell such holdings when necessary to meet its liquidity needs or may be forced to sell at a loss.
Management— The investment adviser to the fund actively manages the fund’s investments. Consequently, the fund is subject to the risk that the methods and analyses, including models, tools and data, employed by the investment adviser in this process may be flawed or incorrect and may not produce the desired results. This could cause the fund to lose value or its investment results to lag relevant benchmarks or other funds with similar objectives.
5. Certain investment techniques
Securities lending— The fund has entered into securities lending transactions in which the fund earns income by lending investment securities to brokers, dealers or other institutions. Each transaction involves three parties: the fund, acting as the lender of the securities, a borrower, and a lending agent that acts as an intermediary.
Securities lending transactions are entered into by the fund under a securities lending agent agreement with the lending agent. The lending agent facilitates the exchange of securities between the lender and approved borrowers, ensures that securities loans are properly coordinated and documented, marks-to-market the value of collateral daily, secures additional collateral from a borrower if it falls below preset terms, and may reinvest cash collateral on behalf of the fund according to agreed parameters. The lending agent provides indemnification to the fund against losses resulting from a borrower default. Although risk is mitigated by the collateral and indemnification, the fund could experience a delay in recovering its securities and a potential loss of income or value if a borrower fails to return securities, collateral investments decline in value or the lending agent fails to perform.
The borrower is required to post highly liquid assets, such as cash or U.S. government securities, as collateral for the loan in an amount at least equal to the value of the securities loaned. Investments made with cash collateral are recognized as assets in the fund’s investment portfolio. The same amount is recorded as a liability in the fund’s statement of assets and liabilities. While securities are on loan, the fund will continue to receive the equivalent of the interest, dividends or other distributions paid by the issuer, as well as a portion of the interest on the investment of the collateral. Additionally, although the fund does not have the right to vote on securities while they are on loan, the fund has a right to consent on corporate actions and a right to recall loaned securities to vote. A borrower is obligated to return loaned securities at the conclusion of a loan or, during the pendency of a loan, on demand from the fund.
As of March 31, 2020, the total value of securities on loan was $632,192,000, and the total value of collateral received was $686,369,000. Collateral received includes cash of $407,122,000 and U.S. government securities of $279,247,000. Investment securities purchased from cash collateral of $407,122,000 are disclosed in the summary investment portfolio as short-term securities. Securities received as collateral, if any, are not recognized as fund assets. The contractual maturity of cash collateral received under the securities lending agreement is classified as overnight and continuous.
Collateral— The fund receives highly liquid assets, such as cash or U.S. government securities, as collateral in exchange for lending investment securities. The purpose of the collateral is to cover potential losses that could occur in the event that the borrower cannot meet its contractual obligation. The lending agent may reinvest cash collateral from securities lending transactions according to agreed parameters. Cash collateral reinvested by the lending agent, if any, is disclosed in the fund’s summary investment portfolio.
6. Taxation and distributions
Federal income taxation— The fund complies with the requirements under Subchapter M of the Internal Revenue Code applicable to mutual funds and intends to distribute substantially all of its net taxable income and net capital gains each year. The fund is not subject to income taxes to the extent such distributions are made. Therefore, no federal income tax provision is required.
As of and during the period ended March 31, 2020, the fund did not have a liability for any unrecognized tax benefits. The fund recognizes interest and penalties, if any, related to unrecognized tax benefits as income tax expense in the statement of operations. During the period, the fund did not incur any significant interest or penalties.
The fund’s tax returns are not subject to examination by federal, state and, if applicable, non-U.S. tax authorities after the expiration of each jurisdiction’s statute of limitations, which is generally three years after the date of filing but can be extended in certain jurisdictions.
Non-U.S. taxation— Dividend and interest income are recorded net of non-U.S. taxes paid. The fund may file withholding tax reclaims in certain jurisdictions to recover a portion of amounts previously withheld. As a result of rulings from European courts, the fund filed for additional reclaims related to prior years. These reclaims are recorded when the amount is known and there are no significant uncertainties on collectability. Gains realized by the fund on the sale of securities in certain countries, if any, may be subject to non-U.S. taxes. If applicable, the fund records an estimated deferred tax liability based on unrealized gains to provide for potential non-U.S. taxes payable upon the sale of these securities.
Distributions— Distributions paid to shareholders are based on net investment income and net realized gains determined on a tax basis, which may differ from net investment income and net realized gains for financial reporting purposes. These differences are due primarily to different treatment for items such as currency gains and losses; short-term capital gains and losses; capital losses related to sales of certain securities within 30 days of purchase; unrealized appreciation of certain investments in securities outside the U.S.; deferred expenses; cost of investments sold and income on certain investments. The fiscal year in which amounts are distributed may differ from the year in which the net investment income and net realized gains are recorded by the fund for financial reporting purposes.
The components of distributable earnings on a tax basis are reported as of the fund’s most recent year-end. As of September 30, 2019, the components of distributable earnings on a tax basis were as follows (dollars in thousands):
| Undistributed long-term capital gains | | $ | 1,982,489 | |
| Post-October capital loss deferral* | | | (379,326 | ) |
| * | This deferral is considered incurred in the subsequent year. |
As of March 31, 2020, the tax basis unrealized appreciation (depreciation) and cost of investments were as follows (dollars in thousands):
| Gross unrealized appreciation on investments | | $ | 10,188,643 | |
| Gross unrealized depreciation on investments | | | (4,752,856 | ) |
| Net unrealized appreciation on investments | | | 5,435,787 | |
| Cost of investments | | | 32,272,915 | |
Tax-basis distributions paid to shareholders from long-term capital gains were as follows (dollars in thousands):
| Share class | | Six months ended
March 31,
2020 | | | Year ended
September 30,
2019 | |
| Class A | | $ | 1,041,216 | | | $ | 1,312,888 | |
| Class C | | | 33,474 | | | | 48,829 | |
| Class T | | | 1 | | | | 1 | |
| Class F-1 | | | 31,740 | | | | 41,462 | |
| Class F-2 | | | 220,843 | | | | 255,099 | |
| Class F-3 | | | 99,063 | | | | 101,976 | |
| Class 529-A | | | 60,724 | | | | 78,608 | |
| Class 529-C | | | 9,039 | | | | 13,747 | |
| Class 529-E | | | 2,675 | | | | 3,645 | |
| Class 529-T | | | 1 | | | | 1 | |
| Class 529-F-1 | | | 6,566 | | | | 8,185 | |
| Class R-1 | | | 1,181 | | | | 1,729 | |
| Class R-2 | | | 26,644 | | | | 36,397 | |
| Class R-2E | | | 1,329 | | | | 1,360 | |
| Class R-3 | | | 34,779 | | | | 47,684 | |
| Class R-4 | | | 34,471 | | | | 48,314 | |
| Class R-5E | | | 2,101 | | | | 1,677 | |
| Class R-5 | | | 16,041 | | | | 22,369 | |
| Class R-6 | | | 361,129 | | | | 410,894 | |
| Total | | $ | 1,983,017 | | | $ | 2,434,865 | |
7. Fees and transactions with related parties
CRMC, the fund’s investment adviser, is the parent company of American Funds Distributors®, Inc. (“AFD”), the principal underwriter of the fund’s shares, and American Funds Service Company® (“AFS”), the fund’s transfer agent. CRMC, AFD and AFS are considered related parties to the fund.
Investment advisory services— The fund has an investment advisory and service agreement with CRMC that provides for monthly fees accrued daily. These fees are based on a series of decreasing annual rates beginning with 0.800% on the first $1 billion of daily net assets and decreasing to 0.589% on such assets in excess of $44 billion. For the six months ended March 31, 2020, the investment advisory services fee was $141,288,000, which was equivalent to an annualized rate of 0.614% of average daily net assets.
Class-specific fees and expenses— Expenses that are specific to individual share classes are accrued directly to the respective share class. The principal class-specific fees and expenses are further described below:
| | Distribution services— The fund has plans of distribution for all share classes, except Class F-2, F-3, R-5E, R-5 and R-6 shares. Under the plans, the board of directors approves certain categories of expenses that are used to finance activities primarily |
| | intended to sell fund shares and service existing accounts. The plans provide for payments, based on an annualized percentage of average daily net assets, ranging from 0.30% to 1.00% as noted in this section. In some cases, the board of directors has limited the amounts that may be paid to less than the maximum allowed by the plans. All share classes with a plan may use up to 0.25% of average daily net assets to pay service fees, or to compensate AFD for paying service fees, to firms that have entered into agreements with AFD to provide certain shareholder services. The remaining amounts available to be paid under each plan are paid to dealers to compensate them for their sales activities. |
| Share class | | Currently approved limits | �� | Plan limits |
| Class A | | | 0.30 | % | | | 0.30 | % |
| Class 529-A | | | 0.30 | | | | 0.50 | |
| Classes C, 529-C and R-1 | | | 1.00 | | | | 1.00 | |
| Class R-2 | | | 0.75 | | | | 1.00 | |
| Class R-2E | | | 0.60 | | | | 0.85 | |
| Classes 529-E and R-3 | | | 0.50 | | | | 0.75 | |
| Classes T, F-1, 529-T, 529-F-1 and R-4 | | | 0.25 | | | | 0.50 | |
| | For Class A and 529-A shares, distribution-related expenses include the reimbursement of dealer and wholesaler commissions paid by AFD for certain shares sold without a sales charge. These share classes reimburse AFD for amounts billed within the prior 15 months but only to the extent that the overall annual expense limits are not exceeded. As of March 31, 2020, there were no unreimbursed expenses subject to reimbursement for Class A or 529-A shares. |
| | |
| | Transfer agent services— The fund has a shareholder services agreement with AFS under which the fund compensates AFS for providing transfer agent services to each of the fund’s share classes. These services include recordkeeping, shareholder communications and transaction processing. In addition, the fund reimburses AFS for amounts paid to third parties for performing transfer agent services on behalf of fund shareholders. |
| | |
| | Administrative services— The fund has an administrative services agreement with CRMC under which the fund compensates CRMC for providing administrative services to all share classes. Administrative services are provided by CRMC and its affiliates to help assist third parties providing non-distribution services to fund shareholders. These services include providing in depth information on the fund and market developments that impact fund investments. Administrative services also include, but are not limited to, coordinating, monitoring and overseeing third parties that provide services to fund shareholders. The agreement provides the fund the ability to charge an administrative services fee at the annual rate of 0.05% of the daily net assets attributable to each share class of the fund. Currently the fund pays CRMC an administrative services fee at the annual rate of 0.03% of daily net assets attributable to each share class of the fund for CRMC’s provision of administrative services. |
| | 529 plan services— Each 529 share class is subject to service fees to compensate the Virginia College Savings Plan (“Virginia529”) for its oversight and administration of the CollegeAmerica 529 college savings plan. The fee is based on the combined net assets invested in Class 529 and ABLE shares of the American Funds. Class ABLE shares are offered on other American Funds by Virginia529 through ABLEAmerica, a tax-advantaged savings program for individuals with disabilities. Prior to January 1, 2020, the quarterly fee was based on a series of decreasing annual rates beginning with 0.10% on the first $20 billion of the combined net assets invested in the American Funds and decreasing to 0.03% on such assets in excess of $100 billion. Effective January 1, 2020, the quarterly fee was amended to a series of decreasing annual rates beginning with 0.09% on the first $20 billion of the combined net assets invested in the American Funds and decreasing to 0.03% on such assets in excess of $100 billion. The fee for any given calendar quarter is accrued and calculated on the basis of the average net assets of Class 529 and ABLE shares of the American Funds for the last month of the prior calendar quarter. The fee is included in other expenses in the fund’s statement of operations. Virginia529 is not considered a related party to the fund. |
| | |
| | For the six months ended March 31, 2020, class-specific expenses under the agreements were as follows (dollars in thousands): |
| Share class | | Distribution
services | | | Transfer agent
services | | | Administrative
services | | | 529 plan
services |
| Class A | | | $30,406 | | | | $16,456 | | | | $3,619 | | | Not applicable |
| Class C | | | 3,275 | | | | 456 | | | | 100 | | | Not applicable |
| Class T | | | — | | | | — | * | | | — | * | | Not applicable |
| Class F-1 | | | 895 | | | | 573 | | | | 108 | | | Not applicable |
| Class F-2 | | | Not applicable | | | | 3,148 | | | | 778 | | | Not applicable |
| Class F-3 | | | Not applicable | | | | 150 | | | | 350 | | | Not applicable |
| Class 529-A | | | 1,573 | | | | 879 | | | | 208 | | | $440 |
| Class 529-C | | | 888 | | | | 117 | | | | 27 | | | 58 |
| Class 529-E | | | 146 | | | | 17 | | | | 9 | | | 19 |
| Class 529-T | | | — | | | | — | * | | | — | * | | —* |
| Class 529-F-1 | | | — | | | | 97 | | | | 23 | | | 48 |
| Class R-1 | | | 122 | | | | 17 | | | | 4 | | | Not applicable |
| Class R-2 | | | 2,040 | | | | 1,012 | | | | 82 | | | Not applicable |
| Class R-2E | | | 91 | | | | 33 | | | | 5 | | | Not applicable |
| Class R-3 | | | 1,905 | | | | 623 | | | | 114 | | | Not applicable |
| Class R-4 | | | 990 | | | | 416 | | | | 119 | | | Not applicable |
| Class R-5E | | | Not applicable | | | | 38 | | | | 8 | | | Not applicable |
| Class R-5 | | | Not applicable | | | | 98 | | | | 57 | | | Not applicable |
| Class R-6 | | | Not applicable | | | | 25 | | | | 1,293 | | | Not applicable |
| Total class-specific expenses | | | $42,331 | | | | $24,155 | | | | $6,904 | | | $565 |
| | * | Amount less than one thousand. |
Directors’ deferred compensation— Directors who are unaffiliated with CRMC may elect to defer the cash payment of part or all of their compensation. These deferred amounts, which remain as liabilities of the fund, are treated as if invested in shares of the fund or other American Funds. These amounts represent general, unsecured liabilities of the fund
and vary according to the total returns of the selected funds. Directors’ compensation of $506,000 in the fund’s statement of operations reflects $301,000 in current fees (either paid in cash or deferred) and a net increase of $205,000 in the value of the deferred amounts.
Affiliated officers and directors— Officers and certain directors of the fund are or may be considered to be affiliated with CRMC, AFD and AFS. No affiliated officers or directors received any compensation directly from the fund.
Investment in CCF— The fund holds shares of CCF, an institutional prime money market fund managed by CRMC. CCF invests in high-quality, short-term money market instruments. CCF is used as the primary investment vehicle for the fund’s short-term investments. CCF shares are only available for purchase by CRMC, its affiliates, and other funds managed by CRMC or its affiliates, and are not available to the public. CRMC does not receive an investment advisory services fee from CCF.
Security transactions with related funds— The fund purchased securities from, and sold securities to, other funds managed by CRMC (or funds managed by certain affiliates of CRMC) under procedures adopted by the fund’s board of directors. The funds involved in such transactions are considered related by virtue of having a common investment adviser (or affiliated investment advisers), common directors and/or common officers. Each transaction was executed at the current market price of the security and no brokerage commissions or fees were paid in accordance with Rule 17a-7 of the 1940 Act. During the six months ended March 31, 2020, the fund engaged in such purchase and sale transactions with related funds in the amounts of $184,205,000 and $138,704,000, respectively, which generated $25,687,000 of net realized gains from such sales.
Interfund lending— Pursuant to an exemptive order issued by the SEC, the fund, along with other CRMC-managed funds (or funds managed by certain affiliates of CRMC), may participate in an interfund lending program. The program provides an alternate credit facility that permits the funds to lend or borrow cash for temporary purposes directly to or from one another, subject to the conditions of the exemptive order. The fund did not lend or borrow cash through the interfund lending program at any time during the six months ended March 31, 2020.
8. Committed line of credit
The fund participates with other funds managed by CRMC (or funds managed by certain affiliates of CRMC) in a $1.5 billion credit facility (the “line of credit”) to be utilized for temporary purposes to support shareholder redemptions. The fund has agreed to pay commitment fees on its pro-rata portion of the line of credit, which are reflected in other expenses in the fund’s statement of operations. The fund did not borrow on this line of credit at any time during the six months ended March 31, 2020.
9. Capital share transactions
Capital share transactions in the fund were as follows (dollars and shares in thousands):
| | | Sales* | | | Reinvestments of
distributions | | | Repurchases* | | | Net increase
(decrease) | |
| Share class | | Amount | | | Shares | | | Amount | | | Shares | | | Amount | | | Shares | | | Amount | | | Shares | |
| | | | | | | | | | | | | | | | | | | | | | | | | | | | | | | | | |
| Six months ended March 31, 2020 |
| | | | | | | | | | | | | | | | | | | | | | | | | | | | | | | | | |
| Class A | | $ | 1,163,709 | | | | 20,882 | | | $ | 1,027,574 | | | | 17,535 | | | $ | (1,806,637 | ) | | | (33,536 | ) | | $ | 384,646 | | | | 4,881 | |
| Class C | | | 41,862 | | | | 883 | | | | 33,326 | | | | 668 | | | | (118,310 | ) | | | (2,509 | ) | | | (43,122 | ) | | | (958 | ) |
| Class T | | | — | | | | — | | | | — | | | | — | | | | — | | | | — | | | | — | | | | — | |
| Class F-1 | | | 53,769 | | | | 963 | | | | 31,344 | | | | 543 | | | | (100,265 | ) | | | (1,868 | ) | | | (15,152 | ) | | | (362 | ) |
| Class F-2 | | | 787,577 | | | | 14,075 | | | | 214,340 | | | | 3,587 | | | | (848,371 | ) | | | (15,562 | ) | | | 153,546 | | | | 2,100 | |
| Class F-3 | | | 418,738 | | | | 7,403 | | | | 98,775 | | | | 1,666 | | | | (308,316 | ) | | | (5,666 | ) | | | 209,197 | | | | 3,403 | |
| Class 529-A | | | 81,466 | | | | 1,460 | | | | 60,720 | | | | 1,051 | | | | (115,767 | ) | | | (2,105 | ) | | | 26,419 | | | | 406 | |
| Class 529-C | | | 9,951 | | | | 202 | | | | 9,036 | | | | 177 | | | | (30,002 | ) | | | (609 | ) | | | (11,015 | ) | | | (230 | ) |
| Class 529-E | | | 2,619 | | | | 50 | | | | 2,675 | | | | 48 | | | | (6,531 | ) | | | (124 | ) | | | (1,237 | ) | | | (26 | ) |
| Class 529-T | | | — | | | | — | | | | 1 | | | | — | † | | | — | | | | — | | | | 1 | | | | — | † |
| Class 529-F-1 | | | 16,421 | | | | 291 | | | | 6,564 | | | | 112 | | | | (16,799 | ) | | | (303 | ) | | | 6,186 | | | | 100 | |
| Class R-1 | | | 1,676 | | | | 34 | | | | 1,174 | | | | 23 | | | | (3,381 | ) | | | (71 | ) | | | (531 | ) | | | (14 | ) |
| Class R-2 | | | 54,266 | | | | 1,099 | | | | 26,618 | | | | 514 | | | | (98,497 | ) | | | (1,991 | ) | | | (17,613 | ) | | | (378 | ) |
| Class R-2E | | | 4,131 | | | | 74 | | | | 1,329 | | | | 23 | | | | (4,214 | ) | | | (79 | ) | | | 1,246 | | | | 18 | |
| Class R-3 | | | 69,109 | | | | 1,300 | | | | 34,736 | | | | 625 | | | | (139,295 | ) | | | (2,639 | ) | | | (35,450 | ) | | | (714 | ) |
| Class R-4 | | | 59,584 | | | | 1,076 | | | | 34,459 | | | | 593 | | | | (142,888 | ) | | | (2,616 | ) | | | (48,845 | ) | | | (947 | ) |
| Class R-5E | | | 25,769 | | | | 452 | | | | 2,100 | | | | 36 | | | | (6,025 | ) | | | (111 | ) | | | 21,844 | | | | 377 | |
| Class R-5 | | | 23,892 | | | | 415 | | | | 16,026 | | | | 264 | | | | (52,245 | ) | | | (912 | ) | | | (12,327 | ) | | | (233 | ) |
| Class R-6 | | | 999,687 | | | | 18,799 | | | | 361,112 | | | | 6,007 | | | | (424,153 | ) | | | (7,877 | ) | | | 936,646 | | | | 16,929 | |
| Total net increase (decrease) | | $ | 3,814,226 | | | | 69,458 | | | $ | 1,961,909 | | | | 33,472 | | | $ | (4,221,696 | ) | | | (78,578 | ) | | $ | 1,554,439 | | | | 24,352 | |
| | | Sales* | | | Reinvestments of
distributions | | | Repurchases* | | | Net increase
(decrease) | |
| Share class | | Amount | | | Shares | | | Amount | | | Shares | | | Amount | | | Shares | | | Amount | | | Shares | |
| | | | | | | | | | | | | | | | | | | | | | | | | | | | | | | | | |
| Year ended September 30, 2019 |
| | | | | | | | | | | | | | | | | | | | | | | | | | | | | | | | | |
| Class A | | $ | 2,210,172 | | | | 41,086 | | | $ | 1,295,479 | | | | 29,112 | | | $ | (2,802,018 | ) | | | (52,309 | ) | | $ | 703,633 | | | | 17,889 | |
| Class C | | | 83,003 | | | | 1,786 | | | | 48,619 | | | | 1,265 | | | | (194,247 | ) | | | (4,184 | ) | | | (62,625 | ) | | | (1,133 | ) |
| Class T | | | — | | | | — | | | | — | | | | — | | | | — | | | | — | | | | — | | | | — | |
| Class F-1 | | | 131,775 | | | | 2,486 | | | | 41,002 | | | | 933 | | | | (183,796 | ) | | | (3,464 | ) | | | (11,019 | ) | | | (45 | ) |
| Class F-2 | | | 1,677,011 | | | | 30,466 | | | | 247,799 | | | | 5,478 | | | | (1,178,290 | ) | | | (21,714 | ) | | | 746,520 | | | | 14,230 | |
| Class F-3 | | | 697,343 | | | | 12,871 | | | | 99,562 | | | | 2,221 | | | | (389,445 | ) | | | (7,176 | ) | | | 407,460 | | | | 7,916 | |
| Class 529-A | | | 145,986 | | | | 2,749 | | | | 78,590 | | | | 1,789 | | | | (216,308 | ) | | | (4,052 | ) | | | 8,268 | | | | 486 | |
| Class 529-C | | | 20,384 | | | | 430 | | | | 13,744 | | | | 351 | | | | (59,717 | ) | | | (1,259 | ) | | | (25,589 | ) | | | (478 | ) |
| Class 529-E | | | 5,289 | | | | 102 | | | | 3,643 | | | | 86 | | | | (10,326 | ) | | | (201 | ) | | | (1,394 | ) | | | (13 | ) |
| Class 529-T | | | — | | | | — | | | | 1 | | | | — | † | | | — | | | | — | | | | 1 | | | | — | † |
| Class 529-F-1 | | | 34,950 | | | | 643 | | | | 8,167 | | | | 183 | | | | (24,157 | ) | | | (449 | ) | | | 18,960 | | | | 377 | |
| Class R-1 | | | 3,828 | | | | 80 | | | | 1,728 | | | | 43 | | | | (8,597 | ) | | | (177 | ) | | | (3,041 | ) | | | (54 | ) |
| Class R-2 | | | 104,191 | | | | 2,172 | | | | 36,387 | | | | 914 | | | | (165,221 | ) | | | (3,426 | ) | | | (24,643 | ) | | | (340 | ) |
| Class R-2E | | | 11,018 | | | | 205 | | | | 1,360 | | | | 31 | | | | (5,877 | ) | | | (110 | ) | | | 6,501 | | | | 126 | |
| Class R-3 | | | 143,974 | | | | 2,805 | | | | 47,647 | | | | 1,123 | | | | (221,232 | ) | | | (4,315 | ) | | | (29,611 | ) | | | (387 | ) |
| Class R-4 | | | 119,255 | | | | 2,231 | | | | 48,251 | | | | 1,094 | | | | (207,111 | ) | | | (3,874 | ) | | | (39,605 | ) | | | (549 | ) |
| Class R-5E | | | 31,748 | | | | 583 | | | | 1,676 | | | | 38 | | | | (19,103 | ) | | | (377 | ) | | | 14,321 | | | | 244 | |
| Class R-5 | | | 45,772 | | | | 826 | | | | 22,355 | | | | 487 | | | | (98,305 | ) | | | (1,767 | ) | | | (30,178 | ) | | | (454 | ) |
| Class R-6 | | | 1,571,194 | | | | 28,468 | | | | 410,894 | | | | 9,043 | | | | (562,953 | ) | | | (10,340 | ) | | | 1,419,135 | | | | 27,171 | |
| Total net increase (decrease) | | $ | 7,036,893 | | | | 129,989 | | | $ | 2,406,904 | | | | 54,191 | | | $ | (6,346,703 | ) | | | (119,194 | ) | | $ | 3,097,094 | | | | 64,986 | |
| * | Includes exchanges between share classes of the fund. |
| † | Amount less than one thousand. |
10. Investment transactions
The fund made purchases and sales of investment securities, excluding short-term securities and U.S. government obligations, if any, of $8,734,317,000 and $8,771,075,000, respectively, during the six months ended March 31, 2020.
Financial highlights
| | | | | | (Loss) income from investment operations1 |
| Period ended | | Net asset
value,
beginning
of period | | | Net
investment
(loss)
income | | | Net (losses)
gains on
securities (both
realized and
unrealized) | | | Total from
investment
operations | |
| Class A: | | | | | | | | | | | | | | | | |
| 3/31/20205,6 | | $ | 55.24 | | | $ | (.05 | ) | | $ | (7.15 | ) | | $ | (7.20 | ) |
| 9/30/2019 | | | 60.19 | | | | .05 | | | | (1.69 | ) | | | (1.64 | ) |
| 9/30/2018 | | | 55.60 | | | | .04 | | | | 7.05 | | | | 7.09 | |
| 9/30/2017 | | | 47.24 | | | | .07 | | | | 8.45 | | | | 8.52 | |
| 9/30/2016 | | | 45.04 | | | | .04 | | | | 4.99 | | | | 5.03 | |
| 9/30/2015 | | | 48.66 | | | | .04 | | | | 1.09 | | | | 1.13 | |
| Class C: | | | | | | | | | | | | | | | | |
| 3/31/20205,6 | | | 47.42 | | | | (.22 | ) | | | (6.02 | ) | | | (6.24 | ) |
| 9/30/2019 | | | 52.63 | | | | (.32 | ) | | | (1.58 | ) | | | (1.90 | ) |
| 9/30/2018 | | | 49.30 | | | | (.38 | ) | | | 6.21 | | | | 5.83 | |
| 9/30/2017 | | | 42.08 | | | | (.29 | ) | | | 7.51 | | | | 7.22 | |
| 9/30/2016 | | | 40.73 | | | | (.29 | ) | | | 4.47 | | | | 4.18 | |
| 9/30/2015 | | | 44.77 | | | | (.32 | ) | | | 1.03 | | | | .71 | |
| Class T: | | | | | | | | | | | | | | | | |
| 3/31/20205,6 | | | 55.54 | | | | .02 | | | | (7.20 | ) | | | (7.18 | ) |
| 9/30/2019 | | | 60.35 | | | | .18 | | | | (1.68 | ) | | | (1.50 | ) |
| 9/30/2018 | | | 55.64 | | | | .15 | | | | 7.06 | | | | 7.21 | |
| 9/30/20175,11 | | | 49.61 | | | | .13 | | | | 5.90 | | | | 6.03 | |
| Class F-1: | | | | | | | | | | | | | | | | |
| 3/31/20205,6 | | | 54.51 | | | | (.05 | ) | | | (7.05 | ) | | | (7.10 | ) |
| 9/30/2019 | | | 59.47 | | | | .03 | | | | (1.68 | ) | | | (1.65 | ) |
| 9/30/2018 | | | 55.00 | | | | — | 12 | | | 6.97 | | | | 6.97 | |
| 9/30/2017 | | | 46.74 | | | | .05 | | | | 8.36 | | | | 8.41 | |
| 9/30/2016 | | | 44.60 | | | | .03 | | | | 4.94 | | | | 4.97 | |
| 9/30/2015 | | | 48.23 | | | | .04 | | | | 1.08 | | | | 1.12 | |
| Class F-2: | | | | | | | | | | | | | | | | |
| 3/31/20205,6 | | | 56.26 | | | | .03 | | | | (7.31 | ) | | | (7.28 | ) |
| 9/30/2019 | | | 61.07 | | | | .20 | | | | (1.70 | ) | | | (1.50 | ) |
| 9/30/2018 | | | 56.24 | | | | .20 | | | | 7.13 | | | | 7.33 | |
| 9/30/2017 | | | 47.80 | | | | .19 | | | | 8.54 | | | | 8.73 | |
| 9/30/2016 | | | 45.42 | | | | .16 | | | | 5.05 | | | | 5.21 | |
| 9/30/2015 | | | 48.92 | | | | .17 | | | | 1.08 | | | | 1.25 | |
| Class F-3: | | | | | | | | | | | | | | | | |
| 3/31/20205,6 | | | 55.80 | | | | .06 | | | | (7.25 | ) | | | (7.19 | ) |
| 9/30/2019 | | | 60.54 | | | | .25 | | | | (1.68 | ) | | | (1.43 | ) |
| 9/30/2018 | | | 55.74 | | | | .24 | | | | 7.06 | | | | 7.30 | |
| 9/30/20175,13 | | | 47.93 | | | | .25 | | | | 7.56 | | | | 7.81 | |
| Dividends and distributions | | | | | | | | | | | | | | | | | | | |
Dividends
(from net
investment
income) | | | Distributions
(from capital
gains) | | | Total
dividends
and
distributions | | | Net asset
value, end
of period | | | Total return2,3 | | | Net assets,
end of
period
(in
millions) | | | Ratio of
expenses to
average net
assets before
reimburse-
ments4 | | | Ratio of
expenses to
average net
assets after
reimburse-
ments3,4 | | | Ratio of net
(loss) income
to average
net assets3 | |
| | | | | | | | | | | | | | | | | | | | | | | | | | |
| $ | — | | | $ | (2.49 | ) | | $ | (2.49 | ) | | $ | 45.55 | | | | (14.03 | )%7 | | $ | 19,356 | | | | 1.06 | %8 | | | 1.06 | %8 | | | (.18 | )%8 |
| | — | | | | (3.31 | ) | | | (3.31 | ) | | | 55.24 | | | | (1.37 | ) | | | 23,203 | | | | 1.06 | | | | 1.06 | | | | .09 | |
| | — | | | | (2.50 | ) | | | (2.50 | ) | | | 60.19 | | | | 13.13 | | | | 24,203 | | | | 1.04 | | | | 1.04 | | | | .06 | |
| | (.16 | ) | | | — | | | | (.16 | ) | | | 55.60 | | | | 18.11 | | | | 21,383 | | | | 1.07 | | | | 1.07 | | | | .14 | |
| | — | | | | (2.83 | ) | | | (2.83 | ) | | | 47.24 | | | | 11.72 | | | | 18,762 | | | | 1.10 | | | | 1.10 | | | | .08 | |
| | — | | | | (4.75 | ) | | | (4.75 | ) | | | 45.04 | | | | 2.25 | | | | 16,882 | | | | 1.07 | | | | 1.07 | | | | .08 | |
| | | | | | | | | | | | | | | | | | | | | | | | | | | | | | | | | | | |
| | — | | | | (2.49 | ) | | | (2.49 | ) | | | 38.69 | | | | (14.33 | )7 | | | 512 | | | | 1.80 | 8 | | | 1.80 | 8 | | | (.91 | )8 |
| | — | | | | (3.31 | ) | | | (3.31 | ) | | | 47.42 | | | | (2.13 | ) | | | 673 | | | | 1.82 | | | | 1.82 | | | | (.68 | ) |
| | — | | | | (2.50 | ) | | | (2.50 | ) | | | 52.63 | | | | 12.23 | | | | 807 | | | | 1.83 | | | | 1.83 | | | | (.74 | ) |
| | — | | | | — | | | | — | | | | 49.30 | | | | 17.16 | | | | 810 | | | | 1.87 | | | | 1.87 | | | | (.66 | ) |
| | — | | | | (2.83 | ) | | | (2.83 | ) | | | 42.08 | | | | 10.82 | | | | 824 | | | | 1.90 | | | | 1.90 | | | | (.73 | ) |
| | — | | | | (4.75 | ) | | | (4.75 | ) | | | 40.73 | | | | 1.45 | | | | 847 | | | | 1.87 | | | | 1.87 | | | | (.73 | ) |
| | | | | | | | | | | | | | | | | | | | | | | | | | | | | | | | | | | |
| | — | | | | (2.49 | ) | | | (2.49 | ) | | | 45.87 | | | | (13.92 | )7,9 | | | — | 10 | | | .81 | 8,9 | | | .81 | 8,9 | | | .08 | 8,9 |
| | — | | | | (3.31 | ) | | | (3.31 | ) | | | 55.54 | | | | (1.14 | )9 | | | — | 10 | | | .82 | 9 | | | .82 | 9 | | | .33 | 9 |
| | — | | | | (2.50 | ) | | | (2.50 | ) | | | 60.35 | | | | 13.36 | 9 | | | — | 10 | | | .85 | 9 | | | .85 | 9 | | | .25 | 9 |
| | — | | | | — | | | | — | | | | 55.64 | | | | 12.15 | 7,9 | | | — | 10 | | | .42 | 7,9 | | | .42 | 7,9 | | | .25 | 7,9 |
| | | | | | | | | | | | | | | | | | | | | | | | | | | | | | | | | | | |
| | — | | | | (2.49 | ) | | | (2.49 | ) | | | 44.92 | | | | (14.04 | )7 | | | 563 | | | | 1.08 | 8 | | | 1.08 | 8 | | | (.19 | )8 |
| | — | | | | (3.31 | ) | | | (3.31 | ) | | | 54.51 | | | | (1.43 | ) | | | 703 | | | | 1.10 | | | | 1.10 | | | | .05 | |
| | — | | | | (2.50 | ) | | | (2.50 | ) | | | 59.47 | | | | 13.06 | | | | 770 | | | | 1.09 | | | | 1.09 | | | | .01 | |
| | (.15 | ) | | | — | | | | (.15 | ) | | | 55.00 | | | | 18.06 | | | | 792 | | | | 1.10 | | | | 1.10 | | | | .11 | |
| | — | | | | (2.83 | ) | | | (2.83 | ) | | | 46.74 | | | | 11.69 | | | | 718 | | | | 1.11 | | | | 1.11 | | | | .07 | |
| | — | | | | (4.75 | ) | | | (4.75 | ) | | | 44.60 | | | | 2.25 | | | | 662 | | | | 1.07 | | | | 1.07 | | | | .08 | |
| | | | | | | | | | | | | | | | | | | | | | | | | | | | | | | | | | | |
| | — | | | | (2.49 | ) | | | (2.49 | ) | | | 46.49 | | | | (13.91 | )7 | | | 4,154 | | | | .79 | 8 | | | .79 | 8 | | | .09 | 8 |
| | — | | | | (3.31 | ) | | | (3.31 | ) | | | 56.26 | | | | (1.12 | ) | | | 4,909 | | | | .80 | | | | .80 | | | | .36 | |
| | — | | | | (2.50 | ) | | | (2.50 | ) | | | 61.07 | | | | 13.41 | | | | 4,459 | | | | .78 | | | | .78 | | | | .34 | |
| | (.29 | ) | | | — | | | | (.29 | ) | | | 56.24 | | | | 18.40 | | | | 2,894 | | | | .82 | | | | .82 | | | | .38 | |
| | — | | | | (2.83 | ) | | | (2.83 | ) | | | 47.80 | | | | 12.03 | | | | 2,118 | | | | .82 | | | | .82 | | | | .36 | |
| | — | | | | (4.75 | ) | | | (4.75 | ) | | | 45.42 | | | | 2.50 | | | | 1,487 | | | | .82 | | | | .82 | | | | .35 | |
| | | | | | | | | | | | | | | | | | | | | | | | | | | | | | | | | | | |
| | — | | | | (2.49 | ) | | | (2.49 | ) | | | 46.12 | | | | (13.87 | )7 | | | 1,936 | | | | .69 | 8 | | | .69 | 8 | | | .20 | 8 |
| | — | | | | (3.31 | ) | | | (3.31 | ) | | | 55.80 | | | | (1.02 | ) | | | 2,153 | | | | .70 | | | | .70 | | | | .46 | |
| | — | | | | (2.50 | ) | | | (2.50 | ) | | | 60.54 | | | | 13.49 | | | | 1,856 | | | | .71 | | | | .71 | | | | .41 | |
| | — | | | | — | | | | — | | | | 55.74 | | | | 16.30 | 7 | | | 1,221 | | | | .71 | 8 | | | .71 | 8 | | | .70 | 8 |
See end of table for footnotes.
Financial highlights(continued)
| | | | | | (Loss) income from investment operations1 |
| Period ended | | Net asset
value,
beginning
of period | | | Net
investment
(loss)
income | | | Net (losses)
gains on
securities (both
realized and
unrealized) | | | Total from
investment
operations | |
| Class 529-A: | | | | | | | | | | | | | | | | |
| 3/31/20205,6 | | $ | 54.51 | | | $ | (.06 | ) | | $ | (7.04 | ) | | $ | (7.10 | ) |
| 9/30/2019 | | | 59.47 | | | | .02 | | | | (1.67 | ) | | | (1.65 | ) |
| 9/30/2018 | | | 55.01 | | | | — | 12 | | | 6.96 | | | | 6.96 | |
| 9/30/2017 | | | 46.74 | | | | .04 | | | | 8.36 | | | | 8.40 | |
| 9/30/2016 | | | 44.63 | | | | — | 12 | | | 4.94 | | | | 4.94 | |
| 9/30/2015 | | | 48.29 | | | | — | | | | 1.09 | | | | 1.09 | |
| Class 529-C: | | | | | | | | | | | | | | | | |
| 3/31/20205,6 | | | 48.35 | | | | (.23 | ) | | | (6.16 | ) | | | (6.39 | ) |
| 9/30/2019 | | | 53.60 | | | | (.34 | ) | | | (1.60 | ) | | | (1.94 | ) |
| 9/30/2018 | | | 50.18 | | | | (.42 | ) | | | 6.34 | | | | 5.92 | |
| 9/30/2017 | | | 42.85 | | | | (.32 | ) | | | 7.65 | | | | 7.33 | |
| 9/30/2016 | | | 41.45 | | | | (.31 | ) | | | 4.54 | | | | 4.23 | |
| 9/30/2015 | | | 45.50 | | | | (.35 | ) | | | 1.05 | | | | .70 | |
| Class 529-E: | | | | | | | | | | | | | | | | |
| 3/31/20205,6 | | | 52.68 | | | | (.11 | ) | | | (6.78 | ) | | | (6.89 | ) |
| 9/30/2019 | | | 57.73 | | | | (.09 | ) | | | (1.65 | ) | | | (1.74 | ) |
| 9/30/2018 | | | 53.57 | | | | (.12 | ) | | | 6.78 | | | | 6.66 | |
| 9/30/2017 | | | 45.53 | | | | (.06 | ) | | | 8.14 | | | | 8.08 | |
| 9/30/2016 | | | 43.63 | | | | (.09 | ) | | | 4.82 | | | | 4.73 | |
| 9/30/2015 | | | 47.41 | | | | (.11 | ) | | | 1.08 | | | | .97 | |
| Class 529-T: | | | | | | | | | | | | | | | | |
| 3/31/20205,6 | | | 55.49 | | | | .01 | | | | (7.20 | ) | | | (7.19 | ) |
| 9/30/2019 | | | 60.32 | | | | .15 | | | | (1.67 | ) | | | (1.52 | ) |
| 9/30/2018 | | | 55.63 | | | | .13 | | | | 7.06 | | | | 7.19 | |
| 9/30/20175,11 | | | 49.61 | | | | .12 | | | | 5.90 | | | | 6.02 | |
| Class 529-F-1: | | | | | | | | | | | | | | | | |
| 3/31/20205,6 | | | 55.41 | | | | .01 | | | | (7.19 | ) | | | (7.18 | ) |
| 9/30/2019 | | | 60.26 | | | | .15 | | | | (1.69 | ) | | | (1.54 | ) |
| 9/30/2018 | | | 55.58 | | | | .13 | | | | 7.05 | | | | 7.18 | |
| 9/30/2017 | | | 47.23 | | | | .15 | | | | 8.43 | | | | 8.58 | |
| 9/30/2016 | | | 44.98 | | | | .09 | | | | 4.99 | | | | 5.08 | |
| 9/30/2015 | | | 48.53 | | | | .11 | | | | 1.09 | | | | 1.20 | |
| Class R-1: | | | | | | | | | | | | | | | | |
| 3/31/20205,6 | | | 49.08 | | | | (.23 | ) | | | (6.26 | ) | | | (6.49 | ) |
| 9/30/2019 | | | 54.32 | | | | (.33 | ) | | | (1.60 | ) | | | (1.93 | ) |
| 9/30/2018 | | | 50.79 | | | | (.38 | ) | | | 6.41 | | | | 6.03 | |
| 9/30/2017 | | | 43.34 | | | | (.29 | ) | | | 7.74 | | | | 7.45 | |
| 9/30/2016 | | | 41.85 | | | | (.28 | ) | | | 4.60 | | | | 4.32 | |
| 9/30/2015 | | | 45.85 | | | | (.31 | ) | | | 1.06 | | | | .75 | |
| Dividends and distributions | | | | | | | | | | | | | | | | | | | |
Dividends
(from net
investment
income) | | | Distributions
(from capital
gains) | | | Total
dividends
and
distributions | | | Net asset
value, end
of period | | | Total return2,3 | | | Net assets,
end of
period
(in
millions) | | | Ratio of
expenses to
average net
assets before
reimburse-
ments4 | | | Ratio of
expenses to
average net
assets after
reimburse-
ments3,4 | | | Ratio of net
(loss) income
to average
net assets3 | |
| | | | | | | | | | | | | | | | | | | | | | | | | | |
| $ | — | | | $ | (2.49 | ) | | $ | (2.49 | ) | | $ | 44.92 | | | | (14.04 | )%7 | | $ | 1,120 | | | | 1.09 | %8 | | | 1.09 | %8 | | | (.20 | )%8 |
| | — | | | | (3.31 | ) | | | (3.31 | ) | | | 54.51 | | | | (1.43 | ) | | | 1,337 | | | | 1.12 | | | | 1.12 | | | | .03 | |
| | — | | | | (2.50 | ) | | | (2.50 | ) | | | 59.47 | | | | 13.05 | | | | 1,430 | | | | 1.11 | | | | 1.11 | | | | — | 14 |
| | (.13 | ) | | | — | | | | (.13 | ) | | | 55.01 | | | | 18.03 | | | | 1,195 | | | | 1.13 | | | | 1.13 | | | | .08 | |
| | — | | | | (2.83 | ) | | | (2.83 | ) | | | 46.74 | | | | 11.64 | | | | 1,024 | | | | 1.17 | | | | 1.17 | | | | — | 14 |
| | — | | | | (4.75 | ) | | | (4.75 | ) | | | 44.63 | | | | 2.16 | | | | 943 | | | | 1.15 | | | | 1.15 | | | | — | |
| | | | | | | | | | | | | | | | | | | | | | | | | | | | | | | | | | | |
| | — | | | | (2.49 | ) | | | (2.49 | ) | | | 39.47 | | | | (14.36 | )7 | | | 142 | | | | 1.83 | 8 | | | 1.83 | 8 | | | (.95 | )8 |
| | — | | | | (3.31 | ) | | | (3.31 | ) | | | 48.35 | | | | (2.17 | ) | | | 185 | | | | 1.86 | | | | 1.86 | | | | (.72 | ) |
| | — | | | | (2.50 | ) | | | (2.50 | ) | | | 53.60 | | | | 12.19 | | | | 230 | | | | 1.88 | | | | 1.88 | | | | (.81 | ) |
| | — | | | | — | | | | — | | | | 50.18 | | | | 17.11 | | | | 314 | | | | 1.91 | | | | 1.91 | | | | (.70 | ) |
| | — | | | | (2.83 | ) | | | (2.83 | ) | | | 42.85 | | | | 10.78 | | | | 286 | | | | 1.96 | | | | 1.96 | | | | (.78 | ) |
| | — | | | | (4.75 | ) | | | (4.75 | ) | | | 41.45 | | | | 1.37 | | | | 274 | | | | 1.93 | | | | 1.93 | | | | (.78 | ) |
| | | | | | | | | | | | | | | | | | | | | | | | | | | | | | | | | | | |
| | — | | | | (2.49 | ) | | | (2.49 | ) | | | 43.30 | | | | (14.11 | )7 | | | 47 | | | | 1.29 | 8 | | | 1.29 | 8 | | | (.40 | )8 |
| | — | | | | (3.31 | ) | | | (3.31 | ) | | | 52.68 | | | | (1.64 | ) | | | 58 | | | | 1.31 | | | | 1.31 | | | | (.17 | ) |
| | — | | | | (2.50 | ) | | | (2.50 | ) | | | 57.73 | | | | 12.82 | | | | 64 | | | | 1.32 | | | | 1.32 | | | | (.22 | ) |
| | (.04 | ) | | | — | | | | (.04 | ) | | | 53.57 | | | | 17.77 | | | | 59 | | | | 1.35 | | | | 1.35 | | | | (.13 | ) |
| | — | | | | (2.83 | ) | | | (2.83 | ) | | | 45.53 | | | | 11.39 | | | | 53 | | | | 1.38 | | | | 1.38 | | | | (.21 | ) |
| | — | | | | (4.75 | ) | | | (4.75 | ) | | | 43.63 | | | | 1.95 | | | | 49 | | | | 1.38 | | | | 1.38 | | | | (.23 | ) |
| | | | | | | | | | | | | | | | | | | | | | | | | | | | | | | | | | | |
| | — | | | | (2.49 | ) | | | (2.49 | ) | | | 45.81 | | | | (13.95 | )7,9 | | | — | 10 | | | .86 | 8,9 | | | .86 | 8,9 | | | .03 | 8,9 |
| | — | | | | (3.31 | ) | | | (3.31 | ) | | | 55.49 | | | | (1.17 | )9 | | | — | 10 | | | .87 | 9 | | | .87 | 9 | | | .28 | 9 |
| | — | | | | (2.50 | ) | | | (2.50 | ) | | | 60.32 | | | | 13.30 | 9 | | | — | 10 | | | .88 | 9 | | | .88 | 9 | | | .22 | 9 |
| | — | | | | — | | | | — | | | | 55.63 | | | | 12.13 | 7,9 | | | — | 10 | | | .45 | 7,9 | | | .45 | 7,9 | | | .22 | 7,9 |
| | | | | | | | | | | | | | | | | | | | | | | | | | | | | | | | | | | |
| | — | | | | (2.49 | ) | | | (2.49 | ) | | | 45.74 | | | | (13.95 | )7 | | | 126 | | | | .86 | 8 | | | .86 | 8 | | | .02 | 8 |
| | — | | | | (3.31 | ) | | | (3.31 | ) | | | 55.41 | | | | (1.22 | ) | | | 146 | | | | .88 | | | | .88 | | | | .27 | |
| | — | | | | (2.50 | ) | | | (2.50 | ) | | | 60.26 | | | | 13.31 | | | | 136 | | | | .89 | | | | .89 | | | | .22 | |
| | (.23 | ) | | | — | | | | (.23 | ) | | | 55.58 | | | | 18.26 | | | | 113 | | | | .92 | | | | .92 | | | | .30 | |
| | — | | | | (2.83 | ) | | | (2.83 | ) | | | 47.23 | | | | 11.85 | | | | 90 | | | | .96 | | | | .96 | | | | .22 | |
| | — | | | | (4.75 | ) | | | (4.75 | ) | | | 44.98 | | | | 2.42 | | | | 83 | | | | .93 | | | | .93 | | | | .22 | |
| | | | | | | | | | | | | | | | | | | | | | | | | | | | | | | | | | | |
| | — | | | | (2.49 | ) | | | (2.49 | ) | | | 40.10 | | | | (14.35 | )7 | | | 19 | | | | 1.81 | 8 | | | 1.81 | 8 | | | (.93 | )8 |
| | — | | | | (3.31 | ) | | | (3.31 | ) | | | 49.08 | | | | (2.12 | ) | | | 24 | | | | 1.82 | | | | 1.82 | | | | (.68 | ) |
| | — | | | | (2.50 | ) | | | (2.50 | ) | | | 54.32 | | | | 12.26 | | | | 30 | | | | 1.81 | | | | 1.81 | | | | (.72 | ) |
| | — | | | | — | | | | — | | | | 50.79 | | | | 17.19 | | | | 30 | | | | 1.83 | | | | 1.83 | | | | (.63 | ) |
| | — | | | | (2.83 | ) | | | (2.83 | ) | | | 43.34 | | | | 10.89 | | | | 33 | | | | 1.85 | | | | 1.85 | | | | (.68 | ) |
| | — | | | | (4.75 | ) | | | (4.75 | ) | | | 41.85 | | | | 1.48 | | | | 36 | | | | 1.82 | | | | 1.82 | | | | (.68 | ) |
See end of table for footnotes.
Financial highlights(continued)
| | | | | | (Loss) income from investment operations1 | |
| Period ended | | Net asset
value,
beginning
of period | | | Net
investment
(loss)
income | | | Net (losses)
gains on
securities (both
realized and
unrealized) | | | Total from
investment
operations | |
| Class R-2: | | | | | | | | | | | | | | | | |
| 3/31/20205,6 | | $ | 49.12 | | | $ | (.23 | ) | | $ | (6.26 | ) | | $ | (6.49 | ) |
| 9/30/2019 | | | 54.36 | | | | (.31 | ) | | | (1.62 | ) | | | (1.93 | ) |
| 9/30/2018 | | | 50.82 | | | �� | (.37 | ) | | | 6.41 | | | | 6.04 | |
| 9/30/2017 | | | 43.35 | | | | (.27 | ) | | | 7.74 | | | | 7.47 | |
| 9/30/2016 | | | 41.85 | | | | (.27 | ) | | | 4.60 | | | | 4.33 | |
| 9/30/2015 | | | 45.84 | | | | (.29 | ) | | | 1.05 | | | | .76 | |
| Class R-2E: | | | | | | | | | | | | | | | | |
| 3/31/20205,6 | | | 54.34 | | | | (.17 | ) | | | (7.00 | ) | | | (7.17 | ) |
| 9/30/2019 | | | 59.52 | | | | (.18 | ) | | | (1.69 | ) | | | (1.87 | ) |
| 9/30/2018 | | | 55.26 | | | | (.22 | ) | | | 6.98 | | | | 6.76 | |
| 9/30/2017 | | | 47.07 | | | | (.14 | ) | | | 8.40 | | | | 8.26 | |
| 9/30/2016 | | | 45.04 | | | | (.08 | ) | | | 4.94 | | | | 4.86 | |
| 9/30/2015 | | | 48.67 | | | | .01 | | | | 1.11 | | | | 1.12 | |
| Class R-3: | | | | | | | | | | | | | | | | |
| 3/31/20205,6 | | | 52.54 | | | | (.12 | ) | | | (6.76 | ) | | | (6.88 | ) |
| 9/30/2019 | | | 57.60 | | | | (.10 | ) | | | (1.65 | ) | | | (1.75 | ) |
| 9/30/2018 | | | 53.47 | | | | (.14 | ) | | | 6.77 | | | | 6.63 | |
| 9/30/2017 | | | 45.45 | | | | (.07 | ) | | | 8.13 | | | | 8.06 | |
| 9/30/2016 | | | 43.56 | | | | (.09 | ) | | | 4.81 | | | | 4.72 | |
| 9/30/2015 | | | 47.34 | | | | (.10 | ) | | | 1.07 | | | | .97 | |
| Class R-4: | | | | | | | | | | | | | | | | |
| 3/31/20205,6 | | | 54.78 | | | | (.04 | ) | | | (7.08 | ) | | | (7.12 | ) |
| 9/30/2019 | | | 59.71 | | | | .06 | | | | (1.68 | ) | | | (1.62 | ) |
| 9/30/2018 | | | 55.18 | | | | .03 | | | | 7.00 | | | | 7.03 | |
| 9/30/2017 | | | 46.89 | | | | .08 | | | | 8.38 | | | | 8.46 | |
| 9/30/2016 | | | 44.71 | | | | .04 | | | | 4.97 | | | | 5.01 | |
| 9/30/2015 | | | 48.33 | | | | .05 | | | | 1.08 | | | | 1.13 | |
| Class R-5E: | | | | | | | | | | | | | | | | |
| 3/31/20205,6 | | | 55.44 | | | | .02 | | | | (7.19 | ) | | | (7.17 | ) |
| 9/30/2019 | | | 60.26 | | | | .18 | | | | (1.69 | ) | | | (1.51 | ) |
| 9/30/2018 | | | 55.55 | | | | .18 | | | | 7.03 | | | | 7.21 | |
| 9/30/2017 | | | 47.30 | | | | .18 | | | | 8.42 | | | | 8.60 | |
| 9/30/20165,15 | | | 47.09 | | | | .12 | | | | 2.92 | | | | 3.04 | |
| Class R-5: | | | | | | | | | | | | | | | | |
| 3/31/20205,6 | | | 57.16 | | | | .05 | | | | (7.44 | ) | | | (7.39 | ) |
| 9/30/2019 | | | 61.94 | | | | .22 | | | | (1.69 | ) | | | (1.47 | ) |
| 9/30/2018 | | | 56.99 | | | | .21 | | | | 7.24 | | | | 7.45 | |
| 9/30/2017 | | | 48.40 | | | | .24 | | | | 8.64 | | | | 8.88 | |
| 9/30/2016 | | | 45.94 | | | | .18 | | | | 5.11 | | | | 5.29 | |
| 9/30/2015 | | | 49.39 | | | | .20 | | | | 1.10 | | | | 1.30 | |
| Dividends and distributions | | | | | | | | | | | | | | | | | | | |
Dividends
(from net
investment
income) | | | Distributions
(from capital
gains) | | | Total
dividends
and
distributions | | | Net asset
value, end
of period | | | Total return2,3 | | | Net assets,
end of
period
(in
millions) | | | Ratio of
expenses to
average net
assets before
reimburse-
ments4 | | | Ratio of
expenses to
average net
assets after
reimburse-
ments3,4 | | | Ratio of net
(loss) income
to average
net assets3 | |
| | | | | | | | | | | | | | | | | | | | | | | | | | | | | | | | | | | |
| $ | — | | | $ | (2.49 | ) | | $ | (2.49 | ) | | $ | 40.14 | | | | (14.35 | )%7 | | $ | 428 | | | | 1.80 | %8 | | | 1.80 | %8 | | | (.91 | )%8 |
| | — | | | | (3.31 | ) | | | (3.31 | ) | | | 49.12 | | | | (2.12 | ) | | | 542 | | | | 1.79 | | | | 1.79 | | | | (.65 | ) |
| | — | | | | (2.50 | ) | | | (2.50 | ) | | | 54.36 | | | | 12.28 | | | | 619 | | | | 1.79 | | | | 1.79 | | | | (.70 | ) |
| | — | | | | — | | | | — | | | | 50.82 | | | | 17.23 | | | | 628 | | | | 1.80 | | | | 1.80 | | | | (.60 | ) |
| | — | | | | (2.83 | ) | | | (2.83 | ) | | | 43.35 | | | | 10.89 | | | | 616 | | | | 1.84 | | | | 1.84 | | | | (.67 | ) |
| | — | | | | (4.75 | ) | | | (4.75 | ) | | | 41.85 | | | | 1.53 | | | | 632 | | | | 1.79 | | | | 1.79 | | | | (.65 | ) |
| | | | | | | | | | | | | | | | | | | | | | | | | | | | | | | | | | | |
| | — | | | | (2.49 | ) | | | (2.49 | ) | | | 44.68 | | | | (14.21 | )7 | | | 24 | | | | 1.49 | 8 | | | 1.49 | 8 | | | (.60 | )8 |
| | — | | | | (3.31 | ) | | | (3.31 | ) | | | 54.34 | | | | (1.82 | ) | | | 28 | | | | 1.50 | | | | 1.50 | | | | (.34 | ) |
| | — | | | | (2.50 | ) | | | (2.50 | ) | | | 59.52 | | | | 12.61 | | | | 24 | | | | 1.50 | | | | 1.50 | | | | (.38 | ) |
| | (.07 | ) | | | — | | | | (.07 | ) | | | 55.26 | | | | 17.57 | | | | 16 | | | | 1.51 | | | | 1.51 | | | | (.27 | ) |
| | — | | | | (2.83 | ) | | | (2.83 | ) | | | 47.07 | | | | 11.32 | | | | 6 | | | | 1.51 | | | | 1.51 | | | | (.20 | ) |
| | — | | | | (4.75 | ) | | | (4.75 | ) | | | 45.04 | | | | 2.23 | 9 | | | — | 10 | | | 1.26 | 9 | | | 1.26 | 9 | | | .01 | 9 |
| | | | | | | | | | | | | | | | | | | | | | | | | | | | | | | | | | | |
| | — | | | | (2.49 | ) | | | (2.49 | ) | | | 43.17 | | | | (14.15 | )7 | | | 591 | | | | 1.34 | 8 | | | 1.34 | 8 | | | (.45 | )8 |
| | — | | | | (3.31 | ) | | | (3.31 | ) | | | 52.54 | | | | (1.67 | ) | | | 757 | | | | 1.34 | | | | 1.34 | | | | (.20 | ) |
| | — | | | | (2.50 | ) | | | (2.50 | ) | | | 57.60 | | | | 12.79 | | | | 852 | | | | 1.35 | | | | 1.35 | | | | (.25 | ) |
| | (.04 | ) | | | — | | | | (.04 | ) | | | 53.47 | | | | 17.74 | | | | 844 | | | | 1.35 | | | | 1.35 | | | | (.14 | ) |
| | — | | | | (2.83 | ) | | | (2.83 | ) | | | 45.45 | | | | 11.41 | | | | 783 | | | | 1.39 | | | | 1.39 | | | | (.22 | ) |
| | — | | | | (4.75 | ) | | | (4.75 | ) | | | 43.56 | | | | 1.93 | | | | 776 | | | | 1.37 | | | | 1.37 | | | | (.22 | ) |
| | | | | | | | | | | | | | | | | | | | | | | | | | | | | | | | | | | |
| | — | | | | (2.49 | ) | | | (2.49 | ) | | | 45.17 | | | | (14.00 | )7 | | | 609 | | | | 1.03 | 8 | | | 1.03 | 8 | | | (.14 | )8 |
| | — | | | | (3.31 | ) | | | (3.31 | ) | | | 54.78 | | | | (1.37 | ) | | | 791 | | | | 1.04 | | | | 1.04 | | | | .11 | |
| | — | | | | (2.50 | ) | | | (2.50 | ) | | | 59.71 | | | | 13.13 | | | | 894 | | | | 1.04 | | | | 1.04 | | | | .05 | |
| | (.17 | ) | | | — | | | | (.17 | ) | | | 55.18 | | | | 18.12 | | | | 865 | | | | 1.05 | | | | 1.05 | | | | .17 | |
| | — | | | | (2.83 | ) | | | (2.83 | ) | | | 46.89 | | | | 11.76 | | | | 764 | | | | 1.07 | | | | 1.07 | | | | .10 | |
| | — | | | | (4.75 | ) | | | (4.75 | ) | | | 44.71 | | | | 2.27 | | | | 715 | | | | 1.05 | | | | 1.05 | | | | .10 | |
| | | | | | | | | | | | | | | | | | | | | | | | | | | | | | | | | | | |
| | — | | | | (2.49 | ) | | | (2.49 | ) | | | 45.78 | | | | (13.92 | )7 | | | 50 | | | | .82 | 8 | | | .82 | 8 | | | .07 | 8 |
| | — | | | | (3.31 | ) | | | (3.31 | ) | | | 55.44 | | | | (1.16 | ) | | | 39 | | | | .84 | | | | .84 | | | | .32 | |
| | — | | | | (2.50 | ) | | | (2.50 | ) | | | 60.26 | | | | 13.38 | | | | 28 | | | | .84 | | | | .84 | | | | .31 | |
| | (.35 | ) | | | — | | | | (.35 | ) | | | 55.55 | | | | 18.33 | | | | 12 | | | | .84 | | | | .84 | | | | .36 | |
| | — | | | | (2.83 | ) | | | (2.83 | ) | | | 47.30 | | | | 7.01 | 7 | | | — | 10 | | | .96 | 8 | | | .95 | 8 | | | .32 | 8 |
| | | | | | | | | | | | | | | | | | | | | | | | | | | | | | | | | | | |
| | — | | | | (2.49 | ) | | | (2.49 | ) | | | 47.28 | | | | (13.89 | )7 | | | 300 | | | | .72 | 8 | | | .72 | 8 | | | .16 | 8 |
| | — | | | | (3.31 | ) | | | (3.31 | ) | | | 57.16 | | | | (1.06 | ) | | | 376 | | | | .74 | | | | .74 | | | | .40 | |
| | — | | | | (2.50 | ) | | | (2.50 | ) | | | 61.94 | | | | 13.46 | | | | 436 | | | | .75 | | | | .75 | | | | .36 | |
| | (.29 | ) | | | — | | | | (.29 | ) | | | 56.99 | | | | 18.48 | | | | 424 | | | | .75 | | | | .75 | | | | .47 | |
| | — | | | | (2.83 | ) | | | (2.83 | ) | | | 48.40 | | | | 12.09 | | | | 359 | | | | .77 | | | | .77 | | | | .41 | |
| | — | | | | (4.75 | ) | | | (4.75 | ) | | | 45.94 | | | | 2.57 | | | | 474 | | | | .75 | | | | .75 | | | | .40 | |
See end of table for footnotes.
Financial highlights(continued)
| | | | | | (Loss) income from investment operations1 | |
| Period ended | | Net asset
value,
beginning
of period | | | Net
investment
(loss)
income | | | Net (losses)
gains on
securities (both
realized and
unrealized) | | | Total from
investment
operations | |
| Class R-6: | | | | | | | | | | | | | | | | |
| 3/31/20205,6 | | $ | 56.56 | | | $ | .06 | | | $ | (7.35 | ) | | $ | (7.29 | ) |
| 9/30/2019 | | | 61.31 | | | | .26 | | | | (1.70 | ) | | | (1.44 | ) |
| 9/30/2018 | | | 56.40 | | | | .25 | | | | 7.16 | | | | 7.41 | |
| 9/30/2017 | | | 47.93 | | | | .26 | | | | 8.54 | | | | 8.80 | |
| 9/30/2016 | | | 45.49 | | | | .21 | | | | 5.06 | | | | 5.27 | |
| 9/30/2015 | | | 48.93 | | | | .22 | | | | 1.09 | | | | 1.31 | |
| | | Six months
ended
March 31, | | Year ended September 30, |
| | | 20205,6,7 | | 2019 | | 2018 | | 2017 | | 2016 | | 2015 |
| Portfolio turnover rate for all share classes16 | | | 21% | | | | 39% | | | | 35% | | | | 32% | | | | 29% | | | | 33% | |
See notes to financial statements.
| Dividends and distributions | | | | | | | | | | | | | | | | | | | |
Dividends
(from net
investment
income) | | | Distributions
(from capital
gains) | | | Total
dividends
and
distributions | | | Net asset
value, end
of period | | | Total return2,3 | | | Net assets,
end of
period
(in
millions) | | | Ratio of
expenses to
average net
assets before
reimburse-
ments4 | | | Ratio of
expenses to
average net
assets after
reimburse-
ments3,4 | | | Ratio of net
(loss) income
to average
net assets3 | |
| | | | | | | | | | | | | | | | | | | | | | | | | | |
| $ | — | | | $ | (2.49 | ) | | $ | (2.49 | ) | | $ | 46.78 | | | | (13.86 | )%7 | | $ | 7,434 | | | | .67 | %8 | | | .67 | %8 | | | .22 | %8 |
| | — | | | | (3.31 | ) | | | (3.31 | ) | | | 56.56 | | | | (1.02 | ) | | | 8,031 | | | | .69 | | | | .69 | | | | .47 | |
| | — | | | | (2.50 | ) | | | (2.50 | ) | | | 61.31 | | | | 13.53 | | | | 7,039 | | | | .69 | | | | .69 | | | | .42 | |
| | (.33 | ) | | | — | | | | (.33 | ) | | | 56.40 | | | | 18.51 | | | | 5,289 | | | | .70 | | | | .70 | | | | .51 | |
| | — | | | | (2.83 | ) | | | (2.83 | ) | | | 47.93 | | | | 12.15 | | | | 3,403 | | | | .71 | | | | .71 | | | | .48 | |
| | — | | | | (4.75 | ) | | | (4.75 | ) | | | 45.49 | | | | 2.63 | | | | 2,269 | | | | .71 | | | | .71 | | | | .45 | |
| 1 | Based on average shares outstanding. |
| 2 | Total returns exclude any applicable sales charges, including contingent deferred sales charges. |
| 3 | This column reflects the impact, if any, of certain reimbursements from CRMC. During one of the periods shown, CRMC reimbursed a portion of the fund’s transfer agent services fees for certain share classes. |
| 4 | Ratios do not include expenses of any Central Funds. The fund indirectly bears its proportionate share of the expenses of any Central Funds. |
| 5 | Based on operations for a period that is less than a full year. |
| 6 | Unaudited. |
| 7 | Not annualized. |
| 8 | Annualized. |
| 9 | All or a significant portion of assets in this class consisted of seed capital invested by CRMC and/or its affiliates. Fees for distribution services are not charged or accrued on these seed capital assets. If such fees were paid by the fund on seed capital assets, fund expenses would have been higher and net income and total return would have been lower. |
| 10 | Amount less than $1 million. |
| 11 | Class T and 529-T shares began investment operations on April 7, 2017. |
| 12 | Amount less than $.01. |
| 13 | Class F-3 shares began investment operations on January 27, 2017. |
| 14 | Amount less than .01%. |
| 15 | Class R-5E shares began investment operations on November 20, 2015. |
| 16 | Rates do not include the fund’s portfolio activity with respect to any Central Funds. |
As a fund shareholder, you incur two types of costs: (1) transaction costs, such as initial sales charges on purchase payments and contingent deferred sales charges on redemptions (loads), and (2) ongoing costs, including management fees, distribution and service (12b-1) fees, and other expenses. This example is intended to help you understand your ongoing costs (in dollars) of investing in the fund so you can compare these costs with the ongoing costs of investing in other mutual funds. The example is based on an investment of $1,000 invested at the beginning of the period and held for the entire six-month period (October 1, 2019, through March 31, 2020).
Actual expenses:
The first line of each share class in the table on the following page provides information about actual account values and actual expenses. You may use the information in this line, together with the amount you invested, to estimate the expenses that you paid over the period. Simply divide your account value by $1,000 (for example, an $8,600 account value divided by $1,000 = 8.6), then multiply the result by the number in the first line under the heading titled “Expenses paid during period” to estimate the expenses you paid on your account during this period.
Hypothetical example for comparison purposes:
The second line of each share class in the table on the following page provides information about hypothetical account values and hypothetical expenses based on the actual expense ratio for the share class and an assumed rate of return of 5.00% per year before expenses, which is not the actual return of the share class. The hypothetical account values and expenses may not be used to estimate the actual ending account balance or expenses you paid for the period. You may use this information to compare the ongoing costs of investing in the fund and other funds. To do so, compare this 5.00% hypothetical example with the 5.00% hypothetical examples that appear in the shareholder reports of the other funds.
Notes:
Retirement plan participants may be subject to certain fees charged by the plan sponsor, and Class F-1, F-2, F-3 and 529-F-1 shareholders may be subject to fees charged by financial intermediaries, typically ranging from 0.75% to 1.50% of assets annually depending on services offered. You can estimate the impact of these fees by adding the amount of the fees to the total estimated expenses you paid on your account during the period as calculated above. In addition, your ending account value would be lower by the amount of these fees.
Note that the expenses shown in the table on the following page are meant to highlight your ongoing costs only and do not reflect any transactional costs, such as sales charges (loads). Therefore, the second line of each share class in the table is useful in comparing ongoing costs only and will not help you determine the relative total costs of owning different funds. In addition, if these transactional costs were included, your costs would have been higher.
| | | Beginning
account value
10/1/2019 | | | Ending
account value
3/31/2020 | | | Expenses paid
during period* | | | Annualized
expense ratio | |
| Class A – actual return | | $ | 1,000.00 | | | $ | 859.67 | | | $ | 4.93 | | | | 1.06 | % |
| Class A – assumed 5% return | | | 1,000.00 | | | | 1,019.70 | | | | 5.35 | | | | 1.06 | |
| Class C – actual return | | | 1,000.00 | | | | 856.71 | | | | 8.36 | | | | 1.80 | |
| Class C – assumed 5% return | | | 1,000.00 | | | | 1,016.00 | | | | 9.07 | | | | 1.80 | |
| Class T – actual return | | | 1,000.00 | | | | 860.80 | | | | 3.77 | | | | .81 | |
| Class T – assumed 5% return | | | 1,000.00 | | | | 1,020.95 | | | | 4.09 | | | | .81 | |
| Class F-1 – actual return | | | 1,000.00 | | | | 859.63 | | | | 5.02 | | | | 1.08 | |
| Class F-1 – assumed 5% return | | | 1,000.00 | | | | 1,019.60 | | | | 5.45 | | | | 1.08 | |
| Class F-2 – actual return | | | 1,000.00 | | | | 860.86 | | | | 3.68 | | | | .79 | |
| Class F-2 – assumed 5% return | | | 1,000.00 | | | | 1,021.05 | | | | 3.99 | | | | .79 | |
| Class F-3 – actual return | | | 1,000.00 | | | | 861.29 | | | | 3.21 | | | | .69 | |
| Class F-3 – assumed 5% return | | | 1,000.00 | | | | 1,021.55 | | | | 3.49 | | | | .69 | |
| Class 529-A – actual return | | | 1,000.00 | | | | 859.63 | | | | 5.07 | | | | 1.09 | |
| Class 529-A – assumed 5% return | | | 1,000.00 | | | | 1,019.55 | | | | 5.50 | | | | 1.09 | |
| Class 529-C – actual return | | | 1,000.00 | | | | 856.38 | | | | 8.49 | | | | 1.83 | |
| Class 529-C – assumed 5% return | | | 1,000.00 | | | | 1,015.85 | | | | 9.22 | | | | 1.83 | |
| Class 529-E – actual return | | | 1,000.00 | | | | 858.92 | | | | 6.00 | | | | 1.29 | |
| Class 529-E – assumed 5% return | | | 1,000.00 | | | | 1,018.55 | | | | 6.51 | | | | 1.29 | |
| Class 529-T – actual return | | | 1,000.00 | | | | 860.50 | | | | 4.00 | | | | .86 | |
| Class 529-T – assumed 5% return | | | 1,000.00 | | | | 1,020.70 | | | | 4.34 | | | | .86 | |
| Class 529-F-1 – actual return | | | 1,000.00 | | | | 860.46 | | | | 4.00 | | | | .86 | |
| Class 529-F-1 – assumed 5% return | | | 1,000.00 | | | | 1,020.70 | | | | 4.34 | | | | .86 | |
| Class R-1 – actual return | | | 1,000.00 | | | | 856.46 | | | | 8.40 | | | | 1.81 | |
| Class R-1 – assumed 5% return | | | 1,000.00 | | | | 1,015.95 | | | | 9.12 | | | | 1.81 | |
| Class R-2 – actual return | | | 1,000.00 | | | | 856.55 | | | | 8.35 | | | | 1.80 | |
| Class R-2 – assumed 5% return | | | 1,000.00 | | | | 1,016.00 | | | | 9.07 | | | | 1.80 | |
| Class R-2E – actual return | | | 1,000.00 | | | | 857.90 | | | | 6.92 | | | | 1.49 | |
| Class R-2E – assumed 5% return | | | 1,000.00 | | | | 1,017.55 | | | | 7.52 | | | | 1.49 | |
| Class R-3 – actual return | | | 1,000.00 | | | | 858.52 | | | | 6.23 | | | | 1.34 | |
| Class R-3 – assumed 5% return | | | 1,000.00 | | | | 1,018.30 | | | | 6.76 | | | | 1.34 | |
| Class R-4 – actual return | | | 1,000.00 | | | | 859.99 | | | | 4.79 | | | | 1.03 | |
| Class R-4 – assumed 5% return | | | 1,000.00 | | | | 1,019.85 | | | | 5.20 | | | | 1.03 | |
| Class R-5E – actual return | | | 1,000.00 | | | | 860.76 | | | | 3.81 | | | | .82 | |
| Class R-5E – assumed 5% return | | | 1,000.00 | | | | 1,020.90 | | | | 4.14 | | | | .82 | |
| Class R-5 – actual return | | | 1,000.00 | | | | 861.11 | | | | 3.35 | | | | .72 | |
| Class R-5 – assumed 5% return | | | 1,000.00 | | | | 1,021.40 | | | | 3.64 | | | | .72 | |
| Class R-6 – actual return | | | 1,000.00 | | | | 861.36 | | | | 3.12 | | | | .67 | |
| Class R-6 – assumed 5% return | | | 1,000.00 | | | | 1,021.65 | | | | 3.39 | | | | .67 | |
| * | The “expenses paid during period” are equal to the “annualized expense ratio,” multiplied by the average account value over the period, multiplied by the number of days in the period, and divided by 366 (to reflect the one-half year period). |
Liquidity Risk Management Program
The fund has adopted a liquidity risk management program (the “program”). The fund’s board has designated Capital Research and Management Company (“CRMC”) as the administrator of the program. Personnel of CRMC or its affiliates conduct the day-to-day operation of the program pursuant to policies and procedures administered by the Capital Group Liquidity Risk Management Committee.
Under the program, CRMC manages the fund’s liquidity risk, which is the risk that the fund could not meet shareholder redemption requests without significant dilution of remaining shareholders’ interests in the fund. This risk is managed by monitoring the degree of liquidity of the fund’s investments, limiting the amount of the fund’s illiquid investments, and utilizing various risk management tools and facilities available to the fund for meeting shareholder redemptions, among other means. CRMC’s process of determining the degree of liquidity of the fund’s investments is supported by one or more third-party liquidity assessment vendors.
The fund’s board reviewed a report prepared by CRMC regarding the operation and effectiveness of the program for the period December 1, 2018, through September 30, 2019. No significant liquidity events impacting the fund were noted in the report. In addition, CRMC provided its assessment that the program had been effective in managing the fund’s liquidity risk.
This page was intentionally left blank.
This page was intentionally left blank.
This page was intentionally left blank.
This page was intentionally left blank.
This page was intentionally left blank.
Office of the fund
6455 Irvine Center Drive
Irvine, CA 92618-4518
Investment adviser
Capital Research and Management Company
333 South Hope Street
Los Angeles, CA 90071-1406
Transfer agent for shareholder accounts
American Funds Service Company
(Write to the address near you.)
P.O. Box 6007
Indianapolis, IN 46206-6007
P.O. Box 2280
Norfolk, VA 23501-2280
Custodian of assets
State Street Bank and Trust Company
One Lincoln Street
Boston, MA 02111
Counsel
Dechert LLP
One Bush Street, Suite 1600
San Francisco, CA 94104-4446
Independent registered public accounting firm
Deloitte & Touche LLP
695 Town Center Drive
Suite 1000
Costa Mesa, CA 92626-7188
Principal underwriter
American Funds Distributors, Inc.
333 South Hope Street
Los Angeles, CA 90071-1406
Investors should carefully consider investment objectives, risks, charges and expenses. This and other important information is contained in the fund prospectus and summary prospectus, which can be obtained from your financial professional and should be read carefully before investing. You may also call American Funds Service Company (AFS) at (800) 421-4225 or visit the Capital Group website at capitalgroup.com.
“American Funds Proxy Voting Procedures and Principles” — which describes how we vote proxies relating to portfolio securities — is available on our website or upon request by calling AFS. The fund files its proxy voting record with the U.S. Securities and Exchange Commission (SEC) for the 12 months ended June 30 by August 31. The proxy voting record is available free of charge on the SEC website at sec.gov and on our website.
A complete March 31, 2020, portfolio of SMALLCAP World Fund’s investments is available free of charge by calling AFS or visiting the SEC website (where it is part of Form N-CSR).
SMALLCAP World Fund files a complete list of its portfolio holdings with the SEC for the first and third quarters of each fiscal year on Form NPORT-P. This filing is available free of charge on the SEC website. Additionally, the list of portfolio holdings is available by calling AFS.
This report is for the information of shareholders of SMALLCAP World Fund, but it also may be used as sales literature when preceded or accompanied by the current prospectus or summary prospectus, which gives details about charges, expenses, investment objectives and operating policies of the fund. If used as sales material after June 30, 2020, this report must be accompanied by an American Funds statistical update for the most recently completed calendar quarter.
MSCI has not approved, reviewed or produced this report, makes no express or implied warranties or representations and is not liable whatsoever for any data in the report. You may not redistribute the MSCI data or use it as a basis for other indices or investment products.
American Funds Distributors, Inc., member FINRA.
The Capital Advantage®
Since 1931, Capital Group, home of American Funds, has helped investors pursue long-term investment success. Our consistent approach — in combination with The Capital SystemSM— has resulted in superior outcomes.
| | Aligned with investor success |
| | We base our decisions on a long-term perspective, which we believe aligns our goals with the interests of our clients. Our portfolio managers average 28 years of investment experience, including 22 years at our company, reflecting a career commitment to our long-term approach.1 |
| | |
| | The Capital System |
| | The Capital System combines individual accountability with teamwork. Funds using The Capital System are divided into portions that are managed independently by investment professionals with diverse backgrounds, ages and investment approaches. An extensive global research effort is the backbone of our system. |
| | |
| | American Funds’ superior outcomes |
| | Equity funds have beaten their Lipper peer indexes in 92% of 10-year periods and 99% of 20-year periods.2Fixed income funds have helped investors achieve diversification through attention to correlation between bonds and equities.3Fund management fees have been among the lowest in the industry.4 |
| | 1 | Portfolio manager experience as of December 31, 2019. |
| | 2 | Based on Class F-2 share results for rolling periods through December 31, 2019. Periods covered are the shorter of the fund’s lifetime or since the comparable Lipper index inception date (except Capital Income Builder and SMALLCAP World Fund, for which the Lipper average was used). Expenses differ for each share class, so results will vary. Visitcapitalgroup.comfor more information on specific expense adjustments and the actual dates of first sale. |
| | 3 | Based on Class F-2 share results as of December 31, 2019. Fifteen of the 17 fixed income American Funds that have been in existence for the three-year period showed a three-year correlation below 0.2. Standard & Poor’s 500 Composite Index was used as an equity market proxy. Correlation based on monthly total returns. Correlation is a statistical measure of how two securities move in relation to each other. A correlation ranges from –1 to 1. A positive correlation close to 1 implies that as one security moves, either up or down, the other security will move in “lockstep,” in the same direction. A negative correlation close to –1 indicates that the securities have moved in the opposite direction. |
| | 4 | On average, our management fees were in the lowest quintile 65% of the time, based on the 20-year period ended December 31, 2019, versus comparable Lipper categories, excluding funds of funds. |
Class F-2 shares were first offered on August 1, 2008. Class F-2 share results prior to the date of first sale are hypothetical based on the results of the original share class of the fund without a sales charge, adjusted for typical estimated expenses. Results for certain funds with an inception date after August 1, 2008, also include hypothetical returns because those funds’ Class F-2 shares sold after the funds’ date of first offering. Visitcapitalgroup.comfor more information on specific expense adjustments and the actual dates of first sale.
All Capital Group trademarks mentioned are owned by The Capital Group Companies, Inc., an affiliated company or fund. All other company and product names mentioned are the property of their respective companies.

ITEM 2 – Code of Ethics
Not applicable for filing of semi-annual reports to shareholders.
ITEM 3 – Audit Committee Financial Expert
Not applicable for filing of semi-annual reports to shareholders.
ITEM 4 – Principal Accountant Fees and Services
Not applicable for filing of semi-annual reports to shareholders.
ITEM 5 – Audit Committee of Listed Registrants
Not applicable to this Registrant, insofar as the Registrant is not a listed issuer as defined in Rule 10A-3 under the Securities Exchange Act of 1934.
ITEM 6 – Schedule of Investments

SMALLCAP World Fund®
Investment portfolio
March 31, 2020
unaudited
Common stocks 90.30%
Information technology 22.93% | Shares | Value
(000) |
| RingCentral, Inc., Class A1 | 4,552,084 | $964,632 |
| MongoDB, Inc., Class A1 | 2,983,206 | 407,327 |
| DocuSign, Inc.1 | 2,880,937 | 266,199 |
| Smartsheet Inc., Class A1,2 | 5,990,800 | 248,678 |
| Alteryx, Inc., Class A1 | 2,244,100 | 213,571 |
| Paycom Software, Inc.1 | 982,669 | 198,509 |
| SimCorp AS2,3 | 2,337,850 | 196,763 |
| Network International Holdings PLC1,2,3 | 37,313,163 | 183,121 |
| TeamViewer AG1,3 | 4,461,586 | 178,530 |
| Cree, Inc.1 | 4,988,138 | 176,879 |
| Netcompany Group AS, non-registered shares1,2,3 | 3,279,837 | 152,760 |
| EPAM Systems, Inc.1 | 817,200 | 151,721 |
| Net One Systems Co., Ltd.2,3 | 6,879,958 | 143,109 |
| Ceridian HCM Holding Inc.1 | 2,851,343 | 142,767 |
| Inphi Corp.1 | 1,718,754 | 136,074 |
| Alarm.Com Holdings, Inc.1,2 | 3,208,000 | 124,823 |
| CANCOM SE, non-registered shares2,3 | 2,878,806 | 123,498 |
| Square, Inc., Class A1 | 2,274,730 | 119,150 |
| Kingdee International Software Group Co. Ltd.3 | 86,321,093 | 114,597 |
| Bottomline Technologies, Inc.1,2 | 3,112,000 | 114,055 |
| WiseTech Global Ltd.3,4 | 10,863,808 | 113,285 |
| Avalara, Inc.1 | 1,506,299 | 112,370 |
| Avast PLC3 | 21,234,000 | 103,343 |
| Carel Industries SpA2,3 | 8,000,000 | 101,748 |
| BE Semiconductor Industries NV3 | 3,309,200 | 100,893 |
| Halma PLC3 | 4,033,862 | 95,839 |
| Douzone Bizon Co., Ltd.3 | 1,393,858 | 91,724 |
| Yext, Inc.1,2 | 8,661,274 | 88,258 |
| Bechtle AG, non-registered shares3 | 661,206 | 86,317 |
| Globant SA1 | 970,531 | 85,290 |
| SVMK Inc.1 | 6,202,609 | 83,797 |
| Vanguard International Semiconductor Corp.3 | 42,615,575 | 83,581 |
| Fortnox AB2,3 | 4,782,746 | 79,038 |
| Appfolio, Inc., Class A1 | 703,777 | 78,084 |
| Euronet Worldwide, Inc.1 | 909,490 | 77,961 |
| MKS Instruments, Inc. | 924,456 | 75,297 |
| Okta, Inc., Class A1 | 581,800 | 71,131 |
| GB Group PLC3 | 9,530,000 | 68,772 |
| Qorvo, Inc.1 | 821,404 | 66,230 |
| Megaport Ltd.1,2,3 | 10,528,000 | 65,928 |
| Cabot Microelectronics Corp. | 565,600 | 64,558 |
| Viavi Solutions Inc.1 | 5,732,000 | 64,256 |
| Kinaxis Inc.1 | 830,418 | 64,254 |
| Silergy Corp.3 | 1,888,060 | 60,737 |
| CDW Corp. | 650,000 | 60,626 |
| Hamamatsu Photonics KK3 | 1,439,850 | 58,935 |
| Pegasystems Inc. | 819,923 | 58,403 |
SMALLCAP World Fund — Page 1 of 17
unaudited
Common stocks (continued)
Information technology (continued) | Shares | Value
(000) |
| Siltronic AG3 | 748,500 | $56,092 |
| Justsystems Corp.3 | 1,218,300 | 55,429 |
| SHIFT Inc.1,2,3,4 | 846,500 | 54,963 |
| Oneconnect Financial Technology Co., Ltd. (ADR)1,4 | 5,294,134 | 53,735 |
| Endava PLC, Class A (ADR)1 | 1,487,998 | 52,318 |
| MACOM Technology Solutions Holdings, Inc.1 | 2,760,000 | 52,247 |
| Sinch AB1,3 | 1,300,045 | 51,240 |
| SUNeVision Holdings Ltd.3 | 88,214,000 | 51,059 |
| Elastic NV, non-registered shares1 | 901,500 | 50,313 |
| Autodesk, Inc.1 | 310,000 | 48,391 |
| Cardtronics PLC, Class A1,2 | 2,302,000 | 48,158 |
| Bravura Solutions Ltd.2,3 | 19,125,000 | 45,017 |
| Computer Services, Inc. | 1,084,411 | 43,626 |
| RealPage, Inc.1 | 817,910 | 43,292 |
| Money Forward, Inc.1,3 | 1,059,052 | 40,439 |
| Aspen Technology, Inc. (USA)1 | 417,000 | 39,644 |
| Nuance Communications, Inc.1 | 2,303,000 | 38,644 |
| SoftwareONE Holding AG1,3 | 1,956,500 | 38,406 |
| Temenos AG3 | 270,000 | 35,404 |
| Nemetschek SE3 | 687,759 | 34,670 |
| Anaplan, Inc.1 | 1,129,467 | 34,178 |
| Cognex Corp. | 800,000 | 33,776 |
| ASM Pacific Technology Ltd.3 | 3,583,779 | 33,438 |
| ON Semiconductor Corp.1 | 2,641,505 | 32,860 |
| BlackLine, Inc.1 | 595,000 | 31,303 |
| eMemory Technology Inc.2,3 | 4,024,334 | 31,283 |
| Nordic Semiconductor ASA1,3 | 6,640,840 | 29,454 |
| Silicon Laboratories Inc.1 | 341,000 | 29,125 |
| Semtech Corp.1 | 774,000 | 29,025 |
| AAC Technologies Holdings Inc.3 | 5,275,000 | 27,184 |
| Yangtze Optical Fibre and Cable Joint Stock Ltd. Co., Class H3,4 | 15,030,000 | 27,112 |
| Novanta Inc.1 | 335,300 | 26,784 |
| RAKUS Co., Ltd.3,4 | 1,813,176 | 26,759 |
| Disco Corp. (Japan)3 | 131,500 | 25,951 |
| Acacia Communications, Inc.1 | 380,000 | 25,528 |
| Venustech Group Inc., Class A3 | 4,797,208 | 25,158 |
| CDK Global, Inc. | 757,216 | 24,875 |
| SUMCO Corp.3 | 1,925,100 | 24,757 |
| QAD Inc., Class A | 616,000 | 24,597 |
| Sansan, Inc.1,3 | 570,400 | 23,677 |
| Coupa Software Inc.1 | 161,500 | 22,566 |
| ALTEN SA, non-registered shares3 | 302,000 | 21,706 |
| AIXTRON SE1,3 | 2,434,518 | 21,381 |
| Tri Chemical Laboratories Inc.3,4 | 296,400 | 20,053 |
| oRo Co., Ltd.3,4 | 804,200 | 19,635 |
| SYNNEX Corp. | 268,000 | 19,591 |
| DraftKings Inc.1,3,5,6 | 5,615,865 | 19,013 |
| LiveRamp Holdings, Inc.1 | 568,700 | 18,722 |
| Faraday Technology Corp.2,3 | 15,370,000 | 18,455 |
| NIIT Technologies Ltd.3 | 1,203,002 | 18,248 |
| Maxlinear, Inc.1 | 1,500,000 | 17,505 |
| TravelSky Technology Ltd., Class H3 | 9,960,000 | 17,481 |
| Zendesk, Inc.1 | 273,000 | 17,475 |
| Smart Metering Systems PLC3,4 | 2,053,096 | 16,921 |
| Trimble Inc.1 | 530,000 | 16,870 |
SMALLCAP World Fund — Page 2 of 17
unaudited
Common stocks (continued)
Information technology (continued) | Shares | Value
(000) |
| NHN KCP Corp.3 | 664,623 | $16,652 |
| INFICON Holding AG3 | 23,396 | 15,244 |
| Veeco Instruments Inc.1 | 1,490,000 | 14,259 |
| Flex Ltd.1 | 1,659,500 | 13,898 |
| EVERTEC, Inc. | 599,690 | 13,631 |
| FDM Group (Holdings) PLC3 | 1,415,000 | 12,953 |
| Fair Isaac Corp.1 | 41,700 | 12,831 |
| Kingboard Holdings Ltd.3 | 5,271,500 | 12,280 |
| TTM Technologies, Inc.1 | 1,167,000 | 12,067 |
| Paylocity Holding Corp.1 | 126,195 | 11,146 |
| Sabre Corp. | 1,867,711 | 11,076 |
| GMO Payment Gateway, Inc.3 | 153,000 | 10,736 |
| Fineos Corp Holdings PLC1,3 | 6,288,063 | 10,508 |
| Smaregi, Inc.1,3,4 | 363,700 | 9,197 |
| Globalwafers Co., Ltd.3 | 777,000 | 8,600 |
| PAR Technology Corp.1,4 | 658,695 | 8,471 |
| Endurance International Group Holdings, Inc.1 | 4,184,420 | 8,076 |
| Jenoptik AG3 | 490,851 | 8,049 |
| Tyro Payments Ltd.1,3,4 | 6,599,336 | 7,576 |
| TeamSpirit Inc.1,3,4 | 450,000 | 7,072 |
| Double Standard Inc.3,4 | 181,100 | 6,836 |
| Datagroup SE3,4 | 120,435 | 6,827 |
| Zebra Technologies Corp., Class A1 | 36,300 | 6,665 |
| eCloudvalley Digital Technology Co., Ltd.3 | 1,340,000 | 6,627 |
| Cloudflare, Inc., Class A1,4 | 264,395 | 6,208 |
| Foursquare Labs, Inc., Series A1,3,5,6,7 | 1,970,385 | 5,891 |
| Teradata Corp.1 | 192,700 | 3,948 |
| Atea ASA3 | 422,042 | 3,573 |
| Zuken Inc.3 | 139,300 | 2,952 |
| Technology One Ltd.3 | 92,891 | 465 |
| | | 8,577,265 |
| Health care 19.31% | | |
| Insulet Corp.1,2 | 3,878,435 | 642,579 |
| Molina Healthcare, Inc.1 | 2,579,100 | 360,326 |
| Haemonetics Corp.1,2 | 2,524,222 | 251,564 |
| Centene Corp.1 | 3,969,978 | 235,856 |
| NovoCure Ltd.1 | 3,480,597 | 234,383 |
| Notre Dame Intermédica Participações SA | 26,440,629 | 228,781 |
| Fisher & Paykel Healthcare Corp. Ltd.3 | 11,321,435 | 205,232 |
| DexCom, Inc.1 | 720,300 | 193,955 |
| Cansino Biologics Inc., Class H1,2,3,4 | 10,552,600 | 169,768 |
| Allakos Inc.1,2,4 | 3,802,533 | 169,175 |
| Mani, Inc.2,3 | 6,830,382 | 167,445 |
| GW Pharmaceuticals PLC (ADR)1,2,4 | 1,703,090 | 149,140 |
| Amplifon SpA3 | 6,641,200 | 136,269 |
| Teladoc Health, Inc.1,4 | 770,000 | 119,358 |
| Integra LifeSciences Holdings Corp.1 | 2,632,175 | 117,579 |
| Cortexyme, Inc.1,2,4 | 2,251,302 | 102,682 |
| Cortexyme, Inc.1,2,3,6 | 76,528 | 3,351 |
| Ambu AS, Class B, non-registered shares3,4 | 4,210,500 | 102,615 |
| Bluebird Bio, Inc.1 | 1,994,320 | 91,659 |
| PRA Health Sciences, Inc.1 | 1,101,150 | 91,440 |
| Ultragenyx Pharmaceutical Inc.1 | 1,989,470 | 88,392 |
| Fagron NV2,3 | 4,464,984 | 88,205 |
SMALLCAP World Fund — Page 3 of 17
unaudited
Common stocks (continued)
Health care (continued) | Shares | Value
(000) |
| Allogene Therapeutics, Inc.1,4 | 3,851,941 | $74,882 |
| Allogene Therapeutics, Inc.1 | 653,594 | 12,706 |
| iRhythm Technologies, Inc.1 | 1,030,650 | 83,843 |
| Galapagos NV1,3 | 418,239 | 82,988 |
| Menicon Co., Ltd.3 | 1,798,500 | 80,381 |
| New Frontier Health Corp., Class A1,2,7 | 9,313,186 | 76,834 |
| Vitrolife AB3 | 5,002,795 | 72,231 |
| Nakanishi Inc.2,3 | 5,332,700 | 70,902 |
| Zai Lab Ltd. (ADR)1 | 1,356,900 | 69,853 |
| Silk Road Medical, Inc.1,2 | 2,085,600 | 65,655 |
| CONMED Corp. | 1,093,000 | 62,596 |
| Natera, Inc.1 | 2,095,580 | 62,574 |
| Sysmex Corp.3 | 859,000 | 62,107 |
| STAAR Surgical Co.1 | 1,918,400 | 61,888 |
| Biohaven Pharmaceutical Holding Co. Ltd.1 | 1,806,900 | 61,489 |
| Pharmaron Beijing Co., Ltd., Class H1,3 | 9,308,000 | 59,836 |
| NuVasive, Inc.1 | 1,166,000 | 59,070 |
| Agilon Health TopCo, Inc.1,3,5,6 | 131,143 | 54,011 |
| Hikma Pharmaceuticals PLC3 | 2,117,000 | 53,367 |
| Exact Sciences Corp.1 | 890,000 | 51,620 |
| MorphoSys AG, non-registered shares1,3 | 510,875 | 51,026 |
| Madrigal Pharmaceuticals, Inc.1 | 742,922 | 49,597 |
| Revance Therapeutics, Inc.1,2 | 3,291,900 | 48,720 |
| Incyte Corp.1 | 640,000 | 46,867 |
| Metropolis Healthcare Ltd.2,3 | 2,780,746 | 46,670 |
| CompuGroup Medical SE3 | 753,500 | 46,366 |
| CryoLife, Inc.1,2 | 2,669,914 | 45,175 |
| Penumbra, Inc.1 | 265,244 | 42,792 |
| Hutchison China MediTech Ltd. (ADR)1 | 2,271,707 | 40,550 |
| Divi’s Laboratories Ltd.3 | 1,500,000 | 39,093 |
| CellaVision AB, non-registered shares2,3 | 1,550,300 | 38,293 |
| Globus Medical, Inc., Class A1 | 896,500 | 38,128 |
| Vir Biotechnology, Inc.1,4 | 1,094,305 | 37,502 |
| Pacific Biosciences of California, Inc.1,2 | 12,242,300 | 37,461 |
| Carl Zeiss Meditec AG, non-registered shares1,3 | 368,406 | 35,795 |
| Glaukos Corp.1,4 | 1,150,322 | 35,499 |
| Revenio Group Oyj, non-registered shares1,2,3 | 1,405,820 | 35,135 |
| Editas Medicine, Inc.1 | 1,760,000 | 34,901 |
| WuXi Biologics (Cayman) Inc.1,3 | 2,672,000 | 34,446 |
| Genmab A/S1,3 | 165,000 | 33,491 |
| Sarepta Therapeutics, Inc.1 | 320,842 | 31,385 |
| Cellectis SA (ADR)1,2 | 2,214,336 | 20,372 |
| Cellectis SA, non-registered shares1,2,3,4 | 1,181,240 | 10,907 |
| Hypera SA, ordinary nominative | 5,561,283 | 30,599 |
| Adaptive Biotechnologies Corp.1,4 | 1,077,200 | 29,925 |
| Genomma Lab Internacional, SAB de CV, Series B1,4 | 35,953,000 | 28,599 |
| Guardant Health, Inc.1 | 409,133 | 28,476 |
| Encompass Health Corp. | 443,400 | 28,391 |
| Abcam PLC3 | 1,900,000 | 27,139 |
| Zealand Pharma A/S1,3 | 741,816 | 25,575 |
| Adaptimmune Therapeutics PLC (ADR)1,2,4 | 9,323,900 | 25,361 |
| Wright Medical Group NV1 | 879,857 | 25,208 |
| Autolus Therapeutics PLC (ADR)1,2,4 | 4,178,494 | 25,029 |
| AddLife AB, Class B3 | 859,875 | 24,905 |
| Acerta Pharma BV1,3,5,6 | 195,556,815 | 24,562 |
SMALLCAP World Fund — Page 4 of 17
unaudited
Common stocks (continued)
Health care (continued) | Shares | Value
(000) |
| Precision BioSciences, Inc.1,2 | 4,062,000 | $24,494 |
| Krka, dd, Novo mesto3 | 335,262 | 24,029 |
| Global Blood Therapeutics, Inc.1,4 | 467,520 | 23,886 |
| Asahi Intecc Co., Ltd.3 | 962,400 | 23,824 |
| Health Catalyst, Inc.1 | 888,900 | 23,245 |
| Gossamer Bio, Inc.1 | 2,262,851 | 22,968 |
| Xenon Pharmaceuticals Inc.1,2,4 | 2,019,226 | 22,898 |
| EM Systems Co., Ltd.3,4 | 2,683,100 | 22,349 |
| Neurocrine Biosciences, Inc.1 | 258,000 | 22,330 |
| Grifols, SA, Class B (ADR) | 616,400 | 12,415 |
| Grifols, SA, Class A, non-registered shares3 | 270,000 | 9,196 |
| Schrodinger, Inc.1 | 500,000 | 21,560 |
| Twist Bioscience Corp.1 | 704,000 | 21,528 |
| BioMarin Pharmaceutical Inc.1 | 250,000 | 21,125 |
| OdontoPrev SA, ordinary nominative | 7,353,900 | 20,493 |
| Ironwood Pharmaceuticals, Inc., Class A1,4 | 2,030,000 | 20,483 |
| Flexion Therapeutics, Inc.1,2,4 | 2,510,700 | 19,759 |
| Addus HomeCare Corp.1 | 290,000 | 19,604 |
| Shockwave Medical, Inc.1 | 585,000 | 19,410 |
| Revolution Medicines, Inc.1 | 869,534 | 19,051 |
| Hangzhou Tigermed Consulting Co., Ltd., Class A3 | 2,107,152 | 18,946 |
| Karuna Therapeutics, Inc.1,4 | 259,000 | 18,648 |
| Chemed Corp. | 42,000 | 18,194 |
| WIN-Partners Co., Ltd.2,3 | 1,936,000 | 17,576 |
| Phreesia, Inc.1 | 768,500 | 16,162 |
| Nevro Corp.1 | 160,000 | 15,997 |
| CRISPR Therapeutics AG1 | 375,000 | 15,904 |
| Hugel, Inc.1,3 | 57,557 | 15,774 |
| NuCana PLC (ADR)1,2,4 | 2,574,816 | 15,011 |
| Alnylam Pharmaceuticals, Inc.1 | 137,700 | 14,989 |
| LivaNova PLC1 | 305,600 | 13,828 |
| Intercept Pharmaceuticals, Inc.1 | 213,137 | 13,419 |
| Sosei Group Corp.1,3,4 | 1,116,200 | 13,318 |
| Black Diamond Therapeutics, Inc.1,4 | 525,000 | 13,099 |
| Fleury SA, ordinary nominative | 3,348,800 | 13,044 |
| Clinuvel Pharmaceuticals Ltd.3,4 | 941,000 | 11,290 |
| Deciphera Pharmaceuticals, Inc.1 | 270,000 | 11,116 |
| Unity Biotechnology, Inc.1,4 | 1,835,000 | 10,643 |
| UDG Healthcare PLC3 | 1,350,127 | 10,552 |
| Medacta Group SA1,3 | 172,600 | 10,164 |
| Genus PLC3 | 246,000 | 10,001 |
| Agios Pharmaceuticals, Inc.1 | 276,600 | 9,814 |
| Rubius Therapeutics, Inc.1 | 2,178,994 | 9,697 |
| Hua Medicine1,3 | 22,418,000 | 8,805 |
| Genfit SA, non-registered shares1,3,4 | 350,509 | 5,229 |
| Genfit SA (ADR)1,4 | 247,100 | 3,561 |
| Arjo AB, Class B3 | 1,749,000 | 8,709 |
| Amvis Holdings, Inc.1,3,4 | 196,600 | 6,796 |
| CELLINK AB, Class B1,3 | 800,000 | 6,692 |
| Creo Medical Group PLC1,3 | 3,457,000 | 4,999 |
| Paramount Bed Holdings Co., Ltd.3 | 107,500 | 4,454 |
| Bausch Health Cos. Inc.1 | 200,000 | 3,100 |
| NMC Health PLC3,5 | 2,363,493 | 1,536 |
| Sage Therapeutics, Inc.1 | 50,900 | 1,462 |
| Neovasc Inc.1,2 | 890,602 | 1,300 |
SMALLCAP World Fund — Page 5 of 17
unaudited
Common stocks (continued)
Health care (continued) | Shares | Value
(000) |
| Piramal Enterprises Ltd.3 | 84,647 | $1,031 |
| Clovis Oncology, Inc.1,4 | 119,000 | 757 |
| | | 7,222,791 |
| Consumer discretionary 14.39% | | |
| Evolution Gaming Group AB2,3 | 10,849,830 | 369,410 |
| Just Eat Takeaway (EUR denominated)1,3 | 2,858,900 | 215,519 |
| Ocado Group PLC1,3 | 11,903,000 | 179,737 |
| Dollarama Inc. | 6,015,000 | 166,862 |
| frontdoor, inc.1,2 | 4,742,274 | 164,936 |
| Trainline PLC1,2,3 | 38,454,440 | 160,843 |
| Helen of Troy Ltd.1 | 983,400 | 141,639 |
| Floor & Decor Holdings, Inc., Class A1 | 4,356,200 | 139,790 |
| Luckin Coffee Inc., Class A (ADR)1,2,4 | 5,080,724 | 138,145 |
| Strategic Education, Inc. | 864,000 | 120,753 |
| TopBuild Corp.1 | 1,593,600 | 114,166 |
| Thor Industries, Inc. | 2,643,692 | 111,511 |
| Five Below, Inc.1 | 1,582,402 | 111,369 |
| Mattel, Inc.1 | 12,260,000 | 108,011 |
| MercadoLibre, Inc.1 | 218,600 | 106,804 |
| Arco Platform Ltd., Class A1 | 2,436,396 | 102,962 |
| Wyndham Hotels & Resorts, Inc. | 3,091,185 | 97,403 |
| Pool Corp. | 483,600 | 95,158 |
| YETI Holdings, Inc.1,2 | 4,790,149 | 93,504 |
| Domino’s Pizza Group PLC2,3 | 26,342,815 | 92,793 |
| Bright Horizons Family Solutions Inc.1 | 871,849 | 88,929 |
| Momo.com Inc.3 | 6,814,000 | 86,228 |
| Grand Canyon Education, Inc.1 | 1,114,200 | 84,997 |
| Freni Brembo SpA3,4 | 10,788,819 | 80,353 |
| GVC Holdings PLC3 | 11,353,694 | 78,813 |
| Moncler SpA3 | 2,120,000 | 77,391 |
| Domino’s Pizza, Inc. | 236,900 | 76,772 |
| Jumbo SA3 | 5,206,161 | 71,111 |
| Gentex Corp. | 3,208,134 | 71,092 |
| zooplus AG, non-registered shares1,2,3,4 | 571,544 | 70,861 |
| Ace Hardware Indonesia Tbk PT3 | 855,750,000 | 68,069 |
| ServiceMaster Global Holdings, Inc.1 | 2,396,000 | 64,692 |
| Jiumaojiu International Holdings Ltd.1,3 | 52,948,000 | 59,685 |
| KB Home | 3,210,519 | 58,110 |
| Brunello Cucinelli SpA3 | 1,608,281 | 48,920 |
| IDP Education Ltd.3 | 6,801,412 | 48,362 |
| Melco International Development Ltd.3 | 33,046,000 | 47,541 |
| Shop Apotheke Europe NV, non-registered shares1,2,3,4 | 804,857 | 45,016 |
| Bygghemma Group First AB1,2,3,4 | 6,670,000 | 41,358 |
| Lennar Corp., Class A | 1,058,458 | 40,433 |
| Lennar Corp., Class B | 21,169 | 612 |
| B2W - Cia. Digital, ordinary nominative1 | 4,372,661 | 40,393 |
| Endurance Technologies Ltd.3 | 5,039,097 | 39,380 |
| POYA International Co., Ltd.3 | 2,795,527 | 39,316 |
| AcadeMedia AB2,3 | 7,897,375 | 38,916 |
| Kontoor Brands, Inc.4 | 1,910,000 | 36,615 |
| ASOS PLC1,3 | 2,380,023 | 35,244 |
| Williams-Sonoma, Inc. | 800,000 | 34,016 |
| China MeiDong Auto Holdings Ltd.3 | 20,000,000 | 31,156 |
| Nien Made Enterprise Co., Ltd.3 | 4,920,000 | 28,963 |
SMALLCAP World Fund — Page 6 of 17
unaudited
Common stocks (continued)
Consumer discretionary (continued) | Shares | Value
(000) |
| MIPS AB3 | 1,195,000 | $26,971 |
| Cairn Homes PLC3 | 35,569,000 | 26,625 |
| MGM China Holdings, Ltd.3,4 | 25,559,704 | 26,025 |
| Tongcheng-Elong Holdings Ltd.1,3,4 | 18,147,800 | 25,397 |
| Kindred Group PLC (SDR)3 | 6,707,442 | 24,999 |
| Cavco Industries, Inc.1 | 170,870 | 24,766 |
| Toll Brothers, Inc. | 1,268,000 | 24,409 |
| Etsy, Inc.1 | 633,000 | 24,333 |
| M.D.C. Holdings, Inc. | 967,528 | 22,447 |
| Wayfair Inc., Class A1,4 | 416,000 | 22,231 |
| Tube Investments of India Ltd.3 | 6,169,000 | 21,986 |
| Levi Strauss & Co., Class A4 | 1,750,000 | 21,752 |
| WH Smith PLC3 | 1,538,000 | 21,723 |
| Relaxo Footwears Ltd.3 | 2,709,720 | 21,449 |
| Stars Group Inc.1,4 | 1,043,400 | 21,306 |
| Paltac Corp.3 | 423,800 | 21,161 |
| Games Workshop Group PLC3 | 382,000 | 20,491 |
| Vivo Energy PLC3 | 23,907,621 | 20,127 |
| Musti Group Oyj1,2,3 | 2,179,804 | 19,954 |
| Basic Fit NV1,3 | 1,142,663 | 19,070 |
| Cie. Plastic Omnium SA3 | 1,348,533 | 18,990 |
| TUI AG3,4 | 4,105,156 | 18,385 |
| D.R. Horton, Inc. | 490,000 | 16,660 |
| Hilton Grand Vacations Inc.1 | 1,044,535 | 16,472 |
| Jumbo Interactive Ltd.3,4 | 2,771,590 | 15,928 |
| Vail Resorts, Inc. | 101,000 | 14,919 |
| Elior Group SA1,3,4 | 2,185,000 | 14,441 |
| GoCo Group PLC3 | 18,388,760 | 13,959 |
| Bajaj Electricals Ltd.3 | 3,965,424 | 13,900 |
| Everi Holdings Inc.1 | 4,211,507 | 13,898 |
| Aramark | 683,000 | 13,640 |
| Six Flags Entertainment Corp. | 1,059,000 | 13,280 |
| Century Communities, Inc.1 | 911,000 | 13,219 |
| Norwegian Cruise Line Holdings Ltd.1 | 1,100,000 | 12,056 |
| Graham Holdings Co., Class B | 35,000 | 11,941 |
| Lands’ End, Inc.1,2 | 2,225,000 | 11,881 |
| Map Aktif Adiperkasa Tbk PT1,3 | 97,144,400 | 11,678 |
| Nordstrom, Inc. | 760,000 | 11,658 |
| Harley-Davidson, Inc. | 592,000 | 11,207 |
| Gourmet Master Co. Ltd.3 | 4,371,000 | 10,858 |
| Thule Group AB3 | 618,600 | 10,771 |
| Beazer Homes USA, Inc.1,2 | 1,659,813 | 10,689 |
| Cooper Tire & Rubber Co. | 616,000 | 10,041 |
| Melco Resorts & Entertainment Ltd. (ADR) | 800,000 | 9,920 |
| Macy’s, Inc. | 1,900,000 | 9,329 |
| Zhongsheng Group Holdings Ltd.3 | 2,652,000 | 9,232 |
| Cyrela Brazil Realty SA, ordinary nominative | 3,331,200 | 9,059 |
| Dalata Hotel Group PLC3 | 3,000,900 | 8,268 |
| DO & CO AG, non-registered shares3 | 205,359 | 8,080 |
| OneSpaWorld Holdings Ltd.4 | 1,887,548 | 7,663 |
| Bloomberry Resorts Corp.3 | 57,777,500 | 6,755 |
| SSP Group PLC3 | 1,461,695 | 5,556 |
| William Hill PLC3 | 6,394,600 | 5,382 |
| Delta Corp. Ltd.3 | 6,186,951 | 5,344 |
| Jamna Auto Industries Ltd.3 | 16,912,000 | 5,319 |
SMALLCAP World Fund — Page 7 of 17
unaudited
Common stocks (continued)
Consumer discretionary (continued) | Shares | Value
(000) |
| Ryohin Keikaku Co., Ltd.3 | 463,900 | $5,207 |
| Dine Brands Global, Inc. | 180,000 | 5,162 |
| Greggs PLC3 | 256,500 | 5,128 |
| Del Taco Restaurants, Inc.1 | 1,438,200 | 4,933 |
| Piaggio & C. SpA3 | 2,650,000 | 4,742 |
| Viomi Technology Co., Ltd. (ADR)1,4 | 992,968 | 4,319 |
| Chow Sang Sang Holdings International Ltd.3 | 4,227,700 | 4,182 |
| Salvatore Ferragamo SpA3 | 260,563 | 3,462 |
| Westwing Group AG, non-registered shares1,3 | 952,000 | 3,461 |
| Lojas Americanas SA, ordinary nominative | 1,232,000 | 3,426 |
| Signet Jewelers Ltd. | 529,100 | 3,413 |
| Despegar.com, Corp.1 | 565,409 | 3,206 |
| Sabina PCL3 | 6,000,000 | 3,075 |
| Victoria PLC1,3,4 | 985,000 | 2,538 |
| Samsonite International SA3 | 1,350,000 | 1,277 |
| Royal Caribbean Cruises Ltd. | 37,500 | 1,206 |
| Central Automotive Products Ltd.3 | 68,400 | 1,181 |
| BNN Technology PLC1,2,3,5 | 19,007,000 | 236 |
| China Zenix Auto International Ltd. (ADR)1 | 2,152,000 | 226 |
| | | 5,382,639 |
| Industrials 13.67% | | |
| IMCD NV2,3 | 3,290,469 | 234,011 |
| BELIMO Holding AG3 | 30,114 | 195,358 |
| Spirax-Sarco Engineering PLC3 | 1,769,028 | 178,703 |
| Nihon M&A Center Inc.3 | 6,387,180 | 174,659 |
| NIBE Industrier AB, Class B3 | 11,926,808 | 173,659 |
| BWX Technologies, Inc. | 3,330,650 | 162,236 |
| Harmonic Drive Systems Inc.3,4 | 3,146,300 | 137,464 |
| MonotaRO Co., Ltd.3 | 5,140,700 | 136,596 |
| Meggitt PLC3 | 37,003,226 | 134,049 |
| Rexnord Corp. | 5,833,000 | 132,234 |
| Marel hf. (ISK denominated)3 | 30,252,308 | 118,722 |
| Marel hf. (EUR denominated)3 | 1,166,667 | 4,501 |
| VAT Group AG3 | 872,000 | 120,809 |
| I.M.A. Industria Macchine Automatiche SpA3,4 | 1,994,005 | 116,853 |
| Diploma PLC3 | 5,626,000 | 112,253 |
| IDEX Corp. | 810,937 | 111,998 |
| Boyd Group Services Inc.2 | 1,038,851 | 108,144 |
| VARTA AG, non-registered shares1,3,4 | 1,290,235 | 93,167 |
| Watsco, Inc. | 545,000 | 86,126 |
| TechnoPro Holdings, Inc.3 | 1,771,000 | 82,246 |
| Nolato AB, Class B3 | 1,777,691 | 80,505 |
| Saia, Inc.1 | 1,065,200 | 78,335 |
| Avon Rubber PLC2,3 | 2,387,963 | 68,160 |
| Graco Inc. | 1,374,000 | 66,955 |
| Matson, Inc. | 2,138,000 | 65,466 |
| Waste Connections, Inc. | 840,000 | 65,100 |
| Sweco AB, Class B, non-registered shares3 | 2,241,000 | 64,037 |
| International Container Terminal Services, Inc.3 | 43,485,826 | 63,495 |
| TransDigm Group Inc. | 190,000 | 60,836 |
| Masco Corp. | 1,625,000 | 56,176 |
| Bravida Holding AB3 | 7,800,414 | 55,121 |
| Curtiss-Wright Corp. | 587,500 | 54,291 |
| Armstrong World Industries, Inc. | 665,196 | 52,830 |
SMALLCAP World Fund — Page 8 of 17
unaudited
Common stocks (continued)
Industrials (continued) | Shares | Value
(000) |
| Wizz Air Holdings PLC1,3 | 1,747,100 | $49,819 |
| Oshkosh Corp. | 760,207 | 48,904 |
| Bingo Industries Ltd.2,3,4 | 40,773,155 | 48,754 |
| Rumo SA1 | 12,401,900 | 46,900 |
| Japan Elevator Service Holdings Co., Ltd.2,3 | 2,039,800 | 46,871 |
| FTI Consulting, Inc.1 | 386,200 | 46,255 |
| Aerojet Rocketdyne Holdings, Inc.1 | 1,100,000 | 46,013 |
| Rheinmetall AG3 | 634,983 | 45,320 |
| Hexcel Corp. | 1,184,123 | 44,038 |
| Instalco AB2,3 | 3,831,789 | 43,531 |
| Aalberts NV, non-registered shares3 | 1,761,000 | 41,812 |
| Upwork Inc.1,2 | 6,345,736 | 40,930 |
| Japan Airport Terminal Co. Ltd.3 | 1,051,300 | 40,580 |
| Arcosa, Inc. | 1,013,000 | 40,257 |
| Havells India Ltd.3 | 6,364,000 | 40,098 |
| Kingspan Group PLC3 | 724,000 | 38,765 |
| Nitto Boseki Co., Ltd.3 | 874,000 | 38,600 |
| Generac Holdings Inc.1 | 412,250 | 38,409 |
| Guangzhou Baiyun International Airport Co. Ltd., Class A3 | 19,489,857 | 34,654 |
| TOMRA Systems ASA3 | 1,205,200 | 33,728 |
| Kratos Defense & Security Solutions, Inc.1 | 2,357,700 | 32,631 |
| HomeServe PLC3 | 2,450,000 | 32,093 |
| Cleanaway Waste Management Ltd.3 | 30,002,998 | 31,887 |
| Lifco AB, Class B3 | 839,000 | 30,841 |
| Coor Service Management Holding AB2,3 | 6,201,250 | 30,362 |
| Alfen NV1,2,3 | 1,275,000 | 29,384 |
| CoStar Group, Inc.1 | 50,000 | 29,360 |
| Granite Construction Inc. | 1,877,000 | 28,493 |
| Atlas Corp. | 3,500,000 | 26,915 |
| Stericycle, Inc.1 | 533,000 | 25,893 |
| Centre Testing International Group Co., Ltd.3 | 11,683,585 | 25,166 |
| Interpump Group SpA3 | 988,000 | 23,841 |
| AF Poyry, Class B3 | 1,553,500 | 23,811 |
| Barrett Business Services, Inc.2 | 590,000 | 23,388 |
| Daifuku Co., Ltd.3 | 313,200 | 19,850 |
| Melrose Industries PLC3 | 17,517,457 | 19,782 |
| XP Power Ltd.3 | 583,458 | 18,891 |
| Air Lease Corp., Class A | 835,600 | 18,500 |
| PGT Innovations, Inc.1 | 2,181,973 | 18,307 |
| Addtech AB, Class B3 | 701,759 | 17,291 |
| Sakai Moving Service Co., Ltd.3 | 303,500 | 16,142 |
| Robert Half International Inc. | 420,000 | 15,855 |
| Greaves Cotton Ltd.2,3 | 16,200,000 | 14,891 |
| ManpowerGroup Inc. | 280,000 | 14,837 |
| Imperial Logistics Ltd.3 | 9,323,584 | 13,763 |
| Woodward, Inc. | 222,000 | 13,196 |
| Trinity Industries, Inc. | 796,500 | 12,800 |
| CAE Inc. | 1,000,000 | 12,641 |
| Carborundum Universal Ltd.3 | 4,365,000 | 12,573 |
| The Brink’s Co. | 240,500 | 12,518 |
| Aeroflot - Russian Airlines PJSC3 | 13,247,000 | 11,488 |
| American Airlines Group Inc.4 | 872,000 | 10,630 |
| BMC Stock Holdings, Inc.1 | 579,222 | 10,270 |
| SiteOne Landscape Supply, Inc.1 | 133,900 | 9,858 |
| Indutrade AB3 | 360,000 | 9,788 |
SMALLCAP World Fund — Page 9 of 17
unaudited
Common stocks (continued)
Industrials (continued) | Shares | Value
(000) |
| Grafton Group PLC, units3 | 1,437,900 | $9,453 |
| Patrick Industries, Inc. | 335,300 | 9,442 |
| Troax Group AB3 | 747,300 | 6,903 |
| Westshore Terminals Investment Corp. | 742,300 | 6,899 |
| Avis Budget Group, Inc.1 | 462,000 | 6,422 |
| Advanced Disposal Services, Inc.1 | 195,000 | 6,396 |
| Middleby Corp.1 | 109,000 | 6,200 |
| DKSH Holding AG1,3 | 117,183 | 5,827 |
| Prosegur Compañía de Seguridad, SA3 | 2,308,705 | 5,811 |
| Embraer SA, ordinary nominative1 | 3,085,000 | 5,664 |
| Grupo Aeroportuario del Pacífico, SAB de CV | 1,022,254 | 5,489 |
| Mullen Group Ltd.4 | 1,845,600 | 5,377 |
| Fluor Corp. | 705,000 | 4,872 |
| Miura Co., Ltd.3 | 133,800 | 4,777 |
| PageGroup PLC3 | 1,015,900 | 4,580 |
| Hertz Global Holdings Inc.1 | 671,857 | 4,152 |
| JELD-WEN Holding, Inc.1 | 415,000 | 4,038 |
| easyJet PLC3 | 472,179 | 3,398 |
| Klingelnberg AG3 | 278,554 | 2,818 |
| JGC Holdings Corp.3 | 340,800 | 2,734 |
| BeNEXT Group Inc.3 | 533,500 | 2,519 |
| Polypipe Group PLC3 | 401,800 | 2,290 |
| Briggs & Stratton Corp.4 | 1,077,815 | 1,951 |
| J. Kumar Infraprojects Ltd.3 | 269,143 | 268 |
| | | 5,115,549 |
| Financials 7.36% | | |
| Kotak Mahindra Bank Ltd.3 | 15,337,852 | 259,569 |
| Cannae Holdings, Inc.1,2 | 6,211,271 | 208,015 |
| Ares Management Corp., Class A | 5,174,776 | 160,056 |
| RenaissanceRe Holdings Ltd. | 1,058,600 | 158,070 |
| First Republic Bank | 1,141,825 | 93,949 |
| Bajaj Finance Ltd.3 | 3,257,000 | 93,882 |
| SVB Financial Group1 | 606,500 | 91,630 |
| Moelis & Co., Class A4 | 3,254,768 | 91,459 |
| AJ Bell PLC3 | 20,354,700 | 78,268 |
| Trupanion, Inc.1,2,4 | 2,795,507 | 72,767 |
| Enstar Group Ltd.1 | 443,115 | 70,477 |
| Seacoast Banking Corp. of Florida1,2 | 3,581,901 | 65,585 |
| Essent Group Ltd. | 2,488,800 | 65,555 |
| MarketAxess Holdings Inc. | 177,900 | 59,164 |
| Aavas Financiers Ltd.1,3 | 3,803,977 | 58,812 |
| East West Bancorp, Inc. | 2,212,970 | 56,962 |
| IIFL Wealth Management Ltd.3 | 4,324,454 | 56,799 |
| Capitec Bank Holdings Ltd.3 | 1,123,983 | 55,029 |
| AU Small Finance Bank Ltd.3 | 7,970,934 | 54,837 |
| Janus Henderson Group PLC | 3,555,041 | 54,463 |
| Focus Financial Partners Inc., Class A1 | 2,354,300 | 54,172 |
| CenterState Bank Corp. | 2,999,933 | 51,689 |
| TMX Group Ltd. | 626,200 | 46,619 |
| AssetMark Financial Holdings, Inc.1 | 2,250,000 | 45,878 |
| Bolsa Mexicana de Valores, SAB de CV, Series A4 | 28,956,645 | 44,236 |
| Euronext NV3 | 568,333 | 42,335 |
| Clarivate Analytics PLC1 | 1,978,797 | 41,060 |
| City Union Bank Ltd.3 | 23,024,994 | 39,046 |
SMALLCAP World Fund — Page 10 of 17
unaudited
Common stocks (continued)
Financials (continued) | Shares | Value
(000) |
| VZ Holding AG3 | 93,000 | $31,229 |
| Eurobank Ergasias Services and Holdings SA1,3 | 62,206,000 | 27,374 |
| The Bank of N.T. Butterfield & Son Ltd. | 1,550,000 | 26,397 |
| Indian Energy Exchange Ltd.3 | 14,190,655 | 23,996 |
| AURELIUS Equity Opportunities SE & Co. KGaA, non-registered shares3,4 | 1,261,365 | 23,865 |
| HDFC Asset Management Co., Ltd.3 | 824,971 | 22,639 |
| Waddell & Reed Financial, Inc., Class A4 | 1,850,000 | 21,053 |
| CIT Group Inc. | 1,169,777 | 20,190 |
| Umpqua Holdings Corp. | 1,785,500 | 19,462 |
| L&T Finance Holdings Ltd.3 | 27,926,500 | 18,933 |
| Fanhua Inc. (ADR)4 | 917,056 | 18,451 |
| Uzabase, Inc.1,3 | 1,390,300 | 17,833 |
| Flow Traders NV, non-registered shares3 | 568,334 | 17,129 |
| Close Brothers Group PLC3 | 1,131,900 | 15,841 |
| TCS Group Holding PLC (GDR)3 | 1,119,136 | 12,876 |
| TCS Group Holding PLC (GDR)3,7 | 217,587 | 2,504 |
| Artisan Partners Asset Management Inc., Class A | 705,000 | 15,150 |
| Sabre Insurance Group PLC3 | 4,096,502 | 14,826 |
| Boston Private Financial Holdings, Inc. | 1,978,177 | 14,144 |
| Hiscox Ltd.3 | 1,179,246 | 13,503 |
| Greenhill & Co., Inc.2 | 1,169,700 | 11,510 |
| Webster Financial Corp. | 500,000 | 11,450 |
| Nova Ljubljanska banka dd (GDR)3 | 1,253,700 | 10,320 |
| Kinsale Capital Group, Inc. | 87,020 | 9,096 |
| Hilltop Holdings Inc. | 600,000 | 9,072 |
| NMI Holdings, Inc.1 | 687,789 | 7,985 |
| Huize Holding Ltd. (ADR)1,4 | 826,780 | 6,780 |
| Radian Group Inc. | 497,075 | 6,437 |
| Shriram Transport Finance Co. Ltd.3 | 730,499 | 6,303 |
| Cowen Inc., Class A | 640,000 | 6,182 |
| MJ Hudson Group PLC1,3 | 8,173,500 | 4,667 |
| Cholamandalam Investment and Finance Co., Ltd.3 | 2,143,378 | 4,260 |
| Funding Circle Holdings PLC1,3,4 | 5,986,000 | 4,081 |
| Discovery Ltd.3 | 899,883 | 3,913 |
| TISCO Financial Group PCL, foreign registered3 | 1,067,600 | 2,234 |
| Luther Burbank Corp. | 100,000 | 917 |
| | | 2,752,985 |
| Consumer staples 4.37% | | |
| Emmi AG2,3 | 317,072 | 289,878 |
| Grocery Outlet Holding Corp.1,2 | 5,059,382 | 173,739 |
| Raia Drogasil SA, ordinary nominative | 6,681,392 | 130,964 |
| Simply Good Foods Co., Class A1,2 | 6,151,000 | 118,468 |
| Jonjee Hi-Tech Industrial And Commercial Holding Co., Ltd., Class A3 | 15,721,895 | 106,268 |
| Freshpet, Inc.1 | 1,179,959 | 75,364 |
| Milbon Co., Ltd.3 | 1,323,500 | 66,866 |
| Varun Beverages Ltd.3 | 8,963,431 | 62,212 |
| COSMOS Pharmaceutical Corp.3 | 230,753 | 55,197 |
| Lion Corp.3 | 1,983,000 | 42,544 |
| Cranswick PLC3 | 831,700 | 38,088 |
| Fresh Del Monte Produce Inc. | 1,359,700 | 37,541 |
| Hilton Food Group PLC3 | 2,712,967 | 36,550 |
| AAK AB3 | 2,099,000 | 34,229 |
| Davide Campari-Milano SpA3 | 4,200,000 | 30,211 |
| Kotobuki Spirits Co., Ltd.3,4 | 665,000 | 29,883 |
SMALLCAP World Fund — Page 11 of 17
unaudited
Common stocks (continued)
Consumer staples (continued) | Shares | Value
(000) |
| Chengdu Hongqi Chain Co., Ltd.3 | 20,457,881 | $27,959 |
| Vector Group Ltd. | 2,813,000 | 26,498 |
| Hotel Chocolat Group PLC2,3,4 | 7,486,000 | 26,000 |
| Chongqing Fuling Zhacai Group Co., Ltd., Class A3 | 5,529,403 | 24,652 |
| Bakkafrost P/F3 | 517,500 | 24,596 |
| Emperador Inc.3 | 135,870,000 | 21,346 |
| Treasury Wine Estates Ltd.3 | 3,351,080 | 20,559 |
| Bid Corp. Ltd.3,4 | 1,640,857 | 19,422 |
| TCI Co., Ltd.3 | 3,150,218 | 18,456 |
| Bellring Brands, Inc., Class A1 | 1,000,000 | 17,050 |
| Kernel Holding SA3 | 1,642,578 | 13,091 |
| Avenue Supermarts Ltd.1,3 | 417,313 | 12,042 |
| United Spirits Ltd.1,3 | 1,780,114 | 11,371 |
| PZ Cussons PLC3,4 | 4,096,400 | 9,830 |
| Nomad Foods Ltd.1 | 400,000 | 7,424 |
| Masan Group Corp.1,3 | 3,452,230 | 7,180 |
| Century Pacific Food, Inc.3 | 25,901,000 | 6,873 |
| Beyond Meat, Inc.1,4 | 73,395 | 4,888 |
| Primo Water Corp. (Canada) | 517,256 | 4,686 |
| R.E.A. Holdings PLC1,3 | 2,152,000 | 2,673 |
| Prataap Snacks Ltd.3 | 304,479 | 2,001 |
| | | 1,636,599 |
| Communication services 3.38% | | |
| Iridium Communications Inc.1,2 | 7,201,932 | 160,819 |
| Iridium Communications Inc.1,2,7 | 636,132 | 14,205 |
| New York Times Co., Class A | 4,015,100 | 123,304 |
| Bandwidth Inc., Class A1,4 | 1,806,971 | 121,591 |
| Altice Europe NV, Class A1,3 | 27,179,700 | 105,065 |
| HUYA, Inc. (ADR)1 | 5,215,445 | 88,402 |
| JCDecaux SA3 | 3,578,000 | 64,883 |
| Yandex NV, Class A1 | 1,530,000 | 52,096 |
| Cogent Communications Holdings, Inc. | 565,000 | 46,313 |
| Cable One, Inc. | 25,321 | 41,628 |
| Zee Entertainment Enterprises Ltd.3 | 21,442,874 | 35,027 |
| The Madison Square Garden Co., Class A1 | 144,915 | 30,636 |
| JOYY Inc., Class A (ADR)1 | 562,000 | 29,932 |
| ITV PLC3 | 34,087,664 | 28,185 |
| Nexstar Media Group, Inc. | 400,000 | 23,092 |
| World Wrestling Entertainment, Inc., Class A4 | 672,000 | 22,801 |
| Codemasters Group Holdings PLC1,3 | 7,560,000 | 22,510 |
| Kamakura Shinsho, Ltd.2,3,4 | 2,297,900 | 22,420 |
| CarGurus, Inc., Class A1 | 1,177,827 | 22,308 |
| DIP Corp.3 | 1,298,800 | 20,893 |
| Adevinta ASA1,3 | 2,144,199 | 19,179 |
| Zillow Group, Inc., Class C, nonvoting shares1,4 | 525,000 | 18,910 |
| RPA Holdings, Inc.1,3,4 | 2,301,800 | 15,937 |
| ProSiebenSat.1 Media SE3 | 1,799,000 | 14,529 |
| VGI PCL, foreign registered3 | 81,538,000 | 14,159 |
| GCI Liberty, Inc., Class A1 | 244,537 | 13,931 |
| Bharti Infratel Ltd.3 | 5,797,028 | 12,143 |
| Vonage Holdings Corp.1 | 1,601,300 | 11,577 |
| The Pebble Group PLC1,2,3 | 10,884,000 | 11,438 |
| Masmovil Ibercom, SA1,3 | 695,996 | 11,057 |
| Yelp Inc.1 | 585,000 | 10,548 |
SMALLCAP World Fund — Page 12 of 17
unaudited
Common stocks (continued)
Communication services (continued) | Shares | Value
(000) |
| Elang Mahkota Teknologi Tbk PT3 | 34,046,200 | $10,325 |
| Euskaltel, SA, non-registered shares3 | 1,330,000 | 9,874 |
| IMAX China Holding, Inc.3 | 4,063,700 | 6,292 |
| Nordic Entertainment Group AB, Class B3 | 288,687 | 6,086 |
| Zegona Communications PLC3,4 | 3,300,304 | 3,271 |
| Catena Media PLC1,3 | 214,035 | 342 |
| | | 1,265,708 |
| Materials 2.01% | | |
| Valvoline Inc. | 4,756,821 | 62,267 |
| Navin Fluorine International Ltd.2,3 | 3,485,500 | 55,175 |
| Royal Gold, Inc. | 598,679 | 52,510 |
| Kansai Paint Co., Ltd.3 | 2,743,344 | 52,310 |
| JCU Corp.2,3 | 2,004,700 | 41,724 |
| CCL Industries Inc., Class B, nonvoting shares | 1,334,700 | 40,583 |
| SIG Combibloc Group AG3 | 2,600,000 | 38,956 |
| Allegheny Technologies Inc.1 | 4,334,359 | 36,842 |
| Lundin Mining Corp. | 8,886,000 | 33,402 |
| Aarti Industries Ltd.3 | 3,045,352 | 30,470 |
| Loma Negra Compania Industrial Argentina SA (ADR)1,2 | 6,792,990 | 24,115 |
| Vidrala, SA, non-registered shares3 | 255,558 | 23,099 |
| Symrise AG3 | 227,500 | 21,545 |
| PI Industries Ltd.3 | 1,362,000 | 21,019 |
| LANXESS AG3 | 505,240 | 20,227 |
| ACC Ltd.3 | 1,506,050 | 19,064 |
| UPL Ltd.3 | 4,369,222 | 18,674 |
| Essel Propack Ltd.3 | 8,419,273 | 17,048 |
| Berger Paints India Ltd.3 | 2,500,993 | 16,311 |
| Croda International PLC3 | 303,595 | 16,056 |
| Aluflexpack AG1,3 | 760,425 | 15,294 |
| Arkema SA3 | 212,100 | 14,668 |
| Gulf Oil Lubricants India Ltd.3 | 2,038,914 | 13,632 |
| Vinati Organics Ltd.3 | 928,972 | 9,395 |
| China BlueChemical Ltd., Class H3 | 48,476,000 | 7,459 |
| Sandstorm Gold Ltd.1,4 | 1,361,300 | 6,820 |
| Wienerberger AG3 | 425,700 | 6,735 |
| Nevada Copper Corp.1,2,4 | 46,345,500 | 6,092 |
| Borregaard ASA3 | 629,000 | 5,853 |
| Alcoa Corp.1 | 910,000 | 5,606 |
| Stella-Jones Inc. | 209,400 | 4,562 |
| Excelsior Mining Corp.1,2,4 | 12,868,000 | 4,023 |
| Gerdau SA (ADR)4 | 2,011,500 | 3,842 |
| Turquoise Hill Resources Ltd. (CAD denominated)1 | 7,862,206 | 3,073 |
| Venator Materials PLC1 | 1,583,000 | 2,723 |
| Kansai Nerolac Paints Ltd.3 | 44,586 | 226 |
| Aarti Surfactants Ltd.1,3,5 | 64,380 | 91 |
| | | 751,491 |
| Real estate 1.98% | | |
| Embassy Office Parks REIT3 | 30,015,600 | 138,932 |
| Altus Group Ltd.2,4 | 3,212,700 | 83,325 |
| WHA Corp. PCL2,3 | 893,252,324 | 60,556 |
| MGM Growth Properties LLC REIT, Class A | 2,397,000 | 56,737 |
| Digital Realty Trust, Inc. REIT | 346,283 | 48,102 |
| BR Properties SA, ordinary nominative1 | 20,315,000 | 35,812 |
SMALLCAP World Fund — Page 13 of 17
unaudited
Common stocks (continued)
Real estate (continued) | Shares | Value
(000) |
| DoubleDragon Properties Corp.1,3 | 92,610,000 | $29,395 |
| JHSF Participacoes SA2 | 40,035,711 | 26,967 |
| Poly Property Development Co., Ltd., Class H1,3 | 3,070,600 | 25,856 |
| Cyrela Commercial Properties SA, ordinary nominative1,2 | 8,557,663 | 22,645 |
| Relo Group, Inc.3 | 1,037,500 | 21,776 |
| Hibernia REIT PLC3 | 16,260,000 | 19,031 |
| Cousins Properties Inc. REIT | 599,532 | 17,548 |
| Two Harbors Investment Corp. REIT | 4,146,622 | 15,799 |
| K-Fast Holding AB, Class B1,3 | 927,828 | 14,884 |
| Concentradora Fibra Danhos, SA de CV REIT | 17,511,980 | 14,351 |
| China Overseas Property Holdings Ltd.3 | 14,969,000 | 14,042 |
| Mitre Realty Empreendimentos E Participações SA1,2 | 6,168,863 | 13,059 |
| K. Wah International Holdings Ltd.3 | 30,270,028 | 12,987 |
| Redwood Trust, Inc. REIT | 2,562,000 | 12,964 |
| Samhallsbyggnadsbolaget i Norden AB, Class B3 | 6,203,000 | 11,837 |
| Central Pattana PCL, foreign registered1,3 | 9,042,800 | 11,585 |
| Foxtons Group PLC2,3 | 17,881,785 | 8,983 |
| Metrovacesa, SA, non-registered shares3 | 1,350,000 | 7,510 |
| Americold Realty Trust REIT | 150,500 | 5,123 |
| BR Malls Participacoes SA, ordinary nominative | 2,173,500 | 4,175 |
| Instone Real Estate Group AG, non-registered shares1,3 | 237,771 | 3,797 |
| Morguard Corp. | 23,400 | 2,196 |
| | | 739,974 |
| Energy 0.62% | | |
| Saipem SpA, Class S1,3 | 15,768,784 | 38,750 |
| Petronet LNG Ltd.3 | 12,920,000 | 33,843 |
| Worley Ltd.3 | 5,701,172 | 22,342 |
| Cactus, Inc., Class A | 1,749,976 | 20,300 |
| New Fortress Energy LLC, Class A1,4 | 1,888,567 | 18,489 |
| Noble Energy, Inc. | 2,225,000 | 13,439 |
| Venture Global LNG, Inc., Series C1,3,5,6,7 | 4,240 | 12,154 |
| Magnolia Oil & Gas Corp., Class A1 | 2,000,000 | 8,000 |
| Whitecap Resources Inc.4 | 9,125,000 | 7,586 |
| Apache Corp. | 1,747,000 | 7,302 |
| Savannah Petroleum PLC1,2,3 | 64,599,102 | 6,363 |
| Equitrans Midstream Corp. | 1,125,800 | 5,663 |
| NuVista Energy Ltd.1,2,4 | 15,965,000 | 5,502 |
| Concho Resources Inc. | 128,000 | 5,485 |
| Solaris Oilfield Infrastructure, Inc., Class A | 891,761 | 4,682 |
| Cosan Ltd., Class A1 | 361,000 | 4,440 |
| China Oilfield Services Ltd., Class H3 | 5,156,000 | 3,941 |
| SM Energy Co. | 2,960,000 | 3,611 |
| Rattler Midstream LP | 773,144 | 2,691 |
| Weatherford International1 | 354,127 | 2,107 |
| Nine Energy Service, Inc.1,2,4 | 2,367,696 | 1,914 |
| Diamondback Energy, Inc. | 50,000 | 1,310 |
| Oil & Gas Development Co. Ltd.3 | 917,206 | 424 |
| Extraction Oil & Gas, Inc.1,4 | 410,000 | 173 |
| Centennial Resource Development, Inc., Class A1,4 | 621,700 | 164 |
| | | 230,675 |
SMALLCAP World Fund — Page 14 of 17
unaudited
Common stocks (continued)
Utilities 0.28% | Shares | Value
(000) |
| Neoenergia SA | 20,443,000 | $67,631 |
| ENN Energy Holdings Ltd.3 | 3,825,000 | 36,785 |
| Mytrah Energy Ltd.1,2,3,5 | 10,418,000 | 129 |
| | | 104,545 |
| Total common stocks(cost: $28,249,818,000) | | 33,780,221 |
Preferred securities 0.93%
Information technology 0.39% | | |
| Avidxchange, Inc., Series F, preferred shares1,2,3,5,6 | 2,159,548 | 105,844 |
| Credo Technology Group Holding, Ltd., Series D, 8.00% noncumulative, preferred shares1,3,5,6 | 4,005,527 | 20,000 |
| Gitlab Inc., Series E, preferred shares1,3,5,6 | 1,044,048 | 19,450 |
| | | 145,294 |
| Health care 0.36% | | |
| Sartorius AG, nonvoting preferred, non-registered shares1,3 | 395,000 | 96,542 |
| Legend Biotech Corp., Series A, preferred shares1,3,5,6 | 3,907,854 | 30,450 |
| PACT Pharma, Inc., Series C, 8.00% noncumulative, preferred shares1,3,5,6 | 4,397,107 | 8,145 |
| | | 135,137 |
| Consumer discretionary 0.11% | | |
| Made.com Design Ltd., Series C-4, preferred shares1,2,3,5,6 | 2,067,967 | 43,101 |
| Industrials 0.07% | | |
| Azul SA, preferred nominative (ADR)1 | 2,332,057 | 23,764 |
| Azul SA, preferred nominative1 | 771,000 | 2,604 |
| | | 26,368 |
| Consumer staples 0.00% | | |
| R.E.A. Holdings PLC 9.00% cumulative, preferred shares1 | 96,000 | 72 |
| Total preferred securities(cost: $286,158,000) | | 349,972 |
Rights & warrants 0.00%
Information technology 0.00% | | |
| Foursquare Labs, Inc., warrants, expire 20331,3,5,6 | 1,163,990 | 594 |
| Communication services 0.00% | | |
| VGI PCL, warrants, expire 20221 | 14,545,500 | 302 |
| Total rights & warrants(cost: $0) | | 896 |
Convertible stocks 0.20%
Communication services 0.08% | | |
| Nextdoor Inc., Series H, convertible preferred shares3,5,6 | 1,512,513 | 30,833 |
| Consumer discretionary 0.07% | | |
| Coursera, Inc., Series E, 8.00% noncumulative, convertible preferred shares3,5,6 | 2,083,333 | 20,937 |
| Coursera, Inc., Series C, 8.00% noncumulative, convertible preferred shares3,5,6 | 450,000 | 4,523 |
SMALLCAP World Fund — Page 15 of 17
unaudited
Convertible stocks (continued)
Information technology 0.04% | Shares | Value
(000) |
| RealSelf, Inc., Series C, convertible preferred shares2,3,5,6 | 3,468,862 | $15,714 |
| Health care 0.01% | | |
| Proteus Digital Health, Inc., Series G, 6.50% noncumulative, convertible preferred shares3,5,6 | 3,044,139 | 1,157 |
| Total convertible stocks(cost: $120,234,000) | | 73,164 |
Bonds, notes & other debt instruments 0.01%
Corporate bonds & notes 0.01%
Energy 0.01% | Principal amount
(000) | |
| Weatherford International PLC 11.00% 20247 | $5,093 | 3,109 |
| Total corporate bonds & notes | | 3,109 |
| Total bonds, notes & other debt instruments(cost: $5,023,000) | | 3,109 |
Short-term securities 9.36%
Money market investments 9.36% | Shares | |
| Capital Group Central Cash Fund 1.00%8 | 30,929,807 | 3,094,218 |
| Goldman Sachs Financial Square Government Fund 0.34%8,9 | 250,000,000 | 250,000 |
| Blackrock FedFund 0.33%8,9 | 70,000,000 | 70,000 |
| RBC U.S. Government Money Market Fund 0.82%8,9 | 44,000,000 | 44,000 |
| Morgan Stanley Institutional Liquidity Funds - Government Portfolio 0.25%8,9 | 19,500,000 | 19,500 |
| Invesco Short-term Investments Trust - Government & Agency Portfolio 0.43%8,9 | 18,121,645 | 18,122 |
| State Street Institutional U.S. Government Money Market Fund 0.32%8,9 | 5,000,000 | 5,000 |
| Fidelity Institutional Money Market Funds - Government Portfolio 0.30%8,9 | 500,000 | 500 |
| | | 3,501,340 |
| Total short-term securities(cost: $3,500,017,000) | | 3,501,340 |
| Total investment securities 100.80%(cost: $32,161,250,000) | | 37,708,702 |
| Other assets less liabilities (0.80)% | | (298,191) |
| Net assets 100.00% | | $37,410,511 |
| 1 | Security did not produce income during the last 12 months. |
| 2 | Represents an affiliated company as defined under the Investment Company Act of 1940. |
| 3 | Valued under fair value procedures adopted by authority of the board of directors. The total value of all such securities was $15,119,460,000, which represented 40.42% of the net assets of the fund. This amount includes $14,589,195,000 related to certain securities trading outside the U.S. whose values were adjusted as a result of significant market movements following the close of local trading. |
| 4 | All or a portion of this security was on loan. The total value of all such securities was $632,192,000, which represented 1.69% of the net assets of the fund. |
| 5 | Value determined using significant unobservable inputs. |
| 6 | Acquired through a private placement transaction exempt from registration under the Securities Act of 1933. May be subject to legal or contractual restrictions on resale. Further details on these holdings appear below. |
| 7 | Acquired in a transaction exempt from registration under Rule 144A or Section 4(2) of the Securities Act of 1933. May be resold in the U.S. in transactions exempt from registration, normally to qualified institutional buyers. The total value of all such securities was $114,697,000, which represented .31% of the net assets of the fund. |
| 8 | Rate represents the seven-day yield at 3/31/2020. |
| 9 | Security purchased with cash collateral from securities on loan. |
| Private placement securities | Acquisition
date(s) | Cost
(000) | Value
(000) | Percent
of net
assets |
| Avidxchange, Inc., Series F, preferred shares | 12/26/2019 | $105,844 | $105,844 | .28% |
| Agilon Health TopCo, Inc. | 1/4/2019-3/4/2020 | 50,494 | 54,011 | .15 |
| Made.com Design Ltd., Series C-4, preferred shares | 3/2/2018 | 41,328 | 43,101 | .12 |
| Nextdoor Inc., Series H, convertible preferred shares | 5/8/2019 | 30,833 | 30,833 | .08 |
| Legend Biotech Corp., Series A, preferred shares | 3/30/2020 | 30,450 | 30,450 | .08 |
SMALLCAP World Fund — Page 16 of 17
unaudited
| Private placement securities | Acquisition
date(s) | Cost
(000) | Value
(000) | Percent
of net
assets |
| Acerta Pharma BV | 5/7/2014 | $11,250 | $24,562 | .07% |
| Coursera, Inc., Series E, 8.00% noncumulative, convertible preferred shares | 4/23/2019 | 25,000 | 20,937 | .06 |
Credo Technology Group Holding, Ltd., Series D,
8.00% noncumulative, preferred shares | 3/20/2020 | 20,000 | 20,000 | .05 |
| Gitlab Inc., Series E, preferred shares | 9/11/2019 | 19,450 | 19,450 | .05 |
| DraftKings Inc. | 3/4/2020 | 26,900 | 19,013 | .05 |
| RealSelf, Inc., Series C, convertible preferred shares | 4/18/2018 | 19,000 | 15,714 | .04 |
| Venture Global LNG, Inc., Series C | 5/1/2015 | 12,720 | 12,154 | .03 |
| PACT Pharma, Inc., Series C, 8.00% noncumulative, preferred shares | 2/7/2020 | 9,000 | 8,145 | .02 |
| Foursquare Labs, Inc., Series A | 12/3/2013 | 20,000 | 5,891 | .02 |
| Coursera, Inc., Series C, 8.00% noncumulative, preferred shares | 2/20/2020 | 5,400 | 4,523 | .01 |
| Cortexyme, Inc. | 2/6/2020 | 3,826 | 3,351 | .01 |
| Proteus Digital Health, Inc., Series G, 6.50% noncumulative, convertible preferred shares | 5/6/2014-7/23/2014 | 40,000 | 1,157 | .00 |
| Foursquare Labs, Inc., warrants, expire 2033 | 12/3/2013 | — | 594 | .00 |
| Total private placement securities | | $ 471,495 | $ 419,730 | 1.12% |
| Key to abbreviations |
| ADR = American Depositary Receipts |
| CAD = Canadian dollars |
| EUR = Euros |
| GDR = Global Depositary Receipts |
| ISK = Icelandic kronor |
| SDR = Swedish Depositary Receipts |
Additional financial disclosures are included in the fund’s current shareholder report and should be read in conjunction with this report.
Investments are not FDIC-insured, nor are they deposits of or guaranteed by a bank or any other entity, so they may lose value.
Investors should carefully consider investment objectives, risks, charges and expenses. This and other important information is contained in the fund prospectus and summary prospectus, which can be obtained from your financial professional and should be read carefully before investing. You may also call American Funds Service Company (AFS) at (800) 421-4225 or visit the Capital Group website at capitalgroup.com.
All Capital Group trademarks mentioned are owned by The Capital Group Companies, Inc., an affiliated company or fund. All other company and product names mentioned are the property of their respective companies.
American Funds Distributors, Inc., member FINRA.
© 2020 Capital Group. All rights reserved.
| MFGEFPX-035-0520O-S73162 | SMALLCAP World Fund — Page 17 of 17 |
ITEM 7 – Disclosure of Proxy Voting Policies and Procedures for Closed-End Management Investment Companies
Not applicable to this Registrant, insofar as the Registrant is not a closed-end management investment company.
ITEM 8 – Portfolio Managers of Closed-End Management Investment Companies
Not applicable to this Registrant, insofar as the Registrant is not a closed-end management investment company.
ITEM 9 – Purchases of Equity Securities by Closed-End Management Investment Company and Affiliated Purchasers
Not applicable to this Registrant, insofar as the Registrant is not a closed-end management investment company.
ITEM 10 – Submission of Matters to a Vote of Security Holders
There have been no material changes to the procedures by which shareholders may recommend nominees to the Registrant’s board of directors since the Registrant last submitted a proxy statement to its shareholders. The procedures are as follows. The Registrant has a nominating and governance committee comprised solely of persons who are not considered ‘‘interested persons’’ of the Registrant within the meaning of the Investment Company Act of 1940, as amended. The committee periodically reviews such issues as the board’s composition, responsibilities, committees, compensation and other relevant issues, and recommends any appropriate changes to the full board of directors. While the committee normally is able to identify from its own resources an ample number of qualified candidates, it will consider shareholder suggestions of persons to be considered as nominees to fill future vacancies on the board. Such suggestions must be sent in writing to the nominating and governance committee of the Registrant, c/o the Registrant’s Secretary, and must be accompanied by complete biographical and occupational data on the prospective nominee, along with a written consent of the prospective nominee for consideration of his or her name by the nominating and governance committee.
ITEM 11 – Controls and Procedures
| (a) | The Registrant’s Principal Executive Officer and Principal Financial Officer have concluded, based on their evaluation of the Registrant’s disclosure controls and procedures (as such term is defined in Rule 30a-3 under the Investment Company Act of 1940), that such controls and procedures are adequate and reasonably designed to achieve the purposes described in paragraph (c) of such rule. |
| | |
| (b) | There were no changes in the Registrant’s internal controls over financial reporting (as defined in Rule 30a-3(d) under the Investment Company Act of 1940) that occurred during the Registrant’s semi-annual period covered by this report that has materially affected, or is reasonably likely to materially affect, the Registrant’s internal control over financial reporting. |
ITEM 12 – Exhibits
| (a)(1) | Not applicable for filing of semi-annual reports to shareholders. |
| | |
| (a)(2) | The certifications required by Rule 30a-2 of the Investment Company Act of 1940 and Sections302 and906 of the Sarbanes-Oxley Act of 2002 are attached as exhibits hereto. |
SIGNATURES
Pursuant to the requirements of the Securities Exchange Act of 1934 and the Investment Company Act of 1940, the Registrant has duly caused this report to be signed on its behalf by the undersigned, thereunto duly authorized.
| | SMALLCAP WORLD FUND, INC. |
| | |
| | By__/s/ Paul F. Roye____________________ |
| | Paul F. Roye, Executive Vice President and Principal Executive Officer |
| | |
| | Date: May 29, 2020 |
Pursuant to the requirements of the Securities Exchange Act of 1934 and the Investment Company Act of 1940, this report has been signed below by the following persons on behalf of the Registrant and in the capacities and on the dates indicated.
| By__/s/ Paul F. Roye_________________ |
Paul F. Roye, Executive Vice President and Principal Executive Officer |
| |
| Date: May 29, 2020 |
| By ___/s/ Hong T. Le __________ |
Hong T. Le, Treasurer and Principal Financial Officer |
| |
| Date: May 29, 2020 |