UNITED STATES
SECURITIES AND EXCHANGE COMMISSION
Washington, D.C. 20549
FORM N-CSR
Certified Shareholder Report of
Registered Management Investment Companies
Investment Company Act File Number: 811-05888
SMALLCAP World Fund, Inc.
(Exact Name of Registrant as Specified in Charter)
6455 Irvine Center Drive
Irvine, California 92618
(Address of Principal Executive Offices)
Registrant's telephone number, including area code: (213) 486-9200
Date of fiscal year end: September 30
Date of reporting period: March 31, 2018
Michael W. Stockton
SMALLCAP World Fund, Inc.
333 South Hope Street
Los Angeles, California 90071
(Name and Address of Agent for Service)
ITEM 1 – Reports to Stockholders
 | SMALLCAP World Fund® |
| |
Semi-annual report
for the six months ended
March 31, 2018 |
| |

We believe global
small companies can
provide opportunities
for investors.
SMALLCAP World Fund seeks to provide you with long-term growth of capital.
This fund is one of more than 40 offered by one of the nation’s largest mutual fund families, American Funds, from Capital Group. For more than 85 years, Capital has invested with a long-term focus based on thorough research and attention to risk.
Fund results shown in this report, unless otherwise indicated, are for Class A shares at net asset value. If a sales charge (maximum 5.75%) had been deducted, the results would have been lower. Results are for past periods and are not predictive of results for future periods. Current and future results may be lower or higher than those shown. Share prices and returns will vary, so investors may lose money. Investing for short periods makes losses more likely. For current information and month-end results, visit americanfunds.com.
Here are the average annual total returns on a $1,000 investment with all distributions reinvested for periods ended March 31, 2018:
| Class A shares | | 1 year | | 5 years | | 10 years |
| | | | | | | |
| Reflecting 5.75% maximum sales charge | | 11.71% | | 9.66% | | 7.04% |
For other share class results, visit americanfunds.com and americanfundsretirement.com.
The total annual fund operating expense ratio was 1.07% for Class A shares as of the prospectus dated December 1, 2017. This expense ratio is restated to reflect current fees.
Investment results assume all distributions are reinvested and reflect applicable fees and expenses. When applicable, investment results reflect fee waivers, without which results would have been lower. Visit americanfunds.com for more information.
Investing outside the United States may be subject to risks, such as currency fluctuations and political instability. These risks may be heightened in connection with investments in developing countries. Investing in small-capitalization stocks can involve greater risk than is customarily associated with investing in stocks of larger, more established companies. Refer to the fund prospectus and the Risk Factors section of this report for more information on these and other risks associated with investing in the fund.
Investments are not FDIC-insured, nor are they deposits of or guaranteed by a bank or any other entity, so they may lose value.
Fellow investors:
The first six months of SMALLCAP World Fund’s current fiscal year was marked by investor uncertainty and market volatility around the globe. Despite this environment, the fund produced a total return of 6.28% during the period. This includes a capital gain distribution of $2.50 a share made on December 20, 2017.
By way of comparison, the fund’s primary benchmark — the unmanaged MSCI All Country World Small Cap Index, returned 5.17% for the same period, while the Lipper Global Small-/Mid-Cap Funds Average gained 6.85%. Neither benchmark includes fees or expenses.
The fund continues its approach of investing for the long term, and below you can see how the fund has fared over these longer periods.
Market overview
The first half of the fund’s fiscal year saw volatility re-enter many equity markets around the world, some for the first time in years. However, the economic environment and corporate balance sheets around the world generally remain healthy. In the United States, the unemployment rate continued to fall and stood at 4.1% for March, while gross domestic product rose 2.9% in the fourth quarter of 2017.
Results at a glance
For periods ended March 31, 2018, with all distributions reinvested
| | | Cumulative total returns | | Average annual total returns |
| | | | | | | | | | | Lifetime |
| | | 6 months | | 1 year | | 5 years | | 10 years | | (since 4/30/90) |
| | | | | | | | | | | | | | | | | | | |
| SMALLCAP World Fund (Class A shares)1 | | | 6.28 | % | | | 18.51 | % | | | 10.97 | % | | | 7.68 | % | | | 9.85 | % |
| MSCI All Country World Small Cap Index2 | | | 5.17 | | | | 16.21 | | | | 10.20 | | | | 8.16 | | | | — | |
| Lipper Global Small-/Mid-Cap Funds Average3 | | | 6.85 | | | | 19.47 | | | | 10.64 | | | | 7.62 | | | | 9.37 | |
| 1 | Results do not include adjustments made for financial reporting purposes in accordance with U.S. generally accepted accounting principles (“U.S. GAAP”). |
| 2 | Source: MSCI. The market index is unmanaged and, therefore, has no expenses. Investors cannot invest directly in an index. The market index is a free float-adjusted market capitalization weighted index that is designed to measure equity market results of smaller capitalization companies in both developed and emerging markets. Results reflect dividends net of withholding taxes. This index was not in existence when the fund’s Class A shares were first sold; therefore, lifetime results are not available. |
| 3 | Source: Thomson Reuters Lipper. Lipper averages reflect the current composition of all eligible mutual funds (all share classes) within a given category. Lipper categories are dynamic and averages may have few funds, especially over longer periods. To see the number of funds included in the Lipper category for each fund’s lifetime, please see the Quarterly Statistical Update available on our website. |
In response, the Federal Reserve continued it’s slow, steady progression of rate increases, the most recent of which increased the Fed’s benchmark rate to a range of 1.50% to 1.75%.
Overseas, the economic picture was similar. In the euro zone, fourth quarter GDP gained 2.7%, while unemployment stood at 8.5% for February — still high, but the lowest figure reported since 2008. Economic activity in Japan continues to grow modestly, while China’s growth rate has stabilized at a strong rate over the past several years.
Corporate earnings generally have been sound across much of the world as well. The volatility seen in many markets can be attributed to geopolitical concerns, such as continuing conflicts in Syria and concerns over trade stemming from U.S. policy.
The fund’s holdings
As of March 31, domestic equities made up 42.6% of the fund’s overall portfolio, slightly up from a year ago, while the fund’s holdings in European shares, at 22% of the portfolio, was also slightly higher than this time last year. Holdings in Asia-Pacific shares remained relatively steady at 21.1%.
Among equity sectors during the six-month period, the fund’s holdings in information technology, industrials, financials and consumer discretionary stocks all helped the fund’s return relative to its benchmark index, while a smaller holding in real estate also aided relative returns. However, the fund’s holdings in health care, while larger than the index, nonetheless detracted from relative returns, as did energy stocks.
It’s worth noting that while we provide a breakdown of geography and industry here, our investment process does not involve a top-down approach to investment.
Where the fund’s assets are invested (by country of domicile)
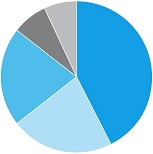
| | As of March 31, 2018 | Percent of
net assets |
| ▀ | United States | | | 42.6 | % |
| ▀ | Europe | | | 22.0 | |
| ▀ | Asia & Pacific Basin | | | 21.1 | |
| ▀ | Other (including Canada & Latin America) | | | 7.5 | |
| ▀ | Short-term securities & other assets less liabilities | | | 6.8 | |
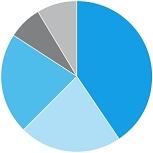
| | As of September 30, 2017 | Percent of
net assets |
| ▀ | United States | | | 40.6 | % |
| ▀ | Europe | | | 21.9 | |
| ▀ | Asia & Pacific Basin | | | 21.9 | |
| ▀ | Other (including Canada & Latin America) | | | 7.1 | |
| ▀ | Short-term securities & other assets less liabilities | | | 8.5 | |
Rather, these breakdowns are simply a result of the choices our investment professionals have made, company by company.
Nine of the top ten holdings in the fund produced positive returns for the period, with only Japanese retailer Seria posting a 9.2% loss. Medical device maker Insulet, the fund’s third-largest holding, gained 57.4% during the period, while technology company RingCentral, the fourth-largest holding, saw a 52.1% gain.
The fund retained 6.8% of the portfolio in cash and other short-term securities, which of course hurt relative returns against the index. However, the fund’s portfolio managers and analysts frequently keep cash available in their portfolios to take advantage of potential investments as they arise. Cash can also help dampen the effects of market volatility on the portfolio.
Looking ahead
The fund’s managers believe in a long-term focus when it comes to investing, and in rigorous bottom-up research into each potential equity investment. Headline-driven volatility typically doesn’t enter into our process, except when there are actual political, economic or corporate policy changes to contend with.
We continue to see potential investment opportunities around the globe, and the current trend toward fewer business regulations is encouraging. The United States continues to drive innovation around the world. Consumer confidence remains high, though we are monitoring confidence among younger consumers, as that has slipped in recent months.
That said, we believe the global economy and equity markets are on sound footing, and any risks to that environment would likely be geopolitical in nature, rather than based on fundamentals. Those geopolitical risks, while generating headlines, have yet to materialize in major changes in the trajectory of the markets, but we continue to monitor problems around the globe for potential risk.
As always, we continue to seek out those companies with the potential to change industries and benefit our shareholders. The portfolio currently holds nearly 600 companies diversified across geographies and industries, and we continue to hold to our philosophy of investing for the long term. We thank you for your support, and look forward to reporting to you again in six months.
Cordially,
 |  |
Jonathan Knowles Vice Chairman of the Board | Gregory W. Wendt President |
May 9, 2018
For current information about the fund, visit americanfunds.com.
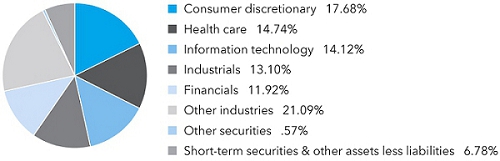
| Summary investment portfolio March 31, 2018 | unaudited |
| Industry sector diversification | Percent of net assets |
| Country diversification by domicile | | Percent of
net assets |
| United States | | | 42.63 | % |
| Euro zone* | | | 8.51 | |
| United Kingdom | | | 7.76 | |
| Japan | | | 6.04 | |
| India | | | 4.98 | |
| Canada | | | 3.16 | |
| China | | | 2.53 | |
| Sweden | | | 2.52 | |
| Taiwan | | | 1.83 | |
| Other countries | | | 13.26 | |
| Short-term securities & other assets less liabilities | | | 6.78 | |
| * | Countries using the euro as a common currency; those represented in the fund’s portfolio are Austria, Belgium, France, Germany, Greece, Italy, the Netherlands, Portugal, Slovenia and Spain. |
| Common stocks 92.65% | | Shares | | | Value
(000) | |
| Consumer discretionary 17.68% | | | | | | | | |
| Seria Co., Ltd.1 | | | 5,056,594 | | | $ | 255,609 | |
| Dollarama Inc. | | | 2,005,000 | | | | 243,669 | |
| GVC Holdings PLC2 | | | 18,141,694 | | | | 233,975 | |
| Domino’s Pizza, Inc. | | | 791,161 | | | | 184,784 | |
| Hilton Grand Vacations Inc.3 | | | 4,155,186 | | | | 178,756 | |
| Planet Fitness, Inc., Class A3 | | | 4,123,511 | | | | 155,745 | |
| Melco International Development Ltd.2 | | | 49,886,000 | | | | 146,221 | |
| ASOS PLC2,3 | | | 1,491,741 | | | | 145,829 | |
| TopBuild Corp.3 | | | 1,745,000 | | | | 133,527 | |
| Other securities | | | | | | | 5,395,376 | |
| | | | | | | | 7,073,491 | |
| | | | | | | | | |
| Health care 14.74% | | | | | | | | |
| Molina Healthcare, Inc.1,3 | | | 4,567,520 | | | | 370,791 | |
| Bluebird Bio, Inc.3 | | | 2,106,520 | | | | 359,688 | |
| Insulet Corp.1,3 | | | 3,770,600 | | | | 326,836 | |
| GW Pharmaceuticals PLC (ADR)1,3 | | | 2,250,346 | | | | 253,547 | |
| WuXi Biologics (Cayman) Inc.2,3 | | | 24,109,231 | | | | 234,207 | |
| | | Shares | | | Value
(000) | |
| Centene Corp.3 | | | 1,459,439 | | | $ | 155,970 | |
| Integra LifeSciences Holdings Corp.3 | | | 2,548,010 | | | | 141,007 | |
| Other securities | | | | | | | 4,057,240 | |
| | | | | | | | 5,899,286 | |
| | | | | | | | | |
| Information technology 14.12% | | | | | | | | |
| RingCentral, Inc., Class A3 | | | 4,720,000 | | | | 299,720 | |
| AAC Technologies Holdings Inc.2 | | | 15,314,500 | | | | 280,015 | |
| Paycom Software, Inc.3 | | | 2,477,734 | | | | 266,084 | |
| Square, Inc., Class A3 | | | 3,284,830 | | | | 161,614 | |
| Mellanox Technologies, Ltd.3 | | | 2,204,000 | | | | 160,561 | |
| Qorvo, Inc.3 | | | 2,247,204 | | | | 158,316 | |
| MINDBODY, Inc., Class A3 | | | 3,400,000 | | | | 132,260 | |
| Zebra Technologies Corp., Class A3 | | | 949,300 | | | | 132,133 | |
| Vanguard International Semiconductor Corp. | | | 56,908,575 | | | | 130,770 | |
| Other securities | | | | | | | 3,928,042 | |
| | | | | | | | 5,649,515 | |
| | | | | | | | | |
| Industrials 13.10% | | | | | | | | |
| Kirby Corp.3 | | | 2,195,000 | | | | 168,905 | |
| MonotaRO Co., Ltd. | | | 4,374,300 | | | | 157,003 | |
| NIBE Industrier AB, Class B2 | | | 15,558,453 | | | | 147,160 | |
| Nihon M&A Center Inc. | | | 4,271,180 | | | | 146,881 | |
| Rexnord Corp.3 | | | 4,430,000 | | | | 131,482 | |
| IDEX Corp. | | | 875,000 | | | | 124,696 | |
| Aalberts Industries NV, non-registered shares2 | | | 2,420,000 | | | | 123,511 | |
| TechnoPro Holdings, Inc.1 | | | 2,036,000 | | | | 122,623 | |
| Other securities | | | | | | | 4,118,170 | |
| | | | | | | | 5,240,431 | |
| | | | | | | | | |
| Financials 11.92% | | | | | | | | |
| Kotak Mahindra Bank Ltd.2 | | | 18,292,040 | | | | 296,660 | |
| Essent Group Ltd.1,3 | | | 6,075,535 | | | | 258,575 | |
| Radian Group Inc. | | | 9,680,000 | | | | 184,307 | |
| Webster Financial Corp. | | | 3,201,922 | | | | 177,387 | |
| CenterState Bank Corp.1 | | | 6,069,250 | | | | 161,017 | |
| SVB Financial Group3 | | | 652,500 | | | | 156,607 | |
| Grupo Supervielle SA, Class B (ADR) | | | 4,912,000 | | | | 149,030 | |
| MarketAxess Holdings Inc. | | | 660,000 | | | | 143,510 | |
| Bajaj Finance Ltd.2 | | | 5,237,160 | | | | 143,376 | |
| Texas Capital Bancshares, Inc.3 | | | 1,507,817 | | | | 135,553 | |
| RenaissanceRe Holdings Ltd. | | | 883,000 | | | | 122,304 | |
| Other securities | | | | | | | 2,843,725 | |
| | | | | | | | 4,772,051 | |
| | | | | | | | | |
| Consumer staples 5.47% | | | | | | | | |
| Emmi AG1,2 | | | 289,300 | | | | 237,166 | |
| Raia Drogasil SA, ordinary nominative | | | 7,527,574 | | | | 170,377 | |
| Morinaga & Co., Ltd.1 | | | 3,667,600 | | | | 161,446 | |
| Lion Corp. | | | 6,887,000 | | | | 138,672 | |
| Ariake Japan Co., Ltd. | | | 1,607,000 | | | | 128,645 | |
| Common stocks (continued) | | Shares | | | Value
(000) | |
| Consumer staples (continued) | | | | | | | | |
| a2 Milk Co. Ltd.2,3 | | | 14,035,000 | | | $ | 124,770 | |
| Other securities | | | | | | | 1,229,013 | |
| | | | | | | | 2,190,089 | |
| | | | | | | | | |
| Materials 4.83% | | | | | | | | |
| Hudbay Minerals Inc.1 | | | 18,856,137 | | | | 133,474 | |
| Other securities | | | | | | | 1,797,619 | |
| | | | | | | | 1,931,093 | |
| | | | | | | | | |
| Real estate 1.42% | | | | | | | | |
| WHA Corp. PCL1 | | | 1,145,170,900 | | | | 136,966 | |
| Other securities | | | | | | | 432,464 | |
| | | | | | | | 569,430 | |
| | | | | | | | | |
| Other 4.48% | | | | | | | | |
| Other securities | | | | | | | 1,792,236 | |
| | | | | | | | | |
| Miscellaneous 4.89% | | | | | | | | |
| Other common stocks in initial period of acquisition | | | | | | | 1,958,745 | |
| | | | | | | | | |
| Total common stocks (cost: $25,550,257,000) | | | | | | | 37,076,367 | |
| | | | | | | | | |
| Preferred securities 0.10% | | | | | | | | |
| Other 0.10% | | | | | | | | |
| Other securities | | | | | | | 42,204 | |
| | | | | | | | | |
| Total preferred securities (cost: $41,513,000) | | | | | | | 42,204 | |
| | | | | | | | | |
| Rights & warrants 0.01% | | | | | | | | |
| Other 0.01% | | | | | | | | |
| Other securities | | | | | | | 2,892 | |
| | | | | | | | | |
| Total rights & warrants (cost: $0) | | | | | | | 2,892 | |
| | | | | | | | | |
| Convertible stocks 0.35% | | | | | | | | |
| Other 0.35% | | | | | | | | |
| Other securities | | | | | | | 142,897 | |
| | | | | | | | | |
| Total convertible stocks (cost: $138,000,000) | | | | | | | 142,897 | |
| | | | | | | | |
| Convertible bonds 0.05% | Principal amount
(000) | | | | | |
| Consumer discretionary 0.05% | | | | | | | | |
| Other securities | | | | | | | 19,336 | |
| | | | | | | | | |
| Total convertible bonds (cost: $21,242,000) | | | | | | | 19,336 | |
| Bonds, notes & other debt instruments 0.06% | Principal amount
(000) | | | | Value
(000) | |
| U.S. Treasury bonds & notes 0.06% | | | | | | | | |
| Other securities | | | | | | $ | 24,934 | |
| | | | | | | | | |
| Total bonds, notes & other debt instruments (cost: $24,951,000) | | | | | | | 24,934 | |
| | | | | | | |
| Short-term securities 6.88% | | | | | | |
| Canadian Imperial Bank of Commerce 1.66%–1.69% due 4/4/2018–4/6/20184 | | $ | 196,100 | | | | 196,035 | |
| Commonwealth Bank of Australia 1.92%–2.04% due 4/19/2018–5/24/20184 | | | 128,400 | | | | 128,201 | |
| Federal Home Loan Bank 1.42%–1.75% due 4/9/2018–6/13/2018 | | | 385,459 | | | | 384,854 | |
| Mizuho Bank, Ltd. 1.70%–1.98% due 4/24/2018–5/21/20184 | | | 193,900 | | | | 193,538 | |
| National Australia Bank Ltd. 1.65%–1.73% due 4/5/2018–5/2/20184 | | | 253,100 | | | | 252,818 | |
| Nordea Bank AB 1.42%–1.68% due 4/9/2018–4/25/20184 | | | 140,000 | | | | 139,844 | |
| Sumitomo Mitsui Banking Corp. 1.68%–2.00% due 4/3/2018–5/21/20184 | | | 181,800 | | | | 181,628 | |
| Swedbank AB 1.70%–1.71% due 4/11/2018–4/16/2018 | | | 124,600 | | | | 124,501 | |
| Total Capital Canada Ltd. 1.66%–1.74% due 4/4/2018–5/9/20184 | | | 177,600 | | | | 177,367 | |
| Other securities | | | | | | | 972,744 | |
| | | | | | | | | |
| Total short-term securities (cost: $2,752,017,000) | | | | | | | 2,751,530 | |
| Total investment securities 100.10% (cost: $28,527,980,000) | | | | | | | 40,060,160 | |
| Other assets less liabilities (0.10)% | | | | | | | (41,382 | ) |
| | | | | | | | | |
| Net assets 100.00% | | | | | | $ | 40,018,778 | |
This summary investment portfolio is designed to streamline the report and help investors better focus on the fund’s principal holdings. See the inside back cover for details on how to obtain a complete schedule of portfolio holdings.
As permitted by U.S. Securities and Exchange Commission regulations, “Miscellaneous” securities include holdings in their first year of acquisition that have not previously been publicly disclosed.
“Other securities” includes all issues that are not disclosed separately in the summary investment portfolio. “Other securities” also includes securities which were pledged as collateral. The total value of pledged collateral was $1,746,000, which represented less than .01% of the net assets of the fund.
Forward currency contracts
| Contract amount | | | | | | Unrealized
appreciation
(depreciation) | |
Purchases
(000) | | Sales
(000) | | Counterparty | | Settlement date | | at 3/31/2018
(000) | |
| USD27,202 | | CAD34,000 | | UBS AG | | | 4/5/2018 | | | $ | 810 | |
| USD33,811 | | GBP24,400 | | Bank of America, N.A. | | | 4/11/2018 | | | | (410 | ) |
| USD15,917 | | GBP11,375 | | Bank of America, N.A. | | | 4/16/2018 | | | | (40 | ) |
| USD14,859 | | GBP10,590 | | Barclays Bank PLC | | | 4/23/2018 | | | | (1 | ) |
| USD27,192 | | GBP19,380 | | Goldman Sachs | | | 4/23/2018 | | | | (3 | ) |
| USD107,096 | | GBP76,514 | | Citibank | | | 4/23/2018 | | | | (271 | ) |
| USD50,554 | | JPY5,303,225 | | JPMorgan Chase | | | 4/27/2018 | | | | 638 | |
| USD46,523 | | INR3,049,338 | | Citibank | | | 5/25/2018 | | | | 92 | |
| | | | | | | | | | | $ | 815 | |
Investments in affiliates
A company is an affiliate of the fund under the Investment Company Act of 1940 if the fund’s holdings in that company represent 5% or more of the outstanding voting shares. The value of the fund’s affiliated-company holdings is either shown in the summary investment portfolio or included in the value of “Other securities” under the respective industry sectors. Further details on such holdings and related transactions during the six months ended March 31, 2018, appear below.
| | | Beginning
shares | | Additions | | Reductions | | Ending
shares | |
| Common stocks 21.81% | | | | | | | | | |
| Consumer discretionary 4.53% | | | | | | | | | |
| Seria Co., Ltd. | | 4,334,948 | | 721,646 | | — | | 5,056,594 | |
| Lions Gate Entertainment Corp., Class A | | 4,243,393 | | 250,000 | | 115,000 | | 4,378,393 | |
| Lions Gate Entertainment Corp., Class B | | 3,878,393 | | — | | 88,000 | | 3,790,393 | |
| At Home Group Inc.3 | | 1,830,940 | | 1,965,933 | | — | | 3,796,873 | |
| MakeMyTrip Ltd., non-registered shares3 | | 2,877,300 | | 284,700 | | — | | 3,162,000 | |
| MakeMyTrip Ltd., non-registered shares3,5 | | 92,000 | | — | | — | | 92,000 | |
| Entertainment One Ltd.2 | | 27,650,631 | | — | | — | | 27,650,631 | |
| Evolution Gaming Group AB2 | | 1,943,200 | | — | | — | | 1,943,200 | |
| zooplus AG, non-registered shares2,3 | | 500,634 | | 60,000 | | — | | 560,634 | |
| Tailored Brands, Inc. | | 3,741,000 | | 580,350 | | 382,250 | | 3,939,100 | |
| Cairn Homes PLC2,3 | | 31,915,000 | | 12,146,000 | | — | | 44,061,000 | |
| Ted Baker PLC2 | | 3,446,897 | | — | | 775,000 | | 2,671,897 | |
| Strayer Education, Inc. | | 845,750 | | — | | — | | 845,750 | |
| POYA International Co., Ltd. | | 6,803,267 | | — | | — | | 6,803,267 | |
| Delta Corp Ltd.2 | | — | | 21,407,238 | | — | | 21,407,238 | |
| Sleep Country Canada Holdings Inc. | | 3,011,253 | | 715 | | — | | 3,011,968 | |
| Taiwan Paiho Ltd. | | 21,611,000 | | — | | 1,050,000 | | 20,561,000 | |
| Lands’ End, Inc.3 | | 1,654,000 | | 107,232 | | — | | 1,761,232 | |
| Hostelworld Group PLC2 | | 7,645,662 | | — | | — | | 7,645,662 | |
| Tile Shop Holdings, Inc. | | — | | 3,158,000 | | — | | 3,158,000 | |
| BNN Technology PLC2,3,6 | | 19,007,000 | | — | | — | | 19,007,000 | |
| Talwalkars Lifestyles Ltd.2,3,6 | | — | | 2,389,000 | | — | | 2,389,000 | |
| Talwalkars Better Value Fitness Ltd.2,6 | | 2,389,000 | | — | | — | | 2,389,000 | |
| Ace Hardware Indonesia Tbk PT2,7 | | 850,382,300 | | 179,367,665 | | 173,999,965 | | 855,750,000 | |
| Beauty Community PCL, foreign registered7 | | 208,500,000 | | — | | 78,835,000 | | 129,665,000 | |
| GVC Holdings PLC2,7 | | 19,240,894 | | 3,695,000 | | 4,794,200 | | 18,141,694 | |
| JINS Inc.7 | | 1,381,000 | | — | | 782,000 | | 599,000 | |
| YOOX Net-A-Porter Group SPA2,3,7 | | 6,093,000 | | 1,104,557 | | 5,177,557 | | 2,020,000 | |
| Health care 5.00% | | | | | | | | | |
| Molina Healthcare, Inc.3 | | 4,069,005 | | 498,515 | | — | | 4,567,520 | |
| Insulet Corp.3 | | 3,734,000 | | 300,000 | | 263,400 | | 3,770,600 | |
| GW Pharmaceuticals PLC (ADR)3 | | 1,891,400 | | 358,946 | | — | | 2,250,346 | |
| Diplomat Pharmacy, Inc.3 | | 872,100 | | 5,050,680 | | — | | 5,922,780 | |
| iRhythm Technologies, Inc.3 | | 1,591,200 | | 40,000 | | — | | 1,631,200 | |
| CONMED Corp. | | 1,823,000 | | 236,000 | | 465,000 | | 1,594,000 | |
| Madrigal Pharmaceuticals, Inc.3 | | — | | 748,393 | | — | | 748,393 | |
| Glaukos Corp.3 | | 2,740,000 | | — | | — | | 2,740,000 | |
| Adaptimmune Therapeutics PLC (ADR)3 | | 6,792,700 | | — | | — | | 6,792,700 | |
| Genomma Lab Internacional, SAB de CV, Series B3 | | 67,483,000 | | — | | — | | 67,483,000 | |
| Flexion Therapeutics, Inc.3 | | 2,538,000 | | 334,000 | | — | | 2,872,000 | |
| Evolent Health, Inc., Class A3 | | — | | 4,142,000 | | — | | 4,142,000 | |
| Osstem Implant Co., Ltd.3 | | 1,078,621 | | — | | — | | 1,078,621 | |
| NuCana PLC (ADR)3 | | 1,932,728 | | 609,900 | | — | | 2,542,628 | |
| CryoLife, Inc.3 | | 1,993,149 | | 164,102 | | — | | 2,157,251 | |
| Tabula Rasa HealthCare, Inc.3 | | — | | 1,060,488 | | — | | 1,060,488 | |
| | | Beginning
shares | | Additions | | Reductions | | Ending
shares | |
| Natera, Inc.3 | | 4,222,609 | | — | | 172,682 | | 4,049,927 | |
| CellaVision AB, non-registered shares2 | | 1,908,123 | | — | | — | | 1,908,123 | |
| Pacific Biosciences of California, Inc.3 | | 8,128,077 | | 2,170,000 | | — | | 10,298,077 | |
| Xenon Pharmaceuticals Inc.3 | | 1,429,000 | | — | | — | | 1,429,000 | |
| Monash IVF Group Ltd.2,7 | | 18,820,000 | | — | | 18,820,000 | | — | |
| Neovasc Inc.3,7 | | — | | 4,090,543 | | — | | 4,090,543 | |
| Neovasc Inc. (CAD denominated)3,7 | | 6,294,667 | | — | | — | | 6,294,667 | |
| Viralytics Ltd.3,7 | | 14,000,000 | | 1,650,000 | | 15,650,000 | | — | |
| Virtus Health Ltd.7 | | 5,223,000 | | — | | 5,223,000 | | — | |
| Vitrolife AB2,7 | | 1,363,579 | | — | | 396,620 | | 966,959 | |
| Information technology 3.16% | | | | | | | | | |
| ZPG PLC2 | | 26,498,395 | | — | | 1,000,000 | | 25,498,395 | |
| Alarm.Com Holdings, Inc.3 | | 1,910,000 | | 1,127,000 | | — | | 3,037,000 | |
| Acacia Communications, Inc.3 | | 2,179,910 | | 977,830 | | 199,000 | | 2,958,740 | |
| Douzone Bizon Co., Ltd. | | 1,755,000 | | 294,408 | | — | | 2,049,408 | |
| Talend SA (ADR)3 | | 2,164,055 | | — | | — | | 2,164,055 | |
| Globant SA3 | | 1,969,510 | | 48,000 | | 226,023 | | 1,791,487 | |
| Inphi Corp.3 | | 2,970,199 | | — | | — | | 2,970,199 | |
| Mitel Networks Corp.3 | | 5,934,900 | | 3,607,353 | | — | | 9,542,253 | |
| SPS Commerce, Inc.3,8 | | 730,000 | | 429,000 | | — | | 1,159,000 | |
| eMemory Technology Inc. | | 6,146,000 | | — | | — | | 6,146,000 | |
| Yext, Inc.3 | | — | | 5,727,067 | | — | | 5,727,067 | |
| Quotient Technology Inc.3 | | 6,711,613 | | — | | 1,399,946 | | 5,311,667 | |
| Ascom Holding AG2 | | — | | 2,226,000 | | — | | 2,226,000 | |
| Bravura Solutions Ltd.2 | | — | | 17,125,000 | | — | | 17,125,000 | |
| Datalex PLC2 | | 6,106,000 | | — | | — | | 6,106,000 | |
| Megaport Ltd.2,3 | | — | | 7,476,000 | | — | | 7,476,000 | |
| GoldMoney Inc.3 | | 3,531,100 | | 1,400,000 | | — | | 4,931,100 | |
| Callidus Software Inc. (USA)3,7 | | 3,420,000 | | — | | 3,420,000 | | — | |
| MagnaChip Semiconductor Corp.3,7 | | 2,355,000 | | — | | 2,355,000 | | — | |
| Paycom Software, Inc.3,7 | | 3,126,716 | | 100,000 | | 748,982 | | 2,477,734 | |
| RIB Software SE2,7 | | 2,980,173 | | — | | 2,053,173 | | 927,000 | |
| Vanguard International Semiconductor Corp.7 | | 83,546,386 | | 4,051,000 | | 30,688,811 | | 56,908,575 | |
| WIN Semiconductors Corp.7 | | 20,743,009 | | 328,000 | | 11,429,651 | | 9,641,358 | |
| Industrials 2.01% | | | | | | | | | |
| TechnoPro Holdings, Inc. | | 1,969,000 | | 67,000 | | — | | 2,036,000 | |
| Bravida Holding AB2 | | 15,730,395 | | 164,803 | | — | | 15,895,198 | |
| King Slide Works Co., Ltd. | | 7,623,765 | | — | | — | | 7,623,765 | |
| Continental Building Products, Inc.3 | | 3,330,700 | | — | | — | | 3,330,700 | |
| Kratos Defense & Security Solutions, Inc.3 | | 8,087,000 | | 175,000 | | — | | 8,262,000 | |
| XP Power Ltd.2 | | 1,237,207 | | 250,793 | | — | | 1,488,000 | |
| Tsubaki Nakashima Co., Ltd. | | 2,118,800 | | 189,000 | | — | | 2,307,800 | |
| Barrett Business Services, Inc. | | 580,000 | | — | | — | | 580,000 | |
| R.R. Donnelley & Sons Co. | | 3,890,358 | | 91,131 | | — | | 3,981,489 | |
| KeyW Holding Corp.3 | | 2,536,400 | | — | | — | | 2,536,400 | |
| J. Kumar Infraprojects Ltd.2 | | 4,450,500 | | — | | — | | 4,450,500 | |
| va-Q-tec AG2,3 | | 542,000 | | 242,000 | | — | | 784,000 | |
| Alfen NV2,3 | | — | | 1,275,000 | | — | | 1,275,000 | |
| Financials 2.36% | | | | | | | | | |
| Essent Group Ltd.3 | | 5,825,535 | | 250,000 | | — | | 6,075,535 | |
| CenterState Bank Corp. | | 3,748,399 | | 2,320,851 | | — | | 6,069,250 | |
| M&A Capital Partners Co., Ltd.3 | | 937,100 | | 275,900 | | 66,700 | | 1,146,300 | |
| Cannae Holdings, Inc.3 | | — | | 4,895,000 | | — | | 4,895,000 | |
| Third Point Reinsurance Ltd.3 | | 5,325,506 | | 2,010,683 | | 1,188,368 | | 6,147,821 | |
Investments in affiliates (continued)
| | | Beginning
shares | | Additions | | Reductions | | Ending
shares | |
| NMI Holdings, Inc.3 | | 2,553,127 | | 2,483,000 | | — | | 5,036,127 | |
| Trupanion, Inc.3 | | 2,380,800 | | 29,400 | | — | | 2,410,200 | |
| TPG Pace Energy Holdings Corp., Class A2,3,4 | | — | | 4,000,000 | | — | | 4,000,000 | |
| Numis Corp. PLC2 | | 5,663,282 | | — | | — | | 5,663,282 | |
| Republic First Bancorp, Inc.3,8 | | 2,584,000 | | 603,000 | | — | | 3,187,000 | |
| Consumer staples 1.69% | | | | | | | | | |
| Emmi AG2 | | 289,300 | | — | | — | | 289,300 | |
| Morinaga & Co., Ltd. | | 2,390,600 | | 1,277,000 | | — | | 3,667,600 | |
| Milbon Co., Ltd. | | 1,324,300 | | 1,142,100 | | 480,200 | | 1,986,200 | |
| Simply Good Foods Co., Class A3 | | 4,017,095 | | 402,905 | | — | | 4,420,000 | |
| CCL Products (India) Ltd.2 | | 10,642,173 | | — | | — | | 10,642,173 | |
| CLIO Cosmetics Co., Ltd. | | 1,166,900 | | 101,199 | | — | | 1,268,099 | |
| BWX Ltd.2 | | 7,708,000 | | 1,352,280 | | — | | 9,060,280 | |
| R.E.A. Holdings PLC2,3 | | 2,162,000 | | — | | — | | 2,162,000 | |
| Materials 1.51% | | | | | | | | | |
| Hudbay Minerals Inc. | | 5,568,237 | | 14,010,000 | | 722,100 | | 18,856,137 | |
| Sirius Minerals PLC2,3 | | 247,367,560 | | — | | — | | 247,367,560 | |
| Scapa Group PLC2 | | 12,183,326 | | — | | — | | 12,183,326 | |
| Century Aluminum Co.3,8 | | 1,332,000 | | 3,536,000 | | — | | 4,868,000 | |
| Clearwater Paper Corp.3 | | 990,000 | | 325,800 | | — | | 1,315,800 | |
| Navin Fluorine International Ltd.2 | | — | | 3,202,000 | | — | | 3,202,000 | |
| Mayur Uniquoters Ltd.2 | | — | | 3,660,000 | | — | | 3,660,000 | |
| Kenmare Resources PLC2,3 | | 7,124,863 | | — | | — | | 7,124,863 | |
| BlueJay Mining PLC2,3,8 | | 25,800,000 | | 19,209,091 | | — | | 45,009,091 | |
| Hummingbird Resources PLC2,3 | | 27,459,300 | | — | | — | | 27,459,300 | |
| Excelsior Mining Corp.2,3,4 | | — | | 12,868,000 | | — | | 12,868,000 | |
| Bacanora Lithium PLC2,3,9 | | 8,573,925 | | — | | — | | 8,573,925 | |
| Danakali Ltd.2,3 | | 16,700,000 | | — | | — | | 16,700,000 | |
| Kennady Diamonds Inc.3,7 | | 2,557,952 | | — | | — | | 2,557,952 | |
| Real estate 0.90% | | | | | | | | | |
| WHA Corp. PCL | | 1,145,170,900 | | — | | — | | 1,145,170,900 | |
| MGM Growth Properties LLC REIT, Class A | | 4,148,087 | | 48,400 | | — | | 4,196,487 | |
| Purplebricks Group PLC2,3 | | 21,151,800 | | 302,700 | | — | | 21,454,500 | |
| Mahindra Lifespace Developers Ltd.2 | | 2,696,725 | | — | | — | | 2,696,725 | |
| Energy 0.39% | | | | | | | | | |
| Nine Energy Service, Inc.3 | | — | | 1,472,900 | | — | | 1,472,900 | |
| Tidewater Midstream and Infrastructure Ltd. | | 24,334,000 | | — | | — | | 24,334,000 | |
| Savannah Petroleum PLC2,3 | | 17,844,000 | | 47,513,000 | | — | | 65,357,000 | |
| Source Energy Services Ltd.3 | | 3,438,235 | | 1,500,000 | | — | | 4,938,235 | |
| San Leon Energy PLC2,3,6 | | 32,348,000 | | — | | — | | 32,348,000 | |
| Independence Contract Drilling, Inc.3 | | 2,955,645 | | 68,952 | | 99,840 | | 2,924,757 | |
| Lekoil Ltd. (CDI)2,3 | | 42,922,391 | | — | | — | | 42,922,391 | |
| BNK Petroleum Inc.3 | | 12,804,914 | | — | | — | | 12,804,914 | |
| Sterling Resources Ltd. | | — | | 34,775,000 | | — | | 34,775,000 | |
| Providence Resources PLC2,3 | | 35,235,000 | | — | | — | | 35,235,000 | |
| Telecommunication services 0.25% | | | | | | | | | |
| Iridium Communications Inc.3 | | 7,206,088 | | 46,300 | | — | | 7,252,388 | |
| Iridium Communications Inc.3,4 | | — | | 636,132 | | — | | 636,132 | |
| Zegona Communications PLC2 | | 12,305,654 | | — | | 4,393,868 | | 7,911,786 | |
| Utilities 0.01% | | | | | | | | | |
| Mytrah Energy Ltd.2,3 | | 10,418,000 | | — | | — | | 10,418,000 | |
| | | Beginning
shares | | Additions | | Reductions | | Ending
shares | |
| Convertible stocks 0.05% | | | | | | | | | |
| Health care 0.05% | | | | | | | | | |
| Allakos Inc., Series B, 8.00% noncumulative2,5,6 | | — | | 2,522,736 | | — | | 2,522,736 | |
| Telecommunication services 0.00% | | | | | | | | | |
| Iridium Communications Inc., Series A, convertible preferred4,7 | | 60,000 | | — | | 60,000 | | — | |
| Preferred securities 0.00% | | | | | | | | | |
| Consumer staples 0.00% | | | | | | | | | |
| R.E.A. Holdings PLC 9.00% | | 96,000 | | — | | — | | 96,000 | |
| Rights & warrants 0.01% | | | | | | | | | |
| Real estate 0.01% | | | | | | | | | |
| WHA Corp. PCL, warrants, expire 20203 | | 6,909,830 | | — | | 2,448,100 | | 4,461,730 | |
| Energy 0.00% | | | | | | | | | |
| Savannah Petroleum PLC, warrants, expire 20192,3 | | — | | 21,698,000 | | — | | 21,698,000 | |
| Health care 0.00% | | | | | | | | | |
| Neovasc Inc., Class A, warrants, expire 20222,3,7 | | — | | 2,020,548 | | — | | 2,020,548 | |
| Neovasc Inc., Class B, warrants, expire 20192,3,7 | | — | | 2,020,548 | | 236,550 | | 1,783,998 | |
| Neovasc Inc., Class C, warrants, expire 20192,3,7 | | — | | 808,489 | | — | | 808,489 | |
| | | Net
realized
gain (loss)
(000) | | | Net
unrealized
(depreciation)
appreciation
(000) | | | Dividend
income
(000) | | | Value of
affiliates at
3/31/2018
(000) | |
| Common stocks 21.81% | | | | | | | | | | | | | | | | |
| Consumer discretionary 4.53% | | | | | | | | | | | | | | | | |
| Seria Co., Ltd. | | $ | — | | | $ | (25,119 | ) | | $ | 1,413 | | | $ | 255,609 | |
| Lions Gate Entertainment Corp., Class A | | | 301 | | | | (33,073 | ) | | | 394 | | | | 113,094 | |
| Lions Gate Entertainment Corp., Class B | | | 229 | | | | (29,701 | ) | | | 341 | | | | 91,273 | |
| At Home Group Inc.3 | | | — | | | | 26,355 | | | | — | | | | 121,652 | |
| MakeMyTrip Ltd., non-registered shares3 | | | — | | | | 18,136 | | | | — | | | | 109,722 | |
| MakeMyTrip Ltd., non-registered shares3,5 | | | — | | | | 547 | | | | — | | | | 3,192 | |
| Entertainment One Ltd.2 | | | — | | | | 13,472 | | | | — | | | | 109,065 | |
| Evolution Gaming Group AB2 | | | — | | | | (17,719 | ) | | | — | | | | 106,346 | |
| zooplus AG, non-registered shares2,3 | | | — | | | | 7,261 | | | | — | | | | 102,167 | |
| Tailored Brands, Inc. | | | 554 | | | | 42,344 | | | | 1,417 | | | | 98,714 | |
| Cairn Homes PLC2,3 | | | — | | | | 5,816 | | | | — | | | | 98,205 | |
| Ted Baker PLC2 | | | 3,682 | | | | (4,948 | ) | | | 755 | | | | 93,999 | |
| Strayer Education, Inc. | | | — | | | | 11,654 | | | | 423 | | | | 85,463 | |
| POYA International Co., Ltd. | | | — | | | | 4,592 | | | | — | | | | 84,816 | |
| Delta Corp Ltd.2 | | | — | | | | (13,226 | ) | | | — | | | | 83,848 | |
| Sleep Country Canada Holdings Inc. | | | — | | | | (7,351 | ) | | | 787 | | | | 79,741 | |
| Taiwan Paiho Ltd. | | | 943 | | | | (37,878 | ) | | | — | | | | 58,530 | |
| Lands’ End, Inc.3 | | | — | | | | 17,899 | | | | — | | | | 41,125 | |
| Hostelworld Group PLC2 | | | — | | | | 4,112 | | | | — | | | | 40,921 | |
| Tile Shop Holdings, Inc. | | | — | | | | (6,116 | ) | | | 274 | | | | 18,948 | |
| BNN Technology PLC2,3,6 | | | — | | | | (501 | ) | | | — | | | | 8,057 | |
| Talwalkars Lifestyles Ltd.2,3,6 | | | — | | | | 4,269 | | | | — | | | | 6,300 | |
| Talwalkars Better Value Fitness Ltd.2,6 | | | — | | | | (5,307 | ) | | | — | | | | 2,568 | |
Investments in affiliates (continued)
| | | Net
realized
gain (loss)
(000) | | | Net
unrealized
(depreciation)
appreciation
(000) | | | Dividend
income
(000) | | | Value of
affiliates at
3/31/2018
(000) | |
| Ace Hardware Indonesia Tbk PT2,7 | | $ | 307 | | | $ | 5,545 | | | $ | — | | | $ | — | |
| Beauty Community PCL, foreign registered7 | | | 34,592 | | | | 802 | | | | — | | | | — | |
| GVC Holdings PLC2,7 | | | 20,281 | | | | 10,663 | | | | 3,347 | | | | — | |
| JINS Inc.7 | | | 11,109 | | | | (25,546 | ) | | | — | | | | — | |
| YOOX Net-A-Porter Group SPA2,3,7 | | | 100,811 | | | | (46,009 | ) | | | — | | | | — | |
| | | | | | | | | | | | | | | | 1,813,355 | |
| Health care 5.00% | | | | | | | | | | | | | | | | |
| Molina Healthcare, Inc.3 | | | — | | | | 46,405 | | | | — | | | | 370,791 | |
| Insulet Corp.3 | | | 8,350 | | | | 110,624 | | | | — | | | | 326,836 | |
| GW Pharmaceuticals PLC (ADR)3 | | | — | | | | 17,971 | | | | — | | | | 253,547 | |
| Diplomat Pharmacy, Inc.3 | | | — | | | | (20,830 | ) | | | — | | | | 119,344 | |
| iRhythm Technologies, Inc.3 | | | — | | | | 18,021 | | | | — | | | | 102,684 | |
| CONMED Corp. | | | 77 | | | | 15,859 | | | | 590 | | | | 100,948 | |
| Madrigal Pharmaceuticals, Inc.3 | | | — | | | | (13,112 | ) | | | — | | | | 87,405 | |
| Glaukos Corp.3 | | | — | | | | (5,946 | ) | | | — | | | | 84,474 | |
| Adaptimmune Therapeutics PLC (ADR)3 | | | — | | | | 20,650 | | | | — | | | | 76,282 | |
| Genomma Lab Internacional, SAB de CV, Series B3 | | | — | | | | (13,545 | ) | | | — | | | | 73,097 | |
| Flexion Therapeutics, Inc.3 | | | — | | | | (5,524 | ) | | | — | | | | 64,362 | |
| Evolent Health, Inc., Class A3 | | | — | | | | 6,844 | | | | — | | | | 59,024 | |
| Osstem Implant Co., Ltd.3 | | | — | | | | (12,180 | ) | | | — | | | | 53,734 | |
| NuCana PLC (ADR)3 | | | — | | | | (2,094 | ) | | | — | | | | 48,107 | |
| CryoLife, Inc.3 | | | — | | | | (5,266 | ) | | | — | | | | 43,253 | |
| Tabula Rasa HealthCare, Inc.3 | | | — | | | | 5,107 | | | | — | | | | 41,147 | |
| Natera, Inc.3 | | | (2,145 | ) | | | (13,106 | ) | | | — | | | | 37,543 | |
| CellaVision AB, non-registered shares2 | | | — | | | | (9,253 | ) | | | — | | | | 31,454 | |
| Pacific Biosciences of California, Inc.3 | | | — | | | | (26,769 | ) | | | — | | | | 21,111 | |
| Xenon Pharmaceuticals Inc.3 | | | — | | | | 2,787 | | | | — | | | | 7,002 | |
| Monash IVF Group Ltd.2,7 | | | (16,738 | ) | | | 13,694 | | | | — | | | | — | |
| Neovasc Inc.3,7 | | | — | | | | (2,700 | ) | | | — | | | | — | |
| Neovasc Inc. (CAD denominated)3,7 | | | — | | | | (10,254 | ) | | | — | | | | — | |
| Viralytics Ltd.3,7 | | | 7,878 | | | | 2,240 | | | | — | | | | — | |
| Virtus Health Ltd.7 | | | (9,961 | ) | | | 7,561 | | | | — | | | | — | |
| Vitrolife AB2,7 | | | 10,359 | | | | (24,714 | ) | | | — | | | | — | |
| | | | | | | | | | | | | | | | 2,002,145 | |
| Information technology 3.16% | | | | | | | | | | | | | | | | |
| ZPG PLC2 | | | (174 | ) | | | (3,389 | ) | | | 1,297 | | | | 120,255 | |
| Alarm.Com Holdings, Inc.3 | | | — | | | | (16,276 | ) | | | — | | | | 114,616 | |
| Acacia Communications, Inc.3 | | | (1,796 | ) | | | (16,751 | ) | | | — | | | | 113,793 | |
| Douzone Bizon Co., Ltd. | | | — | | | | 47,658 | | | | 654 | | | | 111,324 | |
| Talend SA (ADR)3 | | | — | | | | 15,538 | | | | — | | | | 104,134 | |
| Globant SA3 | | | 6,354 | | | | 16,843 | | | | — | | | | 92,333 | |
| Inphi Corp.3 | | | — | | | | (28,484 | ) | | | — | | | | 89,403 | |
| Mitel Networks Corp.3 | | | — | | | | 7,993 | | | | — | | | | 88,552 | |
| SPS Commerce, Inc.3,8 | | | — | | | | 11,455 | | | | — | | | | 74,257 | |
| eMemory Technology Inc. | | | — | | | | (6,155 | ) | | | — | | | | 73,355 | |
| Yext, Inc.3 | | | — | | | | 1,703 | | | | — | | | | 72,447 | |
| Quotient Technology Inc.3 | | | (2,399 | ) | | | (13,823 | ) | | | — | | | | 69,583 | |
| Ascom Holding AG2 | | | — | | | | (8,977 | ) | | | — | | | | 47,301 | |
| Bravura Solutions Ltd.2 | | | — | | | | 6,527 | | | | 443 | | | | 35,854 | |
| Datalex PLC2 | | | — | | | | (4,882 | ) | | | — | | | | 22,045 | |
| Megaport Ltd.2,3 | | | — | | | | 37 | | | | — | | | | 21,574 | |
| GoldMoney Inc.3 | | | — | | | | (5,346 | ) | | | — | | | | 12,898 | |
| | | Net
realized
gain (loss)
(000) | | | Net
unrealized
(depreciation)
appreciation
(000) | | | Dividend
income
(000) | | | Value of
affiliates at
3/31/2018
(000) | |
| Callidus Software Inc. (USA)3,7 | | $ | 47,702 | | | $ | (14,528 | ) | | $ | — | | | $ | — | |
| MagnaChip Semiconductor Corp.3,7 | | | (6,396 | ) | | | 6,403 | | | | — | | | | — | |
| Paycom Software, Inc.3,7 | | | 25,881 | | | | 62,809 | | | | — | | | | — | |
| RIB Software SE2,7 | | | 32,915 | | | | (12,098 | ) | | | — | | | | — | |
| Vanguard International Semiconductor Corp.7 | | | 18,926 | | | | 27,845 | | | | — | | | | — | |
| WIN Semiconductors Corp.7 | | | 53,738 | | | | 22,496 | | | | — | | | | — | |
| | | | | | | | | | | | | | | | 1,263,724 | |
| Industrials 2.01% | | | | | | | | | | | | | | | | |
| TechnoPro Holdings, Inc. | | | — | | | | 26,337 | | | | 899 | | | | 122,623 | |
| Bravida Holding AB2 | | | — | | | | (2,814 | ) | | | — | | | | 113,584 | |
| King Slide Works Co., Ltd. | | | — | | | | 921 | | | | — | | | | 105,897 | |
| Continental Building Products, Inc.3 | | | — | | | | 8,493 | | | | — | | | | 95,091 | |
| Kratos Defense & Security Solutions, Inc.3 | | | — | | | | (22,741 | ) | | | — | | | | 85,016 | |
| XP Power Ltd.2 | | | — | | | | 9,224 | | | | 962 | | | | 66,607 | |
| Tsubaki Nakashima Co., Ltd. | | | — | | | | 10,985 | | | | 673 | | | | 59,760 | |
| Barrett Business Services, Inc. | | | — | | | | 15,283 | | | | 290 | | | | 48,070 | |
| R.R. Donnelley & Sons Co. | | | — | | | | (6,032 | ) | | | 1,089 | | | | 34,758 | |
| KeyW Holding Corp.3 | | | — | | | | 634 | | | | — | | | | 19,936 | |
| J. Kumar Infraprojects Ltd.2 | | | — | | | | 4,773 | | | | — | | | | 18,726 | |
| va-Q-tec AG2,3 | | | — | | | | (2,788 | ) | | | — | | | | 17,085 | |
| Alfen NV2,3 | | | — | | | | (56 | ) | | | — | | | | 15,683 | |
| | | | | | | | | | | | | | | | 802,836 | |
| Financials 2.36% | | | | | | | | | | | | | | | | |
| Essent Group Ltd.3 | | | — | | | | 10,965 | | | | — | | | | 258,575 | |
| CenterState Bank Corp. | | | — | | | | (3,688 | ) | | | 827 | | | | 161,017 | |
| M&A Capital Partners Co., Ltd.3 | | | 1,392 | | | | 39,268 | | | | — | | | | 97,042 | |
| Cannae Holdings, Inc.3 | | | — | | | | 7,968 | | | | — | | | | 92,320 | |
| Third Point Reinsurance Ltd.3 | | | 3,459 | | | | (10,437 | ) | | | — | | | | 85,762 | |
| NMI Holdings, Inc.3 | | | — | | | | 14,922 | | | | — | | | | 83,348 | |
| Trupanion, Inc.3 | | | — | | | | 8,236 | | | | — | | | | 72,041 | |
| TPG Pace Energy Holdings Corp., Class A2,3,4 | | | — | | | | (773 | ) | | | — | | | | 39,227 | |
| Numis Corp. PLC2 | | | — | | | | 7,704 | | | | 494 | | | | 29,012 | |
| Republic First Bancorp, Inc.3,8 | | | — | | | | (1,228 | ) | | | — | | | | 27,727 | |
| | | | | | | | | | | | | | | | 946,071 | |
| Consumer staples 1.69% | | | | | | | | | | | | | | | | |
| Emmi AG2 | | | — | | | | 47,590 | | | | — | | | | 237,166 | |
| Morinaga & Co., Ltd. | | | — | | | | (37,203 | ) | | | 1,566 | | | | 161,446 | |
| Milbon Co., Ltd. | | | 8,173 | | | | 22,200 | | | | 524 | | | | 87,805 | |
| Simply Good Foods Co., Class A3 | | | — | | | | 8,815 | | | | — | | | | 60,687 | |
| CCL Products (India) Ltd.2 | | | — | | | | (4,444 | ) | | | — | | | | 45,764 | |
| CLIO Cosmetics Co., Ltd. | | | — | | | | 2,998 | | | | 109 | | | | 39,736 | |
| BWX Ltd.2 | | | — | | | | (7,762 | ) | | | 229 | | | | 33,942 | |
| R.E.A. Holdings PLC2,3 | | | — | | | | 167 | | | | — | | | | 9,365 | |
| | | | | | | | | | | | | | | | 675,911 | |
| Materials 1.51% | | | | | | | | | | | | | | | | |
| Hudbay Minerals Inc. | | | (390 | ) | | | (28,452 | ) | | | 143 | | | | 133,474 | |
| Sirius Minerals PLC2,3 | | | — | | | | 21,019 | | | | — | | | | 105,479 | |
| Scapa Group PLC2 | | | — | | | | 11,690 | | | | — | | | | 83,857 | |
| Century Aluminum Co.3,8 | | | — | | | | (8,435 | ) | | | — | | | | 80,517 | |
| Clearwater Paper Corp.3 | | | — | | | | (10,871 | ) | | | — | | | | 51,448 | |
| Navin Fluorine International Ltd.2 | | | — | | | | (1,634 | ) | | | — | | | | 38,197 | |
Investments in affiliates (continued)
| | | Net
realized
gain (loss)
(000) | | | Net
unrealized
(depreciation)
appreciation
(000) | | | Dividend
income
(000) | | | Value of
affiliates at
3/31/2018
(000) | |
| Mayur Uniquoters Ltd.2 | | $ | — | | | $ | (1,746 | ) | | $ | 19 | | | $ | 26,985 | |
| Kenmare Resources PLC2,3 | | | — | | | | (8,641 | ) | | | — | | | | 22,603 | |
| BlueJay Mining PLC2,3,8 | | | — | | | | 3,165 | | | | — | | | | 15,421 | |
| Hummingbird Resources PLC2,3 | | | — | | | | (398 | ) | | | — | | | | 12,711 | |
| Excelsior Mining Corp.2,3,4 | | | — | | | | 2,659 | | | | — | | | | 12,656 | |
| Bacanora Lithium PLC2,3,9 | | | — | | | | 1,515 | | | | — | | | | 11,057 | |
| Danakali Ltd.2,3 | | | — | | | | (104 | ) | | | — | | | | 8,962 | |
| Kennady Diamonds Inc.3,7 | | | — | | | | 8 | | | | — | | | | — | |
| | | | | | | | | | | | | | | | 603,367 | |
| Real estate 0.90% | | | | | | | | | | | | | | | | |
| WHA Corp. PCL | | | — | | | | 14,620 | | | | 1,705 | | | | 136,966 | |
| MGM Growth Properties LLC REIT, Class A | | | — | | | | (15,391 | ) | | | 3,525 | | | | 111,375 | |
| Purplebricks Group PLC2,3 | | | — | | | | (16,606 | ) | | | — | | | | 94,533 | |
| Mahindra Lifespace Developers Ltd.2 | | | — | | | | (745 | ) | | | — | | | | 18,396 | |
| | | | | | | | | | | | | | | | 361,270 | |
| Energy 0.39% | | | | | | | | | | | | | | | | |
| Nine Energy Service, Inc.3 | | | — | | | | 583 | | | | — | | | | 35,865 | |
| Tidewater Midstream and Infrastructure Ltd. | | | — | | | | (1,440 | ) | | | 381 | | | | 26,253 | |
| Savannah Petroleum PLC2,3 | | | — | | | | (5,010 | ) | | | — | | | | 25,970 | |
| Source Energy Services Ltd.3 | | | — | | | | (15,822 | ) | | | — | | | | 19,049 | |
| San Leon Energy PLC2,3,6 | | | — | | | | 2,260 | | | | — | | | | 11,200 | |
| Independence Contract Drilling, Inc.3 | | | 116 | | | | (4 | ) | | | — | | | | 11,056 | |
| Lekoil Ltd. (CDI)2,3 | | | — | | | | 711 | | | | — | | | | 10,630 | |
| BNK Petroleum Inc.3 | | | — | | | | 2,833 | | | | — | | | | 5,963 | |
| Sterling Resources Ltd. | | | — | | | | (967 | ) | | | — | | | | 5,533 | |
| Providence Resources PLC2,3 | | | — | | | | 2,725 | | | | — | | | | 5,381 | |
| | | | | | | | | | | | | | | | 156,900 | |
| Telecommunication services 0.25% | | | | | | | | | | | | | | | | |
| Iridium Communications Inc.3 | | | — | | | | 6,825 | | | | — | | | | 81,589 | |
| Iridium Communications Inc.3,4 | | | — | | | | 1,681 | | | | — | | | | 7,157 | |
| Zegona Communications PLC2 | | | 1,255 | | | | (6,050 | ) | | | 842 | | | | 11,368 | |
| | | | | | | | | | | | | | | | 100,114 | |
| Utilities 0.01% | | | | | | | | | | | | | | | | |
| Mytrah Energy Ltd.2,3 | | | — | | | | (30 | ) | | | — | | | | 4,126 | |
| Convertible stocks 0.05% | | | | | | | | | | | | | | | | |
| Health care 0.05% | | | | | | | | | | | | | | | | |
| Allakos Inc., Series B, 8.00% noncumulative2,5,6 | | | — | | | | — | | | | — | | | | 20,000 | |
| Telecommunication services 0.00% | | | | | | | | | | | | | | | | |
| Iridium Communications Inc., Series A, convertible preferred4,7 | | | — | | | | (1,399 | ) | | | 420 | | | | — | |
| Preferred securities 0.00% | | | | | | | | | | | | | | | | |
| Consumer staples 0.00% | | | | | | | | | | | | | | | | |
| R.E.A. Holdings PLC 9.00% | | | — | | | | 14 | | | | 6 | | | | 150 | |
| Rights & warrants 0.01% | | | | | | | | | | | | | | | | |
| Real estate 0.01% | | | | | | | | | | | | | | | | |
| WHA Corp. PCL, warrants, expire 20203 | | | 973 | | | | (866 | ) | | | — | | | | 1,091 | |
| Energy 0.00% | | | | | | | | | | | | | | | | |
| Savannah Petroleum PLC, warrants, expire 20192,3 | | | — | | | | 824 | | | | — | | | | 824 | |
| | | Net
realized
gain (loss)
(000) | | | Net
unrealized
(depreciation)
appreciation
(000) | | | Dividend
income
(000) | | | Value of
affiliates at
3/31/2018
(000) | |
| Health care 0.00% | | | | | | | | | | | | | | | | |
| Neovasc Inc., Class A, warrants, expire 20222,3,7 | | $ | — | | | $ | — | | | $ | — | | | $ | — | |
| Neovasc Inc., Class B, warrants, expire 20192,3,7 | | | — | | | | 1 | | | | — | | | | — | |
| Neovasc Inc., Class C, warrants, expire 20192,3,7 | | | — | | | | 1 | | | | — | | | | — | |
| | | | | | | | | | | | | | | | — | |
| Total 21.87% | | $ | 360,358 | | | $ | 216,081 | | | $ | 26,838 | | | $ | 8,751,884 | |
The following footnotes apply to either the individual securities noted or one or more of the securities aggregated and listed as a single line item.
| 1 | Represents an affiliated company as defined under the Investment Company Act of 1940. |
| 2 | Valued under fair value procedures adopted by authority of the board of directors. The total value of all such securities, including those in “Miscellaneous” and “Other securities,” was $12,882,797,000, which represented 32.19% of the net assets of the fund. This amount includes $12,561,447,000 related to certain securities trading outside the U.S. whose values were adjusted as a result of significant market movements following the close of local trading. |
| 3 | Security did not produce income during the last 12 months. |
| 4 | Acquired in a transaction exempt from registration under Rule 144A or Section 4(2) of the Securities Act of 1933. May be resold in the U.S. in transactions exempt from registration, normally to qualified institutional buyers. The total value of all such securities, including those in “Other securities,” was $2,210,667,000, which represented 5.52% of the net assets of the fund. |
| 5 | Acquired through a private placement transaction exempt from registration under the Securities Act of 1933. May be subject to legal or contractual restrictions on resale. Further details on these holdings appear below. |
| 6 | Value determined using significant unobservable inputs. |
| 7 | Unaffiliated issuer at 3/31/2018. |
| 8 | This security was an unaffiliated issuer in its initial period of acquisition at 9/30/2017; it was not publicly disclosed. |
| 9 | This security changed its name during the reporting period. |
| Private placement securities | | Acquisition
date(s) | | Cost
(000) | | | Value
(000) | | | Percent
of net
assets | |
| Allakos Inc., Series B, 8.00% noncumulative | | 11/29/2017 | | $ | 20,000 | | | $ | 20,000 | | | | .05 | % |
| MakeMyTrip Ltd., non-registered shares | | 5/2/2017 | | | 3,312 | | | | 3,192 | | | | .01 | |
| Other private placement securities | | 12/3/2013-3/2/2018 | | | 183,299 | | | | 202,624 | | | | .50 | |
| Total private placement securities | | | | $ | 206,611 | | | $ | 225,816 | | | | .56 | % |
Key to abbreviations and symbol
ADR = American Depositary Receipts
CAD - Canadian dollars
CDI = CREST Depository Interest
GBP = British pounds
INR = Indian rupees
JPY = Japanese yen
USD/$ = U.S. dollars
See Notes to Financial Statements
Financial statements
Statement of assets and liabilities
at March 31, 2018 | unaudited
(dollars in thousands) |
| Assets: | | | | | | | | |
| Investment securities, at value: | | | | | | | | |
| Unaffiliated issuers (cost: $21,589,662) | | $ | 31,308,276 | | | | | |
| Affiliated issuers (cost: $6,938,318) | | | 8,751,884 | | | $ | 40,060,160 | |
| Cash | | | | | | | 32,368 | |
| Cash denominated in currencies other than U.S. dollars (cost: $3,255) | | | | | | | 3,255 | |
| Unrealized appreciation on open forward currency contracts | | | | | | | 1,540 | |
| Receivables for: | | | | | | | | |
| Sales of investments | | | 103,177 | | | | | |
| Sales of fund’s shares | | | 53,796 | | | | | |
| Dividends and interest | | | 49,024 | | | | | |
| Other | | | 989 | | | | 206,986 | |
| | | | | | | | 40,304,309 | |
| Liabilities: | | | | | | | | |
| Unrealized depreciation on open forward currency contracts | | | | | | | 725 | |
| Payables for: | | | | | | | | |
| Purchases of investments | | | 171,819 | | | | | |
| Repurchases of fund’s shares | | | 62,194 | | | | | |
| Investment advisory services | | | 21,205 | | | | | |
| Services provided by related parties | | | 9,615 | | | | | |
| Directors’ deferred compensation | | | 4,455 | | | | | |
| Non-U.S. taxes | | | 14,434 | | | | | |
| Other | | | 1,084 | | | | 284,806 | |
| Net assets at March 31, 2018 | | | | | | $ | 40,018,778 | |
| | | | | | | | | |
| Net assets consist of: | | | | | | | | |
| Capital paid in on shares of capital stock | | | | | | $ | 26,562,540 | |
| Accumulated net investment loss | | | | | | | (193,751 | ) |
| Undistributed net realized gain | | | | | | | 2,127,773 | |
| Net unrealized appreciation | | | | | | | 11,522,216 | |
| Net assets at March 31, 2018 | | | | | | $ | 40,018,778 | |
See Notes to Financial Statements
(dollars and shares in thousands, except per-share amounts)
Total authorized capital stock — 1,000,000 shares,
$.01 par value (710,021 total shares outstanding)
| | | | | | Shares | | | Net asset value | |
| | | Net assets | | | outstanding | | | per share | |
| Class A | | $ | 22,547,770 | | | | 398,951 | | | $ | 56.52 | |
| Class C | | | 799,075 | | | | 16,104 | | | | 49.62 | |
| Class T | | | 11 | | | | — | * | | | 56.61 | |
| Class F-1 | | | 796,896 | | | | 14,266 | | | | 55.86 | |
| Class F-2 | | | 3,517,277 | | | | 61,416 | | | | 57.27 | |
| Class F-3 | | | 1,561,186 | | | | 27,507 | | | | 56.76 | |
| Class 529-A | | | 1,354,807 | | | | 24,250 | | | | 55.87 | |
| Class 529-C | | | 235,175 | | | | 4,653 | | | | 50.54 | |
| Class 529-E | | | 61,709 | | | | 1,137 | | | | 54.29 | |
| Class 529-T | | | 12 | | | | — | * | | | 56.59 | |
| Class 529-F-1 | | | 122,911 | | | | 2,174 | | | | 56.54 | |
| Class R-1 | | | 28,556 | | | | 558 | | | | 51.21 | |
| Class R-2 | | | 610,107 | | | | 11,908 | | | | 51.24 | |
| Class R-2E | | | 20,180 | | | | 360 | | | | 56.02 | |
| Class R-3 | | | 843,820 | | | | 15,576 | | | | 54.17 | |
| Class R-4 | | | 879,118 | | | | 15,679 | | | | 56.07 | |
| Class R-5E | | | 16,870 | | | | 298 | | | | 56.53 | |
| Class R-5 | | | 342,339 | | | | 5,895 | | | | 58.08 | |
| Class R-6 | | | 6,280,959 | | | | 109,289 | | | | 57.47 | |
| * | Amount less than one thousand. |
See Notes to Financial Statements
Statement of operations
for the six months ended March 31, 2018 | unaudited
(dollars in thousands) |
| | |
| Investment income: | | | | | | | | |
| Income: | | | | | | | | |
| Dividends (net of non-U.S. taxes of $7,227; also includes $26,838 from affiliates) | | $ | 139,340 | | | | | |
| Interest | | | 20,766 | | | $ | 160,106 | |
| Fees and expenses*: | | | | | | | | |
| Investment advisory services | | | 120,517 | | | | | |
| Distribution services | | | 40,109 | | | | | |
| Transfer agent services | | | 22,535 | | | | | |
| Administrative services | | | 5,295 | | | | | |
| Reports to shareholders | | | 984 | | | | | |
| Registration statement and prospectus | | | 664 | | | | | |
| Directors’ compensation | | | 662 | | | | | |
| Auditing and legal | | | 74 | | | | | |
| Custodian | | | 2,661 | | | | | |
| State and local taxes | | | 1 | | | | | |
| Other | | | 1,040 | | | | | |
| Total fees and expenses before waiver | | | 194,542 | | | | | |
| Less investment advisory services waiver | | | 18 | | | | | |
| Total fees and expenses after waiver | | | | | | | 194,524 | |
| Net investment loss | | | | | | | (34,418 | ) |
| | | | | | | | | |
| Net realized gain and unrealized appreciation: | | | | | | | | |
| Net realized gain (loss) on: | | | | | | | | |
| Investments (net of non-U.S. taxes of $1,670): | | | | | | | | |
| Unaffiliated issuers | | | 1,557,124 | | | | | |
| Affiliated issuers | | | 360,358 | | | | | |
| Forward currency contracts | | | (14,417 | ) | | | | |
| Currency transactions | | | (316 | ) | | | 1,902,749 | |
| Net unrealized appreciation on: | | | | | | | | |
| Investments (net of non-U.S. taxes of $11,743): | | | | | | | | |
| Unaffiliated issuers | | | 226,988 | | | | | |
| Affiliated issuers | | | 216,081 | | | | | |
| Forward currency contracts | | | 3,086 | | | | | |
| Currency translations | | | 46 | | | | 446,201 | |
| Net realized gain and unrealized appreciation | | | | | | | 2,348,950 | |
| Net increase in net assets resulting from operations | | | | | | $ | 2,314,532 | |
| * | Additional information related to class-specific fees and expenses is included in the Notes to Financial Statements. |
See Notes to Financial Statements
| Statements of changes in net assets | |
| | (dollars in thousands) |
| | |
| | | Six months ended | | | Year ended | |
| | | March 31,
2018* | | | September 30,
2017 | |
| Operations: | | | | | | | | |
| Net investment (loss) income | | $ | (34,418 | ) | | $ | 54,980 | |
| Net realized gain | | | 1,902,749 | | | | 1,921,566 | |
| Net unrealized appreciation | | | 446,201 | | | | 3,575,047 | |
| Net increase in net assets resulting from operations | | | 2,314,532 | | | | 5,551,593 | |
| | | | | | | | | |
| Dividends and distributions paid to shareholders: | | | | | | | | |
| Dividends from net investment income | | | — | | | | (113,141 | ) |
| Distributions from net realized gain on investments | | | (1,678,267 | ) | | | — | |
| Total dividends and distributions paid to shareholders | | | (1,678,267 | ) | | | (113,141 | ) |
| | | | | | | | | |
| Net capital share transactions | | | 2,493,321 | | | | 1,584,900 | |
| | | | | | | | | |
| Total increase in net assets | | | 3,129,586 | | | | 7,023,352 | |
| | | | | | | | | |
| Net assets: | | | | | | | | |
| Beginning of period | | | 36,889,192 | | | | 29,865,840 | |
| End of period (including accumulated net investment loss and distributions in excess of net investment income: $(193,751) and $(159,333), respectively) | | $ | 40,018,778 | | | $ | 36,889,192 | |
See Notes to Financial Statements
| Notes to financial statements | unaudited |
1. Organization
SMALLCAP World Fund, Inc. (the “fund”) is registered under the Investment Company Act of 1940 as an open-end, diversified management investment company. The fund seeks to provide long-term growth of capital. Shareholders approved a proposal to reorganize the fund from a Maryland corporation to a Delaware statutory trust. The reorganization may be completed in the next year; however, the fund reserves the right to delay the implementation.
The fund has 19 share classes consisting of six retail share classes (Classes A, C, T, F-1, F-2 and F-3), five 529 college savings plan share classes (Classes 529-A, 529-C, 529-E, 529-T and 529-F-1) and eight retirement plan share classes (Classes R-1, R-2, R-2E, R-3, R-4, R-5E, R-5 and R-6). The 529 college savings plan share classes can be used to save for college education. The retirement plan share classes are generally offered only through eligible employer-sponsored retirement plans. The fund’s share classes are described further in the following table:
| Share class | | Initial sales
charge | | Contingent deferred sales
charge upon redemption | | Conversion feature |
| Classes A and 529-A | | Up to 5.75% | | None (except 1% for certain redemptions within 18 months of purchase without an initial sales charge) | | None |
| Class C | | None | | 1% for redemptions within one year of purchase | | Class C converts to Class F-1 after 10 years |
| Class 529-C | | None | | 1% for redemptions within one year of purchase | | Class 529-C converts to Class 529-A after 10 years* |
| Class 529-E | | None | | None | | None |
| Classes T and 529-T† | | Up to 2.50% | | None | | None |
| Classes F-1, F-2, F-3 and 529-F-1 | | None | | None | | None |
| Classes R-1, R-2, R-2E, R-3, R-4, R-5E, R-5 and R-6 | | None | | None | | None |
| * | Effective December 1, 2017. |
| † | Class T and 529-T shares are not available for purchase. |
Holders of all share classes have equal pro rata rights to the assets, dividends and liquidation proceeds of the fund. Each share class has identical voting rights, except for the exclusive right to vote on matters affecting only its class. Share classes have different fees and expenses (“class-specific fees and expenses”), primarily due to different arrangements for distribution, transfer agent and administrative services. Differences in class-specific fees and expenses will result in differences in net investment income and, therefore, the payment of different per-share dividends by each share class.
2. Significant accounting policies
The fund is an investment company that applies the accounting and reporting guidance issued in Topic 946 by the U.S. Financial Accounting Standards Board. The fund’s financial statements have been prepared to comply with U.S. generally accepted accounting principles (“U.S. GAAP”). These principles require the fund’s investment adviser to make estimates and assumptions that affect reported amounts and disclosures. Actual results could differ from those estimates. Subsequent events, if any, have been evaluated through the date of issuance in the preparation of the financial statements. The fund follows the significant accounting policies described in this section, as well as the valuation policies described in the next section on valuation.
Security transactions and related investment income — Security transactions are recorded by the fund as of the date the trades are executed with brokers. Realized gains and losses from security transactions are determined based on the specific identified cost of the securities. In the event a security is purchased with a delayed payment date, the fund will segregate liquid assets sufficient to meet its payment obligations. Dividend income is recognized on the ex-dividend date and interest income is recognized on an accrual basis. Market discounts, premiums and original issue discounts on fixed-income securities are amortized daily over the expected life of the security.
Class allocations — Income, fees and expenses (other than class-specific fees and expenses) and realized and unrealized gains and losses are allocated daily among the various share classes based on their relative net assets. Class-specific fees and expenses, such as distribution, transfer agent and administrative services, are charged directly to the respective share class.
Dividends and distributions to shareholders — Dividends and distributions to shareholders are recorded on the ex-dividend date.
Currency translation — Assets and liabilities, including investment securities, denominated in currencies other than U.S. dollars are translated into U.S. dollars at the exchange rates supplied by one or more pricing vendors on the valuation date. Purchases and sales of investment securities and income and expenses are translated into U.S. dollars at the exchange rates on the dates of such transactions. The effects of changes in exchange rates on investment securities are included with the net realized gain or loss and net unrealized appreciation or depreciation on investments in the fund’s statement of operations. The realized gain or loss and unrealized appreciation or depreciation resulting from all other transactions denominated in currencies other than U.S. dollars are disclosed separately.
3. Valuation
Capital Research and Management Company (“CRMC”), the fund’s investment adviser, values the fund’s investments at fair value as defined by U.S. GAAP. The net asset value of each share class of the fund is generally determined as of approximately 4:00 p.m. New York time each day the New York Stock Exchange is open.
Methods and inputs — The fund’s investment adviser uses the following methods and inputs to establish the fair value of the fund’s assets and liabilities. Use of particular methods and inputs may vary over time based on availability and relevance as market and economic conditions evolve.
Equity securities are generally valued at the official closing price of, or the last reported sale price on, the exchange or market on which such securities are traded, as of the close of business on the day the securities are being valued or, lacking any sales, at the last available bid price. Prices for each security are taken from the principal exchange or market on which the security trades.
Fixed-income securities, including short-term securities, are generally valued at prices obtained from one or more pricing vendors. Vendors value such securities based on one or more of the inputs described in the following table. The table provides examples of inputs that are commonly relevant for valuing particular classes of fixed-income securities in which the fund is authorized to invest. However, these classifications are not exclusive, and any of the inputs may be used to value any other class of fixed-income security.
| Fixed-income class | | Examples of standard inputs |
| All | | Benchmark yields, transactions, bids, offers, quotations from dealers and trading systems, new issues, spreads and other relationships observed in the markets among comparable securities; and proprietary pricing models such as yield measures calculated using factors such as cash flows, financial or collateral performance and other reference data (collectively referred to as “standard inputs”) |
| Corporate bonds & notes; convertible securities | | Standard inputs and underlying equity of the issuer |
| Bonds & notes of governments & government agencies | | Standard inputs and interest rate volatilities |
When the fund’s investment adviser deems it appropriate to do so (such as when vendor prices are unavailable or deemed to be not representative), fixed-income securities will be valued in good faith at the mean quoted bid and ask prices that are reasonably and timely available (or bid prices, if ask prices are not available) or at prices for securities of comparable maturity, quality and type.
Securities with both fixed-income and equity characteristics, or equity securities traded principally among fixed-income dealers, are generally valued in the manner described for either equity or fixed-income securities, depending on which method is deemed most appropriate by the fund’s investment adviser. Forward currency contracts are valued at the mean of representative quoted bid and ask prices, generally based on prices supplied by one or more pricing vendors.
Securities and other assets for which representative market quotations are not readily available or are considered unreliable by the fund’s investment adviser are fair valued as determined in good faith under fair valuation guidelines adopted by authority of the
fund’s board of directors as further described. The investment adviser follows fair valuation guidelines, consistent with U.S. Securities and Exchange Commission rules and guidance, to consider relevant principles and factors when making fair value determinations. The investment adviser considers relevant indications of value that are reasonably and timely available to it in determining the fair value to be assigned to a particular security, such as the type and cost of the security; contractual or legal restrictions on resale of the security; relevant financial or business developments of the issuer; actively traded similar or related securities; conversion or exchange rights on the security; related corporate actions; significant events occurring after the close of trading in the security; and changes in overall market conditions. In addition, the closing prices of equity securities that trade in markets outside U.S. time zones may be adjusted to reflect significant events that occur after the close of local trading but before the net asset value of each share class of the fund is determined. Fair valuations and valuations of investments that are not actively trading involve judgment and may differ materially from valuations that would have been used had greater market activity occurred.
Processes and structure — The fund’s board of directors has delegated authority to the fund’s investment adviser to make fair value determinations, subject to board oversight. The investment adviser has established a Joint Fair Valuation Committee (the “Fair Valuation Committee”) to administer, implement and oversee the fair valuation process, and to make fair value decisions. The Fair Valuation Committee regularly reviews its own fair value decisions, as well as decisions made under its standing instructions to the investment adviser’s valuation teams. The Fair Valuation Committee reviews changes in fair value measurements from period to period and may, as deemed appropriate, update the fair valuation guidelines to better reflect the results of back testing and address new or evolving issues. The Fair Valuation Committee reports any changes to the fair valuation guidelines to the board of directors with supplemental information to support the changes. The fund’s board and audit committee also regularly review reports that describe fair value determinations and methods.
The fund’s investment adviser has also established a Fixed-Income Pricing Review Group to administer and oversee the fixed-income valuation process, including the use of fixed-income pricing vendors. This group regularly reviews pricing vendor information and market data. Pricing decisions, processes and controls over security valuation are also subject to additional internal reviews, including an annual control self-evaluation program facilitated by the investment adviser’s compliance group.
Classifications — The fund’s investment adviser classifies the fund’s assets and liabilities into three levels based on the inputs used to value the assets or liabilities. Level 1 values are based on quoted prices in active markets for identical securities. Level 2 values are based on significant observable market inputs, such as quoted prices for similar securities and quoted prices in inactive markets. Certain securities trading outside the U.S. may transfer between Level 1 and Level 2 due to valuation adjustments resulting from significant market movements following the close of local trading. Level 3 values are based on significant unobservable inputs that reflect the investment adviser’s determination of assumptions that market participants might reasonably use in valuing
the securities. The valuation levels are not necessarily an indication of the risk or liquidity associated with the underlying investment. For example, U.S. government securities are reflected as Level 2 because the inputs used to determine fair value may not always be quoted prices in an active market. The following tables present the fund’s valuation levels as of March 31, 2018 (dollars in thousands):
| | | Investment securities |
| | | Level 1* | | | Level 2 | | | Level 3 | | | Total | |
| Assets: | | | | | | | | | | | | | | | | |
| Common stocks: | | | | | | | | | | | | | | | | |
| Consumer discretionary | | $ | 4,146,939 | | | $ | 2,909,627 | | | $ | 16,925 | | | $ | 7,073,491 | |
| Health care | | | 4,694,312 | | | | 1,184,265 | | | | 20,709 | | | | 5,899,286 | |
| Information technology | | | 4,347,300 | | | | 1,302,215 | | | | — | | | | 5,649,515 | |
| Industrials | | | 2,903,166 | | | | 2,337,265 | | | | — | | | | 5,240,431 | |
| Financials | | | 3,237,225 | | | | 1,534,826 | | | | — | | | | 4,772,051 | |
| Consumer staples | | | 1,231,287 | | | | 958,802 | | | | — | | | | 2,190,089 | |
| Materials | | | 902,437 | | | | 1,028,656 | | | | — | | | | 1,931,093 | |
| Real estate | | | 346,919 | | | | 222,511 | | | | — | | | | 569,430 | |
| Other | | | 1,073,953 | | | | 691,094 | | | | 27,189 | | | | 1,792,236 | |
| Miscellaneous | | | 1,496,784 | | | | 461,961 | | | | — | | | | 1,958,745 | |
| Preferred securities | | | 150 | | | | — | | | | 42,054 | | | | 42,204 | |
| Rights & warrants | | | 1,091 | | | | 826 | | | | 975 | | | | 2,892 | |
| Convertible stocks | | | — | | | | — | | | | 142,897 | | | | 142,897 | |
| Convertible bonds | | | — | | | | 19,336 | | | | — | | | | 19,336 | |
| Bonds, notes & other debt instruments | | | — | | | | 24,934 | | | | — | | | | 24,934 | |
| Short-term securities | | | — | | | | 2,751,530 | | | | — | | | | 2,751,530 | |
| Total | | $ | 24,381,563 | | | $ | 15,427,848 | | | $ | 250,749 | | | $ | 40,060,160 | |
| | | Other investments† |
| | | Level 1 | | | Level 2 | | | Level 3 | | | Total | |
| Assets: | | | | | | | | | | | | | | | | |
| Unrealized appreciation on open forward currency contracts | | $ | — | | | $ | 1,540 | | | $ | — | | | $ | 1,540 | |
| Liabilities: | | | | | | | | | | | | | | | | |
| Unrealized depreciation on open forward currency contracts | | | — | | | | (725 | ) | | | — | | | | (725 | ) |
| Total | | $ | — | | | $ | 815 | | | $ | — | | | $ | 815 | |
| * | Securities with a value of $3,597,140,000, which represented 8.99% of the net assets of the fund, transferred from Level 2 to Level 1 since the prior fiscal year-end, primarily due to a lack of significant market movements following the close of local trading. |
| † | Forward currency contracts are not included in the investment portfolio. |
4. Risk factors
Investing in the fund may involve certain risks including, but not limited to, those described below.
Market conditions — The prices of, and the income generated by, the securities held by the fund may decline – sometimes rapidly or unpredictably – due to various factors, including events or conditions affecting the general economy or particular industries; overall market changes; local, regional or global political, social or economic instability; governmental or governmental agency responses to economic conditions; and currency exchange rate, interest rate and commodity price fluctuations.
Issuer risks — The prices of, and the income generated by, securities held by the fund may decline in response to various factors directly related to the issuers of such securities, including reduced demand for an issuer’s goods or services, poor management performance and strategic initiatives such as mergers, acquisitions or dispositions and the market response to any such initiatives.
Investing in growth-oriented stocks — Growth-oriented common stocks and other equity-type securities (such as preferred stocks, convertible preferred stocks and convertible bonds) may involve larger price swings and greater potential for loss than other types of investments. These risks may be even greater in the case of smaller capitalization stocks.
Investing in small companies — Investing in smaller companies may pose additional risks. For example, it is often more difficult to value or dispose of small company stocks and more difficult to obtain information about smaller companies than about larger companies. Furthermore, smaller companies often have limited product lines, operating histories, markets and/or financial resources, may be dependent on one or a few key persons for management, and can be more susceptible to losses. Moreover, the prices of their stocks may be more volatile than stocks of larger, more established companies.
Investing outside the U.S. — Securities of issuers domiciled outside the U.S., or with significant operations or revenues outside the U.S., may lose value because of adverse political, social, economic or market developments (including social instability, regional conflicts, terrorism and war) in the countries or regions in which the issuers operate or generate revenue. These securities may also lose value due to changes in foreign currency exchange rates against the U.S. dollar and/or currencies of other countries. Issuers of these securities may be more susceptible to actions of foreign governments, such as the imposition of price controls or punitive taxes, that could adversely impact the value of these securities. Securities markets in certain countries may be more volatile and/or less liquid than those in the U.S. Investments outside the U.S. may also be subject to different accounting practices and different regulatory, legal and reporting standards and practices, and may be more difficult to value, than those in the U.S. In addition, the value of investments outside the U.S. may be reduced by foreign taxes, including foreign withholding taxes on interest and dividends. Further, there may be increased risks of delayed settlement of securities purchased or sold by the fund. The risks of investing outside the U.S. may be heightened in connection with investments in emerging markets.
Investing in emerging markets — Investing in emerging markets may involve risks in addition to and greater than those generally associated with investing in the securities markets of developed countries. For instance, developing countries may have less developed legal and accounting systems than those in developed countries. The governments of these countries may be less stable and more likely to impose capital controls, nationalize a company or industry, place restrictions on foreign ownership and on withdrawing sale proceeds of securities from the country, and/or impose punitive taxes that could adversely affect the prices of securities. In addition, the economies of these countries may be dependent on relatively few industries that are more susceptible to local and global changes. Securities markets in these countries can also be relatively small and have substantially lower trading volumes. As a result, securities issued in these countries may be more volatile and less liquid, and may be more difficult to value, than securities issued in countries with more developed economies and/or markets. Less certainty with respect to security valuations may lead to additional challenges and risks in calculating the fund’s net asset value. Additionally, there may be increased settlement risks for transactions in local securities.
Management — The investment adviser to the fund actively manages the fund’s investments. Consequently, the fund is subject to the risk that the methods and analyses employed by the investment adviser in this process may not produce the desired results. This could cause the fund to lose value or its investment results to lag relevant benchmarks or other funds with similar objectives.
5. Certain investment techniques
Forward currency contracts — The fund has entered into forward currency contracts, which represent agreements to exchange currencies on specific future dates at predetermined rates. The fund’s investment adviser uses forward currency contracts to manage the fund’s exposure to changes in exchange rates. Upon entering into these contracts, risks may arise from the potential inability of counterparties to meet the terms of their contracts and from possible movements in exchange rates.
On a daily basis, the fund’s investment adviser values forward currency contracts and records unrealized appreciation or depreciation for open forward currency contracts in the fund’s statement of assets and liabilities. Realized gains or losses are recorded at the time the forward currency contract is closed or offset by another contract with the same broker for the same settlement date and currency.
Closed forward currency contracts that have not reached their settlement date are included in the respective receivables or payables for closed forward currency contracts in the fund’s statement of assets and liabilities. Net realized gains or losses from closed forward currency contracts and net unrealized appreciation or depreciation from open forward currency contracts are recorded in the fund’s statement of operations. The average month-end notional amount of open forward currency contracts while held was $370,679,000.
The following tables present the financial statement impacts resulting from the fund’s use of forward currency contracts as of, or for the six months ended, March 31, 2018 (dollars in thousands):
| | | | | Assets | | | Liabilities | |
| Contracts | | Risk type | | Location on statement of
assets and liabilities | | Value | | | Location on statement of
assets and liabilities | | Value | |
| Forward currency | | Currency | | Unrealized appreciation on open forward currency contracts | | $ | 1,540 | | | Unrealized depreciation on open forward currency contracts | | $ | 725 | |
| | | | | | | | | | | | | | | |
| | | | | Net realized loss | | | Net unrealized appreciation | |
| Contracts | | Risk type | | Location on statement of
operations | | Value | | | Location on statement of
operations | | Value | |
| Forward currency | | Currency | | Net realized loss on forward currency contracts | | $ | (14,417 | ) | | Net unrealized appreciation on forward currency contracts | | $ | 3,086 | |
Collateral — The fund participates in a collateral program due to its use of forward currency contracts that calls for the fund to either receive or pledge highly liquid assets, such as cash or U.S. government securities, as collateral based on the net gain or loss on unsettled forward currency contracts by counterparty. The purpose of the collateral is to cover potential losses that could occur in the event that either party cannot meet its contractual obligation. Non-cash collateral pledged by the fund, if any, is disclosed in the fund’s investment portfolio, and cash collateral pledged by the fund, if any, is held in a segregated account with the fund’s custodian, which is reflected as restricted cash in the fund’s statement of assets and liabilities.
Rights of offset — The fund has entered into enforceable master netting agreements with certain counterparties for forward currency contracts, where on any date amounts payable by each party to the other (in the same currency with respect to the same transaction) may be closed or offset by each party’s payment obligation. If an early termination date occurs under these agreements following an event of default or termination event, all obligations of each party to its counterparty are settled net through a single payment in a single currency (“close-out netting”). For financial reporting purposes, the fund does not offset financial assets and financial liabilities that are subject to these master netting arrangements in the statement of assets and liabilities.
The following table presents the fund’s forward currency contracts by counterparty that are subject to master netting agreements but that are not offset in the fund’s statement of assets and liabilities. The net amount column shows the impact of offsetting on the fund’s statement of assets and liabilities as of March 31, 2018, if close-out netting was exercised (dollars in thousands):
| | | | | | Gross amounts not offset in the | | | | |
| | | Gross amounts | | | statement of assets and liabilities and | | | | |
| | | recognized in the | | | subject to a master netting agreement | | | | |
| Counterparty | | statement of assets
and liabilities | | | Available
to offset | | | Non-cash
collateral* | | | Cash
collateral | | | Net
amount | |
| Assets: | | | | | | | | | | | | | | | | | | | | |
| Citibank | | $ | 92 | | | $ | (92 | ) | | $ | — | | | $ | — | | | $ | — | |
| JPMorgan Chase | | | 638 | | | | — | | | | (638 | ) | | | — | | | | — | |
| UBS AG | | | 810 | | | | — | | | | (810 | ) | | | — | | | | — | |
| Total | | $ | 1,540 | | | $ | (92 | ) | | $ | (1,448 | ) | | $ | — | | | $ | — | |
| Liabilities: | | | | | | | | | | | | | | | | | | | | |
| Bank of America, N.A. | | $ | 450 | | | $ | — | | | $ | (450 | ) | | $ | — | | | $ | — | |
| Barclays Bank PLC | | | 1 | | | | — | | | | — | | | | — | | | | 1 | |
| Citibank | | | 271 | | | | (92 | ) | | | (179 | ) | | | — | | | | — | |
| Goldman Sachs | | | 3 | | | | — | | | | (3 | ) | | | — | | | | — | |
| Total | | $ | 725 | | | $ | (92 | ) | | $ | (632 | ) | | $ | — | | | $ | 1 | |
| * | Non-cash collateral is shown on a settlement basis. |
6. Taxation and distributions
Federal income taxation — The fund complies with the requirements under Subchapter M of the Internal Revenue Code applicable to mutual funds and intends to distribute substantially all of its net taxable income and net capital gains each year. The fund is not subject to income taxes to the extent such distributions are made. Therefore, no federal income tax provision is required.
As of and during the period ended March 31, 2018, the fund did not have a liability for any unrecognized tax benefits. The fund recognizes interest and penalties, if any, related to unrecognized tax benefits as income tax expense in the statement of operations. During the period, the fund did not incur any significant interest or penalties.
The fund’s tax returns are not subject to examination by federal, state and, if applicable, non-U.S. tax authorities after the expiration of each jurisdiction’s statute of limitations, which is generally three years after the date of filing but can be extended in certain jurisdictions.
Non-U.S. taxation — Dividend and interest income are recorded net of non-U.S. taxes paid. The fund may file withholding tax reclaims in certain jurisdictions to recover a portion of amounts previously withheld. As a result of rulings from European courts, the fund filed for additional reclaims related to prior years. These reclaims are recorded when the amount is known and there are no significant uncertainties on collectability. Gains realized by the fund on the sale of securities in certain countries, if any, may be subject to non-U.S. taxes. If applicable, the fund records an estimated deferred tax liability based on unrealized gains to provide for potential non-U.S. taxes payable upon the sale of these securities.
Distributions — Distributions paid to shareholders are based on net investment income and net realized gains determined on a tax basis, which may differ from net investment income and net realized gains for financial reporting purposes. These differences are due primarily to different treatment for items such as currency gains and losses; short-term capital gains and losses; unrealized appreciation of certain investments in securities outside the U.S.; cost of investments sold; non-U.S. taxes on capital gains and income on certain investments. The fiscal year in which amounts are distributed may differ from the year in which the net investment income and net realized gains are recorded by the fund for financial reporting purposes.
The components of distributable earnings on a tax basis are reported as of the fund’s most recent year-end. As of September 30, 2017, the components of distributable earnings on a tax basis were as follows (dollars in thousands):
| Undistributed long-term capital gains | | | $1,524,576 | |
As of March 31, 2018, the tax basis unrealized appreciation (depreciation) and cost of investments were as follows (dollars in thousands):
| Gross unrealized appreciation on investments | | | $13,230,459 | |
| Gross unrealized depreciation on investments | | | (1,548,531 | ) |
| Net unrealized appreciation on investments | | | 11,681,928 | |
| Cost of investments | | | 28,379,047 | |
Distributions paid were characterized for tax purposes as follows (dollars in thousands):
| | | Six months ended March 31, 2018 | | | Year ended September 30, 2017 |
| Share class | | Ordinary
income | | | Long-term
capital gains | | | Total
distributions
paid | | | Ordinary
income | | | Long-term
capital gains | | | Total
dividends
paid | |
| Class A | | $ | — | | | $ | 958,171 | | | $ | 958,171 | | | $ | 62,231 | | | $ | — | | | $ | 62,231 | |
| Class B1 | | | | | | | | | | | | | | | — | | | | — | | | | — | |
| Class C | | | — | | | | 39,880 | | | | 39,880 | | | | — | | | | — | | | | — | |
| Class T2 | | | — | | | | 1 | | | | 1 | | | | — | | | | — | | | | — | |
| Class F-1 | | | — | | | | 34,715 | | | | 34,715 | | | | 2,327 | | | | — | | | | 2,327 | |
| Class F-2 | | | — | | | | 135,935 | | | | 135,935 | | | | 14,539 | | | | — | | | | 14,539 | |
| Class F-33 | | | — | | | | 59,644 | | | | 59,644 | | | | — | | | | — | | | | — | |
| Class 529-A | | | — | | | | 57,868 | | | | 57,868 | | | | 2,838 | | | | — | | | | 2,838 | |
| Class 529-B1 | | | | | | | | | | | | | | | — | | | | — | | | | — | |
| Class 529-C | | | — | | | | 11,428 | | | | 11,428 | | | | — | | | | — | | | | — | |
| Class 529-E | | | — | | | | 2,707 | | | | 2,707 | | | | 47 | | | | — | | | | 47 | |
| Class 529-T2 | | | — | | | | 1 | | | | 1 | | | | — | | | | — | | | | — | |
| Class 529-F-1 | | | — | | | | 5,141 | | | | 5,141 | | | | 445 | | | | — | | | | 445 | |
| Class R-1 | | | — | | | | 1,387 | | | | 1,387 | | | | — | | | | — | | | | — | |
| Class R-2 | | | — | | | | 29,788 | | | | 29,788 | | | | — | 4 | | | — | | | | — | 4 |
| Class R-2E | | | — | | | | 810 | | | | 810 | | | | 10 | | | | — | | | | 10 | |
| Class R-3 | | | — | | | | 38,410 | | | | 38,410 | | | | 614 | | | | — | | | | 614 | |
| Class R-4 | | | — | | | | 38,552 | | | | 38,552 | | | | 2,659 | | | | — | | | | 2,659 | |
| Class R-5E | | | — | | | | 546 | | | | 546 | | | | 61 | | | | — | | | | 61 | |
| Class R-5 | | | — | | | | 14,962 | | | | 14,962 | | | | 2,157 | | | | — | | | | 2,157 | |
| Class R-6 | | | — | | | | 248,321 | | | | 248,321 | | | | 25,213 | | | | — | | | | 25,213 | |
| Total | | $ | — | | | $ | 1,678,267 | | �� | $ | 1,678,267 | | | $ | 113,141 | | | $ | — | | | $ | 113,141 | |
| 1 | Class B and 529-B shares were fully liquidated on May 5, 2017. |
| 2 | Class T and 529-T shares began investment operations on April 7, 2017. |
| 3 | Class F-3 shares began investment operations on January 27, 2017. |
| 4 | Amount less than one thousand. |
7. Fees and transactions with related parties
CRMC, the fund’s investment adviser, is the parent company of American Funds Distributors,® Inc. (“AFD”), the principal underwriter of the fund’s shares, and American Funds Service Company® (“AFS”), the fund’s transfer agent. CRMC, AFD and AFS are considered related parties to the fund.
Investment advisory services — The fund has an investment advisory and service agreement with CRMC that provides for monthly fees accrued daily. At the beginning of the year, these fees were based on a series of decreasing annual rates beginning with 0.800% on the first $1 billion of daily net assets and decreasing to 0.595% on such assets in excess of $27 billion. On September 14, 2017, the fund’s board of directors approved an amended investment advisory and service agreement effective December 1, 2017, decreasing the annual rate to 0.592% on daily net assets in excess of $34 billion. CRMC
voluntarily reduced investment advisory services fees to the approved rate in advance of the effective date. For the six months ended March 31, 2018, total investment advisory services fees waived by CRMC were $18,000. As a result, the fee of $120,517,000 shown on the statement of operations was reduced to $120,499,000, both of which were equivalent to an annualized rate of 0.618% of average daily net assets.
Class-specific fees and expenses — Expenses that are specific to individual share classes are accrued directly to the respective share class. The principal class-specific fees and expenses are further described below:
Distribution services — The fund has plans of distribution for all share classes, except Class F-2, F-3, R-5E, R-5 and R-6 shares. Under the plans, the board of directors approves certain categories of expenses that are used to finance activities primarily intended to sell fund shares and service existing accounts. The plans provide for payments, based on an annualized percentage of average daily net assets, ranging from 0.30% to 1.00% as noted in this section. In some cases, the board of directors has limited the amounts that may be paid to less than the maximum allowed by the plans. All share classes with a plan may use up to 0.25% of average daily net assets to pay service fees, or to compensate AFD for paying service fees, to firms that have entered into agreements with AFD to provide certain shareholder services. The remaining amounts available to be paid under each plan are paid to dealers to compensate them for their sales activities.
| Share class | | Currently approved limits | | Plan limits |
| Class A | | | 0.30 | % | | | 0.30 | % |
| Class 529-A | | | 0.30 | | | | 0.50 | |
| Classes C, 529-C and R-1 | | | 1.00 | | | | 1.00 | |
| Class R-2 | | | 0.75 | | | | 1.00 | |
| Class R-2E | | | 0.60 | | | | 0.85 | |
| Classes 529-E and R-3 | | | 0.50 | | | | 0.75 | |
| Classes T, F-1, 529-T, 529-F-1 and R-4 | | | 0.25 | | | | 0.50 | |
For Class A and 529-A shares, distribution-related expenses include the reimbursement of dealer and wholesaler commissions paid by AFD for certain shares sold without a sales charge. These share classes reimburse AFD for amounts billed within the prior 15 months but only to the extent that the overall annual expense limits are not exceeded. As of March 31, 2018, there were no unreimbursed expenses subject to reimbursement for Class A or 529-A shares.
Transfer agent services — The fund has a shareholder services agreement with AFS under which the fund compensates AFS for providing transfer agent services to each of the fund’s share classes. These services include recordkeeping, shareholder communications and transaction processing. In addition, the fund reimburses AFS for amounts paid to third parties for performing transfer agent services on behalf of fund shareholders.
Administrative services — The fund has an administrative services agreement with CRMC under which the fund compensates CRMC for providing administrative services to Class A, C, T, F, 529 and R shares. These services include, but are not limited to, coordinating, monitoring, assisting and overseeing third parties that provide services to fund shareholders. Under the agreement, Class A shares pay an annual fee of 0.01% and Class C, T, F, 529 and R shares pay an annual fee of 0.05% of their respective average daily net assets.
529 plan services — Each 529 share class is subject to service fees to compensate the Virginia College Savings Plan (“Virginia529”) for its oversight and administration of the 529 college savings plan. The quarterly fee is based on a series of decreasing annual rates beginning with 0.10% on the first $20 billion of the net assets invested in the Class 529 shares of the American Funds and decreasing to 0.03% on such assets in excess of $100 billion. The fee for any given calendar quarter is accrued and calculated on the basis of the average net assets of Class 529 shares of the American Funds for the last month of the prior calendar quarter. The fee is included in other expenses in the fund’s statement of operations. Virginia529 is not considered a related party to the fund.
For the six months ended March 31, 2018, class-specific expenses under the agreements were as follows (dollars in thousands):
| | | Distribution | | Transfer agent | | Administrative | | 529 plan | |
| Share class | | services | | services | | services | | services | |
| Class A | | $26,378 | | $16,113 | | $1,113 | | Not applicable | |
| Class C | | 4,083 | | 608 | | 204 | | Not applicable | |
| Class T | | — | | — | * | — | * | Not applicable | |
| Class F-1 | | 999 | | 595 | | 200 | | Not applicable | |
| Class F-2 | | Not applicable | | 1,502 | | 809 | | Not applicable | |
| Class F-3 | | Not applicable | | 103 | | 353 | | Not applicable | |
| Class 529-A | | 1,412 | | 853 | | 325 | | $433 | |
| Class 529-C | | 1,335 | | 195 | | 68 | | 90 | |
| Class 529-E | | 152 | | 20 | | 15 | | 20 | |
| Class 529-T | | — | | — | * | — | * | — | * |
| Class 529-F-1 | | — | | 79 | | 30 | | 40 | |
| Class R-1 | | 147 | | 18 | | 7 | | Not applicable | |
| Class R-2 | | 2,311 | | 1,137 | | 156 | | Not applicable | |
| Class R-2E | | 55 | | 20 | | 5 | | Not applicable | |
| Class R-3 | | 2,133 | | 693 | | 214 | | Not applicable | |
| Class R-4 | | 1,104 | | 470 | | 221 | | Not applicable | |
| Class R-5E | | Not applicable | | 11 | | 4 | | Not applicable | |
| Class R-5 | | Not applicable | | 104 | | 92 | | Not applicable | |
| Class R-6 | | Not applicable | | 14 | | 1,479 | | Not applicable | |
| Total class-specific expenses | | $40,109 | | $22,535 | | $5,295 | | $583 | |
| * | Amount less than one thousand. |
Directors’ deferred compensation — Directors who are unaffiliated with CRMC may elect to defer the cash payment of part or all of their compensation. These deferred amounts, which remain as liabilities of the fund, are treated as if invested in shares of the fund or other American Funds. These amounts represent general, unsecured liabilities of the fund and vary according to the total returns of the selected funds. Directors’ compensation of $662,000 in the fund’s statement of operations reflects $274,000 in current fees (either paid in cash or deferred) and a net increase of $388,000 in the value of the deferred amounts.
Affiliated officers and directors — Officers and certain directors of the fund are or may be considered to be affiliated with CRMC, AFD and AFS. No affiliated officers or directors received any compensation directly from the fund.
Security transactions with related funds — The fund may purchase from, or sell securities to, other funds managed by CRMC (or funds managed by certain affiliates of CRMC) under procedures adopted by the fund’s board of directors. The funds involved in such transactions are considered related by virtue of having a common investment adviser (or affiliated investment advisers), common directors and/or common officers. When such transactions occur, each transaction is executed at the current market price of the security and no brokerage commissions or fees are paid in accordance with Rule 17a-7 of the 1940 Act.
Interfund lending — Pursuant to an exemptive order issued by the SEC, the fund, along with other CRMC-managed funds (or funds managed by certain affiliates of CRMC), may participate in an interfund lending program. The program provides an alternate credit facility that permits the funds to lend or borrow cash for temporary purposes directly to or from one another, subject to the conditions of the exemptive order. The fund did not lend or borrow cash through the interfund lending program at any time during the six months ended March 31, 2018.
8. Committed line of credit
The fund participates with other funds managed by CRMC (or funds managed by certain affiliates of CRMC) in a $1.5 billion credit facility (the “line of credit”) to be utilized for temporary purposes to support shareholder redemptions. The fund has agreed to pay commitment fees on its pro-rata portion of the line of credit, which are reflected in other expenses in the fund’s statement of operations. The fund did not borrow on this line of credit at any time during the six months ended March 31, 2018.
9. Capital share transactions
Capital share transactions in the fund were as follows (dollars and shares in thousands):
| | | | | | | | | Reinvestments of | | | | | | | | | Net increase | |
| | | Sales1 | | | distributions | | | Repurchases1 | | | (decrease) | |
| Share class | | Amount | | | Shares | | | Amount | | | Shares | | | Amount | | | Shares | | | Amount | | | Shares | |
| | | | | | | | | | | | | | | | | | | | | | | | | |
| Six months ended March 31, 2018 | | | | | | | | | | | | | | | | | | | | | |
| | | | | | | | | | | | | | | | | | | | | | | | | | | | | | | | | |
| Class A | | $ | 1,319,271 | | | | 23,181 | | | $ | 943,780 | | | | 17,036 | | | $ | (1,470,456 | ) | | | (25,865 | ) | | $ | 792,595 | | | | 14,352 | |
| Class C | | | 64,534 | | | | 1,286 | | | | 39,653 | | | | 813 | | | | (121,571 | ) | | | (2,426 | ) | | | (17,384 | ) | | | (327 | ) |
| Class T | | | — | | | | — | | | | — | | | | — | | | | — | | | | — | | | | — | | | | — | |
| Class F-1 | | | 88,161 | | | | 1,569 | | | | 34,362 | | | | 627 | | | | (131,150 | ) | | | (2,333 | ) | | | (8,627 | ) | | | (137 | ) |
| Class F-2 | | | 764,477 | | | | 13,257 | | | | 131,831 | | | | 2,350 | | | | (325,511 | ) | | | (5,655 | ) | | | 570,797 | | | | 9,952 | |
| Class F-3 | | | 403,406 | | | | 7,061 | | | | 58,070 | | | | 1,045 | | | | (143,043 | ) | | | (2,506 | ) | | | 318,433 | | | | 5,600 | |
| Class 529-A | | | 166,606 | | | | 2,952 | | | | 57,828 | | | | 1,056 | | | | (83,852 | ) | | | (1,490 | ) | | | 140,582 | | | | 2,518 | |
| Class 529-C | | | 14,989 | | | | 293 | | | | 11,425 | | | | 230 | | | | (109,317 | ) | | | (2,124 | ) | | | (82,903 | ) | | | (1,601 | ) |
| Class 529-E | | | 3,757 | | | | 69 | | | | 2,705 | | | | 51 | | | | (4,711 | ) | | | (86 | ) | | | 1,751 | | | | 34 | |
| Class 529-T | | | — | | | | — | | | | 1 | | | | — | 2 | | | — | | | | — | | | | 1 | | | | — | 2 |
| Class 529-F-1 | | | 15,109 | | | | 265 | | | | 5,128 | | | | 93 | | | | (11,872 | ) | | | (209 | ) | | | 8,365 | | | | 149 | |
| Class R-1 | | | 2,624 | | | | 51 | | | | 1,387 | | | | 28 | | | | (5,736 | ) | | | (111 | ) | | | (1,725 | ) | | | (32 | ) |
| Class R-2 | | | 68,894 | | | | 1,327 | | | | 29,747 | | | | 591 | | | | (122,210 | ) | | | (2,363 | ) | | | (23,569 | ) | | | (445 | ) |
| Class R-2E | | | 6,392 | | | | 113 | | | | 810 | | | | 15 | | | | (2,938 | ) | | | (52 | ) | | | 4,264 | | | | 76 | |
| Class R-3 | | | 96,067 | | | | 1,763 | | | | 38,386 | | | | 722 | | | | (146,471 | ) | | | (2,686 | ) | | | (12,018 | ) | | | (201 | ) |
| Class R-4 | | | 92,906 | | | | 1,648 | | | | 38,492 | | | | 700 | | | | (132,382 | ) | | | (2,353 | ) | | | (984 | ) | | | (5 | ) |
| Class R-5E | | | 5,323 | | | | 93 | | | | 545 | | | | 10 | | | | (867 | ) | | | (15 | ) | | | 5,001 | | | | 88 | |
| Class R-5 | | | 34,969 | | | | 602 | | | | 14,957 | | | | 263 | | | | (140,741 | ) | | | (2,419 | ) | | | (90,815 | ) | | | (1,554 | ) |
| Class R-6 | | | 792,604 | | | | 13,739 | | | | 248,310 | | | | 4,411 | | | | (151,357 | ) | | | (2,633 | ) | | | 889,557 | | | | 15,517 | |
| Total net increase (decrease) | | $ | 3,940,089 | | | | 69,269 | | | $ | 1,657,417 | | | | 30,041 | | | $ | (3,104,185 | ) | | | (55,326 | ) | | $ | 2,493,321 | | | | 43,984 | |
| | | | | | | | | Reinvestments of | | | | | | | | | Net (decrease) | |
| | | Sales1 | | | dividends | | | Repurchases1 | | | increase | |
| Share class | | Amount | | | Shares | | | Amount | | | Shares | | | Amount | | | Shares | | | Amount | | | Shares | |
| | | | | | | | | | | | | | | | | | | | | | |
| Year ended September 30, 2017 | | | | | | | | | | | | | | | | | | | | | | |
| | | | | | | | | | | | | | | | | | | | | | | | | | | | | | | | | |
| Class A | | $ | 2,513,462 | | | | 50,620 | | | $ | 61,097 | | | | 1,328 | | | $ | (3,188,353 | ) | | | (64,488 | ) | | $ | (613,794 | ) | | | (12,540 | ) |
| Class B3 | | | 216 | | | | 5 | | | | — | | | | — | | | | (23,207 | ) | | | (538 | ) | | | (22,991 | ) | | | (533 | ) |
| Class C | | | 114,381 | | | | 2,593 | | | | — | 2 | | | — | 2 | | | (253,475 | ) | | | (5,734 | ) | | | (139,094 | ) | | | (3,141 | ) |
| Class T4 | | | 10 | | | | — | 2 | | | — | | | | — | | | | — | | | | — | | | | 10 | | | | — | 2 |
| Class F-1 | | | 188,437 | | | | 3,823 | | | | 2,293 | | | | 50 | | | | (240,308 | ) | | | (4,843 | ) | | | (49,578 | ) | | | (970 | ) |
| Class F-2 | | | 1,779,366 | | | | 35,601 | | | | 13,853 | | | | 298 | | | | (1,456,396 | ) | | | (28,741 | ) | | | 336,823 | | | | 7,158 | |
| Class F-35 | | | 1,204,003 | | | | 23,424 | | | | — | | | | — | | | | (80,405 | ) | | | (1,517 | ) | | | 1,123,598 | | | | 21,907 | |
| Class 529-A | | | 121,526 | | | | 2,480 | | | | 2,833 | | | | 62 | | | | (134,607 | ) | | | (2,725 | ) | | | (10,248 | ) | | | (183 | ) |
| Class 529-B3 | | | 14 | | | | — | 2 | | | — | | | | — | | | | (3,850 | ) | | | (89 | ) | | | (3,836 | ) | | | (89 | ) |
| Class 529-C | | | 27,904 | | | | 620 | | | | — | 2 | | | — | 2 | | | (47,078 | ) | | | (1,044 | ) | | | (19,174 | ) | | | (424 | ) |
| Class 529-E | | | 5,095 | | | | 107 | | | | 47 | | | | 1 | | | | (7,988 | ) | | | (167 | ) | | | (2,846 | ) | | | (59 | ) |
| Class 529-T4 | | | 10 | | | | — | 2 | | | — | | | | — | | | | — | | | | — | | | | 10 | | | | — | 2 |
| Class 529-F-1 | | | 21,407 | | | | 433 | | | | 448 | | | | 10 | | | | (16,254 | ) | | | (328 | ) | | | 5,601 | | | | 115 | |
| Class R-1 | | | 4,831 | | | | 106 | | | | — | | | | — | | | | (12,251 | ) | | | (269 | ) | | | (7,420 | ) | | | (163 | ) |
| Class R-2 | | | 123,788 | | | | 2,717 | | | | — | 2 | | | — | 2 | | | (208,118 | ) | | | (4,583 | ) | | | (84,330 | ) | | | (1,866 | ) |
| Class R-2E | | | 10,052 | | | | 203 | | | | 9 | | | | — | 2 | | | (2,311 | ) | | | (47 | ) | | | 7,750 | | | | 156 | |
| Class R-3 | | | 181,821 | | | | 3,806 | | | | 613 | | | | 14 | | | | (251,813 | ) | | | (5,278 | ) | | | (69,379 | ) | | | (1,458 | ) |
| Class R-4 | | | 187,569 | | | | 3,794 | | | | 2,658 | | | | 58 | | | | (219,379 | ) | | | (4,458 | ) | | | (29,152 | ) | | | (606 | ) |
| Class R-5E | | | 10,471 | | | | 222 | | | | 61 | | | | 2 | | | | (720 | ) | | | (14 | ) | | | 9,812 | | | | 210 | |
| Class R-5 | | | 85,715 | | | | 1,684 | | | | 2,156 | | | | 46 | | | | (85,858 | ) | | | (1,693 | ) | | | 2,013 | | | | 37 | |
| Class R-6 | | | 1,563,452 | | | | 30,707 | | | | 25,212 | | | | 542 | | | | (437,539 | ) | | | (8,482 | ) | | | 1,151,125 | | | | 22,767 | |
| Total net increase (decrease) | | $ | 8,143,530 | | | | 162,945 | | | $ | 111,280 | | | | 2,411 | | | $ | (6,669,910 | ) | | | (135,038 | ) | | $ | 1,584,900 | | | | 30,318 | |
| 1 | Includes exchanges between share classes of the fund. |
| 2 | Amount less than one thousand. |
| 3 | Class B and 529-B shares were fully liquidated on May 5, 2017. |
| 4 | Class T and 529-T shares began investment operations on April 7, 2017. |
| 5 | Class F-3 shares began investment operations on January 27, 2017. |
10. Investment transactions
The fund made purchases and sales of investment securities, excluding short-term securities and U.S. government obligations, if any, of $7,178,221,000 and $5,986,996,000, respectively, during the six months ended March 31, 2018.
Financial highlights
| | | | | | Income (loss) from investment operations1 | |
| Period ended | | Net asset
value,
beginning
of period | | | Net
investment
(loss)
income | | | Net gains
(losses) on
securities (both
realized and
unrealized) | | | Total from
investment
operations | |
| Class A: | | | | | | | | | | | | | | | | |
| 3/31/20184,5 | | $ | 55.60 | | | $ | (.06 | ) | | $ | 3.48 | | | $ | 3.42 | |
| 9/30/2017 | | | 47.24 | | | | .07 | | | | 8.45 | | | | 8.52 | |
| 9/30/2016 | | | 45.04 | | | | .04 | | | | 4.99 | | | | 5.03 | |
| 9/30/2015 | | | 48.66 | | | | .04 | | | | 1.09 | | | | 1.13 | |
| 9/30/2014 | | | 48.91 | | | | .01 | | | | 2.17 | | | | 2.18 | |
| 9/30/2013 | | | 39.27 | | | | .06 | | | | 10.12 | | | | 10.18 | |
| Class C: | | | | | | | | | | | | | | | | |
| 3/31/20184,5 | | | 49.30 | | | | (.26 | ) | | | 3.08 | | | | 2.82 | |
| 9/30/2017 | | | 42.08 | | | | (.29 | ) | | | 7.51 | | | | 7.22 | |
| 9/30/2016 | | | 40.73 | | | | (.29 | ) | | | 4.47 | | | | 4.18 | |
| 9/30/2015 | | | 44.77 | | | | (.32 | ) | | | 1.03 | | | | .71 | |
| 9/30/2014 | | | 45.54 | | | | (.36 | ) | | | 2.02 | | | | 1.66 | |
| 9/30/2013 | | | 36.60 | | | | (.26 | ) | | | 9.45 | | | | 9.19 | |
| Class T: | | | | | | | | | | | | | | | | |
| 3/31/20184,5 | | | 55.64 | | | | (.01 | ) | | | 3.48 | | | | 3.47 | |
| 9/30/20174,10 | | | 49.61 | | | | .13 | | | | 5.90 | | | | 6.03 | |
| Class F-1: | | | | | | | | | | | | | | | | |
| 3/31/20184,5 | | | 55.00 | | | | (.08 | ) | | | 3.44 | | | | 3.36 | |
| 9/30/2017 | | | 46.74 | | | | .05 | | | | 8.36 | | | | 8.41 | |
| 9/30/2016 | | | 44.60 | | | | .03 | | | | 4.94 | | | | 4.97 | |
| 9/30/2015 | | | 48.23 | | | | .04 | | | | 1.08 | | | | 1.12 | |
| 9/30/2014 | | | 48.51 | | | | — | | | | 2.15 | | | | 2.15 | |
| 9/30/2013 | | | 38.94 | | | | .09 | | | | 10.03 | | | | 10.12 | |
| Class F-2: | | | | | | | | | | | | | | | | |
| 3/31/20184,5 | | | 56.24 | | | | .01 | | | | 3.52 | | | | 3.53 | |
| 9/30/2017 | | | 47.80 | | | | .19 | | | | 8.54 | | | | 8.73 | |
| 9/30/2016 | | | 45.42 | | | | .16 | | | | 5.05 | | | | 5.21 | |
| 9/30/2015 | | | 48.92 | | | | .17 | | | | 1.08 | | | | 1.25 | |
| 9/30/2014 | | | 49.03 | | | | .15 | | | | 2.17 | | | | 2.32 | |
| 9/30/2013 | | | 39.38 | | | | .21 | | | | 10.12 | | | | 10.33 | |
| Class F-3: | | | | | | | | | | | | | | | | |
| 3/31/20184,5 | | | 55.74 | | | | .03 | | | | 3.49 | | | | 3.52 | |
| 9/30/20174,11 | | | 47.93 | | | | .25 | | | | 7.56 | | | | 7.81 | |
| Dividends and distributions | | | | | | | | | | | | Ratio of | | | Ratio of | | | | |
Dividends
(from net
investment
income) | | | Distributions
(from capital
gains) | | | Total
dividends
and
distributions | | | Net asset
value, end
of period | | | Total return2,3 | | | Net assets,
end of
period
(in
millions) | | | expenses to
average net
assets before
reimburse-
ments | | | expenses to
average net
assets after
reimburse-
ments3 | | | Ratio of net
(loss) income
to average
net assets3 | |
| | | | | | | | | | | | | | | | | | | | | | | | | | | | | | | | | | | |
| $ | — | | | $ | (2.50 | ) | | $ | (2.50 | ) | | $ | 56.52 | | | | 6.28 | %6 | | $ | 22,548 | | | | 1.04 | %7 | | | 1.04 | %7 | | | (.22 | )%7 |
| | (.16 | ) | | | — | | | | (.16 | ) | | | 55.60 | | | | 18.11 | | | | 21,383 | | | | 1.07 | | | | 1.07 | | | | .14 | |
| | — | | | | (2.83 | ) | | | (2.83 | ) | | | 47.24 | | | | 11.72 | | | | 18,762 | | | | 1.10 | | | | 1.10 | | | | .08 | |
| | — | | | | (4.75 | ) | | | (4.75 | ) | | | 45.04 | | | | 2.25 | | | | 16,882 | | | | 1.07 | | | | 1.07 | | | | .08 | |
| | — | | | | (2.43 | ) | | | (2.43 | ) | | | 48.66 | | | | 4.43 | | | | 16,857 | | | | 1.07 | | | | 1.07 | | | | .02 | |
| | (.54 | ) | | | — | | | | (.54 | ) | | | 48.91 | | | | 26.29 | | | | 16,454 | | | | 1.13 | | | | 1.13 | | | | .15 | |
| | | | | | | | | | | | | | | | | | | | | | | | | | | | | | | | | | | |
| | — | | | | (2.50 | ) | | | (2.50 | ) | | | 49.62 | | | | 5.85 | 6 | | | 799 | | | | 1.84 | 7 | | | 1.84 | 7 | | | (1.03 | )7 |
| | — | | | | — | | | | — | | | | 49.30 | | | | 17.16 | | | | 810 | | | | 1.87 | | | | 1.87 | | | | (.66 | ) |
| | — | | | | (2.83 | ) | | | (2.83 | ) | | | 42.08 | | | | 10.82 | | | | 824 | | | | 1.90 | | | | 1.90 | | | | (.73 | ) |
| | — | | | | (4.75 | ) | | | (4.75 | ) | | | 40.73 | | | | 1.45 | | | | 847 | | | | 1.87 | | | | 1.87 | | | | (.73 | ) |
| | — | | | | (2.43 | ) | | | (2.43 | ) | | | 44.77 | | | | 3.61 | | | | 892 | | | | 1.87 | | | | 1.87 | | | | (.79 | ) |
| | (.25 | ) | | | — | | | | (.25 | ) | | | 45.54 | | | | 25.26 | | | | 920 | | | | 1.93 | | | | 1.93 | | | | (.65 | ) |
| | | | | | | | | | | | | | | | | | | | | | | | | | | | | | | | | | | |
| | — | | | | (2.50 | ) | | | (2.50 | ) | | | 56.61 | | | | 6.39 | 6,8 | | | — | 9 | | | .85 | 7,8 | | | .85 | 7,8 | | | (.03 | )7,8 |
| | — | | | | — | | | | — | | | | 55.64 | | | | 12.15 | 6,8 | | | — | 9 | | | .42 | 6,8 | | | .42 | 6,8 | | | .25 | 6,8 |
| | | | | | | | | | | | | | | | | | | | | | | | | | | | | | | | | | | |
| | — | | | | (2.50 | ) | | | (2.50 | ) | | | 55.86 | | | | 6.26 | 6 | | | 797 | | | | 1.09 | 7 | | | 1.09 | 7 | | | (.28 | )7 |
| | (.15 | ) | | | — | | | | (.15 | ) | | | 55.00 | | | | 18.06 | | | | 792 | | | | 1.10 | | | | 1.10 | | | | .11 | |
| | — | | | | (2.83 | ) | | | (2.83 | ) | | | 46.74 | | | | 11.69 | | | | 718 | | | | 1.11 | | | | 1.11 | | | | .07 | |
| | — | | | | (4.75 | ) | | | (4.75 | ) | | | 44.60 | | | | 2.25 | | | | 662 | | | | 1.07 | | | | 1.07 | | | | .08 | |
| | — | | | | (2.43 | ) | | | (2.43 | ) | | | 48.23 | | | | 4.42 | | | | 624 | | | | 1.09 | | | | 1.09 | | | | — | |
| | (.55 | ) | | | — | | | | (.55 | ) | | | 48.51 | | | | 26.33 | | | | 868 | | | | 1.07 | | | | 1.07 | | | | .21 | |
| | | | | | | | | | | | | | | | | | | | | | | | | | | | | | | | | | | |
| | — | | | | (2.50 | ) | | | (2.50 | ) | | | 57.27 | | | | 6.42 | 6 | | | 3,517 | | | | .79 | 7 | | | .79 | 7 | | | .04 | 7 |
| | (.29 | ) | | | — | | | | (.29 | ) | | | 56.24 | | | | 18.40 | | | | 2,894 | | | | .82 | | | | .82 | | | | .38 | |
| | — | | | | (2.83 | ) | | | (2.83 | ) | | | 47.80 | | | | 12.03 | | | | 2,118 | | | | .82 | | | | .82 | | | | .36 | |
| | — | | | | (4.75 | ) | | | (4.75 | ) | | | 45.42 | | | | 2.50 | | | | 1,487 | | | | .82 | | | | .82 | | | | .35 | |
| | — | | | | (2.43 | ) | | | (2.43 | ) | | | 48.92 | | | | 4.72 | | | | 1,208 | | | | .81 | | | | .81 | | | | .31 | |
| | (.68 | ) | | | — | | | | (.68 | ) | | | 49.03 | | | | 26.68 | | | | 629 | | | | .82 | | | | .82 | | | | .48 | |
| | | | | | | | | | | | | | | | | | | | | | | | | | | | | | | | | | | |
| | — | | | | (2.50 | ) | | | (2.50 | ) | | | 56.76 | | | | 6.45 | 6 | | | 1,561 | | | | .71 | 7 | | | .71 | 7 | | | .12 | 7 |
| | — | | | | — | | | | — | | | | 55.74 | | | | 16.30 | 6 | | | 1,221 | | | | .71 | 7 | | | .71 | 7 | | | .70 | 7 |
See end of table for footnotes.
Financial highlights (continued)
| | | | | | Income (loss) from investment operations1 | |
| Period ended | | Net asset
value,
beginning
of period | | | Net
investment
(loss)
income | | | Net gains
(losses) on
securities (both
realized and
unrealized) | | | Total from
investment
operations | |
| Class 529-A: | | | | | | | | | | | | | | | | |
| 3/31/20184,5 | | $ | 55.01 | | | $ | (.08 | ) | | $ | 3.44 | | | $ | 3.36 | |
| 9/30/2017 | | | 46.74 | | | | .04 | | | | 8.36 | | | | 8.40 | |
| 9/30/2016 | | | 44.63 | | | | — | 12 | | | 4.94 | | | | 4.94 | |
| 9/30/2015 | | | 48.29 | | | | — | | | | 1.09 | | | | 1.09 | |
| 9/30/2014 | | | 48.59 | | | | (.03 | ) | | | 2.16 | | | | 2.13 | |
| 9/30/2013 | | | 39.03 | | | | .04 | | | | 10.05 | | | | 10.09 | |
| Class 529-C: | | | | | | | | | | | | | | | | |
| 3/31/20184,5 | | | 50.18 | | | | (.28 | ) | | | 3.14 | | | | 2.86 | |
| 9/30/2017 | | | 42.85 | | | | (.32 | ) | | | 7.65 | | | | 7.33 | |
| 9/30/2016 | | | 41.45 | | | | (.31 | ) | | | 4.54 | | | | 4.23 | |
| 9/30/2015 | | | 45.50 | | | | (.35 | ) | | | 1.05 | | | | .70 | |
| 9/30/2014 | | | 46.27 | | | | (.40 | ) | | | 2.06 | | | | 1.66 | |
| 9/30/2013 | | | 37.20 | | | | (.29 | ) | | | 9.60 | | | | 9.31 | |
| Class 529-E: | | | | | | | | | | | | | | | | |
| 3/31/20184,5 | | | 53.57 | | | | (.14 | ) | | | 3.36 | | | | 3.22 | |
| 9/30/2017 | | | 45.53 | | | | (.06 | ) | | | 8.14 | | | | 8.08 | |
| 9/30/2016 | | | 43.63 | | | | (.09 | ) | | | 4.82 | | | | 4.73 | |
| 9/30/2015 | | | 47.41 | | | | (.11 | ) | | | 1.08 | | | | .97 | |
| 9/30/2014 | | | 47.87 | | | | (.14 | ) | | | 2.11 | | | | 1.97 | |
| 9/30/2013 | | | 38.45 | | | | (.06 | ) | | | 9.91 | | | | 9.85 | |
| Class 529-T: | | | | | | | | | | | | | | | | |
| 3/31/20184,5 | | | 55.63 | | | | (.02 | ) | | | 3.48 | | | | 3.46 | |
| 9/30/20174,10 | | | 49.61 | | | | .12 | | | | 5.90 | | | | 6.02 | |
| Class 529-F-1: | | | | | | | | | | | | | | | | |
| 3/31/20184,5 | | | 55.58 | | | | (.02 | ) | | | 3.48 | | | | 3.46 | |
| 9/30/2017 | | | 47.23 | | | | .15 | | | | 8.43 | | | | 8.58 | |
| 9/30/2016 | | | 44.98 | | | | .09 | | | | 4.99 | | | | 5.08 | |
| 9/30/2015 | | | 48.53 | | | | .11 | | | | 1.09 | | | | 1.20 | |
| 9/30/2014 | | | 48.73 | | | | .08 | | | | 2.15 | | | | 2.23 | |
| 9/30/2013 | | | 39.14 | | | | .13 | | | | 10.07 | | | | 10.20 | |
| Class R-1: | | | | | | | | | | | | | | | | |
| 3/31/20184,5 | | | 50.79 | | | | (.26 | ) | | | 3.18 | | | | 2.92 | |
| 9/30/2017 | | | 43.34 | | | | (.29 | ) | | | 7.74 | | | | 7.45 | |
| 9/30/2016 | | | 41.85 | | | | (.28 | ) | | | 4.60 | | | | 4.32 | |
| 9/30/2015 | | | 45.85 | | | | (.31 | ) | | | 1.06 | | | | .75 | |
| 9/30/2014 | | | 46.56 | | | | (.35 | ) | | | 2.07 | | | | 1.72 | |
| 9/30/2013 | | | 37.40 | | | | (.23 | ) | | | 9.66 | | | | 9.43 | |
| Dividends and distributions | | | | | | | | | | | | Ratio of | | | Ratio of | | | | |
Dividends
(from net
investment
income) | | | Distributions
(from capital
gains) | | | Total
dividends
and
distributions | | | Net asset
value, end
of period | | | Total return2,3 | | | Net assets,
end of
period
(in
millions) | | | expenses to
average net
assets before
reimburse-
ments | | | expenses to
average net
assets after
reimburse-
ments3 | | | Ratio of net
(loss) income
to average
net assets3 | |
| | | | | | | | | | | | | | | | | | | | | | | | | | | | | | | | | | | |
| $ | — | | | $ | (2.50 | ) | | $ | (2.50 | ) | | $ | 55.87 | | | | 6.24 | %6 | | $ | 1,355 | | | | 1.11 | %7 | | | 1.11 | %7 | | | (.29 | )%7 |
| | (.13 | ) | | | — | | | | (.13 | ) | | | 55.01 | | | | 18.03 | | | | 1,195 | | | | 1.13 | | | | 1.13 | | | | .08 | |
| | — | | | | (2.83 | ) | | | (2.83 | ) | | | 46.74 | | | | 11.64 | | | | 1,024 | | | | 1.17 | | | | 1.17 | | | | — | 13 |
| | — | | | | (4.75 | ) | | | (4.75 | ) | | | 44.63 | | | | 2.16 | | | | 943 | | | | 1.15 | | | | 1.15 | | | | — | |
| | — | | | | (2.43 | ) | | | (2.43 | ) | | | 48.29 | | | | 4.37 | | | | 933 | | | | 1.15 | | | | 1.15 | | | | (.05 | ) |
| | (.53 | ) | | | — | | | | (.53 | ) | | | 48.59 | | | | 26.18 | | | | 884 | | | | 1.19 | | | | 1.19 | | | | .09 | |
| | | | | | | | | | | | | | | | | | | | | | | | | | | | | | | | | | | |
| | — | | | | (2.50 | ) | | | (2.50 | ) | | | 50.54 | | | | 5.83 | 6 | | | 235 | | | | 1.89 | 7 | | | 1.89 | 7 | | | (1.08 | )7 |
| | — | | | | — | | | | — | | | | 50.18 | | | | 17.11 | | | | 314 | | | | 1.91 | | | | 1.91 | | | | (.70 | ) |
| | — | | | | (2.83 | ) | | | (2.83 | ) | | | 42.85 | | | | 10.78 | | | | 286 | | | | 1.96 | | | | 1.96 | | | | (.78 | ) |
| | — | | | | (4.75 | ) | | | (4.75 | ) | | | 41.45 | | | | 1.37 | | | | 274 | | | | 1.93 | | | | 1.93 | | | | (.78 | ) |
| | — | | | | (2.43 | ) | | | (2.43 | ) | | | 45.50 | | | | 3.53 | | | | 280 | | | | 1.94 | | | | 1.94 | | | | (.85 | ) |
| | (.24 | ) | | | — | | | | (.24 | ) | | | 46.27 | | | | 25.21 | | | | 273 | | | | 1.98 | | | | 1.98 | | | | (.70 | ) |
| | | | | | | | | | | | | | | | | | | | | | | | | | | | | | | | | | | |
| | — | | | | (2.50 | ) | | | (2.50 | ) | | | 54.29 | | | | 6.14 | 6 | | | 62 | | | | 1.33 | 7 | | | 1.33 | 7 | | | (.51 | )7 |
| | (.04 | ) | | | — | | | | (.04 | ) | | | 53.57 | | | | 17.77 | | | | 59 | | | | 1.35 | | | | 1.35 | | | | (.13 | ) |
| | — | | | | (2.83 | ) | | | (2.83 | ) | | | 45.53 | | | | 11.39 | | | | 53 | | | | 1.38 | | | | 1.38 | | | | (.21 | ) |
| | — | | | | (4.75 | ) | | | (4.75 | ) | | | 43.63 | | | | 1.95 | | | | 49 | | | | 1.38 | | | | 1.38 | | | | (.23 | ) |
| | — | | | | (2.43 | ) | | | (2.43 | ) | | | 47.41 | | | | 4.10 | | | | 49 | | | | 1.39 | | | | 1.39 | | | | (.30 | ) |
| | (.43 | ) | | | — | | | | (.43 | ) | | | 47.87 | | | | 25.90 | | | | 48 | | | | 1.43 | | | | 1.43 | | | | (.15 | ) |
| | | | | | | | | | | | | | | | | | | | | | | | | | | | | | | | | | | |
| | — | | | | (2.50 | ) | | | (2.50 | ) | | | 56.59 | | | | 6.37 | 6,8 | | | — | 9 | | | .88 | 7,8 | | | .88 | 7,8 | | | (.07 | )7,8 |
| | — | | | | — | | | | — | | | | 55.63 | | | | 12.13 | 6,8 | | | — | 9 | | | .45 | 6,8 | | | .45 | 6,8 | | | .22 | 6,8 |
| | | | | | | | | | | | | | | | | | | | | | | | | | | | | | | | | | | |
| | — | | | | (2.50 | ) | | | (2.50 | ) | | | 56.54 | | | | 6.37 | 6 | | | 123 | | | | .89 | 7 | | | .89 | 7 | | | (.07 | )7 |
| | (.23 | ) | | | — | | | | (.23 | ) | | | 55.58 | | | | 18.26 | | | | 113 | | | | .92 | | | | .92 | | | | .30 | |
| | — | | | | (2.83 | ) | | | (2.83 | ) | | | 47.23 | | | | 11.85 | | | | 90 | | | | .96 | | | | .96 | | | | .22 | |
| | — | | | | (4.75 | ) | | | (4.75 | ) | | | 44.98 | | | | 2.42 | | | | 83 | | | | .93 | | | | .93 | | | | .22 | |
| | — | | | | (2.43 | ) | | | (2.43 | ) | | | 48.53 | | | | 4.57 | | | | 80 | | | | .94 | | | | .94 | | | | .16 | |
| | (.61 | ) | | | — | | | | (.61 | ) | | | 48.73 | | | | 26.43 | | | | 73 | | | | .98 | | | | .98 | | | | .30 | |
| | | | | | | | | | | | | | | | | | | | | | | | | | | | | | | | | | | |
| | — | | | | (2.50 | ) | | | (2.50 | ) | | | 51.21 | | | | 5.88 | 6 | | | 29 | | | | 1.82 | 7 | | | 1.82 | 7 | | | (1.00 | )7 |
| | — | | | | — | | | | — | | | | 50.79 | | | | 17.19 | | | | 30 | | | | 1.83 | | | | 1.83 | | | | (.63 | ) |
| | — | | | | (2.83 | ) | | | (2.83 | ) | | | 43.34 | | | | 10.89 | | | | 33 | | | | 1.85 | | | | 1.85 | | | | (.68 | ) |
| | — | | | | (4.75 | ) | | | (4.75 | ) | | | 41.85 | | | | 1.48 | | | | 36 | | | | 1.82 | | | | 1.82 | | | | (.68 | ) |
| | — | | | | (2.43 | ) | | | (2.43 | ) | | | 45.85 | | | | 3.66 | | | | 39 | | | | 1.82 | | | | 1.82 | | | | (.74 | ) |
| | (.27 | ) | | | — | | | | (.27 | ) | | | 46.56 | | | | 25.37 | | | | 42 | | | | 1.84 | | | | 1.84 | | | | (.57 | ) |
See end of table for footnotes.
Financial highlights (continued)
| | | | | | Income (loss) from investment operations1 | |
| Period ended | | Net asset
value,
beginning
of period | | | Net
investment
(loss)
income | | | Net gains
(losses) on
securities (both
realized and
unrealized) | | | Total from
investment
operations | |
| Class R-2: | | | | | | | | | | | | | | | | |
| 3/31/20184,5 | | $ | 50.82 | | | $ | (.25 | ) | | $ | 3.17 | | | $ | 2.92 | |
| 9/30/2017 | | | 43.35 | | | | (.27 | ) | | | 7.74 | | | | 7.47 | |
| 9/30/2016 | | | 41.85 | | | | (.27 | ) | | | 4.60 | | | | 4.33 | |
| 9/30/2015 | | | 45.84 | | | | (.29 | ) | | | 1.05 | | | | .76 | |
| 9/30/2014 | | | 46.56 | | | | (.35 | ) | | | 2.06 | | | | 1.71 | |
| 9/30/2013 | | | 37.39 | | | | (.23 | ) | | | 9.67 | | | | 9.44 | |
| Class R-2E: | | | | | | | | | | | | | | | | |
| 3/31/20184,5 | | | 55.26 | | | | (.19 | ) | | | 3.45 | | | | 3.26 | |
| 9/30/2017 | | | 47.07 | | | | (.14 | ) | | | 8.40 | | | | 8.26 | |
| 9/30/2016 | | | 45.04 | | | | (.08 | ) | | | 4.94 | | | | 4.86 | |
| 9/30/2015 | | | 48.67 | | | | .01 | | | | 1.11 | | | | 1.12 | |
| 9/30/20144,14 | | | 50.83 | | | | (.01 | ) | | | (2.15 | ) | | | (2.16 | ) |
| Class R-3: | | | | | | | | | | | | | | | | |
| 3/31/20184,5 | | | 53.47 | | | | (.15 | ) | | | 3.35 | | | | 3.20 | |
| 9/30/2017 | | | 45.45 | | | | (.07 | ) | | | 8.13 | | | | 8.06 | |
| 9/30/2016 | | | 43.56 | | | | (.09 | ) | | | 4.81 | | | | 4.72 | |
| 9/30/2015 | | | 47.34 | | | | (.10 | ) | | | 1.07 | | | | .97 | |
| 9/30/2014 | | | 47.79 | | | | (.14 | ) | | | 2.12 | | | | 1.98 | |
| 9/30/2013 | | | 38.39 | | | | (.05 | ) | | | 9.89 | | | | 9.84 | |
| Class R-4: | | | | | | | | | | | | | | | | |
| 3/31/20184,5 | | | 55.18 | | | | (.07 | ) | | | 3.46 | | | | 3.39 | |
| 9/30/2017 | | | 46.89 | | | | .08 | | | | 8.38 | | | | 8.46 | |
| 9/30/2016 | | | 44.71 | | | | .04 | | | | 4.97 | | | | 5.01 | |
| 9/30/2015 | | | 48.33 | | | | .05 | | | | 1.08 | | | | 1.13 | |
| 9/30/2014 | | | 48.59 | | | | .02 | | | | 2.15 | | | | 2.17 | |
| 9/30/2013 | | | 39.03 | | | | .09 | | | | 10.04 | | | | 10.13 | |
| Class R-5E: | | | | | | | | | | | | | | | | |
| 3/31/20184,5 | | | 55.55 | | | | (.01 | ) | | | 3.49 | | | | 3.48 | |
| 9/30/2017 | | | 47.30 | | | | .18 | | | | 8.42 | | | | 8.60 | |
| 9/30/20164,15 | | | 47.09 | | | | .12 | | | | 2.92 | | | | 3.04 | |
| Class R-5: | | | | | | | | | | | | | | | | |
| 3/31/20184,5 | | | 56.99 | | | | .02 | | | | 3.57 | | | | 3.59 | |
| 9/30/2017 | | | 48.40 | | | | .24 | | | | 8.64 | | | | 8.88 | |
| 9/30/2016 | | | 45.94 | | | | .18 | | | | 5.11 | | | | 5.29 | |
| 9/30/2015 | | | 49.39 | | | | .20 | | | | 1.10 | | | | 1.30 | |
| 9/30/2014 | | | 49.46 | | | | .15 | | | | 2.21 | | | | 2.36 | |
| 9/30/2013 | | | 39.71 | | | | .22 | | | | 10.22 | | | | 10.44 | |
| Dividends and distributions | | | | | | | | | | | | Ratio of | | | Ratio of | | | | |
Dividends
(from net
investment
income) | | | Distributions
(from capital
gains) | | | Total
dividends
and
distributions | | | Net asset
value, end
of period | | | Total return2,3 | | | Net assets,
end of
period
(in
millions) | | | expenses to
average net
assets before
reimburse-
ments | | | expenses to
average net
assets after
reimburse-
ments3 | | | Ratio of net
(loss) income
to average
net assets3 | |
| | | | | | | | | | | | | | | | | | | | | | | | | | | | | | | | | | | |
| $ | — | | | $ | (2.50 | ) | | $ | (2.50 | ) | | $ | 51.24 | | | | 5.87 | %6 | | $ | 610 | | | | 1.80 | %7 | | | 1.80 | %7 | | | (.98 | )%7 |
| | — | | | | — | | | | — | | | | 50.82 | | | | 17.23 | | | | 628 | | | | 1.80 | | | | 1.80 | | | | (.60 | ) |
| | — | | | | (2.83 | ) | | | (2.83 | ) | | | 43.35 | | | | 10.89 | | | | 616 | | | | 1.84 | | | | 1.84 | | | | (.67 | ) |
| | — | | | | (4.75 | ) | | | (4.75 | ) | | | 41.85 | | | | 1.53 | | | | 632 | | | | 1.79 | | | | 1.79 | | | | (.65 | ) |
| | — | | | | (2.43 | ) | | | (2.43 | ) | | | 45.84 | | | | 3.64 | | | | 689 | | | | 1.83 | | | | 1.83 | | | | (.75 | ) |
| | (.27 | ) | | | — | | | | (.27 | ) | | | 46.56 | | | | 25.41 | | | | 736 | | | | 1.83 | | | | 1.83 | | | | (.55 | ) |
| | | | | | | | | | | | | | | | | | | | | | | | | | | | | | | | | | | |
| | — | | | | (2.50 | ) | | | (2.50 | ) | | | 56.02 | | | | 6.04 | 6 | | | 20 | | | | 1.51 | 7 | | | 1.51 | 7 | | | (.68 | )7 |
| | (.07 | ) | | | — | | | | (.07 | ) | | | 55.26 | | | | 17.57 | | | | 16 | | | | 1.51 | | | | 1.51 | | | | (.27 | ) |
| | — | | | | (2.83 | ) | | | (2.83 | ) | | | 47.07 | | | | 11.32 | | | | 6 | | | | 1.51 | | | | 1.51 | | | | (.20 | ) |
| | — | | | | (4.75 | ) | | | (4.75 | ) | | | 45.04 | | | | 2.23 | 8 | | | — | 9 | | | 1.26 | 8 | | | 1.26 | 8 | | | .01 | 8 |
| | — | | | | — | | | | — | | | | 48.67 | | | | (4.25 | )6,8 | | | — | 9 | | | .08 | 6,8 | | | .08 | 6,8 | | | (.01 | )6,8 |
| | | | | | | | | | | | | | | | | | | | | | | | | | | | | | | | | | | |
| | — | | | | (2.50 | ) | | | (2.50 | ) | | | 54.17 | | | | 6.13 | 6 | | | 844 | | | | 1.36 | 7 | | | 1.36 | 7 | | | (.54 | )7 |
| | (.04 | ) | | | — | | | | (.04 | ) | | | 53.47 | | | | 17.74 | | | | 844 | | | | 1.35 | | | | 1.35 | | | | (.14 | ) |
| | — | | | | (2.83 | ) | | | (2.83 | ) | | | 45.45 | | | | 11.41 | | | | 783 | | | | 1.39 | | | | 1.39 | | | | (.22 | ) |
| | — | | | | (4.75 | ) | | | (4.75 | ) | | | 43.56 | | | | 1.93 | | | | 776 | | | | 1.37 | | | | 1.37 | | | | (.22 | ) |
| | — | | | | (2.43 | ) | | | (2.43 | ) | | | 47.34 | | | | 4.12 | | | | 811 | | | | 1.39 | | | | 1.39 | | | | (.30 | ) |
| | (.44 | ) | | | — | | | | (.44 | ) | | | 47.79 | | | | 25.90 | | | | 836 | | | | 1.40 | | | | 1.40 | | | | (.12 | ) |
| | | | | | | | | | | | | | | | | | | | | | | | | | | | | | | | | | | |
| | — | | | | (2.50 | ) | | | (2.50 | ) | | | 56.07 | | | | 6.29 | 6 | | | 879 | | | | 1.05 | 7 | | | 1.05 | 7 | | | (.23 | )7 |
| | (.17 | ) | | | — | | | | (.17 | ) | | | 55.18 | | | | 18.12 | | | | 865 | | | | 1.05 | | | | 1.05 | | | | .17 | |
| | — | | | | (2.83 | ) | | | (2.83 | ) | | | 46.89 | | | | 11.76 | | | | 764 | | | | 1.07 | | | | 1.07 | | | | .10 | |
| | — | | | | (4.75 | ) | | | (4.75 | ) | | | 44.71 | | | | 2.27 | | | | 715 | | | | 1.05 | | | | 1.05 | | | | .10 | |
| | — | | | | (2.43 | ) | | | (2.43 | ) | | | 48.33 | | | | 4.46 | | | | 727 | | | | 1.06 | | | | 1.06 | | | | .03 | |
| | (.57 | ) | | | — | | | | (.57 | ) | | | 48.59 | | | | 26.31 | | | | 712 | | | | 1.07 | | | | 1.07 | | | | .21 | |
| | | | | | | | | | | | | | | | | | | | | | | | | | | | | | | | | | | |
| | — | | | | (2.50 | ) | | | (2.50 | ) | | | 56.53 | | | | 6.40 | 6 | | | 17 | | | | .85 | 7 | | | .85 | 7 | | | (.03 | )7 |
| | (.35 | ) | | | — | | | | (.35 | ) | | | 55.55 | | | | 18.33 | | | | 12 | | | | .84 | | | | .84 | | | | .36 | |
| | — | | | | (2.83 | ) | | | (2.83 | ) | | | 47.30 | | | | 7.01 | 6 | | | — | 9 | | | .96 | 7 | | | .95 | 7 | | | .32 | 7 |
| | | | | | | | | | | | | | | | | | | | | | | | | | | | | | | | | | | |
| | — | | | | (2.50 | ) | | | (2.50 | ) | | | 58.08 | | | | 6.45 | 6 | | | 342 | | | | .75 | 7 | | | .75 | 7 | | | .05 | 7 |
| | (.29 | ) | | | — | | | | (.29 | ) | | | 56.99 | | | | 18.48 | | | | 424 | | | | .75 | | | | .75 | | | | .47 | |
| | — | | | | (2.83 | ) | | | (2.83 | ) | | | 48.40 | | | | 12.09 | | | | 359 | | | | .77 | | | | .77 | | | | .41 | |
| | — | | | | (4.75 | ) | | | (4.75 | ) | | | 45.94 | | | | 2.57 | | | | 474 | | | | .75 | | | | .75 | | | | .40 | |
| | — | | | | (2.43 | ) | | | (2.43 | ) | | | 49.39 | | | | 4.78 | | | | 452 | | | | .76 | | | | .76 | | | | .29 | |
| | (.69 | ) | | | — | | | | (.69 | ) | | | 49.46 | | | | 26.72 | | | | 550 | | | | .77 | | | | .77 | | | | .51 | |
See end of table for footnotes.
Financial highlights (continued)
| | | | | | Income (loss) from investment operations1 | |
| Period ended | | Net asset
value,
beginning
of period | | | Net
investment
(loss)
income | | | Net gains
(losses) on
securities (both
realized and
unrealized) | | | Total from
investment
operations | |
| Class R-6: | | | | | | | | | | | | | | | | |
| 3/31/20184,5 | | $ | 56.40 | | | $ | .04 | | | $ | 3.53 | | | $ | 3.57 | |
| 9/30/2017 | | | 47.93 | | | | .26 | | | | 8.54 | | | | 8.80 | |
| 9/30/2016 | | | 45.49 | | | | .21 | | | | 5.06 | | | | 5.27 | |
| 9/30/2015 | | | 48.93 | | | | .22 | | | | 1.09 | | | | 1.31 | |
| 9/30/2014 | | | 49.00 | | | | .21 | | | | 2.15 | | | | 2.36 | |
| 9/30/2013 | | | 39.34 | | | | .25 | | | | 10.12 | | | | 10.37 | |
| | | Six months ended | | | |
| | | March 31, | | Year ended September 30 |
| | | 20184,5,6 | | 2017 | | 2016 | | 2015 | | 2014 | | 2013 |
| Portfolio turnover rate for all share classes | | 17% | | 32% | | 29% | | 33% | | 38% | | 37% |
| | | | | | | | | | | | | | | | | | | | | | | | | |
See Notes to Financial Statements
| Dividends and distributions | | | | | | | | | | | | Ratio of | | | Ratio of | | | | |
Dividends
(from net
investment
income) | | | Distributions
(from capital
gains) | | | Total
dividends
and
distributions | | | Net asset
value, end
of period | | | Total return2,3 | | | Net assets,
end of
period
(in
millions) | | | expenses to
average net
assets before
reimburse-
ments | | | expenses to
average net
assets after
reimburse-
ments3 | | | Ratio of net
(loss) income
to average
net assets3 | |
| | | | | | | | | | | | | | | | | | | | | | | | | | | | | | | | | | | |
| $ | — | | | $ | (2.50 | ) | | $ | (2.50 | ) | | $ | 57.47 | | | | 6.47 | %6 | | $ | 6,281 | | | | .70 | %7 | | | .70 | %7 | | | .13 | %7 |
| | (.33 | ) | | | — | | | | (.33 | ) | | | 56.40 | | | | 18.51 | | | | 5,289 | | | | .70 | | | | .70 | | | | .51 | |
| | — | | | | (2.83 | ) | | | (2.83 | ) | | | 47.93 | | | | 12.15 | | | | 3,403 | | | | .71 | | | | .71 | | | | .48 | |
| | — | | | | (4.75 | ) | | | (4.75 | ) | | | 45.49 | | | | 2.63 | | | | 2,269 | | | | .71 | | | | .71 | | | | .45 | |
| | — | | | | (2.43 | ) | | | (2.43 | ) | | | 48.93 | | | | 4.82 | | | | 1,859 | | | | .71 | | | | .71 | | | | .41 | |
| | (.71 | ) | | | — | | | | (.71 | ) | | | 49.00 | | | | 26.80 | | | | 1,206 | | | | .72 | | | | .72 | | | | .57 | |
| 1 | Based on average shares outstanding. |
| 2 | Total returns exclude any applicable sales charges, including contingent deferred sales charges. |
| 3 | This column reflects the impact, if any, of certain reimbursements from CRMC. During one of the periods shown, CRMC paid a portion of the fund’s transfer agent fees for certain retirement plan share classes. |
| 4 | Based on operations for a period that is less than a full year. |
| 5 | Unaudited. |
| 6 | Not annualized. |
| 7 | Annualized. |
| 8 | All or a significant portion of assets in this class consisted of seed capital invested by CRMC and/or its affiliates. Fees for distribution services are not charged or accrued on these seed capital assets. If such fees were paid by the fund on seed capital assets, fund expenses would have been higher and net income and total return would have been lower. |
| 9 | Amount less than $1 million. |
| 10 | Class T and 529-T shares began investment operations on April 7, 2017. |
| 11 | Class F-3 shares began investment operations on January 27, 2017. |
| 12 | Amount less than $.01. |
| 13 | Amount less than .01%. |
| 14 | Class R-2E shares began investment operations on August 29, 2014. |
| 15 | Class R-5E shares began investment operations on November 20, 2015. |
As a fund shareholder, you incur two types of costs: (1) transaction costs, such as initial sales charges on purchase payments and contingent deferred sales charges on redemptions (loads), and (2) ongoing costs, including management fees, distribution and service (12b-1) fees, and other expenses. This example is intended to help you understand your ongoing costs (in dollars) of investing in the fund so you can compare these costs with the ongoing costs of investing in other mutual funds. The example is based on an investment of $1,000 invested at the beginning of the period and held for the entire six-month period (October 1, 2017, through March 31, 2018).
Actual expenses:
The first line of each share class in the table on the following page provides information about actual account values and actual expenses. You may use the information in this line, together with the amount you invested, to estimate the expenses that you paid over the period. Simply divide your account value by $1,000 (for example, an $8,600 account value divided by $1,000 = 8.6), then multiply the result by the number in the first line under the heading titled “Expenses paid during period” to estimate the expenses you paid on your account during this period.
Hypothetical example for comparison purposes:
The second line of each share class in the table on the following page provides information about hypothetical account values and hypothetical expenses based on the actual expense ratio for the share class and an assumed rate of return of 5.00% per year before expenses, which is not the actual return of the share class. The hypothetical account values and expenses may not be used to estimate the actual ending account balance or expenses you paid for the period. You may use this information to compare the ongoing costs of investing in the fund and other funds. To do so, compare this 5.00% hypothetical example with the 5.00% hypothetical examples that appear in the shareholder reports of the other funds.
Notes:
Retirement plan participants may be subject to certain fees charged by the plan sponsor, and Class F-1, F-2, F-3 and 529-F-1 shareholders may be subject to fees charged by financial intermediaries, typically ranging from 0.75% to 1.50% of assets annually depending on services offered. You can estimate the impact of these fees by adding the amount of the fees to the total estimated expenses you paid on your account during the period as calculated above. In addition, your ending account value would be lower by the amount of these fees.
Note that the expenses shown in the table on the following page are meant to highlight your ongoing costs only and do not reflect any transactional costs, such as sales charges (loads). Therefore, the second line of each share class in the table is useful in comparing ongoing costs only and will not help you determine the relative total costs of owning different funds. In addition, if these transactional costs were included, your costs would have been higher.
| | | Beginning
account value
10/1/2017 | | | Ending
account value
3/31/2018 | | | Expenses paid
during period* | | | Annualized
expense ratio | |
| Class A – actual return | | $ | 1,000.00 | | | $ | 1,062.84 | | | $ | 5.35 | | | | 1.04 | % |
| Class A – assumed 5% return | | | 1,000.00 | | | | 1,019.75 | | | | 5.24 | | | | 1.04 | |
| Class C – actual return | | | 1,000.00 | | | | 1,058.52 | | | | 9.44 | | | | 1.84 | |
| Class C – assumed 5% return | | | 1,000.00 | | | | 1,015.76 | | | | 9.25 | | | | 1.84 | |
| Class T – actual return | | | 1,000.00 | | | | 1,063.87 | | | | 4.37 | | | | .85 | |
| Class T – assumed 5% return | | | 1,000.00 | | | | 1,020.69 | | | | 4.28 | | | | .85 | |
| Class F-1 – actual return | | | 1,000.00 | | | | 1,062.58 | | | | 5.61 | | | | 1.09 | |
| Class F-1 – assumed 5% return | | | 1,000.00 | | | | 1,019.50 | | | | 5.49 | | | | 1.09 | |
| Class F-2 – actual return | | | 1,000.00 | | | | 1,064.23 | | | | 4.07 | | | | .79 | |
| Class F-2 – assumed 5% return | | | 1,000.00 | | | | 1,020.99 | | | | 3.98 | | | | .79 | |
| Class F-3 – actual return | | | 1,000.00 | | | | 1,064.45 | | | | 3.65 | | | | .71 | |
| Class F-3 – assumed 5% return | | | 1,000.00 | | | | 1,021.39 | | | | 3.58 | | | | .71 | |
| Class 529-A – actual return | | | 1,000.00 | | | | 1,062.41 | | | | 5.71 | | | | 1.11 | |
| Class 529-A – assumed 5% return | | | 1,000.00 | | | | 1,019.40 | | | | 5.59 | | | | 1.11 | |
| Class 529-C – actual return | | | 1,000.00 | | | | 1,058.27 | | | | 9.70 | | | | 1.89 | |
| Class 529-C – assumed 5% return | | | 1,000.00 | | | | 1,015.51 | | | | 9.50 | | | | 1.89 | |
| Class 529-E – actual return | | | 1,000.00 | | | | 1,061.38 | | | | 6.84 | | | | 1.33 | |
| Class 529-E – assumed 5% return | | | 1,000.00 | | | | 1,018.30 | | | | 6.69 | | | | 1.33 | |
| Class 529-T – actual return | | | 1,000.00 | | | | 1,063.66 | | | | 4.53 | | | | .88 | |
| Class 529-T – assumed 5% return | | | 1,000.00 | | | | 1,020.54 | | | | 4.43 | | | | .88 | |
| Class 529-F-1 – actual return | | | 1,000.00 | | | | 1,063.74 | | | | 4.58 | | | | .89 | |
| Class 529-F-1 – assumed 5% return | | | 1,000.00 | | | | 1,020.49 | | | | 4.48 | | | | .89 | |
| Class R-1 – actual return | | | 1,000.00 | | | | 1,058.77 | | | | 9.34 | | | | 1.82 | |
| Class R-1 – assumed 5% return | | | 1,000.00 | | | | 1,015.86 | | | | 9.15 | | | | 1.82 | |
| Class R-2 – actual return | | | 1,000.00 | | | | 1,058.72 | | | | 9.24 | | | | 1.80 | |
| Class R-2 – assumed 5% return | | | 1,000.00 | | | | 1,015.96 | | | | 9.05 | | | | 1.80 | |
| Class R-2E – actual return | | | 1,000.00 | | | | 1,060.41 | | | | 7.76 | | | | 1.51 | |
| Class R-2E – assumed 5% return | | | 1,000.00 | | | | 1,017.40 | | | | 7.59 | | | | 1.51 | |
| Class R-3 – actual return | | | 1,000.00 | | | | 1,061.34 | | | | 6.99 | | | | 1.36 | |
| Class R-3 – assumed 5% return | | | 1,000.00 | | | | 1,018.15 | | | | 6.84 | | | | 1.36 | |
| Class R-4 – actual return | | | 1,000.00 | | | | 1,062.93 | | | | 5.40 | | | | 1.05 | |
| Class R-4 – assumed 5% return | | | 1,000.00 | | | | 1,019.70 | | | | 5.29 | | | | 1.05 | |
| Class R-5E – actual return | | | 1,000.00 | | | | 1,063.99 | | | | 4.37 | | | | .85 | |
| Class R-5E – assumed 5% return | | | 1,000.00 | | | | 1,020.69 | | | | 4.28 | | | | .85 | |
| Class R-5 – actual return | | | 1,000.00 | | | | 1,064.46 | | | | 3.86 | | | | .75 | |
| Class R-5 – assumed 5% return | | | 1,000.00 | | | | 1,021.19 | | | | 3.78 | | | | .75 | |
| Class R-6 – actual return | | | 1,000.00 | | | | 1,064.73 | | | | 3.60 | | | | .70 | |
| Class R-6 – assumed 5% return | | | 1,000.00 | | | | 1,021.44 | | | | 3.53 | | | | .70 | |
| * | The “expenses paid during period” are equal to the “annualized expense ratio,” multiplied by the average account value over the period, multiplied by the number of days in the period, and divided by 365 (to reflect the one-half year period). |
This page was intentionally left blank.
This page was intentionally left blank.
This page was intentionally left blank.
This page was intentionally left blank.
This page was intentionally left blank.
This page was intentionally left blank.
Offices of the fund and of the investment adviser
Capital Research and Management Company
333 South Hope Street
Los Angeles, CA 90071-1406
6455 Irvine Center Drive
Irvine, CA 92618-4518
Transfer agent for shareholder accounts
American Funds Service Company
(Write to the address near you.)
P.O. Box 6007
Indianapolis, IN 46206-6007
P.O. Box 2280
Norfolk, VA 23501-2280
Custodian of assets
State Street Bank and Trust Company
One Lincoln Street
Boston, MA 02111
Counsel
Dechert LLP
One Bush Street, Suite 1600
San Francisco, CA 94104-4446
Independent registered public accounting firm
Deloitte & Touche LLP
695 Town Center Drive
Suite 1200
Costa Mesa, CA 92626-7188
Principal underwriter
American Funds Distributors, Inc.
333 South Hope Street
Los Angeles, CA 90071-1406
Investors should carefully consider investment objectives, risks, charges and expenses. This and other important information is contained in the fund prospectus and summary prospectus, which can be obtained from your financial professional and should be read carefully before investing. You may also call American Funds Service Company (AFS) at (800) 421-4225 or visit the American Funds website at americanfunds.com. Fund shares offered through American Funds Distributors, Inc.
“American Funds Proxy Voting Procedures and Principles” — which describes how we vote proxies relating to portfolio securities — is available on the American Funds website or upon request by calling AFS. The fund files its proxy voting record with the U.S. Securities and Exchange Commission (SEC) for the 12 months ended June 30 by August 31. The proxy voting record is available free of charge on the SEC website at sec.gov and on the American Funds website.
A complete March 31, 2018, portfolio of SMALLCAP World Fund’s investments is available free of charge by calling AFS or visiting the SEC website (where it is part of Form N-CSR).
SMALLCAP World Fund files a complete list of its portfolio holdings with the SEC for the first and third quarters of each fiscal year on Form N-Q. This filing is available free of charge on the SEC website. You may also review or, for a fee, copy this filing at the SEC’s Public Reference Room in Washington, D.C. Additional information regarding the operation of the Public Reference Room may be obtained by calling the SEC’s Office of Investor Education and Advocacy at (800) SEC-0330. Additionally, the list of portfolio holdings is available by calling AFS.
This report is for the information of shareholders of SMALLCAP World Fund, but it also may be used as sales literature when preceded or accompanied by the current prospectus or summary prospectus, which gives details about charges, expenses, investment objectives and operating policies of the fund. If used as sales material after June 30, 2018, this report must be accompanied by an American Funds statistical update for the most recently completed calendar quarter.
MCSI has not approved, reviewed or produced this report, makes no express or implied warranties or representations and is not liable whatsoever for any data in the report. You may not redistribute the MSCI data or use it as a basis for other indices or investment products.
American Funds from Capital Group
The Capital Advantage®
Since 1931, American Funds, part of Capital Group, has helped investors pursue long-term investment success. Our consistent approach — in combination with The Capital SystemSM — has resulted in a superior long-term track record.
| | Aligned with investor success |
| | We base our decisions on a long-term perspective, which we believe aligns our goals with the interests of our clients. Our portfolio managers average 27 years of investment experience, including 22 years at our company, reflecting a career commitment to our long-term approach.1 |
| | |
| | The Capital System |
| | The Capital System combines individual accountability with teamwork. Funds using The Capital System are divided into portions that are managed independently by investment professionals with diverse backgrounds, ages and investment approaches. An extensive global research effort is the backbone of our system. |
| | |
| | American Funds’ superior long-term track record |
| | Equity funds have beaten their Lipper peer indexes in 92% of 10-year periods and 99% of 20-year periods. Fixed income funds have beaten their Lipper indexes in 77% of 10-year periods and 80% of 20-year periods.2 Fund management fees have been among the lowest in the industry.3 |
| | 1 | Portfolio manager experience as of December 31, 2017. |
| | 2 | Based on Class F-2 share results for rolling periods through December 31, 2017. Periods covered are the shorter of the fund’s lifetime or since the comparable Lipper index inception date (except Capital Income Builder and SMALLCAP World Fund, for which the Lipper average was used). Expenses differ for each share class, so results will vary. Class F-2 shares were first offered on August 1, 2008. Class F-2 share results prior to the date of first sale are hypothetical based on Class A share results without a sales charge, adjusted for typical estimated expenses. Results for certain funds with an inception date after August 1, 2008, also include hypothetical returns because those funds’ Class F-2 shares sold after the funds’ date of first offering. Please see americanfunds.com for more information on specific expense adjustments and the actual dates of first sale. |
| | 3 | On average, our management fees were in the lowest quintile 71% of the time, based on the 20-year period ended December 31, 2017, versus comparable Lipper categories, excluding funds of funds. |
ITEM 2 – Code of Ethics
Not applicable for filing of semi-annual reports to shareholders.
ITEM 3 – Audit Committee Financial Expert
Not applicable for filing of semi-annual reports to shareholders.
ITEM 4 – Principal Accountant Fees and Services
Not applicable for filing of semi-annual reports to shareholders.
ITEM 5 – Audit Committee of Listed Registrants
Not applicable to this Registrant, insofar as the Registrant is not a listed issuer as defined in Rule 10A-3 under the Securities Exchange Act of 1934.
ITEM 6 – Schedule of Investments
SMALLCAP World Fund®
Investment portfolio
March 31, 2018
Common stocks 92.65%
Consumer discretionary 17.68% | Shares | Value
(000) |
| Seria Co., Ltd.1 | 5,056,594 | $255,609 |
| Dollarama Inc. | 2,005,000 | 243,669 |
| GVC Holdings PLC2 | 18,141,694 | 233,975 |
| Lions Gate Entertainment Corp., Class A1 | 4,378,393 | 113,094 |
| Lions Gate Entertainment Corp., Class B1 | 3,790,393 | 91,273 |
| Domino’s Pizza, Inc. | 791,161 | 184,784 |
| Hilton Grand Vacations Inc.3 | 4,155,186 | 178,756 |
| Planet Fitness, Inc., Class A3 | 4,123,511 | 155,745 |
| Melco International Development Ltd.2 | 49,886,000 | 146,221 |
| ASOS PLC2,3 | 1,491,741 | 145,829 |
| TopBuild Corp.3 | 1,745,000 | 133,527 |
| At Home Group Inc.1,3 | 3,796,873 | 121,652 |
| Five Below, Inc.3 | 1,624,402 | 119,134 |
| MakeMyTrip Ltd., non-registered shares1,3 | 3,162,000 | 109,722 |
| MakeMyTrip Ltd., non-registered shares1,3,4 | 92,000 | 3,192 |
| Entertainment One Ltd.1,2 | 27,650,631 | 109,065 |
| Nien Made Enterprise Co., Ltd. | 11,148,000 | 107,247 |
| Evolution Gaming Group AB1,2 | 1,943,200 | 106,346 |
| Ocado Group PLC2,3 | 14,078,000 | 105,111 |
| zooplus AG, non-registered shares1,2,3 | 560,634 | 102,167 |
| Tailored Brands, Inc.1 | 3,939,100 | 98,714 |
| Cairn Homes PLC1,2,3 | 44,061,000 | 98,205 |
| Cedar Fair, LP | 1,496,000 | 95,564 |
| Ted Baker PLC1,2 | 2,671,897 | 93,999 |
| YOOX Net-A-Porter Group SPA2,3 | 2,020,000 | 93,979 |
| Domino’s Pizza Group PLC2 | 20,177,815 | 93,554 |
| Paddy Power Betfair PLC2 | 886,052 | 91,007 |
| Jumbo SA2 | 5,028,161 | 90,011 |
| Gentex Corp. | 3,909,134 | 89,988 |
| Beauty Community PCL, foreign registered | 129,665,000 | 88,323 |
| Strayer Education, Inc.1 | 845,750 | 85,463 |
| POYA International Co., Ltd.1 | 6,803,267 | 84,816 |
| Delta Corp Ltd.1,2 | 21,407,238 | 83,848 |
| Ace Hardware Indonesia Tbk PT2 | 855,750,000 | 82,778 |
| Endurance Technologies Ltd.2 | 4,213,890 | 82,040 |
| Moncler SpA2 | 2,120,000 | 80,814 |
| Sleep Country Canada Holdings Inc.1 | 3,011,968 | 79,741 |
| Caesars Entertainment Corp.3 | 6,811,460 | 76,629 |
| Belmond Ltd., Class A3 | 6,498,000 | 72,453 |
| Grand Canyon Education, Inc.3 | 690,400 | 72,437 |
| Despegar.com, Corp.3 | 2,049,312 | 64,041 |
| Countryside Properties PLC2 | 14,524,434 | 63,954 |
| Lennar Corp., Class A | 1,058,458 | 62,385 |
| Lennar Corp., Class B | 21,169 | 1,010 |
| Cie. Plastic Omnium SA2 | 1,295,995 | 62,111 |
| KB Home | 2,117,000 | 60,229 |
| Taiwan Paiho Ltd.1 | 20,561,000 | 58,530 |
SMALLCAP World Fund — Page 1 of 16
Common stocks
Consumer discretionary (continued) | Shares | Value
(000) |
| Estácio Participações SA, ordinary nominative | 5,425,000 | $57,405 |
| Ollie’s Bargain Outlet Holdings, Inc.3 | 915,000 | 55,175 |
| Maisons du Monde SA2 | 1,509,914 | 55,136 |
| Adtalem Global Education Inc.3 | 1,157,000 | 55,015 |
| Spin Master Corp., subordinate voting shares3 | 1,259,000 | 51,830 |
| Brunello Cucinelli SPA2 | 1,608,281 | 50,537 |
| Crompton Greaves Consumer Electricals Ltd.2 | 13,734,853 | 50,024 |
| Cyrela Brazil Realty SA, ordinary nominative | 10,719,600 | 49,595 |
| Tele Columbus AG2,3 | 4,429,000 | 47,831 |
| Kyoritsu Maintenance Co., Ltd. | 975,400 | 46,648 |
| ElringKlinger AG2 | 2,436,200 | 45,438 |
| Hyundai Wia Corp. | 845,073 | 43,843 |
| Dine Brands Global, Inc. | 638,021 | 41,841 |
| CVC Brasil Operadora e Agência de Viagens SA, ordinary nominative | 2,250,000 | 41,292 |
| Lands’ End, Inc.1,3 | 1,761,232 | 41,125 |
| Hostelworld Group PLC1,2 | 7,645,662 | 40,921 |
| Papa John’s International, Inc. | 714,000 | 40,912 |
| Momo.com Inc. | 4,244,000 | 39,446 |
| Signet Jewelers Ltd. | 1,000,000 | 38,520 |
| Eros International PLC, Class A3 | 3,282,638 | 35,781 |
| Eros International PLC, Class A3,5 | 216,500 | 2,360 |
| Texas Roadhouse, Inc. | 637,440 | 36,831 |
| TVS Motor Co Ltd.2 | 3,779,996 | 35,992 |
| Page Industries Ltd.2 | 102,500 | 35,865 |
| Cavco Industries, Inc.3 | 204,000 | 35,445 |
| Chow Sang Sang Holdings International Ltd.2 | 15,940,000 | 33,632 |
| JINS Inc. | 599,000 | 33,318 |
| Kindred Group PLC (SDR)2 | 2,410,000 | 32,922 |
| ServiceMaster Global Holdings, Inc.3 | 647,000 | 32,900 |
| AA PLC2 | 27,840,061 | 31,570 |
| Six Flags Entertainment Corp. | 500,000 | 31,130 |
| Greene King PLC2 | 4,696,350 | 31,054 |
| Zhongsheng Group Holdings Ltd.2 | 11,153,500 | 30,643 |
| Nifco Inc. | 893,200 | 30,464 |
| Samsonite International SA2 | 6,312,000 | 28,861 |
| Inchcape PLC2 | 2,951,460 | 28,610 |
| Newell Brands Inc. | 1,115,212 | 28,416 |
| Greggs PLC2 | 1,647,800 | 28,406 |
| Glenveagh Properties PLC2,3 | 20,115,000 | 27,529 |
| Century Communities, Inc.3 | 911,000 | 27,284 |
| Daily Mail and General Trust PLC, Class A, nonvoting2 | 2,971,000 | 26,919 |
| Cox & Kings Ltd.2 | 7,500,000 | 26,464 |
| Vail Resorts, Inc. | 116,753 | 25,884 |
| TAKKT AG2 | 1,122,278 | 25,560 |
| M.D.C. Holdings, Inc. | 895,860 | 25,012 |
| World Wrestling Entertainment, Inc., Class A | 672,000 | 24,199 |
| Aritzia Inc., subordinate voting shares3 | 2,572,172 | 24,077 |
| Stella International Holdings Ltd.2 | 18,041,000 | 24,055 |
| Melco Resorts & Entertainment Ltd. (ADR) | 800,000 | 23,184 |
| Dalata Hotel Group PLC2,3 | 2,929,000 | 22,383 |
| Ctrip.com International, Ltd. (ADR)3 | 464,000 | 21,632 |
| D.R. Horton, Inc. | 490,000 | 21,482 |
| Elang Mahkota Teknologi Tbk PT2 | 34,046,900 | 21,206 |
| Capella Education Co. | 227,423 | 19,865 |
| boohoo.com PLC2,3 | 9,233,250 | 19,227 |
SMALLCAP World Fund — Page 2 of 16
Common stocks
Consumer discretionary (continued) | Shares | Value
(000) |
| Tile Shop Holdings, Inc.1 | 3,158,000 | $18,948 |
| Installed Building Products, Inc.3 | 296,000 | 17,775 |
| HUGO BOSS AG2 | 195,848 | 17,064 |
| Cuckoo Homesys Co., Ltd.3 | 99,789 | 16,196 |
| Matahari Department Store Tbk PT2 | 19,189,100 | 15,337 |
| POLYTEC Holding AG, non-registered shares2 | 791,449 | 15,332 |
| PT Surya Citra Media Tbk2 | 73,600,000 | 14,554 |
| Lithia Motors, Inc., Class A | 143,000 | 14,374 |
| Canada Goose Holdings Inc. subordinated voting3 | 428,000 | 14,321 |
| Minor International PCL, nonvoting depositary receipt | 11,350,000 | 13,884 |
| BCA Marketplace PLC2 | 5,898,900 | 13,413 |
| Toll Brothers, Inc. | 300,000 | 12,975 |
| DO & CO AG, non-registered shares2 | 200,278 | 12,696 |
| Central European Media Enterprises Ltd., Class A3 | 2,971,800 | 12,482 |
| Shop Apotheke Europe NV, non-registered shares2,3 | 267,857 | 12,368 |
| Eclat Textile Co., Ltd. | 939,840 | 11,024 |
| William Hill PLC2 | 2,253,000 | 10,443 |
| Mulberry Group PLC2 | 953,963 | 10,361 |
| Cuckoo Holdings Co., Ltd. | 118,210 | 9,582 |
| L’Occitane International SA2 | 5,087,551 | 9,435 |
| Tiffany & Co. | 90,000 | 8,789 |
| BNN Technology PLC1,2,3,6 | 19,007,000 | 8,057 |
| Talwalkars Lifestyles Ltd.1,2,3,6 | 2,389,000 | 6,300 |
| Dustin Group AB2 | 598,491 | 5,314 |
| Kongsberg Automotive ASA2,3 | 4,550,000 | 5,212 |
| Wowprime Corp. | 1,036,000 | 4,584 |
| Talwalkars Better Value Fitness Ltd.1,2,6 | 2,389,000 | 2,568 |
| China Zenix Auto International Ltd. (ADR)3 | 2,152,000 | 2,367 |
| Valeo SA, non-registered shares2 | 34,753 | 2,297 |
| Zinc Media Group PLC2,3 | 343,900 | 2 |
| | | 7,073,491 |
| Health care 14.74% | | |
| Molina Healthcare, Inc.1,3 | 4,567,520 | 370,791 |
| Bluebird Bio, Inc.3 | 2,106,520 | 359,688 |
| Insulet Corp.1,3 | 3,770,600 | 326,836 |
| GW Pharmaceuticals PLC (ADR)1,3 | 2,250,346 | 253,547 |
| WuXi Biologics (Cayman) Inc.2,3 | 24,109,231 | 234,207 |
| Centene Corp.3 | 1,459,439 | 155,970 |
| Integra LifeSciences Holdings Corp.3 | 2,548,010 | 141,007 |
| Cotiviti Holdings, Inc.3 | 3,513,602 | 121,008 |
| Dechra Pharmaceuticals PLC2 | 3,260,018 | 120,142 |
| Diplomat Pharmacy, Inc.1,3 | 5,922,780 | 119,344 |
| DexCom, Inc.3 | 1,503,000 | 111,462 |
| Sysmex Corp. | 1,204,758 | 109,122 |
| Fleury SA, ordinary nominative | 13,176,000 | 108,205 |
| iRhythm Technologies, Inc.1,3 | 1,631,200 | 102,684 |
| China Biologic Products Holdings, Inc.3 | 1,249,600 | 101,218 |
| CONMED Corp.1 | 1,594,000 | 100,948 |
| WellCare Health Plans, Inc.3 | 513,000 | 99,332 |
| Fisher & Paykel Healthcare Corp. Ltd.2 | 10,114,580 | 97,239 |
| Ultragenyx Pharmaceutical Inc.3 | 1,775,970 | 90,557 |
| athenahealth, Inc.3 | 622,000 | 88,965 |
| Madrigal Pharmaceuticals, Inc.1,3 | 748,393 | 87,405 |
| Nakanishi Inc. | 4,172,700 | 84,920 |
SMALLCAP World Fund — Page 3 of 16
Common stocks
Health care (continued) | Shares | Value
(000) |
| Glaukos Corp.1,3 | 2,740,000 | $84,474 |
| ACADIA Pharmaceuticals Inc.3 | 3,603,000 | 80,959 |
| Galapagos NV2,3 | 803,989 | 80,596 |
| Haemonetics Corp.3 | 1,078,500 | 78,903 |
| Adaptimmune Therapeutics PLC (ADR)1,3 | 6,792,700 | 76,282 |
| Lifco AB, Class B2 | 1,984,000 | 76,253 |
| Genomma Lab Internacional, SAB de CV, Series B1,3 | 67,483,000 | 73,097 |
| Editas Medicine, Inc.3 | 2,184,000 | 72,400 |
| Wright Medical Group NV3 | 3,642,857 | 72,274 |
| PRA Health Sciences, Inc.3 | 870,506 | 72,217 |
| Vitrolife AB2 | 966,959 | 68,406 |
| Illumina, Inc.3 | 280,200 | 66,245 |
| Flexion Therapeutics, Inc.1,3 | 2,872,000 | 64,362 |
| NuVasive, Inc.3 | 1,166,000 | 60,877 |
| Evolent Health, Inc., Class A1,3 | 4,142,000 | 59,024 |
| Neurocrine Biosciences, Inc.3 | 688,000 | 57,056 |
| Sartorius AG, non-registered shares, nonvoting preferred2 | 395,000 | 55,185 |
| Osstem Implant Co., Ltd.1,3 | 1,078,621 | 53,734 |
| Incyte Corp.3 | 640,000 | 53,331 |
| Hikma Pharmaceuticals PLC2 | 2,841,100 | 48,150 |
| NuCana PLC (ADR)1,3 | 2,542,628 | 48,107 |
| CryoLife, Inc.1,3 | 2,157,251 | 43,253 |
| BioMarin Pharmaceutical Inc.3 | 531,500 | 43,089 |
| Tabula Rasa HealthCare, Inc.1,3 | 1,060,488 | 41,147 |
| Galenica AG2,3 | 775,075 | 40,937 |
| Ambu AS, Class B, non-registered shares2 | 1,705,000 | 38,661 |
| ImmunoGen, Inc.3 | 3,625,000 | 38,135 |
| Encompass Health Corp. | 663,000 | 37,904 |
| Natera, Inc.1,3 | 4,049,927 | 37,543 |
| Teleflex Inc. | 141,000 | 35,952 |
| Exact Sciences Corp.3 | 890,000 | 35,894 |
| Divi’s Laboratories Ltd.2 | 2,124,952 | 35,789 |
| Genmab A/S2,3 | 165,000 | 35,510 |
| Agios Pharmaceuticals, Inc.3 | 420,000 | 34,348 |
| Teladoc, Inc.3 | 825,000 | 33,248 |
| Capio AB2 | 6,542,608 | 33,107 |
| Abcam PLC2 | 1,900,000 | 33,036 |
| AnaptysBio, Inc.3 | 304,000 | 31,640 |
| CellaVision AB, non-registered shares1,2 | 1,908,123 | 31,454 |
| Eurofins Scientific SE, non-registered shares2 | 59,500 | 31,443 |
| Ironwood Pharmaceuticals, Inc., Class A3 | 2,030,000 | 31,323 |
| Penumbra, Inc.3 | 265,244 | 30,675 |
| QIAGEN NV2,3 | 932,871 | 30,126 |
| Hologic, Inc.3 | 800,000 | 29,888 |
| Brookdale Senior Living Inc.3 | 4,210,000 | 28,249 |
| Hypera SA, ordinary nominative | 2,556,500 | 27,972 |
| Gerresheimer AG, non-registered shares2 | 310,000 | 25,452 |
| Krka, dd, Novo mesto2 | 335,262 | 23,529 |
| Spark Therapeutics, Inc.3 | 346,020 | 23,041 |
| Pacific Biosciences of California, Inc.1,3 | 10,298,077 | 21,111 |
| Grifols, SA, Class B (ADR) | 616,400 | 13,068 |
| Grifols, SA, Class A, non-registered shares2 | 270,000 | 7,645 |
| Acerta Pharma BV2,3,4,6 | 195,556,815 | 20,709 |
| Alkem Laboratories Ltd.2 | 568,419 | 17,383 |
| Alnylam Pharmaceuticals, Inc.3 | 137,700 | 16,400 |
SMALLCAP World Fund — Page 4 of 16
Common stocks
Health care (continued) | Shares | Value
(000) |
| Nevro Corp.3 | 160,000 | $13,867 |
| Mesoblast Ltd.2,3 | 11,435,497 | 13,210 |
| Mesoblast Ltd. (ADR)3 | 80,000 | 462 |
| Intercept Pharmaceuticals, Inc.3 | 213,137 | 13,112 |
| NantKwest, Inc.3 | 1,887,290 | 7,342 |
| Xenon Pharmaceuticals Inc.1,3 | 1,429,000 | 7,002 |
| Mitra Keluarga Karyasehat Tbk PT2 | 44,798,500 | 6,805 |
| Seres Therapeutics, Inc.3 | 827,810 | 6,076 |
| Prothena Corp. PLC3 | 152,000 | 5,580 |
| Neovasc Inc. (CAD denominated)3 | 6,294,667 | 391 |
| Neovasc Inc.3 | 4,090,543 | 249 |
| | | 5,899,286 |
| Information technology 14.12% | | |
| RingCentral, Inc., Class A3 | 4,720,000 | 299,720 |
| AAC Technologies Holdings Inc.2 | 15,314,500 | 280,015 |
| Paycom Software, Inc.3 | 2,477,734 | 266,084 |
| Square, Inc., Class A3 | 3,284,830 | 161,614 |
| Mellanox Technologies, Ltd.3 | 2,204,000 | 160,561 |
| Qorvo, Inc.3 | 2,247,204 | 158,316 |
| MINDBODY, Inc., Class A3 | 3,400,000 | 132,260 |
| Zebra Technologies Corp., Class A3 | 949,300 | 132,133 |
| Vanguard International Semiconductor Corp. | 56,908,575 | 130,770 |
| ZPG PLC1,2 | 25,498,395 | 120,255 |
| EPAM Systems, Inc.3 | 1,020,994 | 116,924 |
| Alarm.Com Holdings, Inc.1,3 | 3,037,000 | 114,616 |
| Acacia Communications, Inc.1,3 | 2,958,740 | 113,793 |
| Halma PLC2 | 6,749,967 | 111,706 |
| Douzone Bizon Co., Ltd.1 | 2,049,408 | 111,324 |
| Talend SA (ADR)1,3 | 2,164,055 | 104,134 |
| WIN Semiconductors Corp. | 9,641,358 | 103,996 |
| VTech Holdings Ltd.2 | 7,858,500 | 99,495 |
| Globant SA1,3 | 1,791,487 | 92,333 |
| InterXion Holding NV, non-registered shares3 | 1,440,000 | 89,438 |
| Inphi Corp.1,3 | 2,970,199 | 89,403 |
| Mitel Networks Corp.1,3 | 9,542,253 | 88,552 |
| Cloudera, Inc.3 | 4,033,000 | 87,032 |
| Lumentum Holdings Inc.3 | 1,352,100 | 86,264 |
| Topcon Corp. | 4,387,510 | 85,623 |
| MercadoLibre, Inc. | 238,100 | 84,856 |
| Wix.com Ltd.3 | 1,036,000 | 82,414 |
| SPS Commerce, Inc.1,3 | 1,159,000 | 74,257 |
| eMemory Technology Inc.1 | 6,146,000 | 73,355 |
| Yext, Inc.1,3 | 5,727,067 | 72,447 |
| Hamamatsu Photonics KK | 1,916,930 | 72,405 |
| Quotient Technology Inc.1,3 | 5,311,667 | 69,583 |
| Cree, Inc.3 | 1,661,914 | 66,992 |
| Coupa Software Inc.3 | 1,351,000 | 61,633 |
| Yandex NV, Class A3 | 1,530,000 | 60,358 |
| CDW Corp. | 850,000 | 59,764 |
| TravelSky Technology Ltd., Class H2 | 19,960,000 | 58,475 |
| Takeaway.com NV2,3 | 1,090,000 | 57,990 |
| SUNeVision Holdings Ltd.2 | 89,854,000 | 57,163 |
| Versum Materials, Inc. | 1,429,190 | 53,780 |
| Nemetschek SE2 | 457,800 | 51,344 |
SMALLCAP World Fund — Page 5 of 16
Common stocks
Information technology (continued) | Shares | Value
(000) |
| Dolby Laboratories, Inc., Class A | 800,000 | $50,848 |
| COLOPL, Inc. | 5,787,000 | 50,350 |
| Siltronic AG2,3 | 294,000 | 50,311 |
| Moneysupermarket.com Group PLC2 | 12,483,000 | 50,221 |
| Alteryx, Inc., Class A3 | 1,444,433 | 49,313 |
| Integrated Device Technology, Inc.3 | 1,588,000 | 48,529 |
| Ascom Holding AG1,2 | 2,226,000 | 47,301 |
| AIXTRON SE2,3 | 2,434,518 | 47,047 |
| Autodesk, Inc.3 | 360,000 | 45,209 |
| CANCOM SE, non-registered shares2 | 425,000 | 43,790 |
| MACOM Technology Solutions Holdings, Inc.3 | 2,541,000 | 42,181 |
| Viavi Solutions Inc.3 | 4,303,000 | 41,825 |
| Cognex Corp. | 800,000 | 41,592 |
| X-FAB Silicon Foundries SE2,3 | 3,766,519 | 40,660 |
| Cypress Semiconductor Corp. | 2,200,000 | 37,312 |
| Bravura Solutions Ltd.1,2 | 17,125,000 | 35,854 |
| Okta, Inc., Class A3 | 827,500 | 32,976 |
| TEMENOS Group AG (Switzerland)2 | 270,000 | 32,385 |
| Silicon Laboratories Inc.3 | 341,000 | 30,656 |
| Trimble Inc.3 | 840,000 | 30,139 |
| ASM Pacific Technology Ltd.2 | 2,071,800 | 29,320 |
| Finisar Corp.3 | 1,813,000 | 28,664 |
| Zillow Group, Inc., Class C, nonvoting3 | 525,000 | 28,245 |
| istyle Inc. | 1,816,000 | 25,304 |
| Semtech Corp.3 | 620,000 | 24,211 |
| BlackLine, Inc.3 | 595,000 | 23,330 |
| Datalex PLC1,2 | 6,106,000 | 22,045 |
| Megaport Ltd.1,2,3 | 7,476,000 | 21,574 |
| Cray Inc.3 | 1,022,300 | 21,162 |
| OBIC Co., Ltd. | 248,000 | 20,622 |
| RIB Software SE2 | 927,000 | 19,756 |
| Gogo Inc.3 | 2,220,000 | 19,159 |
| II-VI, Inc.3 | 440,000 | 17,996 |
| TOTVS SA, ordinary nominative | 2,000,000 | 17,435 |
| YY Inc., Class A (ADR)3 | 134,000 | 14,097 |
| Ultimate Software Group, Inc.3 | 55,700 | 13,574 |
| GoldMoney Inc.1,3 | 4,931,100 | 12,898 |
| Veeco Instruments Inc.3 | 600,000 | 10,200 |
| Matrimony.com Ltd.2,3 | 798,621 | 9,279 |
| Nissha Co., Ltd. | 335,000 | 8,980 |
| iEnergizer Ltd.2,3 | 7,650,500 | 6,864 |
| AGTech Holdings Ltd.2,3 | 55,220,000 | 6,641 |
| Ribbon Communications Inc.3 | 737,085 | 3,759 |
| Tobii AB2,3 | 413,797 | 1,597 |
| Xurpas Inc.2 | 16,004,200 | 1,127 |
| | | 5,649,515 |
| Industrials 13.10% | | |
| Kirby Corp.3 | 2,195,000 | 168,905 |
| MonotaRO Co., Ltd. | 4,374,300 | 157,003 |
| NIBE Industrier AB, Class B2 | 15,558,453 | 147,160 |
| Nihon M&A Center Inc. | 4,271,180 | 146,881 |
| Rexnord Corp.3 | 4,430,000 | 131,482 |
| IDEX Corp. | 875,000 | 124,696 |
| Aalberts Industries NV, non-registered shares2 | 2,420,000 | 123,511 |
SMALLCAP World Fund — Page 6 of 16
Common stocks
Industrials (continued) | Shares | Value
(000) |
| TechnoPro Holdings, Inc.1 | 2,036,000 | $122,623 |
| Wizz Air Holdings PLC2,3 | 2,630,000 | 120,189 |
| Loomis AB, Class B2 | 3,239,042 | 116,459 |
| Bravida Holding AB1,2 | 15,895,198 | 113,584 |
| Spirax-Sarco Engineering PLC2 | 1,344,000 | 108,552 |
| IMCD NV2 | 1,740,000 | 107,049 |
| King Slide Works Co., Ltd.1 | 7,623,765 | 105,897 |
| Watsco, Inc. | 560,000 | 101,343 |
| Continental Building Products, Inc.1,3 | 3,330,700 | 95,091 |
| Johnson Electric Holdings Ltd.2 | 24,327,375 | 91,550 |
| NORMA Group SE, non-registered shares2 | 1,194,339 | 89,449 |
| Nolato AB, Class B2 | 1,192,149 | 86,895 |
| BELIMO Holding AG2 | 21,330 | 86,257 |
| Kratos Defense & Security Solutions, Inc.1,3 | 8,262,000 | 85,016 |
| Allegiant Travel Co. | 487,500 | 84,118 |
| Rheinmetall AG2 | 591,000 | 83,995 |
| ABM Industries Inc. | 2,306,400 | 77,218 |
| Curtiss-Wright Corp. | 534,631 | 72,213 |
| Grupo Aeroportuario del Pacífico SAB de CV | 7,227,429 | 71,384 |
| GIMA TT SpA2,3 | 3,187,048 | 68,131 |
| XP Power Ltd.1,2 | 1,488,000 | 66,607 |
| Oshkosh Corp. | 860,000 | 66,452 |
| Fluidra, SA, non-registered shares2 | 3,894,063 | 66,221 |
| Masco Corp. | 1,625,000 | 65,715 |
| Grafton Group PLC, units2 | 6,031,000 | 65,163 |
| Air Lease Corp., Class A | 1,493,000 | 63,632 |
| Graco Inc. | 1,374,000 | 62,819 |
| Nabtesco Corp. | 1,626,861 | 62,748 |
| Welbilt Inc.3 | 3,210,000 | 62,434 |
| Waste Connections, Inc. | 840,000 | 60,262 |
| Tsubaki Nakashima Co., Ltd.1 | 2,307,800 | 59,760 |
| TransDigm Group Inc. | 190,000 | 58,319 |
| Havells India Ltd.2 | 7,671,266 | 57,850 |
| Rockwool International A/S, Class B2 | 188,600 | 56,106 |
| Nexans SA2 | 1,049,000 | 54,297 |
| Spirit Airlines, Inc.3 | 1,382,000 | 52,212 |
| Fujitec Co., Ltd. | 3,916,000 | 51,512 |
| Barrett Business Services, Inc.1 | 580,000 | 48,070 |
| Boyd Group Income Fund | 591,300 | 47,813 |
| Generac Holdings Inc.3 | 1,019,500 | 46,805 |
| Cía. de Distribución Integral Logista Holdings, SA, non-registered shares2 | 2,164,434 | 45,837 |
| American Airlines Group Inc. | 872,000 | 45,309 |
| Stabilus SA, non-registered shares2 | 470,657 | 44,952 |
| Matson, Inc. | 1,503,000 | 43,046 |
| Elementia, SAB de CV3 | 38,884,118 | 42,611 |
| Takeuchi Mfg. Co., Ltd. | 1,780,000 | 39,721 |
| JELD-WEN Holding, Inc.3 | 1,281,000 | 39,224 |
| Amara Raja Batteries Ltd.2 | 3,118,756 | 38,502 |
| Befesa SA2,3 | 725,000 | 37,519 |
| Meggitt PLC2 | 6,103,934 | 36,994 |
| CoStar Group, Inc.3 | 100,000 | 36,268 |
| VARTA AG, non-registered shares2,3 | 1,500,000 | 35,090 |
| R.R. Donnelley & Sons Co.1 | 3,981,489 | 34,758 |
| Coor Service Management Holding AB2 | 4,285,759 | 34,293 |
| BWX Technologies, Inc. | 487,233 | 30,954 |
SMALLCAP World Fund — Page 7 of 16
Common stocks
Industrials (continued) | Shares | Value
(000) |
| Kingspan Group PLC2 | 724,000 | $30,684 |
| Harmonic Drive Systems Inc. | 529,100 | 30,375 |
| USG Corp.3 | 689,912 | 27,886 |
| Landstar System, Inc. | 251,819 | 27,612 |
| LT Group, Inc.2 | 76,014,300 | 27,396 |
| Flughafen Zürich AG2 | 119,000 | 26,258 |
| Aeroflot - Russian Airlines PJSC | 8,750,000 | 23,764 |
| Europcar Groupe SA2 | 2,131,000 | 23,711 |
| Carborundum Universal Ltd.2 | 4,365,000 | 23,418 |
| REV Group, Inc. | 1,126,938 | 23,395 |
| BBA Aviation PLC2 | 5,195,000 | 23,372 |
| Alliance Global Group, Inc.2,3 | 90,704,100 | 23,014 |
| AKR Corporindo Tbk PT2 | 54,603,300 | 22,594 |
| Embraer SA, ordinary nominative | 3,085,000 | 20,117 |
| KeyW Holding Corp.1,3 | 2,536,400 | 19,936 |
| Grupo Aeroportuario del Centro Norte, SAB de CV, Series B | 4,022,899 | 19,609 |
| J. Kumar Infraprojects Ltd.1,2 | 4,450,500 | 18,726 |
| Kornit Digital Ltd.3 | 1,400,000 | 18,060 |
| Teleperformance SE2 | 116,247 | 18,032 |
| Bossard Holding AG2 | 85,062 | 17,498 |
| va-Q-tec AG1,2,3 | 784,000 | 17,085 |
| Alfen NV1,2,3 | 1,275,000 | 15,683 |
| PayPoint PLC2 | 1,220,000 | 13,647 |
| Talgo SA, non-registered shares2,3 | 1,910,000 | 12,353 |
| BMC Stock Holdings, Inc.3 | 579,222 | 11,324 |
| Briggs & Stratton Corp. | 500,000 | 10,705 |
| International Container Terminal Services, Inc.2 | 5,250,000 | 10,086 |
| Sweco AB, Class B, non-registered shares2 | 425,000 | 8,776 |
| Indutrade AB2 | 310,000 | 8,014 |
| Troax Group AB2 | 275,000 | 7,764 |
| Intrum Justitia AB2 | 245,000 | 6,942 |
| Douglas Dynamics, Inc. | 140,000 | 6,069 |
| | | 5,240,431 |
| Financials 11.92% | | |
| Kotak Mahindra Bank Ltd.2 | 18,292,040 | 296,660 |
| Essent Group Ltd.1,3 | 6,075,535 | 258,575 |
| Radian Group Inc. | 9,680,000 | 184,307 |
| Webster Financial Corp. | 3,201,922 | 177,387 |
| CenterState Bank Corp.1 | 6,069,250 | 161,017 |
| SVB Financial Group3 | 652,500 | 156,607 |
| Grupo Supervielle SA, Class B (ADR) | 4,912,000 | 149,030 |
| MarketAxess Holdings Inc. | 660,000 | 143,510 |
| Bajaj Finance Ltd.2 | 5,237,160 | 143,376 |
| Texas Capital Bancshares, Inc.3 | 1,507,817 | 135,553 |
| RenaissanceRe Holdings Ltd. | 883,000 | 122,304 |
| Financial Engines, Inc. | 3,137,000 | 109,795 |
| VZ Holding AG2 | 396,550 | 107,485 |
| First Republic Bank | 1,141,825 | 105,744 |
| M&A Capital Partners Co., Ltd.1,3 | 1,146,300 | 97,042 |
| Capitec Bank Holdings Ltd.2 | 1,291,983 | 95,168 |
| Cannae Holdings, Inc.1,3 | 4,895,000 | 92,320 |
| Third Point Reinsurance Ltd.1,3 | 6,147,821 | 85,762 |
| Great Western Bancorp, Inc. | 2,074,703 | 83,548 |
| NMI Holdings, Inc.1,3 | 5,036,127 | 83,348 |
SMALLCAP World Fund — Page 8 of 16
Common stocks
Financials (continued) | Shares | Value
(000) |
| Umpqua Holdings Corp. | 3,785,500 | $81,048 |
| MGIC Investment Corp.3 | 6,136,039 | 79,769 |
| GRUH Finance Ltd.2 | 8,560,000 | 76,072 |
| FCB Financial Holdings, Inc., Class A3 | 1,476,000 | 75,424 |
| GT Capital Holdings, Inc.2 | 3,281,095 | 73,886 |
| Metro Bank PLC2,3 | 1,496,528 | 73,777 |
| Avanza Bank Holding AB2 | 1,392,768 | 73,695 |
| Close Brothers Group PLC2 | 3,630,476 | 73,136 |
| Chemical Financial Corp. | 1,332,450 | 72,858 |
| Trupanion, Inc.1,3 | 2,410,200 | 72,041 |
| Unione di Banche Italiane SPA2 | 13,773,000 | 63,026 |
| Eagle Bancorp, Inc.3 | 981,000 | 58,713 |
| City Union Bank Ltd.2 | 21,957,338 | 58,474 |
| EFG International AG2 | 6,785,929 | 54,339 |
| Cholamandalam Investment and Finance Co., Ltd.2 | 2,298,000 | 51,302 |
| Shriram Transport Finance Co. Ltd.2 | 2,245,000 | 49,798 |
| The Bank of N.T. Butterfield & Son Ltd. | 1,065,000 | 47,797 |
| White Mountains Insurance Group, Ltd. | 51,800 | 42,607 |
| KKR Real Estate Finance Trust Inc. REIT | 2,118,600 | 42,499 |
| Cathay General Bancorp, Inc. | 1,000,000 | 39,980 |
| Janus Henderson Group PLC | 1,200,041 | 39,709 |
| Redwood Trust, Inc. REIT | 2,562,000 | 39,634 |
| TPG Pace Energy Holdings Corp., Class A1,2,3,5 | 4,000,000 | 39,227 |
| Waddell & Reed Financial, Inc., class A | 1,850,000 | 37,389 |
| Legg Mason Partners Equity Fund | 915,285 | 37,206 |
| Moelis & Co., Class A | 719,000 | 36,561 |
| Bharat Financial Inclusion Ltd.2,3 | 1,865,000 | 31,650 |
| Boston Private Financial Holdings, Inc. | 1,978,177 | 29,772 |
| Numis Corp. PLC1,2 | 5,663,282 | 29,012 |
| Indiabulls Housing Finance Ltd.2 | 1,500,000 | 28,909 |
| Eurobank Ergasias SA2,3 | 29,592,819 | 28,233 |
| Deutsche Pfandbriefbank AG, non-registered shares2 | 1,760,070 | 27,742 |
| Republic First Bancorp, Inc.1,3 | 3,187,000 | 27,727 |
| Mercury General Corp. | 600,000 | 27,522 |
| First Hawaiian, Inc. | 918,185 | 25,553 |
| Artisan Partners Asset Management Inc., Class A | 705,000 | 23,477 |
| Signature Bank3 | 157,800 | 22,400 |
| Greenhill & Co., Inc. | 1,169,700 | 21,639 |
| Moscow Exchange MICEX-RTS PJSC | 9,271,525 | 18,934 |
| PacWest Bancorp | 354,149 | 17,541 |
| ICRA Ltd.2 | 291,264 | 16,334 |
| Permanent TSB Group Holdings PLC2,3 | 6,457,000 | 15,906 |
| Inversiones La Construcción SA | 790,000 | 15,535 |
| PSG Group Ltd.2 | 756,875 | 14,405 |
| Bank of Ireland Group PLC2,3 | 1,515,227 | 13,214 |
| Bank of Hawaii Corp. | 137,443 | 11,422 |
| Pzena Investment Management, Inc. | 860,808 | 9,581 |
| Habib Bank Ltd. | 5,000,000 | 9,192 |
| Cowen Inc., Class A3 | 640,000 | 8,448 |
| HarborOne Bancorp, Inc.3 | 467,794 | 8,261 |
| National Bank of Pakistan | 18,295,000 | 7,936 |
| IRB Brasil Resseguros SA | 252,734 | 3,201 |
| | | 4,772,051 |
SMALLCAP World Fund — Page 9 of 16
Common stocks
Consumer staples 5.47% | Shares | Value
(000) |
| Emmi AG1,2 | 289,300 | $237,166 |
| Raia Drogasil SA, ordinary nominative | 7,527,574 | 170,377 |
| Morinaga & Co., Ltd.1 | 3,667,600 | 161,446 |
| Lion Corp. | 6,887,000 | 138,672 |
| Ariake Japan Co., Ltd. | 1,607,000 | 128,645 |
| a2 Milk Co. Ltd.2,3 | 14,035,000 | 124,770 |
| Pinnacle Foods Inc. | 1,939,050 | 104,903 |
| Dis-Chem Pharmacies Ltd.2 | 34,627,650 | 100,941 |
| Milbon Co., Ltd.1 | 1,986,200 | 87,805 |
| Varun Beverages Ltd.2 | 6,884,988 | 67,022 |
| COSMOS Pharmaceutical Corp. | 313,153 | 63,525 |
| Sugi Holdings Co., Ltd. | 1,142,000 | 63,200 |
| Treasury Wine Estates Ltd.2 | 4,840,000 | 63,184 |
| Simply Good Foods Co., Class A1,3 | 4,420,000 | 60,687 |
| CCL Products (India) Ltd.1,2 | 10,642,173 | 45,764 |
| Century Pacific Food, Inc.2 | 133,438,000 | 43,809 |
| CLIO Cosmetics Co., Ltd.1 | 1,268,099 | 39,736 |
| Davide Campari-Milano SpA2 | 5,200,000 | 39,398 |
| GRUMA, SAB de CV, Series B | 3,370,000 | 38,647 |
| e.l.f. Beauty, Inc.3 | 1,905,327 | 36,906 |
| Fresh Del Monte Produce Inc. | 755,000 | 34,156 |
| BWX Ltd.1,2 | 9,060,280 | 33,942 |
| Herbalife Ltd.3 | 275,000 | 26,804 |
| Philip Morris CR AS2 | 32,000 | 26,612 |
| PriceSmart, Inc. | 290,812 | 24,297 |
| Kernel Holding SA2 | 1,642,578 | 24,042 |
| Stock Spirits Group PLC2 | 6,404,674 | 22,315 |
| Emperador Inc.2,3 | 135,870,000 | 19,397 |
| Greencore Group PLC2 | 9,815,000 | 18,243 |
| KWS Saat SE, non registered shares2 | 46,500 | 18,071 |
| Coca-Cola Icecek AS, Class C | 1,903,000 | 17,318 |
| Avenue Supermarts Ltd.2,3 | 834,000 | 17,045 |
| Farmer Bros. Co.3 | 550,000 | 16,610 |
| Prataap Snacks Ltd. (dba Yellow Diamond)2,3 | 786,300 | 15,727 |
| Del Monte Pacific Ltd.2 | 62,850,314 | 11,257 |
| Hyundai Department Store Co., Ltd. | 129,573 | 11,257 |
| Lenta Ltd. (GDR)2,3 | 1,222,000 | 7,277 |
| Lenta Ltd. (GDR)2,3,5 | 530,900 | 3,162 |
| Delfi Ltd.2 | 9,182,500 | 10,293 |
| R.E.A. Holdings PLC1,2,3 | 2,162,000 | 9,365 |
| Nomad Foods Ltd.3 | 400,000 | 6,296 |
| | | 2,190,089 |
| Materials 4.83% | | |
| Hudbay Minerals Inc.1 | 18,856,137 | 133,474 |
| Lundin Mining Corp. | 17,349,400 | 113,786 |
| James Hardie Industries PLC (CDI)2 | 6,355,000 | 112,229 |
| Sirius Minerals PLC1,2,3 | 247,367,560 | 105,479 |
| Scapa Group PLC1,2 | 12,183,326 | 83,857 |
| Supreme Industries Ltd.2 | 4,537,805 | 83,529 |
| Century Aluminum Co.1,3 | 4,868,000 | 80,517 |
| Stella-Jones Inc. | 2,128,500 | 75,185 |
| Royal Gold, Inc. | 784,000 | 67,322 |
| Dalmia Bharat Ltd.2 | 1,429,682 | 63,841 |
| Boral Ltd.2 | 9,965,000 | 57,306 |
SMALLCAP World Fund — Page 10 of 16
Common stocks
Materials (continued) | Shares | Value
(000) |
| Chr. Hansen Holding A/S2 | 622,000 | $53,725 |
| Valvoline Inc. | 2,394,000 | 52,979 |
| ACC Ltd.2 | 2,254,090 | 52,296 |
| Clearwater Paper Corp.1,3 | 1,315,800 | 51,448 |
| PolyOne Corp. | 1,209,000 | 51,407 |
| CCL Industries Inc., Class B, nonvoting | 1,000,000 | 50,481 |
| Venator Materials PLC3 | 2,640,000 | 47,758 |
| Mayr-Melnhof Karton AG, non-registered shares2 | 292,300 | 44,328 |
| Allegheny Technologies Inc.3 | 1,644,500 | 38,942 |
| Navin Fluorine International Ltd.1,2 | 3,202,000 | 38,197 |
| Buzzi Unicem SPA2 | 1,603,058 | 37,557 |
| Platform Specialty Products Corp.3 | 3,546,907 | 34,157 |
| Wienerberger AG2 | 1,156,000 | 28,928 |
| Mayur Uniquoters Ltd.1,2 | 3,660,000 | 26,985 |
| Croda International PLC2 | 407,448 | 26,124 |
| KOLON Industries, Inc. | 382,500 | 24,187 |
| Arkema SA2 | 182,500 | 23,824 |
| Kenmare Resources PLC1,2,3 | 7,124,863 | 22,603 |
| CPMC Holdings Ltd.2 | 31,700,000 | 20,669 |
| Ingevity Corp.3 | 272,000 | 20,044 |
| Steel Dynamics, Inc. | 443,700 | 19,620 |
| OCI NV2,3 | 804,000 | 18,610 |
| Indorama Ventures PCL, foreign registered | 10,114,000 | 18,517 |
| Symrise AG2 | 227,500 | 18,312 |
| LANXESS AG2 | 213,040 | 16,329 |
| BlueJay Mining PLC1,2,3 | 45,009,091 | 15,421 |
| HEXPOL AB, Class B2 | 1,395,000 | 12,918 |
| Hummingbird Resources PLC1,2,3 | 27,459,300 | 12,711 |
| Excelsior Mining Corp.1,2,3,5 | 12,868,000 | 12,656 |
| Mountain Province Diamonds Inc.3 | 4,964,264 | 12,330 |
| Wacker Chemie AG2 | 73,500 | 12,073 |
| Bacanora Lithium PLC1,2,3 | 8,573,925 | 11,057 |
| Danakali Ltd.1,2,3 | 16,700,000 | 8,962 |
| Essentra PLC2 | 1,270,675 | 7,556 |
| Kennady Diamonds Inc.3 | 2,557,952 | 6,055 |
| Dalradian Resources Inc.3 | 4,000,000 | 2,980 |
| Rusoro Mining Ltd.3 | 21,437,000 | 1,248 |
| S H Kelkar and Co. Ltd.2 | 143,528 | 574 |
| | | 1,931,093 |
| Energy 2.94% | | |
| Centennial Resource Development, Inc., Class A3,5 | 6,267,761 | 115,013 |
| Centennial Resource Development, Inc., Class A3 | 262,782 | 4,822 |
| Diamondback Energy, Inc.3 | 947,000 | 119,814 |
| Whitecap Resources Inc. | 12,257,954 | 74,971 |
| Whitecap Resources Inc.2,5 | 2,970,000 | 17,892 |
| Petronet LNG Ltd.2 | 22,920,000 | 81,645 |
| SM Energy Co. | 3,439,000 | 62,005 |
| Kosmos Energy Ltd.3 | 9,253,000 | 58,294 |
| Seven Generations Energy Ltd., Class A3 | 4,675,000 | 58,057 |
| Extraction Oil & Gas, Inc.3 | 4,745,000 | 54,378 |
| WorleyParsons Ltd.2 | 4,798,172 | 53,416 |
| Parsley Energy, Inc., Class A3 | 1,707,200 | 49,492 |
| Concho Resources Inc.3 | 279,500 | 42,017 |
| Peyto Exploration & Development Corp. | 4,953,836 | 41,525 |
SMALLCAP World Fund — Page 11 of 16
Common stocks
Energy (continued) | Shares | Value
(000) |
| Nine Energy Service, Inc.1,3 | 1,472,900 | $35,865 |
| Hurricane Energy PLC2,3 | 68,881,650 | 31,271 |
| Tullow Oil PLC2,3 | 10,271,173 | 28,275 |
| Tidewater Midstream and Infrastructure Ltd.1 | 24,334,000 | 26,253 |
| Savannah Petroleum PLC1,2,3 | 65,357,000 | 25,970 |
| Keyera Corp. | 952,400 | 24,771 |
| Source Energy Services Ltd.1,3 | 4,938,235 | 19,049 |
| RSP Permian, Inc.3 | 400,000 | 18,752 |
| Golar LNG Ltd. | 628,092 | 17,185 |
| Venture Global LNG, Inc., Series C2,3,4,5,6 | 4,240 | 15,989 |
| Ophir Energy PLC2,3 | 20,517,000 | 15,146 |
| San Leon Energy PLC1,2,3,6 | 32,348,000 | 11,200 |
| Independence Contract Drilling, Inc.1,3 | 2,924,757 | 11,056 |
| Lekoil Ltd. (CDI)1,2,3 | 42,922,391 | 10,630 |
| Pilipinas Shell Petroleum Corp.2 | 9,991,110 | 10,440 |
| Gulf Keystone Petroleum Ltd.2,3 | 5,027,150 | 9,165 |
| Tourmaline Oil Corp. | 410,000 | 6,953 |
| BNK Petroleum Inc.1,3 | 12,804,914 | 5,963 |
| Sterling Resources Ltd.1 | 34,775,000 | 5,533 |
| Amerisur Resources PLC2,3 | 25,204,200 | 5,445 |
| Providence Resources PLC1,2,3 | 35,235,000 | 5,381 |
| Africa Oil Corp.2,3 | 1,701,357 | 1,588 |
| African Petroleum Corp. Ltd.2,3 | 976,507 | 107 |
| | | 1,175,328 |
| Real estate 1.42% | | |
| WHA Corp. PCL1 | 1,145,170,900 | 136,966 |
| MGM Growth Properties LLC REIT, Class A1 | 4,196,487 | 111,375 |
| Purplebricks Group PLC1,2,3 | 21,454,500 | 94,533 |
| Hibernia REIT PLC REIT2 | 27,060,000 | 48,059 |
| Inmobiliaria Colonial Socimi SA REIT2 | 2,808,000 | 32,482 |
| Gaming and Leisure Properties, Inc. REIT | 800,000 | 26,776 |
| K. Wah International Holdings Ltd.2 | 33,743,028 | 22,692 |
| Mahindra Lifespace Developers Ltd.1,2 | 2,696,725 | 18,396 |
| BR Properties SA, ordinary nominative | 6,352,700 | 17,377 |
| OUTFRONT Media Inc. REIT | 860,153 | 16,119 |
| Fibra Uno Administración, SA de CV REIT | 8,860,744 | 13,330 |
| São Carlos Empreendimentos e Participações S.A | 1,075,400 | 12,252 |
| Prologis Property Mexico, SA de CV REIT | 5,043,902 | 9,640 |
| Soundwill Holdings Ltd.2 | 3,413,500 | 6,349 |
| Morguard Corp. | 23,400 | 3,084 |
| | | 569,430 |
| Utilities 0.78% | | |
| ENN Energy Holdings Ltd.2 | 12,061,000 | 108,168 |
| REN - Redes Energéticas Nacionais, SGPS, SA, non-registered shares2 | 25,626,725 | 79,089 |
| Pampa Energía SA (ADR)3 | 862,400 | 51,399 |
| EDP - Energias do Brasil SA | 9,404,000 | 37,874 |
| Northland Power Inc. | 1,100,000 | 19,645 |
| Energy World Corp. Ltd.2,3 | 50,606,000 | 11,409 |
| Mytrah Energy Ltd.1,2,3 | 10,418,000 | 4,126 |
| | | 311,710 |
SMALLCAP World Fund — Page 12 of 16
Common stocks
Telecommunication services 0.76% | Shares | Value
(000) |
| Iridium Communications Inc.1,3 | 7,252,388 | $81,589 |
| Iridium Communications Inc.1,3,5 | 636,132 | 7,157 |
| Play Communications SA, non-registered shares2,3 | 5,517,000 | 53,575 |
| HKBN Ltd.2 | 36,225,500 | 42,791 |
| Tower Bersama Infrastructure Tbk PT2 | 77,125,000 | 31,348 |
| TalkTalk Telecom Group PLC2 | 16,088,205 | 26,168 |
| Cogent Communications Holdings, Inc. | 565,000 | 24,521 |
| Com Hem Holding AB2 | 834,000 | 13,491 |
| Indosat Tbk PT2 | 38,200,000 | 13,190 |
| Zegona Communications PLC1,2 | 7,911,786 | 11,368 |
| | | 305,198 |
| Miscellaneous 4.89% | | |
| Other common stocks in initial period of acquisition | | 1,958,745 |
| Total common stocks (cost: $25,550,257,000) | | 37,076,367 |
Preferred securities 0.10%
Consumer discretionary 0.10% | | |
| Made.Com Design Ltd., Series C-4, preferred shares2,3,4,6 | 2,067,967 | 42,054 |
| Consumer staples 0.00% | | |
| R.E.A. Holdings PLC 9.00%1 | 96,000 | 150 |
| Total preferred securities (cost: $41,513,000) | | 42,204 |
Rights & warrants 0.01%
Real estate 0.01% | | |
| WHA Corp. PCL, warrants, expire 20201,3 | 4,461,730 | 1,091 |
| Information technology 0.00% | | |
| Foursquare Labs, Inc., warrants, expire 20332,3,4,6 | 1,163,990 | 975 |
| Energy 0.00% | | |
| Savannah Petroleum PLC, warrants, expire 20191,2,3 | 21,698,000 | 824 |
| Health care 0.00% | | |
| Neovasc Inc., Class C, warrants, expire 20192,3 | 808,489 | 1 |
| Neovasc Inc., Class B, warrants, expire 20192,3 | 1,783,998 | 1 |
| Neovasc Inc., Class A, warrants, expire 20222,3 | 2,020,548 | —7 |
| | | 2 |
| Total rights & warrants (cost: $0) | | 2,892 |
SMALLCAP World Fund — Page 13 of 16
Convertible stocks 0.35%
Health care 0.19% | Shares | Value
(000) |
| Proteus Digital Health, Inc., Series G, convertible preferred2,4,6 | 3,044,139 | $42,527 |
| Allakos Inc., Series B, 8.00% noncumulative1,2,4,6 | 2,522,736 | 20,000 |
| Rubius Therapeutics, Inc., Series C, convertible preferred2,4,6 | 1,172,792 | 15,000 |
| | | 77,527 |
| Information technology 0.16% | | |
| DocuSign, Inc., Series E, convertible preferred2,4,6 | 1,236,304 | 41,206 |
| DocuSign, Inc., Series B, convertible preferred2,4,6 | 66,593 | 2,220 |
| DocuSign, Inc., Series D, convertible preferred2,4,6 | 47,810 | 1,593 |
| DocuSign, Inc., Series B1, convertible preferred2,4,6 | 19,947 | 665 |
| Domo, Inc., Series D-2, convertible preferred2,4,6 | 2,965,036 | 13,461 |
| Foursquare Labs, Inc., Series D, convertible preferred2,4,6 | 1,551,988 | 6,225 |
| | | 65,370 |
| Total convertible stocks (cost: $138,000,000) | | 142,897 |
Convertible bonds 0.05%
Consumer discretionary 0.05% | Principal amount
(000) | |
| Caesars Entertainment Corp. 5.00% 2024 | $11,061 | 19,336 |
| Total convertible bonds (cost: $21,242,000) | | 19,336 |
Bonds, notes & other debt instruments 0.06%
U.S. Treasury bonds & notes 0.06%
U.S. Treasury 0.06% | | |
| U.S. Treasury 0.875% 20188 | 25,000 | 24,934 |
| Total U.S. Treasury bonds & notes | | 24,934 |
| Total bonds, notes & other debt instruments (cost: $24,951,000) | | 24,934 |
| Short-term securities 6.88% | | |
| Bank of Nova Scotia 2.22% due 6/15/20185 | 77,300 | 76,944 |
| Bank of Tokyo-Mitsubishi UFJ, Ltd. 1.74% due 4/18/2018 | 56,200 | 56,144 |
| Canadian Imperial Bank of Commerce 1.66%–1.69% due 4/4/2018��4/6/20185 | 196,100 | 196,035 |
| Chevron Corp. 1.85% due 4/20/20185 | 6,000 | 5,993 |
| Commonwealth Bank of Australia 1.92%–2.04% due 4/19/2018–5/24/20185 | 128,400 | 128,201 |
| CPPIB Capital Inc. 1.70%–1.80% due 4/6/2018–4/18/20185 | 82,000 | 81,943 |
| Fairway Finance Corp. 1.76% due 4/17/20185 | 52,700 | 52,649 |
| Federal Home Loan Bank 1.42%–1.75% due 4/9/2018–6/13/2018 | 385,459 | 384,854 |
| Freddie Mac 1.28% due 4/6/2018 | 39,500 | 39,493 |
| IBM Credit LLC 1.82% due 4/10/20185 | 40,000 | 39,976 |
| ING (U.S.) Funding LLC 1.82% due 6/13/2018 | 59,800 | 59,529 |
| Mitsubishi UFJ Trust and Banking Corp. 1.73%–2.00% due 4/12/2018–8/1/20185 | 65,600 | 65,369 |
| Mizuho Bank, Ltd. 1.70%–1.98% due 4/24/2018–5/21/20185 | 193,900 | 193,538 |
| National Australia Bank Ltd. 1.65%–1.73% due 4/5/2018–5/2/20185 | 253,100 | 252,818 |
| National Rural Utilities Cooperative Finance Corp. 1.78% due 4/2/2018 | 15,000 | 14,997 |
| Nestlé Capital Corp. 1.60%–1.94% due 4/5/2018–5/21/20185 | 70,500 | 70,418 |
| Nordea Bank AB 1.42%–1.68% due 4/9/2018–4/25/20185 | 140,000 | 139,844 |
| Novartis Finance Corp. 1.82% due 4/10/20185 | 60,000 | 59,965 |
| Province of Alberta 1.80% due 4/26/20185 | 40,000 | 39,942 |
| Royal Bank of Canada 1.70% due 4/23/2018 | 74,900 | 74,801 |
| Société Générale 1.62% due 4/2/20185 | 55,850 | 55,840 |
SMALLCAP World Fund — Page 14 of 16
| Short-term securities | Principal amount
(000) | Value
(000) |
| Sumitomo Mitsui Banking Corp. 1.68%–2.00% due 4/3/2018–5/21/20185 | $181,800 | $181,628 |
| Swedbank AB 1.70%–1.71% due 4/11/2018–4/16/2018 | 124,600 | 124,501 |
| Thunder Bay Funding, LLC 1.87% due 4/25/20185 | 43,000 | 42,939 |
| Total Capital Canada Ltd. 1.66%–1.74% due 4/4/2018–5/9/20185 | 177,600 | 177,367 |
| United Overseas Bank Ltd. 1.77% due 5/4/20185 | 61,000 | 60,876 |
| Wal-Mart Stores, Inc. 1.85% due 4/17/20185 | 75,000 | 74,926 |
| Total short-term securities (cost: $2,752,017,000) | | 2,751,530 |
| Total investment securities 100.10% (cost: $28,527,980,000) | | 40,060,160 |
| Other assets less liabilities (0.10)% | | (41,382) |
| Net assets 100.00% | | $40,018,778 |
As permitted by U.S. Securities and Exchange Commission regulations, “Miscellaneous” securities include holdings in their first year of acquisition that have not previously been publicly disclosed.
Forward currency contracts
| Contract amount | Counterparty | Settlement
date | Unrealized
appreciation
(depreciation)
at 3/31/2018
(000) |
Purchases
(000) | Sales
(000) |
| USD27,202 | CAD34,000 | UBS AG | 4/5/2018 | $810 |
| USD33,811 | GBP24,400 | Bank of America, N.A. | 4/11/2018 | (410) |
| USD15,917 | GBP11,375 | Bank of America, N.A. | 4/16/2018 | (40) |
| USD14,859 | GBP10,590 | Barclays Bank PLC | 4/23/2018 | (1) |
| USD27,192 | GBP19,380 | Goldman Sachs | 4/23/2018 | (3) |
| USD107,096 | GBP76,514 | Citibank | 4/23/2018 | (271) |
| USD50,554 | JPY5,303,225 | JPMorgan Chase | 4/27/2018 | 638 |
| USD46,523 | INR3,049,338 | Citibank | 5/25/2018 | 92 |
| | | | | $815 |
The following footnotes apply to either the individual securities noted or one or more of the securities aggregated and listed as a single line item.
| 1 | Represents an affiliated company as defined under the Investment Company Act of 1940. |
| 2 | Valued under fair value procedures adopted by authority of the board of directors. The total value of all such securities, including those in “Miscellaneous,“ was $12,882,797,000, which represented 32.19% of the net assets of the fund. This amount includes $12,561,447,000 related to certain securities trading outside the U.S. whose values were adjusted as a result of significant market movements following the close of local trading. |
| 3 | Security did not produce income during the last 12 months. |
| 4 | Acquired through a private placement transaction exempt from registration under the Securities Act of 1933. May be subject to legal or contractual restrictions on resale. Further details on these holdings appear below. |
| 5 | Acquired in a transaction exempt from registration under Rule 144A or Section 4(2) of the Securities Act of 1933. May be resold in the U.S. in transactions exempt from registration, normally to qualified institutional buyers. The total value of all such securities was $2,210,667,000, which represented 5.52% of the net assets of the fund. |
| 6 | Value determined using significant unobservable inputs. |
| 7 | Amount less than one thousand. |
| 8 | A portion of this security was pledged as collateral. The total value of pledged collateral was $1,746,000, which represented less than .01% of the net assets of the fund. |
| Private placement securities | Acquisition
date(s) | Cost
(000) | Value
(000) | Percent
of net
assets |
| DocuSign, Inc., Series E, convertible preferred | 2/28/2014 | $16,236 | $41,206 | .10% |
| DocuSign, Inc., Series B, convertible preferred | 2/28/2014 | 875 | 2,220 | .01 |
| DocuSign, Inc., Series D, convertible preferred | 2/28/2014 | 628 | 1,593 | .00 |
| DocuSign, Inc., Series B1, convertible preferred | 2/28/2014 | 262 | 665 | .00 |
| Proteus Digital Health, Inc., Series G, convertible preferred | 5/6/2014-7/23/2014 | 40,000 | 42,527 | .11 |
SMALLCAP World Fund — Page 15 of 16
| Private placement securities | Acquisition
date(s) | Cost
(000) | Value
(000) | Percent
of net
assets |
| Made.Com Design Ltd., Series C-4, preferred shares | 3/2/2018 | $41,328 | $42,054 | .10% |
| Acerta Pharma BV | 5/7/2014 | 11,250 | 20,709 | .05 |
| Allakos Inc., Series B, 8.00% noncumulative | 11/29/2017 | 20,000 | 20,000 | .05 |
| Venture Global LNG, Inc., Series C | 5/1/2015 | 12,720 | 15,989 | .04 |
| Rubius Therapeutics, Inc., Series C, convertible preferred | 2/23/2018 | 15,000 | 15,000 | .04 |
| Domo, Inc., Series D-2, convertible preferred | 3/31/2015 | 25,000 | 13,461 | .03 |
| Foursquare Labs, Inc., Series D, convertible preferred | 12/3/2013 | 20,000 | 6,225 | .02 |
| MakeMyTrip Ltd., non-registered shares | 5/2/2017 | 3,312 | 3,192 | .01 |
| Foursquare Labs, Inc., warrants, expire 2033 | 12/3/2013 | — | 975 | .00 |
| Total private placement securities | | $206,611 | $225,816 | .56% |
| Key to abbreviations and symbols |
| ADR = American Depositary Receipts |
| CAD = Canadian dollars |
| CDI = CREST Depository Interest |
| GBP = British pounds |
| GDR = Global Depositary Receipts |
| INR = Indian rupees |
| JPY = Japanese yen |
| SDR = Swedish Depositary Receipts |
| USD/$ = U.S. dollars |
Additional financial disclosures are included in the fund’s current shareholder report and should be read in conjunction with this report.
Investments are not FDIC-insured, nor are they deposits of or guaranteed by a bank or any other entity, so they may lose value.
Investors should carefully consider investment objectives, risks, charges and expenses. This and other important information is contained in the fund prospectus and summary prospectus, which can be obtained from your financial professional and should be read carefully before investing. You may also call American Funds Service Company (AFS) at (800) 421-4225 or visit the American Funds website at americanfunds.com. Fund shares offered through American Funds Distributors, Inc.
| MFGEFPX-035-0518O-S60673 | SMALLCAP World Fund — Page 16 of 16 |
ITEM 7 – Disclosure of Proxy Voting Policies and Procedures for Closed-End Management Investment Companies
Not applicable to this Registrant, insofar as the Registrant is not a closed-end management investment company.
ITEM 8 – Portfolio Managers of Closed-End Management Investment Companies
Not applicable to this Registrant, insofar as the Registrant is not a closed-end management investment company.
ITEM 9 – Purchases of Equity Securities by Closed-End Management Investment Company and Affiliated Purchasers
Not applicable to this Registrant, insofar as the Registrant is not a closed-end management investment company.
ITEM 10 – Submission of Matters to a Vote of Security Holders
There have been no material changes to the procedures by which shareholders may recommend nominees to the Registrant’s board of directors since the Registrant last submitted a proxy statement to its shareholders. The procedures are as follows. The Registrant has a nominating and governance committee comprised solely of persons who are not considered ‘‘interested persons’’ of the Registrant within the meaning of the Investment Company Act of 1940, as amended. The committee periodically reviews such issues as the board’s composition, responsibilities, committees, compensation and other relevant issues, and recommends any appropriate changes to the full board of directors. While the committee normally is able to identify from its own resources an ample number of qualified candidates, it will consider shareholder suggestions of persons to be considered as nominees to fill future vacancies on the board. Such suggestions must be sent in writing to the nominating and governance committee of the Registrant, c/o the Registrant’s Secretary, and must be accompanied by complete biographical and occupational data on the prospective nominee, along with a written consent of the prospective nominee for consideration of his or her name by the nominating and governance committee.
ITEM 11 – Controls and Procedures
| (a) | The Registrant’s Principal Executive Officer and Principal Financial Officer have concluded, based on their evaluation of the Registrant’s disclosure controls and procedures (as such term is defined in Rule 30a-3 under the Investment Company Act of 1940), that such controls and procedures are adequate and reasonably designed to achieve the purposes described in paragraph (c) of such rule. |
| | |
| (b) | There were no changes in the Registrant’s internal controls over financial reporting (as defined in Rule 30a-3(d) under the Investment Company Act of 1940) that occurred during the Registrant’s second fiscal quarter of the period covered by this report that has materially affected, or is reasonably likely to materially affect, the Registrant’s internal control over financial reporting. |
ITEM 12 – Exhibits
| (a)(1) | Not applicable for filing of semi-annual reports to shareholders. |
| | |
| (a)(2) | The certifications required by Rule 30a-2 of the Investment Company Act of 1940 and Sections 302 and 906 of the Sarbanes-Oxley Act of 2002 are attached as exhibits hereto. |
SIGNATURES
Pursuant to the requirements of the Securities Exchange Act of 1934 and the Investment Company Act of 1940, the Registrant has duly caused this report to be signed on its behalf by the undersigned, thereunto duly authorized.
| | SMALLCAP WORLD FUND, INC. |
| | |
| | By /s/ Paul F. Roye |
| | Paul F. Roye, Executive Vice President and Principal Executive Officer |
| | |
| | Date: May 31, 2018 |
Pursuant to the requirements of the Securities Exchange Act of 1934 and the Investment Company Act of 1940, this report has been signed below by the following persons on behalf of the Registrant and in the capacities and on the dates indicated.
| By /s/ Paul F. Roye |
Paul F. Roye, Executive Vice President and Principal Executive Officer |
| |
| Date: May 31, 2018 |
| By /s/ Brian D. Bullard |
Brian D. Bullard, Treasurer and Principal Financial Officer |
| |
| Date: May 31, 2018 |