Table of Contents
United States
Securities and Exchange Commission
Washington, DC 20549
FORM 10-K
ý Annual Report Pursuant to Section 13 or 15(d) of the Securities
Exchange Act of 1934, as amended (the "Exchange Act")
For the fiscal year ended December 31, 2013
or
o Transition Report Pursuant to Section 13 or 15(d) of the Exchange Act
For the transition period from to
Commission File Number 001-08029
THE RYLAND GROUP, INC.
(Exact name of registrant as specified in its charter)
| | |
| Maryland | | 52-0849948 |
(State or other jurisdiction
of incorporation or organization) | | (I.R.S. employer identification no.) |
3011 Townsgate Road, Suite 200, Westlake Village, California 91361
(Address of principal executive offices)
Registrant's telephone number, including area code: (805) 367-3800
Securities registered pursuant to Section 12(b) of the Act:
| | |
| Title of each class | | Name of each exchange on which registered
|
| Common stock, par value $1.00 per share | | New York Stock Exchange |
| Preferred stock purchase rights | | New York Stock Exchange |
Securities registered pursuant to Section 12(g) of the Act: None
Indicate by check mark if the registrant is a well-known seasoned issuer, as defined in Rule 405 of the Securities Act.
Yesý Noo
Indicate by check mark if the registrant is not required to file reports pursuant to Section 13 or Section 15(d) of the Act.
Yeso Noý
Indicate by check mark whether the registrant: (1) has filed all reports required to be filed by Section 13 or 15(d) of the Exchange Act during the preceding 12 months (or for such shorter period that the registrant was required to file such reports), and (2) has been subject to such filing requirements for the past 90 days.
Yesý Noo
Indicate by check mark whether the registrant has submitted electronically and posted on its corporate Web site, if any, every Interactive Data File required to be submitted and posted pursuant to Rule 405 of Regulation S-T during the preceding 12 months (or for such shorter period that the registrant was required to submit and post such files).
Yesý Noo
Indicate by check mark if disclosure of delinquent filers pursuant to Item 405 of Regulation S-K is not contained herein, and will not be contained, to the best of registrant's knowledge, in definitive proxy or information statements incorporated by reference in Part III of this Form 10-K or any amendment to this Form 10-K. o
Indicate by check mark whether the registrant is a large accelerated filer, an accelerated filer, a non-accelerated filer, or a smaller reporting company. See the definitions of "large accelerated filer," "accelerated filer" and "smaller reporting company" in Rule 12b-2 of the Exchange Act.
| | | | | | |
| Large accelerated filer ý | | Accelerated filer o | | Non-accelerated filer o
(Do not check if a smaller
reporting company) | | Smaller reporting company o |
Indicate by check mark whether the registrant is a shell company (as defined in Rule 12b-2 of the Act).
Yeso Noý
The aggregate market value of the common stock of The Ryland Group, Inc. held by nonaffiliates of the registrant (45,174,194 shares) at June 30, 2013, was $1,811,485,179. The number of shares of common stock of The Ryland Group, Inc. outstanding on February 24, 2014, was 46,588,764.
Table of Contents
DOCUMENT INCORPORATED BY REFERENCE
| | |
Name of Document | | Location in Report |
Proxy Statement for the 2014 Annual Meeting of Stockholders | | Part III |
2
Table of Contents
THE RYLAND GROUP, INC.
FORM 10-K
INDEX
3
Table of Contents
PART I
Item 1. Business
With headquarters in Southern California, The Ryland Group, Inc., a Maryland corporation (the "Company"), is one of the nation's largest homebuilders and a mortgage-finance company. The Company is traded on the New York Stock Exchange ("NYSE") under the symbol "RYL." Founded in 1967, the Company has built more than 305,000 homes. In addition, Ryland Mortgage Company and its subsidiaries and RMC Mortgage Corporation (collectively referred to as "RMC") have provided mortgage financing and related services for more than 255,000 homebuyers.
The Company consists of six operating business segments: four geographically determined homebuilding regions; financial services; and corporate. All of the Company's business is conducted and located in the United States. The Company's operations span all significant aspects of the homebuying process—from design, construction and sale to mortgage origination, title and escrow services. The homebuilding operations are, by far, the most substantial part of its business, comprising approximately 98 percent of consolidated revenues in 2013. The homebuilding segments generate nearly all of their revenues from sales of completed homes, with a lesser amount from sales of land and lots. In addition to building single-family detached homes, the homebuilding segments also build attached homes, such as townhomes, condominiums and some mid-rise buildings, that share common walls and roofs. The Company generally builds homes for entry-level buyers and first- and second-time move-up buyers. Its prices generally range from $150,000 to more than $600,000, with the average price of a home closed during 2013 being $296,000. The financial services segment provides mortgage-related products and services, as well as title and escrow services, to its homebuyers.
The Company has traditionally concentrated on expanding its operations by investing its available capital in both existing and new markets. New and existing communities are evaluated based on return, profitability and cash flow, and both senior and local management are incentivized based on the achievement of such returns. Management monitors the land acquisition process, sales revenues, margins and returns achieved in each of the Company's markets as part of its capital allocation process. (See discussion in Part I, Item 1A, "Risk Factors.")
The Company, which is diversified throughout the United States, believes diversification not only reduces its exposure to economic and market fluctuations, but also enhances its growth potential. Capital is strategically allocated to avoid concentration in any given geographic area and to reduce the risk associated with excessive dependence on local market anomalies. Subject to macroeconomic and local market conditions, the Company generally tries to either manage its exposure or expand its presence in its existing markets in an effort to be among the largest builders in each of those markets. In managing its exposure, the Company may decide to exit a market or reduce its inventory position because of current factors or conditions, or it may determine that a market is no longer viable for the achievement of its strategic goals. It may seek diversification or expansion by selectively entering new markets, primarily through establishing start-up or satellite operations, or by acquiring the operations of local builders in markets within its existing divisions. In 2012, the Company acquired the operations of Timberstone Homes in the Charlotte and Raleigh markets and Trend Homes in the Phoenix market. In 2013, the Company acquired the operations of LionsGate Homes in the Dallas market and Cornell Homes in the Delaware, New Jersey and Pennsylvania tri-state area.
The Company's national scale has provided opportunities for the negotiation of volume discounts and rebates from material suppliers. Additionally, it has access to a lower cost of capital due to the strength and transparency of its balance sheet, as well as to its relationships within the banking industry and capital markets. The Company believes that economies of scale and diversification may contribute to improvements in its operating margins during periods of growth and mitigate its overall risk.
Committed to product innovation, the Company conducts ongoing research into consumer preferences and trends. It is constantly adapting and improving its floor plans, design features and customized options. The Company strives to offer value, selection, location and quality to all of its homebuyers.
The Company is dedicated to building quality homes and customer relationships. With customer satisfaction as a major priority, it continues to make innovative enhancements designed to attract
4
Table of Contents
homebuyers. The Company continues to improve its methods regarding the collection of customer feedback, which includes online systems for tracking requests, processing issues and promoting customer interaction. In addition, it uses a third party to analyze customer feedback in order to better serve its homebuyers' needs.
The Company enters into land development joint ventures, from time to time, as a means to building lot positions, reducing its risk profile and enhancing its return on capital. It periodically partners with developers, other homebuilders or financial investors to develop finished lots for sale to the joint ventures' members or to other third parties.
Recent Trends
Housing markets in the United States experienced a prolonged downturn from 2006 to 2012 due to weak consumer demand for housing and an oversupply of homes available-for-sale. A challenging economic and employment environment, mortgage losses, and related uncertainty within financial and credit markets led the Company to downsize its operations in response. As a result, the Company decreased its overhead; exited or reduced its investments in certain markets; restructured its debt; focused on improving its operating efficiencies; and redesigned its products to be more affordable and less costly to build, all in an effort to better align its operations with current housing trends.
Due to improving affordability statistics, demographics and household creation trends, and based upon its experience during prior cycles in the homebuilding industry, the Company believes that attractive land acquisition opportunities were available for builders with the financial strength to take advantage of them. Accordingly, the Company began to expand more aggressively through its acquisitions of homebuilders with operations in the Charlotte, Raleigh and Phoenix markets during 2012 and in the Dallas market and in the Delaware, New Jersey and Pennsylvania tri-state area during 2013, as well as through accelerated land acquisitions in most markets, with a goal to increase its community count and volume levels to support a return to higher profitability. With its strong balance sheet, liquidity, broad geographic presence and experienced personnel, the Company believes that it is well positioned to continue making selective investments in markets with perceived growth prospects.
Homebuilding
General
The Company's homes are built on-site and marketed in four major geographic regions, or segments: North, Southeast, Texas and West. Within each of those segments, the Company operated in the following metropolitan areas at December 31, 2013:
| | |
| North | | Baltimore, Chicago, Delaware, Indianapolis, Metro Washington, D.C., Minneapolis, New Jersey, Northern Virginia and Philadelphia |
| Southeast | | Atlanta, Charleston, Charlotte, Myrtle Beach, Orlando, Raleigh/Durham and Tampa |
| Texas | | Austin, Dallas, Houston and San Antonio |
| West | | Denver, Las Vegas, Phoenix and Southern California |
The Company has decentralized operations to provide more flexibility to its local division presidents and management teams. Each of its homebuilding divisions across the country generally consists of a division president; a controller; management personnel focused on land entitlement, acquisition and development, sales, construction, customer service and purchasing; and accounting and administrative personnel. The Company's operations in each of its homebuilding markets may differ due to a number of market-specific factors, including regional economic conditions and job growth; land availability and local land development; consumer preferences; competition from other homebuilders; and home resale activity. The Company not only considers each of these factors upon entering into new markets, but also in determining the extent of its operations and the allocation of its capital in existing markets. Market experience and expertise of local management teams are critical to the decision-making process regarding the Company's operations.
The Company markets attached and detached single-family homes, which are generally targeted to entry-level and first- and second-time move-up buyers. Its diverse product line is tailored to the local styles and preferences found in each of its geographic markets. The product line offered in a particular community is
5
Table of Contents
determined in conjunction with the land acquisition process and is dependent upon a number of factors, including consumer preferences, competitive product offerings and development costs.
In most of the Company's single-family detached home communities, it offers several different floor plans, each with unique architectural styles. In addition, the exterior of each home may be further distinguished by the use of stone, stucco, brick or siding. The Company's traditional attached home communities generally offer several different floor plans with two, three or four bedrooms.
Although some of the same basic home designs are found in similar communities within the Company, it is continuously developing new designs to replace or augment existing ones to ensure that its homes reflect current consumer preferences. The Company relies on its own architectural staff and also engages unaffiliated architectural firms to develop new designs. During 2013, the Company introduced approximately 192 new plans.
Homebuyers are able to customize certain features of their homes by selecting from numerous options and upgrades displayed in the Company's model homes and design centers. These design centers, which are conveniently located in most of the Company's markets, showcase upgrades that represent increasing sources of additional revenue and profit for the Company. In all of the Company's communities, a wide selection of options is available to homebuyers for additional charges. The number and complexity of options typically increase with the size and base selling price of the home. Custom options contributed 15.0 percent of homebuilding revenues in 2013 and resulted in significantly higher margins in comparison to base homes.
Land Acquisition and Development
The Company's long-term objective is to control a portfolio of building lots sufficient to meet its anticipated homebuilding requirements for a period of approximately three to four years. The Company acquires land only after completing due diligence and feasibility studies. The land acquisition process is controlled by a corporate land approval committee to help ensure that transactions meet the Company's standards for financial performance and risk. In the ordinary course of its homebuilding business, the Company utilizes both direct acquisition and lot option purchase contracts to control lot inventory for use in the sale and construction of homes. The Company's direct land acquisition activities include the purchase of finished lots from developers and the purchase of undeveloped entitled land from third parties. The Company generally does not purchase unentitled or unzoned land.
Although control of lot inventory through the use of option contracts minimizes the Company's investment, such a strategy is not viable in certain markets due to the absence of third-party land developers. In other markets, competitive conditions may prevent the Company from controlling quality lots solely through the use of option contracts. In such situations, the Company may acquire undeveloped entitled land and/or finished lots on a bulk basis. The Company utilizes the selective development of land to gain access to prime locations, increase margins and position itself as a leader in the area through its influence over a community's character, layout and amenities. After determining the size, style, price range, density, layout and overall design of a community, the Company obtains governmental and other approvals necessary to begin the development process. Land is then graded; roads, utilities, amenities and other infrastructures are installed; and individual homesites are created.
Materials Costs
Substantially all materials used in construction are available from a number of sources, but they may fluctuate in price due to various factors. To increase purchasing efficiencies, the Company not only standardizes certain building materials and products, but also acquires such products through national supply contracts. The Company has, on occasion, experienced shortages of certain materials. If shortages were to occur in the future, such shortages could result in longer construction times and higher costs than those experienced in the past.
Construction
Substantially all on-site construction is performed for a fixed price by independent subcontractors selected on a competitive-bid basis. The Company generally requires a minimum of three competitive bids for each phase of construction. Construction activities are supervised by the Company's production team, which coordinates subcontractor work; monitors quality; and ensures compliance with local zoning and building
6
Table of Contents
codes. The Company requires substantially all of its subcontractors to have workers' compensation insurance and general liability insurance, including construction defect coverage. Construction time for homes depends on weather, availability of labor or subcontractors, materials, home size, geological conditions and other factors. The duration of the home construction process is generally between three and six months. The Company has an integrated financial and homebuilding management system that assists in scheduling production and controlling costs. Through this system, the Company monitors construction status and job costs incurred for each home during each phase of construction. The system provides for detailed budgeting and allows the Company to track and control actual costs, versus construction bids, for each community and subcontractor. The Company has, on occasion, experienced shortages of skilled labor in certain markets. If shortages were to occur in the future, such shortages could result in longer construction times and higher costs than those experienced in the past.
The Company, its subcontractors and its suppliers maintain insurance, subject to deductibles and self-insured amounts, to protect against various risks associated with homebuilding activities, including, among others, general liability, "all-risk" property, workers' compensation, automobile and employee fidelity. The Company accrues for expected costs associated with deductibles and self-insured amounts, when appropriate.
Marketing
The Company generally markets its homes to entry-level and first- and second-time move-up buyers through targeted product offerings in each of the communities in which it operates. The Company's marketing strategy is determined during the land acquisition and feasibility stages of a community's development. Employees and independent real estate brokers sell the Company's homes generally by showing furnished models. A new order is reported when a customer's sales contract has been signed by the homebuyer, approved by the Company and secured by a deposit, subject to cancellation. The Company normally starts construction of a home when a customer has selected a lot, chosen a floor plan and received preliminary mortgage approval. However, construction may begin prior to this in order to satisfy market demand for completed homes and to facilitate construction scheduling and/or cost savings. Homebuilding revenues are recognized when home sales are closed, title and possession are transferred to the buyer, and there is no significant continuing involvement from the homebuilder.
The Company advertises directly to potential homebuyers through the Internet and in newspapers and trade publications, as well as with marketing brochures and newsletters. It also uses billboards; radio and television advertising; and its website to market the location, price range and availability of its homes. The Company also attempts to operate in conspicuously located communities that permit it to take advantage of local traffic patterns. Model homes play a significant role in the Company's marketing efforts by not only creating an attractive atmosphere, but also by displaying options and upgrades.
The Company's sales contracts typically require an earnest money deposit. The amount of earnest money required varies between markets and communities. Buyers are generally required to pay additional deposits when they select options or upgrades for their homes. Most of the Company's sales contracts stipulate that when homebuyers cancel their contracts with the Company, it has the right to retain their earnest money and option deposits. Its operating divisions may, however, refund a portion of such deposits. The Company's sales contracts may also include contingencies that permit homebuyers to cancel and receive a refund of their deposits if they cannot obtain mortgage financing at prevailing or specified interest rates within a specified time period, or if they cannot sell an existing home. The length of time between the signing of a sales contract for a home and delivery of the home to the buyer may vary, depending on customer preferences, permit approval and construction cycles.
Customer Service and Warranties
The Company's operating divisions are responsible for conducting pre-closing quality control inspections and responding to homebuyers' post-closing needs. The Company believes that prompt and courteous acknowledgment of its homebuyers' needs during and after construction reduces post-closing repair costs; enhances its reputation for quality and service; and ultimately leads to repeat and referral business.
The Company provides each homeowner with product warranties covering workmanship and materials for one year, certain mechanical systems for two years and structural systems for ten years from the time of closing. The Company believes its warranty program meets or exceeds terms customarily offered in the
7
Table of Contents
homebuilding industry. The subcontractors who perform most of the actual construction also provide warranties on workmanship.
Seasonality
The Company experiences seasonal variations in its quarterly operating results and capital requirements. Historically, new order activity is higher during the spring and summer months. As a result, the Company typically has more homes under construction, closes more homes, and has greater revenues and operating income in the third and fourth quarters of its fiscal year. Historical results are not necessarily indicative of current or future homebuilding activities.
Financial Services
The Company's financial services segment provides mortgage-related products and services, as well as title and escrow services, to its homebuyers. The Company's financial services segment includes RMC, RH Insurance Company, Inc. ("RHIC") and Columbia National Risk Retention Group, Inc. ("CNRRG"). By aligning its operations with the Company's homebuilding segments, the financial services segment leverages this relationship to offer its lending services to homebuyers. Providing mortgage financing and other services to its customers helps the Company monitor its backlog and closing process. The mortgage capture rate represents the percentage of homes closed and available to capture by the Company that were financed with mortgage loans obtained from RMC. Substantially all of the loans the Company originates are sold within a short period of time in the secondary mortgage market on a servicing-released basis. The third-party investor then services and manages the loans.
Loan Origination
In 2013, RMC's mortgage operations consisted primarily of loans originated in connection with sales of the Company's homes. During the year, mortgage operations originated 4,007 loans totaling $1.0 billion. The vast majority of that amount was used for purchasing homes built by the Company, while the remainder was used for purchasing homes built by others, purchasing existing homes or refinancing existing mortgage loans.
RMC arranges various types of mortgage financing, including conventional, Federal Housing Administration ("FHA") and Veterans Administration ("VA") mortgages, with various fixed- and adjustable-rate features. RMC is approved to originate loans that conform to guidelines established by the Federal Home Loan Mortgage Corporation ("Freddie Mac") and the Federal National Mortgage Association ("Fannie Mae"). The Company sells the loans it originates, along with the related servicing rights, to third-party investors.
Title and Escrow Services
Cornerstone Title Company, doing business as Ryland Title Company, is a 100 percent-owned subsidiary of RMC that provides escrow and title services and acts as a title insurance agent primarily for the Company's homebuyers. At December 31, 2013, it provided title services in Arizona, Colorado, Florida, Illinois, Indiana, Maryland, Minnesota, Nevada, Texas and Virginia. Additionally, the Company provides title services through joint ventures in Georgia and South Carolina.
Insurance Services
Ryland Insurance Services ("RIS"), a 100 percent-owned subsidiary of RMC, previously provided insurance services to the Company's homebuyers. During 2013, RIS provided insurance services to 38.1 percent of the Company's homebuyers, compared to 40.7 percent during 2012.
RHIC, a 100 percent-owned subsidiary of the Company, provided insurance services to the homebuilding segments' subcontractors in certain markets. Effective June 1, 2008, RHIC ceased providing such services. Registered and licensed under Section 431, Article 19 of the Hawaii Revised Statutes, RHIC is required to meet certain minimum capital and surplus requirements. Additionally, no dividends may be paid without prior approval of the Hawaii Insurance Commissioner.
CNRRG, a 100 percent-owned subsidiary of the Company and some of its affiliates, was established to directly offer structural warranty coverage to protect homeowners against liability risks arising in connection with the homebuilding business of the Company and its affiliates.
8
Table of Contents
Corporate
Corporate is a non-operating business segment with the sole purpose of supporting operations. Its departments are responsible for establishing operational policies and internal control standards; implementing strategic initiatives; and monitoring compliance with policies and controls throughout the Company's operations. Corporate acts as an internal source of capital and provides financial, human resource, information technology, insurance, legal and tax compliance services. In addition, it performs administrative functions associated with a publicly traded entity.
Real Estate and Economic Conditions
The Company is significantly affected by fluctuations in economic activity, interest rates and levels of consumer confidence. The effects of these fluctuations differ among the various geographic markets in which the Company operates. Higher interest rates and the availability of homeowner financing may affect the ability of buyers to qualify for mortgage financing and reduce the demand for new homes. As a result, rising interest rates generally will decrease the Company's home sales and mortgage originations. During 2013, slow relaxation of an extremely restrictive mortgage underwriting environment impacted the Company's ability to attract homebuyers. The Company's business is also affected by national and local economic conditions such as employment rates, consumer confidence and housing demand.
Inventory risk can be substantial for homebuilders. The market value of land, lots and housing inventories fluctuates as a result of changing market and economic conditions. The Company must continuously locate and acquire land not only for expansion into new markets, but also for replacement and expansion of land inventory within current markets. The Company employs various measures designed to control inventory risk, including a corporate land approval process and a continuous review by senior management. It cannot, however, assure that these measures will avoid or eliminate this risk. The Company has experienced substantial losses from inventory and other valuation adjustments and write-offs in prior periods.
Competition
The Company competes in each of its markets with a large number of national, regional and local homebuilding companies. The strong presence of national homebuilders, plus the viability of regional and local homebuilders, impacts the level of competition in many markets. The Company also competes with other housing alternatives, including existing homes and rental properties. Principal competitive factors in the homebuilding industry include price; design; quality; reputation; relationships with developers; accessibility of subcontractors; availability and location of lots; and availability of customer financing. The Company's financial services segment competes with other mortgage bankers to arrange financing for homebuyers. Principal competitive factors include interest rates, fees and other mortgage loan product features available to the consumer.
Employees
At December 31, 2013, the Company had 1,395 employees. The Company considers its employee relations to be good. No employees are represented by a collective bargaining agreement.
Website Access to Reports
The Company files annual, quarterly and special reports; proxy statements; and other information with the U.S. Securities and Exchange Commission ("SEC") under the Exchange Act and the Securities Act of 1933, as amended (the "Securities Act"). The Company files information electronically with the SEC, and its filings are available from the SEC's website atwww.sec.gov. The Company's website address iswww.ryland.com. Information on the Company's website is not part of this report. The Company makes its Annual Report on Form 10-K, Quarterly Reports on Form 10-Q, XBRL filings, Current Reports on Form 8-K and amendments to those reports filed or furnished pursuant to Section 13(a) or 15(d) of the Exchange Act available on its website as soon as possible after it electronically files such material with or furnishes it to the SEC. To retrieve any of this information, visitwww.ryland.com, select "Investor Relations," scroll down the page to "Financial Information" and select "SEC Filings." Through its website, the Company shares information about itself with the securities marketplace.
9
Table of Contents
Item 1A. Risk Factors
The homebuilding industry is cyclical in nature and has experienced downturns, which have in the past and may in the future cause the Company to incur losses in financial and operating results.
The Company is affected by the cyclical nature of the homebuilding industry, which is sensitive to many factors, including fluctuations in general and local economic conditions; interest rates; housing demand; employment levels; levels of new and existing homes for sale; demographic trends; availability of homeowner financing; and consumer confidence. In recent years, the markets served by the Company, and the U.S. homebuilding industry as a whole, experienced a prolonged decrease in demand for new homes, as well as an oversupply of new and existing homes available-for-sale. In addition, an oversupply of alternatives to new homes, such as rental properties and existing homes, can depress prices and reduce margins.
Demand for new homes is sensitive to economic conditions over which the Company has no control, such as the availability of mortgage financing and the level of employment.
Demand for new homes is sensitive to changes in economic conditions such as the level of employment, consumer confidence, consumer income, the availability of financing and interest rate levels. During the last few years, the mortgage lending industry has experienced significant instability. As a result of increased default rates, particularly (but not entirely) with regard to subprime and other nonconforming loans, many lenders have reduced their willingness to make residential mortgage loans and have tightened their credit requirements with regard to them. Fewer loan products, stricter loan qualification standards and higher down payments have made it more difficult for some borrowers to finance home purchases. Although the Company's financial services segment offers mortgage loans to potential buyers, the Company may no longer be able to offer financing terms that are attractive to those buyers. Lack of available mortgage financing at acceptable rates reduces demand for the homes the Company builds and, in some instances, causes potential buyers to cancel contracts they have signed.
There has also been a substantial loss of jobs in the United States during the last several years. People who are unemployed or concerned about job loss are unlikely to purchase new homes, and many may be forced to sell the homes they already own. Therefore, current employment levels can adversely affect the Company both by reducing demand for the homes it builds and by increasing the supply of homes for sale.
Because most of the Company's homebuyers finance the purchase of their homes, the terms and availability of mortgage financing can affect the demand for and the ability to complete the purchase of a home, as well as the Company's future operating and financial results.
The Company's business and earnings depend on the ability of its homebuyers to obtain financing for the purchase of their homes. Many of the Company's homebuyers must sell their existing homes in order to buy a home from the Company. In recent years, the mortgage lending industry as a whole experienced significant instability due to, among other things, defaults on subprime and other loans, resulting in the declining market value of such loans. In light of these developments, lenders, investors, regulators and other third parties questioned the adequacy of lending standards and other credit requirements for several loan programs made available to borrowers in recent years. This has led to tightened credit requirements and an increase in indemnity claims for mortgages that were originated and sold by the Company. Deterioration in credit quality among subprime and other nonconforming loans has caused most lenders to eliminate subprime mortgages and most other loan products that do not conform to Fannie Mae, Freddie Mac, FHA or VA standards. Fewer loan products and tighter loan qualifications, in turn, make it more difficult for a borrower to finance the purchase of a new home or the purchase of an existing home from a potential move-up buyer who wishes to purchase one of the Company's homes. If the Company's potential homebuyers or the buyers of the homebuyers' existing homes cannot obtain suitable financing, or if increased indemnity claims are made for mortgages that are originated and sold, the result will have an adverse effect on the Company's operating and financial results and performance.
Rising interest rates; decreased availability of mortgage financing or of certain mortgage programs; higher down payment requirements; or increased monthly mortgage costs, as discussed above, may lead to reduced demand for the Company's homes and mortgage loan services. Increased interest rates can also hinder the Company's ability to realize its backlog because its home purchase contracts provide customers
10
Table of Contents
with a financing contingency. Financing contingencies allow customers to cancel their home purchase contracts in the event that they cannot arrange for adequate financing. As a result, rising interest rates can decrease the Company's home sales and mortgage originations. Any of these factors could have an adverse impact on the Company's financial condition and results of operations.
As a result of turbulence in the credit markets and mortgage finance industry in 2008 and 2009, the federal government has taken on a significant role in supporting mortgage lending through its conservatorship of Fannie Mae and Freddie Mac, both of which purchase home mortgages and mortgage-backed securities originated by mortgage lenders, and its insurance of mortgages originated by lenders through the FHA and VA. FHA backing of mortgages has recently been particularly important to the mortgage finance industry and to the Company's business. In 2013, 41.0 percent of the Company's homebuyers who chose to finance with RMC purchased a home using an FHA- or VA-backed loan. In addition, the Federal Reserve has purchased a sizable amount of mortgage-backed securities in an effort to stabilize mortgage interest rates and to support the market for mortgage-backed securities. The availability and affordability of mortgage loans, including consumer interest rates for such loans, could be adversely affected by a curtailment or ceasing of the federal government's mortgage-related programs or policies. The FHA may continue to impose stricter loan qualification standards, raise minimum down payment requirements, impose higher mortgage insurance premiums and other costs, and/or limit the number of mortgages it insures. Due to growing federal budget deficits, the U.S. Treasury may not be able to continue supporting the mortgage-related activities of Fannie Mae, Freddie Mac, the FHA and the VA at present levels, or it may significantly revise the federal government's participation in and support of the residential mortgage market. In this regard, the Federal Reserve has announced reductions in its monthly bond purchase stimulus program.
Since the availability of Fannie Mae, Freddie Mac, FHA- and VA-backed mortgage financing is an important factor in marketing and selling many of the Company's homes, any limitations, restrictions or changes in the availability of such government-backed financing could reduce its home sales and adversely affect the Company's results of operations, including its income from RMC.
The Company may be subject to indemnification claims on mortgages sold to third parties.
Substantially all of the loans the Company originates are sold within a short period of time in the secondary mortgage market on a servicing-released basis. The mortgage industry has experienced substantial increases in delinquencies, foreclosures and foreclosures-in-process. All mortgages are generally sold, although under certain limited circumstances, RMC is required to indemnify loan investors for losses incurred on sold loans. Reserves are created to address repurchase and indemnity claims made by these third-party investors or purchasers. These reserves are based on pending claims received that are associated with previously sold mortgage loans, industry foreclosure data, the Company's portfolio delinquency and foreclosure rates on sold loans made available by investors, as well as on historical loss payment patterns used to develop ultimate loss projections. Estimating loss has been made more difficult by the recent processing delays related to foreclosure losses affecting agencies and financial institutions. Because of the uncertainties inherent in estimating these matters, the Company cannot provide assurance that the amounts reserved will be adequate or that any potential inadequacies will not have an adverse effect on its results of operations.
Tax law changes could make home ownership more expensive or less attractive.
Significant expenses of owning a home, including mortgage interest expense and real estate taxes, generally are deductible expenses for the purpose of calculating an individual's federal and, in some cases, state taxable income, subject to various limitations under current tax law and policy. If federal or state governments change income tax laws by eliminating or substantially reducing these income tax benefits, as some policymakers have discussed, the after-tax cost of owning a new home will increase significantly. This could adversely impact both demand for and/or sales prices of new homes.
The Company is subject to inventory risk for its land, options for land, building lots and housing inventory.
The market value of the Company's land, building lots and housing inventories fluctuates as a result of changing market and economic conditions. In addition, inventory carrying costs can result in losses in poorly performing projects or markets. Changes in economic and market conditions have caused the Company to dispose of land and options for land and housing inventories on a basis that has resulted in
11
Table of Contents
loss and required it to write down or reduce the carrying value of its inventory. During the year ended December 31, 2013, the Company decided not to pursue development and construction in certain areas where it held land or made option deposits, which resulted in $1.9 million in recorded write-offs of option deposits and preacquisition feasibility costs. The Company can provide no assurance that it will not need to record additional write-offs in the future.
In the course of its business, the Company makes land acquisitions. Although it employs various measures, including its land approval process and continued review by senior management, designed to manage inventory risk, the Company cannot assure that these measures will enable it to avoid or eliminate its inventory risk.
Construction costs can fluctuate and impact the Company's margins.
The homebuilding industry has, from time to time, experienced significant difficulties, including shortages of qualified tradespeople; reliance on local subcontractors who may be inadequately capitalized; shortages of materials; and volatile increases in the cost of materials, particularly increases in the prices of lumber, drywall and cement, which are significant components of home construction costs. The Company may not be able to recapture increased costs by raising prices because of either market conditions or because it fixes its prices at the time home sales contracts are signed.
Supply shortages and other risks related to demand for building materials and/or skilled labor could increase costs and delay deliveries.
There is a high level of competition in the homebuilding industry for skilled labor and building materials. Rising costs or shortages in building materials or skilled labor could cause increases in construction costs and construction delays. The Company is generally unable to pass on increases in construction costs to homebuyers who have already entered into purchase contracts. A purchase contract generally fixes the price of the home at the time the contract is signed, and this may occur well in advance of when construction commences. Further, the Company may not be able to pass on rising construction costs because of market conditions. Sustained increases in construction costs due to competition for materials and skilled labor, as well as higher commodity prices (including prices for lumber, metals and other building material inputs), among other things, may decrease the Company's margins over time.
Shortages in the availability of subcontract labor may delay construction schedules and increase the Company's costs.
The Company conducts its construction operations only as a general contractor. Virtually all architectural, construction and development work is performed by unaffiliated third-party subcontractors. As a consequence, the Company depends on the continued availability of and satisfactory performance by these subcontractors for the design and construction of its homes. The Company cannot make assurances that there will be sufficient availability of and satisfactory performance by these unaffiliated third-party subcontractors. In addition, inadequate subcontractor resources could delay the Company's construction schedules and have a material adverse effect on its business.
Because the homebuilding industry is competitive, the business practices of other homebuilders can have an impact on the Company's financial results and cause these results to decline.
The residential homebuilding industry is highly competitive. The Company competes in each of its markets with a large number of national, regional and local homebuilding companies. This competition could cause the Company to adjust selling prices in response to competitive conditions in the markets in which it operates and could require it to increase the use of sales incentives. The Company cannot predict whether these measures will be successful or if additional incentives will be made in the future. It also competes with other housing alternatives, including existing homes and rental housing. The homebuilding industry's principal competitive factors are home price, availability of customer financing, design, quality, reputation, relationships with developers, accessibility of subcontractors, and availability and location of homesites. Any of the foregoing factors could have an adverse impact on the Company's financial performance and results of operations.
The Company's financial services segment competes with other mortgage bankers to arrange financing for homebuyers. The principal competitive factors for the financial services segment include interest rates, fees and other features of mortgage loan products available to the consumer.
12
Table of Contents
Homebuilding is subject to warranty claims in the ordinary course of business that can be subject to uncertainty.
As a homebuilder, the Company is subject to warranty claims arising in the ordinary course of business. The Company records warranty and other reserves for the homes it sells to cover expected costs of materials and outside labor during warranty periods based on historical experience in the Company's markets and on the judgment of the qualitative risks associated with the types of homes built by the Company, including analyses of historical claims. Because of the uncertainties inherent to these matters, the Company cannot provide assurance that the amounts reserved for warranty claims will be adequate or that any potential inadequacies will not have an adverse effect on its results of operations.
Because the Company's business is subject to various regulatory and environmental limitations, it may not be able to conduct its business as planned.
The Company's homebuilding segments are subject to various local, state and federal laws, statutes, ordinances, rules and regulations concerning zoning, building design, construction, stormwater permitting and discharge, and similar matters, as well as open spaces, wetlands and environmentally protected areas. These include local regulations that impose restrictive zoning and density requirements in order to limit the number of homes that can be built within the boundaries of a particular area, as well as other municipal or city land planning restrictions, requirements or limitations. The Company may also experience periodic delays in homebuilding projects due to regulatory compliance, municipal appeals and other governmental planning processes in any of the markets in which it operates. These factors could result in delays or increased operational costs.
With respect to originating, processing, selling and servicing mortgage loans, the Company's financial services segment is subject to the rules and regulations of FHA, Freddie Mac, Fannie Mae, VA and the U.S. Department of Housing and Urban Development ("HUD"). Mortgage origination activities are further subject to the Equal Credit Opportunity Act, Federal Truth-in-Lending Act and the Real Estate Settlement Procedures Act, and their associated regulations. These and other federal and state statutes and regulations prohibit discrimination and establish underwriting guidelines that include provisions for audits, inspections and appraisals; require credit reports on prospective borrowers; fix maximum loan amounts; and require the disclosure of certain information concerning credit and settlement costs. The Company is required to submit audited financial statements annually, and each agency or other entity has its own financial requirements. The Company's affairs are also subject to examination by these entities at all times to assure compliance with applicable regulations, policies and procedures.
The Company's ability to grow its business and operations depends, to a significant degree, upon its ability to access capital on favorable terms.
The ability to access capital on favorable terms is an important factor in growing the Company's business and operations in a profitable manner. In 2007, Moody's lowered the Company's debt rating to non-investment grade, and Standard & Poor's ("S&P") also reduced the Company's investment-grade rating to non-investment grade in 2008. The Company received additional downgrades in 2008 and 2011. At December 31, 2013, Moody's and S&P reported the Company's rating outlook as stable. The loss of an investment-grade rating affects the cost, availability and terms of credit available to the Company, making it more difficult and costly to access the debt capital markets for funds that may be required to implement its business plans.
Natural disasters may have a significant impact on the Company's business.
The climates and geology of many of the states in which the Company operates present increased risks of natural disasters. To the extent that hurricanes, severe storms, tornadoes, earthquakes, droughts, floods, wildfires or other natural disasters or similar events occur, its business and financial condition may be adversely affected.
The Company's net operating loss carryforwards could be substantially limited if it experiences an ownership change as defined in the Internal Revenue Code.
Section 382 of the Internal Revenue Code contains rules that limit the ability of a company that undergoes an ownership change, which is generally any change in ownership of more than 50.0 percent of its stock over a three-year period, to utilize its net operating loss ("NOL") carryforwards and to recognize certain built-in losses in years after the ownership change. These rules generally operate by focusing on ownership
13
Table of Contents
changes among stockholders owning directly or indirectly 5.0 percent or more of the stock of a company and any change in ownership arising from a new issuance of stock by the company.
If the Company undergoes an ownership change for purposes of Section 382 as a result of future transactions involving its common stock, including purchases or sales of stock between 5.0 percent stockholders, the Company's ability to use its NOL carryforwards and to recognize certain built-in losses would be subject to the limitations of Section 382. Depending on the resulting limitation, a significant portion of the Company's NOL carryforwards could expire before it would be able to use them. The Company's inability to utilize its NOL carryforwards could have a negative impact on its financial condition and results of operations.
In late 2008 and early 2009, the Company adopted a shareholder rights plan and amended its charter to implement certain share transfer restrictions in order to preserve stockholder value and the value of certain tax assets primarily associated with NOL carryforwards and built-in losses under Section 382 of the Internal Revenue Code. The shareholder rights plan and charter provisions are intended to prevent share transfers that could cause a loss of these tax assets. Both the rights plan and the charter amendment were approved by the Company's stockholders. The Company can provide no assurance that the rights plan and charter provisions will protect the Company's ability to use its NOLs and unrealized losses to reduce potential future federal income tax obligations.
Information technology failures and data security breaches could harm the Company's business.
The Company's information technology systems are dependent upon global communications providers, Web browsers, telephone systems and other aspects of the Internet infrastructure that have experienced significant systems failures and electrical outages in the past. While it takes measures to ensure its major systems have redundant capabilities, the Company's systems are susceptible to outages from fire, floods, power loss, telecommunications failures, break-ins, cyber attacks and similar events. Despite the Company's implementation of network security measures, its servers are vulnerable to computer viruses, break-ins and similar disruptions resulting from unauthorized tampering with its computer systems. The occurrence of any of these events could disrupt or damage the Company's information technology systems and hamper its internal operations, its ability to provide services to its customers and the ability of its customers to access the Company's information technology systems. In addition, the Company's business requires the collection and retention of large volumes of internal and customer data. The Company also maintains personally identifiable information about its employees. The integrity and protection of customer, employee and company data is critical to the Company. A material network breach in the security of the Company's information technology systems could include the theft of customer or employee data or its intellectual property or trade secrets. To the extent that any disruption or security breach results in a loss or damage to the Company's data, or in the inappropriate disclosure of confidential information, it could cause significant damage to its reputation, affect relationships with its customers, reduce demand for the Company's services, lead to claims against the Company and ultimately harm its business. In addition, the Company may be required to incur significant costs to protect against damage caused by these disruptions or security breaches in the future.
The Company's short-term investments and marketable securities are subject to certain risks which could materially and adversely affect its overall financial condition.
The Company invests a portion of its available cash and cash equivalent balances by purchasing marketable securities with maturities in excess of three months in a managed portfolio. The primary objectives of these investments are the preservation of capital and the maintenance of a high degree of liquidity, with a secondary objective being the attainment of yields higher than those earned on the Company's cash and cash equivalent balances. Should any of the Company's short-term investments or marketable securities lose value or have their liquidity impaired, it could materially and adversely affect the Company's overall financial condition by limiting its ability to fund operations.
Item 1B. Unresolved Staff Comments
None.
14
Table of Contents
Item 2. Properties
The Company leases office space for its corporate headquarters in Westlake Village, California, and for its IT Department and RMC's operations center in Scottsdale, Arizona. In addition, the Company leases office space in the various markets in which it operates.
Item 3. Legal Proceedings
Contingent liabilities may arise from obligations incurred in the ordinary course of business or from the usual obligations of on-site housing producers for the completion of contracts.
On December 23, 2011, Countrywide Home Loans, Inc. filed a lawsuit against RMC in California, which was subsequently amended, alleging breach of contract related to repurchase obligations arising out of the sale of mortgage loans associated with a loan purchase agreement between Countrywide and RMC and breach of contract related to indemnity obligations. The Company intends to vigorously defend itself against the asserted allegations and causes of actions contained within this lawsuit. (See Note K, "Commitments and Contingencies.")
The Company is party to various other legal proceedings generally incidental to its businesses. Based on evaluation of these matters and discussions with counsel, management believes that it is not probable that liabilities arising from these matters will have a material adverse effect on the financial condition, results of operations and cash flows of the Company.
Item 4. Mine Safety Disclosures
Not applicable.
PART II
Item 5. Market for Registrant's Common Equity, Related Stockholder Matters and Issuer Purchases of Equity Securities
Market for Common Equity, Common Stock Prices and Dividends
The Company lists its common shares on the NYSE, trading under the symbol "RYL." The latest reported sale price of the Company's common stock on February 11, 2014, was $43.15, and there were 1,489 common stockholders of record on that date.
The following table presents high and low market prices, as well as dividend information, for the Company:
| | | | | | | | | | | | | | | | | | | | |
2013 | | |
HIGH | | |
LOW | | | DIVIDENDS
DECLARED
PER SHARE | |
2012 | | |
HIGH | | |
LOW | | | DIVIDENDS
DECLARED
PER SHARE |
| | | |
|---|
| First quarter | | $ | 43.00 | | $ | 33.50 | | $ | 0.03 | | First quarter | | $ | 21.15 | | $ | 15.70 | | $ | 0.03 |
| Second quarter | | | 50.42 | | | 35.65 | | | 0.03 | | Second quarter | | | 26.23 | | | 17.18 | | | 0.03 |
| Third quarter | | | 43.70 | | | 33.04 | | | 0.03 | | Third quarter | | | 33.93 | | | 23.04 | | | 0.03 |
| Fourth quarter | | | 44.63 | | | 35.70 | | | 0.03 | | Fourth quarter | | | 38.28 | | | 29.00 | | | 0.03 |
| |
Issuer Purchases of Equity Securities
On December 6, 2006, the Company announced that it had received authorization from its Board of Directors to purchase shares totaling $175.0 million. During 2007, 747,000 shares had been repurchased in accordance with this authorization. At December 31, 2013, there was $142.3 million, or 3.3 million additional shares, available for purchase in accordance with this authorization, based on the Company's stock price on that date. This authorization does not have an expiration date. The Company did not purchase any of its own equity securities during the years ended December 31, 2013, 2012 or 2011.
15
Table of Contents
Performance Graph
The following performance graph and related information shall not be deemed "soliciting material" or be "filed" with the SEC, nor shall such information be incorporated by reference into any future filing under the Securities Act or the Exchange Act, except to the extent that the Company specifically incorporates it by reference into such filing.
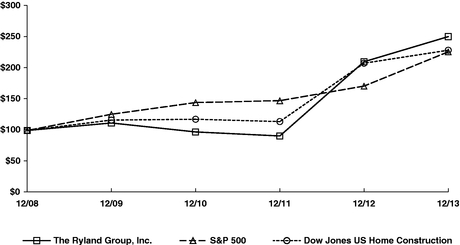
The following graph compares the Company's cumulative total stockholder returns since December 31, 2008, to the S&P 500 and the Dow Jones U.S. Home Construction indices for the calendar years ended December 31:
COMPARISON OF 5-YEAR CUMULATIVE TOTAL RETURN1
Among The Ryland Group, Inc., The S&P 500 Index
And The Dow Jones U.S. Home Construction Index
Securities Authorized for Issuance Under Equity Compensation Plans
The Company's equity compensation plan information as of December 31, 2013, is summarized as follows:
| | | | | | |
| | NUMBER OF SECURITIES TO
BE ISSUED UPON EXERCISE
OF OUTSTANDING OPTIONS,
WARRANTS AND RIGHTS
| | WEIGHTED-AVERAGE
EXERCISE PRICE OF
OUTSTANDING OPTIONS,
WARRANTS AND RIGHTS
| | NUMBER OF SECURITIES
REMAINING AVAILABLE FOR
FUTURE ISSUANCE UNDER
EQUITY COMPENSATION
PLANS (EXCLUDING
SECURITIES REFLECTED
IN COLUMN (a))
|
|---|
PLAN CATEGORY
| | (a)
| | (b)
| | (c)
|
|---|
| |
Equity compensation plans approved by stockholders | | 2,865,307 | | $ 27.02 | | 3,442,685 |
Equity compensation plans not approved by stockholders1 | |
– | |
– | |
– |
| |
- 1
- The Company does not have any equity compensation plans that have not been approved by stockholders.
16
Table of Contents
Item 6. Selected Financial Data
| | | | | | | | | | | | | | | | |
| | YEAR ENDED DECEMBER 31, | |
(in millions, except per share data) | | | 2013 | | | 2012 | | | 2011 | | | 2010 | | | 2009 | |
| | |
ANNUAL RESULTS | | | | | | | | | | | | | | | | |
REVENUES | | | | | | | | | | | | | | | | |
Homebuilding | | $ | 2,089 | | $ | 1,271 | | $ | 863 | | $ | 970 | | $ | 1,144 | |
Financial services | | | 52 | | | 37 | | | 27 | | | 31 | | | 41 | |
| | | | |
TOTAL REVENUES | | | 2,141 | | | 1,308 | | | 890 | | | 1,001 | | | 1,185 | |
| | | | |
Cost of sales | | | 1,654 | | | 1,027 | | | 727 | | | 844 | | | 1,194 | |
Operating expenses | | | 293 | | | 230 | | | 198 | | | 224 | | | 246 | |
| | | | |
TOTAL EXPENSES | | | 1,947 | | | 1,257 | | | 925 | | | 1,068 | | | 1,440 | |
| | | | |
Other income (loss) | | | 2 | | | (7 | ) | | 2 | | | (14 | ) | | 15 | |
| | | | |
Income (loss) from continuing operations before taxes | | | 196 | | | 44 | | | (33 | ) | | (81 | ) | | (240 | ) |
Tax (benefit) expense | | | (183 | ) | | 2 | | | (3 | ) | | – | | | (97 | ) |
| | | | |
Net income (loss) from continuing operations | | | 379 | | | 42 | | | (30 | ) | | (81 | ) | | (143 | ) |
Loss from discontinued operations, net of taxes | | | – | | | (2 | ) | | (21 | ) | | (4 | ) | | (19 | ) |
| | | | |
NET INCOME (LOSS) | | $ | 379 | | $ | 40 | | $ | (51 | ) | $ | (85 | ) | $ | (162 | ) |
| | | | |
YEAR-END POSITION | | | | | | | | | | | | | | | | |
ASSETS | | | | | | | | | | | | | | | | |
Cash, cash equivalents and marketable securities | | $ | 631 | | $ | 615 | | $ | 563 | | $ | 739 | | $ | 815 | |
Housing inventories | | | 1,650 | | | 1,077 | | | 795 | | | 752 | | | 612 | |
Other assets | | | 499 | | | 240 | | | 186 | | | 111 | | | 208 | |
Assets of discontinued operations | | | – | | | 2 | | | 35 | | | 51 | | | 59 | |
| | | | |
TOTAL ASSETS | | | 2,780 | | | 1,934 | | | 1,579 | | | 1,653 | | | 1,694 | |
| | | | |
LIABILITIES | | | | | | | | | | | | | | | | |
Debt and financial services credit facility | | | 1,470 | | | 1,134 | | | 874 | | | 880 | | | 854 | |
Other liabilities | | | 385 | | | 272 | | | 215 | | | 207 | | | 251 | |
Liabilities of discontinued operations | | | 1 | | | 2 | | | 6 | | | 4 | | | 7 | |
| | | | |
TOTAL LIABILITIES | | | 1,856 | | | 1,408 | | | 1,095 | | | 1,091 | | | 1,112 | |
| | | | |
NONCONTROLLING INTEREST | | | 16 | | | 22 | | | 34 | | | 62 | | | – | |
STOCKHOLDERS' EQUITY | | | 908 | | | 504 | | | 450 | | | 500 | | | 582 | |
| | | | |
TOTAL EQUITY | | $ | 924 | | $ | 526 | | $ | 484 | | $ | 562 | | $ | 582 | |
| | | | |
PER COMMON SHARE DATA | | | | | | | | | | | | | | | | |
NET INCOME (LOSS) | | | | | | | | | | | | | | | | |
Basic | | | | | | | | | | | | | | | | |
Continuing operations | | $ | 8.22 | | $ | 0.93 | | $ | (0.67 | ) | $ | (1.83 | ) | $ | (3.30 | ) |
Discontinued operations | | | 0.00 | | | (0.04 | ) | | (0.47 | ) | | (0.10 | ) | | (0.44 | ) |
| | | | |
Total | | | 8.22 | | | 0.89 | | | (1.14 | ) | | (1.93 | ) | | (3.74 | ) |
| | | | |
Diluted | | | | | | | | | | | | | | | | |
Continuing operations | | | 6.79 | | | 0.88 | | | (0.67 | ) | | (1.83 | ) | | (3.30 | ) |
Discontinued operations | | | 0.00 | | | (0.04 | ) | | (0.47 | ) | | (0.10 | ) | | (0.44 | ) |
| | | | |
Total | | $ | 6.79 | | $ | 0.84 | | $ | (1.14 | ) | $ | (1.93 | ) | $ | (3.74 | ) |
| | | | |
DIVIDENDS DECLARED | | $ | 0.12 | | $ | 0.12 | | $ | 0.12 | | $ | 0.12 | | $ | 0.12 | |
STOCKHOLDERS' EQUITY | | $ | 19.64 | | $ | 11.16 | | $ | 10.12 | | $ | 11.31 | | $ | 13.27 | |
| | |
17
Table of Contents
Item 7. Management's Discussion and Analysis of Financial Condition and Results of Operations
The following management's discussion and analysis is intended to assist the reader in understanding the Company's business and is provided as a supplement to, and should be read in conjunction with, the Company's consolidated financial statements and accompanying notes. The Company's results of operations discussed below are presented in conformity with U.S. generally accepted accounting principles ("GAAP").
Forward-Looking Statements
Certain statements in this Annual Report may be regarded as "forward-looking statements" within the meaning of the Private Securities Litigation Reform Act of 1995, and may qualify for the safe harbor provided for in Section 21E of the Exchange Act. These forward-looking statements represent the Company's expectations and beliefs concerning future events, and no assurance can be given that the results described in this Annual Report will be achieved. These forward-looking statements can generally be identified by the use of statements that include words such as "anticipate," "believe," "could," "estimate," "expect," "foresee," "goal," "intend," "likely," "may," "plan," "project," "should," "target," "will" or other similar words or phrases. All forward-looking statements contained herein are based upon information available to the Company on the date of this Annual Report. Except as may be required under applicable law, the Company does not undertake any obligation to update or revise any forward-looking statements, whether as a result of new information, future events or otherwise.
These forward-looking statements are subject to risks, uncertainties and other factors, many of which are outside of the Company's control that could cause actual results to differ materially from the results discussed in the forward-looking statements. The factors and assumptions upon which any forward-looking statements herein are based are subject to risks and uncertainties which include, among others:
- •
- economic changes nationally or in the Company's local markets, including volatility and increases in interest rates, the impact of, and changes in, governmental stimulus, tax and deficit reduction programs, inflation, changes in consumer demand and confidence levels and the state of the market for homes in general;
- •
- changes and developments in the mortgage lending market, including revisions to underwriting standards for borrowers and lender requirements for originating and holding mortgages, changes in government support of and participation in such market, and delays or changes in terms and conditions for the sale of mortgages originated by the Company;
- •
- the availability and cost of land and the future value of land held or under development;
- •
- increased land development costs on projects under development;
- •
- shortages of skilled labor or raw materials used in the production of homes;
- •
- increased prices for labor, land and materials used in the production of homes;
- •
- increased competition;
- •
- failure to anticipate or react to changing consumer preferences in home design;
- •
- increased costs and delays in land development or home construction resulting from adverse weather conditions or other factors;
- •
- potential delays or increased costs in obtaining necessary permits as a result of changes to laws, regulations or governmental policies (including those that affect zoning, density, building standards, the environment and the residential mortgage industry);
- •
- delays in obtaining approvals from applicable regulatory agencies and others in connection with the Company's communities and land activities;
- •
- changes in the Company's effective tax rate and assumptions and valuations related to its tax accounts;
- •
- the risk factors set forth in this Annual Report on Form 10-K; and
- •
- other factors over which the Company has little or no control.
18
Table of Contents
Results of Operations
Overview
During 2013, attractive housing affordability levels, historically low interest rates and increasing home prices have changed buyers' perceptions, and the Company's homebuilding operations have improved during the year. Mortgage rates have increased during 2013 due to evidence that federal policies designed to keep interest rates low have begun to subside. During the fourth quarter of 2013, political headwinds; rapidly increasing sales prices and mortgage interest rates; severe weather in many markets; and economic uncertainty due to changes in government policy have caused improvements in housing fundamentals to pause as homebuyers adjust, resulting in more tepid sales rates per community for the Company. Although rates of improvement in the Company's housing markets may moderate and prices may not continue to increase at rates seen in 2013, it believes that the housing market as a whole is likely to continue to progress over an extended period of time due to a general improvement in overall economic and employment levels; historically low interest rates; slow relaxation of an extremely restrictive mortgage underwriting environment; low production of single-family homes during the recent recession that resulted in low supplies of new and existing inventories of homes; and a steady increase of potential buyers due, in part, to an expected rise in the number of household formations. The Company believes that if mortgage interest rates rise, they will most likely be accompanied by improvements in economic conditions, offsetting their impact on demand, and that healthy, more moderate sales rates should facilitate a more sustainable long-term recovery. These trends, combined with ongoing declines in the number of distressed properties for sale, have led to overall increased demand and a general tightening in the supply of housing inventory in the Company's markets. On average, a return to more traditional required sales incentives has allowed the Company to continue to raise prices in most of its markets. It reported increases of 46.1 percent in closing volume, 27.0 percent in sales volume and 9.8 percent in backlog for the year ended December 31, 2013, compared to 2012. However, high unemployment levels and tepid economic improvements nationally continue to impact the homebuilding industry by keeping sales absorption rates per community below levels historically seen during more robust housing recoveries. The Company believes that continued revenue growth and improved financial performance will come from a greater presence in its established markets and from its entry into new markets, as well as from a return to more traditional absorption rates in its communities made possible by economic stability and growth. The Company also believes that its strategic goals of increasing profitability and leverage through expansion within existing markets and diversification will position it to take full advantage of any continuing housing recovery.
The Company made significant progress in achieving its operational goals during 2013 with a 63.6 percent increase in consolidated revenues; a 1.7 percent rise in housing gross profit margin; and a 2.8 percent decline in the selling, general and administrative expense ratio, all of which led to decisive increases in homebuilding and mortgage operations profitability, compared to the prior year. The number of active communities rose 21.8 percent to 290 active communities at December 31, 2013, from 238 active communities at December 31, 2012. Significant ongoing land acquisitions in its existing markets should enhance the Company's ability to establish additional market penetration and create a platform for future growth. Investments in new communities increased consolidated inventory owned by $578.3 million, or 54.8 percent, at December 31, 2013, compared to December 31, 2012. The Company reversed its deferred tax asset valuation allowance during the year. In addition, it issued $267.5 million of 0.25 percent convertible senior notes due June 2019 during the year to provide additional low-cost capital. As a result of these actions and a profitable year from existing operations, stockholders' equity increased by 80.2 percent, and the net debt-to-capital ratio declined to 45.8 percent at December 31, 2013, compared to 50.8 percent at December 31, 2012.
The Company's net income from continuing operations totaled $379.1 million, or $6.79 per diluted share, for the year ended December 31, 2013, compared to net income of $42.4 million, or $0.88 per diluted share, for 2012 and a net loss of $29.9 million, or $0.67 per diluted share, for 2011. The increase in net income for 2013, compared to 2012, was primarily due to a reversal of the Company's deferred tax asset valuation allowance; a rise in closing volume; higher housing gross profit margin, including lower inventory valuation adjustments and write-offs; a reduced selling, general and administrative expense ratio; and a decline in interest expense. The increase in net income for 2012, compared to 2011, was primarily due to a rise in closing volume; higher housing gross profit margin, including lower inventory and other valuation
19
Table of Contents
adjustments and write-offs; a decline in interest expense; and a reduced selling, general and administrative expense ratio. Pretax charges related to inventory and other valuation adjustments and write-offs totaled $2.0 million, $6.3 million and $17.3 million for the years ended December 31, 2013, 2012 and 2011, respectively. The Company continued to raise gross margins in 2013 by investing in new communities, selectively increasing prices, completing less profitable communities and lowering expense ratios.
The Company's consolidated revenues increased 63.6 percent to $2.1 billion for the year ended December 31, 2013, from $1.3 billion for 2012. This increase was primarily attributable to a 46.1 percent rise in closings and to a 12.5 percent increase in average closing price. The increase in average closing price was due to a more accommodating price environment, as well as to a change in the product and geographic mix of homes delivered during 2013, versus 2012. The Company's consolidated revenues increased 47.1 percent to $1.3 billion for the year ended December 31, 2012, from $889.5 million for 2011. This increase was primarily attributable to a 40.9 percent rise in closings and to a 4.8 percent increase in average closing price. The increase in average closing price was due to a more stable price environment, as well as to a change in the product and geographic mix of homes delivered during 2012, versus 2011. Revenues for the homebuilding and financial services segments totaled $2.1 billion and $51.4 million in 2013, compared to $1.3 billion and $37.6 million in 2012 and $862.6 million and $26.9 million in 2011, respectively.
The Company reported a rise in closing volume for the year ended December 31, 2013, compared to 2012, primarily due to an increase in sales. New orders rose 27.0 percent to 7,262 units for the year ended December 31, 2013, from 5,719 units for 2012 primarily due to an increase in the number of active communities and to higher sales rates. New order dollars increased 47.2 percent for the year ended December 31, 2013, compared to 2012. The Company's average monthly sales absorption rate was 2.3 homes per community for the year ended December 31, 2013, versus 2.2 homes per community for 2012 and 1.5 homes per community for 2011. The Company's average monthly sales absorption rate is calculated as the net new orders in the period divided by the average number of active communities during the period divided by the number of months in that period.
Selling, general and administrative expense totaled 12.1 percent of homebuilding revenues for 2013, compared to 14.9 percent for the same period in 2012. This decrease was primarily attributable to higher leverage that resulted from increased revenues. Selling, general and administrative expense totaled 14.9 percent of homebuilding revenues for 2012, compared to 18.3 percent for 2011. This decrease was primarily attributable to higher leverage resulting from increased revenues, partially offset by higher compensation expense primarily due to the impact of fluctuations in the Company's stock price.
The Company maintained a strong balance sheet, ending the year with $631.2 million in cash, cash equivalents and marketable securities. The Company's earliest senior debt maturity is in 2015. Its net debt-to-capital ratio, including marketable securities, was 45.8 percent at December 31, 2013, compared to 50.8 percent at December 31, 2012. Stockholders' equity per share rose 76.0 percent to $19.64 at December 31, 2013, compared to $11.16 at December 31, 2012.
The net debt-to-capital ratio, including marketable securities, is a non-GAAP financial measure that is calculated as debt, net of cash, cash equivalents and marketable securities, divided by the sum of debt and total stockholders' equity, net of cash, cash equivalents and marketable securities. The Company believes that the net debt-to-capital ratio, including marketable securities, is useful in understanding the leverage employed in its operations and in comparing it with other homebuilders.
Homebuilding Overview
The combined homebuilding operations reported pretax earnings from continuing operations of $203.5 million and $63.9 million for 2013 and 2012, respectively, compared to a pretax loss of $16.8 million for 2011. Homebuilding results in 2013 improved from those in 2012 primarily due to a rise in closing volume; higher housing gross profit margin, including lower inventory valuation adjustments and write-offs; a reduced selling, general and administrative expense ratio; and a decline in interest expense. Homebuilding results in 2012 improved from those in 2011 primarily due to a rise in closing volume; higher housing gross profit margin, including lower inventory and other valuation adjustments and write-offs; a decline in interest expense; and a reduced selling, general and administrative expense ratio.
20
Table of Contents
STATEMENTS OF EARNINGS
| | | | | | | | | | |
| | YEAR ENDED DECEMBER 31, | |
(in thousands, except units) | | | 2013 | | | 2012 | | | 2011 | |
| | |
REVENUES | | | | | | | | | | |
Housing | | $ | 2,082,838 | | $ | 1,263,120 | | $ | 857,180 | |
Land and other | | | 6,537 | | | 7,727 | | | 5,424 | |
| | | | |
TOTAL REVENUES | | | 2,089,375 | | | 1,270,847 | | | 862,604 | |
EXPENSES | | | | | | | | | | |
Cost of sales | | | | | | | | | | |
Housing | | | | | | | | | | |
Cost of sales | | | 1,649,223 | | | 1,017,124 | | | 705,633 | |
Valuation adjustments and write-offs | | | 146 | | | 5,166 | | | 8,336 | |
| | | | |
Total housing cost of sales | | | 1,649,369 | | | 1,022,290 | | | 713,969 | |
Land and other | | | | | | | | | | |
Cost of sales | | | 4,827 | | | 5,182 | | | 4,998 | |
Valuation adjustments and write-offs | | | – | | | – | | | 7,989 | |
| | | | |
Total land and other cost of sales | | | 4,827 | | | 5,182 | | | 12,987 | |
| | | | |
Total cost of sales | | | 1,654,196 | | | 1,027,472 | | | 726,956 | |
Selling, general and administrative | | | 223,295 | | | 163,373 | | | 134,113 | |
Interest | | | 8,358 | | | 16,118 | | | 18,348 | |
| | | | |
TOTAL EXPENSES | | | 1,885,849 | | | 1,206,963 | | | 879,417 | |
| | | | |
PRETAX EARNINGS (LOSS) | | $ | 203,526 | | $ | 63,884 | | $ | (16,813 | ) |
| | |
Closings (units) | | | 7,027 | | | 4,809 | | | 3,413 | |
Housing gross profit margin | | | 20.8 | % | | 19.1 | % | | 16.7 | % |
Selling, general and administrative ratio | | | 10.7 | % | | 12.9 | % | | 15.5 | % |
| | |
Homebuilding revenues increased 64.4 percent to $2.1 billion for 2013 from $1.3 billion for 2012 primarily due to a 46.1 percent rise in closings and to a 12.5 percent increase in average closing price. The increase in closings was due to a 27.0 percent rise in new orders and to a 1.3 percent decrease in cancellation rate during 2013, versus 2012. The increase in average closing price was due to a more accommodating price environment, as well as to a change in the product and geographic mix of homes delivered during 2013, versus 2012. Homebuilding revenues increased 47.3 percent to $1.3 billion for 2012 from $862.6 million for 2011 primarily due to a 40.9 percent rise in closings and to a 4.8 percent increase in average closing price. The increase in closings was due to a 51.8 percent rise in new orders and to a 1.2 percent decrease in cancellation rate during 2012, versus 2011. The increase in average closing price was due to a more accommodating price environment, as well as to a change in the product and geographic mix of homes delivered during 2012, versus 2011.
In order to manage its risk and return of land investments, match land supply with anticipated volume levels and monetize marginal land positions, the Company executed several land and lot sales during the year. Homebuilding revenues included $6.5 million from land and lot sales for the year ended December 31, 2013, compared to $7.7 million for 2012 and $5.4 million for 2011, which resulted in pretax earnings of $1.7 million, $2.5 million and $426,000 for 2013, 2012 and 2011, respectively.
Housing gross profit margin was 20.8 percent for the year ended December 31, 2013, compared to 19.1 percent for the year ended December 31, 2012. This improvement was primarily attributable to reduced relative direct construction costs of 1.7 percent and to lower inventory valuation adjustments and write-offs of 0.4 percent, partially offset by increased land costs of 0.5 percent. Housing gross profit margin was 19.1 percent for the year ended December 31, 2012, compared to 16.7 percent for 2011. This improvement in housing gross profit margin was primarily attributable to reduced relative direct construction costs of 0.9 percent; higher leverage of direct overhead expense of 0.6 percent due to an increase in the number of homes delivered; and lower inventory valuation adjustments of 0.3 percent. Inventory and other valuation adjustments and write-offs affecting housing gross profit margin decreased to $146,000 for the year ended December 31, 2013, from $5.2 million for 2012 and $8.3 million for 2011. Gross profit margin from land and lot sales was 26.2 percent, 32.9 percent and 7.9 percent for the years ended December 31, 2013, 2012 and 2011, respectively. Fluctuations in revenues and gross profit percentages from land and lot sales are a product of local market conditions and changing land
21
Table of Contents
portfolios. The Company generally purchases land and lots with the intent to build homes on those lots and sell them; it will, however, occasionally sell a portion of its land to other homebuilders or third parties.
The homebuilding segments' selling, general and administrative expense ratio totaled 10.7 percent of homebuilding revenues for 2013, 12.9 percent for 2012 and 15.5 percent for 2011. The decrease in the selling, general and administrative expense ratio for 2013, compared to 2012, was primarily attributable to higher leverage resulting from increased revenues. The decrease in the selling, general and administrative expense ratio for 2012, compared to 2011, was primarily attributable to higher leverage resulting from increased revenues, as well as to the impact of cost-saving initiatives.
Interest, which was incurred principally to finance land acquisitions, land development and home construction, totaled $67.6 million, $58.4 million and $56.4 million for the years ended December 31, 2013, 2012 and 2011, respectively. The homebuilding segments recorded $8.4 million, $16.1 million and $18.3 million of interest expense for the years ended December 31, 2013, 2012 and 2011, respectively. The decrease in interest expense in 2013 from 2012 was primarily due to the capitalization of a greater amount of interest incurred during 2013, which resulted from a higher level of inventory under development, partially offset by an overall increase in interest incurred on senior notes. The decrease in interest expense in 2012 from 2011 was primarily due to the capitalization of a greater amount of interest incurred during 2012, which resulted from a higher level of inventory under development, partially offset by an overall increase in interest incurred on senior notes. (See "Housing Inventories" within Note A, "Summary of Significant Accounting Policies.")
New orders represent sales contracts that have been signed by the homebuyer and approved by the Company, subject to cancellations. The dollar value of new orders increased $729.5 million, or 47.2 percent, to $2.3 billion for the year ended December 31, 2013, from $1.5 billion for the year ended December 31, 2012. This increase in new orders was primarily attributable to a 21.8 percent increase in the number of active communities and to a 4.5 percent rise in sales rates. The dollar value of new orders increased 61.9 percent to $1.5 billion for 2012 from $954.0 million for 2011. This increase in new orders was primarily attributable to a 46.7 percent rise in sales rates and to a 12.8 percent increase in the number of active communities. For the years ended December 31, 2013, 2012 and 2011, cancellation rates totaled 17.7 percent, 19.0 percent and 20.2 percent, respectively. Unit orders increased 27.0 percent to 7,262 new orders in 2013, compared to 5,719 new orders in 2012. Unit orders increased 51.8 percent to 5,719 new orders in 2012, compared to 3,767 new orders in 2011.
Consolidated inventory owned by the Company, which includes homes under construction; land under development and improved lots; inventory held-for-sale; and cash deposits related to consolidated inventory not owned, rose 54.8 percent to $1.6 billion at December 31, 2013, from $1.1 billion at December 31, 2012. Homes under construction increased 40.1 percent to $643.4 million at December 31, 2013, from $459.3 million at December 31, 2012, as a result of higher backlog. Land under development and improved lots increased 69.0 percent to $969.8 million at December 31, 2013, compared to $574.0 million at December 31, 2012, as the Company acquired additional land and opened more communities during 2013. The Company had 370 model homes with inventory values totaling $99.3 million at December 31, 2013, compared to 296 model homes with inventory values totaling $67.1 million at December 31, 2012. In addition, it had 977 started and unsold homes with inventory values totaling $196.2 million at December 31, 2013, compared to 724 started and unsold homes with inventory values totaling $120.2 million at December 31, 2012. Inventory held-for-sale totaled $3.5 million at December 31, 2013, compared to $4.7 million at December 31, 2012.
22
Table of Contents
The following table provides certain information with respect to the Company's number of residential communities and lots under development at December 31, 2013:
| | | | | | | | | | | | | | |
| | COMMUNITIES | | | | |
| | ACTIVE | | NEW AND
NOT YET OPEN | | INACTIVE | | HELD-
FOR-SALE | | TOTAL | | TOTAL LOTS
CONTROLLED1 | | |
| | | | |
|
|---|
| | | | | | | | | | | | | | | |
North | | 84 | | 66 | | 7 | | 1 | | 158 | | 13,987 | | |
Southeast | | 89 | | 52 | | 11 | | 7 | | 159 | | 10,553 | | |
Texas | | 83 | | 42 | | – | | 3 | | 128 | | 7,285 | | |
West | | 34 | | 53 | | – | | – | | 87 | | 6,945 | | |
| | | | | | | |
Total | | 290 | | 213 | | 18 | | 11 | | 532 | | 38,770 | | |
| | | |
- 1
- Includes lots controlled through the Company's investments in joint ventures.
Inactive communities consist of projects either under development or on hold for future home sales. At December 31, 2013, of the 11 communities that were held-for-sale, 8 communities had fewer than 20 lots remaining.
Favorable affordability levels and the appearance of recovery in most housing submarkets have allowed the Company to focus on growing inventory and increasing profitability, all while balancing those two objectives with cash preservation. Increasing community count is among the Company's greatest challenges and highest priorities. During the year ended December 31, 2013, it secured 21,751 owned or optioned lots, opened 143 communities and closed 91 communities. The Company operated from 21.8 percent more active communities at December 31, 2013, than it did at December 31, 2012. The number of lots controlled was 38,142 lots at December 31, 2013, compared to 28,305 lots at December 31, 2012. Optioned lots, as a percentage of total lots controlled, were 38.3 percent and 37.2 percent at December 31, 2013 and December 31, 2012, respectively. In addition, the Company controlled 628 lots and 317 lots under joint venture agreements at December 31, 2013 and December 31, 2012, respectively.
23
Table of Contents
Homebuilding Segment Information
The Company's homebuilding operations consist of four geographically determined regional reporting segments: North, Southeast, Texas and West.
STATEMENTS OF EARNINGS
The following table provides a summary of the results for the homebuilding segments for the years ended December 31, 2013, 2012 and 2011:
| | | | | | | | | | |
(in thousands) | | | 2013 | | | 2012 | | | 2011 | |
| | |
NORTH | | | | | | | | | | |
Revenues | | $ | 617,550 | | $ | 393,238 | | $ | 299,595 | |
Expenses | | | | | | | | | | |
Cost of sales | | | 498,084 | | | 324,572 | | | 254,566 | |
Selling, general and administrative | | | 63,612 | | | 50,963 | | | 47,162 | |
Interest | | | 3,414 | | | 6,101 | | | 6,921 | |
| | | | |
Total expenses | | | 565,110 | | | 381,636 | | | 308,649 | |
| | | | |
Pretax earnings (loss) | | $ | 52,440 | | $ | 11,602 | | $ | (9,054 | ) |
Housing gross profit margin | | | 19.3 | % | | 17.5 | % | | 15.0 | % |
| | | | |
SOUTHEAST | | | | | | | | | | |
Revenues | | $ | 597,933 | | $ | 355,621 | | $ | 218,672 | |
Expenses | | | | | | | | | | |
Cost of sales | | | 467,494 | | | 286,450 | | | 189,895 | |
Selling, general and administrative | | | 63,959 | | | 46,399 | | | 35,175 | |
Interest | | | 970 | | | 4,206 | | | 5,278 | |
| | | | |
Total expenses | | | 532,423 | | | 337,055 | | | 230,348 | |
| | | | |
Pretax earnings (loss) | | $ | 65,510 | | $ | 18,566 | | $ | (11,676 | ) |
Housing gross profit margin | | | 21.8 | % | | 19.5 | % | | 16.5 | % |
| | | | |
TEXAS | | | | | | | | | | |
Revenues | | $ | 448,828 | | $ | 323,162 | | $ | 262,321 | |
Expenses | | | | | | | | | | |
Cost of sales | | | 356,768 | | | 257,402 | | | 213,457 | |
Selling, general and administrative | | | 51,753 | | | 39,900 | | | 36,070 | |
Interest | | | 1,277 | | | 2,876 | | | 3,551 | |
| | | | |
Total expenses | | | 409,798 | | | 300,178 | | | 253,078 | |
| | | | |
Pretax earnings | | $ | 39,030 | | $ | 22,984 | | $ | 9,243 | |
Housing gross profit margin | | | 20.5 | % | | 20.4 | % | | 19.1 | % |
| | | | |
WEST | | | | | | | | | | |
Revenues | | $ | 425,064 | | $ | 198,826 | | $ | 82,016 | |
Expenses | | | | | | | | | | |
Cost of sales | | | 331,850 | | | 159,048 | | | 69,038 | |
Selling, general and administrative | | | 43,971 | | | 26,111 | | | 15,706 | |
Interest | | | 2,697 | | | 2,935 | | | 2,598 | |
| | | | |
Total expenses | | | 378,518 | | | 188,094 | | | 87,342 | |
| | | | |
Pretax earnings (loss) | | $ | 46,546 | | $ | 10,732 | | $ | (5,326 | ) |
Housing gross profit margin | | | 21.8 | % | | 19.4 | % | | 15.7 | % |
| | | | |
TOTAL | | | | | | | | | | |
Revenues | | $ | 2,089,375 | | $ | 1,270,847 | | $ | 862,604 | |
Expenses | | | | | | | | | | |
Cost of sales | | | 1,654,196 | | | 1,027,472 | | | 726,956 | |
Selling, general and administrative | | | 223,295 | | | 163,373 | | | 134,113 | |
Interest | | | 8,358 | | | 16,118 | | | 18,348 | |
| | | | |
Total expenses | | | 1,885,849 | | | 1,206,963 | | | 879,417 | |
| | | | |
Pretax earnings (loss) | | $ | 203,526 | | $ | 63,884 | | $ | (16,813 | ) |
Housing gross profit margin | | | 20.8 | % | | 19.1 | % | | 16.7 | % |
| | |
Homebuilding Segments 2013 versus 2012
North—Homebuilding revenues increased 57.0 percent to $617.6 million in 2013 from $393.2 million in 2012 primarily due to a 48.1 percent rise in the number of homes delivered and to a 5.9 percent increase
24
Table of Contents
in average closing price. The increase in the number of homes delivered was broad-based across all markets, with the largest contributions coming from the Chicago, Washington, D.C., and Indianapolis markets. The rise in average closing price was primarily attributable to modest price increases and to the mix of homes delivered in the Baltimore market. Gross profit margin on home sales was 19.3 percent in 2013, compared to 17.5 percent in 2012. This improvement was primarily due to reduced relative direct construction costs of 1.5 percent and to lower option deposit write-offs of 0.8 percent, partially offset by higher land costs of 0.5 percent. As a result, the North region generated pretax earnings of $52.4 million in 2013, compared to pretax earnings of $11.6 million in 2012.
Southeast—Homebuilding revenues increased 68.1 percent to $597.9 million in 2013 from $355.6 million in 2012 primarily due to a 46.9 percent rise in the number of homes delivered and to a 14.7 percent increase in average closing price. The increases in the number of homes delivered and average closing price were broad-based across all markets as general market conditions improved in the region. Gross profit margin on home sales was 21.8 percent in 2013, compared to 19.5 percent in 2012. This improvement was primarily due to reduced relative direct construction costs of 1.3 percent; lower land costs of 0.6 percent; and higher leverage of direct overhead expense of 0.4 percent, which was due to an increase in the number of homes delivered and to a higher average closing price. As a result, the Southeast region generated pretax earnings of $65.5 million in 2013, compared to pretax earnings of $18.6 million in 2012.
Texas—Homebuilding revenues increased 38.9 percent to $448.8 million in 2013 from $323.2 million in 2012 primarily due to a 21.9 percent rise in the number of homes delivered and to a 13.9 percent increase in average closing price. The rise in the number of homes delivered was impacted by the Company's re-entry into the Dallas market in the second quarter of 2013 and to increases in demand and the number of communities in the Houston market. The increase in average closing price was broad-based across all markets. Gross profit margin on home sales was 20.5 percent in 2013, compared to 20.4 percent in 2012. This improvement was primarily due to reduced relative direct construction costs of 0.1 percent; lower land costs of 0.1 percent; and a decrease in warranty costs of 0.1 percent, partially offset by higher mortgage and closing costs of 0.2 percent. As a result, the Texas region generated pretax earnings of $39.0 million in 2013, compared to pretax earnings of $23.0 million in 2012.
West—Homebuilding revenues increased 113.8 percent to $425.1 million in 2013 from $198.8 million in 2012 primarily due to an 88.4 percent rise in the number of homes delivered and to a 15.6 percent increase in average closing price. The increase in the number of homes delivered was broad-based across all markets, with the largest contributions coming from the Las Vegas and Southern California markets and from the Company's re-entry into the Phoenix market in the fourth quarter of 2012. The increase in average closing price was most dramatic in the Southern California and Las Vegas markets, partially offset by a slightly lower price mix of homes in the Denver market. Gross profit margin on home sales was 21.8 percent in 2013, compared to 19.4 percent in 2012. This improvement was primarily due to reduced relative direct construction costs of 2.0 percent and to lower inventory valuation adjustments of 1.0 percent, partially offset by increased land costs of 0.8 percent. As a result, the West region generated pretax earnings of $46.5 million in 2013, compared to pretax earnings of $10.7 million in 2012.
Homebuilding Segments 2012 versus 2011
North—Homebuilding revenues increased 31.3 percent to $393.2 million in 2012 from $299.6 million in 2011 primarily due to a 23.9 percent rise in the number of homes delivered and to a 5.5 percent increase in average closing price. The increase in the number of homes delivered was highest in the Indianapolis and Minneapolis markets, partially offset by a slight decrease in the Washington, D.C., market due to delays in community openings. Gross profit margin on home sales was 17.5 percent in 2012, compared to 15.0 percent in 2011. This improvement was primarily due to a decrease in joint venture impairments of 0.8 percent, higher leverage of direct overhead expense of 0.7 percent, reduced relative direct construction costs of 0.5 percent and lower inventory valuation adjustments of 0.3 percent. As a result, the North region generated pretax earnings of $11.6 million in 2012, compared to a pretax loss of $9.1 million in 2011.
Southeast—Homebuilding revenues increased 62.6 percent to $355.6 million in 2012 from $218.7 million in 2011 primarily due to a 59.5 percent rise in the number of homes delivered and to a 3.2 percent increase in average closing price. The increase in the number of homes delivered was experienced across all markets, with the largest contributions coming from the Orlando market and from the Company's
25
Table of Contents
acquisition of Timberstone Homes in the Charlotte and Raleigh markets. Gross profit margin on home sales was 19.5 percent in 2012, compared to 16.5 percent in 2011. This improvement was primarily due to a decline in inventory valuation adjustments of 1.1 percent; higher leverage of direct overhead expense of 0.8 percent; reduced relative direct construction costs of 0.5 percent; and a decline in land costs of 0.4 percent. As a result, the Southeast region generated pretax earnings of $18.6 million in 2012, compared to a pretax loss of $11.7 million in 2011.
Texas—Homebuilding revenues increased 23.2 percent to $323.2 million in 2012 from $262.3 million in 2011 primarily due to a 19.0 percent rise in the number of homes delivered and to a 3.2 percent increase in average closing price. The increase in the number of homes delivered was most dramatic in the Houston market. Gross profit margin on home sales was 20.4 percent in 2012, compared to 19.1 percent in 2011. This improvement was primarily due to a decline in land and mortgage closing costs of 1.0 percent and to reduced relative direct construction of 0.1 percent, partially offset by higher warranty costs of 0.3 percent. As a result, the Texas region generated pretax earnings of $23.0 million in 2012, compared to pretax earnings of $9.2 million in 2011.
West—Homebuilding revenues increased 142.4 percent to $198.8 million in 2012 from $82.0 million in 2011 primarily due to a 125.9 percent rise in the number of homes delivered and to a 7.2 percent increase in average closing price. The increase in the number of homes delivered was broad-based across all markets, with the largest contributions coming from the Las Vegas and Denver markets. The increase in average closing price was concentrated in the Denver market and was the result of the mix of homes closed. Gross profit margin on home sales was 19.4 percent in 2012, compared to 15.7 percent in 2011. This improvement was primarily due to higher leverage of direct overhead expense of 1.4 percent, reduced relative direct construction costs of 1.0 percent and lower warranty costs of 0.7 percent. As a result, the West region generated pretax earnings of $10.7 million in 2012, compared to a pretax loss of $5.3 million in 2011.
Closings
The following table provides the Company's closings and average closing prices for the years ended December 31, 2013, 2012 and 2011:
| | | | | | | | | | | | | | | | |
| | | 2013 | | % CHG | | | 2012 | | % CHG | | | 2011 | | % CHG | |
| | |
UNITS | | | | | | | | | | | | | | | | |
North | | | 2,032 | | 48.1 | % | | 1,372 | | 23.9 | % | | 1,107 | | (13.5 | )% |
Southeast | | | 2,315 | | 46.9 | | | 1,576 | | 59.5 | | | 988 | | (14.4 | ) |
Texas | | | 1,514 | | 21.9 | | | 1,242 | | 19.0 | | | 1,044 | | 7.2 | |
West | | | 1,166 | | 88.4 | | | 619 | | 125.9 | | | 274 | | (48.4 | ) |
| | | | | | | | |
| | | | | | | | | | | | | | | | | |
Total | | | 7,027 | | 46.1 | % | | 4,809 | | 40.9 | % | | 3,413 | | (13.4 | )% |
| | | | | | | | |
| | | | | | | | | | | | | | | | | |
AVERAGE PRICE(in thousands) | | | | | | | | | | | | | | | | |
North | | $ | 303 | | 5.9 | % | $ | 286 | | 5.5 | % | $ | 271 | | 1.9 | % |
Southeast | | | 258 | | 14.7 | | | 225 | | 3.2 | | | 218 | | (3.1 | ) |
Texas | | | 295 | | 13.9 | | | 259 | | 3.2 | | | 251 | | 0.8 | |
West | | | 363 | | 15.6 | | | 314 | | 7.2 | | | 293 | | 26.8 | |
| | | | | | | | |
| | | | | | | | | | | | | | | | | |
Total | | $ | 296 | | 12.5 | % | $ | 263 | | 4.8 | % | $ | 251 | | 2.4 | % |
| | |
New Orders
New orders increased 27.0 percent to 7,262 units for the year ended December 31, 2013, from 5,719 units for 2012, and new order dollars rose 47.2 percent for 2013, compared to 2012. The overall increase in new orders was primarily due to a 21.8 percent rise in active communities and to higher sales rates, although broader market trends and economic conditions that contribute to soft demand for residential housing persist. The Company's Atlanta, Chicago, Denver and Washington, D.C., markets had the largest year-over-year increases in new orders. Additionally, the Company's entry into Philadelphia and re-entry into Dallas contributed to its overall increase in new orders for 2013. New orders for 2013, compared to 2012, rose 42.9 percent in the North primarily due to an increase in the number of active communities and to higher sales rates. New orders for 2013, compared to 2012, rose 15.5 percent in the Southeast primarily due to an increase in the number of active communities, partially offset by lower sales rates. New orders for 2013, compared to 2012, rose 28.4 percent in Texas primarily due to an increase in the number
26
Table of Contents
of active communities and to higher sales rates. New orders for 2013, compared to 2012, rose 22.0 percent in the West primarily due to an increase in the number of active communities, partially offset by lower sales rates. New orders for 2012, compared to 2011, rose 32.0 percent in the North primarily due to higher sales rates and to an increase in the number of active communities. New orders for 2012, compared to 2011, rose 65.2 percent in the Southeast primarily due to an increase in the number of active communities and to higher sales rates. New orders for 2012, compared to 2011, rose 19.4 percent in Texas primarily due to higher sales rates, partially offset by a decrease in the number of active communities. New orders for 2012, compared to 2011, rose 182.3 percent in the West primarily due to higher sales rates and to an increase in the number of active communities. The Company's average monthly sales absorption rate was 2.3 homes per community for year ended December 31, 2013, versus 2.2 and 1.5 homes per community for the same periods in 2012 and 2011, respectively.
The following table provides the number of the Company's active communities:
| | | | | | | | | | | | | | | | | | | |
| | DECEMBER 31, | |
| | | 2013 | | | % CHG | | | 2012 | | | % CHG | | | 2011 | | | % CHG | |
| | |
North | | | 84 | | | 25.4 | % | | 67 | | | 8.1 | % | | 62 | | | 6.9 | % |
Southeast | | | 89 | | | 4.7 | | | 85 | | | 39.3 | | | 61 | | | 13.0 | |
Texas | | | 83 | | | 45.6 | | | 57 | | | (14.9 | ) | | 67 | | | 1.5 | |
West | | | 34 | | | 17.2 | | | 29 | | | 38.1 | | | 21 | | | 40.0 | |
| | | | | | | | |
| | | | | | | | | | | | | | | | | | | | |
Total | | | 290 | | | 21.8 | % | | 238 | | | 12.8 | % | | 211 | | | 9.3 | % |
| | |
The Company experiences seasonal variations in its quarterly operating results and capital requirements. Historically, new order activity is higher in the spring and summer months. As a result, the Company typically has more homes under construction, closes more homes, and has greater revenues and operating income in the third and fourth quarters of its fiscal year. Historical results, however, are not necessarily indicative of current or future homebuilding activities.
The following table provides the Company's new orders (units and aggregate sales values) for the years ended December 31, 2013, 2012 and 2011:
| | | | | | | | | | | | | | | | |
| | | 2013 | | % CHG | | | 2012 | | % CHG | | | 2011 | | % CHG | |
| | |
UNITS | | | | | | | | | | | | | | | | |
North | | | 2,245 | | 42.9 | % | | 1,571 | | 32.0 | % | | 1,190 | | 8.5 | % |
Southeast | | | 2,236 | | 15.5 | | | 1,936 | | 65.2 | | | 1,172 | | 13.2 | |
Texas | | | 1,651 | | 28.4 | | | 1,286 | | 19.4 | | | 1,077 | | 15.6 | |
West | | | 1,130 | | 22.0 | | | 926 | | 182.3 | | | 328 | | (9.9 | ) |
| | | | | | | | |
| | | | | | | | | | | | | | | | | |
Total | | | 7,262 | | 27.0 | % | | 5,719 | | 51.8 | % | | 3,767 | | 9.9 | % |
| | | | | | | | |
| | | | | | | | | | | | | | | | | |
DOLLARS(in millions) | | | | | | | | | | | | | | | | |
North | | $ | 695 | | 50.9 | % | $ | 461 | | 41.5 | % | $ | 326 | | 12.5 | % |
Southeast | | | 618 | | 36.2 | | | 454 | | 79.3 | | | 253 | | 13.3 | |
Texas | | | 510 | | 47.7 | | | 345 | | 26.7 | | | 272 | | 17.9 | |
West | | | 451 | | 58.2 | | | 285 | | 177.1 | | | 103 | | 13.9 | |
| | | | | | | | |
| | | | | | | | | | | | | | | | | |
Total | | $ | 2,274 | | 47.2 | % | $ | 1,545 | | 61.9 | % | $ | 954 | | 14.4 | % |
| | |
The following table provides the Company's cancellation rates for the years ended December 31, 2013, 2012 and 2011:
| | | | | | | | | | | | | | | | |
| | | | | | | | | | 2013 | | | 2012 | | 2011 | |
| | |
North | | | | | | | | | | 15.8 | % | | 19.4 | % | 19.4 | % |
Southeast | | | | | | | | | | 18.0 | | | 18.3 | | 18.7 | |
Texas | | | | | | | | | | 20.4 | | | 22.2 | | 21.9 | |
West | | | | | | | | | | 16.7 | | | 14.9 | | 22.3 | |
| | | | | | | | | | | | |
Total | | | | | | | | | | 17.7 | % | | 19.0 | % | 20.2 | % |
| | |
27
Table of Contents
The following table provides the Company's sales incentives and price concessions (average dollar value per unit closed and percentage of revenues) for the years ended December 31, 2013, 2012 and 2011:
| | | | | | | | | | | | | | | | | | | |
| | | 2013 | | | 2012 | | | 2011 | |
| | | | |
(in thousands) | | | AVG $
PER UNIT | | | % OF
REVENUES | | | AVG $
PER UNIT | | | % OF
REVENUES | | | AVG $
PER UNIT | | | % OF
REVENUES | |
| | | | | | |
North | | $ | 17 | | | 5.4 | % | $ | 25 | | | 8.0 | % | $ | 29 | | | 9.6 | % |
Southeast | | | 20 | | | 7.2 | | | 23 | | | 9.3 | | | 26 | | | 10.7 | |
Texas | | | 36 | | | 10.9 | | | 40 | | | 13.5 | | | 40 | | | 13.8 | |
West | | | 14 | | | 3.8 | | | 21 | | | 6.3 | | | 29 | | | 9.2 | |
| | | | | | | | |
| | | | | | | | | | | | | | | | | | | | |
Total | | $ | 22 | | | 6.8 | % | $ | 28 | | | 9.6 | % | $ | 31 | | | 11.2 | % |
| | |
Outstanding Contracts
Outstanding contracts denote the Company's backlog of homes sold, but not closed, which are generally built and closed, subject to cancellations, over the subsequent two quarters. At December 31, 2013, the Company had outstanding contracts for 2,626 units, representing a 9.8 percent increase from 2,391 units at December 31, 2012, primarily due to a 27.0 percent rise in unit orders during 2013, compared to 2012. The $854.8 million value of outstanding contracts at December 31, 2013, represented a 28.9 percent increase from $663.4 million at December 31, 2012.
The following table provides the Company's outstanding contracts (units, aggregate dollar values and average prices) at December 31, 2013, 2012 and 2011:
| | | | | | | | | | | | | | | | | | | | | | | | | | | | |
| | DECEMBER 31, 2013 | | DECEMBER 31, 2012 | | DECEMBER 31, 2011 | |
| | | UNITS | | | DOLLARS
(in millions) | | | AVERAGE
PRICE
(in thousands) | | | UNITS | | | DOLLARS
(in millions) | | | AVERAGE
PRICE
(in thousands) | | | UNITS | | | DOLLARS
(in millions) | | | AVERAGE
PRICE
(in thousands) | |
| | |
North | | | 832 | | $ | 267 | | $ | 321 | | | 619 | | $ | 188 | | $ | 305 | | | 420 | | $ | 121 | | $ | 288 | |
Southeast | | | 802 | | | 233 | | | 290 | | | 881 | | | 211 | | | 239 | | | 521 | | | 111 | | | 214 | |
Texas | | | 614 | | | 198 | | | 322 | | | 477 | | | 135 | | | 283 | | | 433 | | | 112 | | | 258 | |
West | | | 378 | | | 157 | | | 416 | | | 414 | | | 129 | | | 311 | | | 107 | | | 38 | | | 353 | |
| | | | | | | | |
| | | | | | | | | | | | | | | | | | | | | | | | | | | | | |
Total | | | 2,626 | | $ | 855 | | $ | 326 | | | 2,391 | | $ | 663 | | $ | 277 | | | 1,481 | | $ | 382 | | $ | 258 | |
| | |
At December 31, 2013, the Company anticipates that approximately 55 percent of its outstanding contracts will close during the first quarter of 2014, subject to cancellations.
Impairments
As required by the Financial Accounting Standards Board's ("FASB") Accounting Standards Codification ("ASC") No. 360 ("ASC 360"), "Property, Plant and Equipment," inventory is reviewed for potential write-downs on an ongoing basis. ASC 360 requires that, in the event that impairment indicators are present and undiscounted cash flows signify that the carrying amount of an asset is not recoverable, impairment charges must be recorded if the fair value of the asset is less than its carrying amount. (See "Housing Inventories" within Note A, "Summary of Significant Accounting Policies.")
28
Table of Contents
The following table provides the total inventory and other valuation adjustments and write-offs taken during the years ended December 31, 2013, 2012 and 2011:
| | | | | | | | | | |
(in thousands) | | | 2013 | | | 2012 | | | 2011 | |
| | |
North | | | | | | | | | | |
Inventory impairment charges | | $ | – | | $ | – | | $ | 2,993 | |
Joint venture and other valuation adjustments and write-offs | | | – | | | – | | | 1,889 | |
Option deposit and preacquisition feasibility cost write-offs | | | 344 | | | 3,580 | | | 849 | |
| | | | |
Total | | | 344 | | | 3,580 | | | 5,731 | |
Southeast | | | | | | | | | | |
Inventory impairment charges | | | – | | | – | | | 8,673 | |
Joint venture and other valuation adjustments and write-offs | | | 154 | | | 8 | | | 25 | |
Option deposit and preacquisition feasibility cost write-offs | | | 714 | | | 251 | | | 316 | |
| | | | |
Total | | | 868 | | | 259 | | | 9,014 | |
Texas | | | | | | | | | | |
Inventory impairment charges | | | – | | | – | | | 1,624 | |
Option deposit and preacquisition feasibility cost write-offs | | | 232 | | | 119 | | | 26 | |
| | | | |
Total | | | 232 | | | 119 | | | 1,650 | |
West | | | | | | | | | | |
Inventory impairment charges | | | – | | | 1,880 | | | 437 | |
Joint venture and other valuation adjustments and write-offs | | | – | | | 140 | | | (6 | ) |
Option deposit and preacquisition feasibility cost write-offs | | | 578 | | | 284 | | | 493 | |
| | | | |
Total | | | 578 | | | 2,304 | | | 924 | |
Total | | | | | | | | | | |
Inventory impairment charges | | | – | | | 1,880 | | | 13,727 | |
Joint venture and other valuation adjustments and write-offs | | | 154 | | | 148 | | | 1,908 | |
Option deposit and preacquisition feasibility cost write-offs | | | 1,868 | | | 4,234 | | | 1,684 | |
| | | | |
Total | | $ | 2,022 | | $ | 6,262 | | $ | 17,319 | |
| | |
Additionally, the Company had $1.9 million and $16.0 million of inventory and other valuation adjustments and write-offs associated with its discontinued operations in 2012 and 2011, respectively.
During 2013, no communities were impaired. During 2012, one community in the West in which the Company expects to build homes was impaired for a total of $1.9 million due to declining prices that resulted from the competitive pressures of new, resale and distressed properties. During 2011, a total of 18 communities were impaired. Of those, eight communities in which the Company expects to build homes were impaired for a total of $5.7 million and ten communities with land or lots held-for-sale were impaired for a total of $8.0 million due to declining prices that resulted from the competitive pressures of new, resale and distressed properties. Should market conditions deteriorate or costs increase, it is possible that the Company's estimates of undiscounted cash flows from its communities could decline, resulting in additional future impairment charges. Additionally, the Company impaired 2 communities and 20 communities associated with its discontinued operations in 2012 and 2011, respectively.
The Company periodically writes off earnest money deposits and preacquisition feasibility costs related to land and lot option purchase contracts that it no longer plans to pursue. The Company recovered $8,000 in earnest money deposits and wrote off $1.9 million of preacquisition feasibility costs during 2013. The Company wrote off $3.2 million and $996,000 of earnest money deposits and preacquisition feasibility costs, respectively, during 2012, compared to $690,000 and $994,000, respectively, during 2011. Should homebuilding market conditions weaken or the Company be unsuccessful in renegotiating certain land option purchase contracts, it may write off additional earnest money deposits and preacquisition feasibility costs in future periods.
Investments in Joint Ventures
As of December 31, 2013, the Company participated in six active homebuilding joint ventures in the Austin, Chicago, Denver, San Antonio and Washington, D.C., markets. These joint ventures exist for the purpose of acquisition and co-development of land parcels and lots, which are then sold to the Company, its joint venture partners or others at market prices. The Company's investments in its unconsolidated joint ventures totaled $12.6 million at December 31, 2013, compared to $8.3 million at December 31, 2012. The increase in the Company's investments in unconsolidated joint ventures was primarily due to its
29
Table of Contents
investment in a joint venture in San Antonio during 2013. The Company's equity in earnings from its unconsolidated joint ventures totaled $1.2 million for the years ended December 31, 2013 and 2012. For the year ended December 31, 2011, the Company's equity in losses from its unconsolidated joint ventures totaled $976,000 primarily as a result of a $1.9 million impairment related to a commercial parcel in a joint venture in Chicago. (See "Investments in Joint Ventures" within Note A, "Summary of Significant Accounting Policies.")
Financial Services
The Company's financial services segment provides mortgage-related products and services, as well as title and escrow services, to its homebuyers. By aligning its operations with the Company's homebuilding segments, the financial services segment leverages this relationship to offer its lending services to homebuyers. Providing mortgage financing and other services to its customers helps the Company monitor its backlog and closing process. Substantially all of the loans the Company originates are sold within a short period of time in the secondary mortgage market on a servicing-released basis. The third-party investor then services and manages the loans. The fair values of the Company's mortgage loans held-for-sale totaled $139.6 million and $108.0 million at December 31, 2013 and 2012, respectively.
STATEMENTS OF EARNINGS
| | | | | | | | | | |
| | YEAR ENDED DECEMBER 31, | |
(in thousands, except units) | | | 2013 | | | 2012 | | | 2011 | |
| | |
REVENUES | | | | | | | | | | |
Income from origination and sale of mortgage loans, net | | $ | 39,158 | | $ | 28,634 | | $ | 19,873 | |
Title, escrow and insurance | | | 9,990 | | | 7,199 | | | 5,895 | |
Interest and other | | | 2,232 | | | 1,786 | | | 1,159 | |
| | | | |
TOTAL REVENUES | | | 51,380 | | | 37,619 | | | 26,927 | |
EXPENSES | | | 31,312 | | | 24,477 | | | 21,188 | |
| | | | |
PRETAX EARNINGS | | $ | 20,068 | | $ | 13,142 | | $ | 5,739 | |
| | |
Originations(units) | | | 4,007 | | | 3,039 | | | 2,556 | |
Ryland Homes origination capture rate | | | 66.3 | % | | 68.1 | % | | 75.7 | % |
| | |
In 2013, RMC's mortgage origination operations consisted primarily of mortgage loans originated in connection with the sale of the Company's homes. The number of mortgage originations was 4,007 in 2013, compared to 3,039 in 2012 and 2,556 in 2011. During 2013, origination volume totaled $1.0 billion. The vast majority of this amount was used for purchasing homes built by the Company, while the remainder was used for either purchasing homes built by others, purchasing existing homes or refinancing existing mortgage loans. The capture rate of mortgages originated for customers of the Company's homebuilding operations was 66.3 percent in 2013, compared to 68.1 percent in 2012 and 75.7 percent in 2011. Approximately nine percent of the Company's homebuyers did not finance their home purchase with a mortgage.
The financial services segment reported pretax earnings of $20.1 million, $13.1 million and $5.7 million for the years ended December 31, 2013, 2012 and 2011, respectively. The rise in pretax earnings for 2013, compared to 2012, was primarily due to increases in locked loan pipeline and origination volumes, as well as to a rise in title income, partially offset by increased personnel costs and by higher expense related to estimates of ultimate insurance loss liability. The increase in the locked loan pipeline was due, in part, to an acceleration in the timing of loan locks during the second and third quarters of 2013, which resulted from a rapid increase in mortgage interest rates during that period. Reversion of the unusually high level of the Company's locked loan pipeline to more typical levels began in the fourth quarter of 2013 and, subject to interest rate fluctuations, is expected to continue in 2014. The rise in pretax earnings for 2012, compared to 2011, was primarily due to increases in locked loan pipeline and origination volumes and to higher title income, partially offset by a rise in personnel and legal expenses and by interest related to the financial services credit facility that was entered into during December 2011.
Revenues for the financial services segment totaled $51.4 million in 2013, compared to $37.6 million in 2012 and $26.9 million in 2011. The 36.6 percent increase in revenues for 2013, compared to 2012, was primarily due to increases in locked loan pipeline and origination volumes, as well as to a rise in title income. The 39.7 percent increase in revenues for 2012, compared to 2011, was primarily due to increases in locked loan pipeline and origination volumes, as well as to a rise in title income.
30
Table of Contents
During 2013, financial services expense totaled $31.3 million and included $15.8 million related to direct expenses of RMC's mortgage operations; $7.4 million related to operating and other expenses; $6.5 million related to title and insurance expenses; and $1.6 million related to loan indemnification expense. Financial services expense totaled $24.5 million for 2012. The rise in expense for 2013 from 2012 was primarily attributable to increased personnel costs and to higher expense related to estimates of ultimate insurance loss liability. Financial services expense for 2012 increased to $24.5 million from $21.2 million for 2011 primarily due to higher personnel and legal expenses and to interest related to the financial services credit facility that was entered into during December 2011.
In 2013, 98.0 percent of the loans originated by RMC had fixed interest rates. Approximately 43 percent were government loans and 57 percent were prime loans. Prime mortgage loans are generally defined as agency-eligible loans (Fannie Mae/Freddie Mac) and any nonconforming loans that would otherwise meet agency criteria. Currently, these loans are generally obtained by borrowers with Fair Isaac Corporation ("FICO") credit scores that exceed 620. During 2013, RMC did not originate mortgage loans classified as subprime, reduced documentation or pay-option adjustable-rate. During 2013, the mortgage loans originated by RMC were sold to third-party investors such as Wells Fargo, PennyMac, and JPMorgan Chase Bank, N.A. ("JPM"). The Company has a repurchase credit facility with JPM to fund, and is secured by, mortgages that were originated by RMC and are pending sale. RMC is typically not required to repurchase mortgage loans. (See Note F, "Fair Values of Financial and Nonfinancial Instruments.") Generally, the Company is required to indemnify its investors to which mortgage loans are sold if it is shown that there has been undiscovered fraud on the part of the borrower; if there are losses due to origination deficiencies attributable to RMC; or if the borrower does not make a first payment. The Company incurred $1.6 million in loan indemnification expense during the year ended December 31, 2013, compared to $1.4 million during 2012 and 2011, and held loan loss or related litigation reserves of $11.5 million and $10.5 million for payment of future indemnifications at December 31, 2013 and 2012, respectively. (See Note K, "Commitments and Contingencies.")
Early Retirement of Debt
There were no pretax charges related to early retirement of debt during the year ended December 31, 2013. Pretax charges related to early retirement of debt totaled $9.1 million and $1.6 million in 2012 and 2011, respectively.
Income Taxes
Deferred tax assets are recognized for estimated tax effects that are attributable to deductible temporary differences and tax carryforwards related to tax credits and NOLs. They are realized when existing temporary differences are carried back to a profitable year(s) and/or carried forward to a future year(s) having taxable income. Deferred tax assets are reduced by a valuation allowance if an assessment of their components indicates that it is more likely than not that all or some portion of these assets will not be realized. In the assessment for a valuation allowance, appropriate consideration is given to all positive and negative evidence related to the realization of the deferred tax assets. This assessment considers, among other matters, the nature, frequency and severity of current and cumulative losses; actual earnings; forecasts of future earnings; the duration of statutory carryforward periods; the Company's experience with NOL carryforwards not expiring unused; and tax planning alternatives.
At June 30, 2013, the Company determined that it was more likely than not that its deferred tax assets will be realized, which resulted in a $187.5 million reversal of the valuation allowance against its deferred tax assets, which was calculated on an annual basis, during the second quarter of 2013. After the reversal, the Company had a valuation allowance of $46.4 million against its deferred tax assets, which represented an estimation of the allowance required for the second half of 2013. At December 31, 2013, the Company had no valuation allowance against its deferred tax assets.
Financial Condition and Liquidity
The Company has historically funded its homebuilding and financial services operations with cash flows from operating activities; the issuance of new debt securities; and borrowings under a repurchase credit facility. In light of current market conditions, the Company is focused on maintaining a strong balance sheet by generating cash from existing communities and by extending debt maturities when market
31
Table of Contents
conditions are favorable, as well as by investing in new communities to facilitate continued growth and profitability. As a result of this strategy, the Company opened 143 new communities during 2013; issued $267.5 million of 0.25 percent convertible senior notes; has no senior debt maturities until 2015; and ended the year with $631.2 million in cash, cash equivalents and marketable securities.
| | | | | | | |
| | DECEMBER 31, | |
(in millions) | | | 2013 | | | 2012 | |
| | |
Cash, cash equivalents and marketable securities | | $ | 631 | | $ | 615 | |
Housing inventories1 | | | 1,634 | | | 1,056 | |
Debt | | | 1,397 | | | 1,134 | |
Stockholders' equity | | $ | 908 | | $ | 504 | |
Net debt-to-capital ratio, including marketable securities | | | 45.8 | % | | 50.8 | % |
| | |
- 1
- Excludes consolidated inventory not owned, net of cash deposits.
Consolidated inventory owned by the Company increased 54.8 percent to $1.6 billion at December 31, 2013, compared to $1.1 billion at December 31, 2012. The Company is currently attempting to grow at an accelerated rate and strives to maintain a projected three- to four-year supply of land, assuming historically normalized sales rates. At December 31, 2013, it controlled 38,142 lots, with 23,540 lots owned and 14,602 lots, or 38.3 percent, under option. Lots controlled increased 34.8 percent at December 31, 2013, from 28,305 lots controlled at December 31, 2012. The Company also controlled 628 lots and 317 lots under joint venture agreements at December 31, 2013 and December 31, 2012, respectively. (See "Housing Inventories" and "Investments in Joint Ventures" within Note A, "Summary of Significant Accounting Policies.")
The Company's operating profit margin, which is calculated as operating profit divided by total homebuilding revenues, increased to 9.7 percent for the year ended December 31, 2013, compared to 5.0 percent for 2012 and negative 1.9 percent for 2011.
At December 31, 2013, the Company's net debt-to-capital ratio, including marketable securities, decreased to 45.8 percent from 50.8 percent at December 31, 2012. The Company remains focused on maintaining its liquidity so that it can be flexible in reacting to changing market conditions. The Company had $631.2 million and $614.6 million in cash, cash equivalents and marketable securities at December 31, 2013 and 2012, respectively.
The following table provides the Company's cash flow activities from continuing operations for the years ended December 31, 2013, 2012 and 2011:
| | | | | | | | | | |
(in thousands) | | | 2013 | | | 2012 | | | 2011 | |
| | |
Net cash from continuing operations provided by (used for): | | | | | | | | | | |
Operating activities | | $ | (267,968 | ) | $ | (121,179 | ) | $ | (157,668 | ) |
Investing activities | | | (950 | ) | | (125,127 | ) | | 81,958 | |
Financing activities | | | 338,817 | | | 245,113 | | | 8,112 | |
| | | | |
Net increase (decrease) in cash and cash equivalents from continuing operations | | $ | 69,899 | | $ | (1,193 | ) | $ | (67,598 | ) |
| | |
(Decrease) increase in investments in marketable securities, available-for-sale, net | | $ | (72,470 | ) | $ | 38,776 | | $ | (90,426 | ) |
| | |
During 2013, the Company used $268.0 million of cash for operating activities from continuing operations, which included cash outflows related to a $542.0 million increase in inventories, partially offset by cash inflows of $161.7 million from current year net income from continuing operations and $112.3 million from changes in assets and liabilities, and other operating activities. Investing activities from continuing operations used $950,000, which included cash outflows of $50.9 million related to business acquisitions, $19.9 million related to property, plant and equipment, and $3.2 million related to net contributions to unconsolidated joint ventures, partially offset by cash inflows of $73.1 million related to net investments in marketable securities. Financing activities from continuing operations provided $338.8 million, which included cash inflows of a $262.2 million net increase in senior debt and short-term borrowings, $73.1 million in net borrowings against the Company's financial services credit facility and $28.2 million from the issuance of common stock under stock-based compensation, partially offset by cash outflows related to an
32
Table of Contents
increase of $19.1 million in restricted cash and to payments of $5.5 million for dividends. Net cash provided by continuing operations during 2013 totaled $69.9 million.
During 2012, the Company used $121.2 million of cash for operating activities from continuing operations, which included cash outflows related to a $236.5 million increase in inventories, partially offset by cash inflows of $78.9 million from current year net income from continuing operations and $36.4 million from changes in assets and liabilities, and other operating activities. Investing activities from continuing operations used $125.1 million, which included cash outflows of $80.2 million related to business acquisitions, $35.1 million related to net investments in marketable securities and $12.2 million related to property, plant and equipment, partially offset by cash inflows of $2.3 million related to a net return of investment in unconsolidated joint ventures. Financing activities from continuing operations provided $245.1 million, which included cash inflows related to a $299.9 million net increase in senior debt and short-term borrowings and to $14.4 million from the issuance of common stock under stock-based compensation, partially offset by cash outflows related to a $49.9 million net decrease in borrowings against the Company's financial services credit facility, an increase of $13.8 million in restricted cash and payments of $5.4 million for dividends. Net cash used for continuing operations during 2012 totaled $1.2 million.
During 2011, the Company used $157.7 million of cash for operating activities from continuing operations, which included cash outflows related to $100.3 million from changes in assets and liabilities, and other operating activities and to an $86.0 million increase in inventories, partially offset by cash inflows of $28.6 million from current year net income from continuing operations. Investing activities from continuing operations provided $82.0 million, which included cash inflows of $90.8 million related to net investments in marketable securities and $2.0 million related to a net return of investment in unconsolidated joint ventures, partially offset by cash outflows of $11.0 million related to property, plant and equipment. Financing activities from continuing operations provided $8.1 million, which included cash inflows related to a $49.9 million increase in net borrowings against the Company's financial services credit facility, a decline of $18.0 million in restricted cash and $3.6 million from the issuance of common stock under stock-based compensation, partially offset by cash outflows related to a $58.0 million net decrease in senior debt and short-term borrowings and to payments of $5.4 million for dividends. The net cash used for continuing operations during 2011 totaled $67.6 million.
Dividends declared totaled $0.12 per share for the annual periods ended December 31, 2013, 2012 and 2011.
For the year ended December 31, 2013, borrowing arrangements for the homebuilding segments included senior notes, convertible senior notes and nonrecourse secured notes payable.
Senior Notes and Convertible Senior Notes
Senior notes outstanding, net of discount, totaled $1.4 billion and $1.1 billion at December 31, 2013 and 2012, respectively.
During 2013, the Company issued $267.5 million of 0.25 percent convertible senior notes due June 2019. The Company will pay interest on the notes on June 1 and December 1 of each year, which commenced on December 1, 2013. The notes, which mature on June 1, 2019, are initially convertible into shares of the Company's common stock at a conversion rate of 13.3307 shares per $1,000 of their principal amount. This corresponds to an initial conversion price of approximately $75.01 per share. The conversion rate of the notes is subject to adjustment for a notice of redemption or for certain events. The Company received net proceeds of $260.1 million from this offering prior to offering expenses. The Company is using these proceeds for general corporate purposes. (See Note G, "Debt and Credit Facilities.")
During 2012, the Company issued $250.0 million of 5.4 percent senior notes due October 2022. The Company will pay interest on the notes on April 1 and October 1 of each year, which commenced on April 1, 2013. The notes will mature on October 1, 2022, and may be redeemed at the stated redemption price, in whole or in part, at the option of the Company at any time.
33
Table of Contents
Additionally during 2012, the Company issued $225.0 million of 1.6 percent convertible senior notes due May 2018. The Company will pay interest on the notes on May 15 and November 15 of each year, which commenced on November 15, 2012. At any time prior to the close of business on the business day immediately preceding the stated maturity date, holders may convert all or any portion of their convertible senior notes. These notes will mature on May 15, 2018, unless converted earlier by the holder, at its option, or purchased by the Company upon the occurrence of a fundamental change. These notes are initially convertible into shares of the Company's common stock at a conversion rate of 31.2168 shares per $1,000 of their principal amount. This corresponds to an initial conversion price of approximately $32.03 per share. The conversion rate of the notes is subject to adjustment for a notice of redemption or for certain events. (See Note G, "Debt and Credit Facilities.")
Senior notes and indenture agreements are subject to certain covenants that include, among other things, restrictions on additional secured debt and the sale of assets. The Company was in compliance with these covenants at December 31, 2013.
The Company's obligations to pay principal, premium and interest under its senior notes and convertible senior notes are guaranteed on a joint and several basis by substantially all of its 100 percent-owned homebuilding subsidiaries ("the Guarantor Subsidiaries"). Such guarantees are full and unconditional. (See Note L, "Supplemental Guarantor Information.")
Financial Services Credit Facility
During 2011, RMC entered into a $50.0 million repurchase credit facility with JPM. This facility is used to fund, and is secured by, mortgages that were originated by RMC and are pending sale. During 2012, the facility was increased to $75.0 million. During 2013, the facility was extended to December 2014. Under the terms of this facility, RMC is required to maintain various financial and other covenants and to satisfy certain requirements relating to the mortgages securing the facility. At December 31, 2013, the Company was in compliance with these covenants. The Company had outstanding borrowings against this credit facility that totaled $73.1 million at December 31, 2013. There were no outstanding borrowings against the facility at December 31, 2012.
Letter of Credit Agreements
To provide letters of credit required in the ordinary course of its business, the Company has various secured letter of credit agreements that require it to maintain restricted cash deposits for outstanding letters of credit. Outstanding letters of credit totaled $93.6 million and $79.5 million under these agreements at December 31, 2013 and 2012, respectively.
Nonrecourse Secured Notes Payable
To finance its land purchases, the Company may also use seller-financed nonrecourse secured notes payable. At December 31, 2013 and 2012, outstanding seller-financed nonrecourse secured notes payable totaled $689,000 and $6.0 million, respectively.
Financial Services Subsidiaries
The financial services segment uses existing equity, cash generated internally and funds made available under the repurchase credit facility with JPM to finance its operations.
Other
During 2012, the Company filed a shelf registration with the SEC. The registration statement provides that securities may be offered, from time to time, in one or more series and in the form of senior, subordinated or convertible debt; preferred stock; preferred stock represented by depository shares; common stock; stock purchase contracts; stock purchase units; and warrants to purchase both debt and equity securities. The Company filed this registration statement to replace the prior registration statement that expired February 6, 2012. In the future, the Company intends to continue to maintain effective shelf registration statements that will facilitate access to the capital markets. The timing and amount of future offerings, if any, will depend on market and general business conditions.
During 2013, the Company did not repurchase any shares of its outstanding common stock. The Company had existing authorization of $142.3 million from its Board of Directors to purchase 3.3 million additional
34
Table of Contents
shares, based on the Company's stock price at December 31, 2013. Outstanding shares of common stock at December 31, 2013 and 2012, totaled 46,234,809 and 45,175,053, respectively.
The following table provides a summary of the Company's contractual cash obligations and commercial commitments at December 31, 2013, and the effect such obligations are expected to have on its future liquidity and cash flow:
| | | | | | | | | | | | | | | | |
(in thousands) | | | TOTAL | | | 2014 | | | 2015–2016 | | | 2017–2018 | | | AFTER 2018 | |
| | |
Debt, principal maturities | | $ | 1,472,754 | | $ | 73,760 | | $ | 126,494 | | $ | 455,000 | | $ | 817,500 | |
Interest on debt | | | 348,074 | | | 63,756 | | | 117,314 | | | 83,107 | | | 83,897 | |
Operating leases | | | 19,139 | | | 5,256 | | | 8,238 | | | 3,869 | | | 1,776 | |
Land option contracts1 | | | 2,505 | | | 2,505 | | | – | | | – | | | – | |
| | | | |
Total at December 31, 2013 | | $ | 1,842,472 | | $ | 145,277 | | $ | 252,046 | | $ | 541,976 | | $ | 903,173 | |
| | |
- 1
- Represents obligations under option contracts with specific performance provisions, net of cash deposits.
While the Company expects challenging economic conditions to eventually subside, it is focused on managing overhead expense, land acquisition, development and homebuilding construction activity in order to maintain cash and debt levels commensurate with its existing business and growth expectations. The Company believes that it will be able to fund its homebuilding and financial services operations through its existing cash resources and issuances of replacement debt.
Off-Balance Sheet Arrangements
In the ordinary course of business, the Company enters into land and lot option purchase contracts in order to procure land or lots for the construction of homes. Land and lot option purchase contracts enable the Company to control significant lot positions with a minimal capital investment, thereby reducing the risks associated with land ownership and development. At December 31, 2013, the Company had $73.0 million in cash deposits and letters of credit outstanding pertaining to land and lot option purchase contracts with an aggregate purchase price of $869.1 million, of which option contracts totaling $2.5 million contained specific performance provisions. At December 31, 2012, the Company had $53.1 million in cash deposits and letters of credit outstanding pertaining to land and lot option purchase contracts with an aggregate purchase price of $589.6 million, of which option contracts totaling $492,000 contained specific performance provisions. Additionally, the Company's liability is generally limited to forfeiture of nonrefundable deposits, letters of credit and other nonrefundable amounts incurred.
Pursuant to ASC No. 810 ("ASC 810"), "Consolidation," the Company consolidated $33.2 million and $39.5 million of inventory not owned related to land and lot option purchase contracts at December 31, 2013 and 2012, respectively. (See "Variable Interest Entities" within Note A, "Summary of Significant Accounting Policies.")
At December 31, 2013 and 2012, the Company had outstanding letters of credit under secured letter of credit agreements that totaled $93.6 million and $79.5 million, respectively. Additionally, at December 31, 2013, it had development or performance bonds that totaled $138.9 million, issued by third parties, to secure performance under various contracts and obligations related to land or municipal improvements, compared to $108.4 million at December 31, 2012. The Company expects that the obligations secured by these letters of credit and performance bonds will generally be satisfied in the ordinary course of business and in accordance with applicable contractual terms. To the extent that the obligations are fulfilled, the related letters of credit and performance bonds will be released, and the Company will not have any continuing obligations.
The Company has no material third-party guarantees other than those associated with its senior notes. (See Note L, "Supplemental Guarantor Information.")
Critical Accounting Policies
Preparation of the Company's consolidated financial statements requires the use of judgment in the application of accounting policies and estimates of inherently uncertain matters. Listed below are those policies that management believes are critical and require the use of complex judgment in their
35
Table of Contents
application. There are items within the financial statements that require estimation, but they are not considered critical. Management has discussed the critical accounting policies with the Audit Committee of its Board of Directors, and the Audit Committee has reviewed the disclosure.
Use of Estimates
In budgeting land acquisitions, development and homebuilding construction costs associated with real estate projects, the Company evaluates market conditions; material and labor costs; buyer preferences; construction timing; and provisions for insurance, mortgage loan reserves and warranty obligations. The Company accrues its best estimate of probable cost for the resolution of legal claims. Estimates, which are based on historical experience and other assumptions, are reviewed continually, updated when necessary and believed to be reasonable under the circumstances. Management believes that the timing and scope of its evaluation procedures are proper and adequate. Changes in assumptions relating to such factors, however, could have a material effect on the Company's results of operations for a particular quarterly or annual period.
Income Recognition
As required by ASC No. 976 ("ASC 976"), "Real Estate—Retail Land," revenues and cost of sales are recorded at the time each home or lot is closed; title and possession are transferred to the buyer; and there is no significant continuing involvement from the homebuilder. In order to match revenues with related expenses, land, land development, interest, taxes and other related costs (both incurred and estimated to be incurred in the future) are allocated to the cost of homes closed, based upon the relative sales value basis of the total number of homes to be constructed in each community, in accordance with ASC No. 970 ("ASC 970"), "Real Estate—General." Estimated land, common area development and related costs of planned communities, including the cost of amenities, are allocated to individual parcels or communities on a relative sales value basis. Changes to estimated costs, subsequent to the commencement of the delivery of homes, are allocated to the remaining undelivered homes in the community. Home construction and related costs are charged to the cost of homes closed under the specific-identification method.
Marketable Securities
In 2009, the Company began to invest a portion of its available cash and cash equivalent balances in marketable securities having maturities in excess of three months in a managed portfolio. These investments are primarily held in the custody of a single financial institution. To be considered for investment, securities must meet certain minimum requirements as to their credit ratings, maturity terms and other risk-related criteria as defined by the Company's investment policies. The primary objectives of these investments are the preservation of capital and the maintenance of a high degree of liquidity, with a secondary objective being the attainment of yields higher than those earned on the Company's cash and cash equivalent balances.
The Company considers its investment portfolio to be available-for-sale. Accordingly, these investments are recorded at their fair values, with unrealized gains and losses included in "Accumulated other comprehensive (loss) income" within the Consolidated Balance Sheets. (See Note F, "Fair Values of Financial and Nonfinancial Instruments.")
The Company periodically reviews its available-for-sale securities for other-than-temporary declines in fair values that are below their cost basis, as well as whenever events or changes in circumstances indicate that the carrying amount of an asset may not be recoverable. This evaluation is based on factors such as the length of time and extent to which the fair value has been less than the security's cost basis and the adverse conditions specifically related to the security, including any changes to the rating of the security by a rating agency. A temporary impairment results in an unrealized loss being recorded in "Accumulated other comprehensive (loss) income" within the Consolidated Balance Sheets. An other-than-temporary impairment charge is recorded as a realized loss in the Consolidated Statements of Earnings. The Company believes that the cost bases for its marketable securities, available-for-sale, were recoverable in all material respects at December 31, 2013 and 2012.
36
Table of Contents
Inventory Valuation
Housing inventories consist principally of homes under construction; land under development and improved lots; and inventory held-for-sale. Inventory includes land and development costs; direct construction costs; capitalized indirect construction costs; capitalized interest; and real estate taxes. The costs of acquiring and developing land and constructing certain related amenities are allocated to the parcels to which these costs relate. Inventories to be held and used are stated at cost unless a community is determined to be impaired, in which case the impaired inventories are written down to their fair values. Inventories held-for-sale are stated at the lower of their costs or fair values, less cost to sell.
As required by ASC 360, inventory is reviewed for potential write-downs on an ongoing basis. Once a community is considered to be impaired, the Company's determinations of fair value and new cost basis are primarily based on discounting estimated cash flows at rates commensurate with inherent risks associated with the continuing assets. Due to the fact that estimates and assumptions included in cash flow models are based on historical results and projected trends, unexpected changes in market conditions that may lead to additional impairment charges in the future cannot be anticipated.
The costs of acquiring and developing land and constructing certain related amenities are allocated to the parcels to which these costs relate. Management believes its processes are designed to properly assess the market and the carrying values of assets. (See "Housing Inventories" within Note A, "Summary of Significant Accounting Policies.")
Warranty Reserves
The Company's homes are sold with limited third-party warranties. Warranty reserves are established as homes close on a house-by-house basis and in an amount estimated to adequately cover the expected costs of materials and outside labor during warranty periods. Certain factors are considered in determining the reserves, including the historical range of amounts paid per house; experience with respect to similar home designs and geographic areas; the historical amount paid as a percentage of home construction costs; any warranty expenditures not considered to be normal and recurring; and conditions that may affect certain subdivisions. Improvements in quality control and construction techniques expected to impact future warranty expenditures are also considered. Accordingly, the process of determining the Company's warranty reserves balance requires estimates associated with various assumptions, each of which can positively or negatively impact this balance.
Generally, warranty reserves are reviewed monthly to determine the reasonableness and adequacy of both the aggregate reserve amount and the per unit reserve amount originally included in housing cost of sales, as well as to note the timing of any reversals of the original reserve. General warranty reserves not utilized for a particular house are evaluated for reasonableness in the aggregate on both a market-by-market basis and a consolidated basis. Warranty payments for an individual house may exceed the related reserve. Payments in excess of the related reserve are evaluated in the aggregate to determine if an adjustment to the warranty reserve should be recorded, which could result in a corresponding adjustment to housing cost of sales.
The Company continues to evaluate the adequacy of its warranty reserves and believes that its existing estimation process is materially accurate. Since the Company's warranty reserves can be impacted by a significant number of factors, it is possible that changes to the Company's assumptions could have a material impact on its warranty reserve balance.
Income Taxes
The Company calculates a provision for its income taxes by using the asset and liability method, under which deferred tax assets and liabilities are recognized by identifying temporary differences arising from the diverse treatment of items for tax and general accounting purposes. The Company evaluates its deferred tax assets on a quarterly basis to determine whether a valuation allowance is required. In accordance with ASC No. 740 ("ASC 740"), "Income Taxes," the Company assesses whether a valuation allowance should be established based on available evidence indicating whether it is more likely than not that all or some portion of the deferred tax assets will not be realized. Significant judgment is required in estimating valuation allowances for deferred tax assets. The realization of a deferred tax asset ultimately depends on the existence of sufficient taxable income in either the carryback or carryforward periods
37
Table of Contents
under tax law. This assessment considers, among other matters, current and cumulative income and loss; future profitability; the duration of statutory carryback or carryforward periods; asset turns; and tax planning alternatives. The Company bases its estimate of deferred tax assets and liabilities on current tax laws and rates. In certain cases, it also bases this estimate on business plan forecasts and other expectations about future outcomes. Changes in existing tax laws or rates could affect the Company's actual tax results, and future business results may affect the amount of its deferred tax liabilities or the valuation of its deferred tax assets over time. Due to uncertainties in the estimation process, particularly with respect to changes in facts and circumstances in future reporting periods, as well as to the residential homebuilding industry's cyclicality and sensitivity to changes in economic conditions, it is possible that actual results could differ from the estimates used in the Company's historical analyses. These differences could have a material impact on the Company's consolidated results of operations or financial position.
Changes in positive and negative evidence, including differences between the Company's future operating results and estimates, could result in the establishment of a valuation allowance against its deferred tax assets. Accounting for deferred taxes is based upon estimates of future results. Differences between the anticipated and actual outcomes of these future results could have a material impact on the Company's consolidated results of operations or financial position. Also, changes in existing federal and state tax laws and tax rates could affect future tax results and the valuation allowance against the Company's deferred tax assets.
Mortgage Loan Loss Reserves
Reserves are created to address repurchase and indemnity claims by third-party investors that arise primarily if the borrower obtained the loan through fraudulent information or omissions; if there are origination deficiencies attributable to RMC; or if the borrower does not make a first payment. Reserves are determined based on pending claims received that are associated with previously sold mortgage loans, industry foreclosure data, the Company's portfolio delinquency and foreclosure rates on sold loans made available by investors, as well as on historical loss payment patterns used to develop ultimate loss projections. Estimating loss is difficult due to the inherent uncertainty in predicting foreclosure activity, as well as to delays in processing and requests for payment related to the loan loss by agencies and financial institutions. Recorded reserves represent the Company's best estimates of current and future unpaid losses as of December 31, 2013, based on existing conditions and available information. The Company continues to evaluate the adequacy of its mortgage loan loss reserves and believes that its existing estimation process provides a reasonable estimate of probable loss. Since the Company's mortgage loan loss reserves can be impacted by a significant number of factors, it is possible that subsequent changes in conditions or available information may change assumptions and estimates, which could have a material impact on its mortgage loan loss reserve balance.
Share-Based Payments
The Company follows the provisions of ASC No. 718 ("ASC 718"), "Compensation—Stock Compensation," which requires that compensation expense be measured and recognized at an amount equal to the fair value of share-based payments granted under compensation arrangements. The Company calculates the fair value of stock options by using the Black-Scholes-Merton option-pricing model. Determination of the fair value of share-based awards at the grant date requires judgment in developing assumptions and involves a number of variables. These variables include, but are not limited to: expected price volatility of the stock over the term of the awards, expected dividend yield and expected stock option exercise behavior. Additionally, judgment is also required in estimating the number of share-based awards that are expected to forfeit. If actual results differ significantly from these estimates, stock-based compensation expense and the Company's consolidated results of operations could be materially impacted. The Company believes that accounting for stock-based compensation is a critical accounting policy because it requires the use of complex judgment in its application.
38
Table of Contents
Outlook
Mortgage rates have increased during 2013 due to evidence that federal policies designed to keep interest rates low have begun to subside. Although rates of improvement in the Company's housing markets can vary, it believes that the housing market as a whole may continue to progress due to general improvement in overall economic and employment levels; slow relaxation of an extremely restrictive mortgage underwriting environment; and expected rise in the number of household formations. The Company believes that if mortgage interest rates rise, they will most likely be accompanied by improvements in economic conditions, partially offsetting their impact on demand, and that moderate sales rates should facilitate a more sustainable long-term recovery. Absent unexpected changes in economic conditions, and other unforeseen circumstances, these developments, combined with additional leverage of overhead expenditures from higher volumes, should allow the Company to improve its performance. The Company increased its number of active communities by 21.8 percent during the year ended December 31, 2013, compared to 2012, and it anticipates steady growth in its community count in 2014. Sales orders for new homes rose 27.0 percent during 2013, compared to 2012. At December 31, 2013, the Company's backlog of orders for new homes totaled 2,626 units, with a projected dollar value of $854.8 million, reflecting a 28.9 percent increase in projected dollar value from $663.4 million at December 31, 2012. The pace at which the Company acquires new land and opens additional communities will depend on market and economic conditions, as well as future sales rates. Although the Company's outlook remains cautious, the strength of its balance sheet, additional liquidity and improved operating leverage have positioned it to successfully take advantage of any continued improvements in economic trends and in the demand for new homes.
Item 7A. Quantitative and Qualitative Disclosures About Market Risk
Market Risk Summary
The following table provides information about the Company's significant financial instruments that are sensitive to changes in interest rates at December 31, 2013. For debt obligations, the table presents principal cash flows and related weighted-average interest rates by expected maturity dates. For other financial instruments, weighted-average rates are based on implied forward rates as of the reporting date.
Interest Rate Sensitivity
Principal Amount by Expected Maturity
| | | | | | | | | | | | | | | | | | | |
(in thousands) | | | 2014 | | | 2015–2016 | | | 2017–2018 | | | THERE-
AFTER | | | TOTAL | | | FAIR VALUE | |
| | |
| | | | | | | | | | | | | | | | | | | | |
Senior notes and convertible senior
notes (fixed rate) | | $ | – | | $ | 126,481 | | $ | 455,000 | | $ | 817,500 | | $ | 1,398,981 | | $ | 1,553,105 | |
Average interest rate | | | – | % | | 5.4 | % | | 5.1 | % | | 4.2 | % | | 4.6 | % | | | |
Other financial instruments | | | | | | | | | | | | | | | | | | | |
Mortgage interest rate lock commitments: | | | | | | | | | | | | | | | | | | | |
Notional amount | | $ | 269,210 | | $ | – | | $ | – | | $ | – | | $ | 269,210 | | $ | 5,218 | |
Average interest rate | | | 4.6 | % | | – | % | | – | % | | – | % | | 4.6 | % | | | |
Forward-delivery contracts: | | | | | | | | | | | | | | | | | | | |
Notional amount | | $ | 118,000 | | $ | – | | $ | – | | $ | – | | $ | 118,000 | | $ | 2,261 | |
Average interest rate | | | 3.5 | % | | – | % | | – | % | | – | % | | 3.5 | % | | | |
| | |
Interest rate risk is a primary market risk facing the Company. Interest rate risk arises principally in the Company's financial services segment. The Company enters into forward-delivery contracts and may, at times, use other hedging contracts to mitigate its exposure to movement in interest rates on mortgage interest rate lock commitments ("IRLCs"). In managing interest rate risk, the Company does not speculate on the direction of interest rates. (See "Derivative Instruments" within Note A, "Summary of Significant Accounting Policies," and Note D, "Derivative Instruments.")
39
Table of Contents
Item 8. Financial Statements and Supplementary Data
CONSOLIDATED STATEMENTS OF EARNINGS
| | | | | | | | | | |
| | | | | | | | | | |
| | YEAR ENDED DECEMBER 31, | |
|---|
(in thousands, except share data) | | | 2013 | | | 2012 | | | 2011 | |
| | |
REVENUES | | | | | | | | | | |
Homebuilding | | $ | 2,089,375 | | $ | 1,270,847 | | $ | 862,604 | |
Financial services | | | 51,380 | | | 37,619 | | | 26,927 | |
| | | | |
TOTAL REVENUES | | | 2,140,755 | | | 1,308,466 | | | 889,531 | |
| | | | |
EXPENSES | | | | | | | | | | |
Cost of sales | | | 1,654,196 | | | 1,027,472 | | | 726,956 | |
Selling, general and administrative | | | 253,047 | | | 189,500 | | | 158,045 | |
Financial services | | | 31,312 | | | 24,477 | | | 21,188 | |
Interest | | | 8,358 | | | 16,118 | | | 18,348 | |
| | | | |
TOTAL EXPENSES | | | 1,946,913 | | | 1,257,567 | | | 924,537 | |
| | | | |
OTHER INCOME (LOSS) | | | | | | | | | | |
Gain from marketable securities, net | | | 1,849 | | | 2,214 | | | 3,882 | |
Loss related to early retirement of debt, net | | | – | | | (9,146 | ) | | (1,608 | ) |
| | | | |
TOTAL OTHER INCOME (LOSS) | | | 1,849 | | | (6,932 | ) | | 2,274 | |
| | | | |
Income (loss) from continuing operations before taxes | | | 195,691 | | | 43,967 | | | (32,732 | ) |
Tax (benefit) expense | | | (183,408 | ) | | 1,585 | | | (2,865 | ) |
| | | | |
NET INCOME (LOSS) FROM CONTINUING OPERATIONS | | | 379,099 | | | 42,382 | | | (29,867 | ) |
| | | | |
Income (loss) from discontinued operations, net of taxes | | | 106 | | | (2,000 | ) | | (20,883 | ) |
| | | | |
NET INCOME (LOSS) | | $ | 379,205 | | $ | 40,382 | | $ | (50,750 | ) |
| | |
NET INCOME (LOSS) PER COMMON SHARE | | | | | | | | | | |
Basic | | | | | | | | | | |
Continuing operations | | $ | 8.22 | | $ | 0.93 | | $ | (0.67 | ) |
Discontinued operations | | | 0.00 | | | (0.04 | ) | | (0.47 | ) |
| | | | |
Total | | | 8.22 | | | 0.89 | | | (1.14 | ) |
| | | | |
Diluted | | | | | | | | | | |
Continuing operations | | | 6.79 | | | 0.88 | | | (0.67 | ) |
Discontinued operations | | | 0.00 | | | (0.04 | ) | | (0.47 | ) |
| | | | |
Total | | $ | 6.79 | | $ | 0.84 | | $ | (1.14 | ) |
| | | | |
AVERAGE COMMON SHARES OUTSTANDING | | | | | | | | | | |
Basic | | | 45,966,307 | | | 44,761,178 | | | 44,357,470 | |
Diluted | | | 56,219,939 | | | 49,655,321 | | | 44,357,470 | |
DIVIDENDS DECLARED PER COMMON SHARE | | $ | 0.12 | | $ | 0.12 | | $ | 0.12 | |
| | |
See Notes to Consolidated Financial Statements.
CONSOLIDATED STATEMENTS OF OTHER COMPREHENSIVE INCOME
| | | | | | | | | | |
| | | | | | | | | | |
| | YEAR ENDED DECEMBER 31, | |
|---|
(in thousands) | | | 2013 | | | 2012 | | | 2011 | |
| | |
Net income (loss) | | $ | 379,205 | | $ | 40,382 | | $ | (50,750 | ) |
Other comprehensive loss before tax: | | | | | | | | | | |
Actuarial loss on defined benefit pension plan | | | (1,674 | ) | | – | | | – | |
Reduction of unrealized gain related to cash flow hedging instruments | | | – | | | (1,709 | ) | | (1,207 | ) |
Unrealized (loss) gain on marketable securities, available-for-sale: | | | | | | | | | | |
Unrealized (loss) gain | | | (279 | ) | | 1,217 | | | 360 | |
Less: reclassification adjustments for losses (gains) included in net income (loss) | | | 64 | | | (233 | ) | | (1,358 | ) |
| | | | |
Total unrealized (loss) gain on marketable securities, available-for-sale | | | (215 | ) | | 984 | | | (998 | ) |
| | | | |
Other comprehensive loss before tax | | | (1,889 | ) | | (725 | ) | | (2,205 | ) |
Income tax benefit related to items of other comprehensive loss | | | 640 | | | 653 | | | 502 | |
| | | | |
Other comprehensive loss, net of tax | | | (1,249 | ) | | (72 | ) | | (1,703 | ) |
| | | | |
Comprehensive income (loss) | | $ | 377,956 | | $ | 40,310 | | $ | (52,453 | ) |
| | |
See Notes to Consolidated Financial Statements.
40
Table of Contents
CONSOLIDATED BALANCE SHEETS
| | | | | | | |
| | | | | | | |
| | DECEMBER 31, | |
|---|
(in thousands, except share data) | | | 2013 | | | 2012 | |
| | |
ASSETS | | | | | | | |
Cash, cash equivalents and marketable securities | | | | | | | |
Cash and cash equivalents | | $ | 227,986 | | $ | 158,087 | |
Restricted cash | | | 90,034 | | | 70,893 | |
Marketable securities, available-for-sale | | | 313,155 | | | 385,625 | |
| | | | |
Total cash, cash equivalents and marketable securities | | | 631,175 | | | 614,605 | |
Housing inventories | | | | | | | |
Homes under construction | | | 643,357 | | | 459,269 | |
Land under development and improved lots | | | 969,755 | | | 573,975 | |
Inventory held-for-sale | | | 3,495 | | | 4,684 | |
Consolidated inventory not owned | | | 33,176 | | | 39,490 | |
| | | | |
Total housing inventories | | | 1,649,783 | | | 1,077,418 | |
Property, plant and equipment | | | 25,437 | | | 20,409 | |
Mortgage loans held-for-sale | | | 139,576 | | | 107,950 | |
Net deferred taxes | | | 185,904 | | | – | |
Other | | | 148,437 | | | 111,057 | |
Assets of discontinued operations | | | 30 | | | 2,480 | |
| | | | |
TOTAL ASSETS | | | 2,780,342 | | | 1,933,919 | |
| | | | |
LIABILITIES | | | | | | | |
Accounts payable | | | 172,841 | | | 124,797 | |
Accrued and other liabilities | | | 212,680 | | | 147,358 | |
Financial services credit facility | | | 73,084 | | | – | |
Debt | | | 1,397,308 | | | 1,134,468 | |
Liabilities of discontinued operations | | | 504 | | | 1,536 | |
| | | | |
TOTAL LIABILITIES | | | 1,856,417 | | | 1,408,159 | |
| | | | |
EQUITY | | | | | | | |
STOCKHOLDERS' EQUITY | | | | | | | |
Preferred stock, $1.00 par value: | | | | | | | |
Authorized—10,000 shares Series A Junior | | | | | | | |
Participating Preferred, none outstanding | | | – | | | – | |
Common stock, $1.00 par value: | | | | | | | |
Authorized—199,990,000 shares | | | | | | | |
Issued—46,234,809 shares at December 31, 2013 | | | | | | | |
(45,175,053 shares at December 31, 2012) | | | 46,235 | | | 45,175 | |
Retained earnings | | | 862,968 | | | 458,669 | |
Accumulated other comprehensive (loss) income | | | (1,157 | ) | | 92 | |
| | | | |
TOTAL STOCKHOLDERS' EQUITY | | | | | | | |
FOR THE RYLAND GROUP, INC. | | | 908,046 | | | 503,936 | |
| | | | |
NONCONTROLLING INTEREST | | | 15,879 | | | 21,824 | |
| | | | |
TOTAL EQUITY | | | 923,925 | | | 525,760 | |
| | | | |
TOTAL LIABILITIES AND EQUITY | | $ | 2,780,342 | | $ | 1,933,919 | |
| | |
See Notes to Consolidated Financial Statements.
41
Table of Contents
CONSOLIDATED STATEMENTS OF STOCKHOLDERS' EQUITY
| | | | | | | | | | | | | |
(in thousands, except per share data)
| | |
COMMON STOCK | | |
RETAINED EARNINGS | | | ACCUMULATED
OTHER
COMPREHENSIVE
(LOSS) INCOME | | |
TOTAL
STOCKHOLDERS'
EQUITY | |
| | |
STOCKHOLDERS' EQUITY BALANCE AT JANUARY 1, 2011 | | $ | 44,188 | | $ | 453,801 | | $ | 1,867 | | $ | 499,856 | |
Net loss | | | | | | (50,750 | ) | | | | | (50,750 | ) |
Other comprehensive loss, net of tax | | | | | | | | | (1,703 | ) | | (1,703 | ) |
Common stock dividends (per share $0.12) | | | | | | (5,410 | ) | | | | | (5,410 | ) |
Stock-based compensation | | | 226 | | | 7,468 | | | | | | 7,694 | |
| | | | |
STOCKHOLDERS' EQUITY
BALANCE AT DECEMBER 31, 2011 | | $ | 44,414 | | $ | 405,109 | | $ | 164 | | $ | 449,687 | |
NONCONTROLLING INTEREST | | | | | | | | | | | | 34,223 | |
| | | | | | | | | | | | | |
TOTAL EQUITY BALANCE AT DECEMBER 31, 2011 | | | | | | | | | | | $ | 483,910 | |
| | |
STOCKHOLDERS' EQUITY BALANCE AT JANUARY 1, 2012 | | $ | 44,414 | | $ | 405,109 | | $ | 164 | | $ | 449,687 | |
Net income | | | | | | 40,382 | | | | | | 40,382 | |
Other comprehensive loss, net of tax | | | | | | | | | (72 | ) | | (72 | ) |
Common stock dividends (per share $0.12) | | | | | | (5,479 | ) | | | | | (5,479 | ) |
Stock-based compensation | | | 761 | | | 18,657 | | | | | | 19,418 | |
| | | | |
STOCKHOLDERS' EQUITY
BALANCE AT DECEMBER 31, 2012 | | $ | 45,175 | | $ | 458,669 | | $ | 92 | | $ | 503,936 | |
NONCONTROLLING INTEREST | | | | | | | | | | | | 21,824 | |
| | | | | | | | | | | | | |
TOTAL EQUITY BALANCE AT DECEMBER 31, 2012 | | | | | | | | | | | $ | 525,760 | |
| | |
STOCKHOLDERS' EQUITY BALANCE AT JANUARY 1, 2013 | | $ | 45,175 | | $ | 458,669 | | $ | 92 | | $ | 503,936 | |
Net income | | | | | | 379,205 | | | | | | 379,205 | |
Other comprehensive loss, net of tax | | | | | | | | | (1,249 | ) | | (1,249 | ) |
Common stock dividends (per share $0.12) | | | | | | (5,590 | ) | | | | | (5,590 | ) |
Stock-based compensation | | | 1,060 | | | 30,684 | | | | | | 31,744 | |
| | | | |
STOCKHOLDERS' EQUITY
BALANCE AT DECEMBER 31, 2013 | | $ | 46,235 | | $ | 862,968 | | $ | (1,157 | ) | $ | 908,046 | |
NONCONTROLLING INTEREST | | | | | | | | | | | | 15,879 | |
| | | | | | | | | | | | | |
TOTAL EQUITY BALANCE AT DECEMBER 31, 2013 | | | | | | | | | | | $ | 923,925 | |
| | |
See Notes to Consolidated Financial Statements.
42
Table of Contents
CONSOLIDATED STATEMENTS OF CASH FLOWS
| | | | | | | | | | |
| | YEAR ENDED DECEMBER 31, | |
(in thousands) | | | 2013 | | | 2012 | | | 2011 | |
| | |
CASH FLOWS FROM OPERATING ACTIVITIES | | | | | | | | | | |
Net income (loss) from continuing operations | | $ | 379,099 | | $ | 42,382 | | $ | (29,867 | ) |
Adjustments to reconcile net income (loss) from continuing operations to
net cash used for operating activities: | | | | | | | | | | |
Depreciation and amortization | | | 20,517 | | | 15,399 | | | 11,312 | |
Inventory and other asset impairments and write-offs | | | 2,022 | | | 6,262 | | | 17,319 | |
Loss on early extinguishment of debt, net | | | – | | | 9,146 | | | 1,608 | |
Realized gain on sale of marketable securities | | | (623 | ) | | (527 | ) | | (1,676 | ) |
(Decrease) increase in deferred tax valuation allowance | | | (258,867 | ) | | (11,584 | ) | | 20,243 | |
Stock-based compensation expense | | | 19,503 | | | 17,841 | | | 9,671 | |
Changes in assets and liabilities: | | | | | | | | | | |
Increase in inventories | | | (541,973 | ) | | (236,512 | ) | | (85,985 | ) |
Net change in other assets, payables and other liabilities | | | 113,618 | | | 37,206 | | | (99,305 | ) |
Other operating activities, net | | | (1,264 | ) | | (792 | ) | | (988 | ) |
| | | | |
Net cash used for operating activities from continuing operations | | | (267,968 | ) | | (121,179 | ) | | (157,668 | ) |
| | | | |
CASH FLOWS FROM INVESTING ACTIVITIES | | | | | | | | | | |
Contributions to unconsolidated joint ventures | | | (5,812 | ) | | (559 | ) | | (1,062 | ) |
Return of investment in unconsolidated joint ventures | | | 2,585 | | | 2,869 | | | 3,017 | |
Additions to property, plant and equipment | | | (19,908 | ) | | (12,224 | ) | | (10,964 | ) |
Purchases of marketable securities, available-for-sale | | | (756,217 | ) | | (1,176,108 | ) | | (1,313,281 | ) |
Proceeds from sales and maturities of marketable securities, available-for-sale | | | 829,332 | | | 1,140,968 | | | 1,404,130 | |
Cash paid for business acquisitions | | | (50,930 | ) | | (80,182 | ) | | – | |
Other investing activities | | | – | | | 109 | | | 118 | |
| | | | |
Net cash (used for) provided by investing activities from continuing operations | | | (950 | ) | | (125,127 | ) | | 81,958 | |
| | | | |
CASH FLOWS FROM FINANCING ACTIVITIES | | | | | | | | | | |
Cash proceeds of long-term debt | | | 267,500 | | | 475,000 | | | – | |
Retirement of long-term debt | | | – | | | (177,219 | ) | | (52,917 | ) |
Increase (decrease) in borrowings against revolving credit facilities, net | | | 73,084 | | | (49,933 | ) | | 49,933 | |
(Decrease) increase in short-term borrowings | | | (5,298 | ) | | 2,154 | | | (5,110 | ) |
Common stock dividends | | | (5,533 | ) | | (5,411 | ) | | (5,405 | ) |
Issuance of common stock under stock-based compensation | | | 28,205 | | | 14,366 | | | 3,622 | |
(Increase) decrease in restricted cash | | | (19,141 | ) | | (13,844 | ) | | 17,989 | |
| | | | |
Net cash provided by financing activities from continuing operations | | | 338,817 | | | 245,113 | | | 8,112 | |
| | | | |
Net increase (decrease) in cash and cash equivalents from continuing operations | | | 69,899 | | | (1,193 | ) | | (67,598 | ) |
Cash flows from operating activities—discontinued operations | | | (25 | ) | | (104 | ) | | 469 | |
Cash flows from investing activities—discontinued operations | | | 25 | | | 75 | | | (363 | ) |
Cash flows from financing activities—discontinued operations | | | – | | | – | | | (89 | ) |
Cash and cash equivalents at beginning of period1 | | | 158,114 | | | 159,336 | | | 226,917 | |
| | | | |
CASH AND CASH EQUIVALENTS AT END OF PERIOD2 | | $ | 228,013 | | $ | 158,114 | | $ | 159,336 | |
| | |
SUPPLEMENTAL DISCLOSURES OF CASH FLOW INFORMATION
FROM CONTINUING OPERATIONS | | | | | | | | | | |
Cash paid for interest, net of capitalized interest | | $ | (5,165 | ) | $ | (12,777 | ) | $ | (22,949 | ) |
Cash paid for income taxes | | | (3,704 | ) | | (404 | ) | | (1,343 | ) |
| | |
SUPPLEMENTAL DISCLOSURES OF NONCASH ACTIVITIES
FROM CONTINUING OPERATIONS | | | | | | | | | | |
Decrease in consolidated inventory not owned related to land options | | $ | 5,945 | | $ | 12,399 | | $ | 27,583 | |
| | |
- 1
- Includes cash and cash equivalents associated with discontinued operations of $27,000, $56,000 and $39,000 at December 31, 2012, 2011 and 2010, respectively.
- 2
- Includes cash and cash equivalents associated with discontinued operations of $27,000 at December 31, 2013 and 2012, compared to $56,000 at December 31, 2011.
43
Table of Contents
Note A: Summary of Significant Accounting Policies
Basis of Presentation
The consolidated financial statements include the accounts of The Ryland Group, Inc. and its 100 percent-owned subsidiaries. Noncontrolling interest represents the selling entities' ownership interests in land and lot option purchase contracts. Intercompany transactions have been eliminated in consolidation. Information is presented on a continuing operations basis unless otherwise noted. The results from continuing and discontinued operations are presented separately in the consolidated financial statements. (See Note M, "Discontinued Operations.") All prior period amounts have been reclassified to conform to the 2013 presentation.
Use of Estimates
The preparation of financial statements in conformity with GAAP requires management to make estimates and assumptions that affect the amounts reported in the financial statements and accompanying notes. Actual results could differ from these estimates.
Cash and Cash Equivalents
Cash and cash equivalents totaled $228.0 million and $158.1 million at December 31, 2013 and 2012, respectively. The Company considers all highly liquid short-term investments purchased with an original maturity of three months or less and cash held in escrow accounts to be cash equivalents.
Restricted Cash
At December 31, 2013 and 2012, the Company had restricted cash of $90.0 million and $70.9 million, respectively. The Company has various secured letter of credit agreements that require it to maintain cash deposits as collateral for outstanding letters of credit. Cash restricted under these agreements totaled $89.5 million and $70.3 million at December 31, 2013 and 2012, respectively. In addition, RMC had restricted cash of $487,000 and $627,000 at December 31, 2013 and 2012, respectively.
Marketable Securities, Available-for-sale
The Company considers its investment portfolio to be available-for-sale. Accordingly, these investments are recorded at their fair values, with unrealized gains or losses generally recorded in other comprehensive income. (See Note E, "Marketable Securities, Available-for-sale.")
Homebuilding Revenues
In accordance with ASC 976, homebuilding revenues are recognized when home and lot sales are closed; title and possession are transferred to the buyer; and there is no significant continuing involvement from the homebuilder. Sales incentives offset revenues and are expensed when homes are closed.
Housing Inventories
Housing inventories consist principally of homes under construction; land under development and improved lots; and inventory held-for-sale. Inventory includes land and development costs; direct construction costs; capitalized indirect construction costs; capitalized interest; and real estate taxes. The costs of acquiring and developing land and constructing certain related amenities are allocated to the parcels to which these costs relate. Inventories to be held and used are stated at cost unless a community is determined to be impaired, in which case the impaired inventories are written down to their fair values. Inventories held-for-sale are stated at the lower of their costs or fair values, less cost to sell.
As required by ASC 360, inventory is reviewed for potential write-downs on an ongoing basis. ASC 360 requires that, in the event that impairment indicators are present and undiscounted cash flows signify that the carrying amount of an asset is not recoverable, impairment charges must be recorded if the fair value of the asset is less than its carrying amount. The Company reviews all communities on a quarterly basis for changes in events or circumstances indicating signs of impairment. Examples of events or changes in circumstances include, but are not limited to: price declines resulting from sustained competitive pressures; a change in the manner in which the asset is being used; a change in assessments by a regulator or municipality; cost increases; the expectation that, more likely than not, an asset will be sold or disposed of significantly before the end of its previously estimated useful life; or the impact of local economic or macroeconomic conditions, such as employment or housing supply, on the market for a
44
Table of Contents
given product. Signs of impairment may include, but are not limited to: very low or negative profit margins, the absence of sales activity in an open community and/or significant price differences for comparable parcels of land held-for-sale.
If it is determined that indicators of impairment exist in a community, undiscounted cash flows are prepared and analyzed at a community level based on expected pricing; sales rates; construction costs; local municipality fees; warranty, closing, carrying, selling, overhead and other related costs; or on similar assets to determine if the realizable values of the assets held are less than their respective carrying amounts. In order to determine assumed sales prices included in cash flow models, the Company analyzes historical sales prices on homes delivered in the community and in other communities located within the same geographic area, as well as sales prices included in its current backlog for such communities. In addition, it analyzes market studies and trends, which generally include statistics on sales prices of similar products in neighboring communities and sales prices of similar products in non-neighboring communities located within the same geographic area. In order to estimate the costs of building and delivering homes, the Company generally assumes cost structures reflecting contracts currently in place with vendors, adjusted for any anticipated cost-reduction initiatives or increases. The Company's analysis of each community generally assumes current pricing equal to current sales orders for a particular or comparable community. For a minority of communities that the Company does not intend to operate for an extended period of time or where the operating life extends beyond several years, slight increases over current sales prices are assumed in later years. Once a community is considered to be impaired, the Company's determinations of fair value and new cost basis are primarily based on discounting estimated cash flows at rates commensurate with inherent risks associated with the continuing assets. Discount rates used generally vary from 17.0 percent to 30.0 percent, depending on market risk, the size or life of a community and development risk. Due to the fact that estimates and assumptions included in cash flow models are based on historical results and projected trends, unexpected changes in market conditions that may lead to additional impairment charges in the future cannot be anticipated.
Valuation adjustments are recorded against homes completed or under construction, land under development or improved lots when analyses indicate that the carrying values are greater than the fair values. Write-downs of impaired inventories to their fair values are recorded as adjustments to the cost basis of the respective inventory. At December 31, 2013 and 2012, valuation reserves related to impaired inventories totaled $154.8 million and $207.8 million, respectively. The net carrying values of the related inventories totaled $155.9 million and $182.2 million at December 31, 2013 and 2012, respectively.
The costs of acquiring and developing land and constructing certain related amenities are allocated to the parcels to which these costs relate. (See "Homebuilding Overview" within Management's Discussion and Analysis of Financial Condition and Results of Operations.)
Interest and taxes are capitalized during active development and construction stages. Capitalized interest is amortized when the related inventory is delivered to homebuyers. The following table summarizes the activity that relates to capitalized interest:
| | | | | | | | | | |
(in thousands) | | | 2013 | | | 2012 | | | 2011 | |
| | |
Capitalized interest at January 1 | | $ | 82,773 | | $ | 81,058 | | $ | 75,094 | |
Interest capitalized | | | 59,208 | | | 42,327 | | | 38,032 | |
Interest amortized to cost of sales | | | (52,362 | ) | | (40,612 | ) | | (32,068 | ) |
| | | | |
Capitalized interest at December 31 | | $ | 89,619 | | $ | 82,773 | | $ | 81,058 | |
| | |
45
Table of Contents
The following table summarizes each reporting segment's total number of lots owned and lots controlled under option agreements (unaudited):
| | | | | | | | | | | | | | | | | | | |
| | DECEMBER 31, 2013 | | DECEMBER 31, 2012 | |
| | | LOTS
OWNED | | | LOTS
OPTIONED | | |
TOTAL | | | LOTS
OWNED | | | LOTS
OPTIONED | | |
TOTAL | |
| | |
North | | | 6,382 | | | 7,455 | | | 13,837 | | | 5,471 | | | 4,056 | | | 9,527 | |
Southeast | | | 8,114 | | | 2,439 | | | 10,553 | | | 7,268 | | | 2,121 | | | 9,389 | |
Texas | | | 3,886 | | | 3,147 | | | 7,033 | | | 2,438 | | | 2,667 | | | 5,105 | |
West | | | 5,158 | | | 1,561 | | | 6,719 | | | 2,604 | | | 1,680 | | | 4,284 | |
| | | | | | |
Total | | | 23,540 | | | 14,602 | | | 38,142 | | | 17,781 | | | 10,524 | | | 28,305 | |
| | |
Additionally, at December 31, 2013 and 2012, the Company controlled 5 lots and 479 lots, respectively, associated with discontinued operations, all of which were owned.
Transactions with Affiliates
During 2013, the Company issued $1.5 million of promissory notes to affiliates of the Company's Philadelphia division for the development and sale of land and lots. These notes will be repaid once each lot and home is sold, and no later than within three years. As of December 31, 2013, the balance of the promissory notes from these affiliates was $1.3 million. Additionally, the Company leases office space from affiliates in its Philadelphia and Phoenix divisions at market terms.
Goodwill and Other Intangible Assets
The Company records goodwill associated with its business acquisitions when the consideration paid exceeds the fair value of the net tangible and identifiable intangible assets acquired. The Company's goodwill balance was $37.1 million at December 31, 2013, which included $13.7 million in the North, $8.1 million in the Southeast, $6.6 million in Texas and $8.7 million in the West. The Company's goodwill balance was $16.8 million at December 31, 2012, which included $8.1 million in the Southeast and $8.7 million in the West. Goodwill was included in "Other" assets within the Consolidated Balance Sheets. ASC No. 350 ("ASC 350"), "Intangibles—Goodwill and Other," requires that goodwill and certain intangible assets be reviewed for impairment at least annually. The Company performs impairment tests of its goodwill annually as of November 30 or whenever significant events or changes occur that indicate impairment of goodwill may exist. The Company tests goodwill for impairment by using the two-step process prescribed in ASC 350. The first step identifies potential impairment, while the second step measures the amount of impairment. The Company had no goodwill impairment during the years ended December 31, 2013, 2012 and 2011.
Variable Interest Entities ("VIE")
As required by ASC 810, a VIE is to be consolidated by a company if that company has the power to direct the VIE's activities and the obligation to absorb its losses or the right to receive its benefits, which are potentially significant to the VIE. ASC 810 also requires disclosures about VIEs that a company is not obligated to consolidate, but in which it has a significant, though not primary, variable interest.
The Company enters into joint ventures, from time to time, for the purpose of acquisition and co-development of land parcels and lots. Its investment in these joint ventures may create a variable interest in a VIE, depending on the contractual terms of the arrangement. Additionally, in the ordinary course of business, the Company enters into lot option purchase contracts in order to procure land for the construction of homes. Under such lot option purchase contracts, the Company funds stated deposits in consideration for the right to purchase lots at a future point in time, usually at predetermined prices. The Company's liability is generally limited to forfeiture of nonrefundable deposits, letters of credit and other nonrefundable amounts incurred. In accordance with the requirements of ASC 810, certain of the Company's lot option purchase contracts may result in the creation of a variable interest in a VIE.
In compliance with the provisions of ASC 810, the Company consolidated $33.2 million and $39.5 million of inventory not owned related to land and lot option purchase contracts at December 31, 2013 and 2012, respectively. Although the Company may not have had legal title to the optioned land, under ASC 810, it had the primary variable interest and was required to consolidate the particular VIE's assets under option
46
Table of Contents
at fair value. To reflect the fair value of the inventory consolidated under ASC 810, the Company included $17.3 million and $17.7 million of its related cash deposits for lot option purchase contracts at December 31, 2013 and 2012, respectively, in "Consolidated inventory not owned" within the Consolidated Balance Sheets. Noncontrolling interest totaled $15.9 million and $21.8 million with respect to the consolidation of these contracts at December 31, 2013 and 2012, respectively, representing the selling entities' ownership interests in these VIEs. Additionally, the Company had cash deposits and/or letters of credit totaling $36.6 million and $22.2 million at December 31, 2013 and 2012, respectively, that were associated with lot option purchase contracts having aggregate purchase prices of $482.8 million and $310.1 million, respectively. As the Company did not have the primary variable interest in these contracts, it was not required to consolidate them.
Investments in Joint Ventures
The Company enters into joint ventures, from time to time, for the purpose of acquisition and co-development of land parcels and lots, which are then sold to the Company, its joint venture partners or others at market prices. It participates in a number of joint ventures in which it has less than a controlling interest. As of December 31, 2013, the Company participated in six active homebuilding joint ventures in the Austin, Chicago, Denver, San Antonio and Washington, D.C., markets. The Company recognizes its share of the respective joint ventures' earnings or losses from the sale of lots to other homebuilders. It does not, however, recognize earnings from lots that it purchases from the joint ventures. Instead, the Company reduces its cost basis in each lot by its share of the earnings from the lot.
The following table summarizes each reporting segment's total estimated share of lots owned by the Company under its joint ventures (unaudited):
| | | | | | | |
| | | DECEMBER 31, 2013 | | | DECEMBER 31, 2012 | |
| | |
North | | | 150 | | | 145 | |
Texas | | | 252 | | | – | |
West | | | 226 | | | 172 | |
| | | | | | |
Total | | | 628 | | | 317 | |
| | |
At December 31, 2013 and 2012, the Company's investments in its unconsolidated joint ventures totaled $12.6 million and $8.3 million, respectively, and were included in "Other" assets within the Consolidated Balance Sheets. The increase in the Company's investments in unconsolidated joint ventures was primarily due to its investment in a joint venture in San Antonio during 2013. The Company's equity in earnings from its unconsolidated joint ventures totaled $1.2 million for the years ended December 31, 2013 and 2012. For the year ended December 31, 2011, the Company's equity in losses from its unconsolidated joint ventures totaled $976,000 primarily as a result of a $1.9 million impairment related to a commercial parcel in a joint venture in Chicago.
Property, Plant and Equipment
Property, plant and equipment totaled $25.4 million and $20.4 million at December 31, 2013 and 2012, respectively. These amounts are carried at cost less accumulated depreciation and amortization. Depreciation is provided for, principally, by the straight-line method over the estimated useful lives of the assets. Property, plant and equipment included model home furnishings of $24.1 million and $19.4 million at December 31, 2013 and 2012, respectively. Model home furnishings are amortized over the life of the community as homes are closed. The amortization expense was included in "Selling, general and administrative" expense within the Consolidated Statements of Earnings.
Service Liabilities
Service, warranty and completion costs are estimated and accrued at the time a home closes and are updated as experience requires.
Advertising Costs
The Company expenses advertising costs as they are incurred. Advertising costs totaled $5.3 million, $4.6 million and $5.2 million in 2013, 2012 and 2011, respectively, and were included in "Selling, general and administrative" expense within the Consolidated Statements of Earnings.
47
Table of Contents
Loan Origination Fees, Mortgage Discount Points and Loan Sales
Mortgage loans are recorded at fair value at the time of origination in accordance with ASC No. 825 ("ASC 825"), "Financial Instruments," and are classified as held-for-sale. Loan origination fees, net of mortgage discount points, are recognized in current earnings upon origination of the related mortgage loan. Sales of mortgages and the related servicing rights are accounted for in accordance with ASC No. 860 ("ASC 860"), "Transfers and Servicing." Generally, in order for a transfer of financial assets to be recognized as a sale, ASC 860 requires that control of the loans be passed to the investor and that consideration other than beneficial interests be received in return.
Derivative Instruments
In the normal course of business and pursuant to its risk-management policy, the Company enters, as an end user, into derivative instruments, including forward-delivery contracts for loans; options on forward-delivery contracts; and options on futures contracts, to minimize the impact of movement in market interest rates on IRLCs. Major factors influencing the use of various hedging contracts include general market conditions, interest rates, types of mortgages originated and the percentage of IRLCs expected to fund. The Company is exposed to credit-related losses in the event of nonperformance by counterparties to certain hedging contracts. Credit risk is limited to those instances where the Company is in a net unrealized gain position. It manages this credit risk by entering into agreements with counterparties meeting its credit standards and by monitoring position limits. The Company elected not to use hedge accounting treatment with respect to its economic hedging activities. Accordingly, all derivative instruments used as economic hedges were included at their fair value in "Other" assets or "Accrued and other liabilities" within the Consolidated Balance Sheets, with changes in value recorded in current earnings. The Company's mortgage pipeline includes IRLCs, which represent commitments that have been extended by the Company to those borrowers who have applied for loan funding and who have met certain defined credit and underwriting criteria.
Comprehensive Income
Comprehensive income consists of net income or loss; actuarial gains or losses on defined benefit pension plans; and the increase or decrease in unrealized gains or losses on the Company's available-for-sale securities, as well as the decrease in unrealized gains associated with treasury locks, net of applicable taxes. Comprehensive income totaled $378.0 million and $40.3 million for the years ended December 31, 2013 and 2012, respectively, compared to a comprehensive loss of $52.5 million for the same period in 2011.
Accumulated Other Comprehensive (Loss) Income
Accumulated other comprehensive income or loss consists of actuarial gains or losses on defined benefit pension plans and unrealized gains or losses on marketable securities, available-for-sale, as reported within the Consolidated Statements of Stockholders' Equity. Reclassification adjustments, which are reported within the Consolidated Statements of Other Comprehensive Income, represent realized gains or losses on the sales of these marketable securities and netted a loss of $64,000 for the year ended December 31, 2013. Realized gains or losses were included in "Gain from marketable securities, net" within the Consolidated Statements of Earnings.
Income Taxes
The Company files a consolidated federal income tax return. Certain items of income and expense are included in one period for financial reporting purposes and in another for income tax purposes. Deferred income taxes are provided in recognition of these differences. Deferred tax assets and liabilities are determined based on enacted tax rates and are subsequently adjusted for changes in these rates. A valuation allowance against the Company's deferred tax assets may be established if it is more likely than not that all or some portion of the deferred tax assets will not be realized. A change in deferred tax assets or liabilities results in a charge or credit to deferred tax expense. (See "Critical Accounting Policies" within Management's Discussion and Analysis of Financial Condition and Results of Operations, and Note H, "Income Taxes.")
Per Share Data
The Company computes earnings per share in accordance with ASC No. 260 ("ASC 260"), "Earnings per Share," which requires the presentation of both basic and diluted earnings per common share to be calculated using the two-class method. Basic net earnings per common share is computed by dividing net
48
Table of Contents
earnings by the weighted-average number of common shares outstanding. The Company's nonvested outstanding shares of restricted stock are classified as participating securities in accordance with ASC 260. As such, earnings or loss for the reporting period are allocated between common shareholders and nonvested restricted stockholders, based upon their respective participating rights in dividends and undistributed earnings. For purposes of determining diluted earnings per common share, basic earnings per common share is further adjusted to include the effect of potential dilutive common shares outstanding, including stock options and warrants using the treasury stock method and convertible debt using the if-converted method. For the year ended December 31, 2011, the effects of outstanding restricted stock units and stock options, as well as nonvested restricted stock, were not included in the diluted earnings per share calculation as they would have been antidilutive due to the Company's net loss in that year.
Stock-Based Compensation
In accordance with the terms of its shareholder-approved equity incentive plans, the Company issues various types of stock awards that include, but are not limited to, grants of stock options and restricted stock units to its employees. The Company records expense associated with its grant of stock awards in accordance with the provisions of ASC 718, which requires that stock-based payments to employees be recognized, based on their estimated fair values, in the Consolidated Statements of Earnings as compensation expense over the vesting period of the awards.
Additionally, the Company grants stock awards to the non-employee members of its Board of Directors pursuant to its shareholder-approved director stock plan. Stock-based compensation is recognized over the service period for such awards.
New Accounting Pronouncements
ASU 2013-11
In July 2013, the FASB issued Accounting Standards Update ("ASU") No. 2013-11 ("ASU 2013-11"), "Presentation of an Unrecognized Tax Benefit When a Net Operating Loss Carryforward, a Similar Tax Loss or a Tax Credit Carryforward Exists." The amendments in ASU 2013-11 are intended to end inconsistent practices regarding the presentation of unrecognized tax benefits on the balance sheet. An entity will be required to present an unrecognized tax benefit as a reduction of a deferred tax asset for an NOL or tax credit carryforward whenever the NOL or tax credit carryforward would be available to reduce the additional taxable income or tax due if the tax position is disallowed. An entity is required to apply the amendments prospectively for annual reporting periods beginning after December 15, 2013, and for interim periods within those annual periods. Early adoption and retrospective application are permitted. The Company does not anticipate that the adoption of this guidance will have a material impact on its consolidated financial statements.
Note B: Segment Information
The Company is a leading national homebuilder and provider of mortgage-related financial services. As one of the largest single-family on-site homebuilders in the United States, it operates in 17 states across the country. In accordance with ASC No. 280 ("ASC 280"), "Segment Reporting," the Company has identified six reportable segments: four geographically determined homebuilding regions (North, Southeast, Texas and West); financial services; and corporate. The homebuilding segments specialize in the sale and construction of single-family attached and detached housing. The Company's financial services segment, which includes RMC, RHIC and CNRRG, provides mortgage-related products and services, as well as title and escrow services, to its homebuyers. Corporate is a nonoperating business segment with the sole purpose of supporting operations. In order to best reflect the Company's financial condition and results of operations, certain corporate expenses are allocated to the homebuilding and financial services segments, along with certain assets and liabilities relating to employee benefit plans.
The Company evaluates performance and allocates resources based on a number of factors, including segment pretax earnings and risk. The accounting policies of the segments are the same as those described in Note A, "Summary of Significant Accounting Policies."
49
Table of Contents
Selected Segment Information
| | | | | | | | | | |
| | YEAR ENDED DECEMBER 31, | |
(in thousands) | | | 2013 | | | 2012 | | | 2011 | |
| | |
REVENUES | | | | | | | | | | |
Homebuilding | | | | | | | | | | |
North | | $ | 617,550 | | $ | 393,238 | | $ | 299,595 | |
Southeast | | | 597,933 | | | 355,621 | | | 218,672 | |
Texas | | | 448,828 | | | 323,162 | | | 262,321 | |
West | | | 425,064 | | | 198,826 | | | 82,016 | |
Financial services | | | 51,380 | | | 37,619 | | | 26,927 | |
| | | | |
Total | | $ | 2,140,755 | | $ | 1,308,466 | | $ | 889,531 | |
| | |
EARNINGS (LOSS) BEFORE TAXES | | | | | | | | | | |
Homebuilding | | | | | | | | | | |
North | | $ | 52,440 | | $ | 11,602 | | $ | (9,054 | ) |
Southeast | | | 65,510 | | | 18,566 | | | (11,676 | ) |
Texas | | | 39,030 | | | 22,984 | | | 9,243 | |
West | | | 46,546 | | | 10,732 | | | (5,326 | ) |
Financial services | | | 20,068 | | | 13,142 | | | 5,739 | |
Corporate and unallocated | | | (27,903 | ) | | (33,059 | ) | | (21,658 | ) |
| | | | |
Total | | $ | 195,691 | | $ | 43,967 | | $ | (32,732 | ) |
| | |
DEPRECIATION AND AMORTIZATION | | | | | | | | | | |
Homebuilding | | | | | | | | | | |
North | | $ | 5,819 | | $ | 4,710 | | $ | 3,527 | |
Southeast | | | 5,629 | | | 4,308 | | | 3,145 | |
Texas | | | 3,960 | | | 2,834 | | | 2,610 | |
West | | | 4,569 | | | 2,984 | | | 1,295 | |
Financial services | | | 175 | | | 78 | | | 181 | |
Corporate and unallocated | | | 365 | | | 485 | | | 554 | |
| | | | |
Total | | $ | 20,517 | | $ | 15,399 | | $ | 11,312 | |
| | |
The following table provides the Company's total assets at December 31, 2013 and 2012:
| | | | | | | | | | |
| | DECEMBER 31, 2013 | |
(in thousands) | | | HOUSING INVENTORIES | | | OTHER ASSETS | | | TOTAL ASSETS | |
| | |
Homebuilding | | | | | | | | | | |
North | | $ | 464,777 | | $ | 48,314 | | $ | 513,091 | |
Southeast | | | 397,237 | | | 24,143 | | | 421,380 | |
Texas | | | 290,018 | | | 37,310 | | | 327,328 | |
West | | | 497,751 | | | 30,248 | | | 527,999 | |
Financial services | | | – | | | 193,652 | | | 193,652 | |
Corporate and unallocated | | | – | | | 796,862 | | | 796,862 | |
| | | | |
Total | | $ | 1,649,783 | | $ | 1,130,529 | | $ | 2,780,312 | |
| | |
| | | | | | | | | | |
| | DECEMBER 31, 2012 | |
Homebuilding | | | | | | | | | | |
North | | $ | 378,523 | | $ | 29,818 | | $ | 408,341 | |
Southeast | | | 292,288 | | | 22,755 | | | 315,043 | |
Texas | | | 174,153 | | | 22,244 | | | 196,397 | |
West | | | 232,454 | | | 41,596 | | | 274,050 | |
Financial services | | | – | | | 157,781 | | | 157,781 | |
Corporate and unallocated | | | – | | | 579,827 | | | 579,827 | |
| | | | |
Total | | $ | 1,077,418 | | $ | 854,021 | | $ | 1,931,439 | |
| | |
Additionally, the Company had assets of $30,000 and $2.5 million associated with discontinued operations at December 31, 2013 and 2012, respectively.
50
Table of Contents
Note C: Earnings Per Share Reconciliation
The Company computes earnings per share in accordance with ASC 260, which requires earnings per share for each class of stock to be calculated using the two-class method. The two-class method is the method by which a company allocates earnings or loss between the holders of its common stock and its participating security holders. Under the two-class method, allocation of earnings or loss between common shareholders and other security holders is based on their respective participation rights in dividends and undistributed earnings for the reporting period. All outstanding nonvested shares of restricted stock that contain non-forfeitable rights to dividends are considered participating securities and are included in the computation of earnings per share pursuant to the two-class method. The Company's nonvested shares of restricted stock are considered participating securities in accordance with ASC 260.
The following table displays the computation of basic and diluted earnings per share:
| | | | | | | | | | |
| | YEAR ENDED DECEMBER 31, | |
(in thousands, except share data) | | | 2013 | | | 2012 | | | 2011 | |
| | |
NUMERATOR | | | | | | | | | | |
Net income (loss) from continuing operations | | $ | 379,099 | | $ | 42,382 | | $ | (29,867 | ) |
Net income (loss) from discontinued operations | | | 106 | | | (2,000 | ) | | (20,883 | ) |
Less: distributed earnings allocated to nonvested restricted stock | | | (13 | ) | | (42 | ) | | – | |
Less: undistributed earnings allocated to nonvested restricted stock | | | (1,135 | ) | | (313 | ) | | – | |
| | | | |
Numerator for basic income (loss) per share | | | 378,057 | | | 40,027 | | | (50,750 | ) |
| | | | |
Plus: interest on 1.6 percent convertible senior notes due 2018 | | | 2,916 | | | 1,829 | | | – | |
Plus: interest on 0.25 percent convertible senior notes due 2019 | | | 710 | | | – | | | – | |
Plus: undistributed earnings allocated to nonvested restricted stock | | | 1,135 | | | 313 | | | – | |
Less: undistributed earnings reallocated to nonvested restricted stock | | | (931 | ) | | (284 | ) | | – | |
| | | | |
Numerator for diluted income (loss) per share | | $ | 381,887 | | $ | 41,885 | | $ | (50,750 | ) |
| | | | |
DENOMINATOR | | | | | | | | | | |
Basic earnings per share—weighted-average shares | | | 45,966,307 | | | 44,761,178 | | | 44,357,470 | |
Effect of dilutive securities: | | | | | | | | | | |
Share-based payments | | | 1,031,656 | | | 487,443 | | | – | |
1.6 percent convertible senior notes due 2018 | | | 7,023,780 | | | 4,406,700 | | | – | |
0.25 percent convertible senior notes due 2019 | | | 2,198,196 | | | – | | | – | |
| | | | |
Diluted earnings per share—adjusted weighted-average shares and assumed conversions | | | 56,219,939 | | | 49,655,321 | | | 44,357,470 | |
| | | | |
NET INCOME (LOSS) PER COMMON SHARE | | | | | | | | | | |
Basic | | | | | | | | | | |
Continuing operations | | $ | 8.22 | | $ | 0.93 | | $ | (0.67 | ) |
Discontinued operations | | | 0.00 | | | (0.04 | ) | | (0.47 | ) |
| | | | |
Total | | | 8.22 | | | 0.89 | | | (1.14 | ) |
Diluted | | | | | | | | | | |
Continuing operations | | | 6.79 | | | 0.88 | | | (0.67 | ) |
Discontinued operations | | | 0.00 | | | (0.04 | ) | | (0.47 | ) |
| | | | |
Total | | $ | 6.79 | | $ | 0.84 | | $ | (1.14 | ) |
| | |
For the year ended December 31, 2011, the effects of outstanding restricted stock units and stock options, as well as nonvested restricted stock, were not included in the diluted earnings per share calculation as they would have been antidilutive due to the Company's net loss in that year.
Note D: Derivative Instruments
The Company, which uses derivative financial instruments in its normal course of operations, has no derivative financial instruments that are held for trading purposes.
51
Table of Contents
The following table presents the contract or notional amounts of the Company's derivative financial instruments:
| | | | | | | |
| | DECEMBER 31, | |
(in thousands) | | | 2013 | | | 2012 | |
| | |
Mortgage interest rate lock commitments | | $ | 269,210 | | $ | 137,741 | |
Hedging contracts: | | | | | | | |
Forward-delivery contracts | | $ | 118,000 | | $ | 68,000 | |
| | |
IRLCs represent loan commitments with customers at market rates generally up to 180 days before settlement. During 2013, the increasing interest rate environment resulted in loan commitments being extended up to 270 days. IRLCs expose the Company to market risk if mortgage rates increase. IRLCs had interest rates generally ranging from 3.0 percent to 5.3 percent at December 31, 2013 and 2012.
Hedging contracts are regularly entered into by the Company for the purpose of mitigating its exposure to movement in interest rates on IRLCs. The selection of these hedging contracts is based upon the Company's secondary marketing strategy, which establishes a risk-tolerance level. Major factors influencing the use of various hedging contracts include general market conditions, interest rates, types of mortgages originated and the percentage of IRLCs expected to fund. The market risk assumed while holding the hedging contracts generally mitigates the market risk associated with IRLCs. The Company is exposed to credit-related losses in the event of nonperformance by counterparties to certain hedging contracts. Credit risk is limited to those instances where the Company is in a net unrealized gain position. The Company manages this credit risk by entering into agreements with counterparties meeting its credit standards and by monitoring position limits.
During 2006, the Company terminated its treasury lock commitments that were deemed to be highly effective cash flow hedges related to future senior note issuances. The gain resulting from these settlements was recorded, net of income tax effect, in "Accumulated other comprehensive (loss) income" within the Consolidated Statements of Other Comprehensive Income and was amortized until the Company's 6.9 percent senior notes due June 2013 were redeemed during 2012, at which time the remaining gain was amortized. The Company amortized $1.7 million and $1.2 million of the gain for the years ended December 31, 2012 and 2011, respectively. The income tax benefit associated with the gain was $653,000 and $462,000 for the years ended December 31, 2012 and 2011, respectively.
Note E: Marketable Securities, Available-for-sale
The Company's investment portfolio includes U.S. Treasury securities; obligations of U.S. government agencies; municipal debt securities; corporate debt securities; asset-backed securities of U.S. government agencies and covered bonds; time deposits; and short-term pooled investments. These investments are primarily held in the custody of a single financial institution. The Company considers its investment portfolio to be available-for-sale as defined in ASC No. 320 ("ASC 320"), "Investments—Debt and Equity Securities." Accordingly, these investments are recorded at their fair values. The cost of securities sold is based on an average-cost basis. Unrealized gains and losses on these investments were included in "Accumulated other comprehensive (loss) income" within the Consolidated Balance Sheets.
The Company periodically reviews its available-for-sale securities for other-than-temporary declines in fair values that are below their cost bases, as well as whenever events or changes in circumstances indicate that the carrying amount of an asset may not be recoverable. At December 31, 2013 and 2012, the Company believed that the cost bases for its available-for-sale securities were recoverable in all material respects.
For the years ended December 31, 2013, 2012 and 2011, net realized earnings associated with the Company's investment portfolio, which includes interest, dividends, and net realized gains on sales of marketable securities, totaled $1.8 million, $2.2 million and $3.9 million, respectively. These earnings were included in "Gain from marketable securities, net" within the Consolidated Statements of Earnings. Realized gains or losses on the sales of marketable securities were included as reclassification adjustments
52
Table of Contents
within the Consolidated Statements of Other Comprehensive Income. (See "Accumulated Other Comprehensive (Loss) Income" within Note A, "Summary of Significant Accounting Policies.")
The following table displays the fair values of marketable securities, available-for-sale, by type of security:
| | | | | | | | | | | | | |
| | DECEMBER 31, 2013 | |
(in thousands) | | | AMORTIZED
COST | | | GROSS
UNREALIZED
GAINS | | | GROSS
UNREALIZED
LOSSES | | | ESTIMATED
FAIR
VALUE | |
| | |
Type of security: | | | | | | | | | | | | | |
U.S. Treasury securities | | $ | 76,355 | | $ | 149 | | $ | – | | $ | 76,504 | |
Obligations of U.S. government agencies | | | 17,074 | | | 2 | | | (8 | ) | | 17,068 | |
Municipal debt securities | | | 33,492 | | | 492 | | | (1,008 | ) | | 32,976 | |
Corporate debt securities | | | 157,798 | | | 102 | | | (21 | ) | | 157,879 | |
Asset-backed securities | | | 20,433 | | | 76 | | | (20 | ) | | 20,489 | |
| | | | |
Total debt securities | | | 305,152 | | | 821 | | | (1,057 | ) | | 304,916 | |
Time deposits | | | 1,606 | | | – | | | – | | | 1,606 | |
Short-term pooled investments | | | 6,633 | | | – | | | – | | | 6,633 | |
| | | | |
Total marketable securities, available-for-sale | | $ | 313,391 | | $ | 821 | | $ | (1,057 | ) | $ | 313,155 | |
| | |
| | | | | | | | | | | | | |
| | DECEMBER 31, 2012 | |
Type of security: | | | | | | | | | | | | | |
U.S. Treasury securities | | $ | 3,098 | | $ | 1 | | $ | – | | $ | 3,099 | |
Obligations of U.S. government agencies | | | 133,029 | | | 112 | | | (31 | ) | | 133,110 | |
Municipal debt securities | | | 21,745 | | | 896 | | | (458 | ) | | 22,183 | |
Corporate debt securities | | | 163,352 | | | 116 | | | (75 | ) | | 163,393 | |
Asset-backed securities | | | 27,325 | | | 153 | | | (164 | ) | | 27,314 | |
| | | | |
Total debt securities | | | 348,549 | | | 1,278 | | | (728 | ) | | 349,099 | |
Short-term pooled investments | | | 36,533 | | | – | | | (7 | ) | | 36,526 | |
| | | | |
Total marketable securities, available-for-sale | | $ | 385,082 | | $ | 1,278 | | $ | (735 | ) | $ | 385,625 | |
| | |
The primary objectives of the Company's investment portfolio are safety of principal and liquidity. Investments are made with the purpose of achieving the highest rate of return consistent with these two objectives. The Company's investment policy limits investments to debt rated investment grade or better, as well as to bank and money market instruments and to issues by the U.S. government, U.S. government agencies and municipal or other institutions primarily with investment-grade credit ratings. Policy restrictions are placed on maturities, as well as on concentration by type and issuer.
The following table displays the fair values of marketable securities, available-for-sale, by contractual maturity:
| | | | | | | |
| | DECEMBER 31, | |
(in thousands) | | | 2013 | | | 2012 | |
| | |
Contractual maturity: | | | | | | | |
Maturing in one year or less | | $ | 129,384 | | $ | 66,546 | |
Maturing after one year through three years | | | 154,169 | | | 257,595 | |
Maturing after three years | | | 21,363 | | | 24,958 | |
| | | | |
Total debt securities | | | 304,916 | | | 349,099 | |
Time deposits and short-term pooled investments | | | 8,239 | | | 36,526 | |
| | | | |
Total marketable securities, available-for-sale | | $ | 313,155 | | $ | 385,625 | |
| | |
Note F: Fair Values of Financial and Nonfinancial Instruments
Financial Instruments
The Company's financial instruments are held for purposes other than trading. The fair values of these financial instruments are based on quoted market prices, where available, or are estimated using other valuation techniques. Estimated fair values are significantly affected by the assumptions used. As required by ASC No. 820 ("ASC 820"), "Fair Value Measurements and Disclosures," fair value measurements of
53
Table of Contents
financial instruments are categorized as Level 1, Level 2 or Level 3, based on the types of inputs used in estimating fair values.
Level 1 fair values are those determined using quoted market prices in active markets for identical assets or liabilities. Level 2 fair values are those determined using directly or indirectly observable inputs in the marketplace that are other than Level 1 inputs. Level 3 fair values are those determined using unobservable inputs, including the use of internal assumptions, estimates or models. Valuations, therefore, are sensitive to the assumptions used for these items. Fair values represent the Company's best estimates as of the balance sheet date and are based on existing conditions and available information at the issuance date of these financial statements. Subsequent changes in conditions or available information may change assumptions and estimates.
The carrying values of cash, cash equivalents, restricted cash and secured notes payable are reported in the Consolidated Balance Sheets and approximate their fair values due to their short-term natures and liquidity. The aggregate carrying values of the senior notes, net of discount, reported at December 31, 2013 and 2012, were $1.4 billion and $1.1 billion, respectively. The aggregate fair values of the senior notes were $1.6 billion and $1.3 billion at December 31, 2013 and 2012, respectively. The fair values of the Company's senior notes have been determined using quoted market prices.
The following table displays the values and methods used for measuring fair values of financial instruments on a recurring basis:
| | | | | | | | | |
| | FAIR VALUE AT DECEMBER 31, | |
(in thousands) | | HIERARCHY | | | 2013 | | | 2012 | |
| | |
Marketable securities, available-for-sale: | | | | | | | | | |
U.S. Treasury securities | | Level 1 | | $ | 76,504 | | $ | 3,099 | |
Obligations of U.S. government agencies | | Level 1 | | | 17,068 | | | 133,110 | |
Municipal debt securities | | Level 2 | | | 32,976 | | | 22,183 | |
Corporate debt securities | | Level 2 | | | 157,879 | | | 163,393 | |
Asset-backed securities | | Level 2 | | | 20,489 | | | 27,314 | |
Time deposits | | Level 2 | | | 1,606 | | | – | |
Short-term pooled investments | | Level 1 | | | 6,633 | | | 36,526 | |
Mortgage loans held-for-sale | | Level 2 | | | 139,576 | | | 107,950 | |
Mortgage interest rate lock commitments | | Level 2 | | | 5,218 | | | 4,737 | |
Forward-delivery contracts | | Level 2 | | | 2,261 | | | (369 | ) |
| | |
Marketable Securities, Available-for-sale
At December 31, 2013 and 2012, the Company had $313.2 million and $385.6 million, respectively, of marketable securities that were available-for-sale and comprised of U.S. Treasury securities; obligations of U.S. government agencies; municipal debt securities; corporate debt securities; asset-backed securities of U.S. government agencies and covered bonds; time deposits; and short-term pooled investments. (See Note E, "Marketable Securities, Available-for-sale.")
Other Financial Instruments
Mortgage loans held-for-sale and forward-delivery contracts are based on quoted market prices of similar instruments (Level 2). IRLCs are valued at their aggregate market price premium or deficit, plus a servicing premium, multiplied by the projected close ratio (Level 2). The market price premium or deficit is based on quoted market prices of similar instruments; the servicing premium is based on contractual investor guidelines for each product; and the projected close ratio is determined utilizing an external modeling system, widely used within the industry, to estimate customer behavior at an individual loan level. At December 31, 2013 and 2012, contractual principal amounts of mortgage loans held-for-sale totaled $137.5 million and $103.4 million, respectively. The fair values of IRLCs were included in "Other" assets within the Consolidated Balance Sheets, and forward-delivery contracts were included in "Other" assets and "Accrued and other liabilities" within the Consolidated Balance Sheets.
Gains realized on the IRLC pipeline, including activity and changes in fair value, totaled $480,000, $1.4 million and $1.9 million for the years ended December 31, 2013, 2012 and 2011, respectively. Gains on forward-delivery contracts used to hedge IRLCs totaled $8.8 million for the year ended December 31,
54
Table of Contents
2013, compared to losses on forward-delivery contracts that totaled $8.1 million and $7.3 million for the years ended December 31, 2012 and 2011, respectively. Gains on loan sales totaled $17.0 million, $26.6 million and $17.9 million for the years ended December 31, 2013, 2012 and 2011, respectively. Net gains and losses related to IRLCs, forward-delivery contracts and loan sales were included in "Financial services" revenues within the Consolidated Statements of Earnings.
The excess of the aggregate fair value over the aggregate unpaid principal balance for mortgage loans held-for-sale measured at fair value totaled $2.1 million and $4.6 million at December 31, 2013 and 2012, respectively. These amounts were included in "Financial services" revenues within the Consolidated Statements of Earnings. At December 31, 2013, the Company held two repurchased loans with payments 90 days or more past due that had an aggregate carrying value of $467,000 and an aggregate unpaid principal balance of $738,000. At December 31, 2012, the Company held no loans with payments 90 days or more past due.
While recorded fair values represent management's best estimate based on data currently available, future changes in interest rates or in market prices for mortgage loans, among other factors, could materially impact these fair values.
Nonfinancial Instruments
In accordance with ASC 820, the Company measures certain nonfinancial homebuilding assets at their fair values on a nonrecurring basis. See "Housing Inventories" within Note A, "Summary of Significant Accounting Policies," for further discussion of the valuation of the Company's nonfinancial assets. There were no housing inventory impairments during the year ended December 31, 2013. In accordance with ASC No. 330, ("ASC 330"), "Inventory," the fair value of housing inventory that was impaired during 2012 totaled $2.9 million at December 31, 2012. Impairment charges related to these assets totaled $1.9 million for the year ended December 31, 2012. The fair values of other assets held-for-sale that were impaired during 2013 totaled $596,000 at December 31, 2013. Impairment charges related to these assets totaled $154,000 for the year ended December 31, 2013. The fair values of other assets held-for-sale that were impaired during 2012 totaled $263,000 at December 31, 2012. Impairment charges related to these assets totaled $41,000 for the year ended December 31, 2012. The fair values of investments in joint ventures that were impaired during 2012 totaled $1.3 million at December 31, 2012. Impairment charges related to these assets totaled $40,000 for the year ended December 31, 2012.
Note G: Debt and Credit Facilities
The following table presents the composition of the Company's homebuilder debt and its financial services credit facility at December 31, 2013 and 2012:
| | | | | | | |
(in thousands) | | | 2013 | | | 2012 | |
| | |
Senior notes | | | | | | | |
5.4 percent senior notes due January 2015 | | $ | 126,481 | | $ | 126,481 | |
8.4 percent senior notes due May 2017 | | | 230,000 | | | 230,000 | |
6.6 percent senior notes due May 2020 | | | 300,000 | | | 300,000 | |
5.4 percent senior notes due October 2022 | | | 250,000 | | | 250,000 | |
Convertible senior notes | | | | | | | |
1.6 percent convertible senior notes due May 2018 | | | 225,000 | | | 225,000 | |
0.25 percent convertible senior notes due June 2019 | | | 267,500 | | | – | |
| | | | |
Total senior notes and convertible senior notes | | | 1,398,981 | | | 1,131,481 | |
Debt discount | | | (2,362 | ) | | (3,000 | ) |
| | | | |
Senior notes and convertible senior notes, net | | | 1,396,619 | | | 1,128,481 | |
Secured notes payable | | | 689 | | | 5,987 | |
| | | | |
Total debt | | $ | 1,397,308 | | $ | 1,134,468 | |
Financial services credit facility | | $ | 73,084 | | $ | – | |
| | |
55
Table of Contents
At December 31, 2013, maturities of the Company's homebuilder debt and its financial services credit facility were scheduled as follows:
| | | | |
(in thousands) | | | | |
| | |
2014 | | $ | 73,760 | |
2015 | | | 126,494 | |
2016 | | | – | |
2017 | | | 230,000 | |
2018 | | | 225,000 | |
After 2018 | | | 817,500 | |
| | | | |
Total | | $ | 1,472,754 | |
| | |
At December 31, 2013, the Company had outstanding(a) $126.5 million of 5.4 percent senior notes due January 2015;(b) $230.0 million of 8.4 percent senior notes due May 2017;(c) $225.0 million of 1.6 percent convertible senior notes due May 2018;(d) $267.5 million of 0.25 percent convertible senior notes due June 2019;(e) $300.0 million of 6.6 percent senior notes due May 2020; and(f) $250.0 million of 5.4 percent senior notes due October 2022. Each of the senior notes pays interest semiannually and all, except for the convertible senior notes due May 2018 and June 2019, may be redeemed at a stated redemption price, in whole or in part, at the option of the Company at any time.
During 2013, the Company issued $267.5 million of 0.25 percent convertible senior notes due June 2019. The Company will pay interest on the notes on June 1 and December 1 of each year, which commenced on December 1, 2013. The notes, which mature on June 1, 2019, are initially convertible into shares of the Company's common stock at a conversion rate of 13.3307 shares per $1,000 of their principal amount. This corresponds to an initial conversion price of approximately $75.01 per share and represents a conversion premium of approximately 50.0 percent, based on the closing price of the Company's common stock on May 14, 2013, which was $50.01 per share. The conversion rate of the notes is subject to adjustment upon the following events: the Company issues a dividend or distribution in shares of common stock on all or substantially all of its shares of common stock; the Company subdivides or combines common stock; the Company offers its stockholders the option to purchase additional shares at a price that is less than the average closing price of its common stock from the ten previous trading days; the Company distributes shares of common stock or offers its holders of common stock the option to purchase capital stock or other securities; a corporate spin-off event occurs; the Company pays dividends or distributions to a stockholder, other than a dividend or distribution due to liquidation or a regular cash dividend that does not exceed $0.03 per share per quarter; the Company makes a payment in respect of a tender offer for its common stock that exceeds the average closing price of its common stock from the ten previous trading days; a make-whole adjustment event occurs; or a redemption notice occurs, which includes a change in control or termination of trading. These events may not be considered standard anti-dilution provisions under a conventional convertible debt security scenario. An event that adversely affects the value of the notes may occur, and that event may not result in an adjustment to the conversion rate. All of the conversion rate adjustment events are intended to make the investor whole for the direct effect that the occurrence of such above mentioned dilutive events should have on the price of the underlying shares; they do not adjust for the actual change in the market value of the underlying shares. Therefore, the only variables that could affect the settlement amount would be inputs to the fair value of a fixed-for-fixed forward or option on equity shares. At any time prior to the close of business on the business day immediately preceding the stated maturity date, holders may convert all or any portion of their notes. The notes are fully and unconditionally guaranteed, jointly and severally, by substantially all of the Company's Guarantor Subsidiaries. The Company may not redeem the notes prior to June 6, 2017. On or after that date, it may redeem for cash any or all of the notes, at its option, if the closing sale price of its common stock for at least 20 trading days (whether or not consecutive) during any 30 consecutive trading day period ending within 5 trading days immediately preceding the date on which it provides notice of redemption, including the last trading day of such 30 day trading period, exceeds 130 percent of the applicable conversion price on each applicable trading day. The redemption price will equal 100 percent of the principal amount of the notes to be redeemed, plus accrued and unpaid interest to, but excluding, the redemption date. No sinking fund is provided for the notes. The Company received net proceeds of $260.1 million from this offering prior to offering expenses.
56
Table of Contents
During 2012, the Company issued $250.0 million of 5.4 percent senior notes due October 2022. The Company will pay interest on the notes on April 1 and October 1 of each year, which commenced on April 1, 2013. It received net proceeds of $246.6 million from this offering prior to offering expenses. The notes are fully and unconditionally guaranteed, jointly and severally, by substantially all of the Company's Guarantor Subsidiaries.
Additionally during 2012, the Company issued $225.0 million of 1.6 percent convertible senior notes due May 2018. The Company will pay interest on the notes on May 15 and November 15 of each year, which commenced on November 15, 2012. At any time prior to the close of business on the business day immediately preceding the stated maturity date, holders may convert all or any portion of their convertible senior notes. These notes will mature on May 15, 2018, unless converted earlier by the holder, at its option, or purchased by the Company upon the occurrence of a fundamental change. These notes are initially convertible into shares of the Company's common stock at a conversion rate of 31.2168 shares per $1,000 of their principal amount. This corresponds to an initial conversion price of approximately $32.03 per share and represents a conversion premium of approximately 42.5 percent, based on the closing price of the Company's common stock on May 10, 2012, which was $22.48 per share. The conversion rate of the notes is subject to adjustment upon the following events: the Company issues a dividend or distribution in shares of common stock on all or substantially all of its shares of common stock; the Company subdivides or combines common stock; the Company offers its stockholders the option to purchase additional shares at a price that is less than the average closing price of its common stock from the ten previous trading days; the Company distributes shares of common stock or offers its holders of common stock the option to purchase capital stock or other securities; a corporate spin-off event occurs; the Company pays dividends or distributions to a stockholder, other than a dividend or distribution due to liquidation or a regular cash dividend that does not exceed $0.03 per share per quarter; the Company makes a payment in respect of a tender offer for its common stock that exceeds the average closing price of its common stock from the ten previous trading days; or a make-whole adjustment event occurs, which includes a change in control or termination of trading. These events may not be considered standard anti-dilution provisions under a conventional convertible debt security scenario. An event that adversely affects the value of the notes may occur, and that event may not result in an adjustment to the conversion rate. All of the conversion rate adjustment events are intended to make the investor whole for the direct effect that the occurrence of such above-mentioned dilutive events should have on the price of the underlying shares; they do not adjust for the actual change in the market value of the underlying shares. Therefore, the only variables that could affect the settlement amount would be inputs to the fair value of a fixed-for-fixed forward or option on equity shares. The notes are fully and unconditionally guaranteed, jointly and severally, by substantially all of the Company's Guarantor Subsidiaries. The Company may not redeem the notes prior to the stated maturity date. No sinking fund is provided for the notes. The Company received net proceeds of $218.8 million from this offering prior to offering expenses.
The Company did not redeem or repurchase any debt during the year ended December 31, 2013. For the year ended December 31, 2012, the Company paid $177.2 million to redeem and repurchase $167.2 million of its 6.9 percent senior notes due June 2013, resulting in a loss of $9.1 million. For the year ended December 31, 2011, the Company's repurchases of its senior notes totaled $51.5 million in the open market, for which it paid $52.9 million, resulting in a loss of $1.6 million. The losses resulting from these debt repurchases were included in "Loss related to early retirement of debt, net" within the Consolidated Statements of Earnings.
To provide letters of credit required in the ordinary course of its business, the Company has various secured letter of credit agreements that require it to maintain restricted cash deposits for outstanding letters of credit. Outstanding letters of credit totaled $93.6 million and $79.5 million under these agreements at December 31, 2013 and 2012, respectively.
To finance its land purchases, the Company may also use seller-financed nonrecourse secured notes payable. At December 31, 2013 and 2012, outstanding seller-financed nonrecourse secured notes payable totaled $689,000 and $6.0 million, respectively.
57
Table of Contents
Senior notes and indenture agreements are subject to certain covenants that include, among other things, restrictions on additional secured debt and the sale of assets. The Company was in compliance with these covenants at December 31, 2013.
During 2011, RMC entered into a $50.0 million repurchase credit facility with JPM. This facility is used to fund, and is secured by, mortgages that were originated by RMC and are pending sale. During 2012, the facility was increased to $75.0 million. During 2013, the facility was extended to December 2014. Under the terms of this facility, RMC is required to maintain various financial and other covenants and to satisfy certain requirements relating to the mortgages securing the facility. At December 31, 2013, the Company was in compliance with these covenants. The Company had outstanding borrowings against this credit facility that totaled $73.1 million at December 31, 2013. There were no outstanding borrowings against the facility at December 31, 2012.
Note H: Income Taxes
Deferred tax assets are recognized for estimated tax effects that are attributable to deductible temporary differences and tax carryforwards related to tax credits and NOLs. They are realized when existing temporary differences are carried back to a profitable year(s) and/or carried forward to a future year(s) having taxable income. Deferred tax assets are reduced by a valuation allowance if an assessment of their components indicates that it is more likely than not that all or some portion of these assets will not be realized. In the assessment for a valuation allowance, appropriate consideration is given to all positive and negative evidence related to the realization of the deferred tax assets. This assessment considers, among other matters, the nature, frequency and severity of current and cumulative losses; actual earnings; forecasts of future earnings; the duration of statutory carryforward periods; the Company's experience with NOL carryforwards not expiring unused; and tax planning alternatives.
Prior to the quarter ended June 30, 2013, the Company gave significant weight to the negative, direct evidence of its three-year cumulative pretax loss position that resulted from prior losses incurred during the housing market decline. As of June 30, 2013, the Company generated five consecutive quarters of pretax income and, therefore, its prior losses were weighted less than the recent positive financial results in its evaluation at June 30, 2013. Other negative, indirect evidence, such as negative macroeconomic conditions that included unemployment and consumer confidence, as well as a more restrictive mortgage lending environment, was considered at a lower weighting because the Company's recent financial performance was achieved in this environment. Also, negative direct evidence of the Company's gross profit margins, which were lower than historical levels before the housing downturn, was considered at a lower weight than the positive direct evidence of its growing pretax income levels.
In the previous three fiscal years, including 2013, 2012 and 2011, the Company generated pretax income of $184.1 million, which included discontinued operations. The last quarterly loss of $5.1 million was for the quarter ended March 31, 2012. For the year ended December 31, 2013, it generated pretax income of $195.8 million, including discontinued operations. As of December 31, 2013, the Company has generated pretax income in each of the last seven quarters totaling $242.9 million. The generation of positive income in the last seven quarters is material, positive evidence that demonstrates the Company's return to the ability to generate consistent profitability and, accordingly, to its ability to realize its deferred tax assets. As such, although several historical periods were considered, the more current evidence was determined to carry greater weight as losses in prior years were primarily due to write-downs of assets in a period of severe decline in real estate values, which was caused by the deterioration of economic conditions and by the evaporation of liquidity and available credit, resulting in a dramatic reduction in demand. These conditions, combined with an oversupply of product amassed over the preceding "boom" years, created an imbalance, which was corrected over the following years through adjustments in valuations, reductions in starts and liquidation of existing inventories at distressed prices. In the past year-and-a-half, prices have begun to increase; sales rates have stabilized at relatively modest levels; write-downs have subsided within the industry; and banking institutions have returned to better health and have begun to supply additional credit to markets. In addition, the Company has replaced higher rate debt with very low rate debt and modified its cost structure to match its current sales levels, thereby allowing it to operate at a substantially profitable level.
58
Table of Contents
At June 30, 2013, the Company evaluated both positive and negative evidence to determine its ability to realize its deferred tax assets. In its evaluation, the Company gave more significant weight to the objective evidence as compared to the subjective evidence. Also, more significant weight was given to evidence that directly related to the Company's current financial performance than to indirect or less current evidence. The Company gave the most significant weight in its evaluation to positive objective, direct evidence related to its recently improved financial results, especially its five consecutive quarters of pretax income; significant growth in net sales orders, backlog and average closing price; increased community count; and its strong balance sheet and liquidity position during 2013. Additionally, the Company considered, at a lower weighting, positive subjective, direct evidence that it expects to increase its pretax income in future years by utilizing its strong balance sheet and liquidity position to invest in opportunities that will sustain and grow its operations. If industry conditions weaken moderately, the Company expects to be able to adjust its operations to maintain long-term profitability and still realize its deferred tax assets. The Company estimated that if its annual pretax income remains at 2013 levels in future years, it will realize all of its federal NOLs and absorb reversing temporary differences related to previously impaired inventory within the next five tax years, which is well in advance of the expiration date of its NOL carryforwards, which begin to expire in 2031.
Based on its evaluation of positive and negative evidence described above at June 30, 2013, the Company concluded that the positive evidence outweighed the negative evidence and that it was more likely than not that all of its federal deferred tax assets will be realized. These significant changes in evidence at June 30, 2013, led the Company to determine that it was appropriate to reverse all of the valuation allowance against its deferred tax assets. As a result, at June 30, 2013, the Company reversed $187.5 million of the valuation allowance against its deferred tax assets, which was calculated on an annual basis, during the second quarter of 2013. After the reversal, the Company had a valuation allowance of $46.4 million against its deferred tax assets, which represented an estimation of the allowance required for the second half of 2013. At December 31, 2013, the Company had no valuation allowance against its deferred tax assets.
Changes in positive and negative evidence, including differences between the Company's future operating results and estimates could result in the establishment of a valuation allowance against its deferred tax assets. The accounting for deferred taxes is based upon estimates of future results. Differences between the anticipated and actual outcomes of these future results could have a material impact on the Company's consolidated results of operations or financial position. Also, changes in existing federal and state tax laws and tax rates could affect future tax results and the valuation allowance against the Company's deferred tax assets.
At December 31, 2013 and 2012, the Company had net deferred tax assets of $185.9 million and $258.9 million, respectively. There is no valuation allowance as of December 31, 2013. The December 31, 2012, net deferred tax assets, however, were offset by a valuation allowance of $258.9 million.
For federal purposes, NOLs can be carried forward 20 years; for state purposes, they can generally be carried forward 10 to 20 years, depending on the taxing jurisdiction. Federal NOL carryforwards, if not utilized, will begin to expire in 2031. Additionally, the Company has other carryforwards primarily composed of federal tax credits that can be carried forward 20 years with expiration dates beginning in 2029. The Company anticipates full utilization of these tax credits.
The Company's provision for income tax presented an overall effective income tax benefit rate of 93.7 percent for the year ended December 31, 2013, primarily related to the reversal of the Company's deferred tax asset valuation allowance. The Company's provision for income tax presented an overall effective income tax expense rate of 3.8 percent for the year ended December 31, 2012, compared to an overall effective income tax benefit rate of 5.3 percent for the year ended December 31, 2011, primarily due to the settlement of previously reserved unrecognized tax benefits.
The Company made a $1.6 million settlement payment for income tax, interest and penalty to a state taxing authority during 2011. Additionally, it recorded a tax benefit of $2.4 million to reverse the excess reserve previously recorded for the tax position that related to this settlement.
59
Table of Contents
The following table reconciles the federal income tax statutory rate to the Company's effective income tax rate for the years ended December 31, 2013, 2012 and 2011:
| | | | | | | | | | |
| | | 2013 | | | 2012 | | | 2011 | |
| | |
Federal income tax statutory rate | | | 35.0 | % | | 35.0 | % | | 35.0 | % |
State income taxes, net of federal tax | | | 3.2 | | | 3.5 | | | 3.2 | |
Deferred tax valuation allowance | | | (132.2 | ) | | (39.3 | ) | | (37.8 | ) |
Compensation expense | | | 0.1 | | | 2.7 | | | (1.6 | ) |
Settlement of uncertain tax positions | | | – | | | – | | | 4.6 | |
Other | | | 0.2 | | | 1.9 | | | 1.9 | |
| | | | |
Effective income tax rate | | | (93.7 | )% | | 3.8 | % | | 5.3 | % |
| | |
The Company's income tax (benefit) expense for the years ended December 31, 2013, 2012 and 2011, is summarized as follows:
| | | | | | | | | | |
(in thousands) | | | 2013 | | | 2012 | | | 2011 | |
| | |
CURRENT TAX EXPENSE (BENEFIT) | | | | | | | | | | |
Federal | | $ | (75 | ) | $ | 568 | | $ | (227 | ) |
State | | | 471 | | | 1,017 | | | (2,638 | ) |
| | | | |
Total current tax expense (benefit) | | | 396 | | | 1,585 | | | (2,865 | ) |
DEFERRED TAX BENEFIT | | | | | | | | | | |
Federal | | | (139,207 | ) | | – | | | – | |
State | | | (44,597 | ) | | – | | | – | |
| | | | |
Total deferred tax benefit | | | (183,804 | ) | | – | | | – | |
| | | | |
Total income tax (benefit) expense | | $ | (183,408 | ) | $ | 1,585 | | $ | (2,865 | ) |
| | |
Deferred income taxes reflect the net tax effects of temporary differences between the carrying amounts of assets and liabilities for financial reporting purposes and the amounts used for income tax purposes.
The following table presents significant components of the Company's deferred tax assets and liabilities:
| | | | | | | |
| | DECEMBER 31, | |
(in thousands) | | | 2013 | | | 2012 | |
| | |
DEFERRED TAX ASSETS | | | | | | | |
Warranty, legal and other accruals | | $ | 19,900 | | $ | 17,482 | |
Employee benefits | | | 19,054 | | | 19,285 | |
Noncash tax charge for impairment of long-lived assets | | | 59,608 | | | 88,042 | |
Joint ventures | | | 4,038 | | | 4,188 | |
Federal NOL carryforwards | | | 72,248 | | | 120,068 | |
Other carryforwards | | | 994 | | | 1,057 | |
State NOL carryforwards | | | 37,971 | | | 37,893 | |
Other | | | 1,131 | | | 912 | |
| | | | |
Total | | | 214,944 | | | 288,927 | |
Valuation allowance | | | – | | | (258,867 | ) |
| | | | |
Total deferred tax assets | | | 214,944 | | | 30,060 | |
| | | | |
DEFERRED TAX LIABILITIES | | | | | | | |
Deferred recognition of income and gains | | | (1,196 | ) | | (2,277 | ) |
Capitalized expenses | | | (24,553 | ) | | (25,748 | ) |
Other | | | (3,291 | ) | | (2,035 | ) |
| | | | |
Total deferred tax liabilities | | | (29,040 | ) | | (30,060 | ) |
| | | | |
NET DEFERRED TAX ASSET | | $ | 185,904 | | $ | – | |
| | |
The Company accounts for unrecognized tax benefits in accordance with ASC 740. It accounts for interest and penalties on unrecognized tax benefits through its provision for income taxes. At December 31, 2013, the Company's liability for gross unrecognized tax benefits was $553,000, of which $359,000, if recognized, will affect the Company's effective tax rate. At December 31, 2012, the Company's liability for gross unrecognized tax benefits was $318,000, of which $207,000, if recognized, will affect the Company's effective tax rate. The Company had $46,000 and $18,000 in accrued interest and penalties at
60
Table of Contents
December 31, 2013 and 2012, respectively. The Company estimates that, within 12 months, none of its gross state unrecognized tax benefits will reverse due to the anticipated expiration of time to assess tax.
The following table displays a reconciliation of changes in the Company's tax uncertainties:
| | | | | | | |
(in thousands) | | | 2013 | | | 2012 | |
| | |
Balance at January 1 | | $ | 318 | | $ | 129 | |
Additions related to prior year positions | | | 235 | | | 218 | |
Reductions due to expiration of the statute of limitations | | | – | | | (29 | ) |
| | | | |
Balance at December 31 | | $ | 553 | | $ | 318 | |
| | |
As of December 31, 2013, tax years 2010 through 2013 remain subject to examination.
Note I: Employee Savings, Stock Purchase, Long-Term Incentive and Supplemental Executive Retirement Plans
Retirement Savings Opportunity Plan ("RSOP")
All full-time employees are eligible to participate in the RSOP. Part-time employees are eligible to participate in the RSOP following the completion of 1,000 hours of service within the first 12 months of employment or within any plan year after the date of hire. Pursuant to Section 401(k) of the Internal Revenue Code, the plan permits deferral of a portion of a participant's income into a variety of investment options. Total compensation expense related to the Company's matching contributions for this plan totaled $2.2 million, $2.0 million and $1.8 million in 2013, 2012 and 2011, respectively.
Employee Stock Purchase Plan ("ESPP")
All full-time employees of the Company, with the exception of its executive officers, are eligible to participate in the ESPP. Eligible employees authorize payroll deductions to be made for the purchase of shares. The Company matches a portion of the employee's contribution by donating an additional 20.0 percent of the employee's payroll deduction. Stock is purchased by a plan administrator on a monthly basis. All brokerage and transaction fees for purchasing the stock are paid for by the Company. The Company's expense related to its matching contributions for this plan totaled $193,000, $164,000 and $153,000 in 2013, 2012 and 2011, respectively.
Long-Term Incentive Plan ("LTIP")
On February 26, 2013, the compensation committee approved the 2013 Executive Officer Long-Term Incentive Plan pursuant to the 2011 Equity and Incentive Plan. The LTIP provides for a target award of 135,332 performance share units, equivalent to shares of common stock. The LTIP will use a three-year long-term performance period and measure the Company's relative total stockholder return ("TSR") and growth in revenues to determine the amount of performance shares earned at the end of the performance period, which is December 31, 2015. One-half of the target amount of performance shares is earned by an executive officer if the Company's TSR is at the 50th percentile of the performance of the compensation peer group as measured over the long-term performance period. If the Company's relative TSR performance exceeds or falls below this target level, one-half of the target amount of performance shares earned by an executive officer is calculated such that it is reduced to zero at or below the 30th percentile level or increased to a maximum level of 200 percent at or above the 90th percentile level. The other half of the target amount of performance shares is earned if the Company's revenue growth over the long-term performance period is 60 percent. If the Company's revenue growth exceeds or falls below this target level, one-half of the target amount of performance shares earned by an executive officer is calculated such that it is reduced to zero for revenue growth at or below 45 percent or increased to a maximum level of 200 percent for revenue growth at or above 75 percent. There are incremental adjustments for the calculation of earned performance shares between these minimum and maximum levels of performance.
Supplemental Executive Retirement Plan
The Company has a supplemental, unfunded nonqualified retirement plan, which generally vests over five-year periods beginning in 2003, pursuant to which it will pay supplemental pension benefits to key
61
Table of Contents
employees upon retirement. In connection with the plan, the Company has purchased cost-recovery life insurance on the lives of certain employees. Insurance contracts associated with the plan are held by trusts established as part of the plan to implement and carry out its provisions and to finance its related benefits. The trusts are owners and beneficiaries of such contracts. The amount of coverage is designed to provide sufficient revenue to cover all costs of the plan if assumptions made as to employment term, mortality experience, policy earnings and other factors are realized. At December 31, 2013, the value of the assets held in trust totaled $15.2 million, compared to $13.1 million at December 31, 2012, and was included in "Other" assets within the Consolidated Balance Sheets.
The net periodic benefit costs of this plan for the year ended December 31, 2013, included interest costs of $1.0 million and service costs of $41,000. As of December 31, 2013, the plan recognized a $1.7 million actuarial loss on the projected benefit obligation due to a change in discount rate, which was included in "Actuarial loss on defined benefit pension plan" within the Consolidated Statements of Other Comprehensive Income. Additionally, the Company recognized an investment gain of $2.1 million on the cash surrender value of the insurance contracts for the year ended December 31, 2013. The net periodic benefit costs of this plan for the year ended December 31, 2012, included interest costs of $1.2 million and service costs of $121,000. Additionally, the Company recognized an investment gain of $1.1 million on the cash surrender value of the insurance contracts and a death benefit of $863,000 for the year ended December 31, 2012. The net periodic benefit costs of this plan for the year ended December 31, 2011, included interest costs of $731,000 and service costs of $347,000. Additionally, the Company recognized an investment loss of $521,000 on the cash surrender value of the insurance contracts for the year ended December 31, 2011. The $15.4 million and $12.7 million projected benefit obligations at December 31, 2013 and 2012, respectively, were equal to the liabilities included in "Accrued and other liabilities" within the Consolidated Balance Sheets at those dates. The weighted-average discount rates used for the plan were 2.0 percent, 5.5 percent and 7.0 percent for 2013, 2012 and 2011, respectively.
The expected future payouts for the senior executive retirement plan as of December 31, 2013, were as follows: 2014—$90,000; 2015—$1.5 million; 2016—$5.4 million; 2017—$1.6 million; 2018—$2.9 million; and 2019 through 2023—$3.2 million.
Note J: Stock-Based Compensation
The Ryland Group, Inc. 2011 Equity and Incentive Plan (the "Plan") permits the granting of stock options, restricted stock awards, stock units, cash incentive awards or any combination of the foregoing to employees. Stock options granted in accordance with the Plan generally have a maximum term of seven years and vest in equal annual installments over three years. Certain outstanding stock options granted under predecessor plans have maximum terms of either five or ten years. Outstanding restricted stock units granted under the Plan or its predecessor plans generally vest in three equal annual installments and those granted to senior executives generally vest with performance criteria. At December 31, 2013 and 2012, stock options or other awards or units available for grant under the Plan or its predecessor plans totaled 3,303,855 and 3,016,108, respectively.
The Ryland Group, Inc. 2011 Non-Employee Director Stock Plan (the "Director Plan") provides for a stock award of 3,000 shares to each non-employee director on May 1 of each year. New non-employee directors will receive a pro rata stock award within 30 days after their date of appointment or election, based on the remaining portion of the plan year in which they are appointed or elected. Stock awards are fully vested and nonforfeitable on their applicable award dates. There were 138,830 and 158,000 stock awards available for future grant in accordance with the Director Plan at December 31, 2013 and 2012, respectively. Previously, The Ryland Group, Inc. 2004 Non-Employee Director Equity Plan and its predecessor plans provided for automatic grants of nonstatutory stock options to directors. These stock options are fully vested and have a maximum term of ten years.
All outstanding stock options, stock awards and restricted stock awards have been granted in accordance with the terms of the applicable Plan, Director Plan and their respective predecessor plans, all of which were approved by the Company's stockholders. Certain option and share awards provide for accelerated vesting if there is a change in control (as defined in the plans).
62
Table of Contents
The Company recorded stock-based compensation expense of $19.5 million, $17.8 million and $9.7 million for the years ended December 31, 2013, 2012 and 2011, respectively. Stock-based compensation expenses have been allocated to the Company's business units and included in "Financial services" and "Selling, general and administrative" expenses within the Consolidated Statements of Earnings.
ASC 718 requires cash flows attributable to tax benefits resulting from tax deductions in excess of compensation costs recognized for exercised stock options ("excess tax benefits") to be classified as financing cash flows. There were no excess tax benefits recognized for the years ended December 31, 2013, 2012 and 2011.
A summary of stock option activity in accordance with the Company's equity incentive plans as of December 31, 2013, 2012 and 2011, and changes for the years then ended, follows:
| | | | | | | | | | | | | |
| | |
SHARES | | |
WEIGHTED-
AVERAGE
EXERCISE
PRICE | | | WEIGHTED-
AVERAGE
REMAINING
CONTRACTUAL
LIFE(in years) | | |
AGGREGATE
INTRINSIC
VALUE
(in
thousands) | |
| | |
Options outstanding at January 1, 2011 | | | 3,722,656 | | $ | 33.29 | | | 2.8 | | | | |
Granted | | | 781,000 | | | 16.52 | | | | | | | |
Exercised | | | (44,398 | ) | | 11.97 | | | | | | | |
Forfeited | | | (510,384 | ) | | 43.36 | | | | | | | |
| | | | | | | | | | | | |
Options outstanding at December 31, 2011 | | | 3,948,874 | | $ | 28.91 | | | 2.4 | | $ | 553 | |
Available for future grant | | | 3,346,508 | | | | | | | | | | |
| | | | | | | | | | | | | |
Total shares reserved at December 31, 2011 | | | 7,295,382 | | | | | | | | | | |
| | | | | | | | | | | | | |
Options exercisable at December 31, 2011 | | | 2,574,246 | | $ | 34.35 | | | 1.7 | | $ | 369 | |
| | |
Options outstanding at January 1, 2012 | | | 3,948,874 | | $ | 28.91 | | | 2.4 | | | | |
Granted | | | 756,000 | | | 18.55 | | | | | | | |
Exercised | | | (568,293 | ) | | 18.89 | | | | | | | |
Forfeited | | | (717,158 | ) | | 35.38 | | | | | | | |
| | | | | | | | | | | | |
Options outstanding at December 31, 2012 | | | 3,419,423 | | $ | 26.92 | | | 2.9 | | $ | 42,992 | |
Available for future grant | | | 3,016,108 | | | | | | | | | | |
| | | | | | | | | | | | | |
Total shares reserved at December 31, 2012 | | | 6,435,531 | | | | | | | | | | |
| | | | | | | | | | | | | |
Options exercisable at December 31, 2012 | | | 1,967,786 | | $ | 33.10 | | | 1.6 | | $ | 16,939 | |
| | |
Options outstanding at January 1, 2013 | | | 3,419,423 | | $ | 26.92 | | | 2.9 | | | | |
Granted | | | – | | | – | | | | | | | |
Exercised | | | (863,933 | ) | | 24.55 | | | | | | | |
Forfeited | | | (229,289 | ) | | 34.88 | | | | | | | |
| | | | | | | | | | | | |
Options outstanding at December 31, 2013 | | | 2,326,201 | | $ | 27.02 | | | 2.3 | | $ | 44,123 | |
Available for future grant | | | 3,303,855 | | | | | | | | | | |
| | | | | | | | | | | | | |
Total shares reserved at December 31, 2013 | | | 5,630,056 | | | | | | | | | | |
| | | | | | | | | | | | | |
Options exercisable at December 31, 2013 | | | 1,650,893 | | $ | 30.74 | | | 1.6 | | $ | 26,908 | |
| | |
A summary of stock options outstanding and exercisable at December 31, 2013, follows:
| | | | | | | | | | | | | | | | |
| | OPTIONS OUTSTANDING | | OPTIONS EXERCISABLE | |
RANGE OF
EXERCISE
PRICES
| | |
NUMBER
OUTSTANDING | | | WEIGHTED-
AVERAGE
REMAINING
LIFE(in years) | | | WEIGHTED-
AVERAGE
EXERCISE
PRICE | | | NUMBER
EXERCISABLE | | | WEIGHTED-
AVERAGE
EXERCISE
PRICE | |
| | |
$14.13 to $18.05 | | | 678,133 | | | 1.8 | | $ | 16.02 | | | 454,803 | | $ | 15.75 | |
$18.22 to $23.27 | | | 1,053,994 | | | 3.5 | | | 20.36 | | | 615,349 | | | 21.89 | |
$30.60 to $72.13 | | | 594,074 | | | 1.0 | | | 51.39 | | | 580,741 | | | 51.87 | |
| | |
The intrinsic values of stock options exercised during the years ended December 31, 2013, 2012 and 2011, totaled $15.3 million, $5.4 million and $284,000, respectively. The intrinsic value of a stock option is the amount by which the market value of the underlying stock exceeds the exercise price of the option.
63
Table of Contents
The Company has determined the grant-date fair value of stock options using the Black-Scholes-Merton option-pricing model. Expected volatility is based upon the historical volatility of the Company's common stock. The expected dividend yield is based on an annual dividend rate of $0.12 per common share. The risk-free rate for periods within the contractual life of the stock option award is based upon the zero-coupon U.S. Treasury bond on the date the stock option is granted, with a maturity equal to the expected option life of the stock option granted. The expected option life is derived from historical experience under the Company's share-based payment plans and represents the period of time that a stock option award granted is expected to be outstanding.
There were no stock options granted during the year ended December 31, 2013. The following table presents the weighted-average inputs used and grant date fair values determined for stock options granted during the years ended December 31, 2013, 2012 and 2011:
| | | | | | | | | | |
| | | 2013 | | | 2012 | | | 2011 | |
| | |
Expected volatility | | | – | % | | 49.3 | % | | 51.0 | % |
Expected dividend yield | | | – | % | | 0.7 | % | | 0.7 | % |
Expected term(in years) | | | – | | | 4.5 | | | 3.5 | |
Risk-free rate | | | – | % | | 0.8 | % | | 1.4 | % |
Weighted-average grant-date fair value | | $ | – | | $ | 7.21 | | $ | 6.02 | |
| | |
Pursuant to the Plan, on March 1, 2012, the Company awarded 275,000 stock options to senior executive officers. Effective October 1, 2012, the Company established the 2012 Amended Executive Officer Non-Qualified Stock Option Agreement, which amended the previous grants made to senior executive officers in 2012. In order to encourage a significant level of appreciation in stockholder value, this agreement added a condition to the exercisability of stock options, which requires that the stock option may only be exercised if and when the Company's stock price is greater than or equal to 150 percent of the grant price. In accordance with ASC 718, the Company used a Black-Scholes-Merton option-pricing model to calculate the incremental expense resulting from the modification of the performance stock options. Expected volatility is based upon the historical volatility of the Company's common stock. The expected dividend yield is based on an annual dividend rate of $0.12 per common share. The zero coupon rate of interest is derived from the observable Treasury rates. The expected option life is derived using a Monte Carlo simulation methodology to model the expected exercise and termination behavior of optionees. This incremental expense, plus the grant-date fair value, will be recognized over the requisite service period in stock-based compensation expense.
Stock-based compensation expense related to employee stock options totaled $3.5 million, $5.0 million and $4.0 million for the years ended December 31, 2013, 2012 and 2011, respectively.
A summary of the Company's nonvested options as of and for the years ended December 31, 2013, 2012 and 2011, follows:
| | | | | | | | | | | | | | | | | | | |
| | 2013 | | 2012 | | 2011 | |
| | |
SHARES | | | WEIGHTED-
AVERAGE
GRANT-DATE
FAIR VALUE | | |
SHARES | | | WEIGHTED-
AVERAGE
GRANT-DATE
FAIR VALUE | | |
SHARES | | | WEIGHTED-
AVERAGE
GRANT-DATE
FAIR VALUE | |
| | |
Nonvested options outstanding at January 1 | | | 1,451,637 | | $ | 7.08 | | | 1,374,628 | | $ | 7.00 | | | 1,142,130 | | $ | 8.31 | |
Granted | | | – | | | – | | | 756,000 | | | 7.21 | | | 781,000 | | | 6.02 | |
Vested | | | (697,667 | ) | | 7.35 | | | (611,659 | ) | | 7.03 | | | (498,507 | ) | | 8.37 | |
Forfeited | | | (78,662 | ) | | 6.78 | | | (67,332 | ) | | 7.47 | | | (49,995 | ) | | 7.89 | |
| | | | | | | | |
Nonvested options outstanding at December 31 | | | 675,308 | | $ | 6.84 | | | 1,451,637 | | $ | 7.08 | | | 1,374,628 | | $ | 7.00 | |
| | |
At December 31, 2013, the total unrecognized compensation cost related to nonvested stock option awards previously granted under the Company's plans was $2.3 million. That cost is expected to be recognized over the next 1.7 years.
64
Table of Contents
Compensation expense associated with restricted stock unit awards totaled $15.1 million, $12.4 million and $5.3 million for the years ended December 31, 2013, 2012 and 2011, respectively.
The following table summarizes the activity that relates to the Company's restricted stock unit awards:
| | | | | | | | | | |
| | | 2013 | | | 2012 | | | 2011 | |
| | |
Restricted stock units at January 1 | | | 774,217 | | | 657,825 | | | 727,317 | |
Shares awarded | | | 143,594 | | | 473,408 | | | 305,000 | |
Shares vested | | | (354,369 | ) | | (350,349 | ) | | (314,492 | ) |
Shares forfeited | | | (24,336 | ) | | (6,667 | ) | | (60,000 | ) |
| | | | |
Restricted stock units at December 31 | | | 539,106 | | | 774,217 | | | 657,825 | |
| | |
At December 31, 2013, the outstanding restricted stock units are expected to vest as follows: 2014—298,979; 2015—193,201; and 2016—46,926.
The Company has granted stock awards to its non-employee directors pursuant to the terms of the Director Plan. The Company recorded stock-based compensation expense related to Director Plan stock awards in the amounts of $838,000, $404,000 and $415,000 for the years ended December 31, 2013, 2012 and 2011, respectively.
Note K: Commitments and Contingencies
Commitments
In the ordinary course of business, the Company acquires rights under option agreements to purchase land or lots for use in future homebuilding operations. At December 31, 2013 and 2012, it had cash deposits and letters of credit outstanding that totaled $73.0 million and $53.1 million, respectively, pertaining to land and lot option purchase contracts with aggregate purchase prices of $869.1 million and $589.6 million, respectively. At December 31, 2013 and 2012, the Company had $2.5 million and $492,000, respectively, in commitments with respect to option contracts having specific performance provisions.
IRLCs represent loan commitments with customers at market rates generally up to 180 days before settlement. During 2013, the increasing interest rate environment resulted in loan commitments being extended up to 270 days. The Company had outstanding IRLCs with notional amounts that totaled $269.2 million and $137.7 million at December 31, 2013 and 2012, respectively. Hedging instruments, including forward-delivery contracts, are utilized to mitigate the risk associated with interest rate fluctuations on IRLCs.
The following table summarizes the Company's rent expense, which primarily relates to its office facilities, model homes, furniture and equipment:
| | | | | | | | | | |
| | YEAR ENDED DECEMBER 31, | |
(in thousands) | | | 2013 | | | 2012 | | | 2011 | |
| | |
Total rent expense1 | | $ | 6,553 | | $ | 5,933 | | $ | 7,087 | |
Less: income from subleases | | | (323 | ) | | (385 | ) | | (456 | ) |
| | | | |
Net rent expense | | $ | 6,230 | | $ | 5,548 | | $ | 6,631 | |
| | |
- 1
- Excludes rent expense associated with the Company's discontinued operations, which totaled $556,000 and $365,000 for the years ended December 31, 2012 and 2011, respectively.
65
Table of Contents
At December 31, 2013, future minimum rental commitments under noncancellable leases with remaining terms in excess of one year were as follows:
| | | | |
(in thousands) | | | | |
| | |
2014 | | $ | 5,301 | |
2015 | | | 4,855 | |
2016 | | | 3,477 | |
2017 | | | 2,460 | |
2018 | | | 1,508 | |
Thereafter | | | 1,780 | |
Less: income from subleases | | | (242 | ) |
| | | | |
Total lease commitments | | $ | 19,139 | |
| | |
Contingencies
As an on-site housing producer, the Company is often required by some municipalities to obtain development or performance bonds and letters of credit in support of its contractual obligations. At December 31, 2013, development bonds totaled $138.9 million, while performance-related cash deposits and letters of credit totaled $64.0 million. At December 31, 2012, development bonds totaled $108.4 million, while performance-related cash deposits and letters of credit totaled $52.0 million. In the event that any such bonds or letters of credit are called, the Company would be required to reimburse the issuer; it does not, however, believe that any currently outstanding bonds or letters of credit will be called.
Substantially all of the loans the Company originates are sold within a short period of time in the secondary mortgage market on a servicing-released basis. After the loans are sold, ownership, credit risk and management, including servicing of the loans, passes to the third-party investor. RMC retains no role or interest other than standard industry representations and warranties. The Company retains potential liability for possible claims by loan purchasers that it breached certain limited standard industry representations and warranties in its sale agreements. There has been an increased industrywide effort by loan purchasers to defray losses from mortgages purchased in an unfavorable economic environment by claiming to have found inaccuracies related to sellers' representations and warranties in particular sale agreements. There is industry debate regarding the extent to which such claims are justified. The significant majority of these claims relate to loans originated in 2005, 2006 and 2007, when underwriting standards were less stringent.
The following table summarizes the composition of the Company's mortgage loan types originated, its homebuyers' average credit scores and its loan-to-value ratios:
| | | | | | | | | | | | | | | | | | | |
| | YEAR ENDED DECEMBER 31, | |
| | | 2013 | | | 2012 | | | 2011 | | | 2010 | | | 2009 | | | 2008 | |
| | |
Prime | | | 57.2 | % | | 48.6 | % | | 42.2 | % | | 34.9 | % | | 32.9 | % | | 51.8 | % |
Government (FHA/VA/USDA) | | | 42.8 | | | 51.4 | | | 57.8 | | | 65.1 | | | 67.1 | | | 48.2 | |
| | | | |
Total | | | 100.0 | % | | 100.0 | % | | 100.0 | % | | 100.0 | % | | 100.0 | % | | 100.0 | % |
Average FICO credit score | | | 733 | | | 731 | | | 726 | | | 723 | | | 717 | | | 711 | |
Average combined loan-to-value ratio | | | 89.8 | % | | 90.1 | % | | 90.3 | % | | 90.8 | % | | 91.4 | % | | 90.1 | % |
| | |
While the Company's access to delinquency information is limited subsequent to loan sale, based on a review of information provided voluntarily by certain investors and on government loan reports made available by HUD, the Company believes that the average delinquency rates of RMC's loans are generally in line with industry averages. Delinquency rates for loans originated in 2008 and subsequent years are significantly lower than those originated in 2005 through 2007. The Company primarily attributes this decrease in delinquency rates to the industrywide tightening of credit standards and the elimination of most nontraditional loan products.
The Company's mortgage operations have established reserves for possible losses associated with mortgage loans previously originated and sold to investors based upon, among other things, actual past repurchases and losses through the disposition of affected loans; an analysis of repurchase requests received and the validity of those requests; and an estimate of potential liability for valid claims not yet
66
Table of Contents
received. Although the amount of an ultimate loss cannot be definitively estimated, the Company has accrued $11.5 million for these types of claims as of December 31, 2013, but it may have additional exposure. (See "Part I, Item 3, Legal Proceedings.")
The following table displays changes in the Company's mortgage loan loss reserves and related legal reserves during the years ended December 31, 2013, 2012 and 2011:
| | | | | | | | | | |
(in thousands) | | | 2013 | | | 2012 | | | 2011 | |
| | |
Balance at January 1 | | $ | 10,484 | | $ | 10,141 | | $ | 8,934 | |
Provision for losses | | | 1,580 | | | 1,156 | | | 1,368 | |
Settlements made | | | (592 | ) | | (813 | ) | | (161 | ) |
| | | | |
Balance at December 31 | | $ | 11,472 | | $ | 10,484 | | $ | 10,141 | |
| | |
Subsequent changes in conditions or available information may change assumptions and estimates. Mortgage loan loss reserves and related legal reserves were included in "Accrued and other liabilities" within the Consolidated Balance Sheets, and their associated expenses were included in "Financial services" expense within the Consolidated Statements of Earnings.
The Company provides product warranties covering workmanship and materials for one year, certain mechanical systems for two years and structural systems for ten years. It estimates and records warranty liabilities based upon historical experience and known risks at the time a home closes as a component of cost of sales, as well as upon identification and quantification of its obligations in cases of unexpected claims. Actual future warranty costs could differ from current estimates.
The following table summarizes changes in the Company's product liability reserves during the years ended December 31, 2013, 2012 and 2011:
| | | | | | | | | | |
(in thousands) | | | 2013 | | | 2012 | | | 2011 | |
| | |
Balance at January 1 | | $ | 18,188 | | $ | 20,648 | | $ | 20,112 | |
Warranties issued | | | 9,052 | | | 3,899 | | | 3,549 | |
Changes in liability for accruals related to pre-existing warranties | | | 1,891 | | | 1,866 | | | 2,823 | |
Settlements made | | | (5,992 | ) | | (8,225 | ) | | (5,836 | ) |
| | | | |
Balance at December 31 | | $ | 23,139 | | $ | 18,188 | | $ | 20,648 | |
| | |
The Company requires substantially all of its subcontractors to have workers' compensation insurance and general liability insurance, including construction defect coverage. RHIC provided insurance services to the homebuilding segments' subcontractors in certain markets until June 1, 2008. RHIC insurance reserves may have the effect of lowering the Company's product liability reserves, as collectability of claims against subcontractors enrolled in the RHIC program is generally higher. At December 31, 2013 and 2012, RHIC had $13.9 million and $14.8 million, respectively, in subcontractor product liability reserves, which were included in "Accrued and other liabilities" within the Consolidated Balance Sheets. Reserves for loss and loss adjustment expense are based upon industry trends and the Company's annual actuarial projections of historical loss development.
The following table displays changes in RHIC's insurance reserves during the years ended December 31, 2013, 2012 and 2011:
| | | | | | | | | | |
(in thousands) | | | 2013 | | | 2012 | | | 2011 | |
| | |
Balance at January 1 | | $ | 14,813 | | $ | 18,209 | | $ | 21,141 | |
Insurance expense provisions or adjustments | | | 1,445 | | | (1,369 | ) | | (900 | ) |
Loss expenses paid | | | (2,401 | ) | | (2,027 | ) | | (2,032 | ) |
| | | | |
Balance at December 31 | | $ | 13,857 | | $ | 14,813 | | $ | 18,209 | |
| | |
Expense provisions or adjustments to RHIC's insurance reserves were included in "Financial services" expense within the Consolidated Statements of Earnings.
67
Table of Contents
The Company is party to various legal proceedings generally incidental to its businesses. Litigation reserves have been established based on discussions with counsel and on the Company's analysis of historical claims. The Company has, and requires its subcontractors to have, general liability insurance to protect it against a portion of its risk of loss and to cover it against construction-related claims. The Company establishes reserves to cover its self-insured retentions and deductible amounts under those policies.
In view of the inherent unpredictability of outcomes in legal matters, particularly where(a) damages sought are speculative, unspecified or indeterminate;(b) proceedings are in the early stages or impacted significantly by future legal determinations or judicial decisions;(c) matters involve unsettled questions of law, multiple parties, or complex facts and circumstances; or(d) insured risk transfer or coverage is undetermined, there is considerable uncertainty surrounding the timing or resolution of these matters, including a possible eventual loss. Given this inherent unpredictability, actual future litigation costs could differ from the Company's current estimates. At the same time, the Company believes that adequate provisions have been made for the resolution of all known claims and pending litigation for probable losses. In accordance with ASC No. 450 ("ASC 450"), "Contingencies," the Company accrues amounts for legal matters where it believes they present loss contingencies that are both probable and reasonably estimable. In such cases, however, the Company may be exposed to losses in excess of any amounts accrued and may need to adjust the accruals from time to time to reflect developments that could affect its estimate of potential losses. Moreover, in accordance with ASC 450, if the Company does not believe that the potential loss from a particular matter is both probable and reasonably estimable, it does not make an accrual and will monitor the matter for any developments that would make the loss contingency both probable and reasonably estimable. For matters as to which the Company believes a loss is probable and reasonably estimable, it had legal reserves of $17.2 million and $17.9 million at December 31, 2013 and 2012, respectively. (See "Part I, Item 3, Legal Proceedings.") It currently estimates that the range of reasonably possible losses, in excess of amounts accrued, could be up to approximately $10 million in the aggregate.
Note L: Supplemental Guarantor Information
The Company's obligations to pay principal, premium, if any, and interest under its 5.4 percent senior notes due January 2015; 8.4 percent senior notes due May 2017; 1.6 percent convertible senior notes due May 2018; 0.25 percent convertible senior notes due June 2019; 6.6 percent senior notes due May 2020; and 5.4 percent senior notes due October 2022 are guaranteed on a joint and several basis by substantially all of its Guarantor Subsidiaries. Such guarantees are full and unconditional.
In lieu of providing separate financial statements for the Guarantor Subsidiaries, the accompanying condensed consolidating financial statements have been included. Management does not believe that separate financial statements for the Guarantor Subsidiaries are material to investors and are, therefore, not presented.
In the event that a Guarantor Subsidiary is sold or disposed of (whether by merger, consolidation, sale of its capital stock, or sale of all or substantially all of its assets [other than by lease]), and whether or not the Guarantor Subsidiary is the surviving corporation in such transaction to a Person which is not the Company or a Restricted Subsidiary of the Company, such Guarantor Subsidiary will be released from its obligations under its guarantee if(a) the sale or other disposition is in compliance with the indenture and(b) all the obligations of such Guarantor Subsidiary under any agreements relating to any other indebtedness of the Company or its restricted subsidiaries terminate upon consummation of such transaction. In addition, a Guarantor Subsidiary will be released from its obligations under the indenture if such Subsidiary ceases to be a Restricted Subsidiary (in compliance with the applicable provisions of the indenture).
68
Table of Contents
The following information presents the consolidating statements of earnings, financial position and cash flows for(a) the parent company and issuer, The Ryland Group, Inc. ("TRG, Inc.");(b) the Guarantor Subsidiaries;(c) the non-Guarantor Subsidiaries; and(d) the consolidation eliminations used to arrive at the consolidated information for The Ryland Group, Inc. and subsidiaries.
CONSOLIDATING STATEMENTS OF EARNINGS
| | | | | | | | | | | | | | | | |
| | YEAR ENDED DECEMBER 31, 2013 | |
(in thousands)
| | |
TRG, INC. | | |
GUARANTOR
SUBSIDIARIES | | | NON-
GUARANTOR SUBSIDIARIES | | |
CONSOLIDATING
ELIMINATIONS | | |
CONSOLIDATED
TOTAL | |
| | |
REVENUES | | $ | 1,207,509 | | $ | 921,252 | | $ | 51,380 | | $ | (39,386 | ) | $ | 2,140,755 | |
EXPENSES | | |
1,097,280 | | |
857,707 | | |
31,312 | | |
(39,386 |
) | |
1,946,913 | |
OTHER INCOME | | | 1,849 | | | – | | | – | | | – | | | 1,849 | |
| | | | |
Income from continuing
operations before taxes | | | 112,078 | | | 63,545 | | | 20,068 | | | – | | | 195,691 | |
Tax benefit | | | (105,043 | ) | | (59,557 | ) | | (18,808 | ) | | – | | | (183,408 | ) |
Equity in net earnings of subsidiaries | | | 161,978 | | | – | | | – | | | (161,978 | ) | | – | |
| | | | |
Net income from continuing
operations | | | 379,099 | | | 123,102 | | | 38,876 | | | (161,978 | ) | | 379,099 | |
Income from discontinued operations, net of taxes | | | 106 | | | 1 | | | – | | | (1 | ) | | 106 | |
| | | | |
NET INCOME | | $ | 379,205 | | $ | 123,103 | | $ | 38,876 | | $ | (161,979 | ) | $ | 379,205 | |
| | |
| | | | | | | | | | | | | | | | |
| | | YEAR ENDED DECEMBER 31, 2012 | |
| | |
REVENUES | | $ | 711,947 | | $ | 562,181 | | $ | 37,619 | | $ | (3,281 | ) | $ | 1,308,466 | |
EXPENSES | | |
688,026 | | |
548,345 | | |
24,477 | | |
(3,281 |
) | |
1,257,567 | |
OTHER LOSS | | | (6,932 | ) | | – | | | – | | | – | | | (6,932 | ) |
| | | | |
Income from continuing
operations before taxes | | | 16,989 | | | 13,836 | | | 13,142 | | | – | | | 43,967 | |
Tax expense | | | 612 | | | 499 | | | 474 | | | – | | | 1,585 | |
Equity in net earnings of subsidiaries | | | 26,005 | | | – | | | – | | | (26,005 | ) | | – | |
| | | | |
Net income from continuing
operations | | | 42,382 | | | 13,337 | | | 12,668 | | | (26,005 | ) | | 42,382 | |
Loss from discontinued operations,
net of taxes | | | (2,000 | ) | | (1,018 | ) | | – | | | 1,018 | | | (2,000 | ) |
| | | | |
NET INCOME | | $ | 40,382 | | $ | 12,319 | | $ | 12,668 | | $ | (24,987 | ) | $ | 40,382 | |
| | |
| | | | | | | | | | | | | | | | |
| | | YEAR ENDED DECEMBER 31, 2011 | |
| | |
REVENUES | | $ | 458,500 | | $ | 404,104 | | $ | 26,927 | | $ | – | | $ | 889,531 | |
EXPENSES | | |
491,505 | | |
411,844 | | |
21,188 | | |
– | | |
924,537 | |
OTHER INCOME | | | 2,274 | | | – | | | – | | | – | | | 2,274 | |
| | | | |
(Loss) income from continuing operations before taxes | | | (30,731 | ) | | (7,740 | ) | | 5,739 | | | – | | | (32,732 | ) |
Tax (benefit) expense | | | (2,690 | ) | | (677 | ) | | 502 | | | – | | | (2,865 | ) |
Equity in net loss of subsidiaries | | | (1,826 | ) | | – | | | – | | | 1,826 | | | – | |
| | | | |
Net (loss) income from continuing operations | | | (29,867 | ) | | (7,063 | ) | | 5,237 | | | 1,826 | | | (29,867 | ) |
Loss from discontinued operations,
net of taxes | | | (20,883 | ) | | (5,763 | ) | | – | | | 5,763 | | | (20,883 | ) |
| | | | |
NET (LOSS) INCOME | | $ | (50,750 | ) | $ | (12,826 | ) | $ | 5,237 | | $ | 7,589 | | $ | (50,750 | ) |
| | |
69
Table of Contents
CONSOLIDATING STATEMENTS OF OTHER COMPREHENSIVE INCOME
| | | | | | | | | | | | | | | | |
| | YEAR ENDED DECEMBER 31, 2013 | |
(in thousands)
| | |
TRG, INC. | | |
GUARANTOR
SUBSIDIARIES | | | NON-
GUARANTOR
SUBSIDIARIES | | | CONSOLIDATING
ELIMINATIONS | | | CONSOLIDATED
TOTAL | |
| | |
Net income | | $ | 379,205 | | $ | 123,103 | | $ | 38,876 | | $ | (161,979 | ) | $ | 379,205 | |
Other comprehensive loss before tax: | | | | | | | | | | | | | | | | |
Actuarial loss on defined benefit pension plan | | | (1,411 | ) | | (134 | ) | | (129 | ) | | – | | | (1,674 | ) |
Unrealized loss on marketable | | | | | | | | | | | | | | | | |
securities, available-for-sale: | | | | | | | | | | | | | | | | |
Unrealized loss | | | (279 | ) | | – | | | – | | | – | | | (279 | ) |
Less: reclassification adjustments for losses included in net income | | | 64 | | | – | | | – | | | – | | | 64 | |
| | | | |
| | | (215 | ) | | – | | | – | | | – | | | (215 | ) |
Other comprehensive loss before tax | | | (1,626 | ) | | (134 | ) | | (129 | ) | | – | | | (1,889 | ) |
Income tax benefit related to items
of other comprehensive loss | | | 540 | | | 51 | | | 49 | | | – | | | 640 | |
Other comprehensive loss, net of tax | | | (1,086 | ) | | (83 | ) | | (80 | ) | | – | | | (1,249 | ) |
| | | | |
Comprehensive income | | $ | 378,119 | | $ | 123,020 | | $ | 38,796 | | $ | (161,979 | ) | $ | 377,956 | |
| | |
| | | | | | | | | | | | | | | | |
| | | YEAR ENDED DECEMBER 31, 2012 | |
| | |
Net income | | $ | 40,382 | | $ | 12,319 | | $ | 12,668 | | $ | (24,987 | ) | $ | 40,382 | |
Other comprehensive loss before tax: | | | | | | | | | | | | | | | | |
Reduction of unrealized gain related to cash flow hedging instruments | | | (1,709 | ) | | – | | | – | | | – | | | (1,709 | ) |
Unrealized gain on marketable securities, available-for-sale: | | | | | | | | | | | | | | | | |
Unrealized gain | | | 1,217 | | | – | | | – | | | – | | | 1,217 | |
Less: reclassification adjustments for gains included in net income | | | (233 | ) | | – | | | – | | | – | | | (233 | ) |
| | | | |
| | | 984 | | | – | | | – | | | – | | | 984 | |
Other comprehensive loss before tax | | | (725 | ) | | – | | | – | | | – | | | (725 | ) |
Income tax benefit related to items
of other comprehensive loss | | | 653 | | | | | | | | | | | | 653 | |
Other comprehensive loss, net of tax | | | (72 | ) | | – | | | – | | | – | | | (72 | ) |
| | | | |
Comprehensive income | | $ | 40,310 | | $ | 12,319 | | $ | 12,668 | | $ | (24,987 | ) | $ | 40,310 | |
| | |
| | | | | | | | | | | | | | | | |
| | | YEAR ENDED DECEMBER 31, 2011 | |
| | |
Net (loss) income | | $ | (50,750 | ) | $ | (12,826 | ) | $ | 5,237 | | $ | 7,589 | | $ | (50,750 | ) |
Other comprehensive loss before tax: | | | | | | | | | | | | | | | | |
Reduction of unrealized gain related to cash flow hedging instruments | | | (1,207 | ) | | – | | | – | | | – | | | (1,207 | ) |
Unrealized loss on marketable securities, available-for-sale: | | | | | | | | | | | | | | | | |
Unrealized gain | | | 360 | | | – | | | – | | | – | | | 360 | |
Less: reclassification adjustments for gains included in net (loss) income | | | (1,358 | ) | | – | | | – | | | – | | | (1,358 | ) |
| | | | |
| | | (998 | ) | | – | | | – | | | – | | | (998 | ) |
Other comprehensive loss before tax | | | (2,205 | ) | | – | | | – | | | – | | | (2,205 | ) |
Income tax benefit related to items
of other comprehensive loss | | | 502 | | | – | | | – | | | – | | | 502 | |
Other comprehensive loss, net of tax | | | (1,703 | ) | | – | | | – | | | – | | | (1,703 | ) |
| | | | |
Comprehensive (loss) income | | $ | (52,453 | ) | $ | (12,826 | ) | $ | 5,237 | | $ | 7,589 | | $ | (52,453 | ) |
| | |
70
Table of Contents
CONSOLIDATING BALANCE SHEETS
| | | | | | | | | | | | | | | | |
| | DECEMBER 31, 2013 | |
(in thousands)
| | |
TRG, INC. | | |
GUARANTOR SUBSIDIARIES | | | NON-
GUARANTOR SUBSIDIARIES | | | CONSOLIDATING ELIMINATIONS | | | CONSOLIDATED TOTAL | |
| | |
ASSETS | | | | | | | | | | | | | | | | |
Cash and cash equivalents | | $ | 25,521 | | $ | 193,356 | | $ | 9,109 | | $ | – | | $ | 227,986 | |
Marketable securities and restricted cash | | | 377,267 | | | – | | | 25,922 | | | – | | | 403,189 | |
Consolidated inventory owned | | | 955,943 | | | 660,664 | | | – | | | – | | | 1,616,607 | |
Consolidated inventory not owned | | | 17,297 | | | – | | | 15,879 | | | – | | | 33,176 | |
| | | | |
Total housing inventories | | | 973,240 | | | 660,664 | | | 15,879 | | | – | | | 1,649,783 | |
Investment in subsidiaries | | | 369,580 | | | – | | | – | | | (369,580 | ) | | – | |
Intercompany receivables | | | 517,057 | | | – | | | – | | | (517,057 | ) | | – | |
Other assets | | | 290,153 | | | 54,052 | | | 155,149 | | | – | | | 499,354 | |
Assets of discontinued operations | | | – | | | 30 | | | – | | | – | | | 30 | |
| | | | |
TOTAL ASSETS | | | 2,552,818 | | | 908,102 | | | 206,059 | | | (886,637 | ) | | 2,780,342 | |
| | | | |
LIABILITIES | | | | | | | | | | | | | | | | |
Accounts payable and other accrued liabilities | | | 247,328 | | | 106,420 | | | 31,773 | | | – | | | 385,521 | |
Financial services credit facility | | | – | | | – | | | 73,084 | | | – | | | 73,084 | |
Debt | | | 1,397,308 | | | – | | | – | | | – | | | 1,397,308 | |
Intercompany payables | | | – | | | 465,252 | | | 51,805 | | | (517,057 | ) | | – | |
Liabilities of discontinued operations | | | 136 | | | 368 | | | – | | | – | | | 504 | |
| | | | |
TOTAL LIABILITIES | | | 1,644,772 | | | 572,040 | | | 156,662 | | | (517,057 | ) | | 1,856,417 | |
| | | | |
EQUITY | | | | | | | | | | | | | | | | |
STOCKHOLDERS' EQUITY | | | 908,046 | | | 336,062 | | | 33,518 | | | (369,580 | ) | | 908,046 | |
NONCONTROLLING INTEREST | | | – | | | – | | | 15,879 | | | – | | | 15,879 | |
| | | | |
TOTAL LIABILITIES AND EQUITY | | $ | 2,552,818 | | $ | 908,102 | | $ | 206,059 | | $ | (886,637 | ) | $ | 2,780,342 | |
| | |
| | | | | | | | | | | | | | | | |
| | | DECEMBER 31, 2012 | |
| | |
ASSETS | | | | | | | | | | | | | | | | |
Cash and cash equivalents | | $ | 32,130 | | $ | 117,838 | | $ | 8,119 | | $ | – | | $ | 158,087 | |
Marketable securities and restricted cash | | | 429,057 | | | – | | | 27,461 | | | – | | | 456,518 | |
Consolidated inventory owned | | | 643,619 | | | 394,309 | | | – | | | – | | | 1,037,928 | |
Consolidated inventory not owned | | | 17,666 | | | – | | | 21,824 | | | – | | | 39,490 | |
| | | | |
Total housing inventories | | | 661,285 | | | 394,309 | | | 21,824 | | | – | | | 1,077,418 | |
Investment in subsidiaries | | | 244,917 | | | – | | | – | | | (244,917 | ) | | – | |
Intercompany receivables | | | 368,126 | | | – | | | – | | | (368,126 | ) | | – | |
Other assets | | | 76,183 | | | 43,572 | | | 119,661 | | | – | | | 239,416 | |
Assets of discontinued operations | | | 187 | | | 2,293 | | | – | | | – | | | 2,480 | |
| | | | |
TOTAL ASSETS | | | 1,811,885 | | | 558,012 | | | 177,065 | | | (613,043 | ) | | 1,933,919 | |
| | | | |
LIABILITIES | | | | | | | | | | | | | | | | |
Accounts payable and other accrued liabilities | | | 172,906 | | | 68,929 | | | 30,320 | | | – | | | 272,155 | |
Debt | | | 1,134,468 | | | – | | | – | | | – | | | 1,134,468 | |
Intercompany payables | | | – | | | 275,163 | | | 92,963 | | | (368,126 | ) | | – | |
Liabilities of discontinued operations | | | 575 | | | 961 | | | – | | | – | | | 1,536 | |
| | | | |
TOTAL LIABILITIES | | | 1,307,949 | | | 345,053 | | | 123,283 | | | (368,126 | ) | | 1,408,159 | |
| | | | |
EQUITY | | | | | | | | | | | | | | | | |
STOCKHOLDERS' EQUITY | | | 503,936 | | | 212,959 | | | 31,958 | | | (244,917 | ) | | 503,936 | |
NONCONTROLLING INTEREST | | | – | | | – | | | 21,824 | | | – | | | 21,824 | |
| | | | |
TOTAL LIABILITIES AND EQUITY | | $ | 1,811,885 | | $ | 558,012 | | $ | 177,065 | | $ | (613,043 | ) | $ | 1,933,919 | |
| | |
71
Table of Contents
CONSOLIDATING STATEMENT OF CASH FLOWS
| | | | | | | | | | | | | | | | |
| | YEAR ENDED DECEMBER 31, 2013 | |
(in thousands)
| | | TRG, INC. | | | GUARANTOR
SUBSIDIARIES | | | NON-
GUARANTOR
SUBSIDIARIES | | | CONSOLIDATING
ELIMINATIONS | | | CONSOLIDATED
TOTAL | |
| | |
CASH FLOWS FROM OPERATING ACTIVITIES | | | | | | | | | | | | | | | | |
Net income from continuing operations | | $ | 379,099 | | $ | 123,102 | | $ | 38,876 | | $ | (161,978 | ) | $ | 379,099 | |
Adjustments to reconcile net income from continuing operations to net cash used for operating activities | | | (225,954 | ) | | 8,225 | | | 281 | | | – | | | (217,448 | ) |
Changes in assets and liabilities | | | (317,140 | ) | | (202,163 | ) | | (71,030 | ) | | 161,978 | | | (428,355 | ) |
Other operating activities, net | | | (1,264 | ) | | – | | | – | | | – | | | (1,264 | ) |
| | | | |
Net cash used for operating activities from continuing operations | | | (165,259 | ) | | (70,836 | ) | | (31,873 | ) | | – | | | (267,968 | ) |
| | | | |
CASH FLOWS FROM INVESTING ACTIVITIES | | | | | | | | | | | | | | | | |
Contributions to unconsolidated joint ventures, net | | | (302 | ) | | (2,925 | ) | | – | | | – | | | (3,227 | ) |
Additions to property, plant and equipment | | | (9,546 | ) | | (9,760 | ) | | (602 | ) | | – | | | (19,908 | ) |
Purchases of marketable securities, available-for-sale | | | (752,043 | ) | | – | | | (4,174 | ) | | – | | | (756,217 | ) |
Proceeds from sales and maturities of marketable securities, available-for-sale | | | 823,759 | | | – | | | 5,573 | | | – | | | 829,332 | |
Cash paid for business acquisitions | | | (19,880 | ) | | (31,050 | ) | | – | | | – | | | (50,930 | ) |
| | | | |
Net cash provided by (used for) investing activities from continuing operations | | | 41,988 | | | (43,735 | ) | | 797 | | | – | | | (950 | ) |
| | | | |
CASH FLOWS FROM FINANCING ACTIVITIES | | | | | | | | | | | | | | | | |
Increase in debt | | | 262,202 | | | – | | | – | | | – | | | 262,202 | |
Increase in borrowings against revolving credit facilities, net | | | – | | | – | | | 73,084 | | | – | | | 73,084 | |
Common stock dividends and stock-based compensation | | | 22,672 | | | – | | | – | | | – | | | 22,672 | |
Increase (decrease) in restricted cash | | | (19,281 | ) | | – | | | 140 | | | – | | | (19,141 | ) |
Intercompany balances | | | (148,931 | ) | | 190,089 | | | (41,158 | ) | | – | | | – | |
| | | | |
Net cash provided by financing activities from continuing operations | | | 116,662 | | | 190,089 | | | 32,066 | | | – | | | 338,817 | |
| | | | |
Net (decrease) increase in cash and cash equivalents from continuing operations | | | (6,609 | ) | | 75,518 | | | 990 | | | – | | | 69,899 | |
Cash flows from operating activities—discontinued operations | | | – | | | (25 | ) | | – | | | – | | | (25 | ) |
Cash flows from investing activities—discontinued operations | | | – | | | 25 | | | – | | | – | | | 25 | |
Cash flows from financing activities—discontinued operations | | | – | | | – | | | – | | | – | | | – | |
Cash and cash equivalents at beginning of year | | | 32,130 | | | 117,865 | | | 8,119 | | | – | | | 158,114 | |
| | | | |
CASH AND CASH EQUIVALENTS AT END OF YEAR | | $ | 25,521 | | $ | 193,383 | | $ | 9,109 | | $ | – | | $ | 228,013 | |
| | |
72
Table of Contents
CONSOLIDATING STATEMENT OF CASH FLOWS
| | | | | | | | | | | | | | | | |
| | YEAR ENDED DECEMBER 31, 2012 | |
(in thousands)
| | | TRG, INC. | | | GUARANTOR
SUBSIDIARIES | | | NON-
GUARANTOR
SUBSIDIARIES | | | CONSOLIDATING
ELIMINATIONS | | | CONSOLIDATED
TOTAL | |
| | |
CASH FLOWS FROM OPERATING ACTIVITIES | | | | | | | | | | | | | | | | |
Net income from continuing operations | | $ | 42,382 | | $ | 13,337 | | $ | 12,668 | | $ | (26,005 | ) | $ | 42,382 | |
Adjustments to reconcile net income from continuing operations to net cash used for operating activities | | | 28,164 | | | 7,873 | | | 500 | | | – | | | 36,537 | |
Changes in assets and liabilities | | | (128,700 | ) | | (56,003 | ) | | (40,608 | ) | | 26,005 | | | (199,306 | ) |
Other operating activities, net | | | (792 | ) | | – | | | – | | | – | | | (792 | ) |
| | | | |
Net cash used for operating activities from continuing operations | | | (58,946 | ) | | (34,793 | ) | | (27,440 | ) | | – | | | (121,179 | ) |
| | | | |
CASH FLOWS FROM INVESTING ACTIVITIES | | | | | | | | | | | | | | | | |
Return of investment in unconsolidated joint ventures, net | | | 708 | | | 1,602 | | | – | | | – | | | 2,310 | |
Additions to property, plant and equipment | | | (7,596 | ) | | (4,560 | ) | | (68 | ) | | – | | | (12,224 | ) |
Purchases of marketable securities, available-for-sale | | | (1,170,627 | ) | | – | | | (5,481 | ) | | – | | | (1,176,108 | ) |
Proceeds from sales and maturities of marketable securities, available-for-sale | | | 1,134,675 | | | – | | | 6,293 | | | – | | | 1,140,968 | |
Cash paid for business acquisitions | | | (80,182 | ) | | – | | | – | | | – | | | (80,182 | ) |
Other investing activities, net | | | – | | | – | | | 109 | | | – | | | 109 | |
| | | | |
Net cash (used for) provided by investing activities from continuing operations | | | (123,022 | ) | | (2,958 | ) | | 853 | | | – | | | (125,127 | ) |
| | | | |
CASH FLOWS FROM FINANCING ACTIVITIES | | | | | | | | | | | | | | | | |
Increase (decrease) in debt | | | 301,145 | | | (1,188 | ) | | (22 | ) | | – | | | 299,935 | |
Decrease in borrowings against revolving credit facilities, net | | | – | | | – | | | (49,933 | ) | | – | | | (49,933 | ) |
Common stock dividends and stock-based compensation | | | 8,955 | | | – | | | – | | | – | | | 8,955 | |
(Increase) decrease in restricted cash | | | (18,658 | ) | | – | | | 4,814 | | | – | | | (13,844 | ) |
Intercompany balances | | | (102,914 | ) | | 39,705 | | | 63,209 | | | – | | | – | |
| | | | |
Net cash provided by financing activities from continuing operations | | | 188,528 | | | 38,517 | | | 18,068 | | | – | | | 245,113 | |
| | | | |
Net increase (decrease) in cash and cash equivalents from continuing operations | | | 6,560 | | | 766 | | | (8,519 | ) | | – | | | (1,193 | ) |
Cash flows from operating activities—discontinued operations | | | (31 | ) | | (73 | ) | | – | | | – | | | (104 | ) |
Cash flows from investing activities—discontinued operations | | | 4 | | | 71 | | | – | | | – | | | 75 | |
Cash flows from financing activities—discontinued operations | | | – | | | – | | | – | | | – | | | – | |
Cash and cash equivalents at beginning of year | | | 25,597 | | | 117,101 | | | 16,638 | | | – | | | 159,336 | |
| | | | |
CASH AND CASH EQUIVALENTS AT END OF YEAR | | $ | 32,130 | | $ | 117,865 | | $ | 8,119 | | $ | – | | $ | 158,114 | |
| | |
73
Table of Contents
CONSOLIDATING STATEMENT OF CASH FLOWS
| | | | | | | | | | | | | | | | |
| | YEAR ENDED DECEMBER 31, 2011 | |
(in thousands)
| | | TRG, INC. | | | GUARANTOR
SUBSIDIARIES | | | NON-
GUARANTOR
SUBSIDIARIES | | | CONSOLIDATING
ELIMINATIONS | | | CONSOLIDATED
TOTAL | |
| | |
CASH FLOWS FROM OPERATING ACTIVITIES | | | | | | | | | | | | | | | | |
Net (loss) income from continuing operations | | $ | (29,867 | ) | $ | (7,063 | ) | $ | 5,237 | | $ | 1,826 | | $ | (29,867 | ) |
Adjustments to reconcile net (loss) income from continuing operations to net cash used for operating activities | | | 51,325 | | | 6,564 | | | 588 | | | – | | | 58,477 | |
Changes in assets and liabilities | | | (58,187 | ) | | (40,741 | ) | | (84,536 | ) | | (1,826 | ) | | (185,290 | ) |
Other operating activities, net | | | (988 | ) | | – | | | – | | | – | | | (988 | ) |
| | | | |
Net cash used for operating activities from continuing operations | | | (37,717 | ) | | (41,240 | ) | | (78,711 | ) | | – | | | (157,668 | ) |
| | | | |
CASH FLOWS FROM INVESTING ACTIVITIES | | | | | | | | | | | | | | | | |
(Contributions to) return of investment in unconsolidated joint ventures, net | | | (912 | ) | | 2,867 | | | – | | | – | | | 1,955 | |
Additions to property, plant and equipment | | | (7,368 | ) | | (3,443 | ) | | (153 | ) | | – | | | (10,964 | ) |
Purchases of marketable securities, available-for-sale | | | (1,307,894 | ) | | – | | | (5,387 | ) | | – | | | (1,313,281 | ) |
Proceeds from sales and maturities of marketable securities, available-for-sale | | | 1,397,566 | | | – | | | 6,564 | | | – | | | 1,404,130 | |
Other investing activities, net | | | – | | | – | | | 118 | | | – | | | 118 | |
| | | | |
Net cash provided by (used for) investing activities from continuing operations | | | 81,392 | | | (576 | ) | | 1,142 | | | – | | | 81,958 | |
| | | | |
CASH FLOWS FROM FINANCING ACTIVITIES | | | | | | | | | | | | | | | | |
Decrease in debt | | | (55,243 | ) | | (2,784 | ) | | – | | | – | | | (58,027 | ) |
Increase in borrowings against revolving credit facilities, net | | | – | | | – | | | 49,933 | | | – | | | 49,933 | |
Common stock dividends and stock-based compensation | | | (1,783 | ) | | – | | | – | | | – | | | (1,783 | ) |
Decrease (increase) in restricted cash | | | 18,315 | | | – | | | (326 | ) | | – | | | 17,989 | |
Intercompany balances | | | (6,625 | ) | | (15,480 | ) | | 22,105 | | | – | | | – | |
| | | | |
Net cash (used for) provided by financing activities from continuing operations | | | (45,336 | ) | | (18,264 | ) | | 71,712 | | | – | | | 8,112 | |
| | | | |
Net decrease in cash and cash equivalents from continuing operations | | | (1,661 | ) | | (60,080 | ) | | (5,857 | ) | | – | | | (67,598 | ) |
Cash flows from operating activities—discontinued operations | | | 353 | | | 116 | | | – | | | – | | | 469 | |
Cash flows from investing activities—discontinued operations | | | (237 | ) | | (126 | ) | | – | | | – | | | (363 | ) |
Cash flows from financing activities—discontinued operations | | | (89 | ) | | – | | | – | | | – | | | (89 | ) |
Cash and cash equivalents at beginning of year | | | 27,231 | | | 177,191 | | | 22,495 | | | – | | | 226,917 | |
| | | | |
CASH AND CASH EQUIVALENTS AT END OF YEAR | | $ | 25,597 | | $ | 117,101 | | $ | 16,638 | | $ | – | | $ | 159,336 | |
| | |
Note M: Discontinued Operations
During 2011, the Company discontinued homebuilding operations in its Jacksonville and Dallas divisions. Since then, the Company sold its land from discontinued operations as part of a strategic plan designed to efficiently manage its invested capital. The results of operations and cash flows for Jacksonville and Dallas, which were historically reported in the Company's Southeast and Texas segments, respectively, were classified as discontinued operations. Additionally, the assets and liabilities related to these discontinued operations were presented separately in "Assets of discontinued operations" and "Liabilities of discontinued operations" within the Consolidated Balance Sheets. During 2013, the Company acquired the operations and assets of LionsGate Homes in Dallas, Texas. Therefore, homebuilding operations in Dallas have been classified as continuing operations.
74
Table of Contents
BALANCE SHEETS
| | | | | | | |
| | DECEMBER 31, | |
(in thousands) | | | 2013 | | | 2012 | |
| | |
Assets | | | | | | | |
Cash and cash equivalents | | $ | 27 | | $ | 27 | |
Housing inventories | | | – | | | 2,239 | |
Other assets | | | 3 | | | 214 | |
| | | | |
Total assets of discontinued operations | | | 30 | | | 2,480 | |
Liabilities | | | | | | | |
Accounts payable and accrued liabilities | | | 504 | | | 1,536 | |
| | | | |
Total liabilities of discontinued operations | | $ | 504 | | $ | 1,536 | |
| | |
The Company's net income from discontinued operations totaled $106,000 for the year ended December 31, 2013, compared to net losses that totaled $2.0 million and $20.9 million for the years ended December 31, 2012 and 2011, respectively.
Note N: Subsequent Events
No events have occurred subsequent to December 31, 2013, that have required recognition or disclosure in the Company's financial statements.
Note O: Quarterly Financial Data (Unaudited)
| | | | | | | | | | | | | | | | | | | | | | | | | |
| | 2013 | | 2012 | |
(in thousands, except per share data) | | | DEC. 31 | | | SEPT. 30 | | | JUN. 30 | | | MAR. 31 | | | DEC. 31 | | | SEPT. 30 | | | JUN. 30 | | | MAR. 31 | |
| | |
CONSOLIDATED RESULTS | | | | | | | | | | | | | | | | | | | | | | | | | |
Revenues | | $ | 696,657 | | $ | 576,423 | | $ | 492,995 | | $ | 374,680 | | $ | 440,135 | | $ | 358,693 | | $ | 293,769 | | $ | 215,869 | |
Income (loss) from continuing operations before taxes | | | 75,223 | | | 53,986 | | | 44,279 | | | 22,203 | | | 30,319 | | | 10,430 | | | 6,239 | | | (3,021 | ) |
Tax expense (benefit) | | | 2,917 | | | 428 | | | (186,952 | ) | | 199 | | | 1,372 | | | 23 | | | 190 | | | – | |
| | | | |
Net income (loss) from continuing operations | | | 72,306 | | | 53,558 | | | 231,231 | | | 22,004 | | | 28,947 | | | 10,407 | | | 6,049 | | | (3,021 | ) |
(Loss) income from discontinued operations, net of taxes | | | (61 | ) | | 91 | | | (37 | ) | | 113 | | | (374 | ) | | 238 | | | 223 | | | (2,087 | ) |
| | | | |
Net income (loss) | | $ | 72,245 | | $ | 53,649 | | $ | 231,194 | | $ | 22,117 | | $ | 28,573 | | $ | 10,645 | | $ | 6,272 | | $ | (5,108 | ) |
| | | | |
Net income (loss) per common share: | | | | | | | | | | | | | | | | | | | | | | | | | |
Basic | | | | | | | | | | | | | | | | | | | | | | | | | |
Continuing operations | | $ | 1.56 | | $ | 1.16 | | $ | 5.01 | | $ | 0.48 | | $ | 0.64 | | $ | 0.23 | | $ | 0.14 | | $ | (0.07 | ) |
Discontinued operations | | | 0.00 | | | 0.00 | | | 0.00 | | | 0.00 | | | (0.01 | ) | | 0.01 | | | 0.00 | | | (0.04 | ) |
| | | | |
Total | | | 1.56 | | | 1.16 | | | 5.01 | | | 0.48 | | | 0.63 | | | 0.24 | | | 0.14 | | | (0.11 | ) |
Diluted | | | | | | | | | | | | | | | | | | | | | | | | | |
Continuing operations | | | 1.27 | | | 0.95 | | | 4.16 | | | 0.43 | | | 0.56 | | | 0.21 | | | 0.14 | | | (0.07 | ) |
Discontinued operations | | | 0.00 | | | 0.00 | | | 0.00 | | | 0.00 | | | (0.01 | ) | | 0.01 | | | 0.00 | | | (0.04 | ) |
| | | | |
Total | | $ | 1.27 | | $ | 0.95 | | $ | 4.16 | | $ | 0.43 | | $ | 0.55 | | $ | 0.22 | | $ | 0.14 | | $ | (0.11 | ) |
Weighted-average common shares outstanding: | | | | | | | | | | | | | | | | | | | | | | | | | |
Basic | | | 46,216 | | | 46,175 | | | 46,036 | | | 45,435 | | | 45,115 | | | 44,826 | | | 44,628 | | | 44,474 | |
Diluted | | | 57,807 | | | 57,679 | | | 55,690 | | | 53,362 | | | 53,053 | | | 52,466 | | | 48,395 | | | 44,474 | |
| | |
75
Table of Contents
Report of Management
Management of the Company is responsible for the integrity and accuracy of the financial statements and all other annual report information. The financial statements are prepared in conformity with generally accepted accounting principles and include amounts based on management's judgments and estimates.
The accounting systems, which record, summarize and report financial information, are supported by internal control systems designed to provide reasonable assurance, at an appropriate cost, that the assets are safeguarded and that transactions are recorded in accordance with Company policies and procedures. Developing and maintaining these systems are the responsibility of management. Proper selection, training and development of personnel also contribute to the effectiveness of the internal control systems. For the purpose of evaluating and documenting its systems of internal control, management elected to use the integrated framework promulgated by the Committee of Sponsoring Organizations of the Treadway Commission 1992 framework. The Company's systems, evaluation and test results were documented. The Company's internal auditors regularly test these systems. Based on its evaluation, management believes that its systems of internal control over financial reporting were effective and is not aware of any material weaknesses.
The Company's independent registered public accounting firm also reviewed and tested the effectiveness of these systems to the extent it deemed necessary to express an opinion on the consolidated financial statements and systems of internal control.
The Audit Committee of the Board of Directors periodically meets with management, the internal auditors and the independent registered public accounting firm to review accounting, auditing and financial matters. Both internal auditors and the independent registered public accounting firm have unrestricted access to the Audit Committee.
/s/ Gordon A. Milne
Gordon A. Milne
Executive Vice President and
Chief Financial Officer
/s/ David L. Fristoe
David L. Fristoe
Senior Vice President, Controller and
Chief Accounting Officer
76
Table of Contents
Report of Independent Registered Public Accounting Firm
The Board of Directors and Stockholders of
The Ryland Group, Inc.
We have audited the accompanying consolidated balance sheets of The Ryland Group, Inc. and subsidiaries as of December 31, 2013 and 2012, and the related consolidated statements of earnings and other comprehensive income, stockholders' equity, and cash flows for each of the three years in the period ended December 31, 2013. These financial statements are the responsibility of the Company's management. Our responsibility is to express an opinion on these financial statements based on our audits.
We conducted our audits in accordance with the standards of the Public Company Accounting Oversight Board (United States). Those standards require that we plan and perform the audit to obtain reasonable assurance about whether the financial statements are free of material misstatement. An audit includes examining, on a test basis, evidence supporting the amounts and disclosures in the financial statements. An audit also includes assessing the accounting principles used and significant estimates made by management, as well as evaluating the overall financial statement presentation. We believe that our audits provide a reasonable basis for our opinion.
In our opinion, the financial statements referred to above present fairly, in all material respects, the consolidated financial position of The Ryland Group, Inc. and subsidiaries at December 31, 2013 and 2012, and the consolidated results of their operations and their cash flows for each of the three years in the period ended December 31, 2013, in conformity with U.S. generally accepted accounting principles.
We also have audited, in accordance with the standards of the Public Company Accounting Oversight Board (United States), The Ryland Group, Inc. and subsidiaries' internal control over financial reporting as of December 31, 2013, based on criteria established in Internal Control—Integrated Framework issued by the Committee of Sponsoring Organizations of the Treadway Commission 1992 framework and our report dated February 27, 2014, expressed an unqualified opinion thereon.
/s/ Ernst & Young LLP
Los Angeles, California
February 27, 2014
77
Table of Contents
Report of Independent Registered Public Accounting Firm
The Board of Directors and Stockholders of
The Ryland Group, Inc.
We have audited The Ryland Group, Inc. and subsidiaries' internal control over financial reporting as of December 31, 2013, based on criteria established in Internal Control—Integrated Framework issued by the Committee of Sponsoring Organizations of the Treadway Commission 1992 framework (the COSO criteria). The Ryland Group, Inc. and subsidiaries' management is responsible for maintaining effective internal control over financial reporting, and for its assessment of the effectiveness of internal control over financial reporting included in the accompanying Report of Management. Our responsibility is to express an opinion on the company's internal control over financial reporting based on our audit.
We conducted our audit in accordance with the standards of the Public Company Accounting Oversight Board (United States). Those standards require that we plan and perform the audit to obtain reasonable assurance about whether effective internal control over financial reporting was maintained in all material respects. Our audit included obtaining an understanding of internal control over financial reporting, assessing the risk that a material weakness exists, testing and evaluating the design and operating effectiveness of internal control based on the assessed risk, and performing such other procedures as we considered necessary in the circumstances. We believe that our audit provides a reasonable basis for our opinion.
A company's internal control over financial reporting is a process designed to provide reasonable assurance regarding the reliability of financial reporting and the preparation of financial statements for external purposes in accordance with generally accepted accounting principles. A company's internal control over financial reporting includes those policies and procedures that (1) pertain to the maintenance of records that, in reasonable detail, accurately and fairly reflect the transactions and dispositions of the assets of the company; (2) provide reasonable assurance that transactions are recorded as necessary to permit preparation of financial statements in accordance with generally accepted accounting principles, and that receipts and expenditures of the company are being made only in accordance with authorizations of management and directors of the company; and (3) provide reasonable assurance regarding prevention or timely detection of unauthorized acquisition, use, or disposition of the company's assets that could have a material effect on the financial statements.
Because of its inherent limitations, internal control over financial reporting may not prevent or detect misstatements. Also, projections of any evaluation of effectiveness to future periods are subject to the risk that controls may become inadequate because of changes in conditions, or that the degree of compliance with the policies or procedures may deteriorate.
In our opinion, The Ryland Group, Inc. and subsidiaries maintained, in all material respects, effective internal control over financial reporting as of December 31, 2013, based on the COSO criteria.
We also have audited, in accordance with the standards of the Public Company Accounting Oversight Board (United States), the consolidated balance sheets of The Ryland Group, Inc. and subsidiaries as of December 31, 2013 and 2012, and the related consolidated statements of earnings and other comprehensive income, stockholders' equity, and cash flows for each of the three years in the period ended December 31, 2013, of The Ryland Group, Inc. and subsidiaries and our report dated February 27, 2014, expressed an unqualified opinion thereon.
/s/ Ernst & Young LLP
Los Angeles, California
February 27, 2014
78
Table of Contents
Item 9. Changes in and Disagreements With Accountants on Accounting and Financial Disclosure
None.
Item 9A. Controls and Procedures
The Company has procedures in place for accumulating and evaluating information that enable it to prepare and file reports with the SEC. At the end of the year covered by this report on Form 10-K, an evaluation was performed by the Company's management, including the CEO and CFO, of the effectiveness of the Company's disclosure controls and procedures as defined in Rule 13a-15(e) promulgated under the Exchange Act. Based on that evaluation, the Company's management, including the CEO and CFO, concluded that the Company's disclosure controls and procedures were effective as of December 31, 2013.
The Company has a committee consisting of key officers, including the chief accounting officer and general counsel, to ensure that its disclosure controls and procedures are effective at the reasonable assurance level. These disclosure controls and procedures are designed such that information required to be disclosed in the reports that it files or submits under the Exchange Act is recorded, processed, summarized and reported within the time periods specified by the SEC and is accumulated and communicated to the Company's management, including its principal executive and principal financial officers, or persons performing similar functions, as appropriate to allow timely decisions regarding required disclosure.
The Company's management summarized its assessment process and documented its conclusions in the Report of Management, which appears in Part II, Item 8, "Financial Statements and Supplementary Data." The Company's independent registered public accounting firm summarized its review of management's assessment of internal control over financial reporting in an attestation report, which also appears in Part II, Item 8, "Financial Statements and Supplementary Data."
At December 31, 2013, the Company completed a detailed evaluation of its internal control over financial reporting, including the assessment, documentation and testing of its controls, as required by the Sarbanes-Oxley Act of 2002. No material weaknesses were identified. The Company's management, including the CEO and CFO, has evaluated any changes in the Company's internal control over financial reporting that occurred during the annual period ended December 31, 2013, and has concluded that there was no change during this period that materially affected, or is reasonably likely to materially affect, the Company's internal control over financial reporting.
NYSE Certification
The NYSE requires that the chief executive officers of its listed companies certify annually to the NYSE that they are not aware of violations by their companies of NYSE corporate governance listing standards. The Company submitted a non-qualified certification by its Chief Executive Officer to the NYSE last year in accordance with the NYSE's rules. Further, the Company files certifications by its Chief Executive Officer and Chief Financial Officer with the SEC in accordance with the Sarbanes-Oxley Act of 2002. These certifications are filed as exhibits to this Annual Report on Form 10-K.
Item 9B. Other Information
None.
79
Table of Contents
PART III
Item 10. Directors, Executive Officers and Corporate Governance
Executive Officers of the Company
The following sets forth certain information regarding the Company's executive officers at December 31, 2013:
| | | | |
Name
| |
Age | | Position(date elected to position)
Prior Business Experience |
| |
Larry T. Nicholson | | 56 | | Chief Executive Officer of the Company (since 2009); President of the Company (since 2008); Chief Operating Officer of the Company (2007-2009); Senior Vice President of the Company and President of the Southeast Region of Ryland Homes (2005-2007) |
Gordon A. Milne | |
62 | | Executive Vice President and Chief Financial Officer of the Company (since 2002); Senior Vice President and Chief Financial Officer of the Company (2000-2002) |
Robert J. Cunnion, III | |
58 | | Senior Vice President, Human Resources of the Company (since 1999) |
David L. Fristoe | |
57 | | Senior Vice President, Controller and Chief Accounting Officer of the Company (since 1999) |
Timothy J. Geckle | |
61 | | Senior Vice President, General Counsel and Secretary of the Company (since 1997) |
Peter G. Skelly | |
50 | | Chief Operating Officer of the Company (since 2013); Senior Vice President of the Company and President of the Company's Homebuilding Operations (since 2011); Senior Vice President of the Company and President of the North/West Region of Ryland Homes (2008-2011) |
| |
The Board of Directors elects all officers.
There are no family relationships between any director or executive officer, or arrangements or understandings pursuant to which the officers listed above were elected. For a description of the Company's employment and severance arrangements with certain of its executive officers, see the Company'sProxy Statement for the 2014 Annual Meeting of Stockholders (the "2014 Proxy Statement"), which is filed pursuant to Regulation 14A under the Exchange Act.
Information as to the Company's directors, executive officers and corporate governance is incorporated by reference from the Company's2014 Proxy Statement, including the determination by the Board of Directors, with respect to the Audit Committee's financial expert, and the identity of each member of the Audit Committee of the Board of Directors.
The Company has adopted a code of ethics that is applicable to its senior officers, directors and employees. To retrieve the Company's code of ethics, visitwww.ryland.com, select "Investor Relations" and then select "Governance Documents" under "Corporate Governance." Scroll down the page to "Code of Ethics."
80
Table of Contents
Item 11. Executive Compensation
The information required by this item is incorporated by reference from the2014 Proxy Statement. The Compensation Committee Report to be included in the2014 Proxy Statement shall be deemed furnished in this Annual Report on Form 10-K and shall not be incorporated by reference into any filing under the Securities Act or the Exchange Act as a result of such furnishing in this Item 11.
Item 12. Security Ownership of Certain Beneficial Owners and Management and Related Stockholder Matters
The information required by this item is set forth on page 16 of this Annual Report on Form 10-K and is incorporated by reference from the2014 Proxy Statement.
Item 13. Certain Relationships and Related Transactions, and Director Independence
The information required by this item is incorporated by reference from the2014 Proxy Statement.
Item 14. Principal Accountant Fees and Services
The information required by this item is incorporated by reference from the2014 Proxy Statement.
PART IV
Item 15. Exhibits and Financial Statement Schedules
| | | | | | | | |
| | |
| | |
3.1 | | Articles of Restatement of The Ryland Group, Inc., as amended
(Incorporated by reference from Form 10-Q for the quarter ended March 31, 2005) |
| | |
| | |
3.2 | | Articles of Amendment of The Ryland Group, Inc.
(Incorporated by reference from Form 10-Q for the quarter ended June 30, 2009) |
81
Table of Contents
| | | | | | | | |
| | | Exhibits,continued |
| | |
| | |
3.3 | | Bylaws of The Ryland Group, Inc., as amended
(Incorporated by reference from Form 8-K, filed December 14, 2010) |
| | |
| | |
3.4 | | Amendment to the Bylaws of The Ryland Group, Inc.
(Incorporated by reference from Form 8-K, filed March 5, 2012) |
| | |
| | |
3.5 | | Amendment to the Bylaws of The Ryland Group, Inc.
(Incorporated by reference from Form 8-K, filed February 14, 2013) |
| | |
| | |
4.1 | | Indenture dated as of June 28, 1996, between the Ryland Group, Inc. and The Bank of New York Mellon Trust Company, N.A., as successor to JPMorgan Chase Bank, N.A., formerly known as The Chase Manhattan Bank
(Incorporated by reference from Post-Effective Amendment No. 1 to the Registration Statement on Form S-3 (No. 33-50933) filed May 15, 1996) |
| | |
| | |
4.2 | | Second Supplemental Indenture dated as of January 11, 2005, by and among the Company, the Guarantors and JPMorgan Chase Bank, N.A., formerly known as Chemical Bank, as trustee
(Incorporated by reference from Form 8-K, filed January 11, 2005) |
| | |
| | |
4.3 | | Senior Note due 2015
(Incorporated by reference from Form 8-K, filed January 11, 2005) |
| | |
| | |
4.4 | | Fifth Supplemental Indenture dated as of May 5, 2009, by and among the Company, the Guarantors and The Bank of New York Mellon Trust Company, N.A., as successor to JPMorgan Chase Bank, N.A., formerly known as Chemical Bank, as trustee
(Incorporated by reference from Form 8-K, filed May 5, 2009) |
| | |
| | |
4.5 | | Senior Note due 2017
(Incorporated by reference from Form 8-K, filed January 5, 2009) |
| | |
| | |
4.6 | | Sixth Supplemental Indenture dated as of May 16, 2012, (including the form of Note and the Form of Guarantee) by and among the Company, the Guarantors and The Bank of New York Mellon Trust Company, N.A., as successor to JPMorgan Chase Bank, N.A., formerly known as The Chase Manhattan Bank, as trustee
(Incorporated by reference from Form 8-K, filed May 16, 2012) |
| | |
| | |
4.7 | | Seventh Supplemental Indenture dated as of May 16, 2012, (including the form of Note and the Form of Guarantee) by and among the Company, the Guarantors and The Bank of New York Mellon Trust Company, N.A., as successor to JPMorgan Chase Bank, N.A., formerly known as The Chase Manhattan Bank, as trustee
(Incorporated by reference from Form 8-K, filed May 16, 2012) |
| | |
| | |
4.8 | | Eighth Supplemental Indenture dated as of September 21, 2012, (including the form of Note and the Form of Guarantee) by and among the Company, the Guarantors and The Bank of New York Mellon Trust Company, N.A., as successor to JPMorgan Chase Bank, N.A., formerly known as Chemical Bank, as trustee
(Incorporated by reference from Form 8-K, filed September 21, 2012) |
| | |
| | |
4.9 | | Ninth Supplemental Indenture dated as of May 20, 2013, (including the form of Note and the Form of Guarantee) by and among the Company, the Guarantors and The Bank of New York Mellon Trust Company, N.A., as successor to JPMorgan Chase Bank, N.A., formerly known as Chemical Bank, as trustee
(Incorporated by reference from Form 8-K, filed May 20, 2013) |
| | |
| | |
4.10 | | Rights Agreement, dated as of December 18, 2008, between The Ryland Group, Inc. and American Stock Transfer & Trust Company, LLC
(Incorporated by reference from Form 8-A, filed December 29, 2008) |
| | | | | | | | |
82
Table of Contents
| | | | | | | | |
| | | Exhibits,continued |
| | |
| | |
4.11 | | Amendment to the Rights Agreement, dated as of May 18, 2009, between The Ryland Group, Inc. and American Stock Transfer & Trust Company, LLC
(Incorporated by reference from Form 8-K, filed May 22, 2009) |
| | |
| | |
10.1 | | Credit Agreement, dated January 24, 2008, between Ryland Mortgage Company and Guaranty Bank
(Incorporated by reference from Form 10-Q for the quarter ended June 30, 2009) |
| | |
| | |
10.2 | | Master Repurchase Agreement, dated December 14, 2011, between Ryland Mortgage Company and RMC Mortgage Corporation and JPMorgan Chase Bank, N.A.
(Incorporated by reference from Form 8-K, filed December 20, 2011) |
| | |
| | |
10.3 | | First Amendment to Master Repurchase Agreement, dated December 12, 2012, between Ryland Mortgage Company and RMC Mortgage Company and JPMorgan Chase Bank, N.A.
(Incorporated by reference from Form 10-K for the year ended December 31, 2012) |
| | |
| | |
10.4 | | Second Amendment to Master Repurchase Agreement, dated December 11, 2013, between Ryland Mortgage Company and RMC Mortgage Company and JPMorgan Chase Bank, N.A.
(Filed herewith) |
| | |
| | |
10.5 | | 2002 Equity Incentive Plan of The Ryland Group, Inc.
(Incorporated by reference from Form 10-Q for the quarter ended June 30, 2002) |
| | |
| | |
10.6 | | Amendment and Restatement of 2005 Equity Incentive Plan of The Ryland Group, Inc.
(Incorporated by reference from Form 10-K for the year ended December 31, 2008) |
| | |
| | |
10.7 | | Amendment and Restatement of The Ryland Group, Inc. 2007 Equity Incentive Plan
(Incorporated by reference from Form 10-K for the year ended December 31, 2008) |
| | |
| | |
10.8 | | Amendment and Restatement of The Ryland Group, Inc. 2008 Equity Incentive Plan
(Incorporated by reference from Form 10-K for the year ended December 31, 2008) |
| | |
| | |
10.9 | | The Ryland Group, Inc. 2011 Equity and Incentive Plan
(Incorporated by reference from Form 8-K, filed March 24, 2011) |
| | |
| | |
10.10 | | The Ryland Group, Inc. 2012 Executive Officer Long-Term Incentive Plan
(Incorporated by reference from Form 8-K, filed October 2, 2012) |
| | |
| | |
10.11 | | The Ryland Group, Inc. 2013 Executive Officer Long-Term Incentive Plan pursuant to the 2011 Equity and Incentive Plan
(Incorporated by reference from Form 8-K, filed March 4, 2013) |
| | |
| | |
10.12 | | Form of Non-Qualified Stock Option Agreement
(Incorporated by reference from Form 8-K, filed April 29, 2005) |
| | |
| | |
10.13 | | 2012 Amended Executive Officer Non-Qualified Stock Option Agreement
(Incorporated by reference from Form 8-K, filed October 2, 2012) |
| | |
| | |
10.14 | | Form of Amended and Restated Stock Unit Agreement
(Incorporated by reference from Form 8-K, filed April 18, 2006) |
| | |
| | |
10.15 | | Form of Stock Unit Agreement for Executive Officers
(Incorporated by reference from Form 8-K, filed April 30, 2008) |
| | |
| | |
10.16 | | Amendment No. 1 to Form of Stock Unit Agreement for Executive Officers
(Incorporated by reference from Form 10-K for the year ended December 31, 2008) |
| | |
| | |
10.17 | | Non-Employee Directors' Stock Unit Plan, effective January 1, 2005
(Incorporated by reference from Form 10-K for the year ended December 31, 2008) |
83
Table of Contents
| | | | | | | | |
| | | Exhibits,continued |
| | |
| | |
10.18 | | 2000 Non-Employee Director Equity Plan of The Ryland Group, Inc., as amended
(Incorporated by reference from Form 10-K for the year ended December 31, 2000) |
| | |
| | |
10.19 | | 2004 Non-Employee Director Equity Plan of The Ryland Group, Inc.
(Incorporated by reference from Form 10-Q for the quarter ended March 31, 2004) |
| | |
| | |
10.20 | | Non-Employee Director Stock Plan, effective April 26, 2006
(Incorporated by reference from Form 8-K, filed April 27, 2006) |
| | |
| | |
10.21 | | The Ryland Group, Inc. 2011 Non-Employee Director Stock Plan
(Incorporated by reference from Form DEF 14, filed March 14, 2011) |
| | |
| | |
10.22 | | Form of Senior Executive Severance Agreement between The Ryland Group, Inc. and certain executive officers of the Company
(Incorporated by reference from Form 10-Q for the quarter ended September 30, 2000) |
| | |
| | |
10.23 | | Amendment and Restatement of The Ryland Group, Inc. Senior Executive Supplemental Retirement Plan
(Incorporated by reference from Form 10-K for the year ended December 31, 2008) |
| | |
| | |
10.24 | | Form of Amendment No. 1 to Senior Executive Severance Agreement between The Ryland Group, Inc. and certain executive officers of the Company
(Incorporated by reference from Form 10-K for the year ended December 31, 2008) |
| | |
| | |
10.25 | | Form of Amendment No. 2 to Senior Executive Severance Agreement between The Ryland Group, Inc. and certain executive officers of the Company
(Incorporated by reference from Form 10-K for the year ended December 31, 2011) |
| | |
| | |
10.26 | | Form of Amendment No. 3 to Senior Executive Severance Agreement between The Ryland Group, Inc. and executive officers of the Corporation
(Incorporated by reference from Form 8-K, filed October 2, 2012) |
| | |
| | |
10.27 | | Form of 2007 Senior Executive Severance Agreement between The Ryland Group, Inc. and certain executive officers of the Company
(Incorporated by reference from Form 10-K for the year ended December 31, 2006) |
| | |
| | |
10.28 | | Form of Amendment No. 1 to 2007 Senior Executive Severance Agreement between The Ryland Group, Inc. and certain executive officers of the Company
(Incorporated by reference from Form 10-K for the year ended December 31, 2008) |
| | |
| | |
10.29 | | Form of Amendment No. 2 to 2007 Senior Executive Severance Agreement between The Ryland Group, Inc. and certain executive officers of the Company
(Incorporated by reference from Form 10-K for the year ended December 31, 2011) |
| | |
| | |
10.30 | | The Ryland Group, Inc. Executive and Director Deferred Compensation Plan II, effective January 1, 2005
(Incorporated by reference from Form 10-K for the year ended December 31, 2008) |
| | |
| | |
10.31 | | TRG Incentive Plan, as amended and restated, effective January 1, 2005
(Incorporated by reference from Form 10-K for the year ended December 31, 2008) |
| | |
| | |
10.32 | | The Ryland Group, Inc. Performance Award Program
(Incorporated by reference from Form 8-K, filed April 30, 2008) |
| | |
| | |
10.33 | | The Ryland Group, Inc. 2011 Retention Incentive Plan
(Incorporated by reference from Form 10-K for the year ended December 31, 2011) |
| | |
| | |
10.34 | | Amendment No. 1 to The Ryland Group, Inc. Performance Award Program
(Incorporated by reference from Form 10-K for the year ended December 31, 2008) |
84
Table of Contents
| | | | | | | | |
| | | Exhibits,continued |
| | |
| | |
10.35 | | CEO Severance Agreement, dated as of December 17, 2009, by and between The Ryland Group, Inc. and Larry T. Nicholson
(Incorporated by reference from Form 8-K, filed December 21, 2009) |
| | |
| | |
10.36 | | The Ryland Group, Inc. Senior Executive Performance Plan
(Incorporated by reference from Form 8-K, filed April 30, 2008) |
| | |
| | |
10.37 | | Amendment No. 1 to The Ryland Group, Inc. Senior Executive Performance Plan
(Incorporated by reference from Form 10-K for the year ended December 31, 2008) |
| | |
| | |
10.38 | | Lease Agreement, dated December 21, 2010, by and between The Ryland Group, Inc. and Westlake Plaza Center East, LLC
(Incorporated by reference from Form 10-K for the year ended December 31, 2010) |
| | |
| | |
10.39 | | Office Lease Agreement Perimeter Gateway III, dated August 11, 2011, by and between The Ryland Group, Inc. and DTR10, LLC
(Incorporated by reference from Form 10-Q for the quarter ended September 30, 2012) |
| | |
| | |
10.40 | | Form of Indemnification Agreement
(Incorporated by reference from Form 10-K for the year ended December 31, 2011) |
| | |
| | |
12.1 | | Computation of Ratio of Earnings to Fixed Charges
(Filed herewith) |
| | |
| | |
21 | | Subsidiaries of the Registrant
(Filed herewith) |
| | |
| | |
23 | | Consent of Independent Registered Public Accounting Firm
(Filed herewith) |
| | |
| | |
24 | | Power of Attorney
(Filed herewith) |
| | |
| | |
31.1 | | Certification of Principal Executive Officer Pursuant to Section 302 of the Sarbanes-Oxley Act of 2002
(Filed herewith) |
| | |
| | |
31.2 | | Certification of Principal Financial Officer Pursuant to Section 302 of the Sarbanes-Oxley Act of 2002
(Filed herewith) |
| | |
| | |
32.1 | | Certification of Principal Executive Officer Pursuant to Section 906 of the Sarbanes-Oxley Act of 2002
(Filed herewith) |
| | |
| | |
32.2 | | Certification of Principal Financial Officer Pursuant to Section 906 of the Sarbanes-Oxley Act of 2002
(Filed herewith) |
| | |
| | |
101.INS | | XBRL Instance Document
(Furnished herewith) |
| | |
| | |
101.SCH | | XBRL Taxonomy Extension Schema Document
(Furnished herewith) |
| | |
| | |
101.CAL | | XBRL Taxonomy Calculation Linkbase Document
(Furnished herewith) |
| | |
| | |
101.LAB | | XBRL Taxonomy Label Linkbase Document
(Furnished herewith) |
| | |
| | |
101.PRE | | XBRL Taxonomy Presentation Linkbase Document
(Furnished herewith) |
| | |
| | |
101.DEF | | XBRL Taxonomy Extension Definition Document
(Furnished herewith) |
85
Table of Contents
Signatures
Pursuant to the requirements of Section 13 or 15(d) of the Exchange Act, the Company has duly caused this report to be signed on its behalf by the undersigned, thereunto duly authorized.
| | | | |
| The Ryland Group, Inc. | | | | |
By: |
|
|
|
|
/s/ Larry T. Nicholson
|
|
|
|
|
Larry T. Nicholson
President and Chief Executive Officer
(Principal Executive Officer) | | | | February 26, 2014 |
Pursuant to the requirements of the Exchange Act, this report has been signed below by the following persons on behalf of the Registrant and in the capacities and on the dates indicated. |
Principal Executive Officer: |
|
|
|
|
/s/ Larry T. Nicholson
|
|
|
|
|
Larry T. Nicholson
President and Chief Executive Officer | | | | February 26, 2014 |
Principal Financial Officer: |
|
|
|
|
/s/ Gordon A. Milne
|
|
|
|
|
Gordon A. Milne
Executive Vice President and
Chief Financial Officer | | | | February 26, 2014 |
Principal Accounting Officer: |
|
|
|
|
/s/ David L. Fristoe
|
|
|
|
|
David L. Fristoe
Senior Vice President, Controller and
Chief Accounting Officer | | | | February 26, 2014 |
A majority of the Board of Directors: William L. Jews, Ned Mansour, Robert E. Mellor, Norman J. Metcalfe, Larry T. Nicholson, Charlotte St. Martin, Thomas W. Toomey and Robert G. van Schoonenberg |
By: |
|
|
|
|
/s/ Timothy J. Geckle
|
|
|
|
|
Timothy J. Geckle
As Attorney-in-Fact | | | | February 26, 2014 |
86
Table of Contents
Index of Exhibits
| | | |
| | 10.4 | | Second Amendment to Master Repurchase Agreement, dated December 11, 2013, between Ryland Mortgage Company and RMC Mortgage Company and JPMorgan Chase Bank, N.A. |
|
12.1 |
|
Computation of Ratio of Earnings to Fixed Charges |
|
21 |
|
Subsidiaries of the Registrant |
|
23 |
|
Consent of Independent Registered Public Accounting Firm |
|
24 |
|
Power of Attorney |
|
31.1 |
|
Certification of Principal Executive Officer Pursuant to Section 302 of the Sarbanes-Oxley Act of 2002 |
|
31.2 |
|
Certification of Principal Financial Officer Pursuant to Section 302 of the Sarbanes-Oxley Act of 2002 |
|
32.1 |
|
Certification of Principal Executive Officer Pursuant to Section 906 of the Sarbanes-Oxley Act of 2002 |
|
32.2 |
|
Certification of Principal Financial Officer Pursuant to Section 906 of the Sarbanes-Oxley Act of 2002 |
|
101.INS |
|
XBRL Instance Document |
|
101.SCH |
|
XBRL Taxonomy Extension Schema Document |
|
101.CAL |
|
XBRL Taxonomy Calculation Linkbase Document |
|
101.LAB |
|
XBRL Taxonomy Label Linkbase Document |
|
101.PRE |
|
XBRL Taxonomy Presentation Linkbase Document |
|
101.DEF |
|
XBRL Taxonomy Extension Definition Document |
87