> | For the fiscal year ended November 30, 2008, Vanguard Ohio Tax-Exempt Money Market Fund returned 2.40%, exceeding the average return of its peers. |
> | Vanguard Ohio Long-Term Tax-Exempt Fund returned –3.61%, which was better than the peer-group average. |
> | During the 12-month period, municipal yields were extremely volatile, as spillover from the subprime credit crunch seeped into all corners of the fixed income market. |
Contents | |
| |
Your Fund’s Total Returns | 1 |
President’s Letter | 2 |
Advisor’s Report | 8 |
Ohio Tax-Exempt Money Market Fund | 10 |
Ohio Long-Term Tax-Exempt Fund | 24 |
About Your Fund’s Expenses | 42 |
Glossary | 44 |
Please note: The opinions expressed in this report are just that—informed opinions. They should not be considered promises or advice. Also, please keep in mind that the information and opinions cover the period through the date on the front of this report. Of course, the risks of investing in your fund are spelled out in the prospectus.
Your Fund’s Total Returns
Fiscal Year Ended November 30, 2008 | | |
| Ticker | Total |
| Symbol | Returns |
Vanguard Ohio Tax-Exempt Money Market Fund | VOHXX | 2.40% |
7-Day SEC Yield: 1.23% | | |
Taxable-Equivalent Yield: 2.02%1 | | |
Average Ohio Tax-Exempt Money Market Fund2 | | 2.03 |
| | |
Vanguard Ohio Long-Term Tax-Exempt Fund | VOHIX | –3.61% |
30-Day SEC Yield: 4.39% | | |
Taxable-Equivalent Yield: 7.20%1 | | |
Barclays Capital 10 Year Municipal Bond Index | | –0.42 |
Average Ohio Municipal Debt Fund2 | | –6.60 |
Your Fund’s Performance at a Glance | | | | |
November 30, 2007–November 30, 2008 | | | | |
| | | Distributions Per Share |
| Starting | Ending | Income | Capital |
| Share Price | Share Price | Dividends | Gains |
Vanguard Ohio Tax-Exempt Fund | | | | |
Money Market | $1.00 | $1.00 | $0.024 | $0.000 |
Long-Term | 11.88 | 10.96 | 0.506 | 0.000 |
1 This calculation, which assumes a typical itemized tax return, is based on the maximum federal tax rate of 35% and the maximum state of Ohio income tax rate. Local taxes were not considered. Please see the prospectus for a detailed explanation of the calculation.
2 Derived from data provided by Lipper Inc.
Note: The Barclays Capital bond indexes were formerly known as Lehman Brothers indexes. The change followed Barclays’ acquisition of Lehman's assets in September.
1

President’s Letter
Dear Shareholder,
Municipal securities experienced unusual volatility during the past 12 months as the global credit crunch reverberated through this typically sedate segment of the fixed income markets.
During this turbulent period, Vanguard Ohio Tax-Exempt Money Market Fund outperformed Vanguard Ohio Long-Term Tax-Exempt Fund, returning 2.40% for the 12 months ended November 30. The fund’s yield at year-end was 1.23% (down from 3.52% a year ago); the taxable-equivalent yield would be 2.02% for investors in the highest income tax bracket. The fund maintained a net asset value of $1 per share, as is expected but not guaranteed.
The Ohio Long-Term Tax-Exempt Fund returned a disappointing –3.61% for the fiscal year. The average return for Ohio municipal funds was –6.60%. As of November 30, the fund’s yield was 4.39% (up from 3.93% a year ago). For investors in the highest income tax bracket, the taxable-equivalent yield was 7.20%.
Please note: Although the funds’ income distributions are expected to be exempt from federal and Ohio state income taxes, a portion of these distributions may be subject to the alternative minimum tax. However, the Ohio Long-Term Tax-Exempt Fund currently owns no bonds that would generate income subject to the AMT.
2
Amid economic uncertainty, bond investors preferred Treasuries
Credit markets remained unsettled throughout the 12-month period. Bond investors grew increasingly reluctant to lend to corporations and even creditworthy states and municipalities. Instead, investors preferred the liquidity and relative safety of U.S. Treasury securities. This tendency persisted throughout the year and intensified toward the close of the period, as demand for Treasuries drove their prices higher and yields lower. At the end of November, the yield of the shortest-term Treasuries neared 0%, and the yield of the 10-year note dipped below 3% for the first time in five decades, indicating a remarkable level of risk aversion for investors across the maturity spectrum.
The U.S. Federal Reserve Board responded to the credit crisis by creating new lending programs and dramatically easing monetary policy. During the year, the Fed reduced its target for the federal funds rate from 4.50% to 1.00%.
For the 12 months, the broad taxable bond market returned 1.74%; the tax-exempt bond market returned –3.61%.
Stock market weakness was sharp and broad-based
Stock markets worldwide, including the U.S. stock market, registered some of the worst 12-month performances in many years. Stocks were weak throughout the year, but declines accelerated in September as the financial crisis deepened and several large financial
Market Barometer | |
| Average Annual Total Returns |
| Periods Ended November 30, 2008 |
| One Year | Three Years | Five Years |
Bonds | | | |
Barclays Capital U.S. Aggregate Bond Index | | | |
(Broad taxable market) | 1.74% | 4.56% | 4.10% |
Barclays Capital Municipal Bond Index | –3.61 | 1.66 | 2.58 |
Citigroup 3-Month Treasury Bill Index | 2.07 | 3.86 | 3.11 |
| | | |
Stocks | | | |
Russell 1000 Index (Large-caps) | –38.98% | –9.10% | –1.43% |
Russell 2000 Index (Small-caps) | –37.46 | –10.13 | –1.65 |
Dow Jones Wilshire 5000 Index (Entire market) | –38.84 | –8.96 | –1.16 |
MSCI All Country World Index ex USA (International) | –48.95 | –6.84 | 3.37 |
| | | |
CPI | | | |
Consumer Price Index | 1.07% | 2.44% | 2.86% |
3
institutions collapsed, received government assistance, or were taken over by competitors. Market volatility spiked, and daily stock market swings of several percentage points became common.
The effects of the financial crisis, which originated in the fixed income markets, continued to hamper the broader economy. Unemployment increased, consumer confidence declined, and production levels fell. Shortly after the close of the fund’s fiscal year, the National Bureau of Economic Research (the body responsible for dating the nation’s business cycles) confirmed that the U.S. economy had been in recession since December 2007.
For the fund’s fiscal year, the broad U.S. stock market returned –38.84%. International stocks fared worse, returning –48.95%.
Credit crisis weighed on the muni market
A year ago, trouble in the fixed income market seemed largely confined to securities backed by subprime mortgages, which came under severe pressure as the housing market deteriorated. As the depth and extent of the subprime market’s weakness became clear, however, distress spread to just about every segment of the fixed income market, including municipal securities.
Expense Ratios1 | | |
Your Fund Compared With Its Peer Group | | |
| | |
| | Peer |
Ohio Tax-Exempt Fund | Fund | Group |
Money Market | 0.10% | 0.63% |
Long-Term | 0.13 | 1.24 |
1 The fund expense ratios shown are from the prospectus dated March 28, 2008. For the fiscal year ended November 30, 2008, the expense ratios were 0.11% for the Ohio Tax-Exempt Money Market Fund and 0.13% for the Ohio Long-Term Tax-Exempt Fund. Peer-group expense ratios are derived from data provided by Lipper Inc. and capture information through year-end 2007. Peer groups are: for the Ohio Tax-Exempt Money Markey Fund, the Average Ohio Tax-Exempt Money Market Fund; and for the Ohio Long-Term Tax-Exempt Fund, the Average Ohio Municipal Debt Fund.
4
For the fiscal period, the Ohio Tax-Exempt Money Market Fund returned 2.40% while maintaining a net asset value of $1 per share. The yields of short-term municipal securities fluctuated significantly during the year, as investors veered back and forth between the perceived safety of Treasury bills and the more generous yields available from tax-exempt securities. After rising initially, yields on short-term municipal securities pulled back, and the Ohio Tax-Exempt Money Market Fund’s yield at the end of the period was more than 2 percentage points below its yield at the start.
In October, the Vanguard money market funds, including the Ohio Tax-Exempt Money Market Fund, elected to participate in the U.S. Treasury’s Temporary Guarantee Program for money market funds. In December, the Vanguard money market funds agreed to participate in the extension of this program, which is scheduled to run through April 30, 2009. We have the highest confidence in the stability and liquidity of our money market funds, and we do not believe the funds will ever need support. We reasoned that our participation in the program could help bring stability to the credit markets, a development that would help Vanguard and other money market investors.
Ohio Long-Term Tax-Exempt Fund returned –3.61% for the 12-month period, as the prices of almost all bonds that weren’t issued by the U.S. Treasury declined. Although the fund’s absolute return was generally disappointing, the fund outperformed its peer group by a substantial margin. This difference reflects the commitment of the fund’s advisor, Vanguard Fixed Income Group, to high-quality securities and prudent portfolio management strategies, which helped protect shareholders from the worst of the market’s upheaval during the past year.
Prudent management and low costs have delivered strong returns
Just as they did during the past 12 months, the funds have benefited over the long term from the advisor’s diligent credit analysis, emphasis on high quality and liquidity, and efforts to keep the portfolios’ exposure to interest rate risk generally in line with those of their respective market segments.
For the ten-year period ended November 30, 2008, the Ohio Tax-Exempt Money Market Fund earned an average annual return of 2.49%, compared with the peer-group average of 2.08% for the same period. The fund was aided by its low expenses—a key for short-term investment vehicles, such as money market funds.
The Ohio Long-Term Tax-Exempt Fund earned an average annual return of 4.08% over the decade, which would have transformed a hypothetical initial investment of $10,000 into $14,911. By comparison, the average return for competing funds would have produced a return of $13,082 over the same ten-year period. The Ohio Long-Term Tax-Exempt
5
Fund also benefited from the skill and strategy of the fund’s experienced advisor, as well as Vanguard’s low costs.
A sensible allocation plan for unsettling times
As stock markets have tumbled, and even typically staid segments of the investment markets such as municipal securities have endured high levels of volatility, the temptation to “do something” has no doubt been strong. Our experience suggests that, more often than not, such an emotional response is counterproductive.
We’ve found that a sensible approach even in turbulent markets—and it’s worth noting that, while extreme, the recent turmoil is not unprecedented—is to determine a mix of stock, bond, and money market funds appropriate for your goals and circumstances, and then stick with it through the good times and bad. A balanced, well-diversified portfolio provides you with some protection from the stock market’s deepest swoons as well as the opportunity to participate in its potential for long-term growth.
Both the Ohio Tax-Exempt Money Market Fund and the Ohio Long-Term Tax-Exempt Fund can play an important role in such a portfolio, particularly for investors in high tax brackets. And, by keeping expenses low, your fund’s advisor enables you to capture more of the return on your investment.
As always, thank you for entrusting your assets to Vanguard.
Sincerely,

F. William McNabb III
President and Chief Executive Officer
December 12, 2008
Details about the Treasury Temporary Guarantee Program for Money Market Funds |
The Ohio Tax-Exempt Money Market Fund is participating in the U.S. Treasury’s Temporary Guarantee Program, which provides a guarantee to money market fund shareholders based on the number of shares they owned at the close of business on September 19, 2008. Some details of the program:
• Any increase in the number of shares that an investor held after the close of business on September 19 will not be guaranteed.
• If a customer closes his or her account in the fund, any future investment in the fund will not be guaranteed.
• If the number of shares an investor holds fluctuates over the period, the investor will be covered for either the number of shares held as of the close of business on September 19 or the current amount, whichever is less.
The program will expire on April 30, 2009, unless it is extended by the Treasury.
6
Total Returns | | |
Ten Years Ended November 30, 2008 | | |
| Average Annual Return |
| | Average |
| Vanguard | Competing |
Ohio Tax-Exempt Fund | Fund | Fund1 |
Money Market | 2.49% | 2.08% |
Long-Term | 4.08 | 2.72 |
The figures shown represent past performance, which is not a guarantee of future results. (Current performance may be lower or higher than the performance data cited. For performance data current to the most recent month-end, visit our website at www.vanguard.com/performance.) Note, too, that both investment returns and principal value can fluctuate widely, so an investor’s shares, when sold, could be worth more or less than their original cost.
1 Derived from data provided by Lipper Inc.
7
Advisor’s Report
For the fiscal year ended November 30, 2008, Vanguard Ohio Tax-Exempt Money Market Fund returned 2.40%. Vanguard Ohio Long-Term Tax-Exempt Fund returned –3.61%, as bond prices declined. Both funds outperformed their peers.
The investment environment
Credit-market problems that first surfaced in mid-2007 intensified during the past 12 months, ultimately leading to a severe disruption of the market’s normal lending and borrowing activity. By the end of the period, the Federal Reserve Board had lowered its target for the federal funds rate, a benchmark for short-term rates, to 1.00%, from 4.50% at the start. (On December 16, 2008, after the close of the fiscal period, the Fed established a rate target of 0% to 0.25%.)
As the tentacles of the subprime loan crisis gripped the credit markets, municipal securities (and just about every other fixed income investment) underperformed U.S. Treasuries, which rallied amid a global flight to quality. Weakness in the municipal market also reflected concern about the financial strength of municipal bond insurers and forced selling by investors who had bought municipals with borrowed money. As asset prices declined, these borrowers sold municipals to meet margin requirements. The net effect was to cheapen high-quality tax-exempt bonds to extraordinarily attractive levels, particularly on an after-tax basis.
A by-product of these developments was a sharp drop in the supply of new securities. Outflows experienced by mutual fund
Yields of Municipal Securities | | |
(AAA-Rated General-Obligation Issues) | | |
| November 30, | November 30, |
Maturity | 2007 | 2008 |
2 years | 3.18% | 2.13% |
5 years | 3.26 | 2.93 |
10 years | 3.62 | 4.02 |
30 years | 4.32 | 5.38 |
Source: Vanguard.
8
companies and a lack of support from other institutional buyers made the placement of new issues difficult. As a result, issuers came to market only on an as-needed basis. During the past 12 months, Ohio issuers brought $11.6 billion in new securities to market, down from $17.8 billion a year ago.
Management of the funds
Vanguard Fixed Income Group has always looked through the insurance wrapper to the underlying quality of the municipal issuer. As the monoline insurers were downgraded, this long-standing approach proved beneficial, limiting our exposure to bonds that were repriced by the market to reflect their lower underlying credit quality. As usual, we maintained a quality bias in our purchases, which helped us to avoid some of the market’s pitfalls for the fiscal year.
In the Long-Term Tax-Exempt Fund, our customary focus on the market’s higher-quality securities enhanced the fund’s performance compared with that of its peer group as investors retreated from risk. During the past 12 months, we kept the fund’s duration (a measure of interest-rate sensitivity) near its typical level.
In the Money Market Fund, our high-quality bias was a source of confidence as the market for short-term securities seized up. This development was exemplified by the breakdown in the auction-rate securities market, which normally gives borrowers the opportunity to finance long-term debts at short-term rates. The demand for high-quality, short-term securities, along with the Fed’s rate cuts, drove down the fund’s 7-day SEC yield over the full 12 months. At the start of the period, the fund’s yield was 3.52%. By the end of the period, the figure was 1.23%.
Outlook
Municipal governments are beginning to feel the effects of the economic slowdown. The contraction has been surprisingly swift and broad-based. Going forward, we will have to pay close attention to credit dynamics. The credit quality of issuers will become more of a focus for the market over the coming year.
We approach the new fiscal year confident that shareholders can rely on the Vanguard Ohio Tax-Exempt Funds’ broad diversification and our experienced credit-research team to take advantage of the opportunities that arise in the municipal market. And as always, the funds’ low expense ratios enhance our clients’ share of the returns produced by these efforts.
Pamela Wisehaupt Tynan, Principal, Portfolio Manager
Marlin G. Brown, Portfolio Manager Vanguard
Fixed Income Group
December 19, 2008
9
Ohio Tax-Exempt Money Market Fund
Fund Profile
As of November 30, 2008
Financial Attributes | |
| |
Yield1 | 1.2% |
Average Weighted Maturity | 43 days |
Average Quality2 | MIG-1 |
Expense Ratio (11/30/2007)3 | 0.10% |
Distribution by Credit Quality4 (% of portfolio) | |
| |
MIG-1/A-1+/SP-1+/F-1+ | 95.2% |
P-1/A-1/SP-1/F-1 | 2.6 |
AAA/AA | 2.2 |
1 7-day SEC yield. See the Glossary.
2 Moody’s Investors Service.
3 Expense ratio shown is from the prospectus dated March 28, 2008. For the fiscal year ended November 30, 2008, the expense ratio was 0.11%.
4 Ratings: Moody’s Investors Service, Standard & Poor’s, Fitch.
10
Ohio Tax-Exempt Money Market Fund
Performance Summary
Investment returns will fluctuate. All of the returns in this report represent past performance, which is not a guarantee of future results that may be achieved by the fund. (Current performance may be lower or higher than the performance data cited. For performance data current to the most recent month-end, visit our website at www.vanguard.com/performance.) The returns shown do not reflect taxes that a shareholder would pay on fund distributions. An investment in a money market fund is not insured or guaranteed by the Federal Deposit Insurance Corporation or any other government agency. Although the fund seeks to preserve the value of your investment at $1 per share, it is possible to lose money by investing in the fund. (For details on the fund’s participation in the U.S. Treasury’s temporary guarantee program, please see the note on page 6.) The annualized yield shown reflects the current earnings of the fund more closely than do the average annual returns.
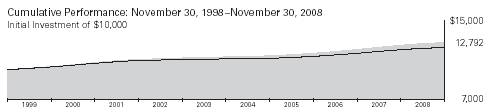
| Average Annual Total Returns | Final Value |
| Periods Ended November 30, 2008 | of a $10,000 |
| One Year | Five Years | Ten Years | Investment |
Ohio Tax-Exempt Money Market Fund1 | 2.40% | 2.52% | 2.49% | $12,792 |
Average Ohio Tax-Exempt Money Market Fund2 | 2.03 | 2.06 | 2.08 | 12,288 |
1 Total returns do not include the account service fee that may be applicable to certain accounts with balances below $10,000.
2 Derived from data provided by Lipper Inc.
11
Ohio Tax-Exempt Money Market Fund
Fiscal-Year Total Returns (%): November 30, 1998–November 30, 2008 |
| | Average |
| | Fund1 |
Fiscal | Total | Total |
Year | Return | Return |
1999 | 3.0% | 2.8% |
2000 | 4.0 | 3.6 |
2001 | 3.0 | 2.6 |
2002 | 1.4 | 1.0 |
2003 | 0.9 | 0.6 |
2004 | 1.1 | 0.6 |
2005 | 2.2 | 1.7 |
2006 | 3.3 | 2.8 |
2007 | 3.6 | 3.1 |
2008 | 2.4 | 2.0 |
7-day SEC yield (11/30/2008): 1.23% | | |
Average Annual Total Returns: Periods Ended September 30, 2008
This table presents average annual total returns through the latest calendar quarter—rather than through the end of the fiscal period. Securities and Exchange Commission rules require that we provide this information.
| Inception Date | One Year | Five Years | Ten Years |
Ohio Tax-Exempt Money Market Fund2 | 6/18/1990 | 2.60% | 2.47% | 2.51% |
1 Returns for the Average Ohio Tax-Exempt Money Market Fund are derived from data provided by Lipper Inc.
2 Total returns do not include the account service fee that may be applicable to certain accounts with balances below $10,000.
Note: See Financial Highlights table for dividend information.
12
Ohio Tax-Exempt Money Market Fund
Financial Statements
Statement of Net Assets
As of November 30, 2008
The fund provides a complete list of its holdings four times in each fiscal year, at the quarter-ends. For the second and fourth fiscal quarters, the lists appear in the fund’s semiannual and annual reports to shareholders. For the first and third fiscal quarters, the fund files the lists with the Securities and Exchange Commission on Form N-Q. Shareholders can look up the fund’s Forms N-Q on the SEC’s website at www.sec.gov. Forms N-Q may also be reviewed and copied at the SEC’s Public Reference Room (see the back cover of this report for further information).
| | | | | Face | Market |
| | | Maturity | | Amount | Value• |
| | Coupon | Date | | ($000) | ($000) |
Tax-Exempt Municipal Bonds (99.2%) | | | | | |
Ohio (98.5%) | | | | | |
| Akron OH BAN | 3.000% | 6/25/09 | | 7,500 | 7,537 |
| Allen County OH Hosp. Fac. Rev. | | | | | |
| (Catholic Healthcare) VRDO | 0.900% | 12/1/08 | LOC | 5,540 | 5,540 |
| Allen County OH Hosp. Fac. Rev. | | | | | |
| (Catholic Healthcare) VRDO | 1.400% | 12/1/08 | LOC | 1,800 | 1,800 |
| Allen County OH Hosp. Fac. Rev. | | | | | |
| (Catholic Healthcare) VRDO | 1.650% | 12/8/08 | LOC | 11,250 | 11,250 |
1 | American Muni. Power Ohio Inc. TOB VRDO | 1.350% | 12/8/08 | (12) | 10,000 | 10,000 |
1 | American Muni. Power Ohio Inc. TOB VRDO | 1.350% | 12/8/08 | (12) | 9,315 | 9,315 |
| Avon OH BAN | 2.350% | 5/14/09 | | 1,840 | 1,843 |
| Avon OH Local School Dist. BAN | 3.500% | 1/8/09 | | 2,000 | 2,001 |
| Beachwood OH BAN | 2.250% | 12/3/09 | | 1,000 | 1,005 |
| Berea OH BAN | 2.500% | 7/2/09 | | 1,175 | 1,178 |
| Brecksville OH BAN | 2.350% | 7/2/09 | | 2,500 | 2,504 |
| Butler County OH BAN | 2.250% | 8/6/09 | | 5,000 | 5,017 |
1 | Cincinnati OH City School Dist. GO TOB VRDO | 1.030% | 12/8/08 | (12) | 12,485 | 12,485 |
1 | Cincinnati OH City School Dist. GO TOB VRDO | 1.150% | 12/8/08 | LOC | 10,000 | 10,000 |
1 | Cincinnati OH City School Dist. TOB VRDO | 1.440% | 12/8/08 | (4) | 12,600 | 12,600 |
1 | Cincinnati OH Water System Rev. TOB VRDO | 1.400% | 12/8/08 | | 5,100 | 5,100 |
| Cleveland OH Airport System Rev. VRDO | 1.000% | 12/8/08 | LOC | 12,800 | 12,800 |
1 | Cleveland OH Income Tax Rev. TOB VRDO | 1.030% | 12/8/08 | | 15,505 | 15,505 |
| Cleveland OH Water Works Rev. VRDO | 0.900% | 12/8/08 | LOC | 8,500 | 8,500 |
| Cleveland OH Water Works Rev. VRDO | 3.000% | 12/8/08 | (4) | 11,700 | 11,700 |
| Cleveland-Cuyahoga County OH Port Auth. Rev. | | | | | |
| (Euclid Avenue Housing Corp. Project) VRDO | 1.030% | 12/8/08 | LOC | 2,750 | 2,750 |
| Cleveland-Cuyahoga County OH Port Auth. Rev. | | | | | |
| (Museum of Art) VRDO | 0.900% | 12/8/08 | | 10,000 | 10,000 |
| Cleveland-Cuyahoga County OH Port Auth. Rev. | | | | | |
| (Museum of Art) VRDO | 0.900% | 12/8/08 | | 7,300 | 7,300 |
| Cleveland-Cuyahoga County OH Port Auth. Rev. | | | | | |
| (Museum of Art) VRDO | 0.900% | 12/8/08 | | 16,700 | 16,700 |
| Columbus OH City School Dist. BAN | 3.750% | 12/11/08 | | 4,000 | 4,001 |
1 | Columbus OH City School Dist. TOB VRDO | 0.980% | 12/8/08 | LOC | 10,230 | 10,230 |
1 | Columbus OH GO TOB VRDO | 1.030% | 12/8/08 | | 4,360 | 4,360 |
1 | Columbus OH GO TOB VRDO | 1.060% | 12/8/08 | | 6,000 | 6,000 |
| Columbus OH Regional Airport Auth. Airport | | | | | |
| Refunding Rev. (Oasbo Expanded Asset | | | | | |
| Program) VRDO | 1.020% | 12/8/08 | LOC | 36,735 | 36,735 |
13
Ohio Tax-Exempt Money Market Fund
| | | | | Face | Market |
| | | Maturity | | Amount | Value• |
| | Coupon | Date | | ($000) | ($000) |
| Columbus OH Regional Airport Auth. Airport | | | | | |
| Refunding Rev. (Oasbo Expanded Asset | | | | | |
| Program) VRDO | 1.020% | 12/8/08 | LOC | 2,600 | 2,600 |
1 | Columbus OH Sewer Rev. TOB VRDO | 0.800% | 12/8/08 | | 4,995 | 4,995 |
| Cuyahoga County OH Hosp. Rev. | | | | | |
| (Cleveland Clinic Foundation) VRDO | 0.800% | 12/1/08 | | 19,100 | 19,100 |
| Cuyahoga Falls OH BAN | 3.750% | 12/11/08 | | 3,750 | 3,750 |
| Cuyahoga Falls OH BAN | 2.750% | 12/9/09 | | 4,500 | 4,558 |
| Delaware County OH Port Auth. Econ. | | | | | |
| Dev. Rev. (Columbus Zoological Park) VRDO | 1.050% | 12/8/08 | LOC | 5,850 | 5,850 |
| Delaware County OH Sewer Dist. | 4.950% | 12/8/08 | (Prere.) | 1,500 | 1,567 |
| Euclid OH BAN | 2.375% | 12/8/08 | | 5,300 | 5,307 |
| Fairfield City OH Police Services Project BAN | 3.500% | 12/8/08 | | 1,665 | 1,669 |
1 | Franklin County OH Convention Fac. Rev. TOB VRDO | 1.400% | 12/8/08 | | 7,585 | 7,585 |
| Franklin County OH Hosp. Rev. | | | | | |
| (Nationwide Hosp.) VRDO | 0.900% | 12/8/08 | | 10,000 | 10,000 |
| Franklin County OH Hosp. Rev. | | | | | |
| (OhioHealth Corp.) VRDO | 0.790% | 12/8/08 | LOC | 13,170 | 13,170 |
| Franklin County OH Hosp. Rev. | | | | | |
| (OhioHealth Corp.) VRDO | 0.810% | 12/8/08 | | 18,000 | 18,000 |
| Franklin County OH Hosp. Rev. | | | | | |
| (U.S. Health Corp.) VRDO | 0.780% | 12/8/08 | LOC | 1,025 | 1,025 |
| Green City OH BAN | 2.750% | 7/14/09 | | 8,400 | 8,443 |
| Greene County OH BAN | 2.600% | 8/17/09 | | 9,056 | 9,056 |
| Lakewood OH BAN | 2.125% | 4/16/09 | | 3,750 | 3,754 |
1 | Lakewood OH City School Dist. GO TOB VRDO | 1.780% | 12/8/08 | (4) | 2,665 | 2,665 |
| Lancaster Port Auth. Ohio Gas Rev. VRDO | 1.000% | 12/8/08 | | 19,860 | 19,860 |
| Little Miami Ohio Local School Dist. BAN | 2.625% | 6/4/09 | | 6,000 | 6,016 |
| Lorain County OH Hosp. Fac. Rev. | | | | | |
| (EMH Regional Medical Center) VRDO | 0.950% | 12/8/08 | LOC | 4,900 | 4,900 |
1 | Lorain County OH Hosp. Rev. | | | | | |
| (Catholic Healthcare Partners) TOB VRDO | 0.930% | 12/8/08 | (4) | 7,715 | 7,715 |
| Lorain County OH Port Auth. Educ. Fac. | | | | | |
| (St. Ignatius High School) VRDO | 1.010% | 12/8/08 | LOC | 2,250 | 2,250 |
| Lorain County OH Sewer System BAN | 2.500% | 5/14/09 | | 2,800 | 2,809 |
| Lucas County OH BAN | 3.000% | 7/30/09 | | 7,000 | 7,059 |
| Lucas County OH Hosp. Rev. | | | | | |
| (ProMedica Health Care) VRDO | 1.150% | 12/8/08 | LOC | 5,500 | 5,500 |
| Lucas County OH Hosp. Rev. | | | | | |
| (ProMedica Health Care) VRDO | 1.150% | 12/8/08 | LOC | 7,800 | 7,800 |
| Marysville OH BAN | 2.500% | 6/3/09 | | 3,835 | 3,845 |
| Mason OH BAN | 3.000% | 3/12/09 | | 2,550 | 2,555 |
| Mason OH City School Dist. BAN | 2.750% | 2/5/09 | | 3,000 | 3,004 |
| Mentor OH BAN | 2.750% | 8/6/09 | | 2,060 | 2,073 |
| Miamisburg OH City School Dist. BAN | 3.500% | 7/28/09 | | 8,250 | 8,284 |
1 | Montgomery County OH Rev. | | | | | |
| (Catholic Health Initiatives) TOB VRDO | 1.780% | 12/8/08 | (4) | 6,970 | 6,970 |
| Montgomery County OH Rev. | | | | | |
| (Catholic Health Initiatives) VRDO | 0.650% | 12/8/08 | | 17,670 | 17,670 |
| Montgomery County OH Rev. | | | | | |
| (Catholic Health Initiatives) VRDO | 0.830% | 12/8/08 | | 6,300 | 6,300 |
1 | Montgomery County OH Rev. TOB VRDO | 1.780% | 12/8/08 | (4) | 4,995 | 4,995 |
1 | Ohio Air Quality Dev. Rev. TOB VRDO | 1.260% | 12/8/08 | (13) | 8,000 | 8,000 |
1 | Ohio Building Auth. Rev. | | | | | |
| (Adult Correctional Building) TOB VRDO | 0.500% | 12/8/08 | | 5,850 | 5,850 |
1 | Ohio Building Auth. Rev. TOB VRDO | 1.780% | 12/8/08 | (4) | 2,695 | 2,695 |
14
Ohio Tax-Exempt Money Market Fund
| | | | | Face | Market |
| | | Maturity | | Amount | Value• |
| | Coupon | Date | | ($000) | ($000) |
| Ohio Common Schools GO | 5.000% | 3/15/09 | | 2,000 | 2,016 |
| Ohio Common Schools GO VRDO | 0.400% | 12/8/08 | | 10,450 | 10,450 |
| Ohio Common Schools GO VRDO | 0.950% | 12/8/08 | | 12,785 | 12,785 |
| Ohio GO | 7.625% | 8/1/09 | | 4,345 | 4,531 |
| Ohio GO | 4.000% | 9/1/09 | | 7,640 | 7,736 |
1 | Ohio GO TOB VRDO | 0.800% | 12/8/08 | | 11,490 | 11,490 |
1 | Ohio GO TOB VRDO | 1.090% | 12/8/08 | | 9,400 | 9,400 |
1 | Ohio GO TOB VRDO | 1.400% | 12/8/08 | | 1,800 | 1,800 |
| Ohio GO VRDO | 0.450% | 12/8/08 | | 3,400 | 3,400 |
| Ohio GO VRDO | 0.500% | 12/8/08 | | 5,750 | 5,750 |
| Ohio Higher Educ. Capital Fac. Rev. | 5.500% | 12/1/08 | | 10,000 | 10,000 |
1 | Ohio Higher Educ. Capital Fac. Rev. TOB VRDO | 1.060% | 12/8/08 | | 4,480 | 4,480 |
1 | Ohio Higher Educ. Fac. Comm. Rev. | | | | | |
| (Austin) TOB VRDO | 0.930% | 12/8/08 | (13) | 5,000 | 5,000 |
| Ohio Higher Educ. Fac. Comm. Rev. | | | | | |
| (Case Western Reserve Univ.) CP | 1.100% | 1/8/09 | | 10,000 | 10,000 |
| Ohio Higher Educ. Fac. Comm. Rev. | | | | | |
| (Case Western Reserve Univ.) VRDO | 1.300% | 12/1/08 | | 6,000 | 6,000 |
| Ohio Higher Educ. Fac. Comm. Rev. | | | | | |
| (Case Western Reserve Univ.) VRDO | 0.650% | 12/8/08 | | 5,995 | 5,995 |
| Ohio Higher Educ. Fac. Comm. Rev. | | | | | |
| (Kenyon College) VRDO | 0.900% | 12/1/08 | | 600 | 600 |
| Ohio Higher Educ. Fac. Comm. Rev. | | | | | |
| (Mount Union College) VRDO | 1.000% | 12/8/08 | LOC | 1,330 | 1,330 |
| Ohio Higher Educ. Fac. Comm. Rev. | | | | | |
| (Northern Univ.) VRDO | 0.950% | 12/8/08 | LOC | 8,000 | 8,000 |
| Ohio Higher Educ. Fac. Comm. Rev. | | | | | |
| (Oberlin College Project) VRDO | 0.500% | 12/8/08 | | 5,885 | 5,885 |
| Ohio Higher Educ. Fac. Comm. Rev. | | | | | |
| (Oberlin College Project) VRDO | 0.500% | 12/8/08 | | 2,750 | 2,750 |
| Ohio Higher Educ. Fac. Comm. Rev. | | | | | |
| (Oberlin College Project) VRDO | 0.500% | 12/8/08 | | 10,000 | 10,000 |
| Ohio Higher Educ. Fac. Comm. Rev. | | | | | |
| (Univ. Hospitals Health System) VRDO | 0.600% | 12/8/08 | LOC | 11,500 | 11,500 |
| Ohio Higher Educ. Fac. Comm. Rev. | | | | | |
| (Univ. Hospitals Health System) VRDO | 0.760% | 12/8/08 | LOC | 8,600 | 8,600 |
| Ohio Higher Educ. Fac. Comm. Rev. | | | | | |
| (Xavier Univ. Project) VRDO | 0.550% | 12/8/08 | LOC | 7,310 | 7,310 |
| Ohio Higher Educ. Fac. Comm. Rev. | | | | | |
| (Xavier Univ.) VRDO | 0.550% | 12/8/08 | LOC | 10,875 | 10,875 |
1 | Ohio Higher Educ. Fac. Comm. Rev. TOB VRDO | 1.030% | 12/8/08 | | 6,225 | 6,225 |
1 | Ohio Housing Finance Agency | | | | | |
| Mortgage Rev. TOB VRDO | 1.250% | 12/8/08 | | 6,770 | 6,770 |
1 | Ohio Housing Finance Agency | | | | | |
| Mortgage Rev. TOB VRDO | 1.250% | 12/8/08 | | 4,745 | 4,745 |
1 | Ohio Housing Finance Agency | | | | | |
| Mortgage Rev. TOB VRDO | 1.280% | 12/8/08 | | 4,455 | 4,455 |
| Ohio Housing Finance Agency | | | | | |
| Mortgage Rev. VRDO | 0.980% | 12/8/08 | | 5,780 | 5,780 |
| Ohio Housing Finance Agency | | | | | |
| Mortgage Rev. VRDO | 1.050% | 12/8/08 | | 11,530 | 11,530 |
| Ohio Housing Finance Agency | | | | | |
| Mortgage Rev. VRDO | 1.140% | 12/8/08 | | 5,000 | 5,000 |
| Ohio Housing Finance Agency | | | | | |
| Mortgage Rev. VRDO | 1.250% | 12/8/08 | | 9,040 | 9,040 |
15
Ohio Tax-Exempt Money Market Fund
| | | | Face | Market |
| | | Maturity | Amount | Value• |
| | Coupon | Date | ($000) | ($000) |
| Ohio Housing Finance Agency | | | | |
| Mortgage Rev. VRDO | 1.250% | 12/8/08 | 8,580 | 8,580 |
| Ohio Housing Finance Agency Mortgage Rev. VRDO | 1.300% | 12/8/08 | 8,000 | 8,000 |
| Ohio Housing Finance Agency Mortgage Rev. VRDO | 1.800% | 12/8/08 | 2,905 | 2,905 |
| Ohio Infrastructure Improvement GO VRDO | 0.450% | 12/8/08 | 2,425 | 2,425 |
| Ohio PCR (Sohio Air British Petroleum Co.) VRDO | 0.800% | 12/1/08 | 3,900 | 3,900 |
| Ohio Solid Waste Rev. (BP Exploration & Oil Inc.) VRDO | 1.070% | 12/1/08 | 14,725 | 14,725 |
| Ohio Solid Waste Rev. (BP Exploration & Oil Inc.) VRDO | 1.070% | 12/1/08 | 3,140 | 3,140 |
| Ohio Solid Waste Rev. (BP Exploration & Oil Inc.) VRDO | 1.070% | 12/1/08 | 7,625 | 7,625 |
| Ohio Solid Waste Rev. (BP Exploration & Oil Inc.) VRDO | 1.070% | 12/1/08 | 7,000 | 7,000 |
| Ohio Solid Waste Rev. (BP Exploration & Oil Inc.) VRDO | 1.070% | 12/1/08 | 11,505 | 11,505 |
1 | Ohio State Higher Educ. Fac. TOB VRDO | 1.030% | 12/8/08 | 3,700 | 3,700 |
1 | Ohio State Higher Educ. TOB VRDO | 0.800% | 12/8/08 LOC | 4,985 | 4,985 |
| Ohio State Univ. General Receipts Rev. CP | 1.850% | 2/9/09 | 22,400 | 22,400 |
| Ohio State Univ. General Receipts Rev. PUT | 3.750% | 1/14/09 | 10,000 | 10,000 |
1 | Ohio State Water Dev. Auth. PCR TOB VRDO | 1.030% | 12/8/08 | 5,995 | 5,995 |
1 | Ohio Turnpike Comm. Turnpike Rev. TOB VRDO | 1.470% | 12/8/08 | 16,305 | 16,305 |
| Ohio Water Dev. Auth. PCR (FirstEnergy | | | | |
| Nuclear) VRDO | 1.300% | 12/8/08 LOC | 13,000 | 13,000 |
| Ohio Water Dev. Auth. PCR (FirstEnergy) VRDO | 0.850% | 12/8/08 LOC | 13,250 | 13,250 |
| Ohio Water Dev. Auth. PCR (FirstEnergy) VRDO | 0.850% | 12/8/08 LOC | 18,000 | 18,000 |
| Ohio Water Dev. Auth. PCR (FirstEnergy) VRDO | 1.050% | 12/8/08 LOC | 10,000 | 10,000 |
| Ohio Water Dev. Auth. PCR (Ohio Edison Co.) VRDO | 5.000% | 12/1/08 LOC | 4,300 | 4,300 |
| Ohio Water Dev. Auth. PCR BAN | 3.000% | 8/4/09 | 5,000 | 5,057 |
1 | Ohio Water Dev. Auth. Rev. (Drinking Water Fund) | | | | |
| TOB VRDO | 1.030% | 12/8/08 | 7,225 | 7,225 |
| Ohio Water Dev. Auth. Rev. (Fresh Water) CP | 1.800% | 12/4/08 | 10,000 | 10,000 |
| Ohio Water Dev. Auth. Rev. (Pure Water) VRDO | 1.150% | 12/8/08 | 39,335 | 39,335 |
| Ohio Water Dev. Auth. Rev. BAN | 4.000% | 10/1/09 | 7,000 | 7,094 |
1 | Ohio Water Dev. Auth. Rev. TOB VRDO | 1.400% | 12/8/08 | 2,700 | 2,700 |
| Perrysburg OH BAN | 2.125% | 5/21/09 | 2,283 | 2,285 |
| Port of Greater Cincinnati Dev. Auth. | | | | |
| (Sycamore Township Kenwood) VRDO | 1.030% | 12/8/08 LOC | 3,000 | 3,000 |
| Portage County OH BAN | 3.250% | 10/2/09 | 5,000 | 5,010 |
| Shaker Heights OH City School Dist. BAN | 2.500% | 12/2/08 | 2,500 | 2,500 |
| Shaker Heights OH Urban Renewal BAN | 3.650% | 4/22/09 | 4,000 | 4,012 |
| Strongsville OH BAN | 2.600% | 12/11/08 | 1,725 | 1,725 |
| Strongsville OH BAN | 3.250% | 5/14/09 | 2,740 | 2,746 |
1 | Toledo Lucas County OH Port Auth. VRDO | 1.030% | 12/8/08 | 5,500 | 5,500 |
| Toledo OH City Services Special Assessment VRDO | 0.900% | 12/8/08 LOC | 6,200 | 6,200 |
| Toledo OH City Services Special Assessment VRDO | 1.040% | 12/8/08 LOC | 9,000 | 9,000 |
| Union Township OH BAN | 3.000% | 9/15/09 | 10,000 | 10,077 |
| Univ. of Akron OH General Receipts Rev. VRDO | 2.000% | 12/8/08 (12) | 10,000 | 10,000 |
| Univ. of Cincinnati OH General Receipts BAN | 2.750% | 7/21/09 | 8,950 | 9,008 |
| Upper Arlington OH City School Dist. TAN | 2.625% | 6/25/09 | 2,500 | 2,509 |
| Willoughby OH BAN | 3.000% | 10/14/09 | 6,810 | 6,840 |
| | | | | |
Puerto Rico (0.7%) | | | | |
| Puerto Rico TRAN | 3.000% | 7/30/09 LOC | 8,000 | 8,071 |
Total Tax-Exempt Municipal Bonds (Cost $1,087,862) | | | | 1,087,862 |
16
Ohio Tax-Exempt Money Market Fund
| Market |
| Value• |
| ($000) |
Other Assets and Liabilities (0.8%) | |
Other Assets | 25,729 |
Liabilities | (17,471) |
| 8,258 |
Net Assets (100%) | |
Applicable to 1,096,109,232 outstanding $.001 par value shares of | |
beneficial interest (unlimited authorization) | 1,096,120 |
Net Asset Value Per Share | $1.00 |
At November 30, 2008, net assets consisted of: | |
| Amount |
| ($000) |
Paid-in Capital | 1,096,140 |
Undistributed Net Investment Income | — |
Accumulated Net Realized Losses | (20) |
Net Assets | 1,096,120 |
• | See Note A in Notes to Financial Statements. |
1 Security exempt from registration under Rule 144A of the Securities Act of 1933. Such securities may be sold in transactions exempt from registration, normally to qualified institutional buyers. At November 30, 2008, the aggregate value of these securities was $247,840,000, representing 22.6% of net assets.
See accompanying Notes, which are an integral part of the Financial Statements.
A key to abbreviations and other references follows the Statement of Net Assets.
17
Ohio Tax-Exempt Money Market Fund
Key to Abbreviations
ARS—Auction Rate Security. |
BAN—Bond Anticipation Note. |
COP—Certificate of Participation. |
CP—Commercial Paper. |
FR—Floating Rate. |
GAN—Grant Anticipation Note. |
GO—General Obligation Bond. |
IDA—Industrial Development Authority Bond. |
IDR—Industrial Development Revenue Bond. |
PCR—Pollution Control Revenue Bond. |
PUT—Put Option Obligation. |
RAN—Revenue Anticipation Note. |
TAN—Tax Anticipation Note. |
TOB—Tender Option Bond. |
TRAN—Tax Revenue Anticipation Note. |
UFSD—Union Free School District. |
USD—United School District. |
VRDO—Variable Rate Demand Obligation. |
(ETM)—Escrowed to Maturity. |
(Prere.)—Prerefunded. |
Scheduled principal and interest payments are guaranteed by: |
(1) MBIA (Municipal Bond Insurance Association). |
(2) AMBAC (Ambac Assurance Corporation). |
(3) FGIC (Financial Guaranty Insurance Company). |
(4) FSA (Financial Security Assurance). |
(5) BIGI (Bond Investors Guaranty Insurance). |
(6) Connie Lee Inc. |
(7) FHA (Federal Housing Authority). |
(8) CapMAC (Capital Markets Assurance Corporation). |
(9) American Capital Access Financial Guaranty Corporation. |
(10) XL Capital Assurance Inc. |
(11) CIFG (CDC IXIS Financial Guaranty). |
(12) Assured Guaranty Corp. |
(13) National Indemnity Co. (Berkshire Hathaway). |
The insurance does not guarantee the market value of the municipal bonds. |
LOC—Scheduled principal and interest payments are guaranteed by bank letter of credit.
18
Ohio Tax-Exempt Money Market Fund
Statement of Operations
| Year Ended |
| November 30, 2008 |
| ($000) |
Investment Income | |
Income | |
Interest | 28,198 |
Total Income | 28,198 |
Expenses | |
The Vanguard Group—Note B | |
Investment Advisory Services | 108 |
Management and Administrative | 703 |
Marketing and Distribution | 303 |
Money Market Guarantee Program | 91 |
Custodian Fees | 7 |
Auditing Fees | 18 |
Shareholders’ Reports | 6 |
Trustees’ Fees and Expenses | 1 |
Total Expenses | 1,237 |
Net Investment Income | 26,961 |
Realized Net Gain (Loss) on Investment Securities Sold | (21) |
Change in Unrealized Appreciation (Depreciation) of Investment Securities | — |
Net Increase (Decrease) in Net Assets Resulting from Operations | 26,940 |
See accompanying Notes, which are an integral part of the Financial Statements.
19
Ohio Tax-Exempt Money Market Fund
Statement of Changes in Net Assets
| Year Ended November 30, |
| 2008 | 2007 |
| ($000) | ($000) |
Increase (Decrease) in Net Assets | | |
Operations | | |
Net Investment Income | 26,961 | 38,350 |
Realized Net Gain (Loss) | (21) | 109 |
Change in Unrealized Appreciation (Depreciation) | — | — |
Net Increase (Decrease) in Net Assets Resulting from Operations | 26,940 | 38,459 |
Distributions | | |
Net Investment Income | (26,961) | (38,350) |
Realized Capital Gain | — | — |
Total Distributions | (26,961) | (38,350) |
Capital Share Transactions (at $1.00) | | |
Issued | 974,567 | 974,813 |
Issued in Lieu of Cash Distributions | 25,163 | 35,571 |
Redeemed | (1,072,018) | (878,352) |
Net Increase (Decrease) from Capital Share Transactions | (72,288) | 132,032 |
Total Increase (Decrease) | (72,309) | 132,141 |
Net Assets | | |
Beginning of Period | 1,168,429 | 1,036,288 |
End of Period | 1,096,120 | 1,168,429 |
See accompanying Notes, which are an integral part of the Financial Statements.
20
Ohio Tax-Exempt Money Market Fund
Financial Highlights
For a Share Outstanding | Year Ended November 30, |
Throughout Each Period | 2008 | 2007 | 2006 | 2005 | 2004 |
Net Asset Value, Beginning of Period | $1.00 | $1.00 | $1.00 | $1.00 | $1.00 |
Investment Operations | | | | | |
Net Investment Income | .024 | .036 | .033 | .022 | .011 |
Net Realized and Unrealized Gain (Loss) | | | | | |
on Investments | — | — | — | — | — |
Total from Investment Operations | .024 | .036 | .033 | .022 | .011 |
Distributions | | | | | |
Dividends from Net Investment Income | (.024) | (.036) | (.033) | (.022) | (.011) |
Distributions from Realized Capital Gains | — | — | — | — | — |
Total Distributions | (.024) | (.036) | (.033) | (.022) | (.011) |
Net Asset Value, End of Period | $1.00 | $1.00 | $1.00 | $1.00 | $1.00 |
| | | | | |
Total Return1 | 2.40% | 3.63% | 3.30% | 2.21% | 1.06% |
| | | | | |
Ratios/Supplemental Data | | | | | |
Net Assets, End of Period (Millions) | $1,096 | $1,168 | $1,036 | $910 | $798 |
Ratio of Total Expenses to | | | | | |
Average Net Assets | 0.11% | 0.10% | 0.13% | 0.13% | 0.13% |
Ratio of Net Investment Income to | | | | | |
Average Net Assets | 2.38% | 3.57% | 3.26% | 2.19% | 1.06% |
1 Total returns do not include the account service fee that may be applicable to certain accounts with balances below $10,000.
See accompanying Notes, which are an integral part of the Financial Statements.
21
Ohio Tax-Exempt Money Market Fund
Notes to Financial Statements
Vanguard Ohio Tax-Exempt Money Market Fund is registered under the Investment Company Act of 1940 as an open-end investment company, or mutual fund. The fund invests in debt instruments of municipal issuers whose ability to meet their obligations may be affected by economic and political developments in the state of Ohio.
A. The following significant accounting policies conform to generally accepted accounting principles for U.S. mutual funds. The fund consistently follows such policies in preparing its financial statements.
1. Security Valuation: Securities are valued at amortized cost, which approximates market value.
2 Federal Income Taxes: The fund intends to continue to qualify as a regulated investment company and distribute all of its income. Management has analyzed the fund’s tax positions taken on federal income tax returns for all open tax years (tax years ended November 30, 2005–2008), and has concluded that no provision for federal income tax is required in the fund’s financial statements.
3. Distributions: Dividends from net investment income are declared daily and paid on the first business day of the following month.
4. Other: Interest income is accrued daily. Premiums and discounts on debt securities purchased are amortized and accreted, respectively, to interest income over the lives of the respective securities. Security transactions are accounted for on the date securities are bought or sold. Costs used to determine realized gains (losses) on the sale of investment securities are those of the specific securities sold.
B. The Vanguard Group furnishes at cost investment advisory, corporate management, administrative, marketing, and distribution services. The costs of such services are allocated to the fund under methods approved by the board of trustees. The fund has committed to provide up to 0.40% of its net assets in capital contributions to Vanguard. At November 30, 2008, the fund had contributed capital of $117,000 to Vanguard (included in Other Assets), representing 0.01% of the fund’s net assets and 0.12% of Vanguard’s capitalization. The fund’s trustees and officers are also directors and officers of Vanguard.
C. In September 2006, the Financial Accounting Standards Board issued Statement of Financial Accounting Standards No. 157 (“FAS 157”), “Fair Value Measurements.” FAS 157 establishes a framework for measuring fair value and expands disclosures about fair value measurements in financial statements.
The various inputs that may be used to determine the value of the fund’s investments are summarized in three broad levels. The inputs or methodologies used for valuing securities are not necessarily an indication of the risk associated with investing in those securities.
Level 1—Quoted prices in active markets for identical securities.
Level 2—Other significant observable inputs (including quoted prices for similar securities, interest rates, prepayment speeds, credit risk, etc.).
Level 3—Significant unobservable inputs (including the fund’s own assumptions used to determine the fair value of investments).
22
Ohio Tax-Exempt Money Market Fund
At November 30, 2008, 100% of the fund’s investments were valued using amortized cost, in accordance with rules under the Investment Company Act of 1940. Amortized cost approximates the current fair value of a security, but since the value is not obtained from a quoted price in an active market, securities valued at amortized cost are considered to be valued using Level 2 inputs.
D. On October 7, 2008, the board of trustees approved the fund’s participation in a temporary program introduced by the U.S. Treasury to guarantee the account values of shareholders in a money market fund in the event the fund’s net asset value falls below $0.995 and the fund’s trustees decide to liquidate the fund. The program covers the lesser of a shareholder’s account value on September 19, 2008, or on the date of liquidation. To participate, the fund is required to pay a fee of 0.01% of its net assets as of September 19, 2008, for coverage that lasts until December 18, 2008. The fund is accruing this expense over the period October 7–December 18, 2008. Through November 30, 2008, the fund has accrued $91,000, resulting in a 0.01% increase in the fund’s expense ratio for the year ended November 30, 2008. In December 2008, the U.S. Treasury extended the program through April 30, 2009, and the fund’s trustees approved the fund’s continuing participation in the program. To continue coverage for the period December 19, 2008–April 30, 2009, the fund will be required to pay an additional 0.015% of its net assets as of September 19, 2008.
23
Ohio Long-Term Tax-Exempt Fund
Fund Profile
As of November 30, 2008
Financial Attributes | | | |
| | Comparative | Broad |
| Fund | Index1 | Index2 |
Number of Issues | 254 | 7,629 | 44,181 |
Yield3 | 4.4% | 4.8% | 4.7% |
Yield to Maturity | 4.6%4 | 4.8% | 4.7% |
Average Coupon | 4.9% | 5.0% | 5.0% |
Average Effective | | | |
Maturity | 12.5 years | 9.9 years | 12.8 years |
Average Quality | AA | AA | AA |
Average Duration | 7.0 years | 7.6 years | 8.1 years |
Expense Ratio | | | |
(11/30/2007)5 | 0.13% | — | — |
Short-Term Reserves | 5.2% | — | — |
Volatility Measures6 | |
| Fund Versus | Fund Versus |
| Comparative Index1 | Broad Index2 |
R-Squared | 0.94 | 0.99 |
Beta | 1.02 | 0.98 |
Distribution by Maturity (% of portfolio) | |
| |
Under 1 Year | 5.9% |
1–5 Years | 25.3 |
5–10 Years | 16.6 |
10–20 Years | 23.8 |
20–30 Years | 24.1 |
Over 30 Years | 4.3 |
Distribution by Credit Quality (% of portfolio) |
| |
AAA | 25.5% |
AA | 50.3 |
A | 20.1 |
BBB | 3.4 |
Other | 0.7 |
Investment Focus

1 Barclays Capital 10 Year Municipal Bond Index.
2 Barclays Capital Municipal Bond Index.
3 30-day SEC yield for the fund; index yield assumes that all bonds are called or prepaid at the earliest possible dates. See the Glossary.
4 Before expenses.
5 Expense ratio shown is from the prospectus dated March 28, 2008. For the fiscal year ended November 30, 2008, the expense ratio was 0.13%.
6 For an explanation of R-squared, beta, and other terms used here, see the Glossary.
24
Ohio Long-Term Tax-Exempt Fund
Performance Summary
All of the returns in this report represent past performance, which is not a guarantee of future results that may be achieved by the fund. (Current performance may be lower or higher than the performance data cited. For performance data current to the most recent month-end, visit our website at www.vanguard.com/performance.) Note, too, that both investment returns and principal value can fluctuate widely, so an investor’s shares, when sold, could be worth more or less than their original cost. The returns shown do not reflect taxes that a shareholder would pay on fund distributions or on the sale of fund shares.
Cumulative Performance: November 30, 1998–November 30, 2008
Initial Investment of $10,000
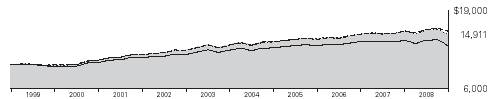
| Average Annual Total Returns | Final Value |
| Periods Ended November 30, 2008 | of a $10,000 |
| One Year | Five Years | Ten Years | Investment |
Ohio Long-Term Tax-Exempt Fund1 | –3.61% | 2.34% | 4.08% | $14,911 |
Barclays Capital Municipal Bond Index | –3.61 | 2.58 | 4.13 | 14,991 |
Barclays Capital 10 Year Municipal Bond Index | –0.42 | 3.24 | 4.49 | 15,510 |
Average Ohio Municipal Debt Fund2 | –6.60 | 1.12 | 2.72 | 13,082 |
1 Total returns do not include the account service fee that may be applicable to certain accounts with balances below $10,000.
2 Derived from data provided by Lipper Inc.
25
Ohio Long-Term Tax-Exempt Fund
Fiscal-Year Total Returns (%): November 30, 1998–November 30, 2008 |
| | | | Barclays1 |
Fiscal | Capital | Income | Total | Total |
Year | Return | Return | Return | Return |
1999 | –6.9% | 4.8% | –2.1% | –0.4% |
2000 | 3.2 | 5.6 | 8.8 | 7.7 |
2001 | 3.7 | 5.2 | 8.9 | 8.2 |
2002 | 1.8 | 4.9 | 6.7 | 6.7 |
2003 | 2.8 | 4.6 | 7.4 | 6.9 |
2004 | –1.0 | 4.5 | 3.5 | 4.0 |
2005 | –1.2 | 4.4 | 3.2 | 3.0 |
2006 | 1.6 | 4.5 | 6.1 | 6.2 |
2007 | –1.6 | 4.3 | 2.7 | 3.5 |
2008 | –7.7 | 4.1 | –3.6 | –0.4 |
Average Annual Total Returns: Periods Ended September 30, 2008
This table presents average annual total returns through the latest calendar quarter—rather than through the end of the fiscal period. Securities and Exchange Commission rules require that we provide this information.
| | | | | | Ten Years |
| Inception Date | One Year | Five Years | Capital | Income | Total |
Ohio Long-Term Tax-Exempt Fund2 | 6/18/1990 | –1.50% | 2.60% | –0.50% | 4.68% | 4.18% |
1 Barclays Capital 10 Year Municipal Bond Index.
2 Total returns do not include the account service fee that may be applicable to certain accounts with balances below $10,000.
Note: See Financial Highlights table for dividend and capital gains information.
26
Ohio Long-Term Tax-Exempt Fund
Financial Statements
Statement of Net Assets
As of November 30, 2008
The fund provides a complete list of its holdings four times in each fiscal year, at the quarter-ends. For the second and fourth fiscal quarters, the lists appear in the fund’s semiannual and annual reports to shareholders. For the first and third fiscal quarters, the fund files the lists with the Securities and Exchange Commission on Form N-Q. Shareholders can look up the fund’s Forms N-Q on the SEC’s website at www.sec.gov. Forms N-Q may also be reviewed and copied at the SEC’s Public Reference Room (see the back cover of this report for further information).
| | | Face | Market |
| | Maturity | Amount | Value• |
| Coupon | Date | ($000) | ($000) |
Tax-Exempt Municipal Bonds (98.7%) | | | | |
Ohio (96.0%) | | | | |
Adams County OH School Dist. GO | 5.550% | 12/1/09 (1) | 1,000 | 1,003 |
Akron OH GO | 5.500% | 12/1/18 (1) | 1,315 | 1,383 |
Akron OH Income Tax Rev. | | | | |
(Community Learning Center) | 5.000% | 12/1/27 (1) | 6,300 | 5,960 |
Allen County OH Hosp. Fac. Rev. | | | | |
(Catholic Healthcare) VRDO | 0.900% | 12/1/08 LOC | 8,100 | 8,100 |
Allen County OH Hosp. Fac. Rev. | | | | |
(Catholic Healthcare) VRDO | 1.400% | 12/1/08 LOC | 9,500 | 9,500 |
American Muni. Power Ohio Inc. | 5.000% | 2/15/38 | 16,385 | 14,219 |
American Muni. Power Ohio Inc. (Omega JV) | 5.250% | 1/1/14 (2) | 2,625 | 2,715 |
American Muni. Power Ohio Inc. (Omega JV) | 5.250% | 1/1/15 (2) | 2,865 | 2,963 |
American Muni. Power Ohio Inc. (Omega JV) | 5.250% | 1/1/16 (2) | 1,015 | 1,050 |
American Muni. Power Ohio Inc. Electricity | | | | |
Purchase Rev. | 5.000% | 2/1/13 | 3,000 | 2,709 |
Amherst OH Exempt Village School Dist. GO | 5.750% | 12/1/11 (3)(Prere.) | 1,300 | 1,433 |
Amherst OH Exempt Village School Dist. GO | 5.750% | 12/1/11 (3)(Prere.) | 1,300 | 1,433 |
Avon OH Local School Dist. GO | 5.250% | 12/1/13 (1)(Prere.) | 2,400 | 2,683 |
Bowling Green State Univ. Ohio General | | | | |
Receipts Rev. | 5.750% | 6/1/10 (3)(Prere.) | 2,250 | 2,405 |
Bowling Green State Univ. Ohio General | | | | |
Receipts Rev. | 5.750% | 6/1/10 (3)(Prere.) | 1,190 | 1,272 |
Buckeye OH Tobacco Settlement Financing | | | | |
Corp. Rev. | 5.125% | 6/1/24 | 8,180 | 5,966 |
Buckeye OH Tobacco Settlement Financing | | | | |
Corp. Rev. | 5.750% | 6/1/34 | 2,500 | 1,589 |
Buckeye OH Tobacco Settlement Financing | | | | |
Corp. Rev. | 6.500% | 6/1/47 | 7,750 | 5,287 |
Butler County OH GO | 5.250% | 12/1/12 (Prere.) | 1,570 | 1,744 |
Butler County OH GO | 5.250% | 12/1/12 (Prere.) | 1,655 | 1,839 |
Butler County OH Hosp. Fac. Rev. | | | | |
(Cincinnati Children’s Hosp.) | 5.000% | 5/15/31 (1) | 5,000 | 3,779 |
Butler County OH Sewer System Rev. | 5.375% | 12/1/09 (3)(Prere.) | 1,230 | 1,294 |
Butler County OH Waterworks Rev. | 5.250% | 12/1/21 (2) | 4,000 | 4,057 |
Canal Winchester OH Local School Dist. GO | 5.500% | 12/1/11 (3)(Prere.) | 805 | 879 |
Canal Winchester OH Local School Dist. GO | 5.500% | 12/1/11 (3)(Prere.) | 1,080 | 1,179 |
Canal Winchester OH Local School Dist. GO | 5.500% | 12/1/11 (3)(Prere.) | 950 | 1,037 |
Canal Winchester OH Local School Dist. GO | 5.000% | 6/1/15 (1)(Prere.) | 3,030 | 3,348 |
Centerville OH City School Dist. GO | 5.000% | 12/1/30 (4) | 9,260 | 8,867 |
Chillicothe OH City School Dist. | 5.250% | 12/1/14 (3)(Prere.) | 1,745 | 1,965 |
27
Ohio Long-Term Tax-Exempt Fund
| | | | Face | Market |
| | | Maturity | Amount | Value• |
| | Coupon | Date | ($000) | ($000) |
| Cincinnati OH City School Dist. Classroom Fac. | | | | |
| Construction & Improvement | 5.250% | 12/1/28 (1) | 4,000 | 3,913 |
| Cincinnati OH City School Dist. GO | 5.375% | 12/1/11 (1)(Prere.) | 3,350 | 3,656 |
| Cincinnati OH City School Dist. Improvement GO | 5.000% | 12/15/32 (4) | 1,000 | 899 |
| Cincinnati OH Econ. Dev. Rev. (Baldwin) | 4.875% | 11/1/38 | 7,870 | 6,801 |
| Cincinnati OH Water System Rev. | 5.500% | 6/1/11 (Prere.) | 1,380 | 1,490 |
| Cincinnati OH Water System Rev. | 5.500% | 6/1/11 (Prere.) | 2,000 | 2,159 |
| Cincinnati OH Water System Rev. | 5.000% | 12/1/23 (1) | 6,000 | 6,017 |
| Cincinnati OH Water System Rev. | 5.000% | 12/1/32 | 4,000 | 3,771 |
| Cleveland OH Airport System Rev. | 5.000% | 1/1/31 (4) | 7,575 | 6,604 |
| Cleveland OH GO | 5.375% | 9/1/10 (2) | 1,000 | 1,041 |
| Cleveland OH GO | 5.500% | 12/1/10 (3)(Prere.) | 1,415 | 1,529 |
| Cleveland OH GO | 5.500% | 12/1/10 (3)(Prere.) | 1,135 | 1,226 |
| Cleveland OH GO | 5.500% | 12/1/11 (1) | 1,340 | 1,420 |
| Cleveland OH GO | 5.375% | 9/1/12 (2) | 1,000 | 1,057 |
| Cleveland OH GO | 5.250% | 8/1/13 (3)(Prere.) | 2,400 | 2,669 |
| Cleveland OH GO | 5.500% | 10/1/20 (2) | 7,350 | 7,853 |
| Cleveland OH GO | 5.000% | 10/1/21 (2) | 2,920 | 2,945 |
| Cleveland OH GO | 5.500% | 10/1/22 (2) | 3,870 | 4,087 |
| Cleveland OH Income Tax Rev. | 5.000% | 10/1/29 (12) | 7,180 | 6,670 |
| Cleveland OH Public Power System Rev. | 5.000% | 11/15/28 (1) | 1,250 | 1,123 |
| Cleveland OH Public Power System Rev. | 0.000% | 11/15/33 (1) | 6,895 | 1,366 |
| Cleveland OH School Dist. GO | 0.000% | 12/1/08 (3)(ETM) | 400 | 400 |
| Cleveland OH State Univ. Rev. | 5.250% | 6/1/19 (1) | 2,825 | 2,886 |
| Cleveland OH State Univ. Rev. | 5.000% | 6/1/30 (1) | 5,000 | 4,378 |
| Cleveland OH Water Works Rev. | 5.500% | 1/1/21 (1) | 9,635 | 9,484 |
1 | Columbus OH City School Dist. School Fac. | | | | |
| Construction & Improvement GO | 5.250% | 12/1/14 (4)(Prere.) | 2,390 | 2,691 |
| Columbus OH City School Dist. School Fac. | | | | |
| Construction & Improvement GO | 5.250% | 12/1/14 (4)(Prere.) | 2,070 | 2,331 |
| Columbus OH GO | 5.000% | 12/15/13 | 5,000 | 5,466 |
| Columbus OH GO | 5.000% | 9/1/16 | 9,225 | 10,094 |
| Columbus OH Sewer Rev. | 5.000% | 6/1/28 | 4,005 | 3,874 |
| Columbus OH Sewer Rev. | 4.500% | 6/1/29 | 8,000 | 6,928 |
| Columbus OH Sewer Rev. | 4.250% | 6/1/30 | 1,740 | 1,413 |
| Columbus OH Sewer Rev. | 5.000% | 6/1/31 | 4,000 | 3,793 |
| Cuyahoga County OH (Capital Improvement) GO | 5.750% | 12/1/10 (Prere.) | 2,000 | 2,152 |
| Cuyahoga County OH (Capital Improvement) GO | 5.750% | 12/1/10 (Prere.) | 2,000 | 2,152 |
| Cuyahoga County OH (Capital Improvement) GO | 5.750% | 12/1/10 (Prere.) | 1,710 | 1,840 |
| Cuyahoga County OH (Capital Improvement) GO | 5.750% | 12/1/10 (Prere.) | 2,000 | 2,152 |
| Cuyahoga County OH Hosp. Rev. (Cleveland | | | | |
| Clinic Foundation) | 6.000% | 1/1/32 | 10,000 | 9,417 |
| Defiance OH Waterworks System GO | 5.650% | 12/1/08 (2)(Prere.) | 1,130 | 1,153 |
| Erie County OH Hosp. Fac. Rev. (Firelands | | | | |
| Regional Medical Center) | 5.500% | 8/15/22 | 1,750 | 1,545 |
| Erie County OH Hosp. Fac. Rev. (Firelands | | | | |
| Regional Medical Center) | 5.250% | 8/15/46 | 11,080 | 7,799 |
| Fairborn OH City School Dist. School | | | | |
| Improvement GO | 5.500% | 12/1/16 (1) | 1,840 | 1,944 |
| Fairborn OH City School Dist. School | | | | |
| Improvement GO | 5.375% | 12/1/20 (1) | 1,200 | 1,222 |
| Fairfield County OH Hosp. Rev. (Lancaster- | | | | |
| Fairfield Hosp.) | 5.375% | 6/15/15 (1) | 3,000 | 3,167 |
| Franklin County OH GO | 5.000% | 12/1/31 | 7,500 | 7,251 |
| Franklin County OH Hosp. Rev. (Nationwide | | | | |
| Childrens) | 4.750% | 11/1/28 | 1,500 | 1,215 |
28
Ohio Long-Term Tax-Exempt Fund
| | | Face | Market |
| | Maturity | Amount | Value• |
| Coupon | Date | ($000) | ($000) |
Franklin County OH Hosp. Rev. (Trinity Health | | | | |
Credit Group) | 5.000% | 6/1/19 | 4,035 | 3,857 |
Franklin County OH Hosp. Rev. (Trinity Health | | | | |
Credit Group) | 5.000% | 6/1/21 | 4,465 | 4,112 |
Gallia County OH Hosp. Rev. (Holzer | | | | |
Medical Center) | 5.125% | 10/1/13 (2) | 2,000 | 1,943 |
Gallia County OH Local School Dist. | 5.000% | 12/1/26 (4) | 2,075 | 2,048 |
Gallia County OH Local School Dist. | 5.000% | 12/1/27 (4) | 2,180 | 2,141 |
Gallia County OH Local School Dist. | 5.000% | 12/1/30 (4) | 5,000 | 4,788 |
Gallia County OH Local School Dist. | 5.000% | 12/1/33 (4) | 5,000 | 4,714 |
Gallipolis Ohio City School Dist. (School Fac.) | 5.000% | 12/1/30 (1) | 4,040 | 3,669 |
Garfield Heights OH City School Dist. School | | | | |
Improvement GO | 5.500% | 12/15/11 (1)(Prere.) | 1,640 | 1,797 |
Greater Cleveland OH Regional Transp. Auth. GO | 5.375% | 12/1/08 (3)(Prere.) | 1,665 | 1,682 |
Greene County OH Sewer System Rev. | 5.000% | 12/1/22 (4) | 4,470 | 4,267 |
Greene County OH Sewer System Rev. | 5.000% | 12/1/23 (4) | 4,695 | 4,444 |
Greene County OH Sewer System Rev. | 5.000% | 12/1/24 (4) | 5,050 | 4,732 |
Greene County OH Sewer System Rev. | 5.000% | 12/1/25 (4) | 5,000 | 4,648 |
Hamilton County OH Convention Center Fac. | | | | |
Auth. Rev. Second Lien | 5.250% | 6/1/14 (3)(Prere.) | 1,270 | 1,419 |
Hamilton County OH Convention Center Fac. | | | | |
Auth. Rev. Second Lien | 5.250% | 12/1/20 (1) | 1,185 | 1,215 |
Hamilton County OH Convention Center Fac. | | | | |
Auth. Rev. Second Lien | 5.250% | 12/1/21 (1) | 1,245 | 1,268 |
Hamilton County OH Convention Center Fac. | | | | |
Auth. Rev. Second Lien | 5.250% | 12/1/23 (1) | 1,380 | 1,389 |
Hamilton County OH Convention Center Fac. | | | | |
Auth. Rev. Second Lien | 5.250% | 12/1/24 (3) | 185 | 186 |
Hamilton County OH Econ. Dev. Rev. (King | | | | |
Highland Community Urban) | 5.250% | 6/1/28 (1) | 7,290 | 6,890 |
Hamilton County OH Hosp. Fac. Rev. | | | | |
(Cincinnati Children’s Hosp.) | 5.200% | 5/15/09 (1) | 695 | 703 |
Hamilton County OH Hosp. Fac. Rev. | | | | |
(Cincinnati Children’s Hosp.) | 5.500% | 5/15/19 (1) | 2,865 | 2,827 |
Hamilton County OH Hosp. Fac. Rev. | | | | |
(Cincinnati Children’s Hosp.) | 5.500% | 5/15/20 (1) | 3,020 | 2,921 |
Hamilton County OH Sales Tax Rev. | 5.000% | 12/1/25 (2) | 5,000 | 4,285 |
Hamilton County OH Sales Tax Rev. | 5.000% | 12/1/26 (2) | 5,000 | 4,244 |
Hamilton County OH Sales Tax Rev. | 5.000% | 12/1/32 (4) | 5,000 | 4,551 |
Hamilton County OH Sewer System Rev. | 5.450% | 12/1/09 (1) | 3,250 | 3,346 |
Hamilton County OH Sewer System Rev. | 5.625% | 6/1/10 (1)(Prere.) | 965 | 1,030 |
Hamilton County OH Sewer System Rev. | 5.625% | 6/1/10 (1)(Prere.) | 755 | 805 |
Hamilton County OH Sewer System Rev. | 5.250% | 12/1/11 (1)(Prere.) | 1,355 | 1,474 |
Hamilton County OH Sewer System Rev. | 5.250% | 12/1/11 (1)(Prere.) | 1,000 | 1,088 |
Hamilton County OH Sewer System Rev. | 5.000% | 12/1/31 (1) | 5,300 | 4,859 |
Hamilton OH City School Dist. GO | 5.000% | 12/1/26 (4) | 3,070 | 3,031 |
Hamilton OH City School Dist. GO | 5.000% | 12/1/28 (4) | 5,000 | 4,858 |
Hamilton OH City School Dist. GO | 5.000% | 12/1/34 (4) | 2,250 | 2,110 |
Highland OH Local School Dist. | | | | |
School Improvement GO | 5.750% | 12/1/11 (4)(Prere.) | 1,510 | 1,664 |
Hilliard OH School Dist. GO | 0.000% | 12/1/12 (1) | 3,220 | 2,777 |
Hilliard OH School Dist. GO | 0.000% | 12/1/13 (1) | 3,220 | 2,647 |
Hilliard OH School Dist. GO | 0.000% | 12/1/14 (1) | 2,720 | 2,126 |
Hilliard OH School Dist. GO | 0.000% | 12/1/15 (1) | 3,720 | 2,757 |
Hilliard OH School Dist. GO | 5.250% | 12/1/16 (1) | 2,000 | 2,119 |
Hilliard OH School Dist. GO | 5.000% | 12/1/27 (1) | 2,895 | 2,768 |
29
Ohio Long-Term Tax-Exempt Fund
| | | Face | Market |
| | Maturity | Amount | Value• |
| Coupon | Date | ($000) | ($000) |
Huron County OH Hosp. Fac. Rev. | | | | |
(Fisher-Titus Medical Center) | 5.250% | 12/1/37 | 4,825 | 3,758 |
Indian Hill OH Exempt Village School | | | | |
Dist. Hamilton County GO | 5.500% | 12/1/11 (Prere.) | 1,295 | 1,418 |
Jackson OH Local School Dist. Stark & Summit | | | | |
Counties Construction & Improvement | 5.250% | 6/1/14 (3)(Prere.) | 4,350 | 4,861 |
Lake Ohio Local School Dist. Stark County OH GO | 5.750% | 12/1/10 (3)(Prere.) | 1,000 | 1,076 |
Logan Hocking OH Local School Dist. GO | 5.500% | 12/1/11 (1)(Prere.) | 1,675 | 1,834 |
Lorain County OH GO | 5.500% | 12/1/22 (1) | 1,500 | 1,523 |
Lorain County OH Hosp. Fac. Rev. | | | | |
(Catholic Healthcare Partners) | 5.000% | 4/1/15 (4) | 5,200 | 5,435 |
Lorain County OH Hosp. Fac. Rev. | | | | |
(Catholic Healthcare Partners) | 5.400% | 10/1/21 | 4,000 | 3,819 |
Lorain County OH Hosp. Fac. Rev. | | | | |
(Catholic Healthcare Partners) | 5.000% | 4/1/33 (4) | 5,000 | 4,416 |
Lucas County OH Hosp. Rev. | 5.000% | 11/15/38 | 5,000 | 3,956 |
Lucas County OH Hosp. Rev. | | | | |
(ProMedica Health Care) | 5.750% | 11/15/14 (1) | 640 | 640 |
Lucas County OH Hosp. Rev. | | | | |
(ProMedica Health Care) | 5.750% | 11/15/14 (1)(ETM) | 5,360 | 5,375 |
Lucas County OH Hosp. Rev. | | | | |
(ProMedica Health Care) | 5.625% | 11/15/15 (2) | 2,500 | 2,530 |
Lucas County OH Hosp. Rev. | | | | |
(ProMedica Health Care) | 5.625% | 11/15/17 (2) | 2,075 | 2,072 |
Mad River OH Local School Dist. GO | 5.750% | 12/1/12 (3)(Prere.) | 1,195 | 1,340 |
Marysville OH Exempt Village School Dist. COP | 5.250% | 6/1/15 (1)(Prere.) | 2,095 | 2,360 |
Marysville OH Exempt Village School Dist. COP | 5.250% | 6/1/15 (1)(Prere.) | 2,140 | 2,411 |
Marysville OH Exempt Village School Dist. COP | 5.250% | 6/1/15 (1)(Prere.) | 3,000 | 3,379 |
Marysville OH Exempt Village School Dist. COP | 5.250% | 6/1/15 (1)(Prere.) | 2,035 | 2,292 |
Marysville OH WasteWater Treatment | | | | |
System Rev. | 5.000% | 12/1/31 (10) | 2,720 | 2,173 |
Mason OH City School Dist. School | | | | |
Improvement GO | 5.000% | 12/1/35 | 2,000 | 1,860 |
Medina OH School Dist. COP | 5.250% | 12/1/37 (12) | 7,210 | 6,666 |
Miami Univ. of Ohio General Receipts Refunding | 5.250% | 12/1/20 (2) | 2,000 | 2,025 |
Middletown OH City School Dist. GO | 5.000% | 12/1/23 (4) | 5,345 | 5,279 |
Milford OH Exempt Village School Dist. | | | | |
School Improvement GO | 6.000% | 12/1/11 (4)(Prere.) | 1,425 | 1,581 |
Milford OH Exempt Village School Dist. | | | | |
School Improvement GO | 6.000% | 12/1/11 (4)(Prere.) | 1,600 | 1,775 |
Montgomery County OH Rev. | | | | |
(Catholic Health Initiatives) | 5.500% | 9/1/11 (Prere.) | 3,270 | 3,556 |
Montgomery County OH Rev. | | | | |
(Catholic Health Initiatives) | 5.000% | 5/1/30 | 7,630 | 6,233 |
Montgomery County OH Rev. | | | | |
(Catholic Health Initiatives) | 5.000% | 10/1/41 (4) | 5,000 | 4,318 |
New Albany Plain OH Local School Dist. GO | 5.500% | 6/1/12 (3)(Prere.) | 500 | 551 |
New Albany Plain OH Local School Dist. GO | 5.500% | 12/1/17 (3) | 675 | 716 |
Nordonia Hills OH Local School Dist. GO | 0.000% | 12/1/11 (2) | 1,200 | 1,083 |
Nordonia Hills OH Local School Dist. GO | 0.000% | 12/1/12 (2) | 1,700 | 1,458 |
North Olmsted OH GO (Library Improvement) | 5.500% | 12/1/10 (3)(Prere.) | 1,355 | 1,451 |
Oak Hills OH Local School Dist. GO | 7.200% | 12/1/09 (1) | 510 | 518 |
Ohio Building Auth. Rev. | | | | |
(Adult Correctional Building) | 5.000% | 10/1/11 (1) | 5,000 | 5,298 |
Ohio Building Auth. Rev. (State Fac. Art Building) | 5.500% | 4/1/11 (Prere.) | 1,500 | 1,615 |
Ohio Building Auth. Rev. (State Fac. Art Building) | 5.500% | 4/1/11 (Prere.) | 1,585 | 1,706 |
30
Ohio Long-Term Tax-Exempt Fund
| | | | Face | Market |
| | | Maturity | Amount | Value• |
| | Coupon | Date | ($000) | ($000) |
| Ohio Building Auth. Rev. (State Fac. Highway | | | | |
| Safety Building Fund) | 5.500% | 10/1/17 (4) | 1,305 | 1,385 |
| Ohio Building Auth. Rev. (State Fac. Highway | | | | |
| Safety Building Fund) | 5.500% | 10/1/18 (4) | 1,380 | 1,447 |
| Ohio GO | 5.000% | 9/15/11 | 5,715 | 6,094 |
| Ohio GO | 5.500% | 11/1/14 | 4,185 | 4,678 |
| Ohio GO | 4.500% | 9/15/22 (1) | 5,000 | 4,727 |
2 | Ohio GO TOB VRDO | 1.400% | 12/8/08 | 4,835 | 4,835 |
| Ohio Higher Educ. Capital Fac. Rev. | 5.000% | 8/1/11 (2) | 6,110 | 6,462 |
3 | Ohio Higher Educ. Fac. Comm. Rev. | 5.750% | 5/1/28 | 5,000 | 4,662 |
| Ohio Higher Educ. Fac. Comm. Rev. | | | | |
| (Case Western Reserve Univ.) | 5.000% | 12/1/13 (Prere.) | 3,885 | 4,297 |
| Ohio Higher Educ. Fac. Comm. Rev. | | | | |
| (Case Western Reserve Univ.) | 5.250% | 12/1/26 (1) | 3,520 | 3,496 |
| Ohio Higher Educ. Fac. Comm. Rev. | | | | |
| (Case Western Reserve Univ.) | 5.000% | 12/1/27 (2) | 2,115 | 1,958 |
| Ohio Higher Educ. Fac. Comm. Rev. | | | | |
| (Case Western Reserve Univ.) VRDO | 1.300% | 12/1/08 | 1,300 | 1,300 |
| Ohio Higher Educ. Fac. Comm. Rev. | | | | |
| (Cleveland Health Clinic) | 5.125% | 1/1/28 | 5,000 | 4,423 |
| Ohio Higher Educ. Fac. Comm. Rev. | | | | |
| (Cleveland Health Clinic) | 5.250% | 1/1/29 | 5,000 | 4,464 |
| Ohio Higher Educ. Fac. Comm. Rev. | | | | |
| (Denison Univ.) | 5.500% | 11/1/11 (Prere.) | 1,000 | 1,102 |
| Ohio Higher Educ. Fac. Comm. Rev. | | | | |
| (Denison Univ.) | 5.000% | 11/1/26 | 5,815 | 5,674 |
| Ohio Higher Educ. Fac. Comm. Rev. | | | | |
| (Denison Univ.) | 5.000% | 11/1/32 | 3,000 | 2,809 |
| Ohio Higher Educ. Fac. Comm. Rev. | | | | |
| (John Carroll Univ.) | 5.850% | 4/1/09 (1)(Prere.) | 2,875 | 2,979 |
| Ohio Higher Educ. Fac. Comm. Rev. | | | | |
| (John Carroll Univ.) | 5.000% | 4/1/32 | 3,415 | 2,818 |
| Ohio Higher Educ. Fac. Comm. Rev. | | | | |
| (Kenyon College) | 5.000% | 7/1/41 | 4,500 | 3,825 |
| Ohio Higher Educ. Fac. Comm. Rev. | | | | |
| (Kenyon College) VRDO | 0.900% | 12/1/08 | 8,600 | 8,600 |
| Ohio Higher Educ. Fac. Comm. Rev. | | | | |
| (Northern Univ.) | 5.000% | 5/1/26 | 5,275 | 4,586 |
| Ohio Higher Educ. Fac. Comm. Rev. | | | | |
| (Oberlin College) | 5.000% | 10/1/33 | 5,000 | 4,663 |
| Ohio Higher Educ. Fac. Comm. Rev. | | | | |
| (Univ. Hospitals Health System) | 5.250% | 1/15/46 | 16,500 | 11,505 |
| Ohio Higher Educ. Fac. Comm. Rev. | | | | |
| (Univ. of Dayton) | 5.375% | 12/1/16 (2) | 1,795 | 1,891 |
| Ohio Highway Capital Improvements Rev. | 5.000% | 5/1/11 | 2,800 | 2,975 |
| Ohio Housing Finance Agency Mortgage Rev. | 5.250% | 9/1/28 | 5,000 | 4,591 |
| Ohio Housing Finance Agency Mortgage Rev. | 6.200% | 9/1/33 | 7,500 | 7,525 |
| Ohio State Univ. General Receipts Rev. | 5.250% | 6/1/23 | 3,000 | 3,023 |
| Ohio Turnpike Comm. Turnpike Rev. | 5.500% | 2/15/18 | 3,150 | 3,273 |
| Ohio Turnpike Comm. Turnpike Rev. | 5.500% | 2/15/19 | 2,235 | 2,322 |
| Ohio Turnpike Comm. Turnpike Rev. | 5.500% | 2/15/20 | 1,570 | 1,622 |
| Ohio Turnpike Comm. Turnpike Rev. | 5.500% | 2/15/24 (1) | 5,000 | 5,209 |
| Ohio Water Dev. Auth. PCR | 5.500% | 6/1/23 | 2,155 | 2,296 |
| Ohio Water Dev. Auth. Rev. (Fresh Water | | | | |
| Improvement) | 5.375% | 6/1/12 (Prere.) | 2,170 | 2,382 |
31
Ohio Long-Term Tax-Exempt Fund
| | | Face | Market |
| | Maturity | Amount | Value• |
| Coupon | Date | ($000) | ($000) |
Ohio Water Dev. Auth. Rev. (Fresh Water | | | | |
Improvement) | 5.375% | 6/1/12 (Prere.) | 2,735 | 3,002 |
Ohio Water Dev. Auth. Rev. (Fresh Water | | | | |
Improvement) | 5.375% | 6/1/12 (Prere.) | 2,100 | 2,305 |
Ohio Water Dev. Auth. Rev. (Fresh Water | | | | |
Improvement) | 5.500% | 12/1/22 | 4,690 | 5,048 |
Ohio Water Dev. Auth. Rev. (Fresh Water | | | | |
Improvement) | 5.500% | 6/1/23 | 1,225 | 1,313 |
Ohio Water Dev. Auth. Rev. (Fresh Water | | | | |
Improvement) | 5.500% | 12/1/23 | 1,115 | 1,197 |
Ohio Water Dev. Auth. Rev. (Pure Water) | 7.000% | 12/1/09 (2)(ETM) | 310 | 318 |
Ohio Water Dev. Auth. Rev. (Pure Water) VRDO | 1.150% | 12/8/08 | 7,460 | 7,460 |
Olentangy OH Local School Dist. GO | 5.500% | 6/1/12 (4)(Prere.) | 1,200 | 1,317 |
Olentangy OH Local School Dist. GO | 5.000% | 6/1/16 (4)(Prere.) | 1,235 | 1,360 |
Olentangy OH Local School Dist. GO | 5.500% | 12/1/16 (4) | 30 | 32 |
Olentangy OH Local School Dist. GO | 5.000% | 12/1/30 (4) | 3,765 | 3,605 |
Olentangy OH Local School Dist. School Fac. | | | | |
Construction & Improvement | 5.250% | 6/1/14 (3)(Prere.) | 1,400 | 1,556 |
Olentangy OH Local School Dist. School Fac. | | | | |
Construction & Improvement | 5.500% | 6/1/14 (3)(Prere.) | 1,300 | 1,461 |
Olentangy OH Local School Dist. School Fac. | | | | |
Construction & Improvement | 5.500% | 6/1/14 (3)(Prere.) | 2,750 | 3,091 |
Reynoldsburg OH School Dist. GO | 0.000% | 12/1/09 (1) | 1,465 | 1,424 |
Reynoldsburg OH School Dist. GO | 0.000% | 12/1/10 (1) | 1,465 | 1,361 |
Richland County OH GO | 6.950% | 12/1/11 (2) | 450 | 452 |
Richland County OH GO | 5.400% | 12/1/15 (2) | 1,120 | 1,123 |
Rocky River OH City School Dist. GO | 5.375% | 12/1/17 | 2,200 | 2,354 |
Ross County OH Hosp. Fac. Rev. | | | | |
(Adena Health System) | 5.750% | 12/1/35 | 3,000 | 2,510 |
Scioto County OH Hosp. Rev. (Southern Ohio | | | | |
Medical Center) | 5.500% | 2/15/28 | 9,000 | 7,502 |
Shawnee State Univ. Ohio General Receipts Rev. | 5.000% | 6/1/34 (1) | 5,470 | 4,346 |
Sugarcreek OH Local School Dist. GO | 5.250% | 12/1/13 (1)(Prere.) | 1,215 | 1,356 |
Summit County OH GO | 6.250% | 12/1/10 (3)(Prere.) | 1,420 | 1,555 |
Summit County OH GO | 6.500% | 12/1/10 (3)(Prere.) | 2,000 | 2,200 |
Summit County OH GO | 5.750% | 12/1/12 (3)(Prere.) | 1,800 | 2,034 |
Summit County OH GO | 5.750% | 12/1/12 (3)(Prere.) | 1,420 | 1,605 |
Summit County OH GO | 5.750% | 12/1/12 (3)(Prere.) | 1,595 | 1,802 |
Summit County OH GO | 5.750% | 12/1/12 (3)(Prere.) | 1,910 | 2,158 |
Summit County OH GO | 5.750% | 12/1/12 (3)(Prere.) | 2,020 | 2,283 |
Summit County OH Sanitary Sewer System | | | | |
Improvement GO | 5.500% | 12/1/11 (3)(Prere.) | 1,015 | 1,121 |
Tallmadge OH City School Dist. | 5.000% | 12/1/28 (4) | 3,030 | 2,869 |
Teays Valley OH Local School Dist. GO | 5.000% | 12/1/27 (1) | 3,040 | 2,949 |
Tri Valley OH Local School Dist. GO | 5.500% | 12/1/16 (1) | 1,255 | 1,354 |
Tri Valley OH Local School Dist. GO | 5.500% | 12/1/19 (1) | 1,785 | 1,875 |
Univ. of Akron OH General Receipts Rev. | 5.500% | 1/1/10 (3)(Prere.) | 2,545 | 2,673 |
Univ. of Akron OH General Receipts Rev. | 5.000% | 1/1/33 (4) | 2,000 | 1,791 |
Univ. of Akron OH General Receipts Rev. | 5.000% | 1/1/38 (4) | 4,000 | 3,517 |
Univ. of Cincinnati OH COP | 5.500% | 6/1/14 (1) | 1,000 | 1,028 |
Univ. of Cincinnati OH General Receipts | 5.750% | 6/1/11 (3)(Prere.) | 1,500 | 1,645 |
Univ. of Cincinnati OH General Receipts | 5.750% | 6/1/11 (3)(Prere.) | 1,285 | 1,410 |
Univ. of Cincinnati OH General Receipts | 5.750% | 6/1/11 (3)(Prere.) | 2,500 | 2,742 |
Univ. of Cincinnati OH General Receipts | 5.375% | 6/1/12 (Prere.) | 2,000 | 2,192 |
Univ. of Cincinnati OH General Receipts | 5.375% | 6/1/12 (Prere.) | 2,595 | 2,845 |
Univ. of Cincinnati OH General Receipts | 5.375% | 6/1/12 (Prere.) | 2,880 | 3,157 |
32
Ohio Long-Term Tax-Exempt Fund
| | | Face | Market |
| | Maturity | Amount | Value• |
| Coupon | Date | ($000) | ($000) |
Univ. of Cincinnati OH General Receipts | 5.000% | 6/1/28 (1) | 5,000 | 4,586 |
Univ. of Toledo OH General Receipts | 5.250% | 6/1/11 (3)(Prere.) | 1,080 | 1,161 |
Westerville OH City School Dist. GO | 5.500% | 6/1/11 (1)(Prere.) | 2,000 | 2,157 |
Westerville OH City School Dist. GO | 5.500% | 6/1/11 (1)(Prere.) | 1,225 | 1,321 |
Woodridge OH School Dist. GO | 6.800% | 12/1/14 (2) | 1,765 | 1,936 |
Wooster OH School Dist. GO | 0.000% | 12/1/09 (4) | 2,195 | 2,146 |
Wooster OH School Dist. GO | 0.000% | 12/1/10 (4) | 2,265 | 2,127 |
Wooster OH School Dist. GO | 0.000% | 12/1/11 (4) | 2,315 | 2,086 |
| | | | |
Puerto Rico (2.4%) | | | | |
Puerto Rico GO | 5.500% | 7/1/20 (1) | 1,600 | 1,466 |
Puerto Rico GO | 5.500% | 7/1/29 | 1,500 | 1,266 |
Puerto Rico GO | 5.000% | 7/1/34 | 740 | 541 |
Puerto Rico Highway & Transp. Auth. Rev. | 5.500% | 7/1/14 (Prere.) | 3,400 | 3,777 |
Puerto Rico Muni. Finance Agency | 5.250% | 8/1/19 (4) | 3,000 | 2,980 |
Puerto Rico Muni. Finance Agency | 5.250% | 8/1/20 (4) | 2,500 | 2,441 |
Puerto Rico Public Buildings Auth. Govt. Fac. Rev. | 5.500% | 7/1/21 (1) | 2,000 | 1,811 |
Puerto Rico Public Finance Corp. | 5.500% | 2/1/12 (Prere.) | 995 | 1,077 |
Puerto Rico Public Finance Corp. | 5.500% | 2/1/12 (Prere.) | 3,005 | 3,254 |
Puerto Rico Public Finance Corp. | 6.000% | 8/1/26 (ETM) | 305 | 339 |
| | | | |
Virgin Islands (0.3%) | | | | |
Virgin Islands Public Finance Auth. Rev. | 5.250% | 10/1/17 | 2,000 | 1,824 |
Total Tax-Exempt Municipal Bonds (Cost $816,054) | | | | 771,749 |
Other Assets and Liabilities (1.3%) | | | | |
Other Assets | | | | 17,673 |
Liabilities | | | | (7,399) |
| | | | 10,274 |
Net Assets (100%) | | | | |
Applicable to 71,380,688 outstanding $.001 par value shares of | | | |
beneficial interest (unlimited authorization) | | | | 782,023 |
Net Asset Value Per Share | | | | $10.96 |
At November 30, 2008, net assets consisted of: | |
| Amount |
| ($000) |
Paid-in Capital | 833,380 |
Undistributed Net Investment Income | — |
Accumulated Net Realized Losses | (6,281) |
Unrealized Appreciation (Depreciation) | |
Investment Securities | (44,305) |
Futures Contracts | (771) |
Net Assets | 782,023 |
• | See Note A in Notes to Financial Statements. |
1 Securities with a value of $1,317,000 have been segregated as initial margin for open futures contracts.
2 Security exempt from registration under Rule 144A of the Securities Act of 1933. Such securities may be sold in transactions exempt from registration, normally to qualified institutional buyers. At November 30, 2008, the value of this security represented 0.6% of net assets.
3 Security purchased on a when-issued or delayed delivery basis for which the fund has not taken delivery as of November 30, 2008. See accompanying Notes, which are an integral part of the Financial Statements.
A key to abbreviations and other references follows the Statement of Net Assets.
33
Ohio Long-Term Tax-Exempt Fund
Key to Abbreviations
ARS—Auction Rate Security. |
BAN—Bond Anticipation Note. |
COP—Certificate of Participation. |
CP—Commercial Paper. |
FR—Floating Rate. |
GAN—Grant Anticipation Note. |
GO—General Obligation Bond. |
IDA—Industrial Development Authority Bond. |
IDR—Industrial Development Revenue Bond. |
PCR—Pollution Control Revenue Bond. |
PUT—Put Option Obligation. |
RAN—Revenue Anticipation Note. |
TAN—Tax Anticipation Note. |
TOB—Tender Option Bond. |
TRAN—Tax Revenue Anticipation Note. |
UFSD—Union Free School District. |
USD—United School District. |
VRDO—Variable Rate Demand Obligation. |
(ETM)—Escrowed to Maturity. |
(Prere.)—Prerefunded. |
Scheduled principal and interest payments are guaranteed by: |
(1) MBIA (Municipal Bond Insurance Association). |
(2) AMBAC (Ambac Assurance Corporation). |
(3) FGIC (Financial Guaranty Insurance Company). |
(4) FSA (Financial Security Assurance). |
(5) BIGI (Bond Investors Guaranty Insurance). |
(6) Connie Lee Inc. |
(7) FHA (Federal Housing Authority). |
(8) CapMAC (Capital Markets Assurance Corporation). |
(9) American Capital Access Financial Guaranty Corporation. |
(10) XL Capital Assurance Inc. |
(11) CIFG (CDC IXIS Financial Guaranty). |
(12) Assured Guaranty Corp. |
(13) National Indemnity Co. (Berkshire Hathaway). |
The insurance does not guarantee the market value of the municipal bonds. |
LOC—Scheduled principal and interest payments are guaranteed by bank letter of credit.
34
Ohio Long-Term Tax-Exempt Fund
Statement of Operations
| Year Ended |
| November 30, 2008 |
| ($000) |
Investment Income | |
Income | |
Interest | 35,073 |
Total Income | 35,073 |
Expenses | |
The Vanguard Group—Note B | |
Investment Advisory Services | 74 |
Management and Administrative | 726 |
Marketing and Distribution | 193 |
Custodian Fees | 8 |
Auditing Fees | 23 |
Shareholders’ Reports | 8 |
Trustees’ Fees and Expenses | 1 |
Total Expenses | 1,033 |
Expenses Paid Indirectly | (15) |
Net Expenses | 1,018 |
Net Investment Income | 34,055 |
Realized Net Gain (Loss) | |
Investment Securities Sold | (1,740) |
Futures Contracts | (1,567) |
Realized Net Gain (Loss) | (3,307) |
Change in Unrealized Appreciation (Depreciation) | |
Investment Securities | (60,738) |
Futures Contracts | (938) |
Change in Unrealized Appreciation (Depreciation) | (61,676) |
Net Increase (Decrease) in Net Assets Resulting from Operations | (30,928) |
See accompanying Notes, which are an integral part of the Financial Statements.
35
Ohio Long-Term Tax-Exempt Fund
Statement of Changes in Net Assets
| Year Ended November 30, |
| 2008 | 2007 |
| ($000) | ($000) |
Increase (Decrease) in Net Assets | | |
Operations | | |
Net Investment Income | 34,055 | 28,322 |
Realized Net Gain (Loss) | (3,307) | (1,788) |
Change in Unrealized Appreciation (Depreciation) | (61,676) | (7,609) |
Net Increase (Decrease) in Net Assets Resulting from Operations | (30,928) | 18,925 |
Distributions | | |
Net Investment Income | (34,055) | (28,322) |
Realized Capital Gain1 | — | (1,798) |
Total Distributions | (34,055) | (30,120) |
Capital Share Transactions | | |
Issued | 261,291 | 213,999 |
Issued in Lieu of Cash Distributions | 24,105 | 21,579 |
Redeemed | (159,236) | (98,407) |
Net Increase (Decrease) from Capital Share Transactions | 126,160 | 137,171 |
Total Increase (Decrease) | 61,177 | 125,976 |
Net Assets | | |
Beginning of Period | 720,846 | 594,870 |
End of Period | 782,023 | 720,846 |
1 Includes fiscal 2008 and 2007 short-term gain distributions totaling $0 and $303,000, respectively. Short-term gain distributions are treated as ordinary income dividends for tax purposes.
See accompanying Notes, which are an integral part of the Financial Statements.
36
Ohio Long-Term Tax-Exempt Fund
Financial Highlights
For a Share Outstanding | Year Ended November 30, |
Throughout Each Period | 2008 | 2007 | 2006 | 2005 | 2004 |
Net Asset Value, Beginning of Period | $11.88 | $12.11 | $12.00 | $12.24 | $12.45 |
Investment Operations | | | | | |
Net Investment Income | .506 | .510 | .521 | .527 | .544 |
Net Realized and Unrealized Gain (Loss) | | | | | |
on Investments | (.920) | (.194) | .191 | (.140) | (.118) |
Total from Investment Operations | (.414) | .316 | .712 | .387 | .426 |
Distributions | | | | | |
Dividends from Net Investment Income | (.506) | (.510) | (.521) | (.527) | (.544) |
Distributions from Realized Capital Gains | — | (.036) | (.081) | (.100) | (.092) |
Total Distributions | (.506) | (.546) | (.602) | (.627) | (.636) |
Net Asset Value, End of Period | $10.96 | $11.88 | $12.11 | $12.00 | $12.24 |
| | | | | |
Total Return1 | –3.61% | 2.71% | 6.13% | 3.20% | 3.51% |
| | | | | |
Ratios/Supplemental Data | | | | | |
Net Assets, End of Period (Millions) | $782 | $721 | $595 | $527 | $499 |
Ratio of Total Expenses to | | | | | |
Average Net Assets | 0.13% | 0.13% | 0.14% | 0.14% | 0.14% |
Ratio of Net Investment Income to | | | | | |
Average Net Assets | 4.36% | 4.30% | 4.37% | 4.32% | 4.42% |
Portfolio Turnover Rate | 23% | 16% | 13% | 22% | 18% |
1 Total returns do not include the account service fee that may be applicable to certain accounts with balances below $10,000.
See accompanying Notes, which are an integral part of the Financial Statements.
37
Ohio Long-Term Tax-Exempt Fund
Notes to Financial Statements
Vanguard Ohio Long-Term Tax-Exempt Fund is registered under the Investment Company Act of 1940 as an open-end investment company, or mutual fund. The fund invests in debt instruments of municipal issuers whose ability to meet their obligations may be affected by economic and political developments in the state of Ohio.
A. The following significant accounting policies conform to generally accepted accounting principles for U.S. mutual funds. The fund consistently follows such policies in preparing its financial statements.
1. Security Valuation: Bonds, and temporary cash investments acquired over 60 days to maturity, are valued using the latest bid prices or using valuations based on a matrix system (which considers such factors as security prices, yields, maturities, and ratings), both as furnished by independent pricing services. Other temporary cash investments are valued at amortized cost, which approximates market value. Securities for which market quotations are not readily available, or whose values have been materially affected by events occurring before the fund’s pricing time but after the close of the securities’ primary markets, are valued by methods deemed by the board of trustees to represent fair value.
2. Futures Contracts: The fund uses futures contracts to invest in fixed income asset classes with greater efficiency and lower cost than is possible through direct investment, to add value when these instruments are attractively priced, or to adjust sensitivity to changes in interest rates. The primary risks associated with the use of futures contracts are imperfect correlation between changes in market values of bonds held by the fund and the prices of futures contracts, and the possibility of an illiquid market.
Futures contracts are valued based upon their quoted daily settlement prices. The aggregate principal amounts of the contracts are not recorded in the Statement of Net Assets. Fluctuations in the value of the contracts are recorded in the Statement of Net Assets as an asset (liability) and in the Statement of Operations as unrealized appreciation (depreciation) until the contracts are closed, when they are recorded as realized futures gains (losses).
3. Federal Income Taxes: The fund intends to continue to qualify as a regulated investment company and distribute all of its income. Management has analyzed the fund’s tax positions taken on federal income tax returns for all open tax years (tax years ended November 30, 2005–2008), and has concluded that no provision for federal income tax is required in the fund’s financial statements.
4. Distributions: Distributions from net investment income are declared daily and paid on the first business day of the following month. Annual distributions from realized capital gains, if any, are recorded on the ex-dividend date.
5. Other: Interest income is accrued daily. Premiums and discounts on debt securities purchased are amortized and accreted, respectively, to interest income over the lives of the respective securities. Security transactions are accounted for on the date securities are bought or sold. Costs used to determine realized gains (losses) on the sale of investment securities are those of the specific securities sold.
B. The Vanguard Group furnishes at cost investment advisory, corporate management, administrative, marketing, and distribution services. The costs of such services are allocated to the fund under methods approved by the board of trustees. The fund has committed to provide up to 0.40% of its net assets in capital contributions to Vanguard. At November 30, 2008, the fund had contributed capital of $82,000 to Vanguard (included in Other Assets), representing 0.01% of the fund’s net assets and 0.08% of Vanguard’s capitalization. The fund’s trustees and officers are also directors and officers of Vanguard.
38
Ohio Long-Term Tax-Exempt Fund
C. The fund’s investment advisor may direct new issue purchases, subject to obtaining the best price and execution, to underwriters who have agreed to rebate or credit to the fund part of the underwriting fees generated. Such rebates or credits are used solely to reduce the fund’s management and administrative expenses. The fund’s custodian bank has also agreed to reduce its fees when the fund maintains cash on deposit in the non-interest-bearing custody account. For the year ended November 30, 2008, these arrangements reduced the fund’s management and administrative expenses by $11,000 and custodian fees by $4,000. The total expense reduction represented an effective annual rate of 0.00% of the fund’s average net assets.
D. Capital gain distributions are determined on a tax basis and may differ from realized capital gains for financial reporting purposes. Differences may be permanent or temporary. Permanent differences are reclassified among capital accounts in the financial statements to reflect their tax character. Temporary differences arise when gains or losses are recognized in different periods for financial statement and tax purposes; these differences will reverse at some time in the future.
For tax purposes, at November 30, 2008, the fund had available realized losses of $6,798,000 to offset future net capital gains of $1,647,000 through November 30, 2015, and $5,151,000 through November 30, 2016.
The fund had realized losses totaling $254,000 through November 30, 2008, which are deferred for tax purposes and reduce the amount of unrealized appreciation on investment securities for tax purposes.
At November 30, 2008, the cost of investment securities for tax purposes was $816,308,000. Net unrealized depreciation of investment securities for tax purposes was $44,559,000, consisting of unrealized gains of $13,613,000 on securities that had risen in value since their purchase and $58,172,000 in unrealized losses on securities that had fallen in value since their purchase.
At November 30, 2008, the aggregate settlement value of open futures contracts expiring in March 2009 and the related unrealized appreciation (depreciation) were:
| | | ($000) |
| Number of | Aggregate | Unrealized |
| Long (Short) | Settlement | Appreciation |
Futures Contracts | Contracts | Value | (Depreciation) |
10-Year U.S. Treasury Note | (163) | 19,718 | (448) |
30-Year U.S. Treasury Bond | (78) | 9,944 | (323) |
Unrealized appreciation (depreciation) on open futures contacts is required to be treated as realized gain (loss) for tax purposes.
E. During the year ended November 30, 2008, the fund purchased $288,969,000 of investment securities and sold $171,790,000 of investment securities, other than temporary cash investments.
39
Ohio Long-Term Tax-Exempt Fund
F. Capital shares issued and redeemed were:
| Year Ended November 30, |
| 2008 | 2007 |
| Shares | Shares |
| (000) | (000) |
Issued | 22,482 | 18,054 |
Issued in Lieu of Cash Distributions | 2,092 | 1,818 |
Redeemed | (13,872) | (8,315) |
Net Increase (Decrease) in Shares Outstanding | 10,702 | 11,557 |
G. In September 2006, the Financial Accounting Standards Board issued Statement of Financial Accounting Standards No. 157 (“FAS 157”), “Fair Value Measurements.” FAS 157 establishes a framework for measuring fair value and expands disclosures about fair value measurements in financial statements.
The various inputs that may be used to determine the value of the fund’s investments are summarized in three broad levels. The inputs or methodologies used for valuing securities are not necessarily an indication of the risk associated with investing in those securities.
Level 1—Quoted prices in active markets for identical securities.
Level 2—Other significant observable inputs (including quoted prices for similar securities, interest rates, prepayment speeds, credit risk, etc.).
Level 3—Significant unobservable inputs (including the fund’s own assumptions used to determine the fair value of investments).
The following table summarizes the fund’s investments as of November 30, 2008, based on the inputs used to value them:
| Investments | Futures |
| in Securities | Contracts |
Valuation Inputs | ($000) | ($000) |
Level 1—Quoted prices | — | (771) |
Level 2—Other significant observable inputs | 771,749 | — |
Level 3—Significant unobservable inputs | — | — |
Total | 771,749 | (771) |
40
Report of Independent Registered Public Accounting Firm
To the Trustees of Vanguard Ohio Tax-Free Funds and the Shareholders of Vanguard Ohio Tax-Exempt Money Market Fund and Vanguard Ohio Long-Term Tax-Exempt Fund:
In our opinion, the accompanying statements of net assets and the related statements of operations and of changes in net assets and the financial highlights present fairly, in all material respects, the financial position of Vanguard Ohio Tax-Exempt Money Market Fund and Vanguard Ohio Long-Term Tax-Exempt Fund (constituting Vanguard Ohio Tax-Free Funds, hereafter referred to as the “Funds”) at November 30, 2008, the results of each of their operations for the year then ended, the changes in each of their net assets for each of the two years in the period then ended and the financial highlights for each of the five years in the period then ended, in conformity with accounting principles generally accepted in the United States of America. These financial statements and financial highlights (hereafter referred to as "financial statements") are the responsibility of the Funds' management; our responsibility is to express an opinion on these financial statements based on our audits. We conducted our audits of these financial statements in accordance with the standards of the Public Company Accounting Oversight Board (United States). Those standards require that we plan and perform the audit to obtain reasonable assurance about whether the financial statements are free of material misstatement. An audit includes examining, on a test basis, evidence supporting the amounts and disclosures in the financial statements, assessing the accounting principles used and significant estimates made by management, and evaluating the overall financial statement presentation. We believe that our audits, which included confirmation of securities at November 30, 2008 by correspondence with the custodian and broker, provide a reasonable basis for our opinion.
PricewaterhouseCoopers LLP
Philadelphia, Pennsylvania
January 20, 2009
Special 2008 tax information (unaudited) for Vanguard Ohio Tax-Exempt Funds |
This information for the fiscal year ended November 30, 2008, is included pursuant to provisions of the Internal Revenue Code.
Each fund designates 100% of its income dividends as exempt-interest dividends.
41
About Your Fund’s Expenses
As a shareholder of the fund, you incur ongoing costs, which include costs for portfolio management, administrative services, and shareholder reports (like this one), among others. Operating expenses, which are deducted from a fund’s gross income, directly reduce the investment return of the fund.
A fund’s expenses are expressed as a percentage of its average net assets. This figure is known as the expense ratio. The following examples are intended to help you understand the ongoing costs (in dollars) of investing in your fund and to compare these costs with those of other mutual funds. The examples are based on an investment of $1,000 made at the beginning of the period shown and held for the entire period.
The accompanying table illustrates your fund’s costs in two ways:
• Based on actual fund return. This section helps you to estimate the actual expenses that you paid over the period. The “Ending Account Value” shown is derived from the fund’s actual return, and the third column shows the dollar amount that would have been paid by an investor who started with $1,000 in the fund. You may use the information here, together with the amount you invested, to estimate the expenses that you paid over the period.
To do so, simply divide your account value by $1,000 (for example, an $8,600 account value divided by $1,000 = 8.6), then multiply the result by the number given for your fund under the heading “Expenses Paid During Period.”
• Based on hypothetical 5% yearly return. This section is intended to help you compare your fund’s costs with those of other mutual funds. It assumes that the fund had a yearly return of 5% before expenses, but that the expense ratio is unchanged. In this case—because the return used is not the fund’s actual return—the results do not apply to your investment. The example is useful in making comparisons because the Securities and Exchange Commission requires all mutual funds to calculate expenses based on a 5% return. You can assess your fund’s costs by comparing this hypothetical example with the hypothetical examples that appear in shareholder reports of other funds.
Six Months Ended November 30, 2008 | | | |
| Beginning | Ending | Expenses |
| Account Value | Account Value | Paid During |
Ohio Tax-Exempt Fund | 5/31/2008 | 11/30/2008 | Period1 |
Based on Actual Fund Return | | | |
Money Market | $1,000.00 | $1,010.94 | $0.60 |
Long-Term | 1,000.00 | 951.37 | 0.68 |
Based on Hypothetical 5% Yearly Return | | | |
Money Market | $1,000.00 | $1,024.47 | $0.61 |
Long-Term | 1,000.00 | 1,024.37 | 0.71 |
1 The calculations are based on expenses incurred in the most recent six-month period. The funds’ annualized six-month expense ratios for that period are 0.12% for the Ohio Tax-Exempt Money Market Fund and 0.14% for the Ohio Long-Term Tax-Exempt Fund. The dollar amounts shown as “Expenses Paid” are equal to the annualized expense ratio multiplied by the average account value over the period, multiplied by the number of days in the most recent six-month period, then divided by the number of days in the most recent 12-month period.
42
Note that the expenses shown in the table are meant to highlight and help you compare ongoing costs only and do not reflect transaction costs incurred by the fund for buying and selling securities. Further, the expenses do not include the account service fee described in the prospectus. If such a fee were applied to your account, your costs would be higher. Your fund does not charge transaction fees, such as purchase or redemption fees, nor does it carry a “sales load.”
The calculations assume no shares were bought or sold during the period. Your actual costs may have been higher or lower, depending on the amount of your investment and the timing of any purchases or redemptions.
You can find more information about the fund’s expenses, including annual expense ratios, in the Financial Statements section of this report. For additional information on operating expenses and other shareholder costs, please refer to your fund’s current prospectus.
43
Glossary
Average Coupon. The average interest rate paid on the fixed income securities held by a fund. It is expressed as a percentage of face value.
Average Duration. An estimate of how much the value of the bonds held by a fund will fluctuate in response to a change in interest rates. To see how the value could change, multiply the average duration by the change in rates. If interest rates rise by 1 percentage point, the value of the bonds in a fund with an average duration of five years would decline by about 5%. If rates decrease by a percentage point, the value would rise by 5%.
Average Effective Maturity. The average length of time until fixed income securities held by a fund reach maturity and are repaid, taking into consideration the possibility that the issuer may call the bond before its maturity date. The figure reflects the proportion of fund assets represented by each security; it also reflects any futures contracts held. In general, the longer the average effective maturity, the more a fund’s share price will fluctuate in response to changes in market interest rates.
Average Quality. An indicator of credit risk, this figure is the average of the ratings assigned to a fund’s holdings by credit-rating agencies. The agencies make their judgment after appraising an issuer’s ability to meet its obligations. Quality is graded on a scale, with AAA indicating the most creditworthy bond issuers and MIG-1, A-1+, SP-1+, and F-1+ indicating the most creditworthy issuers of money market securities.
Average Weighted Maturity. The average length of time until fixed income securities held by a fund reach maturity and are repaid. The figure reflects the proportion of fund assets represented by each security.
Beta. A measure of the magnitude of a fund’s past share-price fluctuations in relation to the ups and downs of a given market index. The index is assigned a beta of 1.00. Compared with a given index, a fund with a beta of 1.20 typically would have seen its share price rise or fall by 12% when the index rose or fell by 10%. For this report, beta is based on returns over the past 36 months for both the fund and the index. Note that a fund’s beta should be reviewed in conjunction with its R-squared (see definition). The lower the R-squared, the less correlation there is between the fund and the index, and the less reliable beta is as an indicator of volatility.
Expense Ratio. The percentage of a fund’s average net assets used to pay its annual administrative and advisory expenses. These expenses directly reduce returns to investors.
Inception Date. The date on which the assets of a fund (or one of its share classes) are first invested in accordance with the fund’s investment objective. For funds with a subscription period, the inception date is the day after that period ends. Investment performance is measured from the inception date.
R-Squared. A measure of how much of a fund’s past returns can be explained by the returns from the market in general, as measured by a given index. If a fund’s total returns were precisely synchronized with an index’s returns, its R-squared would be 1.00. If the fund’s returns bore no relationship to the index’s returns, its R-squared would be 0. For this report, R-squared is based on returns over the past 36 months for both the fund and the index.
Short-Term Reserves. The percentage of a fund invested in highly liquid, short-term securities that can be readily converted to cash.
44
Yield. A money market fund’s 7-day SEC yield is calculated by annualizing its income distributions for the previous seven days, as required by the U.S. Securities and Exchange Commission. For other funds, 30-day SEC yield is derived using a formula specified by the commission. Under the formula, data related to the fund’s security holdings in the previous 30 days are used to calculate the fund’s hypothetical net income for that period, which is then annualized and divided by the fund’s estimated average net assets over the calculation period. For the purposes of this calculation, a security’s income is based on its current market yield to maturity (in the case of bonds) or its projected dividend yield (for stocks). Because the SEC yield represents hypothetical annualized income, it will differ—at times significantly—from the fund’s actual experience. As a result, the fund’s income distributions may be higher or lower than implied by the SEC yield.
Yield to Maturity. The rate of return an investor would receive if the fixed income securities held by a fund were held to their maturity dates.
45
This page intentionally left blank.
The People Who Govern Your Fund
The trustees of your mutual fund are there to see that the fund is operated and managed in your best interests since, as a shareholder, you are a part owner of the fund. Your fund’s trustees also serve on the board of directors of The Vanguard Group, Inc., which is owned by the Vanguard funds and provides services to them on an at-cost basis.
A majority of Vanguard’s board members are independent, meaning that they have no affiliation with Vanguard or the funds they oversee, apart from the sizable personal investments they have made as private individuals. The independent board members have distinguished backgrounds in business, academia, and public service. Each of the trustees and executive officers oversees 156 Vanguard funds.
The following table provides information for each trustee and executive officer of the fund. More information about the trustees is in the Statement of Additional Information, which can be obtained, without charge, by contacting Vanguard at 800-662-7447, or online at www.vanguard.com.
Chairman of the Board and Interested Trustee | Rajiv L. Gupta |
| Born 1945. Trustee Since December 2001.2 Principal |
| Occupation(s) During the Past Five Years: Chairman, |
John J. Brennan1 | President, and Chief Executive Officer of Rohm and |
Born 1954. Trustee Since May 1987. Chairman of | Haas Co. (chemicals); Board Member of the American |
the Board. Principal Occupation(s) During the Past Five | Chemistry Council; Director of Tyco International, Ltd. |
Years: Chairman of the Board and Director/Trustee of | (diversified manufacturing and services), since 2005. |
The Vanguard Group, Inc., and of each of the investment | |
companies served by The Vanguard Group; Chief | |
Executive Officer and President of The Vanguard Group | Amy Gutmann |
and of each of the investment companies served by The | Born 1949. Trustee Since June 2006. Principal |
Vanguard Group (1996–2008). | Occupation(s) During the Past Five Years: President of |
| the University of Pennsylvania since 2004; Professor in |
| the School of Arts and Sciences, Annenberg School for |
Independent Trustees | Communication, and Graduate School of Education of |
| the University of Pennsylvania since 2004; Provost |
| (2001–2004) and Laurance S. Rockefeller Professor of |
Charles D. Ellis | Politics and the University Center for Human Values |
Born 1937. Trustee Since January 2001. Principal | (1990–2004), Princeton University; Director of Carnegie |
Occupation(s) During the Past Five Years: Applecore | Corporation of New York since 2005 and of Schuylkill |
Partners (pro bono ventures in education); Senior | River Development Corporation and Greater Philadelphia |
Advisor to Greenwich Associates (international business | Chamber of Commerce since 2004; Trustee of the |
strategy consulting); Successor Trustee of Yale University; | National Constitution Center since 2007. |
Overseer of the Stern School of Business at New York | |
University; Trustee of the Whitehead Institute for | |
Biomedical Research. | JoAnn Heffernan Heisen |
| Born 1950. Trustee Since July 1998. Principal |
| Occupation(s) During the Past Five Years: Retired |
Emerson U. Fullwood | Corporate Vice President, Chief Global Diversity Officer, |
Born 1948. Trustee Since January 2008. Principal | and Member of the Executive Committee of Johnson & |
Occupation(s) During the Past Five Years: Retired | Johnson (pharmaceuticals/consumer products); Vice |
Executive Chief Staff and Marketing Officer for | President and Chief Information Officer (1997–2005) |
North America and Corporate Vice President of | of Johnson & Johnson; Director of the University |
Xerox Corporation (photocopiers and printers); | Medical Center at Princeton and Women’s Research |
Director of SPX Corporation (multi-industry | and Education Institute. |
manufacturing), of the United Way of Rochester, | |
and of the Boy Scouts of America. | |
André F. Perold | F. William McNabb III1 |
Born 1952. Trustee Since December 2004. Principal | Born 1957. Chief Executive Officer Since August 2008. |
Occupation(s) During the Past Five Years: George Gund | President Since March 2008. Principal Occupation(s) |
Professor of Finance and Banking, Senior Associate | During the Past Five Years: Chief Executive Officer, |
Dean, and Director of Faculty Recruiting, Harvard | Director, and President of The Vanguard Group, Inc., |
Business School; Director and Chairman of UNX, Inc. | since 2008; Chief Executive Officer and President of |
(equities trading firm); Chair of the Investment | each of the investment companies served by The |
Committee of HighVista Strategies LLC (private | Vanguard Group since 2008; Director of Vanguard |
investment firm) since 2005. | Marketing Corporation; Managing Director of The |
| Vanguard Group (1995–2008). |
| |
Alfred M. Rankin, Jr. | |
Born 1941. Trustee Since January 1993. Principal | Heidi Stam1 |
Occupation(s) During the Past Five Years: Chairman, | Born 1956. Secretary Since July 2005. Principal |
President, Chief Executive Officer, and Director of | Occupation(s) During the Past Five Years: Managing |
NACCO Industries, Inc. (forklift trucks/housewares/ | Director of The Vanguard Group, Inc., since 2006; |
lignite); Director of Goodrich Corporation (industrial | General Counsel of The Vanguard Group since 2005; |
products/aircraft systems and services). | Secretary of The Vanguard Group and of each of the |
| investment companies served by The Vanguard Group |
| since 2005; Director and Senior Vice President of |
J. Lawrence Wilson | Vanguard Marketing Corporation since 2005; Principal |
Born 1936. Trustee Since April 1985. Principal | of The Vanguard Group (1997–2006). |
Occupation(s) During the Past Five Years: Retired | |
Chairman and Chief Executive Officer of Rohm and | |
Haas Co. (chemicals); Director of Cummins Inc. (diesel | Vanguard Senior Management Team |
engines) and AmerisourceBergen Corp. (pharmaceutical | |
distribution); Trustee of Vanderbilt University and of | |
Culver Educational Foundation. | R. Gregory Barton | James M. Norris |
| Mortimer J. Buckley | Ralph K. Packard |
| Kathleen C. Gubanich | Glenn W. Reed |
Executive Officers | Paul A. Heller | George U. Sauter |
| Michael S. Miller |
| |
Thomas J. Higgins1 | |
Born 1957. Chief Financial Officer Since September | Founder |
2008. Principal Occupation(s) During the Past Five | |
Years: Principal of The Vanguard Group, Inc.; Chief | |
Financial Officer of each of the investment companies | John C. Bogle |
served by The Vanguard Group since 2008; Treasurer | Chairman and Chief Executive Officer, 1974–1996 |
of each of the investment companies served by The | |
Vanguard Group (1998–2008). | |
| |
| |
Kathryn J. Hyatt1 | |
Born 1955. Treasurer Since November 2008. Principal | |
Occupation(s) During the Past Five Years: Principal of | |
The Vanguard Group, Inc.; Treasurer of each of the | |
investment companies served by The Vanguard | |
Group since 2008; Assistant Treasurer of each of the | |
investment companies served by The Vanguard Group | |
(1988–2008). | |
1 These individuals are “interested persons” as defined in the Investment Company Act of 1940.
2 December 2002 for Vanguard Equity Income Fund, Vanguard Growth Equity Fund, the Vanguard Municipal Bond Funds, and the Vanguard State Tax-Exempt Funds.
| 
|
| P.O. Box 2600 |
| Valley Forge, PA 19482-2600 |
Connect with Vanguard® > www.vanguard.com
Fund Information > 800-662-7447 | All comparative mutual fund data are from Lipper Inc. |
| or Morningstar, Inc., unless otherwise noted. |
Direct Investor Account Services > 800-662-2739 | |
| |
Institutional Investor Services > 800-523-1036 | You can obtain a free copy of Vanguard’s proxy voting |
| guidelines by visiting our website, www.vanguard.com, |
Text Telephone for People | and searching for “proxy voting guidelines,” or by |
With Hearing Impairment > 800-952-3335 | calling Vanguard at 800-662-2739. The guidelines are |
| also available from the SEC’s website, www.sec.gov. |
| In addition, you may obtain a free report on how your |
This material may be used in conjunction | fund voted the proxies for securities it owned during |
with the offering of shares of any Vanguard | the 12 months ended June 30. To get the report, visit |
fund only if preceded or accompanied by | either www.vanguard.com or www.sec.gov. |
the fund’s current prospectus. | |
| |
| You can review and copy information about your fund |
| at the SEC’s Public Reference Room in Washington, D.C. |
The funds or securities referred to herein are not | To find out more about this public service, call the SEC |
sponsored, endorsed, or promoted by MSCI, and MSCI | at 202-551-8090. Information about your fund is also |
bears no liability with respect to any such funds or | available on the SEC’s website, and you can receive |
securities. For any such funds or securities, the | copies of this information, for a fee, by sending a |
prospectus or the Statement of Additional Information | request in either of two ways: via e-mail addressed to |
contains a more detailed description of the limited | publicinfo@sec.gov or via regular mail addressed to the |
relationship MSCI has with The Vanguard Group and | Public Reference Section, Securities and Exchange |
any related funds. | Commission, Washington, DC 20549-0102. |
| |
Russell is a trademark of The Frank Russell Company. | |
| |
| |
| |
| |
| |
| |
| |
| |
| |
| © 2009 The Vanguard Group, Inc. |
| All rights reserved. |
| Vanguard Marketing Corporation, Distributor. |
| |
| Q960 012009 |
(a) Audit Fees.
Aggregate Audit Fees of Registered Investment Companies in the Vanguard Group.
(b) Audit-Related Fees.
Includes fees billed in connection with assurance and related services provided to the Registrant, The Vanguard Group, Inc., Vanguard Marketing Corporation, and other registered investment companies in the Vanguard Group.
(c) Tax Fees.
Includes fees billed in connection with tax compliance, planning and advice services provided to the Registrant, The Vanguard Group, Inc., Vanguard Marketing Corporation, and other registered investment companies in the Vanguard Group and related to income and excise taxes.
(d) All Other Fees.
Includes fees billed for services related to risk management and privacy matters. Services were provided to the Registrant, The Vanguard Group, Inc., Vanguard Marketing Corporation, and other registered investment companies in the Vanguard Group.
(e) (1) Pre-Approval Policies. The policy of the Registrant’s Audit Committee is to consider and, if appropriate, approve before the principal accountant is engaged for such services, all specific audit and non-audit services provided to: (1) the Registrant; (2) The Vanguard Group, Inc.; (3) other entities controlled by The Vanguard Group, Inc. that provide ongoing services to the Registrant; and (4) other registered investment companies in the Vanguard Group. In making a determination, the Audit Committee considers whether the services are consistent with maintaining the principal accountant’s independence.
In the event of a contingency situation in which the principal accountant is needed to provide services in between scheduled Audit Committee meetings, the Chairman of the Audit Committee would be called on to consider and, if appropriate, pre-approve audit or permitted non-audit services in an amount sufficient to complete services through the next Audit Committee meeting, and to determine if such services would be consistent with maintaining the accountant’s independence. At the next scheduled Audit Committee meeting, services and fees would be presented to the Audit Committee for formal consideration, and, if appropriate, approval by the entire Audit Committee. The Audit Committee would again consider whether such services and fees are consistent with maintaining the principal accountant’s independence.
The Registrant’s Audit Committee is informed at least annually of all audit and non-audit services provided by the principal accountant to the Vanguard complex, whether such services are provided to: (1) the Registrant; (2) The Vanguard Group, Inc.; (3) other entities controlled by The Vanguard Group, Inc. that provide ongoing services to the Registrant; or (4) other registered investment companies in the Vanguard Group.
(2) No percentage of the principal accountant’s fees or services were approved pursuant to the waiver provision of paragraph (c)(7)(i)(C) of Rule 2-01 of Regulation S-X.
(g) Aggregate Non-Audit Fees.
Includes fees billed for non-audit services provided to the Registrant, The Vanguard Group, Inc., Vanguard Marketing Corporation, and other registered investment companies in the Vanguard Group.
(h) For the most recent fiscal year, the Audit Committee has determined that the provision of all non-audit services was consistent with maintaining the principal accountant’s independence.
(a) Disclosure Controls and Procedures. The Principal Executive and Financial Officers concluded that the Registrant's Disclosure Controls and Procedures are effective based on their evaluation of the Disclosure Controls and Procedures as of a date within 90 days of the filing date of this report.
(b) Internal Control Over Financial Reporting. There were no significant changes in Registrant’s Internal Control Over Financial Reporting or in other factors that could significantly affect this control subsequent to the date of the evaluation, including any corrective actions with regard to significant deficiencies and material weaknesses.
Pursuant to the requirements of the Securities Exchange Act of 1934 and the Investment Company Act of 1940, the registrant has duly caused this report to be signed on its behalf by the undersigned, thereunto duly authorized.
Pursuant to the requirements of the Securities Exchange Act of 1934 and the Investment Company Act of 1940, this report has been signed below by the following persons on behalf of the registrant and in the capacities and on the dates indicated.
Heidi Stam, pursuant to a Power of Attorney filed on January 18, 2008, see file Number 2-29601, Incorporated by Reference; and pursuant to a Power of Attorney filed on September 26, 2008, see File Number 2-47371, Incorporated by Reference.