UNITED STATES
SECURITIES AND EXCHANGE COMMISSION
Washington, D.C. 20549
FORM N-CSR
CERTIFIED SHAREHOLDER REPORT OF REGISTERED MANAGEMENT INVESTMENT COMPANIES
Investment Company Act file number: | | 811-06094 |
| | |
Exact name of registrant as specified in charter: | | Aberdeen Latin America Equity Fund, Inc. |
| | |
Address of principal executive offices: | | 1735 Market Street, 32nd Floor |
| | Philadelphia, PA 19103 |
| | |
Name and address of agent for service: | | Ms. Andrea Melia |
| | Aberdeen Asset Management Inc. |
| | 1735 Market Street 32nd Floor |
| | Philadelphia, PA 19103 |
| | |
Registrant’s telephone number, including area code: | | 866-839-5205 |
| | |
Date of fiscal year end: | | December 31 |
| | |
Date of reporting period: | | December 31, 2012 |
Item 1 – Reports to Stockholders

Closed-end funds have a one-time initial public offering and then are subsequently traded on the secondary market through one of the stock exchanges. The investment return and principal value will fluctuate so that an investor’s shares may be worth more or less than the original cost. Shares of closed-end funds may trade above (a premium) or below (a discount) the net asset value (NAV) of the fund’s portfolio. Past performance does not guarantee future results. Foreign securities are more volatile, harder to price and less liquid than U.S. securities. These risks may be enhanced in emerging market countries. Concentrating investments in a single country, region or industry may subject a fund to greater price volatility and risk of loss than more diverse funds. Investors should consider a fund’s investment objectives, risks, charges and expenses carefully before investing. A copy of the prospectus for Aberdeen Asia-Pacific Income Fund, Inc., Aberdeen Global Income Fund, Inc. and Aberdeen Chile Fund, Inc. that contains this and other information about the fund may be obtained by calling 866-839-5205. Please read the prospectus carefully before investing. Investing in funds involves risk, including possible loss of principal. Aberdeen Asset Management Inc., 1735 Market Street, 32nd Floor, Philadelphia, PA 19103. NOT FDIC INSURED | NO BANK GUARANTEE | MAY LOSE VALUE
Letter to Shareholders (unaudited)
Dear Shareholder,
We present this Annual Report which covers the activities of Aberdeen Latin America Equity Fund, Inc. (the “Fund”) for the twelve-month period ended December 31, 2012. The Fund’s principal investment objective is to seek long-term capital appreciation by investing primarily in Latin American equity securities.
Total Return Performance
For the year ended December 31, 2012, the total return to shareholders of the Fund, based on the net asset value (“NAV”) of the Fund, was 26.2%, assuming reinvestment of dividends and distributions, versus a return of 8.7% for the Fund’s benchmark, the MSCI Emerging Markets Latin America Index (“MSCI EM Latin America Index”). The Fund’s annual total return is based on the reported NAV on December 31, 2012.
Share Price and NAV
For the year ended December 31, 2012, based on market price, the Fund’s total return was 25.5%, assuming reinvestment of dividends and distributions. The Fund’s share price increased 20.4% over the twelve months, from $30.10 on December 31, 2011 to $36.24 on December 31, 2012. The Fund’s share price on December 31, 2012 represented a discount of 9.9% to the NAV per share of $40.23 on that date, compared with a discount of 9.4% to the NAV per share of $33.23 on December 31, 2011.
Open Market Repurchase Program
The Fund’s policy is generally to buy back Fund shares on the open market when the Fund trades at certain discounts to NAV. During the fiscal year ended December 31, 2012 and fiscal year ended December 31, 2011, the Fund did not repurchase any shares through this program.
Portfolio Holdings Disclosure
The Fund files its complete schedule of portfolio holdings with the Securities and Exchange Commission (“SEC”) for the first and third quarters of each fiscal year on Form N-Q. The Fund’s Forms N-Q are available on the SEC’s website at http://www.sec.gov and may be reviewed and copied at the SEC’s Public Reference Room in Washington, D.C. Information about the operation of the Public Reference Room may be obtained by calling 1-800-SEC-0330. The information on Form N-Q is also available to shareholders on the Fund’s website or upon request and without charge by calling Investor Relations toll-free at 1-866-839-5205.
Proxy Voting
A description of the policies and procedures that the Fund uses to determine how to vote proxies relating to portfolio securities, and information regarding how the Fund voted proxies relating to portfolio securities during the most recent twelve months ended June 30 is available by August 30 of
the relevant year: (i) upon request and without charge by calling Investor Relations toll-free at 1-866-839-5205; and (ii) on the SEC’s website at http://www.sec.gov.
Investor Relations Information
As part of our ongoing commitment to provide information to our shareholders, I invite you to visit the Fund on the web at www.aberdeenlaq.com. From this page, you can view monthly fact sheets, portfolio manager commentary, distribution and performance information, updated daily fact sheets courtesy of Morningstar®, conduct portfolio charting and other timely data.
Please take a look at Aberdeen’s Closed-End Fund Talk Channel, where you can watch fund manager web casts and view our latest short films. For replays of recent broadcasts or to register for upcoming events, please visit Aberdeen’s Closed-End Fund Talk Channel at www.aberdeen-asset.us/aam.nsf/usClosed/aberdeentv.
Please ensure that you are enrolled in our email services, which feature timely news from our portfolio managers around the world. Enroll today at www.aberdeen-asset.us/aam.nsf/usclosed/email and be among the first to receive the latest closed-end fund news, announcements of upcoming fund manager web casts, films and other information. Please note that Aberdeen does not share our shareholder information with any other organizations.
Included within this report is a reply card with postage paid envelope. Please complete and mail the card if you would like to be added to our enhanced email service and receive future communications from Aberdeen.
Please contact Aberdeen Asset Management Inc. by:
· | Calling toll free at 1-866-839-5205 in the United States; |
| |
· | Emailing InvestorRelations@aberdeen-asset.com; |
| |
· | Visting Aberdeen Closed-End Fund Center at http://www.aberdeen-asset.us/aam.nsf/usClosed/home; |
| |
· | Visiting www.aberdeenlaq.com. |
Yours sincerely,

Christian Pittard
President
| Aberdeen Latin America Equity Fund, Inc. | 1 |
Report of the Investment Adviser (unaudited)
Market Review
Latin American stock markets rebounded in 2012 despite being buffeted by global headwinds that had weighed on sentiment worldwide. The MSCI EM Latin America Index’s rise of 8.7% in U.S. Dollar terms lagged the broader MSCI Emerging Markets Index. Concerns over the slowdown in China and the U.S., as well as the European debt crisis, dominated sentiment. Investors were also affected by weaker commodity prices, which declined last year. Towards the year-end, optimism that US budget negotiations could be resolved and better economic data from the US and China further bolstered equities.
On the economic front, much of the region appeared to weather the global slowdown with sufficient resilience. Robust domestic demand, improved competitiveness and fixed asset investments, counterbalanced the deceleration in exports. Policymakers also took steps to support growth by lowering benchmark interest rates. In Brazil, however, rate cuts coupled with several policy initiatives failed to revive lackluster growth.
In politics, Enrique Pena Nieto was elected president of Mexico, returning the Institutional Revolutionary Party to power following a 12-year hiatus. In Venezuela, Hugo Chavez was re-elected president,
which we believe brought nervousness into markets due to his past oil-fuelled socialist populism. Separately, Argentina re-nationalized YPF, the nation’s biggest oil company, which we believe raised fears that increased government intervention in the region could crimp competitiveness and deter foreign investors.
Portfolio Review and Performance
Looking ahead, Latin American stock markets are likely to face considerable uncertainty particularly from the external environment. These include Europe’s on-going debt throes, along with unresolved debt ceiling woes in the US, despite the last-minute deal that partially averted the fiscal cliff.
In the region, the confluence of various stimulus measures implemented by countries such as Brazil have yet to be felt, in part due to execution issues. Meanwhile, the new Mexican administration faces the challenge in attempting to push through substantial energy and taxation reform. Nevertheless, we believe our holdings remain in good shape, backed by robust cash flow and balance sheets, as well as proven management. In our view, this positions our portfolio to overcome any headwinds in the months ahead.
Aberdeen Asset Managers Limited
Dividend Reinvestment and Cash Purchase Plan
Computershare Trust Company, N.A., the Fund’s transfer agent, sponsors and administers a Dividend Reinvestment and Direct Stock Purchase Plan (the “Plan”), which is available to shareholders.
The Plan allows registered shareholders and first time investors to buy and sell shares and automatically reinvest dividends and capital gains through the transfer agent. This is a cost-effective way to invest in the Fund.
Please note that for both purchases and reinvestment purposes, shares will be purchased in the open market at the current share price and cannot be issued directly by the Fund.
For more information about the Plan and a brochure that includes the terms and conditions of the Plan, please call Computershare at 1-800-647-0584 or visit www.computershare.com/buyaberdeen.
2 | Aberdeen Latin America Equity Fund, Inc. | |
Portfolio Summary (unaudited)
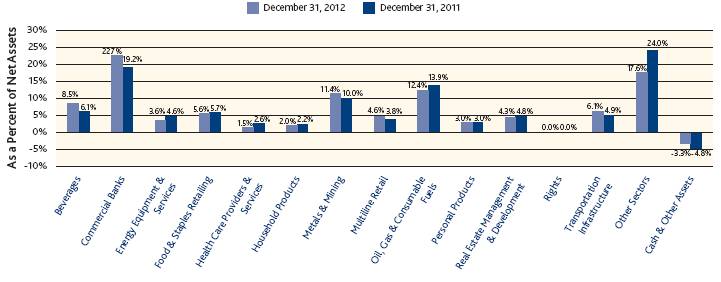
The following chart summarizes the composition of the Fund’s portfolio, in industry classification standard sectors, expressed as a percentage of net assets. An industry classification standard sector can include more than one industry group. As of December 31, 2012, the Fund did not have more than 25% of its assets invested in any industry group. The sectors, as classified by S&P’s Global Industry Classification Standard Sectors, are comprised of several industry groups.
The following chart summarizes the composition of the Fund’s portfolio, in sector allocation, expressed as a percentage of net assets.
Sector Allocation
| Aberdeen Latin America Equity Fund, Inc. | 3 |
Top 10 Holdings, by Issuer (unaudited)
| | Holding | | Sector | | Country | | Percent of Net Assets | |
1. | | Vale S.A., ADR | | Metals & Mining | | Brazil | | 10.2% | |
2. | | Banco Bradesco S.A. | | Commercial Banks | | Brazil | | 9.6% | |
3. | | Petroleo Brasileiro S.A., ADR | | Oil, Gas & Consumable Fuels | | Brazil | | 8.3% | |
4. | | Itau Unibanco Holding S.A., PN, ADR | | Commercial Banks | | Brazil | | 5.7% | |
5. | | Grupo Financiero Banorte S.A.B. de C.V. | | Commercial Banks | | Mexico | | 4.9% | |
6. | | Lojas Renner S.A. | | Multiline Retail | | Brazil | | 4.3% | |
7. | | Fomento Economico Mexicano S.A.B. de C.V., ADR | | Beverages | | Mexico | | 3.9% | |
8. | | Multiplan Empreendimentos Imobiliarios S.A. | | Real Estate Management & Development | | Brazil | | 3.7% | |
9. | | Tenaris S.A., ADR | | Energy Equipment & Services | | Argentina | | 3.6% | |
10. | | Ultrapar Participacoes S.A., ADR | | Oil, Gas & Consumable Fuels | | Brazil | | 3.6% | |
Average Annual Returns (unaudited)
The following table summarizes Fund performance compared to the MSCI EM Latin America index, the Fund’s benchmark, for the 1-year, 3-year, 5-year and 10-year periods ended December 31, 2012.
| | 1 Year | | 3 Years | | 5 Years | | 10 Years | |
Net Asset Value (NAV) | | 26.23% | | 9.21% | | 4.88% | | 24.75% | |
Market Value | | 25.53% | | 8.92% | | 5.15% | | 25.67% | |
MSCI EM Latin America Index | | 8.70% | | 0.17% | | (0.10)% | | 22.76% | |
Aberdeen Asset Managers Limited (and its predecessor Aberdeen Asset Management Investment Services Limited) has voluntarily waived fees and/or reimbursed expenses, without which performance would be lower. Waivers and/or reimbursements are subject to change and may be discontinued at any time. Returns represent past performance. Total investment return at net asset value is based on changes in the net asset value of Fund shares and assumes reinvestment of dividends and distributions, if any, at prices pursuant to the dividend reinvestment program. The Fund’s annual total return is based on the reported NAV on December 31, 2012. Total investment return at market value is based on changes in the market price at which the Fund’s shares traded on the NYSE MKT during the period and assumes reinvestment of dividends and distributions, if any, at prices pursuant to the Fund’s dividend reinvestment program administrated by Computershsre Trust Company, N.A., the Fund’s transfer agent. Because the Fund’s shares trade in the stock market based on investor demand, the Fund may trade at a price higher or lower than its NAV. Therefore, returns are calculated based on both market price and NAV. Past performance is no guarantee of future results. The performance information provided does not reflect the deduction of taxes that a shareholder would pay on distributions received from the Fund. The current performance of the Fund may be lower or higher than the figures shown. The Fund’s yield, return, market price and NAV will fluctuate. Performance information current to the most recent month-end is available by calling 866-839-5205.
The annualized gross expense ratio is 1.18%. The annualized net expense ratio after fee waivers and/or expense reimbursements is 1.16%.
4 | Aberdeen Latin America Equity Fund, Inc. | |
Portfolio of Investments
No. of
Shares | | Description | | Value | |
LONG-TERM EQUITY SECURITIES—103.3% | | | |
ARGENTINA—3.6% | | | |
ENERGY EQUIPMENT & SERVICES—3.6% | | | |
260,000 | | Tenaris S.A., ADR (cost $9,665,225) | | $ 10,899,200 | |
BRAZIL—70.1% | | | |
BEVERAGES—3.5% | | | |
255,000 | | Cia de Bebidas das Americas | | 10,424,176 | |
COMMERCIAL BANKS—15.2% | | | |
1,232,246 | | Banco Bradesco S.A. | | 20,426,095 | |
477,382 | | Banco Bradesco S.A., PN | | 8,200,012 | |
164,300 | | Banco Itaú Holding Financeira S.A., PN | | 2,679,354 | |
878,286 | | Itau Unibanco Holding S.A., PN, ADR | | 14,456,587 | |
| | | | 45,762,048 | |
COMMERCIAL SERVICES & SUPPLIES—1.4% | | | |
187,200 | | Valid Solucoes e Servicos de Seguranca em Meios de Pagamento e Identificacao S.A. | | 4,160,000 | |
DIVERSIFIED FINANCIAL SERVICES-1.7% | | | |
757,563 | | BM&F Bovespa S.A. | | 5,179,918 | |
FOOD PRODUCTS—1.6% | | | |
235,368 | | BRF—Brasil Foods S.A. | | 4,849,903 | |
HEALTH CARE PROVIDERS & SERVICES—1.5% | | | |
831,000 | | Odontoprev S.A. | | 4,354,886 | |
MACHINERY—1.1% | | | |
251,844 | | WEG S.A. | | 3,321,020 | |
MEDIA—0.6% | | | |
132,089 | | Saraiva S.A. Livreiros Editores, PN | | 1,674,095 | |
METALS & MINING—11.4% | | | |
221,800 | | Bradespar S.A., PN | | 3,556,383 | |
1,504,000 | | Vale S.A., ADR | | 30,531,200 | |
| | | | 34,087,583 | |
MULTILINE RETAIL—4.3% | | | |
333,096 | | Lojas Renner S.A. | | 12,974,069 | |
OIL, GAS & CONSUMABLE FUELS—11.9% | | | |
1,292,433 | | Petroleo Brasileiro S.A., ADR | | 24,943,957 | |
484,000 | | Ultrapar Participacoes S.A., ADR | | 10,783,520 | |
| | | | 35,727,477 | |
PERSONAL PRODUCTS—3.1% | | | |
319,000 | | Natura Cosmeticos S.A. | | 9,136,098 | |
REAL ESTATE MANAGEMENT & DEVELOPMENT—3.7% | | | |
379,097 | | Multiplan Empreendimentos Imobiliarios S.A. | | 11,146,100 | |
ROAD & RAIL—1.6% | | | |
261,000 | | Localiza Rent a Car S.A. | | 4,780,220 | |
SOFTWARE—1.0% | | | |
150,000 | | Totvs S.A. | | 2,958,974 | |
SPECIALTY RETAIL—1.4% | | | |
197,000 | | Cia Hering | | 4,040,063 | |
| Aberdeen Latin America Equity Fund, Inc. | 5 |
Portfolio of Investments (continued)
No. of
Shares | | Description | | Value | |
LONG-TERM EQUITY SECURITIES (continued) | | | |
BRAZIL (continued) | | | |
TEXTILES, APPAREL & LUXURY GOODS—1.9% | | | |
294,667 | | Arezzo Industria e Comercio S.A. | | $ 5,691,858 | |
TOBACCO—1.7% | | | |
338,000 | | Souza Cruz S.A. | | 5,086,095 | |
TRANSPORTATION INFRASTRUCTURE—1.5% | | | |
289,400 | | Wilson Sons Limited, BDR | | 4,521,566 | |
| | Total Brazil (cost $143,436,414) | | 209,876,149 | |
CHILE—6.8% | | | |
AIRLINES—0.2% | | | |
23,143 | | Latam Airlines Group S.A. | | 544,314 | |
BEVERAGES—1.0% | | | |
318,000 | | Embotelladora Andina S.A., PNB | | 2,025,901 | |
540,000 | | Viña Concha y Toro S.A. | | 1,051,238 | |
| | | | 3,077,139 | |
CHEMICALS—0.3% | | | |
18,800 | | Sociedad Química y Minera de Chile S.A., PNB | | 1,079,895 | |
COMMERCIAL BANKS—1.2% | | | |
11,421,376 | | Banco de Chile | | 1,765,393 | |
25,113,969 | | Banco Santander Chile | | 1,770,436 | |
| | | | 3,535,829 | |
ELECTRIC UTILITIES—0.5% | | | |
3,780,000 | | Enersis S.A. | | 1,389,619 | |
INDUSTRIAL CONGLOMERATES—0.1% | | | |
18,518 | | Antarchile S.A. | | 286,231 | |
IT SERVICES—0.6% | | | |
592,000 | | Sonda S.A. | | 1,885,744 | |
MULTILINE RETAIL—0.3% | | | |
77,000 | | S.A.C.I. Falabella | | 791,311 | |
OIL, GAS & CONSUMABLE FUELS—0.5% | | | |
98,000 | | Empresas COPEC S.A. | | 1,383,361 | |
PAPER & FOREST PRODUCTS—0.4% | | | |
298,570 | | Empresas CMPC S.A. | | 1,103,851 | |
REAL ESTATE MANAGEMENT & DEVELOPMENT—0.6% | | | |
692,000 | | Parque Arauco S.A. | | 1,718,473 | |
WATER UTILITIES—1.1% | | | |
84,144 | | Inversiones Aguas Metropolitanas S.A., ADR(a)(b) | | 3,391,205 | |
| | Total Chile (cost $11,630,400) | | 20,186,972 | |
COLOMBIA—2.8% | | | |
COMMERCIAL BANKS—1.4% | | | |
237,000 | | Bancolombia S.A. | | 4,023,769 | |
FOOD & STAPLES RETAILING—1.4% | | | |
209,901 | | Almacenes Exito S.A. | | 4,217,026 | |
| | Total Colombia (cost $5,965,744) | | 8,240,795 | |
6 | Aberdeen Latin America Equity Fund, Inc. | |
Portfolio of Investments (continued)
No. of
Shares | | Description | | Value | |
LONG-TERM EQUITY SECURITIES (continued) | | | |
LATIN AMERICA—0.0% | | | |
VENTURE CAPITAL—0.0% | | | |
2,541,650 | (d) | JP Morgan Latin America Capital Partners, L.P. (cost $890,763)(b)(c)(e)(f)(g) | | $ 76,707 | |
MEXICO—20.0% | | | |
BEVERAGES—3.9% | | | |
117,402 | | Fomento Economico Mexicano S.A.B. de C.V., ADR | | 11,822,382 | |
COMMERCIAL BANKS—4.9% | | | |
2,262,000 | | Grupo Financiero Banorte S.A.B. de C.V. | | 14,606,588 | |
FOOD & STAPLES RETAILING—4.2% | | | |
1,536,000 | | Organización Soriana S.A.B. de C.V. | | 5,858,196 | |
2,091,000 | | Wal-Mart de México S.A.B. de C.V., Series V | | 6,823,173 | |
| | | | 12,681,369 | |
HOUSEHOLD DURABLES—0.4% | | | |
1,799,741 | | Urbi Desarrollos Urbanos S.A.B. de C.V.(c) | | 1,129,163 | |
HOUSEHOLD PRODUCTS—2.0% | | | |
2,312,000 | | Kimberly-Clark de Mexico S.A.B. de C.V. | | 5,938,157 | |
TRANSPORTATION INFRASTRUCTURE—4.6% | | | |
319,000 | | Grupo Aeroportuario del Centro Norte S.A.B. de C.V., ADR | | 6,938,250 | |
60,134 | | Grupo Aeroportuario del Sureste S.A.B. de C.V., ADR | | 6,855,276 | |
| | | | 13,793,526 | |
| | Total Mexico (cost $32,304,940) | | 59,971,185 | |
GLOBAL—0.0% | | | |
VENTURE CAPITAL—0.0% | | | |
2,237,292 | (d) | Emerging Markets Ventures l, L.P. (cost $795,656)(b)(c)(e)(f)(g) | | 109,068 | |
| | Total Long-Term Equity Securities (cost $204,689,142) | | 309,360,076 | |
RIGHTS SECURITIES 0.0% | | | |
CHILE—0.0% | | | |
RIGHTS—0.0% | | | |
361 | | Latam Airlines Group S.A.(c) | | 204 | |
76,777 | | Sonda S.A.(c) | | 15,235 | |
| | Total Rights Securities (cost $0) | | 15,439 | |
| | Total Equity Securities (cost $204,689,142) | | 309,375,515 | |
| | | |
Principal
Amount
(000’s) | | | |
SHORT-TERM INVESTMENT—0.3% | | | |
GRAND CAYMAN—0.3% | | | |
$1,035 | | Wells Fargo, overnight deposit, 0.03%, 01/02/13 (cost $1,035,000) | | 1,035,000 | |
| | Total Investments—103.6% (cost $205,724,142) | | 310,410,515 | |
| | Liabilities in Excess of Cash and Other Assets—(3.6)% | | (10,835,548 | ) |
| | Net Assets—100.0% | | $299,574,967 | |
| Aberdeen Latin America Equity Fund, Inc. | 7 |
Portfolio of Investments (concluded)
December 31, 2012
(a) SEC Rule 144A security. Such securities are traded only among “qualified institutional buyers.”
(b) Illiquid Security.
(c) Non-income producing security.
(d) Represents contributed capital.
(e) Restricted security, not readily marketable. (See Note 7).
(f) Security was fair valued as of December 31, 2012. Security is valued at fair value as determined in good faith by, or under the direction of, the Board of Directors (the “Board”) under procedures established by the Board. (See Note 2).
(g) As of December 31, 2012, the aggregate amount of open commitments for the Fund is $775,044. (See Note 7).
ADR American Depositary Receipts.
BDR Brazilian Depositary Receipts.
PN Preferred Shares.
PNB Preferred Shares, Class B.
See Notes to Financial Statements.
8 | Aberdeen Latin America Equity Fund, Inc. | |
Statement of Assets and Liabilities | | | |
| | | |
As of December 31, 2012 | | | |
| | | |
Assets | | | |
Investments, at value (Cost $205,724,142) | | $ 310,410,515 | |
Cash (including $861,700 of foreign currencies with a cost of $848,913) | | 862,212 | |
Dividends receivable | | 1,116,467 | |
Reimbursement receivable and other assets | | 11,700 | |
Prepaid expenses | | 31,649 | |
Total assets | | 312,432,543 | |
| | | |
Liabilities | | | |
Dividends and distributions (Note 2) | | 11,824,893 | |
Investment advisory fees payable (Note 3) | | 566,861 | |
Administration fees payable (Note 3) | | 50,634 | |
Investor relations fees payable (Note 3) | | 36,446 | |
Directors’ fees payable | | 7,983 | |
Chilean repatriation taxes (Note 2) | | 181,605 | |
Accrued expenses and other liabilities | | 189,154 | |
Total liabilities | | 12,857,576 | |
| | | |
Net Assets | | $ 299,574,967 | |
| | | |
Net Assets consist of | | | |
Capital stock, $0.001 par value (Note 5) | | $ 7,449 | |
Paid-in capital | | 185,585,048 | |
Distributions in excess of net investment income | | (1,863,736 | ) |
Accumulated net realized gain on investments and foreign currency related transactions | | 11,145,041 | |
Net unrealized appreciation on investments and foreign currency translation | | 104,701,165 | |
Net Assets applicable to shares outstanding | | $ 299,574,967 | |
Net asset value per share, based on 7,448,517 shares issued and outstanding | | $ 40.22 | (a) |
| |
(a) | The NAV shown differs from the reported NAV on December 31, 2012 due to financial statement rounding and/or financial statement adjustments. |
| |
| |
See Notes to Financial Statements. |
|
|
|
|
|
|
|
|
|
|
|
|
|
|
| Aberdeen Latin America Equity Fund, Inc. | 9 |
| | |
| | |
| | | | | | |
Statement of Operations | | | |
For the Year Ended December 31, 2012 | | | |
| | | |
Investment Income | | | |
Income: | | | |
Dividends and other income | | $ 7,856,294 | |
Less: Foreign taxes withheld | | (520,069 | ) |
Total investment income | | 7,336,225 | |
Expenses: | | | |
Investment advisory fees (Note 3) | | 2,265,924 | |
Custodian’s fees and expenses | | 191,899 | |
Directors’ fees and expenses | | 171,662 | |
Administration fees (Note 3) | | 165,520 | |
Legal fees and expenses | | 132,358 | |
Investor relations fees and expenses (Note 3) | | 74,496 | |
Insurance expense | | 63,834 | |
Reports to shareholders and proxy solicitation | | 62,487 | |
Independent auditor’s fees and expenses | | 60,600 | |
Transfer agent’s fees and expenses | | 22,507 | |
Miscellaneous | | 40,114 | |
Chilean taxes (Note 2) | | 33,770 | |
Total expenses | | 3,285,171 | |
Less: Fee waivers and reimbursements (Note 3) | | (71,240 | ) |
Net expenses | | 3,213,931 | |
| | | |
Net investment income | | 4,122,294 | |
Net Realized and Unrealized Gain/(Loss) on Investments and Foreign Currency Related Transactions | | | |
Net realized gain/(loss) on: | | | |
Investment transactions* | | 19,688,262 | |
Foreign currency transactions | | (213,115 | ) |
Net change in unrealized appreciation of investments and foreign currency translation (includes $1,059 of Chilean taxes) (Note 2) | | 40,491,565 | |
Net realized and unrealized gain on investments and foreign currency transactions | | 59,966,712 | |
Net Increase in Net Assets Resulting from Operations | | $64,089,006 | |
| | | |
* Includes realized gain distributions from underlying venture capital investments of $51,693. | | | |
| | | |
| | | |
See Notes to Financial Statements. | | | |
| | | |
| | | |
| | | |
| | | |
| | | |
| | | |
| | | |
| | | |
| | | |
| | | |
| | | |
10 | Aberdeen Latin America Equity Fund, Inc. | |
| | |
| | |
| | | | | |
Statements of Changes in Net Assets | | | | | |
| | | | | |
| | | | | |
| | | | | |
| | For the Year Ended
December 31,
2012 | | For the Year Ended
December 31,
2011 | |
Increase/(Decrease) in Net Assets | | | | | |
Operations: | | | | | |
Net investment income | | $ 4,122,294 | | $ 5,313,908 | |
Net realized gain on investments and foreign currency related transactions | | 19,475,147 | | 10,000,190 | |
Net change in unrealized appreciation/(depreciation) on investments and foreign currency translations | | 40,491,565 | | (65,479,477 | ) |
Net increase/(decrease) in net assets resulting from operations | | 64,089,006 | | (50,165,379 | ) |
Dividends and distributions to shareholders from: | | | | | |
Net investment income | | (3,045,103 | ) | (4,859,636 | ) |
Net realized gain on investments | | (8,973,824 | ) | (9,942,578 | ) |
Total dividends and distributions to shareholders | | (12,018,927 | ) | (14,802,214 | ) |
Total increase/(decrease) in net assets resulting from operations | | 52,070,079 | | (64,967,593 | ) |
Net Assets | | | | | |
Beginning of year | | 247,504,888 | | 312,472,481 | |
End of year* | | $ 299,574,967 | | $247,504,888 | |
| | | | | |
* Includes distributions in excess of net investment income of $(1,863,736) and $(2,727,906), respectively. | |
| | | | | |
| | | | | |
See Notes to Financial Statements. | | | | | |
| | | | | |
| | | | | |
| | | | | |
| | | | | |
| | | | | |
| | | | | |
| | | | | |
| | | | | |
| | | | | |
| | | | | |
| | | | | |
| | | | | |
| | | | | |
| | | | | |
| | | | | |
| Aberdeen Latin America Equity Fund, Inc. | 11 |
| | | | | |
| | | | | |
| | | | | | | |
Financial Highlights
| | | | | | | | | | | |
| | | | | | | | | | | |
| | For the Fiscal Years Ended December 31, | |
| | 2012 | | 2011 | | 2010 | | 2009 | | 2008 | |
PER SHARE OPERATING PERFORMANCE(a) | | | | | | | | | | | |
Net asset value, beginning of year | | $33.23 | | $41.95 | | $43.41 | | $21.26 | | $53.19 | |
Net investment income | | 0.55 | | 0.71 | | 0.44 | | 0.58 | | 0.55 | |
Net realized and unrealized gain/(loss) on investments and foreign currency related transactions | | 8.05 | | (7.44 | ) | 8.19 | | 22.54 | | (28.97 | ) |
Net increase/(decrease) in net assets resulting from operations | | 8.60 | | (6.73 | ) | 8.63 | | 23.12 | | (28.42 | ) |
Dividends and distributions to shareholders from: | | | | | | | | | | | |
Net investment income | | (0.41 | ) | (0.65 | ) | (0.47 | ) | (1.00 | ) | (0.45 | ) |
Net realized gains | | (1.20 | ) | (1.34 | ) | (9.62 | ) | — | | (3.15 | ) |
Total dividends and distributions to shareholders | | (1.61 | ) | (1.99 | ) | (10.09 | ) | (1.00 | ) | (3.60 | ) |
Anti-dilutive impact due to capital shares tendered | | — | | — | | — | | 0.03 | | 0.09 | |
Net asset value, end of year | | $40.22 | | $33.23 | | $41.95 | | $43.41 | | $21.26 | |
Market value, end of year | | $36.24 | | $30.10 | | $38.72 | | $39.42 | | $18.29 | |
| | | | | | | | | | | |
Total Investment Return Based on:(b) | | | | | | | | | | | |
Market value | | 25.53% | | (17.47% | ) | 24.75% | | 120.93% | | (54.99% | ) |
Net asset value | | 26.20% | (d) | (15.90% | ) | 22.74% | | 109.30% | | (53.46% | ) |
| | | | | | | | | | | |
Ratio/Supplementary Data | | | | | | | | | | | |
Net assets, end of year (000 omitted) | | $299,575 | | $247,505 | | $312,472 | | $265,101 | | $131,298 | |
Average net assets (000 omitted) | | $277,904 | | $291,612 | | $268,440 | | $194,682 | | $280,540 | |
Ratio of expenses to average net assets, net of fee waivers(c) | | 1.16% | | 1.18% | | 1.35% | | 1.28% | | 1.19% | |
Ratio of expenses to average net assets, excluding fee waivers(c) | | 1.18% | | 1.18% | | 1.35% | | 1.28% | | 1.20% | |
Ratio of expenses to average net assets, excluding fee waivers and taxes | | 1.14% | | 1.16% | | 1.27% | | 1.21% | | 1.18% | |
Ratio of net investment income to average net assets | | 1.48% | | 1.82% | | 1.03% | | 1.84% | | 1.24% | |
Portfolio turnover rate | | 16.47% | | 11.93% | | 7.52% | | 75.70% | | 16.55% | |
(a) | Based on average shares outstanding. |
(b) | Total investment return is calculated assuming a purchase of common stock on the first day and a sale on the last day of each reporting period. Dividends and distributions, if any, are assumed, for purposes of this calculation to be reinvested at prices obtained under the Fund’s dividend reinvestment plan. Total investment return does not reflect brokerage commissions. |
(c) | Ratios include the effect of Chilean taxes. |
(d) | The total return includes the impact of financial statements adjustments of the NAV per share. |
See Notes to Financial Statements.
12 | Aberdeen Latin America Equity Fund, Inc. | |
Notes to Financial Statements
December 31, 2012
1. Organization
Aberdeen Latin America Equity Fund, Inc. (the “Fund”) was incorporated in Maryland on April 17, 1990 and commenced investment operations on October 30, 1991. The Fund is registered under the Investment Company Act of 1940, as amended (the “1940 Act”), as a closed-end, non-diversified management investment company. The Fund trades on the NYSE MKT under the ticker symbol “LAQ”.
The Fund seeks long-term capital appreciation by investing primarily in Latin American equity securities.
2. Significant Accounting Policies
The following is a summary of significant accounting policies followed by the Fund in the preparation of its financial statements. The financial statements of the Fund are prepared in accordance with accounting principles generally accepted in the United States of America (“GAAP”). The preparation of financial statements requires management to make estimates and assumptions that affect the reported amounts of assets and liabilities, disclosure of contingent assets and liabilities at the date of the financial statements, and the reported amounts of income and expenses for the period. Actual results could differ from those estimates. The U.S. Dollar is used as both the functional and reporting currency.
(a) Security Valuation:
The Fund is required to value its securities at fair value, which is defined as the price that would be received to sell an asset or paid to transfer a liability in an orderly transaction between market participants at the measurement date.
Equity securities that are traded on an exchange are valued at the last quoted sale price on the principal exchange on which the security is traded at the “Valuation Time.” The Valuation Time is as of the close of regular trading on the New York Stock Exchange (usually 4:00 p.m. Eastern Time). In the absence of a sale price, the security is valued at the mean of the bid/ask price quoted at the close on the principal exchange on which the security is traded. Securities traded on NASDAQ are valued at the NASDAQ official closing price. Closed-end funds and exchange traded funds are valued at the market price of the security at the Valuation Time. A security using any of these pricing methodologies is determined as a Level 1 investment.
Foreign equity securities that are traded on foreign exchanges that close prior to the Valuation Time are valued by applying fair valuation factors to the last sale price. Fair valuation factors are provided by an independent pricing service provider. When the fair value factors are utilized, the value assigned to the foreign securities may not be the same as quoted or published prices of the securities on their primary markets. These factors are based on inputs such as, depositary receipts,
S&P 500 Index/S&P 500 Futures, Nikkei 225 Futures, sector indices/ETFs, exchange rates, and historical opening and closing prices of each security. If the pricing service is unable to provide a valuation factor, or if the valuation factor falls below a predetermined threshold, the security is valued at the last sale price. A security that applies a fair valuation factor is determined as a Level 2 investment. When no fair valuation factor is applied, the security is determined as a Level 1 investment.
In the event that a security’s market quotation is not readily available, or is deemed unreliable, the fair value of a security is determined by the Fund’s Pricing Committee (which is appointed by the Board of Directors), taking into account the relevant factors and surrounding circumstances. A security that has been fair valued in these circumstances may be classified as a Level 2 or Level 3 depending on the nature of the inputs.
The Fund also invests in venture capital private placement securities, which are deemed to be restricted securities. In the absence of readily ascertainable market values these securities are valued at fair value as determined in good faith by, or under the direction of the Board, under procedures established by the Board. The Fund’s estimate of fair value assumes a willing buyer and a willing seller neither of whom are acting under the compulsion to buy or sell. Although these securities may be resold in privately negotiated transactions, the prices realized on such sales could differ from the prices originally paid by the Fund or the current carrying values, and the difference could be material. These securities are categorized as Level 3 investments. Level 3 investments have significant unobservable inputs, as they trade infrequently. In determining the fair value of these investments, management uses the market approach which includes as the primary input the capital balance reported; however, adjustments to the reported capital balance may be made based on various factors, including, but not limited to, the attributes of the interest held, including the rights and obligations, and any restrictions or illiquidity of such interests, and the fair value of these venture capital investments.
In accordance with the authoritative guidance on fair value measurements and disclosures under GAAP, the Fund discloses the fair value of its investments in a hierarchy that classifies the inputs to valuation techniques used to measure the fair value. The hierarchy assigns Level 1 measurements to valuations based upon unadjusted quoted prices in active markets for identical assets, Level 2 measurements to valuations based upon adjusted quoted prices in active markets for identical assets and Level 3 measurements to valuations based upon unobservable inputs that are significant to the valuation. Observable inputs are inputs that reflect the assumptions market participants would use in pricing the asset or liability, which are based on market data obtained from sources independent of the
| Aberdeen Latin America Equity Fund, Inc. | 13 |
Notes to Financial Statements (continued)
December 31, 2012
reporting entity. Unobservable inputs are inputs that reflect the reporting entity’s own assumptions about the assumptions market participants would use in pricing the asset or liability developed based on the best information available in the circumstances. The three-tier hierarchy of inputs is summarized below:
Level 1 – quoted prices in active markets for identical investments;
Level 2 – other significant observable inputs (including quoted prices for similar securities, interest rates, prepayment speeds, credit risk, etc); or
Level 3 – significant unobservable inputs (including the Fund’s own assumptions in determining the fair value of investments).
A financial instrument’s level within the fair value hierarchy is based upon the lowest level of any input that is significant to the fair value measurement.
The following is a summary of the inputs used as of December 31, 2012 in valuing the Fund’s investments carried at fair value The inputs or methodology used for valuing securities are not necessarily an indication of the risk associated with investing in those securities. Refer to the Portfolio of Investments for a detailed breakout of the security types:
Investments, at value | | Level 1 | | Level 2 | | Level 3 | | Balance as of
12/31/2012 | |
Long-Term Investments | | | | | | | | | |
Venture Capital | | $– | | $– | | $185,775 | | $185,775 | |
Other | | 305,783,096 | | – | | – | | 309,174,301 | |
Water Utilities | | – | | 3,391,205 | | – | | – | |
Rights | | 15,439 | | – | | – | | 15,439 | |
Short-Term Investments | | – | | 1,035,000 | | – | | 1,035,000 | |
Total | | $305,798,535 | | $4,426,205 | | $185,775 | | $310,410,515 | |
Amounts listed as “–” are $0 or round to $0.
For movements between the levels within the fair value hierarchy, the Fund has adopted a policy of recognizing transfers at the end of each period. For the year ended December 31, 2012, there have been no transfers between levels and no significant changes to the fair valuation methodologies.
The significant unobservable inputs used in the fair value measurement of the Fund’s venture capital holdings are audited financial statements, expenses incurred from the partnership, interim financial statements, capital calls, and distributions. These unobservable inputs are used by taking the most recent quarterly valuation statements and adjusting the value using the unobservable inputs mentioned above. Significant increases (decreases) in any of those inputs in isolation would result in a significantly lower (higher) fair value measurement.
| | Fair Value at
12/31/12 | | Valuation Technique | | Unobservable Inputs | | Range | |
Venture Capital | | $185,775 | | Partner Capital Value/Net Asset Value | | Expenses | | $(4,912) – ($8,129) | |
| | | | | | Capital Call & Distributions | | $0 – ($64,359) | |
The following is a reconciliation of investments in which significant unobservable inputs (Level 3) were used in determining value:
Investments,
at value | | Balance
as of
12/31/2011 | | Accrued
discounts/
premiums | | Realized
gain/(loss) | | Change in
unrealized
appreciation/
(depreciation) | | Capital
Contributed | | Distributions/
Sales | | Transfers
into
Level 3 | | Transfers
out of
Level 3 | | Balance
as of
12/31/2012 | |
Venture Capital | | $322,225 | | $– | | $– | | $(67,023) | | $37,683 | | $(107,110) | | $– | | $– | | $185,775 | |
Total | | $322,225 | | $– | | $– | | $(67,023) | | $37,683 | | $(107,110) | | $– | | $– | | $185,775 | |
Change in unrealized appreciation/depreciation relating to Level 3 investments still held at December 31, 2012 is $(67,023).
14 | Aberdeen Latin America Equity Fund, Inc. | |
Notes to Financial Statements (continued)
(b) Short-Term Investment:
The Fund sweeps available cash into a short-term time deposit available through Brown Brothers Harriman & Co. (“BBH & Co.”), the Fund’s custodian. The short-term time deposit is a variable rate account classified as a short-term investment.
(c) Foreign Currency Transactions:
Foreign currency amounts are translated into U.S. Dollars on the following basis:
(I) market value of investment securities, other assets and liabilities at the rate of exchange at the Valuation Time; and
(II) purchases and sales of investment securities, income and expenses at the relevant rates of exchange prevailing on the respective dates of such transactions.
The Fund does not isolate that portion of gains and losses on investments in equity securities which is due to changes in the foreign exchange rates from that which is due to changes in market prices of equity securities. Accordingly, realized and unrealized foreign currency gains and losses with respect to such securities are included in the reported net realized and unrealized gains and losses on investment transactions balances.
The Fund reports certain foreign currency related transactions and foreign taxes withheld on security transactions as components of realized gains for financial reporting purposes, whereas such foreign currency related transactions are treated as ordinary income for U.S. federal income tax purposes.
Net unrealized currency gains or losses from valuing foreign currency denominated assets and liabilities at period end exchange rates are reflected as a component of net unrealized appreciation/depreciation in value of investments, and translation of other assets and liabilities denominated in foreign currencies.
Net realized foreign currency transactions represent foreign exchange gains and losses from transactions in foreign currencies and forward foreign currency contracts, exchange gains or losses realized between the trade date and settlement date on security transactions, and the difference between the amounts of interest and dividends recorded on the Fund’s books and the U.S. Dollar equivalent of the amounts actually received.
Foreign security and currency transactions may involve certain considerations and risks not typically associated with those of domestic origin, including unanticipated movements in the value of the foreign currency relative to the U.S. Dollar. When the U.S. Dollar rises in value against foreign currency, the Fund’s investments denominated in that
currency will lose value because its currency is worth fewer U.S. Dollars; the opposite effect occurs if the U.S. Dollar falls in relative value.
(d) Security Transactions and Investment Income:
Securities transactions are recorded on the trade date. Realized and unrealized gains/(losses) from security and currency transactions are calculated on the identified cost basis. Dividend income is recorded on the ex-dividend date except for certain dividends on foreign securities, which are recorded as soon as the Fund is informed after the ex-dividend date. Interest income is recorded on an accrual basis. Expenses are recorded on an accrual basis.
(e) Distributions:
On an annual basis, the Fund intends to distribute its net realized capital gains, if any, by way of a final distribution to be declared during the calendar quarter ending December 31. Dividends and distributions to shareholders are recorded on the ex-dividend date.
Dividends and distributions to shareholders are determined in accordance with federal income tax regulations, which may differ from GAAP. These differences are primarily due to differing treatments for foreign currencies.
(f) Federal Income Taxes and Foreign Taxes:
The Fund intends to qualify or continue to qualify as a “regulated investment company” by complying with the provisions available to certain investment companies, as defined in Subchapter M of the Internal Revenue Code of 1986, as amended (“IRC”), and to make distributions of net investment income and net realized capital gains sufficient to relieve the Fund from all, or substantially all, federal income taxes. Therefore, no federal income tax provision is required.
Income received by the Fund from sources within Latin America may be subject to withholding and other taxes imposed by such countries. Also, certain Latin American countries impose taxes on funds remitted or repatriated from such countries.
Income received by the Fund from sources within Chile and other foreign countries may be subject to withholding and other taxes imposed by such countries. The Fund accrues foreign Chilean taxes on income and realized gains generated from Chilean securities. The Fund also accrues foreign Chilean taxes on securities with little to no Chilean market presence in an amount equal to what the Fund would owe if the securities were sold and the proceeds repatriated on the valuation date as a liability and reduction of unrealized gains. For the year ended December 31, 2012, the Fund incurred $33,770 of such expenses.
The Fund recognizes the tax benefits of uncertain tax positions only where the position is “more likely than not” to be sustained assuming
| | Aberdeen Latin America Equity Fund, Inc. | 15 |
Notes to Financial Statements (continued)
examination by tax authorities. Management of the Fund has concluded that there are no significant uncertain tax positions that would require recognition in the financial statements. Since tax authorities can examine previously filed tax returns, the Fund’s U.S. federal tax returns for each of the prior four years up to the year ended December 31, 2012 are subject to such review.
(g) Partnership Accounting Policy:
The Fund records its pro-rata share of the income/(loss) and capital gains/(losses) allocated from the underlying partnerships and adjusts the cost of the underlying partnerships accordingly. These amounts are included in the Fund’s Statement of Operations.
3. Agreements and Transactions With Affiliates
(a) Investment Adviser and Former Sub-Adviser:
Aberdeen Asset Managers Limited (“AAML”) serves as the Fund’s investment adviser with respect to all investments. AAML is a direct wholly-owned subsidiary of Aberdeen Asset Management PLC. On March 1, 2012, the previous investment adviser, Aberdeen Asset Management Investment Services Limited (“AAMISL”), merged into AAML, which assumed the investment advisory responsibility for the Fund. There was no change to the portfolio management team or the level or nature of the services provided to the Fund as a result of the merger and the same resources available to AAMISL for the management and compliance oversight of the Fund are available to AAML. AAML receives, as compensation for its advisory services from the Fund, an annual fee, calculated weekly and paid quarterly, equal to 1.00% of the first $100 million of the Fund’s average weekly market value or net assets (whichever is lower), 0.90% of the next $50 million and 0.80% of amounts above $150 million. AAML has voluntarily agreed to waive a portion of its advisory fee. For the year ended December 31, 2012, AAML earned $2,265,924 for advisory services, of which AAML waived $9,000. Amounts shown as paid to AAML include amounts paid to AAMISL prior to March 1, 2012.
On December 6, 2011, the Board, including a majority of the Directors that are not deemed “interested persons” (as that term is defined in Section 2(a)(19) of the 1940 Act) of the Fund or the Fund’s investment adviser, voted to terminate the Fund’s sub-advisory agreement with Celfin Capital Servicios Financieros S.A. (“Celfin”), effective February 4, 2012. For its services as the Fund’s sub-adviser with respect to Chilean investments, Celfin was paid a fee out of the advisory fee, calculated weekly and paid quarterly, at an annual rate of 0.10% of the Fund’s average weekly market value or net assets (whichever is lower). For the period from January 1, 2012 to February 4, 2012, Celfin earned $22,055 for sub-advisory services to the Fund.
For the period from January 1, 2012 to February 4, 2012, Celfin did not receive any broker commissions from portfolio transactions executed on behalf of the Fund.
(b) Fund Administration:
BBH & Co. is the U.S. Administrator for the Fund and certain other funds advised by AAML and its affiliates (collectively the “Funds”). The Funds pay BBH & Co. a monthly administration and fund accounting service fee at an annual rate of 0.02% of the Funds’ aggregate assets up to $250 million, 0.015% for the next $250 million and 0.01% in excess of $500 million.
Each Fund pays its pro rata portion of the fee based on its level of assets with a monthly minimum of $2,500. For the year ended December 31, 2012, BBH & Co. earned $41,040 from the Fund for administrative and fund accounting services.
Celfin Capital S.A. Administradora de Fondos de Capital Extranjero (“AFCE”) serves as the Fund’s Chilean administrator. For its services, AFCE is paid an annual fee by the Fund equal to the greater of 2,000 Unidad de Fomentos (“U.F.s”) (approximately $95,283 at December 31, 2012) or 0.10% of the Fund’s average weekly market value or net assets invested in Chile (whichever is lower) and an annual reimbursement of out-of-pocket expenses not to exceed 500 U.F.s (approximately $23,821 at December 31. 2012). In addition, an accounting fee is also paid to AFCE. For the year ended December 31, 2012, the administration fees and accounting fees amounted to $114,881 and $9,599, respectively. AAML has agreed to absorb 50% of the fees payable to the Fund’s Chilean administrator in 2012. For the year ended December 31, 2012 the reimbursement amounted to $62,240.
(c) Investor Relations:
Under the terms of an Investor Relations Services Agreement, Aberdeen Asset Management Inc. (“AAMI”), an affiliate of AAML, provides investor relations services to the Fund and certain other funds advised by AAML or its affiliates.
Pursuant to the terms of the Investor Relations Services Agreement, AAMI, among other things, provides objective and timely information to shareholders based on publicly-available information; provides information efficiently through the use of technology while offering shareholders immediate access to knowledgeable investor relations representatives; develops and maintains effective communications with investment professionals from a wide variety of firms; creates and maintains investor relations communication materials such as fund manager interviews, films and webcasts, published white papers, magazine and articles and other relevant materials discussing the Fund’s investment results, portfolio positioning and outlook; develops
16 | Aberdeen Latin America Equity Fund, Inc. | |
Notes to Financial Statements (continued)
and maintains of effective communications with large institutional shareholders; responds to specific shareholder questions; and reports activities and results to the Board and management detailing insight into general shareholder sentiment.
For the year ended December 31, 2012, the Fund paid fees of approximately $71,751 for investor relations services. Investor relations fees and expenses in the Statement of Operations include certain out-of-pocket expenses.
(d) Director Purchase Plan:
Fifty percent (50%) of the annual retainer of the Independent Directors is invested in Fund shares and, at the option of each Independent Director, 100% of the annual retainer can be invested in shares of the Fund. During the year ended December 31, 2012, 1,275 shares were purchased pursuant to the Directors compensation plan. As of December 31, 2012, the Directors as a group owned less than 1% of the Fund’s outstanding shares.
4. Investment Transactions
For the year ended December 31, 2012, Fund purchases and sales of securities, other than short-term investments, were $45,590,923 and $55,267,258, respectively.
5. Capital
The authorized capital stock of the Fund is 100,000,000 shares of common stock, $0.001 par value. As of December 31, 2012, the Fund had 7,448,517 shares issued and outstanding.
On September 1, 2010, the Board of Directors declared the payment of an elective cash distribution to be paid in the amount of $9.282 per share of common stock on October 29, 2010 to shareholders of record at the close of business on September 14, 2010. As announced, the distribution was payable in the Fund’s common stock. The aggregate amount of cash distributions to all shareholders was limited to 10% of the aggregate dollar amount of the total distribution. For purposes of computing the stock portion of the dividend, the common stock distributed was valued at $37.99 per share, which equaled the average closing price of the Fund’s common shares on the NYSE MKT (formerly, the NYSE Amex) on October 21, 2010 and the two preceding trading days. Following the closing of the elective cash distribution the Fund’s number of outstanding shares was 7,448,517.
6. Credit Facility
The Fund was a party to a joint credit facility along with certain other funds advised by AAML and its affiliates (collectively the “Funds”). The Funds agreed to a $10 million committed revolving joint credit facility with BBH & Co. for temporary or emergency purposes. Under the terms of the joint credit facility, the Funds paid an aggregate commitment fee on the average unused amount of the credit facility. In addition, the Funds paid interest on borrowings at the Overnight LIBOR rate plus a spread. For the year ended December 31, 2012, the Fund had no borrowings under the joint credit facility. The Board determined the renewal of the credit facility was not necessary and therefore the facility expired on November 9, 2012.
7. Restricted Securities
Certain of the Fund’s investments are restricted as to resale and are valued at fair value as determined in good faith by, or under the direction of, the Board under procedures established by the Board in the absence of readily ascertainable market values.
Security | | Acquisition Date(s) | | Cost | | Fair Value At 12/31/12 | | Percent of Net Assets | | Distributions Received | | Open Commitments | |
| | | | | | | | | | | | | |
Emerging Markets Ventures l, L.P. | | 01/22/98 – 01/10/06 | | $795,656 | | $109,068 | | 0.04 | | $2,548,782 | | $262,708 | |
JP Morgan Latin America Capital Partners, L.P. | | 04/10/00 – 07/13/12 | | 890,763 | | 76,707 | | 0.02 | | 2,624,623 | | 512,336 | |
Total | | | | $1,686,419 | | $185,775 | | 0.06 | | $5,173,405 | | $775,044 | |
The Fund may incur certain costs in connection with the disposition of the above securities.
| | Aberdeen Latin America Equity Fund, Inc. | 17 |
Notes to Financial Statements (continued)
8. Open Market Repurchase Program
The Board authorized, but does not require, management to make open market purchases from time to time in an amount up to 10% of the Fund’s outstanding shares, in accordance with Rule 10b-18 under the Securities Exchange Act of 1934, as amended, and other applicable federal securities laws. Such purchases may be made when, in the reasonable judgment of management, such repurchases may enhance shareholder value and when each such Fund’s shares are trading at a discount to net asset value of 12% or more, subject to intraday fluctuations that may result in repurchases at discounts below 12%. The Board has instructed management to report repurchase activity to it regularly, and to post the number of shares repurchased on the Fund’s website on a monthly basis. For the year ended December 31, 2012, the Fund did not repurchase any shares through this program.
9. Portfolio Investment Risks
(a) Risks Associated with Foreign Securities and Currencies:
Investments in securities of foreign issuers carry certain risks not ordinarily associated with investments in securities of U.S. issuers. Such risks include, among others, currency risk, information risk and political risk. Currency risk results from securities denominated in currencies other than U.S. Dollars that are subject to changes in value due to fluctuations in exchange rates. Information risk arises with respect to foreign securities when key information about foreign issuers may be inaccurate or unavailable. Political risk includes future political and economic developments, and the possible imposition of exchange controls or other foreign governmental laws and restrictions. In addition, with respect to certain countries, there is the possibility of expropriation of assets, confiscatory taxation, political or social instability or diplomatic developments, which could adversely affect investments in those countries. Other risks of investing in foreign securities include liquidity and valuation risks.
Certain countries also may impose substantial restrictions on investments in their capital markets by foreign entities, including restrictions on investments in issuers of industries deemed sensitive to relevant national interests. These factors may limit the investment opportunities available and result in a lack of liquidity and high price volatility with respect to securities of issuers from developing countries.
Some countries require governmental approval for the repatriation of investment income, capital or the proceeds of sales of securities by foreign investors. In addition, if there is deterioration in a country’s balance of payments or for other reasons, a country may impose temporary restrictions on foreign capital remittances abroad. Amountsrepatriated prior to the end of specified periods may be subject to taxes as imposed by a foreign country.
(b) Risks Associated with Latin American Markets:
The Latin American securities markets are substantially smaller, less liquid and more volatile than the major securities markets in the United States. A high proportion of the securities of many companies in Latin American countries may be held by a limited number of persons, which may limit the number of securities available for the investment by the Fund. The limited liquidity of Latin American country securities markets may also affect the Fund’s ability to acquire or dispose of securities at the price and time it wishes to do so.
(c) Risks Associated with Restricted Securities:
The Fund, subject to local investment limitations, may invest up to 10% of its assets (at the time of commitment) in illiquid equity securities, including securities of venture capital funds (whether in corporate or partnership form) that invest primarily in emerging markets. When investing through another investment fund, the Fund will bear its proportionate share of the expenses incurred by that underlying fund, including management fees. Such securities are expected to be illiquid which may involve a high degree of business and financial risk and may result in substantial losses. Because of the current absence of any liquid trading market for these investments, the venture capital funds may take longer to liquidate than would be the case for publicly traded securities. Although these securities may be resold in privately negotiated transactions, the prices realized on such sales could be substantially less than those originally paid by the Fund or the current carrying values and these differences could be material. Further, companies whose securities are not publicly traded may not be subject to the disclosures and other investor protection requirements applicable to companies whose securities are publicly traded.
(d) Risks Associated with European Markets:
A number of countries in Europe have experienced severe economic and financial difficulties. Many non-governmental issuers, and even certain governments, have defaulted on, or been forced to restructure, their debts; many other issuers have faced difficulties obtaining credit or refinancing existing obligations; financial institutions have in many cases required government or central bank support, have needed to raise capital, and/or have been impaired in their ability to extend credit; and financial markets in Europe and elsewhere have experienced extreme volatility and declines in asset values and liquidity. These difficulties may continue, worsen or spread within and without Europe whether or not the Fund invests in securities of issuers located in Europe or with significant exposure to European issuers or countries, these events could negatively affect the value and liquidity of the Fund’s investments.
18 | Aberdeen Latin America Equity Fund, Inc. | |
Notes to Financial Statements (concluded)
10. Contingencies
In the normal course of business, the Fund may provide general indemnifications pursuant to certain contracts and organizational documents. The Fund’s maximum exposure under these arrangements is dependent on future claims that may be made against the Fund and therefore, cannot be estimated; however, based on experience, the risk of loss from such claims is considered remote.
11. Tax Information
The U.S. federal income tax basis of the Fund’s investments and the net unrealized appreciation as of December 31, 2012 were as follows:
Tax Basis of Investments | | Appreciation | | Depreciation | | Net Unrealized Appreciation | |
$207,231,428 | | $118,492,745 | | $(15,313,658) | | $103,179,087 | |
Income and capital gain distributions are determined in accordance with federal income tax regulations, which may differ from GAAP.
The tax character of distributions paid during the fiscal years ended December 31, 2012 and December 31, 2011 was as follows:
| | December 31, 2012 | | December 31, 2011 | |
Distributions paid from: | | | | | |
Ordinary Income | | $3,079,217 | | $5,671,100 | |
Long-Term Capital Gains | | 8,939,710 | | 9,131,114 | |
Total tax character of distributions | | $12,018,927 | | $14,802,214 | |
At December 31, 2012, the components of accumulated earnings on a tax basis, for the Fund were as follows:
Undistributed Ordinary Income | | $225,905 | |
Undistributed Long-Term capital gains | | 10,562,686 | |
Other Book/Tax temporary Differences | | (1,507,286) | |
Unrealized Appreciation | | 104,701,165 | |
Total accumulated earnings | | $113,982,470 | |
During the year ended December 31, 2012, the Fund had no capital loss carryforwards. Under the Regulated Investment Company Modernization Act of 2010, the Fund will be permitted to carry forward capital losses incurred in taxable years beginning after December 22, 2010 for an unlimited period. However, any losses incurred during those future taxable years will be required to be utilized prior to the losses incurred in pre-enactment taxable years. As a result of this ordering rule, pre-enactment capital loss carryforwards may be more likely to expire unused. Additionally, post-enactment capital losses that are carried forward will retain their character as either short-term or long-term capital losses rather than being considered all short-term as under previous law.
GAAP requires that certain components of net assets be adjusted to reflect permanent differences between financial and tax reporting. Accordingly, during the current year, $213,021 has been reclassified from distributions in excess of net investment income to accumulated net realized gains on investments and foreign currency related transactions as a result of permanent differences primarily attributable to foreign currency transactions. These reclassifications have no effect on net assets or net asset values per share.
12. Recent Accounting Pronouncements
In December 2011, the Financial Accounting Standards Board (“FASB”) issued an Accounting Standards Update (“ASU”). No. 2011- 11, Balance Sheet (Topic 210): “Disclosures about Offsetting Assets and Liabilities”. The amendments in the ASU enhance disclosures about offsetting of financial assets and liabilities to enable investors to understand the effect of these arrangements on a fund’s financial position. In January 2013, FASB issued ASU No. 2013-01, Balance Sheet (Topic 210): Clarifying the Scope of Disclosures about Offsetting Assets and Liabilities. The amendments in ASU No. 2013-01 clarify the intended scope of disclosures required by ASU No. 2011-11. These ASU’s are effective for interim and annual reporting periods beginning on or after January 1, 2013. The Fund believes the adoption of these ASU’s will not have a material impact on its financial statements.
13. Subsequent Events
Management has evaluated the need for disclosures and/or adjustments resulting from subsequent events through the date the financials statements were issued. Based on this evaluation, no adjustments were required to the financial statements as of December 31, 2012.
| | Aberdeen Latin America Equity Fund, Inc. | 19 |
Report of Independent Registered Public Accounting Firm
To the Board of Directors and Shareholders of
Aberdeen Latin America Equity Fund, Inc.:
In our opinion, the accompanying statement of assets and liabilities, including the portfolio of investments, and the related statements of operations and of changes in net assets and the financial highlights present fairly, in all material respects, the financial position of Aberdeen Latin America Equity Fund, Inc. (the “Fund”) at December 31, 2012, the results of its operations for the year then ended, the changes in its net assets for each of the two years in the period then ended and the financial highlights for each of the five years in the period then ended, in conformity with accounting principles generally accepted in the United States of America. These financial statements and financial highlights (hereafter referred to as “financial statements”) are the responsibility of the Fund’s management. Our responsibility is to express an opinion on these financial statements based on our audits. We conducted our audits of these financial statements in accordance with the standards of the Public Company Accounting Oversight Board (United States). Those standards require that we plan and perform the audit to obtain reasonable assurance about whether the financial statements are free of material misstatement. An audit includes examining, on a test basis, evidence supporting the amounts and disclosures in the financial statements, assessing the accounting principles used and significant estimates made by management, and evaluating the overall financial statement presentation. We believe that our audits, which included confirmation of securities at December 31, 2012 by correspondence with the custodian and venture capital issuers, provide a reasonable basis for our opinion.

New York, NY
February 26, 2013
20 | Aberdeen Latin America Equity Fund, Inc. | |
Tax Information (unaudited)
The following information is provided with respect to the distributions paid by the Aberdeen Latin America Equity Fund, Inc. during the fiscal year ended December 31, 2012:
Payable Date | | Total Cash Distribution | | Long-Term Capital Gain | | Net Ordinary Dividends | | Foreign Taxes Paid(1) | | Gross Ordinary Dividend | | Qualified Dividends(2) | | Foreign Source Income | |
04/13/12 | | 0.026050 | | 0.000000 | | 0.026050 | | 0.034911 | | 0.060961 | | 0.020812 | | 0.060961 | |
01/11/13 | | 1.587550 | | 1.200200 | | 0.387350 | | 0.034911 | | 0.422261 | | 0.144076 | | 0.417681 | |
(1) The foreign taxes paid represent taxes incurred by the Fund on interest received from foreign sources. Foreign taxes paid may be included in taxable income with an offsetting deduction from gross income or may be taken as a credit for taxes paid to foreign governments. You should consult your tax advisor regarding the appropriate treatment of foreign taxes paid.
(2) The Fund hereby designates the amount indicated above or the maximum amount allowable by law.
Supplemental Information (unaudited)
Board Approval of Investment Advisory Agreement
The Investment Company Act of 1940 (the “Investment Company Act”) and the terms of the investment advisory agreement (the “Advisory Agreement”) between the Aberdeen Latin America Equity Fund, Inc. (the “Fund”) and Aberdeen Asset Managers Limited (the “Adviser”) require that, the Advisory Agreement be approved annually at an in-person meeting by the Board of Directors (the “Board”), including a majority of the Directors who have no direct or indirect interest in the Advisory Agreement and are not “interested persons” of the Fund, as defined in the Investment Company Act (the “Independent Directors”).
At its meeting on December 4, 2012, the Board voted unanimously to renew the Advisory Agreement between the Fund and the Adviser. In connection with its evaluation of the Advisory Agreement, the Board reviewed a broad range of information requested for this purpose and considered a variety of factors, including the following:
(i) The nature, extent and quality of the services provided by the Adviser;
(ii) The performance of the Fund;
(iii) The management fee rate, which includes the advisory fee charged by the Adviser and the administration fees charged by the Fund’s administrators, and the total net expense ratio of the Fund, both on an absolute basis and as compared both to a relevant peer group of funds and to fees charged by the Adviser to others;
(iv) The extent to which economies of scale could be realized by the Adviser and shared with the Fund’s shareholders;
(v) The costs of services provided and profits realized by the Adviser;
(vi) Other benefits realized by the Adviser or its affiliates from its relationship with the Fund; and
(vii) Any other factors that the Board deemed relevant to its consideration.
In addition to its review of information presented to the Board during the contract renewal process, the Board considered knowledge gained from presentations by and discussions with management at regular and special meetings throughout the year. The Independent Directors were represented by independent counsel throughout the review process and convened executive sessions without management present. In its deliberations, the Board did not identify any single factor that was all-important or controlling and each Director may have attributed different weights to the various factors.
Certain of the Board considerations outlined above are discussed in more detail below.
Nature, Extent and Quality of Services. The Board received and considered various data and information regarding the nature, extent and quality of services provided under the Advisory Agreement. The Board considered the reorganization of the Fund’s previous investment adviser, Aberdeen Asset Management Investment Services Limited (“AAMISL”), into the Adviser, which occurred on March 1, 2012. As a result of this reorganization, the Adviser continues to conduct AAMISL’s
| | Aberdeen Latin America Equity Fund, Inc. | 21 |
Supplemental Information (unaudited) (continued)
businesses and represented that there has been no change to the portfolio management team or the level or nature of services provided to the Fund and the same resources that were available to AAMISL for the management of the Fund are available to the Adviser. The Board also considered the Adviser’s representation that it continues to (i) provide the same level and quality of advisory services to the Fund as was provided under an investment sub-advisory agreement with Celfin Capital Servicios Financieros S.A. (“Celfin”), which terminated on February 4, 2012, and (ii) dedicate appropriate internal resources to the Fund so that the service level does not decrease.
Additionally, the Board considered, among other things, information about the background and experience of senior management and investment personnel who were responsible for managing the Fund. The Board also received presentations from and participated in information sessions with senior investment personnel of the Adviser. The Board considered information provided regarding the portfolio managers and other resources dedicated to the Fund and the investment philosophy and process followed by those individuals responsible for managing the Fund. The Board, in particular, received information from the Adviser about its resources, including personnel, devoted to focusing on the geographic area in which the Fund invests. The Board was satisfied that the Adviser had appropriate resources to cover the geographic area to manage the Fund in a manner consistent with its investment objective.
The Board also evaluated the ability of the Adviser, based on its resources, reputation and other attributes, to attract and retain qualified investment professionals. In this regard, the Board considered information regarding the general nature of the compensation structure applicable to portfolio managers and other key personnel.
In addition, the Board considered and evaluated materials and information received regarding the Adviser’s investment and legal compliance program and record with respect to the U.S. registered closed-end funds managed by the Adviser. The Board met in-person with and received quarterly reports from the Fund’s Chief Compliance Officer.
Furthermore, the Board received and considered information about the financial viability of the Adviser to satisfy itself that the Adviser had adequate resources to perform the services required under the Advisory Agreement.
Based on the foregoing and other relevant information reviewed, the Board concluded that, overall, the nature, extent and quality of the services provided to the Fund supported renewal of the Advisory Agreement.
Investment Performance. In addition to reports received at its regular quarterly meetings, the Board received and considered information on the investment performance history of the Fund, including comparisons to the Fund’s Morningstar Category average and broad-based benchmark index returns over various calendar years. The Board was provided with reports, independently prepared by Strategic Insight Mutual Fund Research and Consulting, LLC (“Strategic Insight”), which included a comprehensive analysis of the Fund’s performance.
The Board noted that, except for the calendar year 2007 results, the Fund’s performance was higher than or in-line with the performance of its benchmark index, the MSCI EM Latin America Index, for the calendar years under review. That Board also noted that, except for the 2010 calendar year results, the Fund’s performance has been higher than or in-line with the performance of its peer funds, as measured by the Morningstar Latin America Stock Category Average. The Adviser provided information about factors that contributed to the Fund’s recent performance results. The Board concluded that it was generally satisfied with the Fund’s performance and that the Adviser was taking appropriate actions with respect to investment performance.
Fees and Economies of Scale. The Board considered the management fee rate charged which combines the advisory fee charged by the Adviser and the administration fees charged by the Fund`s administrators, and potential economies of scale. The Board received an analysis from Strategic Insight that compared the Fund’s management fee rate to the management fee rate of a peer group of funds on a gross basis and on a net basis after taking into consideration any fee waivers or expense reimbursements. The Board noted that the gross management fee rate for the Fund was lower than the average and median gross management fee rates of its peer group. The Board also noted that the net management fee rate for the Fund was lower than the average and median net management fee rates of its peer group. The Board also reviewed information prepared by Strategic Insight that showed that the Fund’s 2011 total net expense ratio was lower than the average and median ratios of its peer group. Furthermore, the Board concluded that the contractual breakpoints utilized by the Fund adequately took into account potential economies of scale.
Costs of Services Provided and Profitability. The Board considered, among other things, the Adviser’s estimates of its costs in providing advisory services to the Fund, and the Adviser’s resulting profitability. The Board noted instances of reduced expenses for the twelve months ended August 31, 2012 in comparison to the Adviser’s expenses for the twelve months ended September 30, 2011 and the twelve months ended September 30, 2010, and the reasons for the reductions, including the termination of the investment sub-advisory agreement with Celfin. The
22 | Aberdeen Latin America Equity Fund, Inc. | |
Supplemental Information (unaudited) (continued)
Board also considered the effect on the Adviser’s profitability of the Adviser’s agreement to absorb 50% of the fees payable to the Fund’s Chilean administrator in 2012. Based on its review of the estimated cost and profit information provided by the Adviser, and in light of the nature, extent and quality of services provided to the Fund, the Board did not deem the Adviser’s profitability to be excessive.
Information about Services to Other Clients. The Board considered information about the nature and extent of services and fee rates offered by the Adviser to other clients, including other registered investment companies and institutional funds or accounts. The Adviser advised the Board that, due to the unique strategy of the Fund, the Adviser did not manage any other closed-end funds that were directly comparable. The Board considered that the Adviser was subject to a broader and more extensive regulatory regime in connection with management of the Fund compared to the Adviser’s management of institutional funds or accounts. The Board did not deem the fee rate under the Advisory Agreement to be excessive relative to these other fee rates, given its understanding of similarities and differences in the nature and extent of services offered and other factors.
Fall-Out Benefits and Other Factors. The Board also considered information regarding potential “fall-out” or ancillary benefits that could be realized by the Adviser or its affiliates as a result of its relationship with the Fund. In this regard, the Board was advised that
the Adviser and its affiliates may derive reputational benefits from their association with the Fund. The Board also noted, however, that such benefits were difficult to quantify with certainty.
Additionally, the Board considered that the Adviser has the authority to receive research and brokerage services from a broker that may be useful to various clients in exchange for conducting portfolio brokerage transactions through such broker. The Board noted that the Adviser also may enter into commission sharing arrangements with certain brokers for the receipt of goods or services that relate to the execution of trades or the provision of research. The Board considered the Adviser’s representations that it evaluates any soft-dollar or commission sharing arrangements for compliance with applicable US or UK regulations, particularly with respect to the safe harbor contained in Section 28(e) of the Securities Exchange Act of 1934, and for compliance with its duty to seek best execution.
*****
After an evaluation of the above-described factors and based on its deliberations and analysis of the information provided and alternatives considered, the Board, including all of the Independent Directors, unanimously approved the Advisory Agreement and the compensation payable thereunder.
| | Aberdeen Latin America Equity Fund, Inc. | 23 |
Management of the Fund (unaudited)
The names of the Directors and Officers of the Fund, their addresses, year of birth, and principal occupations during the past five years are provided in the tables below. Directors that are deemed “interested persons” (as that term is defined in Section 2(a)(19) of the Investment Company Act of 1940, as amended) of the Fund or the Fund’s investment adviser are included in the table below under the heading “Interested Directors.” Directors who are not interested persons, as described above, are referred to in the table below under the heading “Independent Directors.”
Board of Directors Information
Name, Address and Age | | Position(s) Held
With the Fund | | Term of Office
and Length of
Time Served | | Principal Occupation(s)
During Past Five Years | | Number of
Funds in
Fund Complex*
Overseen by
Director | | Other Directorships
Held by Director |
Independent Directors | | | | | | | | | | |
| | | | | | | | | | |
Enrique R. Arzac
c/o Aberdeen Asset
Management Inc.
Attn: US Legal
1735 Market Street,
32nd Floor,
Philadelphia, PA 19103 Year of Birth: 1941 | | Chairman of the Board of Directors, Nominating Committee Chairman and Audit and Valuation Committee Member | | Since 1996; Chairman since 2005; current term ends at the 2015 annual meeting | | Dr. Arzac is a Professor of Finance and Economics at the Columbia University Graduate School of Business. He is a director of The Adams Express Company, Petroleum & Resources Corporation, Credit Suisse closed-end funds, Credit Suisse U.S. Institutional funds, Aberdeen Asset Management U.S. registered closed-end emerging markets funds (Chair), Epoch Holding Corp. and Mirae Discovering Funds. Dr. Arzac has served as a financial consultant to the United Nations Conference on Trade and Development, the State of New Jersey and several U.S. and foreign corporations and financial institutions. He holds a CPN from the University of Buenos Aires and an M.B.A., M.A., and Ph.D. from Columbia University. | | 5 | | Director of Epoch Holding Corporation; Director of The Adams Express Company; Director of Petroleum and Resources Corporation; Director of Mirae Asset Management (5); Director of Credit Suisse Funds (3); Director of Credit Suisse Asset Management Income Fund Inc. and Credit Suisse High Bond Yield Fund |
| | | | | | | | | | |
James Cattano
1366 Wood Duck Trail
Naples, FL 34108
Year of Birth: 1943
| | Director, Audit and Valuation Committee Chairman and Nominating and Cost Review Committee Member | | Since 1989; current term ends at the 2014 annual Meeting | | Mr. Cattano is the President of Costal Trade Corporation (international commodity trade) October 2011. Previously, he was the President of Primary Resources Inc. (agricultural and raw materials) from 1996 to 2011. | | 5 | | Director of Credit Suisse Asset Management Income Fund, Inc. since 2006 and Director of Credit Suisse High Yield Bond Fund since 2006 |
| | | | | | | | | | |
Lawrence J. Fox
c/o Aberdeen Asset
Management Inc.
Attn: US Legal
1735 Market Street,
32nd Floor,
Philadelphia, PA 19103
Year of Birth: 1943
| | Director, Nominating Committee Member | | Since 2006; current term ends at the 2013 annual Meeting | | Mr. Fox has been a Partner at Drinker Biddle & Reath LLP (law firm) since 1972. He has also been a Lecturer at Yale Law School (education) since 2009. | | 4 | | Director of Credit Suisse Asset Management Income Fund, Inc. since 1990; Director of Credit Suisse High Yield Bond Fund since 2001; and Director of Dynasil Corp of America since 2011 |
| | | | | | | | | | |
Steven Rappaport
c/o Aberdeen Asset
Management Inc.
Attn: US Legal
1735 Market Street,
32nd Floor,
Philadelphia, PA 19103
Year of Birth: 1948
| | Director, Audit and Valuation, Nominating , and Cost Review Committee Member | | Since 2003; current term ends at the 2014 annual meeting | | Mr. Rappaport has been a Partner of Lehigh Court, LLC (private investment firm) and RZ Capital LLC (private investment firm) since 2004. | | 5 | | Director of iCAD, Inc., since 2006; Director of Presstek, Inc., since 2003; Director of Credit Suisse Funds (4); Director of Credit Suisse Asset Management Income Fund Inc. since 2005 and Credit Suisse High Yield Bond Fund since 2005 |
24 | Aberdeen Latin America Equity Fund, Inc. | | |
Management of the Fund (unaudited) (continued)
Name, Address and Age | | Position(s) Held
With the Fund | | Term of Office
and Length of
Time Served | | Principal Occupation(s)
During Past Five Years | | Number of
Funds in
Fund Complex*
Overseen by
Director | | Other Directorships
Held by Director |
Martin Torino c/o Aberdeen Asset Management Inc. Attn: US Legal 1735 Market Street, 32nd Floor, Philadelphia, PA 19103 Year of Birth: 1949 | | Director, Audit and Valuation, Nominating, and Cost Review Committee Member | | Since 2005; current term ends at the 2013 annual meeting | | Mr. Torino has been President of TA USA (agricultural sector) since May 1991; President of Rio Calchaqui SA (food and beverages) since June 2007. Previously he was President of Expreso Morell SA (transportation and logistics) from 2009-2012. | | 3 | | Director of San Lucas S.A. |
* | Aberdeen Asia-Pacific Income Fund, Inc., Aberdeen Global Income Fund, Inc., Aberdeen Australia Equity Fund, Inc., Aberdeen Chile Fund, Inc., Aberdeen Israel Fund, Inc., Aberdeen Indonesia Fund, Inc., Aberdeen Latin America Equity Fund, Inc., Aberdeen Emerging Markets Telecommunications and Infrastructure Fund, Inc., The Singapore Fund, Inc., The Asia-Tigers Fund, Inc., The India Fund, Inc. The Greater China Fund, Inc. and Aberdeen Funds have a common investment manager and/or investment adviser, or an investment adviser that is affiliated with the Investment Adviser, and may thus be deemed to be part of the same “Fund Complex.” |
Further information about the Fund’s Directors is available in the Fund’s Statement of Additional Information, which can be obtained without charge by calling 1-866-839-5233
Information Regarding Officers who are not Directors
Name, Address and Age | | Position(s) Held
With the Fund | | Term of Office
and Length of
Time Served | | Principal Occupation(s) During Past Five Years |
Officers | | | | | | |
| | | | | | |
Christian Pittard* c/o Aberdeen Asset Management Inc. Attn: US Legal 1735 Market Street, 32nd Floor, Philadelphia, PA 19103 Year of Birth: 1973 | | President | | Since July 2009 | | Currently, Group Head of Product Development for Aberdeen Asset Management PLC (parent company of the Investment Adviser). Previously Director and Vice President (from 2006 to 2008), Chief Executive Officer (from October 2005 to September 2006) and employee (since June 2005) of Aberdeen Asset Management Inc. (“AAMI”). He also currently serves as a Director of the Investment Adviser since 2010. |
| | | | | | |
Jeffrey Cotton* c/o Aberdeen Asset Management Inc. Attn: US Legal 1735 Market Street, 32nd Floor, Philadelphia, PA 19103 Year of Birth: 1977 | | Chief Compliance Officer, Vice President — Compliance | | Since March 2011 | | Currently, Vice President and Head of Compliance — U.S. for Aberdeen Asset Management Inc. Mr. Cotton joined Aberdeen in 2010. Prior to joining Aberdeen, Mr. Cotton was a Senior Compliance Officer at Old Mutual Asset Management (2009-2010) supporting its affiliated investment advisers and mutual fund platform. Mr. Cotton was also a VP, Senior Compliance Manager at Bank of America/Columbia Management (2006-2009). |
| | | | | | |
Andrea Melia* c/o Aberdeen Asset Management Inc. Attn: US Legal 1735 Market Street, 32nd Floor, Philadelphia, PA 19103 Year of Birth: 1969 | | Treasurer | | Since November 2009 | | Since November 2009, Ms. Melia currently serves as Vice President and Head of Fund Accounting for AAMI. Prior to joining Aberdeen, Ms. Melia was Director of Fund Administration and accounting oversight for Princeton Administrators LLC, a division of BlackRock Inc. and had worked with Princeton Administrators since 1992. |
| | | | | | |
Megan Kennedy* c/o Aberdeen Asset Management Inc. Attn: US Legal 1735 Market Street, 32nd Floor, Philadelphia, PA 19103 Year of Birth: 1974 | | Secretary and Vice President | | Since July 2009 | | Currently, Head of Product Management for AAMI (since 2009.) Ms. Kennedy joined AAMI in 2005 as a Senior Fund Administrator. Ms. Kennedy was promoted to Assistant Treasurer Collective Funds/North American Mutual Funds in February 2008 and promoted to Treasurer Collective Funds/North American Mutual Funds in July 2008. |
| | Aberdeen Latin America Equity Fund, Inc. | 25 |
Management of the Fund (unaudited) (continued)
Name, Address and Age | | Position(s) Held
With the Fund | | Term of Office
and Length of
Time Served | | Principal Occupation(s) During Past Five Years |
| | | | | | |
Alan Goodson* c/o Aberdeen Asset Management Inc. Attn: US Legal 1735 Market Street, 32nd Floor, Philadelphia, PA 19103 Year of Birth: 1974 | | Vice President | | Since July 2009 | | Currently, Head of Product US, overseeing both Product Management and Product Development for Aberdeen’s registered and unregistered investment companies in the US and Canada. Mr. Goodson is Vice President of Aberdeen Asset Management Inc. and joined Aberdeen in 2000. |
| | | | | | |
Joanne Irvine* c/o Aberdeen Asset Management Inc. Attn: US Legal 1735 Market Street, 32nd Floor, Philadelphia, PA 19103 Year of Birth: 1968 | | Vice President | | Since July 2009 | | Currently, Head of Emerging Markets Ex. Asia on the global emerging markets equities team in London (since 1997). Ms. Irvine joined Aberdeen in 1996 in a group development role. |
| | | | | | |
Devan Kaloo* c/o Aberdeen Asset Management Inc. Attn: US Legal 1735 Market Street, 32nd Floor, Philadelphia, PA 19103 Year of Birth: 1972 | | Vice President | | Since July 2009 | | Currently, Head of Global Emerging Markets (since 2005). Mr. Kaloo joined Aberdeen in 2000 on the Asian portfolio team before becoming responsible for the Asian ex Japan region as well as regional portfolios within emerging market mandates and technology stocks. |
| | | | | | |
Jennifer Nichols* c/o Aberdeen Asset Management Inc. Attn: US Legal 1735 Market Street, 32nd Floor, Philadelphia, PA 19103 Year of Birth: 1978 | | Vice President | | Since July 2009 | | Currently, Global Head of Legal for Aberdeen (2012). Ms. Nichols serves as a Director and Vice President for AAMI since 2010.She previously served as Head of Legal — Americas from 2010-2012. She joined AAMI in October 2006. |
| | | | | | |
Nick Robinson* c/o Aberdeen Asset Management Inc. Attn: US Legal 1735 Market Street, 32nd Floor, Philadelphia, PA 19103 Year of Birth: 1978 | | Vice President | | Since June 2011 | | Currently, Director and Head of Brazilian Equities, of Aberdeen’s operations in São Paulo. Nick joined Aberdeen in 2000 and spent eight years on the North American Equities desk, including three years based in Aberdeen’s US offices. In 2008 he returned to London to join the global emerging markets equities team. Mr. Robinson relocated to São Paulo in 2009. |
| | | | | | |
Lucia Sitar* c/o Aberdeen Asset Management Inc. Attn: US Legal 1735 Market Street, 32nd Floor, Philadelphia, PA 19103 Year of Birth: 1971 | | Vice President | | Since July 2009 | | Currently, U.S. Counsel for AAMI. Ms. Sitar joined AAMI in July 2007. |
| | | | | | |
Hugh Young** c/o Aberdeen Asset Management Inc. Attn: US Legal 1735 Market Street, 32nd Floor, Philadelphia, PA 19103 Year of Birth: 1958 | | Vice President | | Since July 2009 | | Mr. Young is currently a member of the Executive Management Committee of Aberdeen Asset Management PLC. He has been Managing Director of Aberdeen Asset Management Asia Limited (“AAMAL”), since 1991. Mr. Young also served as a Director of Aberdeen Asset Managers (C.I.) Limited from 2000 to June 2005 and a Director of AAMAL since 2000. |
| | | | | | |
Sharon Ferrari* c/o Aberdeen Asset Management Inc. Attn: US Legal 1735 Market Street, 32nd Floor, Philadelphia, PA 19103 Year of Birth: 1977 | | Assistant Treasurer | | Since June 2011 | | Currently, Fund Accounting Manager for AAMI. She joined AAMI as a Senior Fund Administrator in 2008. Prior to joining AAMI, she was an Accounting Analyst at Delaware Investments. |
26 | Aberdeen Latin America Equity Fund, Inc. | | |
Management of the Fund (unaudited) (concluded)
Name, Address and Age | | Position(s) Held
With the Fund | | Term of Office
and Length of
Time Served | | Principal Occupation(s) During Past Five Years |
| | | | | | |
Heather Hasson* c/o Aberdeen Asset Management Inc. Attn: US Legal 1735 Market Street, 32nd Floor, Philadelphia, PA 19103 Year of Birth: 1982 | | Assistant Secretary | | Since March 2012 | | Currently, Senior Product Manager for Aberdeen Asset Management Inc. Ms. Hasson joined AAMI as a Fund Administrator in November 2006. |
* | As of October 2012, Messrs. Pittard, Cotton, Goodson, Kaloo, and Robinson and Mses. Nichols, Irvine, Melia, Kennedy, Sitar, Ferrari and Hasson hold officer position(s) in one or more of the following: Aberdeen Asia-Pacific Income Fund, Inc., Aberdeen Global Income Fund, Inc., Aberdeen Australia Equity Fund, Inc., Aberdeen Chile Fund, Inc., Aberdeen Emerging Markets Telecommunications and Infrastructure Fund, Inc., Aberdeen Israel Fund, Inc., Aberdeen Indonesia Fund, Inc., Aberdeen Latin America Equity Fund, Inc., The Singapore Fund Inc., The India Fund Inc., The Asia-Tigers Fund Inc., The Greater China Fund, Inc. and the Aberdeen Funds each of which may also be deemed to be a part of the same “Fund Complex.” |
** | Mr. Young serves as an Interested Director on the Aberdeen Australia Equity Fund, Inc. and The India Fund, Inc. which has a common investment manager and/or Investment Adviser with the Fund, or an investment adviser that is affiliated with the investment manager and Investment Adviser with the Fund, and may thus be deemed to be part of the same “Fund Complex” as the Fund. |
| | Aberdeen Latin America Equity Fund, Inc. | 27 |
[THIS PAGE INTENTIONALLY LEFT BLANK]
Corporate Information
Directors | Chilean Administrator |
Enrique R. Arzac, Chairman | Celfin Capital Servicios Financieros S.A. |
James J. Cattano | Apoquindo 3721, Piso 19 |
Lawrence J. Fox | Santiago, Chile |
Steven N. Rappaport | |
Martin M. Torino | Shareholder Servicing Agent |
| Computershare Trust Company, N.A. |
Officers | 250 Royall Street |
Christian Pittard, President | Canton, MA 02021 |
Jeffrey Cotton, Vice President and Chief Compliance Officer | |
Andrea Melia, Treasurer and Chief Financial Officer | Independent Registered Public Accounting Firm |
Megan Kennedy, Vice President and Secretary | PricewaterhouseCoopers LLP |
Alan Goodson, Vice President | 300 Madison Avenue |
Joanne Irvine, Vice President | New York, NY 10017 |
Devan Kaloo, Vice President | |
Jennifer Nichols, Vice President | Legal Counsel |
Nick Robinson, Vice President | Willkie Farr & Gallagher LLP |
Lucia Sitar, Vice President | 787 Seventh Avenue |
Hugh Young, Vice President | New York, NY 10019 |
Sharon Ferrari, Assistant Treasurer | |
Heather Hasson, Assistant Secretary | Investor Relations |
| Aberdeen Asset Management Inc. |
Investment Adviser | 1735 Market Street, 32nd Floor |
Aberdeen Asset Managers Limited | Philadelphia, PA 19103 |
Bow Bells House | 1-866-839-5205 |
1 Bread Street | InvestorRelations@aberdeen-asset.com |
London, United Kingdom | |
EC4M 9HH | |
| |
U.S. Administrator & Custodian | |
Brown Brothers Harriman & Co. | |
40 Water Street | |
Boston, MA 02109 | |

Aberdeen Asset Managers Limited
Notice is hereby given in accordance with Section 23(c) of the Investment Company Act of 1940 that the Fund may purchase, from time to time, shares of its common stock in the open market.
Shares of Aberdeen Latin America Equity Fund, Inc. are traded on the NYSE MKT Exchange under the symbol “LAQ”. Information about the Fund’s net asset value and market price is available at www.aberdeenlaq.com.
This report, including the financial information herein, is transmitted to the shareholders of Aberdeen Latin America Equity Fund, Inc. for their general information only. It does not have regard to the specific investment objectives, financial situation and the particular needs of any specific person. Past performance is no guarantee of future returns.

Item 2 – Code of Ethics.
(a) As of the end of the period covered by this report, the Registrant has adopted a Code of Ethics (the “Code of Ethics”) that applies to the Registrant’s principal executive officer, principal financial officer, and principal accounting officer or controller or persons performing similar functions, regardless of whether these individuals are employed by the Registrant or a third party.
(b) Not applicable.
(c) During the period covered by this report, there were no material changes to the Code of Ethics.
(d) The Registrant has not granted any waivers during the period covered by this report, including an implicit waiver, from any provisions of the Code of Ethics.
(e) Not applicable.
(f) A copy of the Registrant’s Code of Ethics is filed as an exhibit hereto.
Item 3 – Audit Committee Financial Expert.
The Board of Directors of the Registrant has determined that the following members of its Audit and Valuation Committee qualify as “Audit Committee Financial Experts,” as that term is defined in Item 3 of Form N-CSR: Mr. Enrique R. Arzac and Mr. Steven N. Rappaport. Mr. Arzac and Mr. Rappaport are considered by the Board to be “Independent Directors,” as that term is defined in Item 3 of Form N-CSR.
Item 4 – Principal Accountant Fees and Services.
(a) – (d) Below is a table reflecting the fee information requested in Items 4(a) through (d):
Fiscal
Year Ended | | (a)
Audit Fees | | (b)
Audit-Related Fees | | (c)1
Tax Fees | | (d)2
All Other Fees |
December 31, 2012 | | $43,600 | | $0 | | $5,400 | | $14,480 |
December 31, 2011 | | $43,600 | | $0 | | $5,400 | | $14,480 |
1 The Tax Fees are for the completion of the Registrant’s federal and state tax returns.
2 Includes local government review and repatriation process.
(e)(1) The Registrant’s Audit and Valuation Committee has adopted an Audit and Valuation Committee Charter that provides that the Audit and Valuation Committee shall annually select, retain or terminate the Fund’s independent auditor and, in connection therewith, to evaluate the terms of the engagement (including compensation of the auditor) and the qualifications and independence of the independent auditor, including whether the independent auditor provides any consulting, auditing or tax services to the Investment Adviser, and to receive the independent auditor’s specific representations as to their independence, delineating all relationships between the independent auditor and the Registrant, consistent with the Independent Standards Board (“ISB”) Standard No. 1. The Audit and Valuation Committee Charter also
provides that the Audit and Valuation Committee shall review in advance, and consider approval of, any and all proposals by Management or the Investment Adviser that the Registrant, Investment Adviser or their affiliated persons, employ the independent auditor to render “permissible non-audit services” to the Registrant and to consider whether such services are consistent with the independent auditor’s independence.
(e)(2) None of the services described in each of paragraphs (b) through (d) of this Item involved a waiver of the pre-approval requirement by the Audit and Valuation Committee pursuant to Rule 2-01 (c)(7)(i)(C) of Regulation S-X.
(f) Not applicable.
(g) Non-Audit Fees
For the fiscal year ended December 31, 2012, PWC billed $2,254,290 for aggregate non-audit fees for services to the Registrant and to the Registrant’s Investment Adviser (not including any sub-adviser whose role is primarily portfolio management and is subcontracted with or overseen by another investment adviser) and any entity controlling, controlled by, or under common control with the Investment Adviser that provides ongoing services to the Registrant (“Registrant’s Covered Service Providers”). For the fiscal year ended December 31, 2011, PWC billed $1,874,276 for aggregate non-audit fees for services to the Registrant and to the Covered Service Providers.
(h) The Registrant’s Audit and Valuation Committee of the Board of Directors has considered whether the provision of non-audit services that were rendered to the Registrant’s Covered Service Providers that were not pre-approved pursuant to paragraph (c)(7)(ii) of Rule 2-01 of Regulation S-X is compatible with maintaining the principal accountant’s independence and has concluded that it is.
Item 5 – Audit Committee of Listed Registrants.
(a) The Registrant has a separately-designated standing audit committee established in accordance with Section 3(a)(58)(A) of the Securities Exchange Act of 1934, as amended.
For the fiscal year ended December 31, 2012, the audit committee members were:
Enrique R. Arzac
James J. Cattano
Steven N. Rappaport
Martin M. Torino
(b) Not applicable.
Item 6 – Investments.
(a) Included as part of the Report to Shareholders filed under Item 1 of this Form N-CSR.
(b) Not applicable.
Item 7 – Disclosure of Proxy Voting Policies and Procedures for Closed-End Management
Investment Companies.
Pursuant to the Registrant’s Proxy Voting Policy and Procedures, the Registrant has delegated responsibility for its proxy voting to its Investment Adviser, provided that the Registrant’s Board of Directors has the opportunity to periodically review the Investment Adviser’s proxy voting policies and material amendments thereto. The Registrant’s Board of Directors most recently ratified the proxy voting policies of the Investment Adviser in June 2012.
The proxy voting policies of the Registrant are referenced in Exhibit A and Investment Adviser are referenced in Exhibit B.
Item 8 - Portfolio Managers of Closed-End Management Investment Companies.
(a)(1) The information in the table below is as of March 8, 2013
Individual & Position | Services Rendered | Past Business Experience |
Devan Kaloo
Head of Global Emerging Markets | Head of global emerging markets, responsible for the London based Global Emerging Markets team, which manages Latin America and EMEA equities, and also has oversight of GEM input from the Asia team based in Singapore. | Joined Aberdeen in 2000 on the Asian portfolio team before becoming responsible for the Asian ex Japan region as well as regional portfolios within emerging market mandates and technology stocks. Previously, worked for Martin Currie on the North American desk before transferring to the global asset allocation team and then Asian portfolios. |
Andy Brown
Senior Investment Manager | Responsible for investment management on the global emerging markets equities team. | Joined Aberdeen in May of 2005 after graduation from St. Andrews University, Scotland. |
Stephen Parr
Investment Manager - EMEA | Responsible for investment management on the global emerging markets equities team. | Joined Aberdeen in July 2009 via the acquisition of Credit Suisse Asset Management. Currently an investment manager. Previously, Mr. Parr worked for Energis Communications as Head of Strategy. Prior to that he worked for Ernst & Young Management Consultants as a Managing Consultant. |
Fiona Manning
Senior Investment Manager | Responsible for investment management on the global emerging markets equities team. | Joined Aberdeen in 2005 via the acquisition of Deutsche Asset Management’s London and Philadelphia fixed income businesses. |
Nick Robinson
Director – Head of Brazilian Equities | Responsible for investment management on the global emerging markets equity team and Director of Aberdeen’s operations in São Paulo | Joined Aberdeen in 2000 and spent eight years on the North American Equities desk, including three years based in Aberdeen’s US offices. In 2008 he returned to London to join the global emerging markets equities team. Nick relocated to São Paulo in 2009. |
a(2)
The following table provides information about portfolios and accounts for which Portfolio Managers are primarily responsible for the day-to-day portfolio management as of December 31, 2012:
Name of
Portfolio Manager | | Type of Accounts | | Total
Number
of
Accounts
Managed | | Total Assets
($ Millions) | | Number of
Accounts
Managed for
Which
Advisory
Fee is Based
on
Performance | | Total Assets for
Which
Advisory Fee is
Based on
Performance
($ Millions) |
Devan Kaloo | | | | | | | | | | |
| | Registered Investment Companies | | 8 | | $ | 10,613.03 | | 0 | | $ | 0 |
| | | | | | | | | | |
| | Pooled Investment Vehicles | | 24 | | $ | 35,627.72 | | 0 | | $ | 0 |
| | | | | | | | | | |
| | Other Accounts | | 56 | | $ | 19,795.26 | | 4 | | $ | 905.47 |
| | | | | | | | | | |
Andy Brown | | | | | | | | | | |
| | Registered Investment Companies | | 8 | | $ | 10,613.03 | | 0 | | $ | 0 |
| | | | | | | | | | |
| | Pooled Investment Vehicles | | 24 | | $ | 35,627.72 | | 0 | | $ | 0 |
| | | | | | | | | | |
| | Other Accounts | | 56 | | $ | 19,795.26 | | 4 | | $ | 905.47 |
| | | | | | | | | | |
Stephen Parr | | | | | | | | | | |
| | Registered Investment Companies | | 8 | | $ | 10,613.03 | | 0 | | $ | 0 |
| | | | | | | | | | |
| | Pooled Investment Vehicles | | 24 | | $ | 35,627.72 | | 0 | | $ | 0 |
| | | | | | | | | | |
| | Other Accounts | | 56 | | $ | 19,795.26 | | 4 | | $ | 905.47 |
| | | | | | | | | | |
Fiona Manning | | | | | | | | | | |
| | Registered Investment Companies | | 8 | | $ | 10,613.03 | | 0 | | $ | 0 |
| | | | | | | | | | |
| | Pooled Investment Vehicles | | 24 | | $ | 35,627.72 | | 0 | | $ | 0 |
| | | | | | | | | | |
| | Other Accounts | | 56 | | $ | 19,795.26 | | 4 | | $ | 905.47 |
| | | | | | | | | | |
Nick Robinson | | | | | | | | | | |
| | Registered Investment Companies | | 8 | | $ | 10,613.03 | | 0 | | $ | 0 |
| | | | | | | | | | |
| | Pooled Investment Vehicles | | 24 | | $ | 35,627.72 | | 0 | | $ | 0 |
| | | | | | | | | | |
| | Other Accounts | | 56 | | $ | 19,795.26 | | 4 | | $ | 905.47 |
Total assets are as of December 31, 2012 and have been translated to U.S. dollars at a rate of £1.00 = $1.63.
The portfolio managers’ management of other registered investment companies, other pooled investment vehicles, and other accounts may give rise to potential conflicts of interest in connection with their management of the Registrant’s investments, on the one hand, and the investments of these other accounts, on the other. These other accounts may have the same investment objective as the Registrant. Therefore, a potential conflict of interest may arise as a result of the identical investment objectives, whereby the portfolio manager could favor one account over another. However, the Investment Adviser believes that these risks are mitigated by the fact that: (i) accounts with like investment strategies managed by a particular portfolio manager are generally managed in a similar fashion, subject to exceptions to account for particular investment restrictions or policies applicable only to certain accounts, differences in cash flows and account sizes, and similar factors; and (ii) portfolio manager personal trading is monitored to avoid potential conflicts. In addition, the
Investment Adviser has adopted trade allocation procedures that require equitable allocation of trade orders for a particular security among participating accounts.
In some cases, other accounts managed by the same portfolio manager may compensate the Investment Adviser or its affiliates based on the performance of the portfolio held by that account. The existence of such a performance-based fee may create additional conflicts of interest for the portfolio manager in the allocation of management time, resources and investment opportunities.
Another potential conflict could include instances in which securities considered as investments for the Registrant also may be appropriate for other investment accounts managed by the Investment Adviser or its affiliates. Whenever decisions are made to buy or sell securities by the Registrant and one or more of the other accounts simultaneously, the Investment Adviser may aggregate the purchases and sales of the securities and will allocate the securities transactions in a manner that it believes to be equitable under the circumstances. As a result of the allocations, there may be instances where the Registrant will not participate in a transaction that is allocated among other accounts. While these aggregation and allocation policies could have a detrimental effect on the price or amount of the securities available to the Registrant from time to time, it is the opinion of the Investment Adviser that the benefits from the Investment Adviser organization outweigh any disadvantage that may arise from exposure to simultaneous transactions. The Registrant has adopted policies that are designed to eliminate or minimize conflicts of interest, although there is no guarantee that procedures adopted under such policies will detect each and every situation in which a conflict arises.
(a)(3) Aberdeen Asset Management PLC’s (“Aberdeen”) remuneration policies (the “Policy”) are designed to support our business strategy, as a leading international asset manager. The objective is to attract, retain and reward talented individuals for the delivery of sustained, superior returns for our clients and shareholders. Aberdeen operates in a highly competitive international employment market, and aims to maintain its strong track record of success in developing and retaining talent.
The policy is to recognise corporate and individual achievements each year through an appropriate annual bonus scheme. The aggregate value of awards in any year is dependent on the Group’s overall performance and profitability. Consideration is also given to the levels of bonuses paid in the market. Individual awards which are payable to all members of staff are non-pensionable, are determined by a rigorous assessment of achievement against defined objectives.
A long-term incentive plan for key staff and senior employees comprises of a mixture of cash and deferred shares in AAM PLC or select Aberdeen funds (where applicable). Overall compensation packages are designed to be competitive relative to the investment management industry.
Base Salary
Any increase is to reflect inflation and is applied in a manner consistent with other Group employees; any other increases must be justified by reference to promotion or changes in responsibilities. The Policy is to pay a fair salary commensurate with the individual’s role, responsibilities and experience, and having regard to the market rates being offered for similar roles in the asset management sector and other comparable companies.
Annual Bonus
The Policy is to recognise corporate and individual achievements each year through an appropriate annual bonus scheme. The Remuneration Committee determines the KPI’s that will be applied in
considering the overall size of the bonus pool. In line with practice amongst other asset management companies, individual bonuses are not subject to an absolute cap. However, the aggregate size of the bonus pool is dependent on the group’s overall performance and profitability. Consideration is also given to the levels of bonuses paid in the market. Individual awards are determined by a rigorous assessment of achievement against defined objectives, and are reviewed and approved by the Remuneration Committee.
The deferral policy is intended to assist in the retention of talent and to create additional alignment of executives’ interests with Aberdeen’s sustained performance and, in respect of the deferral into funds, managed by Aberdeen, to align the interest of asset managers with our clients.
Staff performance is reviewed formally at least once a year. The review process looks at all of the ways in which an individual has contributed to the Aberdeen Group, and specifically, in the case of portfolio managers, to the relevant investment team. Discretionary bonuses are based on client service, asset growth and the performance of the respective portfolio manager. Overall participation in team meetings, generation of original research ideas and contribution to presenting the team externally are also evaluated.
In the calculation of a portfolio management team’s bonus, the Aberdeen Group takes into consideration investment matters (which include the performance of funds, adherence to the company investment process, and quality of company meetings) as well as more subjective issues such as team participation and effectiveness at client presentations. To the extent performance is factored in, such performance is not judged against any specific benchmark and is evaluated over the period of a year - January to December. The pre- or after-tax performance of an individual account is not considered in the determination of a portfolio manager’s discretionary bonus; rather the review process evaluates the overall performance of the team for all of the accounts they manage.
Portfolio manager performance on investment matters is judged over all of the accounts the portfolio manager contributes to and is documented in the appraisal process. A combination of the team’s and individual’s performance is considered and evaluated.
Although performance is not a substantial portion of a portfolio manager’s compensation, the Aberdeen Group also recognizes that fund performance can often be driven by factors outside one’s control, such as (irrational) markets, and as such pays attention to the effort by portfolio managers to ensure integrity of our core process by sticking to disciplines and processes set, regardless of momentum and ‘hot’ themes. Short-terming is thus discouraged and trading-oriented managers will thus find it difficult to thrive in the Aberdeen Group’s environment. Additionally, if any of the aforementioned undue risks were to be taken by a portfolio manager, such trend would be identified via Aberdeen’s dynamic compliance monitoring system.
Long-Term Incentives
As part of an effective remuneration package, a long-term incentive plan is used to structure the package so as to retain, motivate, and reward key staff members with a view to improving their performance and thereby increasing the value of the Aberdeen Group for the benefit of shareholders. Long-term incentive plans can be either fund or share based and typically vest over one, two and three year periods.
(4)(a)
Individual | Dollar Range of Equity Securities in the
Registrant Beneficially Owned by the Portfolio
Manager as of December 31, 2012 |
Devan Kaloo | $0 |
Andy Brown | $0 |
Stephen Parr | $0 |
Fiona Manning | $0 |
Nick Robinson | $0 |
(b) Not applicable.
Item 9 – Purchases of Equity Securities by Closed-End Management Investment Company and Affiliated Purchasers.
REGISTRANT PURCHASES OF EQUITY SECURITIES
Period | (a)
Total Number of
Shares Purchased | (b)
Average Price Paid
per Share | (c)
Total Number of
Shares Purchased
as Part of Publicly
Announced Plans
or Programs 1 | (d)
Maximum Number
of Shares That May
Yet Be Purchased
Under the Plans or
Programs 1 |
January 1 through January 31, 2012 | 0 | 0 | 0 | 345,575 |
February 1 through February 29, 2012 | 0 | 0 | 0 | 345,575 |
March 1 through March 31, 2012 | 0 | 0 | 0 | 345,575 |
April 1 through April 30, 2012 | 0 | 0 | 0 | 345,575 |
May 1 through May 31, 2012 | 0 | 0 | 0 | 345,575 |
June 1 through June 30, 2012 | 0 | 0 | 0 | 345,575 |
July 1 through July 31, 2012 | 0 | 0 | 0 | 345,575 |
August 1 through August 31, 2012 | 0 | 0 | 0 | 345,575 |
September 1 through September 30, 2012 | 0 | 0 | 0 | 345,575 |
October 1 through October 31, 2012 | 0 | 0 | 0 | 345,575 |
November 1 through November 30, 2012 | 0 | 0 | 0 | 345,575 |
December 1 through December 31, 2012 | 0 | 0 | 0 | 345,575 |
Total | 0 | 0 | 0 | 345,575 |
1 The plan was announced on November 16, 2007. The program authorizes management to make open market purchases from time to time in an amount up to 10% of the Fund’s outstanding shares. Such purchases may be made when the Fund’s shares are trading at a discount to net asset value of 12% or more. The plan does not have an expiration date.
Item 10 – Submission of Matters to a Vote of Security Holders.
During the period ended December 31, 2012, there were no material changes to the policies by which stockholders may recommend nominees to the Fund’s Board.
Item 11 – Controls and Procedures.
(a) The Registrant’s principal executive and principal financial officers, or persons performing similar functions, have concluded that the Registrant’s disclosure controls and procedures (as defined in Rule 30a-3(c) under the Investment Company Act of 1940, as amended (the “1940 Act”) (17 CFR 270.30a-3(c))) are effective, as of a date within 90 days of the filing date of this report that includes the disclosure required by this paragraph, based on their evaluation of the controls and procedures required by Rule 30a-3(b) under the 1940 Act (17 CFR 270.30a-3(b)) and Rules 13a-15(b) or 15d-15(b) under the Securities Exchange Act of 1934, as amended (the “Exchange Act”) (17 CFR 240.13a-15(b) or 240.15d-15(b)).
(b) There have been no changes in the Registrant’s internal control over financial reporting that occurred during the second fiscal quarter of the period covered by this report that have materially affected, or is reasonably likely to materially affect, the Registrant’s internal control over financial reporting.
Item 12 – Exhibits.
(a)(1) Code of Ethics pursuant to Item 2(f) of this Form N-CSR.
(a)(2) Certifications pursuant to Rule 30a-2(a) under the Investment Company Act of 1940, as amended.
(a)(3) Not applicable.
(b) Certifications pursuant to Rule 30a-2(b) under the Investment Company Act of 1940, as amended.
SIGNATURES
Pursuant to the requirements of the Securities Exchange Act of 1934 and the Investment Company Act of 1940, the Registrant has duly caused this report to be signed on its behalf by the undersigned, thereunto duly authorized.
Aberdeen Latin American Equity Fund, Inc. | |
| | |
| | |
By: | /s/ Christian Pittard | |
| Christian Pittard, | |
| Principal Executive Officer of | |
| Aberdeen Latin America Equity Fund, Inc. | |
| | |
Date: | March 8, 2013 | |
Pursuant to the requirements of the Securities Exchange Act of 1934 and the Investment Company Act of 1940, this report has been signed below by the following persons on behalf of the Registrant and in the capacities and on the dates indicated.
By: | /s/ Christian Pittard | |
| Christian Pittard, | |
| Principal Executive Officer of | |
| Aberdeen Latin American Equity Fund, Inc. | |
| | |
Date: | March 8, 2013 | |
| | |
| | |
By: | /s/ Andrea Melia | |
| Andrea Melia, | |
| Principal Financial Officer of | |
| Aberdeen Latin America Equity Fund, Inc. | |
| | |
Date: | March 8, 2013 | |
EXHIBIT LIST
12(a)(1) – Code of Ethics
A – Registrant’s Proxy Voting Policies
B – Registrant’s and Investment Adviser’s Proxy Voting Policies
12(a)(2) – Rule 30a-2(a) Certifications
12(b) – Rule 30a-2(b) Certifications