UNITED STATES
SECURITIES AND EXCHANGE COMMISSION
Washington, D.C. 20549
FORM N-CSR
CERTIFIED SHAREHOLDER REPORT OF REGISTERED
MANAGEMENT INVESTMENT COMPANIES
| | | |
| Investment Company Act file number: | | 811-06094 |
| | |
| Exact name of registrant as specified in charter: | | The Latin America Equity Fund, Inc. |
| | |
| Address of principal executive offices: | | 1735 Market Street, 32nd Floor Philadelphia, PA 19103 |
| | |
| Name and address of agent for service: | | Ms. Andrea Melia Aberdeen Asset Management Inc. 1735 Market Street, 32nd Floor Philadelphia, PA 19103 |
| | |
| Registrant’s telephone number, including area code: | | 866-839-5205 |
| | |
| Date of fiscal year end: | | December 31 |
| | |
| Date of reporting period: | | December 31, 2009 |
Item 1. Reports to Stockholders.
THE LATIN AMERICA
EQUITY FUND, INC.
ANNUAL REPORT
DECEMBER 31, 2009
LAQ-AR-1209
LETTER TO SHAREHOLDERS (UNAUDITED)
Dear Shareholder,
We present this Annual Report which covers the activities of The Latin America Equity Fund, Inc. (the "Fund") for the year ended December 31, 2009. The Fund's principal investment objective is to seek long-term capital appreciation by investing primarily in Latin America equity securities.
For the year ended December 31, 2009, the total return to shareholders of the Fund based on the net asset value (NAV) of the Fund was 109.3% versus a 104.2% in the Fund's benchmark, the Morgan Stanley Capital International EM Latin America Index. Based on market price, the Fund's shares gained 120.9% during the year, assuming reinvestment of dividends and distributions.
Share Price Performance
The Fund's share price increased 115.53% over the twelve months, from $18.29 on December 31, 2008 to $39.42 on December 31, 2009. The Fund's share price on December 31, 2009 represented a discount of 9.2% to the NAV per share of $43.41 on that date, compared with a discount of 14.0% to the NAV per share of $21.26 on December 31, 2008. As of February 17, 2010, the share price was $37.60, representing a discount of 9.6% to the NAV per share of $41.57.
Change In Legal Entity Name
Since Aberdeen Asset Management Investment Services Limited ("Aberdeen") now serves as investment manager of the Fund, the Board believes it is appropriate to add "Aberdeen" to the fund's name in order to identify the Fund's manager more clearly and to differentiate the funds in a competitive market with many known brands. Aberdeen is an independent global asset manager, a market leader in global emerging markets, managing approximately US$29.4 billion of assets in emerging market equities and bonds. It should be noted that the Fund's ticker, LAQ, will remain the same.
Market Review
Latin American equities continued to lead gains in the broader emerging markets asset class during the fourth quarter of 2009, increased by a greater risk appetite, the G-20 pledge to maintain stimulus measures, as well as encouraging manufacturing and US economic data. Brazil's decision to tax foreign capital inflows to stem the appreciation of the currency decreased the sentiment temporarily, but the liquidity-led rally appeared to remain intact. Chile led the region, due to solid copper prices on the back of robust Chinese demand, and as industrial production in the nation unexpectedly grew for the first time in more than a year.
Following the transition of investment adviser from Credit Suisse Asset Management, Aberdeen completed several transactions in an effort to align the Fund with Aberdeen's investment process. During the period, the Fund was bought in line with the model portfolio and a position was built in the Brazilian port operator Wilson Sons Ltd. and Brazilian mall operator Multiplan Empreendimentos Imobiliarios, SA. The Fund is now managed in line with Aberdeen's fundamental, bottom-up investment process. Celfin Capital Servicios Financieros S.A. continues in its role as sub-adviser to the Fund.
Outlook
Latin American markets may rally further amid flush liquidity in the short term, but uncertainty and volatility may persist. For now, most policymakers appear to have decided that it is wise to continue the extraordinary fiscal stimulus,
1
LETTER TO SHAREHOLDERS (UNAUDITED) (CONTINUED)
although such a stimulus cannot continue indefinitely. The risk of asset bubbles could become more pronounced, if US interest rates stay low, restricting any recovery of the US dollar. The effect on developing countries will depend on the ability to improve domestic demand in the face of developed economies' tepid recovery.
In the current economic environment, we will continue to uphold our disciplined process of investing in fundamentally strong companies, which we believe will deliver solid long-term results.
Dividend Reinvestment And Cash Purchase Plan
We invite you to participate in the Fund's Dividend Reinvestment and Cash Purchase Plan (the "Plan"), which allows you to automatically reinvest your distributions in shares of the Fund's common stock at favorable commission rates. Distributions made under the Plan are taxable to the same extent as are cash distributions. The Plan also enables you to make additional cash investments in shares of at least $100 per transaction. To request a brochure containing more information on the Plan, together with an enrollment form, please contact the Plan Agent toll free at 1-800-647-0584 (international 1-781-575-3100).
Investor Relations Information
For information about the Fund, daily updates of share price, NAV and details of recent distributions, please contact Aberdeen by:
• calling toll free at 1-866-839-5205 in the United States,
• e-mailing InvestorRelations@aberdeen-asset.com, or
• visiting the website at www.aberdeenlaq.com.
For information about the Aberdeen Group, visit the Aberdeen website at www.aberdeen-asset.us.
Finally included within this report is a postage paid reply card which would register you into the Aberdeen enhanced email service. Following receipt of the completed form, updated investment information relating to the closed end funds would be circulated to your attention.
Yours sincerely,

Christian Pittard
President
2
THE LATIN AMERICA EQUITY FUND, INC.
PORTFOLIO SUMMARY
DECEMBER 31, 2009 (UNAUDITED)
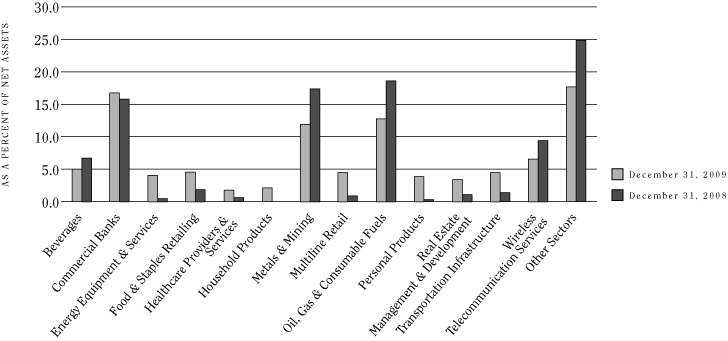
SECTOR ALLOCATION
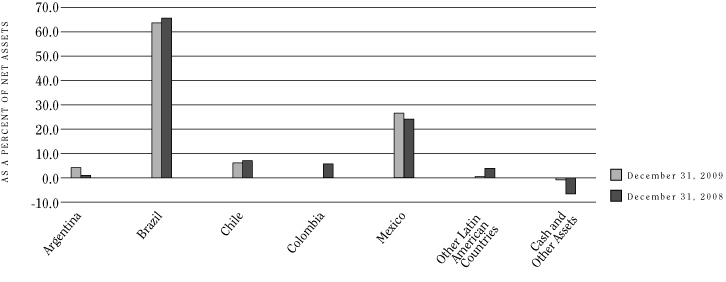
GEOGRAPHIC ASSET BREAKDOWN
3
THE LATIN AMERICA EQUITY FUND, INC.
PORTFOLIO SUMMARY (CONTINUED)
DECEMBER 31, 2009 (UNAUDITED)
TOP 10 HOLDINGS, BY ISSUER
| | | Holding | | Sector | | Country | | Percentage of
Net Assets | |
| | 1. | | | Petroleo Brasileiro S.A. | | Oil, Gas & Consumable Fuels | | Brazil | | | 8.9 | % | |
| | 2. | | | Vale S.A. | | Metals & Mining | | Brazil | | | 8.8 | % | |
| | 3. | | | Banco Bradesco S.A. | | Commercial Banks | | Brazil | | | 8.7 | % | |
| | 4. | | | América Móvil S.A.B. de C.V. | | Wireless Telecommunication Services | | Mexico | | | 6.6 | % | |
| | 5. | | | Fomento Economico Mexicano, S.A. de C.V. | | Beverages | | Mexico | | | 4.6 | % | |
| | 6. | | | Lojas Renner S.A. | | Multiline Retail | | Brazil | | | 4.4 | % | |
| | 7. | | | Tenaris S.A. | | Energy Equipment & Services | | Argentina | | | 4.1 | % | |
| | 8. | | | Grupo Financiero Banorte S.A.B. de C.V. | | Commercial Banks | | Mexico | | | 4.1 | % | |
| | 9. | | | Ultrapar Participacoes S.A. | | Oil, Gas & Consumable Fuels | | Brazil | | | 3.9 | % | |
| | 10. | | | Natura Cosmeticos S.A. | | Personal Products | | Brazil | | | 3.9 | % | |
AVERAGE ANNUAL RETURNS
DECEMBER 31, 2009 (UNAUDITED)
| | | 1 Year | | 3 Years | | 5 Years | | 10 Years | |
| Net Asset Value (NAV) | | | 109.30 | % | | | 13.57 | % | | | 26.35 | % | | | 16.71 | % | |
| Market Value | | | 120.93 | % | | | 12.30 | % | | | 26.94 | % | | | 19.11 | % | |
During the fiscal year, Credit Suisse Asset Management, LLC waived fees and/or reimbursed expenses, without which performance would be lower. Aberdeen Asset Management Investment Services Limited may waive fees and/or reimburse expenses, but has made no determination to do so. Without such waivers and/or reimbursed expenses, performance would be lower. Waivers and/or reimbursements are subject to change and may be discontinued at any time. Returns represent past performance. Total investment return at net asset value is based on changes in the net asset value of fund shares and assumes reinvestment of dividends and distributions, if any. Total investment return at market value is based on changes in the market price at which the fund's shares traded on the stock exchange during the period and assumes reinvestment of dividends and distributions, if any, at actual prices pursuant to the fund's dividend reinvestment program. Because the fund's shares trade in the stock market based on investor demand, the fund may trade at a price higher or lower than its NAV. Therefore, returns are calculated based on share price and NAV. Past performance is no guarantee of future results. The current performance of the fund may be lower or higher than the figures shown. The fund's yield, return and market price and NAV will fluctuate. Performance information current to the most recent month-end is available by calling 866-839-5205.
The annualized gross expense ratio is 1.28%. The annualized net expense ratio after fee waivers and/or expense reimbursements is 1.28%.
4
THE LATIN AMERICA EQUITY FUND, INC.
SCHEDULE OF INVESTMENTS
DECEMBER 31, 2009
| Description | | No. of
Shares | | Value | |
| EQUITY OR EQUITY-LINKED SECURITIES-101.0% | |
| ARGENTINA-4.1% | |
| ENERGY EQUIPMENT & SERVICES-4.1% | |
Tenaris S.A., ADR
(Cost $10,137,960) | | | 254,910 | | | $ | 10,871,911 | | |
| BRAZIL-63.7% | |
| COMMERCIAL BANKS-11.7% | |
| Banco Bradesco S.A. | | | 860,000 | | | | 14,795,434 | | |
| Banco Bradesco S.A., PN | | | 388,100 | | | | 8,099,517 | | |
Banco Itaú Holding Financeira
S.A., PN | | | 87,302 | | | | 1,937,652 | | |
Itau Unibanco Banco Multiplo
S.A., ADR | | | 266,286 | | | | 6,081,972 | | |
| | | | 30,914,575 | | |
| COMMERCIAL SERVICES & SUPPLIES-1.5% | |
| American Banknote S.A. | | | 378,000 | | | | 4,098,325 | | |
| DIVERSIFIED FINANCIAL SERVICES-1.2% | |
| BM&F BOVESPA S.A. | | | 451,563 | | | | 3,173,271 | | |
| FOOD PRODUCTS-1.6% | |
| BRF - Brasil Foods | | | 160,684 | | | | 4,182,098 | | |
| HEALTH CARE PROVIDERS & SERVICES-1.8% | |
| Odontoprev S.A. | | | 131,000 | | | | 4,808,794 | | |
| INSURANCE-1.2% | |
| Amil Participações S.A. | | | 395,593 | | | | 3,109,009 | | |
| IT SERVICES-1.0% | |
| Cielo S.A. | | | 315,000 | | | | 2,771,971 | | |
| MACHINERY-1.0% | |
| Weg S.A. | | | 251,844 | | | | 2,658,289 | | |
| MEDIA-1.6% | |
Saraiva S.A. Livreiros
Editores, PN | | | 212,000 | | | | 4,134,924 | | |
| Description | | No. of
Shares | | Value | |
| METALS & MINING-11.9% | |
| Bradespar S.A., PN | | | 180,800 | | | $ | 3,996,228 | | |
Usinas Siderúrgicas de Minas
Gerais S.A. | | | 148,248 | | | | 4,259,834 | | |
| Vale S.A., ADR | | | 943,342 | | | | 23,413,748 | | |
| | | | 31,669,810 | | |
| MULTILINE RETAIL-4.4% | |
| Lojas Renner S.A. | | | 512,040 | | | | 11,543,811 | | |
| OIL, GAS & CONSUMABLE FUELS-12.8% | |
| Petroleo Brasileiro S.A., ADR | | | 556,433 | | | | 23,587,195 | | |
Ultrapar Participacoes
S.A., ADR | | | 220,000 | | | | 10,318,000 | | |
| | | | 33,905,195 | | |
| PERSONAL PRODUCTS-3.9% | |
| Natura Cosmeticos S.A. | | | 495,037 | | | | 10,311,378 | | |
| REAL ESTATE MANAGEMENT & DEVELOPMENT-3.5% | |
Multiplan Empreendimentos
Imobiliarios S.A. | | | 494,000 | | | | 9,195,904 | | |
| ROAD & RAIL-1.4% | |
| Localiza Rent a Car S.A. | | | 345,000 | | | | 3,823,658 | | |
| TOBACCO-1.8% | |
| Souza Cruz S.A. | | | 145,000 | | | | 4,804,497 | | |
| TRANSPORTATION INFRASTRUCTURE-1.4% | |
| Wilson Sons Ltd. | | | 302,000 | | | | 3,721,294 | | |
TOTAL BRAZIL
(Cost $111,777,831) | | | 168,826,803 | | |
| CHILE-6.0% | |
| AIRLINES-0.1% | |
| Lan Airlines S.A. | | | 23,143 | | | | 395,108 | | |
| BEVERAGES-0.5% | |
| Viña Concha y Toro S.A. | | | 540,000 | | | | 1,197,634 | | |
| CHEMICALS-0.3% | |
Sociedad Química y Minera de
Chile S.A., PNB | | | 18,800 | | | | 711,602 | | |
See accompanying notes to the financial statements.
5
THE LATIN AMERICA EQUITY FUND, INC.
SCHEDULE OF INVESTMENTS (CONTINUED)
DECEMBER 31, 2009
| Description | | No. of
Shares | | Value | |
| COMMERCIAL BANKS-0.6% | |
| Banco Santander Chile | | | 25,113,969 | | | $ | 1,517,483 | | |
| DIVERSIFIED TELECOMMUNICATION SERVICES-0.2% | |
Empresa Nacional de
Telecomunicaciones S.A. | | | 38,693 | | | | 560,505 | | |
| ELECTRIC UTILITIES-0.6% | |
| Enersis S.A. | | | 3,780,000 | | | | 1,725,126 | | |
| FOOD & STAPLES RETAILING-0.4% | |
| Cencosud S.A. | | | 321,000 | | | | 1,086,559 | | |
| INDEPENDENT POWER PRODUCERS & ENERGY TRADERS-1.2% | |
| Colbun S.A. | | | 4,152,645 | | | | 1,060,163 | | |
Empresa Nacional de
Electricidad S.A. | | | 1,249,910 | | | | 2,119,118 | | |
| | | | 3,179,281 | | |
| INDUSTRIAL CONGLOMERATES-0.7% | |
| Antarchile S.A. | | | 18,518 | | | | 339,512 | | |
| Empresas Copec S.A. | | | 98,000 | | | | 1,466,377 | | |
| | | | 1,805,889 | | |
| MULTILINE RETAIL-0.2% | |
| S.A.C.I. Falabella S.A. | | | 77,000 | | | | 454,638 | | |
| PAPER & FOREST PRODUCTS-0.4% | |
| Empresas CMPC S.A. | | | 29,857 | | | | 1,188,982 | | |
| WATER UTILITIES-0.8% | |
Inversiones Aguas
Metropolitanas S.A., ADR†† | | | 84,144 | | | | 2,019,237 | | |
TOTAL CHILE
(Cost $8,231,816) | | | 15,842,044 | | |
| LATIN AMERICA-0.1% | |
| VENTURE CAPITAL-0.1% | |
JPMorgan Latin America Capital
Partners L.P.#†‡^^
(Cost $917,439) | | | 2,503,967 | * | | | 327,043 | | |
| Description | | No. of
Shares | | Value | |
| MEXICO-26.5% | |
| BEVERAGES-4.6% | |
Fomento Economico Mexicano,
S.A. de C.V., ADR | | | 255,701 | | | $ | 12,242,964 | | |
| COMMERCIAL BANKS-4.1% | |
Grupo Financiero Banorte
S.A.B. de C.V. | | | 2,985,000 | | | | 10,787,283 | | |
| FOOD & STAPLES RETAILING-4.2% | |
Organización Soriana S.A.B.
de C.V.† | | | 1,760,000 | | | | 4,401,551 | | |
Wal-Mart de México, S.A.
de C.V., Series V | | | 1,487,417 | | | | 6,642,187 | | |
| | | | 11,043,738 | | |
| HOUSEHOLD DURABLES-1.8% | |
Urbi, Desarrollos Urbanos,
S.A.B. de C.V.† | | | 2,097,741 | | | | 4,740,059 | | |
| HOUSEHOLD PRODUCTS-2.1% | |
Kimberly-Clark de Mexico,
S.A.B. de C.V. | | | 1,278,000 | | | | 5,733,448 | | |
| TRANSPORTATION INFRASTRUCTURE-3.1% | |
Grupo Aeroportuario del
Centro Norte, S.A.B.
de C.V., ADR | | | 334,000 | | | | 4,445,540 | | |
Grupo Aeroportuario del
Sureste, S.A.B. de C.V., ADR | | | 74,134 | | | | 3,840,883 | | |
| | | | 8,286,423 | | |
| WIRELESS TELECOMMUNICATION SERVICES-6.6% | |
América Móvil S.A.B. de C.V.,
Series L | | | 6,292,655 | | | | 14,831,027 | | |
América Móvil S.A.B. de C.V.,
Series L, ADR | | | 57,795 | | | | 2,715,209 | | |
| | | | 17,546,236 | | |
TOTAL MEXICO
(Cost $58,257,674) | | | 70,380,151 | | |
See accompanying notes to the financial statements.
6
THE LATIN AMERICA EQUITY FUND, INC.
SCHEDULE OF INVESTMENTS (CONTINUED)
DECEMBER 31, 2009
| Description | | No. of
Shares | | Value | |
| VENEZUELA-0.5% | |
| COMMERCIAL BANKS-0.5% | |
Mercantil Servicios Financieros,
C.A., ADR
(Cost $1,240,869) | | | 36,358 | | | $ | 1,252,965 | | |
| GLOBAL-0.1% | |
| VENTURE CAPITAL-0.1% | |
Emerging Markets
Ventures I, L.P.#†‡^^
(Cost $860,564) | | | 2,237,292 | * | | | 242,098 | | |
TOTAL EQUITY OR EQUITY-LINKED
SECURITIES (Cost $191,424,153) | | | 267,743,015 | | |
| SHORT-TERM INVESTMENTS-1.0% | |
| CHILEAN MUTUAL FUND-0.1% | |
Fondo Mutuo Security Plus
(Cost $250,852) | | | 74,787 | | | | 280,169 | | |
| | | Principal
Amount
(000's) | | | |
| UNITED KINGDOM-0.9% | |
Citibank London, overnight
deposit, 0.03%, 01/04/10
(Cost $2,362,000) | | $ | 2,362 | | | | 2,362,000 | | |
TOTAL SHORT-TERM INVESTMENTS
(Cost $2,612,852) | | | 2,642,169 | | |
TOTAL INVESTMENTS-102.0%
(Cost $194,037,005) | | | 270,385,184 | | |
LIABILITIES IN EXCESS OF CASH AND
OTHER ASSETS-(2.0)% | | | (5,284,546 | ) | |
| NET ASSETS-100.0% | | $ | 265,100,638 | | |
† Non-income producing security.
†† SEC Rule 144A security. Such securities are traded only among "qualified institutional buyers."
^^ Security was fair valued as of December 31, 2009. Security is valued at fair value as determined in good faith by, or under the direction of, the Board of Directors, under procedures established by the Board of Directors. (See Note B and H).
‡ Restricted security, not readily marketable; security is valued at fair value as determined in good faith by, or under the direction of, the Board of Directors under procedures established by the Board of Directors. (See Notes B and H).
# As of December 31, 2009, the aggregate amount of open commitments for the Fund is $812,869. (See Note H).
* Represents contributed capital.
ADR American Depositary Receipts.
PN Preferred Shares.
PNB Preferred Shares, Class B.
See accompanying notes to the financial statements.
7
THE LATIN AMERICA EQUITY FUND, INC.
STATEMENT OF ASSETS AND LIABILITIES
DECEMBER 31, 2009
| ASSETS | | | | | |
| Investments, at value (Cost $194,037,005) (Notes B, E, G) | | $ | 270,385,184 | | |
| Cash (including $607,109 of foreign currencies with a cost of $603,448) | | | 607,374 | | |
| Receivables: | |
| Dividends | | | 1,047,209 | | |
| Prepaid expenses | | | 28,485 | | |
| Total Assets | | | 272,068,252 | | |
| LIABILITIES | | | | | |
| Payables: | |
| Dividends and distributions (Note B) | | | 6,038,849 | | |
| Investment advisory fees (Note C) | | | 535,351 | | |
| Custodian fees | | | 94,089 | | |
| Audit fees | | | 56,235 | | |
| Administration fees (Note C) | | | 38,103 | | |
| Printing fees | | | 22,400 | | |
| Directors' fees | | | 12,494 | | |
| Other accrued expenses | | | 69,881 | | |
| Chilean repatriation taxes (Note B) | | | 100,212 | | |
| Total Liabilities | | | 6,967,614 | | |
| NET ASSETS (applicable to 6,106,633 shares of common stock outstanding) (Note D) | | $ | 265,100,638 | | |
| NET ASSETS CONSIST OF | | | | | |
Capital stock, $0.001 par value; 6,106,633 shares issued and outstanding
(100,000,000 shares authorized) | | $ | 6,107 | | |
| Paid-in capital | | | 134,762,749 | | |
| Accumulated net investment loss | | | (2,460,128 | ) | |
| Accumulated net realized gain on investments and foreign currency related transactions | | | 56,438,410 | | |
Net unrealized appreciation in value of investments and translation of other
assets and liabilities denominated in foreign currencies | | | 76,353,500 | | |
| Net assets applicable to shares outstanding | | $ | 265,100,638 | | |
| NET ASSET VALUE PER SHARE (based on 6,106,633 shares issued and outstanding) | | $ | 43.41 | | |
| MARKET PRICE PER SHARE | | $ | 39.42 | | |
See accompanying notes to the financial statements.
8
THE LATIN AMERICA EQUITY FUND, INC.
STATEMENT OF OPERATIONS
FOR THE YEAR ENDED DECEMBER 31, 2009
| INVESTMENT INCOME | | | | | |
| Income (Note B) : | |
| Dividends | | $ | 6,558,959 | | |
| Interest | | | 1,263 | | |
| Less: Foreign taxes withheld | | | (474,324 | ) | |
| Total Investment Income | | | 6,085,898 | | |
| Expenses: | |
| Investment advisory fees (Note C) | | | 1,641,093 | | |
| Custodian fees | | | 161,621 | | |
| Accounting fees (Note C) | | | 122,508 | | |
| Directors' fees | | | 112,198 | | |
| Administration fees (Note C) | | | 80,925 | | |
| Legal fees | | | 75,815 | | |
| Audit and tax fees | | | 59,932 | | |
| Insurance fees | | | 36,792 | | |
| Printing fees (Note C) | | | 24,902 | | |
| Shareholder servicing fees | | | 23,275 | | |
| Stock exchange listing fees | | | 868 | | |
| Miscellaneous fees | | | 25,555 | | |
| Brazilian taxes (Note B) | | | 108,577 | | |
| Chilean taxes (Note B) | | | 27,180 | | |
| Total Expenses | | | 2,501,241 | | |
| Less: Fee waivers (Note C) | | | (3,957 | ) | |
| Net Expenses | | | 2,497,284 | | |
| Net Investment Income | | | 3,588,614 | | |
NET REALIZED AND UNREALIZED GAIN/(LOSS) ON INVESTMENTS AND
FOREIGN CURRENCY RELATED TRANSACTIONS | | | | | |
| Net realized gain from: | |
| Investments | | | 56,388,033 | | |
| Foreign currency related transactions | | | 23,378 | | |
Net change in unrealized appreciation in value of investments and translation
of other assets and liabilities denominated in foreign currencies | | | 82,073,325 | | |
| Net realized and unrealized gain on investments and foreign currency related transactions | | | 138,484,736 | | |
| NET INCREASE IN NET ASSET RESULTING FROM OPERATIONS | | $ | 142,073,350 | | |
See accompanying notes to the financial statements.
9
THE LATIN AMERICA EQUITY FUND, INC.
STATEMENTS OF CHANGES IN NET ASSETS
| | | For the Years Ended December 31, | |
| | | 2009 | | 2008 | |
| INCREASE/(DECREASE) IN NET ASSETS | |
| Operations: | |
| Net investment income | | $ | 3,588,614 | | | $ | 3,487,737 | | |
| Net realized gain on investments and foreign currency related transactions | | | 56,411,411 | | | | 12,128,275 | | |
Net change in unrealized appreciation/(depreciation) in value of
investments and translation of other assets and liabilities denominated
in foreign currencies | | | 82,073,325 | | | | (194,247,206 | ) | |
| Net increase/(decrease) in net assets resulting from operations | | | 142,073,350 | | | | (178,631,194 | ) | |
| Dividends and distributions to shareholders: | |
| Net investment income | | | (6,134,774 | ) | | | (2,846,966 | ) | |
| Net realized gain on investments | | | — | | | | (19,799,548 | ) | |
| Total dividends and distributions to shareholders | | | (6,134,774 | ) | | | (22,646,514 | ) | |
| Capital share transactions: | |
Cost of 69,312 and 136,732 shares purchased under the share
repurchase program (Note I) | | | (2,153,560 | ) | | | (3,158,571 | ) | |
Issuance of 523 and 1,207 shares through the directors compensation
plan (Note C) | | | 17,620 | | | | 35,336 | | |
| Total capital share transactions | | | (2,135,940 | ) | | | (3,123,235 | ) | |
| Total increase/(decrease) in net assets | | | 133,802,636 | | | | (204,400,943 | ) | |
| NET ASSETS | |
| Beginning of year | | | 131,298,002 | | | | 335,698,945 | | |
| End of year* | | $ | 265,100,638 | | | $ | 131,298,002 | | |
* Includes accumulated net investment loss of $(2,460,128) and undistributed net investment income of $640,541, respectively.
See accompanying notes to the financial statements.
10
THE LATIN AMERICA EQUITY FUND, INC.
FINANCIAL HIGHLIGHTS
Contained below is per share operating performance data for a share of common stock outstanding, total investment return, ratios to average net assets and other supplemental data for each period indicated. This information has been derived from information provided in the financial statements and market price data for the Fund's shares
| | | For the Years Ended December 31, | |
| | | 2009 | | 2008 | | 2007 | | 2006 | | 2005 | |
| PER SHARE OPERATING PERFORMANCE | |
| Net asset value, beginning of year | | $ | 21.26 | | | $ | 53.19 | | | $ | 46.23 | | | $ | 35.25 | | | $ | 24.39 | | |
| Net investment income/(loss) | | | 0.58 | † | | | 0.55 | † | | | 0.71 | † | | | 0.63 | | | | 0.61 | | |
Net realized and unrealized gain/(loss) on investments and
foreign currency related transactions | | | 22.54 | † | | | (28.97 | ) | | | 18.79 | | | | 15.78 | | | | 11.03 | | |
| Net increase/(decrease) in net assets resulting from operations | | | 23.12 | | | | (28.42 | ) | | | 19.50 | | | | 16.41 | | | | 11.64 | | |
| Dividends and distributions to shareholders: | |
| Net investment income | | | (1.00 | ) | | | (0.45 | ) | | | (0.76 | ) | | | (0.56 | ) | | | (0.50 | ) | |
Net realized gain on investments and foreign currency
related transactions | | | — | | | | (3.15 | ) | | | (11.79 | ) | | | (4.87 | ) | | | (0.28 | ) | |
| Total dividends and distributions to shareholders | | | (1.00 | ) | | | (3.60 | ) | | | (12.55 | ) | | | (5.43 | ) | | | (0.78 | ) | |
Anti-dilutive impact due to capital shares tendered
or repurchased | | | 0.03 | | | | 0.09 | | | | 0.01 | | | | — | | | | — | | |
| Net asset value, end of year | | $ | 43.41 | | | $ | 21.26 | | | $ | 53.19 | | | $ | 46.23 | | | $ | 35.25 | | |
| Market value, end of year | | $ | 39.42 | | | $ | 18.29 | | | $ | 47.31 | | | $ | 43.43 | | | $ | 30.46 | | |
| Total investment return (a) | | | 120.93 | % | | | (54.99 | )% | | | 42.45 | % | | | 61.62 | % | | | 44.06 | % | |
| RATIOS/SUPPLEMENTAL DATA | |
| Net assets, end of year (000 omitted) | | $ | 265,101 | | | $ | 131,298 | | | $ | 335,699 | | | $ | 292,286 | | | $ | 222,852 | | |
| Ratio of expenses to average net assets (b) | | | 1.28 | % | | | 1.19 | % | | | 1.14 | % | | | 1.44 | % | | | 1.33 | % | |
| Ratio of expenses to average net assets, excluding fee waivers | | | 1.28 | % | | | 1.20 | % | | | 1.14 | % | | | 1.45 | % | | | 1.33 | % | |
| Ratio of expenses to average net assets, excluding taxes | | | 1.21 | % | | | 1.18 | % | | | 1.11 | % | | | 1.19 | % | | | 1.26 | % | |
| Ratio of net investment income/(loss) to average net assets | | | 1.84 | % | | | 1.24 | % | | | 1.28 | % | | | 1.49 | % | | | 2.13 | % | |
| Portfolio turnover rate | | | 75.70 | % | | | 16.55 | % | | | 26.33 | % | | | 46.05 | % | | | 75.60 | % | |
† Based on average shares outstanding.
(a) Total investment return at market value is based on the changes in market price of a share during the period and assumes reinvestment of dividends and distributions, if any, at actual prices pursuant to the Fund's dividend reinvestment program.
(b) Ratios reflect actual expenses incurred by the Fund. Amounts are net of fee waivers and inclusive of Chilean and Brazilian taxes.
See accompanying notes to the financial statements.
11
THE LATIN AMERICA EQUITY FUND, INC.
NOTES TO FINANCIAL STATEMENTS
DECEMBER 31, 2009
NOTE A. ORGANIZATION
The Latin America Equity Fund, Inc. (the "Fund") is registered under the Investment Company Act of 1940, as amended, as a closed-end, non-diversified management investment company.
NOTE B. SIGNIFICANT ACCOUNTING POLICIES
Use of Estimates: The preparation of financial statements in conformity with accounting principles generally accepted in the United States of America ("GAAP") requires management to make estimates and assumptions that affect the reported amounts of assets and liabilities and disclosure of contingent assets and liabilities at the date of the financial statements and the reported amounts of revenues and expenses during the reporting period. Actual results could differ from those estimates.
Security Valuation: The net asset value of the Fund is determined daily as of the close of regular trading on the New York Stock Exchange, Inc. (the "Exchange") on each day the Exchange is open for business. Equity investments are valued at market value, which is generally determined using the closing price on the exchange or market on which the security is primarily traded at the time of valuation (the "Valuation Time"). Valuation Time is as of the close of regular trading of the "Exchange" (usually 4:00 pm Eastern Time). If no sales are reported, equity investments are generally valued at the most recent bid quotation as of the Valuation Time or at the lowest ask quotation in the case of a short sale of securities. Debt securities with a remaining maturity greater than 60 days are valued in accordance with the price supplied by a pricing service, which may use a matrix, formula or other objective method that takes into consideration market indices, yield curves and other specific adjustments. Debt obligations that will mature in 60 days or less are valued on the basis of amortized cost, which approximates market value, unless it is determined that using this method would not represent fair value. Investments in mutual funds are valued at the mutual fund's closing net asset value per share on the day of valuation.
Securities and other assets for which market quotations are not readily available, or whose values have been materially affected by events occurring before the Fund's Valuation Time, but after the close of the securities' primary market, are valued at fair value as determined in good faith by, or under the direction of, the Board of Directors under procedures established by the Board of Directors. The Fund may utilize a service provided by an independent third party which has been approved by the Board of Directors to fair value certain securities. When fair-value pricing is employed, the prices of securities used by a fund to calculate its net asset value may differ from quoted or published prices for the same securities. The Fund's estimate of fair value assumes a willing buyer and a willing seller neither acting under the compulsion to buy or sell. Although these securities may be resold in privately negotiated transactions, the prices realized on such sales could differ from the prices originally paid by the Fund or the current carrying values, and the difference could be material.
In accordance with ASC 820, Fair Value Measurements and Disclosures ("ASC 820"), fair value is defined as the price that the Fund would receive upon selling an investment in a timely transaction to an independent buyer in the principal or most advantageous market of the investment. ASC 820 established a three-tier hierarchy to maximize the use of observable market data and minimize the use of unobservable inputs and to establish classification of fair value measurements for disclosure purposes. Inputs refer broadly to the assumptions that market participants would use in pricing the asset or liability, including assumptions about risk, for example, the risk inherent in a particular valuation technique used to measure fair value including such a pricing model and/or the risk inherent in the inputs to the valuation technique.
12
THE LATIN AMERICA EQUITY FUND, INC.
NOTES TO FINANCIAL STATEMENTS (CONTINUED)
DECEMBER 31, 2009
Inputs may be observable or unobservable. Observable inputs are inputs that reflect the assumptions market participants would use in pricing the asset or liability developed based on market data obtained from sources independent of the reporting entity.
Unobservable inputs are inputs that reflect the reporting entity's own assumptions about the assumptions market participants would use in pricing the asset or liability developed based on the best information available in the circumstances. The three-tier hierarchy of inputs is summarized in the three broad Levels listed below.
• Level 1—quoted prices in active markets for identical investments.
• Level 2—other significant observable inputs (including quoted prices for similar investments, interest rates, prepayment speeds, credit risk, etc.)
• Level 3—significant unobservable inputs (including the Fund's own assumptions in determining the fair value of investments, information provided by the General Partner or investee companies such as publicly traded prices, financial statements, capital statements, recent transactions, and general market conditions.)
The inputs or methodology used for valuing securities are not necessarily an indication of the risk associated with investing in those securities.
The following is a summary of the inputs used as of December 31, 2009 in valuing the Fund's investments carried at value:
| Investments, at value | | Quoted Prices in
Active Markets
for Identical
Investments
(Level 1) | | Significant
Other
Observable
Inputs
(Level 2) | | Significant
Unobservable
Inputs
(Level 3) | | Balance
as of
12/31/2009 | |
| Airlines | | $ | 395,108 | | | $ | — | | | $ | — | | | $ | 395,108 | | |
| Beverages | | | 13,440,598 | | | | — | | | | — | | | | 13,440,598 | | |
| Chemicals | | | 711,602 | | | | — | | | | — | | | | 711,602 | | |
| Chilean Mutual Fund | | | 280,169 | | | | | | | | | | | | 280,169 | | |
| Commercial Banks | | | 44,472,306 | | | | — | | | | — | | | | 44,472,306 | | |
| Commercial Services & Supplies | | | 4,098,325 | | | | | | | | | | | | 4,098,325 | | |
| Diversified Financial Services | | | 3,173,271 | | | | — | | | | — | | | | 3,173,271 | | |
| Diversified Telecommunication Services | | | 560,505 | | | | — | | | | — | | | | 560,505 | | |
| Electric Utilities | | | 1,725,126 | | | | — | | | | — | | | | 1,725,126 | | |
| Energy Equipment & Services | | | 10,871,911 | | | | — | | | | — | | | | 10,871,911 | | |
| Food & Staples Retailing | | | 12,130,297 | | | | — | | | | — | | | | 12,130,297 | | |
| Food Products | | | 4,182,098 | | | | — | | | | — | | | | 4,182,098 | | |
| Health Care Providers & Services | | | 4,808,794 | | | | — | | | | — | | | | 4,808,794 | | |
| Household Durables | | | 4,740,059 | | | | — | | | | — | | | | 4,740,059 | | |
| Household Products | | | 5,733,448 | | | | | | | | | | | | 5,733,448 | | |
13
THE LATIN AMERICA EQUITY FUND, INC.
NOTES TO FINANCIAL STATEMENTS (CONTINUED)
DECEMBER 31, 2009
| Investments, at value | | Quoted Prices in
Active Markets
for Identical
Investments
(Level 1) | | Significant
Other
Observable
Inputs
(Level 2) | | Significant
Unobservable
Inputs
(Level 3) | | Balance
as of
12/31/2009 | |
| Independent Power Producers & Energy Traders | | $ | 3,179,281 | | | $ | | | | $ | | | | $ | 3,179,281 | | |
| Industrial Conglomerates | | | 1,805,889 | | | | — | | | | — | | | | 1,805,889 | | |
| Insurance | | | 3,109,009 | | | | — | | | | — | | | | 3,109,009 | | |
| IT Services | | | 2,771,971 | | | | — | | | | — | | | | 2,771,971 | | |
| Machinery | | | 2,658,289 | | | | — | | | | — | | | | 2,658,289 | | |
| Media | | | 4,134,924 | | | | — | | | | — | | | | 4,134,924 | | |
| Metals & Mining | | | 31,669,810 | | | | — | | | | — | | | | 31,669,810 | | |
| Multiline Retail | | | 11,998,449 | | | | — | | | | — | | | | 11,998,449 | | |
| Oil, Gas & Consumable Fuels | | | 33,905,195 | | | | — | | | | — | | | | 33,905,195 | | |
| Paper & Forest Products | | | 1,188,982 | | | | — | | | | — | | | | 1,188,982 | | |
| Personal Products | | | 10,311,378 | | | | — | | | | — | | | | 10,311,378 | | |
| Real Estate Management & Development | | | 9,195,904 | | | | — | | | | — | | | | 9,195,904 | | |
| Road & Rail | | | 3,823,658 | | | | — | | | | — | | | | 3,823,658 | | |
| Tobacco | | | 4,804,497 | | | | — | | | | — | | | | 4,804,497 | | |
| Transportation Infrastructure | | | 12,007,717 | | | | — | | | | — | | | | 12,007,717 | | |
| Venture Capital | | | — | | | | — | | | | 569,141 | | | | 569,141 | | |
| Water Utilities | | | 2,019,237 | | | | — | | | | — | | | | 2,019,237 | | |
| Wireless Telecommunication Services | | | 17,546,236 | | | | — | | | | — | | | | 17,546,236 | | |
| Short-Term | | | — | | | | 2,362,000 | | | | — | | | | 2,362,000 | | |
| Total | | $ | 267,454,043 | | | $ | 2,362,000 | | | $ | 569,141 | | | $ | 270,385,184 | | |
Following is a reconciliation of investments in which significant unobservable inputs (Level 3) were used in determining value:
| Investments, at value | | Balance
as of
12/31/2008 | | Accrued
discounts/
premiums | | Realized
gain/(loss) | | Change in
unrealized
appreciation/
(depreciation) | | Net
purchases
(sales) | | Net
transfers
in and/or
out of
Level 3 | | Balance
as of
12/31/2009 | |
| Venture Capital | | $ | 723,702 | | | $ | — | | | $ | — | | | $ | (247,816 | ) | | $ | 93,255 | | | $ | — | | | $ | 569,141 | | |
| Total | | $ | 723,702 | | | $ | — | | | $ | — | | | $ | (247,816 | ) | | $ | 93,255 | | | $ | — | | | $ | 569,141 | | |
14
THE LATIN AMERICA EQUITY FUND, INC.
NOTES TO FINANCIAL STATEMENTS (CONTINUED)
DECEMBER 31, 2009
Short-Term Investment: The Fund sweeps available cash into a short-term time deposit available through Brown Brothers Harriman & Co., the Fund's custodian. The short-term time deposit is a variable rate account classified as a short-term investment.
Investment Transactions and Investment Income: Investment transactions are accounted for on a trade date basis. The cost of investments sold is determined by use of the specific identification method for both financial reporting and U.S. income tax purposes. Interest income is accrued as earned; dividend income is recorded on the ex-dividend date.
Taxes: No provision is made for federal taxes as it is the Fund's intention to continue to qualify for and elect the tax treatment applicable to regulated investment companies under the Internal Revenue Code of 1986, as amended, and to make the requisite distributions to its shareholders, which will be sufficient to relieve it from federal income and excise taxes.
Income received by the Fund from sources within Latin America may be subject to withholding and other taxes imposed by such countries. Also, certain Latin American countries impose taxes on funds remitted or repatriated from such countries.
As of October 20, 2009, Brazil imposes a Foreign Exchange Transactions ("IOF") tax levied on inflows of foreign capital invested in the Brazilian stock market. The tax rate is 2.00%. For the year ended December 31, 2009, the Fund incurred $108,577 of such expense.
For Chilean securities the Fund accrues foreign taxes on realized gains as a liability and reduction of realized/unrealized gains in an amount equal to what the Fund would owe if the securities were sold on the valuation date. Taxes on foreign income are recorded when the related income is recorded. The tax rate is 10%. For the year ended December 31, 2009, the Fund incurred $27,180 relating to foreign income.
The Fund is subject to the provisions of ASC 740 Income Taxes ("ASC 740"). The Fund has reviewed its current tax positions and has determined that no provision for income tax is required in the Fund's financial statements. The Fund's federal tax returns for the prior four fiscal years remain subject to examination by the Internal Revenue Services.
Foreign Currency Translations: The books and records of the Fund are maintained in U.S. dollars. Foreign currency amounts are translated into U.S. dollars on the following basis:
(I) market value of investment securities, assets and liabilities at the valuation date rate of exchange; and
(II) purchases and sales of investment securities, income and expenses at the relevant rates of exchange prevailing on the respective dates of such transactions.
The Fund does not isolate that portion of gains and losses on investments in equity securities which is due to changes in the foreign exchange rates from that which is due to changes in market prices of equity securities. Accordingly, realized and unrealized foreign currency gains and losses with respect to such securities are included in the reported net realized and unrealized gains and losses on investment transactions balances.
The Fund reports certain foreign currency related transactions and foreign taxes withheld on security transactions as components of realized gains for financial reporting purposes, whereas such foreign currency related transactions are treated as ordinary income for U.S. income tax purposes.
Net unrealized currency gains or losses from valuing foreign currency denominated assets and liabilities at period end exchange rates are reflected as a component
15
THE LATIN AMERICA EQUITY FUND, INC.
NOTES TO FINANCIAL STATEMENTS (CONTINUED)
DECEMBER 31, 2009
of net unrealized appreciation/depreciation in value of investments, and translation of other assets and liabilities denominated in foreign currencies.
Net realized foreign exchange gains or losses represent foreign exchange gains and losses from transactions in foreign currencies and forward foreign currency contracts, exchange gains or losses realized between the trade date and settlement date on security transactions, and the difference between the amounts of interest and dividends recorded on the Fund's books and the U.S. dollar equivalent of the amounts actually received.
Distributions of Income and Gains: The Fund distributes at least annually to shareholders substantially all of its net investment income and net realized short-term capital gains, if any. The Fund determines annually whether to distribute any net realized long-term capital gains in excess of net realized short-term capital losses, including capital loss carryovers, if any. An additional distribution may be made to the extent necessary to avoid the payment of a 4% U.S. federal excise tax. Dividends and distributions to shareholders are recorded by the Fund on the ex-dividend date.
The character of distributions made during the year from net investment income or net realized gains may differ from their ultimate characterization for U.S. income tax purposes due to U.S. generally accepted accounting principles/tax differences in the character of income and expense recognition.
Partnership Accounting Policy: The Fund records its pro-rata share of the income/(loss) and capital gains/(losses) allocated from the underlying partnerships and adjusts the cost of the underlying partnerships accordingly. These amounts are included in the Fund's Statement of Operations.
Other: The Fund may invest in securities of foreign countries and governments which involve certain risks in addition to those inherent in domestic investments. Such risks generally include, among others, currency risks (fluctuations in currency exchange rates), information risk (key information may be inaccurate or unavailable) and political risk (expropriation, nationalization or the imposition of capital or currency controls or punitive taxes). Other risks of investing in foreign securities include liquidity and valuation risks.
Securities denominated in currencies other than U.S. dollars are subject to changes in value due to fluctuations in exchange rates.
Some countries require governmental approval for the repatriation of investment income, capital or the proceeds of sales of securities by foreign investors. In addition, if there is a deterioration in a country's balance of payments or for other reasons, a country may impose temporary restrictions on foreign capital remittances abroad. Amounts repatriated prior to the end of specified periods may be subject to taxes as imposed by a foreign country.
The Latin American securities markets are substantially smaller, less liquid and more volatile than the major securities markets in the United States. A high proportion of the securities of many companies in Latin American countries may be held by a limited number of persons, which may limit the number of securities available for the investment by the Fund. The limited liquidity of Latin American country securities markets may also affect the Fund's ability to acquire or dispose of securities at the price and time it wishes to do so.
The Fund, subject to local investment limitations, may invest up to 10% of its assets (at the time of commitment) in illiquid equity securities, including securities of private equity funds (whether in corporate
16
THE LATIN AMERICA EQUITY FUND, INC.
NOTES TO FINANCIAL STATEMENTS (CONTINUED)
DECEMBER 31, 2009
or partnership form) that invest primarily in emerging markets. When investing through another investment fund, the Fund will bear its proportionate share of the expenses incurred by the fund, including management fees. Such securities are expected to be illiquid which may involve a high degree of business and financial risk and may result in substantial losses. Because of the current absence of any liquid trading market for these investments, the Fund may take longer to liquidate these positions than would be the case for publicly traded securities. Although these securities may be resold in privately negotiated transactions, the prices realized on such sales could be substantially less than those originally paid by the Fund or the current carrying values and these differences could be material. Further, companies whose securities are not publicly traded may not be subject to the disclosure and other investor protection requirements applicable to companies whose securities are publicly traded.
NOTE C. AGREEMENTS
Effective July 1, 2009, Aberdeen Asset Management Investment Services Limited ("AAMISL") serves as the Fund's investment adviser, which is a direct wholly-owned subsidiary of Aberdeen Asset Management PLC. AAMISL receives as compensation for its advisory services from the Fund, an annual fee, calculated weekly and paid quarterly, equal to 1.00% of the first $100 million of the Fund's average weekly market value or net assets (whichever is lower), 0.90% of the next $50 million and 0.80% of amounts above $150 million. For the period July 1, 2009 to December 31, 2009, AAMISL earned $980,855 for advisory services.
Prior to July 1, 2009, Credit Suisse Asset Management, LLC ("Credit Suisse LLC"), served as the Fund's investment adviser. For its services, Credit Suisse LLC received a fee identical to the current fee paid to AAMISL. For the six months ended June 30, 2009, Credit Suisse LLC earned $660,238 for advisory services, of which Credit Suisse LLC waived $3,957.
Celfin Capital Servicios Financieros S.A. ("Celfin") serves as the Fund's sub-adviser with respect to Chilean investments. As compensation for its services, Celfin is paid a fee from the adviser's fee, calculated weekly and paid quarterly at an annual rate of 0.10% of the Fund's average weekly market value or net assets (whichever is lower). For the year ended December 31, 2009, Celfin earned $174,949 for sub-advisory services from both AAMISL and Credit Suisse LLC.
For the year ended December 31, 2009, Celfin earned approximately $515 in brokerage commissions from portfolio transactions executed on behalf of the Fund.
Brown Brothers Harriman & Co. ("BBH & Co.") serves as the Fund's U.S. administrator. For the year ended December 31, 2009, BBH & Co. earned $114,440 for administrative and fund accounting services.
Celfin Capital S.A. Administradora de Fondos de Capital Extranjero ("AFCE") serves as the Fund's Chilean administrator. For its services, AFCE is paid an annual fee by the Fund equal to the greater of 2,000 Unidad de Fomentos ("U.F.s") (approximately $83,000 at December 31, 2009) or 0.10% of the Fund's average weekly market value or net assets invested in Chile (whichever is lower) and an annual reimbursement of out-of-pocket expenses not to exceed 500 U.F.s. In addition, an accounting fee is also paid to AFCE. For the year ended December 31, 2009, the administration fees and accounting fees amounted to $80,925 and $8,068 respectively.
Merrill Corporation ("Merrill"), an affiliate of Credit Suisse LLC, the previous investment adviser, has been engaged by the Fund to provide certain financial printing services. For the year ended December 31, 2009, Merrill was paid $24,902 for its services to the Fund.
Fifty percent (50%) of the annual retainer of the Independent Directors is invested in Fund shares and, at the option of each Independent Director, 100% of the annual retainer can be invested in shares. During the
17
THE LATIN AMERICA EQUITY FUND, INC.
NOTES TO FINANCIAL STATEMENTS (CONTINUED)
DECEMBER 31, 2009
year ended December 31, 2009, 523 shares were issued and an additional 450 shares were purchased pursuant to the directors compensation plan. Directors as a group own less than 1% of the Fund's outstanding shares.
NOTE D. CAPITAL STOCK
The authorized capital stock of the Fund is 100,000,000 shares of common stock, $0.001 par value. As of December 31, 2009 the Fund had 6,106,633 shares outstanding.
NOTE E. INVESTMENT IN SECURITIES
For the year ended December 31, 2009, purchases and sales of securities, other than short-term investments, were $143,344,601 and $153,927,909, respectively.
NOTE F. CREDIT FACILITY
Prior to July 1, 2009, the Fund, together with other funds/portfolios advised by Credit Suisse (collectively, the "Participating Funds"), participated in a $50 million committed, unsecured, line of credit facility ("Credit Facility") with State Street Bank and Trust Company for temporary or emergency purposes. Under the terms of the Credit Facility, the Participating Funds paid an aggregate commitment fee on the average unused amount of the Credit Facility, which was allocated among the Participating Funds in such manner as was determined by the governing Boards of the Participating Funds. In addition, the Participating Funds paid interest on borrowings at either the Overnight Federal Funds rate or the Overnight LIBOR rate plus a spread. This arrangement ceased effective July 1, 2009.
On November 13, 2009, the Fund entered into a credit facility along with other Funds advised by Aberdeen (The Chile Fund, The Indonesia Fund, The First Israel Fund, and The Emerging Markets Telecommunications Fund, collectively, the "Funds"). The Funds agreed to a $10 million committed revolving credit facility with Brown Brothers Harriman & Co. for temporary or emergency purposes. Under the terms of the credit facility, the Funds will pay an aggregate commitment fee on the average unused amount of the credit facility. In addition, the Funds will pay interest on borrowings at the Overnight LIBOR rate plus a spread. For the year ended December 31, 2009, the Fund had no borrowings under the Credit Facility.
NOTE G. FEDERAL INCOME TAXES
Income and capital gain distributions are determined in accordance with federal income tax regulations, which may differ from GAAP.
For the year ended December 31, 2009 the Fund paid $6,134,774 in distributions, classified as ordinary income. For the year ended December 31, 2008 the Fund paid $3,594,118 in distributions, classified as ordinary income and $19,052,396 in distributions, classified as long-term capital gains.
The tax basis of components of distributable earnings differ from the amounts reflected in the Statement of Assets and Liabilities by temporary book/tax differences. These differences are primarily due to losses deferred on wash sales and timing differences due to partnership investments and passive foreign investment companies. At December 31, 2009, the components of distributable earnings on a tax basis, for the Fund were as follows:
| Undistributed ordinary income | | $ | 4,761,237 | | |
| Undistributed long-term gains | | | 51,984,067 | | |
| Unrealized appreciation | | | 73,586,478 | | |
| Total distributable earnings | | $ | 130,331,782 | | |
At December 31, 2009, the identified cost for federal income tax purposes, as well as the gross unrealized appreciation from investments for those securities having an excess of value over cost, gross unrealized depreciation from investments for those securities
18
THE LATIN AMERICA EQUITY FUND, INC.
NOTES TO FINANCIAL STATEMENTS (CONTINUED)
DECEMBER 31, 2009
having an excess of cost over value and the net unrealized appreciation from investments were $196,804,027, $79,084,532, $(5,503,375) and $73,581,157, respectively.
At December 31, 2009, the Fund reclassified $554,509 from accumulated net investment loss to accumulated net realized gain on investments and foreign currency related transactions. These permanent differences are due to differing book/tax treatments of foreign currency transactions, partnership investments and passive foreign investment companies. Net assets were not affected by these reclassifications.
NOTE H. RESTRICTED SECURITIES
Certain of the Fund's investments are restricted as to resale and are valued at fair value as determined in good faith by, or under the direction of, the Board of Directors under procedures established by the Board of Directors in the absence of readily ascertainable market values.
| Security | | Acquisition Date(s) | | Cost | | Fair Value
At 12/31/09 | | Percent of
Net Assets | | Distributions
Received | | Open
Commitments | |
| Emerging Markets Ventures I L.P. | | 01/22/98 – 01/10/06 | | $ | 860,564 | | | $ | 242,098 | | | | 0.09 | | | $ | 2,451,066 | | | $ | 262,708 | | |
J.P. Morgan Latin America
Capital Partners, L.P. | | 04/10/00 – 10/20/09 | | | 917,439 | | | | 327,043 | | | | 0.12 | | | | 2,508,571 | | | | 550,161 | | |
| Total | | | | $ | 1,778,003 | | | $ | 569,141 | | | | 0.21 | | | $ | 4,959,637 | | | $ | 812,869 | | |
The Fund may incur certain costs in connection with the disposition of the above securities.
NOTE I. SHARE REPURCHASE PROGRAM/
SELF-TENDER POLICY
Share Repurchase Program: The Board of Directors of the Fund, at a meeting held on November 15, 2007, authorized management to make open market purchases from time to time in an amount up to 10% of the Fund's outstanding shares whenever the Fund's shares are trading at a discount to net asset value of 12% or more. Open market purchases may also be made within the discretion of management if the discount is less than 12%. The Board has instructed management to report repurchase activity to it regularly, and to post the number of shares repurchased on the Fund's website on a monthly basis. For the year ended December 31, 2009, the Fund repurchased 69,312 of its shares for a total cost of $2,153,560 at a weighted discount of 9.60% from its net asset value.
Self-Tender Policy: In April 2009, the Board authorized a tender offer to purchase 10% of the Fund's outstanding common shares at a price of 98% of the Fund's net asset value on the date the tender offer expires, provided the common shares of the Fund have traded at a volume weighted average discount to net asset value of greater than 10% during a 90-day measurement period. The measurement period was commenced in August 2009 through October 31, 2009; as of October 31, 2009 the volume weighted average discount to net asset value was under 10%, and therefore a tender offer was not initiated.
NOTE J. CONTINGENCIES
In the normal course of business, the Fund may provide general indemnifications pursuant to certain contracts and organizational documents. The Fund's maximum exposure under these arrangements is
19
THE LATIN AMERICA EQUITY FUND, INC.
NOTES TO FINANCIAL STATEMENTS (CONTINUED)
DECEMBER 31, 2009
dependent on future claims that may be made against the Fund and, therefore, cannot be estimated; however, based on experience, the risk of loss from such claims is considered remote.
NOTE K. RECENT ACCOUNTING PRONOUNCEMENTS
In June 2009, the FASB issued Accounting Standard Codification 105-10, "The FASB Accounting Standards Codification and the Hierarchy of Generally Accepted Accounting Principles—a replacement of FASB Statement No. 162" ("ASC 105-10, formerly "SFAS 168"). ASC 105-10 replaces SFAS No. 162, "The Hierarchy of Generally Accepted Accounting Principles" and establishes the "FASB Accounting Standards Codification" ("Codification") as the source of authoritative accounting principles recognized by the FASB to be applied by nongovernmental entities in the preparation of financial statements in conformity with U.S. GAAP. All guidance contained in the Codification carries an equal level of authority. On the effective date of ASC 105-10, the Codification will supersede all then-existing non-SEC accounting and reporting standards. All other non-grandfathered non-SEC accounting literature not included in the Codification will become nonauthoritative. ASC 105-10 is effective for financial statements issued for interim and annual periods ending after September 15, 2009. Management has evaluated this new statement and the financial statements and notes to financial statements have been updated to reflect how the Funds' reference GAAP.
NOTE L. SUBSEQUENT EVENTS
In accordance with the provisions set forth in ASC 855 "Subsequent Events", management has evaluated the possibility of subsequent events existing in the Fund's financial statements through March 1, 2010.
20
REPORT OF INDEPENDENT REGISTERED PUBLIC ACCOUNTING FIRM
To the Board of Directors and Shareholders
of The Latin America Equity Fund, Inc.:
In our opinion, the accompanying statement of assets and liabilities, including the schedule of investments, and the related statements of operations, of changes in net assets and the financial highlights present fairly, in all material respects, the financial position of The Latin America Equity Fund, Inc. (the "Fund") at December 31, 2009, the results of its operations for the year then ended, the changes in its net assets for each of the two years in the period then ended and the financial highlights for each of the five years in the period then ended, in conformity with accounting principles generally accepted in the United States of America. These financial statements and financial highlights (hereafter referred to as "financial statements") are the responsibility of the Fund's management. Our responsibility is to express an opinion on these financial statements based on our audit. We conducted our audit of these financial statements in accordance with the standards of the Public Company Accounting Oversight Board (United States). Those standards require that we plan and perform the audit to obtain reasonable assurance about whether the financial statements are free of material misstatement. An audit includes examining, on a test basis, evidence supporting the amounts and disclosures in the financial statements, assessing the accounting principles used and significant estimates made by management, and evaluating the overall financial statement presentation. We believe that our audit, which included confirmation of securities at December 31, 2009 by correspondence with the custodian and private equity issuers, provides a reasonable basis for our opinion.
/s/ PricewaterhouseCoopers LLP
PricewaterhouseCoopers LLP
Boston, Massachusetts
March 1, 2010
21
TAX INFORMATION (UNAUDITED)
For the year ended December 31, 2009, the Fund designates approximately $3,119,642, or up to the maximum amount of such dividends allowable pursuant to the Internal Revenue code, as qualified dividend income eligible for reduced tax rates. The Fund has made an election under Section 853 to pass through foreign taxes paid by the Fund to its shareholders. The amount of foreign taxes that were passed through to shareholders for the year ended December 31, 2009, was $461,576. The amount of foreign source income was $6,527,698. Shareholders should refer to their Form 1099-DIV to determine the amount includable on their respective tax returns for 2009.
PORTFOLIO MANAGER INFORMATION (UNAUDITED)
Effective July 1, 2009, the Fund is managed by the Global Emerging Markets Team. The Global Emerging Markets Team works in a truly collaborative fashion; all team members have both portfolio construction and research responsibilities. The Team is jointly and primarily responsible for the day-to-day management of the Fund, with the following members having the most significant responsibility for the day-to-day management of the Fund:
Devan Kaloo, Head of Emerging Markets
Devan joined Aberdeen in 2000 when the investment adviser for which he worked, Murray Johnstone International Ltd., was acquired by Aberdeen. Devan initially worked with the Asian equity team and was promoted to senior investment manager in 2003. In May 2005, he was appointed to his current position. Devan began his career at Martin Currie Ltd. in Edinburgh, initially working on the North American team before transferring to the global asset allocation desk. He has an MA (Hons) from St Andrews University and a postgraduate degree in Investment Analysis from Stirling University, also in Scotland.
Fiona Manning, CFA®, Investment Manager
Fiona is an investment manager on the emerging markets ex Asia team. She joined Aberdeen as part of a team acquired from Deutsche Asset Management' London in October 2005. Prior to joining Aberdeen, Fiona was an analyst with Deutsche since 2001. She graduated from the University of Durham with a BA Honours in History with French.
Andy Brown, CFA®, Investment Manager
Andrew Brown is an investment manager on the Global Emerging Markets Team. Andrew joined the Global Emerging Markets team at Aberdeen in 2005 after graduating from the University of St Andrews with a BSc in Geography. Andrew works within the Global Emerging Markets equity team which is responsible for research of companies and portfolio construction across Emerging Markets mandates. He is a CFA Charterholder.
Stephen Parr, Investment Manager
Stephen Parr is an investment manager on the Global Emerging Markets Team. Stephen joined Aberdeen in July 2009 following the acquisition of certain asset management businesses from Credit Suisse Asset Management. Stephen joined Credit Suisse Asset Management in March 2001 and was a Director of Credit Suisse Asset Management Limited ("Credit Suisse Ltd. U.K."). Previously, Stephen worked for Energis Communications as Head of Strategy (1998 to 2001). Prior to that, Stephen worked for Ernst & Young Management Consultants as a Managing Consultant (1996-1998) specialising in the telecommunications sector and prior to that for Energis Communications (1994 - 1996), Northern Telecom (1989-1994), and CASE Communications (1987-1989) where he worked in strategic planning and marketing management. Stephen graduated with an Upper second class hons. degree in Geography from the University of Manchester, a Ph.D in Geography from the University of Keele and an MBA from Warwick Business School.
22
PORTFOLIO MANAGER INFORMATION (UNAUDITED) (CONTINUED)
Nick Robinson, CFA®, Investment Manager
Nick Robinson is an investment manager on the Global Emerging Markets Team and is director of Aberdeen's operations in SãoPaulo. Nick joined Aberdeen in 2000 and spent eight years on the North American Equities Team, including three years based in Aberdeen's US offices. In 2008 he returned to London to join the global emerging markets equities team. Nick relocated to São Paulo in 2009. Nick graduated with a MA in Chemistry from Lincoln College, Oxford and is a CFA Charterholder.
PROXY VOTING AND PORTFOLIO HOLDINGS INFORMATION (UNAUDITED)
Information regarding how the Fund voted proxies related to its portfolio securities during the 12-month period ended June 30, of each year, as well as the policies and procedures that the Fund uses to determine how to vote proxies relating to its portfolio securities are available:
• By calling 1-866-839-5205;
• On the website of the Securities and Exchange Commission, www.sec.gov.
The Fund files a complete schedule of its portfolio holdings for the first and third quarters of its fiscal year with the SEC on Form N-Q. The Fund's Forms N-Q are available on the SEC's website at www.sec.gov and may be reviewed and copied at the SEC's Public Reference Room in Washington, DC. Information on the operation of the SEC's Public Reference Room may be obtained by calling 1-800-SEC-0330.
DIVIDEND REINVESTMENT AND CASH PURCHASE PLAN (UNAUDITED)
The Fund offers a Dividend Reinvestment and Cash Purchase Plan (the "Plan") to its common stockholders. The Plan offers common stockholders a prompt and simple way to reinvest net investment income dividends and capital gains and other periodic distributions in shares of the Fund's common stock. Computershare Trust Company, N.A. ("Computershare") acts as Plan Agent for stockholders in administering the Plan.
Participation in the Plan is voluntary. In order to participate in the Plan, you must be a registered holder of at least one share of stock of the Fund. If you are a beneficial owner of the Fund having your shares registered in the name of a bank, broker or other nominee, you must first make arrangements with the organization in whose name your shares are registered to have the shares transferred into your own name. Registered shareholders can join the Plan via the Internet by going to www.computershare.com, authenticating your online account, agreeing to the Terms and Conditions of online "Account Access" and completing an online Plan Enrollment Form. Alternatively, you can complete the Plan Enrollment Form and return it to Computershare at the address below.
By participating in the Plan, your dividends and distributions will be promptly paid to you in additional shares of common stock of the Fund. The number of shares to be issued to you will be determined by dividing the total amount of the distribution payable to you by the greater of (i) the net asset value per share ("NAV") of the Fund's common stock on the payment date, or (ii) 95% of the market price per share of the Fund's common stock on the payment date. If the NAV of the Fund's common stock is greater than the market price (plus estimated brokerage commissions) on the payment date, then Computershare (or a broker-dealer selected by Computershare) shall endeavor to apply the amount of such distribution on your shares to purchase shares of Fund common stock in the open market.
23
DIVIDEND REINVESTMENT AND CASH PURCHASE PLAN (UNAUDITED) (CONTINUED)
You should be aware that all net investment income dividends and capital gain distributions are taxable to you as ordinary income and capital gain, respectively, whether received in cash or reinvested in additional shares of the Fund's common stock.
The Plan also permits participants to purchase shares of the Fund through Computershare. You may invest $100 or more monthly, with a maximum of $120,000 in any annual period. Computershare will purchase shares for you on the open market on the 25th of each month or the next trading day if the 25th is not a trading day.
There is no service fee payable by Plan participants for dividend reinvestment. For voluntary cash payments, Plan participants must pay a service fee of $5.00 per transaction. Plan participants will also be charged a pro rata share of the brokerage commissions for all open market purchases ($0.03 per share as of October 2006). Participants will also be charged a service fee of $5.00 (subject to change) for each sale and brokerage commissions of $0.03 per share.
You may terminate your participation in the Plan at any time by requesting a certificate or a sale of your shares held in the Plan. Your withdrawal will be effective immediately if your notice is received by Computershare prior to any dividend or distribution record date; otherwise, such termination will be effective only with respect to any subsequent dividend or distribution. Your dividend participation option will remain the same unless you withdraw all of your whole and fractional Plan shares, in which case your participation in the Plan will be terminated and you will receive subsequent dividends and capital gains distributions in cash instead of shares.
If you want further information about the Plan, including a brochure describing the Plan in greater detail, please contact Computershare as follows:
| By Internet: | | www.computershare.com | |
|
| By phone: | | (800) 647-0584 (U.S. and Canada)
(781) 575-3100 (Outside U.S. and Canada)
Customer service associates are available from 9:00 a.m. to 5:00 p.m. Eastern time, Monday through Friday | |
|
| By mail: | | The Latin America Equity Fund, Inc.
c/o Computershare
P.O. Box 43078
Providence, Rhode Island 02940-3078
All notices, correspondence, questions or other communications sent by mail should be sent by registered or certified mail, return receipt requested. | |
|
The Plan may be terminated by the Fund or Computershare upon notice in writing mailed to each participant at least 30 days prior to any record date for the payment of any dividend or distribution.
24
INFORMATION CONCERNING DIRECTORS AND OFFICERS (UNAUDITED)
Name, Address
(Year of Birth) | | Position(s)
Held with
Fund | | Term
of Office
and
Length
of Time
Served | | Principal
Occupation(s) During
Past Five Years | | Number of
Portfolios in
Fund
Complex*
Overseen by
Director | |
Other
Directorships
Held by Director | |
| Independent Directors | | | | | | | | | | | | | |
|
Enrique R. Arzac
c/o Aberdeen Asset
Management
Att: US Legal
1735 Market Street, 32nd Fl
Philadelphia, PA 19103
(1941) | | Chairman of the Board of Directors, Nominating Committee Chairman and Audit Committee Member | | Since 1996; Chairman since 2005; current term ends at the 2012 annual meeting | | Professor of Finance and Economics, Graduate School of Business, Columbia University
since 1971 | | | 5 | | | Director of Epoch Holding Corporation (an investment management and advisory services company); Director of The Adams Express Company (a closed-end investment company); Director of Petroleum and Resources Corporation (a closed-end investment company); Director of Starcomms PLC; Director of Credit Suisse Funds; Director of Credit Suisse Asset Management Income Fund, Inc. and Credit Suisse High Bond Yield Fund | |
|
James J. Cattano
999 Vanderbilt Road -
Suite 200
Naples, FL 34108
(1943) | | Director; Nominating Committee Member and Audit Committee Chairman | | Since 1990; current term ends at the 2011 annual meeting | | President, Primary Resources Inc. (an international trading and manufacturing company
specializing in the sale of agricultural commodities throughout Latin American markets) since October 1996 | | | 5 | | | Director of Credit Suisse Asset Management Income Fund, Inc. and Director of Credit Suisse High Yield Bond Fund | |
|
Lawrence J. Fox
One Logan Square
18th & Cherry Streets
Philadelphia, PA 19103
(1943) | | Director, Nominating and Audit Committee Member | | Since 2006; current term ends at the 2012 annual meeting | | Partner, Drinker Biddle & Reath (law firm) since 1976; Lecturer at Yale Law School (2009-Present) and Harvard Law School (2007 to Present); Adjunct Professor at University of Pennsylvania School of Law (1990-Present) | | | 4 | | | Director of Credit Suisse Asset Management Income Fund, Inc. and Director of Credit Suisse High Yield Bond Fund | |
|
25
INFORMATION CONCERNING DIRECTORS AND OFFICERS (UNAUDITED) (CONTINUED)
Name, Address
(Year of Birth) | | Position(s)
Held with
Fund | | Term
of Office
and
Length
of Time
Served | | Principal
Occupation(s) During
Past Five Years | | Number of
Portfolios in
Fund
Complex*
Overseen by
Director | |
Other
Directorships
Held by Director | |
| Independent Directors—(continued) | | | | | | | | | | | |
|
Steven N. Rappaport
c/o Aberdeen Asset
Management
Att: US Legal
1735 Market Street, 32nd Fl
Philadelphia, PA 19103
(1948) | | Director; Nominating and Audit Committee
Member | | Since 2005; current term ends at the 2011 annual meeting | | Partner of Lehigh Court, LLC and RZ Capital (private investment firms) from July 2002 to present. | | | 5 | | | Director of iCAD, Inc. (a surgical and medical instruments and apparatus company); Director of Presstek, Inc. (a digital imaging technologies company); Director of Credit Suisse Funds; Director of Credit Suisse Asset Management Income Fund, Inc. and Credit Suisse High Yield Bond Fund | |
|
Martin M. Torino
c/o Aberdeen Asset
Management Inc.
Att: US Legal
1735 Market Street, 32nd Fl
Philadelphia, PA 19103
(1949) | | Director; Nominating and Audit Committee
Member | | Since 1990; current term ends at the 2010 annual meeting | | President of TA USA (May 1991-present); President of Rio Chalchoqui SA (June 2007-Present); and President of Exproso Morell SA (December 2009-Present) | | | 3 | | | None | |
|
* Aberdeen Asia-Pacific Income Fund, Inc., Aberdeen Australia Equity Fund, Inc., Aberdeen Global Income Fund, Inc., The Chile Fund, Inc., The First Israel Fund, Inc., The Indonesia Fund, Inc., The Emerging Markets Telecommunications Fund, Inc. and the Aberdeen Funds have a common Investment Manager and/or Investment Adviser with the Fund, or an investment adviser that is affiliated with the Investment Manager and Investment Adviser with the Fund, and may thus be deemed to be part of the same "Fund Complex" as the Fund.
26
INFORMATION CONCERNING DIRECTORS AND OFFICERS (UNAUDITED) (CONTINUED)
Position(s)
Name, Address
(Year of Birth) | | Length
Held with
Fund | | of Time
Served | | Principal Occupation(s) During Past Five Years | |
| Officers | | | | | | | |
|
Christian Pittard
Aberdeen Asset
Management Inc.
1735 Market Street,
32nd Floor
Philadelphia, PA 19103
(1973) | | President | | Since July 2009 | | Currently, Group Head of Product Development, Collective Funds for Aberdeen Asset Management Investment Services Limited. Previously, Director and Vice President (2006-2008), Chief Executive Officer (from October 2005 to September 2006) and employee (from June 2005 to December 2008) of Aberdeen Asset Management Inc.; Member of Executive Management Committee of Aberdeen Asset Management PLC (from August 2005 to August 2006); Managing Director of Aberdeen Asset Management (C.I.) Limited (from 2000 to June 2005); Managing Director of Aberdeen Private Wealth Management Limited (from 2000 to May 2005). | |
|
Vincent McDevitt
Aberdeen Asset
Management Inc.
1735 Market Street,
32nd Floor
Philadelphia, PA 19103
(1966) | | Chief Compliance Officer | | Since July 2009 | | Currently, CCO-Registered Funds for Aberdeen Asset Management Inc. Mr. McDevitt joined Aberdeen Asset Management Inc. in January 2008. He has ten years experience in the investment securities industry. Formerly with ING Clarion Real Estate Securities LP, Turner Investment Partners, Inc., and the Vanguard Group. | |
|
Megan Kennedy
Aberdeen Asset
Management Inc.
1735 Market Street,
32nd Floor
Philadelphia, PA 19103
(1974) | | Vice President and Secretary | | Since July 2009 | | Currently, Head of Product Management for Aberdeen Asset Management Inc. Ms. Kennedy joined Aberdeen Asset Management Inc. in 2005 as a Senior Fund Administrator. Ms. Kennedy was promoted to Assistant Treasurer Collective Funds/North American Mutual Funds in February 2008 and promoted to Treasurer Collective Funds/North American Mutual Funds in July 2008. Prior to joining Aberdeen Asset Management Inc., Ms. Kennedy was a Private Equity Manager with PFPC (2002-2005). | |
|
Andrea Melia
Aberdeen Asset
Management Inc.
1735 Market Street,
32nd Floor
Philadelphia, PA 19103
(1969) | | Treasurer and Chief Financial Officer | | Since November
2009 | | Currently, Head of Fund Accounting for Aberdeen Asset Management Inc. Ms. Melia joined Aberdeen Asset Management Inc. in September 2009. Prior to joining Aberdeen, Ms. Melia was Director of fund administration and accounting oversight for Princeton Administrators LLC, a division of BlackRock Inc. and had worked with Princeton Administrators since 1992. | |
|
William Baltrus
Aberdeen Asset
Management Inc.
1735 Market Street,
32nd Floor
Philadelphia, PA 19103
(1967) | | Vice President | | Since July 2009 | | Currently, Head of Fund Operations for Aberdeen Asset Management Inc. Prior to joining Aberdeen Asset Management Inc. in November 2007, he was Vice President of Administration for Nationwide Funds Group from 2000-2007. | |
|
Alan Goodson
Aberdeen Asset
Management Inc.
1735 Market Street,
32nd Floor
Philadelphia, PA 19103
(1974) | | Vice President | | Since July 2009 | | Currently, Head of US Collective Funds and Vice President of Aberdeen Asset Management Inc. Head of Finance (from 2000 to May 2005) and Company Secretary (from 2001 to May 2005) of Aberdeen Private Wealth Management Limited; Finance Director and Company Secretary of Aberdeen Asset Managers Jersey Limited (from 2002 to November 2005); Company Secretary of Aberdeen Asset Managers (C.I.) Limited (from 2001 to June 2005). | |
|
27
INFORMATION CONCERNING DIRECTORS AND OFFICERS (UNAUDITED) (CONTINUED)
Position(s)
Name, Address
(Year of Birth) | | Length
Held with
Fund | | of Time
Served | | Principal Occupation(s) During Past Five Years | |
| Officers—(continued) | | | | | | | |
|
Joanne Irvine
Aberdeen Asset
Management Inc.
1735 Market Street,
32nd Floor
Philadelphia, PA 19103
(1968) | | Vice President | | Since July 2009 | | Currently, Head of Emerging Markets Ex. Asia on the global emerging markets equities team in London. Ms. Irvine joined Aberdeen in 1996 in a group development role. | |
|
Devan Kaloo
Aberdeen Asset
Management Inc.
1735 Market Street,
32nd Floor
Philadelphia, PA 19103
(1972) | | Vice President | | Since July 2009 | | Currently, serves as Head of Global Emerging Markets. Mr. Kaloo joined Aberdeen in 2000 on the Asian portfolio team before becoming responsible for the Asian ex Japan region as well as regional portfolios within emerging market mandates and technology stocks. | |
|
Jennifer Nichols
Aberdeen Asset
Management Inc.
1735 Market Street,
32nd Floor
Philadelphia, PA 19103
(1978) | | Vice President | | Since July 2009 | | Currently, Head of Legal—US, Vice President and Director of Aberdeen Asset Management Inc. Ms. Nichols joined Aberdeen Asset Management Inc. in October 2006. Prior to that, Ms. Nichols was an associate attorney in the Financial Services Group of Pepper Hamilton LLP (law firm) (2003-2006). Ms. Nichols graduated in 2003 with a J.D. from the University of Virginia School of Law. | |
|
Lucia Sitar
Aberdeen Asset
Management Inc.
1735 Market Street,
32nd Floor
Philadelphia, PA 19103
(1971) | | Vice President | | Since July 2009 | | Currently, U.S. Counsel for Aberdeen Asset Management Inc. Ms. Sitar joined Aberdeen Asset Management Inc. in July 2007. Prior to that, Ms. Sitar was an associate attorney in the Investment Management Group of Stradley Ronan Stevens & Young LIP (law firm) (2000-2007). | |
|
Tim Sullivan
Aberdeen Asset
Management Inc.
1735 Market Street,
32nd Floor
Philadelphia, PA 19103
(1961) | | Vice President | | Since July 2009 | | Currently, Head of Product Development Collective Funds/North American Mutual Funds and Vice President of Aberdeen Asset Management Inc. Mr. Sullivan joined Aberdeen Asset Management Inc. in 2000. | |
|
Hugh Young
Aberdeen Asset
Management Inc.
1735 Market Street,
32nd Floor
Philadelphia, PA 19103
(1958) | | Vice President | | Since July 2009 | | Currently, a member of the Executive Management Committee of Aberdeen Asset Management PLC. He has been Managing Director of Aberdeen Asset Management Asia Limited since 1991. Mr. Young also served as Director of Aberdeen Asset Managers (C.I.) Limited from 2000 to June 2005 and Director of Aberdeen Asset Management Asia Limited since 2000. | |
|
28
DIRECTORS AND CORPORATE OFFICERS
| Enrique R. Arzac | | Chairman of the Board of Directors | |
|
| James J. Cattano | | Director | |
|
| Lawrence J. Fox | | Director | |
|
| Steven N. Rappaport | | Director | |
|
| Martin M. Torino | | Director | |
|
| Christian Pittard | | President | |
|
| Vincent McDevitt | | Chief Compliance Officer | |
|
| Megan Kennedy | | Vice President and Secretary | |
|
| Andrea Melia | | Treasurer and Chief Financial Officer | |
|
| William Baltrus | | Vice President | |
|
| Alan Goodson | | Vice President | |
|
| Joanne Irvine | | Vice President | |
|
| Devan Kaloo | | Vice President | |
|
| Jennifer Nichols | | Vice President | |
|
| Lucia Sitar | | Vice President | |
|
| Tim Sullivan | | Vice President | |
|
| Hugh Young | | Vice President | |
|
INVESTMENT ADVISER
Aberdeen Asset Management Investment Services Limited
Bow Bells House
1 Bread Street
London, United Kingdom
EC4M 9HH
INVESTMENT SUB-ADVISER
Celfin Capital Servicios Financieros S.A.
Apoquindo 3721, Piso 19
Santiago, Chile
ADMINISTRATOR AND CUSTODIAN
Brown Brothers Harriman & Co.
40 Water Street
Boston, MA 02109
SHAREHOLDER SERVICING AGENT
Computershare Trust Company, N.A.
P.O. Box 43078
Providence, RI 02940
INDEPENDENT REGISTERED PUBLIC
ACCOUNTING FIRM
PricewaterhouseCoopers LLP
125 High Street
Boston, MA 02110
LEGAL COUNSEL
Willkie Farr & Gallagher LLP
787 Seventh Avenue
New York, NY 10019
Notice is hereby given in accordance with Section 23(c) of the Investment Company Act of 1940, as amended, that The Latin America Equity Fund, Inc. may from time to time purchase shares of its capital stock in the open market.
The common shares of The Latin America Equity Fund, Inc. are traded on the NYSE Amex Equities exchange under the symbol "LAQ". Information about the Fund's net asset value and market price is available at www.aberdeenlaq.com.
This report, including the financial statements herein, is sent to the shareholders of the Fund for their information. The financial information included herein is taken from the records of the Fund without examination by independent registered public accountants who do not express an opinion thereon. It is not a prospectus, circular or representation intended for use in the purchase or sale of shares of the Fund or of any securities mentioned in this report.
LAQ-AR-1209
Item 2. Code of Ethics.
| (a) | As of the end of the period covered by this report, the Registrant has adopted a code of ethics that applies to the Registrant’s principal executive officer, principal financial officer, principal accounting officer or controller, or persons performing similar functions (the “Code of Ethics”). The Code of Ethics is included as Exhibit 12(a)(1). |
| (b) | For the purposes of this Item, the term “Code of Ethics” means written standards that are reasonably designed to deter wrongdoing and promote: |
| | 1) | Honest and ethical conduct, including the ethical handling of actual or apparent conflicts of interest between personal and professional relationships; |
| | 2) | Full, fair, accurate, timely, and understandable disclosure in reports and documents that a registrant files with, or submits to, the Commission and in other public communications made by the registrant; |
| | 3) | Compliance with applicable governmental laws, rules and regulations; |
| | 4) | The prompt internal reporting of violations of the code to an appropriate person or persons identified in the code; and |
| | 5) | Accountability for adherence to the code. |
| (c) | During the period covered by the report, there were no material changes to the Code of Ethics referred to in 2(a) and (b) above. Effective June 24, 2009, the Code of Ethics was amended to make certain administrative changes. A copy of the amendments is included in Exhibit 12(a)(1). |
| (d) | During the period covered by this report, there were no waivers to the provisions of the Code of Ethics referred to in 2(b) above. |
| (f) | A copy of the Code of Ethics has been filed with this Form N-CSR as Exhibit 12(a)(1). |
| | |
| | Copies of the Code of Ethics may be requested free of charge by calling toll free 866-839-5205. |
Item 3. Audit Committee Financial Expert.
The Board of the Directors of the Registrant has designated Enrique R. Arzac and Steven N. Rappaport as Audit Committee Financial Experts. Mr. Arzac and Mr. Rappaport are both considered by the Board to be independent directors as interpreted under this Item 3.
Item 4. Principal Accountant Fees and Services.
(a) through (d). Below is a table reflecting the fee information requested in Items 4(a) through (d):
| Fiscal Year Ended | (a) Audit Fees | (b)1 Audit Related Fees | (c) 2 Tax Fees | (d) 3 All Other Fees |
December 31, 2009 4 | $43,600 | $3,300 | $5,400 | $12,600 |
| December 31, 2008 | $56,350 | $3,400 | $4,000 | $5,000 |
(1) Services include agreed-upon procedures in connection with the registrant’s semi-annual financial statements ($3,400 in 2008 and $3,300 in 2009).
(2) Services include tax services in connection with the registrant’s excise tax calculations and review of the registrant’s applicable tax returns.
(3) Services include work done in connection with Chilean distributions.
(4) Effective July 1, 2009, Aberdeen Asset Management Investment Services Limited (“AAMISL”) serves as the Fund’s investment adviser with respect to all investments. The Board of Directors approved the continuation of the engagement with the principal accountant prior to AAMISL assuming advisory services.
| (e) | Below are the Registrant’s Pre-Approval Policies and Procedures |
(1) Pre-Approval Policies and Procedures. The Audit Committee (“Committee”) of the registrant is responsible for pre-approving (i) all audit and permissible non-audit services to be provided by the independent registered public accounting firm to the registrant and (ii) all permissible non-audit services to be provided by the independent registered public accounting firm to AAMISL and any entity controlling, controlled by, or under common control with the investment adviser provided ongoing services to the Registrant (“Covered Services Provider”) if the engagement relates directly to the operations and financial reporting of the registrant. The Committee may delegate its responsibility to pre-approve any such audit and permissible non-audit services to the Chairperson of the Committee, and the Chairperson shall report to the Committee, at its next regularly scheduled meeting after the Chairperson’s pre-approval of such services, his or her decision(s). The Committee may also establish detailed pre-approval policies and procedures for pre-approval of such services in accordance with applicable laws, including the delegation of some or all of the Committee’s pre-approval responsibilities to other persons (other than AAMISL or the registrant’s officers). Pre-approval by the Committee of any permissible non-audit services shall not be required so long as: (i) the aggregate amount of all such permissible non-audit services provided to the registrant, AAMISL and any Covered Services Provider constitutes not more than 5% of the total amount of revenues paid by the registrant to its independent registered public accounting firm during the fiscal year in which the permissible non-audit services are provided; (ii) the permissible non-audit services were not recognized by the registrant at the time of the engagement to be non-audit services; and (iii) such services are promptly brought to the attention of the Committee and approved by the Committee (or its delegate(s)) prior to the completion of the audit.
(2) None of the services described in each of paragraphs (b) through (d) of this Item involved a waiver of the pre-approval requirement by the Audit Committee pursuant to paragraph (c)(7)(i)(C) of Rule 2-01of Regulation S-X.
The aggregate fees billed by PricewaterhouseCoopers (“PwC”) for non-audit services rendered to the Registrant, Credit Suisse Asset Management, LLC (the investment adviser prior to July 1, 2009) (“Credit Suisse”) and any Covered Service Providers for the fiscal years ended December 31, 2008 was $27.68 million. The aggregate fees billed by PwC for non-audit services rendered to the Registrant, AAMISL (the investment adviser effective July 1, 2009) and any Covered Service Providers for the fiscal year ended December 31, 2009 was $1,552,000.
| (h) | The Registrant’s Audit and Valuation Committee of the Board of Directors has considered whether the provision of nonaudit services that were rendered to the Registrant’s investment adviser (not including any subadviser whose role is primarily portfolio management and is subcontracted with or overseen by another investment adviser), and any entity controlling, controlled by, or under common control with the investment adviser that provides ongoing services to the Registrant that were not pre-approved pursuant to paragraph (c)(7)(ii) of Rule 2-01 of Regulation S-X is compatible with maintaining the principal accountant’s independence and has concluded that it is. |
Item 5. Audit Committee of Listed Registrants.
(a) The Registrant has a separately designated standing audit committee established in accordance with Section 3(a)(58)(A) of the Securities Exchange Act of 1934, as amended.
For the fiscal ended December 31, 2009, the audit committee members were:
Enrique R. Arzac
James J. Cattano
Lawrence J. Fox
Steven N. Rappaport
Martin M. Torino
(b) Not applicable
Item 6. Schedule of Investments.
(a) Included as part of the Report to Shareholders filed under Item 1 of this Form N-CSR.
(b) Not applicable.
Item 7. Disclosure of Proxy Voting Policies and Procedures for Closed-End Management Investment Companies.
Pursuant to the Registrant’s Proxy Voting Policy and Procedures, the Registrant has delegated responsibility for its proxy voting to its Investment Adviser, provided that the Registrant’s Board of Directors has the opportunity to periodically review the Investment Adviser’s proxy voting policies and material amendments thereto. The Registrant’s Board of Directors approved the proxy voting policies of the Investment Adviser in June 2009.
Each of the proxy voting policies of the Registrant and Investment Adviser are included in Exhibit A and B, respectively.
Item 8. Portfolio Managers of Closed-End Management Investment Companies.
(a)
| (1) | The information in the table below is as of March 8, 2010. (as of filing date) |
The Registrant is managed by a team of financial professionals who are jointly and primarily responsible for the day-to-day management of the Registrant.
| Individual & Position | Services Rendered | Past Business Experience |
Devan Kaloo, Head of Emerging Markets | Head of global emerging markets, responsible for the London based global emerging markets equity team, which manages Latin America and Emerging Markets Ex-Asia equities, and also has oversight of Global Emerging Markets input from the Asia team based in Singapore. | Joined Aberdeen in 2000 when the investment adviser for which he worked, Murray Johnston, was acquired by Aberdeen. Initially worked with the Asian equity team and was promoted to senior investment manager in 2003 and worked closely on regional portfolio construction. In May 2005, he was appointed to his current position. His career at Martin Currie in Edinburgh, initially working on the North American team before transferring to the global asset allocation desk. He has an MA (Hons) from St Andrews University and a postgraduate degree in Investment Analysis from Stirling University, also in Scotland. |
Andy Brown, CFA®, Investment Manager | Responsible for investment management on the global emerging markets equities team. | Joined Aberdeen in 2005. An investment manager on the global emerging markets equities team. Graduate from the University of St Andrews with a BSc in Geography. He is a CFA Charterholder. |
Stephen Parr, Investment Manager | Responsible for investment management on the global emerging markets equities team. | Joined Aberdeen in July 2009 following the acquisition of certain asset management businesses from Credit Suisse Asset Management. An investment manager on the global emerging markets equity desk. Previously, worked for Energis Communications as Head of Strategy. Prior to that, worked for Ernst & Young Management Consultants as a Managing Consultant and prior to that for Energis Communications, Northern Telecom, and CASE Communications in strategic planning and marketing management. Graduate with an Upper second class hons. degree in Geography from the University of Manchester, a Ph.D in Geography from the University of Keele and an MBA from Warwick Business School. |
Fiona Manning, CFA®, Assistant Investment Manager | Responsible for investment management on the global emerging markets equities team. | Joined Aberdeen as part of a team acquired from Deutsche in October 2005. An investment manager on the emerging markets ex Asia team. Prior to joining Aberdeen, was an analyst with Deutsche since 2001. She graduated from the University of Durham with a BA Honours in History with French. |
Nick Robinson, CFA®, Investment Manager | Responsible for investment management on the global emerging markets equity team and Director of Aberdeen’s operations in São Paulo. | Joined Aberdeen in 2000 and spent eight years on the North American equities desk, including three years based in Aberdeen's US offices. An investment manager on the global emerging markets equity team and is director of Aberdeen’s operations in SãoPaulo. In 2008 he returned to London to join the global emerging markets equities team. He was relocated to São Paulo in 2009. A graduate with a MA in Chemistry from Lincoln College, Oxford and is a CFA Charterholder. |
(2) The information in the following table is as of December 31, 2009.
| | Registered Investment Companies Managed by Portfolio Manager | Pooled Investment Vehicles Managed by Portfolio Manager | Other Accounts Managed by Portfolio Manager |
Name of Portfolio Manager | Number of Accounts | AUM USD($M) | Number of Accounts | AUM USD($M) | Number of Accounts | AUM USD($M) |
| Devan Kaloo | 9 | 2,085.3 | 11 | 8,776.49 | 61 | 14,124.83 |
| Joanne Irvine | 9 | 2,085.3 | 11 | 8,776.49 | 61 | 14,124.83 |
| Mark Gordon James | 9 | 2,085.3 | 11 | 8,776.49 | 61 | 14,124.83 |
| Fiona Manning | 9 | 2,085.3 | 11 | 8,776.49 | 61 | 14,124.83 |
| Nick Robinson | 9 | 2,085.3 | 11 | 8,776.49 | 61 | 14,124.83 |
Total Assets are as of December 31, 2009 and have been translated into U.S. dollars at a rate of £1.00 = $1.6149.
It is possible that conflicts of interest may arise in connection with the portfolio managers’ management of the Registrant’s investments on the one hand and the investments of other accounts on the other. For example, the portfolio managers may have conflicts of interest in allocating management time, resources and investment opportunities among the Registrant and other accounts they advise. In addition, due to differences in the investment strategies or restrictions between the Registrant and the other accounts, the portfolio managers may take action with respect to another account that differs from the action taken with respect to the Registrant. AAMISL has adopted policies and procedures that are designed to minimize the effects of these conflicts. Additionally, portfolio managers� personal trading is monitored to avoid further potential conflicts.
A potential conflict of interest also may arise as a result of another account managed by the same portfolio manager being compensated by Aberdeen based on the performance of the portfolio held by that account. The existence of such a performance-based fee may create additional conflicts of interest for the portfolio manager in the allocation of management time, resources and investment opportunities. There are 6 accounts (all other accounts) (with assets under management totaling approximately $1.5 million) with respect to which part of the advisory fee is based on the performance of the account. However, the investment strategies of these accounts are significantly different from those of the Registrant, so the performance fee should not create any conflict between that of the portfolio manager (and consequently, the Investment Adviser) and the interest of the Registrant.
(3) The following is a description of the compensation structure for portfolio managers employed by Aberdeen Asset Management PLC and its subsidiaries, including the Registrant’s Investment Manager and its Investment Adviser (the “Aberdeen Group”) as of December 31, 2009.
The Aberdeen Group recognizes the importance of compensation in attracting and retaining talent and has structured remuneration to include an attractive base salary, a discretionary bonus that is directly linked to one’s contribution to the overall success of the Aberdeen Group and a long term incentive plan for key staff members comprised of a mixture of cash, options, and shares. Overall compensation packages are designed to be competitive relative to investment management industry standards.
The compensation policy has been designed to deliver additional rewards through appropriate incentive schemes, both annual and long term. These are directly linked to performance at both a corporate and an individual level. The policy seeks to reward performance in a manner which aligns the interests of clients, shareholders and executives.
Each Aberdeen Group member recognizes that any remuneration policy must be sufficiently flexible to take into account any changes in the business environment. In accordance with this need for flexibility, the Aberdeen Group takes into account the overall competitiveness of the total remuneration package of all senior executives including some portfolio managers. When justified by performance, the ‘at risk’ performance elements will form the most significant element of total remuneration for executive officers and senior employees.
Base Salary. The base salary is determined by prevailing market conditions and the compensation for similar positions across the industry. The Aberdeen Group uses industry compensation surveys as a tool in determining each portfolio manager’s base salary.
Annual Bonus. The Aberdeen Group’s policy is to recognize corporate and individual achievements each year through an appropriate bonus scheme. The aggregate incentive compensation pool each year is determined by the Board of the parent company, Aberdeen PLC, and is dependent on each member of the Aberdeen Group’s overall performance and profitability. The pool is comprised of a base level plus an agreed proportion of each member of the Aberdeen Group’s profitability.
Staff performance is reviewed formally once a year, with mid-term reviews. The review process looks at all of the ways in which an individual has contributed to the Aberdeen Group, and specifically, in the case of portfolio managers, to the relevant investment team. Discretionary bonuses are based on a combination of both the team and the individual’s performance. Overall participation in team meetings, generation of original research ideas and contribution to presenting the team externally are also evaluated. Discretionary bonuses are not formally laid down and generally range from 10% to 50% of annual salary for portfolio managers.
In the calculation of a portfolio manager’s bonus, the Aberdeen Group takes into consideration investment matters (which include the performance of funds, adherence to the company investment process, and quality of company meetings) as well as more subjective issues such as team participation and effectiveness at client presentations. The split between the two will vary but generally around 80% of bonus will be determined by investment related matters, the remaining 20% will be more subjective in nature. Each Fund’s performance is judged against the benchmark (for the Registrant – Morgan Stanley Capital International Emerging Markets Latin America Index) as established in the relevant Fund’s most recent shareholder report. Portfolio manager performance on investment matters is judged over all of the accounts the portfolio manager contributes to and is documented in the appraisal process. A combination of the team’s and individual’s performance is considered.
Although performance is not a substantial portion of a portfolio manager’s compensation, the Aberdeen Group also recognizes that fund performance can often be driven by factors outside one’s control, such as (irrational) markets, and as such pays attention to the effort by portfolio managers to ensure integrity of our core process by sticking to disciplines and processes set, regardless of momentum and ‘hot’ themes. Short-term trading is thus discouraged and trading-oriented managers will thus find it difficult to thrive in the Aberdeen Group’s environment. Additionally, if any of the aforementioned undue risks were to be taken by a portfolio manager, not only would the portfolio manager be in breach of the Aberdeen Group Code of Ethics, but any such trend would be identified via Aberdeen’s dynamic compliance monitoring system.
Long Term Incentives. As part of an effective remuneration package, a long term incentive plan is used to structure the package so as to retain, motivate, and reward key staff members with a view to improving performance and thereby increasing the value of the Aberdeen Group for the benefit of shareholders. Long-term incentive plans can be either cash or share based and typically vest over a three year period.
The Aberdeen Group offers a meritocracy and a very flat management structure. The culture of the company is entrepreneurial, and enthusiastic, hard-working and talented employees are given plenty of opportunity to prove themselves and obtain a high level of job satisfaction.
The Aberdeen Group does not “tie in” portfolio managers with long-term and restrictive contractual obligations, however. The Aberdeen Group aims to retain key individuals primarily through the provision of competitive compensation and other benefits. It is the policy of the Aberdeen Group to mitigate the effects of any individual leaving the company by ensuring that portfolios are managed on a team basis.
(4)
(a)
| Individual | Dollar Range of Equity Securities in the Registrant Beneficially Owned by the Portfolio Manager as of December 31, 2009 |
| Devan Kaloo | 0 |
| Andy Brown | 0 |
| Stephen Parr | 0 |
| Fiona Manning | 0 |
| Nick Robinson | 0 |
(b) Not applicable.
Item 9. Purchases of Equity Securities by Closed-End Management Investment Company and Affiliated Purchasers.
| Period | (a) Total Number of Shares Purchased | (b) Average Price Paid per Share | (c) Total Number of Shares Purchased as Part of Publicly Announced Plans or Programs 1 | (d) Maximum Number of Shares That May Yet Be Purchased Under the Plans or Programs (a)(b)(c)(d)(e) |
January 1, 2009 through, January 31, 2009 | 10,204 | 20.086 | 10,204 | 473,995 |
February 1, 2009 through, February 28, 2009 | 7,600 | 17.501 | 17,804 | 466,395 |
March 1, 2009 through March 31, 2009 | 3,950 | 18.955 | 21,754 | 462,445 |
April 1, 2009 through April 30, 2009 | 5,150 | 21.723 | 26,904 | 457,295 |
May 1, 2009 through May 31, 2009 | 0 | - | 26,904 | 457,295 |
June 1, 2009 through June 30, 2009 | 0 | - | 26,904 | 457,295 |
July 1, 2009 through July 31, 2009 | 0 | - | 26,904 | 457,295 |
August 1, 2009 through August 31, 200900 | 0 | - | 26,904 | 457,295 |
September 1, 2009 through September 30, 2009 | 0 | - | 26,904 | 457,295 |
October 1, 2009 through October 31, 2009 | 36,800 | 38.181 | 63,704 | 420,495 |
November 1, 2009 through November 30, 2009 | 5,608 | 38.499 | 69,312 | 414,887 |
December 1, 2009 through December 31, 2009 | 0 | - | 69,312 | 345,575 |
| Total | 69,312 | | 69,312 | - |
(a) The plan was announced November 16, 2007.
(b) 10% of the Fund’s outstanding shares.
(c) There is no expiration date for the plan.
(d) Not applicable.
(e) Not applicable.
Item 10. Submission of Matters to a Vote of Security Holders.
There were no material changes to the procedures by which shareholders may recommend nominees to the Registrant’s Board of Directors since the Registrant last provided disclosure in response to the requirements of Item 407(c)(2)(iv) of Regulation S-K (as required by Item 22(b)(15) of Schedule 14A).
Item 11. Controls and Procedures.
(a) It is the conclusion of the Registrant’s principal executive officer and principal financial officer that the effectiveness of the Registrant’s current disclosure controls and procedures (such disclosure controls and procedures having been evaluated within 90 days of the filing) provide reasonable assurance that the information required to be disclosed by the Registrant has been recorded, processed, summarized and reported within the time period specific by the Commission’s rules and forms and that the information required to be disclosed by the Registrant has been accumulated and communicated to the Registrant’s principal executive officer and principal financial officer in order to allow timely decisions regarding required disclosure.
(b) There were no changes in the Registrant’s internal control over financial reporting that occurred during the second fiscal quarter of the period covered by this report that have materially affected, or are reasonably likely to materially affect, the registrant’s internal control over financial reporting.
Item 12. Exhibits.
| (a)(1) | | Registrant’s Code of Ethics is an exhibit to this report. |
| | | |
| (a)(2) | | The certifications of the registrant as required by Rule 30a-2(a) under the Investment Company Act of 1940 are exhibits to this report. |
| | | |
| (a)(3) | | Not applicable. |
| | | |
| (b) | | The certifications of the registrant as required by Rule 30a-2(b) under the Act are an exhibit to this report. |
SIGNATURES
Pursuant to the requirements of the Securities Exchange Act of 1934 and the Investment Company Act of 1940, the Registrant has duly caused this report to be signed on its behalf by the undersigned, thereunto duly authorized.
The Latin America Equity Fund, Inc.
By: /s/ Christian Pittard
Christian Pittard,
President of The Latin America Equity Fund, Inc.
Date: March 8, 2010
Pursuant to the requirements of the Securities Exchange Act of 1934 and the Investment Company Act of 1940, this report has been signed below by the following persons on behalf of the Registrant and in the capacities and on the dates indicated.
By: /s/ Christian Pittard
Christian Pittard,
President of The Latin America Equity Fund, Inc.
Date: March 8, 2010
By: /s/ Andrea Melia
Andrea Melia,
Treasurer of The Latin America Equity Fund, Inc.
Date: March 8, 2010
EXHIBIT LIST
12(a)(1) – Code of Ethics
12(a)(2) – Rule 30a-2(a) Certifications
12(b) – Rule 30a-2(b) Certifications
A – Registrant’s Proxy Voting Policies
B – Investment Manager’s and Investment Adviser’s Proxy Voting Policies