UNITED STATES
SECURITIES AND EXCHANGE COMMISSION
Washington, D.C. 20549
FORM N-CSR
CERTIFIED SHAREHOLDER REPORT OF REGISTERED
MANAGEMENT INVESTMENT COMPANIES
Investment Company Act file number 811-06096
The Torray Fund
(Exact name of registrant as specified in charter)
7501 Wisconsin Avenue, Suite 1100
Bethesda, MD 20814-6523
(Address of principal executive offices) (Zip code)
William M Lane
Torray LLC
7501 Wisconsin Avenue, Suite 1100
Bethesda, MD 20814-6523
(Name and address of agent for service)
registrant’s telephone number, including area code: 301-493-4600
Date of fiscal year end: December 31
Date of reporting period: June 30, 2006
Form N-CSR is to be used by management investment companies to file reports with the Commission not later than 10 days after the transmission to stockholders of any report that is required to be transmitted to stockholders under Rule 30e-1 under the Investment Company Act of 1940 (17 CFR 270.30e-1). The Commission may use the information provided on Form N-CSR in its regulatory, disclosure review, inspection, and policymaking roles.
A registrant is required to disclose the information specified by Form N-CSR, and the Commission will make this information public. A registrant is not required to respond to the collection of information contained in Form N-CSR unless the Form displays a currently valid Office of Management and Budget (“OMB”) control number. Please direct comments concerning the accuracy of the information collection burden estimate and any suggestions for reducing the burden to Secretary, Securities and Exchange Commission, 100 F Street, NE, Washington, DC 20549. The OMB has reviewed this collection of information under the clearance requirements of 44 U.S.C. § 3507.
Item 1. Reports to Stockholders.
The Report to Shareholders is attached herewith.
The Torray Fund
Letter to Shareholders
August 1, 2006
Dear Fellow Shareholders,
The Torray Fund made 0.5% during the six-month period ending June 30, compared to a gain of 2.7% for the S&P 500 Index. After advancing about 7% through early May, our stocks turned down along with the rest of the market in response to The Federal Reserve Board’s tightening of interest rates. During June, the slump deepened as concerns shifted to the Middle East conflict. We do not think these issues pose a serious risk given the sharp reduction in price/earnings ratios that has occurred over the last six years. However, they did deflect attention from the strong business performance and low valuations of The Torray Fund’s investments. We’ll have more to say on these points later. In the meantime, we are pleased to report that our long-term record is solid; since inception December 31, 1990, we have made 548% compared to 427% for the S&P Index, and even though the last six years have been brutal, we’ve managed a cumulative gain of 24%, while the Index lost 3.7%.
The duration of this downturn has left investors disillusioned and in a mood to try almost anything to improve results. Many have shifted to alternative investments like hedge and private equity funds, commodities and currencies. Money has also been flooding into larger developing countries and emerging markets, despite their turbulent history, risky fundamentals and eye-popping advances. Russia and Colombia are up 12 and 14 times, respectively, from their bear market lows; Brazil and India have quadrupled, Poland has tripled and the Philippines nearly doubled. Recently highlighted investments include banks in the former Soviet Republic of Georgia, airlines in Kenya, oil refineries in central Russia and startup stockbrokers in India tabbed “Indiabulls.” DLF, India’s largest real estate developer, has announced plans to go public at a suggested $25.7 billion valuation. With earnings of only $44 million last year, investors will be paying $584 for every dollar of profit if the deal goes through. This compares to less than $15 per dollar of 2007 estimated earnings for The Torray Fund portfolio. The popularity of these often-murky situations highlights not only investors’ frustration with years of poor performance in the U.S., but the fact that memories of past emerging market crises have dimmed.
Meanwhile, investors continue to chase commodities and the stocks of companies that produce them. Even though oil, gold, silver, copper, and so on, have generated virtually no inflation-adjusted returns in over a hundred years, large pension funds and other institutions have committed billions of dollars to them. None apparently had the slightest interest at half the price or less a few years ago. It is claimed that these inert assets, when blended in a broadly
1
The Torray Fund
Letter to Shareholders
August 1, 2006
diversified portfolio, will dampen volatility and boost returns, since their fluctuations theoretically won’t correlate with those of domestic stocks and bonds. Loosely translated, this means no matter which way your other investments go, commodities won’t necessarily follow suit. The point escapes us. Why expose yourself to losses — and, over time, there will be plenty to go around — just to avoid volatility, when it has nothing to do with risk in the first place? Certainly no one complains when stocks are going up. In fact, the higher they climb, the more investors want, and the safer they feel. Only those predisposed to sell when prices fall need to worry, and their best bet is to invest in something else — bonds, savings accounts or real estate, for example. As far as enhancing returns is concerned, the history of commodities clearly points to the likelihood of an opposite outcome. In spite of this reality, their current popularity is just what we would have expected, and a telling contra-indicator, given the tendency of institutions to load up on assets that have already risen sharply in price, and sell those that have either done nothing or gone down.
Unfortunately, a lot of the funding for this activity has come from the sale of high quality, large capitalization domestic stocks of the type held in our Fund. This has effectively kept a lid on their values, perhaps giving the impression something’s wrong with them. Nothing could be further from the truth. A similar pattern surfaced in 1998, when investors piled into vastly inflated tech/telecom and dot.com stocks, while nearly everything else went begging. Just as that cycle reversed, this one will too. At that point, money should flow back to the safety and liquidity of high quality growth companies, bolstering their long-sagging valuations.
So, how have domestic stocks performed compared to these alternatives? The answer is “great” but, as the following shows, you have to stay with them a long time to prove it. (That means no jumping in and out of the market on hunches about its direction, no hedging, and no portfolio rebalancing. These strategies may seem promising in retrospect or on paper, but over time they’ll cost you money.) A look back will help put things in perspective. Charles Dow’s Industrial Average debuted May 27, 1896. The original list contained just 12 stocks, grew to 20 in 1916, and then 30 in 1928. At the turn of the 19th century, the Index stood at 65.73, and now, over 100 years later, hovers around 11,000. That works out to 5.3% compounded annually. Adding dividends, the return averaged 9.9%. Tellingly, the Index’s price gain over this long period directly matched the growth in earnings of American businesses, supporting a point we’ve made for years: rising earnings alone cause stocks to appreciate. Despite the financial industry’s efforts to convince us otherwise, investors, as a group, cannot out-perform what the economy delivers. Had there been no growth or additions to the list, the Dow would still be 65.73.
2
The Torray Fund
Letter to Shareholders
August 1, 2006
While inflation has taken a major toll on stock returns, slashing the century-long nominal 9.9% rate to 6.3% in constant dollars, it has punished commodities even more. Since introduction of the Consumer Price Index in 1921, gold has made only 1.5% annually, and that’s after a 150% advance over the last several years. Its price, now about $650 an ounce, peaked at $850 in January 1980, equivalent to $2244 in today’s money; silver has risen less than 0.5% per year since 1792, and copper has dropped from $4.50 a pound in 1855 to around $3.50 today. Even though oil has surged seven-fold in the last eight years, it remains 20% lower than in 1980. Since 1869, it has averaged $19 a barrel in 2005 dollars, yet sold as low as $10 in 1998. Oil’s history is one of booms and busts, not compounding earnings and free cash flow. Comparable measures of emerging and developing markets cannot be taken due to their relatively short histories, and the same can be said for hedge and private equity funds. As a generalization, we think investors should approach these “opportunities” with caution.
The long-term record of domestic stocks clearly bears no resemblance to what the public came to expect in the 1990s, when the S&P 500 compounded at 18.3% for 10 years (its second-best showing ever) and 28.5% for the last five. The latter result convinced many investors — at least those who did the math — that their portfolios would double every two and a half years or so, a complete fantasy given that earnings were growing 5½% annually, a rate that takes 13 years to double money. As we wrote in our mid-year report a year ago, the same thing happened during the decades of the 1920s and ‘50s, when returns averaged 15% and 19%, respectively. Who could have guessed each of those booms would be followed by 20 years of single-digit returns? History is now repeating itself. The five-year trailing performance of the S&P 500 has fallen from 28.5% per year at last decade’s close to 2.5% for the period ending June 30. And the 10-year result has dropped from 18.3% to 8.3%. Furthermore, as the outsized returns of the late ‘90s are replaced by later data, future trailing 10-year numbers will decline even further.
Though it may seem otherwise, none of this should concern us. The time to worry was six years ago, not today. The market’s performance since early 2000 has been a correction of vast speculative excesses, nothing else. The economy is strong, employment robust, and earnings have grown from $360 billion to $890 billion, cutting the market’s price earnings ratio from 37-to-1 to about 15-to-1, and a projected 13.5-to-1 next year. That number is below average dating back to 1871.
3
The Torray Fund
Letter to Shareholders
August 1, 2006
With this backdrop, it is ironic, yet no surprise, that investors, so eager to buy stocks when valuations were two and a half times higher, now reject them. The record is full of such contradictions. For instance, in the spring of 2000, the S&P, as noted, reached a P/E of 37-to-1 — an earnings yield of just 2.7% — while in the fall of 1974, during the Arab oil embargo, it was only 5-to-1. The public couldn’t get enough stock in the first case, but wanted none in the second, even though the earnings yield (20%) was more than seven times higher.
We have been living in one of the most discouraging periods on record for investors and, at this point, a lot of people probably believe things will never get better. But, they always do, most often when least expected. Sooner or later, it doesn’t matter which, optimism will return, most likely triggered by good news now waiting in the shadows around the corner. When that happens, everyone will be talking about how cheap stocks are, yet only perceptions will have changed. Five years from now, today’s concerns will be long forgotten, and the market should be a lot higher. While we think it is always a good time to buy quality stocks at reasonable prices, opportunities seem particularly promising today.
| | |
| Sincerely, | | |
 | |  |
| Robert E. Torray | | Douglas C. Eby |
4
The Torray Fund
PERFORMANCE DATA
As of June 30, 2006 (unaudited)
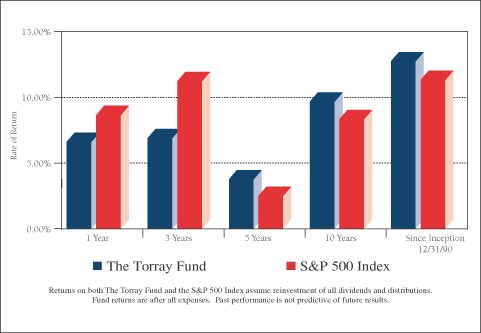
Total Rates of Return on an Investment in The Torray Fund vs. the S&P 500 Index
For the periods ended June 30, 2006:
| | | | | | | | | | | | | | | |
| | | 1 Year
| | | 3 Years
| | | 5 Years
| | | 10 Years
| | | Since
Inception
12/31/90
| |
The Torray Fund | | 6.61 | % | | 6.89 | % | | 3.75 | % | | 9.66 | % | | 12.79 | % |
S&P 500 Index | | 8.63 | % | | 11.22 | % | | 2.49 | % | | 8.32 | % | | 11.32 | % |
Cumulative Returns for the 15 1/2 years ended June 30, 2006
| | | |
The Torray Fund | | 548.39 | % |
S&P 500 Index | | 427.44 | % |
5
The Torray Fund
PERFORMANCE DATA
As of June 30, 2006 (unaudited)
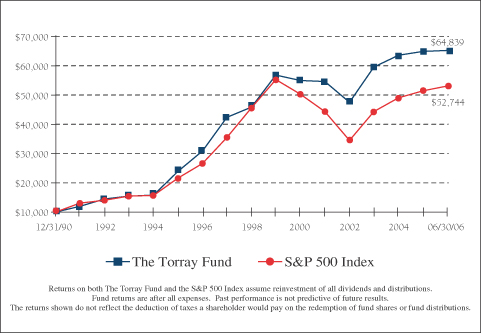
Change in Value of $10,000 Invested on December 31, 1990 (commencement of operations) to:
| | | | | | | | | | | | | | | | | | | | | | | | |
| | | 12/31/92
| | 12/31/94
| | 12/31/96
| | 12/31/98
| | 12/31/00
| | 12/31/02
| | 12/31/04
| | 06/30/06
|
The Torray Fund | | $ | 14,523 | | $ | 15,821 | | $ | 30,719 | | $ | 45,576 | | $ | 54,609 | | $ | 47,236 | | $ | 63,227 | | $ | 64,839 |
S&P 500 Index | | $ | 14,047 | | $ | 15,666 | | $ | 26,499 | | $ | 45,438 | | $ | 49,993 | | $ | 34,318 | | $ | 48,811 | | $ | 52,744 |
6
The Torray Fund
FUND PROFILE
As of June 30, 2006 (unaudited)
| | |
DIVERSIFICATION (% of net assets) | | |
| |
Insurance | | 13.28% |
Pharmaceuticals | | 10.29% |
Media & Entertainment | | 10.04% |
Capital Markets & Asset Managers | | 8.27% |
Aerospace & Defense | | 6.25% |
Machinery | | 6.22% |
Information Technology Services | | 5.83% |
Semiconductor & Semi Equipment | | 5.81% |
Biotechnology | | 4.47% |
Health Care Providers & Services | | 4.44% |
Health Care Equipment & Supplies | | 4.20% |
Telecommunication Services | | 2.71% |
Specialty Retail | | 2.25% |
Consumer Finance | | 2.25% |
Diversified Financial Services | | 2.07% |
Specialty Chemicals | | 1.65% |
Real Estate | | 1.62% |
Electrical Equipment | | 1.55% |
Beverages | | 0.97% |
Industrial Conglomerates | | 0.57% |
Convertible Bond | | 4.36% |
Short-Term Investments | | 0.73% |
Other Assets Less Liabilities | | 0.17% |
| | |
|
| | | 100.00% |
| | |
| TOP TEN EQUITY HOLDINGS |
| 1. | | Univision Communications, Inc. |
| 2. | | Eli Lilly and Company |
| 3. | | Amgen Inc. |
| 4. | | Cardinal Health, Inc. |
| 5. | | Medtronic, Inc. |
| 6. | | Markel Corporation |
| 7. | | Ambac Financial Group, Inc. |
| 8. | | United Technologies Corporation |
| 9. | | Illinois Tool Works Inc. |
| 10. | | Abbott Laboratories |
| | | | | |
TOP FIXED INCOME HOLDINGS | | | |
| | |
Level 3 Communications | | 10.00% | | due 2011 | |
|
PORTFOLIO CHARACTERISTICS | |
| | |
Net Assets (million) | | | | $1,163 | |
Number of Stocks | | | | 40 | |
Portfolio Turnover | | | | 9.94% | * |
P/E Multiple (forward) | | | | 14.8x | |
Portfolio Yield | | | | 1.30% | ** |
Market Capitalization | | Average | | 48.0 B | |
| | | Median | | 26.6 B | |
| * | | For the six-month period ended June 30, 2006 |
7
The Torray Fund
SCHEDULE OF INVESTMENTS
As of June 30, 2006 (unaudited)
| | | | | | | |
| | | Shares
| | | | Market Value
|
| COMMON STOCK 94.74% | | | |
| |
| 13.28% INSURANCE | | | |
| | | 136,105 | | Markel Corporation * | | $ | 47,228,435 |
| | | 574,150 | | Ambac Financial Group, Inc. | | | 46,563,565 |
| | | 376,144 | | Fairfax Financial Holdings Limited | | | 35,744,964 |
| | | 830,500 | | Marsh & McLennan Companies, Inc. | | | 22,332,145 |
| | | 42,400 | | American International Group, Inc. | | | 2,503,720 |
| | | | | | |
|
|
| | | | | | | | 154,372,829 |
| |
| 10.29% PHARMACEUTICALS | | | |
| | | 996,300 | | Eli Lilly and Company | | | 55,065,501 |
| | | 964,900 | | Abbott Laboratories | | | 42,079,289 |
| | | 375,900 | | Johnson & Johnson | | | 22,523,928 |
| | | | | | |
|
|
| | | | | | | | 119,668,718 |
| |
| 10.04% MEDIA & ENTERTAINMENT | | | |
| | | 1,997,900 | | Univision Communications, Inc. * | | | 66,929,650 |
| | | 772,600 | | Tribune Company | | | 25,055,418 |
| | | 466,900 | | The Walt Disney Company | | | 14,007,000 |
| | | 129,025 | | The McClatchy Company - Class A | | | 5,176,474 |
| | | 82,800 | | Gannett Co., Inc. | | | 4,631,004 |
| | | 30,183 | | Clear Channel Communications, Inc. | | | 934,164 |
| | | | | | |
|
|
| | | | | | | | 116,733,710 |
| |
| 8.27% CAPITAL MARKETS & ASSET MANAGERS | | | |
| | | 181,800 | | The Goldman Sachs Group, Inc. | | | 27,348,174 |
| | | 2,240,200 | | LaBranche & Co. Inc. * | | | 27,128,822 |
| | | 225,700 | | Franklin Resources, Inc. | | | 19,593,017 |
| | | 423,100 | | Calamos Asset Management, Inc. | | | 12,265,669 |
| | | 341,671 | | Allied Capital Corporation | | | 9,829,875 |
| | | | | | |
|
|
| | | | | | | | 96,165,557 |
| |
| 6.25% AEROSPACE & DEFENSE | | | |
| | | 730,350 | | United Technologies Corporation | | | 46,318,797 |
| | | 230,100 | | General Dynamics Corporation | | | 15,062,346 |
| | | 279,300 | | Honeywell International Inc. | | | 11,255,790 |
| | | | | | |
|
|
| | | | | | | | 72,636,933 |
8
The Torray Fund
SCHEDULE OF INVESTMENTS (continued)
As of June 30, 2006 (unaudited)
| | | | | | | |
| | | Shares
| | | | Market Value
|
| |
| 6.22% MACHINERY | | | |
| | | 972,500 | | Illinois Tool Works Inc. | | $ | 46,193,750 |
| | | 406,000 | | Danaher Corporation | | | 26,113,920 |
| | | | | | |
|
|
| | | | | | | | 72,307,670 |
| |
| 5.83% INFORMATION TECHNOLOGY SERVICES | | | |
| | | 875,200 | | First Data Corporation | | | 39,419,008 |
| | | 624,800 | | Automatic Data Processing, Inc. | | | 28,334,680 |
| | | | | | |
|
|
| | | | | | | | 67,753,688 |
| |
| 5.81% SEMICONDUCTOR & SEMI EQUIPMENT | | | |
| | | 2,524,700 | | Applied Materials, Inc. | | | 41,102,116 |
| | | 1,398,400 | | Intel Corporation | | | 26,499,680 |
| | | | | | |
|
|
| | | | | | | | 67,601,796 |
| |
| 4.47% BIOTECHNOLOGY | | | |
| | | 797,700 | | Amgen Inc. * | | | 52,033,971 |
| |
| 4.44% HEALTH CARE PROVIDERS & SERVICES | | | |
| | | 803,600 | | Cardinal Health, Inc. | | | 51,695,588 |
| |
| 4.20% HEALTH CARE EQUIPMENT & SUPPLIES | | | |
| | | 1,039,700 | | Medtronic, Inc. | | | 48,782,724 |
| |
| 2.71% TELECOMMUNICATION SERVICES | | | |
| | | 1,575,900 | | Sprint Nextel Corporation | | | 31,502,241 |
| |
| 2.25% SPECIALTY RETAIL | | | |
| | | 840,400 | | O’Reilly Automotive, Inc. * | | | 26,212,076 |
| |
| 2.25% CONSUMER FINANCE | | | |
| | | 492,100 | | American Express Company | | | 26,189,562 |
| |
| 2.07% DIVERSIFIED FINANCIAL SERVICES | | | |
| | | 572,062 | | JPMorgan Chase & Co. | | | 24,026,604 |
| |
| 1.65% SPECIALTY CHEMICALS | | | |
| | | 1,639,900 | | W.R. Grace & Co. * | | | 19,186,830 |
9
The Torray Fund
SCHEDULE OF INVESTMENTS (continued)
As of June 30, 2006 (unaudited)
| | | | | | | |
| | | Shares
| | | | Market Value
|
| |
| 1.62% REAL ESTATE | | | |
| | | 422,500 | | CarrAmerica Realty Corporation | | $ | 18,822,375 |
| |
| 1.55% ELECTRICAL EQUIPMENT | | | |
| | | 215,300 | | Emerson Electric Co. | | | 18,044,293 |
| |
| 0.97% BEVERAGES | | | |
| | | 247,400 | | Anheuser-Busch Cos., Inc. | | | 11,278,966 |
| |
| 0.57% INDUSTRIAL CONGLOMERATES | | | |
| | | 199,600 | | General Electric Company | | | 6,578,816 |
| | | | | | |
|
|
| TOTAL COMMON STOCK 94.74% | | | 1,101,594,947 |
| (cost $943,452,857) | | | | | |
| | | |
| | | Principal Amount ($)
| | | | |
| CONVERTIBLE BOND 4.36% | | | |
| (cost $34,790,263) | | | | | |
| | | 32,880,000 | | Level 3 Communications 10.00% due 2011 | | | 50,746,532 |
| SHORT-TERM INVESTMENTS 0.73% | | | |
| (cost $8,491,461) | | PNC Bank Money Market Account, 4.55% | | | 8,491,461 |
| | | | | | |
|
|
| TOTAL PORTFOLIO SECURITIES 99.83% | | | 1,160,832,940 |
| (cost $986,734,581) | | | | | |
| OTHER ASSETS LESS LIABILITIES 0.17% | | | 1,956,755 |
| | | | | | |
|
|
| NET ASSETS 100.00% | | $ | 1,162,789,695 |
| | | | | | |
|
|
| * | | Non-income producing securities |
See notes to the financial statements.
10
The Torray Fund
STATEMENT OF ASSETS AND LIABILITIES
As of June 30, 2006 (unaudited)
| | | |
ASSETS | | | |
Investments in securities at value
(amortized cost $986,734,581) | | $ | 1,160,832,940 |
Receivable for investments sold | | | 2,030,296 |
Interest and dividends receivable | | | 1,067,694 |
Subscriptions receivable | | | 604,288 |
Prepaid expenses | | | 28,841 |
| | |
|
|
TOTAL ASSETS | | | 1,164,564,059 |
| | |
|
|
| |
LIABILITIES | | | |
Payable to advisor | | | 964,945 |
Redemptions payable | | | 651,141 |
Accrued expenses | | | 158,278 |
| | |
|
|
TOTAL LIABILITIES | | | 1,774,364 |
| | |
|
|
| |
NET ASSETS | | $ | 1,162,789,695 |
| | |
|
|
Shares of beneficial interest ($1 stated value,
29,843,842 shares outstanding, unlimited
shares authorized) | | $ | 29,843,842 |
Paid-in-capital in excess of par | | | 902,453,051 |
Accumulated net investment income | | | 218,833 |
Accumulated net realized gain on investments | | | 56,175,610 |
Net unrealized appreciation of investments | | | 174,098,359 |
| | |
|
|
| |
TOTAL NET ASSETS | | $ | 1,162,789,695 |
| | |
|
|
Per Share | | $ | 38.96 |
| | |
|
|
See notes to the financial statements.
11
The Torray Fund
STATEMENT OF OPERATIONS
For the six months ended June 30, 2006 (unaudited)
| | | | |
INVESTMENT INCOME | | | | |
Dividend income (net of foreign taxes withheld of $78,990) | | $ | 7,479,961 | |
Interest income | | | 1,336,535 | |
| | |
|
|
|
Total income | | | 8,816,496 | |
| | |
|
|
|
| |
EXPENSES | | | | |
Management fees | | | 6,300,305 | |
Transfer agent fees & expenses | | | 286,550 | |
Printing, postage & mailing | | | 41,938 | |
Custodian fees | | | 30,064 | |
Trustees’ fees | | | 32,167 | |
Insurance | | | 19,743 | |
Registration & filing fees | | | 22,813 | |
Legal fees | | | 23,200 | |
Audit fees | | | 18,000 | |
| | |
|
|
|
Total expenses | | | 6,774,780 | |
| | |
|
|
|
NET INVESTMENT INCOME | | | 2,041,716 | |
| | |
|
|
|
REALIZED AND UNREALIZED GAIN (LOSS)
ON INVESTMENTS | | | | |
Net realized gain on investments | | | 39,409,811 | |
Net change in unrealized appreciation (depreciation) on investments | | | (30,024,333 | ) |
| | |
|
|
|
Net realized and unrealized gain on investments | | | 9,385,478 | |
| | |
|
|
|
NET INCREASE IN NET ASSETS FROM OPERATIONS | | $ | 11,427,194 | |
| | |
|
|
|
See notes to the financial statements.
12
The Torray Fund
STATEMENTS OF CHANGES IN NET ASSETS
For the periods indicated:
| | | | | | | | |
| | | Six months ended
06/30/06
(unaudited)
| | | Year ended
12/31/05
| |
Increase in Net Assets from Operations: | | | | | | | | |
Net investment income | | $ | 2,041,716 | | | $ | 5,029,187 | |
Net realized gain on investments | | | 39,409,811 | | | | 105,058,339 | |
Capital gain distributions from investment companies | | | — | | | | 1,567,211 | |
Net change in unrealized appreciation
(depreciation) on investments | | | (30,024,333 | ) | | | (91,069,400 | ) |
| | |
|
|
| |
|
|
|
Net increase in net assets from operations | | | 11,427,194 | | | | 20,585,337 | |
| | |
|
|
| |
|
|
|
| | |
Distributions to Shareholders from: | | | | | | | | |
Net investment income ($0.059 and
$0.133 per share, respectively) | | | (1,822,883 | ) | | | (5,029,187 | ) |
Net realized gains ($0.178 and $2.713 per
share, respectively) | | | (5,295,448 | ) | | | (93,175,112 | ) |
| | |
|
|
| |
|
|
|
Total distributions | | | (7,118,331 | ) | | | (98,204,299 | ) |
| | |
|
|
| |
|
|
|
| | |
Shares of Beneficial Interest | | | | | | | | |
Decrease from share transactions | | | (171,469,918 | ) | | | (326,930,702 | ) |
| | |
|
|
| |
|
|
|
Total decrease | | | (167,161,055 | ) | | | (404,549,664 | ) |
| | |
Net Assets — Beginning of Period | | | 1,329,950,750 | | | | 1,734,500,414 | |
| | |
|
|
| |
|
|
|
Net Assets — End of Period | | $ | 1,162,789,695 | | | $ | 1,329,950,750 | |
| | |
|
|
| |
|
|
|
Accumulated Net Investment Income | | $ | 218,833 | | | $ | — | |
| | |
|
|
| |
|
|
|
See notes to the financial statements.
13
The Torray Fund
FINANCIAL HIGHLIGHTS
For a share outstanding:
PER SHARE DATA
| | | | | | | | | | | | | | | | | | | | | | | | |
| | | Six months
ended
06/30/06 (unaudited)
| | | Years ended December 31:
| |
| | | | 2005
| | | 2004
| | | 2003
| | | 2002
| | | 2001
| |
Net Asset Value,
Beginning of Period | | $ | 39.020 | | | $ | 41.080 | | | $ | 39.980 | | | $ | 32.240 | | | $ | 37.530 | | | $ | 39.790 | |
| | |
|
|
| |
|
|
| |
|
|
| |
|
|
| |
|
|
| |
|
|
|
Income from investment operations | | | | | | | | | | | | | | | | | | | | | | | | |
Net investment income | | | 0.069 | | | | 0.133 | | | | 0.165 | | | | 0.220 | | | | 0.205 | | | | 0.172 | |
Net gains (losses) on securities (both realized and unrealized) | | | 0.108 | | | | 0.653 | | | | 2.523 | | | | 7.864 | | | | (5.083 | ) | | | (0.489 | ) |
| | |
|
|
| |
|
|
| |
|
|
| |
|
|
| |
|
|
| |
|
|
|
Total from investment operations | | | 0.177 | | | | 0.786 | | | | 2.688 | | | | 8.084 | | | | (4.878 | ) | | | (0.317 | ) |
| | |
|
|
| |
|
|
| |
|
|
| |
|
|
| |
|
|
| |
|
|
|
Less: distributions | | | | | | | | | | | | | | | | | | | | | | | | |
Dividends (from net investment income) | | | (0.059 | ) | | | (0.133 | ) | | | (0.165 | ) | | | (0.220 | ) | | | (0.205 | ) | | | (0.184 | ) |
Distributions (from capital gains) | | | (0.178 | ) | | | (2.713 | ) | | | (1.423 | ) | | | (0.124 | ) | | | (0.207 | ) | | | (1.759 | ) |
| | |
|
|
| |
|
|
| |
|
|
| |
|
|
| |
|
|
| |
|
|
|
Total distributions | | | (0.237 | ) | | | (2.846 | ) | | | (1.588 | ) | | | (0.344 | ) | | | (0.412 | ) | | | (1.943 | ) |
| | |
|
|
| |
|
|
| |
|
|
| |
|
|
| |
|
|
| |
|
|
|
Net Asset Value,
End of Period | | $ | 38.960 | | | $ | 39.020 | | | $ | 41.080 | | | $ | 39.980 | | | $ | 32.240 | | | $ | 37.530 | |
| | |
|
|
| |
|
|
| |
|
|
| |
|
|
| |
|
|
| |
|
|
|
TOTAL RETURN(1) | | | 0.46 | %** | | | 2.08 | % | | | 6.90 | % | | | 25.19 | % | | | (13.05 | %) | | | (0.52 | %) |
RATIOS/SUPPLEMENTAL DATA | | | | | | | | | | | | | | | | | | | | | | | | |
Net assets, end of period
(000’s omitted) | | $ | 1,162,790 | | | $ | 1,329,951 | | | $ | 1,734,500 | | | $ | 1,655,279 | | | $ | 1,367,536 | | | $ | 1,638,814 | |
Ratios of expenses to average net assets | | | 1.08 | %* | | | 1.07 | % | | | 1.08 | % | | | 1.11 | % | | | 1.07 | % | | | 1.07 | % |
Ratios of net income to average net assets | | | 0.32 | %* | | | 0.34 | % | | | 0.41 | % | | | 0.62 | % | | | 0.58 | % | | | 0.45 | % |
Portfolio turnover rate | | | 9.94 | %** | | | 33.16 | % | | | 27.12 | % | | | 37.11 | % | | | 22.52 | % | | | 37.56 | % |
| (1) | | Past performance is not predictive of future performance. |
See notes to the financial statements.
14
The Torray Fund
NOTES TO FINANCIAL STATEMENTS
As of June 30, 2006 (unaudited)
NOTE 1 — SUMMARY OF SIGNIFICANT ACCOUNTING POLICIES
The Torray Fund (“Fund”) is a separate series of The Torray Fund (“Trust”). The Trust is registered under the Investment Company Act of 1940 as a no-load, diversified, open-end management investment company. The Trust was organized as a business trust under Massachusetts law. The Fund’s primary investment objective is to provide long-term total return. The Fund seeks to meet its objective by investing its assets in a diversified portfolio of common stocks. In order to accomplish these goals, the Fund intends to hold stocks for the long term, as opposed to actively buying and selling. There can be no assurances that the Fund’s investment objectives will be achieved.
The following is a summary of accounting policies followed by the Fund in the preparation of its financial statements. These policies are in conformity with accounting principles generally accepted in the United States of America.
Securities Valuation Portfolio securities for which market quotations are readily available are valued at market value, which is determined by using the last reported sale price, or, if no sales are reported, the last reported bid price. For NASDAQ traded securities, market value is determined on the basis of the NASDAQ official closing price (the “NOCP”) instead of the last reported sales price. Other assets and securities for which no quotations are readily available or for which Torray LLC (the “Advisor”) believes do not reflect market value are valued at fair value as determined in good faith by the Advisor under the supervision of the Board of Trustees in accordance with the Fund’s Valuation Procedures. Short-term obligations having remaining maturities of 60 days or less are valued at amortized cost, which approximates market value.
Securities Transactions and Investment Income Securities transactions are recorded on a trade date basis. Realized gains and losses from securities transactions are recorded on the specific identification basis. Dividend income and distributions to shareholders are recorded on the ex-dividend date. Interest income, including amortization of discount on short-term investments, and expenses are recorded on the accrual basis.
Federal Income Taxes The Fund intends to continue to comply with the requirements of the Internal Revenue Code applicable to regulated investment companies and to distribute all of its taxable income, including any net realized gain on investments to its shareholders. Therefore, no Federal income tax provision is required.
Net Asset Value The net asset value per share of the Fund is determined daily as of the close of trading on the New York Stock Exchange by dividing the value of the Fund’s net assets by the number of shares outstanding.
Use of Estimates In preparing financial statements in accordance with accounting principles generally accepted in the United States of America, management is required to make estimates and assumptions that affect the reported amounts of assets and liabilities and the disclosure of contingent assets and liabilities at the date of the financial statements, and the reported amounts of increases and decreases in net assets from operations during the reporting period. Actual results could differ from those estimates.
15
The Torray Fund
NOTES TO FINANCIAL STATEMENTS (continued)
As of June 30, 2006 (unaudited)
NOTE 2 — SHARES OF BENEFICIAL INTEREST TRANSACTIONS
Transactions in shares of beneficial interest were as follows:
| | | | | | | | | | | | | | |
| | | Six months ended
06/30/06
| | | Year ended
12/31/05
| |
| | | Shares
| | | Amount
| | | Shares
| | | Amount
| |
Shares issued | | 984,392 | | | $ | 39,663,608 | | | 2,892,352 | | | $ | 114,885,220 | |
Reinvestments of dividends and distributions | | 181,842 | | | | 7,001,830 | | | 2,426,708 | | | | 93,419,725 | |
Shares redeemed | | (5,403,928 | ) | | | (218,135,356 | ) | | (13,457,168 | ) | | | (535,235,647 | ) |
| | |
|
| |
|
|
| |
|
| |
|
|
|
| | | (4,237,694 | ) | | $ | (171,469,918 | ) | | (8,138,108 | ) | | $ | (326,930,702 | ) |
| | |
|
| |
|
|
| |
|
| |
|
|
|
Officers, Trustees and affiliated persons of The Torray Fund and their families directly or indirectly control 2,195,668 shares or 7.36% of the Fund.
NOTE 3 — INVESTMENT TRANSACTIONS
Purchases and sales of investment securities, other than short-term investments, for the six months ended June 30, 2006, aggregated $125,474,058 and $299,784,937, respectively.
NOTE 4 — MANAGEMENT FEES
Pursuant to the Management Contract, Torray LLC provides investment advisory and administrative services to the Fund. The Fund pays Torray LLC a management fee, computed daily and payable monthly at the annual rate of one percent of the Fund’s average daily net assets. For the six months ended June 30, 2006, The Torray Fund paid management fees of $6,300,305.
Excluding the management fee, other expenses incurred by the Fund during the six months ended June 30, 2006, totaled $474,475. These expenses include all costs associated with the Fund’s operations including transfer agent fees, Independent Trustees’ fees ($14,000 per annum and $2,000 for each Board meeting attended), taxes, dues, fees and expenses of registering and qualifying the Fund and its shares for distribution, charges of custodian, auditing and legal expenses, insurance premiums, supplies, postage, expenses of issue or redemption of shares, re- ports to shareholders and Trustees, expenses of printing and mailing prospectuses, proxy statements and proxies to existing shareholders, and other miscellaneous expenses.
Certain officers and Trustees of the Fund are also officers and/or shareholders of Torray LLC.
16
The Torray Fund
NOTES TO FINANCIAL STATEMENTS (continued)
As of June 30, 2006 (unaudited)
NOTE 5 — TAX MATTERS
Distributions to shareholders are determined in accordance with federal income tax regulations which may differ from accounting principles generally accepted in the United States of America.
The tax character of distributions paid during the six months ended June 30, 2006 and the year ended December 31, 2005 were as follows:
| | | | | | | | | | | |
| | | | | Six months ended
06/30/06
| | | 2005
| | |
| | | Distributions paid from: | | | | | | | | | |
| | | Ordinary income | | $ | 1,822,883 | | | $ | 5,029,187 | | |
| | | Long-term capital gain | | | 5,295,448 | | | | 93,175,112 | | |
| | | | |
|
|
| |
|
| | |
| | | | | $ | 7,118,331 | | | $ | 98,204,299 | | |
| | | | |
|
|
| |
|
| | |
|
As of December 31, 2005, the components of distributable earnings on a tax basis were as follows: |
| | | | |
| | | Undistributed long-term gain | | $ | 23,469,593 | | | | | | |
| | | Unrealized appreciation | | | 202,714,346 | | | | | | |
| | | | |
|
|
| | | | | |
| | | | | $ | 226,183,939 | | | | | | |
| | | | |
|
|
| | | | | |
|
The following information is based upon the federal income tax basis of investment securities as of June 30, 2006: |
| | | | |
| | | Gross unrealized appreciation | | $ | 231,915,790 | | | | | | |
| | | Gross unrealized depreciation | | | (57,817,431 | ) | | | | | |
| | | | |
|
|
| | | | | |
| | | Net unrealized appreciation | | $ | 174,098,359 | | | | | | |
| | | | |
|
|
| | | | | |
| | | Federal income tax basis | | $ | 986,734,581 | | | | | | |
| | | | |
|
|
| | | | | |
The primary difference between book basis and tax basis distributions and distributable earnings is different book and tax treatment of short-term capital gains and the tax deferral of losses on wash sales.
NOTE 6 — COMMITMENTS AND CONTINGENCIES
The Fund indemnifies its officers and trustees for certain liabilities that may arise from their performance of their duties to the Fund. Additionally, in the normal course of business, the Fund enters into contracts that contain a variety of representations and warranties which provide general indemnifications. The Fund’s maximum exposure under these arrangements is unknown, as this would involve future claims that may be made against the Fund that have not yet occurred.
17
The Torray Fund
PORTFOLIO HOLDINGS, PROXY VOTING AND PROCEDURES
As of June 30, 2006 (unaudited)
The Fund files its complete schedule of portfolio holdings with the Securities and Exchange Commission (the “Commission”) for the first and third quarters of each fiscal year on Form N-Q. The Fund’s Forms N-Q are available on the Commission’s website at http://www.sec.gov. The Fund’s Form N-Q may be reviewed and copied at the Commission’s Public Reference Room in Washington, D.C. Information on the operation of the Commission’s Public Reference Room may be obtained by calling 1-800-SEC-0330.
A description of the policies and procedures that the Fund uses to determine how to vote proxies relating to portfolio securities is available without charge, upon request, by calling 1-800-443-3036; and on the Commission’s website at http://www.sec.gov.
Information regarding how the Fund voted proxies relating to portfolio securities is available without charge, upon request, by calling 1-800-443-3036; and on the Commission’s website at http://www.sec.gov.
18
The Torray Fund
ABOUT YOUR FUND’S EXPENSES
As of June 30, 2006 (unaudited)
We believe it is important for you to understand the impact of costs on your investment. All mutual funds have operating expenses. As a shareholder of the Fund, you incur ongoing costs, including management fees, and other fund expenses. Operating expenses, which are deducted directly from the Fund’s gross income, directly reduce the investment return of the Fund.
A fund’s expenses are expressed as a percentage of its average net assets. This figure is known as the expense ratio. The following examples are intended to help you understand the ongoing costs (in dollars) of investing in the Fund and to compare these costs with the ongoing costs of investing in other mutual funds. The examples below are based on an investment of $1,000 made at the beginning of the period shown and held for the entire period.
The table on the next page illustrates the Fund’s cost in two ways:
Actual Fund Return This section helps you estimate the actual expenses that you paid over the period. The “Ending Account Value” shown is derived from the Fund’s actual return, and the third column shows the operating expenses that would have been paid by an investor who started with $1,000 in the Fund. You may use the information here, together with the amount invested, to estimate the expenses that you paid over the period.
To do so, simply divide your account value by $1,000 (for example, an $8,600 account value divided by $1,000 = 8.6), then multiply the result by the number given for the Fund under the heading “Expenses Paid During Period” on the next page.
Hypothetical 5% Return This section is intended to help you compare your Fund’s costs with those of other mutual funds. It assumes that the Fund had an annual return of 5% before expenses, and that the expense ratio is unchanged. In this case, because the return used is not the Fund’s actual return, the results do not apply to your investment. The example is useful in making comparisons because the Securities and Exchange Commission requires all mutual funds to calculate expenses based on a 5% return. You can assess the Fund’s costs by comparing this hypothetical example with the hypothetical examples that appear in shareholder reports of other funds.
Note that expenses shown in the table are meant to highlight and help you compare ongoing costs only. The Fund does not charge transactions fees, such as purchase or redemption fees, nor does it carry a “sales load.”
The calculation assumes no shares were bought or sold during the period. Your actual costs may have been higher or lower, depending on the amount of your investment and the timing of any purchases or redemptions.
19
The Torray Fund
ABOUT YOUR FUND’S EXPENSES
As of June 30, 2006 (unaudited)
More information about the Fund’s expenses, including recent annual expense ratios, can be found in this report. For additional information on operating expenses and other shareholder costs, please refer to the Fund’s prospectus.
| | | | | | | | | |
| | | Beginning
Account Value
December 31, 2005
| | Ending
Account Value
June 30, 2006
| | Expenses Paid
During Period *
|
Based on Actual Fund Return | | $ | 1,000.00 | | $ | 1,004.60 | | $ | 5.37 |
Based on Hypothetical 5% Return
(before expenses) | | $ | 1,000.00 | | $ | 1,019.44 | | $ | 5.41 |
* Expenses are equal to The Torray Fund’s annualized expense ratio of 1.08% for the period, multiplied by the average account value over the period, multiplied by 181/365 (to reflect the one-half year period).
20
TRUSTEES
Carol Crawford
Douglas C. Eby
Bruce C. Ellis
Patricia Kavanagh
William M Lane
Robert P. Moltz
Roy A. Schotland
Wayne H. Shaner
Robert E. Torray
INVESTMENT ADVISOR
Torray LLC
OFFICERS
Robert E. Torray, Chairman
Douglas C. Eby, President
William M Lane, Executive Vice President
Fred M. Fialco, Vice President
Siva Natarajan, CFA, Vice President
A. Scott Lamond IV, Vice President
INDEPENDENT REGISTERED
PUBLIC ACCOUNTING FIRM
Briggs, Bunting & Dougherty, LLP
Two Penn Center Plaza, Suite 820
Philadelphia, PA 19102-1732
TRANSFER AGENT
PFPC Inc.
101 Sabin Street
Pawtucket, RI 02860-1427
LEGAL COUNSEL
Dechert
1775 I Street, N.W.
Washington, D.C. 20006
This report is not authorized for distribution to prospective investors unless preceded or accompanied by a current prospectus.
The
TORRAY
FUND
SEMI-ANNUAL REPORT
June 30, 2006
The Torray Fund
Suite 1100
7501 Wisconsin Avenue
Bethesda, Maryland 20814-6523
(301) 493-4600
(800) 443-3036
The Torray Institutional Fund
Letter to Shareholders
August 1, 2006
Dear Fellow Shareholders,
The Torray Institutional Fund depreciated 0.1% during the six-month period ending June 30, while the Standard & Poor’s 500 Index gained 2.7%. Since its inception five years ago, the Fund has returned 4.4% annually, compared to 2.5% for the Index. After advancing about 7% through early May, our stocks turned down along with the rest of the market in response to The Federal Reserve Board’s tightening of interest rates. During June, the slump deepened as concerns shifted to the Middle East conflict. We do not think these issues pose a serious risk, given the sharp reduction in price/earnings ratios that has occurred over the last six years. However, they did deflect attention from the strong business performance and low valuations of the Fund’s investments. We’ll have more to say on these points later.
The duration of this downturn has left investors disillusioned and in a mood to try almost anything to regain lost ground. Many have shifted to alternative investments like hedge and private equity funds, commodities and currencies. Money has also been flooding into larger developing countries and emerging markets, despite their turbulent history, risky fundamentals and eye-popping advances. Russia and Colombia are up 12 and 14 times, respectively, from their bear market lows; Brazil and India have quadrupled, Poland has tripled and the Philippines nearly doubled. Recently highlighted investments include banks in the former Soviet Republic of Georgia, airlines in Kenya, oil refineries in central Russia and startup stockbrokers in India tabbed “Indiabulls.” DLF, India’s largest real estate developer, has announced plans to go public at a suggested $25.7 billion valuation. With earnings of only $44 million last year, investors will be paying $584 for every dollar of profit if the deal goes through. This compares to less than $15 per dollar of 2007 estimated earnings for The Torray Institutional Fund portfolio. The popularity of these often-murky situations highlights not only investors’ frustration with years of poor performance in the U.S., but the fact that memories of past emerging market crises have dimmed.
Meanwhile, investors continue to chase commodities and the stocks of companies that produce them. Even though oil, gold, silver, copper, and so on, have generated virtually no inflation-adjusted returns in over a hundred years, large pension funds and other institutions have committed billions of dollars to them. None apparently had the slightest interest at half the price or less a few years ago. It is claimed that these inert assets, when blended in a broadly diversified portfolio, will dampen volatility and boost returns, since their fluctuations theoretically won’t correlate with those of domestic stocks and bonds. Loosely translated, this means no
1
The Torray Institutional Fund
Letter to Shareholders
August 1, 2006
matter which way your other investments go, commodities won’t necessarily follow suit. The point escapes us. Why expose yourself to losses — and, over time, there will be plenty to go around — just to avoid volatility, when it has nothing to do with risk in the first place? Certainly no one complains when stocks are going up. In fact, the higher they climb, the more investors want, and the safer they feel. Only those predisposed to sell when prices fall need to worry, and their best bet is to invest in something else — bonds, savings accounts or real estate, for example. As far as enhancing returns is concerned, the history of commodities clearly points to the likelihood of an opposite outcome. In spite of this reality, their current popularity is just what we would have expected, and a telling contra-indicator, given the tendency of institutions to load up on assets that have already risen sharply in price, and sell those that have either done nothing or gone down.
Unfortunately, a lot of the funding for this activity has come from the sale of high quality, large capitalization domestic stocks of the type held in our Fund. This has effectively kept a lid on their values, perhaps giving the impression something’s wrong with them. Nothing could be further from the truth. A similar pattern surfaced in 1998, when investors piled into vastly inflated tech/telecom and dot.com stocks, while nearly everything else went begging. Just as that cycle reversed, this one will too. At that point, money should flow back to the safety and liquidity of high quality growth companies, bolstering their long-sagging valuations.
So, how have domestic stocks performed compared to these alternatives? The answer is “great” but, as the following shows, you have to stay with them a long time to prove it. (That means no jumping in and out of the market on hunches about its direction, no hedging, and no portfolio rebalancing. These strategies may seem promising in retrospect or on paper, but over time they’ll cost you money.) A look back will help put things in perspective. Charles Dow’s Industrial Average debuted May 27, 1896. The original list contained just 12 stocks, grew to 20 in 1916, and then 30 in 1928. At the turn of the 19th century, the Index stood at 65.73, and now, over 100 years later, hovers around 11,000. That works out to 5.3% compounded annually. Adding dividends, the return averaged 9.9%. Tellingly, the Index’s price gain over this long period directly matched the growth in earnings of American businesses, supporting a point we’ve made for years: rising earnings alone cause stocks to appreciate. Despite the financial industry’s efforts to convince us otherwise, investors, as a group, cannot out-perform what the economy delivers. Had there been no growth or additions to the list, the Dow would still be 65.73.
2
The Torray Institutional Fund
Letter to Shareholders
August 1, 2006
While inflation has taken a major toll on stock returns, slashing the century-long nominal 9.9% rate to 6.3% in constant dollars, it has punished commodities even more. Since introduction of the Consumer Price Index in 1921, gold has made only 1.5% annually, and that’s after a 150% advance over the last several years. Its price, now about $650 an ounce, peaked at $850 in January 1980, equivalent to $2244 in today’s money; silver has risen less than 0.5% per year since 1792, and copper has dropped from $4.50 a pound in 1855 to around $3.50 today. Even though oil has surged seven-fold in the last eight years, it remains 20% lower than in 1980. Since 1869, it has averaged $19 a barrel in 2005 dollars, yet sold as low as $10 in 1998. Oil’s history is one of booms and busts, not compounding earnings and free cash flow. Comparable measures of emerging and developing markets cannot be taken due to their relatively short histories, and the same can be said for hedge and private equity funds. As a generalization, we think investors should approach these “opportunities” with caution.
The long-term record of domestic stocks clearly bears no resemblance to what the public came to expect in the 1990s, when the S&P 500 compounded at 18.3% for 10 years (its second-best showing ever) and 28.5% for the last five. The latter result convinced many investors — at least those who did the math — that their portfolios would double every two and a half years or so, a complete fantasy given that earnings were growing 5½% annually, a rate that takes 13 years to double money. As we wrote in our mid-year report a year ago, the same thing happened during the decades of the 1920s and ‘50s, when returns averaged 15% and 19%, respectively. Who could have guessed each of those booms would be followed by 20 years of single-digit returns? History is now repeating itself. The five-year trailing performance of the S&P 500 has fallen from 28.5% per year at last decade’s close to 2.5% for the period ending June 30. And the 10-year result has dropped from 18.3% to 8.3%. Furthermore, as the outsized returns of the late ‘90s are replaced by later data, future trailing 10-year numbers will decline even further.
Though it may seem otherwise, none of this should concern us. The time to worry was six years ago, not today. The market’s performance since early 2000 has been a correction of vast speculative excesses, nothing else. The economy is strong, employment robust, and earnings have grown from $360 billion to $890 billion, cutting the market’s price earnings ratio from 37-to-1 to about 15-to-1, and a projected 13.5-to-1 next year. That number is below average dating back to 1871.
3
The Torray Institutional Fund
Letter to Shareholders
August 1, 2006
With this backdrop, it is ironic, yet no surprise, that investors, so eager to buy stocks when valuations were two and a half times higher, now reject them. The record is full of such contradictions. For instance, in the spring of 2000, the S&P, as noted, reached a P/E of 37-to-1 — an earnings yield of just 2.7% — while in the fall of 1974, during the Arab oil embargo, it was only 5-to-1. The public couldn’t get enough stock in the first case, but wanted none in the second, even though the earnings yield (20%) was more than seven times higher.
We have been living in one of the most discouraging periods on record for investors and, at this point, a lot of people probably believe things will never get better. But, they always do, most often when least expected. Sooner or later, it doesn’t matter which, optimism will return, most likely triggered by good news now waiting in the shadows around the corner. When that happens, everyone will be talking about how cheap stocks are, yet only perceptions will have changed. Five years from now, today’s concerns will be long forgotten, and the market should be a lot higher. While we think it is always a good time to buy quality stocks at reasonable prices, opportunities seem particularly promising today.
| | | | |
| Sincerely, | | | | |
| | |
 | | | |  |
| Robert E. Torray | | | | Douglas C. Eby |
4
The Torray Institutional Fund
PERFORMANCE DATA
As of June 30, 2006 (unaudited)
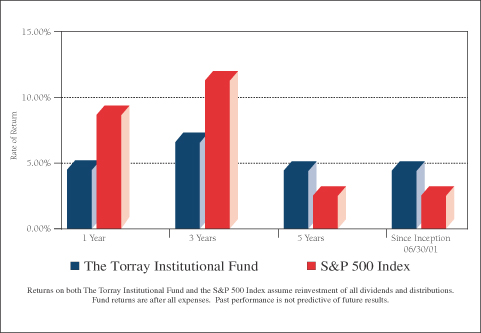
Total Rates of Return on an Investment in The Torray Institutional Fund vs. the S&P 500 Index
For the periods ended June 30, 2006:
| | | | | | | | |
| | | 1 Year
| | 3 Years
| | 5 Years
| | Since
Inception
06/30/01
|
The Torray Institutional Fund | | 4.45% | | 6.54% | | 4.38% | | 4.38% |
S&P 500 Index | | 8.63% | | 11.22% | | 2.49% | | 2.49% |
Cumulative Returns for the 5 years ended June 30, 2006
| | | |
The Torray Institutional Fund | | 23.88 | % |
S&P 500 Index | | 13.11 | % |
5
The Torray Institutional Fund
PERFORMANCE DATA
As of June 30, 2006 (unaudited)
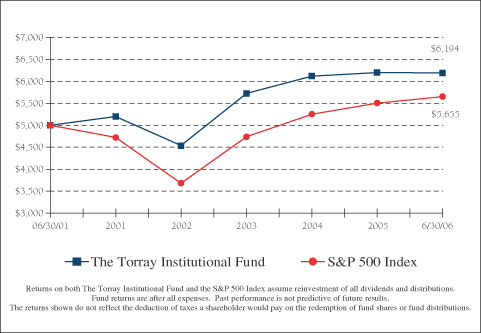
Change in Value of $5,000,000 Invested on June 30, 2001 (commencement of operations) to:
| | | | | | | | | | | | | | | | | | |
| | | 12/31/01
| | 12/31/02
| | 12/31/03
| | 12/31/04
| | 12/31/05
| | 06/30/06
|
The Torray Institutional Fund | | $ | 5,199,000 | | $ | 4,537,500 | | $ | 5,724,500 | | $ | 6,123,000 | | $ | 6,201,000 | | $ | 6,194,000 |
S&P 500 Index | | $ | 4,723,000 | | $ | 3,682,500 | | $ | 4,739,000 | | $ | 5,255,500 | | $ | 5,507,000 | | $ | 5,655,500 |
6
The Torray Institutional Fund
FUND PROFILE
As of June 30, 2006 (unaudited)
| | |
DIVERSIFICATION (% of net assets) |
| |
Media & Entertainment | | 11.07% |
Pharmaceuticals | | 10.84% |
Insurance | | 9.92% |
Capital Markets & Asset Managers | | 9.18% |
Semiconductor & Semi Equipment | | 6.97% |
Machinery | | 6.85% |
Aerospace & Defense | | 5.33% |
Information Technology Services | | 5.00% |
Biotechnology | | 4.86% |
Health Care Equipment & Supplies | | 4.53% |
Health Care Providers & Services | | 3.58% |
Telecommunication Services | | 3.10% |
Real Estate | | 3.00% |
Specialty Retail | | 2.93% |
Diversified Financial Services | | 2.65% |
Specialty Chemicals | | 1.84% |
Beverages | | 1.14% |
Consumer Finance | | 1.11% |
Electrical Equipment | | 0.73% |
Industrial Conglomerates | | 0.37% |
Convertible Bond | | 4.80% |
Short-Term Investments | | 0.69% |
Other Liabilities Less Assets | | -0.49% |
| | |
|
| | | 100.00% |
| | |
| TOP TEN EQUITY HOLDINGS |
| 1. | | Univision Communications, Inc. |
| 2. | | Eli Lilly and Company |
| 3. | | Amgen Inc. |
| 4. | | Medtronic, Inc. |
| 5. | | Ambac Financial Group, Inc. |
| 6. | | Illinois Tool Works Inc. |
| 7. | | Labranche & Co. Inc. |
| 8. | | Applied Materials, Inc. |
| 9. | | United Technologies Corporation |
| 10. | | Cardinal Health, Inc. |
| | | | | |
TOP FIXED INCOME HOLDINGS | | | |
| | |
Level 3 Communications | | 10.00% | | due 2011 | |
|
PORTFOLIO CHARACTERISTICS | |
| | |
Net Assets (million) | | | | $229 | |
Number of Stocks | | | | 39 | |
Portfolio Turnover | | | | 11.99% | * |
P/E Multiple (forward) | | | | 14.9x | |
Portfolio Yield | | | | 1.40% | ** |
Market Capitalization | | Average | | 49.1 B | |
| | | Median | | 26.9 B | |
| * | | For the six-month period ended June 30, 2006 |
7
The Torray Institutional Fund
SCHEDULE OF INVESTMENTS
As of June 30, 2006 (unaudited)
| | | | | | | |
| | | Shares
| | | | Market Value
|
| COMMON STOCK 95.00% |
|
| 11.07% MEDIA & ENTERTAINMENT |
| | | 400,100 | | Univision Communications, Inc. * | | $ | 13,403,350 |
| | | 160,600 | | Tribune Company | | | 5,208,258 |
| | | 77,500 | | The Walt Disney Company | | | 2,325,000 |
| | | 36,500 | | Gannett Co., Inc. | | | 2,041,445 |
| | | 36,491 | | The McClatchy Company — Class A | | | 1,464,033 |
| | | 29,722 | | Clear Channel Communications, Inc. | | | 919,896 |
| | | | | | |
|
|
| | | | | | | | 25,361,982 |
|
| 10.84% PHARMACEUTICALS |
| | | 230,200 | | Eli Lilly and Company | | | 12,723,154 |
| | | 165,000 | | Abbott Laboratories | | | 7,195,650 |
| | | 82,000 | | Johnson & Johnson | | | 4,913,440 |
| | | | | | |
|
|
| | | | | | | | 24,832,244 |
|
| 9.92% INSURANCE |
| | | 120,550 | | Ambac Financial Group, Inc. | | | 9,776,605 |
| | | 77,066 | | Fairfax Financial Holdings Limited | | | 7,323,582 |
| | | 192,000 | | Marsh & McLennan Companies, Inc. | | | 5,162,880 |
| | | 7,600 | | American International Group, Inc. | | | 448,780 |
| | | | | | |
|
|
| | | | | | | | 22,711,847 |
|
| 9.18% CAPITAL MARKETS & ASSET MANAGERS |
| | | 753,000 | | LaBranche & Co. Inc. * | | | 9,118,830 |
| | | 31,400 | | The Goldman Sachs Group, Inc. | | | 4,723,502 |
| | | 88,500 | | Calamos Asset Management, Inc. | | | 2,565,615 |
| | | 27,500 | | Franklin Resources, Inc. | | | 2,387,275 |
| | | 77,329 | | Allied Capital Corporation | | | 2,224,755 |
| | | | | | |
|
|
| | | | | | | | 21,019,977 |
|
| 6.97% SEMICONDUCTOR & SEMI EQUIPMENT |
| | | 558,900 | | Applied Materials, Inc. | | | 9,098,892 |
| | | 362,000 | | Intel Corporation | | | 6,859,900 |
| | | | | | |
|
|
| | | | | | | | 15,958,792 |
8
The Torray Institutional Fund
SCHEDULE OF INVESTMENTS (continued)
As of June 30, 2006 (unaudited)
| | | | | | | |
| | | Shares
| | | | Market Value
|
|
| 6.85% MACHINERY |
| | | 197,100 | | Illinois Tool Works Inc. | | $ | 9,362,250 |
| | | 98,100 | | Danaher Corporation | | | 6,309,792 |
| | | | | | |
|
|
| | | | | | | | 15,672,042 |
|
| 5.33% AEROSPACE & DEFENSE |
| | | 136,400 | | United Technologies Corporation | | | 8,650,488 |
| | | 37,800 | | General Dynamics Corporation | | | 2,474,388 |
| | | 26,800 | | Honeywell International Inc. | | | 1,080,040 |
| | | | | | |
|
|
| | | | | | | | 12,204,916 |
|
| 5.00% INFORMATION TECHNOLOGY SERVICES |
| | | 152,600 | | First Data Corporation | | | 6,873,104 |
| | | 100,700 | | Automatic Data Processing, Inc. | | | 4,566,745 |
| | | | | | |
|
|
| | | | | | | | 11,439,849 |
|
| 4.86% BIOTECHNOLOGY |
| | | 170,500 | | Amgen Inc. * | | | 11,121,715 |
|
| 4.53% HEALTH CARE EQUIPMENT & SUPPLIES |
| | | 221,300 | | Medtronic, Inc. | | | 10,383,396 |
|
| 3.58% HEALTH CARE PROVIDERS & SERVICES |
| | | 127,400 | | Cardinal Health, Inc. | | | 8,195,642 |
|
| 3.10% TELECOMMUNICATION SERVICES |
| | | 354,800 | | Sprint Nextel Corporation | | | 7,092,452 |
|
| 3.00% REAL ESTATE |
| | | 154,000 | | CarrAmerica Realty Corporation | | | 6,860,700 |
|
| 2.93% SPECIALTY RETAIL |
| | | 214,800 | | O’Reilly Automotive, Inc. * | | | 6,699,612 |
|
| 2.65% DIVERSIFIED FINANCIAL SERVICES |
| | | 144,212 | | JPMorgan Chase & Co. | | | 6,056,904 |
|
| 1.84% SPECIALTY CHEMICALS |
| | | 360,100 | | W.R. Grace & Co. * | | | 4,213,170 |
9
The Torray Institutional Fund
SCHEDULE OF INVESTMENTS (continued)
As of June 30, 2006 (unaudited)
| | | | | | | | |
| | | Shares
| | | | Market Value
| |
|
| 1.14% BEVERAGES | |
| | | 57,100 | | Anheuser-Busch Cos., Inc. | | $ | 2,603,189 | |
|
| 1.11% CONSUMER FINANCE | |
| | | 47,600 | | American Express Company | | | 2,533,272 | |
|
| 0.73% ELECTRICAL EQUIPMENT | |
| | | 20,000 | | Emerson Electric Co. | | | 1,676,200 | |
|
| 0.37% INDUSTRIAL CONGLOMERATES | |
| | | 25,700 | | General Electric Company | | | 847,072 | |
| | | | | | |
|
|
|
| TOTAL COMMON STOCK 95.00% | | | 217,484,973 | |
| (cost $198,392,655) | | | | |
| | | |
| | | Principal Amount ($)
| | | | | |
| CONVERTIBLE BOND 4.80% | | | | |
| (cost $7,120,000) | | | | |
| | | 7,120,000 | | Level 3 Communications 10.00% due 2011 | | | 10,988,908 | |
| SHORT-TERM INVESTMENTS 0.69% | | | | |
| (cost $1,571,019) | | PNC Bank Money Market Account, 4.55% | | | 1,571,019 | |
| | | | | | |
|
|
|
| TOTAL PORTFOLIO SECURITIES 100.49% | | | 230,044,900 | |
| (cost $207,083,674) | | | | |
| |
| OTHER LIABILITIES LESS ASSETS (0.49)% | | | (1,119,976 | ) |
| | | | | | |
|
|
|
| NET ASSETS 100.00% | | $ | 228,924,924 | |
| | | | | | |
|
|
|
| * | | Non-income producing securities |
See notes to the financial statements.
10
The Torray Institutional Fund
STATEMENT OF ASSETS AND LIABILITIES
As of June 30, 2006 (unaudited)
| | | |
ASSETS | | | |
Investments in securities at value
(amortized cost $207,083,674) | | $ | 230,044,900 |
Receivable for investments sold | | | 4,949,460 |
Subscriptions receivable | | | 39,835 |
Interest and dividends receivable | | | 228,055 |
| | |
|
|
TOTAL ASSETS | | | 235,262,250 |
| | |
|
|
| |
LIABILITIES | | | |
Redemptions payable | | | 6,245,316 |
Payable to advisor | | | 92,010 |
| | |
|
|
TOTAL LIABILITIES | | | 6,337,326 |
| | |
|
|
| |
NET ASSETS | | $ | 228,924,924 |
| | |
|
|
Shares of beneficial interest ($1 stated value,
2,056,228 shares outstanding, unlimited
shares authorized) | | $ | 2,056,228 |
Paid-in-capital in excess of par | | | 182,154,006 |
Accumulated net investment income | | | 53,641 |
Accumulated net realized gain on investments | | | 21,699,823 |
Net unrealized appreciation of investments | | | 22,961,226 |
| | |
|
|
| |
NET ASSETS | | $ | 228,924,924 |
| | |
|
|
Per Share | | $ | 111.33 |
| | |
|
|
See notes to the financial statements.
11
The Torray Institutional Fund
STATEMENT OF OPERATIONS
For the six months ended June 30, 2006 (unaudited)
| | | | |
INVESTMENT INCOME | | | | |
Dividend income
(net of foreign taxes withheld of $25,760) | | $ | 1,869,002 | |
Interest income | | | 605,877 | |
| | |
|
|
|
Total income | | | 2,474,879 | |
| | |
|
|
|
| |
EXPENSES | | | | |
Management fees | | | 1,313,578 | |
| | |
|
|
|
Total expenses | | | 1,313,578 | |
| | |
|
|
|
NET INVESTMENT INCOME | | | 1,161,301 | |
| | |
|
|
|
REALIZED AND UNREALIZED GAIN (LOSS)
ON INVESTMENTS | | | | |
Net realized gain on investments | | | 24,374,231 | |
Net change in unrealized appreciation (depreciation) on investments | | | (19,901,900 | ) |
| | |
|
|
|
Net realized and unrealized gain on investments | | | 4,472,331 | |
| | |
|
|
|
NET INCREASE IN NET ASSETS FROM OPERATIONS | | $ | 5,633,632 | |
| | |
|
|
|
See notes to the financial statements.
12
The Torray Institutional Fund
STATEMENTS OF CHANGES IN NET ASSETS
For the periods indicated:
| | | | | | | | |
| | | Six months ended
06/30/06
(unaudited)
| | | Year ended
12/31/05
| |
Increase (Decrease) in Net Assets from Operations: | | | | | | | | |
Net investment income | | $ | 1,161,301 | | | $ | 6,121,706 | |
Net realized gain on investments | | | 24,374,231 | | | | 60,125,725 | |
Capital gain distributions from investment companies | | | — | | | | 1,161,363 | |
Net change in unrealized appreciation
(depreciation) on investments | | | (19,901,900 | ) | | | (69,494,489 | ) |
| | |
|
|
| |
|
|
|
Net increase (decrease) in net assets from operations | | | 5,633,632 | | | | (2,085,695 | ) |
| | |
|
|
| |
|
|
|
| | |
Distributions to Shareholders from: | | | | | | | | |
Net investment income ($0.474 and
$0.616 per share, respectively) | | | (1,107,660 | ) | | | (6,121,706 | ) |
Net realized gains ($0.00 and $5.118 per
share, respectively) | | | — | | | | (23,783,989 | ) |
| | |
|
|
| |
|
|
|
Total distributions | | | (1,107,660 | ) | | | (29,905,695 | ) |
| | |
|
|
| |
|
|
|
| | |
Shares of Beneficial Interest | | | | | | | | |
Decrease from share transactions | | | (176,266,026 | ) | | | (579,909,741 | ) |
| | |
|
|
| |
|
|
|
Total decrease | | | (171,740,054 | ) | | | (611,901,131 | ) |
| | |
Net Assets — Beginning of Period | | | 400,664,978 | | | | 1,012,566,109 | |
| | |
|
|
| |
|
|
|
Net Assets — End of Period | | $ | 228,924,924 | | | $ | 400,664,978 | |
| | |
|
|
| |
|
|
|
Accumulated Net Investment Income | | $ | 53,641 | | | $ | — | |
| | |
|
|
| |
|
|
|
See notes to the financial statements.
13
The Torray Institutional Fund
FINANCIAL HIGHLIGHTS
For a share outstanding:
PER SHARE DATA
| | | | | | | | | | | | | | | | | | | | | | | | |
| | | Six months
ended
06/30/06
(unaudited)
| | | Years ended December 31:
| | | Period
ended
12/31/01(1)
| |
| | | |
| | | 2005
| | | 2004
| | | 2003
| | | 2002
| | |
Net Asset Value,
Beginning of Period | | $ | 111.920 | | | $ | 116.290 | | | $ | 110.520 | | | $ | 89.490 | | | $ | 103.300 | | | $ | 100.000 | |
| | |
|
|
| |
|
|
| |
|
|
| |
|
|
| |
|
|
| |
|
|
|
Income from investment operations: | | | | | | | | | | | | | | | | | | | | | | | | |
Net investment income | | | 0.504 | | | | 0.616 | | | | 0.588 | | | | 0.671 | | | | 0.679 | | | | 0.359 | |
Net gains (losses) on securities (both realized and unrealized) | | | (0.620 | ) | | | 0.748 | (3) | | | 7.025 | | | | 22.586 | | | | (13.810 | ) | | | 3.555 | |
| | |
|
|
| |
|
|
| |
|
|
| |
|
|
| |
|
|
| |
|
|
|
Total from investment operations | | | (0.116 | ) | | | 1.364 | | | | 7.613 | | | | 23.257 | | | | (13.131 | ) | | | 3.914 | |
| | |
|
|
| |
|
|
| |
|
|
| |
|
|
| |
|
|
| |
|
|
|
Less: distributions | | | | | | | | | | | | | | | | | | | | | | | | |
Dividends (from net investment income) | | | (0.474 | ) | | | (0.616 | ) | | | (0.588 | ) | | | (0.671 | ) | | | (0.679 | ) | | | (0.359 | ) |
Distributions (from capital gains) | | | 0.000 | | | | (5.118 | ) | | | (1.255 | ) | | | (1.556 | ) | | | 0.000 | | | | (0.255 | ) |
| | |
|
|
| |
|
|
| |
|
|
| |
|
|
| |
|
|
| |
|
|
|
Total distributions | | | (0.474 | ) | | | (5.734 | ) | | | (1.843 | ) | | | (2.227 | ) | | | (0.679 | ) | | | (0.614 | ) |
| | |
|
|
| |
|
|
| |
|
|
| |
|
|
| |
|
|
| |
|
|
|
Net Asset Value,
End of Period | | $ | 111.330 | | | $ | 111.920 | | | $ | 116.290 | | | $ | 110.520 | | | $ | 89.490 | | | $ | 103.300 | |
| | |
|
|
| |
|
|
| |
|
|
| |
|
|
| |
|
|
| |
|
|
|
TOTAL RETURN(2) | | | (0.12 | %)** | | | 1.28 | % | | | 6.96 | % | | | 26.16 | % | | | (12.73 | %) | | | 3.99 | %** |
RATIOS/SUPPLEMENTAL DATA | | | | | | | | | | | | | | | | | | | | | | | | |
Net assets, end of period
(000’s omitted) | | $ | 228,924 | | | $ | 400,665 | | | $ | 1,012,566 | | | $ | 598,183 | | | $ | 137,715 | | | $ | 50,684 | |
Ratios of expenses to average net assets | | | 0.85 | %* | | | 0.85 | % | | | 0.85 | % | | | 0.85 | % | | | 0.85 | % | | | 0.85 | %* |
Ratios of net income to average net assets | | | 0.75 | %* | | | 0.59 | % | | | 0.56 | % | | | 0.80 | % | | | 0.85 | % | | | 0.76 | %* |
Portfolio turnover rate | | | 11.99 | %** | | | 53.66 | % | | | 16.12 | % | | | 22.20 | % | | | 6.87 | % | | | 8.84 | %** |
| (1) | | The Torray Institutional Fund commenced operations on June 30, 2001. |
| (2) | | Past performance is not predictive of future performance. |
| (3) | | The amount shown for the year ended December 31, 2005 for a share outstanding throughout the year does not accord with the aggregate net losses on investments reported in the statement of operations for the year because of the timing of sales and repurchases of Fund shares in relation to fluctuating value of the investments of the Fund. |
See notes to the financial statements.
14
The Torray Institutional Fund
NOTES TO FINANCIAL STATEMENTS
As of June 30, 2006 (unaudited)
NOTE 1 — SUMMARY OF SIGNIFICANT ACCOUNTING POLICIES
The Torray Institutional Fund (“Fund”) is a separate series of The Torray Fund (“Trust”). The Trust is registered under the Investment Company Act of 1940 as a no-load, diversified, open-end management investment company. The Trust was organized as a business trust under Massachusetts law and commenced operations on June 30, 2001. The Fund’s primary investment objective is to provide long-term total return. The Fund seeks to meet its objective by investing its assets in a diversified portfolio of common stocks. In order to accomplish these goals, the Fund intends to hold stocks for the long term, as opposed to actively buying and selling. There can be no assurances that the Fund’s investment objectives will be achieved.
The following is a summary of accounting policies followed by the Fund in the preparation of its financial statements. These policies are in conformity with accounting principles generally accepted in the United States of America.
Securities Valuation Portfolio securities for which market quotations are readily available are valued at market value, which is determined by using the last reported sale price, or, if no sales are reported, the last reported bid price. For NASDAQ traded securities, market value is determined on the basis of the NASDAQ official closing price (the “NOCP”) instead of the last reported sales price. Other assets and securities for which no quotations are readily available or for which Torray LLC (the “Advisor”) believes do not reflect market value are valued at fair value as determined in good faith by the Advisor under the supervision of the Board of Trustees in accordance with the Fund’s Valuation Procedures. Short-term obligations having remaining maturities of 60 days or less are valued at amortized cost, which approximates market value.
Securities Transactions and Investment Income Securities transactions are recorded on a trade date basis. Realized gains and losses from securities transactions are recorded on the specific identification basis. Dividend income and distributions to shareholders are recorded on the ex-dividend date. Interest income, including amortization of discount on short-term investments, and expenses are recorded on the accrual basis.
Federal Income Taxes The Fund intends to continue to comply with the requirements of the Internal Revenue Code applicable to regulated investment companies and to distribute all of its taxable income, including any net realized gain on investments to its shareholders. Therefore, no Federal income tax provision is required.
Net Asset Value The net asset value per share of the Fund is determined daily as of the close of trading on the New York Stock Exchange by dividing the value of the Fund’s net assets by the number of shares outstanding.
Use of Estimates In preparing financial statements in accordance with accounting principles generally accepted in the United States of America, management is required to make estimates and assumptions that affect the reported amounts of assets and liabilities and the disclosure of contingent assets and liabilities at the date of the financial statements, and the reported amounts of increases and decreases in net assets from operations during the reporting period. Actual results could differ from those estimates.
15
The Torray Institutional Fund
NOTES TO FINANCIAL STATEMENTS (continued)
As of June 30, 2006 (unaudited)
NOTE 2 — SHARES OF BENEFICIAL INTEREST TRANSACTIONS
Transactions in shares of beneficial interest were as follows:
| | | | | | | | | | | | | | |
| | | Six months ended
06/30/06
| | | Year ended
12/31/05
| |
| | | Shares
| | | Amount
| | | Shares
| | | Amount
| |
Shares issued | | 190,346 | | | $ | 22,034,086 | | | 3,860,633 | | | $ | 437,614,770 | |
Reinvestments of dividends and distributions | | 8,808 | | | | 1,004,587 | | | 249,632 | | | | 27,652,650 | |
Shares redeemed | | (1,722,999 | ) | | | (199,304,699 | ) | | (9,237,504 | ) | | | (1,045,177,161 | ) |
| | |
|
| |
|
|
| |
|
| |
|
|
|
| | | (1,523,845 | ) | | $ | (176,266,026 | ) | | (5,127,239 | ) | | $ | (579,909,741 | ) |
| | |
|
| |
|
|
| |
|
| |
|
|
|
Officers, Trustees and affiliated persons of The Torray Institutional Fund and their families directly or indirectly control 139,689 shares or 6.79% of the Fund.
NOTE 3 — INVESTMENT TRANSACTIONS
Purchases and sales of investment securities, other than short-term investments, for the six months ended June 30, 2006, aggregated $36,834,187 and $210,809,853, respectively.
NOTE 4 — MANAGEMENT FEES
Pursuant to the Management Contract, Torray LLC provides investment advisory and administrative services to the Fund. The Fund pays Torray LLC a management fee, computed daily and payable monthly at the annual rate of 0.85% of the Fund’s average daily net assets. For the six months ended June 30, 2006. The Torray Institutional Fund paid comprehensive management fees of $1,313,578. The Fund pays the manager a single comprehensive management fee which covers all operating expenses of the Fund including the investment advisory and administrative services provided by the manager as well as all miscellaneous costs incurred in connection with the ongoing operation of the Fund including transfer agency, custody, professional, and registration fees.
Certain officers and Trustees of the Fund are also officers and/or shareholders of Torray LLC.
NOTE 5 — TAX MATTERS
Distributions to shareholders are determined in accordance with federal income tax regulations which may differ from accounting principles generally accepted in the United States of America.
16
The Torray Institutional Fund
NOTES TO FINANCIAL STATEMENTS (continued)
As of June 30, 2006 (unaudited)
The tax character of distributions paid during the six months ended June 30, 2006 and the year ended December 31, 2005 were as follows:
| | | | | | |
| | | Six months
ended
06/30/06
| | 2005
|
Distributions paid from: | | | | | | |
Ordinary income | | $ | 1,107,660 | | $ | 6,121,706 |
Long-term capital gain | | | — | | | 66,420,473 |
| | |
|
| |
|
|
| | | $ | 1,107,660 | | $ | 72,542,179 |
| | |
|
| |
|
|
|
As of December 31, 2005, the components of distributable earnings on a tax basis were as follows: |
Unrealized appreciation | | $ | 40,188,718 | | | |
| | |
|
| | | |
| | | $ | 40,188,718 | | | |
| | |
|
| | | |
The following information is based upon the federal income tax basis of investment securities as of June 30, 2006:
| | | | | | |
Gross unrealized appreciation | | $ | 37,069,351 | | | |
Gross unrealized depreciation | | | (14,108,125 | ) | | |
| | |
|
|
| | |
Net unrealized appreciation | | $ | 22,961,226 | | | |
| | |
|
|
| | |
Federal income tax basis | | $ | 207,083,674 | | | |
| | |
|
|
| | |
The primary difference between book basis and tax basis distributions is different book and tax treatment of short-term capital gains.
NOTE 6 — COMMITMENTS AND CONTINGENCIES
The Fund indemnifies its officers and Trustees for certain liabilities that may arise from their performance of their duties to the Fund. Additionally, in the normal course of business, the Fund enters into contracts that contain a variety of representations and warranties which provide general indemnifications. The Fund’s maximum exposure under these arrangements is unknown, as this would involve future claims that may be made against the Fund that have not yet occurred.
17
The Torray Institutional Fund
PORTFOLIO HOLDINGS, PROXY VOTING AND PROCEDURES
As of June 30, 2006 (unaudited)
The Fund files its complete schedule of portfolio holdings with the Securities and Exchange Commission (the “Commission”) for the first and third quarters of each fiscal year on Form N-Q. The Fund’s Forms N-Q are available on the Commission’s website at http://www.sec.gov. The Fund’s Form N-Q may be reviewed and copied at the Commission’s Public Reference Room in Washington, D.C. Information on the operation of the Commission’s Public Reference Room may be obtained by calling 1-800-SEC-0330.
A description of the policies and procedures that the Fund uses to determine how to vote proxies relating to portfolio securities is available without charge, upon request, by calling 1-800-443-3036, and on the Commission’s website at http://www.sec.gov.
Information regarding how the Fund voted proxies relating to portfolio securities is available without charge, upon request, by calling 1-800-443-3036; and on the Commission’s website at http://www.sec.gov.
18
The Torray Institutional Fund
ABOUT YOUR FUND’S EXPENSES
As of June 30, 2006 (unaudited)
We believe it is important for you to understand the impact of costs on your investment. All mutual funds have operating expenses. As a shareholder of the Fund, you incur ongoing costs, including management fees, and other fund expenses. Operating expenses, which are deducted directly from the Fund’s gross income, directly reduce the investment return of the Fund.
A fund’s expenses are expressed as a percentage of its average net assets. This figure is known as the expense ratio. The following examples are intended to help you understand the ongoing costs (in dollars) of investing in the Fund and to compare these costs with the ongoing costs of investing in other mutual funds. The examples below are based on an investment of $1,000 made at the beginning of the period shown and held for the entire period.
The table on the next page illustrates the Fund’s cost in two ways:
Actual Fund Return This section helps you estimate the actual expenses that you paid over the period. The “Ending Account Value” shown is derived from the Fund’s actual return, and the third column shows the operating expenses that would have been paid by an investor who started with $1,000 in the Fund. You may use the information here, together with the amount invested, to estimate the expenses that you paid over the period.
To do so, simply divide your account value by $1,000 (for example, an $8,600 account value divided by $1,000 = 8.6), then multiply the result by the number given for the Fund under the heading “Expenses Paid During Period” on the next page.
Hypothetical 5% Return This section is intended to help you compare your Fund’s costs with those of other mutual funds. It assumes that the Fund had an annual return of 5% before expenses, and that the expense ratio is unchanged. In this case, because the return used is not the Fund’s actual return, the results do not apply to your investment. The example is useful in making comparisons because the Securities and Exchange Commission requires all mutual funds to calculate expenses based on a 5% return. You can assess the Fund’s costs by comparing this hypothetical example with the hypothetical examples that appear in shareholder reports of other funds.
Note that expenses shown in the table are meant to highlight and help you compare ongoing costs only. The Fund does not charge transactions fees, such as purchase or redemption fees, nor does it carry a “sales load.”
The calculation assumes no shares were bought or sold during the period. Your actual costs may have been higher or lower, depending on the amount of your investment and the timing of any purchases or redemptions.
19
The Torray Institutional Fund
ABOUT YOUR FUND’S EXPENSES
As of June 30, 2006 (unaudited)
More information about the Fund’s expenses, including recent annual expense ratios, can be found in this report. For additional information on operating expenses and other shareholder costs, please refer to the Fund’s prospectus.
| | | | | | | | | |
| | | Beginning
Account Value
December 31, 2005
| | Ending
Account Value
June 30, 2006
| | Expenses Paid
During Period *
|
Based on Actual Fund Return | | $ | 1,000.00 | | $ | 998.80 | | $ | 4.21 |
Based on Hypothetical 5% Return
(before expenses) | | $ | 1,000.00 | | $ | 1,020.58 | | $ | 4.26 |
* Expenses are equal to The Torray Institutional Fund’s annualized expense ratio of 0.85% multiplied by the average account value over the period, multiplied by 181/365 (to reflect the one-half year period).
20
TRUSTEES
Carol Crawford
Douglas C. Eby
Bruce C. Ellis
Patricia Kavanagh
William M Lane
Robert P. Moltz
Roy A. Schotland
Wayne H. Shaner
Robert E. Torray
INVESTMENT ADVISOR
Torray LLC
OFFICERS
Robert E. Torray, Chairman
Douglas C. Eby, President
William M Lane, Executive Vice President
Fred M. Fialco, Vice President
Siva Natarajan, CFA, Vice President
A. Scott Lamond IV, Vice President
INDEPENDENT REGISTERED PUBLIC ACCOUNTING FIRM
Briggs, Bunting & Dougherty, LLP
Two Penn Center Plaza, Suite 820
Philadelphia, PA 19102-1732
TRANSFER AGENT
PFPC Inc.
101 Sabin Street
Pawtucket, RI 02860-1427
LEGAL COUNSEL
Dechert
1775 I Street, N.W.
Washington, D.C. 20006
This report is not authorized for distribution to prospective investors unless preceded or accompanied by a current prospectus.
The
TORRAY
INSTITUTIONAL
FUND
SEMI-ANNUAL REPORT
June 30, 2006
The Torray Institutional Fund
Suite 1100
7501 Wisconsin Avenue
Bethesda, Maryland 20814-6523
(301) 493-4600
(800) 443-3036
Item 2. Code of Ethics.
Not applicable.
Item 3. Audit Committee Financial Expert.
Not applicable.
Item 4. Principal Accountant Fees and Services.
Not applicable.
Item 5. Audit Committee of Listed registrants.
Not applicable.
Item 6. Schedule of Investments.
Schedule of Investments in securities of unaffiliated issuers as of the close of the reporting period is included as part of the report to shareholders filed under Item 1 of this form.
Item 7. Disclosure of Proxy Voting Policies and Procedures for Closed-End Management Investment Companies.
Not applicable.
Item 8. Portfolio Managers of Closed-End Management Investment Companies.
Not applicable.
Item 9. Purchases of Equity Securities by Closed-End Management Investment Company and Affiliated Purchasers.
Not applicable.
Item 10. Submission of Matters to a Vote of Security Holders.
There have been no material changes to the procedures by which the shareholders may recommend nominees to the registrant’s board of directors, where those changes were implemented after the registrant last provided disclosure in response to the requirements of Item 7(d)(2)(ii)(G) of Schedule 14A (17 CFR 240.14a-101), or this Item.
Item 11. Controls and Procedures.
| | (a) | The registrant’s principal executive and principal financial officers, or persons performing similar functions, have concluded that the registrant’s disclosure controls and procedures (as defined in Rule 30a-3(c) under the Investment Company Act of 1940, as amended (the “1940 Act”) (17 CFR 270.30a-3(c))) are effective, as of a date within 90 days of the filing date of the report that includes the disclosure required by this paragraph, based on their evaluation of these controls and procedures required by Rule 30a-3(b) under the 1940 Act (17 CFR 270.30a-3(b)) and Rules 13a-15(b) or 15d-15(b) under the Securities Exchange Act of 1934, as amended (17 CFR 240.13a-15(b) or 240.15d-15(b)). |
| | (b) | There were no changes in the registrant’s internal control over financial reporting (as defined in Rule 30a-3(d) under the 1940 Act (17 CFR 270.30a-3(d)) that occurred during the registrant’s second fiscal quarter of the period covered by this report that has materially affected, or is reasonably likely to materially affect, the registrant’s internal control over financial reporting. |
Item 12. Exhibits.
| | (a)(2) | Certifications pursuant to Rule 30a-2(a) under the 1940 Act and Section 302 of the Sarbanes-Oxley Act of 2002 are attached hereto. |
| | (b) | Certifications pursuant to Rule 30a-2(b) under the 1940 Act and Section 906 of the Sarbanes-Oxley Act of 2002 are attached hereto. |
SIGNATURES
Pursuant to the requirements of the Securities Exchange Act of 1934 and the Investment Company Act of 1940, the registrant has duly caused this report to be signed on its behalf by the undersigned, thereunto duly authorized.
| | |
| (registrant) | | The Torray Fund |
| |
| By (Signature and Title)* | | /s/ William M Lane |
| | William M Lane, President & Secretary |
| | (principal executive officer) |
Date August 25, 2006
Pursuant to the requirements of the Securities Exchange Act of 1934 and the Investment Company Act of 1940, this report has been signed below by the following persons on behalf of the registrant and in the capacities and on the dates indicated.
| | |
| By (Signature and Title)* | | /s/ William M Lane |
| | William M Lane, President & Secretary |
| | (principal executive officer) |
Date August 25, 2006
| | |
| By (Signature and Title)* | | /s/ Douglas C. Eby |
| | Douglas C. Eby, Vice President & Treasurer |
| | (principal financial officer) |
| * | Print the name and title of each signing officer under his or her signature. |