UNITED STATES
SECURITIES AND EXCHANGE COMMISSION
Washington, D.C. 20549
FORM N-CSR
CERTIFIED SHAREHOLDER REPORT OF REGISTERED MANAGEMENT
INVESTMENT COMPANIES
Investment Company Act file number 811-06096
The Torray Fund
(Exact name of registrant as specified in charter)
7501 Wisconsin Avenue, Suite 1100
Bethesda, MD 20814-6523
(Address of principal executive offices) (Zip code)
William M Lane
Torray LLC
7501 Wisconsin Avenue, Suite 1100
Bethesda, MD 20814-6523
(Name and address of agent for service)
Registrant’s telephone number, including area code: 301-493-4600
Date of fiscal year end: December 31
Date of reporting period: June 30, 2009
Item 1. Reports to Stockholders.
The Report to Shareholders is attached herewith.
The Torray Fund
Letter to Shareholders
July 31, 2009
Dear Fellow Shareholders,
The Torray Fund gained 0.92% during the first half of 2009, compared to a 3.16% advance for the Standard & Poor’s 500. In a continuation of last year’s miserable showing, the market collapsed an additional 25% before bottoming March 9th. At that point, stocks had lost a staggering 57% from the top reached October 9, 2007. At mid-year, even after a 36% rally, they were still 41% below the old high.
When stocks recover from a crash, speculative issues often perform best, and last quarter’s rally proved no exception. In fact, it may have been a record-setter in that regard. Shares priced under $5 out-ran stocks trading above $50 by 91%. Those of companies losing money or breaking even beat profitable ones by 24%, and, belying the notion investors crave income, stocks paying dividends trailed those that didn’t. These are truly extraordinary statistics.
As we write, these trends have reversed, with higher-quality stocks taking the lead. There are signs the economy and financial system are stabilizing, and reported earnings, so far, have been running ahead of expectations. All of this is encouraging. While one can never know the future, we think there’s more room for optimism now than at any time since the financial crisis began. In saying this, we’re talking longer term, not just a few months or quarters.
In response to the tremendous beating they’ve taken, desperate investors are looking for cures in what we see as all the wrong places. Stocks of the best companies have been sold and the proceeds put into money market funds, CDs, savings accounts and bonds. Huge sums have also moved to overseas markets, especially those in lesser-developed countries. Sooner or later, we believe this money is bound to end up back where it started, but probably not until stock prices are much higher. We’ve seen it happen too many times to think otherwise.
Despite our economy’s ups and downs, and the market’s unpredictable erratic gyrations, patient long-term holders of stocks have fared very well. In fact, stocks are the only widely available option that has directly tracked America’s prosperity. Fixed income options have run far behind. Yet, as noted, people have been buying them anyway, largely in response to punishing losses they fear may only get worse. Ironically, at the top in October 2007, they were doing just the opposite. The national savings rate was negative, and investors chased stocks, many at twice today’s levels, often on margin. They also bid up houses and commodities. This is the only business we can think of where the customer goes into a frenzy over a rising price. Think about
1
The Torray Fund
Letter to Shareholders (continued)
July 31, 2009
it. Who would reject a new car at $10,000 only to buy two at $30,000? But, that’s what people tend to do when it comes to investing.
Unfortunately, in the present circumstance, we think investors sitting on 2% CDs and five and ten-year government bonds yielding 2 1/2% - 3 1/2% are once again heading for disappointment. Taxes aside, long experience suggests these choices, net of inflation, will return little or nothing. Beyond that, it’s even more foolish to be selling quality stocks after they’ve dropped 30% - 50% to buy speculative ones just because they’re going up.
We believe stocks like those in our Fund are bargains today. The price/earnings ratio on the S&P 500 is roughly 30% below its 20-year trailing average; its current dividend yield is 2.6%, compared to 1.8% over the same period. Furthermore, yields on a lot of stocks are even higher, exceeding returns on intermediate bonds, not to mention money funds and CDs. More importantly, as earnings and dividends grow, share prices will follow suit. This is an unbeatable combination. Over the 70 years ending June 30, the nominal return on stocks was 10.6%, and on bonds, 5.5%. After inflation, averaging 4% a year, the real returns were 6.6% and 1.5%, respectively. In a testimony to the miracle of compounding, $1 in stocks, net of inflation, grew to $87.70, in bonds, to only $2.84. Given today’s low interest rates and the government’s unprecedented deficit spending funded by record bond issuance, fixed income buyers may do even worse than usual going forward.
Finally, we want to re-emphasize our commitment to the investment philosophy that has guided our Company for nearly 37 years. Regretfully, the benefits that flow from these timeless precepts have been lost in waves of bubbles and crashes that have plagued serious investors for over 10 years. Commodities, futures contracts, leveraged exchange-traded funds, high-frequency trading programs and more have diverted attention from the values building in quality companies with above-average economic prospects. While the performance of these alternatives is hard to assess, highly publicized reports of occasional spectacular gains on them tend to leave the impression that all of the players are being enriched while everyone else is left behind.
This speculative circus, along with the discouraging results achieved through sound investment policies, has caused some observers to declare long-term, buy-and-hold investing dead. Do not believe it. A game in which the participants are simply betting against each other will never create value. Sooner or later this is bound to sink in, and when it does, we think the public will
2
The Torray Fund
Letter to Shareholders (continued)
July 31, 2009
once again embrace the fundamental investment principles that have proven so successful throughout history.
In closing, we want to assure you of our dedication to your best interests, and thank you for your continued confidence in our management of your money.
| | | | | | |
| | Sincerely, | | | | |
| | | |
| |  | | | | |
| | Robert E. Torray | | | | |
| | 
| | | | |
| | Fred M. Fialco | | | | |
| | 
| | | | |
| | Shawn M. Hendon | | | | |
| | | | | | |
3
The Torray Fund
PERFORMANCE DATA
As of June 30, 2009 (unaudited)
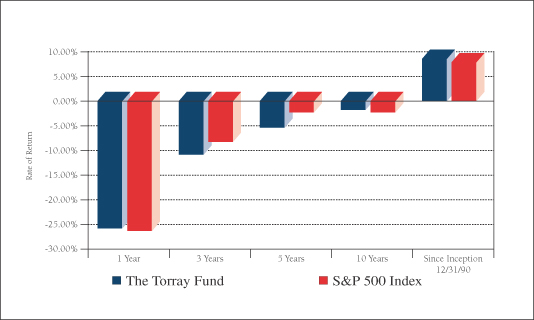
Average Annual Returns on an Investment in
The Torray Fund vs. the S&P 500 Index
For the periods ended June 30, 2009:
| | | | | | | | | | |
| | | 1 Year | | 3 Years | | 5 Years | | 10 Years | | Since
Inception
12/31/90 |
The Torray Fund | | -25.73% | | -10.80% | | -5.36% | | -1.75% | | 8.60% |
S&P 500 Index | | -26.21% | | -8.22% | | -2.24% | | -2.22% | | 7.89% |
Cumulative Returns for the 18 1/2 years ended June 30, 2009
| | | |
The Torray Fund | | 360.14 | % |
S&P 500 Index | | 307.73 | % |
4
The Torray Fund
PERFORMANCE DATA (continued)
As of June 30, 2009 (unaudited)
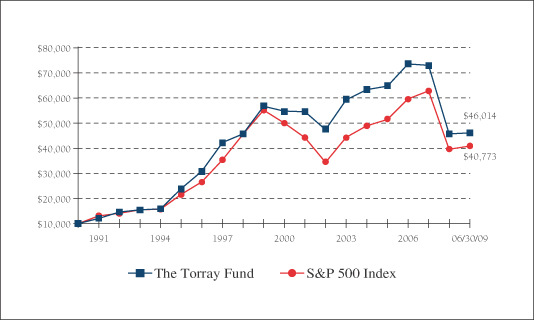
Change in Value of $10,000 Invested
on December 31, 1990 (commencement of operations) to:
| | | | | | | | | | | | | | | | | | | | | |
| | | 12/31/91 | | 12/31/94 | | 12/31/97 | | 12/31/00 | | 12/31/03 | | 12/31/06 | | 06/30/09 |
The Torray Fund | | $ | 11,996 | | $ | 15,827 | | $ | 42,126 | | $ | 54,617 | | $ | 59,149 | | $ | 73,408 | | $ | 46,014 |
S&P 500 Index | | $ | 13,048 | | $ | 15,666 | | $ | 35,339 | | $ | 49,993 | | $ | 44,156 | | $ | 59,452 | | $ | 40,773 |
The returns quoted represent past performance and do not guarantee future results. Investment return and principal value will fluctuate so that shares, when redeemed, may be worth more or less than their original cost. Current performance may be lower or higher. Returns current to the most recent month-end are available at www.torray.com. The returns shown do not reflect the deduction of taxes a shareholder would pay on the redemption of fund shares and distributions. The Fund’s gross annual operating expense ratio, as stated in the current prospectus, is 1.13%. Returns on both The Torray Fund and the S&P 500 Index assume reinvestment of all dividends and distributions. The S&P 500 Index is an unmanaged index consisting of 500 U.S. large-cap stocks.
5
The Torray Fund
FUND PROFILE
As of June 30, 2009 (unaudited)
| | |
DIVERSIFICATION (% of net assets) |
| |
Information Technology | | 23.10% |
Industrials | | 16.44% |
Health Care | | 16.35% |
Financials | | 11.81% |
Consumer Discretionary | | 9.33% |
Consumer Staples | | 6.62% |
Materials | | 3.81% |
Telecommunications | | 3.34% |
Energy | | 3.12% |
Short-Term Investments | | 6.28% |
Other Liabilities Less Assets | | (0.20)% |
| | |
| | 100.00% |
| | | | |
TOP TEN EQUITY HOLDINGS (% of net assets) |
| | |
| 1. | | Loews Corp. | | 3.69% |
| 2. | | 3M Co. | | 3.69% |
| 3. | | WellPoint, Inc. | | 3.62% |
| 4. | | Illinois Tool Works, Inc. | | 3.61% |
| 5. | | EMC Corp. | | 3.57% |
| 6. | | Automatic Data Processing, Inc. | | 3.56% |
| 7. | | Intel Corp. | | 3.50% |
| 8. | | Johnson & Johnson | | 3.41% |
| 9. | | Cisco Systems, Inc. | | 3.39% |
| 10. | | Walt Disney Co. (The) | | 3.39% |
| | | | |
| | | | 35.43% |
| | | | |
| | | | |
PORTFOLIO CHARACTERISTICS | | |
| |
Net Assets (million) | | $320 |
Number of Holdings | | 32 |
Portfolio Turnover | | 13.46% |
P/E Multiple (forward) | | 12.6x |
Portfolio Yield | | 2.40% |
Market Capitalization (billion) | | Average | | $43.4 |
| | Median | | $20.9 |
6
The Torray Fund
SCHEDULE OF INVESTMENTS
As of June 30, 2009 (unaudited)
| | | | | | | |
| | | Shares | | | | Market Value |
| COMMON STOCK 93.92% | | | |
| |
23.10% INFORMATION TECHNOLOGY | | | |
| | 871,600 | | EMC Corp. * | | $ | 11,417,960 |
| | 321,200 | | Automatic Data Processing, Inc. | | | 11,383,328 |
| | 676,300 | | Intel Corp. | | | 11,192,765 |
| | 581,400 | | Cisco Systems, Inc. * | | | 10,837,296 |
| | 102,200 | | International Business Machines Corp. | | | 10,671,724 |
| �� | 583,900 | | Western Union Co. (The) | | | 9,575,960 |
| | 796,875 | | Applied Materials, Inc. | | | 8,741,719 |
| | | | | | | |
| | | | | | | 73,820,752 |
| |
16.44% INDUSTRIALS | | | |
| | 196,000 | | 3M Co. | | | 11,779,600 |
| | 308,800 | | Illinois Tool Works, Inc. | | | 11,530,592 |
| | 449,946 | | Cintas Corp. | | | 10,276,767 |
| | 603,797 | | General Electric Co. | | | 7,076,501 |
| | 155,700 | | Eaton Corp. | | | 6,945,777 |
| | 385,737 | | Owens Corning, Inc. * | | | 4,929,719 |
| | | | | | | |
| | | | | | | 52,538,956 |
| |
16.35% HEALTH CARE | | | |
| | 227,200 | | WellPoint, Inc. * | | | 11,562,208 |
| | 191,724 | | Johnson & Johnson | | | 10,889,923 |
| | 427,000 | | UnitedHealth Group, Inc. | | | 10,666,460 |
| | 203,800 | | Abbott Laboratories | | | 9,586,752 |
| | 133,700 | | Becton Dickinson & Co. | | | 9,534,147 |
| | | | | | | |
| | | | | | | 52,239,490 |
| |
11.81% FINANCIALS | | | |
| | 430,300 | | Loews Corp. | | | 11,790,220 |
| | 511,218 | | Marsh & McLennan Cos., Inc. | | | 10,290,818 |
| | 2,183,591 | | LaBranche & Co., Inc. * | | | 9,389,441 |
| | 269,300 | | American Express Co. | | | 6,258,532 |
| | | | | | | |
| | | | | | | 37,729,011 |
See notes to the financial statements.
7
The Torray Fund
SCHEDULE OF INVESTMENTS (continued)
As of June 30, 2009 (unaudited)
| | | | | | | | |
| | | Shares | | | | Market Value | |
9.33% CONSUMER DISCRETIONARY | | | | |
| | 464,100 | | Walt Disney Co. (The) | | $ | 10,827,453 | |
| | 332,100 | | McGraw-Hill Cos., Inc. (The) | | | 9,999,531 | |
| | 169,820 | | O’Reilly Automotive, Inc. * | | | 6,466,746 | |
| | 706,900 | | Gannett Co., Inc. | | | 2,523,633 | |
| | | | | | | | |
| | | | | | | 29,817,363 | |
6.62% CONSUMER STAPLES | | | | |
| | 423,300 | | Kraft Foods, Inc., Class A | | | 10,726,422 | |
| | 204,300 | | Procter & Gamble Co. (The) | | | 10,439,730 | |
| | | | | | | | |
| | | | | | | 21,166,152 | |
3.81% MATERIALS | | | | |
| | 258,100 | | E.I. du Pont de Nemours & Co. | | | 6,612,522 | |
| | 344,700 | | Dow Chemical Co. (The) | | | 5,563,458 | |
| | | | | | | | |
| | | | | | | 12,175,980 | |
3.34% TELECOMMUNICATIONS | | | | |
| | 429,300 | | AT&T, Inc. | | | 10,663,812 | |
3.12% ENERGY | | | | |
| | 1,876,231 | | USEC, Inc. * | | | 9,981,549 | |
| | | | | | | | |
| TOTAL COMMON STOCK 93.92% | | | 300,133,065 | |
(cost $376,243,074) | | | | | | |
| | | |
| | | Principal Amount ($) | | | | Market Value | |
| SHORT-TERM INVESTMENTS 6.28% | | | | |
| | 20,069,857 | | PNC Bank Money Market Account, 0.05%(1) | | $ | 20,069,857 | |
(cost $20,069,857) | | | | | | |
| | | | | | | | |
| TOTAL INVESTMENTS 100.20% | | | 320,202,922 | |
(cost $396,312,931) | | | | | | |
| |
| LIABILITES LESS OTHER ASSETS (0.20%) | | | (641,010 | ) |
| | | | | | | | |
| NET ASSETS 100.00% | | $ | 319,561,912 | |
| | | | | | | | |
| * | | Non-income producing securities |
| (1) | | Represents current yield at June 30, 2009. |
See notes to the financial statements.
8
The Torray Fund
STATEMENT OF ASSETS AND LIABILITIES
As of June 30, 2009 (unaudited)
| | | | |
ASSETS | | | | |
Investments in securities at value
(cost $396,312,931) | | $ | 320,202,922 | |
Interest and dividends receivable | | | 514,057 | |
Receivable for fund shares sold | | | 949 | |
Prepaid expenses | | | 12,787 | |
| | | | |
TOTAL ASSETS | | | 320,730,715 | |
| | | | |
| |
LIABILITIES | | | | |
Payable for fund shares redeemed | | | 670,933 | |
Payable to advisor | | | 267,501 | |
Accrued expenses | | | 230,369 | |
| | | | |
TOTAL LIABILITIES | | | 1,168,803 | |
| | | | |
| |
NET ASSETS | | $ | 319,561,912 | |
| | | | |
Shares of beneficial interest ($1 stated value,
14,717,732 shares outstanding, unlimited
shares authorized) | | $ | 14,717,732 | |
Paid-in-capital in excess of par | | | 479,856,722 | |
Distributions in excess of net investment income | | | (56 | ) |
Accumulated net realized loss on investments | | | (98,902,477 | ) |
Net unrealized depreciation of investments | | | (76,110,009 | ) |
| | | | |
| |
TOTAL NET ASSETS | | $ | 319,561,912 | |
| | | | |
Net asset value, offering and redemption price per share | | $ | 21.71 | |
| | | | |
See notes to the financial statements.
9
The Torray Fund
STATEMENT OF OPERATIONS
For the six months ended June 30, 2009 (unaudited)
| | | | |
INVESTMENT INCOME | | | | |
Dividend income | | $ | 3,776,711 | |
Interest income | | | 5,752 | |
| | | | |
Total income | | | 3,782,463 | |
| | | | |
| |
EXPENSES | | | | |
Management fees | | | 1,585,724 | |
Transfer agent fees & expenses | | | 215,559 | |
Legal fees | | | 41,680 | |
Insurance expense | | | 35,097 | |
Printing, postage & mailing | | | 22,149 | |
Trustees’ fees | | | 21,945 | |
Audit fees | | | 17,988 | |
Custodian fees | | | 17,915 | |
Registration & filing fees | | | 10,576 | |
| | | | |
Total expenses | | | 1,968,633 | |
| | | | |
NET INVESTMENT INCOME | | | 1,813,830 | |
| | | | |
REALIZED AND UNREALIZED GAIN (LOSS)
ON INVESTMENTS | | | | |
Net realized loss on investments | | | (47,344,125 | ) |
Net change in unrealized appreciation (depreciation) on investments | | | 45,533,531 | |
| | | | |
Net realized and unrealized loss on investments | | | (1,810,594 | ) |
| | | | |
NET INCREASE IN NET ASSETS FROM OPERATIONS | | $ | 3,236 | |
| | | | |
See notes to the financial statements.
10
The Torray Fund
STATEMENTS OF CHANGES IN NET ASSETS
For the periods indicated:
| | | | | | | | |
| | | Six months ended
06/30/09
(unaudited) | | | Year ended
12/31/08 | |
Increase (Decrease) in Net Assets from Operations: | | | | | | | | |
Net investment income | | $ | 1,813,830 | | | $ | 5,309,667 | |
Net realized loss on investments | | | (47,344,125 | ) | | | (51,558,352 | ) |
Net change in unrealized appreciation
(depreciation) on investments | | | 45,533,531 | | | | (233,567,470 | ) |
| | | | | | | | |
Net increase (decrease) in net assets from operations | | | 3,236 | | | | (279,816,155 | ) |
| | | | | | | | |
| | |
Distributions to Shareholders from: | | | | | | | | |
Net investment income ($0.120 and
$0.303 per share, respectively) | | | (1,813,886 | ) | | | (6,343,588 | ) |
Net realized gains ($0.000 and $1.242 per
share, respectively) | | | — | | | | (29,816,455 | ) |
Return of Capital ($0.000 and $0.034 per
share, respectively) | | | — | | | | (706,904 | ) |
| | | | | | | | |
Total distributions | | | (1,813,886 | ) | | | (36,866,947 | ) |
| | | | | | | | |
| | |
Shares of Beneficial Interest | | | | | | | | |
Decrease from share transactions | | | (32,072,480 | ) | | | (330,215,602 | ) |
| | | | | | | | |
Total decrease | | | (33,883,130 | ) | | | (646,898,704 | ) |
| | |
Net Assets — Beginning of Period | | | 353,445,042 | | | | 1,000,343,746 | |
| | | | | | | | |
Net Assets — End of Period | | $ | 319,561,912 | | | $ | 353,445,042 | |
| | | | | | | | |
Distributions in Excess of Net Investment Income | | $ | (56 | ) | | $ | — | |
| | | | | | | | |
See notes to the financial statements.
11
The Torray Fund
FINANCIAL HIGHLIGHTS
For a share outstanding throughout each period presented:
PER SHARE DATA
| | | | | | | | | | | | | | | | | | | | | | | | |
| | | Six months
ended
06/30/09
(unaudited) | | | Years ended December 31: | |
| | | | 2008 | | | 2007 | | | 2006 | | | 2005 | | | 2004 | |
Net Asset Value,
Beginning of Period | | $ | 21.640 | | | $ | 36.440 | | | $ | 41.570 | | | $ | 39.020 | | | $ | 41.080 | | | $ | 39.980 | |
| | | | | | | | | | | | | | | | | | | | | | | | |
Income/(loss) from investment operations | | | | | | | | | | | | | | | | | | | | | | | | |
Net investment income | | | 0.116 | (2) | | | 0.243 | (2) | | | 0.152 | | | | 0.073 | | | | 0.133 | | | | 0.165 | |
Net gains (losses) on securities (both realized and unrealized) | | | 0.074 | | | | (13.464 | ) | | | (0.443 | ) | | | 5.176 | | | | 0.653 | | | | 2.523 | |
| | | | | | | | | | | | | | | | | | | | | | | | |
Total from investment operations | | | 0.190 | | | | (13.221 | ) | | | (0.291 | ) | | | 5.249 | | | | 0.786 | | | | 2.688 | |
| | | | | | | | | | | | | | | | | | | | | | | | |
Less: distributions | | | | | | | | | | | | | | | | | | | | | | | | |
Dividends (from net investment
income) | | | (0.120 | ) | | | (0.303 | ) | | | (0.121 | ) | | | (0.087 | ) | | | (0.133 | ) | | | (0.165 | ) |
Distributions (from capital gains) | | | 0.000 | | | | (1.242 | ) | | | (4.718 | ) | | | (2.612 | ) | | | (2.713 | ) | | | (1.423 | ) |
Distributions (from return of capital) | | | 0.000 | | | | (0.034 | ) | | | — | | | | — | | | | — | | | | — | |
| | | | | | | | | | | | | | | | | | | | | | | | |
Total distributions | | | (0.120 | ) | | | (1.579 | ) | | | (4.839 | ) | | | (2.699 | ) | | | (2.846 | ) | | | (1.588 | ) |
| | | | | | | | | | | | | | | | | | | | | | | | |
Net Asset Value,
End of Period | | $ | 21.710 | | | $ | 21.640 | | | $ | 36.440 | | | $ | 41.570 | | | $ | 39.020 | | | $ | 41.080 | |
| | | | | | | | | | | | | | | | | | | | | | | | |
TOTAL RETURN(1) | | | 0.92 | %** | | | (37.39 | %) | | | (0.80 | %) | | | 13.74 | % | | | 2.08 | % | | | 6.90 | % |
RATIOS/SUPPLEMENTAL DATA | | | | | | | | | | | | | | | | | | | | | | | | |
Net assets, end of period
(000’s omitted) | | $ | 319,562 | | | $ | 353,445 | | | $ | 1,000,344 | | | $ | 1,198,919 | | | $ | 1,329,951 | | | $ | 1,734,500 | |
Ratios of expenses to average net
assets | | | 1.24 | %* | | | 1.13 | % | | | 1.09 | % | | | 1.10 | % | | | 1.07 | % | | | 1.08 | % |
Ratios of net investment income to
average net assets | | | 1.14 | %* | | | 0.80 | % | | | 0.36 | % | | | 0.18 | % | | | 0.34 | % | | | 0.41 | % |
Portfolio turnover rate | | | 13.46 | %** | | | 28.13 | % | | | 50.47 | % | | | 21.92 | % | | | 33.16 | % | | | 27.12 | % |
| (1) | | Past performance is not predictive of future performance. |
| (2) | | Calculated based on the average amount of shares outstanding during the period. |
See notes to the financial statements.
12
The Torray Fund
NOTES TO FINANCIAL STATEMENTS
As of June 30, 2009 (unaudited)
NOTE 1 — SUMMARY OF SIGNIFICANT ACCOUNTING POLICIES
The Torray Fund (“Fund”) is a separate series of The Torray Fund (“Trust”). The Trust is registered under the Investment Company Act of 1940, as amended, as a no-load, diversified, open-end management investment company. The Trust was organized as a business trust under Massachusetts law. The Fund’s primary investment objective is to provide long-term total return. The Fund seeks to meet its objective by investing its assets in a diversified portfolio of common stocks. In order to accomplish these goals, the Fund intends to hold stocks for the long term, as opposed to actively buying and selling. There can be no assurances that the Fund’s investment objectives will be achieved.
The following is a summary of accounting policies followed by the Fund in the preparation of its financial statements. These policies are in conformity with accounting principles generally accepted in the United States of America.
Securities Valuation Portfolio securities for which market quotations are readily available are valued at market value, which is determined by using the last reported sale price, or, if no sales are reported, the last reported bid price. For NASDAQ traded securities, market value is determined on the basis of the NASDAQ official closing price instead of the last reported sales price. Other assets and securities for which no quotations are readily available or for which Torray LLC (the “Advisor”) believes do not reflect market value are valued at fair value as determined in good faith by the Advisor under the supervision of the Board of Trustees (the “Board” or “Trustees”) in accordance with the Fund’s Valuation Procedures. Short-term obligations having remaining maturities of 60 days or less are valued at amortized cost, which approximates market value.
Statement of Financial Accounting Standards No. 157 “Fair Value Measurements” (“FAS 157”) This standard clarifies the definition of fair value for financial reporting, establishes a framework for measuring fair value and requires additional disclosures about the use of fair value measurements. The three levels of the fair value hierarchy under FAS 157 are described below:
| | • | | Level 1 — quoted prices in active markets for identical securities |
| | • | | Level 2 — other significant observable inputs (including quoted prices for similar securities, interest rates, prepayment speeds, credit risk, etc.) |
| | • | | Level 3 — significant unobservable inputs (including the Fund’s own assumptions in determining the fair value of investments) |
The inputs or methodology used for valuing securities are not necessarily an indication of the risk associated with investing in those securities.
13
The Torray Fund
NOTES TO FINANCIAL STATEMENTS (continued)
As of June 30, 2009 (unaudited)
The summary of inputs used to value the Fund’s net assets as of June 30, 2009 is as follows:
| | | |
Valuation Inputs | | | |
Level 1 — Quoted Prices * | | $ | 320,202,922 |
Level 2 — Other Significant Observable Inputs | | | — |
Level 3 — Significant Unobservable Inputs | | | — |
| | | |
Total Market Value of Investments | | $ | 320,202,922 |
| | | |
| * | | Security type and industry classifications as defined in the Schedule of Investments |
Securities Transactions and Investment Income Securities transactions are recorded on a trade date basis. Realized gains and losses from securities transactions are recorded on the specific identification basis. Dividend income and distributions to shareholders are recorded on the ex-dividend date. Interest income, including amortization of discount on short-term investments, and expenses are recorded on the accrual basis. Premium and discount are amortized using the effective yield to maturity method.
Federal Income Taxes The Fund intends to continue to comply with the requirements of the Internal Revenue Code applicable to regulated investment companies and to distribute all of its taxable income, including any net realized gain on investments to its shareholders. Therefore, no Federal income tax provision is required.
Management has analyzed the Fund’s tax positions taken on federal income tax returns for all open tax years (current and prior three tax years), and has concluded that no provision for federal income tax is required in the Fund’s financial statements. The Fund’s federal and state income and federal excise tax returns for tax years for which the applicable statutes of limitations have not expired are subject to examination by the Internal Revenue Service and state departments of revenue.
Net Asset Value The net asset value per share of the Fund is determined daily as of the close of trading on the New York Stock Exchange by dividing the value of the Fund’s net assets by the number of shares outstanding.
Interest Expense When cash balances are overdrawn in the Fund’s custody account, the Fund is charged an overdraft fee equal to 1.25% above the Federal Funds Rate. In addition, in December 2006, the Trust entered into a line of credit facility with PNC Bank. Under the terms of the line of credit, the separate series of the Trust (including the Fund) may borrow up to $20,000,000 on a short-term basis with interest accruing at the Federal Funds Rate plus 0.75%. Any interest expense on the line of credit is paid by the Advisor under the comprehensive management fee arrangement described in Note 4. As of June 30, 2009, the Fund had no outstanding borrowings under this line of credit facility.
Use of Estimates In preparing financial statements in accordance with accounting principles generally accepted in the United States of America, management is required to make estimates and assumptions that affect the reported amounts of assets and liabilities and the disclosure of contingent assets and liabilities at the date of the financial statements, and the reported amounts of increases and decreases in net assets from operations during the reporting period. Actual results could differ from those estimates.
14
The Torray Fund
NOTES TO FINANCIAL STATEMENTS (continued)
As of June 30, 2009 (unaudited)
NOTE 2 — SHARES OF BENEFICIAL INTEREST TRANSACTIONS
Transactions in shares of beneficial interest were as follows:
| | | | | | | | | | | | | | |
| | | Six months ended
06/30/09 | | | Year ended
12/31/08 | |
| | | Shares | | | Amount | | | Shares | | | Amount | |
Shares issued | | 107,955 | | | $ | 2,159,366 | | | 1,640,783 | | | $ | 53,535,920 | |
Reinvestments of dividends and distributions | | 84,492 | | | | 1,713,010 | | | 1,204,731 | | | | 35,559,707 | |
Shares redeemed | | (1,806,145 | ) | | | (35,944,856 | ) | | (13,963,362 | ) | | | (419,311,229 | ) |
| | | | | | | | | | | | | | |
| | (1,613,698 | ) | | $ | (32,072,480 | ) | | (11,117,848 | ) | | $ | (330,215,602 | ) |
| | | | | | | | | | | | | | |
As of June 30, 2009, the Trust’s officers, Trustees and affiliated persons and their families directly or indirectly controlled 1,254,314 shares or 8.52% of the Fund.
NOTE 3 — INVESTMENT TRANSACTIONS
Purchases and sales of investment securities, other than short-term investments, for the six months ended June 30, 2009, aggregated $39,823,716 and $64,982,059, respectively.
NOTE 4 — MANAGEMENT FEES
Pursuant to the Management Contract, the Advisor provides investment advisory and administrative services to the Fund. The Fund pays the Advisor a management fee, computed daily and payable monthly at the annual rate of 1.00% of the Fund’s average daily net assets. For the six months ended June 30, 2009, the Fund incurred management fees of $1,585,724.
Excluding the management fee, other expenses incurred by the Fund during the six months ended June 30, 2009, totaled $382,909. These expenses include all costs associated with the Fund’s operations including transfer agent fees, independent trustees’ fees ($14,000 per annum and $2,000 for each Board meeting attended per Trustee), dues, fees and expenses of registering and qualifying the Fund and its shares for distribution, charges of custodian, auditing and legal expenses, insurance premiums, supplies, postage, expenses of issue or redemption of shares, reports to shareholders and Trustees, expenses of printing and mailing prospectuses, proxy statements and proxies to existing shareholders, and other miscellaneous expenses.
Certain officers and Trustees of the Fund are also officers and/or shareholders of the Advisor.
NOTE 5 — TAX MATTERS
Distributions to shareholders are determined in accordance with United States Federal income tax regulations, which may differ from accounting principles generally accepted in the United States of America.
15
The Torray Fund
NOTES TO FINANCIAL STATEMENTS (continued)
As of June 30, 2009 (unaudited)
The tax character of distributions paid during the year ended December 31, 2008 was as follows:
| | | |
Distributions paid from: | | | |
Ordinary income | | $ | 6,347,372 |
Long-term capital gain | | | 29,812,671 |
Non-taxable return of capital | | | 706,904 |
| | | |
| | $ | 36,866,947 |
| | | |
The primary difference between book basis and tax basis distributions is differing book and tax treatment of short-term capital gains.
At December 31, 2008, the Torray Fund had net capital loss carry forward for federal income tax purposes of $687,498, which are available to reduce future required distributions of net capital gains to shareholders through 2016.
At December 31, 2008, the Torray Fund had deferred post-October losses of $50,870,854.
The following information is based upon the federal tax basis of investment securities as of June 30, 2009:
| | | | | | |
Gross unrealized appreciation | | $ | 23,001,776 | | | |
Gross unrealized depreciation | | | (99,111,785 | ) | | |
| | | | | | |
Net unrealized depreciation | | $ | (76,110,009 | ) | | |
| | | | | | |
Cost | | $ | 396,312,931 | | | |
| | | | | | |
NOTE 6 — COMMITMENTS AND CONTINGENCIES
The Fund indemnifies its officers and Trustees for certain liabilities that may arise from their performance of their duties to the Fund. Additionally, in the normal course of business, the Fund enters into contracts that contain a variety of representations and warranties which provide general indemnifications. The Fund’s maximum exposure under these arrangements is unknown, as this would involve future claims that may be made against the Fund that have not yet occurred.
NOTE 7 — SUBSEQUENT EVENTS
Management has evaluated the impact of all subsequent events on the Fund through August 31, 2009, the date the financial statements were issued, and has determined that there were no subsequent events requiring recognition or disclosure in the financial statements.
16
The Torray Fund
PORTFOLIO HOLDINGS, PROXY VOTING AND PROCEDURES
As of June 30, 2009 (unaudited)
The Fund files its complete schedule of portfolio holdings with the Securities and Exchange Commission (the “Commission”) for the first and third quarters of each fiscal year on Form N-Q. The Fund’s Forms N-Q are available on the Commission’s website at http://www.sec.gov. The Fund’s Form N-Q may be reviewed and copied at the Commission’s Public Reference Room in Washington, D.C. Information on the operation of the Commission’s Public Reference Room may be obtained by calling 1-800-SEC-0330.
A description of the policies and procedures that the Fund uses to determine how to vote proxies relating to portfolio securities is available without charge, upon request, by calling 1-800-443-3036; and on the Commission’s website at http://www.sec.gov.
Information regarding how the Fund voted proxies relating to portfolio securities is available without charge, upon request, by calling 1-800-443-3036; and on the Commission’s website at http://www.sec.gov.
17
The Torray Fund
ABOUT YOUR FUND’S EXPENSES
As of June 30, 2009 (unaudited)
We believe it is important for you to understand the impact of costs on your investment. All mutual funds have operating expenses. As a shareholder of the Fund, you incur ongoing costs, including management fees, and other Fund expenses. Operating expenses, which are deducted directly from the Fund’s gross income, directly reduce the investment return of the Fund.
A mutual fund’s expenses are expressed as a percentage of its average net assets. This figure is known as the expense ratio. The following examples are intended to help you understand the ongoing costs (in dollars) of investing in the Fund and to compare these costs with the ongoing costs of investing in other mutual funds. The examples below are based on an investment of $1,000 made at the beginning of the period shown and held for the entire period.
The table on the next page illustrates the Fund’s cost in two ways:
Actual Fund Return This section helps you estimate the actual expenses that you paid over the period. The “Ending Account Value” shown is derived from the Fund’s actual return, and the third column shows the operating expenses that would have been paid by an investor who started with $1,000 in the Fund. You may use the information here, together with the amount invested, to estimate the expenses that you paid over the period.
To do so, simply divide your account value by $1,000 (for example, an $8,600 account value divided by $1,000 = 8.6), then multiply the result by the number given for the Fund under the heading “Expenses Paid During Period”on the next page.
Hypothetical 5% Return This section is intended to help you compare your Fund’s costs with those of other mutual funds. It assumes that the Fund had an annual return of 5% before expenses, and that the expense ratio is unchanged. In this case, because the return used is not the Fund’s actual return, the results do not apply to your investment. The example is useful in making comparisons because the Commission requires all mutual funds to calculate expenses based on a 5% return. You can assess the Fund’s costs by comparing this hypothetical example with the hypothetical examples that appear in shareholder reports of other funds.
Note that expenses shown in the table are meant to highlight and help you compare ongoing costs only. The Fund does not charge transactions fees, such as purchase or redemption fees, nor does it carry a “sales load.”
The calculation assumes no shares were bought or sold during the period. Your actual costs may have been higher or lower, depending on the amount of your investment and the timing of any purchases or redemptions.
18
The Torray Fund
ABOUT YOUR FUND’S EXPENSES (continued)
As of June 30, 2009 (unaudited)
More information about the Fund’s expenses, including recent annual expense ratios, can be found in this report. For additional information on operating expenses and other shareholder costs, please refer to the Fund’s prospectus.
| | | | | | | | | |
| | | Beginning
Account Value
January 1, 2009 | | Ending
Account Value
June 30, 2009 | | Expenses Paid
During Period* |
Based on Actual Fund Return | | $ | 1,000.00 | | $ | 1,009.20 | | $ | 6.18 |
Based on Hypothetical 5% Return
(before expenses) | | $ | 1,000.00 | | $ | 1,018.65 | | $ | 6.21 |
| * | | Expenses are equal to the Fund’s annualized expense ratio of 1.24% for the period, multiplied by the average account value over the period, multiplied by 181/365 (to reflect the one-half year period). |
19
TRUSTEES
Carol Crawford
Bruce C. Ellis
William M Lane
Robert P. Moltz
Wayne H. Shaner
INVESTMENT ADVISOR
Torray LLC
OFFICERS
Robert E. Torray
William M Lane
Fred M. Fialco
Shawn M. Hendon
INDEPENDENT REGISTERED
PUBLIC ACCOUNTING FIRM
Briggs, Bunting & Dougherty, LLP
1835 Market Street 26th Floor
Philadelphia, PA 19103
TRANSFER AGENT
PNC Global Investment Servicing (U.S.) Inc.
101 Sabin Street
Pawtucket, RI 02860-1427
LEGAL COUNSEL
Dechert LLP
1775 I Street, N.W.
Washington, DC 20006
Distributed by PFPC Distributors, Inc.
760 Moore Road, King of Prussia, PA 19406-1212
Date of first use, August 2009
This report is not authorized for distribution to
prospective investors unless preceded or accompanied
by a current prospectus. All indices are unmanaged
groupings of stocks that are not available for
investment.
The
TORRAY
FUND
SEMI-ANNUAL REPORT
June 30, 2009
The Torray Fund
Suite 1100
7501 Wisconsin Avenue
Bethesda, Maryland 20814-6523
(301) 493-4600
(800) 443-3036
The Torray Institutional Fund
Letter to Shareholders
July 31, 2009
Dear Fellow Shareholders,
The Torray Institutional Fund gained 2.07% during the first half of 2009, compared to a 3.16% advance for the Standard & Poor’s 500. In a continuation of last year’s miserable showing, the market collapsed an additional 25% before bottoming March 9th. At that point, stocks had lost a staggering 57% from the top reached October 9, 2007. At mid-year, even after a 36% rally, they were still 41% below the old high.
When stocks recover from a crash, speculative issues often perform best, and last quarter’s rally proved no exception. In fact, it may have been a record-setter in that regard. Shares priced under $5 out-ran stocks trading above $50 by 91%. Those of companies losing money or breaking even beat profitable ones by 24%, and, belying the notion investors crave income, stocks paying dividends trailed those that didn’t. These are truly extraordinary statistics.
As we write, these trends have reversed, with higher-quality stocks taking the lead. There are signs the economy and financial system are stabilizing, and reported earnings, so far, have been running ahead of expectations. All of this is encouraging. While one can never know the future, we think there’s more room for optimism now than at any time since the financial crisis began. In saying this, we’re talking longer term, not just a few months or quarters.
In response to the tremendous beating they’ve taken, desperate investors are looking for cures in what we see as all the wrong places. Stocks of the best companies have been sold and the proceeds put into money market funds, CDs, savings accounts and bonds. Huge sums have also moved to overseas markets, especially those in lesser-developed countries. Sooner or later, we believe this money is bound to end up back where it started, but probably not until stock prices are much higher. We’ve seen it happen too many times to think otherwise.
Despite our economy’s ups and downs, and the market’s unpredictable erratic gyrations, patient long-term holders of stocks have fared very well. In fact, stocks are the only widely available option that has directly tracked America’s prosperity. Fixed income options have run far behind. Yet, as noted, people have been buying them anyway, largely in response to punishing losses they fear may only get worse. Ironically, at the top in October 2007, they were doing just the opposite. The national savings rate was negative, and investors chased stocks, many at twice today’s levels, often on margin. They also bid up houses and commodities. This is the only business we can think of where the customer goes into a frenzy over a rising price. Think about
1
The Torray Institutional Fund
Letter to Shareholders (continued)
July 31, 2009
it. Who would reject a new car at $10,000 only to buy two at $30,000? But, that’s what people tend to do when it comes to investing.
Unfortunately, in the present circumstance, we think investors sitting on 2% CDs and five and ten-year government bonds yielding 2½% - 3½% are once again heading for disappointment. Taxes aside, long experience suggests these choices, net of inflation, will return little or nothing. Beyond that, it’s even more foolish to be selling quality stocks after they’ve dropped 30% - 50% to buy speculative ones just because they’re going up.
We believe stocks like those in our Fund are bargains today. The price/earnings ratio on the S&P 500 is roughly 30% below its 20-year trailing average; its current dividend yield is 2.6%, compared to 1.8% over the same period. Furthermore, yields on a lot of stocks are even higher, exceeding returns on intermediate bonds, not to mention money funds and CDs. More importantly, as earnings and dividends grow, share prices will follow suit. This is an unbeatable combination. Over the 70 years ending June 30, the nominal return on stocks was 10.6%, and on bonds, 5.5%. After inflation, averaging 4% a year, the real returns were 6.6% and 1.5%, respectively. In a testimony to the miracle of compounding, $1 in stocks, net of inflation, grew to $87.70, in bonds, to only $2.84. Given today’s low interest rates and the government’s unprecedented deficit spending funded by record bond issuance, fixed income buyers may do even worse than usual going forward.
Finally, we want to re-emphasize our commitment to the investment philosophy that has guided our Company for nearly 37 years. Regretfully, the benefits that flow from these timeless precepts have been lost in waves of bubbles and crashes that have plagued serious investors for over 10 years. Commodities, futures contracts, leveraged exchange-traded funds, high-frequency trading programs and more have diverted attention from the values building in quality companies with above-average economic prospects. While the performance of these alternatives is hard to assess, highly publicized reports of occasional spectacular gains on them tend to leave the impression that all of the players are being enriched while everyone else is left behind.
This speculative circus, along with the discouraging results achieved through sound investment policies, has caused some observers to declare long-term, buy-and-hold investing dead. Do not believe it. A game in which the participants are simply betting against each other will never create value. Sooner or later this is bound to sink in, and when it does, we think the public will
2
The Torray Institutional Fund
Letter to Shareholders (continued)
July 31, 2009
once again embrace the fundamental investment principles that have proven so successful throughout history.
In closing, we want to assure you of our dedication to your best interests, and thank you for your continued confidence in our management of your money.
| | | | | | |
| | Sincerely, | | | | |
| | | |
| |  | | | | |
| | Robert E. Torray | | | | |
| | 
| | | | |
| | Fred M. Fialco | | | | |
| | 
| | | | |
| | Shawn M. Hendon | | | | |
3
The Torray Institutional Fund
PERFORMANCE DATA
As of June 30, 2009 (unaudited)
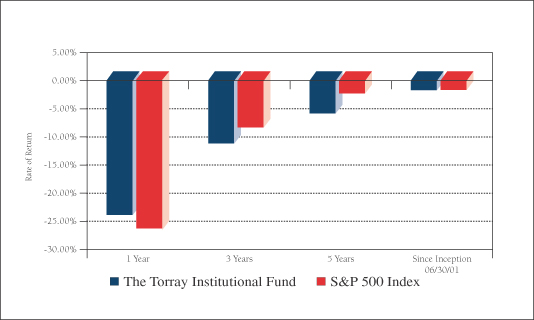
Average Annual Returns on an Investment in
The Torray Institutional Fund vs. the S&P 500 Index
For the periods ended June 30, 2009:
| | | | | | | | |
| | | 1 Year | | 3 Years | | 5 Years | | Since
Inception
06/30/01 |
The Torray Institutional Fund | | -23.59% | | -11.04% | | -5.76% | | -1.70% |
S&P 500 Index | | -26.21% | | -8.22% | | -2.24% | | -1.66% |
Cumulative Returns for the 8 years ended June 30, 2009
| | | |
The Torray Institutional Fund | | -12.79 | % |
S&P 500 Index | | -12.56 | % |
4
The Torray Institutional Fund
PERFORMANCE DATA (continued)
As of June 30, 2009 (unaudited)
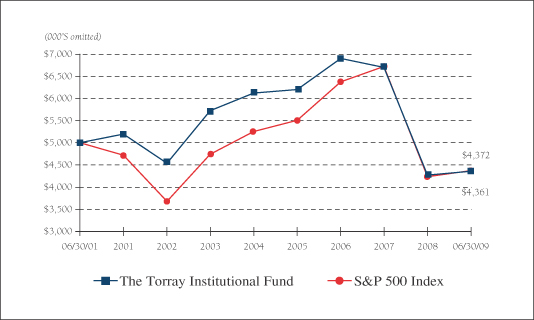
Change in Value of $5,000,000 Invested
on June 30, 2001 (commencement of operations) to:
| | | | | | | | | | | | | | | |
| | | 12/31/01 | | 12/31/03 | | 12/31/05 | | 12/31/07 | | 06/30/09 |
The Torray Institutional Fund | | $ | 5,199,000 | | $ | 5,725,000 | | $ | 6,201,500 | | $ | 6,701,000 | | $ | 4,360,500 |
S&P 500 Index | | $ | 4,723,000 | | $ | 4,739,000 | | $ | 5,507,000 | | $ | 6,726,000 | | $ | 4,372,000 |
The returns quoted represent past performance and do not guarantee future results. Investment return and principal value will fluctuate so that shares, when redeemed, may be worth more or less than their original cost. Current performance may be lower or higher. Returns current to the most recent month-end are available at www.torray.com. The returns shown do not reflect the deduction of taxes a shareholder would pay on the redemption of fund shares and distributions. The Fund’s gross annual operating expense ratio, as stated in the current prospectus, is 0.85%. Returns on both The Torray Institutional Fund and the S&P 500 Index assume reinvestment of all dividends and distributions. The S&P 500 Index is an unmanaged index consisting of 500 U.S. large-cap stocks.
5
The Torray Institutional Fund
FUND PROFILE
As of June 30, 2009 (unaudited)
| | |
DIVERSIFICATION (% of net assets) |
| |
Information Technology | | 22.16% |
Industrials | | 15.79% |
Health Care | | 15.76% |
Financials | | 11.40% |
Consumer Discretionary | | 9.03% |
Consumer Staples | | 6.38% |
Materials | | 3.67% |
Telecommunications | | 3.22% |
Energy | | 3.00% |
Short-Term Investments | | 9.59% |
Other Liabilities Less Assets | | 0.00% |
| | |
| | 100.00% |
| | | | |
TOP TEN EQUITY HOLDINGS (% of net assets) |
| | |
| 1. | | 3M Co. | | 3.58% |
| 2. | | Loews Corp. | | 3.57% |
| 3. | | WellPoint, Inc. | | 3.53% |
| 4. | | EMC Corp. | | 3.47% |
| 5. | | Illinois Tool Works, Inc. | | 3.46% |
| 6. | | Automatic Data Processing, Inc. | | 3.42% |
| 7. | | Intel Corp. | | 3.41% |
| 8. | | Walt Disney Co. (The) | | 3.29% |
| 9. | | Cisco Systems, Inc. | | 3.29% |
| 10. | | Johnson & Johnson | | 3.27% |
| | | | |
| | | | 34.29% |
| | | | |
PORTFOLIO CHARACTERISTICS | | |
| | |
Net Assets (million) | | | | $17 |
Number of Holdings | | | | 32 |
Portfolio Turnover | | | | 16.14% |
P/E Multiple (forward) | | | | 12.6x |
Portfolio Yield | | | | 2.40% |
Market Capitalization (billion) | | Average | | $43.4 |
| | Median | | $20.9 |
6
The Torray Institutional Fund
SCHEDULE OF INVESTMENTS
As of June 30, 2009 (unaudited)
| | | | | | | |
| | | Shares | | | | Market Value |
| COMMON STOCK 90.41% | | | |
| |
22.16% INFORMATION TECHNOLOGY | | | |
| | 43,942 | | EMC Corp. * | | $ | 575,640 |
| | 16,016 | | Automatic Data Processing, Inc. | | | 567,607 |
| | 34,156 | | Intel Corp. | | | 565,282 |
| | 29,300 | | Cisco Systems, Inc. * | | | 546,152 |
| | 5,100 | | International Business Machines Corp. | | | 532,542 |
| | 29,400 | | Western Union Co. (The) | | | 482,160 |
| | 37,193 | | Applied Materials, Inc. | | | 408,007 |
| | | | | | | |
| | | | | | | 3,677,390 |
| |
15.79% INDUSTRIALS | | | |
| | 9,900 | | 3M Co. | | | 594,990 |
| | 15,400 | | Illinois Tool Works, Inc. | | | 575,036 |
| | 22,692 | | Cintas Corp. | | | 518,285 |
| | 30,319 | | General Electric Co. | | | 355,339 |
| | 7,800 | | Eaton Corp. | | | 347,958 |
| | 17,918 | | Owens Corning, Inc. * | | | 228,992 |
| | | | | | | |
| | | | | | | 2,620,600 |
| |
15.76% HEALTH CARE | | | |
| | 11,500 | | WellPoint, Inc. * | | | 585,235 |
| | 9,564 | | Johnson & Johnson | | | 543,235 |
| | 21,100 | | UnitedHealth Group, Inc. | | | 527,078 |
| | 6,800 | | Becton Dickinson & Co. | | | 484,908 |
| | 10,100 | | Abbott Laboratories | | | 475,104 |
| | | | | | | |
| | | | | | | 2,615,560 |
| |
11.40% FINANCIALS | | | |
| | 21,600 | | Loews Corp. | | | 591,840 |
| | 25,617 | | Marsh & McLennan Cos., Inc. | | | 515,670 |
| | 109,875 | | LaBranche & Co., Inc. * | | | 472,463 |
| | 13,423 | | American Express Co. | | | 311,951 |
| | | | | | | |
| | | | | | | 1,891,924 |
See notes to the financial statements.
7
The Torray Institutional Fund
SCHEDULE OF INVESTMENTS (continued)
As of June 30, 2009 (unaudited)
| | | | | | | | |
| | | Shares | | | | Market Value | |
9.03% CONSUMER DISCRETIONARY | | | | |
| | 23,410 | | Walt Disney Co. (The) | | $ | 546,155 | |
| | 16,700 | | McGraw-Hill Cos., Inc. (The) | | | 502,837 | |
| | 8,525 | | O’Reilly Automotive, Inc. * | | | 324,632 | |
| | 35,100 | | Gannett Co., Inc. | | | 125,307 | |
| | | | | | | | |
| | | | | | | 1,498,931 | |
6.38% CONSUMER STAPLES | | | | |
| | 21,200 | | Kraft Foods, Inc., Class A | | | 537,208 | |
| | 10,200 | | Procter & Gamble Co. (The) | | | 521,220 | |
| | | | | | | | |
| | | | | | | 1,058,428 | |
3.67% MATERIALS | | | | |
| | 13,000 | | E.I. du Pont de Nemours & Co. | | | 333,060 | |
| | 17,100 | | Dow Chemical Co. (The) | | | 275,994 | |
| | | | | | | | |
| | | | | | | 609,054 | |
3.22% TELECOMMUNICATIONS | | | | |
| | 21,500 | | AT&T, Inc. | | | 534,060 | |
| |
3.00% ENERGY | | | | |
| | 93,793 | | USEC, Inc. * | | | 498,979 | |
| | | | | | | | |
| TOTAL COMMON STOCK 90.41% | | | 15,004,926 | |
(cost $19,544,643) | | | | | | |
| | | |
| | | Principal Amount ($) | | | | | |
| SHORT-TERM INVESTMENTS 9.59% | | | | |
| | 1,592,194 | | PNC Bank Money Market Account, 0.05%(1) | | | 1,592,194 | |
(cost $1,592,194) | | | | | | |
| | | | | | | | |
| TOTAL INVESTMENTS 100.00% | | | 16,597,120 | |
(cost $21,136,837) | | | | | | |
| |
| LIABILITES LESS OTHER ASSETS (0.00%) | | | (53 | ) |
| | | | | | | | |
| NET ASSETS 100.00% | | $ | 16,597,067 | |
| | | | | | | | |
| * | | Non-income producing securities |
| (1) | | Represents current yield at June 30, 2009. |
See notes to the financial statements.
8
The Torray Institutional Fund
STATEMENT OF ASSETS AND LIABILITIES
As of June 30, 2009 (unaudited)
| | | | |
ASSETS | | | | |
Investments in securities at value
(cost $21,136,837) | | $ | 16,597,120 | |
Interest and dividends receivable | | | 25,674 | |
| | | | |
TOTAL ASSETS | | | 16,622,794 | |
| | | | |
| |
LIABILITIES | | | | |
Payable for fund shares redeemed | | | 14,134 | |
Payable to advisor | | | 11,593 | |
| | | | |
TOTAL LIABILITIES | | | 25,727 | |
| | | | |
| |
NET ASSETS | | $ | 16,597,067 | |
| | | | |
Shares of beneficial interest ($1 stated value,
331,684 shares outstanding, unlimited
shares authorized) | | $ | 331,684 | |
Paid-in-capital in excess of par | | | 25,970,721 | |
Accumulated undistributed net investment income | | | 160 | |
Accumulated net realized loss on investments | | | (5,165,781 | ) |
Net unrealized depreciation of investments | | | (4,539,717 | ) |
| | | | |
| |
TOTAL NET ASSETS | | $ | 16,597,067 | |
| | | | |
Net Asset Value, Offering and Redemption Price Per Share | | $ | 50.04 | |
| | | | |
See notes to the financial statements.
9
The Torray Institutional Fund
STATEMENT OF OPERATIONS
For the six months ended June 30, 2009 (unaudited)
| | | | |
INVESTMENT INCOME | | | | |
Dividend income | | $ | 188,267 | |
Interest income | | | 171 | |
| | | | |
Total income | | | 188,438 | |
| | | | |
| |
EXPENSES | | | | |
Management fees | | | 67,989 | |
| | | | |
Total expenses | | | 67,989 | |
| | | | |
NET INVESTMENT INCOME | | | 120,449 | |
| | | | |
REALIZED AND UNREALIZED GAIN (LOSS)
ON INVESTMENTS | | | | |
Net realized loss on investments | | | (1,788,975 | ) |
Net change in unrealized appreciation (depreciation) on investments | | | 1,887,702 | |
| | | | |
Net realized and unrealized gain on investments | | | 98,727 | |
| | | | |
NET INCREASE IN NET ASSETS FROM OPERATIONS | | $ | 219,176 | |
| | | | |
See notes to the financial statements.
10
The Torray Institutional Fund
STATEMENTS OF CHANGES IN NET ASSETS
For the periods indicated:
| | | | | | | | |
| | | Six months ended
06/30/09
(unaudited) | | | Year ended
12/31/08 | |
Increase (Decrease) in Net Assets from Operations: | | | | | | | | |
Net investment income | | $ | 120,449 | | | $ | 324,302 | |
Net realized loss on investments | | | (1,788,975 | ) | | | (2,874,312 | ) |
Net change in unrealized appreciation
(depreciation) on investments | | | 1,887,702 | | | | (10,021,539 | ) |
| | | | | | | | |
Net increase (decrease) in net assets from operations | | | 219,176 | | | | (12,571,549 | ) |
| | | | | | | | |
| | |
Distributions to Shareholders from: | | | | | | | | |
Net investment income ($0.354 and
$0.770 per share, respectively) | | | (120,289 | ) | | | (325,807 | ) |
Net realized gains ($0.000 and $1.889 per
share, respectively) | | | — | | | | (806,861 | ) |
Return of Capital ($0.000 and $0.092 per
share, respectively) | | | — | | | | (39,970 | ) |
| | | | | | | | |
Total distributions | | | (120,289 | ) | | | (1,172,638 | ) |
| | | | | | | | |
| | |
Shares of Beneficial Interest | | | | | | | | |
Decrease from share transactions | | | (1,195,248 | ) | | | (15,250,909 | ) |
| | | | | | | | |
Total decrease | | | (1,096,361 | ) | | | (28,995,096 | ) |
| | |
Net Assets — Beginning of Period | | | 17,693,428 | | | | 46,688,524 | |
| | | | | | | | |
Net Assets — End of Period | | $ | 16,597,067 | | | $ | 17,693,428 | |
| | | | | | | | |
Undistributed Net Investment Income | | $ | 160 | | | $ | — | |
| | | | | | | | |
See notes to the financial statements.
11
The Torray Institutional Fund
FINANCIAL HIGHLIGHTS
For a share outstanding throughout each period presented:
PER SHARE DATA
| | | | | | | | | | | | | | | | | | | | | | | | |
| | | Six months
ended
06/30/09
(unaudited) | | | Years ended December 31: | |
| | | | 2008 | | | 2007 | | | 2006 | | | 2005 | | | 2004 | |
Net Asset Value,
Beginning of Period | | $ | 49.400 | | | $ | 80.800 | | | $ | 108.640 | | | $ | 111.920 | | | $ | 116.290 | | | $ | 110.520 | |
| | | | | | | | | | | | | | | | | | | | | | | | |
Income/(loss) from investment operations: | | | | | | | | | | | | | | | | | | | | | | | | |
Net investment income | | | 0.350 | (3) | | | 0.687 | (3) | | | 0.896 | | | | 0.720 | | | | 0.616 | | | | 0.588 | |
Net gains (losses) on securities (both realized and unrealized) | | | 0.644 | | | | (29.336 | ) | | | (4.074 | ) | | | 11.587 | | | | 0.748 | (2) | | | 7.025 | |
| | | | | | | | | | | | | | | | | | | | | | | | |
Total from investment operations | | | 0.994 | | | | (28.649 | ) | | | (3.178 | ) | | | 12.307 | | | | 1.364 | | | | 7.613 | |
| | | | | | | | | | | | | | | | | | | | | | | | |
Less: distributions | | | | | | | | | | | | | | | | | | | | | | | | |
Dividends (from net investment
income) | | | (0.354 | ) | | | (0.770 | ) | | | (0.716 | ) | | | (0.790 | ) | | | (0.616 | ) | | | (0.588 | ) |
Distributions (from capital gains) | | | — | | | | (1.889 | ) | | | (23.946 | ) | | | (14.797 | ) | | | (5.118 | ) | | | (1.255 | ) |
Distributions (from return of capital) | | | — | | | | (0.092 | ) | | | — | | | | — | | | | — | | | | — | |
| | | | | | | | | | | | | | | | | | | | | | | | |
Total distributions | | | (0.354 | ) | | | (2.751 | ) | | | (24.662 | ) | | | (15.587 | ) | | | (5.734 | ) | | | (1.843 | ) |
| | | | | | | | | | | | | | | | | | | | | | | | |
Net Asset Value,
End of Period | | $ | 50.040 | | | $ | 49.400 | | | $ | 80.800 | | | $ | 108.640 | | | $ | 111.920 | | | $ | 116.290 | |
| | | | | | | | | | | | | | | | | | | | | | | | |
TOTAL RETURN(1) | | | 2.07 | %** | | | (36.24 | %) | | | (3.01 | %) | | | 11.40 | % | | | 1.28 | % | | | 6.96 | % |
RATIOS/SUPPLEMENTAL DATA | | | | | | | | | | | | | | | | | | | | | | | | |
Net assets, end of period
(000’s omitted) | | $ | 16,597 | | | $ | 17,693 | | | $ | 46,689 | | | $ | 205,851 | | | $ | 400,665 | | | $ | 1,012,566 | |
Ratios of expenses to average net
assets | | | 0.85 | %* | | | 0.85 | % | | | 0.85 | % | | | 0.85 | % | | | 0.85 | % | | | 0.85 | % |
Ratios of net investment income to
average net assets | | | 1.51 | %* | | | 1.00 | % | | | 0.66 | % | | | 0.60 | % | | | 0.59 | % | | | 0.56 | % |
Portfolio turnover rate | | | 16.14 | %** | | | 32.00 | % | | | 44.32 | % | | | 24.26 | % | | | 53.66 | % | | | 16.12 | % |
| (1) | | Past performance is not predictive of future performance. |
| (2) | | The amount shown for the year ended December 31, 2005 for a share outstanding throughout the year does not accord with the aggregate net losses on investments reported in the statement of operations for the year because of the timing of sales and repurchases of Fund shares in relation to fluctuating market value of the investments of the Fund. |
| (3) | | Calculated based on the average amount of shares outstanding during the period. |
See notes to the financial statements.
12
The Torray Institutional Fund
NOTES TO FINANCIAL STATEMENTS
As of June 30, 2009 (unaudited)
NOTE 1 — SUMMARY OF SIGNIFICANT ACCOUNTING POLICIES
The Torray Institutional Fund (“Fund”) is a separate series of The Torray Fund (“Trust”). The Trust is registered under the Investment Company Act of 1940, as amended, as a no-load, diversified, open-end management investment company. The Trust was organized as a business trust under Massachusetts law and the Fund commenced operations on June 30, 2001. The Fund’s primary investment objective is to provide long-term total return. The Fund seeks to meet its objective by investing its assets in a diversified portfolio of common stocks. In order to accomplish these goals, the Fund intends to hold stocks for the long term, as opposed to actively buying and selling. There can be no assurances that the Fund’s investment objectives will be achieved.
The following is a summary of accounting policies followed by the Fund in the preparation of its financial statements. These policies are in conformity with accounting principles generally accepted in the United States of America.
Securities Valuation Portfolio securities for which market quotations are readily available are valued at market value, which is determined by using the last reported sale price, or, if no sales are reported, the last reported bid price. For NASDAQ traded securities, market value is determined on the basis of the NASDAQ official closing price instead of the last reported sales price. Other assets and securities for which no quotations are readily available or for which Torray LLC (the “Advisor”) believes do not reflect market value are valued at fair value as determined in good faith by the Advisor under the supervision of the Board of Trustees (the “Board” or “Trustees”) in accordance with the Fund’s Valuation Procedures. Short-term obligations having remaining maturities of 60 days or less are valued at amortized cost, which approximates market value.
Statement of Financial Accounting Standards No. 157 “Fair Value Measurements” (“FAS 157”) This standard clarifies the definition of fair value for financial reporting, establishes a framework for measuring fair value and requires additional disclosures about the use of fair value measurements. The three levels of the fair value hierarchy under FAS 157 are described below:
| | • | | Level 1 — quoted prices in active markets for identical securities |
| | • | | Level 2 — other significant observable inputs (including quoted prices for similar securities, interest rates, prepayment speeds, credit risk, etc.) |
| | • | | Level 3 — significant unobservable inputs (including the Fund’s own assumptions in determining the fair value of investments) |
The inputs or methodology used for valuing securities are not necessarily an indication of the risk associated with investing in those securities.
13
The Torray Institutional Fund
NOTES TO FINANCIAL STATEMENTS (continued)
As of June 30, 2009 (unaudited)
The summary of inputs used to value the Fund’s net assets as of June 30, 2009 is as follows:
| | | |
Valuation Inputs | | | |
Level 1 — Quoted Prices * | | $ | 16,597,120 |
Level 2 — Other Significant Observable Inputs | | | — |
Level 3 — Significant Unobservable Inputs | | | — |
| | | |
Total Market Value of Investments | | $ | 16,597,120 |
| | | |
| * | | Security types and industry classifications as defined in the Schedule of Investments |
Securities Transactions and Investment Income Securities transactions are recorded on a trade date basis. Realized gains and losses from securities transactions are recorded on the specific identification basis. Dividend income and distributions to shareholders are recorded on the ex-dividend date. Interest income, including amortization of discount on short-term investments, and expenses are recorded on the accrual basis. Premium and discount are amortized using the effective yield to maturity method.
Federal Income Taxes The Fund intends to continue to comply with the requirements of the Internal Revenue Code applicable to regulated investment companies and to distribute all of its taxable income, including any net realized gain on investments to its shareholders. Therefore, no Federal income tax provision is required.
Management has analyzed the Fund’s tax positions taken on federal income tax returns for all open tax years (current and prior three tax years), and has concluded that no provision for federal income tax is required in the Fund’s financial statements. The Fund’s federal and state income and federal excise tax returns for tax years for which the applicable statutes of limitations have not expired are subject to examination by the Internal Revenue Service and state departments of revenue.
Net Asset Value The net asset value per share of the Fund is determined daily as of the close of trading on the New York Stock Exchange by dividing the value of the Fund’s net assets by the number of shares outstanding.
Interest Expense When cash balances are overdrawn in the Fund’s custody account, the Fund is charged an overdraft fee equal to 1.25% above the Federal Funds Rate. Such overdraft fees are paid by the Advisor under the comprehensive management fee arrangement described in Note 4. In addition, in December 2006, the Trust entered into a line of credit facility with PNC Bank. Under the terms of the line of credit, the separate series of the Trust (including the Fund) may borrow up to $20,000,000 on a short-term basis with interest accruing at the Federal Funds Rate plus 0.75%. Any interest expense on the line of credit is paid by the Advisor under the comprehensive management fee arrangement described in Note 4. As of June 30, 2009, the Fund had no outstanding borrowings under this line of credit facility.
Use of Estimates In preparing financial statements in accordance with accounting principles generally accepted in the United States of America, management is required to make estimates and assumptions that affect the
14
The Torray Institutional Fund
NOTES TO FINANCIAL STATEMENTS (continued)
As of June 30, 2009 (unaudited)
reported amounts of assets and liabilities and the disclosure of contingent assets and liabilities at the date of the financial statements, and the reported amounts of increases and decreases in net assets from operations during the reporting period. Actual results could differ from those estimates.
NOTE 2 — SHARES OF BENEFICIAL INTEREST TRANSACTIONS
Transactions in shares of beneficial interest were as follows:
| | | | | | | | | | | | | | |
| | | Six months ended
06/30/09 | | | Year ended
12/31/08 | |
| | | Shares | | | Amount | | | Shares | | | Amount | |
Shares issued | | 5,744 | | | $ | 259,016 | | | 28,742 | | | $ | 2,018,803 | |
Reinvestments of dividends and distributions | | 2,586 | | | | 120,057 | | | 17,899 | | | | 1,169,772 | |
Shares redeemed | | (34,789 | ) | | | (1,574,321 | ) | | (266,338 | ) | | | (18,439,484 | ) |
| | | | | | | | | | | | | | |
| | (26,459 | ) | | $ | (1,195,248 | ) | | (219,697 | ) | | $ | (15,250,909 | ) |
| | | | | | | | | | | | | | |
As of June 30, 2009, the Trust’s officers, Trustees and affiliated persons and their families directly or indirectly controlled 208,241 shares or 62.78% of the Fund.
NOTE 3 — INVESTMENT TRANSACTIONS
Purchases and sales of investment securities, other than short-term investments, for the six months ended June 30, 2009, aggregated $2,360,105 and $2,766,347, respectively.
NOTE 4 — MANAGEMENT FEES
Pursuant to the Management Contract, the Advisor provides investment advisory and administrative services to the Fund. The Fund pays the Advisor a management fee, computed daily and payable monthly at the annual rate of 0.85% of the Fund’s average daily net assets. For the six months ended June 30, 2009, the Fund paid comprehensive management fees of $67,989. The Fund pays the Advisor a single comprehensive management fee which covers all operating expenses of the Fund including the investment advisory and administrative services provided by the Advisor as well as all miscellaneous costs incurred in connection with the ongoing operation of the Fund including transfer agency, custody, professional, and registration fees.
Certain officers and Trustees of the Fund are also officers and/or shareholders of the Advisor.
NOTE 5 — TAX MATTERS
Distributions to shareholders are determined in accordance with United States Federal income tax regulations, which may differ from accounting principles generally accepted in the United States of America.
15
The Torray Institutional Fund
NOTES TO FINANCIAL STATEMENTS (continued)
As of June 30, 2009 (unaudited)
The tax character of distributions paid during the year ended December 31, 2008 was as follows:
| | | |
Distributions paid from: | | | |
Ordinary income | | $ | 1,132,668 |
Long-term capital gain | | | — |
Non-taxable return of capital | | | 39,970 |
| | | |
| | $ | 1,172,638 |
| | | |
The primary difference between book basis and tax basis distributions is differing book and tax treatment of short-term capital gains.
At December 31, 2008 the Torray Institutional Fund had net capital loss carry forward for federal income tax purposes of $342,098, which are available to reduce future required distributions of net capital gains to shareholders through 2016.
At December 31, 2008, the Torray Institutional Fund had deferred post-October losses of $2,666,279.
The following information is based upon the book basis of investment securities as of June 30, 2009:
| | | | | | |
Gross unrealized appreciation | | $ | 580,149 | | | |
Gross unrealized depreciation | | | (5,119,866 | ) | | |
| | | | | | |
Net unrealized depreciation | | $ | (4,539,717 | ) | | |
| | | | | | |
Cost | | $ | 21,136,837 | | | |
| | | | | | |
NOTE 6 — COMMITMENTS AND CONTINGENCIES
The Fund indemnifies its officers and Trustees for certain liabilities that may arise from their performance of their duties to the Fund. Additionally, in the normal course of business, the Fund enters into contracts that contain a variety of representations and warranties, which provide general indemnifications. The Fund’s maximum exposure under these arrangements is unknown, as this would involve future claims that may be made against the Fund that have not yet occurred.
NOTE 7 — SUBSEQUENT EVENTS
Management has evaluated the impact of all subsequent events on the Fund through August 31, 2009, the date the financial statements were issued, and has determined that there were no subsequent events requiring recognition or disclosure in the financial statements.
16
The Torray Institutional Fund
PORTFOLIO HOLDINGS, PROXY VOTING AND PROCEDURES
As of June 30, 2009 (unaudited)
The Fund files its complete schedule of portfolio holdings with the Securities and Exchange Commission (the “Commission”) for the first and third quarters of each fiscal year on Form N-Q. The Fund’s Forms N-Q are available on the Commission’s website at http://www.sec.gov. The Fund’s Form N-Q may be reviewed and copied at the Commission’s Public Reference Room in Washington, D.C. Information on the operation of the Commission’s Public Reference Room may be obtained by calling 1-800-SEC-0330.
A description of the policies and procedures that the Fund uses to determine how to vote proxies relating to portfolio securities is available without charge, upon request, by calling 1-800-443-3036; and on the Commission’s website at http://www.sec.gov.
Information regarding how the Fund voted proxies relating to portfolio securities is available without charge, upon request, by calling 1-800-443-3036; and on the Commission’s website at http://www.sec.gov.
17
The Torray Institutional Fund
ABOUT YOUR FUND’S EXPENSES
As of June 30, 2009 (unaudited)
We believe it is important for you to understand the impact of costs on your investment. All mutual funds have operating expenses. As a shareholder of the Fund, you incur ongoing costs, including management fees, and other Fund expenses. Operating expenses, which are deducted directly from the Fund’s gross income, directly reduce the investment return of the Fund.
A mutual fund’s expenses are expressed as a percentage of its average net assets. This figure is known as the expense ratio. The following examples are intended to help you understand the ongoing costs (in dollars) of investing in the Fund and to compare these costs with the ongoing costs of investing in other mutual funds. The examples below are based on an investment of $1,000 made at the beginning of the period shown and held for the entire period.
The table on the next page illustrates the Fund’s cost in two ways:
Actual Fund Return This section helps you estimate the actual expenses that you paid over the period. The “Ending Account Value” shown is derived from the Fund’s actual return, and the third column shows the operating expenses that would have been paid by an investor who started with $1,000 in the Fund. You may use the information here, together with the amount invested, to estimate the expenses that you paid over the period.
To do so, simply divide your account value by $1,000 (for example, an $8,600 account value divided by $1,000 = 8.6), then multiply the result by the number given for the Fund under the heading “Expenses Paid During Period”on the next page.
Hypothetical 5% Return This section is intended to help you compare your Fund’s costs with those of other mutual funds. It assumes that the Fund had an annual return of 5% before expenses, and that the expense ratio is unchanged. In this case, because the return used is not the Fund’s actual return, the results do not apply to your investment. The example is useful in making comparisons because the Commission requires all mutual funds to calculate expenses based on a 5% return. You can assess the Fund’s costs by comparing this hypothetical example with the hypothetical examples that appear in shareholder reports of other funds.
Note that expenses shown in the table are meant to highlight and help you compare ongoing costs only. The Fund does not charge transactions fees, such as purchase or redemption fees, nor does it carry a “sales load.”
The calculation assumes no shares were bought or sold during the period. Your actual costs may have been higher or lower, depending on the amount of your investment and the timing of any purchases or redemptions.
18
The Torray Institutional Fund
ABOUT YOUR FUND’S EXPENSES (continued)
As of June 30, 2009 (unaudited)
More information about the Fund’s expenses, including recent annual expense ratios, can be found in this report. For additional information on operating expenses and other shareholder costs, please refer to the Fund’s prospectus.
| | | | | | | | | |
| | | Beginning
Account Value
January 1, 2009 | | Ending
Account Value
June 30, 2009 | | Expenses Paid
During Period* |
Based on Actual Fund Return | | $ | 1,000.00 | | $ | 1,020.70 | | $ | 4.26 |
Based on Hypothetical 5% Return
(before expenses) | | $ | 1,000.00 | | $ | 1,020.58 | | $ | 4.26 |
| * | | Expenses are equal to the Fund’s annualized expense ratio of 0.85% for the period, multiplied by the average account value over the period, multiplied by 181/365 (to reflect the one-half year period). |
19
TRUSTEES
Carol Crawford
Bruce C. Ellis
William M Lane
Robert P. Moltz
Wayne H. Shaner
INVESTMENT ADVISOR
Torray LLC
OFFICERS
Robert E. Torray
William M Lane
Fred M. Fialco
Shawn M. Hendon
INDEPENDENT REGISTERED PUBLIC ACCOUNTING FIRM
Briggs, Bunting & Dougherty, LLP
1835 Market Street 26th Floor
Philadelphia, PA 19103
TRANSFER AGENT
PNC Global Investment Servicing (U.S.) Inc.
101 Sabin Street
Pawtucket, RI 02860-1427
LEGAL COUNSEL
Dechert LLP
1775 I Street, N.W.
Washington, DC 20006
Distributed by PFPC Distributors, Inc.
760 Moore Road, King of Prussia, PA 19406-1212
Date of first use, August 2009
This report is not authorized for distribution to
prospective investors unless preceded or accompanied
by a current prospectus. All indices are unmanaged
groupings of stocks that are not available for
investment.
The
TORRAY
INSTITUTIONAL
FUND
SEMI-ANNUAL REPORT
June 30, 2009
The Torray Institutional Fund
Suite 1100
7501 Wisconsin Avenue
Bethesda, Maryland 20814-6523
(301) 493-4600
(800) 443-3036
Item 2. Code of Ethics.
Not applicable.
Item 3. Audit Committee Financial Expert.
Not applicable.
Item 4. Principal Accountant Fees and Services.
Not applicable.
Item 5. Audit Committee of Listed registrants.
Not applicable.
Item 6. Investments.
| (a) | Schedule of Investments in securities of unaffiliated issuers as of the close of the reporting period is included as part of the report to shareholders filed under Item 1 of this form. |
Item 7. Disclosure of Proxy Voting Policies and Procedures for Closed-End Management Investment Companies.
Not applicable.
Item 8. Portfolio Managers of Closed-End Management Investment Companies.
Not applicable.
Item 9. Purchases of Equity Securities by Closed-End Management Investment Company and Affiliated Purchasers.
Not applicable.
Item 10. Submission of Matters to a Vote of Security Holders.
There have been no material changes to the procedures by which the shareholders may recommend nominees to the registrant’s board of directors, where those changes were implemented after the registrant last provided disclosure in response to the requirements of Item 407(c)(2)(iv) of Regulation S-K (17 CFR 229.407) (as required by Item 22(b)(15) of Schedule 14A (17 CFR 240.14a-101)), or this Item.
Item 11. Controls and Procedures.
| | (a) | The registrant’s principal executive and principal financial officers, or persons performing similar functions, have concluded that the registrant’s disclosure controls and procedures (as defined in Rule 30a-3(c) under the Investment Company Act of 1940, as amended (the “1940 Act”) (17 CFR 270.30a-3(c))) are effective, as of a date within 90 days of the filing date of the report that includes the disclosure required by this paragraph, based on their evaluation of these controls and procedures required by Rule 30a-3(b) under the 1940 Act (17 CFR 270.30a-3(b)) and Rules 13a-15(b) or 15d-15(b) under the Securities Exchange Act of 1934, as amended (17 CFR 240.13a-15(b) or 240.15d-15(b)). |
| | (b) | There were no changes in the registrant’s internal control over financial reporting (as defined in Rule 30a-3(d) under the 1940 Act (17 CFR 270.30a-3(d)) that occurred during the registrant’s second fiscal quarter of the period covered by this report that has materially affected, or is reasonably likely to materially affect, the registrant’s internal control over financial reporting. |
Item 12. Exhibits.
| | (a)(2) | Certifications pursuant to Rule 30a-2(a) under the 1940 Act and Section 302 of the Sarbanes-Oxley Act of 2002 are attached hereto. |
| | (b) | Certifications pursuant to Rule 30a-2(b) under the 1940 Act and Section 906 of the Sarbanes- Oxley Act of 2002 are attached hereto. |
SIGNATURES
Pursuant to the requirements of the Securities Exchange Act of 1934 and the Investment Company Act of 1940, the registrant has duly caused this report to be signed on its behalf by the undersigned, thereunto duly authorized.
| | | | | | |
| (registrant) | | | | | | The Torray Fund |
| | | | |
| |
| By (Signature and Title)* | | /s/ Robert E. Torray |
| | | | Robert E. Torray, President |
| | | | (principal executive officer) |
Pursuant to the requirements of the Securities Exchange Act of 1934 and the Investment Company Act of 1940, this report has been signed below by the following persons on behalf of the registrant and in the capacities and on the dates indicated.
| | | | |
| By (Signature and Title)* | | /s/ Robert E. Torray |
| | | | Robert E. Torray, President |
| | | | (principal executive officer) |
| | | | |
| By (Signature and Title)* | | /s/ William M Lane |
| | | | William M Lane, Treasurer |
| | | | (principal financial officer) |
| * | Print the name and title of each signing officer under his or her signature. |