UNITED STATES
SECURITIES AND EXCHANGE COMMISSION
Washington, D.C. 20549
FORM N-CSR
CERTIFIED SHAREHOLDER REPORT OF REGISTERED
MANAGEMENT INVESTMENT COMPANIES
| | |
| Investment Company Act file number 811-06096 | | |
The Torray Fund
(Exact name of registrant as specified in charter)
7501 Wisconsin Avenue, Suite 1100
Bethesda, MD 20814-6523
(Address of principal executive offices) (Zip code)
William M Lane
Torray LLC
7501 Wisconsin Avenue, Suite 1100
Bethesda, MD 20814-6523
(Name and address of agent for service)
Registrant’s telephone number, including area code: 301-493-4600
Date of fiscal year end: December 31
Date of reporting period: June 30, 2011
| Item 1. | Reports to Stockholders. |
The Report to Shareholders is attached herewith.
The Torray Fund
Letter to Shareholders
July 26, 2011
Dear Fellow Shareholders,
We are pleased to report The Torray Fund gained 9.9% during the six-month period ending June 30, compared to 6% for the Standard & Poor’s 500 Index. By coincidence, this result matches our 9.9% annual return since its inception over 20 years ago, multiplying an original investment nearly seven times. In addition, the Fund has doubled since the market bottomed in early 2009 and posted positive returns for the last one, three, five and 10 years.
We feel particularly fortunate about this outcome given the ravages of two recessions and two of the most brutal bear markets in history. When the first downturn began in March of 2000, the S&P Index was around 1500, having advanced sharply in a wildly speculative binge over the previous two years. Today, 11 years later, and after a second collapse in 2008, with dividends reinvested, it is only slightly higher than it was back then. There is an important difference, however. Corporate earnings have nearly doubled, cutting the Index’s price earnings ratio in half. It now stands at a significant discount to its average multiple dating back 85 years to 1926. Despite the current seemingly endless list of global problems, we are convinced that quality U.S. companies offer compelling value for long-term investors.
As noted in our 2010 Annual Report, the fallout from this confidence-shattering decade has prompted a number of so-called “experts” to declare long-term investing dead. In its place, they recommend actively trading stocks, options, commodities, exchange traded funds, and so on. We continue to think this is bad advice. Over the last 70 years, our country has endured incredible challenges — World War II, Korea, Vietnam, Iraq, Afghanistan, the Russian debt default, recessions, the World Trade Center tragedy, stock market panics and crashes, financial industry bankruptcies and the sub-prime mortgage and real estate collapses. We suspect the average person, if asked how they thought stocks did in the face of all this, would probably answer, “terrible.”
Thanks to Ned Davis Research, Inc., a well-respected independent firm, we can report otherwise: during the same 70-year period, the S&P 500 with dividends reinvested returned 11.2% compounded, turning $100 into $168,785. By comparison, Treasury bonds yielded an average 5.6%, producing only $4,534. Yet investors persist in buying bonds at yields that have been falling for 30 years and now stand at historic lows. Meanwhile, the economy and financial system are on the mend, and earnings and dividends are heading up. Twenty-six of our 31 holdings have increased dividends over the past year, and 10 of them have done so for 25
1
The Torray Fund
Letter to Shareholders (continued)
July 26, 2011
straight years. (The portfolio’s yield is about one percentage point above the return on five-year government bonds.) In addition, analysts project the earnings of these companies, as a group, will grow 10% a year for the next five years. While we are highly skeptical of such forecasts, the long operating histories, competitive strengths and sound finances of these businesses make us confident there is potential for meaningful growth along with dividend increases.
However, none of this will matter if investors aren’t on board for the ride. On that note, we have recently analyzed The Torray Fund’s accounting of share purchases and redemptions. The disheartening results confirmed our sense that despite 40 shareholder letters urging investors to stay the course, money has poured in when stock prices were rising and then out just as fast when they fell. The largest sums came in during the late stages of the 1998 speculative boom. These inflows were almost surely a response to media accounts of the 21% per year returns our Fund posted over the preceding eight years, multiplying an initial investment 4½ times. We also found the ins and outs tended to track our shorter-term investment performance relative to market averages and that of other funds.
The eight-year record referenced above was totally unsustainable, and we said so in our 1998 Annual Report, pointing out that $50,000 earning 21% a year would grow to $10 trillion in a century, roughly equal to the stock market’s entire value at the time. Ironically, this was also the year of our largest redemptions. In this case it seems likely departing shareholders were attracted to other funds heavily concentrated in the vastly inflated stocks that drove the Index up 29% that year. We owned none of them. When the market collapsed a few years later, the S&P and NASDAQ sank 38% and 67%, respectively. Our Fund’s loss was 16%.
Finally, in 2008, stocks were decimated again, causing another round of redemptions across the fund industry. The proceeds flooded into banks, money market funds and bonds where they remain today, indicating the shock has still not worn off. Investors so-positioned and approaching retirement are facing an uphill battle trying to recover the wealth they’ve lost. By contrast, Torray Fund shareholders that held on have recouped their losses and, in our opinion, are well-situated to benefit from the market’s historically conservative valuation.
Having said this, the financial uncertainties plaguing the world’s economy are serious, and we do not by any means discount them. Turmoil in the credit markets is only the latest manifestation of today’s mind-numbing worries. Against this backdrop, we feel it is particularly important to invest only in first-rate businesses or mutual funds that own them. As always, our
2
The Torray Fund
Letter to Shareholders (continued)
July 26, 2011
focus is on containing risk as best we can, and achieving a combination of earnings growth and dividends that will produce reasonable returns for you in the years ahead. Although there is no way to know what those returns will be, we believe they will compare favorably to the alternatives.
We appreciate your continued confidence and trust in our management.
| | | | | | |
| | Sincerely, | | | | |
| | | |
| |  | | | | |
| | Robert E. Torray | | | | |
| | 
| | | | |
| | Fred M. Fialco | | | | |
| | 
| | | | |
| | Shawn M. Hendon | | | | |
| | | | | | |
3
The Torray Fund
PERFORMANCE DATA
As of June 30, 2011 (unaudited)
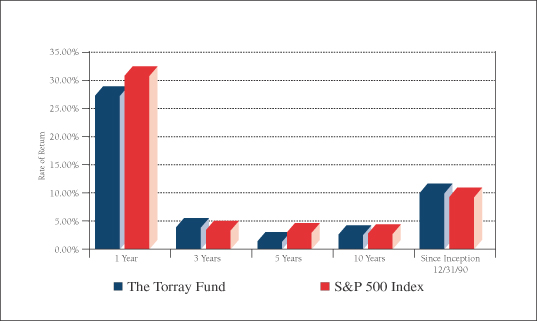
Average Annual Returns on an Investment in
The Torray Fund vs. the S&P 500 Index
For the periods ended June 30, 2011:
| | | | | | | | | | | | | | | | | | | | |
| | | 1 Year | | | 3 Years | | | 5 Years | | | 10 Years | | | Since
Inception
12/31/90 | |
The Torray Fund | | | 27.18 | % | | | 3.83 | % | | | 1.35 | % | | | 2.55 | % | | | 9.90 | % |
S&P 500 Index | | | 30.69 | % | | | 3.34 | % | | | 2.94 | % | | | 2.72 | % | | | 9.22 | % |
Cumulative Returns for the 20 1/2 Years Ended June 30, 2011
| | | | |
The Torray Fund | | | 592.80 | % |
S&P 500 Index | | | 509.62 | % |
4
The Torray Fund
PERFORMANCE DATA (continued)
As of June 30, 2011 (unaudited)
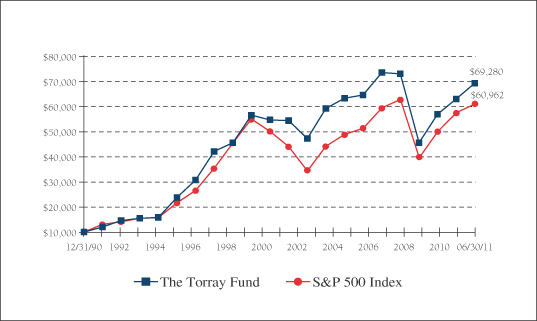
Change in Value of $10,000 Invested
on December 31, 1990 (commencement of operations) to:
| | | | | | | | | | | | | | | | | | | | | | | | | | | | |
| | | 12/31/93 | | | 12/31/96 | | | 12/31/99 | | | 12/31/02 | | | 12/31/05 | | | 12/31/08 | | | 06/30/11 | |
The Torray Fund | | $ | 15,448 | | | $ | 30,719 | | | $ | 56,519 | | | $ | 47,236 | | | $ | 64,542 | | | $ | 45,598 | | | $ | 69,280 | |
S&P 500 Index | | $ | 15,465 | | | $ | 26,499 | | | $ | 54,998 | | | $ | 34,318 | | | $ | 51,319 | | | $ | 39,511 | | | $ | 60,962 | |
The returns quoted represent past performance and do not guarantee future results. Investment return and principal value will fluctuate so that shares, when redeemed, may be worth more or less than their original cost. Current performance may be lower or higher. For performance current to the most recent month end, please call (800) 626-9769. The returns shown do not reflect the deduction of taxes a shareholder would pay on the redemption of fund shares and distributions. The Fund’s gross annual operating expense ratio, as stated in the current prospectus, is 1.17%. Returns on both The Torray Fund and the S&P 500 Index assume reinvestment of all dividends and distributions. The S&P 500 Index is an unmanaged index consisting of 500 U.S. large-cap stocks.
5
The Torray Fund
FUND PROFILE
As of June 30, 2011 (unaudited)
| | | | |
DIVERSIFICATION (% of net assets) | | | | |
| |
Information Technology | | | 20.36% | |
Health Care | | | 18.96% | |
Financials | | | 16.65% | |
Consumer Staples | | | 14.23% | |
Industrials | | | 12.05% | |
Consumer Discretionary | | | 5.22% | |
Telecommunications | | | 3.61% | |
Materials | | | 2.91% | |
Short-Term Investments | | | 5.89% | |
Other Assets Less Liabilities | | | 0.12% | |
| | | | |
| | | 100.00% | |
| | | | |
| | | | | | | | |
| TOP TEN EQUITY HOLDINGS (% of net assets) | |
| | |
| | 1. | | | Marsh & McLennan Cos., Inc. | | | 3.82% | |
| | 2. | | | Loews Corp. | | | 3.79% | |
| | 3. | | | AT&T Inc. | | | 3.61% | |
| | 4. | | | Johnson & Johnson | | | 3.42% | |
| | 5. | | | Western Union Co. (The) | | | 3.39% | |
| | 6. | | | WellPoint, Inc. | | | 3.31% | |
| | 7. | | | Cintas Corp. | | | 3.29% | |
| | 8. | | | Colgate-Palmolive Co. | | | 3.28% | |
| | 9. | | | Kraft Foods Inc., Class A | | | 3.27% | |
| | 10. | | | UnitedHealth Group Inc. | | | 3.22% | |
| | | | | | | | |
| | | | | | | 34.40% | |
| | | | | | | | |
| | | | | | | | |
PORTFOLIO CHARACTERISTICS | | | | | |
| | |
Net Assets (million) | | | | | | | $373 | |
Number of Holdings | | | | | | | 31 | |
Portfolio Turnover | | | | | | | 8.80% | * |
P/E Multiple (forward) | | | | | | | 12.9x | |
Portfolio Yield | | | | | | | 2.13% | |
Market Capitalization (billion) | | | Average | | | | $69.1 | |
| | | Median | | | | $50.2 | |
6
The Torray Fund
SCHEDULE OF INVESTMENTS
As of June 30, 2011 (unaudited)
| | | | | | | | | | |
| | | Shares | | | | | Market Value | |
| COMMON STOCK 93.99% | | | | |
| |
20.36% INFORMATION TECHNOLOGY | | | | |
| | | 632,100 | | | Western Union Co. (The) | | $ | 12,660,963 | |
| | | 226,500 | | | Automatic Data Processing, Inc. | | | 11,932,020 | |
| | | 66,400 | | | International Business Machines Corp. | | | 11,390,920 | |
| | | 400,000 | | | EMC Corp. * | | | 11,020,000 | |
| | | 635,200 | | | Cisco Systems, Inc. | | | 9,915,472 | |
| | | 264,900 | | | Hewlett-Packard Co. | | | 9,642,360 | |
| | | 424,600 | | | Intel Corp. | | | 9,409,136 | |
| | | | | | | | | | |
| | | | | | | | | 75,970,871 | |
| |
18.96% HEALTH CARE | | | | |
| | | 191,724 | | | Johnson & Johnson | | | 12,753,481 | |
| | | 157,000 | | | WellPoint, Inc. | | | 12,366,890 | |
| | | 232,800 | | | UnitedHealth Group Inc. | | | 12,007,824 | |
| | | 133,700 | | | Becton Dickinson & Co. | | | 11,520,929 | |
| | | 190,700 | | | Baxter International Inc. | | | 11,382,883 | |
| | | 203,800 | | | Abbott Laboratories | | | 10,723,956 | |
| | | | | | | | | | |
| | | | | | | | | 70,755,963 | |
| |
16.65% FINANCIALS | | | | |
| | | 456,518 | | | Marsh & McLennan Cos., Inc. | | | 14,238,796 | |
| | | 336,400 | | | Loews Corp. | | | 14,159,076 | |
| | | 187,200 | | | Chubb Corp. | | | 11,720,592 | |
| | | 219,300 | | | American Express Co. | | | 11,337,810 | |
| | | 380,500 | | | Wells Fargo & Co. | | | 10,676,830 | |
| | | | | | | | | | |
| | | | | | | | | 62,133,104 | |
| |
14.23% CONSUMER STAPLES | | | | |
| | | 140,000 | | | Colgate-Palmolive Co. | | | 12,237,400 | |
| | | 346,400 | | | Kraft Foods Inc., Class A | | | 12,203,672 | |
| | | 233,100 | | | Walgreen Co. | | | 9,897,426 | |
| | | 314,400 | | | Sysco Corp. | | | 9,802,992 | |
| | | 141,300 | | | Procter & Gamble Co. (The) | | | 8,982,441 | |
| | | | | | | | | | |
| | | | | | | | | 53,123,931 | |
7
The Torray Fund
SCHEDULE OF INVESTMENTS (continued)
As of June 30, 2011 (unaudited)
| | | | | | | | | | |
| | | Shares | | | | | Market Value | |
| |
12.05% INDUSTRIALS | | | | |
| | | 371,946 | | | Cintas Corp. | | $ | 12,285,376 | |
| | | 603,797 | | | General Electric Co. | | | 11,387,612 | |
| | | 118,900 | | | 3M Co. | | | 11,277,665 | |
| | | 134,700 | | | General Dynamics Corp. | | | 10,037,844 | |
| | | | | | | | | | |
| | | | | | | | | 44,988,497 | |
| |
5.22% CONSUMER DISCRETIONARY | | | | |
| | | 273,600 | | | McGraw-Hill Cos. Inc. (The) | | | 11,466,576 | |
| | | 559,600 | | | Gannett Co., Inc. | | | 8,013,472 | |
| | | | | | | | | | |
| | | | | | | | | 19,480,048 | |
| |
3.61% TELECOMMUNICATIONS | | | | |
| | | 429,300 | | | AT&T Inc. | | | 13,484,313 | |
| |
2.91% MATERIALS | | | | |
| | | 200,900 | | | E.I. du Pont de Nemours & Co. | | | 10,858,645 | |
| | | | | | | | | | |
| TOTAL COMMON STOCK 93.99% | | | 350,795,372 | |
(cost $301,669,177) | | | | | | | |
| | | |
| | | Principal Amount ($) | | | | | | |
| |
| SHORT-TERM INVESTMENTS 5.89% | | | | |
| | | 21,970,269 | | | BNY Mellon Cash Reserve, 0.05%(1) | | | 21,970,269 | |
(cost $21,970,269) | | | | | | | |
| | | | | | | | | | |
| TOTAL INVESTMENTS 99.88% | | | 372,765,641 | |
(cost $323,639,446) | | | | |
| OTHER ASSETS LESS LIABILITIES 0.12% | | | 435,461 | |
| | | | | | | | | | |
| NET ASSETS 100.00% | | $ | 373,201,102 | |
| | | | | | | | | | |
| * | | Non-income producing securities. |
| (1) | | Represents current yield at June 30, 2011. |
See notes to the financial statements.
8
The Torray Fund
STATEMENT OF ASSETS AND LIABILITIES
As of June 30, 2011 (unaudited)
| | | | |
ASSETS | | | | |
Investments in securities at value
(cost $323,639,446) | | $ | 372,765,641 | |
Interest and dividends receivable | | | 636,069 | |
Receivable for fund shares sold | | | 704 | |
Prepaid expenses | | | 58,268 | |
| | | | |
TOTAL ASSETS | | | 373,460,682 | |
| | | | |
| |
LIABILITIES | | | | |
Payable for fund shares redeemed | | | 160,596 | |
Payable for legal fees | | | 39,492 | |
Payable for transfer agent fees & expenses | | | 23,010 | |
Payable for printing, postage & mailing fees | | | 17,700 | |
Payable for audit fees | | | 14,544 | |
Accrued expenses | | | 4,238 | |
| | | | |
TOTAL LIABILITIES | | | 259,580 | |
| | | | |
| |
NET ASSETS | | $ | 373,201,102 | |
| | | | |
Shares of beneficial interest ($1 stated value,
11,599,231 shares outstanding, unlimited
shares authorized) | | $ | 11,599,231 | |
Paid-in-capital in excess of par | | | 397,460,947 | |
Distributions in excess of net investment income | | | (37,793 | ) |
Accumulated net realized loss on investments | | | (84,947,478 | ) |
Net unrealized appreciation of investments | | | 49,126,195 | |
| | | | |
| |
TOTAL NET ASSETS | | $ | 373,201,102 | |
| | | | |
Net Asset Value, Offering and Redemption Price per Share | | $ | 32.17 | |
| | | | |
See notes to the financial statements.
9
The Torray Fund
STATEMENT OF OPERATIONS
For the six months ended June 30, 2011 (unaudited)
| | | | |
INVESTMENT INCOME | | | | |
Dividend income | | $ | 4,044,881 | |
Interest income | | | 4,924 | |
| | | | |
Total investment income | | | 4,049,805 | |
| | | | |
| |
EXPENSES | | | | |
Management fees | | | 1,838,600 | |
Transfer agent fees & expenses | | | 153,736 | |
Legal fees | | | 33,928 | |
Printing, postage & mailing | | | 25,389 | |
Insurance expense | | | 25,217 | |
Audit fees | | | 16,044 | |
Trustees’ fees | | | 15,982 | |
Registration & filing fees | | | 11,757 | |
Custodian fees | | | 9,619 | |
| | | | |
Total expenses | | | 2,130,272 | |
| | | | |
NET INVESTMENT INCOME | | | 1,919,533 | |
| | | | |
REALIZED AND UNREALIZED GAIN ON INVESTMENTS | | | | |
Net realized gain on investments | | | 4,900,119 | |
Net change in unrealized appreciation (depreciation) on investments | | | 28,104,489 | |
| | | | |
Net realized and unrealized gain on investments | | | 33,004,608 | |
| | | | |
NET INCREASE IN NET ASSETS FROM OPERATIONS | | $ | 34,924,141 | |
| | | | |
See notes to the financial statements.
10
The Torray Fund
STATEMENTS OF CHANGES IN NET ASSETS
For the periods indicated:
| | | | | | | | |
| | | Six months ended
06/30/11
(unaudited) | | | Year ended
12/31/10 | |
Increase in Net Assets from Operations: | | | | | | | | |
Net investment income | | $ | 1,919,533 | | | $ | 2,979,395 | |
Net realized gain on investments | | | 4,900,119 | | | | 4,801,831 | |
Net change in unrealized appreciation
(depreciation) on investments | | | 28,104,489 | | | | 29,046,530 | |
| | | | | | | | |
Net increase in net assets from operations | | | 34,924,141 | | | | 36,827,756 | |
| | | | | | | | |
| | |
Distributions to Shareholders from: | | | | | | | | |
Net investment income ($0.167 and
$0.233 per share, respectively) | | | (1,966,158 | ) | | | (2,970,563 | ) |
| | | | | | | | |
Total distributions | | | (1,966,158 | ) | | | (2,970,563 | ) |
| | | | | | | | |
| | |
Shares of Beneficial Interest | | | | | | | | |
Decrease from share transactions | | | (22,165,394 | ) | | | (34,462,230 | ) |
| | | | | | | | |
Total increase (decrease) | | | 10,792,589 | | | | (605,037 | ) |
| | |
Net Assets — Beginning of Period | | | 362,408,513 | | | | 363,013,550 | |
| | | | | | | | |
Net Assets — End of Period | | $ | 373,201,102 | | | $ | 362,408,513 | |
| | | | | | | | |
Distribution in Excess of Net Investment Income and Undistributed Net Investment Income, Respectively | | $ | (37,793 | ) | | $ | 8,832 | |
| | | | | | | | |
See notes to the financial statements.
11
The Torray Fund
FINANCIAL HIGHLIGHTS
For a share outstanding throughout each period presented:
PER SHARE DATA
| | | | | | | | | | | | | | | | | | | | | | | | |
| | | Six months
ended
06/30/11
(unaudited) | | | Years ended December 31: | |
| | |
| | | 2010 | | | 2009 | | | 2008 | | | 2007 | | | 2006 | |
Net Asset Value,
Beginning of Period | | $ | 29.430 | | | $ | 26.760 | | | $ | 21.640 | | | $ | 36.440 | | | $ | 41.570 | | | $ | 39.020 | |
| | | | | | | | | | | | | | | | | | | | | | | | |
Income/(loss) from investment operations | | | | | | | | | | | | | | | | | | | | | | | | |
Net investment income | | | 0.161 | (2) | | | 0.230 | (2) | | | 0.200 | (2) | | | 0.243 | (2) | | | 0.152 | | | | 0.073 | |
Net gains (losses) on securities (both realized and unrealized) | | | 2.746 | | | | 2.673 | | | | 5.124 | | | | (13.464 | ) | | | (0.443 | ) | | | 5.176 | |
| | | | | | | | | | | | | | | | | | | | | | | | |
Total from investment operations | | | 2.907 | | | | 2.903 | | | | 5.324 | | | | (13.221 | ) | | | (0.291 | ) | | | 5.249 | |
| | | | | | | | | | | | | | | | | | | | | | | | |
Less: distributions | | | | | | | | | | | | | | | | | | | | | | | | |
Dividends (from net investment
income) | | | (0.167 | ) | | | (0.233 | ) | | | (0.204 | ) | | | (0.303 | ) | | | (0.121 | ) | | | (0.087 | ) |
Distributions (from capital gains) | | | — | | | | — | | | | — | | | | (1.242 | ) | | | (4.718 | ) | | | (2.612 | ) |
Distributions (from return of capital) | | | — | | | | — | | | | — | | | | (0.034 | ) | | | — | | | | — | |
| | | | | | | | | | | | | | | | | | | | | | | | |
Total distributions | | | (0.167 | ) | | | (0.233 | ) | | | (0.204 | ) | | | (1.579 | ) | | | (4.839 | ) | | | (2.699 | ) |
| | | | | | | | | | | | | | | | | | | | | | | | |
Net Asset Value,
End of Period | | $ | 32.170 | | | $ | 29.430 | | | $ | 26.760 | | | $ | 21.640 | | | $ | 36.440 | | | $ | 41.570 | |
| | | | | | | | | | | | | | | | | | | | | | | | |
TOTAL RETURN(1) | | | 9.90 | %** | | | 10.90 | % | | | 24.80 | % | | | (37.39 | %) | | | (0.80 | %) | | | 13.74 | % |
RATIOS/SUPPLEMENTAL DATA | | | | | | | | | | | | | | | | | | | | | | | | |
Net assets, end of period
(000’s omitted) | | $ | 373,201 | | | $ | 362,409 | | | $ | 363,014 | | | $ | 353,445 | | | $ | 1,000,344 | | | $ | 1,198,919 | |
Ratios of expenses to average net
assets | | | 1.16 | %* | | | 1.17 | % | | | 1.21 | % | | | 1.13 | % | | | 1.09 | % | | | 1.10 | % |
Ratios of net investment income to average net assets | | | 1.04 | %* | | | 0.84 | % | | | 0.89 | % | | | 0.80 | % | | | 0.36 | % | | | 0.18 | % |
Portfolio turnover rate | | | 8.80 | %** | | | 14.42 | % | | | 15.87 | % | | | 28.13 | % | | | 50.47 | % | | | 21.92 | % |
| (1) | | Past performance is not predictive of future performance. |
| (2) | | Calculated based on the average amount of shares outstanding during the period. |
See notes to the financial statements.
12
The Torray Fund
NOTES TO FINANCIAL STATEMENTS
As of June 30, 2011 (unaudited)
NOTE 1 — SUMMARY OF SIGNIFICANT ACCOUNTING POLICIES
The Torray Fund (“Fund”) is a separate series of The Torray Fund (“Trust”). The Trust is registered under the Investment Company Act of 1940, as amended, as a no-load, diversified, open-end management investment company. The Trust was organized as a business trust under Massachusetts law and the Fund commenced operations on December 31, 1990. The Fund’s primary investment objective is to build investor wealth over extended periods and to minimize shareholder capital gains tax liability by limiting the realization of long and short-term gains. The Fund seeks to meet its objective by investing its assets in a diversified portfolio of common stocks. In order to accomplish these goals, the Fund intends to hold stocks for the long term, as opposed to actively buying and selling. There can be no assurances that the Fund’s investment objectives will be achieved.
The following is a summary of accounting policies followed by the Fund in the preparation of its financial statements. These policies are in conformity with accounting principles generally accepted in the United States of America.
Securities Valuation Portfolio securities for which market quotations are readily available are valued at market value, which is determined by using the last reported sale price, or, if no sales are reported, the last reported bid price. For NASDAQ traded securities, market value is determined on the basis of the NASDAQ Official Closing Price instead of the last reported sales price. Other assets and securities for which no quotations are readily available or for which Torray LLC (the “Advisor”) believes do not reflect market value are valued at fair value as determined in good faith by the Advisor under the supervision of the Board of Trustees (the “Board” or “Trustees”) in accordance with the Fund’s Valuation Procedures. Short-term obligations having remaining maturities of 60 days or less are valued at amortized cost, which approximates market value.
Fair Value Measurements Various inputs are used in determining the fair value of investments which are as follows:
| | • | | Level 1 — quoted prices in active markets for identical securities |
| | • | | Level 2 — significant observable inputs (including quoted prices for similar securities, interest rates, prepayment speeds, credit risk, etc.) |
| | • | | Level 3 — significant unobservable inputs (including the Fund’s own assumptions in determining the fair value of investments) |
The inputs or methodology used for valuing securities are not necessarily an indication of the risk associated with investing in those securities.
13
The Torray Fund
NOTES TO FINANCIAL STATEMENTS (continued)
As of June 30, 2011 (unaudited)
The summary of inputs used to value the Fund’s investments as of June 30, 2011 is as follows:
| | | | |
Valuation Inputs | | | | |
Level 1 — Quoted Prices * | | $ | 372,765,641 | |
Level 2 — Other Significant Observable Inputs | | | — | |
Level 3 — Significant Unobservable Inputs | | | — | |
| | | | |
Total Market Value of Investments | | $ | 372,765,641 | |
| | | | |
| * | | Security types and industry classifications as defined in the Schedule of Investments. |
The Fund did not have significant transfers between Level 1 and Level 2 investments during the period.
Securities Transactions and Investment Income Securities transactions are recorded on a trade date basis. Realized gains and losses from securities transactions are recorded on the specific identification basis. Dividend income and distributions to shareholders are recorded on the ex-dividend date. Interest income, including amortization of discount on short-term investments, and expenses are recorded on the accrual basis. Premium and discount are amortized using the effective yield to maturity method.
Federal Income Taxes The Fund intends to continue to comply with the requirements of the Internal Revenue Code applicable to regulated investment companies and to distribute all of its taxable income, including any net realized gain on investments to its shareholders. Therefore, no Federal income tax provision is required.
Management has analyzed the Fund’s tax positions taken on federal income tax returns for all open tax years (current and prior three tax years), and has concluded that no provision for federal income tax is required in the Fund’s financial statements. The Fund’s federal and state income and federal excise tax returns for tax years for which the applicable statutes of limitations have not expired are subject to examination by the Internal Revenue Service and state departments of revenue.
Net Asset Value The net asset value per share of the Fund is determined daily as of the close of trading on the New York Stock Exchange by dividing the value of the Fund’s net assets by the number of shares outstanding.
Interest Expense When cash balances are overdrawn in the Fund’s custody account, the Fund is charged an overdraft fee equal to 1.25% above the Federal Funds Rate. The Trust has entered into a line of credit facility with PNC Bank. Under the terms of the line of credit, the separate series of the Trust (including the Fund) may borrow up to $20,000,000 on a short-term basis with interest accruing at the Federal Funds Rate plus 0.75%. As of June 30, 2011, the Fund had no outstanding borrowings under this line of credit facility.
14
The Torray Fund
NOTES TO FINANCIAL STATEMENTS (continued)
As of June 30, 2011 (unaudited)
Use of Estimates In preparing financial statements in accordance with accounting principles generally accepted in the United States of America, management is required to make estimates and assumptions that affect the reported amounts of assets and liabilities and the disclosure of contingent assets and liabilities at the date of the financial statements, and the reported amounts of increases and decreases in net assets from operations during the reporting period. Actual results could differ from those estimates.
NOTE 2 — SHARES OF BENEFICIAL INTEREST TRANSACTIONS
Transactions in shares of beneficial interest were as follows:
| | | | | | | | | | | | | | | | |
| | | Six months ended
06/30/11 | | | Year ended
12/31/10 | |
| | | Shares | | | Amount | | | Shares | | | Amount | |
Shares issued | | | 127,406 | | | $ | 3,969,846 | | | | 409,087 | | | $ | 11,455,255 | |
Reinvestments of dividends and distributions | | | 59,545 | | | | 1,845,816 | | | | 99,617 | | | | 2,797,454 | |
Shares redeemed | | | (900,917 | ) | | | (27,981,056 | ) | | | (1,759,347 | ) | | | (48,714,939 | ) |
| | | | | | | | | | | | | | | | |
| | | (713,966 | ) | | $ | (22,165,394 | ) | | | (1,250,643 | ) | | $ | (34,462,230 | ) |
| | | | | | | | | | | | | | | | |
As of June 30, 2011, the Trust’s officers, Trustees and affiliated persons and their families directly or indirectly controlled 1,505,864 shares or 12.98% of the Fund.
NOTE 3 — INVESTMENT TRANSACTIONS
Purchases and sales of investment securities, other than short-term investments, for the six months ended June 30, 2011, aggregated $30,828,228 and $48,241,258, respectively.
NOTE 4 — MANAGEMENT FEES
Pursuant to the Management Contract, the Advisor provides investment advisory and administrative services to the Fund. The Fund pays the Advisor a management fee, computed daily and payable monthly at the annual rate of 1.00% of the Fund’s average daily net assets. For the six months ended June 30, 2011, the Fund incurred management fees of $1,838,600.
Excluding the management fee, other expenses incurred by the Fund during the six months ended June 30, 2011, totaled $291,672. These expenses include all costs associated with the Fund’s operations including transfer agent fees, independent trustees’ fees ($14,000 per annum and $2,000 for each Board meeting attended per Trustee), dues, fees and expenses of registering and qualifying the Fund and its shares for distribution, charges of the custodian, auditing and legal expenses, insurance premiums, supplies, postage, expenses of issue or redemption of shares, reports to shareholders and Trustees, expenses of printing and mailing prospectuses, proxy statements and proxies to existing shareholders, and other miscellaneous expenses.
Certain officers and Trustees of the Fund are also officers and/or shareholders of the Advisor.
15
The Torray Fund
NOTES TO FINANCIAL STATEMENTS (continued)
As of June 30, 2011 (unaudited)
NOTE 5 — TAX MATTERS
Distributions to shareholders are determined in accordance with United States Federal income tax regulations, which may differ from accounting principles generally accepted in the United States of America.
The tax character of distributions paid during the year ended December 31, 2010 was as follows:
| | | | |
Distributions paid from: | | | | |
Ordinary income | | $ | 2,970,563 | |
| | | | |
| | $ | 2,970,563 | |
| | | | |
The primary difference between book basis and tax basis distributions is differing book and tax treatment of short-term capital gains.
At December 31, 2010, the Fund had net capital loss carry forward for federal income tax purposes of $89,847,597 which is available to reduce future required distributions of net capital gains to shareholders through 2017.
The following information is based upon the federal tax basis of investment securities as of June 30, 2011:
| | | | | | |
Gross unrealized appreciation | | $ | 68,762,523 | | | |
Gross unrealized depreciation | | | (19,636,328 | ) | | |
| | | | | | |
Net unrealized appreciation | | $ | 49,126,195 | | | |
| | | | | | |
Cost | | $ | 323,639,446 | | | |
| | | | | | |
NOTE 6 — COMMITMENTS AND CONTINGENCIES
The Fund indemnifies its officers and Trustees for certain liabilities that may arise from their performance of their duties to the Fund. Additionally, in the normal course of business, the Fund enters into contracts that contain a variety of representations and warranties which provide general indemnifications. The Fund’s maximum exposure under these arrangements is unknown, as this would involve future claims that may be made against the Fund that have not yet occurred.
NOTE 7 — SUBSEQUENT EVENTS
Management has evaluated the impact of all subsequent events on the Fund through the date these financial statements were issued and has determined that there were no subsequent events requiring recognition or disclosure in the financial statements.
16
The Torray Fund
PORTFOLIO HOLDINGS, PROXY VOTING AND PROCEDURES
As of June 30, 2011 (unaudited)
The Fund files its complete schedule of portfolio holdings with the Securities and Exchange Commission (the “Commission”) for the first and third quarters of each fiscal year on Form N-Q. The Fund’s Forms N-Q are available on the Commission’s website at http://www.sec.gov. The Fund’s Forms N-Q may be reviewed and copied at the Commission’s Public Reference Room in Washington, D.C. Information on the operation of the Commission’s Public Reference Room may be obtained by calling 1-800-SEC-0330.
A description of the policies and procedures that the Fund uses to determine how to vote proxies relating to portfolio securities is available without charge, upon request, by calling 1-800-443-3036; and on the Commission’s website at http://www.sec.gov.
Information regarding how the Fund voted proxies relating to portfolio securities is available without charge, upon request, by calling 1-800-443-3036; and on the Commission’s website at http://www.sec.gov.
17
The Torray Fund
ABOUT YOUR FUND’S EXPENSES
As of June 30, 2011 (unaudited)
We believe it is important for you to understand the impact of costs on your investment. All mutual funds have operating expenses. As a shareholder of the Fund, you incur ongoing costs, including management fees, and other fund expenses. Operating expenses, which are deducted directly from the Fund’s gross income, directly reduce the investment return of the Fund.
A mutual fund’s expenses are expressed as a percentage of its average net assets. This figure is known as the expense ratio. The following examples are intended to help you understand the ongoing costs (in dollars) of investing in the Fund and to compare these costs with the ongoing costs of investing in other mutual funds. The examples below are based on an investment of $1,000 made at the beginning of the period shown and held for the entire period.
The table on the next page illustrates the Fund’s cost in two ways:
Actual Fund Return — This section helps you estimate the actual expenses that you paid over the period. The “Ending Account Value” shown is derived from the Fund’s actual return, and the third column shows the operating expenses that would have been paid by an investor who started with $1,000 in the Fund. You may use the information here, together with the amount invested, to estimate the expenses that you paid over the period.
To do so, simply divide your account value by $1,000 (for example, an $8,600 account value divided by $1,000 = 8.6), then multiply the result by the number given for the Fund under the heading “Expenses Paid During Period” on the next page.
Hypothetical 5% Return — This section is intended to help you compare your Fund’s costs with those of other mutual funds. It assumes that the Fund had an annual return of 5% before expenses, and that the expense ratio is unchanged. In this case, because the return used is not the Fund’s actual return, the results do not apply to your investment. The example is useful in making comparisons because the Commission requires all mutual funds to calculate expenses based on a 5% return. You can assess the Fund’s costs by comparing this hypothetical example with the hypothetical examples that appear in shareholder reports of other funds.
Note that expenses shown in the table are meant to highlight and help you compare ongoing costs only. The Fund does not charge transactions fees, such as purchase or redemption fees, nor does it carry a “sales load.”
The calculation assumes no shares were bought or sold during the period. Your actual costs may have been higher or lower, depending on the amount of your investment and the timing of any purchases or redemptions.
18
The Torray Fund
ABOUT YOUR FUND’S EXPENSES (continued)
As of June 30, 2011 (unaudited)
More information about the Fund’s expenses, including recent annual expense ratios, can be found in this report. For additional information on operating expenses and other shareholder costs, please refer to the Fund’s prospectus.
| | | | | | | | | | | | |
| | | Beginning
Account Value
January 1, 2011 | | | Ending
Account Value
June 30, 2011 | | | Expenses Paid
During Period* | |
Based on Actual Fund Return | | $ | 1,000.00 | | | $ | 1,099.00 | | | $ | 6.04 | |
Based on Hypothetical 5% Return | | $ | 1,000.00 | | | $ | 1,019.04 | | | $ | 5.81 | |
| • | | Expenses are equal to the Fund’s annualized expense ratio of 1.16% for the period, multiplied by the average account value over the period, multiplied by 181/365 (to reflect the one-half-year period). |
19
TRUSTEES
Carol Crawford
Bruce C. Ellis
William M Lane
Robert P. Moltz
Wayne H. Shaner
INVESTMENT ADVISOR
Torray LLC
OFFICERS
Robert E. Torray
William M Lane
Fred M. Fialco
Shawn M. Hendon
Nicholas C. Haffenreffer
Barbara C. Warder
INDEPENDENT REGISTERED PUBLIC ACCOUNTING FIRM
BBD, LLP
1835 Market Street, 26th Floor
Philadelphia, PA 19103
TRANSFER AGENT
BNY Mellon Investment Servicing (U.S.) Inc.
4400 Computer Drive
Westborough, MA 01581-1722
LEGAL COUNSEL
Dechert LLP
1775 I Street, N.W.
Washington, DC 20006
Distributed by BNY Mellon Distributors Inc.
760 Moore Road, King of Prussia, PA 19406-1212
Date of first use, August 2011
This report is not authorized for distribution to
prospective investors unless preceded or accompanied
by a current prospectus. All indices are unmanaged
groupings of stocks that are not available for
investment.
The
TORRAY
FUND
SEMI-ANNUAL REPORT
June 30, 2011
The Torray Fund
Suite 1100
7501 Wisconsin Avenue
Bethesda, Maryland 20814-6523
(301) 493-4600
(800) 443-3036
The Torray Institutional Fund
Letter to Shareholders
July 26, 2011
Dear Fellow Shareholders,
This letter marks the 10th anniversary of The Torray Institutional Fund. We are pleased to report the Fund gained 9.5% during the six-month period ending June 30, compared to 6% for the Standard & Poor’s 500 Index. It returned 3% annually since inception, while the Index made 2.7%.
We feel particularly fortunate about both outcomes given the ravages of two recessions and two of the most brutal bear markets in history. When the first downturn began in March of 2000, the S&P Index was around 1500, having advanced sharply in a wildly speculative binge over the previous two years. Today, 11 years later, and after a second collapse in 2008, with dividends reinvested, it is only slightly higher than it was back then. There is an important difference, however. Corporate earnings have nearly doubled, cutting the Index’s price earnings ratio in half. It now stands at a significant discount to its average multiple dating back 85 years to 1926. Despite the current seemingly endless list of global problems, we are convinced that quality U.S. companies offer compelling value for long-term investors.
As noted in our 2010 Annual Report, the fallout from this confidence-shattering decade has prompted a number of so-called “experts” to declare long-term investing dead. In its place, they recommend actively trading stocks, options, commodities, exchange traded funds, and so on. We continue to think this is bad advice. Over the last 70 years, our country has endured incredible challenges — World War II, Korea, Vietnam, Iraq, Afghanistan, the Russian debt default, recessions, the World Trade Center tragedy, stock market panics and crashes, financial industry bankruptcies and the sub-prime mortgage and real estate collapses. We suspect the average person, if asked how they thought stocks did in the face of all this, would probably answer, “terrible.”
Thanks to Ned Davis Research, Inc., a well-respected independent firm, we can report otherwise: during the same 70-year period, the S&P 500 with dividends reinvested returned 11.2% compounded, turning $100 into $168,785. By comparison, Treasury bonds yielded an average 5.6%, producing only $4,534. Yet investors persist in buying bonds at yields that have been falling for 30 years and now stand at historic lows. Meanwhile, the economy and financial system are on the mend, and earnings and dividends are heading up. Twenty-six of our 31 holdings have increased dividends over the past year, and 10 of them have done so for 25 straight
1
The Torray Institutional Fund
Letter to Shareholders (continued)
July 26, 2011
years. (The portfolio’s yield is about one percentage point above the return on five-year government bonds.) In addition, analysts project the earnings of these companies, as a group, will grow 10% a year for the next five years. While we are highly skeptical of such forecasts, the long operating histories, competitive strengths and sound finances of these businesses make us confident there is potential for meaningful growth along with dividend increases.
However, none of this will matter if investors aren’t on board for the ride. On that note, we have recently analyzed The Torray Fund’s accounting of share purchases and redemptions over the last 20 years and six months. The disheartening results confirmed our sense that despite 40 shareholder letters urging investors to stay the course, money has poured in when stock prices were rising and then out just as fast when they fell. The largest sums came in during the late stages of the 1998 speculative boom. These inflows were almost surely a response to media accounts of the 21% per year returns our Fund posted over the preceding eight years, multiplying an initial investment 4½ times. We also found the ins and outs tended to track our shorter-term investment performance relative to market averages and that of other funds.
The eight-year record referenced above was totally unsustainable, and we said so in The Torray Fund’s 1998 Annual Report, pointing out that $50,000 earning 21% a year would grow to $10 trillion in a century, roughly equal to the stock market’s entire value at the time. Ironically, this was also the year of the Fund’s largest redemptions. In this case it seems likely departing shareholders were attracted to other funds heavily concentrated in the vastly inflated stocks that drove the Index up 29% that year. We owned none of them. When the market collapsed a few years later, the S&P and NASDAQ sank 38% and 67%, respectively. The Fund’s loss was 16%.
Finally, in 2008, stocks were decimated again, causing another round of redemptions across the fund industry. The proceeds flooded into banks, money market funds and bonds where they remain today, indicating the shock has still not worn off. Investors so-positioned and approaching retirement are facing an uphill battle trying to recover the wealth they’ve lost. By contrast, Torray Fund and Torray Institutional Fund shareholders that held on have recouped their losses and, in our opinion, are well-situated to benefit from the market’s historically conservative valuation.
2
The Torray Institutional Fund
Letter to Shareholders (continued)
July 26, 2011
Having said this, the financial uncertainties plaguing the world’s economy are serious, and we do not by any means discount them. Turmoil in the credit markets is only the latest manifestation of today’s mind-numbing worries. Against this backdrop, we feel it is particularly important to invest only in first-rate businesses or mutual funds that own them. As always, our focus is on containing risk as best we can, and achieving a combination of earnings growth and dividends that will produce reasonable returns for you in the years ahead. Although there is no way to know what those returns will be, we believe they will compare favorably to the alternatives.
We appreciate your continued confidence and trust in our management.
| | | | | | |
| | Sincerely, | | | | |
| | | |
| |  | | | | |
| | Robert E. Torray | | | | |
| | 
| | | | |
| | Fred M. Fialco | | | | |
| | 
| | | | |
| | Shawn M. Hendon | | | | |
3
The Torray Institutional Fund
PERFORMANCE DATA
As of June 30, 2011 (unaudited)
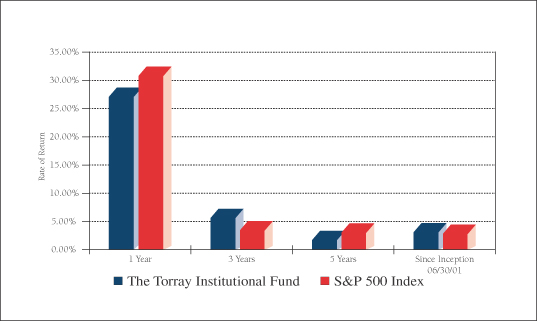
Average Annual Returns on an Investment in
The Torray Institutional Fund vs. the S&P 500 Index
For the periods ended June 30, 2011:
| | | | | | | | | | | | | | | | |
| | | 1 Year | | | 3 Years | | | 5 Years | | | Since
Inception
06/30/01 | |
The Torray Institutional Fund | | | 26.96% | | | | 5.50% | | | | 1.59% | | | | 2.97% | |
S&P 500 Index | | | 30.69% | | | | 3.34% | | | | 2.94% | | | | 2.72% | |
Cumulative Returns for the 10 Years Ended June 30, 2011
| | | | |
The Torray Institutional Fund | | | 34.04 | % |
S&P 500 Index | | | 30.75 | % |
4
The Torray Institutional Fund
PERFORMANCE DATA (continued)
As of June 30, 2011 (unaudited)
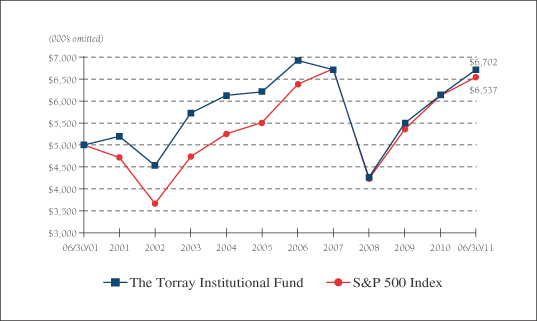
Change in Value of $5,000,000 Invested
on June 30, 2001 (commencement of operations) to:
| | | | | | | | | | | | | | | | | | | | |
| | | 12/31/03 | | | 12/31/05 | | | 12/31/07 | | | 12/31/09 | | | 06/30/11 | |
The Torray Institutional Fund | | $ | 5,725,000 | | | $ | 6,201,000 | | | $ | 6,701,000 | | | $ | 5,495,000 | | | $ | 6,702,000 | |
S&P 500 Index | | $ | 4,739,000 | | | $ | 5,507,000 | | | $ | 6,726,000 | | | $ | 5,358,000 | | | $ | 6,537,000 | |
The returns quoted represent past performance and do not guarantee future results. Investment return and principal value will fluctuate so that shares, when redeemed, may be worth more or less than their original cost. Current performance may be lower or higher. For performance current to the most recent month end, please call (800) 626-9769. The returns shown do not reflect the deduction of taxes a shareholder would pay on the redemption of fund shares and distributions. The Fund’s gross annual operating expense ratio, as stated in the current prospectus, is 0.85%. Returns on both The Torray Institutional Fund and the S&P 500 Index assume reinvestment of all dividends and distributions. The S&P 500 Index is an unmanaged index consisting of 500 U.S. large-cap stocks.
5
The Torray Institutional Fund
FUND PROFILE
As of June 30, 2011 (unaudited)
| | | | |
DIVERSIFICATION (% of net assets) | |
| |
Information Technology | | | 19.97% | |
Health Care | | | 17.71% | |
Financials | | | 15.64% | |
Consumer Staples | | | 13.59% | |
Industrials | | | 11.43% | |
Consumer Discretionary | | | 5.08% | |
Telecommunications | | | 3.40% | |
Materials | | | 2.84% | |
Short-Term Investments | | | 10.27% | |
Other Assets Less Liabilities | | | 0.07% | |
| | | | |
| | | 100.00% | |
| | | | |
| | | | | | | | |
| TOP TEN EQUITY HOLDINGS (% of net assets) | |
| | |
| | 1. | | | Marsh & McLennan Cos., Inc. | | | 3.57% | |
| | 2. | | | Loews Corp. | | | 3.54% | |
| | 3. | | | AT&T Inc. | | | 3.40% | |
| | 4. | | | Cintas Corp. | | | 3.28% | |
| | 5. | | | Kraft Foods Inc., Class A | | | 3.26% | |
| | 6. | | | WellPoint, Inc. | | | 3.22% | |
| | 7. | | | Western Union Co. (The) | | | 3.17% | |
| | 8. | | | Johnson & Johnson | | | 3.12% | |
| | 9. | | | UnitedHealth Group Inc. | | | 3.12% | |
| | 10. | | | International Business Machines Corp. | | | 3.08% | |
| | | | | | | | |
| | | | | | | 32.76% | |
| | | | | | | | |
| | | | | | | | |
| | | | | | | | |
PORTFOLIO CHARACTERISTICS | | | | | |
| | |
Net Assets (million) | | | | | | | $24 | |
Number of Holdings | | | | | | | 31 | |
Portfolio Turnover | | | | | | | 9.06% | * |
P/E Multiple (forward) | | | | | | | 12.9x | |
Portfolio Yield | | | | | | | 2.12% | |
Market Capitalization (billion) | | | Average | | | | $69.1 | |
| | | Median | | | | $50.2 | |
6
The Torray Institutional Fund
SCHEDULE OF INVESTMENTS
As of June 30, 2011 (unaudited)
| | | | | | | | | | |
| | | Shares | | | | | Market Value | |
| COMMON STOCK 89.66% | | | | |
| |
19.97% INFORMATION TECHNOLOGY | | | | |
| | | 38,000 | | | Western Union Co. (The) | | $ | 761,140 | |
| | | 4,300 | | | International Business Machines Corp. | | | 737,665 | |
| | | 13,716 | | | Automatic Data Processing, Inc. | | | 722,559 | |
| | | 25,042 | | | EMC Corp.* | | | 689,907 | |
| | | 41,000 | | | Cisco Systems, Inc. | | | 640,010 | |
| | | 27,956 | | | Intel Corp. | | | 619,505 | |
| | | 17,000 | | | Hewlett-Packard Co. | | | 618,800 | |
| | | | | | | | | | |
| | | | | | | | | 4,789,586 | |
| |
17.71% HEALTH CARE | | | | |
| | | 9,800 | | | WellPoint, Inc. | | | 771,946 | |
| | | 11,264 | | | Johnson & Johnson | | | 749,281 | |
| | | 14,500 | | | UnitedHealth Group Inc. | | | 747,910 | |
| | | 11,500 | | | Baxter International Inc. | | | 686,435 | |
| | | 7,900 | | | Becton Dickinson & Co. | | | 680,743 | |
| | | 11,600 | | | Abbott Laboratories | | | 610,392 | |
| | | | | | | | | | |
| | | | | | | | | 4,246,707 | |
| |
15.64% FINANCIALS | | | | |
| | | 27,417 | | | Marsh & McLennan Cos., Inc. | | | 855,136 | |
| | | 20,200 | | | Loews Corp. | | | 850,218 | |
| | | 11,300 | | | Chubb Corp. | | | 707,493 | |
| | | 13,423 | | | American Express Co. | | | 693,969 | |
| | | 23,000 | | | Wells Fargo & Co. | | | 645,380 | |
| | | | | | | | | | |
| | | | | | | | | 3,752,196 | |
| |
13.59% CONSUMER STAPLES | | | | |
| | | 22,200 | | | Kraft Foods Inc., Class A | | | 782,106 | |
| | | 8,400 | | | Colgate-Palmolive Co. | | | 734,244 | |
| | | 14,900 | | | Walgreen Co. | | | 632,654 | |
| | | 18,900 | | | Sysco Corp. | | | 589,302 | |
| | | 8,200 | | | Procter & Gamble Co. (The) | | | 521,274 | |
| | | | | | | | | | |
| | | | | | | | | 3,259,580 | |
7
The Torray Institutional Fund
SCHEDULE OF INVESTMENTS (continued)
As of June 30, 2011 (unaudited)
| | | | | | | | | | |
| | | Shares | | | | | Market Value | |
| |
11.43% INDUSTRIALS | | | | |
| | | 23,792 | | | Cintas Corp. | | $ | 785,850 | |
| | | 7,200 | | | 3M Co. | | | 682,920 | |
| | | 35,419 | | | General Electric Co. | | | 668,003 | |
| | | 8,100 | | | General Dynamics Corp. | | | 603,612 | |
| | | | | | | | | | |
| | | | | | | | | 2,740,385 | |
| |
5.08% CONSUMER DISCRETIONARY | | | | |
| | | 17,600 | | | McGraw-Hill Cos. Inc. (The) | | | 737,616 | |
| | | 33,600 | | | Gannett Co., Inc. | | | 481,152 | |
| | | | | | | | | | |
| | | | | | | | | 1,218,768 | |
| |
3.40% TELECOMMUNICATIONS | | | | |
| | | 26,000 | | | AT&T Inc. | | | 816,660 | |
| |
2.84% MATERIALS | | | | |
| | | 12,600 | | | E.I. du Pont de Nemours & Co. | | | 681,030 | |
| | | | | | | | | | |
| TOTAL COMMON STOCK 89.66% | | | 21,504,912 | |
(cost $18,817,510) | | | | | | | |
| | | |
| | | Principal Amount ($) | | | | | | |
| |
| SHORT-TERM INVESTMENTS 10.27% | | | | |
| | | 2,464,398 | | | BNY Mellon Cash Reserve, 0.05%(1) | | | 2,464,398 | |
(cost $2,464,398) | | | | | | | |
| | | | | | | | | | |
| TOTAL INVESTMENTS 99.93% | | | 23,969,310 | |
(cost $21,281,908) | | | | | | | |
| |
| OTHER ASSETS LESS LIABILITIES 0.07% | | | 16,091 | |
| | | | | | | | | | |
| NET ASSETS 100.00% | | $ | 23,985,401 | |
| | | | | | | | | | |
| * | | Non-income producing securities. |
| (1) | | Represents current yield at June 30, 2011. |
See notes to the financial statements.
8
The Torray Institutional Fund
STATEMENT OF ASSETS AND LIABILITIES
As of June 30, 2011 (unaudited)
| | | | |
ASSETS | | | | |
Investments in securities at value
(cost $21,281,908) | | $ | 23,969,310 | |
Interest and dividends receivable | | | 38,634 | |
| | | | |
TOTAL ASSETS | | | 24,007,944 | |
| | | | |
| |
LIABILITIES | | | | |
Payable to advisor | | | 15,000 | |
Payable for fund shares redeemed | | | 7,543 | |
| | | | |
TOTAL LIABILITIES | | | 22,543 | |
| | | | |
| |
NET ASSETS | | $ | 23,985,401 | |
| | | | |
Shares of beneficial interest ($1 stated value,
318,383 shares outstanding, unlimited
shares authorized) | | $ | 318,383 | |
Paid-in-capital in excess of par | | | 25,249,928 | |
Distributions in excess of net investment income | | | (2,493 | ) |
Accumulated net realized loss on investments | | | (4,267,819 | ) |
Net unrealized appreciation of investments | | | 2,687,402 | |
| | | | |
| |
TOTAL NET ASSETS | | $ | 23,985,401 | |
| | | | |
Net Asset Value, Offering and Redemption Price per Share | | $ | 75.34 | |
| | | | |
See notes to the financial statements.
9
The Torray Institutional Fund
STATEMENT OF OPERATIONS
For the six months ended June 30, 2011 (unaudited)
| | | | |
INVESTMENT INCOME | | | | |
Dividend income | | $ | 238,789 | |
Interest income | | | 517 | |
| | | | |
Total investment income | | | 239,306 | |
| | | | |
| |
EXPENSES | | | | |
Management fees | | | 96,593 | |
| | | | |
Total expenses | | | 96,593 | |
| | | | |
NET INVESTMENT INCOME | | | 142,713 | |
| | | | |
REALIZED AND UNREALIZED GAIN ON INVESTMENTS | | | | |
Net realized gain on investments | | | 42,909 | |
Net change in unrealized appreciation (depreciation) on investments | | | 1,870,227 | |
| | | | |
Net realized and unrealized gain on investments | | | 1,913,136 | |
| | | | |
NET INCREASE IN NET ASSETS FROM OPERATIONS | | $ | 2,055,849 | |
| | | | |
See notes to the financial statements.
10
The Torray Institutional Fund
STATEMENTS OF CHANGES IN NET ASSETS
For the periods indicated:
| | | | | | | | |
| | | Six months ended
06/30/11
(unaudited) | | | Year ended
12/31/10 | |
Increase in Net Assets from Operations: | | | | | | | | |
Net investment income | | $ | 142,713 | | | $ | 207,996 | |
Net realized gain on investments | | | 42,909 | | | | 163,976 | |
Net change in unrealized appreciation
(depreciation) on investments | | | 1,870,227 | | | | 1,861,864 | |
| | | | | | | | |
Net increase in net assets from operations | | | 2,055,849 | | | | 2,233,836 | |
| | | | | | | | |
| | |
Distributions to Shareholders from: | | | | | | | | |
Net investment income ($0.461 and
$0.662 per share, respectively) | | | (145,838 | ) | | | (207,364 | ) |
| | | | | | | | |
Total distributions | | | (145,838 | ) | | | (207,364 | ) |
| | | | | | | | |
| | |
Shares of Beneficial Interest | | | | | | | | |
Increase (decrease) from share transactions | | | 576,929 | | | | (851,312 | ) |
| | | | | | | | |
Total increase | | | 2,486,940 | | | | 1,175,160 | |
Net Assets — Beginning of Period | | | 21,498,461 | | | | 20,323,301 | |
| | | | | | | | |
Net Assets — End of Period | | $ | 23,985,401 | | | $ | 21,498,461 | |
| | | | | | | | |
Distribution in Excess of Net Investment Income and Undistributed Net Investment Income, Respectively | | $ | (2,493 | ) | | $ | 632 | |
| | | | | | | | |
See notes to the financial statements.
11
The Torray Institutional Fund
FINANCIAL HIGHLIGHTS
For a share outstanding throughout each period presented:
PER SHARE DATA
| | | | | | | | | | | | | | | | | | | | | | | | |
| | | Six months
ended
06/30/11
(unaudited) | | | Years ended December 31: | |
| | | | 2010 | | | 2009 | | | 2008 | | | 2007 | | | 2006 | |
Net Asset Value,
Beginning of Period | | $ | 69.240 | | | $ | 62.790 | | | $ | 49.400 | | | $ | 80.800 | | | $ | 108.640 | | | $ | 111.920 | |
| | | | | | | | | | | | | | | | | | | | | | | | |
Income/(loss) from investment operations: | | | | | | | | | | | | | | | | | | | | | | | | |
Net investment income | | | 0.455 | (2) | | | 0.660 | (2) | | | 0.605 | (2) | | | 0.687 | (2) | | | 0.896 | | | | 0.720 | |
Net gains (losses) on securities (both realized and unrealized) | | | 6.106 | | | | 6.452 | | | | 13.394 | | | | (29.336 | ) | | | (4.074 | ) | | | 11.587 | |
| | | | | | | | | | | | | | | | | | | | | | | | |
Total from investment operations | | | 6.561 | | | | 7.112 | | | | 13.999 | | | | (28.649 | ) | | | (3.178 | ) | | | 12.307 | |
| | | | | | | | | | | | | | | | | | | | | | | | |
Less: distributions | | | | | | | | | | | | | | | | | | | | | | | | |
Dividends (from net investment
income) | | | (0.461 | ) | | | (0.662 | ) | | | (0.609 | ) | | | (0.770 | ) | | | (0.716 | ) | | | (0.790 | ) |
Distributions (from capital gains) | | | — | | | | — | | | | — | | | | (1.889 | ) | | | (23.946 | ) | | | (14.797 | ) |
Distributions (from return of capital) | | | — | | | | — | | | | — | | | | (0.092 | ) | | | — | | | | — | |
| | | | | | | | | | | | | | | | | | | | | | | | |
Total distributions | | | (0.461 | ) | | | (0.662 | ) | | | (0.609 | ) | | | (2.751 | ) | | | (24.662 | ) | | | (15.587 | ) |
| | | | | | | | | | | | | | | | | | | | | | | | |
Net Asset Value,
End of Period | | $ | 75.340 | | | $ | 69.240 | | | $ | 62.790 | | | $ | 49.400 | | | $ | 80.800 | | | $ | 108.640 | |
| | | | | | | | | | | | | | | | | | | | | | | | |
TOTAL RETURN(1) | | | 9.51 | %** | | | 11.39 | % | | | 28.61 | % | | | (36.24 | %) | | | (3.01 | %) | | | 11.40 | % |
RATIOS/SUPPLEMENTAL DATA | | | | | | | | | | | | | | | | | | | | | | | | |
Net assets, end of period
(000’s omitted) | | $ | 23,985 | | | $ | 21,498 | | | $ | 20,323 | | | $ | 17,693 | | | $ | 46,689 | | | $ | 205,851 | |
Ratios of expenses to average net
assets | | | 0.85 | %* | | | 0.85 | % | | | 0.85 | % | | | 0.85 | % | | | 0.85 | % | | | 0.85 | % |
Ratios of net investment income to average net
assets | | | 1.26 | %* | | | 1.02 | % | | | 1.16 | % | | | 1.00 | % | | | 0.66 | % | | | 0.60 | % |
Portfolio turnover rate | | | 9.06 | %** | | | 15.40 | % | | | 18.60 | % | | | 32.00 | % | | | 44.32 | % | | | 24.26 | % |
| (1) | | Past performance is not predictive of future performance. |
| (2) | | Calculated based on the average amount of shares outstanding during the period. |
See notes to the financial statements.
12
The Torray Institutional Fund
NOTES TO FINANCIAL STATEMENTS
As of June 30, 2011 (unaudited)
NOTE 1 — SUMMARY OF SIGNIFICANT ACCOUNTING POLICIES
The Torray Institutional Fund (“Fund”) is a separate series of The Torray Fund (“Trust”). The Trust is registered under the Investment Company Act of 1940, as amended, as a no-load, diversified, open-end management investment company. The Trust was organized as a business trust under Massachusetts law and the Fund commenced operations on June 30, 2001. The Fund’s primary investment objective is to build investor wealth over extended periods. The Fund seeks to meet its objective by investing its assets in a diversified portfolio of common stocks. In order to accomplish these goals, the Fund intends to hold stocks for the long term, as opposed to actively buying and selling. There can be no assurances that the Fund’s investment objectives will be achieved.
The following is a summary of accounting policies followed by the Fund in the preparation of its financial statements. These policies are in conformity with accounting principles generally accepted in the United States of America.
Securities Valuation Portfolio securities for which market quotations are readily available are valued at market value, which is determined by using the last reported sale price, or, if no sales are reported, the last reported bid price. For NASDAQ traded securities, market value is determined on the basis of the NASDAQ official closing price instead of the last reported sales price. Other assets and securities for which no quotations are readily available or for which Torray LLC (the “Advisor”) believes do not reflect market value are valued at fair value as determined in good faith by the Advisor under the supervision of the Board of Trustees (the “Board” or “Trustees”) in accordance with the Fund’s Valuation Procedures. Short-term obligations having remaining maturities of 60 days or less are valued at amortized cost, which approximates market value.
Fair Value Measurements Various inputs are used in determining the fair value of investments which are as follows:
| | • | | Level 1 — quoted prices in active markets for identical securities |
| | • | | Level 2 — significant observable inputs (including quoted prices for similar securities, interest rates, prepayment speeds, credit risk, etc.) |
| | • | | Level 3 — significant unobservable inputs (including the Fund’s own assumptions in determining the fair value of investments) |
The inputs or methodology used for valuing securities are not necessarily an indication of the risk associated with investing in those securities.
13
The Torray Institutional Fund
NOTES TO FINANCIAL STATEMENTS (continued)
As of June 30, 2011 (unaudited)
The summary of inputs used to value the Fund’s investments as of June 30, 2011 is as follows:
| | | | |
Valuation Inputs | | | | |
Level 1 — Quoted Prices * | | $ | 23,969,310 | |
Level 2 — Other Significant Observable Inputs | | | — | |
Level 3 — Significant Unobservable Inputs | | | — | |
| | | | |
Total Market Value of Investments | | $ | 23,969,310 | |
| | | | |
| * | | Security types and industry classifications as defined in the Schedule of Investments. |
The Fund did not have significant transfers between Level 1 and Level 2 investments during the reporting period.
Securities Transactions and Investment Income Securities transactions are recorded on a trade date basis. Realized gains and losses from securities transactions are recorded on the specific identification basis. Dividend income and distributions to shareholders are recorded on the ex-dividend date. Interest income, including amortization of discount on short-term investments, and expenses are recorded on the accrual basis. Premium and discount are amortized using the effective yield to maturity method.
Federal Income Taxes The Fund intends to continue to comply with the requirements of the Internal Revenue Code applicable to regulated investment companies and to distribute all of its taxable income, including any net realized gain on investments to its shareholders. Therefore, no Federal income tax provision is required.
Management has analyzed the Fund’s tax positions taken on federal income tax returns for all open tax years (current and prior three tax years), and has concluded that no provision for federal income tax is required in the Fund’s financial statements. The Fund’s federal and state income and federal excise tax returns for tax years for which the applicable statutes of limitations have not expired are subject to examination by the Internal Revenue Service and state departments of revenue.
Net Asset Value The net asset value per share of the Fund is determined daily as of the close of trading on the New York Stock Exchange by dividing the value of the Fund's net assets by the number of shares outstanding.
Interest Expense When cash balances are overdrawn in the Fund’s custody account, the Fund is charged an overdraft fee equal to 1.25% above the Federal Funds Rate. Such overdraft fees are paid by the Advisor under the comprehensive management fee arrangement described in Note 4. The Trust has entered into a line of credit facility with PNC Bank. Under the terms of the line of credit, the separate series of the Trust (including the Fund) may borrow up to $20,000,000 on a short-term basis with interest accruing at the Federal Funds Rate plus 0.75%. Any interest expense on the line of credit is paid by the Advisor under the comprehensive management fee arrangement described in Note 4. As of June 30, 2011, the Fund had no outstanding borrowings under this line of credit facility.
14
The Torray Institutional Fund
NOTES TO FINANCIAL STATEMENTS (continued)
As of June 30, 2011 (unaudited)
Use of Estimates In preparing financial statements in accordance with accounting principles generally accepted in the United States of America, management is required to make estimates and assumptions that affect the reported amounts of assets and liabilities and the disclosure of contingent assets and liabilities at the date of the financial statements, and the reported amounts of increases and decreases in net assets from operations during the reporting period. Actual results could differ from those estimates.
NOTE 2 — SHARES OF BENEFICIAL INTEREST TRANSACTIONS
Transactions in shares of beneficial interest were as follows:
| | | | | | | | | | | | | | | | |
| | | Six months ended
06/30/11 | | | Year ended
12/31/10 | |
| | | Shares | | | Amount | | | Shares | | | Amount | |
Shares issued | | | 12,321 | | | $ | 899,937 | | | | 2,530 | | | $ | 162,829 | |
Reinvestments of dividends and distributions | | | 1,999 | | | | 145,251 | | | | 3,149 | | | | 207,271 | |
Shares redeemed | | | (6,430 | ) | | | (468,259 | ) | | | (18,876 | ) | | | (1,221,412 | ) |
| | | | | | | | | | | | | | | | |
| | | 7,890 | | | $ | 576,929 | | | | (13,197 | ) | | $ | (851,312 | ) |
| | | | | | | | | | | | | | | | |
As of June 30, 2011, the Trust’s officers, Trustees and affiliated persons and their families directly or indirectly controlled 212,852 shares or 66.85% of the Fund.
NOTE 3 — INVESTMENT TRANSACTIONS
Purchases and sales of investment securities, other than short-term investments, for the six months ended June 30, 2011, aggregated $2,563,297 and $1,870,626, respectively.
NOTE 4 — MANAGEMENT FEES
Pursuant to the Management Contract, the Advisor provides investment advisory and administrative services to the Fund. The Fund pays the Advisor a management fee, computed daily and payable monthly at the annual rate of 0.85% of the Fund’s average daily net assets. For the six months ended June 30, 2011, the Fund paid comprehensive management fees of $96,593. The Fund pays the Advisor a single comprehensive management fee which covers all operating expenses of the Fund including the investment advisory and administrative services provided by the Advisor as well as all miscellaneous costs incurred in connection with the ongoing operation of the Fund including transfer agency, custody, professional, and registration fees.
Certain officers and Trustees of the Fund are also officers and/or shareholders of the Advisor.
15
The Torray Institutional Fund
NOTES TO FINANCIAL STATEMENTS (continued)
As of June 30, 2011 (unaudited)
NOTE 5 — TAX MATTERS
Distributions to shareholders are determined in accordance with United States Federal income tax regulations, which may differ from accounting principles generally accepted in the United States of America.
The tax character of distributions paid during the year ended December 31, 2010 was as follows:
| | | | |
Distributions paid from: | | | | |
Ordinary income | | $ | 207,364 | |
| | | | |
| | $ | 207,364 | |
| | | | |
The primary difference between book basis and tax basis distributions is differing book and tax treatment of short-term capital gains.
At December 31, 2010 the Fund had net capital loss carry forward for federal income tax purposes of $339,016, $3,679,435 and $1,023, which are available to reduce future required distributions of net capital gains to shareholders through 2016, 2017 and 2018, respectively.
The following information is based upon the federal tax basis of investment securities as of June 30, 2011:
| | | | | | |
Gross unrealized appreciation | | $ | 3,582,751 | | | |
Gross unrealized depreciation | | | (895,349 | ) | | |
| | | | | | |
Net unrealized appreciation | | $ | 2,687,402 | | | |
| | | | | | |
Cost | | $ | 21,281,908 | | | |
| | | | | | |
NOTE 6 — COMMITMENTS AND CONTINGENCIES
The Fund indemnifies its officers and Trustees for certain liabilities that may arise from their performance of their duties to the Fund. Additionally, in the normal course of business, the Fund enters into contracts that contain a variety of representations and warranties, which provide general indemnifications. The Fund’s maximum exposure under these arrangements is unknown, as this would involve future claims that may be made against the Fund that have not yet occurred.
NOTE 7 — SUBSEQUENT EVENTS
Management has evaluated the impact of all subsequent events on the Fund through the date these financial statements were issued and has determined that there were no subsequent events requiring recognition or disclosure in the financial statements.
16
The Torray Institutional Fund
PORTFOLIO HOLDINGS, PROXY VOTING AND PROCEDURES
As of June 30, 2011 (unaudited)
The Fund files its complete schedule of portfolio holdings with the Securities and Exchange Commission (the “Commission”) for the first and third quarters of each fiscal year on Form N-Q. The Fund’s Forms N-Q are available on the Commission’s website at http://www.sec.gov. The Fund’s Forms N-Q may be reviewed and copied at the Commission’s Public Reference Room in Washington, D.C. Information on the operation of the Commission’s Public Reference Room may be obtained by calling 1-800-SEC-0330.
A description of the policies and procedures that the Fund uses to determine how to vote proxies relating to portfolio securities is available without charge, upon request, by calling 1-800-443-3036; and on the Commission’s website at http://www.sec.gov.
Information regarding how the Fund voted proxies relating to portfolio securities is available without charge, upon request, by calling 1-800-443-3036; and on the Commission’s website at http://www.sec.gov.
17
The Torray Institutional Fund
ABOUT YOUR FUND’S EXPENSES
As of June 30, 2011 (unaudited)
We believe it is important for you to understand the impact of costs on your investment. All mutual funds have operating expenses. As a shareholder of the Fund, you incur ongoing costs, including management fees, and other fund expenses. Operating expenses, which are deducted directly from the Fund’s gross income, directly reduce the investment return of the Fund.
A mutual fund’s expenses are expressed as a percentage of its average net assets. This figure is known as the expense ratio. The following examples are intended to help you understand the ongoing costs (in dollars) of investing in the Fund and to compare these costs with the ongoing costs of investing in other mutual funds. The examples below are based on an investment of $1,000 made at the beginning of the period shown and held for the entire period.
The table on the next page illustrates the Fund’s cost in two ways:
Actual Fund Return This section helps you estimate the actual expenses that you paid over the period. The “Ending Account Value” shown is derived from the Fund’s actual return, and the third column shows the operating expenses that would have been paid by an investor who started with $1,000 in the Fund. You may use the information here, together with the amount invested, to estimate the expenses that you paid over the period.
To do so, simply divide your account value by $1,000 (for example, an $8,600 account value divided by $1,000 = 8.6), then multiply the result by the number given for the Fund under the heading “Expenses Paid During Period” on the next page.
Hypothetical 5% Return This section is intended to help you compare your Fund’s costs with those of other mutual funds. It assumes that the Fund had an annual return of 5% before expenses, and that the expense ratio is unchanged. In this case, because the return used is not the Fund’s actual return, the results do not apply to your investment. The example is useful in making comparisons because the Commission requires all mutual funds to calculate expenses based on a 5% return. You can assess the Fund’s costs by comparing this hypothetical example with the hypothetical examples that appear in shareholder reports of other funds.
Note that expenses shown in the table are meant to highlight and help you compare ongoing costs only. The Fund does not charge transactions fees, such as purchase or redemption fees, nor does it carry a “sales load.”
The calculation assumes no shares were bought or sold during the period. Your actual costs may have been higher or lower, depending on the amount of your investment and the timing of any purchases or redemptions.
18
The Torray Institutional Fund
ABOUT YOUR FUND’S EXPENSES (continued)
As of June 30, 2011 (unaudited)
More information about the Fund’s expenses, including recent annual expense ratios, can be found in this report. For additional information on operating expenses and other shareholder costs, please refer to the Fund’s prospectus.
| | | | | | | | | | | | |
| | | Beginning
Account Value
January 1, 2011 | | | Ending
Account Value
June 30, 2011 | | | Expenses Paid
During Period* | |
Based on Actual Fund Return | | $ | 1,000.00 | | | $ | 1,095.10 | | | $ | 4.42 | |
Based on Hypothetical 5% Return | | $ | 1,000.00 | | | $ | 1,020.58 | | | $ | 4.26 | |
| * | | Expenses are equal to the Fund’s annualized expense ratio of 0.85% for the period, multiplied by the average account value over the period, multiplied by 181/365 (to reflect the one-half-year period). |
19
TRUSTEES
Carol Crawford
Bruce C. Ellis
William M Lane
Robert P. Moltz
Wayne H. Shaner
INVESTMENT ADVISOR
Torray LLC
OFFICERS
Robert E. Torray
William M Lane
Fred M. Fialco
Shawn M. Hendon
Nicholas C. Haffenreffer
Barbara C. Warder
INDEPENDENT REGISTERED PUBLIC ACCOUNTING FIRM
BBD, LLP
1835 Market Street, 26th Floor
Philadelphia, PA 19103
TRANSFER AGENT
BNY Mellon Investment Servicing (U.S.) Inc.
4400 Computer Drive
Westborough, MA 01581-1722
LEGAL COUNSEL
Dechert LLP
1775 I Street, N.W.
Washington, DC 20006
Distributed by BNY Mellon Distributors Inc.
760 Moore Road, King of Prussia, PA 19406-1212
Date of first use, August 2011
This report is not authorized for distribution to
prospective investors unless preceded or accompanied
by a current prospectus. All indices are unmanaged
groupings of stocks that are not available for
investment.
The
TORRAY
INSTITUTIONAL
FUND
SEMI-ANNUAL REPORT
June 30, 2011
The Torray Institutional Fund
Suite 1100
7501 Wisconsin Avenue
Bethesda, Maryland 20814-6523
(301) 493-4600
(800) 443-3036
The Torray Resolute Fund
Letter to Shareholders
July 26, 2011
Dear Fellow Shareholders,
As we mark the passage of the first half of the year, we arrive at an obvious conclusion: it’s a challenging investment environment characterized by risk, opportunity and contradiction. Corporate fundamentals are good, but the economic and political backdrop is poor. Valuations are reasonable, but growth is increasingly hard to come by. Debt markets paint one picture, equities another. These cross-currents were reflected in the high volatility of the market over the course of the last six months. Despite the mixed signals and market swings, The Torray Resolute Fund gained 7.6% for the period ended June 30, compared to 6.8% for the Russell 1000 Growth Index and 6.0% for the S&P 500.
Top fund contributors for the period included payments provider Visa (V, +20%) and Canadian-based pipeline company Enbridge (ENB, +17%). Visa shares benefited from a Federal Reserve ruling on the Durbin Amendment regarding debit interchange fees which was more benign than expected. Enbridge continued to produce excellent financial returns resulting from its dominant position exporting approximately 67% of Canadian crude imported to the U.S., 12% of the country’s total imports. Detractors included data networking giant Cisco Systems (CSCO, -23%) and Latin American telecom service provider America Movil (AMX, -6%). Shares of Cisco suffered from continued weakness in key end markets and a growing consensus concerning management missteps. America Movil produced steady growth, but incurred regulatory challenges and concerns regarding the health and sustainability of the Latin American expansion and North American recovery.
Recent portfolio changes include the purchase of four new securities, NetApp (NTAP), Varian Medical Systems (VAR), Compass Minerals (CMP) and Cummins (CMI). Shares sold included Cisco Systems (CSCO), Berkshire Hathaway (BRK.B) and Lubrizol (LZ). While short-term market volatility is typically considered risky, it also creates opportunity for investors with a longer-term perspective. In this vein, we took advantage of the environment to establish positions we believe have potential growth opportunities.
The data storage industry is among the fastest growing segments of the Information Technology sector. Despite competitive pressure from larger industry participants, NetApp has been able to achieve above-industry growth rates of 20% (sales) over the past five years and increase market share from 11% in 2009 to 16% in 2011 by addressing two fundamental issues for the end user — cost and ease of use. Concerns regarding supply shortages in the January period afforded an opportunity to purchase this industry leader at a price we considered reasonable. We believe the
1
The Torray Resolute Fund
Letter to Shareholders (continued)
July 26, 2011
company will continue to benefit from the long-term secular growth trends supporting the data storage industry.
Varian Medical Systems designs and manufactures integrated radiotherapy systems used in the treatment of cancer and X-ray imaging. Varian had 2010 revenues of $2.4 billion, making it the market leader with 70% share in the U.S. and 50% internationally. The company has produced an impressive record of consistent growth and profitability over the past ten years, increasing revenues at a compound average rate of 13%, expanding operating margins from 13% to 23%, and increasing earnings at a compound annual rate of 22%. Looking forward, Varian has many of the business characteristics we look for — pricing power within a niche market, high switching costs, demographic tailwinds in developed markets, and growth opportunities in emerging markets.
Compass Minerals is a unique, low-cost provider of two basic mineral products, rock salt and sulfate of potash (“SOP”). Rock salt (82% of sales) is used primarily for highway deicing and SOP (18% of sales) as a specialty fertilizer for high-value agricultural crops. While both products are commodities, the company has been able to generate stable profit growth as a result of the size, geographic and structural advantages enjoyed by its production assets — the largest salt mines in North America and the U.K. and strategic leases on the Great Salt Lake in Utah. With just two significant competitors, the salt industry operates as an oligopoly with a history of stable pricing. Compass’ solar evaporation facility in Utah provides cost advantages over other SOP manufacturers that rely on fossil fuels for their production process. Both products participate in steady end markets with little correlation to the overall economy.
A June correction hit the economically-sensitive industrial sector particularly hard, as the pace and sustainability of the global economic recovery were brought into question. Shares of engine and component manufacturer Cummins were no exception, declining 21% from April highs to June lows. Serving the global trucking and power generation industries, there is no doubt Cummins’ end markets are cyclical, but we believe opportunities outweigh risks. Over the past decade, Cummins’ efforts to diversify geographically and improve operating performance have paid off: international sales have increased from 40% of total to 64%, emerging market sales have grown in excess of 30% a year and we think this will continue. At the conclusion of the 2001 recession, Cummins reported a loss of $0.66 per share. In 2009, the company earned $2.16 per share. Clearly, the company is better positioned to maintain profitability through a business cycle than it was a decade ago.
2
The Torray Resolute Fund
Letter to Shareholders (continued)
July 26, 2011
Shares of specialty chemical company Lubrizol were sold following the $135 all cash offer from Berkshire Hathaway, a 25% premium to the Fund’s initial purchase price in January. Shares of Berkshire were also sold as our list of concerns grew around this company: its increasing reliance on larger acquisitions, a lack of corporate governance revealed by the David Sokol incident and a growing realization of how challenging the execution of a successful succession plan will be. Finally, shares of Cisco Systems were sold. While we recognize Cisco represents a compelling value at its current price, we think the company’s key end markets will remain weak and don’t believe management has established a convincing plan to regain satisfactory growth and profitability.
It is unusual for us to make this many changes to the Fund, but we think it is appropriate given our assessment of where we are in the business cycle. The pace of the recovery is maturing, profits are peaking and we believe a premium will be placed on businesses that have durable profit characteristics and benefit from distinct secular trends that should sustain growth through this period. Stock selection is always important, but it feels more so today than at any point in the past two years.
As always, we appreciate your interest and trust.
| | | | | | |
| | Respectfully, | | | | |
| | | |
| |  | | | | |
| | Nicholas C. Haffenreffer | | | | |
3
The Torray Resolute Fund
PERFORMANCE DATA
As of June 30, 2011 (unaudited)
Average Annual Returns on an Investment in
The Torray Resolute Fund vs.
the Russell 1000 Growth Index and the S&P 500 Index
For the periods ended June 30, 2011:
| | | | | | | | | | | | | | | | |
| | | Year to Date | | | 1 Month | | | 3 Month | | | Since
Inception
12/31/10 | |
The Torray Resolute Fund | | | 7.60 | % | | | -0.56 | % | | | 2.97 | % | | | 7.60 | % |
Russell 1000 Growth Index | | | 6.83 | % | | | -1.43 | % | | | 0.76 | % | | | 6.83 | % |
S&P 500 Index | | | 6.03 | % | | | -1.67 | % | | | 0.10 | % | | | 6.03 | % |
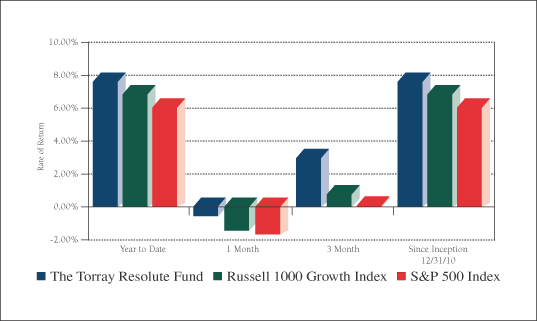
Cumulative Returns for the 6 Months Ended June 30, 2011
| | | | |
The Torray Resolute Fund | | | 7.60 | % |
Russell 1000 Growth Index | | | 6.83 | % |
S&P 500 Index | | | 6.03 | % |
4
The Torray Resolute Fund
PERFORMANCE DATA (continued)
As of June 30, 2011 (unaudited)
Change in Value of $10,000 Invested
on December 31, 2010 (commencement of operations) to:
| | | | | | | | | | | | | | | | | | | | | | | | |
| | | 01/31/11 | | | 02/28/11 | | | 03/31/11 | | | 04/30/11 | | | 05/31/11 | | | 06/30/11 | |
The Torray Resolute Fund | | $ | 10,060 | | | $ | 10,410 | | | $ | 10,450 | | | $ | 10,730 | | | $ | 10,820 | | | $ | 10,760 | |
Russell 1000 Growth Index | | $ | 10,255 | | | $ | 10,590 | | | $ | 10,603 | | | $ | 10,958 | | | $ | 10,839 | | | $ | 10,683 | |
S&P 500 Index | | $ | 10,237 | | | $ | 10,588 | | | $ | 10,592 | | | $ | 10,906 | | | $ | 10,783 | | | $ | 10,603 | |
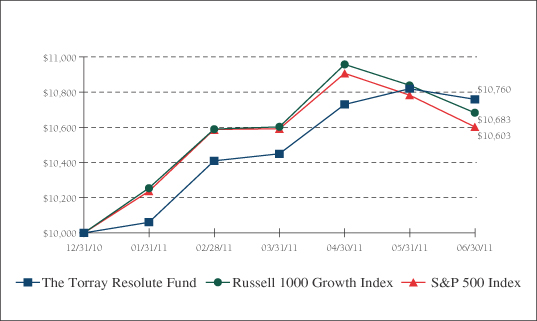
The returns quoted represent past performance and do not guarantee future results. Investment return and principal value will fluctuate so that shares, when redeemed, may be worth more or less than their original cost. Current performance may be lower or higher. For performance current to the most recent month end, please call (800) 626-9769. The returns shown do not reflect the deduction of taxes a shareholder would pay on the redemption of fund shares and distributions. The Fund’s gross annual operating expense ratio, as stated in the current prospectus, is 1.22%. Returns on The Torray Resolute Fund, the Russell 1000 Growth Index and the S&P 500 Index assume reinvestment of all dividends and distributions. The Russell 1000 Growth Index is an unmanaged index consisting of 591 U.S. large-cap growth stocks, and the S&P 500 Index is an unmanaged index consisting of 500 large-cap stocks.
5
The Torray Resolute Fund
FUND PROFILE
As of June 30, 2011 (unaudited)
| | | | |
DIVERSIFICATION (% of net assets) | | | | |
| |
Information Technology | | | 32.07% | |
Health Care | | | 15.44% | |
Energy | | | 10.03% | |
Industrials | | | 10.01% | |
Telecommunications | | | 6.98% | |
Consumer Staples | | | 6.97% | |
Financials | | | 6.10% | |
Materials | | | 5.02% | |
Consumer Discretionary | | | 2.94% | |
Short-Term Investments | | | 7.31% | |
Liabilities Less Other Assets | | | (2.87)% | |
| | | | |
| | | 100.00% | |
| | | | |
| | | | | | | | |
| TOP TEN EQUITY HOLDINGS (% of net assets) | |
| | |
| | 1. | | | Apple Inc. | | | 4.41 | % |
| | 2. | | | United Technologies Corp. | | | 4.01 | % |
| | 3. | | | Oracle Corp. | | | 3.99 | % |
| | 4. | | | Danaher Corp. | | | 3.99 | % |
| | 5. | | | Enbridge, Inc. | | | 3.99 | % |
| | 6. | | | American Tower Corp., Class A | | | 3.95 | % |
| | 7. | | | Visa Inc., Class A | | | 3.84 | % |
| | 8. | | | Amphenol Corp., Class A | | | 3.58 | % |
| | 9. | | | Franklin Resources, Inc. | | | 3.56 | % |
| | 10. | | | EOG Resources, Inc. | | | 3.50 | % |
| | | | | | | | |
| | | | | | | 38.82 | % |
| | | | | | | | |
| | | | | | | | |
PORTFOLIO CHARACTERISTICS | | | | | |
| | |
Net Assets (million) | | | | | | | $2 | |
Number of Holdings | | | | | | | 30 | |
Portfolio Turnover | | | | | | | 12.10% | * |
P/E Multiple (forward) | | | | | | | 16.4x | |
Portfolio Yield | | | | | | | 1.01% | |
Market Capitalization (billion) | | | Average | | | | $48.5 | |
| | | Median | | | | $32.6 | |
6
The Torray Resolute Fund
SCHEDULE OF INVESTMENTS
As of June 30, 2011 (unaudited)
| | | | | | | | | | |
| | | Shares | | | | | Market Value | |
| COMMON STOCK 95.56% | | | | |
| |
32.07% INFORMATION TECHNOLOGY | | | | |
| | | 324 | | | Apple Inc.* | | $ | 108,757 | |
| | | 2,989 | | | Oracle Corp. | | | 98,368 | |
| | | 1,123 | | | Visa Inc., Class A | | | 94,624 | |
| | | 1,636 | | | Amphenol Corp., Class A | | | 88,328 | |
| | | 1,175 | | | Fiserv Inc. * | | | 73,590 | |
| | | 1,215 | | | Accenture PLC, Class A | | | 73,410 | |
| | | 1,467 | | | MICROS Systems, Inc. * | | | 72,925 | |
| | | 1,191 | | | NetApp, Inc. * | | | 62,861 | |
| | | 1,962 | | | Adobe Systems, Inc. * | | | 61,705 | |
| | | 1,092 | | | Global Payments Inc. | | | 55,692 | |
| | | | | | | | | | |
| | | | | | | | | 790,260 | |
| |
15.44% HEALTH CARE | | | | |
| | | 1,438 | | | Baxter International Inc. | | | 85,834 | |
| | | 2,065 | | | Gilead Sciences, Inc. * | | | 85,512 | |
| | | 601 | | | Novo-Nordisk A/S, ADR | | | 75,293 | |
| | | 1,100 | | | Johnson & Johnson | | | 73,172 | |
| | | 868 | | | Varian Medical Systems, Inc. * | | | 60,777 | |
| | | | | | | | | | |
| | | | | | | | | 380,588 | |
| |
10.03% ENERGY | | | | |
| | | 3,026 | | | Enbridge, Inc. | | | 98,224 | |
| | | 826 | | | EOG Resources, Inc. | | | 86,358 | |
| | | 562 | | | Core Laboratories N.V. | | | 62,686 | |
| | | | | | | | | | |
| | | | | | | | | 247,268 | |
| |
10.01% INDUSTRIALS | | | | |
| | | 1,117 | | | United Technologies Corp. | | | 98,866 | |
| | | 1,854 | | | Danaher Corp. | | | 98,244 | |
| | | 480 | | | Cummins Inc. | | | 49,675 | |
| | | | | | | | | | |
| | | | | | | | | 246,785 | |
7
The Torray Resolute Fund
SCHEDULE OF INVESTMENTS (continued)
As of June 30, 2011 (unaudited)
| | | | | | | | | | |
| | | Shares | | | | | Market Value | |
| |
6.98% TELECOMMUNICATIONS | | | | |
| | | 1,859 | | | American Tower Corp., Class A * | | $ | 97,282 | |
| | | 1,389 | | | America Movil, ADR | | | 74,839 | |
| | | | | | | | | | |
| | | | | | | | | 172,121 | |
| |
6.97% CONSUMER STAPLES | | | | |
| | | 985 | | | Colgate-Palmolive Co. | | | 86,099 | |
| | | 1,215 | | | PepsiCo, Inc. | | | 85,572 | |
| | | | | | | | | | |
| | | | | | | | | 171,671 | |
| |
6.10% FINANCIALS | | | | |
| | | 668 | | | Franklin Resources, Inc. | | | 87,702 | |
| | | 1,528 | | | JPMorgan Chase & Co. | | | 62,556 | |
| | | | | | | | | | |
| | | | | | | | | 150,258 | |
| |
5.02% MATERIALS | | | | |
| | | 683 | | | Praxair, Inc. | | | 74,030 | |
| | | 576 | | | Compass Minerals International, Inc. | | | 49,576 | |
| | | | | | | | | | |
| | | | | | | | | 123,606 | |
| |
2.94% CONSUMER DISCRETIONARY | | | | |
| | | 806 | | | Nike, Inc., Class B | | | 72,524 | |
| | | | | | | | | | |
| TOTAL COMMON STOCK 95.56% | | | 2,355,081 | |
(cost $2,251,379) | | | | | | | |
| | | |
| | | Principal Amount ($) | | | | | | |
| |
| SHORT-TERM INVESTMENTS 7.31% | | | | |
| | | 180,210 | | | BNY Mellon Cash Reserve, 0.05%(1) | | $ | 180,210 | |
(cost $180,210) | | | | |
| | | | | | | | | | |
| TOTAL INVESTMENTS 102.87% | | | 2,535,291 | |
(cost $2,431,589) | | | | |
| |
| LIABILITIES LESS OTHER ASSETS (2.87%) | | | (70,685 | ) |
| | | | | | | | | | |
| NET ASSETS 100.00% | | $ | 2,464,606 | |
| | | | | | | | | | |
| * | | Non-income producing securities. |
| (1) | | Represents current yield at June 30, 2011. |
| ADR | | - American Depository Receipt |
See notes to the financial statements.
8
The Torray Resolute Fund
STATEMENT OF ASSETS AND LIABILITIES
As of June 30, 2011 (unaudited)
| | | | |
ASSETS | | | | |
Investments in securities at value
(cost $2,431,589) | | $ | 2,535,291 | |
Receivable for fund shares sold | | | 463,950 | |
Interest and dividends receivable | | | 555 | |
Prepaid expenses | | | 8,395 | |
| | | | |
TOTAL ASSETS | | | 3,008,191 | |
| | | | |
| |
LIABILITIES | | | | |
Payable for securities purchased | | | 528,158 | |
Accrued expenses | | | 15,427 | |
| | | | |
TOTAL LIABILITIES | | | 543,585 | |
| | | | |
| |
NET ASSETS | | $ | 2,464,606 | |
| | | | |
Paid-in-capital (229,152 shares outstanding, unlimited shares authorized) | | $ | 2,362,207 | |
Distributions in excess of net investment income | | | (910 | ) |
Accumulated net realized loss on investments | | | (393 | ) |
Net unrealized appreciation of investments | | | 103,702 | |
| | | | |
| |
TOTAL NET ASSETS | | $ | 2,464,606 | |
| | | | |
Net Asset Value, Offering and Redemption Price per Share | | $ | 10.76 | |
| | | | |
See notes to the financial statements.
9
The Torray Resolute Fund
STATEMENT OF OPERATIONS
For the six months ended June 30, 2011 (unaudited)
| | | | |
INVESTMENT INCOME | | | | |
Dividend income | | $ | 4,876 | |
Interest income | | | 17 | |
| | | | |
Total investment income | | | 4,893 | |
| | | | |
| |
EXPENSES | | | | |
Management fees | | | 4,642 | |
Transfer agent fees & expenses | | | 9,143 | |
Legal fees | | | 4,135 | |
Insurance expense | | | 2,241 | |
Trustees’ fees | | | 16,063 | |
Printing, postage & mailing | | | 2,458 | |
Audit fees | | | 6,884 | |
Registration & filing fees | | | 8,143 | |
Custodian fees | | | 1,967 | |
| | | | |
Total expenses | | | 55,676 | |
Fees waived and reimbursed by Adviser | | | (49,873 | ) |
| | | | |
Net expenses | | | 5,803 | |
| | | | |
NET INVESTMENT INCOME | | | (910 | ) |
| | | | |
| |
REALIZED AND UNREALIZED GAIN (LOSS) ON INVESTMENTS | | | | |
Net realized loss on investments | | | (393 | ) |
Net change in unrealized appreciation (depreciation) on investments | | | 103,702 | |
| | | | |
Net realized and unrealized gain on investments | | | 103,309 | |
| | | | |
NET INCREASE IN NET ASSETS FROM OPERATIONS | | $ | 102,399 | |
| | | | |
See notes to the financial statements.
10
The Torray Resolute Fund
STATEMENTS OF CHANGES IN NET ASSETS
For the periods indicated:
| | | | | | | | |
| | | Six months ended
06/30/11
(unaudited) | | | Period ended
12/31/10(1) | |
Increase (Decrease) in Net Assets from Operations: | | | | | | | | |
Net investment income (loss) | | $ | (910 | ) | | $ | — | |
Net realized loss on investments | | | (393 | ) | | | — | |
Net change in unrealized appreciation
(depreciation) on investments | | | 103,702 | | | | — | |
| | | | | | | | |
Net increase in net assets from operations | | | 102,399 | | | | — | |
| | | | | | | | |
| | |
Shares of Beneficial Interest | | | | | | | | |
Increase from share transactions | | | 2,262,207 | | | | 100,000 | |
| | | | | | | | |
Total increase | | | 2,364,606 | | | | 100,000 | |
| | |
Net Assets — Beginning of Period | | | 100,000 | | | | — | |
| | | | | | | | |
Net Assets — End of Period | | $ | 2,464,606 | | | $ | 100,000 | |
| | | | | | | | |
Distribution in Excess of Net Investment Income | | $ | (910 | ) | | $ | 0 | |
| | | | | | | | |
| (1) | | Commencement of operations on 12/31/10. |
See notes to the financial statements.
11
The Torray Resolute Fund
FINANCIAL HIGHLIGHTS
For a share outstanding throughout each period presented:
PER SHARE DATA
| | | | | | | | |
| | | Six months
ended
06/30/11
(unaudited) | | | Period
ended
12/31/10(3) | |
Net Asset Value, Beginning of Period | | $ | 10.000 | | | $ | 10.000 | |
| | | | | | | | |
Income/(loss) from investment operations | | | | | | | | |
Net investment loss | | | (0.010 | )(2) | | | 0.000 | |
Net gains (losses) on securities (both realized and unrealized) | | | 0.770 | | | | 0.000 | |
| | | | | | | | |
Total from investment operations | | | 0.760 | | | | 0.000 | |
| | | | | | | | |
Net Asset Value, End of Period | | $ | 10.760 | | | $ | 10.000 | |
| | | | | | | | |
TOTAL RETURN(1) | | | 7.60 | %** | | | 0.00 | % |
RATIOS/SUPPLEMENTAL DATA | | | | | | | | |
Net assets, end of period (000’s omitted) | | $ | 2,465 | | | $ | 100 | |
Ratios of expenses to average net assets before expense reimbursement | | | 12.02 | % | | | 0.00 | % |
Ratios of expenses to average net assets after expense reimbursement | | | 1.25 | %* | | | 0.00 | % |
Ratios of net investment income to average net assets | | | (0.20 | )%* | | | 0.00 | % |
Portfolio turnover rate | | | 12.10 | %** | | | 0.00 | % |
| (1) | | Past performance is not predictive of future performance. |
| (2) | | Calculated based on the average amount of shares outstanding during the period. |
| (3) | | Commencement of operations on 12/31/10. |
See notes to the financial statements.
12
The Torray Resolute Fund
NOTES TO FINANCIAL STATEMENTS
As of June 30, 2011 (unaudited)
NOTE 1 — SUMMARY OF SIGNIFICANT ACCOUNTING POLICIES
The Torray Resolute Fund (“Fund”) is a separate series of The Torray Fund (“Trust”). The Trust is registered under the Investment Company Act of 1940, as amended, as a no-load, diversified, open-end management investment company. The Trust was organized as a business trust under Massachusetts law and the Fund commenced operations on December 31, 2010. The Fund’s primary investment objective is to seek to achieve long-term growth of capital. The Fund seeks to meet its objective by investing its assets in a diversified portfolio of common stocks. In order to accomplish these goals, the Fund intends to hold stocks for the long term, as opposed to actively buying and selling. There can be no assurances that the Fund’s investment objectives will be achieved.
The following is a summary of accounting policies followed by the Fund in the preparation of its financial statements. These policies are in conformity with accounting principles generally accepted in the United States of America.
Securities Valuation Portfolio securities for which market quotations are readily available are valued at market value, which is determined by using the last reported sale price, or, if no sales are reported, the last reported bid price. For NASDAQ traded securities, market value is determined on the basis of the NASDAQ Official Closing Price instead of the last reported sales price. Other assets and securities for which no quotations are readily available or for which Torray LLC (the “Advisor”) believes do not reflect market value are valued at fair value as determined in good faith by the Advisor under the supervision of the Board of Trustees (the “Board” or “Trustees”) in accordance with the Fund’s Valuation Procedures. Short-term obligations having remaining maturities of 60 days or less are valued at amortized cost, which approximates market value.
Fair Value Measurements Various inputs are used in determining the fair value of investments which are as follows:
| | • | | Level 1 — quoted prices in active markets for identical securities |
| | • | | Level 2 — significant observable inputs (including quoted prices for similar securities, interest rates, prepayment speeds, credit risk, etc.) |
| | • | | Level 3 — significant unobservable inputs (including the Fund’s own assumptions in determining the fair value of investments) |
The inputs or methodology used for valuing securities are not necessarily an indication of the risk associated with investing in those securities.
13
The Torray Resolute Fund
NOTES TO FINANCIAL STATEMENTS (continued)
As of June 30, 2011 (unaudited)
The summary of inputs used to value the Fund’s investments as of June 30, 2011 is as follows:
| | | | |
Valuation Inputs | | | | |
Level 1 — Quoted Prices* | | $ | 2,535,291 | |
Level 2 — Other Significant Observable Inputs | | | — | |
Level 3 — Significant Unobservable Inputs | | | — | |
| | | | |
Total Market Value of Investments | | $ | 2,535,291 | |
| | | | |
| * | | Security types and industry classifications as defined in the Schedule of Investments. |
The Fund did not have significant transfers between Level 1 and Level 2 investments during the period.
Securities Transactions and Investment Income Securities transactions are recorded on a trade date basis. Realized gains and losses from securities transactions are recorded on the specific identification basis. Dividend income and distributions to shareholders are recorded on the ex-dividend date. Interest income, including amortization of discount on short-term investments, and expenses are recorded on the accrual basis. Premium and discount are amortized using the effective yield to maturity method.
Federal Income Taxes The Fund intends to continue to comply with the requirements of the Internal Revenue Code applicable to regulated investment companies and to distribute all of its taxable income, including any net realized gain on investments to its shareholders. Therefore, no Federal income tax provision is required.
Management has analyzed the Fund’s tax positions taken on federal income tax returns for the current year, and has concluded that no provision for federal income tax is required in the Fund’s financial statements. The Fund’s federal and state income and federal excise tax returns for tax years for which the applicable statutes of limitations have not expired are subject to examination by the Internal Revenue Service and state departments of revenue.
Net Asset Value The net asset value per share of the Fund is determined daily as of the close of trading on the New York Stock Exchange by dividing the value of the Fund’s net assets by the number of shares outstanding.
Interest Expense When cash balances are overdrawn in the Fund’s custody account, the Fund is charged an overdraft fee equal to 1.25% above the Federal Funds Rate. The Trust has entered into a line of credit facility with PNC Bank. Under the terms of the line of credit, the separate series of the Trust (including the Fund) may borrow up to $20,000,000 on a short-term basis with interest accruing at the Federal Funds Rate plus 0.75%. As of June 30, 2011, the Fund had no outstanding borrowings under this line of credit facility.
Use of Estimates In preparing financial statements in accordance with accounting principles generally accepted in the United States of America, management is required to make estimates and assumptions that affect the reported amounts of assets and liabilities and the disclosure of contingent assets and liabilities at the date of the
14
The Torray Resolute Fund
NOTES TO FINANCIAL STATEMENTS (continued)
As of June 30, 2011 (unaudited)
financial statements, and the reported amounts of increases and decreases in net assets from operations during the reporting period. Actual results could differ from those estimates.
NOTE 2 — SHARES OF BENEFICIAL INTEREST TRANSACTIONS
Transactions in shares of beneficial interest were as follows:
| | | | | | | | | | | | | | | | |
| | | Six months ended | | | Period ended | |
| | | 06/30/11 | | | 12/31/10 | |
| | | Shares | | | Amount | | | Shares | | | Amount | |
Shares issued | | | 220,590 | | | $ | 2,277,207 | | | | 10,000 | | | $ | 100,000 | |
Reinvestments of dividends and distributions | | | — | | | | — | | | | — | | | | — | |
Shares redeemed | | | (1,438 | ) | | | (15,000 | ) | | | — | | | | — | |
| | | | | | | | | | | | | | | | |
| | | 219,152 | | | $ | 2,262,207 | | | | 10,000 | | | $ | 100,000 | |
| | | | | | | | | | | | | | | | |
As of June 30, 2011, the Trust’s officers, Trustees and affiliated persons and their families directly or indirectly controlled 88,611 shares or 38.67% of the Fund.
NOTE 3 — INVESTMENT TRANSACTIONS
Purchases and sales of investment securities, other than short-term investments, for the six months ended June 30, 2011, aggregated $2,388,797 and $137,025, respectively.
NOTE 4 — MANAGEMENT FEES
Pursuant to the Management Contract, the Advisor provides investment advisory and administrative services to the Fund. The Fund pays the Advisor a management fee, computed daily and payable monthly at the annual rate of 1.00% of the Fund’s average daily net assets. For the six months ended June 30, 2011, the Fund incurred management fees of $4,642.
Excluding the management fee, other expenses incurred by the Fund during the six months ended June 30, 2011, totaled $51,034. During the period ended June 30, 2011 the Fund voluntarily waived expenses in the amount of $49,873 to maintain the Fund’s expense ratio at 1.25%. These expenses include all costs associated with the Fund’s operations including transfer agent fees, independent trustees’ fees ($14,000 per annum and $2,000 for each Board meeting attended per Trustee), dues, fees and expenses of registering and qualifying the Fund and its shares for distribution, charges of the custodian, auditing and legal expenses, insurance premiums, supplies, postage, expenses of issue or redemption of shares, reports to shareholders and Trustees, expenses of printing and mailing prospectuses, proxy statements and proxies to existing shareholders, and other miscellaneous expenses.
Certain officers and Trustees of the Fund are also officers and/or shareholders of the Advisor.
15
The Torray Resolute Fund
NOTES TO FINANCIAL STATEMENTS (continued)
As of June 30, 2011 (unaudited)
NOTE 5 — TAX MATTERS
Distributions to shareholders are determined in accordance with United States Federal income tax regulations, which may differ from accounting principles generally accepted in the United States of America.
The following information is based upon the federal tax basis of investment securities as of June 30, 2011:
| | | | | | |
Gross unrealized appreciation | | $ | 107,461 | | | |
Gross unrealized depreciation | | | (3,759 | ) | | |
| | | | | | |
Net unrealized appreciation | | $ | 103,702 | | | |
| | | | | | |
Cost | | $ | 2,431,589 | | | |
| | | | | | |
NOTE 6 — COMMITMENTS AND CONTINGENCIES
The Fund indemnifies its officers and Trustees for certain liabilities that may arise from their performance of their duties to the Fund. Additionally, in the normal course of business, the Fund enters into contracts that contain a variety of representations and warranties which provide general indemnifications. The Fund’s maximum exposure under these arrangements is unknown, as this would involve future claims that may be made against the Fund that have not yet occurred.
NOTE 7 — SUBSEQUENT EVENTS
Management has evaluated the impact of all subsequent events on the Fund through the date these financial statements were issued and has determined that there were no subsequent events requiring recognition or disclosure in the financial statements.
16
The Torray Resolute Fund
PORTFOLIO HOLDINGS, PROXY VOTING AND PROCEDURES
As of June 30, 2011 (unaudited)
The Fund files its complete schedule of portfolio holdings with the Securities and Exchange Commission (the “Commission”) for the first and third quarters of each fiscal year on Form N-Q. The Fund’s Forms N-Q are available on the Commission’s website at http://www.sec.gov. The Fund’s Forms N-Q may be reviewed and copied at the Commission’s Public Reference Room in Washington, D.C. Information on the operation of the Commission’s Public Reference Room may be obtained by calling 1-800-SEC-0330.
A description of the policies and procedures that the Fund uses to determine how to vote proxies relating to portfolio securities is available without charge, upon request, by calling 1-800-443-3036; and on the Commission’s website at http://www.sec.gov.
Information regarding how the Fund voted proxies relating to portfolio securities is available without charge, upon request, by calling 1-800-443-3036; and on the Commission’s website at http://www.sec.gov.
17
The Torray Resolute Fund
ABOUT YOUR FUND’S EXPENSES
As of June 30, 2011 (unaudited)
We believe it is important for you to understand the impact of costs on your investment. All mutual funds have operating expenses. As a shareholder of the Fund, you incur ongoing costs, including management fees, and other fund expenses. Operating expenses, which are deducted directly from the Fund’s gross income, directly reduce the investment return of the Fund.
A mutual fund’s expenses are expressed as a percentage of its average net assets. This figure is known as the expense ratio. The following examples are intended to help you understand the ongoing costs (in dollars) of investing in the Fund and to compare these costs with the ongoing costs of investing in other mutual funds. The examples below are based on an investment of $1,000 made at the beginning of the period shown and held for the entire period.
The table on the next page illustrates the Fund’s cost in two ways:
Actual Fund Return This section helps you estimate the actual expenses that you paid over the period. The “Ending Account Value” shown is derived from the Fund’s actual return, and the third column shows the operating expenses that would have been paid by an investor who started with $1,000 in the Fund. You may use the information here, together with the amount invested, to estimate the expenses that you paid over the period.
To do so, simply divide your account value by $1,000 (for example, an $8,600 account value divided by $1,000 = 8.6), then multiply the result by the number given for the Fund under the heading “Expenses Paid During Period” on the next page.
Hypothetical 5% Return This section is intended to help you compare your Fund’s costs with those of other mutual funds. It assumes that the Fund had an annual return of 5% before expenses, and that the expense ratio is unchanged. In this case, because the return used is not the Fund’s actual return, the results do not apply to your investment. The example is useful in making comparisons because the Commission requires all mutual funds to calculate expenses based on a 5% return. You can assess the Fund’s costs by comparing this hypothetical example with the hypothetical examples that appear in shareholder reports of other funds.
Note that expenses shown in the table are meant to highlight and help you compare ongoing costs only. The Fund does not charge transactions fees, such as purchase or redemption fees, nor does it carry a “sales load.”
The calculation assumes no shares were bought or sold during the period. Your actual costs may have been higher or lower, depending on the amount of your investment and the timing of any purchases or redemptions.
18
The Torray Resolute Fund
ABOUT YOUR FUND’S EXPENSES (continued)
As of June 30, 2011 (unaudited)
More information about the Fund’s expenses, including recent annual expense ratios, can be found in this report. For additional information on operating expenses and other shareholder costs, please refer to the Fund’s prospectus.
| | | | | | | | | | | | |
| | | Beginning
Account Value
January 1, 2011 | | | Ending
Account Value
June 30, 2011 | | | Expenses Paid
During Period* | |
Based on Actual Fund Return | | $ | 1,000.00 | | | $ | 1,076.00 | | | $ | 6.43 | |
Based on Hypothetical 5% Return | | $ | 1,000.00 | | | $ | 1,018.60 | | | $ | 6.26 | |
| * | | Expenses are equal to the Fund’s annualized expense ratio of 1.25% for the period, multiplied by the average account value over the period, multiplied by 181/365 (to reflect the one-half-year period). |
19
TRUSTEES
Carol Crawford
Bruce C. Ellis
William M Lane
Robert P. Moltz
Wayne H. Shaner
INVESTMENT ADVISOR
Torray LLC
OFFICERS
Robert E. Torray
William M Lane
Fred M. Fialco
Shawn M. Hendon
Nicholas C. Haffenreffer
Barbara C. Warder
INDEPENDENT REGISTERED PUBLIC ACCOUNTING FIRM
BBD, LLP
1835 Market Street, 26th Floor
Philadelphia, PA 19103
TRANSFER AGENT
BNY Mellon Investment Servicing (U.S.) Inc.
4400 Computer Drive
Westborough, MA 01581-1722
LEGAL COUNSEL
Dechert LLP
1775 I Street, N.W.
Washington, DC 20006
Distributed by BNY Mellon Distributors Inc.
760 Moore Road, King of Prussia, PA 19406-1212
Date of first use, August 2011
This report is not authorized for distribution to
prospective investors unless preceded or accompanied
by a current prospectus. All indices are unmanaged
groupings of stocks that are not available for
investment.
The
TORRAY
RESOLUTE
FUND
SEMI-ANNUAL REPORT
June 30, 2011
The Torray Resolute Fund
Suite 1100
7501 Wisconsin Avenue
Bethesda, Maryland 20814-6523
(301) 493-4600
(800) 443-3036
Not applicable.
| Item 3. | Audit Committee Financial Expert. |
Not applicable.
| Item 4. | Principal Accountant Fees and Services. |
Not applicable.
| Item 5. | Audit Committee of Listed registrants. |
Not applicable.
| (a) | | Schedule of Investments in securities of unaffiliated issuers as of the close of the reporting period is included as part of the report to shareholders filed under Item 1 of this form. |
| Item 7. | Disclosure of Proxy Voting Policies and Procedures for Closed-End Management Investment Companies. |
Not applicable.
| Item 8. | Portfolio Managers of Closed-End Management Investment Companies. |
Not applicable.
| Item 9. | Purchases of Equity Securities by Closed-End Management Investment Company and Affiliated Purchasers. |
Not applicable.
| Item 10. | Submission of Matters to a Vote of Security Holders. |
There have been no material changes to the procedures by which the shareholders may recommend nominees to the registrant’s board of directors, where those changes were implemented after the registrant last provided disclosure in response to the requirements of Item 407(c)(2)(iv) of Regulation S-K (17 CFR 229.407) (as required by Item 22(b)(15) of Schedule 14A (17 CFR 240.14a-101)), or this Item.
| Item 11. | Controls and Procedures. |
| | (a) | | The registrant’s principal executive and principal financial officers, or persons performing similar functions, have concluded that the registrant’s disclosure controls and procedures (as defined in Rule 30a-3(c) under the Investment Company Act of 1940, as amended (the “1940 Act”) (17 CFR 270.30a-3(c))) are effective, as of a date within 90 days of the filing date of the report that includes the disclosure required by this paragraph, based on their evaluation of these controls and procedures required by Rule 30a-3(b) under the 1940 Act (17 CFR 270.30a-3(b)) and Rules 13a-15(b) or 15d-15(b) under the Securities Exchange Act of 1934, as amended (17 CFR 240.13a-15(b) or 240.15d-15(b)). |
| | (b) | | There were no changes in the registrant’s internal control over financial reporting (as defined in Rule 30a-3(d) under the 1940 Act (17 CFR 270.30a-3(d)) that occurred during the registrant’s second fiscal quarter of the period covered by this report that has materially affected, or is reasonably likely to materially affect, the registrant’s internal control over financial reporting. |
| | (a)(2) | | Certifications pursuant to Rule 30a-2(a) under the 1940 Act and Section 302 of the Sarbanes-Oxley Act of 2002 are attached hereto. |
| | (b) | | Certifications pursuant to Rule 30a-2(b) under the 1940 Act and Section 906 of the Sarbanes- Oxley Act of 2002 are attached hereto. |
SIGNATURES
Pursuant to the requirements of the Securities Exchange Act of 1934 and the Investment Company Act of 1940, the registrant has duly caused this report to be signed on its behalf by the undersigned, thereunto duly authorized.
| | | | | | |
| (registrant) | | The Torray Fund |
| |
| By (Signature and Title)* | | /s/ Robert E. Torray |
| | | | | | Robert E. Torray, President |
| | | | | | (principal executive officer) |
| Date | | 8/10/11 |
Pursuant to the requirements of the Securities Exchange Act of 1934 and the Investment Company Act of 1940, this report has been signed below by the following persons on behalf of the registrant and in the capacities and on the dates indicated.
| | | | |
| |
By (Signature and Title)* | | /s/ Robert E. Torray |
| | | | Robert E. Torray, President |
| | | | (principal executive officer) |
| | |
| Date | | 8/10/11 | | |
| | | | |
| |
By (Signature and Title)* | | /s/ William M Lane |
| | | | William M Lane, Treasurer |
| | | | (principal financial officer) |
| | |
| Date | | 8/10/11 | | |
| * | | Print the name and title of each signing officer under his or her signature. |