UNITED STATES
SECURITIES AND EXCHANGE COMMISSION
Washington, D.C. 20549
FORM N-CSR
CERTIFIED SHAREHOLDER REPORT OF REGISTERED
MANAGEMENT INVESTMENT COMPANIES
Investment Company Act file number 811-06096
The Torray Fund
(Exact name of registrant as specified in charter)
7501 Wisconsin Avenue, Suite 1100
Bethesda, MD 20814-6523
(Address of principal executive offices) (Zip code)
William M Lane
Torray LLC
7501 Wisconsin Avenue, Suite 1100
Bethesda, MD 20814-6523
(Name and address of agent for service)
Registrant’s telephone number, including area code: 301-493-4600
Date of fiscal year end: December 31
Date of reporting period: June 30, 2010
| Item 1. | Reports to Stockholders. |
The Report to Shareholders is attached herewith.
The Torray Fund
Letter to Shareholders
August 2, 2010
Dear Fellow Shareholders,
The Torray Fund depreciated 4.2% during the first half of 2010, reversing gains from earlier in the year; the Standard & Poor’s 500 Index was down 6.7%. On the brighter side, our Fund advanced 18.5% over the last 12 months, the Index, 14.4%. Although, from an investment perspective, the past decade was the worst in 80 years, we were fortunate to have eked out a 4.4% total return in a market that lost just shy of 15%. While this is not a story we like to tell, the good news is we think the darkest chapters are closed. Problems clearly remain, but they are not on a scale comparable to those we’ve all endured in recent years.
In sharp contrast to stocks, bonds performed exceptionally well over the period, compounding at about 6% annually. This caused investors to move huge sums out of stocks into bonds, particularly during the crash. As a result of this massive capital shift, the market remains locked in the doghouse, even though stocks, compared to bonds, are now the cheapest they’ve been in 60 years. This shows once again that investors can’t stop viewing life through a rearview mirror, favoring assets that have done the best and rejecting those that have performed the worst. Economic and business fundamentals play no role. It’s all about the direction and momentum of prices. Inevitably, when trends reverse, those on the wrong side of the equation suffer losses. Put another way, if all the money ends up in one place, you can be sure it’s the wrong place.
The situation today is dramatically different. While stock prices are up significantly since the spring of 2009, they remain undervalued and evidence suggests the financial crisis has passed. Earnings have risen and balance sheets are strong with cash at record levels. The price-to-earnings ratio on stocks in The Torray Fund averages about 12-to-1, representing an earnings yield of 8.3%. If these earnings are reinvested and P/E’s on the portfolio remain flat, the collective value of the businesses will double in less than nine years, although actual Fund returns may differ. Should earnings grow, which we’re confident they will, fundamental underlying results will be even more favorable. By comparison, a decade ago, the market’s P/E ratio was 26-to-1 for an earnings yield of less than 4%. At that rate, it takes 18 years for money to double. Just as important, the financial and competitive strengths of quality businesses provide a solid cushion against permanent loss. Over the nearly 40 years we’ve been in business, there have been nine market declines, three of them severe. The shares of most solid companies nevertheless recovered and rewarded their owners over time.
In spite of the disappointing last 10 years, our Fund managed a 9.1% compound annual return over its 19 1/2-year history, turning $1 into $5.50. Today’s heavily favored government
1
The Torray Fund
Letter to Shareholders (continued)
August 2, 2010
bonds yielded 5.5% on average, boosting $1 to only $2.84. But, they now pay little more than half that, guaranteeing bond holders will do far worse in the future. If inflation ignites, rates will rise and bonds will go down, possibly a lot, creating a no-win situation for those that already own them. For example, if the yield on today’s 10-year issue jumped to match its 5.5% average for the last 20 years, the bond’s price would fall 20% (equivalent to a 2,200 point loss on the Dow Jones Average). We have mentioned in past letters that in the early ‘80s, raging inflation drove bonds down and interest rates up by unimaginable percentages. Before the cycle ended, 30-year governments yielded over 15%, nearly four times present-day rates, yet investors wouldn’t touch them. We will add here that as it relates to the risk of inflation, government bonds are no more than I.O.U.’s, dependent for payback on the printing of money by an entity that can print all it wants. Our opinion is that investors, in the long run, will fare much better owning a diversified list of profitable growing businesses. If stocks were to take five years to advance a mere 10% — an unduly pessimistic scenario in our view — their return would exceed interest payments to maturity on today’s five-year government bonds (1.57%). Assuming dividends don’t increase, which seems unlikely, the total return would still be nearly three times that of the latest five-year issue. For those seeking a shorter-term investment, prospects are slim. Three-year IBM bonds pay 1% and 2-year governments, 1/2 of 1%.
In earlier letters we have critically addressed the numerous murky financial innovations that have rattled markets and frightened the public to the point where countless investors have abandoned stocks. Hardly a day goes by that we don’t hear about it from friends and acquaintances. Any faith they had in long-term investing is now gone and relentless criticism of the approach by doomsayers has only reinforced their skepticism. The new message is forget buy and hold, start trading, nail down profits and cut losses at the first sign of trouble. But this is not new. Speculative trading has been a prominent feature on Wall Street for over 100 years, though as far as we know, nobody’s ever made money at it for long.
This new paradigm has triggered a shift in focus by stock analysts and market strategists from studying long-term business fundamentals to predicting next-quarter earnings and guessing their likely impact on share prices. Regrettably, these forecasts and how they pan out have become the central theme of TV business shows. Our position is that quarterly earnings are largely meaningless in a long-term context, a point that’s been made over the years by a number of thoughtful corporate CEO’s. We suspect a lot of them wish analysts would just drop the subject. The only certainty about earnings is they fluctuate. Despite this reality, business show hosts work
2
The Torray Fund
Letter to Shareholders (continued)
August 2, 2010
themselves into a frenzy every three months as the fabled “earnings season” comes around. When reports are due, there’s teeth gnashing and nail biting about whether sales, earnings and cash flow will beat, meet or miss analysts’ targets. Typically, if just one measure falls short by a percentage point or two, the stock sinks. Many of our holdings have succumbed to this, only to recover in subsequent days or weeks. In other cases, if the numbers meet expectations, the shares go down anyway. This often reflects bets by speculators that have bought in thinking the news will be good, intending to sell if they’re right. If they are, they unload in a flash, sending the price down before anyone can figure out what’s going on. It brings to mind the old Wall Street adage, “buy on the rumor, sell on the news.”
Without getting into detail — we’ve discussed this before — flash trading and other computer-controlled strategies, along with machinations of the type just noted, are the major cause of today’s market volatility. Their defenders claim these tactics benefit the public by improving liquidity. The truth is long-term investors don’t need liquidity. They’re not buying to sell the next day, week, or year, and, in any event, over time, how much difference can five or ten cents a share make? The fact is the operators of these schemes are in the business of making money the fast way, even if it’s only in fractions of pennies per share on positions reportedly held for only seconds or minutes. The gain may not sound like much, but on the billions of shares they trade each day — estimated at 40%-70% of the Exchange’s volume — it adds up. This has to be a zero sum game — that is, they can’t all be winning. If they are, someone else must be losing, and most likely it’s the public.
There is no way to tell how these disquieting and irritating side shows will play out in the short run. We believe investors should ignore them, think long term, exercise patience and, above all, keep in mind that value is in the business, not the stock. Regardless of current uncertainties, it is important to remember there has never been a time in history, and we mean never, when challenges, no matter how serious, were not met. That includes panics in the late 1800’s, the 1930’s Depression, two World Wars and more. Leaving aside the spring of 2009, the stocks of quality companies appear to be better values today than at any time in 15 years. They represent a terrific opportunity, especially relative to the alternatives.
In closing, we are very pleased to let you know that we have recently acquired Resolute Capital Management, a firm run by Nicholas Haffenreffer, whom we’ve known for a long time. Nicholas has 20 years of investment experience, 12 of them successfully steering Resolute, which he founded in 1998. He and his team follow the same philosophy we’ve employed for nearly 40
3
The Torray Fund
Letter to Shareholders (continued)
August 2, 2010
years, and we welcome them as a solid addition to our organization. There will be no change in the investment approach used to manage The Torray Fund.
We thank you for your investment and assure you we are dedicated, as always, to your best interests. If you ever have any questions, please let us hear from you.
| | | | | | |
| | Sincerely, | | | | |
| | | |
| |  | | | | |
| | Robert E. Torray | | | | |
| | 
| | | | |
| | Fred M. Fialco | | | | |
| | 
| | | | |
| | Shawn M. Hendon | | | | |
| | | | | | |
4
The Torray Fund
PERFORMANCE DATA
As of June 30, 2010 (unaudited)
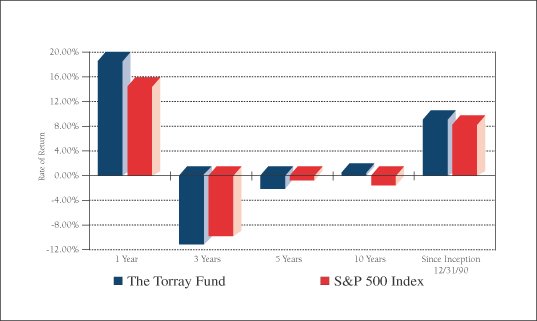
Average Annual Returns on an Investment in
The Torray Fund vs. the S&P 500 Index
For the periods ended June 30, 2010:
| | | | | | | | | | | | | | | |
| | | 1 Year | | | 3 Years | | | 5 Years | | | 10 Years | | | Since
Inception
12/31/90 | |
The Torray Fund | | 18.50 | % | | -11.15 | % | | -2.16 | % | | 0.43 | % | | 9.09 | % |
S&P 500 Index | | 14.43 | % | | -9.81 | % | | -0.79 | % | | -1.59 | % | | 8.22 | % |
Cumulative Returns for the 19 1/2 years ended June 30, 2010
| | | |
The Torray Fund | | 445.38 | % |
S&P 500 Index | | 366.51 | % |
5
The Torray Fund
PERFORMANCE DATA (continued)
As of June 30, 2010 (unaudited)
Change in Value of $10,000 Invested
on December 31, 1990 (commencement of operations) to:
| | | | | | | | | | | | | | | | | | | | | |
| | | 12/31/92 | | 12/31/95 | | 12/31/98 | | 12/31/01 | | 12/31/04 | | 12/31/07 | | 06/30/10 |
The Torray Fund | | $ | 14,523 | | $ | 23,796 | | $ | 45,576 | | $ | 54,325 | | $ | 63,227 | | $ | 72,908 | | $ | 54,538 |
S&P 500 Index | | $ | 14,047 | | $ | 21,547 | | $ | 45,438 | | $ | 44,054 | | $ | 48,811 | | $ | 62,716 | | $ | 46,651 |

The returns quoted represent past performance and do not guarantee future results. Investment return and principal value will fluctuate so that shares, when redeemed, may be worth more or less than their original cost. Current performance may be lower or higher. Returns current to the most recent month-end are available at www.torray.com. The returns shown do not reflect the deduction of taxes a shareholder would pay on the redemption of fund shares and distributions. The Fund’s gross annual operating expense ratio, as stated in the current prospectus, is 1.21%. Returns on both The Torray Fund and the S&P 500 Index assume reinvestment of all dividends and distributions. The S&P 500 Index is an unmanaged index consisting of 500 U.S. large-cap stocks.
6
The Torray Fund
FUND PROFILE
As of June 30, 2010 (unaudited)
| | |
DIVERSIFICATION (% of net assets) | | |
| |
Information Technology | | 22.45% |
Financials | | 17.27 |
Health Care | | 16.90 |
Industrials | | 11.12 |
Consumer Discretionary | | 8.97 |
Consumer Staples | | 7.29 |
Telecommunications | | 3.14 |
Materials | | 2.70 |
Short-Term Investments | | 10.16 |
Other Assets Less Liabilities | | 0.00 |
| | |
| | 100.00% |
| | | | | |
TOP TEN EQUITY HOLDINGS (% of net assets) | |
| 1. | | Loews Corp. | | 3.83 | % |
| 2. | | International Business Machines Corp. | | 3.81 | |
| 3. | | Procter & Gamble Co. (The) | | 3.70 | |
| 4. | | Kraft Foods Inc., Class A | | 3.58 | |
| 5. | | Marsh & McLennan Cos., Inc. | | 3.48 | |
| 6. | | Johnson & Johnson | | 3.42 | |
| 7. | | Western Union Co. (The) | | 3.35 | |
| 8. | | Cintas Corp. | | 3.26 | |
| 9. | | EMC Corp. | | 3.24 | |
| 10. | | Cisco Systems, Inc. | | 3.23 | |
| | | | | |
| | | | 34.90 | % |
| | | | | |
PORTFOLIO CHARACTERISTICS | | | |
| | |
Net Assets (million) | | | | $331 | |
Number of Holdings | | | | 31 | |
Portfolio Turnover | | | | 9.46% | * |
P/E Multiple (forward) | | | | 11.1x | |
Portfolio Yield | | | | 2.15% | |
Market Capitalization (billion) | | Average | | $56.0 | |
| | Median | | $31.3 | |
7
The Torray Fund
SCHEDULE OF INVESTMENTS
As of June 30, 2010 (unaudited)
| | | | | | | |
| | | Shares | | | | Market Value |
| COMMON STOCK 89.84% | | | |
22.45% INFORMATION TECHNOLOGY | | | |
| | 102,200 | | International Business Machines Corp. | | $ | 12,619,656 |
| | 742,300 | | Western Union Co. (The) | | | 11,067,693 |
| | 585,600 | | EMC Corp.* | | | 10,716,480 |
| | 501,800 | | Cisco Systems, Inc.* | | | 10,693,358 |
| | 539,600 | | Intel Corp. | | | 10,495,220 |
| | 796,875 | | Applied Materials, Inc. | | | 9,578,437 |
| | 226,500 | | Automatic Data Processing, Inc. | | | 9,118,890 |
| | | | | | | |
| | | | | | | 74,289,734 |
17.27% FINANCIALS | | | |
| | 380,400 | | Loews Corp. | | | 12,671,124 |
| | 511,218 | | Marsh & McLennan Cos., Inc. | | | 11,527,966 |
| | 380,500 | | Wells Fargo & Co. | | | 9,740,800 |
| | 187,200 | | Chubb Corp. | | | 9,361,872 |
| | 219,300 | | American Express Co. | | | 8,706,210 |
| | 1,201,496 | | LaBranche & Co Inc.* | | | 5,142,403 |
| | | | | | | |
| | | | | | | 57,150,375 |
16.90% HEALTH CARE | | | |
| | 191,724 | | Johnson & Johnson | | | 11,323,219 |
| | 364,200 | | UnitedHealth Group Inc. | | | 10,343,280 |
| | 203,800 | | Abbott Laboratories | | | 9,533,764 |
| | 188,400 | | WellPoint, Inc.* | | | 9,218,412 |
| | 133,700 | | Becton Dickinson & Co. | | | 9,040,794 |
| | 158,700 | | Baxter International Inc. | | | 6,449,568 |
| | | | | | | |
| | | | | | | 55,909,037 |
11.12% INDUSTRIALS | | | |
| | 449,946 | | Cintas Corp. | | | 10,785,205 |
| | 118,900 | | 3M Co. | | | 9,391,911 |
| | 603,797 | | General Electric Co. | | | 8,706,754 |
| | 134,700 | | General Dynamics Corp. | | | 7,888,032 |
| | | | | | | |
| | | | | | | 36,771,902 |
See notes to the financial statements.
8
The Torray Fund
SCHEDULE OF INVESTMENTS (continued)
As of June 30, 2010 (unaudited)
| | | | | | | |
| | | Shares | | | | Market Value |
| |
8.97% CONSUMER DISCRETIONARY | | | |
| | 332,100 | | McGraw-Hill Cos. Inc. (The) | | $ | 9,345,294 |
| | 169,820 | | O’Reilly Automotive, Inc.* | | | 8,076,639 |
| | 221,000 | | Walt Disney Co. (The) | | | 6,961,500 |
| | 394,200 | | Gannett Co., Inc. | | | 5,305,932 |
| | | | | | | |
| | | | | | | 29,689,365 |
| |
7.29% CONSUMER STAPLES | | | |
| | 204,300 | | Procter & Gamble Co. (The) | | | 12,253,914 |
| | 423,300 | | Kraft Foods Inc., Class A | | | 11,852,400 |
| | | | | | | |
| | | | | | | 24,106,314 |
| |
3.14% TELECOMMUNICATIONS | | | |
| | 429,300 | | AT&T Inc. | | | 10,384,767 |
| |
2.70% MATERIALS | | | |
| | 258,100 | | E.I. du Pont de Nemours & Co. | | | 8,927,679 |
| | | | | | | |
| TOTAL COMMON STOCK 89.84% | | | 297,229,173 |
(cost $319,710,395) | | | | | |
| | | |
| | | Principal
Amount ($) | | | | |
| SHORT-TERM INVESTMENTS 10.16% | | | |
| | 33,600,110 | | PNC Bank Money Market Account, 0.05%(1) | | | 33,600,110 |
(cost $33,600,110) | | | |
| | | | | | | |
| TOTAL INVESTMENTS 100.00% | | | 330,829,283 |
(cost $353,310,505) | | | |
| |
| OTHER ASSETS LESS LIABILITIES 0.00% | | | 12,814 |
| | | | | | | |
| NET ASSETS 100.00% | | $ | 330,842,097 |
| | | | | | | |
| * | | Non-income producing securities. |
| (1) | | Represents current yield at June 30, 2010. |
See notes to the financial statements.
9
The Torray Fund
STATEMENT OF ASSETS AND LIABILITIES
As of June 30, 2010 (unaudited)
| | | | |
ASSETS | | | | |
Investments in securities at value
(cost $353,310,505) | | $ | 330,829,283 | |
Interest and dividends receivable | | | 488,843 | |
Receivable for fund shares sold | | | 54,329 | |
Prepaid expenses | | | 64,558 | |
| | | | |
TOTAL ASSETS | | | 331,437,013 | |
| | | | |
| |
LIABILITIES | | | | |
Payable to advisor | | | 283,154 | |
Payable for fund shares redeemed | | | 178,409 | |
Payable for legal fees | | | 47,768 | |
Payable for printing fees | | | 47,427 | |
Accrued expenses | | | 37,078 | |
Payable to trustees | | | 1,080 | |
| | | | |
TOTAL LIABILITIES | | | 594,916 | |
| | | | |
| |
NET ASSETS | | $ | 330,842,097 | |
| | | | |
Shares of beneficial interest ($1 stated value,
12,952,917 shares outstanding, unlimited
shares authorized) | | $ | 12,952,917 | |
Paid-in-capital in excess of par | | | 436,132,475 | |
Accumulated undistributed net investment income | | | 189 | |
Accumulated net realized loss on investments | | | (95,762,262 | ) |
Net unrealized depreciation of investments | | | (22,481,222 | ) |
| | | | |
| |
TOTAL NET ASSETS | | $ | 330,842,097 | |
| | | | |
Net Asset Value, Offering and Redemption Price per Share | | $ | 25.54 | |
| | | | |
See notes to the financial statements.
10
The Torray Fund
STATEMENT OF OPERATIONS
For the six months ended June 30, 2010 (unaudited)
| | | | |
INVESTMENT INCOME | | | | |
Dividend income | | $ | 3,547,519 | |
Interest income | | | 10,103 | |
| | | | |
Total investment income | | | 3,557,622 | |
| | | | |
| |
EXPENSES | | | | |
Management fees | | | 1,795,543 | |
Transfer agent fees & expenses | | | 151,557 | |
Printing, postage & mailing | | | 52,356 | |
Legal fees | | | 34,777 | |
Insurance expense | | | 30,543 | |
Trustees’ fees | | | 24,580 | |
Audit fees | | | 18,761 | |
Registration & filing fees | | | 12,454 | |
Custodian fees | | | 10,770 | |
| | | | |
Total expenses | | | 2,131,341 | |
| | | | |
| |
NET INVESTMENT INCOME | | | 1,426,281 | |
| | | | |
| |
REALIZED AND UNREALIZED GAIN (LOSS)
ON INVESTMENTS | | | | |
Net realized loss on investments | | | (1,112,834 | ) |
Net change in unrealized appreciation (depreciation) on investments | | | (14,456,398 | ) |
| | | | |
Net realized and unrealized loss on investments | | | (15,569,232 | ) |
| | | | |
NET DECREASE IN NET ASSETS FROM OPERATIONS | | $ | (14,142,951 | ) |
| | | | |
See notes to the financial statements.
11
The Torray Fund
STATEMENTS OF CHANGES IN NET ASSETS
For the periods indicated:
| | | | | | | | |
| | | Six months ended
06/30/10
(unaudited) | | | Year ended
12/31/09 | |
Increase (Decrease) in Net Assets from Operations: | | | | | | | | |
Net investment income | | $ | 1,426,281 | | | $ | 2,980,550 | |
Net realized loss on investments | | | (1,112,834 | ) | | | (43,082,102 | ) |
Net change in unrealized appreciation
(depreciation) on investments | | | (14,456,398 | ) | | | 113,618,716 | |
| | | | | | | | |
Net increase (decrease) in net assets from operations | | | (14,142,951 | ) | | | 73,517,164 | |
| | | | | | | | |
| | |
Distributions to Shareholders from: | | | | | | | | |
Net investment income ($0.109 and
$0.204 per share, respectively) | | | (1,426,092 | ) | | | (2,980,744 | ) |
| | | | | | | | |
Total distributions | | | (1,426,092 | ) | | | (2,980,744 | ) |
| | | | | | | | |
Shares of Beneficial Interest | | | | | | | | |
Decrease from share transactions | | | (16,602,410 | ) | | | (60,967,912 | ) |
| | | | | | | | |
Total increase (decrease) | | | (32,171,453 | ) | | | 9,568,508 | |
| | |
Net Assets — Beginning of Period | | | 363,013,550 | | | | 353,445,042 | |
| | | | | | | | |
Net Assets — End of Period | | $ | 330,842,097 | | | $ | 363,013,550 | |
| | | | | | | | |
Undistributed Net Investment Income | | $ | 189 | | | $ | — | |
| | | | | | | | |
See notes to the financial statements.
12
The Torray Fund
FINANCIAL HIGHLIGHTS
For a share outstanding throughout each period presented:
PER SHARE DATA
| | | | | | | | | | | | | | | | | | | | | | | | |
| | | Six months
ended
06/30/10
(unaudited) | | | Years ended December 31: | |
| | | | 2009 | | | 2008 | | | 2007 | | | 2006 | | | 2005 | |
Net Asset Value,
Beginning of Period | | $ | 26.760 | | | $ | 21.640 | | | $ | 36.440 | | | $ | 41.570 | | | $ | 39.020 | | | $ | 41.080 | |
| | | | | | | | | | | | | | | | | | | | | | | | |
Income/(loss) from investment operations | | | | | | | | | | | | | | | | | | | | | | | | |
Net investment income | | | 0.108 | (2) | | | 0.200 | (2) | | | 0.243 | (2) | | | 0.152 | | | | 0.073 | | | | 0.133 | |
Net gains (losses) on securities (both realized and unrealized) | | | (1.219 | ) | | | 5.124 | | | | (13.464 | ) | | | (0.443 | ) | | | 5.176 | | | | 0.653 | |
| | | | | | | | | | | | | | | | | | | | | | | | |
Total from investment operations | | | (1.111 | ) | | | 5.324 | | | | (13.221 | ) | | | (0.291 | ) | | | 5.249 | | | | 0.786 | |
| | | | | | | | | | | | | | | | | | | | | | | | |
Less: distributions | | | | | | | | | | | | | | | | | | | | | | | | |
Dividends (from net investment
income) | | | (0.109 | ) | | | (0.204 | ) | | | (0.303 | ) | | | (0.121 | ) | | | (0.087 | ) | | | (0.133 | ) |
Distributions (from capital gains) | | | — | | | | — | | | | (1.242 | ) | | | (4.718 | ) | | | (2.612 | ) | | | (2.713 | ) |
Distributions (from return of capital) | | | — | | | | — | | | | (0.034 | ) | | | — | | | | — | | | | — | |
| | | | | | | | | | | | | | | | | | | | | | | | |
Total distributions | | | (0.109 | ) | | | (0.204 | ) | | | (1.579 | ) | | | (4.839 | ) | | | (2.699 | ) | | | (2.846 | ) |
| | | | | | | | | | | | | | | | | | | | | | | | |
Net Asset Value,
End of Period | | $ | 25.540 | | | $ | 26.760 | | | $ | 21.640 | | | $ | 36.440 | | | $ | 41.570 | | | $ | 39.020 | |
| | | | | | | | | | | | | | | | | | | | | | | | |
TOTAL RETURN(1) | | | (4.18 | %)** | | | 24.80 | % | | | (37.39 | %) | | | (0.80 | %) | | | 13.74 | % | | | 2.08 | % |
RATIOS/SUPPLEMENTAL DATA | | | | | | | | | | | | | | | | | | | | | | | | |
Net assets, end of period
(000’s omitted) | | $ | 330,842 | | | $ | 363,014 | | | $ | 353,445 | | | $ | 1,000,344 | | | $ | 1,198,919 | | | $ | 1,329,951 | |
Ratios of expenses to average net
assets | | | 1.19 | %* | | | 1.21 | % | | | 1.13 | % | | | 1.09 | % | | | 1.10 | % | | | 1.07 | % |
Ratios of net investment income to
average net assets | | | 0.79 | %* | | | 0.89 | % | | | 0.80 | % | | | 0.36 | % | | | 0.18 | % | | | 0.34 | % |
Portfolio turnover rate | | | 9.46 | %** | | | 15.87 | % | | | 28.13 | % | | | 50.47 | % | | | 21.92 | % | | | 33.16 | % |
| (1) | | Past performance is not predictive of future performance. |
| (2) | | Calculated based on the average amount of shares outstanding during the period. |
See notes to the financial statements.
13
The Torray Fund
NOTES TO FINANCIAL STATEMENTS
As of June 30, 2010 (unaudited)
NOTE 1 — SUMMARY OF SIGNIFICANT ACCOUNTING POLICIES
The Torray Fund (“Fund”) is a separate series of The Torray Fund (“Trust”). The Trust is registered under the Investment Company Act of 1940, as amended, as a no-load, diversified, open-end management investment company. The Trust was organized as a business trust under Massachusetts law. The Fund’s primary investment objective is to provide long-term total return. The Fund seeks to meet its objective by investing its assets in a diversified portfolio of common stocks. In order to accomplish these goals, the Fund intends to hold stocks for the long term, as opposed to actively buying and selling. There can be no assurances that the Fund’s investment objectives will be achieved.
The following is a summary of accounting policies followed by the Fund in the preparation of its financial statements. These policies are in conformity with accounting principles generally accepted in the United States of America.
Securities Valuation Portfolio securities for which market quotations are readily available are valued at market value, which is determined by using the last reported sale price, or, if no sales are reported, the last reported bid price. For NASDAQ traded securities, market value is determined on the basis of the NASDAQ official closing price instead of the last reported sales price. Other assets and securities for which no quotations are readily available or for which Torray LLC (the “Advisor”) believes do not reflect market value are valued at fair value as determined in good faith by the Advisor under the supervision of the Board of Trustees (the “Board” or “Trustees”) in accordance with the Fund’s Valuation Procedures. Short-term obligations having remaining maturities of 60 days or less are valued at amortized cost, which approximates market value.
Fair Value Measurements Various inputs are used in determining the fair value of investments which are as follows:
Level 1 — quoted prices in active markets for identical securities
Level 2 — significant observable inputs (including quoted prices for similar securities, interest rates, prepayment speeds, credit risk, etc.)
Level 3 — significant unobservable inputs (including the Fund’s own assumptions in determining the fair value of investments)
The inputs or methodology used for valuing securities are not necessarily an indication of the risk associated with investing in those securities.
14
The Torray Fund
NOTES TO FINANCIAL STATEMENTS (continued)
As of June 30, 2010 (unaudited)
The summary of inputs used to value the Fund’s net assets as of June 30, 2010 is as follows:
| | | |
Valuation Inputs | | | |
Level 1 — Quoted Prices * | | $ | 330,829,283 |
Level 2 — Other Significant Observable Inputs | | | — |
Level 3 — Significant Unobservable Inputs | | | — |
| | | |
Total Market Value of Investments | | $ | 330,829,283 |
| | | |
| * | | Security types and industry classifications as defined in the Schedule of Investments. |
In January 2010, the Financial Accounting Standards Board issued Accounting Standards Update (“ASU”) No. 2010-06, “Improving Disclosures about Fair Value Measurements.” ASU 2010-06 clarifies existing disclosure and requires additional disclosures regarding fair value measurements. Effective for fiscal years beginning after December 15, 2010, and for interim periods within those fiscal years, entities will need to disclose information about purchases, sales, issuances and settlements of Level 3 securities on a gross basis, rather than as a net number as currently required.
Securities Transactions and Investment Income Securities transactions are recorded on a trade date basis. Realized gains and losses from securities transactions are recorded on the specific identification basis. Dividend income and distributions to shareholders are recorded on the ex-dividend date. Interest income, including amortization of discount on short-term investments, and expenses are recorded on the accrual basis. Premium and discount are amortized using the effective yield to maturity method.
Federal Income Taxes The Fund intends to continue to comply with the requirements of the Internal Revenue Code applicable to regulated investment companies and to distribute all of its taxable income, including any net realized gain on investments to its shareholders. Therefore, no Federal income tax provision is required.
Management has analyzed the Fund’s tax positions taken on federal income tax returns for all open tax years (current and prior three tax years), and has concluded that no provision for federal income tax is required in the Fund’s financial statements. The Fund’s federal and state income and federal excise tax returns for tax years for which the applicable statutes of limitations have not expired are subject to examination by the Internal Revenue Service and state departments of revenue.
Net Asset Value The net asset value per share of the Fund is determined daily as of the close of trading on the New York Stock Exchange by dividing the value of the Fund’s net assets by the number of shares outstanding.
Interest Expense When cash balances are overdrawn in the Fund’s custody account, the Fund is charged an overdraft fee equal to 1.25% above the Federal Funds Rate.
15
The Torray Fund
NOTES TO FINANCIAL STATEMENTS (continued)
As of June 30, 2010 (unaudited)
Use of Estimates In preparing financial statements in accordance with accounting principles generally accepted in the United States of America, management is required to make estimates and assumptions that affect the reported amounts of assets and liabilities and the disclosure of contingent assets and liabilities at the date of the financial statements, and the reported amounts of increases and decreases in net assets from operations during the reporting period. Actual results could differ from those estimates.
NOTE 2 — SHARES OF BENEFICIAL INTEREST TRANSACTIONS
Transactions in shares of beneficial interest were as follows:
| | | | | | | | | | | | | | |
| | | Six months ended
06/30/10 | | | Year ended
12/31/09 | |
| | | Shares | | | Amount | | | Shares | | | Amount | |
Shares issued | | 307,746 | | | $ | 8,592,500 | | | 149,751 | | | $ | 3,200,077 | |
Reinvestments of dividends and distributions | | 49,111 | | | | 1,342,292 | | | 127,284 | | | | 2,811,759 | |
Shares redeemed | | (967,780 | ) | | | (26,537,202 | ) | | (3,044,625 | ) | | | (66,979,748 | ) |
| | | | | | | | | | | | | | |
| | (610,923 | ) | | $ | (16,602,410 | ) | | (2,767,590 | ) | | $ | (60,967,912 | ) |
| | | | | | | | | | | | | | |
As of June 30, 2010, the Trust’s officers, Trustees and affiliated persons and their families directly or indirectly controlled 1,332,701 shares or 10.29% of the Fund.
NOTE 3 — INVESTMENT TRANSACTIONS
Purchases and sales of investment securities, other than short-term investments, for the six months ended June 30, 2010, aggregated $29,934,840 and $31,240,260, respectively.
NOTE 4 — MANAGEMENT FEES
Pursuant to the Management Contract, the Advisor provides investment advisory and administrative services to the Fund. The Fund pays the Advisor a management fee, computed daily and payable monthly at the annual rate of 1.00% of the Fund’s average daily net assets. For the six months ended June 30, 2010, the Fund incurred management fees of $1,795,543.
Excluding the management fee, other expenses incurred by the Fund during the six months ended June 30, 2010, totaled $335,798. These expenses include all costs associated with the Fund’s operations including transfer agent fees, independent trustees’ fees ($14,000 per annum and $2,000 for each Board meeting attended per Trustee), dues, fees and expenses of registering and qualifying the Fund and its shares for distribution, charges of custodian,
16
The Torray Fund
NOTES TO FINANCIAL STATEMENTS (continued)
As of June 30, 2010 (unaudited)
auditing and legal expenses, insurance premiums, supplies, postage, expenses of issue or redemption of shares, reports to shareholders and Trustees, expenses of printing and mailing prospectuses, proxy statements and proxies to existing shareholders, and other miscellaneous expenses.
Certain officers and Trustees of the Fund are also officers and/or shareholders of the Advisor.
NOTE 5 — TAX MATTERS
Distributions to shareholders are determined in accordance with United States Federal income tax regulations, which may differ from accounting principles generally accepted in the United States of America.
The tax character of distributions paid during the year ended December 31, 2009 was as follows:
| | | |
Distributions paid from: | | | |
Ordinary income | | $ | 2,980,744 |
| | | |
| | $ | 2,980,744 |
| | | |
The primary difference between book basis and tax basis distributions is differing book and tax treatment of short-term capital gains.
At December 31, 2009, the Fund had net capital loss carry forward for federal income tax purposes of $561,440 and $90,980,681 which are available to reduce future required distributions of net capital gains to shareholders through 2016 and 2017, respectively.
At December 31, 2009, The Torray Fund had deferred post-October losses of $3,107,307.
The following information is based upon the federal tax basis of investment securities as of June 30, 2010:
| | | | | | |
Gross unrealized appreciation | | $ | 28,094,782 | | | |
Gross unrealized depreciation | | | (50,576,004 | ) | | |
| | | | | | |
Net unrealized depreciation | | $ | (22,481,222 | ) | | |
| | | | | | |
Cost | | $ | 353,310,505 | | | |
| | | | | | |
17
The Torray Fund
NOTES TO FINANCIAL STATEMENTS (continued)
As of June 30, 2010 (unaudited)
NOTE 6 — COMMITMENTS AND CONTINGENCIES
The Fund indemnifies its officers and Trustees for certain liabilities that may arise from their performance of their duties to the Fund. Additionally, in the normal course of business, the Fund enters into contracts that contain a variety of representations and warranties which provide general indemnifications. The Fund’s maximum exposure under these arrangements is unknown, as this would involve future claims that may be made against the Fund that have not yet occurred.
NOTE 7 — SUBSEQUENT EVENTS
Management has evaluated the impact of all subsequent events on the Fund and has determined that there were no subsequent events requiring recognition or disclosure in the financial statements.
18
The Torray Fund
PORTFOLIO HOLDINGS, PROXY VOTING AND PROCEDURES
As of June 30, 2010 (unaudited)
The Fund files its complete schedule of portfolio holdings with the Securities and Exchange Commission (the “Commission”) for the first and third quarters of each fiscal year on Form N-Q. The Fund’s Forms N-Q are available on the Commission’s website at http://www.sec.gov. The Fund’s Forms N-Q may be reviewed and copied at the Commission’s Public Reference Room in Washington, D.C. Information on the operation of the Commission’s Public Reference Room may be obtained by calling 1-800-SEC-0330.
A description of the policies and procedures that the Fund uses to determine how to vote proxies relating to portfolio securities is available without charge, upon request, by calling 1-800-443-3036; and on the Commission’s website at http://www.sec.gov.
Information regarding how the Fund voted proxies relating to portfolio securities is available without charge, upon request, by calling 1-800-443-3036; and on the Commission’s website at http://www.sec.gov.
19
The Torray Fund
ABOUT YOUR FUND’S EXPENSES
As of June 30, 2010 (unaudited)
We believe it is important for you to understand the impact of costs on your investment. All mutual funds have operating expenses. As a shareholder of the Fund, you incur ongoing costs, including management fees, and other fund expenses. Operating expenses, which are deducted directly from the Fund’s gross income, directly reduce the investment return of the Fund.
A mutual fund’s expenses are expressed as a percentage of its average net assets. This figure is known as the expense ratio. The following examples are intended to help you understand the ongoing costs (in dollars) of investing in the Fund and to compare these costs with the ongoing costs of investing in other mutual funds. The examples below are based on an investment of $1,000 made at the beginning of the period shown and held for the entire period.
The table on the next page illustrates the Fund’s cost in two ways:
Actual Fund Return — This section helps you estimate the actual expenses that you paid over the period. The “Ending Account Value” shown is derived from the Fund’s actual return, and the third column shows the operating expenses that would have been paid by an investor who started with $1,000 in the Fund. You may use the information here, together with the amount invested, to estimate the expenses that you paid over the period.
To do so, simply divide your account value by $1,000 (for example, an $8,600 account value divided by $1,000 = 8.6), then multiply the result by the number given for the Fund under the heading “Expenses Paid During Period” on the next page.
Hypothetical 5% Return — This section is intended to help you compare your Fund’s costs with those of other mutual funds. It assumes that the Fund had an annual return of 5% before expenses, and that the expense ratio is unchanged. In this case, because the return used is not the Fund’s actual return, the results do not apply to your investment. The example is useful in making comparisons because the Commission requires all mutual funds to calculate expenses based on a 5% return. You can assess the Fund’s costs by comparing this hypothetical example with the hypothetical examples that appear in shareholder reports of other funds.
Note that expenses shown in the table are meant to highlight and help you compare ongoing costs only. The Fund does not charge transactions fees, such as purchase or redemption fees, nor does it carry a “sales load.”
The calculation assumes no shares were bought or sold during the period. Your actual costs may have been higher or lower, depending on the amount of your investment and the timing of any purchases or redemptions.
20
The Torray Fund
ABOUT YOUR FUND’S EXPENSES (continued)
As of June 30, 2010 (unaudited)
More information about the Fund’s expenses, including recent annual expense ratios, can be found in this report. For additional information on operating expenses and other shareholder costs, please refer to the Fund’s prospectus.
| | | | | | | | | |
| | | Beginning
Account Value
January 1, 2010 | | Ending
Account Value
June 30, 2010 | | Expenses Paid
During Period* |
Based on Actual Fund Return | | $ | 1,000.00 | | $ | 958.20 | | $ | 5.78 |
Based on Hypothetical 5% Return
(before expenses) | | $ | 1,000.00 | | $ | 1,018.89 | | $ | 5.96 |
| * | | Expenses are equal to the Fund’s annualized expense ratio of 1.19% for the period, multiplied by the average account value over the period, multiplied by 181/365 (to reflect the one-half year period). |
21
TRUSTEES
Carol Crawford
Bruce C. Ellis
William M Lane
Robert P. Moltz
Wayne H. Shaner
INVESTMENT ADVISOR
Torray LLC
OFFICERS
Robert E. Torray
William M Lane
Fred M. Fialco
Shawn M. Hendon
Nicholas C. Haffenreffer
INDEPENDENT REGISTERED
PUBLIC ACCOUNTING FIRM
BBD, LLP
1835 Market Street, 26th Floor
Philadelphia, PA 19103
TRANSFER AGENT
BNY Mellon Investment Servicing (U.S.) Inc.
101 Sabin Street
Pawtucket, RI 02860-1427
LEGAL COUNSEL
Dechert LLP
1775 I Street, N.W.
Washington, DC 20006
Distributed by BNY Mellon Distributors Inc.
760 Moore Road, King of Prussia, PA 19406-1212
Date of first use, August 2010
This report is not authorized for distribution to
prospective investors unless preceded or accompanied
by a current prospectus. All indices are unmanaged
groupings of stocks that are not available for
investment.
The
TORRAY
FUND
SEMI-ANNUAL REPORT
June 30, 2010
The Torray Fund
Suite 1100
7501 Wisconsin Avenue
Bethesda, Maryland 20814-6523
(301) 493-4600
(800) 443-3036
The Torray Institutional Fund
Letter to Shareholders
August 2, 2010
Dear Fellow Shareholders,
The Torray Institutional Fund depreciated 4% during the first half of 2010, reversing gains from earlier in the year; the Standard & Poor’s 500 Index was down 6.7%. On the brighter side, it advanced 21.1% over the last 12 months, the Index, 14.4%. Since the Fund’s inception nine years ago, it eked out a 5.6% total return, while the Index was essentially unchanged. From an investment perspective, this was about the worst period in 80 years. While this is not a story we like to tell, the good news is we think the darkest chapters are closed. Problems clearly remain, but they are not on a scale comparable to those we’ve all endured in recent years.
In sharp contrast to stocks, bonds performed exceptionally well over the period, compounding at about 6% annually. This caused investors to move huge sums out of stocks into bonds, particularly during the crash. As a result of this massive capital shift, the market remains locked in the doghouse, even though stocks, compared to bonds, are now the cheapest they’ve been in 60 years. This shows once again that investors can’t stop viewing life through a rearview mirror, favoring assets that have done the best and rejecting those that have performed the worst. Economic and business fundamentals play no role. It’s all about the direction and momentum of prices. Inevitably, when trends reverse, those on the wrong side of the equation suffer losses. Put another way, if all the money ends up in one place, you can be sure it’s the wrong place.
The situation today is dramatically different. While stock prices are up significantly since the spring of 2009, they remain undervalued and evidence suggests the financial crisis has passed. Earnings have risen and balance sheets are strong with cash at record levels. The price-to-earnings ratio on stocks in the Institutional Fund averages about 12-to-1, representing an earnings yield of 8.3%. If these earnings are reinvested and P/E’s on the portfolio remain flat, the collective value of the businesses will double in less than nine years, although actual Fund returns may differ. Should earnings grow, which we’re confident they will, fundamental underlying results will be even more favorable. By comparison, a decade ago, the market’s P/E ratio was 26-to-1 for an earnings yield of less than 4%. At that rate, it takes 18 years for money to double. Just as important, the financial and competitive strengths of quality businesses provide a solid cushion against permanent loss. Over the nearly 40 years we’ve been in business, there have been nine market declines, three of them severe. The shares of most solid companies nevertheless recovered and rewarded their owners over time.
1
The Torray Institutional Fund
Letter to Shareholders (continued)
August 2, 2010
Today’s heavily favored government bonds yielded 5.5% on average over the last 20 years, but they now pay little more than half that, guaranteeing bond holders will do far worse in the future. If inflation ignites, rates will rise and bonds will go down, possibly a lot, creating a no-win situation for those that already own them. For example, if the yield on today’s 10-year issue jumped to match its 5.5% average for the last 20 years, the bond’s price would fall 20% (equivalent to a 2,200 point loss on the Dow Jones Average). We have mentioned in past letters that in the early ‘80s, raging inflation drove bonds down and interest rates up by unimaginable percentages. Before the cycle ended, 30-year governments yielded over 15%, nearly four times present-day rates, yet investors wouldn’t touch them. We will add here that as it relates to the risk of inflation, government bonds are no more than I.O.U.’s, dependent for payback on the printing of money by an entity that can print all it wants. Our opinion is that investors, in the long run, will fare much better owning a diversified list of profitable growing businesses. If stocks were to take five years to advance a mere 10% — an unduly pessimistic scenario in our view — their return would exceed interest payments to maturity on today’s five-year government bonds (1.57%). Assuming dividends don’t increase, which seems unlikely, the total return would still be nearly three times that of the latest five-year issue. For those seeking a shorter-term investment, prospects are slim. Three-year IBM bonds pay 1% and 2-year governments, 1/2 of 1%.
In earlier letters we have critically addressed the numerous murky financial innovations that have rattled markets and frightened the public to the point where countless investors have abandoned stocks. Hardly a day goes by that we don’t hear about it from friends and acquaintances. Any faith they had in long-term investing is now gone and relentless criticism of the approach by doomsayers has only reinforced their skepticism. The new message is forget buy and hold, start trading, nail down profits and cut losses at the first sign of trouble. But this is not new. Speculative trading has been a prominent feature on Wall Street for over 100 years, though as far as we know, nobody’s ever made money at it for long.
This new paradigm has triggered a shift in focus by stock analysts and market strategists from studying long-term business fundamentals to predicting next-quarter earnings and guessing their likely impact on share prices. Regrettably, these forecasts and how they pan out have become the central theme of TV business shows. Our position is that quarterly earnings are largely meaningless in a long-term context, a point that’s been made over the years by a number of thoughtful corporate CEO’s. We suspect a lot of them wish analysts would just drop the subject. The only certainty about earnings is they fluctuate. Despite this reality, business show hosts work
2
The Torray Institutional Fund
Letter to Shareholders (continued)
August 2, 2010
themselves into a frenzy every three months as the fabled “earnings season” comes around. When reports are due, there’s teeth gnashing and nail biting about whether sales, earnings and cash flow will beat, meet or miss analysts’ targets. Typically, if just one measure falls short by a percentage point or two, the stock sinks. Many of our holdings have succumbed to this, only to recover in subsequent days or weeks. In other cases, if the numbers meet expectations, the shares go down anyway. This often reflects bets by speculators that have bought in thinking the news will be good, intending to sell if they’re right. If they are, they unload in a flash, sending the price down before anyone can figure out what’s going on. It brings to mind the old Wall Street adage, “buy on the rumor, sell on the news.”
Without getting into detail — we’ve discussed this before — flash trading and other computer-controlled strategies, along with machinations of the type just noted, are the major cause of today’s market volatility. Their defenders claim these tactics benefit the public by improving liquidity. The truth is long-term investors don’t need liquidity. They’re not buying to sell the next day, week, or year, and, in any event, over time, how much difference can five or ten cents a share make? The fact is the operators of these schemes are in the business of making money the fast way, even if it’s only in fractions of pennies per share on positions reportedly held for only seconds or minutes. The gain may not sound like much, but on the billions of shares they trade each day — estimated at 40%-70% of the Exchange’s volume — it adds up. This has to be a zero sum game — that is, they can’t all be winning. If they are, someone else must be losing, and most likely it’s the public.
There is no way to tell how these disquieting and irritating side shows will play out in the short run. We believe investors should ignore them, think long term, exercise patience and, above all, keep in mind that value is in the business, not the stock. Regardless of current uncertainties, it is important to remember there has never been a time in history, and we mean never, when challenges, no matter how serious, were not met. That includes panics in the late 1800’s, the 1930’s Depression, two World Wars and more. Leaving aside the spring of 2009, the stocks of quality companies appear to be better values today than at any time in 15 years. They represent a terrific opportunity, especially relative to the alternatives.
In closing, we are very pleased to let you know that we have recently acquired Resolute Capital Management, a firm run by Nicholas Haffenreffer, whom we’ve known for a long time. Nicholas has 20 years of investment experience, 12 of them successfully steering Resolute, which
3
The Torray Institutional Fund
Letter to Shareholders (continued)
August 2, 2010
he founded in 1998. He and his team follow the same philosophy we’ve employed for nearly 40 years, and we welcome them as a solid addition to our organization. There will be no change in the investment approach used to manage The Torray Institutional Fund.
We thank you for your investment and assure you we are dedicated, as always, to your best interests. If you ever have any questions, please let us hear from you.
| | | | | | |
| | Sincerely, | | | | |
| | | |
| |  | | | | |
| | Robert E. Torray | | | | |
| | 
| | | | |
| | Fred M. Fialco | | | | |
| | 
| | | | |
| | Shawn M. Hendon | | | | |
4
The Torray Institutional Fund
PERFORMANCE DATA
As of June 30, 2010 (unaudited)
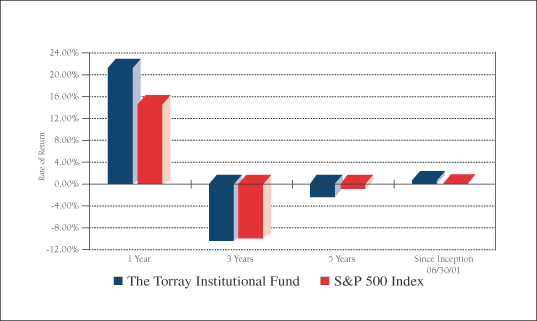
Average Annual Returns on an Investment in
The Torray Institutional Fund vs. the S&P 500 Index
For the periods ended June 30, 2010:
| | | | | | | | | | | | |
| | | 1 Year | | | 3 Years | | | 5 Years | | | Since
Inception
06/30/01 | |
The Torray Institutional Fund | | 21.06 | % | | -10.29 | % | | -2.30 | % | | 0.60 | % |
S&P 500 Index | | 14.43 | % | | -9.81 | % | | -0.79 | % | | 0.01 | % |
Cumulative Returns for the 9 years ended June 30, 2010
| | | |
The Torray Institutional Fund | | 5.58 | % |
S&P 500 Index | | 0.04 | % |
5
The Torray Institutional Fund
PERFORMANCE DATA (continued)
As of June 30, 2010 (unaudited)
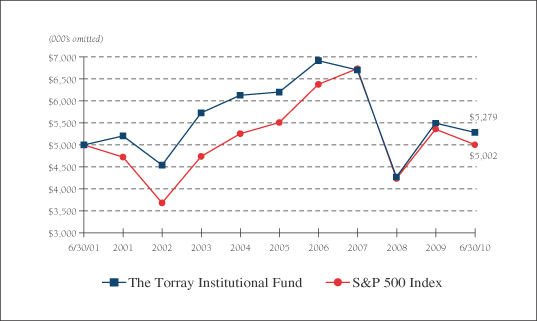
Change in Value of $5,000,000 Invested
on June 30, 2001 (commencement of operations) to:
| | | | | | | | | | | | | | | |
| | | 12/31/02 | | 12/31/04 | | 12/31/06 | | 12/31/08 | | 06/30/10 |
The Torray Institutional Fund | | $ | 4,537,000 | | $ | 6,123,000 | | $ | 6,908,000 | | $ | 4,272,000 | | $ | 5,279,000 |
S&P 500 Index | | $ | 3,682,500 | | $ | 5,255,500 | | $ | 6,373,000 | | $ | 4,237,380 | | $ | 5,002,000 |
The returns quoted represent past performance and do not guarantee future results. Investment return and principal value will fluctuate so that shares, when redeemed, may be worth more or less than their original cost. Current performance may be lower or higher. Returns current to the most recent month-end are available at www.torray.com. The returns shown do not reflect the deduction of taxes a shareholder would pay on the redemption of fund shares and distributions. The Fund’s gross annual operating expense ratio, as stated in the current prospectus, is 0.85%. Returns on both The Torray Institutional Fund and the S&P 500 Index assume reinvestment of all dividends and distributions. The S&P 500 Index is an unmanaged index consisting of 500 U.S. large-cap stocks.
6
The Torray Institutional Fund
FUND PROFILE
As of June 30, 2010 (unaudited)
| | |
DIVERSIFICATION (% of net assets) | | |
| |
Information Technology | | 20.63% |
Financials | | 16.60 |
Health Care | | 15.66 |
Industrials | | 10.23 |
Consumer Discretionary | | 8.29 |
Consumer Staples | | 6.39 |
Telecommunications | | 2.76 |
Materials | | 2.39 |
Short-Term Investments | | 17.06 |
Liabilities Less Other Assets | | (0.01) |
| | |
| | 100.00% |
| | | | | |
TOP TEN EQUITY HOLDINGS (% of net assets) | |
| 1. | | Loews Corp. | | 3.76 | % |
| 2. | | International Business Machines Corp. | | 3.34 | |
| 3. | | Western Union Co. (The) | | 3.29 | |
| 4. | | Procter & Gamble Co. (The) | | 3.25 | |
| 5. | | EMC Corp. | | 3.20 | |
| 6. | | Kraft Foods Inc., Class A | | 3.15 | |
| 7. | | UnitedHealth Group Inc. | | 3.07 | |
| 8. | | Marsh & McLennan Cos., Inc. | | 3.06 | |
| 9. | | Johnson & Johnson | | 3.00 | |
| 10. | | Wells Fargo & Co. | | 2.89 | |
| | | | | |
| | | | 32.01 | % |
| | | | | |
PORTFOLIO CHARACTERISTICS | | | |
| | |
Net Assets (million) | | | | $19 | |
Number of Holdings | | | | 31 | |
Portfolio Turnover | | | | 7.66% | * |
P/E Multiple (forward) | | | | 11.1x | |
Portfolio Yield | | | | 1.95% | |
Market Capitalization (billion) | | Average | | $56.0 | |
| | Median | | $31.3 | |
7
The Torray Institutional Fund
SCHEDULE OF INVESTMENTS
As of June 30, 2010 (unaudited)
| | | | | | | |
| | | Shares | | | | Market Value |
| COMMON STOCK 82.95% | | | |
| |
20.63% INFORMATION TECHNOLOGY | | | |
| | 5,100 | | International Business Machines Corp. | | $ | 629,748 |
| | 41,600 | | Western Union Co. (The) | | | 620,256 |
| | 32,942 | | EMC Corp. * | | | 602,839 |
| | 27,956 | | Intel Corp. | | | 543,744 |
| | 25,200 | | Cisco Systems, Inc. * | | | 537,012 |
| | 12,616 | | Automatic Data Processing, Inc. | | | 507,920 |
| | 37,193 | | Applied Materials, Inc. | | | 447,060 |
| | | | | | | |
| | | | | | | 3,888,579 |
| |
16.60% FINANCIALS | | | |
| | 21,300 | | Loews Corp. | | | 709,503 |
| | 25,617 | | Marsh & McLennan Cos., Inc. | | | 577,664 |
| | 21,300 | | Wells Fargo & Co. | | | 545,280 |
| | 10,500 | | Chubb Corp. | | | 525,105 |
| | 12,223 | | American Express Co. | | | 485,253 |
| | 67,119 | | LaBranche & Co Inc. * | | | 287,269 |
| | | | | | | |
| | | | | | | 3,130,074 |
| |
15.66% HEALTH CARE | | | |
| | 20,400 | | UnitedHealth Group Inc. | | | 579,360 |
| | 9,564 | | Johnson & Johnson | | | 564,850 |
| | 10,500 | | WellPoint, Inc. * | | | 513,765 |
| | 10,100 | | Abbott Laboratories | | | 472,478 |
| | 6,800 | | Becton Dickinson & Co. | | | 459,816 |
| | 8,900 | | Baxter International Inc. | | | 361,696 |
| | | | | | | |
| | | | | | | 2,951,965 |
| |
10.23% INDUSTRIALS | | | |
| | 22,692 | | Cintas Corp. | | | 543,927 |
| | 6,500 | | 3M Co. | | | 513,435 |
| | 30,319 | | General Electric Co. | | | 437,200 |
| | 7,400 | | General Dynamics Corp. | | | 433,344 |
| | | | | | | |
| | | | | | | 1,927,906 |
See notes to the financial statements.
8
The Torray Institutional Fund
SCHEDULE OF INVESTMENTS (continued)
As of June 30, 2010 (unaudited)
| | | | | | | | |
| | | Shares | | | | Market Value | |
| |
8.29% CONSUMER DISCRETIONARY | | | | |
| | 16,700 | | McGraw-Hill Cos. Inc. (The) | | $ | 469,938 | |
| | 8,525 | | O’Reilly Automotive, Inc. * | | | 405,449 | |
| | 12,410 | | Walt Disney Co. (The) | | | 390,915 | |
| | 22,000 | | Gannett Co., Inc. | | | 296,120 | |
| | | | | | | | |
| | | | | | | 1,562,422 | |
| |
6.39% CONSUMER STAPLES | | | | |
| | 10,200 | | Procter & Gamble Co. (The) | | | 611,796 | |
| | 21,200 | | Kraft Foods Inc., Class A | | | 593,600 | |
| | | | | | | | |
| | | |
| | | | | | | 1,205,396 | |
| |
2.76% TELECOMMUNICATIONS | | | | |
| | 21,500 | | AT&T Inc. | | | 520,085 | |
| |
2.39% MATERIALS | | | | |
| | 13,000 | | E.I. du Pont de Nemours & Co. | | | 449,670 | |
| | | | | | | | |
| TOTAL COMMON STOCK 82.95% | | | 15,636,097 | |
(cost $17,488,338) | | | | | | |
| | | |
| | | Principal
Amount ($) | | | | | |
| SHORT-TERM INVESTMENTS 17.06% | | | | |
| | 3,215,375 | | PNC Bank Money Market Account, 0.05%(1) | | | 3,215,375 | |
(cost $3,215,375) | | | | | | |
| | | | | | | | |
| TOTAL INVESTMENTS 100.01% | | | 18,851,472 | |
(cost $20,703,713) | | | | | | |
| |
| LIABILITIES LESS OTHER ASSETS (0.01%) | | | (993 | ) |
| | | | | | | | |
| NET ASSETS 100.00% | | $ | 18,850,479 | |
| | | | | | | | |
| * | | Non-income producing securities. |
| (1) | | Represents current yield at June 30, 2010. |
See notes to the financial statements.
9
The Torray Institutional Fund
STATEMENT OF ASSETS AND LIABILITIES
As of June 30, 2010 (unaudited)
| | | | |
ASSETS | | | | |
Investments in securities at value
(cost $20,703,713) | | $ | 18,851,472 | |
Interest and dividends receivable | | | 26,272 | |
| | | | |
TOTAL ASSETS | | | 18,877,744 | |
| | | | |
| |
LIABILITIES | | | | |
Payable for fund shares redeemed | | | 7,321 | |
Payable to advisor | | | 19,944 | |
| | | | |
TOTAL LIABILITIES | | | 27,265 | |
| | | | |
| |
NET ASSETS | | $ | 18,850,479 | |
| | | | |
Shares of beneficial interest ($1 stated value,
314,001 shares outstanding, unlimited
shares authorized) | | $ | 314,001 | |
Paid-in-capital in excess of par | | | 24,908,399 | |
Accumulated undistributed net investment income | | | 38 | |
Accumulated net realized loss on investments | | | (4,519,718 | ) |
Net unrealized depreciation of investments | | | (1,852,241 | ) |
| | | | |
| |
TOTAL NET ASSETS | | $ | 18,850,479 | |
| | | | |
Net Asset Value, Offering and Redemption Price per Share | | $ | 60.03 | |
| | | | |
See notes to the financial statements.
10
The Torray Institutional Fund
STATEMENT OF OPERATIONS
For the six months ended June 30, 2010 (unaudited)
| | | | |
INVESTMENT INCOME | | | | |
Dividend income | | $ | 182,891 | |
Interest income | | | 894 | |
| | | | |
Total investment income | | | 183,785 | |
| | | | |
| |
EXPENSES | | | | |
Management fees | | | 85,743 | |
| | | | |
Total expenses | | | 85,743 | |
| | | | |
NET INVESTMENT INCOME | | | 98,042 | |
| | | | |
REALIZED AND UNREALIZED LOSS
ON INVESTMENTS | | | | |
Net realized loss on investments | | | (45,014 | ) |
Net change in unrealized appreciation (depreciation) on investments | | | (807,552 | ) |
| | | | |
Net realized and unrealized loss on investments | | | (852,566 | ) |
| | | | |
NET DECREASE IN NET ASSETS FROM OPERATIONS | | $ | (754,524 | ) |
| | | | |
See notes to the financial statements.
11
The Torray Institutional Fund
STATEMENTS OF CHANGES IN NET ASSETS
For the periods indicated:
| | | | | | | | |
| | | Six months ended
06/30/10
(unaudited) | | | Year ended
12/31/09 | |
Increase (Decrease) in Net Assets from Operations: | | | | | | | | |
Net investment income | | $ | 98,042 | | | $ | 203,148 | |
Net realized loss on investments | | | (45,014 | ) | | | (1,097,450 | ) |
Net change in unrealized appreciation
(depreciation) on investments | | | (807,552 | ) | | | 5,382,730 | |
| | | | | | | | |
Net increase (decrease) in net assets from operations | | | (754,524 | ) | | | 4,488,428 | |
| | | | | | | | |
| | |
Distributions to Shareholders from: | | | | | | | | |
Net investment income ($0.311 and
$0.609 per share, respectively) | | | (98,004 | ) | | | (203,153 | ) |
| | | | | | | | |
Total distributions | | | (98,004 | ) | | | (203,153 | ) |
| | | | | | | | |
| | |
Shares of Beneficial Interest | | | | | | | | |
Decrease from share transactions | | | (620,294 | ) | | | (1,655,402 | ) |
| | | | | | | | |
Total increase (decrease) | | | (1,472,822 | ) | | | 2,629,873 | |
| | |
Net Assets — Beginning of Period | | | 20,323,301 | | | | 17,693,428 | |
| | | | | | | | |
Net Assets — End of Period | | $ | 18,850,479 | | | $ | 20,323,301 | |
| | | | | | | | |
Undistributed Net Investment Income | | $ | 38 | | | $ | — | |
| | | | | | | | |
See notes to the financial statements.
12
The Torray Institutional Fund
FINANCIAL HIGHLIGHTS
For a share outstanding throughout each period presented:
PER SHARE DATA
| | | | | | | | | | | | | | | | | | | | | | | | |
| | | Six months
ended
06/30/10
(unaudited) | | | Years ended December 31: | |
| | | | 2009 | | | 2008 | | | 2007 | | | 2006 | | | 2005 | |
Net Asset Value,
Beginning of Period | | $ | 62.790 | | | $ | 49.400 | | | $ | 80.800 | | | $ | 108.640 | | | $ | 111.920 | | | $ | 116.290 | |
| | | | | | | | | | | | | | | | | | | | | | | | |
Income/(loss) from investment operations: | | | | | | | | | | | | | | | | | | | | | | | | |
Net investment income | | | 0.309 | (3) | | | 0.605 | (3) | | | 0.687 | (3) | | | 0.896 | | | | 0.720 | | | | 0.616 | |
Net gains (losses) on securities (both realized and unrealized) | | | (2.758 | ) | | | 13.394 | | | | (29.336 | ) | | | (4.074 | ) | | | 11.587 | | | | 0.748 | (2) |
| | | | | | | | | | | | | | | | | | | | | | | | |
Total from investment operations | | | (2.449 | ) | | | 13.999 | | | | (28.649 | ) | | | (3.178 | ) | | | 12.307 | | | | 1.364 | |
| | | | | | | | | | | | | | | | | | | | | | | | |
Less: distributions | | | | | | | | | | | | | | | | | | | | | | | | |
Dividends (from net investment
income) | | | (0.311 | ) | | | (0.609 | ) | | | (0.770 | ) | | | (0.716 | ) | | | (0.790 | ) | | | (0.616 | ) |
Distributions (from capital gains) | | | — | | | | — | | | | (1.889 | ) | | | (23.946 | ) | | | (14.797 | ) | | | (5.118 | ) |
Distributions (from return of capital) | | | — | | | | — | | | | (0.092 | ) | | | — | | | | — | | | | — | |
| | | | | | | | | | | | | | | | | | | | | | | | |
Total distributions | | | (0.311 | ) | | | (0.609 | ) | | | (2.751 | ) | | | (24.662 | ) | | | (15.587 | ) | | | (5.734 | ) |
| | | | | | | | | | | | | | | | | | | | | | | | |
Net Asset Value,
End of Period | | $ | 60.030 | | | $ | 62.790 | | | $ | 49.400 | | | $ | 80.800 | | | $ | 108.640 | | | $ | 111.920 | |
| | | | | | | | | | | | | | | | | | | | | | | | |
TOTAL RETURN(1) | | | (3.93 | %)** | | | 28.61 | % | | | (36.24 | %) | | | (3.01 | %) | | | 11.40 | % | | | 1.28 | % |
RATIOS/SUPPLEMENTAL DATA | | | | | | | | | | | | | | | | | | | | | | | | |
Net assets, end of period
(000’s omitted) | | $ | 18,850 | | | $ | 20,323 | | | $ | 17,693 | | | $ | 46,689 | | | $ | 205,851 | | | $ | 400,665 | |
Ratios of expenses to average net
assets | | | 0.85 | %* | | | 0.85 | % | | | 0.85 | % | | | 0.85 | % | | | 0.85 | % | | | 0.85 | % |
Ratios of net investment income to average net
assets | | | 0.97 | %* | | | 1.16 | % | | | 1.00 | % | | | 0.66 | % | | | 0.60 | % | | | 0.59 | % |
Portfolio turnover rate | | | 7.66 | %** | | | 18.60 | % | | | 32.00 | % | | | 44.32 | % | | | 24.26 | % | | | 53.66 | % |
| (1) | | Past performance is not predictive of future performance. |
| (2) | | The amount shown for the year ended December 31, 2005 for a share outstanding throughout the year does not accord with the aggregate net losses on investments reported in the statement of operations for the year because of the timing of sales and repurchases of Fund shares in relation to fluctuating market value of the investments of the Fund. |
| (3) | | Calculated based on the average amount of shares outstanding during the period. |
See notes to the financial statements.
13
The Torray Institutional Fund
NOTES TO FINANCIAL STATEMENTS
As of June 30, 2010 (unaudited)
NOTE 1 — SUMMARY OF SIGNIFICANT ACCOUNTING POLICIES
The Torray Institutional Fund (“Fund”) is a separate series of The Torray Fund (“Trust”). The Trust is registered under the Investment Company Act of 1940, as amended, as a no-load, diversified, open-end management investment company. The Trust was organized as a business trust under Massachusetts law and the Fund commenced operations on June 30, 2001. The Fund’s primary investment objective is to provide long-term total return. The Fund seeks to meet its objective by investing its assets in a diversified portfolio of common stocks. In order to accomplish these goals, the Fund intends to hold stocks for the long term, as opposed to actively buying and selling. There can be no assurances that the Fund’s investment objectives will be achieved.
The following is a summary of accounting policies followed by the Fund in the preparation of its financial statements. These policies are in conformity with accounting principles generally accepted in the United States of America.
Securities Valuation Portfolio securities for which market quotations are readily available are valued at market value, which is determined by using the last reported sale price, or, if no sales are reported, the last reported bid price. For NASDAQ traded securities, market value is determined on the basis of the NASDAQ official closing price instead of the last reported sales price. Other assets and securities for which no quotations are readily available or for which Torray LLC (the “Advisor”) believes do not reflect market value are valued at fair value as determined in good faith by the Advisor under the supervision of the Board of Trustees (the “Board” or “Trustees”) in accordance with the Fund’s Valuation Procedures. Short-term obligations having remaining maturities of 60 days or less are valued at amortized cost, which approximates market value.
Fair Value Measurements Various inputs are used in determining the fair value of investments which are as follows:
Level 1 — quoted prices in active markets for identical securities
Level 2 — significant observable inputs (including quoted prices for similar securities, interest rates, prepayment speeds, credit risk, etc.)
Level 3 — significant unobservable inputs (including the Fund’s own assumptions in determining the fair value of investments)
The inputs or methodology used for valuing securities are not necessarily an indication of the risk associated with investing in those securities.
14
The Torray Institutional Fund
NOTES TO FINANCIAL STATEMENTS (continued)
As of June 30, 2010 (unaudited)
The summary of inputs used to value the Fund’s net assets as of June 30, 2010 is as follows:
| | | |
Valuation Inputs | | | |
Level 1 — Quoted Prices * | | $ | 18,851,472 |
Level 2 — Other Significant Observable Inputs | | | — |
Level 3 — Significant Unobservable Inputs | | | — |
| | | |
Total Market Value of Investments | | $ | 18,851,472 |
| | | |
| * | | Security types and industry classifications as defined in the Schedule of Investments. |
In January 2010, the Financial Accounting Standards Board issued Accounting Standards Update (“ASU”) No. 2010-06, “Improving Disclosures about Fair Value Measurements.” ASU 2010-06 clarifies existing disclosure and requires additional disclosures regarding fair value measurements. Effective for fiscal years beginning after December 15, 2010, and for interim periods within those fiscal years, entities will need to disclose information about purchases, sales, issuances and settlements of Level 3 securities on a gross basis, rather than as a net number as currently required.
Securities Transactions and Investment Income Securities transactions are recorded on a trade date basis. Realized gains and losses from securities transactions are recorded on the specific identification basis. Dividend income and distributions to shareholders are recorded on the ex-dividend date. Interest income, including amortization of discount on short-term investments, and expenses are recorded on the accrual basis. Premium and discount are amortized using the effective yield to maturity method.
Federal Income Taxes The Fund intends to continue to comply with the requirements of the Internal Revenue Code applicable to regulated investment companies and to distribute all of its taxable income, including any net realized gain on investments to its shareholders. Therefore, no Federal income tax provision is required.
Management has analyzed the Fund’s tax positions taken on federal income tax returns for all open tax years (current and prior three tax years), and has concluded that no provision for federal income tax is required in the Fund’s financial statements. The Fund’s federal and state income and federal excise tax returns for tax years for which the applicable statutes of limitations have not expired are subject to examination by the Internal Revenue Service and state departments of revenue.
Net Asset Value The net asset value per share of the Fund is determined daily as of the close of trading on the New York Stock Exchange by dividing the value of the Fund’s net assets by the number of shares outstanding.
15
The Torray Institutional Fund
NOTES TO FINANCIAL STATEMENTS (continued)
As of June 30, 2010 (unaudited)
Interest Expense When cash balances are overdrawn in the Fund’s custody account, the Fund is charged an overdraft fee equal to 1.25% above the Federal Funds Rate. Such overdraft fees are paid by the Advisor under the comprehensive management fee arrangement described in Note 4.
Use of Estimates In preparing financial statements in accordance with accounting principles generally accepted in the United States of America, management is required to make estimates and assumptions that affect the reported amounts of assets and liabilities and the disclosure of contingent assets and liabilities at the date of the financial statements, and the reported amounts of increases and decreases in net assets from operations during the reporting period. Actual results could differ from those estimates.
NOTE 2 — SHARES OF BENEFICIAL INTEREST TRANSACTIONS
Transactions in shares of beneficial interest were as follows:
| | | | | | | | | | | | | | |
| | | Six months ended
06/30/10 | | | Year ended
12/31/09 | |
| | | Shares | | | Amount | | | Shares | | | Amount | |
Shares issued | | 1,153 | | | $ | 74,816 | | | 10,727 | | | $ | 562,111 | |
Reinvestments of dividends and distributions | | 1,532 | | | | 97,959 | | | 3,952 | | | | 202,799 | |
Shares redeemed | | (12,374 | ) | | | (793,069 | ) | | (49,132 | ) | | | (2,420,312 | ) |
| | | | | | | | | | | | | | |
| | (9,689 | ) | | $ | (620,294 | ) | | (34,453 | ) | | $ | (1,655,402 | ) |
| | | | | | | | | | | | | | |
As of June 30, 2010, the Trust’s officers, Trustees and affiliated persons and their families directly or indirectly controlled 197,332 shares or 62.84% of the Fund.
NOTE 3 — INVESTMENT TRANSACTIONS
Purchases and sales of investment securities, other than short-term investments, for the six months ended June 30, 2010, aggregated $1,732,909 and $1,264,678, respectively.
NOTE 4 — MANAGEMENT FEES
Pursuant to the Management Contract, the Advisor provides investment advisory and administrative services to the Fund. The Fund pays the Advisor a management fee, computed daily and payable monthly at the annual rate of 0.85% of the Fund’s average daily net assets. For the six months ended June 30, 2010, the Fund paid comprehensive management fees of $85,743. The Fund pays the Advisor a single comprehensive management fee which covers all operating expenses of the Fund including the investment advisory and administrative services provided by the Advisor as well as all miscellaneous costs incurred in connection with the ongoing operation of the Fund including transfer agency, custody, professional, and registration fees.
16
The Torray Institutional Fund
NOTES TO FINANCIAL STATEMENTS (continued)
As of June 30, 2010 (unaudited)
Certain officers and Trustees of the Fund are also officers and/or shareholders of the Advisor.
NOTE 5 — TAX MATTERS
Distributions to shareholders are determined in accordance with United States Federal income tax regulations, which may differ from accounting principles generally accepted in the United States of America.
The tax character of distributions paid during the year ended December 31, 2009 was as follows:
| | | |
Distributions paid from: | | | |
Ordinary income | | $ | 203,153 |
| | | |
| | $ | 203,153 |
| | | |
The primary difference between book basis and tax basis distributions is differing book and tax treatment of short-term capital gains.
At December 31, 2009 the Fund had net capital loss carry forward for federal income tax purposes of $339,016 and $3,679,435, which are available to reduce future required distributions of net capital gains to shareholders through 2016 and 2017, respectively.
At December 31, 2009, The Torray Institutional Fund had deferred post-October losses of $167,476.
The following information is based upon the federal tax basis of investment securities as of June 30, 2010:
| | | | | | |
Gross unrealized appreciation | | $ | 859,829 | | | |
Gross unrealized depreciation | | | (2,712,070 | ) | | |
| | | | | | |
Net unrealized depreciation | | $ | (1,852,241 | ) | | |
| | | | | | |
Cost | | $ | 20,703,713 | | | |
| | | | | | |
NOTE 6 — COMMITMENTS AND CONTINGENCIES
The Fund indemnifies its officers and Trustees for certain liabilities that may arise from their performance of their duties to the Fund. Additionally, in the normal course of business, the Fund enters into contracts that contain a variety of representations and warranties, which provide general indemnifications. The Fund’s maximum exposure under these arrangements is unknown, as this would involve future claims that may be made against the Fund that have not yet occurred.
17
The Torray Institutional Fund
NOTES TO FINANCIAL STATEMENTS (continued)
As of June 30, 2010 (unaudited)
NOTE 7 — SUBSEQUENT EVENTS
Management has evaluated the impact of all subsequent events on the Fund and has determined that there were no subsequent events requiring recognition or disclosure in the financial statements.
18
The Torray Institutional Fund
PORTFOLIO HOLDINGS, PROXY VOTING AND PROCEDURES
As of June 30, 2010 (unaudited)
The Fund files its complete schedule of portfolio holdings with the Securities and Exchange Commission (the “Commission”) for the first and third quarters of each fiscal year on Form N-Q. The Fund’s Forms N-Q are available on the Commission’s website at http://www.sec.gov. The Fund’s Forms N-Q may be reviewed and copied at the Commission’s Public Reference Room in Washington, D.C. Information on the operation of the Commission’s Public Reference Room may be obtained by calling 1-800-SEC-0330.
A description of the policies and procedures that the Fund uses to determine how to vote proxies relating to portfolio securities is available without charge, upon request, by calling 1-800-443-3036; and on the Commission’s website at http://www.sec.gov.
Information regarding how the Fund voted proxies relating to portfolio securities is available without charge, upon request, by calling 1-800-443-3036; and on the Commission’s website at http://www.sec.gov.
19
The Torray Institutional Fund
ABOUT YOUR FUND’S EXPENSES
As of June 30, 2010 (unaudited)
We believe it is important for you to understand the impact of costs on your investment. All mutual funds have operating expenses. As a shareholder of the Fund, you incur ongoing costs, including management fees, and other fund expenses. Operating expenses, which are deducted directly from the Fund’s gross income, directly reduce the investment return of the Fund.
A mutual fund’s expenses are expressed as a percentage of its average net assets. This figure is known as the expense ratio. The following examples are intended to help you understand the ongoing costs (in dollars) of investing in the Fund and to compare these costs with the ongoing costs of investing in other mutual funds. The examples below are based on an investment of $1,000 made at the beginning of the period shown and held for the entire period.
The table on the next page illustrates the Fund’s cost in two ways:
Actual Fund Return This section helps you estimate the actual expenses that you paid over the period. The “Ending Account Value” shown is derived from the Fund’s actual return, and the third column shows the operating expenses that would have been paid by an investor who started with $1,000 in the Fund. You may use the information here, together with the amount invested, to estimate the expenses that you paid over the period.
To do so, simply divide your account value by $1,000 (for example, an $8,600 account value divided by $1,000 = 8.6), then multiply the result by the number given for the Fund under the heading “Expenses Paid During Period” on the next page.
Hypothetical 5% Return This section is intended to help you compare your Fund’s costs with those of other mutual funds. It assumes that the Fund had an annual return of 5% before expenses, and that the expense ratio is unchanged. In this case, because the return used is not the Fund’s actual return, the results do not apply to your investment. The example is useful in making comparisons because the Commission requires all mutual funds to calculate expenses based on a 5% return. You can assess the Fund’s costs by comparing this hypothetical example with the hypothetical examples that appear in shareholder reports of other funds.
Note that expenses shown in the table are meant to highlight and help you compare ongoing costs only. The Fund does not charge transactions fees, such as purchase or redemption fees, nor does it carry a “sales load.”
The calculation assumes no shares were bought or sold during the period. Your actual costs may have been higher or lower, depending on the amount of your investment and the timing of any purchases or redemptions.
20
The Torray Institutional Fund
ABOUT YOUR FUND’S EXPENSES (continued)
As of June 30, 2010 (unaudited)
More information about the Fund’s expenses, including recent annual expense ratios, can be found in this report. For additional information on operating expenses and other shareholder costs, please refer to the Fund’s prospectus.
| | | | | | | | | |
| | | Beginning
Account Value
January 1, 2010 | | Ending
Account Value
June 30, 2010 | | Expenses Paid
During Period* |
Based on Actual Fund Return | | $ | 1,000.00 | | $ | 960.70 | | $ | 4.13 |
Based on Hypothetical 5% Return
(before expenses) | | $ | 1,000.00 | | $ | 1,020.58 | | $ | 4.26 |
| * | | Expenses are equal to the Fund’s annualized expense ratio of 0.85% for the period, multiplied by the average account value over the period, multiplied by 181/365 (to reflect the one-half year period). |
21
TRUSTEES
Carol Crawford
Bruce C. Ellis
William M Lane
Robert P. Moltz
Wayne H. Shaner
INVESTMENT ADVISOR
Torray LLC
OFFICERS
Robert E. Torray
William M Lane
Fred M. Fialco
Shawn M. Hendon
Nicholas C. Haffenreffer
INDEPENDENT REGISTERED PUBLIC ACCOUNTING FIRM
BBD, LLP
1835 Market Street, 26th Floor
Philadelphia, PA 19103
TRANSFER AGENT
BNY Mellon Investment Servicing (U.S.) Inc.
101 Sabin Street
Pawtucket, RI 02860-1427
LEGAL COUNSEL
Dechert LLP
1775 I Street, N.W.
Washington, DC 20006
Distributed by BNY Mellon Distributors Inc.
760 Moore Road, King of Prussia, PA 19406-1212
Date of first use, August 2010
This report is not authorized for distribution to
prospective investors unless preceded or accompanied
by a current prospectus. All indices are unmanaged
groupings of stocks that are not available for
investment.
The
TORRAY
INSTITUTIONAL
FUND
SEMI-ANNUAL REPORT
June 30, 2010
The Torray Institutional Fund
Suite 1100
7501 Wisconsin Avenue
Bethesda, Maryland 20814-6523
(301) 493-4600
(800) 443-3036
Not applicable.
| Item 3. | Audit Committee Financial Expert. |
Not applicable.
| Item 4. | Principal Accountant Fees and Services. |
Not applicable.
| Item 5. | Audit Committee of Listed registrants. |
Not applicable.
| (a) | Schedule of Investments in securities of unaffiliated issuers as of the close of the reporting period is included as part of the report to shareholders filed under Item 1 of this form. |
| Item 7. | Disclosure of Proxy Voting Policies and Procedures for Closed-End Management Investment Companies. |
Not applicable.
| Item 8. | Portfolio Managers of Closed-End Management Investment Companies. |
Not applicable.
| Item 9. | Purchases of Equity Securities by Closed-End Management Investment Company and Affiliated Purchasers. |
Not applicable.
| Item 10. | Submission of Matters to a Vote of Security Holders. |
There have been no material changes to the procedures by which the shareholders may recommend nominees to the registrant’s board of directors, where those changes were implemented after the registrant last provided disclosure in response to the requirements of Item 407(c)(2)(iv) of Regulation S-K (17 CFR 229.407) (as required by Item 22(b)(15) of Schedule 14A (17 CFR 240.14a-101)), or this Item.
| Item 11. | Controls and Procedures. |
| | (a) | The registrant’s principal executive and principal financial officers, or persons performing similar functions, have concluded that the registrant’s disclosure controls and procedures (as defined in Rule 30a-3(c) under the Investment Company Act of 1940, as amended (the “1940 Act”) (17 CFR 270.30a-3(c))) are effective, as of a date within 90 days of the filing date of the report that includes the disclosure required by this paragraph, based on their evaluation of these controls and procedures required by Rule 30a-3(b) under the 1940 Act (17 CFR 270.30a-3(b)) and Rules 13a-15(b) or 15d-15(b) under the Securities Exchange Act of 1934, as amended (17 CFR 240.13a-15(b) or 240.15d-15(b)). |
| | (b) | There were no changes in the registrant’s internal control over financial reporting (as defined in Rule 30a-3(d) under the 1940 Act (17 CFR 270.30a-3(d)) that occurred during the registrant’s second fiscal quarter of the period covered by this report that has materially affected, or is reasonably likely to materially affect, the registrant’s internal control over financial reporting. |
| | |
| |
| (a)(1) | | Not applicable. |
| |
| (a)(2) | | Certifications pursuant to Rule 30a-2(a) under the 1940 Act and Section 302 of the Sarbanes-Oxley Act of 2002 are attached hereto. |
| |
| (a)(3) | | Not applicable. |
| |
| (b) | | Certifications pursuant to Rule 30a-2(b) under the 1940 Act and Section 906 of the Sarbanes- Oxley Act of 2002 are attached hereto. |
SIGNATURES
Pursuant to the requirements of the Securities Exchange Act of 1934 and the Investment Company Act of 1940, the registrant has duly caused this report to be signed on its behalf by the undersigned, thereunto duly authorized.
| | |
| (registrant) | | The Torray Fund |
| |
| By (Signature and Title)* | | /s/ Robert E. Torray |
| | Robert E. Torray, President |
| | (principal executive officer) |
Date 9/3/10
Pursuant to the requirements of the Securities Exchange Act of 1934 and the Investment Company Act of 1940, this report has been signed below by the following persons on behalf of the registrant and in the capacities and on the dates indicated.
| | |
| |
| By (Signature and Title)* | | /s/ Robert E. Torray |
| | Robert E. Torray, President |
| | (principal executive officer) |
Date 9/3/10
| | |
| |
| By (Signature and Title)* | | /s/ William M Lane |
| | William M Lane, Treasurer |
| | (principal financial officer) |
Date 9/3/10
| * | Print the name and title of each signing officer under his or her signature. |