Back to Contents
RISK FACTORS
The following describes some of the risks that could affect Rio Tinto. There may be additional risks unknown to Rio Tinto and other risks, currently believed to be immaterial, could turn out to be material. These risks, whether they materialise individually or simultaneously, could significantly affect the Group’s business and financial results. They should also be considered in connection with any forward looking statements in this document and the cautionary statement on the following page.
Economic conditions
Commodity prices, and demand for the Group’s products, are influenced strongly by world economic growth, particularly that in the US and Asia. The Group’s normal policy is to sell its products at prevailing market prices. Commodity prices can fluctuate widely and could have a material and adverse impact on the Group’s asset values, revenues, earnings and cash flows.
The strong underlying economic conditions and commodity prices have led to a rapid growth in demand for technical skills in mining, metallurgy and geological sciences, and for materials and supplies related to the mining industry, causing skills and materials shortages. The retention of skilled employees, the recruitment of new staff and the purchasing of materials and supplies may lead to increased costs, interruptions to existing operations and to delays in new projects.
Further discussion can be found on page 12, Business environment, markets and regulations, and on page 79, commodity prices.
Exchange rates
The Group’s asset values, earnings and cash flows are influenced by a wide variety of currencies due to the geographic diversity of the Group’s sales and areas of operation. The majority of the Group’s sales are denominated in US dollars.The Australian and US dollars are the most important currencies influencing costs. The relative value of currencies canfluctuate widely and could have a material and adverse impact on the Group’s asset values, costs, earnings and cash flows. Further discussion can be found under, Exchange rates, reporting currencies and currency exposure on page 77.
Acquisitions
The Group has grown partly through the acquisition of other businesses. Business combinations commonly entail anumber of risks and Rio Tinto cannot be sure that management will be able effectively to integrate businesses acquiredor generate the cost savings and synergies anticipated. Failure to do so could have a material and adverse impact on the Group’s costs, earnings and cash flows. Furthermore, the Group may, under the terms of the acquisition, be liable forthe past acts or omissions of the acquired businesses in circumstances where the price paid does not adequately reflect the eventual cost of these liabilities.
Exploration and new projects
The Group seeks to identify new mining properties through an active exploration programme. There is no guarantee,however, that such expenditure will be recouped or that existing mineral reserves will be replaced. Failure to do socould have a material and adverse impact on the Group’s financial results and prospects. In particular, Rio Tinto has commenced or recommenced exploration for new projects in a number of new countries which may increase risksaround land and resource tenure.
The Group develops new mining properties and expands its existing operations as a means of generating shareholder value. Increasing regulatory, environmental and social approvals are, however, required which can result insignificant increases in construction costs and/or significant delays in construction. These increases could materially andadversely affect the economics of a project and, consequently, the Group’s asset values, costs, earnings and cash flows.
Ore reserve estimates
There are numerous uncertainties inherent in estimating ore reserves; assumptions that are valid at the time of estimation may change significantly when new information becomes available.
Changes in the forecast prices of commodities, exchange rates, production costs or recovery rates may change theeconomic status of reserves and may, ultimately, result in the reserves being restated. Such changes in reserves could impact on depreciation and amortisation rates, asset carrying values, deferred stripping calculations and provisions forclose down, restoration and environmental clean up costs. Further discussion can be found under Ore reserve estimates on page 82.
Political and community
The Group has operations in jurisdictions having varying degrees of political and commercial instability. Political instability can result in civil unrest, expropriation, nationalisation, renegotiation or nullification of existing agreements, mining leases and permits, changes in laws, taxation policies or currency restrictions. Commercial instability caused by bribery and corruption in their various guises can lead to similar consequences. Any of these can have a material adverse effect on the profitability or, in extreme cases, the viability of an operation.
Some of the Group’s current and potential operations are located in or near communities that may now, or in the future, regard such an operation as having a detrimental effect on their economic and social circumstances. Should this
Back to Contents
occur, it may have a material adverse impact on the profitability or, in extreme cases, the viability of an operation. In addition, such an event may adversely affect the Group’s ability to enter into new operations in the country.
Technology
The Group has invested in and implemented information system and operational initiatives. Several technical aspects ofthese initiatives are still unproven and the eventual operational outcome or viability cannot be assessed with certainty.Accordingly, the costs and benefits from these initiatives and the consequent effects on the Group’s future earnings and financial results may vary widely from present expectations.
Land and resource tenure
The Group operates in several countries where title to land and rights in respect of land and resources (includingindigenous title) may be unclear and may lead to disputes over resource development. Such disputes could disrupt relevant mining projects and/or impede the Group’s ability to develop new mining properties.
Health, safety and environment
Rio Tinto operates in an industry that is subject to numerous health, safety and environmental laws and regulations aswell as community expectations. Evolving regulatory standards and expectations can result in increased litigation and/orincreased costs all of which can have a material and adverse effect on earnings and cash flows.
Mining operations
Mining operations are vulnerable to a number of circumstances beyond the Group’s control, including natural disasters, unexpected geological variations and industrial actions. These can affect costs at particular mines for varying periods. Mining, smelting and refining processes also rely on key inputs, for example fuel and electricity. Appropriate insurance can provide protection from some, but not all, of the costs that may arise from unforeseen events. Disruption to the supply of key inputs, or changes in their pricing, may have a material and adverse impact on the Group’s asset values,costs, earnings and cash flows.
Rehabilitation
Costs associated with rehabilitating land disturbed during the mining process and addressing environmental, health andcommunity issues are estimated and provided for based on the most current information available. Estimates may, however, be insufficient and/or further issues may be identified. Any underestimated or unidentified rehabilitation costswill reduce earnings and could materially and adversely affect the Group’s asset values, earnings and cash flows.
Non managed projects and operations
Where projects and operations are controlled and managed by the Group’s partners, the Group may provide expertise and advice, but it cannot guarantee compliance with its standards and objectives. Improper management or ineffectivepolicies, procedures or controls could not only adversely affect the value of the related non managed projects andoperations but could also, by association, harm the Group’s other operations and future access to new assets.
CAUTIONARY STATEMENT ABOUT FORWARD LOOKING STATEMENTS
This document contains certain forward looking statements with respect to the financial condition, results of operations and business of the Rio Tinto Group. The words “intend”, “aim”, “project”, “anticipate”, “estimate”, “plan”, “believes”,“expects”, “may”, “should”, “will”, or similar expressions, commonly identify such forward looking statements.Examples of forward looking statements in this annual report on Form 20-Finclude, without limitation, those regardingestimated ore reserves, anticipated production or construction dates, costs, outputs and productive lives of assets or similar factors. Forward looking statements involve known and unknown risks, uncertainties, assumptions and other factors set forth in this document that are beyond the Group’s control. For example, future ore reserves will be based in part on market prices that may vary significantly from current levels. These may materially affect the timing and feasibility of particular developments. Other factors that could affect the Group’s results include the ability to produce and transport products profitably, demand for our products, the effect of foreign currency exchange rates on market prices and operating costs, and activities by governmental authorities, such as changes in taxation or regulation, and political uncertainty.
In light of these risks, uncertainties and assumptions, actual results could be materially different from any future results expressed or implied by these forward looking statements which speak only as at the date of this report. Exceptas required by applicable regulations or by law, the Group does not undertake any obligation to publicly update orrevise any forward looking statements, whether as a result of new information or future events. The Group cannot guarantee that its forward looking statements will not differ materially from actual results.
Back to Contents
| Item 4. | Information on the Company |
INTRODUCTION
Rio Tinto is a leading international mining group whose business is finding, mining and processing the earth’s mineral resources. The Group’s interests are diverse both in geography and product. Our activities span the world but we are strongly represented in Australia and North America and we have significant businesses in South America, Asia, Europe and southern Africa. Those businesses include open pit and underground mines, mills, refineries and smelters as well as a number of research and service facilities.
The Group combines Rio Tinto plc, registered in England and Wales, listed on the London Stock Exchange and headquartered in the UK; and, Rio Tinto Limited, incorporated in Victoria, Australia, listed on the Australian Securities Exchange and with executive offices in Melbourne. The Group consists of wholly and partly owned subsidiaries, jointly controlled assets, jointly controlled entities and associated companies, the principal ones being listed in notes 35 to 38 to the 2006 financial statements.
On 31 December 2006, Rio Tinto plc had a market capitalisation of £27.8 billion (US$54 .5 billion) and Rio Tinto Limited had a market capitalisation in publicly held shares of A$21.2 billion (US$16.8 billion). The combined Group’s market capitalisation in publicly held shares at the end of 2006 was US$71.3 billion.
Objective, strategy and management structure
Our fundamental objective is to maximise the overall long term value and return to our shareholders. We do this byoperating responsibly and sustainably in areas of proven expertise such as exploration, project evaluation and mining,where the Group has a competitive advantage.
Our strategy is to maximise net present value by investing in large, long life, cost competitive mines. Investmentsare driven by the quality of each opportunity, not by the choice of commodity.
Rio Tinto’s management structure is designed to facilitate a clear focus on the Group’s objective. This structure, reflected in this report, is based on the following principal product and global support groups:
| • | Iron Ore |
| • | Energy |
| • | Industrial Minerals |
| • | Aluminium |
| • | Copper |
| • | Diamonds |
| • | Exploration |
| • | Technology and Innovation (formerly Operational and Technical Excellence). |
| The chief executive of each product group reports to the chief executive of Rio Tinto. |
Nomenclature and financial data
Rio Tinto Limited and Rio Tinto plc operate as one business organisation, referred to in this report as Rio Tinto, the Rio Tinto Group or, more simply, the Group. These collective expressions are used for convenience only, since both Companies, and the individual companies in which they directly or indirectly own investments, are separate and distinct legal entities.
“Limited”, “plc”, “Pty”, “Inc”, “Limitada”, “SA” and similar suffixes have generally been omitted from Group company names, except to distinguish between Rio Tinto plc and Rio Tinto Limited.
Financial data in United States dollars (US$) is derived from, and should be read in conjunction with, the 2006financial statements which are in US$. In general, financial data in pounds sterling (£) and Australian dollars (A$) have been translated from the consolidated financial statements and have been provided solely for convenience; exceptionsarise where data, such as directors’ remuneration, can be extracted directly from source records.
Rio Tinto Group sales revenue, profit before tax and net earnings and operating assets for 2005 and 2006 attributable to the product groups and geographical areas are shown in notes 30 and 31 to the 2006 financial statements.In theOperating and financial review(OFR), operating assets and sales revenue for 2005 and 2006 are consistent withthe financial information by business unit in note 47 to the 2006 financial statements.
The tables on pages 19 to 22 show production for 2004, 2005 and 2006 and include estimates of proven andprobable ore reserves. Words and phrases, often technical, have been used which have particular meanings; definitions of these terms are in the Glossary on pages 153 to 155. The weights and measures used are mainly metric units;conversions into other units are shown on page 155.
History
Rio Tinto’s predecessor companies were formed in 1873 and 1905. The Rio Tinto Company was formed by investors in1873 to mine ancient copper workings at Rio Tinto, near Seville in southern Spain. The Consolidated Zinc Corporation was incorporated in 1905 to treat zinc bearing mine waste at Broken Hill, New South Wales, Australia.
The RTZ Corporation (formerly The Rio Tinto-Zinc Corporation) was formed in 1962 by the merger of The RioTinto Company and The Consolidated Zinc Corporation.
CRA Limited (formerly Conzinc Riotinto of Australia Limited) was formed at the same time by a merger of the
Back to Contents
Australian interests of The Consolidated Zinc Corporation and The Rio Tinto Company.
Between 1962 and 1995, both RTZ and CRA discovered important mineral deposits, developed major miningprojects and also grew through acquisition.
RTZ and CRA were unified in 1995 through a dual listed companies structure. This means the Group, with its common board of directors, is designed to place the shareholders of both Companies in substantially the same positionas if they held shares in a single enterprise owning all of the assets of both Companies.
In 1997, The RTZ Corporation became Rio Tinto plc and CRA Limited became Rio Tinto Limited, together known as the Rio Tinto Group. Since the 1995 merger, the Group has continued to invest in developments andacquisitions in keeping with its strategy.
Contact details
The registered office of Rio Tinto plc is at 6 St James’s Square, London, SW1Y 4LD (telephone: +44 20 7930 2399) and the registered office of Rio Tinto Limited is at Level 33, 120 Collins Street, Melbourne, Victoria 3000 (telephone: +61 3 9283 3333). Rio Tinto’s agent in the US is Shannon Crompton, secretary of Rio Tinto’s US holding companies, who may be contacted at Rio Tinto Services Inc., 80 State Street, Albany, New York, 12207-2543.
Back to Contents
CAPITAL PROJECTS
Rio Tinto is investing heavily in future growth opportunities from the Group’s broad portfolio of assets. Projects havebeen financed out of internally generated funds. Major projects completed and ongoing are summarised below.
| Project | Estimated cost | | Status/Milestones |
| | (100% basis) | | |
| | US$m | | |
|
|
|
|
| Completed in 2004 | | | |
|
|
|
|
| Iron ore –Development of the Eastern Range (Rio Tinto: 54%) with a capacity of ten million tonnes per year. | 67 | | First shipments dispatched in the first half of the year. |
|
|
|
|
| Aluminium –Construction of the first stage of new 1.4million tonnes per year alumina refinery at Gladstone. | 750 | | Completed three months early. Initial shipments started in early 2005. |
|
|
|
|
| Copper –Northparkes (Rio Tinto: 80%) construction ofsecond block cave. | 100 | | Production commenced in 2004. |
|
|
|
|
| Copper –Palabora (Rio Tinto: 49%) underground blockcaving operation | 465 | | Construction completed but production was initially impacted by fragmentation of the cave. |
|
|
|
|
| Completed in 2005 | | | |
|
|
|
|
| Iron ore –HIsmelt® plant (Rio Tinto: 60%) at Kwinana inWestern Australia. | 200 | | The full production rate of 800,000 tonnes per year is expected to be reached over three years. |
|
|
|
|
| Iron ore –Expansion of Yandicoogina mine. | 200 | | Expansion completed in the third quarter. |
|
|
|
|
| Iron ore –Expansion of West Angeles mine (Rio Tinto:53%). | 105 | | Project completed in the third quarter. |
|
|
|
|
| Titanium dioxide– Expansion of upgraded slag plant. | 76 | | Commissioning started in first quarter. |
|
|
|
|
| Copper –Development of the Escondida Norte satellitedeposit (Rio Tinto: 30%) to provide mill feed to keep Escondida’s capacity above 1.2 million tonnes of copper per year to the end of 2008. | 400 | | First production occurred in 2005. |
|
|
|
|
| Iron ore –Expansion of port capacity to 116 milliontonnes per annum. | 685 | | Focus on production ramp up following completionof construction. |
|
|
|
|
| Completed in 2006 | | | |
|
|
|
|
| Iron ore –Expansion of Hamersley Iron’s (Rio Tinto:100%) Tom Price and Marandoo mines and construction of new mine capacity at Nammuldi. | 290 | | The Marandoo and Nammuldi components arecomplete and Tom Price is scheduled forcompletion by the first quarter of 2007. |
|
|
|
|
| Iron ore– Expansion by Robe River (Rio Tinto: 53%) ofrail capacity including completion of dual tracking of 100 km mainline section. | 200 | | The project was completed on budget and ahead of schedule. |
|
|
|
|
| Copper– Escondida sulphide leach (Rio Tinto: 30%). Theproject will produce 180,000 tonnes per annum of copper cathode for more than 25 years. | 925 | | The first cathode production from the sulphideleach plant occurred in June 2006. |
|
|
|
|
| Titanium dioxide– Expansion of annual capacity at UGSplant from 325,000 tonnes to 375,000 tonnes. | 79 | | The project was completed in October three monthsahead of schedule and under budget. |
|
|
|
|
| Boric acid –Phase 2 of Rio Tinto Minerals boric acidExpansion | 50 | | The project was completed on schedule and under budget. |
|
|
|
|
| Coking coal– Hail Creek (Rio Tinto: 82%) Expansion ofannual capacity from 6 million tonnes to nameplate 8 million tonnes per annum, with washing plant increased to 12 million tonnes per annum. | 223 | | The new dragline was commissioned early in thethird quarter of 2006. |
|
|
|
|
| Ongoing | | | |
|
|
|
|
| Copper– KUC (Rio Tinto: 100%) East 1 pushback. Theproject extends the life of the open pit to 2017 while retaining options for further underground or open pit mining thereafter. | 170 | | The project was approved in February 2005 and work on the pushback continues. The pebble crushing unit was commissioned in the third quarter of 2006. |
| | | | |
|
|
|
|
| Diamonds– Construction at Diavik (Rio Tinto: 60%) ofthe A418 dyke, and funding for further study of the viability of underground mining, including the construction of an exploratory decline. | 265 | | The project was approved in 2004. The A418 dykewas closed off in late 2005 with dewateringcompleted in 2006. The dyke was completed duringMarch 2007 with production from the A418 pipe expected to commence during April 2008. Construction of the exploratory decline is expected to be completed during June 2007. |
|
|
|
|
| Rio Tinto 2006 Form 20-F | 9 |
Back to Contents
| Iron ore– Brownfields mine expansion of HamersleyIron’s (Rio Tinto: 100%) Yandicoogina mine from 36 million tonnes per annum to 52 million tonnes per annum. | 530 | | The project was approved in October 2005 and completion is expected by the end of the third quarter of 2007. |
|
|
|
|
| Iron ore– Expansion of Hamersley Iron’s (Rio Tinto:100%) Dampier port (Phase B) from 116 million tonnes per annum to 140 million tonnes per annum capacity and additional rolling stock and infrastructure. | 803 | | This project was also approved in October 2005 and completion is expected by the end of 2007. |
|
|
|
|
| Titanium dioxide– Construction by QMM (Rio Tinto:80%) of a greenfield ilmenite operation in Madagascar and associated upgrade of processing facilities at QIT. | 850 | | Basic infrastructure is being put in place and the port construction contract was awarded in 2006. First production is scheduled for 2008. |
|
|
|
|
| Gold– Development of Cortez Hills (Rio Tinto: 40%). | 504 | | Approved in September 2005, the project continues to focus on permitting requirements. |
|
|
|
|
| Energy– Rössing (Rio Tinto: 68.6%) uranium mine lifeextension to 2016. | 82 | | Approved in December 2005, works are on schedule and on budget to prolong the life of the mine to 2016 and beyond. |
|
|
|
|
| Diamonds– Argyle (Rio Tinto: 100%) development ofunderground mine and open pit cutback, extending the life of the mine to 2018. | 910 | | Approved in December 2005, the underground development is progressing with the mine due to start ramping up from 2008. Underground development cost estimates are currently under review. |
|
|
|
|
| Recently approved | | | |
|
|
|
|
| Iron ore –Hope Downs development (Rio Tinto share:50% of mine and 100% of infrastructure). Construction of 22 million tonnes per annum mine and related | 980 | | Construction is under way. First production expected in early 2008. |
| infrastructure. | | | |
|
|
|
|
| Copper– Northparkes (Rio Tinto: 80%) E48 block caveproject extending mine life to 2016. | 160 | | Approved in November 2006. |
|
|
|
|
| Energy– Clermont (Rio Tinto: 50.1%) is expected toproduce 12.2 million tonnes per annum, replacing Blair Athol. | 750 | | Approved in January 2007, first shipments are expected in the second quarter of 2010 with full capacity being reached in 2013. |
|
|
|
|
| Iron ore– Cape Lambert port expansion (Rio Tinto share:53%) from 55 to 80 million tonnes per annum. | 860 | | Approved in January 2007, the project is forecast to be complete by the end of 2008, with progressive capacity ramp up in the first half of 2009. |
|
|
|
|
| ACQUISITIONS | | | |
|
|
|
|
| Asset | Estimated | | Status |
| | cost | | |
| | US$m | | |
|
|
|
|
| Acquired in 2004 | | | |
|
|
|
|
| Energy– additional 177 million tonnes of in-situ coalreserves at West Antelope | 146 | | Successful bid. |
|
|
|
|
| Acquired in 2005 | | | |
|
|
|
|
| Iron ore– Hope Downs iron ore assets in WesternAustralia | n/a | | Rio Tinto reached agreement with Hancock Prospecting Pty Ltd to purchase a 50% interest. |
|
|
|
|
| Acquired in 2006 | | | |
|
|
|
|
| Copper– Ivanhoe Mines (Rio Tinto: 9.9%) | 303 | | Agreement to acquire a strategic stake including, upon completion of satisfactory a long term investment agreement with the Mongolian government, a second tranche of 9.9% for US$338m. |
|
|
|
|
| Copper– Northern Dynasty Minerals (Rio Tinto: 9.9%) | | | Increased stake to 19.8% during February 2007 |
|
|
|
|
| Rio Tinto 2006 Form 20-F | 10 |
Back to Contents
| DIVESTITURES | | | |
| Asset | Estimated | | Status |
| | proceeds | | |
| | US$m | | |
|
|
|
|
| Divested in 2004 | | | |
|
|
|
|
| Copper– Mineração Serra da Fortaleza Ltda (Rio Tinto:100%) nickel mining company. | 80 | | Sold to Votorantim Metais, a Brazilian controlled mining company. Proceeds included an adjustment for future nickel prices. |
|
|
|
|
| Other operations– Sepon project in Laos (Rio Tinto:20%), comprising a gold operation and the Khanong copperproject. | 85 | | Sold to Oxiana Limited. |
|
|
|
|
| Copper– Freeport-McMoRan Copper & Gold Inc (FCX) (Rio Tinto: 13.1%). | 882 | | Rio Tinto retains its 40 per cent joint venture interest in reserves discovered after 1994 at the Grasberg mine, which is managed by FCX. The sale of FCX shares does not affect the terms of the joint venture nor the management of the Grasberg mine. |
|
|
|
|
| Copper– Zinkgruvan Mining AB (Rio Tinto: 100%) | n/a | | Sold to South Atlantic Ventures. Zinkgruvan was acquired in 2000 as part of North Ltd. |
| | | | |
|
|
|
|
| Copper– Neves Corvo copper mine in Portugal (Rio Tinto: 49%) | 92 | | Rio Tinto and Empresa de Desenvolvimento Mineiro completed the sale of their interests to EuroZinc for a cash consideration and a participation in the average copper price in excess of certain thresholds. |
|
|
|
|
| Diamonds– Rio Tinto Zimbabwe (RioZim) (Rio Tinto: 56%) | n/a | | As a result of a restructuring of Rio Tinto’s interests in Zimbabwe, it became the holder of a direct 78% interest in Murowa, and RioZim became an independent listed company owning the remaining 22% and certain other Zimbabwean interests. Rio Tinto also retains a reduced cash participation in RioZim’s other interests for a period of ten years. |
|
|
|
|
| Energy– Hail Creek Joint Venture (Rio Tinto: 92%) | 150 | | Sale of a 10% interest in the Hail Creek Joint Venture and a 47% interest in the Beasley River iron ore deposits to Rio Tinto’s Japanese partners. |
| Iron ore– Beasley River iron ore deposits (Rio Tinto: 100%) | | | |
| | | | |
|
|
|
|
| Copper– Rio Paracatu Mineração (Rio Tinto: 51%) | 250 | | The sale of the owner of the Morro do Ouro mine in Brazil. |
|
|
|
|
| Divested in 2005 | | | |
|
|
|
|
| Iron ore– Labrador Iron Ore Royalty Income Fund (LIORIF) (Rio Tinto: 19%) | 130 | | LIORIF has an interest of 15.1% in, and receives royalties from, Iron Ore Company of Canada (IOC), a subsidiary of Rio Tinto. The transaction had no effect on Rio Tinto’s 59% direct interest in IOC. |
|
|
|
|
| Other operations– Lihir Gold (Rio Tinto: 14.5%) | 295 | | Rio Tinto relinquished its management agreement with Lihir, and subsequently sold its interest. |
|
|
|
|
| Divested in 2006 | | | |
|
|
|
|
| Aluminium –Eurallumina SpA (Rio Tinto: 56.2%) | n/a | | Sold to RUSAL |
|
|
|
|
| Diamonds– Ashton Mining of Canada Inc (Rio Tinto: 51.7%) | n/a | | Sold to Stornaway Diamond Corporation for US$26m plus shares representing an interest of 17.7% |
|
|
|
|
| Rio Tinto 2006 Form 20-F | 11 |
Back to Contents
BUSINESS ENVIRONMENTS, MARKETS AND REGULATIONS
Competitive environment
Rio Tinto is a major producer in all the metals and minerals markets in which it operates. It is generally among the top five global producers by volume. The competitive arena is spread across the globe.
Most of Rio Tinto’s competitors are private sector companies which are publicly quoted. Several are, like Rio Tinto, diversified in terms of commodity exposure, but others are focused on particular commodity segments. Metal and mineral markets are highly competitive, with few barriers to entry. They can be subject to price declines in real terms reflecting large productivity gains, increasing technical sophistication, better management and advances in information technology.
High quality and long life mineral resources, the basis of good financial returns, are relatively scarce. Rio Tinto’s ownership of or interest in some of the world’s largest deposits enables it to contribute to long term market growth. World production volumes are likely to grow at least in line with global economic activity. The emergence of China and eventually India as major economies requiring metals and minerals for development could mean even higher market growth.
Economic overview
The world economy grew by 4.9 per cent in 2006 on a purchasing power parity basis. This was the fourth successive year of global growth in excess of four per cent.
Growth was broad based, but once again the US and China provided the bedrock for this expansion. Although thepace of US economic growth progressively slowed over the course of the year, as the housing market faltered, it still managed to rise by 3.3 per cent over its 2005 level. Chinese growth for the year was 10.5 per cent, its biggest annualincrease in over a decade. The Japanese economy rose 2.4 per cent and in Asia as a whole growth was 5.1 per cent.Latin America grew by 4.8 per cent and activity picked up in Europe, rising by 2.7 per cent on 2005.
Despite this sustained rapid global growth and higher commodity prices, global inflation remained relativelytame. Central banks have increased interest rates as the balance of inflationary pressure has shifted towards the upside.Even the Japanese Central Bank raised interest rates for the first time since 2001, but this has been a progressive development and both financial and foreign exchange markets have been stable.
These strong underlying economic conditions, a general ongoing low level of commodity stock availability and continued delays in bringing on new supply contributed to further large increases in commodity prices in the first half of 2006. In the second half of 2006 some general easing in prices was recorded as the pace of demand growth slowed and expectations of faster supply growth filtered through. There are however some important differences between trends inindividual commodities. With few exceptions prices remain well above their historical levels and significantly so inmany cases.
Strong growth in Chinese iron ore imports continued into 2006 and the already tight market conditions worsened following heavy rain early in the year. After a record price increase of 71.5 per cent during 2005 a further 19 per centwas agreed in 2006. Benchmark prices are set to rise a further 9.5 per cent in 2007.
The cash price of copper reached a record high of almost US$4 per pound in May 2006, but finished the year on a weaker tone and over the year averaged US$3.06 per pound.
After lagging the other base metals in 2005 the aluminium price rose to an annual average of US$1.16 a pound in 2006, its highest in real terms for 17 years. Whilst the metal was strong, spot alumina prices fell sharply later in the year as a surge in Chinese refinery production came on the market. After starting the year at US$650 a tonne, spot aluminaended not much above US$200.
The volatility seen in metals markets last year was replicated in the energy sector. Spot prices for seaborne thermal coal reached the low US$50s a tonne early in 2006, but were US$10 per tonne off their peak later in the year.The annual average price was similar to that achieved in 2005. After more than doubling in the 2005/6 marketing year,coking coal prices fell slightly in 2006/7 in response to mixed demand in their major markets. Prices for Powder River Basin coal in the US started the year at very high levels and although they ended the year somewhat weaker the annualaverage price was up 25-30 per cent (depending on grade) over 2005 levels. Uranium prices rose sharply during 2006on concerns about low stocks. Spot prices doubled over the course of the year.
Demand for industrial minerals such as borates and titanium minerals continued to benefit from solid US demandin the first half of the year but concerns about the US housing market dampened expectations in the latter part of the year.
Diamond prices started the year on a very firm basis but conditions declined, due to monsoon flooding in majorIndian cutting and polishing centres, and increased stockholding costs in the jewellery supply chain.
Gold prices have not seen the same degree of escalation as other metals but recorded a strong trend in 2006,averaging over US$600 per ounce over the year as a whole, up 36 per cent on 2005.
Many less widely traded metals have also continued to benefit from firm demand. The molybdenum price averaged US$25 per pound in 2006, down on its 2005 level but still historically high.
Marketing channels
Rio Tinto’s marketing channels are described under ‘Marketing’ on page 66.
| Rio Tinto 2006 Form 20-F | 12 |
Back to Contents
Governmental regulations
Rio Tinto is subject to extensive governmental regulations affecting all aspects of its operations and consistently seeksto apply best practice in all of its activities. Due to Rio Tinto’s product and geographical spread, there is unlikely to beany single governmental regulation that could have a material effect on the Group’s business.
Rio Tinto’s operations in Australia, New Zealand, and Indonesia are subject to state, provincial and federalregulations of general application governing mining and processing, land tenure and use, environmental requirements,including site specific environmental licences, permits and statutory authorisations, workplace health and safety, trade and export, corporations, competition, access to infrastructure, foreign investment and taxation. Some operations areconducted under specific agreements with the respective governments and associated acts of parliament. In addition,Rio Tinto’s uranium operations in the Northern Territory, Australia and Namibia are subject to specific regulation in relation to mining and the export of uranium.
US and Canada based operations are subject to local, state, provincial and national regulations governing land tenure and use, environmental aspects of operations, product and workplace health and safety, trade and exportadministration, corporations, competition, securities and taxation.
The South African Mineral and Petroleum Resources Development Act 2002, as read with the Empowerment Charter for the South African Mining Industry, targets the transfer (for fair value) of 26 per cent ownership of existingSouth African mining assets to historically disadvantaged South Africans (HDSAs) within ten years. Attached to theEmpowerment Charter is a “scorecard” by which companies will be judged on their progress towards empowerment and the attainment of the target transfer of 26 per cent ownership. The scorecard also provides that in relation to existingmining assets, 15 per cent ownership should vest in HDSAs within five years of 1 May 2004. Rio Tinto anticipates thatthe government of South Africa will continue working towards the introduction of new royalty payments in respect of mining tenements, expected to become effective during 2009.
Environmental regulation
Rio Tinto measures its performance against environmental regulation referred to in the previous section by rating incidents on a low, moderate, high, or critical scale of likelihood and consequence of impacting the environment. Highand critical ratings are reported to the Executive committee and the boardCommittee on social and environmental accountability, including progress with remedial actions. Prosecutions and other breaches are also used to gauge RioTinto’s performance.
In 2006, there were eight reportable incidents, the same number as in 2005. Three of these incidents resulted in spills which caused minor contamination.
Four operations incurred fines in 2006 amounting to US$56,779 (predominantly relating to incidents in 2005) compared with three operations incurring fines of US$67,900 during 2005. The 2006 fines included:
| • | US$38,500 imposed by the Utah State government’s Department of Environmental Quality, Division of Air Quality against Kennecott Utah Copper for exceeding the permissible concentration of emissions of fine particles from its smelter near Salt Lake City, Utah on two occasions. However, the mass emission rate was below the threshold permitted. |
| • | US$12,900 imposed by the United States Environmental Protection Agency following a spill at Greens Creek base and precious metals mine, Alaska of four gallons of diesel fuel during exploration drilling. The company and the drilling contractor have implemented additional controls and training to prevent any further spills. |
Further information in respect of the Group’s environmental performance is in the 2006Sustainable development reviewavailable on the Rio Tinto website.
| Rio Tinto 2006 Form 20-F | 13 |
Back to Contents
GROUP MINES
| Mine | | Location | | Access | | Title/lease |
|
|
|
|
|
|
|
| ALUMINIUM | | | | | | |
|
|
|
|
|
|
|
Rio Tinto Aluminium
Weipa | | Weipa, Queensland, Australia | | Road, air, and port | | Queensland Government lease expires in 2041 with 21 year extension, then two years’ notice of termination |
|
|
|
|
|
|
|
| COPPER | | | | | | |
|
|
|
|
|
|
|
| Escondida(30%) | | Atacama Desert, Chile | | Pipeline and road to deep sea port at Coloso | | Rights conferred by Government under Chilean Mining Code |
|
|
|
|
|
|
|
| Grasberg joint venture (40%) | | Papua, Indonesia | | Pipeline, road and port | | Indonesian Government Contracts of Work expire in 2021 with option of two ten year extensions |
|
|
|
|
|
|
|
| Kennecott Minerals | | Nevada, US | | Road | | Patented and unpatented mining claims |
| Cortez/Pipeline (40%) | | | | | | |
|
|
|
|
|
|
|
| Kennecott Minerals | | Alaska, US | | Port | | Patented and unpatented mining claims |
| Greens Creek (70%) | | | | | | |
|
|
|
|
|
|
|
| Kennecott Utah Copper | | Near Salt Lake City, Utah, US | | Pipeline, road and rail | | Owned |
| Bingham Canyon | | | | | | |
|
|
|
|
|
|
|
| Northparkes(80%) | | Goonumbla, New South Wales, Australia | | Road and rail | | State Government mining lease issued in 1991 for 21 years |
|
|
|
|
|
|
|
| Palabora(58%) | | Phalaborwa, Northern Province, South Africa | | Rail and road | | Lease from South African Government valid until deposits exhausted. Base metal claims owned by Palabora |
|
|
|
|
|
|
|
| DIAMONDS | | | | | | |
|
|
|
|
|
|
|
| Argyle Diamonds | | Kimberley Ranges, Western Australia | | Road and air | | Mining tenement held under Diamond (Argyle Diamond Mines Joint Venture) Agreement Act 1981-83; lease extended for 21 years from 2004 |
|
|
|
|
|
|
|
| Diavik(60%) | | Northwest Territories, Canada | | Air, ice road in winter | | Mining leases from Canadian federal government |
|
|
|
|
|
|
|
| Murowa(78%) | | Zvishavane, Zimbabwe | | Road and air | | Claims and mining leases |
|
|
|
|
|
|
|
| ENERGY | | | | | | |
|
|
|
|
|
|
|
| Energy Resources of | | Northern Territory, Australia | | Road | | Leases granted by State |
| Australia(68%) | | | | | | |
| Ranger | | | | | | |
|
|
|
|
|
|
|
| Rio Tinto 2006 Form 20-F | 14 |
Back to Contents
GROUP MINES
| Mine | | History | | Type of mine | | Power source |
|
|
|
|
|
|
|
| ALUMINIUM | | | | | | |
|
|
|
|
|
|
|
Rio Tinto Aluminium
Weipa | | Bauxite mining commenced in 1961. Major upgrade completed in 1998. Rio Tinto interest increased from 72.4% to 100% in 2000. In 2004 a mine expansion was completed that has lifted annual capacity to 16.5 million tonnes. Mining commenced on the adjacent Ely mining lease in 2006, in accordance with the 1998 agreement with Alcan. A second shiploader that increases the shipping capability of the Weipa operation was commissioned in 2006 | | Open cut | | On site generation; new power station under construction |
|
|
|
|
|
|
|
| COPPER | | | | | | |
|
|
|
|
|
|
|
| Escondida(30%) | | Production started in 1990 and expanded in phases to 2002 when new concentrator was completed; production from Norte commenced in 2005 and the sulphide leach produced the first cathode during 2006 | | Open pit | | Supplied from SING grid under various contracts with Norgener Gas Atacama and Edelnor |
|
|
|
|
|
|
|
| Grasberg joint venture (40%) | | Joint venture interest acquired 1995; capacity expanded to over 200,000 tonnes of ore per day in 1998 with addition of underground production of more than 35,000 tonnes per day in 2003 with an expansion to a sustained rate of 50,000 tones per day by mid 2007 | | Open pit and underground | | Long term contract with US-Indonesian consortium operated, purpos e built, coal fired generating station |
|
|
|
|
|
|
|
Kennecott Minerals
Cortez/Pipeline (40%) | | Gold production started at Cortez in 1969, Pipeline in 1997 and Cortez Hills was approved in 2005. | | Open pit | | Public utility |
|
|
|
|
|
|
|
| Kennecott Minerals | | Redeveloped in 1997 | | Underground / drift and fill | | On site diesel generators |
| Greens Creek (70%) | | | | | | |
|
|
|
|
|
|
|
Kennecott Utah Copper
Bingham Canyon | | Interest acquired in 1989; modernisation includes smelter complex and expanded tailings dam | | Open pit | | On site generation supplemented by long term contracts with Utah Power and Light |
|
|
|
|
|
|
|
| Northparkes(80%) | | Interest acquired in 2000; production started in 1995 | | Open pit and underground | | Supplied from State grid |
|
|
|
|
|
|
|
| Palabora(58%) | | Development of 20 year underground mine commenced 1996 with open pit closure in 2003 | | Underground | | Supplied by ESCOM via grid network |
|
|
|
|
|
|
|
| DIAMONDS | | | | | | |
|
|
|
|
|
|
|
| Argyle Diamonds | | Interest increased from 59.7% following purchase of Ashton Mining in 2000. Underground mine project approved in 2005 to extend mine life to 2018 | | Open pit | | Long term contract with Ord Hydro Consortium and on site generation back up |
|
|
|
|
|
|
|
| Diavik(60%) | | Deposits discovered 1994-1995; construction approved 2000; diamond production started 2003. Second dyke closed off in 2005 for mining of additional orebody | | Open pit to underground in future | | On site diesel generators; installed capacity 27MW |
|
|
|
|
|
|
|
| Murowa(78%) | | Discovered 1997; small scale production started 2004 | | Open pit | | Supplied by ZESA |
|
|
|
|
|
|
|
| ENERGY | | | | | | |
|
|
|
|
|
|
|
Energy Resources of Australia (68%)
Ranger | | Mining commenced 1981; interest acquired through North in 2000; life of mine extension to 2014 announced in 2005 | | Open pit | | On site diesel/steam power generation |
|
|
|
|
|
|
|
| Rio Tinto 2006 Form 20-F | 15 |
Back to Contents
GROUP MINES
| Mine | | Location | | Access | | Title/lease |
|
|
|
|
|
|
|
| ENERGY(continued) | | | | | | |
|
|
|
|
|
|
|
Rio Tinto Coal Australia
Bengalla (30%)
Blair Athol (71%)
Hail Creek (82%)
Hunter Valley Ops. (76%)
Kestrel (80%)
Mount Thorley Ops. (61%)
Tarong Coal
Warkworth (42%) | | New South Wales and Queensland, Australia | | Road, rail conveyor and port | | Leases granted by State |
|
|
|
|
|
|
|
Rio Tinto Energy America
Antelope
Colowyo (20%)
Cordero Rojo
Decker (50%)
Jacobs Ranch
Spring Creek | | Wyoming, Montana and Colorado, US | | Rail and road | | Leases from US and State Governments and private parties, with minimum coal production levels, and adherence to permit requirements and statutes |
|
|
|
|
|
|
|
| Rössing Uranium(69%) | | Namib Desert, Namibia | | Rail, road and port | | Federal lease |
|
|
|
|
|
|
|
| INDUSTRIAL MINERALS | | | | | | |
|
|
|
|
|
|
|
| Rio Tinto Minerals - Boron | | California, US | | Road, rail and port | | Owned |
|
|
|
|
|
|
|
| Rio Tinto Minerals - salt (65%) | | Dampier, Lake MacLeod and Port Hedland, Western Australia | | Road and port | | Mining leases expiring in 2013 at Dampier, 2018 at Port Hedland and 2021 at Lake MacLeod with options to renew in each case |
|
|
|
|
|
|
|
| Rio Tinto Minerals - talc | | Trimouns, France (other smaller operations in Australia, Europe and North America) | | Road and rail | | Owner of ground (orebody) and long term lease agreement to 2012 |
|
|
|
|
|
|
|
| QIT-Fer et Titane | | Saguenay County, Quebec, Canada | | Rail and port (St Lawrence River) | | Mining covered by two Concessions granted by State in 1949 and 1951 which, subject to certain Mining Act restrictions, confer rights and obligations of an owner |
|
|
|
|
|
|
|
| Richards Bay Minerals (50%) | | Richards Bay, KwaZulu - Natal, South Africa | | Rail, road and port | | Long term renewable leases ; State lease for Reserve 4 initially runs to end 2022; Ingonyama Trust lease for Reserve 10 runs to 2010 |
|
|
|
|
|
|
|
| IRON ORE | | | | | | |
|
|
|
|
|
|
|
Hamersley Iron
Brockman
Marandoo
Mount Tom Price
Nammuldi
Paraburdoo
Yandicoogina
Channar (60%)
Eastern Range (54%) | | Hamersley Ranges, Western Australia | | Railway and port (owned by Hamersley Iron and operated by Pilbara Iron) | | Agreements for life of mine with Government of We stern Australia |
|
|
|
|
|
|
|
| Iron Ore Company of Canada (59%) | | Labrador City, Province of Labrador and Newfoundland | | Railway and port facilities in Sept-Iles, Quebec (owned and operated by IOC) | | Sublease with the Labrador Iron Ore Royalty Income Fund which has lease agreements with the Government of Newfoundland and Labrador that are due to be renewed in 2020 and 2022 |
|
|
|
|
|
|
|
| Rio Tinto Brasil Corumbá | | Matto Grosso do Sul, Brazil | | Road, air and river | | Government licence for undetermined period |
|
|
|
|
|
|
|
Robe River Iron
Associates (53%)
Mesa J
West Angelas | | Pilbara region, Western Australia | | Railway and port (owned by Robe River and operated by Pilbara Iron) | | Agreements for life of mine with Government of We stern Australia |
|
|
|
|
|
|
|
| Rio Tinto 2006 Form 20-F | 16 |
Back to Contents
GROUP MINES
| Mine | | History | | Type of mine | | Power source |
|
|
|
|
|
|
|
| ENERGY(continued) | | | | | | |
|
|
|
|
|
|
|
Rio Tinto Coal Australia
Bengalla (30%)
Blair Athol (71%)
Hail Creek (82%)
Hunter Valley Ops. (76%)
Kestrel (80%)
Mount Thorley Ops. (61%)
Tarong Coal
Warkworth (42%) | | Peabody Australian interests acquired in 2001. Production started for export at Blair Athol and adjacent power station at Tarong in 1984. Kestrel acquired and recommissioned 1999. Hail Creek started 2003. | | Open cut and underground (Kestrel) | | State owned grid |
|
|
|
|
|
|
|
Rio Tinto Energy America
Antelope
Colowyo (20%)
Cordero Rojo
Decker (50%)
Jacobs Ranch
Spring Creek | | Antelope, Spring Creek, Decker and Cordero acquired in 1993, Colowyo in 1995, Caballo Rojo in 1997, Jacobs Ranch in 1998 and West Antelope in 2004 | | Open cut | | Supplied by IPPs and Cooperatives through national grid service |
|
|
|
|
|
|
|
| Rössing Uranium(69%) | | Production began in 1978. Life of mine extension to 2016 approved in 2005 | | Open pit | | Namibian National Power |
|
|
|
|
|
|
|
| INDUSTRIAL MINERALS | | | | | | |
|
|
|
|
|
|
|
| Rio Tinto Minerals - Boron | | Deposit discovered in 1925, acquired by Rio Tinto in 1967 | | Open pit | | On site co-generation units |
|
|
|
|
|
|
|
| Rio Tinto Minerals - salt(65%) | | Construction of the Dampier field started in 1969; first shipment in 1972. Lake MacLeod was acquired in 1978 as an operating field | | Solar evaporation of seawater (Dampier and Port Hedland) and underground brine (Lake MacLeod); dredging of gypsum from surface of Lake MacLeod | | Dampier supply from Hamersley Iron Power; Lake MacLeod from Western Power and on site generation units; Port Hedland from Western Power |
|
|
|
|
|
|
|
| Rio Tinto Minerals - talc | | Production started in 1885; acquired in 1988. (Australian mine acquired in 2001) | | Open pit | | Supplied by EdF and on site generation units |
|
|
|
|
|
|
|
| QIT-Fer et Titane | | Production started 1950; interest acquired in 1989 | | Open pit | | Long term contract with Quebec Hydro |
|
|
|
|
|
|
|
Richards Bay Minerals
(50%) | | Production started 1977; interest acquired 1989; fifth dredge commissioned 2000 | | Beach sand dredging | | Contract with ESCOM |
|
|
|
|
|
|
|
| IRON ORE | | | | | | |
|
|
|
|
|
|
|
Hamersley Iron
Brockman
Marandoo
Mount Tom Price
Nammuldi
Paraburdoo
Yandicoogina
Channar (60%)
Eastern Range (54%) | | Annual capacity increased to 68 million tonnes during 1990s; Yandicoogina first ore shipped in 1999 and port capacity increased; Eastern Range mine started 2004 | | Open pits | | Supplied through the integrated Hamersley and Robe power network operated by Pilbara Iron |
|
|
|
|
|
|
|
| Iron Ore Company of Canada (59%) | | Current operation began in 1962 and has processed over one billion tonnes of crude ore since; annual capacity now 17.5 million tonnes of concentrate of which 13.5 million tonnes can be pelletised. Interest acquired in 2000 through North | | Open pit | | Supplied by Newfoundland Hydro under long term contract |
|
|
|
|
|
|
|
Rio Tinto Brasil
Corumbá | | Iron ore production started 1978; interest acquired in 1991 | | Open pit | | Supplied by ENERSUL |
|
|
|
|
|
|
|
Robe River Iron
Associates (53%)
Mesa J
West Angelas | | First shipment in 1972; annual sales reached 30 million tonnes in late 1990s; interest acquired in 2000 through North; West Angelas first ore shipped in 2002 and mine expanded in 2005 | | Open pit | | Supplied through the integrated Hamersley and Robe power network operated by Pilbara Iron |
|
|
|
|
|
|
|
| Rio Tinto 2006 Form 20-F | 17 |
Back to Contents
GROUP SMELTERS
|
|
|
|
|
|
|
|
|
| Smelter, refinery or plant | | Location | | Title/lease | | Plant type/product | | Capacity |
|
|
|
|
|
|
|
|
|
| ALUMINIUM GROUP | | | | | | | | |
|
|
|
|
|
|
|
|
|
| Anglesey Aluminium(51%) | | Holyhead, Anglesey, Wales | | 100% Freehold | | Aluminium smelter producing aluminium billet, block, sow | | 145,000 tonnes per year aluminium |
|
|
|
|
|
|
|
|
|
| Bell Bay | | Bell Bay, Northern Tasmania, Australia | | 100% Freehold | | Aluminium smelter producing aluminium ingot, block, t-bar | | 178,000 tonnes per year aluminium |
|
|
|
|
|
|
|
|
|
| Boyne Smelters(59%) | | Boyne Island, Queensland, Australia | | 100% Freehold | | Aluminium smelter producing aluminium ingot, billet, t-bar | | 545,000 tonnes per year aluminium |
|
|
|
|
|
|
|
|
|
| Yarwum(previously Comalco Alumina Refinery) | | Gladstone, Queensland, Australia | | 97% Freehold 3% Leasehold (expiring in 2101 and after) | | Refinery producing alumina | | 1,400,000 tonnes per year alumina |
|
|
|
|
|
|
|
|
|
Gladstone Power
Station (42%) | | Gladstone, Queensland, Australia | | 100% Freehold | | Thermal power station | | 1,680 megawatts |
|
|
|
|
|
|
|
|
|
New Zealand
Aluminium Smelters
(NZAS) (79%) | | Tiwai Point, Southland, New Zealand | | 19.6% Freehold 80.4% Leasehold (expiring in 2029 and use of certain Crown land) | | Aluminium smelter producing aluminium ingot, billet, t-bar | | 352,000 tonnes per year aluminium |
|
|
|
|
|
|
|
|
|
Queensland Alumina
(39%) | | Gladstone, Queensland, Australia | | 73.3% Freehold 26.7% Leasehold (of which more than 80% expires in 2026 and after) | | Refinery producing alumina | | 3,953,000 tonnes per year alumina |
|
|
|
|
|
|
|
|
|
| COPPER GROUP | | | | | | | | |
|
|
|
|
|
|
|
|
|
Kennecott Utah
Copper | | Magna, Salt Lake City, Utah, US | | 100% Freehold | | Flash smelting furnace / Flash convertor furnace copper refinery | | 335,000 tonnes per year refined copper |
|
|
|
|
|
|
|
|
|
| Palabora(58%) | | Phalaborwa, South Africa | | 100% Freehold | | Reverberatory Pierce Smith copper refinery | | 130,000 tonnes per year refined copper |
|
|
|
|
|
|
|
|
|
| INDUSTRIAL | | | | | | | | |
| MINERALS | | | | | | | | |
|
|
|
|
|
|
|
|
|
| Boron | | California, US | | 100% Freehold | | Borates refinery | | 584,000 tonnes per year boric oxide |
|
|
|
|
|
|
|
|
|
| QIT-Fer et Titane Sorel Plant | | Sorel-Tracy, Quebec, Canada | | 100% Freehold | | Ilmenite smelter | | 1,100,000 tonnes per year titanium dioxide slag 900,000 tonnes per year iron |
|
|
|
|
|
|
|
|
|
Richards Bay
Minerals (50%) | | Richards Bay, South Africa | | 100% Freehold | | Ilmenite smelter | | 1,060,000 tonnes per year titanium dioxide slag |
|
|
|
|
|
|
|
|
|
| IRON ORE GROUP | | | | | | | | |
|
|
|
|
|
|
|
|
|
| Hlsmelt®(60%) | | Kwinana, Western Australia | | 100% Leasehold (expiring in 2010 with rights of renewal for two further 25 year terms) | | Hlsmelt®ironmaking plant producing pig iron | | 800,000 tonnes per year pig iron |
|
|
|
|
|
|
|
|
|
IOC Pellet Plant
(59%) | | Labrador City, Newfoundland, Canada | | 100% Leaseholds (expiring in 2020, 2022 and 2025 with rights of renewal for further terms of 30 years) | | Pellet induration furnaces producing multiple iron ore pellet types | | 13,500,000 tonnes per year pellet |
|
|
|
|
|
|
|
|
|
| Rio Tinto 2006 Form 20-F | 18 |
Back to Contents
METALS AND MINERALS PRODUCTION
| | | | 2004 | | 2005 | | 2006 | |
| | | | Production (a) | | Production (a) | | Production(a) | |
|
|
|
|
|
|
|
|
|
|
|
|
|
| |
| | Rio Tinto | | Total | | Rio Tinto | | Total | | Rio Tinto | | Total | | Rio Tinto | |
| | % share (b) | | | | share | | | | share | | | | share | |
|
|
|
|
|
|
|
|
|
|
|
|
|
| |
| ALUMINA (’000 tonnes) | | | | | | | | | | | | | | |
| Eurallumina (Italy) (c) | — | | 1,064 | | 597 | | 1,070 | | 601 | | 914 | | 513 | |
| Queensland Alumina (Australia) | 38.6 | | 3,778 | | 1,459 | | 3,953 | | 1,526 | | 3,871 | | 1,494 | |
| Yarwun (Australia) (d) | 100.0 | | 175 | | 175 | | 835 | | 835 | | 1,240 | | 1,240 | |
|
|
|
|
|
|
|
|
|
|
|
|
|
| |
| Rio Tinto total | | | | | 2,231 | | | | 2,963 | | | | 3,247 | |
|
|
|
|
|
|
|
|
|
|
|
|
|
| |
| ALUMINIUM (refined) (’000 tonnes) | | | | | | | | | | | | | | |
| Anglesey (UK) | 51.0 | | 144.8 | | 73.8 | | 143.9 | | 73.4 | | 143.8 | | 73.3 | |
| Bell Bay (Australia) | 100.0 | | 162.0 | | 162.0 | | 173.8 | | 173.8 | | 177.5 | | 177.5 | |
| Boyne Island (Australia) | 59.4 | | 540.5 | | 321.2 | | 544.9 | | 326.2 | | 545.1 | | 325.0 | |
| Tiwai Point (New Zealand) | 79.4 | | 350.3 | | 279.5 | | 351.4 | | 280.3 | | 337.3 | | 268.9 | |
|
|
|
|
|
|
|
|
|
|
|
|
|
| |
| Rio Tinto total | | | | | 836.5 | | | | 853.7 | | | | 844.7 | |
|
|
|
|
|
|
|
|
|
|
|
|
|
| |
| BAUXITE (’000 tonnes) | | | | | | | | | | | | | | |
| Boké (Guinea) (e) | — | | 5,773 | | 179 | | — | | — | | — | | — | |
| Weipa (Australia) | 100.0 | | 12,649 | | 12,649 | | 15,474 | | 15,474 | | 16,139 | | 16,139 | |
|
|
|
|
|
|
|
|
|
|
|
|
|
| |
| Rio Tinto total | | | | | 12,828 | | | | 15,474 | | | | 16,139 | |
|
|
|
|
|
|
|
|
|
|
|
|
|
| |
| BORATES (’000 tonnes)(f) | | | | | | | | | | | | | | |
| Rio Tinto Minerals - Boron (US) | 100.0 | | 543 | | 543 | | 540 | | 540 | | 538 | | 538 | |
| Rio Tinto Minerals (Argentina) | 100.0 | | 22 | | 22 | | 20 | | 20 | | 15 | | 15 | |
|
|
|
|
|
|
|
|
|
|
|
|
|
| |
| Rio Tinto total | | | | | 565 | | | | 560 | | | | 553 | |
|
|
|
|
|
|
|
|
|
|
|
|
|
| |
| COAL – HARD COKING (’000 tonnes) | | | | | | | | | | | | | | |
| Rio Tinto Coal Australia(g) | | | | | | | | | | | | | | |
| Hail Creek Coal (Australia) (h) | 82.0 | | 5,104 | | 4,633 | | 5,900 | | 4,838 | | 4,544 | | 3,726 | |
| Kestrel Coal (Australia) | 80.0 | | 2,659 | | 2,127 | | 2,946 | | 2,357 | | 2,729 | | 2,183 | |
|
|
|
|
|
|
|
|
|
|
|
|
|
| |
| Rio Tinto total hard coking coal | | | | | 6,760 | | | | 7,195 | | | | 5,909 | |
|
|
|
|
|
|
|
|
|
|
|
|
|
| |
| COAL – OTHER* (’000 tonnes) | | | | | | | | | | | | | | |
| Rio Tinto Coal Australia(g) | | | | | | | | | | | | | | |
| Bengalla (Australia) | 30.3 | | 5,312 | | 1,609 | | 5,965 | | 1,806 | | 5,544 | | 1,679 | |
| Blair Athol (Australia) | 71.2 | | 12,229 | | 8,712 | | 10,600 | | 7,551 | | 10,190 | | 7,259 | |
| Hunter Valley Operations (Australia) | 75.7 | | 13,269 | | 10,046 | | 12,374 | | 9,369 | | 12,024 | | 9,104 | |
| Kestrel Coal (Australia) | 80.0 | | 623 | | 499 | | 774 | | 619 | | 863 | | 691 | |
| Mount Thorley Operations (Australia) | 60.6 | | 3,548 | | 2,149 | | 3,962 | | 2,400 | | 3,895 | | 2,359 | |
| Tarong Coal (Australia) | 100.0 | | 7,004 | | 7,004 | | 6,470 | | 6,470 | | 6,979 | | 6,979 | |
| Warkworth (Australia) | 42.1 | | 6,954 | | 2,926 | | 6,293 | | 2,647 | | 7,342 | | 3,089 | |
|
|
|
|
|
|
|
|
|
|
|
|
|
| |
| Total Australian other coal | | | | | 32,943 | | | | 30,863 | | | | 31,159 | |
|
|
|
|
|
|
|
|
|
|
|
|
|
| |
| Rio Tinto Energy America(i) | | | | | | | | | | | | | | |
| Antelope (US) | 100.0 | | 26,928 | | 26,928 | | 27,174 | | 27,174 | | 30,749 | | 30,749 | |
| Colowyo (US) | (j) | | 5,788 | | 5,788 | | 5,325 | | 5,325 | | 5,754 | | 5,754 | |
| Cordero Rojo (US) | 100.0 | | 35,233 | | 35,233 | | 34,234 | | 34,234 | | 36,094 | | 36,094 | |
| Decker (US) | 50.0 | | 7,831 | | 3,916 | | 6,288 | | 3,144 | | 6,449 | | 3,225 | |
| Jacobs Ranch (US) | 100.0 | | 34,979 | | 34,979 | | 33,823 | | 33,823 | | 36,258 | | 36,258 | |
| Spring Creek (US) | 100.0 | | 10,892 | | 10,892 | | 11,881 | | 11,881 | | 13,181 | | 13,181 | |
|
|
|
|
|
|
|
|
|
|
|
|
|
| |
| Total US coal | | | | | 117,734 | | | | 115,580 | | | | 125,260 | |
|
|
|
|
|
|
|
|
|
|
|
|
|
| |
| Rio Tinto total other coal | | | | | 150,677 | | | | 146,443 | | | | 156,418 | |
|
|
|
|
|
|
|
|
|
|
|
|
|
| |
| * | Coal – other includes thermal coal, semi-soft coking coal and semi-hard coking coal. |
| See notes on page 22 |
| Rio Tinto 2006Form 20-F | 19 |
Back to Contents
METALS AND MINERALS PRODUCTION continued
| | | | 2004 | | 2005 | | 2006 | |
| | | | Production (a) | | Production (a) | | Production(a) | |
|
|
|
|
|
|
|
|
|
|
|
|
|
| |
| | Rio Tinto | | Total | | Rio Tinto | | Total | | Rio Tinto | | Total | | Rio Tinto | |
| | % share (b) | | | | share | | | | share | | | | share | |
|
|
|
|
|
|
|
|
|
|
|
|
|
| |
| COPPER (mined) (’000 tonnes) | | | | | | | | | | | | | | |
| Bingham Canyon (US) | 100.0 | | 263.7 | | 263.7 | | 220.6 | | 220.6 | | 265.6 | | 265.6 | |
| Escondida (Chile) | 30.0 | | 1,207.1 | | 362.1 | | 1,270.2 | | 381.1 | | 1,313.4 | | 394.0 | |
| Grasberg – FCX (Indonesia) (k) | — | | 396.4 | | 5.5 | | — | | — | | — | | — | |
| Grasberg – Joint Venture (Indonesia) (k) | 40.0 | | 120.0 | | 48.0 | | 273.9 | | 109.6 | | 115.5 | | 46.2 | |
| Neves Corvo (Portugal) (l) | — | | 46.9 | | 23.0 | | — | | — | | — | | — | |
| Northparkes (Australia) | 80.0 | | 30.0 | | 24.0 | | 54.0 | | 43.2 | | 83.3 | | 66.6 | |
| Palabora (South Africa) (m) | 57.7 | | 54.4 | | 26.8 | | 61.2 | | 30.0 | | 61.5 | | 31.1 | |
|
|
|
|
|
|
|
|
|
|
|
|
|
| |
| Rio Tinto total | | | | | 753.1 | | | | 784.4 | | | | 803.5 | |
|
|
|
|
|
|
|
|
|
|
|
|
|
| |
| COPPER (refined) (’000 tonnes) | | | | | | | | | | | | | | |
| Atlantic Copper (Spain) (k) | — | | 58.4 | | 7.0 | | — | | — | | — | | — | |
| Escondida (Chile) | 30.0 | | 152.1 | | 45.6 | | 143.9 | | 43.2 | | 134.4 | | 40.3 | |
| Kennecott Utah Copper (US) | 100.0 | | 246.7 | | 246.7 | | 232.0 | | 232.0 | | 217.9 | | 217.9 | |
| Palabora (South Africa) (m) | 57.7 | | 67.5 | | 33.2 | | 80.3 | | 39.3 | | 81.2 | | 40.9 | |
|
|
|
|
|
|
|
|
|
|
|
|
|
| |
| Rio Tinto total | | | | | 332.6 | | | | 314.5 | | | | 299.2 | |
|
|
|
|
|
|
|
|
|
|
|
|
|
| |
| DIAMONDS (’000 carats) | | | | | | | | | | | | | | |
| Argyle (Australia) | 100.0 | | 20,620 | | 20,620 | | 30,476 | | 30,476 | | 29,078 | | 29,078 | |
| Diavik (Canada) | 60.0 | | 7,575 | | 4,545 | | 8,272 | | 4,963 | | 9,829 | | 5,897 | |
| Murowa (Zimbabwe) (n) | 77.8 | | 47 | | 36 | | 251 | | 195 | | 240 | | 187 | |
|
|
|
|
|
|
|
|
|
|
|
|
|
| |
| Rio Tinto total | | | | | 25,202 | | | | 35,635 | | | | 35,162 | |
|
|
|
|
|
|
|
|
|
|
|
|
|
| |
| GOLD (mined) (’000 ounces) | | | | | | | | | | | | | | |
| Barneys Canyon (US) | 100.0 | | 22 | | 22 | | 16 | | 16 | | 15 | | 15 | |
| Bingham Canyon (US) | 100.0 | | 308 | | 308 | | 401 | | 401 | | 523 | | 523 | |
| Cortez/Pipeline (US) | 40.0 | | 1,051 | | 421 | | 904 | | 361 | | 444 | | 178 | |
| Escondida (Chile) | 30.0 | | 217 | | 65 | | 183 | | 55 | | 170 | | 51 | |
| Grasberg – FCX (Indonesia) (k) | — | | 1,377 | | 14 | | — | | — | | — | | — | |
| Grasberg – Joint Venture (Indonesia) (k) | 40.0 | | 207 | | 83 | | 1,676 | | 670 | | 238 | | 95 | |
| Greens Creek (US) | 70.3 | | 86 | | 61 | | 73 | | 51 | | 63 | | 44 | |
| Kelian (Indonesia) | 90.0 | | 328 | | 295 | | 43 | | 38 | | — | | — | |
| Lihir (Papua New Guinea) (o) | — | | 599 | | 87 | | 424 | | 61 | | — | | — | |
| Morro do Ouro (Brazil) (p) | — | | 188 | | 96 | | — | | — | | — | | — | |
| Northparkes (Australia) | 80.0 | | 79 | | 63 | | 57 | | 46 | | 95 | | 76 | |
| Rawhide (US) | 51.0 | | 50 | | 25 | | 35 | | 18 | | 26 | | 13 | |
| Rio Tinto Zimbabwe (Zimbabwe) (q) | — | | 11 | | 6 | | — | | — | | — | | — | |
| Others | — | | 13 | | 7 | | 15 | | 7 | | 18 | | 9 | |
|
|
|
|
|
|
|
|
|
|
|
|
|
| |
| Rio Tinto total | | | | | 1,552 | | | | 1,726 | | | | 1,003 | |
|
|
|
|
|
|
|
|
|
|
|
|
|
| |
| GOLD (refined) (’000 ounces) | | | | | | | | | | | | | | |
| Kennecott Utah Copper (US) | 100.0 | | 300 | | 300 | | 369 | | 369 | | 462 | | 462 | |
|
|
|
|
|
|
|
|
|
|
|
|
|
| |
| IRON ORE (’000 tonnes) | | | | | | | | | | | | | | |
| Channar (Australia) | 60.0 | | 9,759 | | 5,855 | | 8,644 | | 5,186 | | 9,798 | | 5,879 | |
| Corumbá (Brazil) | 100.0 | | 1,301 | | 1,301 | | 1,410 | | 1,410 | | 1,982 | | 1,982 | |
| Eastern Range (Australia) | (r) | | 2,970 | | 2,970 | | 6,559 | | 6,559 | | 8,215 | | 8,215 | |
| Hamersley Iron (Australia) | 100.0 | | 65,407 | | 65,407 | | 74,387 | | 74,387 | | 79,208 | | 79,208 | |
| Iron Ore Company of Canada (Canada) | 58.7 | | 11,139 | | 6,541 | | 15,647 | | 9,188 | | 16,080 | | 9,442 | |
| Robe River (Australia) | 53.0 | | 48,459 | | 25,684 | | 52,385 | | 27,764 | | 52,932 | | 28,054 | |
|
|
|
|
|
|
|
|
|
|
|
|
|
| |
| Rio Tinto total | | | | | 107,757 | | | | 124,494 | | | | 132,780 | |
|
|
|
|
|
|
|
|
|
|
|
|
|
| |
| See notes on page 22 | | | | | | | | | | | | | | |
| Rio Tinto 2006Form 20-F | 20 |
Back to Contents
METALS AND MINERALS PRODUCTION continued
| | | | 2004 | | 2005 | | 2006 | |
| | | | Production (a) | | Production (a) | | Production(a) | |
|
|
|
|
|
|
|
|
|
|
|
|
|
| |
| | Rio Tinto | | Total | | Rio Tinto | | Total | | Rio Tinto | | Total | | Rio Tinto | |
| | % share (b) | | | | share | | | | share | | | | share | |
|
|
|
|
|
|
|
|
|
|
|
|
|
| |
| LEAD (’000 tonnes) | | | | | | | | | | | | | | |
| Greens Creek (US) | 70.3 | | 19.8 | | 13.9 | | 16.9 | | 11.9 | | 16.9 | | 11.9 | |
| Zinkgruvan (Sweden) (s) | — | | 11.2 | | 11.2 | | — | | — | | — | | — | |
|
|
|
|
|
|
|
|
|
|
|
|
|
| |
| Rio Tinto total | | | | | 25.1 | | | | 11.9 | | | | 11.9 | |
|
|
|
|
|
|
|
|
|
|
|
|
|
| |
| MOLYBDENUM (’000 tonnes) | | | | | | | | | | | | | | |
| Bingham Canyon (US) | 100.0 | | 6.8 | | 6.8 | | 15.6 | | 15.6 | | 16.8 | | 16.8 | |
|
|
|
|
|
|
|
|
|
|
|
|
|
| |
| NICKEL (refined) (’000 tonnes) | | | | | | | | | | | | | | |
| Empress (Zimbabwe) (q) | — | | 2.9 | | 1.6 | | — | | — | | — | | — | |
|
|
|
|
|
|
|
|
|
|
|
|
|
| |
| PIG IRON (’000 tonnes) | | | | | | | | | | | | | | |
| HIsmelt®(Australia) (t) | 60.0 | | — | | — | | 9 | | 5 | | 89 | | 53 | |
|
|
|
|
|
|
|
|
|
|
|
|
|
| |
| SALT (’000 tonnes) | | | | | | | | | | | | | | |
| Rio Tinto Minerals - salt (Australia) | 64.9 | | 7,380 | | 4,792 | | 8,480 | | 5,507 | | 8,323 | | 5,405 | |
|
|
|
|
|
|
|
|
|
|
|
|
|
| |
| SILVER (mined) (’000 ounces) | | | | | | | | | | | | | | |
| Bingham Canyon (US) | 100.0 | | 3,584 | | 3,584 | | 3,958 | | 3,958 | | 4,214 | | 4,214 | |
| Escondida (Chile) | 30.0 | | 5,747 | | 1,724 | | 6,565 | | 1,970 | | 6,646 | | 1,994 | |
| Grasberg – FCX (Indonesia) (k) | — | | 3,077 | | 79 | | — | | — | | — | | — | |
| Grasberg – Joint Venture (Indonesia) (k) | 40.0 | | 1,961 | | 784 | | 3,410 | | 1,364 | | 1,675 | | 670 | |
| Greens Creek (US) | 70.3 | | 9,707 | | 6,821 | | 9,664 | | 6,791 | | 8,866 | | 6,230 | |
| Zinkgruvan (Sweden) (s) | — | | 651 | | 651 | | — | | — | | — | | — | |
| Others | — | | 2,025 | | 1,187 | | 1,422 | | 843 | | 1,345 | | 861 | |
|
|
|
|
|
|
|
|
|
|
|
|
|
| |
| Rio Tinto total | | | | | 14,830 | | | | 14,926 | | | | 13,968 | |
|
|
|
|
|
|
|
|
|
|
|
|
|
| |
| SILVER (refined) (’000 ounces) | | | | | | | | | | | | | | |
| Kennecott Utah Copper (US) | 100.0 | | 3,344 | | 3,344 | | 3,538 | | 3,538 | | 4,152 | | 4,152 | |
|
|
|
|
|
|
|
|
|
|
|
|
|
| |
| TALC (’000 tonnes) | | | | | | | | | | | | | | |
| Rio Tinto Minerals – talc (Australia/Europe/N. America) (u) | 100.0 | | 1,444 | | 1,443 | | 1,364 | | 1,364 | | 1,392 | | 1,392 | |
|
|
|
|
|
|
|
|
|
|
|
|
|
| |
| TIN (tonnes) | | | | | | | | | | | | | | |
| Neves Corvo (Portugal) (l) | — | | 120 | | 59 | | — | | — | | — | | — | |
|
|
|
|
|
|
|
|
|
|
|
|
|
| |
| TITANIUM DIOXIDE FEEDSTOCK (‘000 tonnes) | | | | | | | | | | | | | | |
| Rio Tinto Iron & Titanium (Canada/South Africa) (v) | 100.0 | | 1,192 | | 1,192 | | 1,312 | | 1,312 | | 1,415 | | 1,415 | |
|
|
|
|
|
|
|
|
|
|
|
|
|
| |
| URANIUM (tonnes U3O8) | | | | | | | | | | | | | | |
| Energy Resources of Australia (Australia) | 68.4 | | 5,143 | | 3,517 | | 5,903 | | 4,037 | | 4,704 | | 3,217 | |
| Rössing (Namibia) | 68.6 | | 3,582 | | 2,457 | | 3,711 | | 2,545 | | 3,617 | | 2,481 | |
|
|
|
|
|
|
|
|
|
|
|
|
|
| |
| Rio Tinto total | | | | | 5,974 | | | | 6,582 | | | | 5,698 | |
|
|
|
|
|
|
|
|
|
|
|
|
|
| |
| ZINC (mined) (’000 tonnes) | | | | | | | | | | | | | | |
| Greens Creek (US) | 70.3 | | 62.7 | | 44.1 | | 52.9 | | 37.2 | | 47.5 | | 33.4 | |
| Zinkgruvan (Sweden) (s) | — | | 29.7 | | 29.7 | | — | | — | | — | | — | |
|
|
|
|
|
|
|
|
|
|
|
|
|
| |
| Rio Tinto total | | | | | 73.8 | | | | 37.2 | | | | 33.4 | |
|
|
|
|
|
|
|
|
|
|
|
|
|
| |
| See notes on page 22 | | | | | | | | | | | | | | |
| Rio Tinto 2006Form 20-F | 21 |
Back to Contents
METALS AND MINERALS PRODUCTION continued
| Notes |
| (a) | Mine production figures for metals refer to the total quantity of metal produced in concentrates or doré bullion irrespective of whether these products are then refined onsite, except for the data for iron ore and bauxite which represent production of saleable quantities of ore. |
| (b) | Rio Tinto percentage share, shown above, is as at the end of 2006 and has applied over the period 2004 – 2006 except for those operations where the share has varied during the year and the weighted average for them is shown below. The Rio Tinto share varies at individual mines and refineries in the “Others” category and thus no value is shown. |
| | | | | | | | | | |
| | Rio Tinto share % | | | | | | | | |
| | Operation | See Note | | 2004 | | 2005 | | 2006 | |
| |
|
|
|
|
|
|
|
| |
| | Atlantic Copper | (k) | | 12.0 | | — | | — | |
| | Grasberg | (k) | | 10.8 | | — | | — | |
| | Hail Creek | (h) | | 90.8 | | 82.0 | | 82.0 | |
| | Palabora | (m) | | 49.2 | | 49.0 | | 50.5 | |
| |
|
|
|
|
|
|
|
| |
| (c) | Rio Tinto sold its 56.2 per cent share in Eurallumina with an effective date of 31 October 2006 and production data are shown up to that date. |
| (d) | Yarwun, previously known as Comalco Alumina Refinery, started production in October 2004. |
| (e) | Rio Tinto completed the sale of its four per cent interest in the Boké mine on 25 June 2004. Production data are shown up t o the date of sale. |
| (f) | Borate quantities are expressed as B2O3. |
| (g) | Rio Tinto Coal Australia manages all the Australian coal operations including the mines which were previously reported separately under the Coal & Allied name. |
| (h) | Rio Tinto reduced its shareholding in Hail Creek from 92.0 per cent to 82.0 per cent on 15 November 2004. |
| (i) | Rio Tinto Energy America was previously known as Kennecott Energy. |
| (j) | In view of Rio Tinto Energy America’s responsibilities under a management agreement for the operation of the Colowyo mine, all of Colowyo’s output is included in Rio Tinto’s share of production. |
| (k) | From mid 1995 until 30 March 2004, Rio Tinto held 23.93 million shares of Freeport-McMoRan Copper & Gold (FCX) common stock from which it derived a share of production. This interest was sold to FCX on 30 March 2004. Also, through a joint venture agreement with FCX, Rio Tinto is entitled, as shown separately in the above tables, to 40 per cent of additional material mined as a consequence of expansions and developments of the Grasberg facilities since 1998. |
| (l) | Rio Tinto completed the sale of its 49 per cent interest in Somincor on 18 June 2004. Production data are shown up to the d ate of sale. |
| (m) | During the second half of 2005, the conversion of debentures into ordinary shares resulted in a dilution of Rio Tinto’s shareholding in Palabora from 49.2 per cent to 47.2 per cent. The conversions, which continued during 2006, were completed during the third quarter when Rio Tinto also participated, ending the year with a 57.7 per cent interest. |
| (n) | Ore mining and processing at Murowa commenced during the third quarter of 2004. |
| (o) | On 30 November 2005, Rio Tinto sold its 14.5 per cent in Lihir Gold; it had agreed in September 2005 to relinquish the management agreement for Lihir. The production data are shown up to 30 September 2005, from which date the Rio Tinto interest in Lihir was held as an investment rather than being equity accounted.. |
| (p) | Rio Tinto sold its 51 per cent interest in Morro do Ouro on 31 December 2004. Production data are shown up to the date of sale. |
| (q) | As a result of the corporate restructuring completed on 8 July 2004, Rio Tinto has ceased to be an ordinary shareholder in the renamed RioZim but will retain a reduced cash participation in its gold and nickel assets for a period of ten years. |
| (r) | Rio Tinto’s share of production includes 100 per cent of the production from the Eastern Range mine, which commenced production in March 2004. Under the terms of the joint venture agreement (Rio Tinto 54 per cent), Hamersley Iron manages the operation and is obliged to purchase all mine production from the joint venture. |
| (s) | Rio Tinto completed the sale of its 100 per cent interest in the Zinkgruvan mine on 2 June 2004. Production data are shown up to the date of sale. |
| (t) | HIsmelt® commenced production during September 2005. |
| (u) | Talc production includes some products derived from purchased ores. |
| (v) | Quantities comprise 100 per cent of QIT and 50 per cent of Richards Bay Minerals’ production. |
| Rio Tinto 2006Form 20-F | 22 |
Back to Contents
ORE RESERVES
(under Industry Guide 7)
| Reserves have been prepared in accordance with Industry Guide 7 under the United States Securities Act of 1933 and the following definitions: |
| • | An ‘Ore Reserve’ means that part of a mineral deposit that can be economically and legally extracted orproduced at the time of the reserves determination. To establish this, studies appropriate to the type of mineraldeposit involved have been carried out to estimate the quantity, grade and value of the ore mineral(s) present. Inaddition, technical studies have been completed to determine realistic assumptions for the extraction of theminerals including estimates of mining, processing, economic, marketing, legal, environmental, social andgovernmental factors. The degree of these studies is sufficient to demonstrate the technical and economicfeasibility of the project and depends on whether or not the project is an extension of an existing project oroperation. The estimates of minerals to be produced include allowances for ore losses and the treatment ofunmineralised materials which may occur as part of the mining and processing activities. Ore Reserves are sub-divided in order of increasing confidence into Probable Ore Reserves and Proven Ore Reserves as defined below. |
| • | The term “economically”, as used in the definition of reserves, implies that profitable extraction or productionunder defined investment assumptions has been established through the creation of a mining plan, processingplan and cash flow model. The assumptions made must be reasonable, including costs and operating conditionsthat will prevail during the life of the project. |
| • | Ore reserves presented in accordance with SEC Industry Guide 7 do not exceed the quantities that, it isestimated, could be extracted economically if future prices were to be in line with the average of historical pricesfor the three years to 30 June 2006, or contracted prices where applicable. For this purpose, contracted prices areapplied only to future sales volumes for which the price is predetermined by an existing contract; and theaverage of historical prices is applied to expected sales volumes in excess of such amounts. Moreover, reportedore reserve estimates have not been increased above the levels expected to be economic based on Rio Tinto'sown long term price assumptions. |
| • | The term “legally”, as used in the definition of reserves, does not imply that all permits needed for mining andprocessing have been obtained or that other legal issues have been completely resolved. However, for reservesto exist, there is reasonable assurance of the issuance of these permits or resolution of legal issues. Reasonableassurance means that, based on applicable laws and regulations, the issuance of permits or resolution of legalissues necessary for mining and processing at a particular deposit will be accomplished in the ordinary courseand in a timeframe consistent with the Company’s current mine plans. |
| • | The term “proven reserves” means reserves for which (a) quantity is computed from dimensions revealed inoutcrops, trenches, workings or drill holes; grade and/or quality are computed from the results of detailedsampling; and (b) the sites for inspection, sampling and measurement are spaced so closely and the geologiccharacter is so well defined that size, shape, depth and mineral content of reserves are well established. Provenreserves represent that part of an orebody for which there exists the highest level of confidence in data regardingits geology, physical characteristics, chemical composition and probable processing requirements. |
| • | The term “probable reserves” means reserves for which quantity and grade and/or quality are computed frominformation similar to that used for proven reserves, but the sites for inspection, sampling and measurement arefarther apart or are otherwise less adequately spaced. The degree of assurance, although lower than that forproven reserves, is high enough to assume continuity between points of observation. This means that probablereserves generally have a wider drill hole spacing than for proven reserves. |
| • | The amount of proven and probable reserves shown below does not necessarily represent the amount of materialcurrently scheduled for extraction, because the amount scheduled for extraction may be derived from a life ofmine plan predicated on prices and other assumptions which are different to those used in the life of mine planprepared in accordance with Industry Guide 7. |
| • | The estimated ore reserve figures in the following tables are as of 31 December 2006. Metric units are usedthroughout. The figures used to calculate Rio Tinto's share of reserves are often more precise than the roundednumbers shown in the tables, hence small differences might result if the calculations are repeated using thetabulated figures. Commodity price information is given in footnote (a). |
| Rio Tinto 2006Form 20-F | 23 |
Back to Contents
ORE RESERVES (under Industry Guide 7) continued
| | | | | | | | | | | |
| | Type of | | Total ore reserves at end 2006 | | | | | |
| | mine | |
|
|
| | Interest | | Rio Tinto | |
| | (b) | | Tonnage | | Grade | | % | | share | |
|
|
|
|
|
|
|
|
|
| |
| | | | | | | | | | Recoverable | |
| | | | | | | | | | mineral | |
| | | | millions | | | | | | millions | |
| BAUXITE (d) | | | of tonnes | | %Al2O3 | | | | of tonnes | |
| Reserves at operating mine | | | | | | | | | | |
| Weipa (Australia) | O/P | | 1,193 | | 53.7 | | 100.0 | | 1,193 | |
|
|
|
|
|
|
|
|
|
| |
| | | | | | | | | | | |
| | | | | | | | | | Marketable | |
| | | | | | | | | | product | |
| | | | millions | | | | | | millions | |
| BORATES (e) | | | of tonnes | | | | | | of tonnes | |
| Reserves at operating mine | | | | | | | | | | |
| Rio Tinto Minerals - Boron (US) (j) | | | | | | | | | | |
| – mine | O/P | | 19.8 | | | | 100.0 | | 19.8 | |
| – stockpiles (i) | S/P | | 2.1 | | | | 100.0 | | 2.1 | |
|
|
|
|
|
|
|
|
|
| |
| Rio Tinto total | | | | | | | | | 21.9 | |
|
|
|
|
|
|
|
|
|
| |
| | | | | | | | | | | | | |
| | | | Coal type | | Marketable | | Marketable coal quality | | | | | |
| | | | (g) | | reserves | | (h) | | (h) | | | | | |
| | | | | |
|
|
|
|
| | | | | |
| | | | | | | | | | | | | | Marketable | |
| | | | | | | | Calorific | | Sulphur | | | | reserves | |
| | | | | | millions | | value | | content | | | | millions | |
| COAL (f) | | | | | of tonnes | | MJ/kg | | % | | | | of tonnes | |
| Reserves at operating mines | | | | | | | | | | | | | | |
| Rio Tinto Energy America(k) | | | | | | | | | | | | | | |
| Antelope (US) | O/C | | SC | | 359 | | 20.59 | | 0.24 | | 100.0 | | 359 | |
| Colowyo (US) (l) | O/C | | SC | | 14 | | 24.39 | | 0.39 | | 100.0 | | 14 | |
| Cordero Rojo (US) | O/C | | SC | | 285 | | 19.59 | | 0.31 | | 100.0 | | 285 | |
| Decker (US) | O/C | | SC | | 18 | | 22.10 | | 0.38 | | 50.0 | | 9 | |
| Jacobs Ranch (US) | O/C | | SC | | 418 | | 20.35 | | 0.43 | | 100.0 | | 418 | |
| Spring Creek (US) | O/C | | SC | | 199 | | 21.75 | | 0.33 | | 100.0 | | 199 | |
|
|
|
|
|
|
|
|
|
|
|
|
|
| |
| Total US coal | | | | | | | | | | | | | 1,283 | |
|
|
|
|
|
|
|
|
|
|
|
|
|
| |
| Rio Tinto Coal Australia | | | | | | | | | | | | | | |
| Bengalla (Australia) | O/C | | SC | | 150 | | 28.12 | | 0.48 | | 30.3 | | 45 | |
| Blair Athol (Australia) | O/C | | SC | | 42 | | 27.13 | | 0.30 | | 71.2 | | 30 | |
| Hail Creek (Australia) | O/C | | MC | | 179 | | 32.20 | | 0.35 | | 82.0 | | 146 | |
| Hunter Valley Operations | O/C | | SC + MC | | 308 | | 28.94 | | 0.57 | | 75.7 | | 233 | |
| (Australia) | | | | | | | | | | | | | | |
| Kestrel (Australia) | U/G | | SC + MC | | 112 | | 32.20 | | 0.65 | | 80.0 | | 90 | |
| Mount Thorley Operations | O/C | | SC + MC | | 23 | | 29.48 | | 0.46 | | 60.6 | | 14 | |
| (Australia) | | | | | | | | | | | | | | |
| Warkworth (Australia) | O/C | | SC + MC | | 251 | | 28.87 | | 0.45 | | 42.1 | | 106 | |
|
|
|
|
|
|
|
|
|
|
|
|
|
| |
| Total Australian coal | | | | | | | | | | | | | 664 | |
|
|
|
|
|
|
|
|
|
|
|
|
|
| |
| Rio Tinto total reserves at operating mines | | | | | | | | | | | | | 1,946 | |
|
|
|
|
|
|
|
|
|
|
|
|
|
| |
| Undeveloped reserves(m) | | | | | | | | | | | | | | |
| Rio Tinto Coal Australia | | | | | | | | | | | | | | |
| Clermont (Australia) | O/C | | SC | | 189 | | 27.90 | | 0.33 | | 50.1 | | 95 | |
| Mount Pleasant (Australia) | O/C | | SC | | 350 | | 26.73 | | 0.51 | | 75.7 | | 265 | |
|
|
|
|
|
|
|
|
|
|
|
|
|
| |
| Rio Tinto total undeveloped reserves | | | | | | | | | | | | | 360 | |
|
|
|
|
|
|
|
|
|
|
|
|
|
| |
| See notes on pages 32 to 33 | | | | | | | | | | | | | | |
| Rio Tinto 2006Form 20-F | 24 |
Back to Contents
ORE RESERVES (under Industry Guide 7) continued
| | | | Total ore reserves | | Average | | | | | |
| | Type of | | at end 2006 | | mill | | | | | |
| | mine | |
|
|
| | recovery | | Interest | | Rio Tinto | |
| | (b) | | Tonnage | | Grade | | % | | % | | share | |
|
|
|
|
|
|
|
|
|
|
|
| |
| | | | | | | | | | | | Recoverable | |
| | | | | | | | | | | | metal | |
| | | | millions | | | | | | | | millions | |
| COPPER | | | of tonnes | | %Cu | | | | | | of tonnes | |
| Reserves at operating mines | | | | | | | | | | | | |
| Bingham Canyon (US) | | | | | | | | | | | | |
| – mine | O/P | | 604 | | 0.54 | | 86 | | 100.0 | | 2.802 | |
| – stockpiles (i) | S/P | | 37 | | 0.33 | | 86 | | 100.0 | | 0.107 | |
| Escondida (Chile) (n) | | | | | | | | | | | | |
| – sulphide mine | O/P | | 1,360 | | 1.06 | | 85 | | 30.0 | | 3.681 | |
| – sulphide leach mine | O/P | | 1,412 | | 0.51 | | 34 | | 30.0 | | 0.744 | |
| – oxide mine | O/P | | 21 | | 0.74 | | 75 | | 30.0 | | 0.035 | |
| – sulphide stockpiles (i) | S/P | | 17 | | 1.23 | | 85 | | 30.0 | | 0.053 | |
| – sulphide leach stockpiles (i) | S/P | | 131 | | 0.49 | | 34 | | 30.0 | | 0.067 | |
| – oxide stockpiles (i) | S/P | | 57 | | 0.67 | | 75 | | 30.0 | | 0.086 | |
| Escondida Norte (Chile) (n) | | | | | | | | | | | | |
| – sulphide mine | O/P | | 455 | | 1.40 | | 85 | | 30.0 | | 1.621 | |
| – sulphide leach mine | O/P | | 604 | | 0.60 | | 34 | | 30.0 | | 0.371 | |
| – oxide mine | O/P | | 22 | | 1.55 | | 75 | | 30.0 | | 0.076 | |
| – sulphide stockpiles (i) | S/P | | 0.1 | | 4.07 | | 85 | | 30.0 | | 0.001 | |
| – sulphide leach stockpiles (i) | S/P | | 1.5 | | 0.52 | | 34 | | 30.0 | | 0.001 | |
| – oxide stockpiles (i) | S/P | | 3.3 | | 0.96 | | 75 | | 30.0 | | 0.007 | |
| Grasberg (Indonesia) | O/P + U/G | | 2,813 | | 1.04 | | 88 | | (o) | | 7.584 | |
| Northparkes (Australia) | | | | | | | | | | | | |
| – mine | U/G | | 46 | | 1.06 | | 91 | | 80.0 | | 0.355 | |
| – stockpiles (i) | S/P | | 3.8 | | 0.67 | | 85 | | 80.0 | | 0.017 | |
| Palabora (South Africa) (p) | | | | | | | | | | | | |
| – mine | U/G | | 118 | | 0.64 | | 88 | | 57.7 | | 0.381 | |
|
|
|
|
|
|
|
|
|
|
|
| |
| Rio Tinto total | | | | | | | | | | | 17.989 | |
|
|
|
|
|
|
|
|
|
|
|
| |
| | | | | | | | | | | | | |
| | | | | | | | | | | | Recoverable | |
| | | | | | | | | | | | diamonds | |
| | | | millions | | carats | | | | | | millions | |
| DIAMONDS (d) | | | of tonnes | | per tonne | | | | | | of carats | |
| Reserves at operating mines | | | | | | | | | | | | |
| Argyle (Australia) | | | | | | | | | | | | |
| – AK1 pipe mine (q) | O/P + U/G | | 102 | | 2.1 | | | | 100.0 | | 215.5 | |
| – AK1 pipe stockpiles (i) | S/P | | 3.9 | | 1.3 | | | | 100.0 | | 5.0 | |
| Diavik (Canada) (r) | O/P + U/G | | 25 | | 3.3 | | | | 60.0 | | 49.0 | |
| Murowa (Zimbabwe) | | | | | | | | | | | | |
| – mine | O/P | | 22 | | 0.7 | | | | 77.8 | | 11.8 | |
| – stockpiles (i) | S/P | | 0.1 | | 1.2 | | | | 77.8 | | 0.1 | |
|
|
|
|
|
|
|
|
|
|
|
| |
| Rio Tinto total | | | | | | | | | | | 281.5 | |
|
|
|
|
|
|
|
|
|
|
|
| |
| | | | | | | | | | | | | |
| | | | | | | | | | | | Recoverable | |
| | | | | | | | | | | | metal | |
| | | | millions | | grammes | | | | | | millions | |
| GOLD | | | of tonnes | | per tonne | | | | | | of ounces | |
| Reserves at operating mines | | | | | | | | | | | | |
| Bingham Canyon (US) | | | | | | | | | | | | |
| – mine | O/P | | 604 | | 0.31 | | 64 | | 100.0 | | 3.882 | |
| – stockpiles (i) | S/P | | 37 | | 0.20 | | 64 | | 100.0 | | 0.151 | |
| Cortez/Pipeline (US) (s) | | | | | | | | | | | | |
| – mine | O/P | | 125 | | 1.83 | | 73 | | 40.0 | | 2.131 | |
| – stockpiles (i) | S/P | | 1.1 | | 4.30 | | 86 | | 40.0 | | 0.052 | |
| Grasberg (Indonesia) | O/P + U/G | | 2,813 | | 0.90 | | 69 | | (o) | | 13.751 | |
| Greens Creek (US) | U/G | | 7.0 | | 3.86 | | 69 | | 70.3 | | 0.417 | |
| Northparkes (Australia) | | | | | | | | | | | | |
| – mine | U/G | | 46 | | 0.46 | | 74 | | 80.0 | | 0.407 | |
| – stockpiles (i) | S/P | | 3.8 | | 0.58 | | 76 | | 80.0 | | 0.043 | |
|
|
|
|
|
|
|
|
|
|
|
| |
| Rio Tinto total | | | | | | | | | | | 20.834 | |
|
|
|
|
|
|
|
|
|
|
|
| |
| See notes on pages 32 to 33 | | | | | | | | | | | | |
| Rio Tinto 2006Form 20-F | 25 |
Back to Contents
ORE RESERVES (under Industry Guide 7) continued
| | | | Total ore reserves | | Average | | | | | |
| | Type of | | at end 2006 | | mill | | | | | |
| | mine | |
|
|
| | recovery | | Interest | | Rio Tinto | |
| | (b) | | Tonnage | | Grade | | % | | % | | share | |
|
|
|
|
|
|
|
|
|
|
|
| |
| | | | | | | | | | | | Marketable | |
| | | | | | | | | | | | product | |
| | | | millions | | | | | | | | millions | |
| IRON ORE (d) | | | of tonnes | | %Fe | | | | | | of tonnes | |
| Reserves at operating mines | | | | | | | | | | | | |
| and mines under construction | | | | | | | | | | | | |
| Channar (Australia) | | | | | | | | | | | | |
| – Brockman Ore | O/P | | 100 | | 63.5 | | | | 60.0 | | 60 | |
| Corumbá (Brazil) | | | | | | | | | | | | |
| – mine | O/P | | 213 | | 67.2 | | | | 100.0 | | 213 | |
| – stockpiles (i) | S/P | | 1 | | 66.7 | | | | 100.0 | | 1 | |
| Eastern Range (Australia) | | | | | | | | | | | | |
| – Brockman Ore | O/P | | 91 | | 62.9 | | | | 54.0 | | 49 | |
| Hope Downs (Australia) (t) | | | | | | | | | | | | |
| – Marra Mamba Ore | O/P | | 344 | | 61.6 | | | | 50.0 | | 172 | |
| Hamersley (Australia) | | | | | | | | | | | | |
| – Brockman 2 (Brockman Ore) | O/P | | 30 | | 62.6 | | | | 100.0 | | 30 | |
| – Brockman 4 (Brockman Ore) | O/P | | 449 | | 62.2 | | | | 100.0 | | 449 | |
| – Marandoo (Marra Mamba Ore) | O/P | | 67 | | 61.6 | | | | 100.0 | | 67 | |
| – Mt Tom Price (Brockman Ore) | | | | | | | | | | | | |
| – mine | O/P | | 109 | | 64.6 | | | | 100.0 | | 109 | |
| – stockpiles (i) | S/P | | 17 | | 64.5 | | | | 100.0 | | 17 | |
| – Mt Tom Price (Marra Mamba Ore)(u) | O/P | | 35 | | 61.2 | | | | 100.0 | | 35 | |
| – Paraburdoo (Brockman Ore) | O/P | | 12 | | 63.6 | | | | 100.0 | | 12 | |
| – Paraburdoo (Marra Mamba Ore) | O/P | | 0.5 | | 63.2 | | | | 100.0 | | 0.5 | |
| – Nammuldi (Marra Mamba Ore) | O/P | | 31 | | 61.4 | | | | 100.0 | | 31 | |
| – Yandicoogina (Pisolite Ore HG) | | | | | | | | | | | | |
| – mine | O/P | | 327 | | 58.7 | | | | 100.0 | | 327 | |
| – stockpiles (i) | S/P | | 1.5 | | 58.1 | | | | 100.0 | | 1 | |
| – Yandicoogina (Process Product) | | | | | | | | | | | | |
| – mine | O/P | | 109 | | 58.4 | | | | 100.0 | | 109 | |
| Iron Ore Company of Canada | O/P | | 416 | | 65.0 | | | | 58.7 | | 244 | |
| (Canada) | | | | | | | | | | | | |
| Robe River (Australia) | | | | | | | | | | | | |
| – Pannawonica (Pisolite Ore) | | | | | | | | | | | | |
| – mine | O/P | | 327 | | 57.2 | | | | 53.0 | | 174 | |
| – stockpiles (i) | S/P | | 17 | | 56.9 | | | | 53.0 | | 9 | |
| – West Angelas (Marra Mamba Ore) | | | | | | | | | | | | |
| – mine | O/P | | 403 | | 61.9 | | | | 53.0 | | 213 | |
| – stockpiles (i) | S/P | | 6 | | 59.3 | | | | 53.0 | | 3 | |
|
|
|
|
|
|
|
|
|
|
|
| |
| Rio Tinto total | | | | | | | | | | | 2,326 | |
|
|
|
|
|
|
|
|
|
|
|
| |
| | | | | | | | | | | | | |
| | | | | | | | | | | | Recoverable | |
| | | | | | | | | | | | metal | |
| | | | millions | | | | | | | | millions | |
| LEAD | | | of tonnes | | %Pb | | | | | | of tonnes | |
| Reserves at operating mine | | | | | | | | | | | | |
| Greens Creek (US) | U/G | | 7.0 | | 3.98 | | 67 | | 70.3 | | 0.131 | |
|
|
|
|
|
|
|
|
|
|
|
| |
| | | | | | | | | | | | | |
| | | | | | | | | | | | Recoverable | |
| | | | | | | | | | | | metal | |
| | | | millions | | | | | | | | millions | |
| MOLYBDENUM | | | of tonnes | | %Mo | | | | | | of tonnes | |
| Reserves at operating mine | | | | | | | | | | | | |
| Bingham Canyon (US) | | | | | | | | | | | | |
| – mine | O/P | | 604 | | 0.047 | | 61 | | 100.0 | | 0.175 | |
| – stockpiles (i) | S/P | | 37 | | 0.032 | | 61 | | 100.0 | | 0.007 | |
|
|
|
|
|
|
|
|
|
|
|
| |
| Rio Tinto total | | | | | | | | | | | 0.183 | |
|
|
|
|
|
|
|
|
|
|
|
| |
| See notes on pages 32 to 33 | | | | | | | | | | | | |
| Rio Tinto 2006Form 20-F | 26 |
Back to Contents
ORE RESERVES (under Industry Guide 7) continued
| | | | Total ore reserves | | Average | | | | | |
| | Type of | | at end 2006 | | mill | | | | | |
| | mine | |
|
|
| | recovery | | Interest | | Rio Tinto | |
| | (b) | | Tonnage | | Grade | | % | | % | | share | |
|
|
|
|
|
|
|
|
|
|
|
| |
| | | | | | | | | | | | Recoverable | |
| | | | | | | | | | | | metal | |
| | | | millions | | grammes | | | | | | millions | |
| SILVER | | | of tonnes | | per tonne | | | | | | of ounces | |
| Reserves at operating mines | | | | | | | | | | | | |
| Bingham Canyon (US) | | | | | | | | | | | | |
| – mine | O/P | | 604 | | 2.52 | | 77 | | 100.0 | | 37.699 | |
| – stockpiles (i) | S/P | | 37 | | 1.69 | | 77 | | 100.0 | | 1.558 | |
| Grasberg (Indonesia) | O/P + U/G | | 2,813 | | 4.16 | | 64 | | (o) | | 73.722 | |
| Greens Creek (US) | U/G | | 7.0 | | 494.46 | | 72 | | 70.3 | | 56.206 | |
|
|
|
|
|
|
|
|
|
|
|
| |
| Rio Tinto total | | | | | | | | | | | 169.185 | |
|
|
|
|
|
|
|
|
|
|
|
| |
| | | | | | | | | | | | | |
| | | | | | | | | | | | Marketable | |
| | | | | | | | | | | | product | |
| | | | millions | | | | | | | | millions | |
| TALC (e) | | | of tonnes | | | | | | | | of tonnes | |
| Reserves at operating mines | | | | | | | | | | | | |
| Rio Tinto Minerals – talc (v) | | | | | | | | | | | | |
| Europe/N America/Australia) | O/P + U/G | | 28.8 | | | | | | 100.0 | | 28.8 | |
|
|
|
|
|
|
|
|
|
|
|
| |
| | | | | | | | | | | | | |
| | | | | | | | | | | | Marketable | |
| | | | | | | | | | | | product | |
| TITANIUM DIOXIDE | | | millions | | | | | | | | millions | |
| FEEDSTOCK(e) | | | of tonnes | | | | | | | | of tonnes | |
| Reserves at operating mines | | | | | | | | | | | | |
| QIT (Canada) (w) | O/P | | 52.7 | | | | | | 100.0 | | 52.7 | |
| QMM (Madagascar) | D/O | | 12.4 | | | | | | 80.0 | | 9.9 | |
| RBM (South Africa) | D/O | | 24.9 | | | | | | 50.0 | | 12.5 | |
|
|
|
|
|
|
|
|
|
|
|
| |
| Rio Tinto total | | | | | | | | | | | 75.0 | |
|
|
|
|
|
|
|
|
|
|
|
| |
| | | | | | | | | | | | | |
| | | | | | | | | | | | Recoverable | |
| | | | | | | | | | | | metal | |
| | | | millions | | | | | | | | millions | |
| URANIUM | | | of tonnes | | %U308 | | | | | | of tonnes | |
| Reserves at operating mines | | | | | | | | | | | | |
| Energy Resources of Australia | | | | | | | | | | | | |
| (Australia) | | | | | | | | | | | | |
| – Ranger #3 mine | O/P | | 9.6 | | 0.241 | | 89 | | 68.4 | | 0.0141 | |
| – Ranger #3 stockpiles (i) (x) | S/P | | 25.9 | | 0.107 | | 86 | | 68.4 | | 0.0163 | |
| Rössing (Namibia) | | | | | | | | | | | | |
| – mine | O/P | | 17.7 | | 0.038 | | 85 | | 68.6 | | 0.0039 | |
| – stockpiles (i) | S/P | | 2.3 | | 0.015 | | 85 | | 68.6 | | 0.0002 | |
|
|
|
|
|
|
|
|
|
|
|
| |
| Rio Tinto total | | | | | | | | | | | 0.0345 | |
|
|
|
|
|
|
|
|
|
|
|
| |
| | | | | | | | | | | | | |
| | | | | | | | | | | | Recoverable | |
| | | | | | | | | | | | metal | |
| | | | millions | | | | | | | | millions | |
| ZINC | | | of tonnes | | %Zn | | | | | | of tonnes | |
| Reserves at operating mine | | | | | | | | | | | | |
| Greens Creek (US) | U/G | | 7.0 | | 10.39 | | 77 | | 70.3 | | 0.390 | |
|
|
|
|
|
|
|
|
|
|
|
| |
| See notes on pages 32 to 33 | | | | | | | | | | | | |
| Rio Tinto 2006Form 20-F | 27 |
Back to Contents
ORE RESERVES (under Industry Guide 7) continued
| | | | Proven ore reserves | | Probable ore reserves | |
| | | | at end 2006 | | at end 2006 | |
| | Type of | |
|
|
|
|
|
|
|
|
|
|
| |
| | mine | | | | | | Drill hole | | | | | | Drill hole | |
| | (b) | | Tonnage | | Grade | | spacing (c) | | Tonnage | | Grade | | spacing (c) | |
|
|
|
|
|
|
|
|
|
|
|
|
|
| |
| | | | millions | | | | | | millions | | | | | |
| BAUXITE (d) | | | of tonnes | | %Al2O3 | | | | of tonnes | | %Al2O3 | | | |
| Reserves at operating mine | | | | | | | | | | | | | | |
| Weipa (Australia) | O/P | | 119 | | 53.8 | | 76m x 76m | | 1,074 | | 53.7 | | 400m x 800m | |
| | | | | | | | | | | | | | (or better) | |
|
|
|
|
|
|
|
|
|
|
|
|
|
| |
| | | | | | | | | | | | | | | |
| | | | millions | | | | | | millions | | | | | |
| BORATES (e) | | | of tonnes | | | | | | of tonnes | | | | | |
| Reserves at operating mine | | | | | | | | | | | | | | |
| Rio Tinto Minerals - Boron (US) (j) | | | | | | | | | | | | | | |
| – mine | O/P | | 14.8 | | | | 61m x 61m | | 5.0 | | | | 61m x 61m | |
| – stockpiles (i) | S/P | | 0.1 | | | | | | 2.0 | | | | | |
|
|
|
|
|
|
|
|
|
|
|
|
|
| |
| | | | | | | | | |
| | | | | | % Yield to | | Marketable Reserves | |
| | | | Recoverable | | give | |
|
|
|
|
|
|
| |
| | | | reserves | | marketable | | | | Drill hole | | | | Drill hole | |
| | | | total | | reserves | | Proven | | spacing (c) | | Probable | | spacing (c) | |
|
|
|
|
|
|
|
|
|
|
|
|
|
| |
| | | | millions | | | | millions | | | | millions | | | |
| COAL (f) | | | of tonnes | | | | of tonnes | | | | of tonnes | | | |
| Reserves at operating mines | | | | | | | | | | | | | | |
| Rio Tinto Energy America(k) | | | | | | | | | | | | | | |
| Antelope (US) | O/C | | 359 | | 100 | | 359 | | 350m | | | | | |
| Colowyo (US) (l) | O/C | | 14 | | 100 | | 14 | | 250m | | 0.1 | | 365m | |
| Cordero Rojo (US) | O/C | | 285 | | 100 | | 281 | | 250m | | 4.4 | | 375m | |
| Decker (US) | O/C | | 18 | | 100 | | 18 | | 250m | | | | | |
| Jacobs Ranch (US) | O/C | | 418 | | 100 | | 413 | | 300m | | 4.3 | | 300m | |
| Spring Creek (US) | O/C | | 199 | | 100 | | 199 | | 250m | | | | | |
| | | | | | | | | | | | | | | |
| Rio Tinto Coal Australia | | | | | | | | | | | | | | |
| Bengalla (Australia) | O/C | | 193 | | 77 | | 92 | | 350m | | 58 | | 500m | |
| Blair Athol (Australia) | O/C | | 45 | | 92 | | 42 | | 150m | | | | | |
| Hail Creek (Australia) | O/C | | 267 | | 67 | | 105 | | 300m | | 73 | | 400m | |
| Hunter Valley Operations (Australia) | O/C | | 453 | | 68 | | 245 | | 300m | | 63 | | 500m | |
| Kestrel (Australia) | U/G | | 140 | | 80 | | 49 | | 500m | | 63 | | 1,000m | |
| Mount Thorley Operations (Australia) | O/C | | 35 | | 66 | | 20 | | 125m | | 2.5 | | 500m | |
| Warkworth (Australia) | O/C | | 392 | | 64 | | 151 | | 450m | | 100 | | 1,000m | |
| | | | | | | | | | | | | | | |
| Undeveloped reserves(m) | | | | | | | | | | | | | | |
| Rio Tinto Coal Australia | | | | | | | | | | | | | | |
| Clermont (Australia) | O/C | | 197 | | 96 | | 185 | | 220m | | 4 | | 150m to 300m | |
| Mount Pleasant (Australia) | O/C | | 459 | | 76 | | | | | | 350 | | 125m to 500m | |
|
|
|
|
|
|
|
|
|
|
|
|
|
| |
| See notes on pages 32 to 33 | | | | | | | | | | | | | | |
| Rio Tinto 2006Form 20-F | 28 |
Back to Contents
ORE RESERVES (under Industry Guide 7) continued
| | | | Proven ore reserves | | Probable ore reserves | |
| | Type of | | at end 2006 | | at end 2006 | |
| | mine | |
|
|
|
|
|
|
|
|
|
|
| |
| | (b) | | Tonnage | | Grade | | Drill hole | | Tonnage | | Grade | | Drill hole | |
| | | | | | | | spacing (c) | | | | | | spacing (c) | |
|
|
|
|
|
|
|
|
|
|
|
|
|
| |
| COPPER | | | millions | | | | | | millions | | | | | |
| | | | of tonnes | | %Cu | | | | of tonnes | | %Cu | | | |
| Reserves at operating mines | | | | | | | | | | | | | | |
| Bingham Canyon (US) | | | | | | | | | | | | | | |
| – mine | O/P | | 325 | | 0.59 | | 90m | | 279 | | 0.48 | | 110m | |
| – stockpiles (i) | S/P | | 12 | | 0.35 | | | | 25 | | 0.32 | | | |
| Escondida (Chile) (n) | | | | | | | | | | | | | | |
| – sulphide mine | O/P | | 516 | | 1.17 | | 60m x 60m | | 844 | | 1.00 | | 100m x 100m | |
| – sulphide leach mine | O/P | | 421 | | 0.51 | | 60m x 60m | | 992 | | 0.51 | | 105m x 105m | |
| – oxide mine | O/P | | 6 | | 0.74 | | 45m x 45m | | 15 | | 0.74 | | 50m x 50m | |
| – sulphide stockpiles (i) | S/P | | 17 | | 1.23 | | | | | | | | | |
| – sulphide leach stockpiles (i) | S/P | | 131 | | 0.49 | | | | | | | | | |
| – oxide stockpiles (i) | S/P | | 57 | | 0.67 | | | | | | | | | |
| Escondida Norte (Chile) (n) | | | | | | | | | | | | | | |
| – sulphide mine | O/P | | 138 | | 1.53 | | 60m x 60m | | 318 | | 1.34 | | 100m x 100m | |
| – sulphide leach mine | O/P | | 57 | | 0.53 | | 60m x 60m | | 548 | | 0.61 | | 105m x 105m | |
| – oxide mine | O/P | | 2.8 | | 1.97 | | 45m x 45m | | 19 | | 1.49 | | 50m x 50m | |
| – sulphide stockpiles (i) | S/P | | 0.1 | | 4.07 | | | | | | | | | |
| – sulphide leach stockpiles (i) | S/P | | 1.5 | | 0.52 | | | | | | | | | |
| – oxide stockpiles (i) | S/P | | 3.3 | | 0.96 | | | | | | | | | |
| Grasberg (Indonesia) | O/P + U/G | | 809 | | 1.08 | | 13m to 40m | | 2,004 | | 1.02 | | 42m to 100m | |
| Northparkes (Australia) | | | | | | | | | | | | | | |
| – mine | U/G | | | | | | | | 46 | | 1.06 | | 40 x 40 x 80m | |
| – stockpiles (i) | S/P | | 3.8 | | 0.67 | | | | | | | | | |
| Palabora (South Africa) (p) | | | | | | | | | | | | | | |
| – mine | U/G | | 118 | | 0.64 | | 76m | | | | | | | |
|
|
|
|
|
|
|
|
|
|
|
|
|
| |
| | | | | | | | | | | | | | | |
| DIAMONDS (d) | | | millions | | carats | | | | millions | | carats | | | |
| | | | of tonnes | | per tonne | | | | of tonnes | | per tonne | | | |
| Reserves at operating mines | | | | | | | | | | | | | | |
| Argyle (Australia) | | | | | | | | | | | | | | |
| – AK1 pipe mine (q) | O/P + U/G | | 27 | | 1.4 | | 50m x 50m | | 75.0 | | 2.4 | | 50m x 50m | |
| – AK1 pipe stockpiles (i) | S/P | | 0.9 | | 2.8 | | | | 3.0 | | 0.8 | | | |
| Diavik (Canada) (r) | O/P + U/G | | 12 | | 3.4 | | 27m to 30m | | 13 | | 3.2 | | 30m to 34m | |
| Murowa (Zimbabwe) | O/P | | | | | | | | | | | | | |
| – mine | O/P | | | | | | | | 22 | | 0.7 | | 25m | |
| – stockpiles (i) | S/P | | | | | | | | 0.1 | | 1.2 | | | |
|
|
|
|
|
|
|
|
|
|
|
|
|
| |
| | | | | | | | | | | | | | | |
| GOLD | | | millions | | grammes | | | | millions | | grammes | | | |
| | | | of tonnes | | per tonne | | | | of tonnes | | per tonne | | | |
| Reserves at operating mines | | | | | | | | | | | | | | |
| Bingham Canyon (US) | | | | | | | | | | | | | | |
| – mine | O/P | | 325 | | 0.34 | | 90m | | 279 | | 0.28 | | 110m | |
| – stockpiles (i) | S/P | | 12 | | 0.20 | | | | 25 | | 0.20 | | | |
| Cortez/Pipeline (US) (s) | | | | | | | | | | | | | | |
| – mine | O/P | | 52 | | 2.05 | | 27m to 30m | | 73 | | 1.67 | | 48m | |
| – stockpiles (i) | S/P | | 1.1 | | 4.30 | | | | | | | | | |
| Grasberg (Indonesia) | O/P + U/G | | 809 | | 1.03 | | 13m to 40m | | 2,004 | | 0.85 | | 42m to 100m | |
| Greens Creek (US) | U/G | | | | | | | | 7.0 | | 3.86 | | 30m | |
| Northparkes (Australia) | | | | | | | | | | | | | | |
| – mine | O/P | | | | | | | | 46 | | 0.46 | | 40 x 40 x 80m | |
| – stockpiles (i) | S/P | | 3.8 | | 0.58 | | | | | | | | | |
|
|
|
|
|
|
|
|
|
|
|
|
|
| |
| See notes on pages 32 to 33 | | | | | | | | | | | | | | |
| Rio Tinto 2006 Form 20-F | 29 |
Back to Contents
ORE RESERVES (under Industry Guide 7) continued
| | | | Proven ore reserves | | Probable ore reserves | |
| | Type of | | at end 2006 | | at end 2006 | |
| | mine | |
|
|
|
|
|
|
|
|
|
|
| |
| | (b) | | Tonnage | | Grade | | Drill hole | | Tonnage | | Grade | | Drill hole | |
| | | | | | | | spacing (c) | | | | | | spacing (c) | |
|
|
|
|
|
|
|
|
|
|
|
|
|
| |
| IRON ORE (d) | | | millions | | | | | | millions | | | | | |
| | | | of tonnes | | %Fe | | | | of tonnes | | %Fe | | | |
| Reserves at operating mines | | | | | | | | | | | | | | |
| and mines under construction | | | | | | | | | | | | | | |
| Channar (Australia) | | | | | | | | | | | | | | |
| – Brockman Ore | O/P | | 87 | | 63.5 | | 60m x 60m | | 13 | | 63.6 | | max 120m | |
| Corumbá (Brazil) | | | | | | | | | | | | | | |
| – mine | O/P | | 108 | | 67.2 | | 100m x 100m | | 106 | | 67.2 | | 200m x 400m | |
| – stockpiles (i) | S/P | | 1 | | 66.7 | | | | | | | | | |
| Eastern Range (Australia) | | | | | | | | | | | | | | |
| – Brockman Ore | O/P | | 66 | | 63.0 | | 60m x 60m | | 25 | | 62.8 | | max 120m | |
| Hope Downs (Australia) (t) | | | | | | | | | | | | | | |
| – Marra Mamba Ore | O/P | | 66 | | 61.3 | | 100m x 50m | | 279 | | 61.7 | | 200m x 50m | |
| Hamersley (Australia) | | | | | | | | | | | | | | |
| – Brockman 2 (Brockman Ore) | O/P | | 19 | | 62.6 | | 50m x 50m | | 11.0 | | 62.6 | | max 100m | |
| – Brockman 4 (Brockman Ore) | O/P | | 115 | | 62.6 | | 50m x 50m | | 334 | | 62.1 | | 200m x 100m | |
| – Marandoo (Marra Mamba Ore) | O/P | | 65 | | 61.7 | | 75m x 75m | | 2.0 | | 60.7 | | max 150m | |
| – Mt Tom Price (Brockman Ore) | | | | | | | | | | | | | | |
| – mine | O/P | | 72 | | 64.4 | | 30m x 30m | | 37 | | 64.9 | | 60m x 30m | |
| – stockpiles (i) | S/P | | | | | | | | 17 | | 64.5 | | | |
| – Mt Tom Price (Marra Mamba Ore)(u) | O/P | | | | | | | | 35 | | 61.2 | | 60m x 30m | |
| – Paraburdoo (Brockman Ore) | O/P | | 8 | | 63.6 | | 30m x 30m | | 4.1 | | 63.6 | | 60m x 30m | |
| – Paraburdoo (Marra Mamba Ore) | O/P | | | | | | | | 0.5 | | 63.2 | | 60m x 60m | |
| – Nammuldi (Marra Mamba Ore) | O/P | | 3.9 | | 62.0 | | 60m x 60m | | 27 | | 61.3 | | 120m x 120m | |
| – Yandicoogina (Pisolite Ore HG) | | | | | | | | | | | | | | |
| – mine | O/P | | 327 | | 58.7 | | 50m x 50m | | | | | | | |
| – stockpiles (i) | S/P | | | | | | | | 1.5 | | 58.1 | | | |
| – Yandicoogina (Process Product) | | | | | | | | | | | | | | |
| – mine | O/P | | 109 | | 58.4 | | 50m x 50m | | | | | | | |
| Iron Ore Company of Canada | | | | | | | | | | | | | | |
| (Canada) | O/P | | 345 | | 65.0 | | 122m x 61m | | 70 | | 65.0 | | 122m x 122m | |
| Robe River (Australia) | | | | | | | | | | | | | | |
| – Pannawonica (Pisolite Ore) | | | | | | | | | | | | | | |
| – mine | O/P | | 289 | | 57.3 | | max 70m x 70m | | 38 | | 57.0 | | max 100m x 100m | |
| – stockpiles (i) | S/P | | | | | | | | 17 | | 56.9 | | | |
| – West Angelas (Marra Mamba Ore) | | | | | | | | | | | | | | |
| – mine | O/P | | 178 | | 62.2 | | 25m x 25m | | 225 | | 61.6 | | max 200m x 50m | |
| – stockpiles (i) | S/P | | 0.7 | | 59.7 | | | | 5 | | 59.3 | | | |
|
|
|
|
|
|
|
|
|
|
|
|
|
| |
| | | | | | | | | | | | | | | |
| LEAD | | | millions | | | | | | millions | | | | | |
| | | | of tonnes | | %Pb | | | | of tonnes | | %Pb | | | |
| Reserves at operating mine | | | | | | | | | | | | | | |
| Greens Creek (US) | U/G | | | | | | | | 7.0 | | 3.98 | | 30m | |
|
|
|
|
|
|
|
|
|
|
|
|
|
| |
| | | | | | | | | | | | | | | |
| MOLYBDENUM | | | millions | | | | | | millions | | | | | |
| | | | of tonnes | | %Mo | | | | of tonnes | | %Mo | | | |
| Reserves at operating mine | | | | | | | | | | | | | | |
| Bingham Canyon (US) | | | | | | | | | | | | | | |
| – mine | O/P | | 325 | | 0.047 | | 90m | | 279 | | 0.047 | | 110m | |
| – stockpiles (i) | S/P | | 12.1 | | 0.028 | | | | 25 | | 0.034 | | | |
|
|
|
|
|
|
|
|
|
|
|
|
|
| |
| See notes on pages 32 to 33 | | | | | | | | | | | | | | |
| Rio Tinto 2006 Form 20-F | 30 |
Back to Contents
ORE RESERVES (under Industry Guide 7) continued
| | | | Proven ore reserves | | Probable ore reserves | |
| | Type of | | at end 2006 | | at end 2006 | |
| | mine | |
|
|
|
|
|
|
|
|
|
|
| |
| | (b) | | Tonnage | | Grade | | Drill hole | | Tonnage | | Grade | | Drill hole | |
| | | | | | | | spacing (c) | | | | | | spacing (c) | |
|
|
|
|
|
|
|
|
|
|
|
|
|
| |
| SILVER | | | millions | | grammes | | | | millions | | grammes | | | |
| | | | of tonnes | | per tonne | | | | of tonnes | | per tonne | | | |
| Reserves at operating mines | | | | | | | | | | | | | | |
| Bingham Canyon (US) | | | | | | | | | | | | | | |
| – mine | O/P | | 325 | | 2.74 | | 90m | | 279 | | 2.25 | | 110m | |
| – stockpiles (i) | S/P | | 12.1 | | 1.75 | | | | 25 | | 1.66 | | | |
| Grasberg (Indonesia) | O/P + U/G | | 809 | | 4.23 | | 13m to 40m | | 2,004 | | 4.13 | | 42m to 100m | |
| Greens Creek (US) | U/G | | | | | | | | 7.0 | | 494.46 | | 30m | |
|
|
|
|
|
|
|
|
|
|
|
|
|
| |
| | | | | | | | | | | | | | | |
| TALC (e) | | | millions | | | | | | millions | | | | | |
| | | | of tonnes | | | | | | of tonnes | | | | | |
| Reserves at operating mines | | | | | | | | | | | | | | |
| Rio Tinto Minerals – talc (v) | | | | | | | | | | | | | | |
| (Europe/North America/Australia) | O/P + U/G | | 21.6 | | | | 10m to 60m | | 7.2 | | | | 15m to 100m | |
|
|
|
|
|
|
|
|
|
|
|
|
|
| |
| | | | | | | | | | | | | | | |
| TITANIUM DIOXIDE | | | millions | | | | | | millions | | | | | |
| FEEDSTOCK(e) | | | of tonnes | | | | | | of tonnes | | | | | |
| Reserves at operating mines | | | | | | | | | | | | | | |
| QIT (Canada) (w) | O/P | | 29.2 | | | | <60m x 60m | | 23.5 | | | | >60m x 60m | |
| QMM (Madagascar) | D/O | | 12.0 | | | | 200m x 100m | | 0.4 | | | | 400m x 200m | |
| RBM (South Africa) | D/O | | 6.3 | | | | 50m x 50m | | 18.6 | | | | 800m x 100m | |
|
|
|
|
|
|
|
|
|
|
|
|
|
| |
| | | | | | | | | | | | | | | |
| URANIUM | | | millions | | | | | | millions | | | | | |
| | | | of tonnes | | %U308 | | | | of tonnes | | %U308 | | | |
| Reserves at operating mines | | | | | | | | | | | | | | |
| Energy Resources of Australia | | | | | | | | | | | | | | |
| (Australia) | | | | | | | | | | | | | | |
| – Ranger #3 mine | O/P | | 4.9 | | 0.24 | | 25m | | 4.8 | | 0.24 | | 50m | |
| – Ranger #3 stockpiles (i) (x) | S/P | | 25.9 | | 0.11 | | | | | | | | | |
| Rössing (Namibia) | | | | | | | | | | | | | | |
| – mine | O/P | | 0.8 | | 0.036 | | 20m | | 16.9 | | 0.038 | | 60m | |
| – stockpiles (i) | S/P | | 2.3 | | 0.015 | | | | | | | | | |
|
|
|
|
|
|
|
|
|
|
|
|
|
| |
| | | | | | | | | | | | | | | |
| ZINC | | | millions | | | | | | millions | | | | | |
| | | | of tonnes | | %Zn | | | | of tonnes | | %Zn | | | |
| Reserves at operating mine | | | | | | | | | | | | | | |
| Greens Creek (US) | U/G | | | | | | | | 7.0 | | 10.39 | | 30m | |
|
|
|
|
|
|
|
|
|
|
|
|
|
| |
| See notes on pages 32 to 33 | | | | | | | | | | | | | | |
| Rio Tinto 2006 Form 20-F | 31 |
Back to Contents
ORE RESERVES (under Industry Guide 7) continued
| Notes | |
| (a) | Commodity prices (based on a three year average historical price to 30 June 2006) used to test whether the reported reserve estimates could be economically extracted, include the following benchmark prices: | |
| | |
| Ore reserves | Unit | | US$ | |
|
|
|
| |
| ALUMINIUM | | | | |
| Weipa (Australia) | pound | | 0.85 | |
| | | | | |
| COPPER | | | | |
| Bingham Canyon (US) | pound | | 1.59 | |
| Escondida (Chile)* | pound | | 1.59 | |
| Escondida Norte (Chile)* | pound | | 1.59 | |
| Grasberg (Indonesia)* | pound | | 1.59 | |
| Northparkes (Australia) | pound | | 1.59 | |
| Palabora (South Africa) | pound | | 1.59 | |
| | | | | |
| GOLD | | | | |
| Bingham Canyon (US) | ounce | | 446 | |
| Cortez / Pipeline (US)* | ounce | | 446 | |
| Grasberg (Indonesia)* | ounce | | 446 | |
| Greens Creek (US) | ounce | | 446 | |
| Northparkes (Australia) | ounce | | 446 | |
| | | | | |
| IRON ORE | | | | |
| Australian benchmark (fines) | dmtu** | | 0.46 | |
| Atlantic benchmark (fines) | dmtu** | | 0.49 | |
| | | | | |
| LEAD | | | | |
| Greens Creek (US) | pound | | 0.41 | |
| | | | | |
| MOLYBDENUM | | | | |
| Bingham Canyon (US) | pound | | 20.5 | |
| | | | | |
| SILVER | | | | |
| Bingham Canyon (US) | ounce | | 7.34 | |
| Grasberg (Indonesia)* | ounce | | 7.34 | |
| Greens Creek (US) | ounce | | 7.34 | |
| | | | | |
| ZINC | | | | |
| Greens Creek (US) | pound | | 0.64 | |
|
|
|
| |
| * = non managed operations |
| ** = dry metric tonne unit |
| | |
| | Prices for all other commodities are determined by individual contract negotiation. The reported reserves for these commodities have been tested to confirm that they could be economically extracted using a combination of existing contract prices until expiry and thereafter three year historical prices. |
| (b) | Type of mine: O/P = open pit, O/C = open cut, U/G = underground, D/O = dredging operation, S/P = stockpile. |
| (c) | Drill hole spacings are either average distances, a specified grid distance (a regular pattern of drill holes - the distance between the drill holes along the two axes of the grid will be aligned to test the size, shape and continuity of the mineral deposit; as such there may be different distances between the drill holes along the two axes of a grid) or the maximum drill hole spacing that is sufficient to determine the reserve category for a particular deposit. As the continuity of mineralisation varies from deposit to deposit, the drill hole spacing required to categorise a reserve varies between and within deposit types. |
| (d) | Reserves of iron ore, bauxite (as alumina) and diamonds are shown as recoverable reserves of saleable product after accounting for all mining and processing losses. Mill recoveries are therefore not shown. |
| (e) | Reserves of industrial minerals are expressed in terms of marketable product, i.e. after all mining and processing losses. In the case of borates, the saleable product is B2O3. |
| (f) | Coal reserves are shown as both recoverable and marketable. The yield factors shown reflect the impact of further processing, where necessary, to provide marketable coal. All reserves at operating mines are assigned, all undeveloped reserves are unassigned. By “assigned” and “unassigned,” we mean the following: assigned reserves means coal which has been committed by the coal company to operating mine shafts, mining equipment, and plant facilities, and all coal which has been leased by the company to others; unassigned reserves represent coal which has not been committed, and which would require new mineshafts, mining equipment, or plant facilities before operations could begin in the property. |
| (g) | Coal type: SC = steam/thermal coal; MC = metallurgical/coking coal. |
| (h) | Analyses of coal from the US were undertaken according to "American Standard Testing Methods" (ASTM) on an "As Received" moisture basis whereas the coals from Australia have been analysed on an "Air Dried" moisture basis according to Australian Standards (AS). MJ/kg = megajoules per kilogramme. 1 MJ/kg = 430.2 Btu/lb. |
| (i) | Stockpile components of reserves are shown for all operations. |
| (j) | Rio Tinto Minerals - Boron was previously known as Boron. |
| (k) | Rio Tinto Energy America was previously known as Kennecott Energy. |
| (l) | Rio Tinto Energy America has a partnership interest in the Colowyo mine, but, as it is responsible under a management agreement for the operation of the mine, all of Colowyo's reserves are included in Rio Tinto's share shown above. |
| Rio Tinto 2006 Form 20-F | 32 |
Back to Contents
ORE RESERVES (under Industry Guide 7) continued
| (m) | The term 'undeveloped reserves' is used here to describe material that is economically viable on the basis of technical and economic studies but for which construction and commissioning have yet to commence. |
| (n) | The increase in reserves at Escondida and Escondida Norte results from updated models following increased drilling and the application of new economic parameters, which transferred mineralised material to reserves. Oxide material has been transferred to sulphide leach following the start up of new processing facilities. |
| (o) | Under the terms of a joint venture agreement between Rio Tinto and Freeport-McMoRan Copper & Gold (FCX), Rio Tinto is entitled to a direct 40 per cent share in reserves discovered at Grasberg after 31 December 1994 and it is this entitlement that is shown. |
| (p) | Reserves at Palabora have decreased following detailed remodelling of both grade and block cave models, and the effect of diluting material from the open pit. The conversion of debentures into ordinary shares continued during 2006 with Rio Tinto participating, ending the year with a 57.7 per cent interest. |
| (q) | The successful completion of feasibility studies and change in economic parameters has increased reserves at Argyle. |
| (r) | Production depletion and refinement of mine design at Diavik, that reduced dilution, results in the reduced reserve. |
| (s) | Portions of the Pipeline and Crossroads extension reserves were reclassified as mineralised material following technical and economic review. |
| (t) | Following the acquisition of a 50 per cent interest in the Hope Downs iron ore project, reserves are presented here for the first time. |
| (u) | Mt Tom Price reserves have increased following the upgrading of mineralised material and approved mine design extensions into a new area. |
| (v) | Following a reassessment of economic and design criteria a proportion of reserves were reclassified as mineralised material at several of the talc operations. Rio Tinto Minerals - talc was formerly known as the Luzenac Group. |
| (w) | The reserve model was updated on receipt of new data, which including depletion, resulted in a reduction of reserves at QIT. |
| (x) | Improvements in processing and economic parameters enabled lower grade stockpile material to be added to the reserves at Ranger #3. |
| Rio Tinto 2006 Form 20-F | 33 |
Back to Contents
| LOCATION OF GROUP OPERATIONS as at June 2007 (wholly owned unless stated otherwise) |
 |
| |
| |
| |
| | | ALUMINIUM |
| | | Operating sites |
| 1 | | Anglesey Aluminium (51%) |
| 2 | | Bell Bay |
| 3 | | Boyne Island (59%) |
| 3 | | Gladstone Power Station (42%) |
| 3 | | Queensland Alumina (39%) |
| 4 | | Tiwai Point (79%) |
| 5 | | Weipa |
| 3 | | Yarwun (formerly Comalco |
| | | Alumina Refinery) |
| | | BORATES |
| | | Operating sites |
| 6 | | Boron |
| 7 | | Coudekerque Plant |
| 8 | | Tincalayu |
| 9 | | Wilmington Plant |
| | | COAL |
| | | Operating sites |
| 10 | | Antelope |
| 11 | | Bengalla (30%) |
| 12 | | Blair Athol (71%) |
| 13 | | Colowyo (20%) |
| 10 | | Cordero Rojo |
| 14 | | Decker (50%) |
| 12 | | Hail Creek (82%) |
| 15 | | Hunter Valley Operations (76%) |
| 10 | | Jacobs Ranch |
| 16 | | Kestrel (80%) |
| 15 | | Mt Thorley Operations (61%) |
| 14 | | Spring Creek |
| 17 | | Tarong |
| 15 | | Warkworth (42%) |
| | | |
| | | Projects |
| 12 | | Clermont (50%) |
| 11 | | Mt Pleasant (76%) |
| | | COPPER AND GOLD |
| | | Operating sites |
| 18 | | Bougainville (not operating) (54%) |
| 19 | | Cortez/Pipeline (40%) |
| 20 | | Escondida (30%) |
| 21 | | Grasberg joint venture (40%) |
| 22 | | Kennecott Utah Copper |
| 23 | | Northparkes (80%) |
| 24 | | Palabora (58%) |
| 25 | | Rawhide (51%) |
| | | |
| | | Projects |
| 26 | | La Granja |
| 27 | | Oyu Tolgoi (10%) |
| 28 | | Pebble (20%) |
| 29 | | Resolution (55%) |
| | | |
| | | DIAMONDS |
| | | Operating sites |
| 30 | | Argyle |
| 31 | | Diavik (60%) |
| 32 | | Murowa (78%) |
| | | IRON ORE |
| | | Operating sites |
| 33 | | Corumbá |
| 34 | | Hamersley Iron mines: |
| | | Brockman |
| | | Marandoo |
| | | Mt Tom Price |
| | | Nammuldi |
| | | Paraburdoo |
| | | Yandicoogina |
| | | Channar (60%) |
| | | Eastern Range (54%) |
| 35 | | HIsmelt®(60%) |
| 34 | | Robe River mines: (53%) |
| | | West Angelas |
| | | Pannawonica |
| 35 | | Iron Ore Company of |
| | | Canada (59%) |
| | | |
| | | Projects |
| 34 | | Hope Downs (50%) |
| 37 | | IOC Pellet Plant (59%) |
| 38 | | Orissa (51%) |
| 39 | | Simandou (95%) |
| | | |
| | | NICKEL |
| | | Projects |
| 40 | | Eagle |
| | | |
| | | POTASH |
| | | Projects |
| 41 | | Rio Colorado Potash |
| | | |
| | | SALT |
| | | Operating sites |
| 42 | | Dampier (65%) |
| 43 | | Lake MacLeod (65%) |
| 42 | | Port Hedland (65%) |
| | | TALC |
| | | Operating sites |
| | | (only major sites are shown) |
| | | |
| 44 | | Ludlow |
| 45 | | Talc de Luzenac |
| 46 | | Yellowstone |
| 47 | | Three Springs |
| | | |
| | | TITANIUM DIOXIDE |
| | | FEEDSTOCK |
| | | Operating sites |
| 48 | | QIT-Fer et Titane Lac Allard |
| 49 | | QIT-Fer et Titane Sorel |
| | | Plant |
| 50 | | Richards Bay Minerals (50%) |
| | | |
| | | Projects |
| 51 | | QIT Madagascar Minerals (80%) |
| | | |
| | | URANIUM |
| | | Operating sites |
| 52 | | ERA (68%) |
| 53 | | Rössing (69%) |
| | | |
| | | Projects |
| 54 | | Kintyre |
| 55 | | Sweetwater |
| | | |
| | | ZINC, LEAD, SILVER |
| | | Operating sites |
| 56 | | Greens Creek (70%) |
| | • | Mines and mining projects |
| | | |
| | • | Smelters, refineries and processing plants remote from mine |
| Rio Tinto 2006Form 20-F | 34 |
Back to Contents
| Item 4A. | Unresolved Staff Comments |
As far as Rio Tinto is aware there are no unresolved written comments from the SEC staff regarding its periodic reportsunder the Exchange Act received more than 180 days before 31 December 2006.
| Item 5. | Operating and Financial Review and Prospects |
| | |
This Item contains forward looking statements and attention is drawn to the Cautionary statement on page 6.
This Item includes a discussion of the main factors affecting the Group’s “Profit for the year”, as measured in accordance with International Financial Reporting Standards as adopted by the European Union (‘EU IFRS’). In monitoring its financial performance, the Group also focuses on that part of the Profit for the year attributable to equity shareholders of Rio Tinto, which is referred to as “Net earnings”, and on an additional measure called “Underlying earnings”. The latter measure, which is also based on the amounts attributable to Rio Tinto shareholders, is reported to provide greater understanding of the underlying business performance of Rio Tinto operations. This measure is used by management to track the performance of the Group on a monthly basis. The earnings of the Group’s product groups as reviewed by management exclude amounts that are outside the scope of underlying earnings. Underlying earnings is defined and reconciled with Net earnings in note 2 to the 2006 financial statements.
Significant movements in the items excluded from Underlying earnings are discussed on pages 40 to 41.
In this report, the sales revenue of the parent companies and their subsidiaries is referred to as ‘Consolidated sales revenue’. Rio Tinto also reports a sales revenue measure that includes its share of jointly controlled entities and associates, which is referred to as ‘Gross sales revenue’. This latter measure is considered informative because a significant part of the Group's business is conducted through operations that are subject to equity accounting. |
| | This Item is comprised of the following: |
| • | Chairman’s message providing a high level review of the Group |
| • | Interview with the chief executive providing a high level review of the Group’s operations |
| • | Group financial performance |
| • | Operating reviews for each of the principal product groups and global support groups |
| • | Financial review of the Group |
| As a result of adopting IAS 32, IAS 39 and IFRS 5 on 1 January 2005, the Group changed its method of accounting forfinancial instruments and non-current assets held for sale. In line with the relevant transitional provisions, the priorperiod comparatives have not been re-stated. See Note 1 to the 2006 financial statements for further discussion. |
CHAIRMAN’S MESSAGE
We continued to experience strong global demand and high prices across our product groups in 2006 and are pleased to report a third successive year of record earnings. This performance reflects the underlying quality of the Rio Tintoportfolio, which has proved robust across the economic cycle.
I have warned in previous messages about the risk of complacency that can flow from a period of strong markets and sustained success. We remain alert to this and recognize the long term cyclical nature of our industry. In responsewe continue to focus on rigorous investment discipline, operational excellence and pursuing all opportunities to enhancethe underlying performance of our business.
Results and dividends
The Group’s underlying earnings in 2006 were US$7,338 million, US$2,383 million or 48 per cent above 2005. Netearnings were US$7,438 million, compared with US$5,215 million in 2005. Cash flow from operations increased 36 percent to [US$10,923]* million.
The final dividend declared for 2006 of 64 US cents per share brings the total for 2006 to 104 US cents, anincrease of 30 per cent. We have a long standing policy of progressive dividend delivery and maintaining it remains apriority. In addition, our strong operational cash flows have enabled us to return US$2.4 billion to shareholders through the buyback of shares and the payment of US$1.5 billion special dividend. We have recently announced, subject tomarket conditions, our intention to return a further US$3 billion to be completed by the end of 2007, while still retaining the financial flexibility to take up growth opportunities as they arise.
Our main priority for the use of cash generated continues to be profitable investment in the growth of thebusiness with particular emphasis on our portfolio of economically robust projects. Our capital investment grew from US$2.5 billion in 2005 to US$3.9 billion in 2006. Our pipeline of project opportunities will see this grow to aroundUS$5 billion in 2007.
| Rio Tinto 2006Form 20-F | 35 |
Back to Contents
Strategy
Our strategy remains to focus on large, long life, low cost ore bodies capable of delivering superior returns across theeconomic cycle. Creating value for shareholders is our primary objective and will remain so. We are fortunate to have a geographical portfolio weighted towards large, mature and growing economies. However, we recognise that pursuit offuture value growth will see us operating in a wider range of countries than in the past. Recent projects and investmentsin Russia, Madagascar, Peru and Mongolia are evidence of this.
We are also focused on driving productivity and performance improvements across all our primary businessprocesses, thereby adding to the resilience of our portfolios in more challenging markets. We made significant progresstowards that objective in 2006.
Sustainable development
Rio Tinto is in a long term, capital intensive business and our investments typically have life spans of 30 years or more and are often in remote locations. Without economic and social stability we cannot deliver economic returns to our host governments, local communities and our shareholders. We therefore remain committed to the principles of sustainable development, which is fully reflected in all aspects of our business. It facilitates access to new opportunities, improves business performance and inspires our own people, who fully share this commitment.
As we move into new geographical areas, meeting economic, social and environmental challenges simultaneously will be an increasingly critical feature of our business. I am pleased that our way of doing business has received positive recognition and support from our various stakeholders in these environments.
New chief executive
We have announced that Tom Albanese will succeed Leigh Clifford as chief executive on 1 May 2007. Leigh has made an outstanding contribution to Rio Tinto for almost 37 years. His seven years as chief executive have seen significantgrowth in the profitability and value of the business and major enhancements in our operational performance. We thankhim for all he has done for Rio Tinto and wish him well for the future.
Tom brings a broad based experience of the mining industry developed in a sequence of challenging roles in Rio Tinto. He has been a key player in a number of important initiatives over recent years and in shaping our strategicdirection. We have plans in place for a smooth handover from Leigh to Tom and the board is confident that, under hisleadership, Rio Tinto will continue to deliver profitable growth and increased value for shareholders.
Board developments
Michael Fitzpatrick joined the board in June 2006 after a successful period in investment fund management. He brings along experience of entrepreneurial activity to the board and is a valuable addition to our Australian representation. Weare fortunate to have an experienced and diverse board which provides strong support and constructive challenge to ourexecutive team.
Forward outlook
The global economy remains resilient in the face of a range of political and economic risks. We expect a continuation of positive economic growth in 2007 in most of the major economies. China’s strong, growing demand for metals and minerals, which has been a key driver of market strength, seems set to continue.
On the supply side, a number of constraints, ranging from shortages of key consumables, like truck tyres andexplosives, to the tight supply of skilled technical managers and tradesmen, have limited the growth of new productioncapacity. Stocks of most products have remained low, resulting in tight markets. This has reinforced the strength of the current cycle and we expect prices in 2007 to continue at levels significantly above the long term trend.
Our people
Despite the benefit of strong markets, 2006 was very challenging in operational terms. We have faced daily pressures inmeeting the requirements of our customers and developing new projects within tight timetables and budgets. Our recordresults would not have been possible without the commitment, dedication and hard work of our global workforce. Once again, on behalf of the board and you, our shareholders, I thank them for all they have achieved in an excellent year forRio Tinto.
Paul Skinner Chairman
23 February 2007
| * | Adjusted following a reclassification post publication in the 2006 Annual report and financial statements. |
| Rio Tinto 2006Form 20-F | 36 |
Back to Contents
INTERVIEW WITH THE CHIEF EXECUTIVE
How would you describe the past year?
Underlying earnings in 2006 were a record US$7.3 billion. Not only were prices for metals and minerals higher, but wewere able to make the most of the situation with increased production at many of our operations – maximising deliveryinto strong markets. With our strong balance sheet we are in a position to invest heavily in growth and to return capital to shareholders. Through our business improvement programme,Improving performance together(IPT), we are seeinga significant change in the way business units cooperate and share best practice. IPT resulted in substantial additionalcash flow in 2006 and should deliver very large value enhancements in the future. Health, safety and environment indicators generally showed steady improvement, but unfortunately the year was marred by three fatalities at Rio Tintomanaged operations.
Why are markets this good?
Economic growth and development around the world, particularly in China and India, mean an increased need for minerals. The mining industry is struggling to keep pace with demand. There is normally a quicker supply response when demand rises. However, because of previous under investment in exploration, the next generation of large world class deposits is only now being identified and evaluated. These deposits are often in remote locations, present new technical challenges and will take some years to come into production. The delivery times for major items of equipment have also significantly increased. While we believe a new higher base level of prices has developed for most commodities, this is mirrored by higher operating and development costs.
Rio Tinto’s volume growth has typically been six to seven per cent a year – where to now?
We concentrate on what we do best, which is mining – the first stage of the supply chain. Rio Tinto operates or shares in some of the largest deposits in the world. That is partly why we are enjoying financial success at a time of strongprices, although all our product groups generate strong cash flow at all points of the cycle. Large long life deposits alsogive us the opportunity to increase production in line with demand, a great advantage in the current environment. Ours is a simple strategy and it works. While most of our existing assets are in OECD countries, we are responding to new opportunities in the developing world – Peru, Guinea and Indonesia to name a few – and in countries that are only now opening up to mining investment, like Madagascar, Russia and Mongolia.
We are always alert to merger and acquisition opportunities, but growth is often ab out choosing between buyingand building. When you build a new project you should know what you’re getting if you execute the project well, butwhen you buy you may find not all the assets are jewels. The key is to make value creating decisions – not just increase volume. We are willing to make the big bets, as we have in iron ore and copper, but the key factor in the execution ofour strategy is discipline: discipline in analysis and discipline in execution.
How are you responding to cost pressures?
We work very hard to manage costs related to operational inputs, supplies, wages, energy and higher material coststhrough the excellent work of our global procurement team and our strong supplier relationships. However, the prices of many key inputs, including labour, have risen sharply in recent times. Of course our exploration and project evaluationcosts feeding our development pipeline are in the nature of investments in the future.
Can you say a little more on theImproving performance togetherinitiative?
We need to permanently change the way we run our individual operations, replicating best performance across everything we do –project analysis, project development, mine planning, mining, processing and marketing. We are aglobal Group and we need to work across functions and international borders to solve problems together instead ofbusinesses going it alone. By creating a standard operating model with common systems, standards and metrics we will ensure that we capture the best ways of operating and reproducing these across the Group. The substantial additionalcash flow we achieved in 2006 is the start to adding considerable value to the Group over time.
You spent about US$4 billion in new capital in 2006. How are the major projects going?
Overall, our new projects are coming along well. Our iron ore expansion projects in Western Australia remain ourbiggest current capital investment. The challenge of operating and expanding ten mines, three ports and more than 1,600km of rail line in the Pilbara at a time of buoyant market conditions should not be underestimated. With totalexpenditure of US$3 billion, by the end of 2007 our port and rail infrastructure will be capable of handling up to 195 million tonnes of iron ore annually. The recently announced expansion of Cape Lambert port, at a cost of US$860 million, will further expand capacity to 220 million tonnes. The Yandicoogina mine will expand to 52 million tonnes a year in the same period and the Hope Downs project will start production in 2008 with output of 22 million tonnes, rising to 30 million tonnes in stage two. From negotiation of the agreement on Hope Downs to first deliveries will be only three years.
Our ilmenite project in Madagascar is on schedule, and construction of basic infrastructure by local contractors is under way. The port contract has been awarded, enabling us to finalise a definitive cost estimate of US$850 million for the total project including the building of additional processing capacity in Canada. First production is scheduled for2008, when we believe there will be growing demand for the high quality ilmenite that Madagascar will produce for 40 years.
| Rio Tinto 2006Form 20-F | 37 |
Back to Contents
Development continues at the Argyle Diamond mine in Western Australia, Diavik in Canada and Cortez in Nevada, as does the extension of the life of the Rössing Uranium mine in Namibia. Earlier this year we announced thedevelopment of the Clermont thermal coal mine in Queensland, and we completed significant investment to expandcapacity at the Weipa bauxite mine in Queensland.
What about new opportunities?
We have acquired interests in three promising copper projects: La Granja in Peru, the Pebble project in Alaska and OyuTolgoi (Turquoise Hill) in Mongolia which, together with Resolution Copper in the US, give us an interest in four world class undeveloped copper mineral deposits. The investment in Mongolia represents a phased, risk managed entry into apotentially outstanding resource. La Granja has been given the go ahead for a US$95 million pre-feasibility study.
We are encouraged by the exploration potential on ERA leases in Australia and the expansion possibilities at Rössing Uranium in Namibia. These, together with the potential of Kintyre in Western Australia and Sweetwater in Wyoming, US, mean we are well placed to extend uranium reserves in the near future.
In addition we have an extensive global exploration programme, spending a total of US$345 million in 2006, and we continue to evaluate numerous development opportunities, often with others.
Much is being made of a skills shortage. What is your view?
Technical skills in mining, metallurgy and geological sciences are in short supply and there is strong competition for recent graduates, experienced engineers and artisans as well as supervisors. However, I believe we are better placedthan most. Global graduate recruitment is a high priority and we are doing well in attracting good quality people. Weare seen as an organisation that can provide exciting international experience, good training and lots of opportunity. We are also being more creative in retaining the skills and experience of staff in the later stages of their career. All that said ,I think the mining industry as a whole needs to sell itself as an attractive employer more effectively. We need toconsider changes to career structures to retain staff by offering greater flexibility and to identify “adventurous” people at the recruitment stage.
Any reflections on your handover to Tom Albanese?
I am fortunate to have worked for Rio Tinto for almost 37 years. It has given me a diverse and interesting career duringwhich I have met and worked with many different people who form this great team that is Rio Tinto. In Tom Albanese we have a very able, experienced and committed individual to continue Rio Tinto’s success. I would like to take this opportunity of wishing him well, and to thank all my colleagues around the world for the strong support they have given me in the many roles over my career.
Leigh Clifford Chief executive
23 February 2007
| Rio Tinto 2006 Form 20-F | 38 |
Back to Contents
GROUP FINANCIAL PERFORMANCE
Underlying earnings is the key financial performance indicator which management use internally to assess performance. It is presented here as an additional measure of earnings to provide greater understanding of the underlying businessperformance of the Group’s operations. The categories of items excluded from net earnings to arrive at underlyingearnings are explained in note 2 to the 2006 financial statementstogether with information on a minor change in the definition of underlying earnings.
Both net earnings and underlying earnings deal with amounts attributable to equity shareholders of Rio Tinto.However, EU IFRS requires that the profit for the period reported in the income statement should also include earnings attributable to outside shareholders in subsidiaries. The profit for the period is reconciled to net earnings and tounderlying earnings as follows:
| | 2006 | | 2005 | | 2004 | |
| | US$m | | US$m | | US$m | |
|
|
|
|
|
| |
| Profit for the year | 7,867 | | 5,498 | | 3,244 | |
| Less: attributable to outside equity shareholders | (429 | ) | (283 | ) | 53 | |
|
|
|
|
|
| |
| Attributable to equity shareholders of Rio Tinto (net earnings) | 7,438 | | 5,215 | | 3,297 | |
| Less: exclusions from underlying earnings | (100 | ) | (260 | ) | (1,025 | ) |
|
|
|
|
|
| |
| Underlying earnings attributable to shareholders of Rio Tinto | 7,338 | | 4,955 | | 2,272 | |
|
|
|
|
|
| |
Amounts attributable to outside equity shareholders increased in 2006 largely because of improved results at Palaboraand the reversal of impairment at IOC. Amounts attributable to outside equity shareholders increased in 2005 because of improved results at Robe River, IOC, Coal & Allied, Rio Tinto Iron & Titanium and Palabora. In addition, in 2004outside equity shareholders’ interests included a US$129 million charge for impairments.
Earnings contributions from Group businesses and business segments are based on underlying earnings. Amounts excluded from net earnings in arriving at underlying earnings are summarised in the following table and discussed further below.
| | 2006 | | 2005 | | 2004 | |
| | US$m | | US$m | | US$m | |
|
|
|
|
|
| |
| Profit less losses on disposal of interests in businesses | 3 | | 311 | | 1,175 | |
| Impairment reversals less charges | 44 | | 4 | | (321 | ) |
| Adjustment to environmental remediation provision | 37 | | 84 | | — | |
| Exchange gains/(losses) on external net debt and intragroup balances (including those relating to equity accounted units) | (14 | ) | (99 | ) | 159 | |
| Gains/(losses) on currency and interest rate derivatives not qualifying for hedge | | | | | | |
| accounting (including those relating to equity accounted units) | 30 | | (40 | ) | 12 | |
|
|
|
|
|
| |
| Total excluded in arriving at underlying earnings | 100 | | 260 | | 1,025 | |
|
|
|
|
|
| |
| Changes in underlying earnings 2004 - 2006 | US$m | |
|
| |
| 2004 Underlying earnings | 2,272 | |
| Effect of changes in: | | |
| Prices | 2,374 | |
| Exchange rates | (123 | ) |
| General inflation | (141 | ) |
| Volumes | 1,140 | |
| Costs | (598 | ) |
| Tax and other | 31 | |
|
| |
| 2005 Underlying earnings | 4,955 | |
| Effect of changes in: | | |
| Prices | 3,068 | |
| Exchange rates | (35 | ) |
| General inflation | (174 | ) |
| Volumes | (135 | ) |
| Costs | (741 | ) |
| Tax and other | 400 | |
|
| |
| 2006 Underlying earnings | 7,338 | |
|
| |
2006 compared with 2005
Net earnings of US$7,438 million in 2006 were US$2,223 million above 2005, an increase of 43 per cent. Underlyingearnings of US$7,338 million were US$2,383 million above 2005, an increase of 48 per cent. Underlying earnings pershare, which increased by 52 per cent, also reflected the lower number of shares resulting from the share buyback programme. The principal factors explaining the changes in underlying earnings are shown in the table above.
| Rio Tinto 2006 Form 20-F | 39 |
Back to Contents
Changes in underlying earnings
The effect of price movements on all major commodities was to increase underlying earnings by US$3,068 million.Prices for the major products remained strong throughout the year and were considerably higher than those experiencedin 2005: average copper prices were 84 per cent higher whilst average aluminium prices were 35 per cent higher. The strength of the global iron ore market was reflected in the 19 per cent increase in the benchmark price, mainly effectivefrom 1 April 2006. The seaborne thermal coal market was also strong, although it weakened in the second half.
Molybdenum prices averaged US$25/lb throughout 2006, a decline of 20 per cent compared with the prior year.
The net effect of changes in average levels of exchange rates against the US dollar for those currencies influencing the Group’s costs was to reduce underlying earnings relative to 2005 by US$35 million.
Lower sales volumes decreased underlying earnings by US$135 million compared with 2005. As anticipated, significantly reduced volumes from lower grades at Grasberg impacted earnings by US$355 million year on year. Thismore than offset higher volumes at other operations. The ramp up of new projects in iron ore (including the Yandicoogina and brownfields expansions), higher copper in concentrate volumes from improved grades andthroughput at Northparkes, higher ore grades and the commencement of sulphide leach production at Escondida, alongwith higher molybdenum and gold production at Kennecott Utah Copper (KUC), were the main contributors. Record volumes of thermal coal sales at Rio Tinto Energy America and alumina at Yarwun (formerly Comalco AluminaRefinery), also contributed to higher volumes. Lower sales volumes were recorded at Argyle with a build up ofdiamond inventories due to softer market conditions, at Kennecott Minerals from lower grades at Cortez, and at Hail Creek from lower coking coal volumes in response to lower customer demand.
Excluding the effects of general inflation, higher costs reduced underlying earnings by US$741 million, of whichUS$77 million was the result of higher energy costs. Ongoing acute shortages in the mining industry, in particular in the Pilbara, have continued to put pressure on costs. Costs at KUC were affected by an extended, scheduled smeltermaintenance shutdown whilst Escondida experienced higher wages, following the strike in August. Significant shippingcongestion at the port of Newcastle affected coal sales in the second half of the year with a resulting impact on costs at Rio Tinto Coal Australia, through higher demurrage and a higher unit cost of sale.
The effective tax rate on underlying earnings, excluding equity accounted units, was 24.2 per cent compared with 29.2 per cent in 2005, following the recognition of US$335 million of US Alternative Minimum Tax (AMT) credits now expected to be utilised in future years. This reflected improved projections of long term taxable earnings from our US operations. Additionally, the high levels of profit generated by the Group’s US operations in 2006 resulted in the realisation of US$140 million of previously unrecognised deferred tax assets in the year. Deferred tax provisions decreased by US$46 million as a result of a reduction in Canadian tax rates. These favourable tax variances are includedwithin the favourable variance of US$400 million for ‘Tax and other items’.
Exclusions in arriving at underlying earnings
In 2006 a US$3 million gain was realised from disposals of interests in non core businesses, compared with gains from disposals of US$311 million in 2005. In 2005, the gains related mainly to the sale of Rio Tinto’s interests in the Labrador Iron Ore Royalty Income Fund and in Lihir Gold.
Net earnings in 2006 included net impairment reversals totalling US$44 million. Impairments were reversed atKUC and IOC which more than offset impairment charges at Argyle and Tarong Coal. The valuation of the Argyleunderground project is being kept under review, given the continuing pressure on mine development costs resultingfrom acute shortages in the mining industry and more challenging mining conditions than expected. In addition, net earnings in 2006 include a reduction of US$37 million (2005: US$84 million) in an environmental remediationprovision at KUC, reversing an exceptional charge taken up in 2002 (which was excluded from adjusted earnings in thatyear).
Exchange gains and losses on external net debt and intragroup balances that are recorded in the US dollar incomestatement, together with gains and losses on currency and interest rate derivative contracts that do not qualify as hedges under EU IFRS, are excluded from underlying earnings. In 2006, these items represented a gain of US$16 million (2005: a loss of US$139 million).
The effective tax rate on net earnings, excluding equity accounted units was 26.8 per cent compared with 27.8 per cent in 2005. There were significant untaxed gains in 2005 which lowered the effective tax rate and the tax benefits referred to above reduced the tax rate for 2006.
2005 financial results compared with 2004
Net earnings of US$5,215 million in 2005 were US$1,918 million above 2004, an increase of 58 per cent. Underlyingearnings of US$4,955 million were US$2,683 million above 2004, an increase of 118 per cent. The increase of 120 per cent in underlying earnings per share also reflected the lower number of shares resulting from the share buybackprogramme. The principal factors explaining the changes in underlying earnings are shown in the table above.
Changes in underlying earnings
The effect of price movements on all major commodities was to increase earnings by US$2,374 million. Prices for the major products remained strong throughout the year and were appreciably higher than those experienced in 2004: average copper prices were 28 per cent higher whilst average aluminium prices were ten per cent higher. The strength of the global iron ore market was reflected in the 71.5 per cent increase in the benchmark price, mainly effective from 1 April 2005. The seaborne thermal and coking coal markets were also strong.
| Rio Tinto 2006 Form 20-F | 40 |
Back to Contents
Molybdenum prices, which had generally been below US$5 per pound over the previous ten years, averaged over US$30 per pound during 2005, although they did soften towards the end of that year.
The US dollar was generally weaker than in 2004 relative to the currencies in which the Group incurs themajority of its costs. The average levels of the Australian and Canadian dollars strengthened against the US dollar by four per cent and eight per cent, respectively. The effect of this, together with other currency movements, was to reduceunderlying earnings relative to 2004 by US$123 million.
Over 40 per cent of the underlying earnings increase year on year came from higher sales volumes, resulting in a favourable variance of US$1,140 million compared with 2004. The West Angelas and Yandicoogina mine expansions(to 36 million tonnes per annum) were completed in 2005 whilst strong operational performance led to majorproduction gains at many operations including IOC and Argyle. The improvement over 2004 also reflected the following adverse influences on that earlier year: the Grasberg slippage, the ten week strike at IOC and the effects ofCyclone Monty at Hamersley Iron and Robe River. To take advantage of the strong market for molybdenum, the mine sequencing at KUC was optimised to maximise molybdenum production. This, together with modifications to themolybdenum circuit at the concentrator, boosted production volumes by 130 per cent.
Excluding the effects of inflation, higher costs reduced earnings by US$598 million. Of this, US$130 million was due to higher energy costs and US$46 million was attributable to increased exploration expenditure from brownfieldexploration and further evaluation work. More generally, costs were influenced by the strong price environment beingenjoyed by the mining industry. This led to rising mining input costs caused by supply constraints for skilled labour, steel, tyres, explosives, freight and other mining related goods and services. Costs at KUC were affected by a scheduled17 day smelter maintenance shutdown in the first half of 2005 whilst continued port congestion at Dalrymple Bay,Queensland, fed through to higher demurrage charges.
Higher non cash costs reflected increased depreciation at KUC following the changes in the mine plan at the endof 2004. Increases in closure cost provisions resulted in higher depreciation charges on the amounts capitalised. One-offcosts included restructuring costs of US$30 million relating to the formation of the Rio Tinto Minerals organisation.
The effective tax rate on underlying earnings, excluding equity accounted units, was 29.2 per cent compared with27.1 per cent in 2004 because of higher rates on increased profits in Canada and Indonesia and higher withholdingtaxes.
In total “Tax and other items” improved by US$31 million. Within that total, the net after tax interest expense ofUS$44 million was US$25 million lower than in 2004 due to lower levels of net debt. Also within “Tax and other items”, 2004 underlying earnings included contributions totalling US$88 million from the operations of businesses that were sold during that year. Earnings in 2005 benefited from an improvement in the net impact of insurance items,including lower claims on the captive insurers due to the absence of cyclone related damages experienced in 2004.
Exclusions in arriving at underlying earnings
In 2005 the net profit on the disposal of interests in businesses was US$311 million relating mainly to the sale of Rio Tinto’s interests in the Labrador Iron Ore Royalty Income Fund and in Lihir Gold. Disposals in 2004, principally the holding in Freeport-McMoRan Copper & Gold, resulted in gains of US$1,175 million.
Net earnings in 2005 include a reduction of US$84 million in an environmental remediation provision atKennecott Utah Copper, reversing part of an exceptional charge taken up in 2002 (which was excluded from adjustedearnings in that year). Net earnings in 2004 included an impairment charge of US$160 million relating to the Colowyocoal operation and of US$161 million for the write down of Palabora’s copper assets.
Exchange gains and losses on external net debt and intragroup balances that are recorded in the US dollar incomestatement, together with gains and losses on currency and interest rate derivative contracts that do not qualify as hedgesunder EU IFRS, are excluded from underlying earnings. In 2005, these items represented a loss of US$139 million (2004: a gain of US$171 million).
The effective tax rate on net earnings, excluding equity accounted units was 27.8 per cent compared with 18.5per cent in 2004. There were very significant untaxed gains in 2004 which lowered the effective tax rate. There was a smaller amount of untaxed gains in 2005 which, together with the adverse 2005 tax effects referred to above, resultedin a higher effective tax rate.
| Rio Tinto 2006 Form 20-F | 41 |
Back to Contents
Group financial results by product group
The table below summarises the Group’s underlying earnings by product group for each of the three years to 2006.
| | 2006 | | 2005 | | 2004 | |
| | US$m | | US$m | | US$m | |
|
|
|
|
|
| |
| Iron Ore | 2,279 | | 1,722 | | 565 | |
| Energy | 711 | | 733 | | 431 | |
| Industrial Minerals | 243 | | 187 | | 243 | |
| Aluminium | 746 | | 392 | | 331 | |
| Copper | 3,562 | | 2,020 | | 860 | |
| Diamonds | 205 | | 281 | | 188 | |
| Other operations | 33 | | 40 | | 25 | |
| Exploration and evaluation | (163 | ) | (174 | ) | (128 | ) |
| Other items | (261 | ) | (202 | ) | (174 | ) |
| Net interest | (17 | ) | (44 | ) | (69 | ) |
|
|
|
|
|
| |
| Group underlying earnings | 7,338 | | 4,955 | | 2,272 | |
| Exclusions from underlying earnings | 100 | | 260 | | 1,025 | |
|
|
|
|
|
| |
| Net earnings | 7,438 | | 5,215 | | 3,297 | |
|
|
|
|
|
| |
Trend information
The demand for the Group’s products is closely aligned with changes in global GDP. Changes in the GDP of developing countries are expected to have greater impact on materials such as iron ore and coal that can be used toimprove infrastructure whereas changes in the GDP of developed countries are expected to have greater impact onindustrial minerals that have many applications in consumer products. Copper is used in a wide range of applications from infrastructure to consumer electronics and demand for it has tended to grow in line with or slightly faster than global GDP. Trends in production of the Group’s minerals and metals, gross sales revenue and underlying earnings are set out in thisOperating and financial review.
| Rio Tinto 2006 Form 20-F | 42 |
Back to Contents
IRON ORE GROUP
| Production | Rio Tinto share | |
| | million tonnes | |
|
| |
| 2002 | 91.0 | |
| 2003 | 102.6 | |
| 2004 | 107.8 | |
| 2005 | 124.5 | |
| 2006 | 132.8 | |
|
| |
| | | |
| Underlying earnings contribution* | US$m | |
|
| |
| 2004 | 565 | |
| 2005 | 1,722 | |
| 2006 | 2,279 | |
|
| |
| | | |
| Changes in underlying earnings 2004 - 2006 | US$m | |
|
| |
| 2004 Underlying earnings | 565 | |
| Effect of changes in: | | |
| Prices and exchange rates | 968 | |
| General inflation | (18 | ) |
| Volumes | 270 | |
| Costs | (51 | ) |
| Tax and other | (12 | ) |
|
| |
| 2005 Underlying earnings | 1,722 | |
| Effect of changes in: | | |
| Prices and exchange rates | 616 | |
| General inflation | (25 | ) |
| Volumes | 156 | |
| Costs | (220 | ) |
| Tax and other | 30 | |
|
| |
| 2006 Underlying earnings | 2,279 | |
|
| |
| * | A reconciliation of the net earnings with underlying earnings for 2004, 2005 and 2006 as determined under EU IFRS is set out on page 39 |
Rio Tinto’s Iron Ore group (RTIO) comprises iron ore operations in Australia, Canada and Brazil and development projects in Guinea (west Africa) and India. The portfolio also includes a HIsmelt®plant in Australia, which is arevolutionary process that converts iron ore fines into high quality pig iron.
At 31 December 2006, the iron ore group accounted for 32 per cent of Rio Tinto’s operating assets, and in 2006contributed 27 per cent of the Group’s gross sales revenue and 31 per cent of underlying earnings.
RTIO employs 4,800 people in Western Australia and approximately 7,000 worldwide. RTIO recruited strongly during the year and in a highly contested recruitment market in Western Australia hired 1,400 new starters, in additionto making a large number of internal transfers, secondments and promotions.
Work progressed on a number of safety and environmental initiatives, and particularly focused on the issues surrounding contractor management and the operation of heavy mobile equipment.
Final steps were taken for the next stage of the group’s expansion, with infrastructure now in place or approved to handle up to 220 million tonnes of iron ore exports annually. The growth strategy has seen approximately US$5 billion committed to port, rail, power and mine assets since 2003, resulting in a world class, integrated iron ore networkable to capitalise on continued strong demand internationally.
In April 2006, RTIO’s 50:50 joint venture with Hancock Prospecting for the development of the Hope Downs project was ratified following State Government approval. Construction of the US$980 million, 22 million tonnes perannum stage one Hope Downs mine has started, with production expected to commence in early 2008.
Sam Walsh, chief executive Iron Ore, is based in Perth, Western Australia.
Financial performance
2006 compared with 2005
RTIO’s contribution to 2006 underlying earnings was US$2,279 million, US$557 million higher than in 2005.
Demand for iron ore remained extremely strong across the product range throughout 2006, driven by the continuing strong growth in global steel demand and production. Total Chinese iron ore imports rose from 275 million tonnes to 326 million tonnes. Hamersley Iron, Robe River, Iron Ore Company of Canada and Corumbá in Brazil all operated at record or near record levels of production in 2006.
For the contract year commencing April 2006, RTIO reached agreement with customers on price increases of19 per cent for all products following on from the previous agreement of a 71.5 per cent increase. In December 2006,prices for the 2007 contract year were agreed with Baosteel of China, for a 9.5 per cent increase to the benchmark price.Similar price increase agreements were subsequently reached with other steelmakers.
| Rio Tinto 2006 Form 20-F | 43 |
Back to Contents
2005 compared with 2004
RTIO’s contribution to 2005 underlying earnings was US$1,722 million, US$1,157 million higher than in 2004. Demand for iron ore continued to be extremely strong across the product range throughout 2005, driven by continued strong growth in global steel production and improvements in steel demand. Chinese iron ore imports rose 30 per cent year on year, and Hamersley Iron, Robe River, IOC and Corumbá all achieved record production in 2005.
Operations
Hamersley Iron(Rio Tinto: 100 per cent)
Hamersley Iron operates eight mines in Western Australia, including two mines in joint ventures, 630 kilometres of dedicated railway, and port and infrastructure facilities located at Dampier. These assets are run as a single operation managed and maintained by Pilbara Iron.
The first phase of major expansions to the Pilbara infrastructure (including expanding Dampier port to 116 million tonnes per annum and Yandicoogina mine to 36 million tonnes per annum, and brownfields mine expansion) is now fully operational and the second phase is well under way and tracking on schedule and on budget.
The Marandoo mine was expanded and the new Nammuldi mine was completed in the second quarter of the year.
Hamersley Iron’s Yandicoogina mine is being expanded from 36 million tonnes per annum to 52 million tonnes and the scheduled completion has been accelerated to the end of the third quarter in 2007. Work also continued on pre-development studies for new mines.
2006 operating performance
Hamersley Iron’s total production in 2006 was 97.2 million tonnes, 7.6 million tonnes more than the 89.6 million tonnes in 2005, notwithstanding the volume of expansion work under way across the business. Rio Tinto’s share of this production was 93.3 million tonnes.
Flooding caused by a succession of five cyclones early in the year hindered operations significantly. Production increases through the year sought to recover from the early setbacks and meet increased capacity targets.
Shipments by Hamersley Iron totalled 98.1 million tonnes, including sales through joint ventures. Hamersley Iron’s shipments to China also reached a new record level at 52.9 million tonnes, securing China’s place as the single largest destination for Hamersley’s iron ore.
Production from all mines was stretched to achieve these levels, placing cost and other operating stresses on theHamersley Iron system. Ongoing labour shortages in a competitive market and materials pressures such as tyreshortages also provided significant challenges to meeting production targets.
| Hamersley’s total shipments of iron ore to major markets in 2006 | Million tonnes | |
|
| |
| China | 52.9 | |
| Japan | 27.4 | |
| Other Asia | 15.8 | |
| Europe | 2.0 | |
|
| |
| Total | 98.1 | |
|
| |
| | | |
| Note | | |
| This table includes 100 per cent of all shipments through joint ventures. | | |
Robe River Iron Associates(Rio Tinto: 53 per cent)
Robe River Iron Associates (Robe) is an unincorporated joint venture in which Mitsui (33 per cent), Nippon Steel (10.5 per cent) and Sumitomo Metal Industries (3.5 per cent) also have interests. Robe River is the world’s fourth largestseaborne trader in iron ore.
Robe River operates two open pit mining operations in Western Australia. Mesa J is located in the Robe Valley,north of the town of Pannawonica. The mine produces Robe River fines and lump, which are pisolitic iron ore products.The West Angelas mine, opened in 2002, is located approximately 100 kilometres west of the town of Newman. The mine produces West Angelas fines and lump, which are Marra Mamba iron ore products. Preparations are under wayfor these products to contribute to the Pilbara Blend from the third quarter 2007, when RTIO’s product range will besimplified from nine products to five.
Expansion of mine, rail and port operations has continued. As a result of the 2005 expansion of the West Angelasmine, which took production capacity to 25 million tonnes per annum, Robe River’s overall production capacityincreased to a nominal 57 million tonnes per year.
The expansion of the dedicated rail system, operated by Pilbara Iron, was completed during the year, ahead ofschedule. Completion of the northern section of the Pilbara Iron main line meant that almost 100 kilometres of track and associated interconnection and infrastructure such as signalling and communications is now duplicated. This provides
| Rio Tinto 2006Form 20-F | 44 |
Back to Contents
significantly greater flexibility, and hence improvements to capacity, in delivering ore to Robe River’s deepwater port facilities at Cape Lambert.
The expansion of the Cape Lambert port facility from 55 million tonnes to a rated capacity of 80 million tonnesper annum was recently approved. This is a significant project, comprising a number of major initiatives, including a new product reclaimer and an extended wharf.
Robe River primarily exports under medium and long term supply contracts with major integrated steel millcustomers in Japan, China, Europe, South Korea and Taiwan.
2006 operating performance
Cyclones slowed production early in the year at Robe River’s Pannawonica and West Angelas mines and hinderedoperations well into the second quarter. Robe River’s total production in 2006 was 52.9 million tonnes, comprising 29.3 million tonnes from Mesa J, and 23.7 million tonnes from West Angelas. Sales were 29.1 million tonnes of Mesa J and 23.3 million tonnes of West Angelas products.
Sales growth, based on increased production from West Angelas, was again fuelled by the growth in the Chinese market, where Robe River achieved record total sales of 18.5 million tonnes. However, Japan remains Robe River’s largest single market, with total shipments in 2006 of 24.7 million tonnes.
A new mining strategy at West Angelas has resulted in an improved product, with less grade variation. This improved performance is expected to continue through the transition to the Pilbara Blend.
| Robe’s total shipments of iron ore to major markets in 2006 | Million tonnes | |
|
| |
| Japan | 24.7 | |
| China | 18.5 | |
| Europe | 6.1 | |
| Other Asia | 2.7 | |
|
| |
| Total | 52.0 | |
|
| |
Iron Ore Company of Canada(Rio Tinto: 58.7 per cent)
RTIO operates Iron Ore Company of Canada (IOC) on behalf of shareholders Mitsubishi (26.2 per cent) and the Labrador Iron Ore Royalty Income Fund (15.1 per cent). IOC is Canada’s largest iron ore pellet producer. It operates anopen pit mine, concentrator and pellet plant at Labrador City, Newfoundland and Labrador, together with a 418kilometre railway to its port facilities in Sept-Îles, Quebec. IOC has large quantities of ore reserves with low levels of contaminants.
Products are transported on IOC’s railway to Sept-Îles. The port is open all year, handles ore carriers of up to 255,000 tonnes and provides competitive access to all seaborne pellet markets and to the North American Great Lakesregion. IOC exports its concentrate and pellet products to major North American, European and Asian steel makers.
IOC employs approximately 1,900 people and recruited 250 people during the year to offset an increase in retirements and to meet greater production needs.
2006 operating performance
While concentrate prices continued to rise, showing a 17.3 per cent increase, the pellet premium retreated from the record high of the previous year, resulting in pellet prices softening by 3.5 per cent. Pellets account for 80 per cent of IOC’s production.
Total saleable production was 16.1 million tonnes (compared with 15.6 million tonnes in 2005) following astrong recovery from weather related production losses in the first quarter. The total was made up of 12.7 million tonnesof pellet production (13.3 million tonnes in 2005) and 3.4 million tonnes of saleable concentrate production (2.3 million tonnes in 2005).
Higher oil prices and efforts to recover first quarter production losses put pressure on unit costs. A project toincrease annual concentrate production to 17.5 million tonnes was largely completed by the year end, and plans for further expansion are currently under consideration. IOC commenced negotiation of a new collective agreement in thefourth quarter of 2006, and following a five-week labour dispute, a new five-year collective agreement was concluded in the second quarter of 2007.
| IOC’s total shipments of iron ore to major markets in 2006 | Million tonnes | |
|
| |
| Europe | 5.7 | |
| Asia Pacific | 5.4 | |
| North America | 4.8 | |
|
| |
| Total | 15.9 | |
|
| |
| Rio Tinto 2006Form 20-F | 45 |
Back to Contents
Mineração Corumbaense Reunida (Corumbá)(Rio Tinto: 100 per cent)
Corumbá produced a record two million tonnes of lump iron ore in 2006 and sold 1.8 million tonnes, which was bargedalong the Paraguay River for export to South American and European customers. The feasibility of expandingproduction at the mine in stages to 15 million tonnes per annum is under study. Logistic options are being considered for expanded export sales and for supplies to a proposed steel making project at Corumbá, which is being promoted byRio Tinto. Corumbá has over 200 million tonnes of reserves and over 400 million tonnes of additional mineralisedmaterial. There are approximately 500 employees.
HIsmelt®(Rio Tinto: 60 per cent)
The HIsmelt®iron making project at Kwinana in Western Australia is a joint venture between Rio Tinto (60 per centinterest through its subsidiary, HIsmelt®Corporation), US steelmaker Nucor Corporation (25 per cent), Mitsubishi Corporation (10 per cent), and Chinese steelmaker Shougang Corporation (five per cent). The project has so farreceived support of A$80 million from the Australian federal government.
The HIsmelt®process is a direct iron smelting technology developed largely by Rio Tinto that converts iron ore fines into high quality pig iron (96 per cent iron content) without the use of coke ovens and sinter plants. Notably, thetechnology allows efficient processing of ore fines with higher levels of impurities.
In 2006 the Hlsmelt®plant moved into the first year of a three-year ramp up to its full production rate of 800,000 tonnes per annum. Since start up, the facility has produced 98,000 tonnes of pig iron and has made three shipments ofproduct.
HIsmelt®has approximately 130 employees.
In 2006 the HIsmelt®facility hosted visits from senior representatives of the Chinese government, as well as asignificant number of international steel companies. HIsmelt®Corporation continues to promote the technology globallyand expects interest to increase as the ramp up phase progresses. In November, Australian state and federal ministers attended a special ceremony at Kwinana to recognise the opening of the world’s first commercial HIsmelt®plant.
Projects
Orissa, India(Rio Tinto: 51 per cent)
Orissa is one of the key iron ore regions of the world. RTIO has a joint venture interest in Rio Tinto Orissa Mining withthe state owned Orissa Mining Corporation. The joint venture holds rights to iron ore leases in Orissa, which it is seeking to develop. Rio Tinto is keen to participate in the development of the Indian iron ore sector through its jointventure. A project team has been established and is working to expedite the development of operations in India.
India’s economy is expected to maintain its present growth, so providing support for an expanding domestic steel industry, and discussions have continued with major domestic steel companies.
Simandou, Guinea(Rio Tinto: 95 per cent)
The Simandou project in eastern Guinea, west Africa, is a Rio Tinto greenfields discovery with potentially significantquantities of high grade iron ore. Simandou moved from Rio Tinto Exploration to full project status as part of RTIO in October 2004. A prefeasibility study is assessing the mining and transport options needed to bring Simandou intoproduction as quickly as possible. The International Finance Corporation (the private sector arm of the World BankGroup) took a five per cent stake in the project in August 2006 and is working with Rio Tinto to develop the project in an environmentally and socially sustainable way. To date Rio Tinto has spent more than US$50 million on the project.
| Rio Tinto 2006Form 20-F | 46 |
Back to Contents
| ENERGY GROUP | | |
| Mined | Rio Tinto share | |
| Coal | million tonnes | |
|
| |
| 2002 | 149.1 | |
| 2003 | 148.8 | |
| 2004 | 157.4 | |
| 2005 | 153.6 | |
| 2006 | 162.3 | |
|
| |
| | | |
| | | |
| Underlying earnings contribution* | US$m | |
|
| |
| 2004 | 431 | |
| 2005 | 733 | |
| 2006 | 711 | |
|
| |
| | | |
| | | |
| Changes in underlying earnings 2004 - 2006 | US$m | |
|
| |
| 2004 Underlying earnings | 431 | |
| Effect of changes in: | | |
| Prices and exchange rates | 483 | |
| General inflation | (41 | ) |
| Volumes | 8 | |
| Costs | (140 | ) |
| Tax and other | (8 | ) |
|
| |
| 2005 Underlying earnings | 733 | |
| Effect of changes in: | | |
| Prices and exchange rates | 199 | |
| General inflation | (50 | ) |
| Volumes | (13 | ) |
| Costs | (209 | ) |
| Tax and other | 51 | |
|
| |
| 2006 Underlying earnings | 711 | |
|
| |
| * | A reconciliation of the net earnings with underlying earnings for 2004, 2005 and 2006 as determined under EU IFRS is set out on page 39 |
The Energy group comprises thermal coal and coking coal operations and uranium. Coal interests are located in Australia and the US. They supply internationally traded and US and Australian domestic markets. The energy portfolioalso includes Rössing Uranium in Namibia and Energy Resources of Australia which supply uranium oxide forelectricity generation globally.
The group has consolidated its asset holdings, branding and product stewardship with the creation of Rio Tinto Coal Australia, Rio Tinto Energy America and Rio Tinto Uranium. An overarching group strategy was needed toharness and focus resources to deliver a world class performance in operations, sustainable development and value creation.
In 2006 the Energy group undertook a review of its strategy and asset portfolio. The review highlighted theimportance of the Japanese and US markets to the business and the role of China in providing depth in demand whilst increasing the potential volatility. The strategy is focused on becoming the world’s leader in mineable energy.
A key part of the strategy is to ensure that the group is a leading advocate of, and investor in, the sustainablefuture uses of coal and uranium. In 2006 the group dedicated resources and investment funds to the FutureGen project in the US, COAL21 in Australia and the International Energy Agency Clean Coal Centre.
In uranium, both ERA’s Ranger mine in Australia and the Rössing Uranium mine in Namibia represent low cost brownfield expansion opportunities. Rio Tinto also holds other attractive undeveloped uranium deposits, including Kintyre in Western Australia, and we are currently assessing the viability of restarting the Sweetwater uranium mill and adjacent uranium mine in Wyoming, US.
At 31 December 2006, the Energy group accounted for 13 per cent of Group operating assets and, in 2006, contributed 17 per cent of Rio Tinto’s gross sales revenue and ten per cent of underlying earnings.
Preston Chiaro, chief executive Energy, is based in London.
Financial performance
2006 compared with 2005
The Energy group’s 2006 contribution to underlying earnings was US$711 million, US$22 million lower than in 2005.
Results benefited from a sustained increase in the price received for thermal coal during 2006. Problems in thecoal supply chain in the Hunter Valley region of New South Wales impeded production from Coal & Allied operations. Drought in parts of Queensland and New South Wales has begun to affect production levels. Operations focused on producing high margin products and optimising the coal supply chain. Increases in the cost of basic materials, fuel,
| Rio Tinto 2006Form 20-F | 47 |
Back to Contents
explosives and labour were not fully offset by production growth, resulting in a rise in the cost per unit of production across all operations.
Our uranium businesses continue to provide options and opportunities in the reinvigorated international uraniummarket. The focus of the uranium operations is to seek additional production volumes and long term expansions to sell into the current favourable price environment. Spot prices for uranium oxide strengthened considerably during theperiod, increasing from US$36.38 at the beginning of the year to close at US$72 in December. Uranium oxide istypically sold on long term contracts, with pricing determined several years in advance. The significant rise in the spot price of uranium oxide during the period is therefore not fully reflected in the current earnings. The effects of the 2006pricing levels will flow through to earnings in future years. Our uranium businesses are contracted and priced to 98 percent in 2007 and 88 per cent in 2008.
2005 compared with 2004
The Energy group’s 2005 contribution to underlying earnings was US$733 million, US$302 million higher than in2004.
A significant increase in the price received for both thermal and coking coal during 2005 was a key factor in this improvement. Third party infrastructure issues continued to impede production growth in all of the coal operations.Operational emphasis shifted to high margin products and to facilitating the further expansion of the Hail Creek mineinto a strong market for coking coal. The inability to reap the required economies of scale and an increase in the price of fuel and explosives resulted in a rise in the unit cost of production across the group.
Spot prices for uranium oxide strengthened considerably during 2005, increasing from US$20.43 at thebeginning of the year to close at US$36.38 in December. The significant rise in the spot price of uranium oxide during the period was not fully reflected in the year’s earnings.
Operations
Rio Tinto Energy America(Rio Tinto: 100 per cent)
Rio Tinto Energy America (RTEA, formerly known as Kennecott Energy) wholly owns and operates four open cut coalmines in the Powder River Basin of Montana and Wyoming, US, and has a 50 per cent interest in, but does not operate,the Decker mine in Montana. RTEA also manages the group’s interest in Colowyo Coal in Colorado, US. In total it employs approximately 2,300 people.
One of the largest US producers, RTEA sells its ultra low sulphur coal to electricity generators predominantly in mid western and southern states. Sales are made under multiple year contracts and on a spot basis for one year or less.
The domestic US market for low sulphur coal continues to grow due to its competitive cost per delivered energy unit and restrictions on sulphur emissions by utilities. The strong demand for low cost and low sulphur western coal is expected to continue and grow with the announcement of numerous new coal fired generation projects and increased utilisation of existing coal generation capacity in the US.
2006 operating performance
RTEA’s attributable production of 125 million tonnes of coal was eight per cent higher than in 2005, with productionincreasing at all of the mines. Expansions at Antelope and Spring Creek increased output to record levels. The new dragline commissioned at Jacob’s Ranch during the year enabled a new production record to be set. Underlyingearnings of US$177 million were 31 per cent higher than the US$135 million recorded in 2005. This increase was attributable to overall production increases and a higher sales price realisation, somewhat offset by a higher effective tax rate and increased operational costs, particularly the cost of diesel, explosives, tyres and labour.
Spot prices were volatile during the period. The spot price for 8800 BTU (0.80 sulphur) moved from US$23 a tonne in December 2005 to US$9 in December 2006 for delivery the following year.
A fatality occurred at the Spring Creek mine in November 2006.
Rio Tinto Coal Australia(Rio Tinto: 100 per cent)
Rio Tinto Coal Australia (RTCA) manages the group’s Australian coal interests. These include, in Queensland; the Blair Athol (Rio Tinto: 71 per cent), Kestrel (Rio Tinto: 80 per cent), Tarong (Rio Tinto: 100 per cent) and Hail Creek(Rio Tinto: 82 per cent) coal mines and the Clermont deposit (Rio Tinto: 50 per cent).
RTCA also provides management services to Coal & Allied Industries (Coal & Allied) for operation of its four mines located within the Hunter Valley in New South Wales. Coal & Allied (Rio Tinto: 75.7 per cent) is publicly listedon the Australian Securities Exchange and had a market capitalisation of A$6.5 billion (US$ 4.9 billion) at 31 December2006. Coal & Allied wholly owns Hunter Valley Operations, has an 80 per cent interest in Mount Thorley Operations and a 55.6 per cent interest in the contiguous Warkworth mine, and a 40 per cent interest in the Bengalla mine which abuts its wholly owned Mount Pleasant development project. Coal & Allied also has a 37 per cent interest in Port Waratah Coal Services coal loading terminal.
Production from the Tarong mine is sold exclusively to Tarong Energy Corporation, an adjacent state owned power utility. A ten year contract for up to 7.5 million tonnes annually expires at the end of 2010.
Kestrel and Hail Creek sell mainly metallurgical coal to customers in Japan, south east Asia, Europe and Central
| Rio Tinto 2006Form 20-F | 48 |
Back to Contents
America, generally on annual agreements.
Coal & Allied produces thermal and semi soft coal. Most of its thermal coal is sold under contracts to electricalor industrial customers in Japan, Korea and elsewhere in Asia. The balance is sold in Europe and Australia. Coal & Allied’s semi soft coal is exported to steel producing customers in Asia and Europe under a combination of long term contracts and spot business.
In May 2007 Coal & Allied announced production cutbacks of approximately 20% at its Hunter Valley mines following notice of reductions in its port and rail allocations for the remainder of the year.
In June 2007 Coal & Allied declared force majeure on a number of its sales contracts as a result of the severeweather conditions encountered at the Port of Newcastle and in the Hunter Valley region of New South Wales.
RTCA and Coal & Allied collectively employ approximately 2,500 people.
2006 operating performance
RTCA and Coal & Allied’s combined underlying earnings of US$490 million in 2006 were 14 per cent below the 2005result because of coal supply chain bottlenecks and increased operating costs.
At all operations other than Tarong, sales were constrained by inability of the infrastructure to handle producer demand. Blair Athol and Hail Creek shipments were both affected by infrastructure constraints at the Dalrymple BayCoal Terminal, while Coal & Allied mines were similarly affected at Port Waratah in New castle because of constraints in the volume of material that could be railed to the port.
Total production at Blair Athol decreased from 10.6 million tonnes to 10.2 million tonnes primarily as a result of limited port capacity. Kestrel’s production fell three per cent to 3.6 million tonnes in 2006; this included 2.7 million tonnes of coking coal. At Tarong, production increased by eight per cent to 7.0 million tonnes in line with demand from Tarong Energy Corporation. Hail Creek production was 4.5 million tonnes, a reduction of 23 per cent.
At Hunter Valley Operations, total production decreased from 12.4 million tonnes to 12.0 million tonnes. The integrated Mount Thorley Warkworth operations increased production by ten per cent to 11.2 million tonnes. At Bengalla, production decreased seven per cent from 6.0 million tonnes to 5.5 million tonnes.
Safety performance and awareness continue to be the major focus of all operations managed by RTCA.
Rössing Uranium(Rio Tinto: 68.6 per cent)
Rössing produces and exports uranium oxide from Namibia to European, US and Asia Pacific electricity producers. In June, Rössing celebrated its thirtieth anniversary of uranium oxide production. 2006 also marked the first year of production of the life of mine extension.
Rössing employs approximately 900 people.
2006 operating performance
In 2006, total production of uranium oxide decreased slightly to 3,617 tonnes. The higher market prices for uranium oxide are beginning to flow through into underlying earnings. However, the higher realised prices were partially offset by an increase in cash costs and higher taxation levels, resulting in a US$27million underlying earnings contribution in2006.
Rössing continues to put a significant effort and management focus on safety. The goal is to eliminate all injuriesfrom the workplace and to have an embedded safety culture and systems that identify and rectify potential safety incidents.
Energy Resources of Australia(Rio Tinto: 68.4 per cent)
Energy Resources of Australia Ltd (ERA) is publicly listed and had a market capitalisation of A$4.0 billion (US$3.0 billion) at 31 December 2006. ERA employs approximately 400 people, with 13 per cent of the operational workforce being represented by Aboriginal people.
ERA produces uranium oxide at the Ranger open pit mine, 260 kilometres east of Darwin in the NorthernTerritory. ERA also has title to the nearby Jabiluka mineral lease, which in 2003 was put on long term care and maintenance.
Ranger has a 5,500 tonnes per year nameplate capacity and started production in 1981. ERA’s operations, including Jabiluka, are surrounded by, but remain separate from, the World Heritage listed Kakadu National Park, andespecially stringent environmental requirements and governmental oversight apply.
2006 operating performance
Total uranium oxide production of 4,704 tonnes was significantly below the 5,903 tonnes produced in 2005 owing to the effects of a tropical cyclone and a failure in the acid plant. Stronger prices were partially offset by the higher cost of consumables and resulted in underlying earnings of US$17 million. During the year, ERA embarked upon an extensiveexploration and development programme to identify new reserves and increase the mine life of existing reserves.
| Rio Tinto 2006 Form 20-F | 49 |
Back to Contents
Projects
Rössing Uranium(Rio Tinto: 68.6 per cent)
In December 2005, approval was granted to extend the life of the operation until at least 2016 and restore annual production capacity to 4,000 tonnes per annum at a total incremental and sustaining capital cost of US$112 million.
Energy Resources of Australia(Rio Tinto: 68.4 per cent)
ERA is spending A$27.6 million in 2007 to construct a plant at the Ranger mine to process lateritic ore, a material containing a high proportion of clay minerals. The laterite processing plant will contribute approximately 400 tonnes per annum of uranium oxide to ERA’s production from 2008 through to 2014. Construction of the plant will commence in April 2007, with the first lateritic ore scheduled for processing in the first quarter of 2008.
Rio Tinto Coal Australia Clermont(Rio Tinto: 50.1 per cent)
Rio Tinto and its joint venture partners approved investment of US$750 million for the development of the Clermont thermal coal mine in central Queensland, situated 15 kilometres south east of the Blair Athol Mine. Clermont is expected to become Australia’s largest thermal coal producer when it reaches full capacity, which is scheduled for 2013. The mine is expected to be brought into production to replace Blair Athol, due to close in 2012, and will use Blair Athol’s existing infrastructure and market position.
Coal & Allied Mount Pleasant(Rio Tinto: 75.7 per cent)
In 2006, Coal & Allied started a feasibility study on the Mount Pleasant coal mine project located adjacent to the Bengalla mine near Muswellbrook in the Hunter Valley, New South Wales. The study is expected to take about 12 months to complete and will include extensive community consultation.
Hydrogen Energy(Rio Tinto: 50.0 per cent)
In May 2007, Rio Tinto and BP announced the formation of a new jointly owned company, Hydrogen Energy, which would develop decarbonised energy projects around the world. The venture would initially focus on hydrogen fuelled power generation, using fossil fuels and carbon capture and storage technology to produce new large scale supplies of clean electricity. The first new project would be for the potential development of a US$1,500 million coal fired power generation project at Kwinana in Western Australia. This project would be subject to the successful outcome of detailed engineering and commercial studies and to government policy to make it commercially viable.
| Rio Tinto 2006 Form 20-F | 50 |
Back to Contents
INDUSTRIAL MINERALS GROUP
| Production | Rio Tinto share | |
| Borates | ‘000 tonnes B2O3 | |
|
| |
| 2002 | 528 | |
| 2003 | 559 | |
| 2004 | 565 | |
| 2005 | 560 | |
| 2006 | 553 | |
|
| |
| | | |
| Titanium dioxide | ‘000 tonnes | |
|
| |
| 2002 | 1,274 | |
| 2003 | 1,192 | |
| 2004 | 1,192 | |
| 2005 | 1,312 | |
| 2006 | 1,415 | |
|
| |
| | |
| Underlying earnings contribution* | US$m | |
|
| |
| 2004 | 243 | |
| 2005 | 187 | |
| 2006 | 243 | |
|
| |
| | |
| Changes in underlying earnings 2004 - 2006 | US$m | |
|
|
|
| 2004 Underlying earnings | 243 | |
| Effect of changes in: | | |
| Prices and exchange rates | 35 | |
| General inflation | (14 | ) |
| Volumes | 27 | |
| Costs | (92 | ) |
| Tax and other | (12 | ) |
|
|
|
| 2005 Underlying earnings | 187 | |
| Effect of changes in: | | |
| Prices and exchange rates | 34 | |
| General inflation | (18 | ) |
| Volumes | 3 | |
| Costs | — | |
| Tax and other | 37 | |
|
|
|
| 2006 Underlying earnings | 243 | |
|
|
|
| * | A reconciliation of the net earnings with underlying earnings for 2004, 2005 and 2006 as determined under EU IFRS is set out on page 39. | | |
Rio Tinto’s Industrial Minerals group comprises Rio Tinto Minerals, which produces borates, talc and salt, and Rio Tinto Iron & Titanium, a major producer of titanium dioxide feedstock. Rio Tinto is a global leader in the supply and science of these products. There are more than 200 industrial minerals and markets are often diverse, highly technical and require unique marketing and sales expertise.
At 31 December 2006, Industrial Minerals accounted for 13 per cent of the Group’s operating assets and in 2006 contributed approximately ten per cent of Rio Tinto’s gross sales revenue and three per cent of underlying earnings.Approximately 7,000 people were employed in 2006.
The Industrial minerals group was combined with the Diamonds group with effect from 1 June 2007, to form theDiamonds and Minerals group. Andrew Mackenzie, chief executive Diamonds and Minerals and formerly chief executive Industrial minerals, is based in London.
Financial performance
2006 compared with 2005
Industrial Minerals’ contribution to 2006 underlying earnings was US$243 million, a 30 per cent improvement on 2005.
Rio Tinto Minerals’ underlying earnings, at US$91 million, were 54 per cent higher than in 2005. Despiteupward cost pressure caused by cyclones and labour markets in Western Australia, the absence in 2006 of the 2005 Rio Tinto Minerals restructure provision, coupled with modest revenue increases, led to this improved result.
Rio Tinto Iron & Titanium underlying earnings, at US$152 million, were 19 per cent higher than in 2005. Goodprice performance across all products, combined with favourable volume trends, strict cost control at Richards Bay Minerals and beneficial Canadian tax changes, offset increased costs in the Canadian operations and the impact of the strong Canadian dollar.
| Rio Tinto 2006 Form 20-F | 51 |
Back to Contents
2005 compared with 2004
Industrial Minerals’ contribution to the Group’s 2005 underlying earnings was US$187 million, 23 per cent lower thanin 2004, reflecting significant one off costs of US$42 million after tax, including provision for restructuring in relation to the formation of Rio Tinto Minerals. There were also increased energy and distribution costs at all business units.
Dampier Salt and Rio Tinto Iron & Titanium incurred high initial operating costs for the commissioning of a newplant and for the upgraded titanium slag (UGS) expansion. Rio Tinto Iron & Titanium also incurred a tax expense of US$13 million resulting from a change in the tax rate for QIT-Fer et Titane in Quebec.
Rio Tinto Borax’s underlying earnings, at US$48 million, were 48 per cent lower than in 2004. The boratesbusiness was affected by lower sales volumes and higher energy and distribution costs. Rio Tinto Borax also incurred a one off restructuring cost of US$12 million after tax in relation to the formation of Rio Tinto Mineral.
Rio Tinto Iron & Titanium’s underlying earnings, at US$128 million, were ten per cent higher than in 2004. Strong price performance across all products, combined with increased volumes and strict cost performance at Richards Bay Minerals led to this strong result.
Operations
Rio Tinto Minerals
During 2006, three of Rio Tinto’s Industrial Minerals businesses – Borax, Luzenac and Dampier Salt – combined theirmanagement to form a new and more efficient organisation called Rio Tinto Minerals. Rio Tinto Minerals’ global presence includes mines and refineries, shipping facilities, refining and packing facilities and sales and technical facilities throughout the Americas, Asia and Europe.
The company serves 2,500 customers in approximately 100 countries. The global operational headquarters havebeen relocated to Denver, Colorado, and the global commercial headquarters are in Chiswick, London.
Borates– More than one million tonnes of refined borates are produced at the principal borate mining and refining operation, Boron, in California’s Mojave Desert. Borates are essential to plants and are part of a healthy diet for people. They are also key ingredients in hundreds of modern products, chief among them: insulation fibreglass, textile fibreglass and heat resistant glass (44 per cent of world demand); ceramic and enamel frits and glazes (13 per cent); detergents, soaps and personal care products (six per cent); agricultural micronutrients (seven per cent); and other usesincluding wood preservatives and flame retardants (30 per cent).
Talc– Rio Tinto Minerals operates talc mines, including the world’s largest (in south west France), and processingfacilities in Australia, Austria, Belgium, Canada, France, Italy, Japan, Mexico, Spain, the UK and the US. Talcs enhance performance in countless applications, including paper, paints, putties, roofing materials, plastics, automotive parts, ceramics, foundry, rubber goods, personal care products, agriculture, food, pharmaceuticals, soap, cosmetics, and pesticides. This multiplicity demands an in depth understanding not only of talc’s properties and functions but also of its full range of applications and user industries.
Salt– Rio Tinto Minerals manages Dampier Salt’s (Rio Tinto: 64.9 per cent) three salt operations located in Western Australia. It produces industrial salt by solar evaporation at Dampier, Port Hedland and Lake MacLeod, where it alsomines gypsum. Dampier Salt’s customers are located in Asia and the Middle East . The majority are chemical companies which use salt as basic feed for the production of chlorine and caustic soda (together known as chlor-alkali production). Dampier Salt’s product is also used as food salt and for general purposes, including road de-icing.
2006 operating performance
In 2006 Rio Tinto Minerals streamlined its sales and administrative function, reducing staff by 20 per cent and closing three laboratories and three offices. There are plans to close two more. In its operations, Rio Tinto Minerals divested several less profitable product lines and operational sites, built boric acid capacity, approved new salt capacity, andimproved plant efficiency, mine planning and energy use. In the marketplace, North America remains the most profitable region for Rio Tinto Minerals’ products. Developing economies such as China, eastern Europe and India hold promise because of their rising living standards and the demand for higher quality raw materials.
Borates– Production volumes were down one per cent, at 553,000 tonnes, but sales volumes remained consistent with 2005’s total. Asia continued to drive growth in the borate market, though there were pockets of growth in Russia andeastern Europe. In North America, stagnation in the housing market signals a possible decline in demand from insulations and wood preservatives customers, but this is likely to be offset by retrofit and remodeling trends. Rio Tinto Minerals expanded its boric acid capacity by a further 56,000 tonnes to supply market growth. The project was completed on time and under budget and is meeting planned throughput.
Talc– Talc production volumes increased two per cent, while sales volumes remained at the same level as 2005,reflecting stable markets with growth in the polymer, paint and technical ceramics sector offsetting declines in paper.
Salt– Five cyclones in Western Australia during 2006 adversely affected salt operations, reducing production by almost two per cent to 8.3 million tonnes (Rio Tinto share: 5.4 million tonnes). Sales volumes decreased by five per cent.Despite this, supply reliability and excellent customer relations were maintained. Repairs are well under way. The residual impact of dilution from the record rains will be felt for the next two years. At Lake MacLeod, a 26 per cent capacity increase was approved by all shareholders.
| Rio Tinto 2006 Form 20-F | 52 |
Back to Contents
Rio Tinto Iron & Titanium
Rio Tinto Iron & Titanium (RIT) comprises the wholly owned QIT-Fer et Titane (QIT) in Quebec, Canada and the 50per cent interest in Richards Bay Minerals (RBM) in KwaZulu-Natal, South Africa. Both operations produce titanium dioxide feedstock used as pigment by manufacturers of paints and surface coatings, plastics and paper. Coproducts include high purity iron and zircon.
QIT’s proprietary process technology enables it to supply both the sulphate and chloride pigment manufacturingmethods. Its upgraded slag (UGS) plant supplies the growing chloride sector and is designed for expansion, in line with demand, up to a capacity of 600,000 tonnes per year. During 2006, RIT expanded its UGS plant to 375,000 tonnes per annum, three months ahead of schedule.
RBM’s ilmenite has a low alkali content, which makes its feedstock suitable for the chloride pigment process. RBM has the capacity to produce one million tonnes of feedstock annually.
2006 operating performance
RIT increased production across all of its products in 2006, with a ten per cent increase in UGS as expanded capacity was brought on-line. RBM operated at full capacity and saw an eleven per cent increase in titanium dioxide (TiO2)feedstock production.
Strong market performance led to strong financial performance as TiO2 pigment producers reported an increase in sales volumes of five per cent on average during 2006, after a decrease in 2005 of 0.5 per cent. Market conditions remain tight for chloride feedstock, as chloride pigment plants continue to run at high utilisation rates. Demand for high-grade TiO2 feedstock, such as QIT’s UGS, remains strong. Market conditions for iron and steel co-products also remain strong. Zircon prices continued to increase throughout 2006, as demand was effectively constrained by available supply. The offices of RIT were relocated from Montreal to the UK during 2006.
Projects
QIT Madagascar Minerals(Rio Tinto: 80 per cent)
In 2005 Rio Tinto announced the approval of the Madagascar titanium dioxide project. RIT manages the project, in which an agency of the Government of Madagascar has a 20 per cent interest.
The project comprises a mineral sands operation and port in Madagascar and an upgrade of Rio Tinto’s ilmenitefacilities in Canada. First production from the operation in the Fort-Dauphin region of Madagascar is expected in late 2008 and the initial capacity will be 750,000 tonnes of ilmenite per year. During 2006 the definitive cost estimate of the project was finalised. The cost increased by just under ten per cent to US$850 million. The cost inflation was mainly caused by higher materials costs and foreign exchange pressures but increased production capacity and logistics will ensure the project value is unchanged.
The ilmenite will be smelted at Rio Tinto’s facilities at Sorel in Quebec. This will require an upgrade of storage and handling facilities as well as their associated ancillary services. With a grade of 60 per cent titanium dioxide, theMadagascar orebody is the world’s largest known undeveloped high grade ilmenite deposit. It has an expected mine life of 40 years and will supply a new, high quality chloride slag with 91 per cent titanium dioxide content to meet long term demand for titanium dioxide by the pigment industry.
A deep sea multi-use public port at Ehoala, near the town of Fort-Dauphin, is an important component of theproject. The mine will be the key initial customer, providing the base load to help establish the port. Over time, it is expected the port will make an important contribution to the economic development of the region.
The Government of Madagascar contributed US$35 million to the establishment of the port, as part of its GrowthPoles Project funded by the World Bank. RIT will manage the port operations.
Potasio Rio Colorado S.A.(Rio Tinto: 100 per cent)
The Rio Colorado potash project in Argentina lies 1,000 km south west of Buenos Aires. Evaluation of the project began in late 2003, and a large scale trial of solution mining of the potash has run successfully from late 2004. Currently a feasibility study is under way and, assuming favourable progress, will be completed in 2007. A positive development decision in 2007 could see first production from the mine in 2010 and production volumes in the range of 1.6 to 2.4 million tonnes per year.
| Rio Tinto 2006 Form 20-F | 53 |
Back to Contents
ALUMINIUM GROUP
| Mined | Rio Tinto share | |
| Weipa bauxite | million tonnes | |
|
| |
| 2002 | 11.2 | |
| 2003 | 11.9 | |
| 2004 | 12.6 | |
| 2005 | 15.5 | |
| 2006 | 16.1 | |
|
| |
| | |
| Production | Rio Tinto share | |
| Alumina | ‘000 tonnes | |
|
| |
| 2002 | 1,947 | |
| 2003 | 2,014 | |
| 2004 | 2,231 | |
| 2005 | 2,963 | |
| 2006 | 3,247 | |
|
| |
| | | |
| Aluminium | ‘000 tonnes | |
|
| |
| 2002 | 794 | |
| 2003 | 817 | |
| 2004 | 837 | |
| 2005 | 854 | |
| 2006 | 845 | |
|
| |
| | | |
| Underlying earnings contribution* | US$m | |
|
| |
| 2004 | 331 | |
| 2005 | 392 | |
| 2006 | 746 | |
|
| |
| | | |
| Changes in underlying earnings 2004 - 2006 | US$m | |
|
| |
| 2004 Underlying earnings | 331 | |
| Effect of changes in: | | |
| Prices and exchange rates | 93 | |
| General inflation | (34 | ) |
| Volumes | 34 | |
| Costs | (47 | ) |
| Tax and other | 15 | |
|
| |
| 2005 Underlying earnings | 392 | |
| Effect of changes in: | | |
| Prices and exchange rates | 454 | |
| General inflation | (36 | ) |
| Volumes | 8 | |
| Costs | (65 | ) |
| Tax and other | (7 | ) |
|
| |
| 2006 Underlying earnings | 746 | |
|
| |
| * | A reconciliation of the net earnings with underlying earnings for 2004, 2005 and 2006 as determined under EU IFRS is set out on page 39. |
Rio Tinto Aluminium is an integrated product group with operations in Australia, New Zealand and the UK. The Comalco name was replaced by Rio Tinto Aluminium in November 2006 to take advantage of the Rio Tinto global brand and reputation.
The Aluminium group’s strategy is to maximise shareholder return by committing to excellence in health, safety and environmental performance; maximising value generated from existing assets; and optimising and opportunisticallygrowing the bauxite, alumina and aluminium portfolio. Rio Tinto Aluminium uses its dedicated business improvement programme, called Lean Six Sigma, to solve operational problems, improve process stability and eliminate waste.
The Aluminium group has two operating business units – Mining and Refining, and Smelting. At 31 December2006, the group accounted for 17 per cent of Rio Tinto’s operating assets and in 2006 contributed 14 per cent of the Group’s gross sales revenue and ten per cent of its underlying earnings.
Rio Tinto Aluminium employs about 4,300 people. Oscar Groeneveld, chief executive Aluminium, is based inBrisbane, Australia.
| Rio Tinto 2006 Form 20-F | 54 |
Back to Contents
Financial performance
2006 compared with 2005
In 2006, Rio Tinto Aluminium’s contribution to the Group’s underlying earnings was US$746 million, an increase of 90per cent. Higher aluminium prices resulted in earnings increasing by US$451 million, with the average aluminium price in 2006 at 116 US cents per pound compared with 86 US cents in 2005.
2005 compared with 2004
Rio Tinto Aluminium’s contribution to underlying earnings in 2005 was US$392 million, an increase of 18 per cent. The average aluminium price in 2005 was 86 US cents per pound compared with 78 US cents in 2004 and this led to an increase in earnings of US$106 million. However, the effect of the weakening US currency reduced Aluminium’s earnings by US$34 million.
Operations
Mining and refining
Rio Tinto Aluminium has a large, wholly owned bauxite mine at Weipa on Cape York Peninsula, Queensland. AUS$150 million expansion in 2004 increased capacity to 16.5 million tonnes per year. This expansion, when combined with recent infrastructure investment, provides the foundation for Weipa to increase annual production to 25 million tonnes.
As at 31 December 2006, mineable reserves of bauxite at Weipa were 1,193 million tonnes. Approximately 90 per cent of the bauxite from Weipa was shipped to alumina refineries at Gladstone, Queensland, and Sardinia, Italy in2006.
In 2006, Weipa’s safety performance was recognised when it received the Minerals Council of Australia’s National Minerals Industry Safety and Health Excellence Award (the MINEX Award).
Rio Tinto Aluminium owns the Yarwun alumina refinery (formerly Comalco Alumina Refinery) and 38.6 percent of Queensland Alumina in Gladstone. Rio Tinto Aluminium sold its 56.2 per cent interest in the Eurallumina refinery in Sardinia, Italy. The sale was effective in October and was in line with Rio Tinto’s strategy of selling non core assets.
The Yarwun alumina refinery reached and exceeded nameplate capacity of 1.4 million tonnes per annum in the fourth quarter of 2006, in line with the original development schedule. A two million tonne per annum expansion is under study. There is potential for total capacity to be expanded to over four million tonnes. Most of the refinery’scurrent output goes into Rio Tinto Aluminium smelters; the balance is placed in the traded alumina market. The refinery adds value to the Weipa bauxite deposit and strengthens both Rio Tinto Aluminium’s and Australia’s positions in the world alumina market.
Rio Tinto Aluminium is continuing to pursue new market opportunities for bauxite and alumina, including participation in China’s growing alumina market.
2006 operating performance
Bauxite production at Weipa reached record levels in 2006, at 16.1 million tonnes, four per cent higher than in 2005. This increase was a result of the ongoing ramp up of project NeWeipa, which led to increased production from both theEast Weipa and Andoom mines. Weipa bauxite shipments rose by six per cent, to 15.9 million tonnes.
Rio Tinto Aluminium advised its calcined bauxite customers in December 2006 that it would withdraw from the production of calcined bauxite by 2008 after 40 years of providing this product to the abrasives and oil and gas exploration industries. Calcined bauxite represents about one per cent of Weipa’s total bauxite production.
Rio Tinto’s share of alumina production for 2006 was ten per cent higher than in 2005. This increase was theresult of the ramp up at the Yarwun alumina refinery, which produced 1.2 million tonnes, about 400,000 tonnes more than in 2005. Production at Queensland Alumina Limited and Eurallumina (until its sale effective in October) was similar to 2005 levels.
Smelting
Rio Tinto Aluminium’s primary aluminium is produced by smelters at Boyne Island (59.4 per cent) near Gladstone, Bell Bay (100 per cent) in Tasmania, Tiwai Point (79.4 per cent) in New Zealand and Anglesey Aluminium (51 per cent) in Wales, UK. Rio Tinto Aluminium also maintains a 42.1 per cent interest in the Gladstone Power Station.
During the year, Rio Tinto Aluminium participated in the Minding the Carbon Store project and, through it, will generate carbon credits for up to one million tonnes of greenhouse gas emissions. This represents about ten per cent ofRio Tinto Aluminium’s total emissions, including the emissions from purchased electricity and forms part of Rio Tinto Aluminium’s climate change strategy.
Rio Tinto Aluminium continued to invest in the development of drained cathode cell technology in 2006. Thisnew smelter technology has the potential to save ten to 15 per cent of the electricity currently used at Rio Tinto Aluminium smelters. Rio Tinto Aluminium Technology is currently undertaking a demonstration project of the new technology at Bell Bay.
| Rio Tinto 2006 Form 20-F | 55 |
Back to Contents
Rio Tinto Aluminium is exploring opportunities for developing its smelting business. In addition to work being undertaken in the Middle East, it has expressed a strong interest to the Sarawak state and federal governments inMalaysia to build an aluminium smelter based on hydro electricity.
2006 operating performance
Rio Tinto Aluminium’s share of aluminium production from its four smelters, at 845,000 tonnes, was slightly below2005 production levels because of reduced hydro-electricity generation in New Zealand after low inflows. Attributable metal shipments for 2006 were 850,000 tonnes, a decrease of 9,000 tonnes. They went primarily to Japan, Korea, Australia, South East Asia and Europe.
Rio Tinto Aluminium smelters continued to produce at or close to capacity in 2006. Production at Bell Bay,Anglesey Aluminium and Boyne Smelters was consistent with 2005 levels.
Projects
Weipa(Rio Tinto: 100 per cent)
In 2006, Rio Tinto Aluminium commissioned a new US$40 million 26 megawatt power station. The new power station services the mining operation and surrounding communities. A US$60 million second shiploader was commissioned in the fourth quarter to ensure reliability of bauxite supply to customers.
To meet the needs of increased trade of bauxite and alumina, Rio Tinto Marine committed US$120 million to the purchase of three new post Panamax bulk ore carriers to be used primarily on the Weipa to Gladstone run. The first ship will be delivered in the third quarter of 2007.
Yarwun(Rio Tinto: 100 per cent)
Rio Tinto Aluminium continues to study the expansion of the Yarwun alumina refinery, formerly Comalco AluminaRefinery, in Gladstone to meet the growing needs of its own smelters and to supply growing demand, particularly from China and the Middle East.
Abu Dhabi aluminium smelter(Rio Tinto: 50 per cent)
In 2006, Rio Tinto Aluminium signed a preliminary agreement with General Holding Corporation of Abu Dhabi to undertake a feasibility study into construction of an aluminium smelter in the United Arab Emirates.
Development could result in a smelter with a first stage production capacity of 550,000 tonnes of metal per year.A company, Abu Dhabi Aluminium Company (Adalco) has been formed to manage the joint venture. With its abundant gas resources, the Middle East is fast becoming a key region in the global aluminium industry.
| Rio Tinto 2006 Form 20-F | 56 |
Back to Contents
COPPER GROUP
| Mined | Rio Tinto share | |
| Copper | ‘000 tonnes | |
|
| |
| 2002 | 887 | |
| 2003 | 867 | |
| 2004 | 753 | |
| 2005 | 784 | |
| 2006 | 803 | |
|
| |
| | | |
| Gold | ‘000 ounces | |
|
| |
| 2002 | 3,135 | |
| 2003 | 2,731 | |
| 2004 | 1,552 | |
| 2005 | 1,726 | |
| 2006 | 1,003 | |
|
| |
| | |
| Refined | Rio Tinto share | |
| Copper | ‘000 tonnes | |
|
| |
| 2002 | 417 | |
| 2003 | 349 | |
| 2004 | 333 | |
| 2005 | 314 | |
| 2006 | 299 | |
|
| |
| | | |
| Underlying earnings contribution* | US$m | |
|
| |
| 2004 | 860 | |
| 2005 | 2,020 | |
| 2006 | 3,562 | |
|
| |
| | | |
| Changes in underlying earnings 2004 - 2006 | US$m | |
|
| |
| 2004 Underlying earnings | 860 | |
| Effect of changes in: | | |
| Prices and exchange rates | 629 | |
| General inflation | (26 | ) |
| Volumes | 696 | |
| Costs | (130 | ) |
| Tax and other | (9 | ) |
|
| |
| 2005 Underlying earnings | 2,020 | |
| Effect of changes in: | | |
| Prices and exchange rates | 1,707 | |
| General inflation | (28 | ) |
| Volumes | (179 | ) |
| Costs | (205 | ) |
| Tax and other | 247 | |
|
| |
| 2006 Underlying earnings | 3,562 | |
|
| |
| * | A reconciliation of the net earnings with underlying earnings for 2004, 2005 and 2006 as determined under EU IFRS is set out on page 39. |
Rio Tinto’s Copper group comprises Kennecott Utah Copper in the US and interests in the copper mines of Escondida in Chile, Grasberg in Indonesia, Northparkes in Australia, Palabora in South Africa, and the Resolution Copper project in the US. The group also has management responsibility for Kennecott Minerals Company in the US. Since the beginning of 2006, the group acquired the La Granja project in Peru and took an ownership stake in Ivanhoe Mines and Northern Dynasty Minerals which have the Oyu Tolgoi and Pebble deposits in Mongolia and the US respectively.
Historically, the Copper group built the majority of its portfolio through acquisitions (Kennecott) or jointventures (Escondida, Grasberg) followed by expansions. The current pipeline of projects (Oyu Tolgoi, Resolution, La Granja and Pebble) represents a transition with a greater proportion of opportunities created through exploration and acquisitions at an early stage of development. In addition to the Copper group’s interests in these four world class deposits, the group is developing the E48 underground deposit at Northparkes and undertaking a prefeasibility study at Kennecott Utah Copper to extend the mine’s life, either through a further pushback of the open pit or a transition to underground mining.
The Copper group’s long term development plans are not just confined to its principal product. Rio Tinto has a number of nickel development opportunities which are currently being evaluated. At the small, high grade Eagle nickeldeposit (Rio Tinto: 100 per cent) in Michigan in the US, feasibility studies have been undertaken and a decision on developing the deposit is expected in 2007.
At 31 December 2006, the Copper group, which also produces gold and molybdenum as significant coproducts,
| Rio Tinto 2006 Form 20-F | 57 |
Back to Contents
accounted for 16 per cent of the Group’s operating assets and in 2006 contributed approximately 28 per cent of Rio Tinto’s gross sales revenue, of which 74 per cent was from copper, 13 per cent from molybdenum and the remainder mostly from gold. It accounted for 49 per cent of underlying earnings in 2006.
Bret Clayton succeeded Tom Albanese as chief executive Copper, and is based in London.
Financial performance
2006 compared with 2005
The Copper group’s contribution to underlying earnings was US$3,562 million, US$1,542 million higher than in 2005.The average price of copper was 306 US cents per pound during 2006, 84 per cent higher than in 2005. The average gold price of US$602 per ounce increased by 36 per cent. The average price of molybdenum was US$24.60 per pound compared with US$30.70 per pound in 2005.
Kennecott Utah Copper’s contribution to underlying earnings of US$1,804 million was US$767 million higher than in 2005, with the operation benefiting from higher prices and volumes and a tax credit of US$289 million following recognition of deferred tax assets. Record molybdenum production was achieved during the year, offsetting the impact of lower refined copper production due to a scheduled smelter shutdown in the second half of 2006. An increase in the group’s long term copper price assumption triggered an assessment of the amount of recoverable copper at Kennecott Utah Copper. As a result, the impairment made in 2001 and 2002 was reversed in 2006.
Rio Tinto’s share of underlying earnings from Escondida increased by US$648 million to US$1,250 million. Higher prices and the commencement of sulphide leaching counterbalanced higher mining costs and input prices.
The Grasberg joint venture contributed US$122 million to underlying earnings, US$110 million below 2005. Lower grades of copper, gold and silver, the result of mine sequencing, led to significantly lower production of all three metals.
Palabora’s 2006 earnings of US$52 million were US$33 million above the prior year, benefiting from higher copper prices and sales volumes and the sale of some smelter stocks.
Northparkes’ contribution to underlying earnings of US$229 million represents a US$172 million increase from 2005. In addition to higher prices, better grades, increased throughput and improved recoveries all contributed to a 54per cent increase in production of copper contained in concentrates.
Kennecott Minerals’ 2006 earnings of US$105 million were US$32 million above 2005. The effect of higher gold and zinc prices and the recognition of a US$14 million deferred tax asset were offs et by higher costs and lowersales volumes from Cortez, due to lower grades.
2005 compared with 2004
The Copper group’s contribution to underlying earnings was US$2,020 million, US$1,160 million higher than in 2004. The average price of copper was 166 US cents per pound compared with 130 US cents in 2004. The average price ofmolybdenum was US$30.70 per pound compared with US$14.60 in 2004. The average gold price of US$444 per ounce increased by nine per cent.
Kennecott Utah Copper’s contribution to underlying earnings was US$1,037 million, compared with US$311million in 2004. Molybdenum production increased significantly as a result of the refocusing of the mine plan in response to significantly higher molybdenum prices.
Rio Tinto’s share of underlying earnings from Escondida increased by US$196 million to US$602 million.Mined production of copper was up five per cent.
The underlying earnings contribution from the Grasberg joint venture increased by US$200 million to US$232 million chiefly as a result of the continuation of full production after the material slippage in October 2003.
Palabora recorded a profit of US$19 million in 2005, helped by improved performance of undergroundproduction. Northparkes’ copper production was 80 per cent above the previous year due to the successful ramp up of Lift 2. Kennecott Minerals lower sales volumes were due to lower grades at Cortez.
Operations
Kennecott Utah Copper(Rio Tinto: 100 per cent)
Kennecott Utah Copper (KUC) operates the Bingham Canyon mine, Copperton concentrator and Garfield smelter andrefinery complex, near Salt Lake City, US. KUC is a polymetallic mine, producing copper, gold, molybdenum and silver. As the second largest copper producer in the US, KUC supplies more than 17 per cent of the nation’s annual refined copper requirements and it employs approximately 1,700 people.
2006 operating performance
KUC continued to demonstrate operating flexibility by delivering record molybdenum production during a period ofexceptionally high prices. Employing Rio Tinto’sImproving performance together(IPT) methodology, KUC substantially improved its knowledge of molybdenum mineralisation in the orebody to optimise molybdenumproduction, which was eight per cent higher than 2005.
In July, a pebble crushing facility was commissioned at the concentrator. Final modifications to this circuit will
| Rio Tinto 2006 Form 20-F | 58 |
Back to Contents
be completed in 2007, leading to a projected increase in plant throughput of approximately 18 per cent. A capital investment of US$82 million was approved in October, to expand and modernise the bulk flotation circuit at theconcentrator. This project is expected to increase recoveries of copper, molybdenum and gold and improve concentrategrade, thereby benefiting smelter throughput rates. The scheduled completion of this pr oject is mid 2008 with full production benefits realised by 2009.
The Garfield smelter was shut down in September for planned maintenance work and was re-commissioned inearly November. The interruption reduced refined copper production by six per cent, compared with 2005. Smelter throughput rates following the shutdown are exceeding initial expectations.
Current ore reserves will support open pit operations until 2019. Prefeasibility studies continued during the yearto evaluate alternatives for extending the mine’s life beyond 2019. The alternatives include additional open pit pushbacks and/or underground mining options. KUC intends to dewater and rehabilitate an existing mine shaft in 2007to provide access for an underground drilling programme to augment these studies.
Principal operating statistics at KUC 2004-2006
| | 2004 | | 2005 | | 2006 | |
|
|
|
|
|
| |
| Rock mined (’000 tonnes) | 129,196 | | 140,906 | | 145,343 | |
| Ore milled (’000 tonnes) | 45,712 | | 46,664 | | 47,857 | |
| Head grades: | | | | | | |
| Copper (%) | 0.63 | | 0.53 | | 0.63 | |
| Gold (g/t) | 0.29 | | 0.37 | | 0.49 | |
| Silver (g/t) | 3.04 | | 3.23 | | 3.50 | |
| Molybdenum (%) | 0.033 | | 0.058 | | 0.057 | |
| Copper concentrates produced (’000 tonnes) | 1,106 | | 881 | | 1,019 | |
| Production of metals in copper concentrates | | | | | | |
| Copper (’000 tonnes) | 263.7 | | 220.6 | | 265.6 | |
| Gold (’000 ounces) | 308 | | 401 | | 523 | |
| Silver (’000 ounces) | 3,584 | | 3,958 | | 4,214 | |
| Molybdenum concentrates produced (’000 tonnes) | 12.9 | | 29.5 | | 30.2 | |
| Contained molybdenum (’000 tonnes) | 6.8 | | 15.6 | | 16.8 | |
| Concentrate smelted on site (’000 tonnes) | 1,098 | | 1,042 | | 918 | |
| Production of refined metals | | | | | | |
| Copper (’000 tonnes) | 246.7 | | 232.0 | | 217.9 | |
| Gold (’000 ounces) | 300 | | 369 | | 462 | |
| Silver (’000 ounces) | 3,344 | | 3,538 | | 4,152 | |
|
|
|
|
|
| |
Grasberg joint venture(Rio Tinto: 40 per cent)
Grasberg, in Papua, Indonesia, is one of the world’s largest copper and gold mines in terms of reserves and production.It is owned and operated by Freeport Indonesia (PTFI), the principal and 91 per cent owned subsidiary of the US based Freeport-McMoRan Copper & Gold Inc. (FCX).
In meeting the mine’s social obligations to local communities, at least one per cent of Grasberg’s net salesrevenues are committed to support village based programmes. In addition, two trust funds were established in 2001 in recognition of the traditional land rights of the local Amungme and Komoro tribes. In 2006, PTFI contributed US$43.9million (net of Rio Tinto portion) and Rio Tinto US$3.6 million in total to the funds.
As a result of training and educational programmes, Papuans represented more than a quarter of PTFI’s approximately 9,000 strong workforce by the end of 2006.
2006 operating performance
Rio Tinto’s share of metal production is dependent on the metal strip, which determines the allocation of volumesbetween the joint venture partners. Owing to lower grades, Rio Tinto’s share of production from the Grasberg mine wasconstrained in 2006 and owing to adjustments to the mine schedule, will continue to show significant variation year to year. After 2021, Rio Tinto shares 40 per cent of total production as the metal strip ceases.
PTFI, as manager, recently completed an analysis of its longer range mine plans to assess the optimal design of the Grasberg open pit and the timing of development of the Grasberg underground block cave ore body. The revisedlong range plan includes changes to the expected final Grasberg open pit design which will result in a section of highgrade ore previously expected to be mined in the open pit to be mined in the Grasberg underground block cave mine. The revised mine plan reflects a transition from the Grasberg open pit to the Grasberg underground block cave ore bodyin mid 2015. The mine plan revisions alter the timing of metal production in the period of 2015 and beyond but do nothave a significant effect on ultimate recoverable reserves.
| Rio Tinto 2006 Form 20-F | 59 |
Back to Contents
Principal operating statistics for PTFI 2004-2006
| | 2004 | | 2005 | | 2006 | |
|
|
|
|
|
| |
| Ore milled (’000 tonnes) | 67,750 | | 78,907 | | 83,716 | |
| Head grades: | | | | | | |
| Copper (%) | 0.87 | | 1.13 | | 0.85 | |
| Gold (g/t) | 0.88 | | 1.65 | | 0.85 | |
| Silver (g/t) | 3.85 | | 4.88 | | 3.84 | |
| Production of metals in concentrates | | | | | | |
| Copper (’000 tonnes) | 516.4 | | 793.9 | | 610.8 | |
| Gold (’000 ounces) | 1,584 | | 3,546 | | 1,880 | |
| Silver (’000 ounces) | 5,037 | | 7,531 | | 5,609 | |
|
|
|
|
|
| |
Escondida(Rio Tinto: 30 per cent)
The low cost Escondida copper mine in Chile is one of the largest copper mines in the world in terms of annualproduction, and has a mine life expected to exceed 30 years. It accounts for approximately eight per cent of worldprimary copper production. BHP Billiton owns 57.5 per cent of Escondida and is the operator and product sales agent.
The Escondida district hosts two of the largest porphyry copper deposit systems in the world – Escondida andEscondida Norte, located five kilometres from Escondida. A sulphide leach project was complete d during the year withthe first cathode being produced in June. During August, operations were affected by strike action over wage negotiations. Operations resumed in September after a new three year contract was settled.
Escondida employs approximately 2,900 people.
2006 operating performance
Escondida’s mined copper production was three per cent higher than in 2005, with higher grades and the commencement of sulphide leaching more than offsetting the effects of the strike action. Cathode production was seven per cent lower than in 2005 due to lower grade oxide ore.
Principal operating statistics at Escondida 2004-2006
| | 2004 | | 2005 | | 2006 | |
|
|
|
|
|
| |
| Rock mined (’000 tonnes) | 377,356 | | 359,569 | | 338,583 | |
| Ore milled (’000 tonnes) | 82,378 | | 86,054 | | 84,158 | |
| Head grade: | | | | | | |
| Copper (%) | 1.51 | | 1.53 | | 1.59 | |
| Production of metals in concentrates | | | | | | |
| Copper (’000 tonnes) | 1,046 | | 1,127 | | 1,122 | |
| Gold (’000 ounces) | 217 | | 183 | | 170 | |
| Silver (’000 ounces) | 5,747 | | 6,565 | | 6,646 | |
| Copper cathode (’000 tonnes) | 152.1 | | 143.9 | | 134.4 | |
|
|
|
|
|
| |
Palabora(Rio Tinto: 57.7 per cent)
Palabora Mining Company (Palabora) is a publicly listed company on the Johannesburg Stock Exchange and operates a mine and smelter complex in South Africa.
Palabora developed a US$465 million underground mine with a current planned production rate of at least32,000 tonnes of ore per day. Approximately 663,500 tonnes of copper are expected to be produced over the remaining life of the mine.
Palabora supplies most of South Africa’s copper needs and exports the balance. It employs approximately 2,000people and labour agreements are negotiated annually.
2006 operating performance
Palabora recorded a net profit of US$52 million in 2006, US$33 million higher than 2005. Underground production for the year averaged 30,200 tonnes per day, which is ten per cent higher than 2005.
Production rates peaked in the last week of December at 36,562 tonnes per day. The average annual production fell short of the planned target of 32,000 tonnes per day as a result of breakdown and maintenance problems. Theaverage ore grade was 0.71 per cent compared with 0.72 per cent in 2005.
During the first quarter of 2006, Palabora’s reverberatory furnace, which has been in operation for over 40 years, was subjected to its eighth rebuild, the last having occurred in 2000. A ten per cent increase in capacity is expected from the rebuild, taking the overall operational capacity to 110,000 tonnes per annum.
As part of the decision to build the magnetite business using current production, Palabora entered into a supply contract with Minmetals for the supply of two million tonnes of magnetite concentrate per annum starting in October2006.
As a result of mine production shortfalls and lower grades, concentrate production was supplemented by purchases of concentrate material to optimise smelter throughput. Palabora will continue to purchase concentrates to
| Rio Tinto 2006 Form 20-F | 60 |
Back to Contents
supplement the smelter as capacity exceeds the mine output.
Vermiculite revenue of US$40 million increased by five per cent on 2005. Production in 2006 was down by sixper cent compared with 2005, and the strong market demand for the coarser grades continuesto exceed production in all market segments.
Palabora’s lending facilities and hedge contracts, which were finalised in September 2005 as part of a refinancingproject, were closely monitored during 2006. Forward pricing contracts, representing 62.5 per cent of the budgetedunderground production up to 2008, and 30 per cent up to 2013, are in place.
Principal operating statistics at Palabora 2004-2006
| | 2004 | | 2005 | | 2006 | |
|
|
|
|
|
| |
| Ore milled (’000 tonnes) | 8,657 | | 9,536 | | 10,730 | |
| Head grade: | | | | | | |
| Copper (%) | 0.74 | | 0.72 | | 0.71 | |
| Copper concentrates produced (’000 tonnes) | 187.7 | | 197.1 | | 208.9 | |
| Contained copper (’000 tonnes) | 54.4 | | 61.2 | | 61.5 | |
| New concentrates smelted on site (’000 tonnes) | 253.4 | | 304.4 | | 288.5 | |
| Refined copper produced (’000 tonnes) | 67.5 | | 80.3 | | 81.2 | |
|
|
|
|
|
| |
Northparkes(Rio Tinto: 80 per cent)
Rio Tinto’s interest in the Northparkes copper-gold mine in central New South Wales, Australia, resulted from the acquisition of North Ltd. Northparkes is a joint venture with the Sumitomo Group (20 per cent).
Following an initial open pit operation at Northparkes, underground block cave mining has been undertaken since 1997. In November 2006, the joint venture partners approved the development of the E48 block cave project, which is expected to cost US$160 million (Rio Tinto share: US$127 million) and extend the mine’s life until 2016. The project is a state of the art development incorporating experience and know how from the previous two block cave projects. The E48 block cave will progressively replace the current block cave from 2009, and output from E48 will beprocessed in the existing concentrator and transported by rail to Port Kembla for export.
The copper concentrate produced is shipped under long term contracts that provide for periodic negotiation ofcertain charges, as well as spot sales, to smelters in Japan (74 per cent), China (13 per cent), and India (13 per cent).Northparkes employs approximately 220 people.
2006 operating performance
Northparkes achieved a solid performance during 2006, with production of concentrate up 40 per cent from 2005 due to increased grades, milling rates and recoveries.
Principal operating statistics at Northparkes 2004-2006
| | 2004 | | 2005 | | 2006 | |
|
|
|
|
|
| |
| Ore milled (’000 tonnes) | 5,008 | | 5,453 | | 5,789 | |
| Head grade: | | | | | | |
| Copper (%) | 0.79 | | 1.12 | | 1.53 | |
| Gold (g/t) | 0.66 | | 0.46 | | 0.64 | |
| Production of contained metals | | | | | | |
| Copper (’000 tonnes) | 30.0 | | 54.0 | | 83.3 | |
| Gold (’000 ounces) | 79.4 | | 57.0 | | 94.7 | |
|
|
|
|
|
| |
Kennecott Minerals(Rio Tinto: 100 per cent)
Kennecott Minerals in the US manages the Greens Creek mine (Rio Tinto: 70 per cent) on Admiralty Island in Alaska which produces silver, zinc, lead and gold. The Rawhide mine (Rio Tinto: 51 per cent) in Nevada produces gold andsilver by leaching since mining operations ceased in 2002. Reclamation work is well advanced. Kennecott Minerals alsoowns the group’s interest in the Cortez joint venture (Rio Tinto: 40 per cent), also in Nevada.
Kennecott Minerals employs approximately 322 people, excluding employees of non managed operations.
2006 operating performance
Underlying earnings of US$105 million were US$32 million higher than 2005 underlying earnings, reflecting the strongprice environment for gold, silver, zinc and lead.
At Greens Creek, production was affected by a major rehabilitation programme at the mine. Mill throughput isexpected to increase in 2007 following the substantial completion of the project in 2006.
In 2006 there was a dramatic but expected decline in Cortez production due to the move into the final lower grade stages of the Pipeline orebody. While production is expected to increase in 2007, it will remain below the levelsexperienced when mining the best Pipeline ore zones. Production is expected to increase in 2009 when production fromCortez Hills is planned to commence.
| Rio Tinto 2006 Form 20-F | 61 |
Back to Contents
Projects
Resolution(Rio Tinto: 55 per cent)
The Resolution project is situated in Arizona, US, in the area of the depleted Magma (Superior) copper mine. The project team is currently working through a prefeasibility study, including a proposed land exchange, an environmental impact study, further deposit definition drilling and the sinking of two shafts to gain access to the mineralisation. Expenditure to the end of feasibility in 2011, if approved, is expected to be approximately US$700 million, with total capital to initiate production forecast to be about US$2.5 billion. While there are technical challenges with regard to depth and rock temperature, we believe that Resolution could become a leading global copper producer over several decades.
The Act supporting a land exchange programme was introduced in the Senate and House of Representatives during 2006, but the timing did not allow the Act to progress to point of Presidential signature. It will be re-introduced in both Houses in early 2007.
Oyu Tolgoi(Rio Tinto: 9.9 per cent stake in Ivanhoe Mines)
Rio Tinto acquired a 9.9 per cent holding of Ivanhoe Mines in order to jointly develop and operate Ivanhoe’s Oyu Tolgoi copper-gold complex in Mongolia’s South Gobi region. A joint Ivanhoe-Rio Tinto technical committee will engineer, construct and operate the project.
Subject to reaching a satisfactory long term investment agreement with the Mongolian government, an open pit mine is expected to be in operation by the end of the decade followed by an underground mine several years later. Rio Tinto’s holding in Ivanhoe Mines is expected to rise to 19.9 per cent upon completion of the long term investment agreement. The Group has an option to increase its stake in due course to 33.35 per cent, and potentially take it up to 40 per cent via open market transactions.
As part of the investment arrangements, Ivanhoe Mines has agreed with Rio Tinto to divest its joint venture interest in the Myanmar Copper Project located in the Union of Myanmar, together with any other rights, interests orinvestments relating to the country. Pending their sale, the Myanmar based assets have, in accordance with the terms of the agreement between Rio Tinto and Ivanhoe Mines, been transferred to an independent third party trust, the solepurpose of which is to sell the assets. Ivanhoe Mines has no interest in the trust, other than as an unsecured creditorunder a promissory note issued by trust on the transfer of the Myanmar based assets (which is to be repaid once the assets are sold).
La Granja(Rio Tinto: 100 per cent)
Rio Tinto won the state privatisation tender for the La Granja copper project, located in the Cajamarca region of northern Peru. The bid comprised staged payments to the Peruvian government of US$22 million and US$60 million ininvestment in exploration and feasibility work. In late 2006, Rio Tinto approved expenditure up to US$95 million, mostof which is expected to be spent over 2007–2009. The La Granja project is technically challenging and has modest copper grades. However, the deposit contains significant mineralisation of more than two billion tonnes.
Instead of looking at La Granja as a conventional milling operation producing concentrates for export, theprefeasibility study is aimed at demonstrating the possibility of recovering copper metal using bioleaching and electrowinning.
Pebble(Rio Tinto: 19.8 per cent stake in Northern Dynasty Minerals)
Rio Tinto acquired a 9.9 per cent interest in Northern Dynasty Minerals during the year and increased its interest to 19.8per cent during February 2007. Northern Dynasty Minerals is advancing the Pebble copper-gold-molybdenum deposit in southwestern Alaska, which is another world class ore body that is amenable to block caving.
Cortez Hills(Rio Tinto: 40 per cent)
Rio Tinto holds a 40 per cent interest in the Cortez joint venture, with Barrick Gold managing the joint venture and holding the remaining 60 per cent interest. The operation is located in north-eastern Nevada, US, and contains total proven and probable reserves of 7.5 million ounces; this includes the Cortez Hills deposit discovered in 2003.
Eagle(Rio Tinto: 100 per cent)
The Eagle project is a high grade nickel deposit located in Michigan, US. Kennecott Minerals has carried out a project feasibility study. Permitting approvals are under way while exploration continues in the area around Eagle and thewider district. A decision on developing the deposit is expected in 2007.
| Rio Tinto 2006 Form 20-F | 62 |
Back to Contents
DIAMONDS GROUP
| Mined | Rio Tinto share | |
| Diamonds | ‘000 carats | |
|
| |
| 2002 | 33,620 | |
| 2003 | 33,272 | |
| 2004 | 25,502 | |
| 2005 | 35,635 | |
| 2006 | 35,162 | |
|
| |
| Underlying earnings contribution* | US$m | |
|
| |
| 2004 | 188 | |
| 2005 | 281 | |
| 2006 | 205 | |
|
| |
| Changes in underlying earnings 2004 - 2006 | US$m | |
|
| |
| 2004 Underlying earnings | 188 | |
| Effect of changes in: | | |
| Prices and exchange rates | 46 | |
| General inflation | (5 | ) |
| Volumes | 89 | |
| Costs | (18 | ) |
| Tax and other | (19 | ) |
|
| |
| 2005 Underlying earnings | 281 | |
| Effect of changes in: | | |
| Prices and exchange rates | 12 | |
| General inflation | (8 | ) |
| Volumes | (100 | ) |
| Costs | (10 | ) |
| Tax and other | 30 | |
|
| |
| 2006 Underlying earnings | 205 | |
|
| |
| * | A reconciliation of the net earnings with underlying earnings for 2004, 2005 and 2006 as determined under EU IFRS is set out on page 39 |
The Diamonds group comprises Rio Tinto’s 60 per cent interest in the Diavik Diamonds mine located in the Northwest Territories of Canada, the wholly owned Argyle mine in Western Australia, Rio Tinto’s 78 per cent interest in theMurowa mine in Zimbabwe and diamond sales and representative offices in Antwerp, Belgium, and Mumbai, India. It also includes new teams established in 2006 with responsibility for business development, product security and thedevelopment and transfer of best practice across the group.
The group has enjoyed strong growth over the past five years as Diavik has been brought to full production and Murowa has been added to the portfolio and as the Argyle product has benefited from improved pricing. Over the pastfive years, sales revenues and underlying earnings have tripled. This has positioned Diamonds as a strong contributor toRio Tinto overall.
Within the industry, the Diamond group is well positioned as a leading supplier to the market, with a clear focuson the upstream portion of the value chain. Rio Tinto’s exploration programme has been successful in discovering new assets for Diamonds to develop, and a differentiated approach to marketing has enabled the capture of higher prices. The group’s strategy is to compete in the diamond business and strive to build further value. The focus is on the mining,recovery and sale of rough diamonds. In keeping with Rio Tinto’s values, the Diamonds group is a leading proponent ofa number of programmes and partnerships that help improve social and environmental standards of partners, suppliers and customers.
Rio Tinto sells diamonds from all three operations through its marketing arm, Rio Tinto Diamonds, according toa strict chain of custody process, ensuring all products are segregated according to mine source.
At the end of 2006 Diamonds employed 1,500 people and had 930 contractors.
The Diamonds group was combined with the Industrial minerals group with effect from 1 June 2007, to form theDiamonds and Minerals group. Keith Johnson, based in London, who had been chief executive Diamonds, became Group executive Business Resources; and, Andrew Mackenzie, based in London, became chief executive Diamondsand Minerals.
Financial performance
2006 compared with 2005
Diamonds contributed US$205 million to Rio Tinto’s underlying earnings in 2006, a decrease of US$76 million from 2005. Sales revenue for 2006 was US$838 million, US$238 million lower than in 2005. The lower earnings and sales revenue arose mainly from a downturn in the rough diamond market in the second half of 2006. This resulted in lower
| Rio Tinto 2006 Form 20-F | 63 |
Back to Contents
prices for most product types, with Rio Tinto Diamonds stocking some lower priced product, which will be sold in future periods.
Diamond production remained at similar levels to 2005 across all operations. Argyle produced 29.1 millioncarats in 2006, approximately 1.4 million carats less than in 2005. This was in line with expectations of a decreasing diamond production profile as the open pit winds down and underground production ramps up over the next five years. Diavik produced 5.9 million carats in 2006, 0.9 million carats more than in 2005. Murowa produced 0.2 million carats in 2006, slightly less than in 2005.
The rough diamond market started strong in the first half of 2006 but deteriorated into the second half. Year endprices closed at similar levels to the start of 2006. A number of factors influenced this mid year correction including a congested processing pipeline, tight liquidity in the manufacturing sector and extensive flooding in India’s major cutting centre, Surat, which forced the shutdown of many cutting and manufacturing centres for several weeks.
Polished diamond prices remained constant through 2006 with reasonable demand experienced for most products, particularly for larger better quality white diamonds.
2005 compared with 2004
Diamonds contributed US$281million to underlying earnings, an increase of US$93 million from 2004, assisted by astrong diamond market and the solid performance by Argyle, Diavik and Murowa.
The rough diamond market remained strong for most of 2005 with the Rio Tinto product offering in great demand. Seasonal softening toward the end of the year was mainly due to holidays and festivals in the key customermarkets.
Prices for polished diamonds increased in 2005, with the majority of gains made in the first half of the year. Strongest demand was seen in the product types in shortest supply. This included large diamonds greater than two caratsin size with better colour and quality, and the smaller diamond segments.
Operations
Argyle Diamonds(Rio Tinto: 100 per cent)
Rio Tinto owns and operates the Argyle diamond mine in Western Australia. Production from Argyle’s AK1 open pit mine is expected to continue until 2012. From 2009 the mine is expected to gradually transition to underground operations which would extend the life of the mine to about 2018.
2006 operating performance
Despite tight mining conditions in the deepening and geotechnically challenging open pit, the operation maintainedproduction and plant throughput in 2006, producing 29.1 million carats in 2006 compared with 30.5 million carats in 2005.
Commencing in 2006, underground safety performance was separated from that of the open pit section. Althoughthe aggregate 2006 safety performance was only slightly better than in 2005, the open pit operation achieved exceptional performance with lost time injury frequency rate down by over 300 per cent.
Argyle celebrated the signing of a Participation Agreement with neighbouring communities in June 2005 and hasspent the last 18 months implementing the terms of the agreement.
Diavik Diamonds(Rio Tinto: 60 per cent)
Construction of Diavik was completed in 2003 with production first commencing in January 2003. Since then the project has exceeded expectations and is now focused on further improving value recovery and business excellence, and planning for the integration of the A418 open pit.
Safety performance in 2006 was considerably better than 2005, with the lost time injury frequency rate down byalmost half and the all injury rate down by a third.
In 2006 total cumulative spending since 2000 on local purchasing with northern Aboriginal businesses surpassed the C$1 billion mark.
2006 operating performance
Diavik produced more carats in 2006 than in any other previous year, thanks to higher ore grade, excellent operationalperformance throughout the year and ore blending strategies employed to maximise process plant throughput.
This was achieved during a massive winter road recovery operation. Freight and construction materials scheduledfor trucking to the mine up the 2006 winter road could not be transported on surface due to a shorter season of cold winter conditions necessary for maintenance of the ice road. The recovery operation included the air lifting of fuel, bentonite, explosives and consumables to site.
Open pit mining is expected to be predominantly from A154 in 2007 with some A418 open pit ore commencing in 2008.
| Rio Tinto 2006Form 20-F | 64 |
Back to Contents
Murowa(Rio Tinto: 77.8 per cent)
Production at Murowa commenced in late 2004 after US$11 million was spent on constructing a 200,000 tonnes per year plant and supporting infrastructure. Chain of custody safeguards put in place at the commencement of production have performed without incident.
Murowa’s 2006 safety performance was exceptional with no lost time injuries reported in 2006 and the all injuryfrequency rate down by more than 80 per cent.
2006 operating performance
A start was made on upgrading the 200,000 tonnes per year processing plant to increase throughput, improve recoveriesand protect against power outages. The modification was completed during April 2007 and is expected to give Murowa several more years of operation. Worsening power outages are impacting production and this situation is not expected to improve until August 2007 when a new generator is expected to be operational.
Projects
Argyle(Rio Tinto: 100 per cent)
Rio Tinto approved the development of an underground block cave mine under the AK1 open pit in late 2005. It also approved an open pit cutback on the Northern Bowl to facilitate the transition from open pit to underground mining. The capital cost of the underground mine is expected to be US$760 million, and the cutback US$150 million.
Construction started in February 2006. By the end of 2006, 10,600 metres of underground development in four main access declines had been completed. In late 2006 the first of the underground declines reached the required depthfor ore extraction. The underground block cave undercut is expected to be initiated on schedule in 2008.
Diavik(Rio Tinto: 60 per cent)
In late 2004 the joint venture approved a study of the feasibility of underground mining of the A154N, A154S and A418 kimberlites. This study includes the development of a 3.3 kilometre exploratory decline, at an estimated cost of US$75 million.
In 2006 a three phase underground development funding model, totalling some US$265 million, was approved. If underground mining is given the go ahead, the first ore is planned to be extracted in 2008.
Meanwhile, a US$190 million project, involving the construction of a dyke round the A418 kimberlite to allow open pit mining beneath the lake bed, is well advanced. The construction and dewatering of the dyke was completed in2006 and pre-stripping began in December. The A418 ore is softer than that of the A154 pipes and will allow ore blending strategies to maintain the high process plant throughput achieved in 2006. The first ore from the A418 open pit is scheduled to be mined in late 2007 and will continue through to 2012.
About two kilometres south of the A154 pipes, under the waters of Lac de Gras, is the A21 kimberlite pipe. It does not currently form part of the Diavik ore reserve or mine plan as little is known about the value of the diamonds it holds. A feasibility study into open pit mining, which includes the development of an exploratory decline, is now in hand. At the end of 2006, the decline had reached the kimberlite, and bulksampling results are expected in the first quarter of 2007. The study is scheduled for completion in 2007, at which time it will be decided whether the A21 kimberlite should be included in reserves, but ore extraction would not start until 2012.
Murowa(Rio Tinto: 77.8 per cent)
Murowa commenced studies in mid 2006 to determine whether to expand the mine.
| Rio Tinto 2006Form 20-F | 65 |
Back to Contents
OTHER OPERATIONS
Kennecott Land(Rio Tinto: 100 per cent)
Kennecott Land was established in 2001 to capture value from the non mining land and water rights assets of Kennecott Utah Copper. Kennecott Land’s holdings are around 53 per cent of the remaining undeveloped land in Utah’s Salt Lake Valley. Approximately 16,000 hectares of the 37,200 hectares owned is developable land and is all within 20 miles (32km) of downtown Salt Lake City.
The initial Daybreak community encompasses 1,800 hectares and is entitled to develop nearly 14,000 residential units and nine million square feet of commercial space. Kennecott Land develops the required infrastructure and prepares the land for sale to home builders. The project is well advanced, with over 1,200 home sales completed since opening in June 2004. At full build out, the community will house 30,000 to 40,000 residents. Revenues in 2006 were US$60 million.
Kennecott Land is in the process of securing development rights from Salt Lake County for the remaining landholdings. Current development potential for this land is in excess of 150,000 residential units and 50 million square feet of commercial space. Securing entitlement is a long term public process that will culminate in a plan being submitted for approval by the Salt Lake County Council in the next one to two years.
Sari Gunay(Rio Tinto: 70 per cent)
Rio Tinto has carried out exploration and project evaluation in Iran since 2000. Preliminary results from the Sari Gunay gold project in Western Iran have indicated the potential for a medium sized low grade oxide resource. Following successful geostatistical and infill drilling programme in 2004, a feasibility study, including further evaluation drilling and metallurgical testwork, has been completed. Rio Tinto is currently evaluating its options for Sari Gunay.
MARKETING
Marketing and sales of the Group’s various metal and mineral products are handled either by the specific business concerned, or in some cases are undertaken at a product group level.
In 2006, Rio Tinto established a small central marketing team based in London to develop and share leading marketing practices across the Group. The team supports the Group’s businesses by helping to identify new ways of adding value in meeting customers’ needs.
Rio Tinto has numerous marketing channels, which include electronic market places, with differingcharacteristics and pricing mechanisms depending on the nature of the commodity and markets being served.
Rio Tinto’s businesses contract their metal and mineral production direct with end users under both short andlong term supply contracts. Long term contracts typically specify annual volume commitments and an agreed mechanism for determining prices at prevailing market prices. For example, businesses producing non ferrous metals and minerals reference their sales prices to the London Metal Exchange (LME) or other metal exchanges such as the Commodity Exchange Inc (Comex) in New York.
Ocean freight
Ocean freight has become an important part of Rio Tinto’s marketing. It is managed by Rio Tinto Marine, which isbased in Melbourne. In 2006, Rio Tinto Marine handled 70 million tonnes of dry bulk cargo, a significant increase on the 51 million tonnes transported in 2005.
Rio Tinto Marine leverages the Group’s substantial cargo base to obtain a low cost mix of short, medium andlong term freight cover. It seeks to create enterprise value from its freight by creating competitive advantage for the Group’s products rather than by trading freight.
Rio Tinto Marine sets and maintains the Group’s HSE and vessel assurance standards for freight and is one ofthree equal shareholders in Rightship, a ship vetting specialist, promoting safety and efficiency in the global maritime industry.
| Rio Tinto 2006Form 20-F | 66 |
Back to Contents
EXPLORATION GROUP
Rio Tinto Exploration seeks to discover or identify mineral deposits that will contribute to the growth of the Rio Tinto Group. The discovery of new deposits is essential to replace reserves as they are mined, to provide new opportunities for growth, and to help meet the increasing global demand for minerals and metals.
The Exploration group is opportunistic in approach and its resources are deployed on projects that show the best chance of delivering a world class deposit to Rio Tinto. Exploration maintains close dialogue with product groups toensure that strategies and project portfolios are closely aligned.
Mineral exploration is a high risk activity. Rio Tinto’s statistics show that an average of only one in 350 mineral prospects that are drill tested result in a mine for the Group. Rio Tinto believes in having a critical mass of projects,selected through a rigorous process of prioritisation.
The Exploration group is organised into five geographically-based teams in North America, South America, Australasia, Asia and Africa/Europe and a sixth project generation team that searches the world for new opportunitiesand provides specialised geological, geophysical and commercial expertise to the regional teams. The Asia team was formed in 2006, reflecting a significant expansion in exploration effort in Russia, Mongolia and the FSU. Industrial minerals exploration, previously a separate team, has been integrated into the regional teams and project generation.
At the end of 2006, Rio Tinto was exploring in over 35 countries for a broad range of commodities includingcopper, diamonds, nickel, industrial minerals, bauxite, uranium, iron ore and coal. Exploration employs about 180 geoscientists around the world and has a total complement of approximately 900 people.
Eric Finlayson was appointed head of Exploration, based in London, from January 2007, succeeding TomAlbanese, director, Group Resources, who became chief executive of Rio Tinto from May 2007.
Financial performance
2006 compared with 2005
Cash expenditure on exploration in 2006 was US$345 million, an increase of US$81 million over 2005, reflecting anincrease in contractor costs, the high quality of projects in the Exploration pipeline and acceleration of evaluation on significant projects. The pre-tax charge to underlying earnings was US$237 million, due to the sale of Ashton Mining of Canada shares and various other interests during 2006.
2005 compared with 2004
Cash expenditure on exploration in 2005 was US$264 million and the pre-tax charge to underlying earnings was US$250 million, a US$60 million increase over 2004, reflecting a further increase in iron ore exploration in Western Australia, the growth of high quality projects in the Exploration pipeline and acceleration of evaluation on significant projects by product groups during the year.
Operations
2006 operating performance
Since 2001 six projects have moved from Exploration to the next stage of project evaluation including Resolution (copper, US), Potasio Rio Colorado (potash, Argentina) and Simandou (iron ore, Guinea). Last year, five iron ore deposits in the Pilbara were transferred to the product group evaluation team.
Rio Tinto also conducts near mine exploration around a number of operations. Where additional mineralisationhas supplemented reserves or new mineralisation has been discovered this has been reported by the relevant product group.
Exploration in 2006 focused on advancing the most promising targets across the spectrum of grassroots and nearmine programmes. Encouraging results were obtained from a number of locations.
Order of magnitude studies are in progress at the Chapudi project (coal, South Africa) and the Bunder project(diamonds, India).
Negotiations continue on a Contract of Work for the La Sampala project (nickel, Indonesia) with the Government of Indonesia.
During 2007 projects in Mozambique and Serbia (industrial minerals), Brazil (bauxite), Colombia (coal), and theUS (coal and nickel) are expected to commence order of magnitude studies to assess their economic potential for advancement to pre-feasibility study.
Diamond exploration continues, focused in Canada, southern Africa, Mauritania, Brazil and India. Workcommenced in Mali. A number of kimberlite pipes were discovered and follow up test work is in progress to assess economic potential.
Copper exploration continued in Turkey, Kazakhstan, Peru, Chile, Argentina, Mexico and the US and in Russia under the RioNor joint venture with Norilsk Nickel. Drilling encountered significant copper mineralisation in Chile, Kazahkstan and the US, warranting further follow up drill testing.
Exploration focus on the bulk commodities, iron ore, coal and bauxite continued in 2006. Drilling progressed on bauxite projects in Brazil. Thermal and coking coal projects were drill tested in the US, Canada, southern Africa,
| Rio Tinto 2006Form 20-F | 67 |
Back to Contents
Colombia and Mongolia. Results in all countries are encouraging and work is continuing in 2007. Iron ore exploration continued in west Africa and further iron ore deposits in the Pilbara in Australia have been handed over to the iron ore product group in 2007.
Industrial minerals exploration was active in many parts of the world including southern Africa, Europe and South America. Following the successful tender for the Jarandol concession (borates, Serbia), drilling has commenced.
Brownfields exploration support continued at several Rio Tinto operations and product group projects, including Diavik, Argyle, Kennecott Utah Copper, Eagle, Energy Resources of Australia, La Granja, Pilbara Iron, Greens Creek and Rössing. Exploration also provided expertise to the brownfields programmes at the Grasberg and Cortez joint ventures.
In December the Exploration group’s ISO14001 environmental management system certification was extended to cover the new Asia region and the project generation team.
| Rio Tinto 2006Form 20-F | 68 |
Back to Contents
TECHNOLOGY AND INNOVATION
The Technology and Innovation group, formerly Operational and Technical Excellence, was formed during 2006 by bringing together the Technology group and the Group’sImproving performance togetherbusiness improvement workin the areas of mining, processing and asset management.
Technology and Innovation provides a central body of expertise for supporting the business units to embed operational best practice and is the vehicle through which technology innovations are driven and technical talent isdeveloped.
The group comprises a number of Centres of Excellence which drive sustainable performance in the areas of health, safety and environment, mining, processing, assets integrity, project development and evaluation, and strategicplanning. Key elements are standardisation of core processes to make them leading practice, the improvement ofanalytical tools, the introduction of common, transparent metrics and data to measure performance, and enhanced functional training and capability development of staff.
A further Centre of Excellence focuses on major innovation likely to be required to develop the orebodies of thefuture.
The total staff in Technology and Innovation at year end was 368, compared with 343 in 2005. The increase wasdue to the higher level of activity resulting from the current climate of growth in the industry.
In July 2006, Grant Thorne succeeded Ian Smith as global head of Technology and Innovation.
Operations
Health, Safety and Environment
The HSE Centre of Excellence ensures that strategies and standards are in place to minimise HSE risk and driveperformance. Activities support their implementation in the businesses and report results and performance trends to the board.
Specific activities during 2006 included the embedding of key environmental standards and metrics withinbusiness units, complementing the health and safety standards which place Rio Tinto as an industry leader in terms ofperformance in these areas, and completing development of the product stewardship strategy, which integrates product stewardship into business systems, securing both market access and competitive advantage.
Innovation
The Innovation Centre of Excellence is designed to drive step change innovation for Rio Tinto, focused on a five to tenyear timeframe. The main focus is on technologies applicable across the Group, particularly in mining, processing and energy.
Key innovation programmes were undertaken in underground and surface mining as well as processing. Specificactivities during 2006 focused on the block cave mining method, tunnel development and remote monitoring in underground mining, in pit material sizing and conveying, data fusion in surface mining, and process advances in oresorting and comminution.
Shared Expertise
Shared Expertise, a core group of technical professionals located across five global offices, provides a breadth ofexperience and a multi disciplinary approach in delivering projects to the business units across the Group. This team works in partnership with the operating sites to implement leading practice. It also provides technical support on an ongoing basis as required.
Mining and Processing
The Mining and Processing Centres of Excellence address the core mine production processes. Specific activities inthese areas during 2006 focused on continuing to establish and disseminate leading practice in orebody knowledge and value driven production planning across the operations.
Assets Integrity
The Assets Integrity Centre of Excellence develops world class asset management capabilities to create significant value for Rio Tinto. Activities for 2006 focused on the reliability and performance of physical assets across the Group, including the implementation of standards and internal league tables for maintenance of heavy mobile equipment such as trucks and shovels. This led to significant improvement in areas such as tyre life, truck utilisation and prolonging engine and component life.
Project Development and Evaluation
On 1 March 2007 the Projects Centre of Excellence and the Evaluation team were combined to form a new Centre for Excellence for Project Development and Evaluation (PDE). The principal accountabilities of PDE are to provideindependent advice to the capital appraisal and approval process, and on the adequacy of project submissions, fromprefeasibility studies through to execution and commissioning. It also conducts post investment reviews; and ensures that the substantial experience of the Group in project definition and delivery is reflected in future projects.
| Rio Tinto 2006 Form 20-F | 69 |
Back to Contents
Strategic Planning
The Strategic Planning Centre of Excellence focuses on three separate but related areas. These are value optimisation inthe strategic planning horizon, risk assessment and management, and business improvement, providing a centre forcoordinating leading practice for improvement methodologies across Rio Tinto.
Financial performance
2006 compared with 2005
The charge against net earnings for the group was US$50 million, compared with US$41 million in 2005. The increase was due to the greater level of activity, reflected also in the addition of staff.
2005 compared with 2004
The charge for the Technology group (including Health, Safety and Environment) against net earnings was US$41million, compared with US$35 million in 2004. The increase was due to the great er level of activity in all Technology group units.
| Rio Tinto 2006 Form 20-F | 70 |
Back to Contents
SOCIETY AND ENVIRONMENT
| Group employees | | | | | | |
| | | | | | | |
| Approximate average for the year | Subsidiaries and jointly | | Equity | | Total | |
| | controlled assets | | accounted units | | | |
|
|
|
|
|
| |
| 2002 | 29,000 | | 8,000 | | 37,000 | |
| 2003 | 29,000 | | 7,000 | | 36,000 | |
| 2004 | 28,000 | | 4,000 | | 32,000 | |
| 2005 | 28,000 | | 4,000 | | 32,000 | |
| 2006 | 31,000 | | 4,000 | | 35,000 | |
|
|
|
|
|
| |
| Principal employee locations 2006 | | | | | | |
|
|
|
|
|
| |
| Australia / New Zealand | | | | | 14,000 | |
| North America | | | | | 10,000 | |
| Africa | | | | | 5,000 | |
| Other | | | | | 6,000 | |
|
|
|
|
|
| |
| | | | | | 35,000 | |
|
|
|
|
|
| |
Rio Tinto is in business to create value by finding and developing world class mineral deposits and operating and eventually closing operations safely, responsibly and efficiently. To do so, the Group takes a disciplined and integrated approach to the economic, social and environmental aspects of all its activities.
The approach to achieving this is through implementation of the policies described inThe way we work, Rio Tinto’s statement of business practice, at all levels of the business.
The statement was published initially in January 1998 and revised in 2002 and 2003. It is now available in more than 20 languages. It is the result of wide internal consultation and discussion and represents shared values from around the Group.
The way we workcommits the Group to transparency consistent with normal commercial confidentiality,corporate accountability and the application of appropriate standards and internal controls. It sets the basis for how Group companies’ employees work and also provides guidance for joint venture partners and others. Every employee isresponsible for implementing the policies in the document.
Rio Tinto has adopted the Association of British Insurers’ 2003 disclosure guidelines on social responsibility in preparing this report. Details of the Group’s overall and individual businesses’ social and environmental performance continue to be published on the Rio Tinto website: www.riotinto.com and in theSustainable development review.
Board responsibilities
The directors of Rio Tinto, and of Group companies, are responsible for monitoring adherence to the Group policies outlined inThe way we work. Assurance for performance in these areas involves checking, reviewing and reportingeach business’s implementation of the policies, their compliance with regulations and voluntary commitments, and theeffectiveness of management and control systems, while also providing mechanisms for improvement.
As discussed in the section onCorporate governanceon page 122, the boards established a process foridentifying, evaluating and managing the significant risks faced by the Group. Directors meet regularly, have regular scheduled discussions on aspects of the Group’s strategy and full and timely access to the information required to discharge their responsibilities fully and effectively.
Rio Tinto’sCompliance guidancerequires that the identification of risk be systematic and ongoing. Itrecommends that each Group company undertakes a structured risk profiling exercise to identify, categorise and weigh the risks it faces in the conduct of its business. Each Group company puts systems in place to ensure that risks arereviewed at an appropriate frequency.
Total remuneration is related to performance through the use of annual bonuses, long term incentives and stretching targets for personal, financial and safety performance.
The board’sCommittee on social and environmental accountabilityreviews the effectiveness of policies andprocedures. The committee comprises four non executive directors. It meets four times annually with the chief executive and heads of Technology, Health, Safety and Environment (HSE), and Communications and ExternalRelations.
Reports for the committee summarise significant matters identified through Rio Tinto’s assurance activities.These include reviews every four years of each business to identify and manage strategic risks in relation to health,safety, and the environment; audits against Rio Tinto standards; risk reviews for specific concerns; procedures and systems for reporting critical and significant issues and incidents; completion of annual internal control questionnairesby all Group business leaders covering the full spectrum of business and operational risk; and findings andrecommendations of the independent external assurance and data verification programme. In 2006 a new Corporate Assurance function was established to integrate all assurance activities, including the assurance activities of InternalAudit, HSE, and Communities, into a single assurance process.
Policies, programmes and results
Implementation of the policies inThe way we workis discussed in the following sections according to each policy area.Known risks arising from social and environmental matters and their management in Group businesses is described in
| Rio Tinto 2006 Form 20-F | 71 |
Back to Contents
the relevant Group operations section.
In 2006 HSE developed an integrated HSE and Quality Management System. Implementation will commence in2007 and is mandatory for all managed businesses.
Safety
Rio Tinto believes that all injuries are preventable and its goal is zero injuries. Wherever we operate, we hold the healthand safety of our employees to be core values. This requires visible leadership and a culture of supportive workplacebehaviour, as well as clear standards, consistent implementation, and the transfer of best practice and improvement throughout the Group.
While in 2006 the safety record improved for the seventh consecutive year, there is still some way to go inachieving the goal of zero injuries. In 2006, very regrettably, three employees lost their lives at managed operations. The incidents have been investigated and actions taken to prevent recurrance. The Group has again demonstrated strong improvements in the year end lost time injury frequency rate (LTIFR) at 0.50 (2005: 0.56) and all injury frequency rate (AIFR) at 1.10 (2005: 1.35), reductions of 11 per cent and 18 per cent respectively. Rio Tinto set targets in 2003 for a 50 per cent reduction in LTIFR and AIFR by 2008 – in 2006 we were on trajectory to meet those targets.
Fines for infringement of safety regulations involved nine operations, totalling US$34,794 (2005: US$87,600).
Occupational health
Occupational health is a major priority. Rio Tinto is committed to ensuring the good health of its employees and contractors.
Our occupational health standards have now been implemented in 96 per cent of our businesses. In 2006 there were 32 new cases of occupational illness per 10,000 employees, a 40 per cent improvement compared with 54 in 2005. The Group has achieved a 69 per cent reduction in the rate of new cases of occupational illness since 2003.
The nature of occupational illnesses is changing and we have active programmes in place to manage the emerging issues of stress, fatigue, and age related illnesses such as heart disease and reduced physical capacity. In 2006 we also revised our HIV/AIDS strategy and, whereas in the past our efforts had been concentrated on southern Africa, today our approach is global.
In 2004, in order to focus attention on reducing noise induced hearing (NIHL) loss across the Group, a target wasset of a 20 per cent reduction in the rate of exposure (per 10,000 employees) to a noise environment of more than 85decibels (dB) between 2004 and 2008.
Implementation of the hearing conservation standard has increased the awareness of NIHL, resulting in anincreased baseline after 2004. The reported rate of exposure to more than 85 dB in 2006 was reduced by 1.0 per cent from 2004.
Fines for infringement of occupational health regulations in 2006 involved two operations, totalling US$3,000 (2005: US$58,100).
Environment
Respect for the environment is at the heart of Rio Tinto’s approach to sustainable development. Wherever possible Rio Tinto prevents, or otherwise minimises, mitigates and remediates, harmful effects of the Group’s operations on theenvironment. The strategic framework used to improve environmental performance provides a coherent way of assessing and addressing risks to the business.
We have devised and implemented a number of practical, core programmes covering the management of water, mineral and non mineral waste, air quality, product stewardship, land stewardship and biodiversity. These programmes involve input from our partners and local communities as well as from experts in these fields.
Rio Tinto believes that emissions of greenhouse gases (GHGs) from human activities are contributing to climatechange. Controlling GHG emissions is one of our biggest challenges, and the Group is working to reduce emissionsfrom its processes and in the use of its products. We have five year targets to reduce our GHG emissions by four per cent per tonne of product and improve our energy efficiency by five per cent per tonne of product by 2008, comparedwith a 2003 baseline.
In 2006, energy efficiency improved by 2.6 per cent compared with 2003, while GHG efficiency improved by 0.3 per cent. Both areas slipped from 2005 and remain below the trajectory needed to achieve the 2008 targets. Ouremissions efficiency result is affected by both production interruptions and changes in the emissions intensity of purchased electricity. The scheduled maintenance shutdown of the Kennecott Utah copper smelter significantlyimpacted our performance per unit. Without the smelter shutdown our performance would have been one per centbetter.
We continued to engage with governments and stakeholders who are also trying to find solutions to climatechange. In order to ensure that Group actions remain effective and that Rio Tinto maintains a leading position in thisarea, in 2006 Rio Tinto embarked on a new three year climate change plan. Changes in emission factors affected performance by a further 0.6 per cent.
The improvement in freshwater withdrawal efficiency, at 11.5 per cent compared with 2003, remained on track to achieve the 2008 target of ten per cent.
By the end of 2006, 96 per cent of operations had certified ISO 14001 or an equivalent environmental management system (EMS). There were eight significant environmental incidents in 2006, of which three were spills, compared with eight in 2005, of which two were spills. Fines for infringements of environmental regulations involved
| Rio Tinto 2006 Form 20-F | 72 |
Back to Contents
four operations and totalled US$56,799 (2005: US$67,900).
Land access
Rio Tinto manages 35,000 square kilometres of land, five per cent of which is disturbed for mining purposes. Rio Tintoseeks to ensure the widest possible support for its proposals throughout the life cycle of the Group’s activities by coordinating economic, technical, environmental and social factors in an integrated process.
This involves negotiation of mining access agreements with indigenous landowners; responsible landmanagement and rehabilitation; planning for closure; developing and implementing a biodiversity strategy; and forming strategic partnerships with external organisations.
Political involvement
Rio Tinto does not directly or indirectly participate in party politics nor make payments to political parties or individual politicians.
ABusiness integrity guidance, addressing bribery, corruption and political involvement, was issued in 2003 toassist managers in implementing this policy. The guidance covers questions relating to compliance and implementation; gifts and entertainment; the use of agents and intermediaries; and “facilitation” payments.
Rio Tinto avoids making facilitation payments anywhere in the world. Bribery in any form is prohibited. Giftsand entertainment are only offered or accepted for conventional social and business purposes and then only at a level appropriate to the circumstances.
Communities
Rio Tinto sets out to build enduring relationships with its neighbours that are characterised by mutual respect, activepartnership, and long term commitment.
Every business unit is required to have rolling five year community plans which are updated annually. In 2004, a series of pilot studies were completed aimed at achieving a deeper level of understanding of the linkages betweenmining activities and the economies in which they take place.
All Group businesses produce their own reports for their local communities and other audiences. Community assurance of the quality and content of these reports is increasing. This provides an opportunity for engagement with thecommunity on their views of programmes sponsored by the operations.
Businesses managed by Rio Tinto contributed US$96.4 million to community programmes in 2006 (2005: US$93.4 million) calculated on the basis of the London Benchmarking Group model. Of the total contributions, US$29.6 million was community investment and US$32.6 million in direct payments made under legislation or anagreement with a local community.
Human rights
Rio Tinto supports human rights consistent with the Universal Declaration of Human Rights and also respects thoserights in conducting the Group’s operations throughout the world.
Rio Tinto also supports the UN Secretary General’s Global Compact, the US/UK Voluntary Principles on Security and Human Rights and the Global Sullivan Principles.
Rio Tinto’sHuman rights guidanceis designed to assist managers in implementing the Group’s human rights policy in complex local situations. It was revised and republished in 2003. In 2004, a web based training module wasdeveloped to instruct managers on what the policy means in practice and how to respond to difficult situations.
Employment
Rio Tinto recognises that business performance is closely linked to effective people development. It has a long termplan to strengthen approaches to the training and development of leaders in the Group.
New talent is essential to our business and Rio Tinto provides attractive career opportunities for outstanding graduates across many disciplines. However, the recent rapid growth in demand for skilled recruits, coupled with areduced flow of qualified candidates from traditional schools, is making competition for human resources very intensewithin the mining industry. Making mining more attractive as a career is therefore crucial for our ability to access new people. We are committed to the training and development of our existing employees.
People development in Rio Tinto is focused on ensuring leadership and competence across the Group. In addition to a comprehensive and customised series of leadership development programmes from supervisor through to managing director, Rio Tinto is developing a series of functional development programmes for professionals and practitioners across the Group, such as mining, processing or marketing.
Beyond formal programmes we are also developing our own approach to coaching which will further strengthen our people development activities. This plus an increased focus on training and e-learning will be key to Rio Tinto’s people development strategy moving forward. Rio Tinto values diversity because we believe it confers a real business benefit. An international group like ours needs to be able to draw on the broad range of management experience andinsight that can only come from a team of men and women with a diversity of racial and cultural backgrounds.
In 2004, we focused on achieving specific diversity related targets important to the future of our organisation. While we continue to work towards these targets, these were reviewed and refined in 2006 to ensure their continuingalignment with our business objectives and needs. Diversity will continue to be an important people developmentagenda for the Group.
| Rio Tinto 2006 Form 20-F | 73 |
Back to Contents
Rio Tinto requires safe and effective working relationships in all its operations. Whilst respecting different cultures, traditions and employment practices, common goals are shared, in particular the elimination of workplaceinjuries, and commitment to good corporate values and ethical behaviour.
In 2005 and 2006, Group companies, mainly concentrated in Australia and North America, employed approximately 31,000 people and, together with Rio Tinto’s proportionate share of consolidated companies and equityaccounted units, the total was approximately 35,000 (2005: 32,000). Wages and salaries paid in 2006 excluding Rio Tinto’s proportionate share of consolidated companies and equity accounted units, totalled US$2.5 billion (2005: US$2.1 billion).
Retirement payments and benefits to dependants are provided in accordance with local conditions and good practice.
Rio Tinto encourages the involvement of its employees in the Group’s performance through their participation inan employee share scheme. As stated inThe way we work, the Group recognises the right of employees to choose whether or not they wish to be represented collectively.
Sustainable development
Rio Tinto has made a strategic commitment to sustainable development, in the belief that acting responsibly will resultin long term business benefits such as lowering risks, reducing costs, creating options, and leveraging reputation. It is corporate policy that Group businesses, projects, operations and products should contribute constructively to the global transition to sustainable development. Details of our policy, programmes and results are provided in ourSustainable development review, available on the website.
During the course of 2006, our Sustainable Development Leadership Panel (SDLP), composed of senior executives from all six product groups and corporate functions, focused on Rio Tinto’s sustainable development strategy. Input was sought from a wide range of sources, both within Rio Tinto and outside. The panel assessed the current status of sustainable development practice in the Group, decided that Rio Tinto should strive to be the sector leader in its contribution to sustainable development, and defined the areas we need to focus on in order to accomplish that goal.
The focus areas include developing a sustainable development culture, similar to that already in place on safety, key performance indicators, effective communication, supply chain management, and taking account of sustainable development in risk management, long term, planning and mines of the future.
To help explain the concepts of sustainable development, both to existing employees and newcomers, we introduced training and awareness raising tools throughout the Group. In addition, we are using another, more detailedprogramme for managers, based on the e-learning tool, Chronos, developed by the World Business Council for Sustainable Development and Cambridge University in the UK. By the end of 2006 more than 700 managers had participated in the programme.
As a founding member of the International Council on Mining and Metals, Rio Tinto is committed to superior business practices in sustainable development. We have committed to implement the ICMM Sustainable DevelopmentFramework and comply with policy statements of the ICMM Council.
Openness and accountability
Rio Tinto conducts the Group’s affairs in an accountable and transparent manner, reflecting the interests of Rio Tintoshareholders, employees, host communities and customers as well as others affected by the Group’s activities.
Policies on transparency, business integrity, corporate governance and internal controls and reporting proceduresare outlined inThe way we work. In 2003, aCompliance guidancewas issued to provide a framework to enable eachGroup business to implement and maintain a best practice compliance programme which should identify and manage risks associated with non compliance with laws, regulations, codes, standards and Rio Tinto policies.
Assurance and verification
To be accountable and transparent, assurance is provided to the Group and others that Rio Tinto policies are beingimplemented fully and consistently across the Group’s businesses and operations.
The overall objective of the external assurance and data verification programme is to provide assurance that the material in theSustainable development reviewis relevant, complete, accurate and responsive, and, in particular, thatRio Tinto’s policies and programmes are reflected in implementation activities at operations. In 2006, Environmental Resources Management (ERM) undertook the external assurance and data verification programme and the results are available in Rio Tinto’sSustainable development review.
Competition
Rio Tinto has adopted a specific antitrust policy requiring all employees to compete fairly and to comply with relevantlaws and regulations. Under the policy, guidance is provided on contacts with competitors and benchmarking as well as implementation of the policy in individual businesses. As integral parts of the policy, all relevant employees receive regular training and are required to certify annually that they are not aware of any antitrust violations. No violations were reported in 2006.
| Rio Tinto 2006Form 20-F | 74 |
Back to Contents
FINANCIAL REVIEW
Cash flow
2006 compared with 2005
Cash flow from operations, including dividends from equity accounted units, was a record US$10,923 million, 36 percent higher than in 2005. The increase was mainly due to increased profits. There was a cash outflow on working capital in both years reflecting higher receivables across all product groups due to higher metal prices and sales volumes. The cash outflow on inventory was US$454 million in 2006 compared to US$249 million in 2005, partly due to increased operating activity and production costs.
The Group invested at record levels, in particular in expansion projects. Expenditure on property, plant and equipment, exploration and other intangible assets was US$3,992 million in 2006, an increase of US$1,402 million over2005. This included the second phase of the Dampier port and Yandicoogina iron ore mine expansions, as well as construction of the Hope Downs iron ore mine in Western Australia, the A418 dyke construction at the Diavik diamond mine, the Madagascar ilmenite mine and the capacity increases at Rio Tinto Energy America. Capital expenditure is expected to continue at a high level in 2007.
Tax paid in 2006 increased to US$2,799 million, US$1,782 million higher than in 2005. The increase reflects higher profits including the lag effect of tax payments on higher profits from 2005.
Acquisitions less disposals were US$279 million in 2006 mainly relating to the acquisition of an initial stake inIvanhoe Mines. In 2005, there were net proceeds of disposal of US$321 million arising mainly from the sale of the Group’s interest in Lihir.
Dividends paid in 2006 of US$2,573 million were US$1,432 million higher than dividends paid in 2005. Theseincluded the special dividend totalling US$1.5 billion which was paid to shareholders in April 2006. Capital management activity also included the on market buyback of Rio Tinto plc shares in 2006, comprising US$2,299 million from the 2006/07 programme and US$95 million in January from the 2005/06 programme (before deducting US$24 million proceeds from the exercise of options). In 2005 an off market buyback of Rio Tinto Limited shares returned US$774 million to shareholders and an on market buyback of Rio Tinto plc shares returned US$103 million.
2005 compared with 2004
Cash flow from operations, including dividends from equity accounted units at US$8,031 million, was 88 per centhigher than in 2004.
The increase was mainly due to increased profits. This was partly offset by an increased cash outflow on workingcapital in 2005 mainly reflecting higher receivables across all product groups due to higher metal prices and sales volumes.
Cash flow of US$323 million from disposals of interests in businesses in 2005 primarily related to the sale of Lihir. In 2004, disposals generated proceeds of over US$1.5 billion. The largest components of this were the sale of shares in FCX and the sale of Rio Tinto’s interest in the Morro do Ouro gold mine in Brazil.
Purchase of property, plant and equipment and intangible assets of US$2,590 million included the major port andrail infrastructure expansion in Western Australia, payments for coal reserves purchased by Rio Tinto Energy America, the expansion of Hail Creek coking coal and initial expenditure on the construction of a new dyke at Diavik.
During the year the Group repaid US$893 million of its gross outstanding debt and cash balances increased byapproximately US$2.0 billion. Dividends paid in 2005 of US$1,141 million were US$235 million higher than dividends paid in 2004 following the 20 per cent increase in the dividend declared in respect of the previous year. A capital return programme was commenced under which an off market buy back of Rio Tinto Limited shares was carried out, and subsequently an on market buy back of Rio Tinto plc shares. Almost two thirds of the US$1.5 billion capital management programme announced on 3 February 2005 had been completed by the end of January 2006.
Balance sheet
The balance sheet remained strong during the period, although record capital expenditure and the increased capitalmanagement activity resulted in an increase in net debt of US$1,124 million to US$2,437 million at 31 December 2006. Debt to total capital rose to 11 per cent but interest cover strengthened to 89 times.
In 2006, net assets increased by US$3,646 million. Outside interests increased by US$362 million mainly due toretained profits at Robe River and IOC. Equity attributable to Rio Tinto shareholders increased by US$3,284 million: as net earnings attributable to Rio Tinto shareholders of US$7,438 million exceeded the combined amounts of share buybacks and dividends paid by US$2,207 million; and there was a positive currency translation effect of US$820 million mainly reflecting the eight per cent strengthening of the Australian dollar.
The Group’s borrowings, net of related currency and interest rate swaps, totalled US$3.2 billion at 31 December 2006, of which US$1,143 million will mature in 2007. The majority of the Group’s borrowings relate to amounts issuedunder the Group’s corporate bond and medium term notes programmes totalling approximately US$2.0 billion, of which US$847 million will mature in 2007.
In addition to the above, the Group’s share of the third party net debt of equity accounted units totalled US$459 million at 31 December 2006. This debt, which is set out in note 15 to the 2006 financial statements, is without recourse to the Rio Tinto Group.
| Rio Tinto 2006Form 20-F | 75 |
Back to Contents
Financial risk management
The Group’s policies with regard to risk management are clearly defined and consistently applied. They are afundamental principle of the Group’s long term strategy.
The Group’s business is mining and not trading. The Group only sells commodities it has produced. In the long term, natural hedges operate in a number of ways to help protect and stabilise earnings and cash flow. The Group has adiverse portfolio of commodities and markets, which have varying responses to the economic cycle. The relationship between commodity prices and the currencies of most of the countries in which the Group operates provides further natural protection in the long term. These natural hedges reduce the relevance of derivatives or other forms of synthetic hedging. Such hedging is therefore undertaken to a strictly limited degree, as described in the sections on currency, interest rate, commodity price exposure and treasury management below.
The Group’s 2006 financial statementsand disclosures show the full extent of its financial commitmentsincluding debt.
The risk factors to which the Group is subject that are thought to be of particular importance are summarised onpages 5 to 6.
The effectiveness of internal control procedures continues to be a high priority in the Rio Tinto Group. The boards’ statement on internal control is included underCorporate governanceon page 126.
Liquidity and capital resources
The unified credit status of the Group is maintained through cross guarantees whereby contractual obligations of RioTinto plc and Rio Tinto Limited are automatically guaranteed by the other. Rio Tinto plc and Rio Tinto Limited enjoy strong long and short term credit ratings from Moody’s and Standard and Poor’s. These ratings continue to provide financial flexibility and consistent access to debt via money or capital markets and enable very competitive terms to be obtained. The ratings outlook from both agencies is presently reported as ‘stable’. Credit ratings are not a recommendation to purchase, hold or sell securities, and are subject to revision or withdrawal at any time by the ratings organisation.
Rio Tinto does not have a target debt/equity ratio, but has a policy of maintaining a flexible financing structure so as to be able to take advantage of new investment opportunities that may arise. This policy is balanced against the desire to ensure efficiency in the debt/equity structure of the Rio Tinto balance sheet in the longer term through pro-active capital management programmes.
The Group maintains backup liquidity for debt maturing within 12 months and its commercial paper programmes by way of bank standby credit facilities, which totalled US$2.3 billion at 31 December 2006. These facilities, whichwere unused at the year end, can be drawn upon at any time on terms extending out to five years.
As at 31 December 2006, the Group had contractual cash obligations arising in the ordinary course of business asfollows:
| Contractual cash obligations | Total | | Less than 1 | | Between 1 | | Between 3 | | After 5 | |
| | year | | and 3 years | | and 5 years | | years | |
| US$m | | US$m | | US$m | | US$m | | US$m | |
|
|
|
|
|
|
|
|
|
| |
| Debt (a) | 3,179 | | 1,157 | | 847 | | 544 | | 631 | |
| Operating leases | 427 | | 62 | | 72 | | 51 | | 242 | |
| Unconditional purchase obligations (b) | 3,600 | | 903 | | 1,211 | | 660 | | 826 | |
| Deferred consideration | 179 | | 37 | | 78 | | 29 | | 35 | |
| Other (c) | 2,413 | | 1,675 | | 572 | | 129 | | 37 | |
|
|
|
|
|
|
|
|
|
| |
| Total | 9,798 | | 3,834 | | 2,780 | | 1,413 | | 1,771 | |
|
|
|
|
|
|
|
|
|
| |
| Notes |
| (a) | Debt obligations include bank borrowings repayable on demand and reflect the impact of related currency and interest rates waps |
| (b) | Unconditional purchase obligations relate to commitments to make payments in the future for fixed or minimum quantities of goods or services at fixed or minimum prices. The future payment commitments have not been discounted and mainly relate to commitments under ‘take or pay’ power and freight contracts. They exclude unconditional purchase obligations of jointly controlled entities apart from those relating to the Group ’s tolling arrangements. |
| (c) | Other relates primarily to capital commitments. |
| (d) | In addition, the Group had liabilities for trade and other payables, other financial liabilities, tax and provisions. |
Information regarding the Group’s pension commitments and funding arrangements is provided in thePost retirement benefitssection of thisFinancial reviewand in note 46 to the 2006 financial statements.
On the basis of the levels of obligations described above, the unused capacity under the Group’s commercial paper and European Medium Term Notes programmes, the Group’s anticipated ability to access debt and equity capital markets in the future and the level of anticipated free cash flow, there are reason able grounds to believe that the Group has sufficient short and long term sources of funding available to meet its liquidity requirements.
The Group’s committed bank standby facilities contain no financial undertakings relating to interest cover. TheGroup has no financial agreements that would be affected to any material extent by a reduction in the Group’s credit rating. There are no covenants relating to corporate debt which are under negotiation at present.
The Group’s policy is to centralise debt and surplus cash balances whenever possible.
| Rio Tinto 2006Form 20-F | 76 |
Back to Contents
Dividends
Dividends paid on Rio Tinto plc and Rio Tinto Limited shares are equalised on a net cash basis; that is without takinginto account any associated tax credits. Dividends are determined in US dollars.
Rio Tinto’s progressive dividend policy aims to increase the US dollar value of dividends over time, without cutting them in economic downturns. Rio Tinto plc shareholders receive dividends in pounds sterling and Rio TintoLimited shareholders receive dividends in Australian dollars, which are determined by reference to the exchange rates applicable to the US dollar two days prior to the announcement of dividends. Changes in exchange rates could result in a reduced sterling or Australian dollar dividend in a year in which the US dollar value is maintained or increased. The interim dividend for each year in US dollar terms will be equivalent to 50 per cent of the total US dollar dividends declared in respect of the previous year.
In April 2006 the Group paid a US$1.5 billion special dividend (US$1.10 per share) announced as part of the2006 capital management programme (see below). The special dividend was paid concurrently with the 2005 final ordinary dividend, but did not form part of the Group’s progressive ordinary dividend policy.
The Group announced a re-basing of its ordinary dividend in February 2007, increasing the full year ordinarydividend in respect of 2006 by 30 per cent to 104 US cents. An interim dividend of 40 US cents was paid in October 2006 and a final dividend for the year of 64 US cents was paid in April 2007.
Capital management programme
On 2 February 2006 the Group announced a US$4 billion capital management programme, comprising the US$1.5billion special dividend (US$1.10 per share paid in April 2006) referred to above and a US$2.5 billion share buyback programme over two years to the end of 2007.
The US$4 billion programme was completed almost a year ahead of schedule in January 2007.
On 27 October 2006, the Group announced an increase in the programme by US$3 billion to US$7 billion, to becompleted over the remaining period to the end of 2007. The additional cash return is planned through the buyback of shares, subject to market conditions.
As at 31 December 2006, the cumulative cash returns to shareholders under the 2005/06 and 2006/07 capital management programmes amounted to US$4.8 billion.
Treasury management and financial instruments
Treasury activities operate as a service to the business of the Rio Tinto Group and not as a profit centre. Strict limits on the size and type of transaction permitted are laid down by the Rio Tinto board and are subject to rigorous internalcontrols. Corporate funding and overall strategic management of Rio Tinto’s balance sheet is handled by the London based Group Treasury.
Rio Tinto does not acquire or issue derivative financial instruments for trading or speculative purposes; nor does it believe that it has exposure to such trading or speculative holdings through its investments in joint ventures and associates. Derivatives are used to separate funding and cash management decisions from currency exposure and interest rate management. The Group uses interest rate swaps in conjunction with longer term funds raised in the capital markets to achieve a floating rate obligation which is consistent with the Group’s interest rate policy as described in the section on ‘Interest rates’ below. Currency swaps are used to convert debt or investments into currencies, primarily theUS dollar, which are consistent with the Group’s policy on currency exposure management as described inExchange rates, reporting currencies and currency exposurebelow. No material exposure is considered to exist by virtue of the possible non performance of the counterparties to financial instruments held by the Group.
The derivative contracts in which the Group is involved are valued by reference to quoted market prices,quotations from independent financial institutions or by discounting expected cash flows.
Off balance sheet arrangements
In the ordinary course of business, to manage the Group’s operations and financing, Rio Tinto enters into certain performance guarantees and commitments for capital and other expenditure.
The aggregate amount of indemnities and other performance guarantees, on which no material loss is expected,including those related to joint ventures and associates, was US$501 million at 31 December 2006.
Other commitments include contracted capital expenditure, operating leases and unconditional purchaseobligations as set out in the table of contractual cash obligations, included in theLiquidity and capital resourcessection above.
Exchange rates, reporting currencies and currency exposure
Rio Tinto’s shareholder’s equity, earnings and cash flows are influenced by a wide variety of currencies due to thegeographic diversity of the Group’s sales and the countries in which it operates. The US dollar, however, is the currency in which the great majority of the Group’s sales are denominated. Operating costs are influenced by the currencies of those countries where the Group’s mines and processing plants are located and also by those currencies in which the costs of imported equipment and services are determined. The Australian and Canadian dollars are the most important currencies influencing costs, apart from the US dollar.
In any particular year, currency fluctuations may have a significant impact on Rio Tinto’s financial results. A weakening of the US dollar against the currencies in which the Group’s costs are determined has an adverse effect onRio Tinto’s underlying earnings.
| Rio Tinto 2006Form 20-F | 77 |
Back to Contents
However, this would also result in exchange gains on net debt denominated in US dollars held in non US functional currency operations, which has a positive effect on Rio Tinto’s EU IFRS profit and net earnings. It wouldalso result in exchange gains and losses on intragroup balances denominated in US dollars held by non US functional currency operations. Such gains and losses on US dollar net debt and intragroup balances are excluded from underlying earnings.
The following sensitivities give the estimated effect on underlying earnings of a ten per cent change in the fullyear average exchange rate, assuming that each exchange rate moved in isolation. Movements in exchange rates can cause movements in commodity prices and vice versa. However, the relationship between currencies and commodity prices is a complex one, with varying degrees of correlation depending on the currency in question. Where the functional currency of an operation is that of a country for which production of commodities is an important feature of the economy, such as the Australian dollar, there is a certain degree of natural protection against cyclical fluctuations in the long term, in that the currency tends to be weak, reducing costs in US dollar terms, when commodity prices are low, and vice versa.
The exchange rate sensitivities quoted below include the effect on operating costs of movements in exchangerates but exclude the effect of the revaluation of foreign currency working capital, US dollar net debt and intragroup balances. They should therefore be used with care.
| Exchange rate sensitivities | | | 2006 | |
| | | Effect on underlying | |
| Average | | earnings of 10% | |
| Exchange | | change in full | |
| rate for | | year average | |
| 2006 | | +/- US$m | |
|
|
|
| |
| Australian dollar | 75 US cents | | 280 | |
| Canadian dollar | 88 US cents | | 80 | |
| Chilean peso | US$1 = 530 pesos | | 10 | |
| New Zealand dollar | 65 US cents | | 6 | |
| South African rand | 15 US cents | | 22 | |
| UK Sterling | 184 US cents | | 15 | |
| Other | n/a | | 6 | |
|
|
|
| |
The sensitivities in the 2006 column are based on 2006 prices, costs and volumes and assume that all other variables remain constant.
Gains and losses on exchange arising from net monetary assets/(liabilities), other than US dollar net debt and intragroup balances, that are not denominated in the functional currency of the relevant business unit are recorded in theincome statement and are included in underlying earnings. The table below reflects the amounts of assets less liabilities, net of tax and outside interests as at the end of 2006, which expose the Group to such exchange gains and losses. These balances will not remain constant throughout 2007, however, and therefore these numbers should be used with care.
| | Currency of exposure | | 2006 | |
| | US dollar | | Other | | Total | |
| | US$m | | US$m | | US$m | |
|
|
|
|
|
| |
| Functional currency of business unit: | | | | | | |
| Australian dollar | 487 | | 1 | | 488 | |
| Canadian dollar | 86 | | 8 | | 94 | |
| South African rand | 26 | | 5 | | 31 | |
| Other currencies | 95 | | 19 | | 114 | |
|
|
|
|
|
| |
| Total | 694 | | 33 | | 727 | |
|
|
|
|
|
| |
Given the dominant role of the US currency in the Group’s affairs, the US dollar is the currency in which financial results are presented both internally and externally. It is also the most appropriate currency for borrowing and holding surplus cash, although a portion of surplus cash may also be held in other currencies, most notably Australian dollars, in order to meet short term operational and capital commitments and dividend payments.
The Group finances its operations primarily in US dollars, either directly or using currency swaps, and asubstantial part of the Group’s US dollar debt is located in subsidiaries having functional currencies other than the US dollar. Exchange differences on net debt that hedges the net assets of entities with functional currencies other than the US dollar are dealt with through equity. All other exchange differences on net debt are dealt with in the income statement, but those related to US dollar net debt are excluded in arriving at underlying earnings. Exchange gains and losses which arise on balances between Group entities are taken to equity where that balance is, in substance, part of the Group’s net investment in a subsidiary or equity accounted unit. All other exchange differences on intragroup balances are dealt with in the income statement but are excluded from underlying earnings.
The table below reflects the amounts of net debt and intragroup balances at the end of 2006, net of tax andoutside interests, that expose the Group to exchange gains and losses that would be recorded in the income statement. These balances will not remain constant during 2007, however, and these numbers should therefore be used with care.
| Rio Tinto 2006Form 20-F | 78 |
Back to Contents
| | | | Net debt1 | | 2006 | | Intragroup balances | | 2006 | |
| | Currency of exposure | | | | Currency of exposure | | | |
| |
| | | |
| | | |
| | US$ | | Other | | Total | | US$ | | Other | | Total | |
| Functional currency of business unit: | US$m | | US$m | | US$m | | US$m | | US$m | | US$m | |
|
|
|
|
|
|
|
|
|
|
|
| |
| United States dollar | — | | (5 | ) | (5 | ) | — | | 2,747 | 2 | 2,747 | |
| Australian dollar | (516 | ) | 6 | | (510 | ) | (1,522 | ) | 31 | | (1,491 | ) |
| Canadian dollar | (106 | ) | 1 | | (105 | ) | (245 | ) | — | | (245 | ) |
| South African rand | (19 | ) | — | | (19 | ) | (38 | ) | (4 | ) | (42 | ) |
| Other currencies | 17 | | 4 | | 21 | | (38 | ) | 20 | | (18 | ) |
|
|
|
|
|
|
|
|
|
|
|
| |
| Total | (624 | ) | 6 | | (618 | ) | (1,843 | ) | 2,794 | | 951 | |
|
|
|
|
|
|
|
|
|
|
|
| |
| Notes |
| 1 | The table shows exposures after taking account of the impact of currency swaps. Further details of currency swaps are included in note 32 to the 2006 financial statements. |
| 2 | These amounts relate to intragroup liabilities denominated in Australian dollars reported by subsidiaries with a US dollar functional currency. They are shown as positive balances because they have the effect of offsetting the exposures resulting from external and intragroup US dollar liabilities in Australian functional currency subsidiaries. |
The Group does not generally believe that active currency hedging would provide long term benefits to shareholders. Currency protection measures may be deemed appropriate in specific commercial circumstances and are subject to strict limits laid down by the Rio Tinto board. As set out in note 32 to the 2006 financial statements, as at 31 December 2006 there were derivative contracts to sell US$581 million and buy A$550 million and NZ$520 million in respect of future trading transactions. A significant part of the above hedge book was acquired with North Limited. North held a substantial hedge book on acquisition which has been retained but is not being renewed as maturities occur.
The functional currency of most operations within the Rio Tinto Group is the local currency in the country of operation. Foreign currency gains or losses arising on translation of the net assets of these operations are taken to equityand, with effect from 1 January 2004, recorded in a currency translation reserve. The approximate translation effects on the Group’s net assets of ten per cent movements from the year end exchange rates are as follows:
| | | | 2006 | |
| | | | Effect on net | |
| | Closing | | assets of | |
| | exchange | | 10% change in | |
| | rate | | closing rate | |
| | US cents | | +/- US$m | |
|
|
|
| |
| Australian dollar | 79 | | 1,161 | |
| Canadian dollar | 86 | | 152 | |
| South African rand | 14 | | (4 | ) |
| UK Sterling | 196 | | 32 | |
| Other | — | | (1 | ) |
|
|
|
| |
Interest rates
Rio Tinto’s interest rate management policy is generally to borrow and invest cash at floating rates. Short term US dollar rates are normally lower than long term rates, resulting in lower interest costs to the Group. Furthermore, cyclicalmovements of interest rates tend to compensate in the long term, to an extent, for those of commodity prices. In some circumstances, an element of fixed rate funding may be considered appropriate. At the end of 2006, US$1.2 billion of the Group’s debt was at fixed rates after taking into account interest rate swaps. Based on the Group’s net debt at 31 December 2006, and with other variables unchanged, the approximate effect on the Group’s net earnings of a one percentage point increase in US dollar LIBOR interest rates would be a reduction of US$6 million.
Commodity prices
The Group’s normal policy is to sell its products at prevailing market prices. Exceptions to this rule are subject to strict limits laid down by the Rio Tinto board and to rigid internal controls. Rio Tinto’s exposure to commodity prices isdiversified by virtue of its broad commodity spread and the Group does not generally believe commodity price hedging would provide long term benefit to shareholders. The forward contracts to sell 420 million pounds of copper at a fixed rand price per pound were entered into as a condition of the refinancing of Palabora in 2005.
Metals such as copper and aluminium are generally sold under contract, often long term, at prices determined by reference to prevailing market prices on terminal markets, such as the London Metal Exchange and COMEX in NewYork, usually at the time of delivery. Prices fluctuate widely in response to changing levels of supply and demand but, in the long run, prices are related to the marginal cost of supply. Gold is also pr iced in an active market in which prices respond to daily changes in quantities offered and sought. Newly mined gold is only one source of supply; investment and disinvestment can be important elements of supply and demand. Contract prices for many other natural resource products are generally agreed annually or for longer periods with customers, although volume commitments vary by product.
| Rio Tinto 2006 Form 20-F | 79 |
Back to Contents
Approximately 53 per cent of Rio Tinto’s 2006 net earnings from operating businesses came from products whose prices were terminal market related and the remainder came from products priced by direct negotiation.
Commodity prices increased rapidly in 2005 and 2006. Looking to 2007, there are a number of uncertainties inthe global economy, not least the direction of inflation and interest rates in major economies. The Group expects some moderation of global economic growth, although confidence in Japan and Europe is increasing. Growth in China, which is critical to the demand outlook for many of the Group’s products, is expected to remain strong and well balanced. The Group continues to view the overall outlook for commodities as positive, with prices expected to remain well above their long run averages in 2007.
Ore reserves (under Industry Guide 7) presented on pages 23 to 33 do not exceed the quantities that it isestimated could be extracted economically if future prices were to be in line with the average of historical prices for the three years to 30 June 2006, or contracted prices where applicable. For this purpose, contract ed prices are applied only to future sales volumes for which the price is predetermined by an existing contract; and the average of historical prices is applied to expected sales volumes in excess of such amounts. Moreover, reported ore reserve estimates have not been increased above the levels expected to be economic based on Rio Tinto's own long term price assumptions. Therefore, a reduction in commodity prices from the three year average historical price levels would not necessarily give rise to a reduction in reported ore reserves.
The table below shows published ‘benchmark’ prices for Rio Tinto’s commodities for the last three years wherethese are publicly available, and where there is a reasonable degree of correlation between the benchmark and Rio Tinto’s realised prices. The prices set out in the table are the averages for each of the calendar years, 2004, 2005 and 2006. The Group’s revenue will not necessarily move in line with these benchmarks for a number of reasons which are discussed below.
| | | | | 2004 | | 2005 | | 2006 | |
| Commodity | Source | Unit | | US$ | | US$ | | US$ | |
|
|
|
|
|
|
|
|
| |
| Aluminium | LME | pound | | 0.78 | | 0.86 | | 1.16 | |
| Copper | LME | pound | | 1.30 | | 1.66 | | 3.06 | |
| Gold | LBMA | ounce | | 409 | . | 444 | . | 602 | . |
| Iron ore | Australian benchmark (fines)(a) | dmtu (b) | | 0.35 | | 0.55 | | 0.71 | |
| Lead | LME | pound | | 0.40 | | 0.44 | | 0.59 | |
| Molybdenum | Metals Week: quote for dealer oxide price | pound | | 16 | . | 31 | . | 25 | . |
| Silver | LBMA | ounce | | 6.6 | | 7.3 | | 11.6 | |
| Zinc | LME | pound | | 0.48 | | 0.63 | | 1.49 | |
|
|
|
|
|
|
|
|
| |
| Notes |
| (a) | average for the calendar year |
| (b) | dry metric tonne unit |
The discussion of revenues below relates to the Group’s gross revenue from sales of commodities, including its share of the revenue of equity accounted units, as included in note 47 to the 2006 financial statements.
The Australian iron ore fines benchmark increased by 19 per cent in April 2006. The higher prices, combined with higher volumes at Hamersley, contributed to an increase in the Group’s iron ore revenue of 26 per cent. Thebenchmark price increased by 71.5 per cent in April 2005 compared with 2004. This contributed to an increase in the Group’s iron ore revenue of 83 per cent, with the additional benefits of volume increases from the West Angelas and Yandicoogina expansions and the recovery of output at IOC, after a ten week strike in 2004.
A significant proportion of Rio Tinto’s coal production is sold under long term contracts. In Australia, the prices applying to sales under the long term contracts are generally renegotiated annually; but prices are fixed at different times of the year and on a variety of bases. For these reasons, average realised prices will not necessarily reflect themovements in any of the publicly quoted benchmarks. Moreover, there are significant product specification differences between mines. Sales volumes will vary during the year and the timing of shipments will also result in differences between average realised prices and benchmark prices.
Revenues of the Group’s Australian coal operations increased by two per cent in 2006. There was a sustained increase in the received price for thermal coal. This benefit was largely offset by lower coking coal sales because ofmarket weakness and the delay in thermal coal shipments arising from congestion at Newcastle. Published market indications for Australian thermal coal show a slight increase in thermal coal prices in 2006 on a calendar year basis and a seven per cent increase in the coking coal benchmark price.
Revenues from these operations increased by 45 per cent in 2005, benefiting from a significant increase in pricesrealised on sales both of thermal and coking coal yet published market indications for Australian thermal coal showed a reduction of ten per cent in 2005 compared with 2004. The coking coal benchmark price increased by 99 per cent in 2005.
In the US, Rio Tinto Energy America’s revenues increased by 19 per cent in 2006, with higher realised prices for Powder River Basin coal and increased volumes. Published market indications of spot prices for Wyoming thermal coalshow an increase of 24 per cent for the average spot price in 2006 compared with 2005. However, spot prices were volatile during the period. Revenues increased by six per cent in 2005, with benefits from higher prices limited by the influence of long term contracts. Published market indications of spot prices for Wyoming thermal coal showed an
| Rio Tinto 2006 Form 20-F | 80 |
Back to Contents
increase of 61 per cent in 2005 over 2004.
Information included in the RWE NUKEM Inc. Price Bulletin indicated price increases of 71 per cent in 2006and 54 per cent in 2005 for uranium oxide. The Group’s uranium revenue increased by 27 per cent in 2006 and by 23 per cent in 2005 as a result of higher prices. The large increases reported in the Price Bulletin are not fully reflected in the revenues for the period because uranium oxide is typically sold on long term contracts with pricing determined for several years beyond the commencement of the contracts. However, a significant portion of output from Rössing is not under long term contracts and there is therefore more exposure to the spot market from Rössing’s output than from ERA’s.
Industrial Minerals sales are made under contract at negotiated prices. Revenue from industrial mineralsincreased by five per cent in 2006 against 2005. This was mainly attributable to improved prices and to stronger demand for titanium dioxide chloride feedstock. Revenue in 2005 was 17 per cent higher than in 2004. This was mainly attributable to strong price performance across all products at Rio Tinto Iron and Titanium and increased volumes, particularly at Richards Bay Minerals.
The Aluminium group’s sales revenues are from aluminium, alumina and bauxite. Revenue increased by 27 percent in 2006. Average aluminium prices quoted on the LME increased by 35 per cent in 2006 but achieved spot alumina prices were lower than in 2005. In 2005, revenue increased by 16 per cent while average prices quoted on the LME increased by ten per cent. In addition to these price increases, revenues reflected increased sales volumes, including the ramp up of output from Yarwun, which commenced shipments in November 2004.
The Copper group also produces gold and molybdenum as significant by products. Total Copper group salesrevenues in 2006 increased by 46 per cent over 2005. Copper revenues increased by 77 per cent, broadly in line with the 84 per cent increase in the LME price. Lower grades and therefore volumes at Grasberg more than offset the higher volumes at the other copper operations. A 22 per cent decrease in gold revenue was also attributable to lower grades at Grasberg which outweighed the effect of the 36 per cent increase in the gold price. Molybdenum revenue was only six per cent down on 2005 with record production at KUC offsetting much of the effect of the 20 per cent fall in price.
In 2005, the Copper group’s revenues were 60 per cent higher than in 2004. Copper revenues increased by 33 per cent while the average LBMA copper price increased by 28 per cent. Revenues benefited both from the increase in prices and from increased volumes, including the effect of a return to full operations at Grasberg after a pit wall slippage in 2003. Gold revenues in 2005 were 69 per cent higher than in 2004 while the average LBMA gold price increased by nine per cent year on year. Revenues benefited from the price increase and also from the very substantial recovery in sales volumes at Grasberg. Average molybdenum prices quoted in Metals Week in 2005 almost doubled from the 2004 level. Sales revenue was over five times higher. In addition to the higher prices, this reflected a major step up in volumes achieved through changes in the mine plan at KUC to maximise molybdenum production in response to the strong market.
Whilst the Diamond Trading Company (DTC) reported a two per cent increase in diamond prices in February,market reports indicated that prices were re-adjusted downwards in the second half of the year. While movements in the DTC price are a general indicator of the overall rough diamond market, they do not necessarily correlate closely with prices actually realised by Rio Tinto, which reflect the particular type of diamonds in its diverse product mix. The 22 per cent decrease in Diamond group revenue in 2006 against 2005 was almost wholly attributable to the softer markets experienced by Argyle which resulted in excess of US$100 million of surplus rough diamonds being held in inventory at the end of the year. Diamond revenue increased 45 per cent in 2005 against 2004. There was a six per cent increase in the DTC indicated price for rough diamonds in the year. The majority of the increase in Rio Tinto diamond revenues was attributable to higher volumes and higher prices at Argyle and the commencement of the Murowa operation.
Lead, zinc and silver accounted for less than one per cent of revenue in each of the two years to 2006.
The approximate effect on the Group’s underlying earnings of a ten per cent change from the full year averagemarket price in 2006 for the following products would be:
| | | | Average | | Effect on underlying | |
| | | | market price | | earnings of 10% change in | |
| | | | for 2006 | | full year average | |
| | Unit | | US$ | | +/- US$m | |
|
|
|
|
|
| |
| Copper | Pound | | 3.06 | | 422 | |
| Aluminium | Pound | | 1.16 | | 167 | |
| Gold | Ounce | | 602 | . | 46 | |
| Molybdenum | Pound | | 25 | . | 56 | |
| Iron ore | dmtu | | n/a | | 367 | |
|
|
|
|
|
| |
The above sensitivities are based on 2006 volumes and give the estimated impact on underlying earnings of changes in prices assuming that all other variables remain constant. These should be used with care. As noted previously, the relationship between currencies and commodity prices is a complex one and changes in exchange rates can influence commodity prices and vice versa.
| Rio Tinto 2006 Form 20-F | 81 |
Back to Contents
Critical accounting policies and estimates
Dual listed company reporting
In previous years, the Form 20-F filed with the United States Securities and Exchange Commission (SEC), contained separate consolidated financial statements for the Rio Tinto plc and Rio Tinto Limited parts of the Group. These were presented on the basis of the legal ownership of the various operations within each part of the Group. The separate financial statements for Rio Tinto Limited included, on a consolidated basis, the Group undertakings under its legal ownership, and those for Rio Tinto plc included, on a consolidated basis, the Group undertakings under its legal ownership. This presentation of financial information filed with the SEC was on the assumption that the formation of the Group through the dual listed companies (DLC) arrangements was not a business combination. The financial statements filed with the SEC also included supplemental financial information that combined the consolidated financial statements of the Rio Tinto plc and Rio Tinto Limited parts of the Group to present the Rio Tinto Group, with no adjustment for fair values.
This combined financial information for the Rio Tinto Group was consistent with the financial statements that were used for the purposes of satisfying the Group's reporting obligations in the United Kingdom and Australia. The combined financial statements for the Rio Tinto Group viewed the formation of the DLC as a business combination and accounted for the transaction as a merger in accordance with UK Financial Reporting Standard No. 6 Acquisitions and Mergers (‘FRS 6’). Applying FRS 6, Rio Tinto plc and Rio Tinto Limited were combined and presented as one economic entity with no adjustment for fair values.
As permitted under the transitional arrangements set out in IFRS 1 ‘First time adoption of International Financial Reporting Standards’, which sets out the rules for first time adoption of IFRS, the Group did not apply the concepts of IFRS 3 ‘Business Combinations’ for business combinations prior to the first time application( of EU IFRS. Accordingly, the Group is following the same method of accounting for the DLC in its financial statements under EU IFRS as was historically followed under UK GAAP: the Group is presented as one economic entity at historical cost.
Subsequent to the formation of the Group, the accounting model used in filings with the SEC for the presentation of financial statements of companies that form DLCs has changed. The formation of a new DLC is now viewed as a business combination. The Group now believes that it is preferable to treat the formation of the DLC as a business combination, and as a result, that the accounting and reporting of financial statements prepared in accordance with IFRSto the SEC will be consistent with the accounting and reporting in the United Kingdom and Australia.
Accordingly, the Group has revised the presentation of its financial statements included in Form 20-F to account for the formation of the DLC as a business combination. As a consequence, separate financial statements for Rio Tintoplc and Rio Tinto Limited will no longer be presented. Instead, the financial statements will deal with the Rio Tinto Group as one combined economic entity. This new presentation is applied retrospectively for all periods presented. The EU IFRS information presented on this new basis in the 20-F is the same as the combined supplemental information for the Rio Tinto Group that was previously disclosed.
Under US GAAP, the Group now accounts for the formation of the DLC using the purchase method. As aconsequence of this treatment, Rio Tinto shareholders' funds under US GAAP at 31 December 2006 are US$1,519 million above those under IFRS; and US GAAP net earnings for 2006 are US$62 million below those under EU IFRS. Further information on the impact of purchase accounting under US GAAP is shown in note 48 to the 2006 financial statements.
The 2006Annual report and financial statementssatisfy the obligations of Rio Tinto Limited to prepare consolidated accounts under Australian company law, as amended by an order issued by the Australian Securities andInvestments Commission on 27 January 2006 (as amended on 22 December 2006). The 2006 financial statementsdisclose the effect of the adjustments to consolidated EU IFRS profit, consolidated total recognised income and consolidated shareholders’ funds for the Group that would be required under the version of IFRS that is applicable in Australia (‘Australian IFRS’).
The US dollar is the presentation currency used in these financial statements, as it most reliably reflects the Group’s global business performance.
Ore reserve estimates
Rio Tinto estimates its ore reserves and mineral resources based on information compiled by Competent Persons asdefined in accordance with the Australasian Code for Reporting of Exploration Results, Mineral Resources and Ore Reserves of December 2004 (‘the JORC code’). The amounts presented under EU and Australian IFRS are based on the reserves, and in some cases mineral resources, determined under the JORC code.
For the purposes of the Group’s financial information under US GAAP, ore reserves are computed in accordance with the SEC’s Industry Guide 7 and are shown on pages 23 to 33. Estimates of ore reserves and mineral resources inaccordance with JORC are not shown in this combined annual report on Form 20-F.
Ore reserves presented in accordance with SEC Industry Guide 7 do not exceed the quantities that, it is estimated, could be extracted economically if future prices were to be in line with the average of historical prices for the threeyears to 30 June 2006, or contracted prices where applicable. For this purpose, contracted prices are applied only to future sales volumes for which the price is predetermined by an existing contract; an d the average of historical prices is applied to expected sales volumes in excess of such amounts. Moreover, reported ore reserve estimates have not been increased above the levels expected to be economic based on Rio Tinto's own long term price assumptions. Therefore, a
| Rio Tinto 2006 Form 20-F | 82 |
Back to Contents
reduction in commodity prices from the three year average historical price levels would not necessarily give rise to a reduction in reported ore reserves.
There are numerous uncertainties inherent in estimating ore reserves and assumptions that are valid at the time ofestimation may change significantly when new information becomes available.
Changes in the forecast prices of commodities, exchange rates, production cost s or recovery rates may change theeconomic status of reserves and may, ultimately, result in the reserves being restated. Such changes in reserves could impact on depreciation and amortisation rates, asset carrying values, deferred stripping calculations and provisions for close down, restoration and environmental clean up costs.
Asset carrying values
Events or changes in circumstances can give rise to significant impairment charges or reversals of impairmentprovisions in a particular year. In 2006, the Group’s results included net impairment reversals of US$396 million (US$44 million after tax and outside shareholders interests). Impairments were reversed at KUC and IOC which more than offset impairment charges at Argyle and Tarong Coal. In 2005, there were no significant impairment charges or reversals. However in 2004, the Group incurred a US$558 million impairment charge, (US$321 million net of tax and outside shareholders’ interests).
When such events or changes in circumstances impact on a particular asset or cash generating unit, its carryingvalue is assessed by reference to its recoverable amount being the higher of fair value less costs to sell and value in use (being the net present value of expected future cash flows of the relevant cash generating unit). The best evidence of an asset’s fair value is its value obtained from an active market or binding sale agreement. Where neither exists, fair value less costs to sell is based on the best information available to reflect the amount the Group could receive for the cash generating unit in an arm’s length transaction. In most cases this is estimated using a discounted cash flow analysis. The cash flows used in these analyses are particularly sensitive to changes in two parameters: exchange rates and commodity selling prices. The great majority of the Group’s sales are based on prices denominated in US dollars. To the extent that the currencies of countries in which the Group produces commodities strengthen against the US dollar without commodity price offset, cash flows and, therefore, net present values are reduced. Management considers that over the long term, there is a tendency for movements in commodity prices to compensate to some extent for movements in the value of the US dollar (and vice versa). But such compensating changes are not synchronised and do not fully offset each other.
Recent favourable changes in commodity prices have exceeded adverse shifts in exchange rates. Comparing average exchange rates in 2006 against those in 2003, the Australian dollar strengthened by 16 per cent against the USdollar, the Canadian dollar strengthened by 24 per cent and the South African rand by ten per cent. Over the same period, commodity prices rose substantially: for example, copper prices increased by 281 per cent, aluminium by 79 per cent and gold by 66 per cent.
Reviews of carrying values relate to cash generating units which, in accordance with IAS 36 ‘Impairment of Assets’, are identified by dividing an entity into as many largely independent cash generating streams as is reasonablypracticable. In some cases the business units within the product groups consist of several operations with independent cash generating streams, which therefore constitute separate cash generating units.
The cash flow forecasts are based on best estimates of expected future revenues and costs. These may include net cash flows expected to be realised from extraction, processing and sale of other mineralisation that does not currentlyqualify for inclusion in proven or probable ore reserves. Such non reserve material is included where there is a high degree of confidence in its economic extraction. This expectation is usually based on preliminary drilling and sampling of areas of mineralisation that are contiguous with existing reserves. Typically, the additional evaluation to achieve reserve status for such material has not yet been done because this would involve incurring costs earlier than is required for the efficient planning and operation of the mine.
The expected future cash flows of cash generating units reflect long term mine plans which are based on detailed research, analysis and iterative modelling to optimise the level of return from investment, output and sequence of extraction. The plan takes account of all relevant characteristics of the orebody, including waste to ore ratios, ore grades, haul distances, chemical and metallurgical properties of the ore impacting on process recoveries and capacities of processing equipment that can be used. The mine plan is therefore the basis for forecasting production output in each future year and production costs.
Rio Tinto’s cash flow forecasts are based on assessments of expected long term commodity prices, which for most commodities are derived from an analysis of the marginal costs of the producers of these commodities. These assessments often differ from current price levels and are updated periodically.
In some cases, prices applying to some part of the future sales volumes of a cash generating unit are predetermined by existing sales contracts. The effects of such contracts are taken into account in forecasting future cash flows.
Cost levels incorporated in the cash flow forecasts are based on the current long term mine plan for the cashgenerating unit. For impairment reviews, recent cost levels are considered, together with expected changes in costs that are compatible with the current condition of the business and which meet the requirements of IAS 36. IAS 36 includes a number of restrictions on the future cash flows that can be recognised in respect of future restructurings and improvement related capital expenditure.
The useful lives of the major assets of a cash generating unit are usually dependent on the life of the orebody to which they relate. Thus the lives of mining properties, smelters, concentrators and other long lived processing
| Rio Tinto 2006 Form 20-F | 83 |
Back to Contents
equipment generally relate to the expected life of the ore body. The life of the ore body, in turn, is estimated on the basis of the long term mine plan.
Forecast cash flows are discounted to present values using Rio Tinto’s weighted aver age cost of capital with appropriate adjustment for the risks associated with the relevant cash flows, to the extent that such risks are not reflected in the forecast cash flows. For final feasibility studies and ore reserve estimation, internal hurdle rates are used which are generally higher than the weighted average cost of capital.
Final feasibility studies, ore reserve estimates and value in use estimates are based on the exchange rates current at the time of the evaluation. In estimates of fair value, a forecast of the long term exchange rate is made having regard to spot exchange rates, historical data and external forecasts.
Forecast cash flows for ore reserve estimation for JORC purposes and for impairment testing are based on Rio Tinto’s long term price forecasts. For final feasibility studies these prices and projected costs, are assumed to decline systematically in real terms.
For the majority of Rio Tinto’s businesses, both by number and by value, the recoverable amounts are substantially in excess of the carrying value in the balance sheet. For a minority of the businesses the carrying value is close to their recoverable amount, and these are reviewed for impairment where required. The effects of exchange rate and commodity price changes on the values of these units relative to their book values are monitored closely.
All goodwill and intangible assets that are not yet ready for use or have an indefinite life are tested annually for impairment regardless of whether there has been any change in events or circumstances.
Under US GAAP, assumptions used in cash flow forecasts are principally the same as those used under EU IFRS, except that the estimated cash flows related to the liability for asset retirement obligations are excluded under US GAAP (and the related liabilities are excluded from the determination of the carrying value of the asset group). Goodwill is tested annually for impairment. Impairment of other intangible assets and of property, plant and equipment is only recognised when the anticipated undiscounted cash flows are insufficient to recover the carrying value of the asset group. Once impairment is determined, an asset is written down to its fair value, which is normally calculated using discounted cash flows, similar to those under EU IFRS and the result is generally similar to that under EU IFRS. It is not possible to reverse impairment charges under US GAAP.
Close down, restoration and clean up obligations
Provision is made for environmental remediation costs when the related environmental disturbance occurs, based on thenet present value of estimated future costs.
Close down and restoration costs are a normal consequence of mining, and the majority of close down and restoration expenditure is incurred at the end of the life of the mine. The costs are estimated on the basis of a closure plan. The cost estimates are calculated annually during the life of the operation to reflect known developments, eg updated cost estimates and revisions to the estimated lives of operations, and are subject to formal review at regular intervals. Although the ultimate cost to be incurred is uncertain, the Group’s businesses estimate their respective costs based on feasibility and engineering studies using current restoration standards and techniques. The initial closure provision together with changes, other than those arising from the unwind of the discount applied in establishing the net present value of the provision, are capitalised within property, plant and equipment and depreciated over the lives of the assets to which they relate.
Clean up costs result from environmental damage that was not a necessary consequence of mining, including remediation, compensation and penalties. These costs are charged to the income statement. Provisions are recognised at the time the damage, remediation process and estimated remediation costs become known. Remediation procedures may commence soon after this point in time but can continue for many years depending on the nature of the disturbance and the remediation techniques.
As noted above, the ultimate cost of environmental disturbance is uncertain and cost estimates can vary in response to many factors including changes to the relevant legal requirements, the emergence of new restoration techniques or experience at other mine sites. The expected timing of expenditure can also change, for example in response to changes in ore reserves or production rates. As a result there could be significant adjustments to the provision for close down and restoration and environmental clean up, which would affect future financial results.
Overburden removal costs
In open pit mining operations, it is necessary to remove overburden and other barren waste materials to access ore from which minerals can economically be extracted. The process of mining overburden and waste materials is referred to asstripping. During the development of a mine, before production commences, it is generally accepted that stripping costs are capitalised as part of the investment in construction of the mine.
Where a mine operates several open pits that are regarded as separate operations for the purpose of mine planning, stripping costs are accounted for separately by reference to the ore from each separate pit. If, however, the pits are highly integrated for the purpose of mine planning, the second and subsequent pits are regarded as extensions of the first pit in accounting for stripping costs. In such cases, the initial stripping of the second and subsequent pits is considered to be production phase stripping relating to the combined operation.
Stripping of waste materials continues during the production stage of the mine or pit. Some mining companies expense these production stage stripping costs as incurred, while others defer such stripping costs. In operations that experience material fluctuations in the ratio of waste materials to ore or contained minerals on a year to year basis over the life of the mine or pit, deferral of stripping costs reduces the volatility of the cost of stripping expensed in individual
| Rio Tinto 2006 Form 20-F | 84 |
Back to Contents
reporting periods. Those mining companies that expense stripping costs as incurred will therefore report greater volatility in the results of their operations from period to period.
Rio Tinto defers production stage stripping costs for those operations where this is the most appropriate basis for matching costs with the related economic benefits and the effect is material. Stripping costs incurred in the period are deferred to the extent that the current period ratio exceeds the life of mine or pit ratio. Such deferred costs are then charged against reported profits to the extent that, in subsequent periods, the ratio falls short of the life of mine or pit ratio. The life of mine or pit ratio is based on the proven and probable reserves of the mine or pit and is obtained by dividing the tonnage of waste mined either by the quantity of ore mined or by the quantity of minerals contained in the ore. In some operations, the quantity of ore is a more practical basis for matching costs with the related economic benefits where there are important by products or where the grade of the ore is relatively stable from year to year.
The life of mine or pit waste-to-ore ratio is a function of the pit design and therefore changes to that design will generally result in changes to the ratio. Changes in other technical or economic parameters that impact on reserves will also have an impact on the life of mine or pit ratio even if they do not affect the pit design. Changes to the life of mine or pit ratio are accounted for prospectively.
In the production stage of some operations, further development of the mine or pit requires a phase of unusually high overburden removal activity that is similar in nature to preproduction mine development. The costs of such unusually high overburden removal activity are deferred and charged against reported profits in subsequent periods on a units of production basis. This accounting treatment is consistent with that for stripping costs incurred during the development phase of a mine or pit, before production commences.
Deferred stripping costs are included in property, plant and equipment or in investment in equity accounted units, as appropriate. These form part of the total investment in the relevant cash generating unit, which is reviewed for impairment if events or changes in circumstances indicate that the carrying value may not be recoverable. Amortisation of deferred stripping costs is included in operating costs or in the Group’s share of the results of its jointly controlled entities and associates as appropriate.
During 2006, production stage stripping costs incurred by subsidiaries and equity accounted operations exceeded the amounts charged against pre tax profit, which included net impairment reversals of US$36 million, by US$56 million (2005: US$93 million). The net book value carried forward in property, plant and equipment and in investments in equity accounted units at 31 December 2006 was US$929 million (2005: US$ 845 million).
Information about the stripping ratios of the business units, including equity accounted units, that account for the majority of the deferred stripping balance at 31 December 2006, along with the year in which deferred stripping is expected to be fully amortised, is set out in the following table:
| | | Actual stripping ratio for the year | | Life of mine stripping ratio | |
| | |
| |
| |
| | | 2004 | | 2005 | | 2006 | | 2004 | | 2005 | | 2006 | |
|
|
|
|
|
|
|
|
|
|
|
|
| |
| Kennecott Utah Copper (2019) (a) (b) | | 1.83 | | 2.02 | | 2.04 | | 1.24 | | 1.51 | | 1.36 | |
| Argyle Diamonds (2009) (a) | | 6.70 | | 6.60 | | 4.00 | | 4.91 | | 4.40 | | 4.40 | |
| Grasberg Joint Venture (2015) (a) | | 3.39 | | 3.12 | | 3.01 | | 2.43 | | 2.43 | | 2.63 | |
| Diavik (2008) (c) | | 1.47 | | 1.21 | | 0.89 | | 0.94 | | 0.91 | | 0.96 | |
| Escondida (2042) (d) | | 0.11 | | 0.09 | | 0.08 | | 0.11 | | 0.12 | | 0.12 | |
|
|
|
|
|
|
|
|
|
|
|
|
| |
| Notes |
| (a) | Strip ratios shown are waste to ore. |
| (b) | Kennecott’s life of mine strip ratio decreased as the latest mine plan provides for the pit walls to be made steeper in an area within the mine which resulted in adding ore without adding waste. |
| (c) | Diavik’s strip ratio is disclosed as bank cubic metre per carat. |
| (d) | Escondida’s strip ratio is based on waste tonnes to pounds of copper mined. |
Borax capitalised stripping costs as part of a distinct period of new development during the production stage of the mine. Capitalisation stopped in 2004. The capitalised costs will be fully amortised in 2034.
In 2006, the Group adopted EITF Issue No. 04-06 'Accounting for Stripping Costs Incurred during Production in the Mining Industry' ('EITF 04-06') for US GAAP. Under EITF 04-06, stripping costs incurred during the production phase of a surface mine are considered variable production costs that should be recorded directly as a component of production cost, except to the extent they can be attributed to inventory in accordance with normal inventory valuation principles.
As a consequence, on 1 January 2006 a cumulative adjustment of US$651 million (US$415 million net of taxation) attributable to subsidiaries was recognised directly in US GAAP equity. A further US$94 million net of taxation related to equity accounted units was recognised directly in US GAAP equity.
Deferred tax on mining rights
On transition to EU IFRS with effect from 1 January 2004, deferred tax was provided in respect of fair valueadjustments on acquisitions in previous years. No other adjustments were made to the assets and liabilities recognised in such prior year acquisitions and, accordingly, shareholders’ funds were reduced by US$720 million on transition to EU IFRS primarily as a result of deferred tax on fair value adjustments to mining rights. In general, these mining rights are not eligible for income tax allowances. In such cases, the provision for deferred tax was based on the difference between their carrying value and their nil income tax base. The existence of a tax base for capital gains tax purposes
| Rio Tinto 2006 Form 20-F | 85 |
Back to Contents
was not taken into account in determining the deferred tax provision relating to such mineral rights because it is expected that the carrying amount will be recovered primarily through use and not from the disposal of the mineral rights. Also, the Group is only entitled to a deduction for capital gains tax purposes if the mineral rights are sold or formally relinquished.
For acquisitions after 1 January 2004 provision for deferred tax on acquisition results in a corresponding increase in the amounts attributed to acquired assets and/or goodwill under EU IFRS.
Under US GAAP, such provisions for deferred tax result in corresponding increases in the amounts attributed to acquired assets and/or goodwill irrespective of the date of acquisition. The different treatment of acquisitions prior to 1 January 2004, results in higher shareholders’ funds under US GAAP.
Post retirement benefits
For defined benefit post employment plans, the Group has adopted the option under IAS 19 to recognise the difference between the fair value of the plan assets (if any) and the present value of the plan liabilities as an asset or liability on the balance sheet and to record actuarial gains and losses directly in the Statement of Recognised Income and Expense.
The most significant assumptions used in accounting for post retirement plans are the long term rate of return on plan assets, the discount rate and the mortality assumptions.
The long term rate of return on plan assets is used to calculate interest income on pension assets, which is credited to the Group’s income statement. The discount rate is used to determine the net present value of future liabilities and each year the unwinding of the discount on those liabilities is charged to the Group’s income statement. The mortality assumption is used to project the future stream of benefit payments, which is then discounted to arrive at the net present value of liabilities.
Valuations are carried out using the projected unit method.
The expected rate of return on pension plan assets is determined as management’s best estimate of the long term return on the major asset classes, ie equity, debt, real estate and other, weighted by the actual allocation of assets among the categories at the measurement date. The expected rate of return is calculated using geometric averaging.
The sources used to determine management’s best estimate of long term returns are numerous and include country specific bond yields, which may be derived from the market using local bond indices or by analysis of the local bond market, and country specific inflation and investment market expectations derived from market data and analysts’ or governments’ expectations as applicable.
In particular, the Group estimates long term expected real returns on equity, ie returns in excess of inflation, based on the economic outlook, analysts’ views and those of other market commentators. This is the most subjective of the assumptions used and it is reviewed regularly to ensure that it remains consistent with best practice.
The discount rate used in determining the service cost and interest cost charged to income is the market yield at the start of the year on high quality corporate bonds. For countries where there is no deep market in such bonds the yield on Government bonds is used. For determining the present value of obligations shown on the balance sheet, market yields at the balance sheet date are used.
Details of the key assumptions are set out in note 46 to the 2006 financial statements.
For 2006 the charge against income for post retirement benefits net of tax and minorities was US$158 million under EU IFRS. Under US GAAP the net cost was US$200 million. These charges include both pension and post retirement healthcare benefits. The charges are net of the expected return on assets which (net of tax and minorities) was US$228 million under EU IFRS and US$209 million under US GAAP.
In calculating the 2006 EU IFRS expense the average future increase in compensation levels was assumed to be 4.7 per cent and the same rate will be used for 2007. For US GAAP, the 2006 average future increase in compensation levels was assumed to be 4.6 per cent and this will remain at 4.6 per cent for 2007. For EU IFRS, the average discount rate used for the Group’s plans in 2006 was 5.0 per cent and the average discount rate used in 2007 will be 5.4 per cent. This increase is attributable to higher bond yields across all regions. For US GAAP, the average discount rate used for the Group’s plans in 2006 was 5.2 per cent and the average discount rate to be used in 2007 will be 5.4 per cent. This is also due to higher bond yields.
For both EU IFRS and US GAAP, the average expected long term rate of return on assets used to determine 2006 pension cost was 6.3 per cent. This will increase to 6.9 per cent for 2007. This is due to an increase in bond yields and a change in the methodology for setting the expected return on equity. Previously, the expected return on equities was set by reference to a fixed margin above inflation. This will be amended for 2007 so that the expected return on equities will be set by adding a risk premium to the yield on government bonds. This methodology is more consistent with that used by other major organisations and is considered to be more theoretically robust.
Based on the known changes in assumptions noted above and other expected circumstances, the impact of post retirement costs on the Group’s EU IFRS net earnings in 2007 would be expected to decrease by some US$26 million to US$132 million. The impact of post-retirement benefits on the Group’s US GAAP net earnings in 2006 would be expected to decrease by some US$28 million to US$172 million. The actual charge may be impacted by other factors that cannot be predicted, such as the effect of changes in benefits and exchange rates.
The table below sets out the potential change in the Group’s 2006 net earnings (after tax and outside interests) that would result from hypothetical changes to post retirement assumptions and estimates. The sensitivities are viewed for each assumption in isolation.
| Rio Tinto 2006 Form 20-F | 86 |
Back to Contents
| | EU IFRS | | US GAAP | |
| Sensitivity of Group’s 2006 net earnings to changes in: | US$m | | US$m | |
|
|
|
| |
| Expected return on assets | | | | |
| – increase of 1 percentage point | 26 | | 24 | |
| – decrease of 1 percentage point | (26 | ) | (24 | ) |
| Discount rate | | | | |
| – increase of 0.5 percentage points | 1 | | 8 | |
| – decrease of 0.5 percentage points | (1 | ) | (8 | ) |
| Salary increases | | | | |
| – increase of 0.5 percentage points | (4 | ) | (6 | ) |
| – decrease of 0.5 percentage points | 4 | | 6 | |
| Demographic – allowance for additional future mortality improvements | | | | |
| – overall increase of 5% in benefit obligation | (11 | ) | (18 | ) |
| – overall decrease of 5% in benefit obligation | 11 | | 18 | |
|
|
|
| |
The figures in the above table only show the impact on net earnings. Changing the assumptions would also have an impact on the balance sheet.
The impact on cash flow in 2006 of the Group’s pension plans, being the employer contributions to defined benefit and defined contribution pension plans, was US$172 million. In addition there were contributions of US$19 million in respect of unfunded healthcare schemes. Contributions to pension plans for 2007 are estimated to be around US$8m higher than for 2006. Healthcare plans are unfunded and contributions for future years will be equal to benefit payments and therefore cannot be predetermined.
Further information on pensions and other post retirement benefits is given in note 46 to the 2006 financial statements.
US deferred tax potentially recoverable
Rio Tinto’s US tax group have Alternative Minimum Tax (AMT) credits and temporary differences, which have thepotential to reduce tax charges in future years. These potential reductions in future tax charges (‘possible tax assets’) totalled US$577 million at 31 December 2005. An asset of US$10 million was recognised in the balance sheet at 31 December 2005 based on utilisation of AMT credits projected for 2006.
Principally as a result of current high commodity prices, US$140 million of these possible tax assets were realised in 2006. Updated projections of future taxable profits for the operations that form part of Rio Tinto’s US tax group resulted in the recognition of a further deferred tax asset of US$335 million during 2006. Having taken account of other adjustments this leaves possible tax assets of US$65 million. Recoveries are dependent on future commodity prices, costs, financing arrangements and business developments in future years.
Exploration
During the year the Group changed its policy on accounting for exploration and evaluation expenditure. Previously, theGroup capitalised exploration and evaluation expenditure from acquisition of a beneficial interest or option in mineral rights. Full provision was made for impairment unless there was a high degree of confidence in the project’s viability and hence it was considered probable that future economic benefits would flow to the Group. If, as a result of developments in subsequent periods, the expenditure was considered to be recoverable, such provisions were reversed. Under the Group’s revised policy, exploration and evaluation expenditure is not capitalised until the point is reached at which there is a high degree of confidence in the project’s viability and it is considered probable that future economic benefits will flow to the Group. This change was made to improve the alignment of Rio Tinto’s accounting with the way that EU IFRS is being applied generally. Under US GAAP, exploration and evaluation expenditure is expensed as incurred.
The carrying values of exploration assets are reviewed twice per annum by management and the results of these reviews are reported to theAudit committee. There may only be mineralised material to form a basis for the impairment review. The review is based on a status report regarding the Group’s intentions for development of the undevelopedproperty. In some cases, the undeveloped properties are regarded as successors to orebodies currently in production and will therefore benefit from existing infrastructure and equipment.
Temporary differences related to closure costs and finance leases
Under the ‘initial recognition’ rules in paragraphs 15 and 24 of IAS 12 ‘Income Taxes’, deferred tax is not provided onthe initial recognition of an asset or liability in a transaction that does not affect accounting profit or taxable profit and is not a business combination.
The Group’s interpretation of these initial recognition rules has the result that no deferred tax asset is provided on the recognition of a provision for close down and restoration costs and the related asset or on recognition of assets held under finance leases and the associated lease liability, except where these are recognised as a consequence of business combinations.
| Rio Tinto 2006 Form 20-F | 87 |
Back to Contents
On creation of the closure provision, for instance, there is no effect on accounting or taxable profit because the cost is capitalised. As a result, the initial recognition rules would appear to prevent the recognition of a deferred taxasset in respect of the provision and of a deferred tax liability in respect of the related capitalised amount.
The temporary differences will reverse in future periods as the closure asset is depreciated and when tax deductible payments are made that are charged against the provision. Paragraph 22 of IAS 12 extends the initial recognition rules to the reversal of temporary differences on assets and liabilities to which the initial recognition rules apply. Therefore, deferred tax is not recognised on the changes in the carrying amount of the asset which result from depreciation or from the changes in the provision resulting from expenditure. When tax relief on expenditure is received this will be credited to the income statement as part of the current tax charge. The unwind of the discount applied in establishing the present value of the closure costs does affect accounting profit. Therefore, this unwinding of discount results in the recognition of deferred tax assets.
The application of this initial recognition exemption has given rise to diversity in practice: some companies do provide for deferred tax on closure cost provisions and the related capitalised amounts. Deferred tax accounting on initial recognition is currently the subject of an IASB/FASB convergence project which may at some future time require the Group to change this aspect of its deferred tax accounting policy.
If the Group were to provide for deferred tax on closure costs and finance leases under EU IFRS (as is already the case for US GAAP), the impact on net earnings and shareholders’ equity would be as follows:
| | | | | | Impact on closing | |
| | Impact on net earnings | | shareholders’ equity | |
| |
| |
| |
| | US$m | | % | | US$m | | % | |
|
|
|
|
|
|
|
| |
| 2006 | 9 | | .001 | % | 127 | | .007 | % |
| 2005 | 15 | | .003 | % | 120 | | .008 | % |
| 2004 | 20 | | .006 | % | 105 | | .008 | % |
|
|
|
|
|
|
|
| |
Contingencies
Disclosure is made of material contingent liabilities unless the possibility of any loss arising is considered remote. Contingencies are disclosed in note 33 to the 2006 financial statements. These include tax assessments in Australia ofapproximately A$515 million which, based on Counsels’ opinion, the Group expects to be successful in challenging.
Underlying earnings
The Group presents ‘Underlying earnings’ as an additional measure to provide greater understanding of the underlyingbusiness performance of its operations. The adjustments made to net earnings to arrive at underlying earnings are explained above in the section on underlying earnings.
| Rio Tinto 2006 Form 20-F | 88 |
Back to Contents
| Item 6. | Directors, Senior Management and Employees |
| | |
| | | | | | | | Committee on social | |
| | Audit | | Nominations | | Remuneration | | and environmental | |
| | committee | | committee | | committee | | accountability | |
|
|
|
|
|
|
|
| |
| Chairman | | | | | | | | |
| Paul Skinner | | | • | | | | | |
| | | | | | | | | |
| Chief executive | | | | | | | | |
| Tom Albanese | | | | | | | | |
| | | | | | | | | |
| Finance director | | | | | | | | |
| Guy Elliott | | | | | | | | |
| | | | | | | | | |
| Non executive directors | | | | | | | | |
| Ashton Calvert AC * | | | • | | | | • | |
| Sir David Clementi * | • | | | | • | | | |
| Vivienne Cox * | • | | | | | | | |
| Sir Rod Eddington * | | | • | | | | • | |
| Michael Fitzpatrick * | • | | | | • | | | |
| Richard Goodmanson * | | | | | • | | • | |
| Andrew Gould * | • | | | | • | | | |
| Lord Kerr of Kinlochard * | • | | | | | | • | |
| David Mayhew | | | • | | | | | |
| Sir Richard Sykes * | | | • | | • | | | |
|
|
|
|
|
|
|
| |
| * Independent | | | | | | | | |
CHAIRMAN
Paul SkinnerBA (Hons) (Law), DpBA (Business Administration) age 62.
Appointment and election:Director of Rio Tinto plc and Rio Tinto Limited since 2001, he was appointed chairman of the Group in November 2003. Paul was last re-elected by shareholders in 2005 and is chairman of the Nominations committee (note b).
Skills and experience:Paul graduated in law from Cambridge University and in business administration from Manchester Business School. He was previously a managing director of The “Shell” Transport and Trading Company plc and group managing director of The Royal Dutch/Shell Group of Companies, for whom he had worked since 1966. During his career he worked in all Shell’s main businesses, including senior appointments in the UK, Greece, Nigeria, New Zealand and Norway. He was CEO of its global Oil Products business from 1999 to 2003.
External appointments (current and recent):
Director of The ‘Shell’ Transport and Trading Company plc from 2000 to 2003.
Director of Standard Chartered plc since 2003.
Director of the Tetra Laval Group since 2005.
Director of L’Air Liquide SA since 2006.
Chairman of the International Chamber of Commerce (UK) since 2005.
Non executive member of the Defence Management Board of the UK Ministry of Defence since June 2006.
Member of the board of INSEAD business school since 1999.
CHIEF EXECUTIVE
Tom AlbaneseBS (Mineral Economics) MS (Mining Engineering) age 49.
Appointment and election: Director of Rio Tinto plc and Rio Tinto Limited since March 2006. Tom was elected byshareholders in 2006.
Skills and experience:Tom joined Rio Tinto in 1993 on Rio Tinto’s acquisition of Nerco and held a series ofmanagement positions before being appointed chief executive of the Industrial Minerals group in 2000, after which he became chief executive of the Copper group and head of Exploration in 2004. He took over as chief executive from Leigh Clifford with effect from 1 May 2007.
External appointments (current and recent):
Director of Ivanhoe Mines Limited since November 2006.
Director of Palabora Mining Company from 2004 to 2006.
Member of the Executive Committee of the International Copper Association from 2004 to 2006.
| Rio Tinto 2006 Form 20-F | 89 |
Back to Contents
FINANCE DIRECTOR
Guy ElliottMA (Oxon) MBA (INSEAD) age 51.
Appointment and election:Finance director of Rio Tinto plc and Rio Tinto Limited since 2002. Guy was last re-elected by shareholders in 2007.
Skills and experience:Guy joined the Group in 1980 after gaining an MBA. He has subsequently held a variety of commercial and management positions, including head of Business Evaluation and president of Rio Tinto Brasil.
External appointments (current and recent):
None.
NON EXECUTIVE DIRECTORS
Ashton CalvertAC, BSc (Hons) (Tas), DPhil (Oxon), Hon DSc (Tas) age 61.
Appointment and election:Director of Rio Tinto plc and Rio Tinto Limited since 2005. Ashton was re-elected by shareholders in 2007 (notes b, d and e).
Skills and experience:Ashton retired as secretary of the Department of Foreign Affairs and Trade of the Governmentof Australia in January 2005 after six and a half years in that position. He was educated at the University of Tasmania and, as a Rhodes scholar, also gained a doctorate in mathematics from Oxford University. During his career in the Australian foreign service he held appointments in Washington and, on four occasions, in Tokyo, where he was ambassador prior to his appointment as secretary. In these and other roles he developed extensive experience of the Asian countries which represent key markets for Rio Tinto.
External appointments (current and recent):
Director of Woodside Petroleum Limited since 2005.
Director of The Australian Trade Commission between 1998 and 2005.
Director of The Export Finance and Insurance Corporation between 1998 and 2005.
Director of The Australian Strategic Policy Institute between 2001 and 2005.
Sir David ClementiMA, MBA, FCA age 57.
Appointment and election:Director of Rio Tinto plc and Rio Tinto Limited since 2003. Sir David was last re-elected by shareholders in 2006 (notes a, c and e).
Skills and experience: Sir David is chairman of Prudential plc, prior to which he was Deputy Governor of the Bank ofEngland. His earlier career was with Kleinwort Benson where he spent 22 years, holding various positions including chief executive and vice chairman. A graduate of Oxford University and a qualified chartered accountant, Sir David also holds an MBA from Harvard Business School.
External appointments (current and recent):
Chairman of Prudential plc since 2002.
Member of the Financial Reporting Council since 2003.
Vivienne CoxMA (Oxon), MBA (INSEAD) age 47.
Appointment and election:Director of Rio Tinto plc and Rio Tinto Limited since 2005. Vivienne was elected by shareholders in 2005 (notes a and e).
Skills and experience: Vivienne is currently executive vice president of BP p.l.c. for Gas Power & Renewables. She isa member of the BP group chief executive’s committee. She holds degrees in chemistry from Oxford University and in business administration from INSEAD. During her career in BP she has worked in chemicals, exploration, finance, and refining and marketing.
External appointments (current and recent):
Non executive Director of Eurotunnel plc between 2002 and 2004.
Sir Rod EddingtonB.Eng M.Eng (University of Western Australia), D.Phil (Oxon) age 57.
Appointment and election: Director of Rio Tinto plc and Rio Tinto Limited since 2005. Sir Rod was elected byshareholders in 2006 (notes b, d and e).
Skills and experience:Sir Rod was chief executive of British Airways Plc until the end of September 2005. Prior to hisrole with British Airways, Sir Rod was Managing Director of Cathay Pacific Airways from 1992 until 1996 and Executive Chairman of Ansett Airlines from 1997 until 2000.
External appointments (current and recent):
Director of News Corporation plc since 1999.
Director of John Swire & Son Pty Limited since 1997.
Non executive chairman of JPMorgan Australia and New Zealand since January 2006.
Director of CLP Holdings since January 2006.
Director of Allco Finance Group Limited since July 2006.
Chief executive British Airways Plc from 2000 until 2005.
Chairman of the EU/Hong Kong Business Co-operation Committee of the Hong Kong Trade Development Council from 2002 until March 2006.
| Rio Tinto 2006 Form 20-F | 90 |
Back to Contents
Michael FitzpatrickB. Eng (University of Western Australia), BA (Oxon) age 54.
Appointment and election:Director of Rio Tinto plc and Rio Tinto Limited since June 2006. Michael was elected byshareholders in 2007 (notes a, c
and e).
Skills and experience:Michael recently sold his interest in, and ceased to be a director of, Hastings Funds ManagementLtd., the pioneering infrastructure asset management company which he founded in 1994. He is Chairman of the Victorian Funds Management Corporation, which manages funds on behalf of the State of Victoria, and of Treasury Group Limited, an incubator of fund management companies. He is a commissioner of the Australian Football League, having previously played the game professionally, and is a former chairman of the Australian Sports Commission.
External appointments (current and recent):
Managing Director of Hastings Funds Management Ltd from 1994 to 2006.
Chairman of the Victorian Funds Management Corporation since 2006.
Chairman of Treasury Group Limited since 2005.
Director of Pacific Hydro Limited from 1996 to 2004.
Director of Australian Infrastructure Fund Limited from 1994 to 2005.
Director of the Walter & Eliza Hall Institute of Medical Research since 2001.
Richard GoodmansonMBA (Columbia University), BEc and BCom (University of Queensland), B. Eng. – Civil (Royal Military College, Duntroon)
age 59.
Appointment and election: Director of Rio Tinto plc and Rio Tinto Limited since 2004. He was elected by shareholders in 2005 and is chairman of the Committee on social and environmental accountability (notes c, d and e).
Skills and experience: Richard is executive vice president and chief operating officer of DuPont. During his career he has worked at senior levels for McKinsey & Co, PepsiCo and American West Airlines, where he was president and CEO. He joined DuPont in early 1999 and in his current position has responsibility for a number of the global functions, and for the non US operations of DuPont, with particular focus on growth in emerging markets.
External appointments (current and recent):
Executive vice president and chief operating officer of DuPont since 1999.
Chairman of the United Way of Delaware since January 2006 (director since 2002).
Director of the Boise Cascade Corporation between 2000 and 2004.
Andrew GouldBA FCA age 60.
Appointment and election: Director of Rio Tinto plc and Rio Tinto Limited since 2002. Andrew was last re-elected by shareholders in 2006. He is also chairman of the Audit committee (notes a, c and e).
Skills and experience: Andrew is chairman and chief executive officer of Schlumberger Limited, where he has held asuccession of financial and operational management positions, including that of executive vice president of Schlumberger Oilfield Services and president and chief operating officer of Schlumberger Limited. He has worked in Asia, Europe and the US. He joined Schlumberger in 1975. He holds a degree in economic history from Cardiff University and qualified as a chartered accountant with Ernst & Young.
External appointments (current and recent):
Chairman and Chief Executive Officer of Schlumberger Limited since 2003.
Member of the Advisory Board of the King Fahd University of Petroleum and Minerals in Dhahran, Saudi Arabia since January 2007.
Member of the commercialization advisory board of Imperial College of Science Technology and Medicine, London since 2002.
Member of the UK Prime Minister’s Council of Science and Technology from 2004 to February 2007.
Lord Kerr of KinlochardGCMG MA age 65.
Appointment and election: Director of Rio Tinto plc and Rio Tinto Limited since 2003. He was re-elected byshareholders in 2007 (notes a, d and e).
Skills and experience:An Oxford graduate, he was in the UK Diplomatic Service for 36 years an d headed it from 1997 to 2002 as Permanent Under Secretary at the Foreign Office. His foreign service included periods in the Soviet Union and Pakistan, and as Ambassador to the European Union (1990 to 1995), and the US (1995 to 1997). He has been a member of the House of Lords since 2004.
External appointments (current and recent):
Deputy Chairman of Royal Dutch Shell plc since 2005.
Director of The “Shell” Transport and Trading Company plc from 2002 to 2005.
Director of The Scottish American Investment Trust plc since 2002.
Chairman of the Court and Council of Imperial College, London since 2005.
Trustee of the Rhodes Trust since 1997, The National Gallery since 2002, and the Carnegie Trust for the Universities of Scotland since 2005.
| Rio Tinto 2006 Form 20-F | 91 |
Back to Contents
David Mayhewage 66.
Appointment and election:Director of Rio Tinto plc and Rio Tinto Limited since 2000. He was last re-elected byshareholders in 2006 (note b).
Skills and experience:David joined Cazenove in 1969 from Panmure Gordon. In 1972 he became the firm’s dealing partner and was subsequently responsible for the Institutional Broking Department. From 1986 until 2001 he was thepartner in charge of the firm’s Capital Markets Department. He became Chairman of Cazenove on incorporation in 2001 and Chairman of JPMorgan Cazenove in 2005.
External appointments (current and recent):
Chairman of Cazenove Group Limited (formerly Cazenove Group plc) since 2001.
Chairman of Cazenove Capital Holdings Limited since 2005.
Sir Richard SykesBSc (Microbiology) PhD (Microbial Biochemistry), DSc, Kt, FRS, FMedSci age 64.
Appointment and election: Director of Rio Tinto plc and Rio Tinto Limited since 1997. Sir Richard was appointed the senior non executive director in 2005 and is chairman of the Remuneration committee. Sir Richard was re-elected for a further term of office in 2007 but his intention is to retire after the annual general meetings in 2008 (notes b, c and e).
Skills and experience: After reading microbiology at the University of London, Sir Richard obtained doctorates in microbial chemistry and in science from the University of Bristol and the University of London respectively. A former chairman of GlaxoSmithKline plc Sir Richard is a Fellow of the Royal Society. He is currently Rector of Imperial College London.
External appointments (current and recent):
Director of Lonza Group Limited since 2003, Deputy Chairman since 2005.
Chairman of the Healthcare Advisory Group (Apax Partners Limited) since 2002.
Chairman of Metabometrix Ltd since 2004.
Chairman of Merlion Pharmaceuticals Pte Limited since 2005.
Chairman of OmniCyte Ltd since 2006
Chairman of Circassia Ltd since 2007
Director of Abraxis BioScience Inc since 2006.
Director of Bio*One Capital Pte Ltd since 2003
Chairman of GlaxoSmithKline plc between 2000 and 2002.
Rector of Imperial College London since 2001.
Trustee of the Natural History Museum, London between 1996 and 2005 and of the Royal Botanic Gardens, Kew between 2003 and 2005.
DIRECTOR RETIRING AT CONCLUSION OF THE 2007 ANNUAL GENERAL MEETINGS
Leigh CliffordB Eng (Mining), M Eng Sci age 59.
Appointment and election:Director of Rio Tinto plc since 1994 and Rio Tinto Limited since 1995, he was appointed chief executive in 2000.
Skills and experience: Leigh graduated from the University of Melbourne as a mining engineer and gained a Master of Engineering Science degree from the same University. He has held various roles in the Group’s coal and metalliferous operations since joining in 1970, including managing director of Rio Tinto Limited and chief executive of the Energygroup. He was a member of the Coal Industry Advisory Board of the International Energy Agency for a number of years and its chairman from 1998 to 2000.
External appointments (current and recent):
Director Barclays Bank plc since 2004.
Chairman of the International Council on Mining & Metals since October 2006.
Director of Freeport-McMoRan Copper & Gold Inc between 2000 and 2004.
Appointed to Bechtel Board of Counsellors in May 2007.
| Notes |
| (a) | Audit committee |
| | (Sir David Clementi, Vivienne Cox, Michael Fitzpatrick, Andrew Gould and Lord Kerr of Kinlochard) |
| (b) | Nominations committee |
| | (Paul Skinner, Ashton Calvert, Sir Rod Eddington, David Mayhew and Sir Richard Sykes) |
| (c) | Remuneration committee |
| | (Sir David Clementi, Michael Fitzpatrick, Richard Goodmanson, Andrew Gould and Sir Richard Sykes) |
| (d) | Committee on social and environmental accountability |
| | (Ashton Calvert, Sir Rod Eddington, Richard Goodmanson and Lord Kerr of Kinlochard) |
| (e) | Independent |
| | (Ashton Calvert, Sir David Clementi, Vivienne Cox, Sir Rod Eddington, Michael Fitzpatrick, Richard Goodmanson, Andrew Gould, Lord Kerr ofKinlochard, Sir Richard Sykes) |
| Rio Tinto 2006 Form 20-F | 92 |
Back to Contents
GROUP EXECUTIVES
For accounting standards purposes (IAS 24 and AASB 124) the Group’s key management personnel as defined, comprises the directors and the product group chief executives. From 1 June 2007 they include the Group executive Technology and Innovation, and the Group executive Business Resources.
Preston ChiaroBSc (Hons) Environmental Engineering, MEng Environmental Engineering), age 53.
Skills and experience:Preston was appointed chief executive of the Energy group in September 2003. He heads theGroup’s climate change and sustainable development leadership panels. He joined the Group in 1991 at Kennecott Utah Copper’s Bingham Canyon mine as vice president, technical services. In 1995 he became vice president and general manager of the Boron operations in California. He was chief executive of Rio Tinto Borax from 1999 to 2003.
External appointments (current and recent):
Director of the World Coal Institute since 2003 (chairman since November 2006).
Member of the Executive board of the Coal Industry Advisory Board to the International Energy Agency since 2004.
Director of Energy Resources of Australia Limited
Director of Coal & Allied Industries Limited between 2003 and September 2006.
Director of Rössing Uranium Limited since 2004.
Bret ClaytonBA (Accounting), age 44.
Skills and experience: Bret was appointed chief executive of the Copper group in July 2006. He joined the Group in 1995 and has held a series of management positions, including chief financial officer of Rio Tinto Iron Ore and president and chief executive officer of Rio Tinto Energy America. Prior to joining the Group, Bret worked for PricewaterhouseCoopers for nine years, auditing and consulting to the mining industry.
External appointments (current and recent):
Member of the Executive Committee of the International Copper Association since July 2006.
Oscar GroeneveldBE (Mining), MSc, DIC age 53.
Skills and experience:Oscar has been with the Group for over 30 years and was appointed chief executive of theAluminium group in October 2004. Oscar has qualifications in engineering, science and management and is also responsible for Rio Tinto Japan, Kennecott Land and heads the Group’s safety leadership panel. He has occupied senior roles in coal, aluminium and technology and was the Copper group chief executive from 1999 to 2004. He was an executive director of the Group from 1998 to 2004.
External appointments (current and recent):
Director of Australian Aluminium Council since 2004.
Chairman of International Aluminium Institute since 2006.
Director of Rio Tinto plc and Rio Tinto Limited between 1998 and 2004.
Director of Freeport-McMoRan Copper & Gold Inc between 1999 and 2004.
Director of Palabora Mining Company Limited between 1999 and 2004.
Keith JohnsonBSc (Mathematics), MBA age 45.
Skills and experience:Keith was appointed Group executive Business Resources on 1 June 2007 having been chief executive, Diamonds since 2003. He holds degrees in mathematics and management and is a Fellow of the RoyalStatistical Society. Prior to joining Rio Tinto he worked in analytical roles in the UK Treasury, private consulting and the oil industry. He joined Rio Tinto in 1991 and has held a series of management positions including head of Business Evaluation and managing director of Comalco Mining and Refining.
External appointments (current and recent):
None.
Andrew MackenzieBSc (Geology), PhD (Chemistry) age 50.
Skills and experience: Andrew was appointed chief executive Diamonds and Minerals on 1 June 2007. He joined RioTinto in 2004 as chief executive Industrial Minerals from BP Petrochemicals where he was group vice president. He spent 22 years with BP primarily in the UK and North America in senior positions including head of Capital Markets in BP Finance, chief reservoir engineer with oversight of oil and gas reserves and production, head of Government and Public Affairs worldwide and group vice president Technology which included responsibility for research and development and engineering.
External appointments (current and recent):
Director of Centrica plc since 2005. Trustee of Demos since 1998.
| Rio Tinto 2006 Form 20-F | 93 |
Back to Contents
Grant ThorneBSc (Hons) Metallurgy, PhD (Mineral Processing) age 57.
Skills and experience:
Grant was appointed Group executive Technology and Innovation on 1 June 2007. After tertiarystudy at the University of Queensland, he joined the Group in 1975 and has held senior operational roles in base metals, aluminium and coal. He was Vice-president of Research and Technology for Comalco from 1994 to 1995. His service has included appointments in Australia, Indonesia, Papua New Guinea and UK. Prior to his current appointment, he was Managing Director of Rio Tinto’s coal business in Australia. Grant is a Fellow and Chartered Professional (Management) of the Australasian Institute of Mining and Metallurgy.
External appointments (current and recent):
Member of the Coal Industry Advisory Board to the International Energy Agency from 2002 to 2006
Director of The Wesley Research Institute from 2002 to 2003
President of the Queensland Resources Council from 2002 to 2004
Managing Director of Coal and Allied Industries from 2004 to 2006
Sam WalshB Com (Melbourne) age 57.
Skills and experience:
Sam was appointed chief executive of the Iron Ore group in 2004. He joined Rio Tinto in 1991, following 20 years in the automotive industry at General Motors and Nissan Australia. He has held a number ofmanagement positions within the Group, including managing director of Comalco Foundry Products, CRA Industrial Products, Hamersley Iron Sales and Marketing, Hamersley Iron Operations, vice president of Rio Tinto Iron Ore (with responsibility for Hamersley Iron and Robe River) and from 2001 to 2004 chief executive of the Aluminium group. Sam is also a Fellow of the Australian Institute of Management, the Australian Institute of Company Directors and the Australasian Institute of Mining and Metallurgy.
External appointments (current and recent):
Director of the Australian Mines and Metals Association, between 2001 and 2005.
Director of the Australian Chamber of Commerce and Industry, between 2003 and 2005.
Director of the Committee for Perth Ltd since 2006.
COMPANY SECRETARIES
Anette LawlessMA, FCIS age 50.
Skills and experience:
Anette joined Rio Tinto in 1998 and became company secretary of Rio Tinto plc in 2000. Beforejoining Rio Tinto, she spent 11 years with Pearson plc, five of which as company secretary. She qualified as a chartered secretary in 1989 and became a fellow of the ICSA in 1992. She also holds an MA from the Copenhagen Business School.
External appointments (current and recent):
Member of the Regulatory Decisions Committee of the UK Financial Services Authority from 2001 to 2006.
Stephen ConsedineB Bus CPA age 45.
Skills and experience: Stephen joined Rio Tinto in 1983 and has held various positions in Accounting, Treasury, andEmployee Services before becoming company secretary of Rio Tinto Limited in 2002. He holds a bachelor of business degree and is a certified practising accountant.
External appointments (current and recent):
None.
EMPLOYEES
Information on the Group’s employees including their costs, is on pages 71 to 74, and in notes 4 and 34 to the 2006 financial statements.
REMUNERATION
The Remuneration report to shareholders dated 24 February 2006 has been reproduced below, except that the page numbers have been revised to reflect those in this combined annual report on Form 20-F, Tables 3, 4 and 5 have been augmented to show share interests as at the latest practicable date.
| Rio Tinto 2006Form 20-F | 94 |
Back to Contents
Remuneration report
Introduction
This report forms part of theDirectors’ reportand covers the following information: |
| • | a description of theRemuneration committeeand its duties; |
| • | a description of the policy on directors’, product group chief executives’ and company secretaries’ remuneration; |
| • | a summary of the terms of executive directors’ and product group chief executives’ contracts and non executivedirectors’ letters of appointment; |
| • | details of each director’s and product group chief executive’s remuneration and awards under long term incentiveplans and the link to corporate performance; |
| • | details of directors’ and product group chief executives’ interests in Rio Tinto shares; and |
| • | graphs illustrating Group performance, including relative to the HSBC Global Mining Companies’ Index. |
| |
Remuneration committee
The following independent, non executive directors were members of theRemuneration committeeduring 2006: |
| • | Sir Richard Sykes (chairman) |
| • | Sir David Clementi |
| • | Michael Fitzpatrick |
| • | Richard Goodmanson |
| • | Andrew Gould |
| |
| The committee met four times during 2006 and members’ attendance is set out on page 123. The committee’s responsibilities are set out in its Terms of Reference, which can be viewed on Rio Tinto’s website. They include: |
| • | recommending remuneration policy relating to the executives to the board; |
| • | reviewing and determining the remuneration of the product group chief executives and the company secretary ofRio Tinto plc; |
| • | reviewing and agreeing management’s strategy for remuneration and conditions of employment for managersother than the executives; |
| • | monitoring the effectiveness and appropriateness of general executive remuneration policy and practice; and |
| • | reviewing the chairman’s fees. |
Jeffery Kortum, global practice leader, Remuneration, attends the committee’s meetings in an advisory capacity. The chairman, Paul Skinner, the chief executive, Leigh Clifford and Tom Albanese, the chief executive designate, also participated in meetings at the invitation of the committee, but were not present when issues relating to their own remuneration were discussed. Anette Lawless, the company secretary of Rio Tinto plc, acts as secretary to the committee, but was not present when issues relating to her remuneration were discussed.
In 2004, the committee appointed Kepler Associates, an independent remuneration consultancy, to provide advice on executive remuneration matters. Apart from providing specialist remuneration advice, Kepler Associates has no links to the Group.
To carry out its duties in accordance with its Terms of Reference, the committee monitors global remunerationtrends and developments and draws on a range of external sources of data, in addition to that supplied by Kepler Associates, including publications by remuneration consultants Towers Perrin, Hay Group, Mercer and Watson Wyatt.
Corporate governance
The committee reviewed its Terms of Reference in 2006 and concluded that, in the course of its business, it had coveredthe main duties set out in the Combined Code on Corporate Governance, published by the UK Financial Reporting Council (the Code), and Principle 9 of the Australian Securities Exchange (ASX) Corporate Governance Council Principles of Good Corporate Governance and Best Practice Recommendations (the ASX Principles), and was constituted in accordance with the requirements of the Code and the ASX Principles.
The board considered the performance of the committee and confirmed that the committee had satisfactorilyperformed the duties set out in its Terms of Reference.
The 2006Remuneration reportwas approved by shareholders at the 2007 annual general meetings.
Executive remuneration
Rio Tinto is subject to a number of different reporting requirements for the contents of theRemuneration report. TheAustralian Corporations Act requires certain disclosures in respect of the five highest paid executives below board level, and Australian and International accounting standards (AASB 124 and IAS 24 respectively) both require additionaldisclosures for “key management personnel”. The board has considered the definition of “key management personnel” and has decided that, in addition to the executive and non executive directors, they comprise the six product group chief executives. In 2006, the five highest paid executives below board level in respect of whom disclosures are required are all product group chief executives. Throughout this report, the executive directors and the product group chief executives will collectively be referred to as the executives.
| Rio Tinto 2006Form 20-F | 95 |
Back to Contents
Board policy
Rio Tinto operates in global, as well as local markets, where it competes for a limited resource of talented executives. Itrecognises that to achieve its business objectives, the Group needs high quality, committed people.
Rio Tinto has therefore designed an executive remuneration policy to support its business goals by enabling it to attract, retain and appropriately reward executives of the calibre necessary to pro duce very high levels of performance. This policy is regularly reviewed to take account of changing market, industry and economic circumstances, as well as developing Group requirements.
| | The main principles of the Group’s executive remuneration policy are: |
| • | to provide total remuneration which is competitive in structure and quantum with comparator companies’practices in the regions and markets within which the Group operates; |
| • | to achieve clear alignment between total remuneration and delivered business and personal performance, withparticular emphasis on shareholder value creation and performance in the health, safety and environmental areas; |
| • | to link variable elements of remuneration to the achievement of challenging performance criteria that areconsistent with the best interests of the Group and shareholders over the short, medium and long term; |
| • | to provide an appropriate balance of fixed and variable remuneration; and |
| • | to provide appropriate relativities between executives within Rio Tinto, in order to support executive placementsto meet the needs of the Group. |
The composition of total remuneration packages for management, including the remuneration of the company secretaries, is designed to provide an appropriate balance between fixed and variable components. This is in line with Rio Tinto’s stated objective of aligning total remuneration with personal and business performance. Details of the executives’ remuneration composition are set out in Table 1 on pages 107 to 108.
The Group’s return to shareholders over the last five years is set out in the table on page 101.
Remuneration components
Base salary
Base salaries for executives are reviewed annually and adjusted as necessary, taking in to account the nature of the individual executive’s role, external market trends and business and personal performance. TheRemuneration committeeuses a range of international companies of a similar size, global reach and complexity to make this comparison.
Executive remuneration is explicitly related to business performance through the following long and short termarrangements:
| Short term incentive plan (STIP) |
| STIP is a cash bonus plan, designed to support overall remuneration policy by: |
| • | focusing participants on achieving calendar year performance goals which contribute to sustainable shareholdervalue; and |
| • | providing significant bonus differential based on performance against challenging personal, business, and othertargets, including safety. |
TheRemuneration committeereviews and approves performance targets and objectives for ex ecutives annually. Executive directors’ STIP payments are linked to three performance criteria: Group financial performance, Group safety performance and personal performance. Product group chief executives’ STIP payments are linked to Group and product group financial performance, product group safety performance and personal performance. Group and product group financial performance is partly measured on an actual underlying earnings basis and partly on a basis normalised for fluctuations of market prices and exchange rates.
The target level of bonus for executives for 2007 is 60 per cent of salary, the same as 2006. Executives may receive up to twice their target (ie up to 120 per cent of salary) for exceptional performance against all criteria.
Details relating to STIP awards for 2006 are on page 104.
Long term incentives
Shareholders approved two long term incentives for senior employees including executives at the annual generalmeetings in 2004, the Share Option Plan and the Mining Companies Comparative Plan.
These are intended to provide theRemuneration committeewith a means of linking management’s rewards toGroup performance. Total shareholder return (TSR) was, at the time of the introduction of these plans, considered the most appropriate measure of a company’s performance for the purpose of share based long term incentives and a TSR performance measure was therefore applied to both plans. The committee intends to review the incentive structure and performance criteria over the next 12 months to ensure continued relevance and effectiveness.
| Rio Tinto 2006Form 20-F | 96 |
Back to Contents
Share Option Plan (SOP)
Each year, theRemuneration committeeconsiders whether a grant of options should be made under the SOP, and if so,at what level. In arriving at a decision, the committee takes into consideration the personal performance of each executive as well as local remuneration practice. The maximum grant under the SOP is three times salary, based on the average share price over the previous financial year. Under the SOP, options are granted to purchase shares at a weighted average market price using the closing share price for the five days preceeding the grant. No options are granted at a discount and no amount is paid or payable by the recipient upon grant of the options. Grants made to executives are set out in Table 5 on pages 116 to 121.
No options will become exercisable unless the Group has met stretching performance conditions. In addition,before approving any vesting and regardless of performance against the respective performance conditions, theRemuneration committeeretains discretion to satisfy itself that the TSR performance is a genuine reflection ofunderlying financial performance.
Under the plan, vesting is subject to Rio Tinto’s TSR equalling or outperforming the HSBC Global Mining Indexover a three-year performance period. The HSBC Global Mining Index covers the mining industry in 26 countries. Rio Tinto’s TSR is calculated as a weighted average of the TSR of Rio Tinto plc and Rio Tinto Limited. If TSR performance equals the index, the higher of one third of the original grant or 20,000 options will vest (subject to the actual grant level not being exceeded). The full grant vests if the TSR performance is equal to or greater than the HSBC Global Mining Index plus five per cent per annum. Historically, TSR performance at this level has been equivalent to the upper quartile of companies in the index. Between these points, options vest on a sliding scale, with no options becoming exercisable for a three year TSR performance below the index.
Options granted under the 2004 plan before 31 December 2006 will be subject to a single fixed base re-test five years after grant if they have not vested after the initial three year performance period, with options granted after31 December 2006 not subject to any re-test. These latter options will, therefore, lapse if they do not vest at the conclusion of the three year performance period.
Prior to any options being released to participants for exercise, the Group’s performance against the criteriarelevant to the SOP is examined and verified by the external auditors. If Rio Tinto were subject to a change of control or a company restructuring, options would become exercisable subject to the satisfaction of the performance condition measured at the time of the takeover or restructure.
Where an option holder dies in service, qualifying options vest immediately, regardless of whether the performance conditions have been satisfied. The estate will have 12 months in which to exercise the options.
All SOP grants made prior to 2004 under the rules approved by shareholders in 1998 have now vested in full.The SOP grant made in 2004 was due for testing against the performance condition in 2007. The performance condition was not achieved and these options have therefore not vested.
SOP options may, upon exercise, be satisfied by treasury shares, the issue of new shares or the purchase of shareson market.
Mining Companies Comparative Plan (MCCP)
Rio Tinto’s performance share plan, the MCCP, provides participants with a conditional right to receive shares. The maximum conditional award under the current MCCP is two times salary, calculated using the average share price overthe previous financial year. Awards made to executive directors and product group chief executives are set out in Table 4 on pages 112 to 115.
The conditional awards will only vest if performance conditions approved by the committee are satisfied. Again, were there to be a change of control or a company restructuring, the awards would only vest subject to the satisfaction of the performance condition measured at the time of the takeover or restructuring. Additionally, if a performance period is deemed to end during the first 12 months after the conditional award is made, that award will be reduced pro-rata. These conditional awards are not pensionable.
The performance condition compares Rio Tinto’s TSR with the TSR of a comparator group of 15 other international mining companies over the same four year period. The composition of this comparator group is reviewed regularly by the committee to provide continued relevance in a consolidating industry. The members of this group relevant to the 2006 conditional award are listed at the bottom of the ranking table below. The comparator group for the 2007 conditional award will be determined by theRemuneration committeeprior to approving the award.
The following table shows the percentage of each conditional award which will be received by executives based on Rio Tinto’s four year TSR performance relative to the comparator group for conditional awards made after 1 January 2004:
| Rio Tinto 2006Form 20-F | 97 |
Back to Contents
| Ranking in comparator group | | | | | | | | | | | | | | | | |
| Percentage vesting: | | | | | | | | | | | | | | | | |
| | 1st-2nd | | 3rd | | 4th | | 5th | | 6th | | 7th | | 8th | | 9th-16th | |
|
|
|
|
|
|
|
|
|
|
|
|
|
|
|
| |
| % | 150 | | 125 | | 100 | | 83.75 | | 67.5 | | 51.25 | | 35 | | — | |
|
|
|
|
|
|
|
|
|
|
|
|
|
|
|
| |
The historical ranking of Rio Tinto in relation to the comparator group is shown in the following table:
| Ranking of Rio Tinto versus comparator companies | | |
| Period | Ranking out of 16 | |
|
| |
| 1993 - 97 | 4 | |
| 1994 - 98 | 4 | |
| 1995 - 99 | 2 | |
| 1996 - 00 | 2 | |
| 1997 - 01 | 2 | |
| 1998 - 02 | 3 | |
| 1999 - 03 | 7 | |
| 2000 - 04 | 11 | |
| 2001 - 05 | 10 | |
| 2002 - 06 | 10 | |
|
| |
| Note |
| Comparator companies for the 2006 Conditional Award were: |
| Alcan, Alcoa, Anglo American, Barrick Gold, BHP Billiton, Cameco Corporation, Cia Vale do Rio Doce, Freeport-McMoRan Copper & G old, Grupo Mexico, INCO, Newmont, Peabody, Phelps Dodge, Teck Cominco and Xstrata |
Before awards are released to participants, the external auditors and Kepler Associates independently review the Group’s TSR performance compared to that of the comparator companies.
Awards are released to participants as either Rio Tinto plc or Rio Tinto Limited shares or as an equivalentamount in cash. In addition, for MCCP Conditional Awards made after 1 January 2004, a cash payment equivalent to the dividends that would have accrued on the vested number of shares over the four year period will be made to executives.
Shares to satisfy the vesting may be treasury shares, shares purchased in the market, by subscription, or, in thecase of Rio Tinto Limited, transfers of existing shares.
New restricted share plan
TheRemuneration committeehas approved a restricted share plan for senior employees below director and product group chief executive level. The new plan is designed to support the Group’s ability to attract and retain key staff in anincreasingly tight and competitive labour market. Under the new plan, eligible employees may receive a conditional award of shares which will vest, wholly or partly, when performance conditions laid down by theRemuneration committeeat the time of the award have been satisfied. Shares to satisfy these awards will be purchased in the market. No directors are eligible to participate and no new shares will be issued to satisfy awards under this plan.
Post employment benefits
Under current pension arrangements, executives in the UK can take their pension benefits unreduced for early payment from the age of 60. Executives with Australian employment contracts would normally be expected to retire at age 62. In2004, Leigh Clifford’s contractual retirement age was reduced from 62 to 60, with a corresponding change to his retirement arrangements.
United Kingdom
Guy Elliott and Tom Albanese participate in the non contributory Rio Tinto Pension Fund, a funded occupationalpension scheme approved by HM Revenue and Customs. The Fund provides both defined benefit and defined contribution benefits. In April 2005, the defined benefit section of the Fund was closed to new participants.
Members of the defined benefit section of the Fund who retire early may draw a pension reduced by approximately four per cent a year for each year of early payment. Spouse and dependants’ pensions are also provided.Pensions paid from this section are guaranteed to increase annually in line with increases in the UK Retail Price Index subject to a maximum of ten per cent per annum. Increases above this level are discretionary.
During 2006, there was no requirement for Company cash contributions to be paid into the Rio Tinto PensionFund.
Rio Tinto reviewed its pension policy in the light of the legislation changes introduced from April 2006. The Rio Tinto Pension Fund was amended to incorporate a fund specific limit equivalent to the earnings cap for all memberspreviously affected; unfunded benefits continue to be provided, where already promised, on pensionable salary above the fund specific limit.
Guy Elliott is accruing a pension of 2.3 per cent of basic salary for each year of service with the Company to age60. Proportionally lower benefits are payable on leaving service or retirement prior to the age of 60. The unfunded arrangements described above will be utilised to deliver this promise to the extent not provided by the Fund.
Rio Tinto plc exercised discretion to allow Tom Albanese to join the Rio Tinto Pension Fund as a member of the
| Rio Tinto 2006Form 20-F | 98 |
Back to Contents
defined benefit section on 1 July 2006 in recognition of his participation in one of the US defined benefit pension arrangements offered by Rio Tinto prior to that date. He is accruing a pension of two thirds of basic salary payable at the normal retirement age of 60, subject to completion of 20 years’ service with the Group, inclusive of benefits accrued under the US pension arrangements. Proportionally lower benefits are payable for shorter serv ice or, if having attained 20 years’ service, retirement is taken prior to the age of 60. His benefits under the Rio Tinto Pension Fund are restricted to the fund specific limit, with the balance provided through unfunded arrangements.
Australia
Leigh Clifford is a member of the Rio Tinto Staff Superannuation Fund, a funded superannuation fund regulated byAustralian legislation. The fund provides both defined benefit and defined contribution benefits. Leigh Clifford is a defined benefit member, accruing lump sums payable on retirement. Retirement benefits are limited to a lump sum multiple of up to seven times final basic salary at age 62, although, as stated above, Leigh Clifford will retire at age 60. For retirement after 62, the benefit increases to up to 7.6 times average salary at age 65.
Death in service and disablement benefits are provided as lump sums and are equal to the prospective age 65 retirement benefit. Proportionate benefits are also payable on termination of employment for ill health or resignation.
Executives are not required to pay contributions. During 2006, Company cash contributions were paid into the Rio Tinto Staff Superannuation Fund to fund members’ defined benefit and defined contribution benefits.
Other pensionable benefits
The percentage of total remuneration which is dependent on performance is substantial. For Australian participantsannual STIP awards are pensionable up to a maximum value of 20 per cent of basic salary. This results in a defined contribution payment equivalent to 20 per cent of the pensionable component of STIP and does not impact the defined benefit component. For the UK executive directors basic pay only is pensionable.
Details of directors’ pension and superannuation entitlements are set out in Table 2 on page 110.
Performance and non performance related remuneration
Total remuneration is a combination of fixed and performance related elements, each of which is described in this report. In addition, some executives have specific arrangements for remuneration outside these core elements. Theyinclude expatriate/secondment packages, which may include items such as housing benefit, assistance with incremental school fees and tax equalisation. Other compensation includes medical insurance, the provision of a company car and fuel, or an allowance in lieu, 401k contributions in the USA, annual leave accruals and professional advice. The total remuneration for executives shown in Table 1 includes these non performance related items, which are specific to the circumstances of each executive.
The performance related, or variable, elements are the short and long term incentive plans, which are linked toachievement of business and personal performance goals and are, therefore, “at risk”. The rest of the elements of the package are “fixed”, as they are not at risk, although some, such as base salary, are also related to performance.
Excluding post employment costs and expatriate secondment costs, employment costs and other benefits, the proportion of total direct remuneration provided by way of variable components, assuming target levels of performance, is approximately 68 per cent for the chief executive, 62 per cent for the finance director and between 62 per cent and 68 per cent for the product group chief executives. Variable components comprise the Short Term Incentive Plan, the Share Option Plan and the Mining Companies Comparative Plan (STIP, SOP and MCCP). The actual proportion of total direct remuneration provided by way of variable components is set out in Table 1 on pages 107 to 109 and may differ fromthese target percentages depending on Company and personal performance.
Share based remuneration not dependent on performance
Executives may participate in share and share option plans that apply to all employees at particular locations and for which neither grant nor vesting is subject to the satisfaction of a performance condition. These plans are consistent with standard remuneration practice whereby employees are offered share and option plan participation as part of their employment entitlements in order to encourage alignment with the long term performance of the Company.
Executives employed in the Rio Tinto plc part of the Group may participate in the Rio Tinto plc Share Savings Plan, a savings-related plan which is open to employees in the UK and elsewhere. Under the plan, participants can save up to £250 per month, or equivalent in local currency, for a maximum of five years. At the end of the savings period participants may exercise an option over shares granted at a discount of up to 20 per cent to the market value at the time of the grant. The number of options to which participants are entitled is determined by the option price, the savings amount and the length of the savings contract. No consideration is paid or payable by the participant on receipt of the options. The UK section of this plan is Inland Revenue approved.
Eligible UK employees, including some of the executives, may also participate in the Rio Tinto Share Ownership Plan, an Inland Revenue approved share incentive plan which was approved by shareholders at the 2001 annual general meeting and introduced in 2002. Under this plan, participating employees can save up to £125 per month, which the plan administrator invests in Rio Tinto plc shares. Rio Tinto matches these purchases on a one-for-one basis. In addition, eligible employees may receive an annual award of Rio Tinto shares up to a maximum of five per cent of salary, subject to a cap of £3,000.
Executives employed in the Rio Tinto Limited part of the Group may elect to participate in the Rio Tinto LimitedShare Savings Plan, also introduced in 2001, which is similar to the Rio Tinto plc Share Savings Plan.
| Rio Tinto 2006 Form 20-F | 99 |
Back to Contents
Service contracts
Each of the executives has a service contract with a Group company.
It is the Group’s policy that executives’ service contracts have no fixed term but are capable of terminationgiving no less than 12 months’ notice. Notice periods for executives are as follows:
| Notice periods | | | | | | |
| | | | | | Remaining | |
| | | | | | service period | |
| | Date of | | Notice | | if less than | |
| Name | Agreement | | period | | 12 months | |
|
|
|
|
|
| |
| Executive directors | | | | | | |
| Leigh Clifford | 30 Mar 2005 | | 12 months | | 7 months | |
| Guy Elliott | 19 Jun 2002 | | 12 months | | N/A | |
| Tom Albanese | 10 Apr 2006 | | 12 months | | N/A | |
| Product group chief executives | | | | | | |
| Preston Chiaro | 30 Sep 2003 | | 12 months | | N/A | |
| Oscar Groeneveld | 1 Oct 2004 | | 12 months | | N/A | |
| Bret Clayton | 1 Jun 2006 | | 12 months | | N/A | |
| Keith Johnson | 12 Mar 2004 | | 12 months | | N/A | |
| Andrew Mackenzie | 4 May 2004 | | 12 months | | N/A | |
| Sam Walsh | 3 Aug 2004 | | 12 months | | N/A | |
|
|
|
|
|
| |
Termination payments
Rio Tinto has retained the right to pay executives in lieu of notice. Given the wide variety of possible circumstancesleading to early termination, the executives’ service contracts do not provide explicitly for compensation, but in the event of early termination, it is the Group’s policy to act fairly in all circumstances and the duty to mitigate would be taken into account. Compensation would not provide unmerited reward for poor performance.
There were no termination payments made in 2006.
Shareholding policy
In 2002, the committee decided that it would be appropriate to encourage executives to build up a substantialshareholding, aiming to reach a holding equal in value to two times base salary over five years. Details of executives’ share interests in the Group are set out in Table 3 on page 111.
In 2006, the board recommended that non executive directors be encouraged to build up a shareholding equal invalue to one year’s base fees. To help facilitate this, the Companies have put in place share purchase plans under which non executive directors can elect to invest a proportion of their fees net of tax on a regular basis.
Remuneration paid in 2006
Performance of Rio Tinto, product groups and individual executives
2006 was another year of strong operational performance and was the third successive year of record results for the Group.
To illustrate the performance of the Companies relative to their markets, graphs showing the performance of Rio Tinto plc in terms of TSR over the last five years, compared to the FTSE 100 Index and Rio Tinto Limited compared to the ASX All Ordinaries Index are reproduced below. A graph showing Rio Tinto’s performance relative to the HSBCGlobal Mining Index is also included to illustrate the performance of Rio Tinto relative to other mining companies.
TSR (£) – Rio Tinto plc v FTSE 100
Total return basis Index 2001 = 100

| Rio Tinto 2006 Form 20-F | 100 |
Back to Contents
TSR (A$) – Rio Tinto Limited v ASX All Share
Total return basis Index 2001 = 100
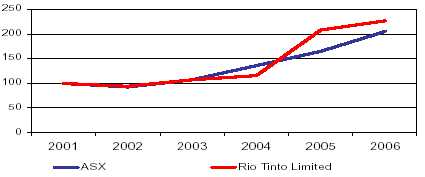
TSR (US$) – Rio Tinto Group v HSBC Global Mining Index
Total return basis Index 2001 = 100

The effect of this performance on shareholder wealth, as measured by TSR, is detailed in the table below and the relationship between TSR and executive remuneration is discussed in the Executive remuneration and Remuneration components sections above.
| Rio Tinto shareholder return 2002-2006 | | | | | | | | | | | | | | | |
| | Dividends per share | | Share price – | | Share price – | | Total shareholder return | |
| Year | paid during the year | | Rio Tinto plc | | Rio Tinto Limited | | (TSR) | |
|
|
|
|
|
|
|
|
|
|
|
|
|
| |
| | | | 1 Jan | | 31 Dec | | 1 Jan | | 31 Dec | | plc | | Limited | | Combined | |
| | US cents | | pence | | pence | | A$ | | A$ | | % | | % | | % | |
|
|
|
|
|
|
|
|
|
|
|
|
|
|
|
| |
| 2006 | 191.5 | | 2,655 | | 2,718 | | 69.00 | | 74.30 | | 6.3 | | 12.2 | | 7.6 | |
| 2005 | 83.5 | | 1,533 | | 2,655 | | 39.12 | | 69.00 | | 77.5 | | 81.3 | | 78.4 | |
| 2004 | 66.0 | | 1,543 | | 1,533 | | 37.54 | | 39.12 | | 1.7 | | 7.4 | | 3.0 | |
| 2003 | 60.5 | | 1,240 | | 1,543 | | 33.95 | | 37.54 | | 27.9 | | 14.7 | | 24.8 | |
| 2002 | 68.5 | | 1,316 | | 1,240 | | 37.21 | | 33.95 | | (2.3 | ) | (5.4 | ) | (3.0 | ) |
|
|
|
|
|
|
|
|
|
|
|
|
|
|
|
| |
Rio Tinto Group and product group performance during 2006, and over relevant performance periods ending at 31 December 2006, impacted executives’ remuneration as follows:
| Share based awards: |
| • | MCCP – Rio Tinto ranked tenth in the sixteen company comparator group at the completion of the four-yearperformance period ending 31 December 2006, resulting in zero vesting of the conditional award made toexecutives who were directors at the date of the conditional award. This group included Leigh Clifford, GuyElliott and Oscar Groeneveld. The vesting shown in Table 4 on pages 112 to 115, for other product group chiefexecutives, where relevant, is in accordance with the performance condition applicable to the 2003 award andrepresents 25 per cent of the original awards. |
| • | SOP – Rio Tinto TSR growth over the three years ending 31 December 2006 did not achieve the level required by the applicable performance condition. This grant will therefore not vest in 2007, but will be subject to one retest after a further two years. |
| Rio Tinto 2006 Form 20-F | 101 |
Back to Contents
Annual cash bonus
Cash bonuses (STIP) in respect of the 2006 performance period, to be paid in March 2007, are set out in Table 1 on page 108 and the percentages awarded to each executive (or forfeited) are set out in the table on page 103. These bonuses were approved by the committee on the basis of delivered performance against financial, safety and personal targets and objectives for each executive.
Financial performance was assessed against underlying earnings targets for the Group and product groups asrelevant and established by the committee at the commencement of the performance period. The potential impact of fluctuations in exchange rates and some prices are outside the control of the Group. The committee therefore compares, on an equal weighting basis, both actual results and underlying performance. This approach is designed to ensure that the annual bonus reflects financial results and addresses underlying performance excluding the impact of prices and exchange rates. The committee retains discretion to consider underlying business performance in deciding STIP awards.
The safety measures included Group or relevant product group lost time injury frequency rates (LTIFR) and overall assessment of progress against improvement targets in other safety measures, including all injury frequencyrates (AIFR). These measures are chosen as they reflect the priority of safety at all Rio Tinto operations.
Personal performance targets and objectives were established for each executive at the start of the performance period. These comprise a balanced set of measures for each individual that reflect current operational performance, aswell as progress on initiatives and projects designed to grow the value of each business unit and the Rio Tinto portfolio. The targets and objectives chosen enable personal performance and the benefit accruing to shareholders in the long term to be mirrored in each of the executives’ “at risk” remuneration.
To achieve linkage between business/financial and personal/non-financial performance and remuneration, eachexecutive director’s STIP payment is calculated as a percentage of salary in accordance with the formula set out below:
| |
| |
| |
| | Business / financial | | Personal / non financial | |
| | | (score = 0% to 133%) | | (score = 0% to 133%) | |
| Target | |
| |
| |
| STIP | x | 75% weight | | 25% weight | x | | |
| (60%) | | Group | | Group | | Personal targets | |
| | | financial results | | safety performance | | and objectives | |
| |
| |
| |
| |
For each product group chief executive, STIP payments are calculated as a percentage of salary in accordance with the formula set out below:
| |
|
|
| |
|
|
| |
| | Business / financial | | Personal / non financial | |
| | | (score = 0% to 133%) | | (score = 0% to 133%) | |
| Target | |
|
|
| |
|
|
| |
| STIP | x | 40% weight | | 60% weight | x | 25% weight | | 75% weight | |
| (60%) | | Group | | Product group | | Product group | | Personal targets | |
| | | financial results | | financial results | | safety | | and objectives | |
| |
|
|
| |
|
|
| |
Strong Group financial performance for 2006 resulted in a STIP score at 117.2 per cent for this component. Financial performance for each product group varied and theRemuneration committeeapproved STIP scores ranging from 81 percent of target to 120 per cent of target (maximum is 133 per cent) for this component. Group safety performance resulted in theRemuneration committeeapproving a score of 120 per cent of target (maximum is 133 per cent) for this component.
Product group safety performance varied and STIP scores ranged from 90 per cent of target to 150 per cent of target (where 150 per cent is the maximum achievable) for this component. Consequently, total STIP awards forexecutives ranged from 68.7 per cent to 92 per cent of salary (57 per cent to 77 per cent of maximum).
Each of the results set out below therefore reflect the above, including a second successive year of record results, strong operational performance and portfolio initiatives to secure future value for the business across the Group, as wellas individual considerations as outlined:
| Leigh Clifford |
| • | The committee assessed personal performance as above target and the overall STIP award was 153.3 per cent oftarget (76.6 per cent of maximum). |
| |
| Guy Elliott |
| • | The committee assessed personal performance as above target and the overall STIP award was 153.3 per cent oftarget (76.6 per cent of maximum). |
| • | The committee assessed product group financial and safety performance as well as personal performance asabove target. The overall STIP award was 147.6 per cent of target (73.8 per cent of maximum). |
| Rio Tinto 2006 Form 20-F | 102 |
Back to Contents
| Preston Chiaro |
| • | The committee assessed product group financial performance as below target and safety and personalperformance as above target. The overall STIP award was 114.5 per cent of target (57.3 per cent of maximum). |
| |
| Bret Clayton (from 1 June 2006) |
| • | The committee assessed product group financial and safety performance as well as personal performance asabove target. The overall STIP award was 133.3 per cent of target (66.6 per cent of maximum). |
| |
| Oscar Groeneveld |
| • | The committee assessed product group financial performance and personal performance as above target andsafety performance as below target. The overall STIP award was 136.2 per cent of target (68.1 per cent ofmaximum). |
| |
| Keith Johnson |
| • | The committee assessed product group financial and safety performance as well aspersonal performance asabove target. The overall STIP award was 149.7 per cent of target (74.8 per cent of maximum). |
| |
| Andrew Mackenzie |
| • | The committee assessed product group financial and safety performance as well aspersonal performance asabove target. The overall STIP award was 151.5 per cent of target (75.8 per cent of maximum). |
| |
| Sam Walsh |
| • | The committee assessed product group financial performance as below target, safety performance at target andpersonal performance as above target. The overall STIP award was 116.7 per cent of target (58.3 per cent ofmaximum). |
Share based payment – long term incentives granted in 2006
Options over either Rio Tinto plc or Rio Tinto Limited shares as appropriate were granted to each executive under the Share Option Plan on 7 March 2006. TheRemuneration committeereviewed the performance condition applicable to this grant and confirmed that vesting will be dependent on Rio Tinto’s TSR relative to the HSBC Global Mining Index over a three year performance period. Share options granted are included in Table 5 on pages 116 to 121.
A conditional award of performance shares in either Rio Tinto plc or Rio Tinto Limited shares was made to each executive under the MCCP on 7 March 2006. TheRemuneration committeereviewed the performance conditionapplicable to the conditional award and confirmed that vesting will be dependent on Rio Tinto’s TSR relative to 15 other mining companies.
The percentages of maximum bonuses made to executives in respect of 2006 and grants vested in respect ofperformance periods ending 31 December 2006, as well as the percentages forfeited because the relevant Company or individual did not meet the performance criteria required for full vesting, are as follows:
| Bonuses and grants made during or in respect of 2006 | | | | | | | | | | | | |
| | STIP Cash1 | | SOP Options2 | | MCCP Shares3 | |
|
|
|
|
|
|
|
|
|
|
|
| |
| | % of | | % of | | % | | % | | % | | % | |
| | maximum | | maximum | | vested | | forfeited | | vested | | forfeited | |
| | vested | | forfeited | | | | | | | | | |
|
|
|
|
|
|
|
|
|
|
|
| |
| Leigh Clifford | 76.6 | | 23.4 | | — | | — | | — | | 100 | |
| Guy Elliott | 76.6 | | 23.4 | | — | | — | | — | | 100 | |
| Tom Albanese | 73.8 | | 26.2 | | — | | — | | 25 | | 75 | |
| Preston Chiaro | 57.3 | | 42.7 | | — | | — | | 25 | | 75 | |
| Bret Clayton | 66.6 | | 33.4 | | — | | — | | 25 | | 75 | |
| Oscar Groeneveld | 68.1 | | 31.9 | | — | | — | | — | | 100 | |
| Keith Johnson | 74.8 | | 25.2 | | — | | — | | 25 | | 75 | |
| Andrew Mackenzie4 | 75.8 | | 24.2 | | — | | — | | — | | — | |
| Sam Walsh | 58.3 | | 41.7 | | — | | — | | 25 | | 75 | |
|
|
|
|
|
|
|
|
|
|
|
| |
| Notes |
| 1. | Paid in March 2007 in respect of 2006. |
| 2. | There was no vesting of the 2004 SOP options in March 2007. |
| 3. | Vesting of 2003 Conditional Award in February 2007. |
| 4. | Andrew Mackenzie joined in 2004 after the 2003 MCCP award had been made. |
| Rio Tinto 2006 Form 20-F | 103 |
Back to Contents
Minimum and maximum total bonuses and grants 2007
The estimated maximum and minimum total value of bonuses and share and option-based compensation for the 2007financial year are set out below.
| | | | | | | | | | | |
| | STIP Cash 1 | | | | | |
| | Potential range of | | | | | |
| | bonus payments in | | SOP Options | | MCCP Shares | |
| | March 2008 in | | (% of March | | (% of March | |
| | respect of 2007 | | 2007 salary) 2,3 | | 2007 salary) 2,4 | |
|
|
|
|
|
|
|
|
|
|
|
| |
| | Min | | Max | | Min | | Max | | Min | | Max | |
| | US$ | | US$ | | | | | | | | | |
|
|
|
|
|
|
|
|
|
|
|
| |
| Leigh Clifford5 | — | | 2,231,890 | | — | | 300 | | — | | 200 | |
| Guy Elliott | — | | 1,449,432 | | — | | 200 | | — | | 140 | |
| Tom Albanese | — | | 1,451,788 | | — | | 300 | | — | | 200 | |
| Preston Chiaro | — | | 792,000 | | — | | 300 | | — | | 200 | |
| Bret Clayton | — | | 696,000 | | — | | 300 | | — | | 200 | |
| Oscar Groeneveld | — | | 1,355,640 | | — | | 200 | | — | | 140 | |
| Keith Johnson | — | | 930,936 | | — | | 200 | | — | | 140 | |
| Andrew Mackenzie | — | | 1,025,208 | | — | | 200 | | — | | 140 | |
| Sam Walsh | — | | 1,279,800 | | — | | 200 | | — | | 140 | |
|
|
|
|
|
|
|
|
|
|
|
| |
| Notes |
| 1. | Based on eligibility at 1 March 2007 at exchange rates of £1 = US$1.964 and A$1 = US$0.790. |
| 2. | Grant/Conditional Award based on the average share price during 2006. |
| 3. | SOP Options to be granted in 2007 may, subject to achievement of the performance condition, vest in 2010. The maximum value of these options at the date of vesting would be calculated by multiplying the number of vested options by the intrinsic value at that time (ie the difference between the option exercise price and the current market price). |
| 4. | MCCP performance shares to be awarded conditionally in 2007 may, subject to achievement of the performance condition, vest in 2011. The maximum value of these shares at the date of vesting would be calculated by multiplying the number of vested shares by the intrinsic value at that time (ie the current market price plus, the value of dividends “earned” on the vested shares during the performance period). |
| 5. | Leigh Clifford’s STIP, SOP option grant and MCCP conditional award will be reduced proportionally to reflect the actual pro portion of 2007 he was an employee of the Group. |
OTHER DISCLOSURES
Executives’ external and other appointments
Executives are likely to be invited to become non executive directors of other companies. Rio Tinto believes that such appointments can broaden their experience and knowledge, to the benefit of the Group. It is Group policy to limit executives’ external directorships to one FTSE 100 company or equivalent and they are not allowed to take on the chairmanship of another FTSE 100 company.
Consequently, where there is no likelihood that such directorships will give rise to conflicts of interests, theboard will normally give consent to the appointment, with the executive permitted to retain the fees earned. Details of fees earned are set out in the notes to Table 1 on pages 107 to 109.
Executives have agreed to waive any fees receivable from subsidiary and associated companies. One executive director waived US$1,390 during the period (2005: Nil).
Company secretary remuneration
The broad policy described above applies to the company secretary of each of Rio Tinto plc and Rio Tinto Limited. Thesecretaries participate in the same performance based remuneration arrangements as the executives. The individual performance measures for the secretaries’ annual cash bonus comprise Group and personal measures. Their personalmeasures reflect the key responsibilities of the company secretarial role and included ensuring compliance withregulatory requirements, oversight of good corporate governance practice and the provision of corporate secretarial services.
Chairman and non executive director remuneration
Remuneration policy
Reflecting the board’s focus on long term strategic direction and corporate performance rather than short term results, remuneration for the chairman and non executive directors is structured with a fixed fee component only, details of which are set out below and in Table 1 on pages 107 to 109. The board as a whole determines non executive directors’ fees, although non executive directors donot vote on any changes to their own fees. Fees are set to reflect the responsibilities and time spent by the directors on the affairs of Rio Tinto. To reflect the commitment expected from directors, as well as market practice for similar companies, fees for committee chairmen and members were reviewed in December 2006. The new fees are set out in the table below.
It is Rio Tinto’s policy that the chairman should be remunerated on a competitive basis and at a level which reflects his contribution to the Group, as assessed by the board. The chairman is not present at any discussion regarding
| Rio Tinto 2006 Form 20-F | 104 |
Back to Contents
his own remuneration and he does not participate in the Group’s incentive plans or pension arrangements.
Letters of appointment
Non executive directors have formal letters of appointment setting out their duties and responsibilities. These letters areavailable for inspection at Rio Tinto plc’s registered office prior to the annual general meeting and at the meeting itself. Each non executive director is appointed subject to periodic re-election by shareholders as detailed on page 124. Thereare no provisions for compensation payable on termination of any non executive director’s appointment.
The chairman’s letter of appointment summarises his duties as chairman of the Group and was agreed by theRemuneration committee. It stipulates that he is expected to dedicate at least three days per week on average to carry outthese duties. The letter envisages that Paul Skinner will continue in the role of chairman until he reaches the age of 65 in2009, subject to re-election as a director by shareholders, although the appointment may be terminated by either Rio Tinto or Paul Skinner giving six months’ notice. Other than in this case, there is no provision for compensation payable on termination of his chairmanship or directorship.
Remuneration components
The following table sets out the annual fees payable to the chairman and the non executive directors in £/A$, as appropriate.
| | As at 31 Dec 2006 | | As at 1 Jan 2006 | |
|
|
|
| |
| Base fees: | | | | |
| Chairman | £630,000 | | £600,000 | |
| Other directors | £60,000 / A$150,000 | | £60,000 / A$150,000 | |
| Additional fees: | | | | |
| Senior independent director | £35,000 | | £35,000 | |
| Audit committee chairman | £30,000 | | £20,000 | |
| Audit committee member | £15,000 / A$37,500 | | £10,000 | |
| Remuneration committee chairman | £20,000 | | £15,000 | |
| Remuneration committee member | £10,000 / A$25,000 | | £5,000 | |
| Committee on social and environmental accountability chairman | £20,000 | | £10,000 | |
| Committee on social and environmental accountability member | £7,500 / A$18,750 | | £3,000 / A$7,500 | |
| Overseas meeting allowances: | | | | |
| Long distance (flights over 10 hours per journey) | £4,000 / A$10,000 | | £4,000 / A$10,000 | |
| Medium distance (flights of 5-10 hours per journey) | £2,000 / A$5,000 | | £2,000 / A$5,000 | |
|
|
|
| |
No additional fee is payable to the chairman or members of theNominations committeealthough this arrangement remains subject to review and will depend on the volume of committee business in future.
Rio Tinto does not pay retirement benefits or allowances tonon executive directors, nor do any of themparticipate in any of the Group’s incentive plans. Where the payment of statutory minimum superannuation contributions for Australian non executive directors is required by the Australian superannuation guarantee legislation, these contributions are deducted from the directors’ overall fee entitlements.
Remuneration paid during 2006
Details of the nature and amount of each element of remuneration paid to the chairman and non executive directorsduring 2006 are set out in Table 1 on pages 107 to 109. No post employment, long term or termination payments were paid and no share based payments made.
Auditable information
Under Part 3 of Schedule 7A to the United Kingdom Companies Act 1985, the information included in respect of the directors in the table immediately below, the information about the directors’ short term employee benefits (excluding employment costs), defined contribution pension costs and termination benefits in Table 1, 4 and 5 are auditable.
The Australian Securities Investments Commission issued an order dated 27 January 2006 (and amended on 22 December 2006) under which the information included in the Remuneration report to comply with paragraph 25 of Australian Accounting Standard AASB 124 “Related Party Disclosures” (relating to “key management personnel” compensation) is also auditable. This information comprises Tables 1, 3, 4 and 5 and the disclosures provided under theheadings Executive remuneration, Remuneration components, Remuneration paid in 2006 and chairman and nonexecutive director remuneration.
| Rio Tinto 2006 Form 20-F | 105 |
Back to Contents
| Directors’ total remuneration as defined under Schedule 7A of the Companies Act 1985 | | | | |
| | 2006 | | 2005 | |
| | US$’000 | | US$’000 | |
|
|
|
| |
| Chairman | | | | |
| Paul Skinner | 1,147 | | 1,049 | |
| Non executive directors | | | | |
| Ashton Calvert | 179 | | 132 | |
| Vivienne Cox | 136 | | 107 | |
| Sir David Clementi | 153 | | 138 | |
| Leon Davis | — | | 95 | |
| Sir Rod Eddington | 130 | | 43 | |
| Michael Fitzpatrick | 109 | | — | |
| Sir Richard Giordano | — | | 80 | |
| Richard Goodmanson | 156 | | 127 | |
| Andrew Gould | 171 | | 142 | |
| Lord Kerr | 142 | | 130 | |
| David Mayhew | 148 | | 122 | |
| John Morschel | — | | 43 | |
| Sir Richard Sykes | 217 | | 188 | |
| Executive directors | | | | |
| Robert Adams | — | | 220 | |
| Tom Albanese | 1,295 | | — | |
| Leigh Clifford | 3,576 | | 3,093 | |
| Guy Elliott | 2,070 | | 1,872 | |
|
|
|
| |
Annual general meetings
Shareholders will be asked to vote on this Remuneration report at the Companies’ forthcoming annual general meetings1.
By order of the board
Anette Lawless
Secretary
Remuneration Committee
23 February 2007
| Note |
| 1. | The shareholders approved the 2006 Remuneration report at the 2007 Annual general meetings. |
| Rio Tinto 2006 Form 20-F | 106 |
Back to Contents
Table 1 – Directors’ and senior management’s total remuneration
| | | | | | Short term employee benefits and costs | | Other | | Value of share based awards5 | |
| | | | | | | | | | | | | | long term | | | | | | | |
| | | | | | | | | | | | | | benefits | | | | | | | |
| | | | | | Other | | | | | | | | | | | | | | | |
| | | | | | cash | | Non- | | Second- | | Employ- | | | | | | | | | |
| | Base | | Cash | | based | | monetary | | ment | | ment | | Long | | | | | | SSP/ | |
| Stated in US$’0001 | salary | | bonus | | benefits2 | | benefits2 | | costs3 | | costs4 | | Service 13 | | MCCP6 | | SOP7 | | Others9 | |
|
|
|
|
|
|
|
|
|
|
|
|
|
|
|
|
|
|
|
| |
| Chairman | | | | | | | | | | | | | | | | | | | | |
| Paul Skinner | 1,114 | | — | | 31 | | 2 | | — | | 145 | | — | | — | | — | | — | |
| Non executive directors | | | | | | | | | | | | | | | | | | | | |
| Ashton Calvert | 119 | | — | | 53 | | 7 | | — | | 9 | | — | | — | | — | | — | |
| Vivienne Cox | 129 | | — | | 7 | | — | | — | | 16 | | — | | — | | — | | — | |
| Sir David Clementi | 138 | | — | | 15 | | — | | — | | 18 | | — | | — | | — | | — | |
| Leon Davis16 | — | | — | | — | | — | | — | | — | | — | | — | | — | | — | |
| Sir Rod Eddington | 109 | | — | | 21 | | — | | — | | 7 | | — | | — | | — | | — | |
| Michael Fitzpatrick11 | 74 | | — | | 35 | | — | | — | | 6 | | — | | — | | — | | — | |
| Sir Richard Giordano16 | — | | — | | — | | — | | — | | — | | — | | — | | — | | — | |
| Richard Goodmanson | 138 | | — | | 18 | | — | | — | | — | | — | | — | | — | | — | |
| Andrew Gould | 156 | | — | | 15 | | — | | — | | — | | — | | — | | — | | — | |
| Lord Kerr | 135 | | — | | 7 | | — | | — | | 17 | | — | | — | | — | | — | |
| David Mayhew12 | 133 | | — | | 15 | | — | | — | | — | | — | | — | | — | | — | |
| John Morschel16 | — | | — | | — | | — | | — | | — | | — | | — | | — | | — | |
| Sir Richard Sykes16 | 202 | | — | | 15 | | — | | — | | — | | — | | — | | — | | — | |
| Executive directors | | | | | | | | | | | | | | | | | | | | |
| Robert Adams16 | — | | — | | — | | — | | — | | — | | — | | — | | — | | — | |
| Tom Albanese11,13,14 | 899 | | 842 | | — | | 38 | | (85 | ) | 114 | | 378 | | (115 | ) | 599 | | 13 | |
| Leigh Clifford15 | 1,611 | | 1,598 | | 148 | | 3 | | 156 | | 408 | | — | | (1,162 | ) | 1,090 | | 3 | |
| Guy Elliott | 1,016 | | 1,011 | | 28 | | 6 | | — | | 258 | | — | | (614 | ) | 512 | | 11 | |
| Product group chief executives | | | | | | | | | | | | | | | | | | | |
| Preston Chiaro14 | 591 | | 412 | | 21 | | 9 | | 205 | | 26 | | — | | (119 | ) | 444 | | 7 | |
| Bret Clayton | 429 | | 349 | | 50 | | 3 | | 427 | | 36 | | — | | 64 | | 102 | | 12 | |
| Oscar Groeneveld13 | 962 | | 839 | | — | | 37 | | 51 | | 95 | | 359 | | (606 | ) | 418 | | 2 | |
| Keith Johnson | 663 | | 644 | | — | | 35 | | — | | 167 | | — | | (54 | ) | 325 | | 9 | |
| Andrew MacKenzie | 737 | | 723 | | — | | 32 | | — | | 162 | | — | | 57 | | 267 | | 11 | |
| Chris Renwick16 | — | | — | | — | | — | | — | | — | | — | | — | | — | | — | |
| Sam Walsh | 887 | | 664 | | — | | 6 | | 51 | | 110 | | — | | (28 | ) | 381 | | 2 | |
| |
|
|
|
|
|
|
|
|
|
|
|
|
|
|
|
|
|
|
| |
| 2006 Remuneration | 10,242 | | 7,082 | | 479 | | 178 | | 805 | | 1,594 | | 737 | | (2,577 | ) | 4,138 | | 70 | |
| |
|
|
|
|
|
|
|
|
|
|
|
|
|
|
|
|
|
|
| |
| 2005 Remuneration | 9,223 | | 5,981 | | 422 | | 314 | | 1,568 | | 1,696 | | 737 | | 7,484 | | 4,600 | | 70 | |
| |
|
|
|
|
|
|
|
|
|
|
|
|
|
|
|
|
|
|
| |
| Rio Tinto 2006 Form 20-F | 107 |
Back to Contents
Table 1 – Directors’ and senior management’s total remuneration
| | Post employment costs9 | | Termination | | Remuneration | | | | Total | | | |
| | | | | | | | | | benefits | | | | mix10 | | remuneration | | | |
| |
|
|
|
|
| |
|
|
| |
|
|
|
|
| | | | | | | |
| | Pension – Defined | | | | | | | | | | | | | | | | | | | |
| |
| | | | | | | | | | | | | | | | | | | |
| | | | | | | | | | | | Fixed | | At-risk | | | | | | | | | |
| | | | | | | | Post | | | | as % | | as % | | Options | | | | | | Currency | |
| | | | Contrib- | | Medical | | service | | | | 2006 | | 2006 | | as % | | | | | | of actual | |
| Stated in US$’000 | Benefits | | utions | | costs | | payments | | Gifts | | total | | total | | total | | 2006 | | 200513,14 | | payment | |
|
|
|
|
|
|
|
|
|
|
|
|
|
|
|
|
|
|
|
|
|
| |
| Chairman | | | | | | | | | | | | | | | | | | | | | | |
| Paul Skinner | — | | — | | — | | — | | — | | 100.0 | | — | | — | | 1,292 | | 1,182 | | £ | |
| Non executive directors | | | | | | | | | | | | | | | | | | | | | | |
| Ashton Calvert | — | | — | | — | | — | | — | | 100.0 | | — | | — | | 188 | | 139 | | A$ | |
| Vivienne Cox | — | | — | | — | | — | | — | | 100.0 | | — | | — | | 152 | | 120 | | £ | |
| Sir David Clementi | — | | — | | — | | — | | — | | 100.0 | | — | | — | | 171 | | 154 | | £ | |
| Leon Davis16 | — | | — | | — | | — | | — | | — | | — | | — | | — | | 100 | | £ | |
| Sir Rod Eddington | — | | — | | — | | — | | — | | 100.0 | | — | | — | | 137 | | 48 | | £ | |
| Michael Fitzpatrick11 | — | | — | | — | | — | | — | | 100.0 | | — | | — | | 115 | | — | | £ | |
| Sir Richard Giordano16 | — | | — | | — | | — | | — | | — | | — | | — | | — | | 88 | | £ | |
| Richard Goodmanson | — | | — | | — | | — | | — | | 100.0 | | — | | — | | 156 | | 127 | | £ | |
| Andrew Gould | — | | — | | — | | — | | — | | 100.0 | | — | | — | | 171 | | 142 | | £ | |
| Lord Kerr | — | | — | | — | | — | | — | | 100.0 | | — | | — | | 159 | | 145 | | £ | |
| David Mayhew12 | — | | — | | — | | — | | — | | 100.0 | | — | | — | | 148 | | 123 | | £ | |
| John Morschel16 | — | | — | | — | | — | | — | | — | | — | | — | | — | | 46 | | A$ | |
| Sir Richard Sykes12 | — | | — | | — | | — | | — | | 100.0 | | — | | — | | 217 | | 189 | | £ | |
| Executive directors | | | | | | | | | | | | | | | | | | | | | | |
| Robert Adams16 | — | | — | | — | | — | | — | | — | | — | | — | | — | | 2,114 | | £ | |
| Tom Albanese11,13,14 | 707 | | — | | — | | — | | — | | 60.5 | | 39.5 | | 17.7 | | 3,390 | | 3,962 | | £ | |
| Leigh Clifford15 | 346 | | 60 | | — | | — | | — | | 64.1 | | 35.9 | | 25.6 | | 4,261 | | 6,704 | | £ | |
| Guy Elliott | 707 | | — | | — | | — | | — | | 68.6 | | 31.4 | | 17.5 | | 2,935 | | 3,897 | | £ | |
| Product group chief executives | | | | | | | | | | | | | | | | | | | | | |
| Preston Chiaro14 | 168 | | 12 | | 5 | | — | | — | | 58.2 | | 41.8 | | 25.0 | | 1,781 | | 2,983 | | US$ | |
| Bret Clayton | 57 | | 13 | | 3 | | — | | — | | 65.9 | | 34.1 | | 6.6 | | 1,545 | | 900 | | US$ | |
| Oscar Groeneveld13 | 204 | | 50 | | — | | — | | — | | 72.9 | | 27.1 | | 17.5 | | 2,411 | | 3,509 | | A$ | |
| Keith Johnson | 385 | | — | | — | | — | | — | | 57.5 | | 42.5 | | 15.0 | | 2,174 | | 2,284 | | £ | |
| Andrew MacKenzie | 475 | | — | | — | | — | | — | | 57.1 | | 42.9 | | 10.9 | | 2,464 | | 2,217 | | £ | |
| Chris Renwick16 | — | | — | | — | | — | | — | | — | | — | | — | | — | | 1,225 | | A$ | |
| Sam Walsh | 220 | | 32 | | — | | — | | — | | 56.2 | | 43.8 | | 16.5 | | 2,325 | | 3,151 | | A$ | |
| |
|
|
|
|
|
|
|
|
|
|
|
|
|
|
|
|
|
|
| | | |
| 2006 Remuneration | 3,269 | | 167 | | 8 | | — | | — | | | | | | | | 26,192 | | | | | |
| |
|
|
|
|
|
|
|
|
|
|
|
|
|
|
|
|
| | | | | |
| 2005 Remuneration | 2,199 | | 114 | | 12 | | 1,115 | | 14 | | | | | | | | | | 35,549 | | | |
| |
|
|
|
|
|
|
|
|
|
|
|
|
|
|
|
|
|
|
| | | |
| Short term employee benefits and costs | | | | | | | | | | | | | | | | | 20,380 | | 19,204 | | | |
| Other long term benefits | | | | | | | | | | | | | | | | | 737 | | 737 | | | |
| Value of share based awards5 | | | | | | | | | | | | | | | | | 1,631 | | 12,154 | | | |
| Post employment costs9 | | | | | | | | | | | | | | | | | 3,444 | | 2,325 | | | |
| Termination benefits | | | | | | | | | | | | | | | | | — | | 1,129 | | | |
| | | | | | | | | | | | | | | | | |
|
|
| | | |
| | | | | | | | | | | | | | | | | | 26,192 | | 35,549 | | | |
| | | | | | | | | | | | | | | | | |
|
|
| | | |
| Notes to Table 1 |
| 1. | The total remuneration is reported in US dollars. The amounts, with the exception of the annual cash bonus, can be converted into sterling at the rate of US$1 = £0.5432 or alternatively into Australian dollars at the rate of US$1 = A$1.329, each being the average exchange rate for 2006. The annual cash bonus is payable under the STIP and this may be converted at the 2006 year end exchange rate of US$1 = £0.5092 to a scertain the sterling equivalent or alternatively, US$1 = A$1.2653 to calculate the Australian dollar value. |
| 2. | Other cash and non cash based benefits are described in the Remuneration report on page 95 to 121. Cash based benefits include car, fuel, overseas meeting allowances and cash in lieu of holiday. The amounts shown as paid to non executive directors relate entirely to overseas meeting allowances. Non monetary benefits include heathcare, 401K contributions in the US, the provision of a car, annual leave accruals and professional advice. |
| 3. | Secondment costs comprise housing, education, tax equalisation and relocation payments made to and on behalf of executive directors and product group chief executives living outside their home country. The figure in respect of Tom Albanese reflects a tax refund to the Company during the course of the year. |
| 4. | Employment costs comprise social security contributions and accident insurance premiums in the UK and US and payroll taxes in Australia paid by the employer as a direct additional cost of hire. |
| 5. | The value of share based awards has been determined in accordance with the recognition and measurement requirements of IFRS2 “Share-based Payment”. The fair value of awards granted under the Rio Tinto Share Option Plan (the SOP) and the Rio Tinto Share Savings Plan (the SSP) have been calculated at their dates of grant using an independent lattice based option valuation model provided by external consultants, Lane Clark and Peacock LLP. The fair value of awards granted under the Mining Companies Comparative Plan (the MCCP) has been based on the |
| Rio Tinto 2006 Form 20-F | 108 |
Back to Contents
| | market price of shares at the measurement date adjusted to reflect the number of awards expected to vest based on the current and anticipated relative TSR performance and, where relevant, for non receipt of dividends between measurement date and date of vest. The failure of the 2003 conditional award to vest for directors reduced the projected value of future awards, as calculated in accordance with the relevant accounting standards. This in turn led to a negative MCCP value arising for certain individuals to offset earlier valuations which are now, under these accounting standards, considered over-valued. Further details of the valuation methods and assumptions used for these awards ar e included in the note 45 (Share based payments). The non executive directors do not participate in the long term incentive share schemes. The fair value of other share based awards is measured at the purchase cost of the shares from the market. |
| 6. | The number of conditional shares awarded to executive directors and senior executives under the MCCP for the twelve month period ending 31 December 2006 are shown in Table 4 of this report. The MCCP is stated under primary emoluments to reflect the treatment of the plan as a cash settled share based payment. |
| 7. | The award of options to executive directors under the SOP and SSP during the twelve month period up to 31 December 2006 are shown in Table 5 of this report. |
| 8. | Details of other share based awards refer to the Rio Tinto Share Ownership Plan and the SSP, details of which are set out in the Remuneration report on page 95 to 121. Under the Share Ownership Plan UK executives are beneficiaries of free shares up to a maximum value of £3,000 (US$ 5,523) and may also contribute to purchase additional shares where the Company will match their personal contributions up to a maximum of £1,500 (US$ 2,762) per annum. Under these plans Guy Elliott, Keith Johnson and Andrew Mackenzie each received a total of £4,500 (US$8,285). American group product chief executives enjoy a Company matching of personal contribution for shares under the 401k arrangements up to a maximum of US$13,213. The Company matched personal contributions to the following values: Tom Albanese US$ 13,213, Preston Chiaro US$5,410 and Bret Clayton US$11,534. |
| 9. | The costs shown for defined benefit pension plans and post retirement medical benefits are the service costs attributable to the individual, calculated in accordance with IAS19. The cost for defined contribution plans is the amount contributed in the year by the company |
| 10. | Remuneration mix shows the proportions of total remuneration comprising fixed and variable pay components and the percentage of total remuneration comprising share options only. Fixed pay is represented by base salary, non monetary and other cash benefits, secondment and employment costs, post employment costs, long service payments, termination benefits and voluntary share based awards as detailed in Note 8. Variable pay is made up of the cash bonus and the values of the share based awards related to company performance. |
| 11. | Tom Albanese was appointed an executive director with effect from 7 March 2006, having previously been chief executive Copper and Exploration. The aggregate figure of US$3,390,000 reported above represents his remuneration for the full year. The part year since his appointment as executive director amounted to US$2,413,000 and is made up of short term benefits and costs of US$1,388,000, share based awards of US$360,000 and post employment costs of US$665,000. Michael Fitzpatrick was appointed a non executive director with effect from 6 June 2006. Bret Clayton became chief executive, Copper on 1 July 2006. |
| 12. | David Mayhew’s fees were paid to JP Morgan Cazenove and Sir Richard Sykes’s fees were paid to Imperial College. The fees disclosed above include £10,000 (US$ 18,410) paid to JP Morgan Cazenove for David Mayhew’s attendance atAudit committeemeetings in his capacity as advisor. |
| 13. | Prior to Tom Albanese’s appointment as an executive director and Oscar Groeneveld’s transfer to product group chief executive, Aluminium and with a view to retaining their services, both were awarded a one-off three year retention bonus in April 2004 of 100 per cent of salary as at 1 March 2007 which may vest in October 2007, if they remain employed by Rio Tinto at that time. The maximum values for Tom Albanese and Oscar Groeneveld are US$1,134,000 and US$1,076,000 respectively. These amounts have been spread equally over the three year period on an accrual basis and are reported here as long service payments of US$378,000 for Tom Albanese and US$359,000 for Oscar Groeneveld .. The comparative figures for 2005 have similarly been adjusted and restated. |
| 14. | In 2005, the tax equalisation figures for Tom Albanese and Preston Chiaro, which were included under secondment costs, were overstated by US$524,894 and US$262,517 respectively. The 2005 total remuneration comparative figure shown above has been restated to reflect the adjustment. |
| 15. | In the course of the year, Leigh Clifford received US$139,533 in respect of his non Rio Tinto related directorship. |
| 16. | Leon Davis, Sir Richard Giordano and John Morschel retired on 29 April 2005. Robert Adams died on 27 January 2005 and Chris Renwick received a post retirement payment in 2005. |
| Rio Tinto 2006Form 20-F | 109 |
Back to Contents
Table 2 – Executive directors’ pension entitlements (as at 31 December 2006) |
| | | | | | Accrued benefits | | Transfer values | |
| | | | | |
|
|
|
|
|
|
| |
|
|
|
|
|
|
| |
| | Age | | Years of | | At 31 | | At 31 | | Change in | | Change in | | At 31 | | At 31 | | Change, | | Transfer | |
| | | | service | | December | | December | | accrued | | accrued | | December | | December | | net of | | value of | |
| | | | completed | | 2005 | | 2006 | | benefits | | benefit | | 2005 | | 2006 | | personal | | change in | |
| | | | | | | | | | during the | | net of | | | | | | contribs. | | accrued | |
| | | | | | | | | | year ended | | inflation1 | | | | | | | | benefit | |
| | | | | | | | | | 31 | | | | | | | | | | net of | |
| | | | | | | | | | December | | | | | | | | | | inflation1 | |
| | | | | | | | | | 2006 | | | | | | | | | | | |
| | | | | | | | | | | | | | | | | | | | | |
| UK | | | | | £’000 pa | | £’000 pa | | £’000 pa | | £’000 pa | | £’000 | | £’000 | | £’000 | | £’000 | |
| directors | | | | | pension | | pension | | pension | | pension | | | | | | | | | |
|
|
|
|
|
|
|
|
|
|
|
|
|
|
|
|
|
|
|
| |
| Tom Albanes2,3 | 49 | | 25 | | 115 | | 126 | | 11 | | 7 | | 729 | | 882 | | 153 | | 137 | |
| Guy Elliott2 | 51 | | 26 | | 291 | | 335 | | 44 | | 31 | | 3,781 | | 4,484 | | 703 | | 415 | |
|
|
|
|
|
|
|
|
|
|
|
|
|
|
|
|
|
|
|
| |
| Australian | | | | | A$’000 | | A$’000 | | A$’000 | | A$’000 | | A$’000 | | A$’000 | | A$’000 | | A$’000 | |
| director | | | | | Lump sum | | Lump sum | | Lump sum | | Lump sum | | | | | | | | | |
|
|
|
|
|
|
|
|
|
|
|
|
|
|
|
|
|
|
|
| |
| Leigh Clifford4,5 | 59 | | 36 | | 13,877 | | 15,341 | | 1,464 | | 1,006 | | 13,877 | | 15,341 | | 1,464 | | 1,006 | |
|
|
|
|
|
|
|
|
|
|
|
|
|
|
|
|
|
|
|
| |
| Notes to Table 2 |
| 1 | Price inflation is calculated as the increase in the relevant retail or consumer price index over the year to 31 December 2006. |
| 2 | Transfer values are calculated in a manner consistent with “Retirement Benefit Schemes – Transfer Values (GN11)” published by the Institute of Actuaries and the Faculty of Actuaries. |
| 3 | Tom Albanese became a director of Rio Tinto plc and Rio Tinto Limited with effect from 7 March 2006; the figures shown cover the whole of 2006. He accrued pension benefits in the US plans for service up to 30 June 2006 and in the UK fund for subsequent service. The transfer value of his benefits in the US plans is represented by the Accumulated Benefit Obligation calculated on the accounting assumptions used for the Group’s post retirement benefits disclosures. In addition, the employer paid $13,200 in respect of Tom Albanese into a 401k plan in the US for the period. |
| 4 | In addition, A$79,730 was credited to the account belonging to Leigh Clifford in the Rio Tinto Staff Superannuation Fund in relation to the pensionable element of his 2006 performance bonus. |
| 5 | The figures shown for Leigh Clifford include allowance for an enhancement to benefits granted in 2004, whereby his contractual retirement age was reduced from 62 to 60 and the pension multiple at age 60 was increased from 6.65 to 7.0. The figures as at 31 December 2005 shown in the 2005 Financial statements did not include this enhancement. As a result the accrued lump sum shown at the start of the year, of A$13,877,000, is higher than the figure disclosed in the 2005 Financialstatements, of A$13,147,000. |
| Rio Tinto 2006Form 20-F | 110 |
Back to Contents
| Table 3 – Directors’ and senior management’s beneficial interests in Rio Tinto shares | | | |
| |
| | | | | |
| | Rio Tinto plc | | Rio Tinto Limited | | Movement | |
| |
|
|
| |
|
|
|
|
| |
|
|
|
|
| |
| | 1 Jan | | 31 Dec | | 31 May | | 1 Jan | | 31 Dec | | 31 May | | Exercise | | Compen- | | Other6 | |
| | 20061 | | 20062 | | 2007 | | 200611 | | 20062 | | 2007 | | of | | sation5 | | | |
| | | | | | | | | | | | | | options4 | | | | | |
|
|
|
|
|
|
|
|
|
|
|
|
|
|
|
|
|
| |
| Directors | | | | | | | | | | | | | | | | | | |
| Tom Albanese3,7,9 | 23,261 | | 41,814 | | 44,839 | | — | | — | | — | | 35,350 | | 3,025 | | (19,640 | ) |
| Ashton Calvert | — | | — | | — | | — | | — | | 735 | | — | | — | | 735 | |
| Sir David Clementi | — | | 147 | | 308 | | — | | — | | — | | — | | — | | 308 | |
| Leigh Clifford | 2,100 | | 2,100 | | 2,100 | | 91,255 | | 91,255 | | 91,255 | | — | | — | | — | |
| Vivienne Cox | 381 | | 528 | | 692 | | — | | — | | — | | — | | — | | 311 | |
| Sir Rod Eddington | — | | — | | — | | — | | — | | — | | — | | — | | — | |
| Guy Elliott7 | 47,827 | | 48,033 | | 48,644 | | — | | — | | — | | — | | 357 | | 470 | |
| Michael Fitzpatrick3 | — | | — | | — | | 2,100 | | 2,100 | | 2,100 | | — | | — | | — | |
| Richard Goodmanson | — | | 677 | | 1,628 | | — | | — | | — | | — | | — | | 1,628 | |
| Andrew Gould | 1,000 | | 1,000 | | 1,000 | | — | | — | | — | | — | | — | | — | |
| Lord Kerr | 2,300 | | 3,000 | | 3,000 | | — | | — | | — | | — | | — | | 700 | |
| David Mayhew | 2,500 | | 2,500 | | 2,500 | | — | | — | | — | | — | | — | | — | |
| Paul Skinner | 5,409 | | 5,598 | | 5,657 | | — | | — | | — | | — | | — | | 248 | |
| Sir Richard Sykes | 2,482 | | 2,569 | | 2,596 | | — | | — | | — | | — | | — | | 114 | |
| | | | | | | | | | | | | | | | | | | |
| Product group chief executives | | | | | | | | | | | | | | | | | | |
| Preston Chiaro7,9 | 60,762 | | 60,927 | | 62,585 | | — | | — | | — | | 490 | | — | | 1,823 | |
| Bret Clayton3,7,9 | 6,640 | | 6,867 | | 7,376 | | — | | — | | — | | — | | — | | 736 | |
| Oscar Groeneveld | 3,000 | | 3,000 | | 3,000 | | 79,502 | | 66,790 | | 66,790 | | 171,000 | | — | | (183,712 | ) |
| Keith Johnson7 | 2,236 | | 17,536 | | 18,882 | | — | | — | | — | | 43,426 | | 2,446 | | (29,216 | ) |
| Andrew Mackenzie10 | 39,197 | | 40,456 | | 40,597 | | — | | — | | — | | — | | 357 | | 1,053 | |
| Sam Walsh | — | | — | | — | | 6,570 | | 42,322 | | 42,723 | | 187,118 | | 4,156 | | (155,121 | ) |
|
|
|
|
|
|
|
|
|
|
|
|
|
|
|
|
|
| |
| Notes to Table 3 |
| 1 | Or date of appointment if later. |
| 2 | Or date of retirement or resignation if earlier. |
| 3 | Tom Albanese was appointed executive director on 7 March 2006 and took over as chief executive from Leigh Clifford with effect 1 May 2007. Bret Clayton was appointed chief executive Copper on 1 July 2006. Michael Fitzpatrick was appointed non executive director on 6 June 2006. |
| 4 | Shares obtained through the exercise of options under the Rio Tinto Share Savings Plan or the Rio Tinto Share Option Plan. The number of shares retained may differ from the number of options exercised. |
| 5 | Shares obtained through the Rio Tinto Share Ownership Plan and/or vesting of awards under the Mining Companies Comparative Plan. |
| 6 | Share movements due to sale or purchase of shares, shares received under the Dividend Reinvestment Plan, shares purchased/sold through the Rio Tinto America Savings Plan or non executive directors share purchase plan. |
| 7 | These executives also have an interest in a trust fund containing 864 Rio Tinto plc shares at 31 December 2006 (1 January 2006: 835 Rio Tinto plc shares) as potential beneficiaries of the Rio Tinto Share Ownership Trust. At 8 June 2007 this trust fund contained 873 Rio Tinto plc shares. |
| 8 | Shares in Rio Tinto plc are ordinary shares of ten pence each. Shares in Rio Tinto Limited are ordinary shares. |
| 9 | The shareholdings of Tom Albanese, Preston Chiaro and Bret Clayton include Rio Tinto plc ADRs held through the Rio Tinto America Savings Plan. |
| 10 | Andrew Mackenzie’s 31 December 2005 balance was understated in the 2005 Remuneration report by ten Rio Tinto plc shares. |
| Rio Tinto 2006Form 20-F | 111 |
Back to Contents
Table 4 – Directors’ and senior management’s awards under long term incentive plans
| Mining Companies Comparative Plan | | Plan terms and conditions | |
| |
|
|
|
|
|
|
| |
|
|
|
|
|
|
| |
| | Conditional | | Market | | 1Jan | | Awarded3 | | Lapsed3 | | Vested3 | | 31Dec | | Perfor- | | Date | | Market | | Monetary | |
| | award | | price at | | 20063 | | | | | | | | 200610 | | mance | | award | | price at | | 5value of | |
| | granted | | award | | | | | | | | | | | | period | | vests | | vesting | | vested | |
| | | | | | | | | | | | | | | | concludes | | | | | | award | |
| | | | | | | | | | | | | | | | | | | | | | US$’000 | |
| |
|
|
|
|
|
|
|
|
|
|
|
|
| |
|
|
|
|
|
|
| |
| Executive directors | | | | | | | | | | | | | | | | | | | | | |
| Tom | 7 Mar | | | | | | | | | | | | | | 31 Dec | | 16 Feb | | | | | |
| Albanese | 2003 | | 1198 | p | 19,274 | | — | | 14,456 | | 4,818 | | — | | 2006 | | 2007 | | 2697 | p | 255 | |
| | 22 Apr | | | | | | | | | | | | | | 31 Dec | | | | | | | |
| | 2004 | | 1276 | p | 56,015 | | — | | — | | — | | 56,015 | | 2007 | | | | | | | |
| | 9 Mar | | | | | | | | | | | | | | 31 Dec | | | | | | | |
| | 2005 | | 1839 | p | 55,951 | | — | | — | | — | | 55,951 | | 2008 | | | | | | | |
| | 7 Mar | �� | | | | | | | | | | | | | 31 Dec | | | | | | | |
| | 2006 | | 2630 | p | — | | 45,007 | | — | | — | | 45,007 | | 2009 | | | | | | | |
| | | | | |
|
|
|
|
|
|
|
|
| | | | | | | |
| |
| | | | | | 131,240 | | 45,007 | | 14,456 | | 4,818 | | 156,973 | | | | | | | | 255 | |
| | | | | |
|
|
|
|
|
|
|
|
| | | | | | | |
| |
| Leigh | 7 Mar | | | | | | | | | | | | | | 31 Dec | | | | | | | |
| Clifford | 2003 | | A$30.69 | | 36,341 | | — | | 36,341 | | — | | — | | 2006 | | | | | | | |
| | 22 Apr | | | | | | | | | | | | | | 31 Dec | | | | | | | |
| | 2004 | | A$33.17 | | 119,581 | | — | | — | | — | | 119,581 | | 2007 | | | | | | | |
| | 9 Mar | | | | | | | | | | | | | | 31 Dec | | | | | | | |
| | 2005 | | A$47.39 | | 113,324 | | — | | — | | — | | 113,324 | | 2008 | | | | | | | |
| | 7 Mar | | | | | | | | | | | | | | 31 Dec | | | | | | | |
| | 2006 | | A$69.60 | | — | | 84,661 | | — | | — | | 84,661 | | 2009 | | | | | | | |
| | | | | |
|
|
|
|
|
|
|
|
| | | | | | | |
| |
| | | | | | 269,246 | | 84,661 | | 36,341 | | — | | 317,566 | | | | | | | | — | |
| | | | | |
|
|
|
|
|
|
|
|
| | | | | | | |
| |
| Guy | 7 Mar | | | | | | | | | | | | | | 31 Dec | | | | | | | |
| Elliott | 2003 | | 1198 | p | 22,923 | | — | | 22,923 | | — | | — | | 2006 | | | | | | | |
| | 22 Apr | | | | | | | | | | | | | | 31 Dec | | | | | | | |
| | 2004 | | 1276 | p | 51,550 | | — | | — | | — | | 51,550 | | 2007 | | | | | | | |
| | 9 Mar | | | | | | | | | | | | | | 31 Dec | | | | | | | |
| | 2005 | | 1839 | p | 51,081 | | — | | — | | — | | 51,081 | | 2008 | | | | | | | |
| | 7 Mar | | | | | | | | | | | | | | 31 Dec | | | | | | | |
| | 2006 | | 2630 | p | — | | 40,670 | | — | | — | | 40,670 | | 2009 | | | | | | | |
| | | | | |
|
|
|
|
|
|
|
|
| | | | | | | |
| |
| | | | | | 125,554 | | 40,670 | | 22,923 | | — | | 143,301 | | | | | | | | — | |
| | | | | |
|
|
|
|
|
|
|
|
| | | | | | | |
| |
| Product group chief executives | | | | | | | | | | | | | | | | | | | |
| Preston | 7 Mar | | | | | | | | | | | | | | 31 Dec | | 16 Feb | | | | | |
| Chiaro | 2003 | | 1198 | p | 7,352 | | — | | 5,514 | | 1,838 | | — | | 2006 | | 2007 | | 2697 | p | 97 | |
| | 22 Apr | | | | | | | | | | | | | | 31 Dec | | | | | | | |
| | 2004 | | 1276 | p | 46,995 | | — | | — | | — | | 46,995 | | 2007 | | | | | | | |
| | 9 Mar | | | | | | | | | | | | | | 31 Dec | | | | | | | |
| | 2005 | | 1839 | p | 42,351 | | — | | — | | — | | 42,351 | | 2008 | | | | | | | |
| | 7 Mar | | | | | | | | | | | | | | 31 Dec | | | | | | | |
| | 2006 | | 2630 | p | — | | 34,182 | | — | | — | | 34,182 | | 2009 | | | | | | | |
| | | | | |
|
|
|
|
|
|
|
|
| | | | | | | |
| |
| | | | | | 96,698 | | 34,182 | | 5,514 | | 1,838 | | 123,528 | | | | | | | | 97 | |
| | | | | |
|
|
|
|
|
|
|
|
| | | | | | | |
| |
| Bret | 7 Mar | | | | | | | | | | | | | | 31 Dec | | 16 Feb | | | | | |
| Clayton | 2003 | | 1198 | p | 4,862 | | — | | 3,647 | | 1,215 | | — | | 2006 | | 2007 | | 2697 | p | 64 | |
| | 22 Apr | | | | | | | | | | | | | | 31 Dec | | | | | | | |
| | 2004 | | 1276 | p | 13,315 | | — | | — | | — | | 13,315 | | 2007 | | | | | | | |
| | 9 Mar | | | | | | | | | | | | | | 31 Dec | | | | | | | |
| | 2005 | | 1839 | p | 11,539 | | — | | — | | — | | 11,539 | | 2008 | | | | | | | |
| | 7 Mar | | | | | | | | | | | | | | 31 Dec | | | | | | | |
| | 2006 | | 2630 | p | — | | 10,767 | | — | | — | | 10,767 | | 2009 | | | | | | | |
| | | | | |
|
|
|
|
|
|
|
|
| | | | | | | |
| |
| | | | | | 29,716 | | 10,767 | | 3,647 | | 1,215 | | 35,621 | | | | | | | | 64 | |
| | | | | |
|
|
|
|
|
|
|
|
| | | | | | | |
| |
| Rio Tinto 2006Form 20-F | 112 |
Back to Contents
Table 4 – Awards to executive directors and product group chief executives under long term incentive plans
| Mining Companies Comparative Plan | | Plan terms and conditions | |
| |
|
|
|
|
|
|
| |
|
|
|
|
|
|
| |
| | Conditional | | Market | | 1 Jan | | Awarded3 | | Lapsed3 | | Vested3 | | 31 Dec | | Perfor- | | Date | | Market | | Monetary | |
| | award | | price at | | 20063 | | | | | | | | 200610 | | mance | | award | | price at | | 5value of | |
| | granted | | award | | | | | | | | | | | | period | | vests | | vesting | | vested | |
| | | | | | | | | | | | | | | | concludes | | | | | | award | |
| | | | | | | | | | | | | | | | | | | | | | US$’000 | |
| |
|
|
|
|
|
|
|
|
|
|
|
|
| |
|
|
|
|
|
|
| |
| Oscar | 7 Mar | | | | | | | | | | | | | | 31 Dec | | | | | | | |
| Groeneveld | 2003 | | A$30.69 | | 21,469 | | — | | 21,469 | | — | | — | | 2006 | | — | | — | | — | |
| | 22 Apr | | | | | | | | | | | | | | 31 Dec | | | | | | | |
| | 2004 | | A$33.17 | | 43,785 | | — | | — | | — | | 43,785 | | 2007 | | — | | — | | — | |
| | 9 Mar | | | | | | | | | | | | | | 31 Dec | | | | | | | |
| | 2005 | | A$47.39 | | 45,024 | | — | | — | | — | | 45,024 | | 2008 | | — | | — | | — | |
| | 7 Mar | | | | | | | | | | | | | | 31 Dec | | | | | | | |
| | 2006 | | A$69.60 | | — | | 36,460 | | — | | — | | 36,460 | | 2009 | | — | | — | | — | |
| | | | | |
|
|
|
|
|
|
|
|
| | | | | | | |
| |
| | | | | | 110,278 | | 36,460 | | 21,469 | | — | | 125,269 | | | | | | | | — | |
| | | | | |
|
|
|
|
|
|
|
|
| | | | | | | |
| |
| Keith | 7 Mar | | | | | | | | | | | | | | 31 Dec | | 16 Feb | | | | | |
| Johnson | 2003 | | 1198 | p | 8,186 | | — | | 6,140 | | 2,046 | | — | | 2006 | | 2007 | | 2697 | p | 108 | |
| | 22 Apr | | | | | | | | | | | | | | 31 Dec | | | | | | | |
| | 2004 | | 1276 | p | 30,387 | | — | | — | | — | | 30,387 | | 2007 | | — | | — | | — | |
| | 9 Mar | | | | | | | | | | | | | | 31 Dec | | | | | | | |
| | 2005 | | 1839 | p | 33,556 | | — | | — | | — | | 33,556 | | 2008 | | — | | — | | — | |
| | 7 Mar | | | | | | | | | | | | | | 31 Dec | | | | | | | |
| | 2006 | | 2630 | p | — | | 26,508 | | — | | — | | 26,508 | | 2009 | | — | | — | | — | |
| | | | | |
|
|
|
|
|
|
|
|
| | | | | | | |
| |
| | | | | | 72,129 | | 26,508 | | 6,140 | | 2,046 | | 90,451 | | | | | | | | 108 | |
| | | | | |
|
|
|
|
|
|
|
|
| | | | | | | |
| |
| Andrew | 7 Mar | | | | | | | | | | | | | | 31 Dec | | | | | | | |
| Mackenzie | 2003 | | 1198 | p | — | | — | | — | | — | | — | | 2006 | | — | | — | | — | |
| | 22 Apr | | | | | | | | | | | | | | 31 Dec | | | | | | | |
| | 2004 | | 1276 | p | 16,270 | | — | | — | | — | | 16,270 | | 2007 | | — | | — | | — | |
| | 9 Mar | | | | | | | | | | | | | | 31 Dec | | | | | | | |
| | 2005 | | 1839 | p | 37,638 | | — | | — | | — | | 37,638 | | 2008 | | — | | — | | — | |
| | 7 Mar | | | | | | | | | | | | | | 31 Dec | | | | | | | |
| | 2006 | | 2630 | p | — | | 29,413 | | — | | — | | 29,413 | | 2009 | | — | | — | | — | |
| | | | | |
|
|
|
|
|
|
|
|
| | | | | | | |
| |
| | | | | | 53,908 | | 29,413 | | — | | — | | 83,321 | | | | | | | | — | |
| | | | | |
|
|
|
|
|
|
|
|
| | | | | | | |
| |
| Sam Walsh | 7 Mar | | | | | | | | | | | | | | 31 Dec | | 16 Feb | | | | | |
| | 2003 | | A$30.69 | | 16,884 | | — | | 12,663 | | 4,221 | | — | | 2006 | | 2007 | | A$75.60 | | 252 | |
| | 22 Apr | | | | | | | | | | | | | | 31 Dec | | | | | | | |
| | 2004 | | A$33.17 | | 38,023 | | — | | — | | — | | 38,023 | | 2007 | | — | | — | | — | |
| | 9 Mar | | | | | | | | | | | | | | 31 Dec | | | | | | | |
| | 2005 | | A$47.39 | | 41,176 | | — | | — | | — | | 41,176 | | 2008 | | — | | — | | — | |
| | 7 Mar | | | | | | | | | | | | | | 31 Dec | | | | | | | |
| | 2006 | | A$69.60 | | — | | 33,655 | | — | | — | | 33,655 | | 2009 | | — | | — | | — | |
| | | | | |
|
|
|
|
|
|
|
|
| | | | | | | |
| |
| | | | | | 96,083 | | 33,655 | | 12,663 | | 4,221 | | 112,854 | | | | | | | | 252 | |
| | | | | |
|
|
|
|
|
|
|
|
| | | | | | | |
| |
| Rio Tinto 2006Form 20-F | 113 |
Back to Contents
Table 4 – Awards to executive directors and product group chief executives under long term incentive plans
| | Mining Companies Comparative Plan | | Plan terms and conditions | |
| |
| |
| |
| | Conditional | | Market | | 1 Jan | | Awarded3 | | Lapsed3 | | Vested3 | | 31 May | | Perfor- | | Date | | Market | | Monetary | |
| | award | | price at | | 20073 | | | | | | | | 200710 | | mance | | award | | price at | | 5value of | |
| | granted | | award | | | | | | | | | | | | period | | vests | | vesting | | vested | |
| | | | | | | | | | | | | | | | concludes | | | | | | award | |
| | | | | | | | | | | | | | | | | | | | | | US$’000 | |
| |
|
|
|
|
|
|
|
|
|
|
|
|
| |
|
|
|
|
|
|
| |
| Executive directors | | | | | | | | | | | | | | | | | | | | | | |
| Tom | 22Apr | | | | | | | | | | | | | | 31Dec | | | | | | | |
| Albanese | 2004 | | 1276 | p | 56,015 | | — | | — | | — | | 56,015 | | 2007 | | — | | — | | — | |
| | 9Mar | | | | | | | | | | | | | | 31Dec | | | | | | | |
| | 2005 | | 1839 | p | 55,951 | | — | | — | | — | | 55,951 | | 2008 | | — | | — | | — | |
| | 7Mar | | | | | | | | | | | | | | 31Dec | | | | | | | |
| | 2006 | | 2630 | p | 45,007 | | — | | — | | — | | 45,007 | | 2009 | | — | | — | | — | |
| | 13Mar | | | | | | | | | | | | | | 31Dec | | | | | | | |
| | 2007 | | 2681 | p | — | | 44,124 | | — | | — | | 44,124 | | 2010 | | — | | — | | — | |
| | | | |
|
|
|
|
|
|
|
|
| | | | | | | |
| |
| | | | | | 156,973 | | 44,124 | | — | | — | | 201,097 | | | | | | | | — | |
| | | | |
|
|
|
|
|
|
|
|
| | | | | | | |
| |
| Leigh | 22Apr | | A$ | | | | | | | | | | | | 31Dec | | | | | | | |
| Clifford | 2004 | | 33.17 | | 119,581 | | — | | — | | — | | 119,581 | | 2007 | | — | | — | | — | |
| | 9Mar | | A$ | | | | | | | | | | | | 31Dec | | | | | | | |
| | 2005 | | 47.39 | | 113,324 | | — | | — | | — | | 113,324 | | 2008 | | — | | — | | — | |
| | 7Mar | | A$ | | | | | | | | | | | | 31Dec | | | | | | | |
| | 2006 | | 69.60 | | 84,661 | | — | | — | | — | | 84,661 | | 2009 | | — | | — | | — | |
| | 13Apr | | A$ | | | | | | | | | | | | 31Dec | | | | | | | |
| | 2007 | | 74.50 | | — | | 61,550 | | — | | — | | 61,550 | | 2010 | | — | | — | | — | |
| | | | |
|
|
|
|
|
|
|
|
| | | | | | | |
| |
| | | | | | 317,566 | | 61,550 | | — | | — | | 379,116 | | | | | | | | — | |
| | | | |
|
|
|
|
|
|
|
|
| | | | | | | |
| |
| Guy | 22Apr | | | | | | | | | | | | | | 31Dec | | | | | | | |
| Elliott | 2004 | | 1276 | p | 51,550 | | — | | — | | — | | 51,550 | | 2007 | | — | | — | | — | |
| | 9Mar | | | | | | | | | | | | | | 31Dec | | | | | | | |
| | 2005 | | 1839 | p | 51,081 | | — | | — | | — | | 51,081 | | 2008 | | — | | — | | — | |
| | 7Mar | | | | | | | | | | | | | | 31Dec | | | | | | | |
| | 2006 | | 2630 | p | 40,670 | | — | | — | | — | | 40,670 | | 2009 | | — | | — | | — | |
| | 13Apr | | | | | | | | | | | | | | 31Dec | | | | | | | |
| | 2007 | | 2681 | p | — | | 30,837 | | — | | — | | 30,837 | | 2010 | | — | | — | | — | |
| | | | |
|
|
|
|
|
|
|
|
| | | | | | | |
| |
| | | | | | 143,301 | | 30,837 | | — | | — | | 174,138 | | | | | | | | — | |
| | | | |
|
|
|
|
|
|
|
|
| | | | | | | |
| |
| Product group chief executives | | | | | | | | | | | | | | | | | | | | | |
| Preston | 22Apr | | | | | | | | | | | | | | 31Dec | | | | | | | |
| Chiaro | 2004 | | 1276 | p | 46,995 | | — | | — | | — | | 46,995 | | 2006 | | — | | — | | — | |
| | 9Mar | | | | | | | | | | | | | | 31Dec | | | | | | | |
| | 2005 | | 1839 | p | 42,351 | | — | | — | | — | | 42,351 | | 2007 | | — | | — | | — | |
| | 7Mar | | | | | | | | | | | | | | 31 Dec | | | | | | | |
| | 2006 | | 2630 | p | 34,182 | | — | | — | | — | | 34,182 | | 2008 | | — | | — | | — | |
| | 13Apr | | | | | | | | | | | | | | 31 Dec | | | | | | | |
| | 2007 | | 2681 | p | — | | 25,679 | | — | | — | | 25,679 | | 2010 | | — | | — | | — | |
| | | | |
|
|
|
|
|
|
|
|
| | | | | | | |
| |
| | | | | | 123,528 | | 25,679 | | — | | — | | 149,207 | | | | | | | | — | |
| | | | |
|
|
|
|
|
|
|
|
| | | | | | | |
| |
| Bret | 22Apr | | | | | | | | | | | | | | 31Dec | | | | | | | |
| Clayton | 2004 | | 1276 | p | 13,315 | | — | | — | | — | | 13,315 | | 2007 | | — | | — | | — | |
| | 9Mar | | | | | | | | | | | | | | 31Dec | | | | | | | |
| | 2005 | | 1839 | p | 11,539 | | — | | — | | — | | 11,539 | | 2008 | | — | | — | | — | |
| | 7Mar | | | | | | | | | | | | | | 31Dec | | | | | | | |
| | 2006 | | 2630 | p | 10,767 | | — | | — | | — | | 10,767 | | 2009 | | — | | — | | — | |
| | 13Apr | | | | | | | | | | | | | | 31Dec | | | | | | | |
| | 2007 | | 2681 | p | — | | 22,566 | | — | | — | | 22,566 | | 2010 | | — | | — | | — | |
| | | | |
|
|
|
|
|
|
|
|
| | | | | | | |
| |
| | | | | | 35,621 | | 22,566 | | — | | — | | 58,187 | | | | | | | | — | |
| | | | |
|
|
|
|
|
|
|
|
| | | | | | | |
| |
| Rio Tinto 2006 Form 20-F | 114 |
Back to Contents
Table 4 – Awards to executive directors and product group chief executives under long term incentive plans
| | Mining Companies Comparative Plan | | Plan terms and conditions | |
| |
| |
| |
| | Conditional | | Market | | 1 Jan | | Awarded3 | | Lapsed3 | | Vested3 | | 31 May | | Perfor- | | Date | | Market | | Monetary | |
| | award | | price at | | 20073 | | | | | | | | 200710 | | mance | | award | | price at | | 5 value of | |
| | granted | | award | | | | | | | | | | | | period | | vests | | vesting | | vested | |
| | | | | | | | | | | | | | | | concludes | | | | | | award | |
| | | | | | | | | | | | | | | | | | | | | | US$’000 | |
| |
|
|
|
|
|
|
|
|
|
|
|
|
| |
|
|
|
|
|
|
| |
| Oscar | 22 Apr | | A$ | | | | | | | | | | | | 31 Dec | | | | | | | |
| Groeneveld | 2004 | | 33.17 | | 43,785 | | — | | — | | — | | 43,785 | | 2007 | | — | | — | | — | |
| | 9 Mar | | A$ | | | | | | | | | | | | 31 Dec | | | | | | | |
| | 2005 | | 47.39 | | 45,024 | | — | | — | | — | | 45,024 | | 2008 | | — | | — | | — | |
| | 7 Mar | | A$ | | | | | | | | | | | | 31 Dec | | | | | | | |
| | 2006 | | 69.60 | | 36,460 | | — | | — | | — | | 36,460 | | 2009 | | — | | — | | — | |
| | 13 Apr | | A$ | | | | | | | | | | | | 31 Dec | | | | | | | |
| | 2007 | | 74.50 | | — | | 26,590 | | — | | — | | 26,590 | | 2010 | | — | | — | | — | |
| | | | |
|
|
|
|
|
|
|
|
| | | | | | | |
| |
| | | | | | 125,269 | | 26,590 | | — | | — | | 151,859 | | | | | | | | — | |
| | | | |
|
|
|
|
|
|
|
|
| | | | | | | |
| |
| Keith | 22 Apr | | | | | | | | | | | | | | 31 Dec | | — | | — | | | |
| Johnson | 2004 | | 1276 | p | 30,387 | | — | | — | | — | | 30,387 | | 2007 | | | | | | — | |
| | 9 Mar | | | | | | | | | | | | | | 31 Dec | | | | | | | |
| | 2005 | | 1839 | p | 33,556 | | — | | — | | — | | 33,556 | | 2008 | | — | | — | | — | |
| | 7 Mar | | | | | | | | | | | | | | 31 Dec | | | | | | | |
| | 2006 | | 2630 | p | 26,508 | | — | | — | | — | | 26,508 | | 2009 | | — | | — | | — | |
| | 13 Apr | | | | | | | | | | | | | | 31 Dec | | | | | | | |
| | 2007 | | 2681 | p | — | | 19,805 | | — | | — | | 19,805 | | 2010 | | — | | — | | — | |
| | | | |
|
|
|
|
|
|
|
|
| | | | | | | |
| |
| | | | | | 90,451 | | 19,805 | | — | | — | | 110,256 | | | | | | | | — | |
| | | | |
|
|
|
|
|
|
|
|
| | | | | | | |
| |
| Andrew | 22 Apr | | | | | | | | | | | | | | 31 Dec | | | | | | | |
| Mackenzie | 2004 | | 1276 | p | 16,270 | | — | | — | | — | | 16,270 | | 2007 | | — | | — | | — | |
| | 9 Mar | | | | | | | | | | | | | | 31 Dec | | | | | | | |
| | 2005 | | 1839 | p | 37,638 | | — | | — | | — | | 37,638 | | 2008 | | — | | — | | — | |
| | 7 Mar | | | | | | | | | | | | | | 31 Dec | | | | | | | |
| | 2006 | | 2630 | p | 29,413 | | — | | — | | — | | 29,413 | | 2009 | | — | | — | | — | |
| | 13 Apr | | | | | | | | | | | | | | 31 Dec | | | | | | | |
| | 2007 | | 2681 | p | — | | 21,811 | | — | | — | | 21,811 | | 2010 | | — | | — | | — | |
| | | | |
|
|
|
|
|
|
|
|
| | | | | | | |
| |
| | | | | | 83,321 | | 21,811 | | — | | — | �� | 105,132 | | | | | | | | — | |
| | | | |
|
|
|
|
|
|
|
|
| | | | | | | |
| |
| Sam Walsh | 22 Apr | | A$ | | | | | | | | | | | | 31 Dec | | | | | | | |
| | 2004 | | 33.17 | | 38,023 | | — | | — | | — | | 38,023 | | 2007 | | — | | — | | — | |
| | 9 Mar | | A$ | | | | | | | | | | | | 31 Dec | | | | | | | |
| | 2005 | | 47.39 | | 41,176 | | — | | — | | — | | 41,176 | | 2008 | | — | | — | | — | |
| | 7 Mar | | A$ | | | | | | | | | | | | 31 Dec | | | | | | | |
| | 2006 | | 69.60 | | 33,655 | | — | | — | | — | | 33,655 | | 2009 | | — | | — | | — | |
| | 13 Apr | | A$ | | | | | | | | | | | | 31 Dec | | | | | | | |
| | 2007 | | 74.50 | | — | | 25,103 | | — | | — | | 25,103 | | 2010 | | — | | — | | — | |
| | | | |
|
|
|
|
|
|
|
|
| | | | | | | |
| |
| | | | | | 112,854 | | 25,103 | | — | | — | | 137,957 | | | | | | | | — | |
| | | | |
|
|
|
|
|
|
|
|
| | | | | | | |
| |
| Notes to Table 4 |
| 1. | Awards denominated in pence were for Rio Tinto plc ordinary shares of 10p each. Awards denominated in A$ were for Rio TintoLimited shares. |
| 2. | The fair value of conditional awards granted in 2006 was 964p for Rio Tinto plc and A$24.96 for Rio Tinto Limited shares. |
| 3. | The Group’s 10th place ranking against the comparator group for the MCCP 2003 award will not generate any vesting of the conditional award to any participant who was an executive director at the time of the initial grant. Tom Albanese was not an executive director at that time and along with participating senior employees of the Group he will qualify for a 25 per cent vesting based on the scales applied to conditional awards made prior to 2004. |
| 4. | The value of the vested awards have been based on share prices of 2697p and A$75.60 being the respective closing share prices for Rio Tinto plc and Rio Tinto Limited ordinary shares on 9 February 2007, the latest practicable date prior to the publication of the 2006 Annual report and financial statements. The amount in US dollars has been converted from sterling at the rate of US$1 = £0.5092 and Australian dollars at the rate of US$1 = A$1.2653, being the year end exchange rate used elsewhere in this publication. |
| 5. | Conditional awards are awarded at no cost to the recipient and no amount remains unpaid on any shares granted. No award would be vested and unexercisable at the reporting date. |
| 6. | Leigh Clifford was given a conditional award over 84,661 Rio Tinto Limited shares during the year. These awards were approved by the shareholders under the ASX Listing Rule 10.14 at the 2004 annual general meeting. |
| 7. | A full explanation of the MCCP can be found on pages 97 to 98. |
| Rio Tinto 2006 Form 20-F | 115 |
Back to Contents
Table 5 – Directors’ and senior management’s options to acquire Rio Tinto plc and Rio Tinto Limited shares
| | | | | | | | | | Vested and | | | | | | Value of | | | | | | | |
| | | | | | | | | | exercisable | | | | | | options | | Market | | | | | |
| | | | | | Vested | | | | on | | | | | | exercised | | price on | | Date from | | | |
| | 1 Jan | | | | during | | | | 31Dec | | 31 Dec | | Option | | during | | date of | | which first | | Expiry | |
| | 2006 | | Granted | | 2006 | | Exercised | | 2006 | | 2006 | | price | | 20069 | | exercise | | exercisable | | date | |
|
|
|
|
|
|
|
|
|
|
|
|
|
|
|
|
|
|
|
|
|
| |
| Rio Tinto plc Share Savings Plan | | | | | | | | | | | | | | | | | | | |
|
|
|
|
|
|
|
|
|
|
|
|
|
|
|
|
|
|
|
|
|
| |
| Tom | | | | | | | | | | | | | | | | | | | 1 Jan | | 7 Jan | |
| Albanese | 530 | | — | | 530 | | 530 | | — | | — | | 1150 | p | £8,072 | | 2673 | p | 2006 | | 2006 | |
| | | | | | | | | | | | | | | | | | | | 1 Jan | | 30 Jun | |
| | — | | 791 | | — | | — | | — | | 791 | | 2068 | p | — | | — | | 2012 | | 2012 | |
|
|
|
|
|
|
|
|
|
|
|
|
|
|
|
|
|
|
|
|
|
| |
| Preston | | | | | | | | | | | | | | | | | | | 1 Jan | | 5 Jan | |
| Chiaro | 490 | | — | | — | | — | | — | | 490 | | 1277 | p | — | | — | | 2007 | | 2007 | |
| | | | | | | | | | | | | | | | | | | | 1 Jan | | 6 Jan | |
| | — | | 298 | | — | | — | | — | | 298 | | 2088 | p | — | | — | | 2009 | | 2009 | |
|
|
|
|
|
|
|
|
|
|
|
|
|
|
|
|
|
|
|
|
|
| |
| Bret | | | | | | | | | | | | | | | | | | | 1 Jan | | 7 Jan | |
| Clayton2 | 530 | | — | | 530 | | 530 | | — | | — | | 1150 | p | £8,072 | | 2673 | p | 2006 | | 2006 | |
|
|
|
|
|
|
|
|
|
|
|
|
|
|
|
|
|
|
|
|
|
| |
| Guy | | | | | | | | | | | | | | | | | | | 1 Jan | | 30 Jun | |
| Elliott | 1,431 | | — | | — | | — | | — | | 1,431 | | 1107 | p | — | | — | | 2009 | | 2009 | |
|
|
|
|
|
|
|
|
|
|
|
|
|
|
|
|
|
|
|
|
|
| |
| Keith | | | | | | | | | | | | | | | | | | | 1 Jan | | 5 Jan | |
| Johnson | 1,078 | | — | | 1,078 | | 1,078 | | — | | — | | 876 | p | £21,528 | | 2873 | p | 2007 | | 2007 | |
| | | | | | | | | | | | | | | | | | | | 1 Jan | | 6 Jan | |
| | — | | 456 | | — | | — | | — | | 456 | | 2068 | p | — | | — | | 2009 | | 2009 | |
|
|
|
|
|
|
|
|
|
|
|
|
|
|
|
|
|
|
|
|
|
| |
| Andrew | | | | | | | | | | | | | | | | | | | 1 Jan | | 30 Jun | |
| Mackenzie | 1,021 | | — | | — | | — | | — | | 1,021 | | 1576 | p | — | | — | | 2009 | | 2009 | |
|
|
|
|
|
|
|
|
|
|
|
|
|
|
|
|
|
|
|
|
|
| |
| Rio Tinto plc Share Option Plan | | | | | | | | | | | | | | | | | | | |
|
|
|
|
|
|
|
|
|
|
|
|
|
|
|
|
|
|
|
|
|
| |
| Tom | | | | | | | | | | | | | | | | | | | 27 May | | 27 May | |
| Albanese | 11,142 | | — | | — | | 11,142 | | — | | — | | 820 | p | £221,280 | | 2806 | p | 2001 | | 2008 | |
| | | | | | | | | | | | | | | | | | | | 12 Mar | | 12 Mar | |
| | 12,382 | | — | | — | | 12,382 | | — | | — | | 808.8 | p | £247,293 | | 2806 | p | 2002 | | 2009 | |
| | | | | | | | | | | | | | | | | | | | 7 Mar | | 7 Mar | |
| | 7,530 | | — | | — | | 7,530 | | — | | — | | 965.4 | p | £138,597 | | 2806 | p | 2003 | | 2010 | |
| | | | | | | | | | | | | | | | | | | | 7 Mar | | 7 Mar | |
| | 3,766 | | — | | — | | 3,766 | | — | | — | | 965.4 | p | £69,317 | | 2806 | p | 2005 | | 2010 | |
| | | | | | | | | | | | | | | | | | | | 6 Mar | | 6 Mar | |
| | 102,718 | | — | | — | | — | | 102,718 | | 102,718 | | 1265.6 | p | — | | — | | 2005 | | 2011 | |
| | | | | | | | | | | | | | | | | | | | 13 Mar | | 13 Mar | |
| | 125,336 | | — | | — | | — | | 125,336 | | 125,336 | | 1458.6 | p | — | | — | | 2005 | | 2012 | |
| | | | | | | | | | | | | | | | | | | | 7 Mar | | 7 Mar | |
| | 139,165 | | — | | 139,165 | | — | | 139,165 | | 139,165 | | 1263 | p | — | | — | | 2006 | | 2013 | |
| | | | | | | | | | | | | | | | | | | | 22 Apr | | 22 Apr | |
| | 84,020 | | — | | — | | — | | — | | 84,020 | | 1329 | p | — | | — | | 2007 | | 2014 | |
| | | | | | | | | | | | | | | | | | | | 9 Mar | | 9 Mar | |
| | 83,926 | | — | | — | | — | | — | | 83,926 | | 1826.2 | p | — | | — | | 2008 | | 2015 | |
| | | | | | | | | | | | | | | | | | | | 7 Mar | | 7 Mar | |
| | — | | 67,511 | | — | | — | | — | | 67,511 | | 2711.2 | p | — | | — | | 2009 | | 2016 | |
|
|
|
|
|
|
|
|
|
|
|
|
|
|
|
|
|
|
|
|
|
| |
| Preston | | | | | | | | | | | | | | | | | | | 7 Mar | | 7 Mar | |
| Chiaro | 37,160 | | — | | 37,160 | | — | | 37,160 | | 37,160 | | 1263 | p | — | | — | | 2006 | | 2013 | |
| | | | | | | | | | | | | | | | | | | | 22 Apr | | 22 Apr | |
| | 70,490 | | — | | — | | — | | — | | 70,490 | | 1329 | p | — | | — | | 2007 | | 2014 | |
| | | | | | | | | | | | | | | | | | | | 9 Mar | | 9 Mar | |
| | 63,527 | | — | | — | | — | | — | | 63,527 | | 1826.2 | p | — | | — | | 2008 | | 2015 | |
| | | | | | | | | | | | | | | | | | | | 7 Mar | | 7 Mar | |
| | — | | 51,274 | | — | | — | | — | | 51,274 | | 2711.2 | p | — | | — | | 2009 | | 2016 | |
|
|
|
|
|
|
|
|
|
|
|
|
|
|
|
|
|
|
|
|
|
| |
| Rio Tinto 2006 Form 20-F | 116 |
Back to Contents
Table 5 – Directors’ and senior management’s options to acquire Rio Tinto plc and Rio Tinto Limited shares
| | | | | | | | | | Vested and | | | | | | Value of | | | | | | | |
| | | | | | | | | | exercisable | | | | | | options | | Market | | | | | |
| | | | | | Vested | | | | on | | | | | | exercised | | price on | | Date from | | | |
| | 1 Jan | | | | during | | | | 31 Dec | | 31 Dec | | Option | | during | | date of | | which first | | Expiry | |
| | 2006 | | Granted | | 2006 | | Exercised | | 2006 | | 2006 | | price | | 20069 | | exercise | | exercisable | | date | |
|
|
|
|
|
|
|
|
|
|
|
|
|
|
|
|
|
|
|
|
|
| |
| Rio Tinto plc Share Option Plan (continued) | | | | | | | | | | | | | | | | | |
|
|
|
|
|
|
|
|
|
|
|
|
|
|
|
|
|
|
|
|
|
| |
| Bret | | | | | | | | | | | | | | | | | | | 7 Mar | | 7 Mar | |
| Clayton2 | 24,573 | | — | | 24,573 | | 24,573 | | — | | — | | 1263 | p | £343,531 | | 2661 | p | 2006 | | 2013 | |
| | | | | | | | | | | | | | | | | | | | 22 Apr | | 22 Apr | |
| | 13,315 | | — | | — | | — | | — | | 13,315 | | 1329 | p | — | | — | | 2007 | | 2014 | |
| | | | | | | | | | | | | | | | | | | | 9 Mar | | 9 Mar | |
| | 11,539 | | — | | — | | — | | — | | 11,539 | | 1826.2 | p | — | | — | | 2008 | | 2015 | |
| | | | | | | | | | | | | | | | | | | | 7 Mar | | 7 Mar | |
| | 10,767 | | — | | — | | — | | — | | 10,767 | | 2711.2 | p | — | | — | | 2009 | | 2016 | |
|
|
|
|
|
|
|
|
|
|
|
|
|
|
|
|
|
|
|
|
|
| |
| Guy | | | | | | | | | | | | | | | | | | | 13 Mar | | 13 Mar | |
| Elliott | 61,703 | | — | | — | | — | | 61,703 | | 61,703 | | 1458.6 | p | — | | — | | 2005 | | 2012 | |
| | | | | | | | | | | | | | | | | | | | 7 Mar | | 7 Mar | |
| | 97,387 | | — | | 97,387 | | | | 97,387 | | 97,387 | | 1263 | p | — | | — | | 2006 | | 2013 | |
| | | | | | | | | | | | | | | | | | | | 22 Apr | | 22 Apr | |
| | 73,700 | | — | | — | | — | | — | | 73,700 | | 1329 | p | — | | — | | 2007 | | 2014 | |
| | | | | | | | | | | | | | | | | | | | 9 Mar | | 9 Mar | |
| | 72,972 | | — | | — | | — | | — | | 72,972 | | 1826.2 | p | — | | — | | 2008 | | 2015 | |
| | | | | | | | | | | | | | | | | | | | 7 Mar | | 7 Mar | |
| | — | | 58,100 | | — | | — | | — | | 58,100 | | 2711.2 | p | — | | — | | 2009 | | 2016 | |
|
|
|
|
|
|
|
|
|
|
|
|
|
|
|
|
|
|
|
|
|
| |
| Keith | | | | | | | | | | | | | | | | | | | 7 Mar | | 7 Mar | |
| Johnson | 3,855 | | — | | — | | 3,855 | | — | | — | | 965.4 | p | 68,488 | | 2742 | p | 2005 | | 2010 | |
| | | | | | | | | | | | | | | | | | | | 6 Mar | | 6 Mar | |
| | 11,667 | | — | | — | | 11,667 | | — | | — | | 1265.6 | p | 172,252 | | 2742 | p | 2005 | | 2011 | |
| | | | | | | | | | | | | | | | | | | | 13 Mar | | 13 Mar | |
| | 10,595 | | — | | — | | 10,595 | | — | | — | | 1458.6 | p | 135,976 | | 2742 | p | 2005 | | 2012 | |
| | | | | | | | | | | | | | | | | | | | 7 Mar | | 7 Mar | |
| | 16,231 | | — | | 16,231 | | 16,231 | | — | | — | | 1263 | p | 240,056 | | 2742 | p | 2006 | | 2013 | |
| | | | | | | | | | | | | | | | | | | | 22 Apr | | 22 Apr | |
| | 43,500 | | — | | — | | — | | — | | 43,500 | | 1329 | p | — | | — | | 2007 | | 2014 | |
| | | | | | | | | | | | | | | | | | | | 9 Mar | | 9 Mar | |
| | 47,937 | | — | | — | | — | | — | | 47,937 | | 1826.2 | p | — | | — | | 2008 | | 2015 | |
| | | | | | | | | | | | | | | | | | | | 7 Mar | | 7 Mar | |
| | — | | 37,869 | | — | | — | | — | | 37,869 | | 2711.2 | p | — | | — | | 2009 | | 2016 | |
|
|
|
|
|
|
|
|
|
|
|
|
|
|
|
|
|
|
|
|
|
| |
| Andrew | | | | | | | | | | | | | | | | | | | 9 Mar | | 9 Mar | |
| Mackenzie10 | 53,769 | | — | | — | | — | | — | | 53,769 | | 1826.2 | p | — | | — | | 2008 | | 2015 | |
| | | | | | | | | | | | | | | | | | | | 7 Mar | | 7 Mar | |
| | — | | 42,019 | | — | | — | | — | | 42,019 | | 2711.2 | p | — | | — | | 2009 | | 2016 | |
|
|
|
|
|
|
|
|
|
|
|
|
|
|
|
|
|
|
|
|
|
| |
| Rio Tinto Limited Share Savings Plan | | | | | | | | | | | | | | | | | |
|
|
|
|
|
|
|
|
|
|
|
|
|
|
|
|
|
|
|
|
|
| |
| Leigh | | | | | | | | | | | | | A$ | | | | | | 30 Sep | | 31 Mar | |
| Clifford11 | 1,486 | | — | | — | | — | | — | | 1,486 | | 29.04 | | — | | — | | 2007 | | 2008 | |
|
|
|
|
|
|
|
|
|
|
|
|
|
|
|
|
|
|
|
|
|
| |
| Oscar | | | | | | | | | | | | | A$ | | | | | | 1 Jan | | 30 Jun | |
| Groeneveld | 1,431 | | — | | — | | — | | — | | 1,431 | | 27.48 | | — | | — | | 2009 | | 2009 | |
|
|
|
|
|
|
|
|
|
|
|
|
|
|
|
|
|
|
|
|
|
| |
| Sam | | | | | | | | | | | | | A$ | | A$ | | A$ | | 1 Jan | | 30 Jun | |
| Walsh | 1,078 | | — | | 1,078 | | 1,078 | | — | | — | | 25.57 | | 53,787 | | 75.465 | | 2006 | | 2006 | |
| | | | | | | | | | | | | | A$ | | | | | | 1 Jan | | 30 Jun | |
| | 601 | | — | | — | | — | | — | | 601 | | 40.92 | | — | | — | | 2009 | | 2009 | |
|
|
|
|
|
|
|
|
|
|
|
|
|
|
|
|
|
|
|
|
|
| |
| Rio Tinto 2006 Form 20-F | 117 |
Back to Contents
Table 5 – Directors’ and senior management’s options to acquire Rio Tinto plc and Rio Tinto Limited shares
| | | | | | | | | | Vested and | | | | | | Value of | | | | | | | |
| | | | | | | | | | exercisable | | | | | | options | | Market | | | | | |
| | | | | | Vested | | | | on | | | | | | exercised | | price on | | Date from | | | |
| | 1 Jan | | | | during | | | | 31 Dec | | 31 Dec | | Option | | during | | date of | | which first | | Expiry | |
| | 2006 | | Granted | | 2006 | | Exercised | | 2006 | | 2006 | | price | | 20069 | | exercise | | exercisable | | date | |
|
|
|
|
|
|
|
|
|
|
|
|
|
|
|
|
|
|
|
|
|
| |
| Rio Tinto Limited Share Option Plan | | | | | | | | | | | | | | | | | |
|
|
|
|
|
|
|
|
|
|
|
|
|
|
|
|
|
|
|
|
|
| |
| Leigh | | | | | | | | | | | | | A$ | | | | | | 28 May | | 28 May | |
| Clifford11 | 52,683 | | — | | — | | — | | 52,683 | | 52,683 | | 23.4382 | | — | | — | | 2002 | | 2009 | |
| | | | | | | | | | | | | | A$ | | | | | | 7 Mar | | 7 Mar | |
| | 59,318 | | — | | — | | — | | 59,318 | | 59,318 | | 24.069 | | — | | — | | 2003 | | 2010 | |
| | | | | | | | | | | | | | A$ | | | | | | 7 Mar | | 7 Mar | |
| | 29,660 | | — | | — | | — | | 29,660 | | 29,660 | | 24.069 | | — | | — | | 2005 | | 2010 | |
| | | | | | | | | | | | | | A$ | | | | | | 6 Mar | | 6 Mar | |
| | 241,430 | | — | | — | | — | | 241,430 | | 241,430 | | 33.0106 | | — | | — | | 2005 | | 2011 | |
| | | | | | | | | | | | | | A$ | | | | | | 13 Mar | | 13 Mar | |
| | 208,882 | | — | | — | | — | | 208,882 | | 208,882 | | 39.8708 | | — | | — | | 2005 | | 2012 | |
| | | | | | | | | | | | | | A$ | | | | | | 7 Mar | | 30 Sept | |
| | 254,132 | | — | | 254,132 | | — | | 254,132 | | 254,132 | | 33.336 | | — | | — | | 2006 | | 2012 | |
| | | | | | | | | | | | | | A$ | | | | | | 22 Apr | | 30 Sept | |
| | 179,370 | | — | | — | | — | | — | | 179,370 | | 34.406 | | — | | — | | 2007 | | 2012 | |
| | | | | | | | | | | | | | A$ | | | | | | 9 Mar | | 30 Sept | |
| | 169,987 | | — | | — | | — | | — | | 169,987 | | 47.042 | | — | | — | | 2008 | | 2012 | |
| | | | | | | | | | | | | | A$ | | | | | | 7 Mar | | 30 Sept | |
| | — | | 126,992 | | — | | — | | — | | 126,992 | | 71.06 | | — | | — | | 2009 | | 2012 | |
|
|
|
|
|
|
|
|
|
|
|
|
|
|
|
|
|
|
|
|
|
| |
| Oscar | | | | | | | | | | | | | A$ | | A$ | | A$ | | 6 Mar | | 6 Mar | |
| Groeneveld | 80,920 | | — | | — | | 80,920 | | — | | — | | 33.0106 | | 3,136,411 | | 71.77 | | 2005 | | 2011 | |
| | | | | | | | | | | | | | A$ | | | | | | 7 Mar | | 30 Sept | |
| | 90,080 | | — | | 90,080 | | — | | 90,080 | | 90,080 | | 33.336 | | — | | — | | 2006 | | 2012 | |
| | | | | | | | | | | | | | A$ | | | | | | 22 Apr | | 30 Sept | |
| | 62,600 | | — | | — | | — | | — | | 62,600 | | 34.406 | | — | | — | | 2007 | | 2012 | |
| | | | | | | | | | | | | | A$ | | | | | | 9 Mar | | 30 Sept | |
| | 64,321 | | — | | — | | — | | — | | 64,321 | | 47.042 | | — | | — | | 2008 | | 2012 | |
| | | | | | | | | | | | | | A$ | | | | | | 7 Mar | | 30 Sept | |
| | — | | 52,086 | | — | | — | | — | | 52,086 | | 71.06 | | — | | — | | 2009 | | 2012 | |
|
|
|
|
|
|
|
|
|
|
|
|
|
|
|
|
|
|
|
|
|
| |
| Sam | | | | | | | | | | | | | A$ | | A$ | | | | 6 Mar | | 6 Mar | |
| Walsh | 49,983 | | — | | — | | 49,983 | | — | | — | | 33.0106 | | 2,494,122 | | $82.91 | | 2005 | | 2011 | |
| | | | | | | | | | | | | | A$ | | A$ | | | | 13 Mar | | 13 Mar | |
| | 60,194 | | — | | — | | 60,194 | | — | | — | | 39.8708 | | 2,590,702 | | $82.91 | | 2005 | | 2012 | |
| | | | | | | | | | | | | | A$ | | A$ | | | | 7 Mar | | 7 Mar | |
| | 75,863 | | — | | 75,863 | | 75,863 | | — | | — | | 33.336 | | 3,760,832 | | $82.91 | | 2006 | | 2013 | |
| | | | | | | | | | | | | | A$ | | | | | | 22 Apr | | 22 Apr | |
| | 54,400 | | — | | — | | — | | — | | 54,400 | | 34.406 | | — | | — | | 2007 | | 2014 | |
| | | | | | | | | | | | | | A$ | | | | | | 9 Mar | | 9 Mar | |
| | 58,823 | | — | | — | | — | | — | | 58,823 | | 47.042 | | — | | — | | 2008 | | 2015 | |
| | | | | | | | | | | | | | A$ | | | | | | 7 Mar | | 7 Mar | |
| | — | | 48,079 | | — | | — | | — | | 48,079 | | 71.06 | | — | | — | | 2009 | | 2016 | |
|
|
|
|
|
|
|
|
|
|
|
|
|
|
|
|
|
|
|
|
|
| |
| Rio Tinto 2006 Form 20-F | 118 |
Back to Contents
Table 5 – Directors’ and senior management’s options to acquire Rio Tinto plc and Rio Tinto Limited shares
| | | | | | | | | | | Vested and | | | | | | Value of | | | | | | | |
| | | | | | | | | | | exercisable | | | | | | options | | Market | | | | | |
| | | | | | | Vested | | | | on | | | | | | exercised | | price on | | Date from | | | |
| | | 1 Jan | | | | during | | | | 31May | | 31 May | | Option | | during | | date of | | which first | | Expiry | |
| | | 2007 | | Granted | | 2007 | | Exercised | | 2007 | | 2007 | | price | | 20079 | | exercise | | exercisable | | date | |
|
|
|
|
|
|
|
|
|
|
|
|
|
|
|
|
|
|
|
|
|
|
| |
| Rio Tinto plc Share Savings Plan | | | | | | | | | | | | | | | | | | | |
|
|
|
|
|
|
|
|
|
|
|
|
|
|
|
|
|
|
|
|
|
|
| |
| Tom | | | | | | | | | | | | | | | | | | | | 1 Jan | | 30 Jun | |
| Albanese | | 791 | | — | | — | | — | | — | | 791 | | 2068 | p | — | | — | | 2012 | | 2012 | |
|
|
|
|
|
|
|
|
|
|
|
|
|
|
|
|
|
|
|
|
|
|
| |
| Preston | | | | | | | | | | | | | | | | | | | | 1Jan | | 5 Jan | |
| Chiaro | | 490 | | — | | 490 | | �� | | — | | — | | 1277 | p | £6,017 | | £25.05 | | 2007 | | 2007 | |
| | | | | | | | | | | | | | | | | | | | | 1 Jan | | 6 Jan | |
| | | 298 | | — | | — | | — | | — | | 298 | | 2088 | p | — | | — | | 2009 | | 2009 | |
|
|
|
|
|
|
|
|
|
|
|
|
|
|
|
|
|
|
|
|
|
|
| |
| Bret | | | | | | | | | | | | | | | | | | | | | | | |
| Clayton2 | | — | | — | | — | | — | | — | | — | | — | | — | | — | | — | | — | |
|
|
|
|
|
|
|
|
|
|
|
|
|
|
|
|
|
|
|
|
|
|
| |
| Guy | | | | | | | | | | | | | | | | | | | | 1 Jan | | 30 Jun | |
| Elliott | | 1,431 | | — | | — | | — | | — | | 1,431 | | 1107 | p | — | | — | | 2009 | | 2009 | |
|
|
|
|
|
|
|
|
|
|
|
|
|
|
|
|
|
|
|
|
|
|
| |
| Keith | | | | | | | | | | | | | | | | | | | | 1 Jan | | 6 Jan | |
| Johnson | | 456 | | — | | — | | — | | — | | 456 | | 2068 | p | — | | — | | 2009 | | 2009 | |
|
|
|
|
|
|
|
|
|
|
|
|
|
|
|
|
|
|
|
|
|
|
| |
| Andrew | | | | | | | | | | | | | | | | | | | | 1 Jan | | 30 Jun | |
| Mackenzie | | 1,021 | | — | | — | | — | | — | | 1,021 | | 1576 | p | — | | — | | 2009 | | 2009 | |
|
|
|
|
|
|
|
|
|
|
|
|
|
|
|
|
|
|
|
|
|
|
| |
| Rio Tinto plc Share Option Plan | | | | | | | | | | | | | | | | | | | |
|
|
|
|
|
|
|
|
|
|
|
|
|
|
|
|
|
|
|
|
|
|
| |
| Tom | | | | | | | | | | | | | | | | | | | | 6 Mar | | 6 Mar | |
| Albanese | | 102,718 | | — | | — | | — | | 102,718 | | 102,718 | | 1265.6 | p | — | | — | | 2005 | | 2011 | |
| | | | | | | | | | | | | | | | | | | | | 13 Mar | | 13 Mar | |
| | | 125,336 | | — | | — | | — | | 125,336 | | 125,336 | | 1458.6 | p | — | | — | | 2005 | | 2012 | |
| | | | | | | | | | | | | | | | | | | | | 7 Mar | | 7 Mar | |
| | | 139,165 | | — | | — | | — | | 139,165 | | 139,165 | | 1263.0 | p | — | | — | | 2006 | | 2013 | |
| | | | | | | | | | | | | | | | | | | | | 22 Apr | | 22 Apr | |
| | | 84,020 | | — | | — | | — | | — | | 84,020 | | 1329.0 | p | — | | — | | 2007 | | 2014 | |
| | | | | | | | | | | | | | | | | | | | | 9 Mar | | 9 Mar | |
| | | 83,926 | | — | | — | | — | | — | | 83,926 | | 1826.2 | p | — | | — | | 2008 | | 2015 | |
| | | | | | | | | | | | | | | | | | | | | 7 Mar | | 7 Mar | |
| | | 67,511 | | — | | — | | — | | — | | 67,511 | | 2711.2 | p | — | | — | | 2009 | | 2016 | |
| | | | | | | | | | | | | | | | | | | | | 13 Mar | | 13 Mar | |
| | | — | | 66,186 | | — | | — | | — | | 66,186 | | 2701.2 | p | — | | — | | 2010 | | 2017 | |
|
|
|
|
|
|
|
|
|
|
|
|
|
|
|
|
|
|
|
|
|
|
| |
| Preston | | | | | | | | | | | | | | | | | | | | 7 Mar | | 7 Mar | |
| Chiaro | | 37,160 | | — | | — | | — | | 37,160 | | 37,160 | | 1263.0 | p | — | | — | | 2006 | | 2013 | |
| | | | | | | | | | | | | | | | | | | | | 22 Apr | | 22 Apr | |
| | | 70,490 | | — | | — | | — | | — | | 70,490 | | 1329.0 | p | — | | — | | 2007 | | 2014 | |
| | | | | | | | | | | | | | | | | | | | | 9 Mar | | 9 Mar | |
| | | 63,527 | | — | | — | | — | | — | | 63,527 | | 1826.2 | p | — | | — | | 2008 | | 2015 | |
| | | | | | | | | | | | | | | | | | | | | 7 Mar | | 7 Mar | |
| | | 51,274 | | — | | — | | — | | — | | 51,274 | | 2711.2 | p | — | | — | | 2009 | | 2016 | |
| | | | | | | | | | | | | | | | | | | | | 7 Mar | | 7 Mar | |
| | | — | | 38,519 | | — | | — | | — | | 38,519 | | 2701.2 | p | — | | — | | 2010 | | 2017 | |
|
|
|
|
|
|
|
|
|
|
|
|
|
|
|
|
|
|
|
|
|
|
| |
| Rio Tinto 2006 Form 20-F | 119 |
Back to Contents
Table 5 – Directors’ and senior management’s options to acquire Rio Tinto plc and Rio Tinto Limited shares
| | | | | | | | | | | | | | | | | Value of | | | | | | | |
| | | | | | | | | | | Vested and | | | | | | options | | Market | | | | | |
| | | | | | | Vested | | | | exercisable | | | | | | exercised | | price on | | Date from | | | |
| | | 1 Jan | | | | during | | | | on 31 May | | 31 May | | Option | | during | | date of | | which first | | Expiry | |
| | | 2007 | | Granted | | 2007 | | Exercised | | 2007 | | 2007 | | price | | 20079 | | exercise | | exercisable | | date | |
|
|
|
|
|
|
|
|
|
|
|
|
|
|
|
|
|
|
|
|
|
|
| |
| Rio Tinto plc Share Option Plan (continued) | | | | | | | | | | | | | | | | | |
|
|
|
|
|
|
|
|
|
|
|
|
|
|
|
|
|
|
|
|
|
|
| |
| Bret | | | | | | | | | | | | | | | | | | | | 22Apr | | 22Apr | |
| Clayton2 | | 13,315 | | — | | — | | — | | — | | 13,315 | | 1329.0 | p | — | | — | | 2007 | | 2014 | |
| | | | | | | | | | | | | | | | | | | | | 9Mar | | 9Mar | |
| | | 11,539 | | — | | — | | — | | — | | 11,539 | | 1826.2 | p | — | | — | | 2008 | | 2015 | |
| | | | | | | | | | | | | | | | | | | | | 7Mar | | 7Mar | |
| | | 10,767 | | — | | — | | — | | — | | 10,767 | | 2711.2 | p | — | | — | | 2009 | | 2016 | |
| | | | | | | | | | | | | | | | | | | | | 7Mar | | 7Mar | |
| | | — | | 33,850 | | — | | — | | — | | 33,850 | | 2701.2 | p | — | | — | | 2010 | | 2017 | |
|
|
|
|
|
|
|
|
|
|
|
|
|
|
|
|
|
|
|
|
|
|
| |
| Guy | | | | | | | | | | | | | | | | | | | | 13Mar | | 13Mar | |
| Elliott | | 61,703 | | — | | — | | — | | 61,703 | | 61,703 | | 1458.6 | p | — | | — | | 2005 | | 2012 | |
| | | | | | | | | | | | | | | | | | | | | 7Mar | | 7Mar | |
| | | 97,387 | | — | | — | | – | | 97,387 | | 97,387 | | 1263.0 | p | — | | — | | 2006 | | 2013 | |
| | | | | | | | | | | | | | | | | | | | | 22Apr | | 22Apr | |
| | | 73,700 | | — | | — | | — | | — | | 73,700 | | 1329.0 | p | — | | — | | 2007 | | 2014 | |
| | | | | | | | | | | | | | | | | | | | | 9Mar | | 9Mar | |
| | | 72,972 | | — | | — | | — | | — | | 72,972 | | 1826.2 | p | — | | — | | 2008 | | 2015 | |
| | | | | | | | | | | | | | | | | | | | | 7Mar | | 7Mar | |
| | | 58,100 | | — | | — | | — | | — | | 58,100 | | 2711.2 | p | — | | — | | 2009 | | 2016 | |
| | | | | | | | | | | | | | | | | | | | | 7Mar | | 7Mar | |
| | | — | | 44,052 | | — | | — | | — | | 44,052 | | 2701.2 | p | — | | — | | 2010 | | 2017 | |
|
|
|
|
|
|
|
|
|
|
|
|
|
|
|
|
|
|
|
|
|
|
| |
| Keith | | | | | | | | | | | | | | | | | | | | 22Apr | | 22Apr | |
| Johnson | | 43,500 | | — | | — | | — | | — | | 43,500 | | 1329.0 | p | — | | — | | 2007 | | 2014 | |
| | | | | | | | | | | | | | | | | | | | | 9Mar | | 9Mar | |
| | | 47,937 | | — | | — | | — | | — | | 47,937 | | 1826.2 | p | — | | — | | 2008 | | 2015 | |
| | | | | | | | | | | | | | | | | | | | | 7Mar | | 7Mar | |
| | | 37,869 | | — | | — | | — | | — | | 37,869 | | 2711.2 | p | — | | — | | 2009 | | 2016 | |
| | | | | | | | | | | | | | | | | | | | | 7Mar | | 7Mar | |
| | | — | | 28,294 | | — | | — | | — | | 28,294 | | 2701.2 | p | — | | — | | 2010 | | 2017 | |
|
|
|
|
|
|
|
|
|
|
|
|
|
|
|
|
|
|
|
|
|
|
| |
| Andrew | | | | | | | | | | | | | | | | | | | | 9Mar | | 9Mar | |
| Mackenzie10 | | 53,769 | | — | | — | | — | | — | | 53,769 | | 1826.2 | p | — | | — | | 2008 | | 2015 | |
| | | | | | | | | | | | | | | | | | | | | 7Mar | | 7Mar | |
| | | 42,019 | | — | | — | | — | | — | | 42,019 | | 2711.2 | p | — | | — | | 2009 | | 2016 | |
| | | | | | | | | | | | | | | | | | | | | 7Mar | | 7Mar | |
| | | — | | 31,159 | | — | | — | | — | | 31,159 | | 2701.2 | p | — | | — | | 2010 | | 2017 | |
|
|
|
|
|
|
|
|
|
|
|
|
|
|
|
|
|
|
|
|
|
|
| |
| Rio Tinto Limited Share Savings Plan | | | | | | | | | | | | | | | | | |
|
|
|
|
|
|
|
|
|
|
|
|
|
|
|
|
|
|
|
|
|
|
| |
| Leigh | | | | | | | | | | | | | | A$ | | | | | | 30 Sep | | 31 Mar | |
| Clifford11 | | 1,486 | | — | | — | | — | | — | | 1,486 | | 29.04 | | — | | — | | 2007 | | 2008 | |
|
|
|
|
|
|
|
|
|
|
|
|
|
|
|
|
|
|
|
|
|
|
| |
| Oscar | | | | | | | | | | | | | | A$ | | | | | | 1Jan | | 30Jun | |
| Groeneveld | | 1,431 | | — | | — | | — | | — | | 1,431 | | 27.48 | | — | | — | | 2009 | | 2009 | |
|
|
|
|
|
|
|
|
|
|
|
|
|
|
|
|
|
|
|
|
|
|
| |
| Sam | | | | | | | | | | | | | | A$ | | | | | | 1Jan | | 30Jun | |
| Walsh | | 601 | | — | | — | | — | | — | | 601 | | 40.92 | | — | | — | | 2009 | | 2009 | |
|
|
|
|
|
|
|
|
|
|
|
|
|
|
|
|
|
|
|
|
|
|
| |
| Rio Tinto 2006 Form 20-F | 120 |
Back to Contents
Table 5 – Directors’ and senior management’s options to acquire Rio Tinto plc and Rio Tinto Limited shares
| | | | | | | | | | | | | | | | | Value of | | | | | | | |
| | | | | | | | | | | Vested and | | | | | | options | | Market | | | | | |
| | | | | | | Vested | | | | exercisable | | | | | | exercised | | price on | | Date from | | | |
| | | 1 Jan | | | | during | | | | on 31 May | | 31 May | | Option | | during | | date of | | which first | | Expiry | |
| | | 2007 | | Granted | | 2007 | | Exercised | | 2007 | | 2007 | | price | | 20079 | | exercise | | exercisable | | date | |
|
|
|
|
|
|
|
|
|
|
|
|
|
|
|
|
|
|
|
|
|
|
| |
| Rio Tinto Limited Share Option Plan | | | | | | | | | | | | | | | | | |
|
|
|
|
|
|
|
|
|
|
|
|
|
|
|
|
|
|
|
|
|
|
| |
| Leigh | | | | | | | | | | | | | | A$ | | | | | | 12 Mar | | 12 Mar | |
| Clifford11 | | 52,683 | | — | | — | | — | | 52,683 | | 52,683 | | 23.4382 | | — | | — | | 2002 | | 2009 | |
| | | | | | | | | | | | | | | A$ | | | | | | 7 Mar | | 7 Mar | |
| | | 59,318 | | — | | — | | — | | 59,318 | | 59,318 | | 24.069 | | — | | — | | 2003 | | 2010 | |
| | | | | | | | | | | | | | | A$ | | | | | | 7 Mar | | 7 Mar | |
| | | 29,660 | | — | | — | | — | | 29,660 | | 29,660 | | 24.069 | | — | | — | | 2005 | | 2010 | |
| | | | | | | | | | | | | | | A$ | | | | | | 6 Mar | | 6 Mar | |
| | | 241,430 | | — | | — | | — | | 241,430 | | 241,430 | | 33.0106 | | — | | — | | 2005 | | 2011 | |
| | | | | | | | | | | | | | | A$ | | | | | | 13 Mar | | 13 Mar | |
| | | 208,882 | | — | | — | | — | | 208,882 | | 208,882 | | 39.8708 | | — | | — | | 2005 | | 2012 | |
| | | | | | | | | | | | | | | A$ | | | | | | 7 Mar | | 30 Sept | |
| | | 254,132 | | — | | — | | — | | 254,132 | | 254,132 | | 33.336 | | — | | — | | 2006 | | 2012 | |
| | | | | | | | | | | | | | | A$ | | | | | | 22 Apr | | 30 Sept | |
| | | 179,370 | | — | | — | | — | | — | | 179,370 | | 34.406 | | — | | — | | 2007 | | 2012 | |
| | | | | | | | | | | | | | | A$ | | | | | | 9 Mar | | 30 Sept | |
| | | 169,987 | | — | | — | | — | | — | | 169,987 | | 47.042 | | — | | — | | 2008 | | 2012 | |
| | | | | | | | | | | | | | | A$ | | | | | | 7 Mar | | 30 Sept | |
| | | 126,992 | | — | | — | | — | | — | | 126,992 | | 71.06 | | — | | — | | 2009 | | 2012 | |
| | | | | | | | | | | | | | | A$ | | | | | | 13 Mar | | 13 Mar | |
| | | — | | 92,325 | | — | | — | | — | | 92,325 | | 74.588 | | — | | — | | 2010 | | 2017 | |
|
|
|
|
|
|
|
|
|
|
|
|
|
|
|
|
|
|
|
|
|
|
| |
| Oscar | | | | | | | | | | | | | | A$ | | A$ | | A$ | | 7 Mar | | 30 Sept | |
| Groeneveld | | 90,080 | | — | | — | | — | | 90,080 | | 90,080 | | 33.336 | | 5,464,613 | | 94.00 | | 2006 | | 2012 | |
| | | | | | | | | | | | | | | A$ | | | | | | 22 Apr | | 30 Sept | |
| | | 62,600 | | — | | — | | — | | — | | 62,600 | | 34.406 | | — | | — | | 2007 | | 2012 | |
| | | | | | | | | | | | | | | A$ | | | | | | 9 Mar | | 30 Sept | |
| | | 64,321 | | — | | — | | — | | — | | 64,321 | | 47.042 | | — | | — | | 2008 | | 2012 | |
| | | | | | | | | | | | | | | A$ | | | | | | 7 Mar | | 30 Sept | |
| | | 52,086 | | — | | — | | — | | — | | 52,086 | | 71.06 | | — | | — | | 2009 | | 2012 | |
| | | | | | | | | | | | | | | A$ | | | | | | 13 Mar | | 13 Mar | |
| | | — | | 37,987 | | — | | — | | — | | 37,987 | | 74.588 | | — | | — | | 2010 | | 2017 | |
|
|
|
|
|
|
|
|
|
|
|
|
|
|
|
|
|
|
|
|
|
|
| |
| Sam | | | | | | | | | | | | | | A$ | | | | | | 22 Apr | | 22 Apr | |
| Walsh | | 54,400 | | — | | — | | — | | — | | 54,400 | | 34.406 | | — | | — | | 2007 | | 2014 | |
| | | | | | | | | | | | | | | A$ | | | | | | 9 Mar | | 9 Mar | |
| | | 58,823 | | — | | — | | — | | — | | 58,823 | | 47.042 | | — | | — | | 2008 | | 2015 | |
| | | | | | | | | | | | | | | A$ | | | | | | 7 Mar | | 7 Mar | |
| | | 48,079 | | — | | — | | — | | — | | 48,079 | | 71.06 | | — | | — | | 2009 | | 2016 | |
| | | | | | | | | | | | | | | A$ | | | | | | 13 Mar | | 13 Mar | |
| | | — | | 35,861 | | — | | — | | — | | 35,861 | | 74.588 | | — | | — | | 2010 | | 2017 | |
|
|
|
|
|
|
|
|
|
|
|
|
|
|
|
|
|
|
|
|
|
|
| |
| Notes to Table 5 |
| 1 | Or at date of appointment if later. |
| 2 | Bret Clayton was appointed chief executive of the Copper group on 1 July 2006. |
| 3 | All options are granted over ordinary shares. Rio Tinto plc – ordinary shares of 10p each stated in pence sterling; Rio Tinto Limited ordinary shares – stated in Australian dollars. Each option is granted over one share. |
| 4 | No options lapsed during the year. |
| 5 | The closing price of Rio Tinto plc ordinary shares at 31 December 2006 was 2718p (2005: 2655p) and the closing price of RioTinto Limited shares at 31 December 2006 was A$74.30 (2005: A$69.00). The highest and lowest prices during the year were 3322p and 2352p respectively for Rio Tinto plc and A$88.10 and A$65.01 for Rio Tinto Limited. |
| 6 | The option price represents the exercise price payable on the options. No amount was paid or payable by the recipient at thedate of grant. No amounts are unpaid on any shares allocated on the exercise of the options. |
| 7 | Under the plans no options would be vested and unexercisable at the reporting date. |
| 8 | The fair value per option, granted during 2006, at date of grant was as follows: Rio Tinto plc Share Savings Plan two year contract 676p; three year contract 812p and five year contract 944p; Rio Tinto Limited Share Savings Plan three year contract A$22.37 and five year contract A$26.07. Rio Tinto plc Share Option Plan 740p; Rio Tinto Limited Share Option Plan A$17.09. |
| 9 | The value of options exercised during 2006 is calculated by multiplying the number of options exercised by the difference between the market price and the option price on date of exercise. |
| 10 | Andrew Mackenzie was granted 40,216 phantom options over Rio Tinto plc shares at a price of 1329p per share, exercisable between 22 April 2007 and 22 April 2014. This grant will not vest in 2007, but will be subject to retest after a further two years. |
| 11. | Leigh Clifford was granted options over 126,992 Rio Tinto Limited shares during the year. This option grant was approved by shareholders under ASX Listing Rule 10.14 at the 2004 annual general meeting. Subject to the rules of the Rio Tinto Limited Share Savings Plan, Leigh Clifford’s options granted under that plan will be reduced proportionally to reflect the actual portion of 2007 he was an employee of the Group. |
| Rio Tinto 2006 Form 20-F | 121 |
Back to Contents
CORPORATE GOVERNANCE
The directors of Rio Tinto believe that high standards of corporate governance are central to business integrity andperformance. The following describes how this philosophy is applied in practice.
As Rio Tinto’s three main listings are in London, Melbourne and New York, the directors have referred to TheCombined Code on Corporate Governance, published by the UK Financial Reporting Council (the Code), the AustralianSecurities Exchange (ASX) Corporate Governance Council Principles of Good Corporate Governance and Best Practice Recommendations (the ASX Principles), and the New York Stock Exchange (NYSE) Corporate Governance Standards(the NYSE Standards), as well as the Sarbanes-Oxley Act of 2002.
Rio Tinto complied fully with the detailed provisions of Section 1 of the Code and the ASX Principles as detailed further below. A statement on compliance with the NYSE Standards is set out below.
The board
The Companies have common boards of directors which are collectively responsible for the success of the Group and accountable to shareholders for the performance of the business. Throughout this report, they are described as the board.
The board currently consists of 14 directors: the chairman, three executive directors and ten non executive directors.The Nominations committeecontinually assesses the balance of executive and non executive directors and the composition of the board in terms of the skills and diversity required to ensure it remains relevant in the current environment. The skills, experience and expertise of each director together with their term s in office are shown in the biographical details on pages 89 to 92.
The role and responsibilities of the board
The role of the board is to provide the Group with good governance and strategic direction. The board also reviews theGroup’s control and accountability framework. The directors have agreed a formal schedule of matters specifically reserved for decision by the board, including strategy, major investments and acquisitions. This is available on RioTinto’s website at www.riotinto.com.
Responsibility for day-to-day management of the business lies with the executive team, with the board agreeing annual performance targets for management against the Group’s financial plan. The board is ultimately accountable to shareholders for the performance of the business.
To ensure an efficient process, the board meets regularly and, in 2006, had eight scheduled and one unscheduled meeting. Details of directors’ attendance at board and committee meetings are set out on page 123.
The board has regular scheduled discussions on aspects of the Group’s strategy, as well as two separate strategy review meetings, one half day and one two day meeting, both of which are dedicated to in-depth discussions on Groupstrategy.
Directors receive timely, regular and necessary management and other information to en able them to fulfil their duties. The board has agreed a procedure for the directors to have access to independent professional advice at theGroup’s expense and to the advice and services of both company secretaries.
In addition to these formal processes, directors are in regular communication with senior executives from the product groups, at both formal and informal meetings, to ensure regular exchange of knowledge and experience between management and non executive directors. To continue building on the formal induction programmes, which all new non executive directors undertake, they are encouraged to take every opportunity to visit the Group’s operatinglocations. The full board also takes the opportunity to combine attendance at the annual general meeting in Australiaand at the two day strategy review meeting with site visits when they are able to witness at first hand operations atindividual business units and to meet local staff.
The chairman holds regular meetings with non executive directors without the executive directors being present.
| Rio Tinto 2006 Form 20-F | 122 |
Back to Contents
Directors’ attendance at board and committee meetings during 2006
| | | | | | | Committee on | | | |
| | | | | | | social and | | | |
| | | | | Audit | | Remuneration | environmental | | Nominations | |
| | | Board | | committee | | committee | accountability | | committee | |
| | |
| |
| |
| |
| |
| |
| Name of Director | | A1,2 | | B1 | | A | | B | | A | | B | | A | | B | | A | | B | |
|
|
|
|
|
|
|
|
|
|
|
|
|
|
|
|
|
|
|
|
| |
| Tom Albanese3 | | 7 | | 7 | | | | | | | | | | | | | | | | | |
| Ashton Calvert | | 9 | | 9 | | | | | | | | | | 4 | | 4 | | 4 | | 4 | |
| Sir David Clementi | | 9 | | 8 | | 7 | | 6 | | 4 | | 4 | | | | | | | | | |
| Leigh Clifford | | 9 | | 9 | | | | | | | | | | | | | | | | | |
| Vivienne Cox | | 9 | | 7 | | 7 | | 7 | | | | | | | | | | | | | |
| Sir Rod Eddington | | 9 | | 8 | | | | | | | | | | 4 | | 2 | | 4 | | 4 | |
| Guy Elliott | | 9 | | 9 | | | | | | | | | | | | | | | | | |
| Michael Fitzpatrick4 | | 6 | | 6 | | 3 | | 2 | | 1 | | — | | | | | | | | | |
| Richard Goodmanson | | 9 | | 9 | | | | | | 4 | | 4 | | 4 | | 4 | | | | | |
| Andrew Gould | | 9 | | 8 | | 7 | | 6 | | 4 | | 4 | | | | | | | | | |
| Lord Kerr | | 9 | | 8 | | 7 | | 7 | | | | | | 4 | | 4 | | | | | |
| David Mayhew | | 9 | | 9 | | | | | | | | | | | | | | 4 | | 4 | |
| Paul Skinner | | 9 | | 9 | | | | | | | | | | | | | | 4 | | 4 | |
| Sir Richard Sykes | | 9 | | 9 | | | | | | 4 | | 4 | | | | | | 4 | | 4 | |
|
|
|
|
|
|
|
|
|
|
|
|
|
|
|
|
|
|
|
|
| |
| Notes |
| 1 | A = Maximum number of meetings the director could have attended; B = Number of meetings attended |
| 2 | Eight of the board meetings were scheduled and one was called at short notice. |
| 3 | Tom Albanese was appointed on 7 March 2006. |
| 4 | Michael Fitzpatrick was appointed on 6 June 2006 and became an Audit committee andRemuneration committee member on the same date. |
Board performance
In 2006 the board conducted a formal process, facilitated by external consultants, to evaluate once again itseffectiveness and that of the board committees and individual directors.
Each director’s performance was appraised by the chairman and, in a meeting chaired by the senior independent non executive director, the non executive directors assessed the chairman’s performance, taking into consideration the views of executive colleagues.
The evaluation process takes place annually and aims to cover board dynamics, board capability, board process, board structure, corporate governance, strategic clarity and alignment and the performance of individual directors. Thedirectors believe that, through this evaluation process, they comply with the requirements of Clause A.6 of the Code,Principle 8 of the ASX Principles, and of the NYSE Standards.
Independence
The tests of director independence in the jurisdictions where Rio Tinto is listed are not wholly consistent. The boardhas, therefore, adopted a formal policy for the determination of independence of directors. The policy, which containsthe materiality thresholds approved by the board, can be viewed on the Rio Tinto website. Among the key criteria are independence of management and the absence of any business relationship which could materially interfere with thedirector’s independence of judgement and ability to provide a strong, valuable contribution to the board’s deliberationsor which could interfere with the director’s ability to act in the best interest of the Group. Where contracts in the ordinary course of business exist between Rio Tinto and a company in which a director has declared an interest, theseare reviewed for materiality to both the Group and the other party to the contract. Applying these criteria, the board issatisfied that the majority of the non executive directors: Ashton Calvert, Sir David Clementi, Vivienne Cox, Sir Rod Eddington, Michael Fitzpatrick, Richard Goodmanson, Andrew Gould, Lord Kerr and Sir Richard Sykes areindependent.
The board is also satisfied that the strength and objectivity of Sir Richard Sykes contribution to the board, as a non executive director since 1997, is fully consistent with that of an independent director and so continues to regard him as independent. He was re-elected at the 2007 annual general meetings, to serve one more year, to support the board during a period of executive transition. Sir Richard is the senior independent director and also chairs theRemuneration committee.
David Mayhew, who is chairman of one of Rio Tinto plc’s stockbrokers, is not considered independent in accordance with the Code.
Paul Skinner was, until his appointment as chairman in 2003, an independent non executive director in compliance with the Code. He also satisfies the tests for independence under the ASX Principles and the NYSEStandards.
The directors’ biographies are set out on pages 89 to 92.
| Rio Tinto 2006 Form 20-F | 123 |
Back to Contents
Election and re-election
Directors are elected by shareholders at the first annual general meetings after their appointment and, after that, offerthemselves for re-election at least once every three years. Non executive directors are normally expected to serve at least two terms of three years and, except where special circumstances justify it, would not normally serve more than three such terms.
Chairman and chief executive
The roles of the chairman and chief executive are separate and the division of responsibilities has been formallyapproved by the board.
Board committees
There are four board committees, theAudit committee,Remuneration committee,Nominations committeeand theCommittee on social and environmental accountability. Each committee plays a vital role in ensuring that good corporate governance is maintained throughout the Group. Committee terms of reference are reviewed annually by the board and the committees to ensure they continue to be at the forefront of best practice; and are posted on the Group’s website. Minutes of all committee meetings are circulated to the board, with oral reports at the next board meeting. None of the executive directors are members of any of these committees.
Audit committee
TheAudit committee’smain responsibilities include the review of accounting principles, policies and practices adoptedin the preparation of public financial information, review with management of procedures relating to financial and capital expenditure controls, including internal audit plans and reports, review with external auditors of the scope and results of their audit, the nomination of auditors for appointment by shareholders, and the review of and recommendation to the board for approval of Rio Tinto’s risk management policy. Its responsibilities also include the review of corporate governance practices of Group sponsored pension funds. The committee has a number of training sessions which may cover new legislation and other relevant information. The external auditors, the finance director, the Group controller and Group internal auditor all attend meetings. A copy of theAudit committeecharter is reproduced on page 129 to 130 and can be found on the website.
TheAudit committeeis chaired by Andrew Gould and its members are Sir David Clementi, Vivienne Cox, Michael Fitzpatrick and Lord Kerr. David Mayhew attends in an advisory capacity.
Remuneration committee
TheRemuneration committeeis responsible for determining the policy for executive remuneration and for theremuneration and benefits of individual executive directors and senior executives. Full disclosure of all elements of directors’ and relevant senior executives’ remuneration can be found in theRemuneration reporton pages 95 to 121, together with details of the Group’s remuneration policies. The committee is chaired by Sir Richard Sykes and itsmembers are Sir David Clementi, Michael Fitzpatrick, Richard Goodmanson and Andrew Gould.
Nominations committee
TheNominations committeeis chaired by the chairman of Rio Tinto, Paul Skinner. The committee is responsible, onbehalf of the board, for ensuring that a suitable process is in place to meet the recruitment requirements of the board. It reviews the mix, structure and experience of the board and the desired profiles of potential candidates for membership. In consultation with external search consultants it oversees the review and recruitment process to fill vacancies as they arise. The recruitment process itself includes identification of suitable candidates, followed by a formal assessment of each candidate, leading to a final selection process. Proposals for new members are submitted to the full board for approval. On behalf of the board it also reviews proposals for senior executive appointments and succession planning.
The committee further reviews the time required to be committed to Group business by non executive directors and assesses whether non executive directors are devoting sufficient time to carry out their duties. In addition to Paul Skinner, the committee consists of Ashton Calvert, Sir Rod Eddington, David Mayhew and Sir Richard Sykes.Under the Code, two members of the committee are not considered independent: Paul Skinner, following his appointment as chairman, and David Mayhew. The Code specifically allows the chairman to chair theNominations committee. As stated above, the board takes the view that Sir Richard continues to be an independent director and the composition of the committee is therefore compliant with the Code.
Committee on social and environmental accountability
TheCommittee on social and environmental accountabilityreviews the effectiveness of management policies andprocedures in place to deliver those standards in our statement of business practice,The way we work,which are not covered by the other board committees and, in particular, those relating to health, safety, the environment and social issues. The overall objective of the committee is to promote the development of high quality business practices throughout the Group and to develop the necessary clear accountability on these practices.
Members of the committee, which is chaired by Richard Goodmanson, are Ashton Calvert, Sir Rod Eddington and Lord Kerr.
| Rio Tinto 2006 Form 20-F | 124 |
Back to Contents
Executive directors’ other directorships
Executive directors are likely to be invited to become non executive directors of other companies. For full details of theGroup policy and fees, see page 74.
Directors’ dealings in shares
Rio Tinto has a Group policy in place to govern the dealing in Rio Tinto securities by directors and employees. The policy, which prohibits dealings when in possession of price sensitive information and shortly before a results announcement, can be viewed on the website.
Communication
Rio Tinto recognises the importance of effective communication with shareholders and the general investment community. To ensure shareholders are kept informed in a timely manner, the Group has adoptedContinuous disclosure standards,which are appended to theCorporate governance standardsand posted on the website.
In addition to statutory documents, Rio Tinto has a recently redesigned website featuring in-depth information on health, safety and the environment, as well as general investor information and Group policies. Results presentations and investor seminars are made available as they happen as well as in the form of an archive on the website.
The Group produces a range of informative publications, which are available on request. For further details, see our website.
Full advantage is taken of the annual general meetings to inform shareholders of current developments and to give shareholders the opportunity to ask questions. As recommended by the ASX Principles, Rio Tinto Limited’s external auditor attends the annual general meeting and is available to answer shareholder questions about the conduct of the audit and the preparation and content of the auditor’s report. Rio Tinto Limited shareholders are also able to submit written questions regarding the statutory audit report to the auditors via the Company. Any questions received and answers provided are made available to the members at the Rio Tinto Limited annual general meeting. Rio Tinto plc’s auditors attend the annual general meeting in London and are available to respond to audit related shareholderquestions.
The main channels of communication with the general investment community are through the chairman, chief executive and finance director, who conduct regular meetings with the Companies’ major shareholders. The seniorindependent director and other non executive directors are also available as appropriate.
The Group organises regular investor seminars which provide a two way communication with investors and analysts; the valuable feedback is communicated to the board. An annual survey of major shareholders’ opinion and perception of the Group is presented to the board by the Group’s investor relations advisors.
Statement of business practice
The way we workprovides the directors and all Group employees with a summary of the global policies and controls in place to help ensure that high governance and business standards are communicated and maintain ed throughout theGroup.
Global policies are adopted by the board after wide consultation, externally and within the Group. Once adopted, they are communicated to business units worldwide, together with mandatory standards and guidance notes to supportimplementation. Business units are required to devote the necessary effort by management to implement and report on these policies and standards.
In 2006, Rio Tinto undertook a review of its global policies. The following policies are currently in place: accessto land; communities; corporate governance; employment; environment; human rights; information management; occupational health; political involvement; safety and sustainable development. To complete the suite of policies, the following are being revised: business integrity; information security management and information technology; internal controls and reporting; transparency; and risk. Each of these policies is supported by standards expanding on the minimum expectations on topics such as antitrust, continuous disclosure, compliance, and health, safety and the environment. Many of these standards are supplemented by guidance notes. These policies and standards apply to all Rio Tinto managed businesses.
There is also a Groupwide “whistle blowing” programme calledSpeak-OUT.Employees are encouraged to report any concerns, including any suspicion of a violation of the Group’s financial reporting and environmentalprocedures, through an independent third party and without fear of recrimination. A process has been established for the investigation of any matters reported with clear lines of reporting and responsibility in each Group business.
Where the Group does not have operating responsibility for a business, Rio Tinto’s policies are communicated toits business partners and they are encouraged to adopt similar policies of their own.
Rio Tinto’s report on social and environmental matters follows the guidelines of the Global Reporting Initiativeand the Association of British Insurers. This report can be found on page 71. Details of the Group’s overall and individual businesses’ social and environmental performance continue to be published on the website and in theSustainable development review.
Responsibilities of the directors
The directors are required to prepare financial statements for each financial period which give a true and fair view of thestate of affairs of the Group as at the end of the financial period and of the profit or loss and cash flows for that period. This includes, in respect of Rio Tinto plc, preparing financial statements in accordance with UK company law which
| Rio Tinto 2006 Form 20-F | 125 |
Back to Contents
give a true and fair view of the state of the Company’s affairs, and preparing a Remuneration report which includes the information required by Part 3 of Schedule 7A to the UK Companies Act 1985 and Australian Accounting Standard AASB 124 “Related Party Disclosures”.
To ensure that these requirements are satisfied, the directors are responsible for establishing and maintaining adequate internal controls, including disclosure controls and procedures for financial reporting throughout the Group.
The directors consider that the 2006Annual report and financial statementspresent a true and fair view and havebeen prepared in accordance with applicable accounting standards, using the most appropriate accounting policies for Rio Tinto’s business and supported by reasonable and prudent judgements and estimates. The accounting policies have been consistently applied. The directors have received a written statement from the chief executive and the finance director to this effect. In accordance with ASX Principle 7.2, this written statement relies on a sound system of risk management and internal compliance and controls which implements the policies adopted by the board and confirms that the Group’s risk management and internal compliance and control systems are operating efficiently and effectively in all material respects.
The directors, senior executives, senior financial managers and other members of staff who are required toexercise judgement in the course of the preparation of the financial statements are required to co nduct themselves with integrity and honesty and in accordance with the ethical standards of their profession and/or business.
The directors are responsible for maintaining proper accounting records, in accordance with the UK CompaniesAct 1985 and the Australian Corporations Act 2001. They have a general responsibility for taking such steps as are reasonably open to them to safeguard the assets of the Group and to prevent and detect fraud and other irregularities. The directors are also responsible for ensuring that appropriate systems are in place to maintain and preserve the integrity of the Group’s website. Legislation in the UK governing the preparation and dissemination of financial statements may differ from current and future legislation in other jurisdictions. The work carried out by the auditors does not involve consideration of such developments and, accordingly, the auditors accept no re sponsibility for any changes, should any be made, to the financial statements since they were initially available on the website.
Going concern
The financial statements have been prepared on the going concern basis. The directors report that they have satisfied themselves that the Companies and the Group are a going concern since they have adequate financial resources to continue in operational existence for the foreseeable future.
Board’s statement on internal control
Rio Tinto’s overriding corporate objective is to maximise long term shareholder value through responsible and sustainable investment in mining and related assets. The directors recognise that creating shareholder value is thereward for taking and accepting risk.
The directors are responsible for the Group’s system of internal controls and for reviewing its effectiveness in providing shareholders with a return on their investments that is consistent with a responsible assessment and mitigation of risks. This includes reviewing financial, operational and compliance controls and risk management procedures. Due to the limitations inherent in any such system, this is designed to manage rather than eliminate risk and to provide reasonable but not absolute assurance against material misstatement or loss.
The directors have established a process for identifying, evaluating and managing the significant risks faced bythe Group. This process was in place during 2006 and up to and including the date of approval of the 2006Annual report and financial statements. The process is reviewed annually by the directors and accords with the guidance set outinInternal Control: Guidance for Directors on the Combined Code.
Two of the Group’s management committees, theExecutive committeeand theDisclosures and procedures committeeregularly review information related to the Group’s control framework. This information is presented to theAudit committeeto enable its members to assess the effectiveness of the internal controls. In addition, the board and its committees monitor the Group’s significant risks on an ongoing basis.
Assurance functions, including internal auditors and health, safety and environmental auditors, perform reviews of control activities and provide regular written and oral reports to directors and management committees. The directorsreceive and review minutes of the meetings of each board committee, in addition to oral reports from the respective chairmen at the first board meeting following the relevant committee meeting.
Certain risks, for example natural disasters, cannot be mitigated to an acceptable degree using internal controls. Such major risks are transferred to third parties in the international insurance markets, to the extent consideredappropriate.
Each year, the leaders of the Group’s businesses and administrative offices complete an internal control questionnaire that seeks to confirm that adequate internal controls are in place, are operating effectively and aredesigned to capture and evaluate failings and weaknesses, if any exist, and take prompt action as appropriate. The results of this process are reviewed by the executive committee and it is then presented to theAudit committeeand board as a further part of their review of the Group’s internal controls. This process is continually reviewed andstrengthened as appropriate.
The Group has material investments in a number of jointly controlled entities and associates. Where Rio Tinto does not have managerial control, it cannot guarantee that local management of mining and related assets will complywith Rio Tinto standards or objectives. Accordingly, the review of their internal controls is less comprehensive than that of the Group’s managed operations.
| Rio Tinto 2006 Form 20-F | 126 |
Back to Contents
Disclosure controls and procedures
The common management of each of Rio Tinto plc and Rio Tinto Limited, with the participation of their common chief executive and finance director, have evaluated the effectiveness of the design and operation of the Group’s disclosure controls and procedures as of 31 December 2006 and have concluded that these disclosure controls and procedures were effective to provide reasonable assurance that the information it is required to disclose is reported fairly as and when required.
TheDisclosure and procedures committeeis tasked with reviewing the adequacy and effectiveness of Group controls and procedures over the public disclosure of financial and related information. The committee has been presenting the results of this process to the directors since its establishment in 2002 and will continue to do so.
Management’s report on internal control over financial reporting has been set out on page 147.
New York Stock Exchange
Rio Tinto plc, as a foreign issuer with American Depositary Shares listed on the NYSE, is obliged by the NYSEStandards to disclose any significant ways in which its practices of corporate governance differ from the NYSE standards.
The Company has reviewed the NYSE Standards and believes that its practices are broadly consistent with them,with one exception. The NYSE Standards state that companies must have a nominating/corporate governance committee composed entirely of independent directors and with written terms of reference which, in addition to identifying individuals qualified to become board members, develops and recommends to the board a set of corporate governance principles applicable to the Company. Rio Tinto has aNominations committee, information about which is set out on page 128. This committee does not develop corporate governance principles for the board’s approval. Theboard itself performs this task and approves the Group’s overall system of governance and internal controls.
New Zealand Stock Exchange
Rio Tinto Limited is also listed on the New Zealand Stock Exchange (“NZX”) which has introduced a CorporateGovernance Best Practice Code (the NZX Code). As an overseas listed issuer on the NZX, Rio Tinto Limited is deemed to comply generally with the NZX Listing Rules, including the NZX Code, while it remains listed on the ASX. Whilst the ASX Principles and the NZX Code are substantially the same, there may be some AS X Principles or other ASX corporate governance rules which differ materially from the NZX’s corporate governance rules or the NZX Code. The ASX Principles and other corporate governance rules can be found on the ASX website: www.asx.com.au.
Principal auditors
The remuneration of the Group’s principal auditors for audit services and other services, as well as remunerationpayable to other accounting firms, has been set out in note 41 to the 2006 financial statements.
Rio Tinto has adopted policies designed to uphold the independence of the Group’s principal auditors by prohibiting their engagement to provide a range of accounting and other professional services that might compromise their appointment as independent auditors. The engagement of the Group’s principal auditors to provide statutory audit services, certain other assurance services, tax services and some other specific services are pre-approved annually by theAudit committee. Each engagement of the Group’s principal auditors to provide other permitted services is subject to the specific approval of theAudit committeeor its chairman.
Prior to the commencement of each financial year, the Group’s finance director submits to theAudit committeeaschedule of the types of services that are expected to be performed during the following year for its approval. TheAudit committeemay impose a US dollar limit on the total value of other permitted services that can be provided. Any non audit service provided by the Group’s principal auditors, where the expected fee exceeds a pre-determined level, mustbe subject to the Group’s normal tender procedures. However, in exceptional circumstances the finance director is authorised to engage the Group’s principal auditors to provide such services without going to tender, but if the fees are expected to exceed US$250,000 then the chairman of theAudit committeemust approve the engagement.
TheAudit committeehas adopted policies for the pre-approval of permitted services provided by the Group’s principal auditors. These are regularly reviewed by the committee. Engagements for services provided by the Group’s principal auditors since the adoption of these policies were either within the pre-approval policies or approved by theAudit committee.
Audit committee
TheAudit committeemeets the membership requirements of the Code, the ASX Principles and the NYSE Standards. The Group also meets the composition, operation and responsibility requirements in respect of audit committees mandated by the ASX. TheAudit committeeis governed by a written charter approved by the board, which theAudit committeereviews and reassesses each year for adequacy. A copy of this charter is reproduced on page 129 to 130.
TheAudit committeecomprises the five members set out below. Michael Fitzpatrick became a member of the committee with effect from June 2006. The members of the committee are independent and are free of any relationship that would interfere with impartial judgement in carrying out their responsibilities. David Mayhew attends the meetings in an advisory capacity.
| Rio Tinto 2006 Form 20-F | 127 |
Back to Contents
Report of the Audit committee
TheAudit committeemet seven times in 2006. It monitors developments in corporate governance in the UK, Australiaand the US, to ensure the Group continues to apply high and appropriate standards.
The charter, reproduced on page 129, is subject to regular discussion and review.
There is in place a set of procedures, including budgetary guidelines, for the appointment of the external auditorto undertake non audit work, which aims to provide the best possible services for the Group at the most advantageous price. The committee reviews the independence of the external auditors on an annual basis and a process is also in place to review their effectiveness to ensure that the Group continues to receive an efficient and unbiased service. TheAudit committeeadvised the directors that it is satisfied that the provision of non audit services by the external auditors during2006 is compatible with the general standard of independence for auditors imposed by the Australian Corporations Act 2001. Furthermore, as part of its responsibility to foster open communication, the committee meets separately with management, the external auditors and the internal auditor.
Financial expert
TheAudit committeereviewed the SEC requirements for audit committees’ financial experts and the Code requirement that at least one committee member should have recent and relevant financial experience. Following a detailed review, the committee recommended to the board that Michael Fitzpatrick, Andrew Gould and Sir David Clementi be identified as theAudit committee’sfinancial experts in the 2006Annual report and financial statements. The board has also concluded that Michael Fitzpatrick, Andrew Gould and Sir David Clementi possess the requisite skills, experience and background to qualify for the purpose of clause C.3.1 of the Code.
2006 financial statements
TheAudit committeehas reviewed and discussed with management the Group’s audited financial statements for theyear ended 31 December 2006.
We have discussed with the external auditors the matters described in the American Institute of Certified PublicAccountant Auditing Standard No. 90,Audit committee communications,and in theInternational Standard on Auditing (UK and Ireland) 260,Communication of Audit Matters with those charged with governance (ISA 260),including their judgements regarding the quality of the Group’s accounting principles and underlying estimates.
The committee has discussed with the external auditors their independence, and received and reviewed their written disclosures, as required by the US Independence Standards Board’s Standard No. 1, Independence Discussions with Audit Committees and ISA 260.
Based on the reviews and discussions referred to above, the committee has recommended to the board ofdirectors that the financial statements referred to above be included in the 2006Annual report and financial statements.
Andrew Gould(Chairman)
Sir David Clementi
Vivienne Cox
Michael Fitzpatrick
Lord Kerr
Report of the Nominations committee
TheNominations committee’sactivities during 2006 covered executive and non executive succession and appointments.2006 saw the appointment of both an executive director, Tom Albanese, and a non executive director, Michael Fitzpatrick, as well as the appointment of Bret Clayton as Tom Albanese’s successor as chief executive, Copper, followed by the announcement in December 2006 of Tom’s succession as chief executive in May 2007.
Michael Fitzpatrick is an Australian independent director, who brings extensive Australian and international business experience to the board. A short biography of each is set out on pages 89 to 92.
As part of his annual performance assessment of individual directors, Paul Skinner, who is chairman of theNominations committee, has also reviewed the time committed by directors to Group business and confirmed this to be appropriate in each case.
Paul Skinner(Chairman)
Ashton Calvert, AC
Sir Rod Eddington
David Mayhew
Sir Richard Sykes
| Rio Tinto 2006 Form 20-F | 128 |
Back to Contents
AUDIT COMMITTEE CHARTER
| Scope and authority |
The Company is required by the UK Listing Authority (UKLA), the New York Stock Exchange (NYSE), and the Australian Stock Exchange (ASX) to establish an Audit committee. Each of the UKLA, the NYSE and the ASX also lay down rules and guidelines for the composition of the committee and the work to be undertaken by it. These requirements, where not self evident, have been incorporated into this Charter.
The primary function of the Audit committee is to assist the boards of directors in fulfilling their responsibilities by reviewing: The financial information that will be provided to shareholders and the public; |
| • | The systems of internal controls that the boards and management have established; |
| • | The Group’s auditing, accounting and financial reporting processes. In carrying out its responsibilities the committee has full authority to investigate all matters that fall within the terms of reference of this Charter. Accordingly, the committee may: |
| • | Obtain independent professional advice in the satisfaction of its duties at the cost of the Group; |
| • | Have such direct access to the resources of the Group as it may reasonably require including the external internal auditors. |
Composition
The Audit committee shall comprise three or more non executive directors, all of whom shall be independent. The chairman of the Audit committee will be an independent director, who is not also the chairman of the boards. The boards will determine each director’s independence having regard to the Independence Policy adopted by the boards, which includes consideration of any past and present relationships with the Group which, in the opinion of the boards, could influence the director’s judgment.
All members of the committee shall have a working knowledge of basic finance and accounting practices. At least one member of the committee will have accounting or related financial management expertise, as determined by the boards.
A quorum will comprise any two committee members.
The committee may invite members of the management team to attend the meetings and to provide information as necessary.
Meetings
The committee shall meet not less than four times a year or more frequently as circumstances require. Audit committee minutes will be confirmed at the following meeting of the committee and tabled as soon as practicable at a meeting of the boards.
The Company’s senior financial management, external auditors and internal auditor shall be available to attend all meetings.
As part of its responsibility to foster open communication, the committee should meet with management, the external auditors and the internal auditor, at least annually, to discuss any matters that are best dealt with privately.
Responsibilities
The boards and the external auditors are accountable to shareholders. The Audit committee is accountable to the boards. The internal auditor is accountable to the Audit committee and the finance director.
To fulfil its responsibilities the committee shall:
| Charter |
| • | Review and, if appropriate, update this Charter at least annually. |
| • | Financial Reporting and Internal Financial Controls |
| • | Review with management and the external auditors the Group’s financial statements, Form 20-F, stock exchange and media releases in respect of each half year and full year. |
| • | Review with management and the external auditors the accounting policies and practices adopted by the company and their compliance with accounting standards, stock exchange listing rules and relevant legislation. |
| • | Discuss with management and the external auditors management’s choice of accounting principles and material judgments, including whether they are aggressive or conservative and whether they are common or minority practices. |
| • | Recommend to the boards that the annual and interim financial statements and Form 20-F reviewed by the committee (or the chairman representing the committee for this purpose) be included in the Group’s annual report. |
| • | Review the regular reports prepared by the internal auditor including the effectiveness of the Group’s internal financial controls. |
| | |
| External auditors |
| • | Review and recommend to the boards the external auditors to be proposed to shareholders, following a commercial tender if deemed necessary. |
| • | Review with the external auditors the planned scope of their audit and subsequently their audit findings including any internal control recommendations. |
| Rio Tinto 2006 Form 20-F | 129 |
Back to Contents
| • | Periodically consult with the external auditors out of the presence of management about the quality of the Group’s accounting principles, material judgments and any other matters that the committee deems appropriate. |
| • | Periodically review the performance of the external auditors and the effectiveness of the audit process, taking into consideration relevant professional and regulatory requirements. |
| • | Review and approve the fees and other compensation to be paid to the external auditors. |
| • | Review and approve any non audit work and related fees to be carried out by the external auditors. |
| • | Ensure that the external auditors submit a written statement outlining all of its professional relationships with the Group including the provision of services that may affect their objectivity or independence. Review and discuss with the external auditors all significant relationships they have with the company to determine their independence. |
| | |
| Internal auditor |
| • | Review the qualifications, organisation, strategic focus and resourcing of internal audit. |
| • | Review and approve the internal audit plans. |
| • | Review internal audit performance. |
| • | Periodically consult privately with the internal auditor about any significant difficulties encountered including restrictions on scope of work, access to required information or any other matters that the committee deems appropriate. |
| |
| Risk management |
| • | Review and evaluate the internal processes for determining and managing key risk areas. |
| • | Ensure the Company has an effective risk management system and that macro risks are reported at least annually to the board. |
| • | Require periodic reports from nominated senior managers: |
| | – | confirming the operation of the risk management system including advice that accountable management have confirmed the proper operation of agreed risk mitigation strategies and controls, and |
| | – | detailing material risks |
| • | Address the effectiveness of the Company’s internal control system with management and the internal and external auditors. |
| • | Evaluate the process the Company has in place for assessing and continuously improving internal controls, particularly those related to areas of material risk. |
| | |
| Other matters |
| The committee shall also perform any other activities consistent with this Charter that the committee or boards deem appropriate. This will include but not be limited to: |
| • | Review of the Group’s insurance cover. |
| • | Review the Group’s tax planning and compliance. |
| • | Review the Group’s whistle-blowing procedures for financial reporting. |
| Rio Tinto 2006 Form 20-F | 130 |
Back to Contents
| Item 7. | Major Shareholders and Related Party Transactions |
MAJOR SHAREHOLDERS
As far as is known, Rio Tinto plc is not directly or indirectly owned or controlled by another corporation or by any government. Rio Tinto plc does not know of any arrangements which may result in a change in its control. As of 8 June 2007, the total amount of the voting securities owned by the directors of Rio Tinto plc as a group wa s 112,964 ordinary shares of 10p each representing less than one per cent of the number in issue.
As far as is known, Rio Tinto Limited, with the exception of the arrangements for the dual listed companies merger described on pages 136 to 139, is not directly or indirectly owned or controlled by another corporation or by any government. As of 8 June 2007, the only person known to Rio Tinto Limited as owning more than five per cent of its shares was Tinto Holdings Australia Pty Limited, which is an indirect wholly owned subsidiary of Rio Tinto plc, with 171,072,520 shares, representing 37.48 per cent of its issued capital. Rio Tinto Limited does not know of any arrangements which may result in a change in its control. As of 8 June 2007 the total amount of the voting securities owned by the directors of Rio Tinto Limited as a group was 96,190 shares representing less than one per cent of the number in issue.
Directors’ interests in Group voting securities are shown in Table 3 on page 111. Their total beneficial interest in the Group amounts to less than one per cent.
Except as provided under the DLC Merger Sharing Agreement as explained on pages 136 to 137, the Group’s major shareholders have the same voting and other rights as other shareholders.
As at 8 June 2007 there were 250 shareholders who had registered addresses in the US holding 157,241 shares in Rio Tinto plc, and 255 who had registered addresses in the US holding 342,609 shares in Rio Tinto Limited.
SUBSTANTIAL SHAREHOLDERS
Under the Listing Rules, any shareholder of Rio Tinto plc with a beneficial interest of more than three per cent, or of Rio Tinto Limited with a beneficial interest of more than five per cent, is required to provide the Companies with notice. Excluding the interest held by Tinto Holdings Australia Pty Limited in Rio Tinto Limited, the shareholders to have provided such notice are:
| Rio Tinto plc | Date of | | Number of | | Percentage | |
| | notice | | shares | | of issued | |
| | | | | | share capital | |
|
|
|
|
|
| |
| Barclays PLC | 12 Jul 2006 | | 42,129,019 | | 4.02 | |
| The Capital Group Companies, Inc | 13 Jun 2006 | | 41,031,494 | | 3.90 | |
| Legal & General plc | 5 Oct 2005 | | 33,539,570 | | 3.13 | |
|
|
|
|
|
| |
| Note | | | | | | |
| As far as it is known, Rio Tinto is not directly or indirectly owned or controlled by another corporation or by any government. | | | | | | |
| Rio Tinto Limited | Date of notice | | Number of | | Percentage | |
| | | | shares | | of issued | |
| | | | | | share capital | |
|
|
|
|
|
| |
| None | | | — | | — | |
|
|
|
|
|
| |
| Note | | | | | | |
| Rio Tinto is not aware of any arrangement which may result in a change in its control. | | | | | | |
| Rio Tinto 2006 Form 20-F | 131 |
Back to Contents
ANALYSIS OF ORDINARY SHAREHOLDERS As at 9 February 2007
| | | | | | Rio Tinto plc | | | | | | Rio Tinto Limited | |
| | No of | | % | | Shares | | % | | No of | | % | | Shares | | % | |
| | accounts | | | | | | | | accounts | | | | | | | |
|
|
|
|
|
|
|
|
|
|
|
|
|
|
|
| |
| 1 to 1,000 shares | 38,405 | | 71.07 | | 14,822,316 | | 1.46 | | 82,340 | | 80.40 | | 29,578,002 | | 10.35 | |
| 1,001 to 5,000 shares | 12,810 | | 23.70 | | 25,735,953 | | 2.53 | | 17,665 | | 17.25 | | 34,745,068 | | 12.16 | |
| 5,001 to 10,000 shares | 1,098 | | 2.03 | | 7,540,348 | | 0.74 | | 1,489 | | 1.45 | | 10,395,908 | | 3.64 | |
| 10,001 to 25,000 shares | 560 | | 1.04 | | 8,800,248 | | 0.86 | | 597 | | 0.58 | | 8,920,489 | | 3.12 | |
| 25,001 to 125,000 shares | 550 | | 1.02 | | 31,301,789 | | 3.07 | | 225 | | 0.22 | | 11,279,596 | | 3.95 | |
| 125,001 to 250,000 shares | 204 | | 0.38 | | 37,073,012 | | 3.64 | | 40 | | 0.04 | | 6,602,885 | | 2.31 | |
| 250,001 to 1,250,000 shares | 273 | | 0.50 | | 148,918,025 | | 14.63 | | 36 | | 0.04 | | 20,609,086 | | 7.21 | |
| 1,250,001 to 2,500,000 | 71 | | 0.13 | | 124,513,650 | | 12.23 | | 8 | | 0.01 | | 15,088,234 | | 5.28 | |
| 2,500,001 and over | 68 | | 0.13 | | 515,236,968 | | 50.61 | | 10 | | 0.01 | | 148,524,155 | | 51.98 | |
| ADRs | — | | — | | 104,131,792 | | 10.23 | | — | | — | | — | | — | |
|
|
|
|
|
|
|
|
|
|
|
|
|
|
|
| |
| Publicly held shares | 54,309 | | 100 | | 1,018,074,101 | | 100 | | 102,411 | | 100 | | 285,743,423 | | 100 | |
| Shares held in treasury | | | | | 53,607,337 | | | | | | | | — | | | |
| Tinto Holdings Australia Pty Limited | | | | | | | | | | | | | 171,072,520 | | | |
|
|
|
|
|
|
|
|
|
|
|
|
|
|
|
| |
| | | | | | 1,071,681,438 | | | | | | | | 456,815,943 | | | |
|
|
|
|
|
|
|
|
|
|
|
|
|
|
|
| |
| Number of holdings less than marketable parcel of A$500. | | | | | | 1,378 | | | | | | | |
TWENTY LARGEST REGISTERED SHAREHOLDERS
In accordance with the ASX Listing Rules, below are the names of the twenty largest registered holders of Rio Tinto Limited shares and the number of shares and the percentage of issued capital each holds:
Rio Tinto Limited
| | | | | Percentage | |
| | | | | of issued | |
| | | Number of | | share | |
| | | shares | | capital | |
|
|
|
|
| |
| 1 | Tinto Holdings Australia Pty Limited | 171,072,520 | | 37.45 | |
| 2 | National Nominees Limited | 38,626,816 | | 8.46 | |
| 3 | J P Morgan Nominees Australia Limited | 36,164,864 | | 7.92 | |
| 4 | Westpac Custodian Nominees Pty Limited | 33,163,997 | | 7.26 | |
| 5 | Citicorp Nominees Pty Limited | 10,141,523 | | 2.22 | |
| 6 | ANZ Nominees Limited | 8,209,196 | | 1.80 | |
| 7 | Cogent Nominees Pty Limited | 6,320,939 | | 1.38 | |
| 8 | Queensland Investment Corporation | 6,151,422 | | 1.35 | |
| 9 | HSBC Custody Nominees (Australia) Limited | 4,006,203 | | 0.88 | |
| 10 | Citicorp Nominees Pty Limited | 3,186,324 | | 0.70 | |
| 11 | Westpac Financial Services Limited | 2,552,871 | | 0.56 | |
| 12 | Australian Foundation Investment Company Limited | 2,438,414 | | 0.53 | |
| 13 | AMP Life Limited | 2,424,837 | | 0.53 | |
| 14 | UBS Wealth Management Australia Nominees Pty Ltd | 2,332,068 | | 0.51 | |
| 15 | Citicorp Nominees Pty Limited | 2,125,342 | | 0.47 | |
| 16 | RBC Dexia Investor Services Australia Nominees Pty Ltd | 1,793,472 | | 0.39 | |
| 17 | Citicorp Nominees Pty Limited | 1,397,217 | | 0.31 | |
| 18 | Argo Investments Limited | 1,298,920 | | 0.28 | |
| 19 | RBC Dexia Investor Services Australia Nominees Pty Ltd | 1,277,964 | | 0.28 | |
| 20 | Suncorp Custodian Services Pty Limited | 1,240,193 | | 0.27 | |
|
|
|
|
| |
| | | 335,925,102 | | 73.55 | |
|
|
|
|
| |
| Notes |
| 1 | Tinto Holdings Australia Pty Limited is a wholly owned subsidiary of Rio Tinto plc. |
| 2 | Other large registered shareholders are nominees who hold securities on behalf of beneficial shareholders. |
RELATED PARTY TRANSACTIONS
Information about material related party transactions of the Rio Tinto Group is set out in note 42 to the 2006 financial statements.
| Rio Tinto 2006 Form 20-F | 132 |
Back to Contents
| Item 8. | Financial Information |
LEGAL PROCEEDINGS
Neither Rio Tinto plc nor Rio Tinto Limited nor any of their subsidiaries is a defendant in any proceedings which the directors believe will have a material effect on either Company’s financial position or profitability.
DIVIDENDS
Both Companies have paid dividends on their shares every year since incorporation in 1962. The rights of Rio Tinto shareholders to receive dividends are explained under the description of the Dual Listed Companies Structure on pages 136 to 139.
Dividend policy
The aim of Rio Tinto’s progressive dividend policy is to increase the US dollar value of ordinary dividends over time, without cutting them during economic downturns.
The rate of the total annual dividend, in US dollars, is determined taking into account the results for the past year and the outlook for the current year. The interim dividend is set at one half of the total ordinary dividend for the previous year. Under Rio Tinto’s dividend policy the final ordinary dividend for each year is expected to be at least equal to the previous interim dividend.
Dividend determination
The majority of the Group’s sales are transacted in US dollars, making this the most reliable measure for the Group’s global business performance. It is Rio Tinto’s main reporting currency and consequently the natural currency for dividend determination. Dividends determined in US dollars are translated at exchange rates prevailing two days prior to the announcement and are then declared payable in sterling by Rio Tinto plc and in Australian dollars by Rio Tinto Limited.
On request shareholders of Rio Tinto plc can elect to receive dividends in Australian dollars and shareholders of Rio Tinto Limited can elect to receive dividends in sterling. Shareholders requiring further information should contact Computershare.
2006 dividends
The 2006 interim and final dividends were determined at 40.0 US cents and at 64.0 US cents per share respectively and the applicable translation rates were US$1.8674 and US$1.96145 to the pound sterling and US$0.7622 and US$0.77255 to the Australian dollar.
Final dividends of 32.63 pence per share and of 82.84 Australian cents per share were paid on 13 April 2007. A final dividend of 256 US cents per Rio Tinto plc ADR (each representing four shares) was paid by JPMorgan Chase Bank NA to ADR holders on 16 April 2007.
The tables below set out the amounts of interim, final and special cash dividends paid or payable on each share or ADS in respect of each financial year, but before deduction of any withholding tax.
| Rio Tinto Group – US cents per share | 2006 | | 2005 | | 2004 | | 2003 | | 2002 | |
|
|
|
|
|
|
|
|
|
| |
| Interim | 40.0 | | 38.5 | | 32.0 | | 30.0 | | 29.5 | |
| Final | 64.0 | | 41.5 | | 45.0 | | 34.0 | | 30.5 | |
| Special | — | | 110.0 | | — | | — | | — | |
|
|
|
|
|
|
|
|
|
| |
| Total | 104.0 | | 190.0 | | 77.0 | | 64.0 | | 60.0 | |
|
|
|
|
|
|
|
|
|
| |
| | | | | | | | | | | |
| Rio Tinto plc – UK pence per share | 2006 | | 2005 | | 2004 | | 2003 | | 2002 | |
|
|
|
|
|
|
|
|
|
| |
| Interim | 21.42 | | 21.75 | | 17.54 | | 18.45 | | 18.87 | |
| Final | 32.63 | | 23.35 | | 23.94 | | 18.68 | | 18.60 | |
| Special | — | | 61.89 | | — | | — | | — | |
|
|
|
|
|
|
|
|
|
| |
| Total | 54.05 | | 106.99 | | 41.48 | | 37.13 | | 37.47 | |
|
|
|
|
|
|
|
|
|
| |
| | | | | | | | | | | |
| Rio Tinto Limited – Australian cents per share | 2006 | | 2005 | | 2004 | | 2003 | | 2002 | |
|
|
|
|
|
|
|
|
|
| |
| Interim | 52.48 | | 50.56 | | 45.53 | | 45.02 | | 54.06 | |
| Final | 82.84 | | 54.86 | | 58.29 | | 44.68 | | 51.87 | |
| Special | — | | 145.42 | | — | | — | | — | |
|
|
|
|
|
|
|
|
|
| |
| Total | 135.32 | | 250.84 | | 103.82 | | 89.70 | | 105.93 | |
|
|
|
|
|
|
|
|
|
| |
| Rio Tinto 2006 Form 20-F | 133 |
Back to Contents
| Rio Tinto plc and Rio Tinto Limited – US cents per ADS | | | | | | | | | | | |
| | | 2006 | | 2005 | | 2004 | | 2003 | | 2002 | |
|
|
|
|
|
|
|
|
|
|
| |
| Interim | | 160 | | 154 | | 128 | | 120 | | 118 | |
| Final | | 256 | | 166 | | 180 | | 136 | | 122 | |
| Special | | — | | 440 | | — | | — | | — | |
|
|
|
|
|
|
|
|
|
|
| |
| Total | | 416 | | 760 | | 308 | | 256 | | 240 | |
|
|
|
|
|
|
|
|
|
|
| |
Dividend reinvestment plan (DRP)
Rio Tinto offers a DRP to registered shareholders, which provides the opportunity to use cash dividends to purchase RioTinto shares in the market free of commission. See Taxation on page 143 for an explanation of the tax consequences. Due to local legislation the DRP cannot be extended to shareholders in the US, Canada and certain other countries. Please contact Computershare for further information.
POST BALANCE SHEET EVENTS
No significant changes have occurred since the date of the financial statements.
| Item 9. | The Offer and Listing |
MARKET LISTINGS AND SHARE PRICES
Rio Tinto plc
The principal market for Rio Tinto plc shares is the London Stock Exchange (LSE).
As a constituent of the Financial Times Stock Exchange 100 index (FTSE 100), Rio Tinto plc shares trade through the Stock Exchange Electronic Trading Service (SETS) system.
Central to the SETS system is the electronic order book on which an LSE member firm can post buy and sell orders, either on its own behalf or for its clients. Buy and sell orders are executed against each other automatically in strict price, then size, priority. The order book operates from 8.00 am to 4.30 pm daily. From 7.50 am to 8.00 am ordersmay be added to, or deleted from the book, but execution does not occur. At 8.00 am the market opens by means of an uncrossing algorithm which calculates the greatest volume of trades on the book which can be executed, then matches the orders, leaving unexecuted orders on the book at the start of trading.
All orders placed on the order book are firm and are for standard three day settlement. While the order book isvital to all market participants, orders are anonymous, with the counterparties being revealed to each other only after execution of the trade.
Use of the order book is not mandatory but all trades, regardless of size, executed over the SETS system arepublished immediately. The only exception to this is where a Worked Principal Agreement (WPA) is entered into for trades greater than 8 x Normal Market Size (NMS). Rio Tinto plc has an NMS of 100,000 shares. Publication of trades entered under a WPA is delayed until the earlier of 80 per cent of the risk position assumed by the member firm taking on the trade being unwound or the end of the business day.
Closing LSE share prices are published in most UK national newspapers and are also available during the day onthe Rio Tinto and other websites. In addition, share prices are available on CEEFAX and TELETEXT and can be obtained through the Cityline service operated by the Financial Times in the UK: telephone 0906 843 3880. Calls are currently charged at 60p per minute plus VAT, in addition to any mobile phone charges.
Rio Tinto plc has a sponsored American Depositary Receipt (ADR) facility with JPMorgan Chase Bank NA (JPMorgan) under a Deposit Agreement, dated 13 July 1988, as amended on 11 June 1990, as further amended andrestated on 15 February 1999 and as further amended and restated on 18 February 20 05 when JPMorgan became Rio Tinto plc’s depository. The ADRs evidence Rio Tinto plc American Depositary Shares (ADS), each representing four ordinary shares. The shares are registered with the US Securities and Exchange Commission (SEC), are listed on the New York Stock Exchange (NYSE) and are traded under the symbol ‘RTP’.
Rio Tinto plc shares are also listed on Euronext and on Deutsche Börse.
The following table shows share prices for the period indicated, the reported high and low middle marketquotations, which represent an average of bid and asked prices, for Rio Tinto plc’s shares on the LSE based on the LSE Daily Official List, and the highest and lowest sale prices of the Rio Tinto plc ADSs as reported on the NYSE composite tape.
| Rio Tinto 2006 Form 20-F | 134 |
Back to Contents
| | Pence per | | US$ per | |
| | Rio Tinto plc share | | Rio Tinto plc ADS | |
| | High | | Low | | High | | Low | |
|
|
|
|
|
|
|
| |
| 2002 | 1,492 | | 981 | | 85.93 | | 62.00 | |
| 2003 | 1,543 | | 1,093 | | 111.35 | | 71.70 | |
| 2004 | 1,574 | | 1,212 | | 119.39 | | 86.42 | |
| 2005 | 2,657 | | 1,472 | | 183.29 | | 111.57 | |
| 2006 | 3,322 | | 2,352 | | 253.33 | | 176.09 | |
|
|
|
|
|
|
|
| |
| Aug 2006 | 2,807 | | 2,640 | | 216.11 | | 198.01 | |
| Sep 2006 | 2,824 | | 2,352 | | 214.50 | | 176.09 | |
| Oct 2006 | 2,897 | | 2,401 | | 221.87 | | 178.70 | |
| Nov 2006 | 3,015 | | 2,658 | | 231.15 | | 200.67 | |
| Dec 2006 | 2,850 | | 2,649 | | 225.93 | | 205.23 | |
| Jan 2007 | 2,760 | | 2,505 | | 218.99 | | 193.60 | |
| Feb2007 | 2,940 | | 2,686 | | 230.60 | | 208.81 | |
| Mar 2007 | 2,902 | | 2,582 | | 228.10 | | 203.68 | |
| Apr 2007 | 3,183 | | 2,888 | | 255.30 | | 230.60 | |
| May 2007 | 3,675 | | 3,060 | | 296.27 | | 244.73 | |
|
|
|
|
|
|
|
| |
| 2005 | | | | | | | | |
| First quarter | 1,851 | | 1,472 | | 142.80 | | 111.57 | |
| Second quarter | 1,762 | | 1,557 | | 130.75 | | 115.80 | |
| Third quarter | 2,346 | | 1,724 | | 166.90 | | 122.98 | |
| Fourth quarter | 2,657 | | 2,073 | | 183.29 | | 148.81 | |
|
|
|
|
|
|
|
| |
| 2006 | | | | | | | | |
| First quarter | 2,981 | | 2,588 | | 212.94 | | 176.81 | |
| Second quarter | 3,322 | | 2,547 | | 253.33 | | 184.05 | |
| Third quarter | 2,901 | | 2,352 | | 216.11 | | 176.09 | |
| Fourth quarter | 3,015 | | 2,401 | | 231.15 | | 178.70 | |
|
|
|
|
|
|
|
| |
| 2007 | | | | | | | | |
| First quarter | 2,940 | | 2,505 | | 230.60 | | 193.60 | |
|
|
|
|
|
|
|
| |
As at 8 June 2007, there were 25.9 million Rio Tinto plc ADSs in issue, representing 103.6 million Rio Tinto plc shares which were held of record by 380 ADR holders and which represented 10.35 per cent of the publicly held shares. There were 53,482 holders of record of Rio Tinto plc’s shares of whom 250 had registered addresses in the US, holding 157,241 Rio Tinto plc shares which represented 0.016 per cent of the publicly held shares. In addition, certain accounts of record with registered addresses other than in the US hold shares, in whole or in part, beneficially for US persons.
Rio Tinto Limited
Rio Tinto Limited shares are listed on the Australian Securities Exchange (ASX) and the New Zealand SecuritiesExchange. The ASX is the principal trading market for Rio Tinto Limited shares. The ASX is a national stock exchange operating in the capital city of each Australian State with an automated trading system. Although not listed, Rio Tinto Limited shares are also traded in London.
Closing ASX share prices are published in most Australian newspapers and are also available during the day on the Rio Tinto and other websites.
Rio Tinto Limited had an ADR facility with JPMorgan Chase Bank NA under a Deposit Agreement, dated6 June 1989, as amended on 1 August 1989, as further amended and restated on 2 June 1992 and as further amended and restated on 7 July 2005 when JPMorgan became Rio Tinto Limited’s depository.
Rio Tinto Limited had established a separate ADR programme before the DLC merger in 1995 but the Group didnot believe that there was any benefit in continuing to maintain two separate ADR programmes and in 2006 decided that, due to the relative size of the Rio Tinto Limited ADR programme, it should be terminated. In February 2006 formal notice of termination of the Deposit Agreement was given to JPMorgan and it was terminated on 10 April 2006, immediately after the payment of the final dividend to the ADR holders. Any questions concerning holdings of Rio Tinto Limited ADRs should be directed to the JPMorgan Service Center on (800) 990 1135.
The following table sets out for the periods indicated the high and low closing sale prices of Rio Tinto Limitedshares based upon information provided by the ASX. There is no established trading market in the US for Rio Tinto Limited’s shares.
| Rio Tinto 2006 Form 20-F | 135 |
Back to Contents
| | A$ per | |
| | Rio Tinto Limited share | |
| | High | | Low | |
|
|
|
| |
| 2002 | 41.35 | | 29.05 | |
| 2003 | 37.54 | | 28.17 | |
| 2004 | 40.20 | | 31.98 | |
| 2005 | 69.10 | | 38.82 | |
| 2006 | 87.97 | | 65.38 | |
|
|
|
| |
| Aug 2006 | 76.15 | | 72.05 | |
| Sep 2006 | 74.80 | | 65.38 | |
| Oct 2006 | 79.77 | | 68.01 | |
| Nov 2006 | 82.00 | | 72.57 | |
| Dec 2006 | 77.80 | | 72.99 | |
| Jan 2007 | 77.45 | | 69.50 | |
| Feb 2007 | 80.11 | | 75.48 | |
| Mar 2007 | 79.20 | | 72.53 | |
| Apr 2007 | 84.89 | | 77.20 | |
| May 2007 | 96.36 | | 81.15 | |
|
|
|
| |
| 2005 | | | | |
| First quarter | 47.93 | | 38.82 | |
| Second quarter | 45.90 | | 41.40 | |
| Third quarter | 60.01 | | 45.12 | |
| Fourth quarter | 69.10 | | 54.27 | |
|
|
|
| |
| 2006 | | | | |
| First quarter | 78.85 | | 67.50 | |
| Second quarter | 87.97 | | 70.90 | |
| Third quarter | 78.56 | | 65.38 | |
| Fourth quarter | 82.00 | | 68.01 | |
|
|
|
| |
| 2007 | | | | |
| First quarter | 80.11 | | 69.50 | |
|
|
|
| |
As at 8 June 2007, there were 104,491 holders of record of Rio Tinto Limited’s shares of whom 255 had registered addresses in the US holding 342,609 Rio Tinto Limited shares which represented 0.12 per cent of the publicly held shares. In addition, certain accounts of record with registered addresses other than in the US may hold Rio Tinto Limited shares, in whole or in part, beneficially for US persons.
ADR holders
ADR holders may instruct JPMorgan as to how the shares represented by their ADRs should be voted. Registered holders of ADRs will have theAnnual reviewand interim reports mailed to them at their record address. ADR holders will receive theAnnual reviewand interim reports on request.
Rio Tinto is subject to the US Securities and Exchange Commission (SEC) reporting requirements for foreign companies. A Form 20-F, which corresponds with the Form 10-K in US public companies, will be filed with the SEC. Rio Tinto’s Form 20-F and other filings can be viewed on the Rio Tinto website as well as the SEC web site at www.sec.gov
Investment warning
Past performance of shares is not necessarily a guide to future performance. The value of shares and investments andthe income derived from them can go down as well as up, and investors may not get back the amount they invested.
| Item 10. | Additional Information |
DUAL LISTED COMPANIES STRUCTURE
In 1995, Rio Tinto shareholders approved the terms of the dual listed companies merger (the DLC merger) which was designed to place the shareholders of both Companies in substantially the same position as if they held shares in a single enterprise owning all of the assets of both Companies. As a condition of its approval of the DLC merger, the Australian Government required Rio Tinto plc to reduce its shareholding in Rio Tinto Limited to 39 per cent by the end of 2005. Consistent with the commitments made to the Australian Government in 1995, the Rio Tinto plc shareholding in Rio Tinto Limited has been reduced over time and it now stands at approximately 37.5 per cent.
Following the approval of the DLC merger, both Companies entered into a DLC Merger Sharing Agreement (the Sharing Agreement) through which each Company agreed to ensure that the businesses of Rio Tinto plc and Rio Tinto
| Rio Tinto 2006 Form 20-F | 136 |
Back to Contents
Limited are managed on a unified basis, to ensure that the boards of directors of each Company is the same, and to give effect to certain arrangements designed to provide shareholders of each Company with a common economic interest in the combined enterprise.
In order to achieve this third objective, the Sharing Agreement provided for the ratio of dividend, voting andcapital distribution rights attached to each Rio Tinto plc share and to each Rio Tinto Limited share to be fixed in an Equalisation Ratio which has remained unchanged at 1:1. The Sharing Agreement has provided for this ratio to be revised in special circumstances where, for example, certain modifications are made to the share capital of one Company, such as rights issues, bonus issues, share splits and share consolidations, but not to the share capital of the other. Outside these specified circumstances, the Equalisation Ratio can only be altered with the approval of shareholders under the Class Rights Action approval procedure described under Voting rights. In addition, any adjustments are required to be confirmed by the auditors.
One consequence of the DLC merger is that Rio Tinto is subject to a wide range of laws, rules and regulatoryreview across multiple jurisdictions. Where these rules differ Rio Tinto, as a Group, aims to comply with the strictest applicable level.
Consistent with the creation of a single combined enterprise under the DLC merger, directors of each Companyact in the best interests of Rio Tinto as a whole. When matters may involve a conflict of interests between the shareholders of each Company they must be approved under the Class Rights Action approval procedure.
To ensure that the boards of both Companies are identical, resolutions to appoint or remove directors must be putto shareholders of both as a joint electorate as Joint Decisions as described under Voting rights, and it is a requirement that a person can only be a director of one Company if that person is also a director of the other Company. So, for example, if a person was removed as a director of Rio Tinto plc, he or she would also cease to be a director of Rio Tinto Limited.
Dividend rights
The Sharing Agreement provides for dividends paid on Rio Tinto plc and Rio Tinto Limited shares to be equalised on a net cash basis, that is without taking into account any associated tax credits. Dividends are determined in US dollars and are then, except for ADR holders, translated and paid in sterling and Australian dollars. The Companies are also required to announce and pay their dividends and other distributions as close in time to each other as possible.
In the unlikely event that one Company did not have sufficient distributable reserves to pay the equaliseddividend or the equalised capital distribution, it would be entitled to receive a top up payment from the other Company. The top up payment could be made as a dividend on the DLC Dividend Share, or by way of a contractual payment.
If the payment of an equalised dividend would contravene the law applicable to one of the Companies, then theymay depart from the Equalisation Ratio. However, should such a departure occur, then the relevant Company will put aside reserves to be held for payment on the relevant shares at a later date.
Rio Tinto shareholders have no direct rights to enforce the dividend equalisation provisions of the Sharing Agreement.
The DLC Dividend Share can also be utilised to provide the Group with flexibility for internal fundsmanagement by allowing dividends to be paid between the two parts of the Group. Such dividend payments are of no economic significance to the shareholders of either Company, as they will have no effect on the Group’s overall resources.
Voting rights
In principle, the Sharing Agreement provides for the public shareholders of Rio Tinto plc and Rio Tinto Limited to voteas a joint electorate on all matters which affect shareholders of both Companies in similar ways. These are referred to as Joint Decisions. Such Joint Decisions include the creation of new classes of share capital, the appointment or removal of directors and auditors and the receiving of annual financial statements. Joint Decisions are voted on a poll.
The Sharing Agreement also provides for the protection of the public shareholders of each Company by treating the shares issued by each Company as if they were separate classes of shares issued by a single company. So decisions that do not affect the shareholders of both Companies equally require the separate approval of the shareholders of both Companies. Matters requiring this approval procedure are referred to as Class Rights Actions and are voted on a poll.
Thus, the interests of the shareholders of each Company are protected against decisions which affect them and the shareholders in the other Company differently, by requiring their separate approval. For example, fundamentalelements of the DLC merger cannot be changed unless approved by shareholders under the Class Rights Action approval procedure.
Exceptions to these principles can arise in situations such as where legislation requires the separate approval of adecision by the appropriate majority of shareholders in one Company and where approval of the matter by shareholders of the other Company is not required.
Where a matter has been expressly categorised as either a Joint Decision or a Class Rights Action, the directorsdo not have the power to change that categorisation. If a matter falls within both categories, it is treated as a Class Rights Action. In addition, the directors can determine that matters not expressly listed in either category should be put to shareholders for their approval under either procedure.
To facilitate the joint voting arrangements each Company has entered into shareholder voting agreements. Each Company has issued a Special Voting Share to a special purpose company held in trust by a common Trustee.
| Rio Tinto 2006 Form 20-F | 137 |
Back to Contents
Rio Tinto plc has issued its Special Voting Share (RTP Special Voting Share) to RTL Shareholder SVC and RioTinto Limited has issued its Special Voting Share (RTL Special Voting Share) to RTP Shareholder SVC. The total number of votes cast on Joint Decisions by the public shareholders of one Company are voted at the parallel meeting of the other Company. The role of these special purpose companies in achieving this is described below.
In exceptional circumstances, certain public shareholders of the Companies can be excluded from voting at the respective Company’s general meetings because they have acquired shares in one Company in excess of a giventhreshold without making an offer for all the shares in the other Company. If this should occur, the votes cast by these excluded shareholders will be disregarded.
Following the Companies’ general meetings the overall results of the voting on Joint Decisions and the results ofvoting on separate decisions were announced to the stock exchanges, published on the Rio Tinto website and advertised in the Financial Times and The Australian newspapers.
Rio Tinto plc
At a Rio Tinto plc shareholders’ meeting at which a Joint Decision will be considered, each Rio Tinto plc share willcarry one vote and the holder of its Special Voting Share will have one vote for each vote cast by the public shareholders of Rio Tinto Limited. The holder of the Special Voting Share is required to vote strictly and only in accordance with the votes cast by public shareholders for and against the equivalent resolution at the parallel Rio Tinto Limited shareholders’ meeting.
The holders of Rio Tinto Limited ordinary shares do not actually hold any voting shares in Rio Tinto plc by virtue of their holding in Rio Tinto Limited and cannot enforce the voting arrangements relating to the Special VotingShare.
Rio Tinto Limited
At a Rio Tinto Limited shareholders’ meeting at which a Joint Decision will be considered, each Rio Tinto Limitedshare will carry one vote and, together with the Rio Tinto Limited ordinary shares held by Tinto Holdings Australia, the holder of its Special Voting Share will carry one vote for each vote cast by the public shareholders of Rio Tinto plc in their parallel meeting. Tinto Holdings Australia and the holder of the Special Voting Share are required to vote strictly, and only, in accordance with the votes cast for and against the equivalent resolution at the parallel Rio Tinto plc shareholders’ meeting.
The holders of Rio Tinto plc ordinary shares do not actually hold any voting shares in Rio Tinto Limited byvirtue of their holding in Rio Tinto plc and cannot enforce the voting arrangements relating to the Special Voting Share.
Capital distribution rights
If either of the Companies goes into liquidation, the Sharing Agreement provides for a valuation to be made of thesurplus assets of both Companies. If the surplus assets available for distribution by one Company on each of the shares held by its public shareholders exceed the surplus assets available for distribution by the other Company on each of the shares held by its public shareholders, then an equalising payment between the two Companies shall be made, to the extent permitted by applicable law, such that the amount available for distribution on each share held by public shareholders of each Company conforms to the Equalisation Ratio. The objective is to ensure that the public shareholders of both Companies have equivalent rights to the assets of the combined Group on a per share basis, taking account of the Equalisation Ratio.
The Sharing Agreement does not grant any enforceable rights to the shareholders of either Company upon liquidation of a Company.
Limitations on ownership of shares and merger obligations
The laws and regulations of the UK and Australia impose restrictions and obligations on persons who control interestsin public quoted companies in excess of defined thresholds that, under certain circumstances, include obligations to make a public offer for all of the outstanding issued shares of the relevant company. The threshold applicable to Rio Tinto plc under UK law and regulations is 30 per cent and to Rio Tinto Limited under Australian law and regulations is 20 per cent.
As part of the DLC merger, the memorandum and articles of association of Rio Tinto plc and the constitution of Rio Tinto Limited were amended with the intention of extending these laws and regulations to the combined enterpriseand, in particular, to ensure that a person cannot exercise control over one Company without having made offers to the public shareholders of both Companies. It is consistent with the creation of the single economic enterprise and the equal treatment of the two sets of shareholders, that these laws and regulations should operate in this way. The articles of association of Rio Tinto plc and the constitution of Rio Tinto Limited impose restrictions on any person who controls, directly or indirectly, 20 per cent or more of the votes on a Joint Decision. If, however, such a person only has an interest in either Rio Tinto Limited or Rio Tinto plc, then the restrictions will only apply if they control, directly or indirectly, 30 per cent or more of the votes at that Company’s general meetings.
If one of the thresholds specified above is breached then, subject to certain limited exceptions and notification bythe relevant Company, such persons may not attend or vote at general meetings of the relevant Company, may not receive dividends or other distributions from the relevant Company, and may be divested of their interest by the directors of the relevant Company. These restrictions will continue to apply until such persons have either made a
| Rio Tinto 2006 Form 20-F | 138 |
Back to Contents
public offer for all of the publicly held shares of the other Company, or have reduced their controlling interest below the thresholds specified, or have acquired through a permitted means at least 50 per cent of the voting rights of all the shares held by the public shareholders of each Company.
These provisions are designed to ensure that offers for the publicly held shares of both Companies would berequired to avoid the restrictions set out above, even if the interests which breach the thresholds are only held in one of the Companies. The directors do not have the discretion to exempt a person from the operation of these rules.
Under the Sharing Agreement, the Companies agree to cooperate to enforce the restrictions contained in theirarticles of association and constitution and also agree that no member of the Rio Tinto Group shall accept a third party offer for Rio Tinto Limited shares unless such acceptance is approved by a Joint Decision of the public shareholders of both Companies.
Guarantees
In 1995, each Company entered into a Deed Poll Guarantee in favour of creditors of the other Company. Pursuant to the Deed Poll Guarantees, each Company guaranteed the contractual obligations of the other Company and the obligationsof other persons which are guaranteed by the other Company, subject to certain limited exceptions. Beneficiaries under the Deed Poll Guarantees may make demand upon the guarantor thereunder without first having recourse to the Company or persons whose obligations are being guaranteed. The obligations of the guarantor under each Deed Poll Guarantee expire upon termination of the Sharing Agreement and under other limited circumstances, but only in respect of obligations arising after such termination and, in the case of other limited circumstances, the publication and expiry of due notice. The shareholders of the Companies cannot enforce the provision of the Deed Poll Guarantees.
MEMORANDUM AND ARTICLES OF ASSOCIATION
Rio Tinto plc adopted new Articles of Association by special resolution passed on 11 April 2002 and, amended on 14 April 2005 and 13 April 2007. And Rio Tinto Limited adopted a new Constitution by special resolution passed on 24 May 2000 and, amended by special resolution on 18 April 2002, 29 April 2005 and 27 April 2007. The resolution passed during April 2007 was in response to the implementation in the United Kingdom of the European Union Directive on Takeover Bids on 20 May 2006. Following the DLC merger in 1995 the Group introduced some change of control provisions which were designed to ensure that no one could gain control of one Company without making an offer to the shareholders of the other. The resolution removed certain discretions conferred on the directors by the change of control provisions which might have been impacted by the implementation of the Directive on Takeover Bids.
Introduction
As explained on pages 136 to 139 under the terms of the DLC merger the shareholders of Rio Tinto plc and of Rio Tinto Limited entered into certain contractual arrangements which are designed to place the shareholders of bothCompanies in substantially the same position as if they held shares in a single enterprise which owned all of the assets of both Companies. Generally and as far as is permitted by the UK Companies Act and the Australian Corporations Law this principle is reflected in the Memorandum and Articles of Association of Rio Tinto plc and in the Constitution of Rio Tinto Limited. The summaries below include descriptions of material rights of the shareholders of both Rio Tinto plc and Rio Tinto Limited. Unless stated otherwise the Memorandum and Articles of Association of and Constitution are identical.
Rio Tinto plc is incorporated under the name “Rio Tinto plc” and is registered in England and Wales withregistered number 719885 and Rio Tinto Limited is incorporated under the name “Rio Tinto Limited” and is registered in Australia with ABN 96 004 458 404.
No holder of shares, which may be held in either certificated or uncertificated form, will be required to make anyadditional contributions of capital.
Objects
The objects of Rio Tinto plc are set out in the fourth clause of its Memorandum of Association and the objects of Rio Tinto Limited are set out in the second clause of its Constitution. Included in these objects is the right for each Company to enter into, with one another, operate and carry into effect an Agreement known as the DLC Merger Sharing Agreement and a Deed Poll Guarantee.
| Other objects of Rio Tinto plc include provisions: |
| • | to carry on as an Investment Holding Company; |
| • | to subscribe for, sell, exchange or dispose of any type of security or investment; |
| • | to purchase any estate or interest in property or assets; |
| • | to borrow and raise money to secure or discharge any debt or obligation of or binding on the Company; |
| • | to draw, make or deal in negotiable or transferable instruments; |
| Rio Tinto 2006Form 20-F | 139 |
Back to Contents
| • | to amalgamate with and co-operate with or assist or subsidise any company, firm or person and to purchase orotherwise acquire or undertake all or any part of the business property or liabilities of any person, body orcompany carrying on any business which this Company is authorised to carry on; |
| • | to promote the Company; |
| • | to lend money and guarantee contracts or obligations of the Company and to give all kinds of indemnities; |
| • | to sell, lease, grant licences and other rights over any part of the Company; |
| • | to procure the registration of the Company outside England; |
| • | to subscribe or guarantee money to any national, charitable, benevolent, public, general or exhibition which mayfurther the objects of the Company or the interest of its members; |
| • | to grant pensions or gratuities to employees, ex-employees, officers and ex-officers; |
| • | to establish any scheme or trust which may benefit employees; |
| • | to lend money to employees to purchase Company shares; |
| • | to purchase and maintain insurance for employees and to carry on the objects of the Company in any part of theworld either as principals, agents, contractors, trustees or otherwise. |
| | |
| Other objects of Rio Tinto Limited include the powers: |
| • | to prospect for, explore, quarry, develop, excavate, dredge for, open, work, win, purchase or otherwise obtain allminerals, metals and substances; |
| • | to carry on business as proprietors of and to purchase, take on, lease or in exchange or otherwise acquire andcontrol mineral and other properties, lands and hereditaments of any tenure, mines and other rights or optionsthereon; |
| • | to raise, win, get, quarry, crush, smelt, calcine, refine, dress, amalgamate, manipulate and otherwise treat,prepare, sell and deal in ores, metals and other products of mines; |
| • | to carry on business as ship owners, railway proprietors, motor car, lorry and coach proprietors, and garageproprietors, carriers and hauliers, bankers, storekeepers, wharfingers, cartage, storage, building and generalcontractors and to buy and sell or otherwise deal in real or personal property of any kind; |
| • | to carry on business as manufacturers of and dealers in and exporters and importers of goods and merchandise ofall kinds and merchants generally; and |
| • | to guarantee the payment of premiums on any sinking fund or endowment policy or policies taken out by anycompany having objects similar to the objects of the Company. |
| | |
Directors
Under Rio Tinto plc's Articles of Association a director may not vote in respect of any proposal in which he or any other person connected with him, has any material interest other than by virtue of his interests in shares or debentures or other securities of or otherwise in or through the Company, except where resolutions: |
| (a) | indemnify him or a third party in respect of obligations incurred by the director on behalf of, or for the benefit of, the Company, or in respect of obligations of the Company, for which the director has assumed responsibility under an indemnity, security or guarantee; |
| (b) | relate to an offer of securities in which he may be interested as a holder of securities or as an underwriter; |
| (c) | concern another body corporate in which the director is beneficially interested in less than one per cent of the issued shares of any class of shares of such a body corporate; |
| (d) | relate to an employee benefit in which the director will share equally with other employees; and |
| (e) | relate to liability insurance that the Company is empowered to purchase for the benefit of directors of the Company in respect of actions undertaken as directors (or officers) of the Company. |
Under Rio Tinto Limited's Constitution, except where a director is constrained by Australian law, a director may be present at a meeting of the board while a matter in which the director has a material interest is being considered and may vote in respect of that matter.
The directors are empowered to exercise all the powers of the Companies to borrow money, to charge any property or business of the Companies or all or any of their uncalled capital and to issue debentures or give any other security for a debt, liability or obligation of the Companies or of any other person. The directors shall restrict the borrowings of Rio Tinto plc to the limitation that the aggregate amount of all moneys borrowed by the Company and its subsidiaries shall not exceed an amount equal to one and one half times the Company’s share capital plus aggregate reserves unless sanctioned by an ordinary resolution of the Company.
Directors are not required to hold any shares of either Company by way of qualification, but a director is nevertheless entitled to attend and speak at shareholders' meetings. Nevertheless, as disclosed in the Remuneration report on pages 95 to 121 the Remuneration committee has informed the executive directors that they would be expected to build up a shareholding equal in value to two times salary over five years.
Directors are required to retire in accordance with statutory age limits. Directors who we re elected or re-elected a director in the third year before each annual general meeting are required to retire by rotation and such further directors (if any) shall retire by rotation as would bring the number retiring by rotation up to one third of the number of directors in office at the date of the notice of meeting (or, if their number is not a multiple of three, the number nearest to but not greater than one third). These further directors required to retire shall be selected from the other directors subject to |
| Rio Tinto 2006Form 20-F | 140 |
Back to Contents
retirement by rotation who have been longest in office since their last re-election and where directors were re-elected on the same day then, unless they otherwise agree amongst themselves, they will be selected by the alphabetical order of their names. In addition any director appointed by the directors since the last annual general meeting is also required to retire. A retiring director shall be eligible for re-election.
In the absence of an independent quorum, the directors are not competent to vote compensation to themselves or to any members of their body.
Rights attaching to shares
Under English law, dividends on shares may only be paid out of profits available for distribution, as determined inaccordance with generally accepted accounting principles and by the relevant law. Shareholders are entitled to receive such dividends as may be declared by the directors. The directors may also pay shareholders such interim dividends as appear to them to be justified by the financial position of the Group.
Any Rio Tinto plc dividend unclaimed after 12 years from the date the dividend was declared, or became due for payment, will be forfeited and returned to the Company. Any Rio Tinto Limited dividend unclaimed may be invested orotherwise made use of by the board for the benefit of the Company until claimed or otherwise disposed of according to Australian law.
Voting rights
Voting at any general meeting of shareholders on a resolution on which the holder of the Special Voting Share is entitled to vote shall be decided by a poll, being a written vote, and any other resolution shall be decided by a show of hands unless a poll has been duly demanded. On a show of hands, every shareholder who is present in person or by proxy at a general meeting has one vote regardless of the number of shares held. On a poll, every shareholder who is present in person or by proxy has one vote for every ordinary share or share for which he or she is the holder and, in the case of Joint Decisions, the holder of the Special Voting Share has one vote for each vote cast by the public shareholders at the parallel meeting of shareholders. The voting rights attached to the Special Voting Share have been set out on pages 137 to 138. A poll may be demanded by any of the following: |
| • | the chairman of the meeting; |
| • | at least five shareholders entitled to vote at the meeting; |
| • | any shareholder or shareholders representing in the aggregate not less than one tenth (Rio Tinto plc) or onetwentieth (Rio Tinto Limited) of the total voting rights of all shareholders entitled to vote at the meeting; |
| • | any shareholder or shareholders holding shares conferring a right to vote at the meeting on which there have beenpaid-up sums in the aggregate equal to not less than one tenth of the total sum paid up on all the shares conferringthat right; or |
| • | the holder of the Special Voting Share. |
A proxy form will be treated as giving the proxy the authority to demand a poll, or to join others in demanding one.
The necessary quorum for a Rio Tinto plc general meeting is three persons and for a Rio Tinto Limited general meeting is two persons carrying a right to vote upon the business to be transacted, whether present in person or by proxy.
Matters are transacted at general meetings by the proposing and passing of resolutions, of which there are three kinds: |
| • | an ordinary resolution, which includes resolutions for the election of directors, the receiving of financialstatements, the cumulative annual payment of dividends, the appointment of auditors, the increase of authorisedshare capital or the grant of authority to allot shares; |
| • | a special resolution, which includes resolutions amending the Company’s Memorandum and Articles of Association of Rio Tinto plc or the Constitution of Rio Tinto Limited, disapplying statutory pre-emption rights orchanging the Company’s name; and |
| • | an extraordinary resolution, which includes resolutions modifying the rights of any class of the Group’s shares ata meeting of the holders of such class of shares or relating to certain matters concerning the winding up of eitherCompany. |
An ordinary resolution requires the affirmative vote of a majority of the votes of those persons voting at a meeting at which there is a quorum. Special and extraordinary resolutions require the affirmative vote of not less than three fourths of the persons voting at a meeting at which there is a quorum. In the case of an equality of votes, whether on a show of hands or on a poll, the chairman of the meeting is entitled to cast the deciding vote in addition to any other vote he may have.
The DLC Merger Sharing Agreement further classifies these three kinds of resolutions into ‘Joint Decisions’ and ‘Class Rights Actions’ as explained under voting rights on pages 137 to 138.
Annual general meetings must be convened with 21 days advance written notice for Rio Tinto plc and with 28 days for Rio Tinto Limited. Other meetings must be convened with 21 days advance written notice for the passing of a special resolution and with 14 days for any other resolution, depending on the nature of the business to be transacted. The days of delivery or receipt of the notice are not included. The notice must specify the nature of the business to be transacted. The board of directors may, if they choose, make arrangements for shareholders who are unable to attend the place of the meeting to participate at other places. |
| Rio Tinto 2006Form 20-F | 141 |
Back to Contents
Variation of Rights
If, at any time, the share capital is divided into different classes of shares, the rights attached to any class may be varied,subject to the provisions of the relevant legislation, with the consent in writing of holders of three fourths in value of the shares of that class or upon the adoption of an extraordinary resolution passed at a separate meeting of the holders of the shares of that class. At every such separate meeting, all of the provisions of the Articles of Association and Constitution relating to proceedings at a general meeting apply, except that the quorum is to be the number of persons (which must be two or more) who hold or represent by proxy not less than one third in nominal value of the issued shares of the class.
The Sharing Agreement provides for the protection of the public shareholders of both Companies and so anyvariations of rights would be dealt with as ‘Class Rights Actions’ that require the separate approval of the shareholders of both Companies.
Rights in a Winding-up
Except as the shareholders have agreed or may otherwise agree, upon a winding up, the balance of assets available for distribution: |
| • | after the payment of all creditors including certain preferential creditors, whet her statutorily preferred creditors ornormal creditors; and |
| • | subject to any special rights attaching to any class of shares; |
is to be distributed among the holders of ordinary shares according to the amounts paid-up on the shares held by them. This distribution is generally to be made in cash. A liquidator may, however, upon the adoption of an extraordinary resolution of the shareholders, divide among the shareholders the whole or any part of the assets in kind.
The DLC Merger Sharing Agreement further sets out the rights of ordinary shareholders in a liquidation as explained on page 138. |
Limitations on Voting and Shareholding
Except for the provisions of the Foreign Acquisitions and Takeovers Act 1975 which impose certain conditions on the foreign ownership of Australian companies, there are no limitations imposed by law, Rio Tinto plc's Memorandum andArticles of Association or Rio Tinto Limited's Constitution, on the rights of non residents or foreign persons to hold or vote the Group’s ordinary shares or ADSs that would not apply generally to all shareholders.
EXCHANGE CONTROLS
Rio Tinto plc
There are no UK foreign exchange controls or other restrictions on the import or export of capital or on the payment of dividends to non resident holders of Rio Tinto plc shares or that affect the conduct of Rio Tinto plc’s operations. TheBank of England, however, administers financial sanctions against specified targets related to certain regimes.
There are no restrictions under Rio Tinto plc’s memorandum and articles of association or under UK law that limit the right of non resident owners to hold or vote Rio Tinto plc shares.
Rio Tinto Limited
Under current Australian legislation, the Reserve Bank of Australia does not restrict the import and export of funds and no permission is required for the movement of funds into or out of Australia, except that restrictions apply to certainfinancial transactions relating to specified individuals and entities associated with certain regimes.
The Department of Foreign Affairs and Trade has responsibility for the administration of restrictions relating toterrorists and their sponsors, and the former Iraqi regime.
Rio Tinto Limited may be required to deduct withholding tax from foreign remittances of dividends, to the extentthat they are unfranked, and from payments of interest.
There are no restrictions under the constitution of Rio Tinto Limited that limit the right of non residents to hold or vote Rio Tinto Limited shares.
However acquisitions of interests in shares in Australian companies by foreign interests are subject to review andapproval by the Treasurer of the Commonwealth of Australia under the Foreign Acquisitions and Takeovers Act 1975 (the Takeovers Act). The Takeovers Act applies to any acquisition of 15 per cent or more of the outstanding shares of an Australian company or to any transaction that results in one non resident, or a group of associated non residents, controlling 15 per cent or more of an Australian company. The Takeovers Act also applies to any transaction which results in a group of non associated non residents controlling 40 per cent or more of an Australian company. Persons who are proposing such acquisitions or transactions are required to notify the Treasurer of their intention. The Treasurer has the power to order divestment in cases where such acquisitions or transactions have already occurred. The Takeovers Act does not affect the rights of owners whose interests are held in compliance with the legislation.
| Rio Tinto 2006Form 20-F | 142 |
Back to Contents
TAXATION
UK resident individuals shareholdings in Rio Tinto plc
Taxation of dividends
Dividends carry a tax credit equal to one ninth of the dividend. Individuals who are not liable to income tax at thehigher rate will have no further tax to pay. Higher rate tax payers are liable to tax on UK dividends at 32.5 per cent which, after taking account of the tax credit, produces a further tax liability of 25 per cent of the dividend received.
Dividend reinvestment plan (DRP)
The taxation effect of participation in the DRP will depend on individual circumstances. Shareholders will generally be liable for tax on dividends reinvested in the DRP on the same basis as if they had received the cash and arranged the investment. The dividend should, therefore, be included in the annual tax return in the normal way.
The shares acquired should be added to shareholdings at the date and at the net cost shown on the share purchase advice. The actual cost of the shares, for Rio Tinto plc shareholders including the stamp duty/stamp duty reserve tax, will form the base cost for capital gains tax purposes.
Capital gains tax
Shareholders who have any queries on capital gains tax issues are advised to consult their financial adviser. Details of relevant events since 31 March 1982 and adjusted values for Rio Tinto plc securities as at that date areavailable from the company secretary.
Australian resident individuals shareholdings in Rio Tinto Limited
Taxation of dividends
The basis of the Australian dividend imputation system is that when Australian resident shareholders receive dividends from Rio Tinto Limited, they may be entitled to a credit for the Australian tax paid by the Group in respect of thatincome, depending on the tax status of the shareholder.
The application of the system results in the Australian tax paid by the Group being allocated to shareholders byway of franking credits attaching to the dividends they receive. Such dividends are known as franked dividends. A dividend may be partly or fully franked. The current Rio Tinto Limited dividend is fully franked and the franking credits attached to the dividend are shown in the distribution statement provided to shareholders.
The extent to which a company can frank a dividend depends on the credit balance in its franking account.Credits to this account can arise in a number of ways, including when a company pays company tax or receives a franked dividend from another company. The dividend is required to be included in a resident individual shareholder’s assessable income. In addition, an amount equal to the franking credit attached to the franked dividend is also included in the assessable income of the resident individual, who may then be entitled to a rebate of tax equal to the franking credit amount included in their income. Should the franking credits exceed the tax due, the excess is refunded to the resident individual.
The effect of the dividend imputation system on non resident shareholders is that, to the extent that the dividendis franked, no Australian tax will be payable and there is an exemption from dividend withholding tax.
A withholding tax is normally levied at the rate of 15 per cent when unfranked dividends are paid to residents ofcountries with which Australia has a taxation treaty. Most Western countries have a taxation treaty with Australia. A rate of 30 per cent applies to countries where there is no taxation treaty.
Since 1988, all dividends paid by Rio Tinto Limited have been fully franked. It is the Group’s policy to pay fully franked dividends whenever possible.
Dividend reinvestment plan (DRP)
Shareholders will generally be liable for tax on dividends reinvested in the DRP on the same basis as if they hadreceived the cash and arranged the investment. The dividend should therefore be included in the annual tax return as assessable income.
The shares acquired should be added to the shareholding at the date of acquisition at the actual cost of the shares, which is the amount of the dividend applied by the shareholder to acquire shares and any incidental costs associatedwith the acquisition, including stamp duty, will form part of the cost base or reduced cost base of the shares for capital gains tax purposes.
Capital gains tax
The Australian capital gains tax legislation is complex. If shareholders have acquired shares after 19 September 1985 they may be subject to capital gains tax on the disposal of those shares.
Generally, disposal of shares held on capital account would give rise to a capital gain or loss. A capital gain arises when the proceeds on disposal are greater than the cost base of shares. A capital loss arises when the proceeds on sale are less than the cost base or reduced cost base. Where a capital gain arises on shares held for at least 12 months,
| Rio Tinto 2006Form 20-F | 143 |
Back to Contents
individual, trust and superannuation fund shareholders may be eligible for a capital gains tax discount.
Shareholders are advised to seek the advice of an independent taxation consultant on any possible capital gains tax exposure.
US residents
The following is a summary of the principal UK tax, Australian tax and US Federal income tax consequences of the ownership of Rio Tinto plc ADSs, Rio Tinto plc shares and Rio Tinto Limited shares ‘the Group’s ADSs and shares’ by a US holder as defined below. It is not intended to be a comprehensive description of all the tax considerations that are relevant to all classes of taxpayer. Future changes in legislation may affect the tax consequences of the ownership of the Group’s ADSs and shares.
It is based in part on representations by the Group’s depositary bank as Depositary for the ADRs evidencing the ADSs and assumes that each obligation in the deposit agreements will be performed in accordance with its terms.
You are a US holder if you are a beneficial owner of the Group’s ADSs and shares, you are eligible for the benefits of the relevant Convention, and you are: a citizen or resident of the United States, a domestic corporation, an estate whose income is subject to United States federal income tax regardless of its source, or a trust if a United States court can exercise primary supervision over the trust’s administration and one or more United States persons are authorized to control all substantial decisions of the trust.
This section applies to US holders only if shares or ADSs are held as capital assets for tax purposes. This section does not apply to shareholders who are members of a special class of holders subject to special rules, including a dealer in securities, a trader in securities who elects to use a mark-to-market method of accounting for securities holdings, a tax-exempt organization, a life insurance company, a person liable for alternative minimum tax, a person that actually or constructively owns ten per cent or more of Rio Tinto’s voting stock, a person that holds shares or ADSs as part of a straddle or a hedging or conversion transaction, or a US holder whose functional currency is not the US dollar.
This section is based on the Internal Revenue Code of 1986, as amended, its legislative history, existing and proposed regulations, published rulings and court decisions, and on the convention between the United States of America and United Kingdom, and the convention between the United States of America and Australia which may affect the tax consequences of the ownership of the Group’s ADSs and shares. These laws and conventions are subject to change, possibly on a retroactive basis. |
| US holders should consult their own tax adviser regarding the United States federal, state and local and foreign and other tax consequences of owning and disposing of shares and ADSs in their particular circumstances. |
For the purposes of the Conventions and of the US Internal Revenue Code of 1986, as amended, (the Code) US holders of ADSs are treated as the owners of the underlying shares. Exchanges of shares for ADSs, and ADSs for shares, generally will not be subject to US federal income tax.
The summary describes the treatment applicable under the Conventions in force at the date of this report. |
UK taxation of shareholdings in Rio Tinto plc
Taxation of dividends
US holders do not suffer deductions of UK withholding tax on dividends paid by Rio Tinto plc. Dividends carry a tax credit equal to one ninth of the net dividend, or ten per cent of the net dividend plus the tax credit. The tax credit is notrepayable to US holders.
Capital gains
A US holder will not normally be liable to UK tax on capital gains realised on the disposition of Rio Tinto plc ADSs orshares unless the holder carries on a trade, profession or vocation in the UK through a permanent establishment in the UK and the ADSs or shares have been used for the purposes of the trade, profession or vocation or are acquired, held or used for the purposes of such a permanent establishment.
Inheritance tax
Under the UK Estate Tax Treaty, a US holder, who is domiciled in the US and is not a national of the UK, will not besubject to UK inheritance tax upon the holder’s death or on a transfer during the holder’s lifetime unless the ADSs and shares form part of the business property of a permanent establishment in the UK or pertain to a fixed base situated in the UK used in the performance of independent personal services. In the exceptional case where ADSs or shares are subject both to UK inheritance tax and to US Federal gift or estate tax, the UK Estate Tax Treaty generally provides for tax payments to be relieved in accordance with the priority rules set out in the Treaty.
Stamp duty and stamp duty reserve tax
Transfers of Rio Tinto plc ADSs will not be subject to UK stamp duty provided that the transfer instrument is notexecuted in, and at all times remains outside, the UK.
Purchases of Rio Tinto plc shares are subject either to stamp duty at a rate of 50 pence per £100 or to stamp duty reserve tax (SDRT) at a rate of 0.5 per cent. Conversions of Rio Tinto plc shares into Rio Tinto plc ADSs will be subject to additional SDRT at a rate of 1.5 per cent on all transfers to the Depositary or its nominee.
| Rio Tinto 2006 Form 20-F | 144 |
Back to Contents
Australian taxation of shareholdings in Rio Tinto Limited
Taxation of dividends
US holders are not normally liable to Australian withholding tax on dividends paid by Rio Tinto Limited because suchdividends are normally fully franked under the Australian dividend imputation system, meaning that they are paid out of income that has borne Australian income tax. Any unfranked dividends would suffer Australian withholding tax which under the Australian income tax convention is limited to 15 per cent of the gross dividend.
Capital gains
US holders are not normally subject to any Australian tax on the disposal of Rio Tinto Limited ADSs or shares unlessthey have been used in carrying on a trade or business wholly or partly through a permanent establishment in Australia, or the gain is in the nature of income sourced in Australia.
Gift, estate and inheritance tax
Australia does not impose any gift, estate or inheritance taxes in relation to gifts of shares or upon the death of ashareholder.
Stamp duty
An issue or transfer of Rio Tinto Limited shares does not require the payment of Australian stamp duty.
US Federal income tax
United States Internal Revenue Service Circular 230 Notice
To ensure compliance with Internal Revenue Service Circular 230, holders are hereby notified that, any discussion of US federal tax issues contained or referred to in this report or any document referred to herein is not intended or writtento be used, and cannot be used by holders for the purpose of avoiding penalties that may be imposed on them under the United States Internal Revenue Code, such discussion is written for use in connection with the matters addressed herein, and holders should seek advice based on their particular circumstances from an independent tax adviser.
Taxation of dividends
Under the US federal income tax laws, and subject to the passive foreign investment company, or PFIC, rules discussedbelow, the gross amount of any dividend that we pay out of our current or accumulated earnings and profits (as determined for US federal income tax purposes) will generally be treated as dividend income for purposes of US Federal income tax. In the case of Rio Tinto Limited, the income will be the net dividend plus, in the event of a dividend being subject to withholding tax, the withholding tax. The dividend is taxable to you when you, in the case of shares, or the Depositary, in the case of ADSs, receive the dividend, actually or constructively.
Dividend income will not be eligible for the dividends received deduction allowed to US corporations. Distributions in excess of current accumulated earnings and profits, as determined for US federal income tax purposes, will be treated as non-taxable return of capital to the extent of your basis in the shares or ADSs and thereafter as capital gain.
Dividends paid by Qualified Foreign Corporations (QFCs) are subject to a maximum rate of income tax of 15 per cent. This maximum rate applies to taxable years beginning before
1 January 2011. Both Rio Tinto plc and Rio Tinto Limited expect to be QFCs throughout this period. To qualify for the 15 per cent maximum income tax rate on dividends the stock of the QFC must be held for more than 60 days during the 121 day period beginning on the date which is 60 days before the ex-dividend date.
Dividends will be income from sources outside the US, but dividends paid in taxable years beginning before January 1, 2007 generally will be “passive” or “financial services” income, and dividends paid in taxable years beginning after December 31, 2006 will, depending on the circumstances, be “passive” or “general” income which, in either case, is treated separately from other types of income for purposes of computing the foreign tax credit allowable to you.
Taxation of Capital Gains
Subject to the PFIC rules discussed below, if you are a US holder and you sell or otherwise dispose ofthe Group’s ADSs or shares, you will recognise capital gain or loss for US federal income tax purposes equal to the differencebetween the US dollar value of the amount that you realize and your tax basis, determined in US dollars, in your shares or ADSs. Capital gain of a non corporate US holder that is recognised in taxable years beginning before 1 January 2011 is generally taxed at a maximum rate of 15% where the holder has a holding period greater than one year. The gain or loss will generally be income or loss from sources within the United States for foreign tax credit limitation purposes.
Passive Foreign Investment Company (PFIC) Rules
We believe that the Group’s shares or ADSs should not be treated as stock of PFIC for US federal income tax purposes, but this conclusion is a factual determination that is made annually and thus may be subject to change. If we were to betreated as a PFIC, unless the shares or ADSs are “marketable stock” and a US Holder elects to be taxed annually on a mark-to-market basis with respect to the shares or ADSs, gain realized on the sale or other disposition of the shares or ADSs would in general not be treated as capital gain. Instead, if you are a US Holder, you would be treated as if you
| Rio Tinto 2006 Form 20-F | 145 |
Back to Contents
had realized such gain and certain “excess distributions” rateably over your holding period for the shares or ADSs and would be taxed at the highest tax rate in effect for each such year to which the gain was allocated, together with an interest charge in respect of the tax attributable to each such year. In addition, dividends that you receive from us will not be eligible for the special tax rates applicable to qualified dividend income if we are a PFIC either in the taxable year of the distribution or the preceding taxable year, but instead will be taxable at rates applicable to ordinary income.
DOCUMENTS ON DISPLAY
Rio Tinto plc and Rio Tinto Limited file reports and other information with the SEC. You may read without charge and copy at prescribed rates any document filed at the public reference facilities of the SEC’s principal office at 100 F Street NE, Washington, DC 20549, United States of America. Please call the SEC at 1-800-SEC-0330 for further information on the operation of the public reference facilities.
| Item 11. | Quantitative and Qualitative Disclosures about Market Risk |
The Rio Tinto Group’s policies for currency, interest rate and commodity price exposures, and the use of derivative financial instruments are discussed in the Operating and financial review on pages 76 to 81. In addition, the Group’s quantitative and qualitative disclosures about market risk are set out in Note 32 to the 2006 financial statements. The discussion regarding market risk contains certain forward looking statements and attention is drawn to the Cautionary statement on page 6.
| Item 12. | Description of Securities other than Equity Securities |
Not applicable.
| Rio Tinto 2006 Form 20-F | 146 |
Back to Contents
PART II
| Item 13. | Defaults, Dividend Arrearages and Delinquencies |
There are no defaults, dividend arrearages or delinquencies.
| Item 14. | Material Modifications to the Rights of Security Holders and Use of Proceeds |
There are no material modifications to the rights of security holders.
| Item 15. | Controls and Procedures |
Disclosure controls and procedures
The common management of each of Rio Tinto plc and Rio Tinto Limited, with the participation of their common chief executive and finance director, have evaluated the effectiveness of the design and operation of the Group’s disclosure controls and procedures as of 31 December 2006 and have concluded that these disclosure controls and procedures were effective to provide reasonable assurance that the information it is required to disclose is reported fairly as and when required.
Management’s report on internal control over financial reporting
The common management of each of Rio Tinto plc and Rio Tinto Limited is responsible for establishing andmaintaining adequate internal control over financial reporting. The Companies’ internal control over financial reporting is a process designed under the supervision of their common chief executive and finance director to provide reasonable assurance regarding the reliability of financial reporting and the preparation and fair presentation of the Group’s published financial statements for external reporting purposes in accordance with EU IFRS and the required reconciliation to US GAAP.
Because of its inherent limitations, internal control over financial reporting cannot provide absolute assurance, and may not prevent or detect all misstatements whether caused by error or fraud, if any, within each of Rio Tinto plc and Rio Tinto Limited.
The Group’s internal control over financial reporting includes policies and procedures that pertain to the maintenance of records that, in reasonable detail, accurately and fairly reflect transactions and dispositions of assets; provide reasonable assurances that transactions are recorded as necessary to permit preparation of financial statements in accordance with EU IFRS and the required reconciliation to US GAAP.
Management conducted an assessment of the effectiveness of internal control over financial reporting as of 31 December 2006, based on theInternal Control – Integrated Frameworkissued by the Committee of Sponsoring Organizations of the Treadway Commission (COSO), and concluded that it was effective.
The Group’s internal control over financial reporting includes policies and procedures that pertain to the maintenance of records that, in reasonable detail, accurately and fairly reflect transactions and dispositions of assets;provide reasonable assurances that transactions are recorded as necessary to permit preparation of financial statements in accordance with EU IFRS and the required reconciliation to US GAAP, and that receipts and expenditures are being made only in accordance with authorisation of management and the directors of the Companies; and provide reasonable assurance regarding prevention or timely detection of unauthorised acquisition, use or disposition of the Company’s assets that could have a material effect on our financial statements.
PricewaterhouseCoopers LLP and PricewaterhouseCoopers, the auditors of Rio Tinto plc and Rio Tinto Limited respectively, have audited the 2006 financial statements, and have also audited management’s assessment of the internal controls over financial reporting and the internal controls over financial reporting as of 31 December 2006 and have issued their report included herein.
Changes in internal control over financial reporting
There has been no change in Rio Tinto’s internal control over financial reporting during the year ended 31 December 2006 that has materially affected or is reasonably likely to materially affect, Rio Tinto’s internal control over financial reporting.
| Item 16A. | Audit Committee Financial Expert |
See Corporate governance on page 128 for information regarding the identification of theAudit committeefinancialexpert.
| Rio Tinto 2006 Form 20-F | 147 |
Back to Contents
The way we work, Rio Tinto’s statement of business practice, summarises the Group’s principles and policies for all directors and employees.
The way we workand the supplementary guidance documents are discussed more fully under Corporategovernance on pages 122 to 130 and in Group society and environment on pages 71 to 74. They can be viewed on Rio Tinto’s website: www.riotinto.com and will be provided to any person without charge upon written request received by one the company secretaries.
| Item 16C. | Principal Accountant Fees and Services |
The remuneration of the Group’s principal auditors including audit fees, audit related fees, tax fees and all other fees, as well as remuneration payable to other accounting firms, has been set out in note 41 to the 2006 financial statements.
Rio Tinto has adopted policies designed to uphold the independence of the Group’s principal auditors by prohibiting their engagement to provide a range of accounting and other professional services that might compromise their appointment as independent auditors. The engagement of the Group’s principal auditors to provide statutory audit services, certain other assurance services, tax services and certain limited other services are pre approved. Each engagement of the Group’s principal auditors to provide other permitted services is subject to the specific approval of theAudit committeeor its chairman.
Prior to the commencement of each financial year the Group’s Finance director and its principal auditors submitto theAudit committeea schedule of the types of services that are expected to be performed during the following yearfor its approval. TheAudit committeemay impose a US dollar limit on the total value of other permitted services that can be provided. Any non audit service provided by the Group’s principal auditors, where the expected fee exceeds apre determined level, must be subject to the Group’s normal tender procedures. However, in exceptional circumstances the Finance director is authorised to engage the Group’s principal auditors to provide such services without going to tender, but if the fees are expected to exceed $250,000 then the chairman of the audit committee must approve the engagement.
TheAudit committeehas adopted policies for the pre approval of permitted services provided by the Group’s principal auditors. Engagements for services provided by the Group’s principal auditors since the adoption of these policies were either within the pre approval policies or approved by theAudit committee.
| Item 16D. | Exemptions from the Listing Standards for Audit Committees |
Not applicable.
| Item 16E. | Purchases of Equity Securities by the Issuer and Affiliated Purchasers |
| | |
| | Rio Tinto plc | | Rio Tinto Limited | | | |
| |
| |
| | | |
| Period | (a) Total | | (b) Average | | (c) Total number | | (a) Total | | (b) Average | | (c) Total number | | (d) Approximate | |
| | number of | | price | | of shares | | number of | | price | | of shares | | dollar value of | |
| | shares | | paid per share | | purchased as part | | shares | | paid per share | | purchased as part | | shares that may | |
| | purchased | | | | of publicly | | purchased | | | | of publicly | | yet be purchased | |
| | | | | | announced plans | | | | | | announced plans | | under the plans | |
| | | | | | or programmes | | | | | | or programmes | | or programmes | |
| | | | US$ | | | | | | US$ | | | | US$m | |
| |
| 2006 | | | | | | | | | | | | | | |
| 1 Jan to 31 Jan | 1,965,000 | | 48.41 | | 1,965,000 | | 118,728 | | 53.69 | | — | | 528 | |
| 1 Feb to 28 Feb | 4,200,000 | | 48.90 | | 4,200,000 | | 403,712 | | 54.74 | | — | | 2,295 | |
| 1 Mar to 31 Mar | 3,710,000 | | 47.06 | | 3,710,000 | | 348,943 | | 52.61 | | — | | 2,120 | |
| 1 Apr to 30 Apr | 2,749,659 | | 55.92 | | 1,750,000 | | 1,229,034 | | 60.73 | | — | | 2,022 | |
| 1 May to 31 May | 4,750,000 | | 55.54 | | 4,750,000 | | 74,764 | | 63.64 | | — | | 1,758 | |
| 1 Jun to 30 Jun | 5,790,000 | | 50.39 | | 5,790,000 | | 61,233 | | 54.73 | | — | | 1,467 | |
| 1 Jul to 31 Jul | 4,325,000 | | 51.76 | | 4,325,000 | | 7,611 | | 58.38 | | — | | 1,243 | |
| 1 Aug to 31 Aug | 2,775,000 | | 52.11 | | 2,775,000 | | 24,154 | | 51.35 | | — | | 1,098 | |
| 1 Sep to 30 Sep | 7,484,059 | | 47.57 | | 7,300,000 | | 253,734 | | 55.48 | | — | | 752 | |
| 1 Oct to 31 Oct | 3,675,000 | | 48.61 | | 3,675,000 | | 55,136 | | 58.09 | | — | | 3,573 | |
| 1 Nov to 30 Nov | 4,050,000 | | 53.81 | | 4,050,000 | | 17,951 | | 62.53 | | — | | 3,355 | |
| 1 Dec to 31 Dec | 2,850,000 | | 54.26 | | 2,850,000 | | 41,832 | | 59.70 | | — | | 3,201 | |
| |
| Total | 48,323,718 | | 50.80 | | 47,140,000 | | 2,636,832 | | 57.71 | | — | | | |
| |
| Rio Tinto 2006 Form 20-F | 148 |
Back to Contents
|
|
|
|
|
|
|
|
|
|
|
|
|
| |
| 2007 | | | | | | | | | | | | | | |
| 1 Jan to 31 Jan | 5,185,000 | | 51.12 | | 5,185,000 | | 104,741 | | 57.71 | | — | | 2,935 | |
| 1 Feb to 28 Feb | 6,600,000 | | 54.45 | | 6,600,000 | | 231,101 | | 60.82 | | — | | 2,576 | |
| 1 Mar to 31 Mar | 6,250,000 | | 52.64 | | 6,250,000 | | 79,472 | | 58.37 | | — | | 2,247 | |
| 1 Apr to 30 Apr | 2,150,000 | | 60.99 | | 2,150,000 | | 554,049 | | 69.30 | | — | | 2,116 | |
| 1 May to 31 May | 2,850,000 | | 69.66 | | 2,850,000 | | 151,687 | | 77.19 | | — | | 1,917 | |
| 1 Jun to 8 Jun | 300,000 | | 73.47 | | 300,000 | | 8,223 | | 80.80 | | — | | 1,895 | |
|
|
|
|
|
|
|
|
|
|
|
|
|
| |
| | |
| Notes | |
| 1. | Rio Tinto plc ordinary shares of 10p each; Rio Tinto Limited shares. |
| 2. | The average prices paid have been translated into US dollars at the exchange rate on the day of settlement. |
| 3. | The average prices paid for shares purchased each month between 1 January 2006 and 31 May 2006 have, where applicable, been restated to include stamp duty. |
| 4. | Shares purchased by the Companies’ registrars in connection with the dividend reinvestment plans and employee share plans were not deemed to form part of any publicly announced plan or programme. |
PART III
| Item 17. | Financial Statements |
Not applicable.
| Item 18. | Financial Statements |
The 2006 financial statements of the Rio Tinto Group and the separate 2006 financial statements of Minera EscondidaLimitada (Rio Tinto: 30 per cent), which exceeded certain tests of significance under Rule 3-09 of Regulation S-X, are included as the “A” pages in this annual report on Form 20-F.
Exhibits marked “*” have been filed as exhibits to this annual report on Form 20-F and other exhibits have been incorporated by reference as indicated.
INDEX
| Exhibit | |
| Number | Description |
| | |
| 1.1* | Memorandum and Articles of Association of Rio Tinto plc (adopted by special resolution passed on 11 April 2002 and amended on 14 April 2005 and 13 April 2007) |
| 1.2* | Constitution of Rio Tinto Limited (ACN 004 458 404) (as adopted by special resolution passed on 24 May 2000 and amended by special resolution on 18 April 2002, 29 April 2005 and 27 April 2007) |
| 3.1 | DLC Merger Implementation Agreement, dated 3 November 1995 between CRA Limited and The RTZ Corporation PLC relating to the implementation of the DLC merger (incorporated by reference to Exhibit 2.1 of Rio Tinto plc's Annual report on Form 20-F for the financial year ended 31 December 1995, File No. 1-10533) |
| 3.2 | DLC Merger Sharing Agreement, dated 21 December 1995 and amended on 29 April 2005 between CRA Limited and The RTZ Corporation PLC relating to the ongoing relationship between CRA and RTZ following the DLC merger (incorporated by reference to Exhibit 4.23 of Rio Tinto plc's Annual report on Form 20-F for the financial year ended 31 December 2004, File No. 1-10533) |
| 3.3 | RTZ Shareholder Voting Agreement, dated 21 December 1995 between The RTZ Corporation PLC, RTZ Shareholder SVC Pty. Limited, CRA Limited, R.T.Z. Australian Holdings Limited and The Law Debenture Trust Corporation p.l.c. (incorporated by reference to Exhibit 2.3 of Rio Tinto plc's Annual report on Form 20-F for the financial year ended 31 December 1995, File No. 1-10533) |
| 3.4 | CRA Shareholder Voting Agreement, dated 21 December 1995 between CRA Limited, CRA Shareholder SVC Limited, The RTZ Corporation PLC and The Law Debenture Trust Corporation p.l.c., relating to the RTZ Special Voting Share (incorporated by reference to Exhibit 2.4 of Rio Tinto plc's Annual report on Form 20-F for the financial year ended 31 December 1995, File No. 1-10533) |
| Rio Tinto 2006Form 20-F | 149 |
Back to Contents
| 4.01 | Letter dated 1 January 1992 to Mr R Adams about supplementary pension arrangements (incorporated by reference to Exhibit 4.23 of Rio Tinto plc's Annual report on Form 20-F for the financial year ended 31 December 2000, File No. 1-10533) |
| 4.02 | Supplementary letter dated 1 January 1992 to Mr R Adams about pension arrangements (incorporated by reference to Exhibit 4.24 of Rio Tinto plc's Annual report on Form 20-F for the financial year ended 31 December 2000, File No. 1-10533) |
| 4.03 | Letter dated 22 November 1994 to Mr R Adams about supplementary pension arrangements (incorporated by reference to Exhibit 4.29 of Rio Tinto plc's Annual report on Form 20-F for the financial year ended 31 December 2000, File No. 1-10533) |
| 4.04 | Letter dated 20 January 1997 to Mr R Adams about directors' pension arrangements (incorporated by reference to Exhibit 4.32 of Rio Tinto plc's Annual report on Form 20-F for the financial year ended 31 December 2001, File No. 1-10533). |
| 4.05 | Service Agreement dated 15 April 2003 between Mr R Adams and Rio Tinto London Limited (incorporated by reference to Exhibit 4.30 of Rio Tinto plc's Annual report on Form 20-F for the financial year ended 31 December 2002, File No. 1-10533) |
| 4.06 | Memorandum effective 1 March 2004 to Service Agreement dated 15 April 2003 between Mr R Adams and Rio Tinto London Limited (incorporated by reference to Exhibit 4.06 of Rio Tinto plc's Annual report on Form 20-F for the financial year ended 31 December 2003, File No. 1-10533) |
| 4.07 | Service Agreement dated 12 April 2006 between Mr T Albanese and Rio Tinto London Limited (incorporated by reference to Exhibit 4.07 of Rio Tinto plc's Annual report on Form 20-F for the financial year ended 31 December 2005, File No. 1-10533) |
| 4.08 * | Memorandum effective 1 March 2007 to Service Agreement dated 12 April 2006 between Mr T Albanese and Rio Tinto London Limited |
| 4.09 | Service Agreement dated 30 March 2004 between Mr R L Clifford and Rio Tinto Limited (incorporated by reference to Exhibit 4.23 of Rio Tinto plc's Annual report on Form 20-F for the financial year ended 31 December 2004, File No. 1-10533) |
| 4.10 | Supplemental letter dated 30 March 2004 to Service Agreement dated 30 March 2004 between Mr R L Clifford and Rio Tinto Limited (incorporated by reference to Exhibit 4.23 of Rio Tinto plc's Annual report on Form 20-F for the financial year ended 31 December 2004, File No. 1-10533) |
| 4.11 | Memorandum effective 1 March 2005 to Service Agreement dated 30 March 2004 between Mr R L Clifford and Rio Tinto Limited (incorporated by reference to Exhibit 4.23 of Rio Tinto plc's Annual report on Form 20-F for the financial year ended 31 December 2004, File No. 1-10533) |
| 4.12 | Memorandum effective 1 March 2006 to Service Agreement dated 30 March 2004 between Mr R L Clifford and Rio Tinto Limited (incorporated by reference to Exhibit 4.11 of Rio Tinto plc's Annual report on Form 20-F for the financial year ended 31 December 2005, File No. 1-10533) |
| 4.13* | Memorandum effective 1 March 2007 to Service Agreement dated 30 March 2004 between Mr R L Clifford and Rio Tinto Limited |
| 4.14 | Service Agreement dated 19 June 2002 between Mr G R Elliott and Rio Tinto London Limited (incorporated by reference to Exhibit 4.31 of Rio Tinto plc's Annual report on Form 20-F for the financial year ended 31 December 2002, File No. 1-10533) |
| 4.15 | Memorandum effective 1 March 2003 to Service Agreement dated 19 June 2002 between Mr G R Elliott and Rio Tinto Limited (incorporated by reference to Exhibit 4.32 of Rio Tinto plc's Annual report on Form 20-F for the financial year ended 31 December 2002, File No. 1-10533) |
| 4.16 | Memorandum effective 1 March 2004 to Service Agreement dated 19 June 2002 between Mr G R Elliott and Rio Tinto London Limited (incorporated by reference to Exhibit 4.32 of Rio Tinto plc's Annual report on Form 20-F for the financial year ended 31 December 2002, File No. 1-10533) |
| 4.17 | Memorandum effective 1 March 2005 to Service Agreement dated 19 June 2002 between Mr G R Elliott and Rio Tinto London Limited (incorporated by reference to Exhibit 4.23 of Rio Tinto plc's Annual report on Form 20-F for the financial year ended 31 December 2004, File No. 1-10533) |
| 4.18 | Memorandum effective 1 March 2006 to Service Agreement dated 19 June 2002 between Mr G R Elliott and Rio Tinto London Limited (incorporated by reference to Exhibit 4.16 of Rio Tinto plc's Annual report on Form 20-F for the financial year ended 31 December 2005, File No. 1-10533) |
| 4.19* | Memorandum effective 1 March 2007 to Service Agreement dated 19 June 2002 between Mr G R Elliott and Rio Tinto London Limited |
| 4.20 | Mining Companies Comparative Plan (incorporated by reference to Exhibit 4.65 of Rio Tinto plc's Annual report on Form 20-F for the financial year ended 31 December 2000, File No. 1-10533) |
| 4.21 | Share Option Plan (incorporated by reference to Exhibit 4.66 of Rio Tinto plc's Annual report on Form 20-F for the financial year ended 31 December 2000, File No. 1-10533) |
| 4.22 | Medical expenses plan (incorporated by reference to Exhibit 4.67 of Rio Tinto plc's Annual report on Form 20-F for the financial year ended 31 December 2000, File No. 1-10533) |
| 4.23 | Pension plan (incorporated by reference to Exhibit 4.68 of Rio Tinto plc's Annual report on Form 20-F for the financial year ended 31 December 2000, File No. 1-10533) |
| Rio Tinto 2006Form 20-F | 150 |
Back to Contents
| Rio Tinto 2006Form 20-F | 151 |
Back to Contents
SIGNATURE
The Registrants hereby certify that they meet all of the requirements for filing on Form 20-F and that they have dulycaused and authorised the undersigned to sign this Annual Report on their behalf.
| Rio Tinto plc | | Rio Tinto Limited |
| (Registrant) | | (Registrant) |
| | | |
| | | |
| | | |
| | | |
| /s/ Anette Lawless | | /s/ Anette Lawless |
| Name:Anette Lawless | | Name:Anette Lawless |
| Title: Secretary | | Title: Assistant Secretary |
| | | |
| Date: 27 June 2007 | | Date: 27 June 2007 |
| Rio Tinto 2006Form 20-F | 152 |
Back to Contents
GLOSSARY
NON MINING DEFINITIONS
Throughout this document, the collective expressions Rio Tinto, Rio Tinto Group and Group are used for convenienceonly. Depending on the context in which they are used, they mean Rio Tinto plc and/or Rio Tinto Limited and/or one or more of the individual companies in which Rio Tinto plc and/or Rio Tinto Limited directly or indirectly owninvestments, all of which are separate and distinct legal entities.
Unless the context indicates otherwise, the following terms have the meanings shown below:
| Adjusted earnings | | An additional measure of earnings reported by Rio Tinto with its UK GAAP results which excludes exceptional items of such magnitude that their exclusion is necessary to reflect the underlying performance of the Group. |
| ADR | | American Depositary Receipt evidencing American Depositary Shares (ADS). |
| Australian dollars | | Australian currency. Abbreviates to A$. |
| Australian GAAP | | Generally accepted accounting principles in Australia. |
| A IFRS | | International Financial Reporting Standards as adopted in Australia. |
| Billion | | One thousand million. |
| Canadian dollars | | Canadian currency. Abbreviates to C$. |
| Company / Companies | | Rio Tinto plc and/or Rio Tinto Limited, as the context so requires. |
| DLC merger | | Dual listed companies merger (1995) |
EU IFRS | | International Financial Reporting Standards as adopted by the European Union. |
IFRS | | International Financial Reporting Standards. |
LBMA | | London Bullion Market Association. |
LME | | London Metal Exchange. |
| New Zealand dollars | | New Zealand currency. Abbreviates to NZ$. |
| Pounds sterling | | UK currency. Abbreviates to £, pence or p. |
| Public shareholders | | The holders of Rio Tinto plc shares that are not companies in the Rio Tinto Limited Group and the holders of Rio Tinto Limited shares that are not companies in the Rio Tinto plc Group. |
| Rand | | South African currency. Abbreviates to R. |
| Rio Tinto Limited | | Rio Tinto Limited, and, where the context permits, its subsidiaries and associated companies. |
| Rio Tinto Limited shareholders | | The holders of Rio Tinto Limited shares. |
| Rio Tinto Limited | | The agreement, dated 21 December 1995, between Rio Tinto plc, Rio Tinto Limited, RTL |
| Shareholder Voting Agreement | | Shareholder SVC Limited and the Law Debenture Trust Corporation p.l.c. relating to the voting rights of the Rio Tinto plc Special Voting Share at meetings of shareholders of Rio Tinto plc. |
| Rio Tinto Limited shares | | The ordinary shares in Rio Tinto Limited. |
Rio Tinto Limited /
RTL DLC Dividend Share | | The DLC Dividend Share in Rio Tinto Limited. |
Rio Tinto Limited /
RTL Special Voting Share | | The Special Voting Share in Rio Tinto Limited. |
| Rio Tinto plc | | Rio Tinto plc and its subsidiaries and associated companies. |
| Rio Tinto plc ADS | | An American Depositary Share representing the right to receive four Rio Tinto plc ordinary shares. |
| Rio Tinto plc Group | | Rio Tinto plc and its subsidiaries and associated companies. |
| Rio Tinto plc ordinary shares | | The ordinary shares of 10p each in Rio Tinto plc. |
| Rio Tinto plc shareholders | | The holders of Rio Tinto plc shares. |
| Rio Tinto Shareholder Voting Agreement | | The agreement, dated 21 December 1995, between Rio Tinto plc, Rio Tinto AustralianHoldings Limited, RTP Shareholder SVC Pty Limited, Rio Tinto Limited and the Law Debenture Trust Corporation p.l.c. relating to the voting rights of the Rio Tinto Limited shares held by the Rio Tinto plc group and the Rio Tinto Limited Special Voting Share at meetings of Rio Tinto Limited shareholders. |
| Rio Tinto plc shares | | Rio Tinto plc ordinary shares. |
| Rio Tinto plc / RTP | | The Special Voting Share of 10p in Rio Tinto plc. |
| Rio Tinto 2006Form 20-F | 153 |
Back to Contents
| Special Voting Share | | |
| Share / shares | | Rio Tinto Limited shares or Rio Tinto plc ordinary shares, as the context requires. |
| Sharing Agreement | | The agreement, dated 21 December 1995, as amended between Rio Tinto Limited and Rio Tinto plc relating to the regulation of the relationship between Rio Tinto Limited and Rio Tinto plc following the DLC merger. |
| UK GAAP | | Generally accepted accounting principles in the UK. |
| Underlying earnings | | An additional measure of earnings reported by Rio Tinto with its EU IFRS results to provide greater understanding of the underlying business performance of its operations. This measure is explained in greater detail in the financial statements. |
| US dollars | | United States currency. Abbreviates to dollars, $ or US$ and US cents or USc. |
| US GAAP | | Generally accepted accounting principles in the United States. |
MINING AND TECHNICAL DEFINITIONS
| Alumina | | Aluminium oxide. It is extracted from bauxite in a chemical refining process and is subsequently the principal raw material in the electro-chemical process by which aluminium is produced. |
| Anode and cathode copper | | At the final stage of the smelting of copper concentrates, the copper is cast into specially shaped slabs called anodes for subsequent refining to produce refined cathode copper. |
| Bauxite | | Mainly hydrated aluminium oxides (Al2O3.2H2O). Principal ore of alumina, the raw material from which aluminium is made. |
| Beneficiated bauxite | | Bauxite ore that has been treated to remove waste material to improve its physical or chemical characteristics. |
| Bioleaching | | The deliberate use of bacteria to speed the chemical release of metals from ores. |
| Block caving | | An underground bulk mining method. It involves undercutting the orebody to induce ore fracture and collapse by gravity. The broken ore is recovered through draw points below. |
| Borates | | A generic term for mineral compounds which contain boron and oxygen. |
| Cathode copper | | Refined copper produced by electrolytic refining of impure copper or by electro-winning. |
| Classification | | Separating crushed and ground ore into portions of different size particles. |
| Coking coal | | By virtue of its carbonisation properties, it is used in the manufacture of coke, which is used in the steel making process. Also known as metallurgical coal. |
| Concentrate | | The product of a physical concentration process, such as flotation or gravity concentration, which involves separating ore minerals from unwanted waste rock. Concentrates require subsequent processing (such as smelting or leaching) to break down or dissolve the ore minerals and obtain the desired elements, usually metals. |
| Cutoff grade | | The lowest grade of mineralised material considered economic to process. It is used in the calculation of the quantity of ore present in a given deposit. |
| Doré | | A precious metal alloy which is produced by smelting. Doré is an intermediate product which is subsequently refined to produce pure gold and silver. |
| DWT | | Dead weight tons is the combined weight in long tons (2,240 pounds weight) of cargo, fuel and fresh water that a ship can carry. |
| Flotation | | A method of separating finely ground minerals using a froth created in water by specific reagents. In the flotation process certain mineral particles are induced to float by becoming attached to bubbles of froth whereas others, usually unwanted, sink. |
| FOB | | Free on board. |
| Grade | | The proportion of metal or mineral present in ore, or any other host material, expressed in this document as per cent, grammes per tonne or ounces per ton. |
| Head grade | | The average grade of ore delivered to the mill. |
| Ilmenite | | Mineral composed of iron, titanium and oxygen. |
| Metallurgical coal | | By virtue of its carbonisation properties, it is used in the manufacture of coke, which is used in the steel making process. Also known as coking coal. |
| Ore | | A rock from which a metal(s) or mineral(s) can be economic ally and legally extracted. |
| Ore milled | | The quantity of ore processed. |
| Ore hoisted | | The quantity of ore which is removed from an underground mine for processing. |
| Pressure oxidation | | A method of treating sulphide ores. In the case of refractory gold ores, the object is to oxidise the sulphides to sulphates and hence liberate the gold for subsequent cyanide leaching. The technique involves reaction of the ore with sulphuric acid under pressure in the presence of oxygen gas. |
| Rio Tinto 2006 Form 20-F | 154 |
Back to Contents
| Probable ore reserves | | Reserves for which quantity and grade and/or quality are computed from information similar to that used for proven reserves, but the sites for inspection, sampling and measurement are farther apart or are otherwise less adequately spaced. The degree of assurance, although lower than that for proven reserves, is high enough to assume continuity between points of observation. |
| Proven ore reserves | | Reserves for which (a) quantity is computed from dimensions revealed in outcrops, trenches, workings or drill holes; grade and/or quality are computed from the results of detailed sampling and (b) the sites for inspection, sampling and measurement are spaced so closely and the geologic character is so well defined that size, shape, depth and mineral content of reserves are well established. |
| Rock mined | | The quantity of ore and waste rock excavated from the mine. In this document, the term is only applied to surface mining operations. |
| Rutile | | A mineral composed of titanium and oxygen (TiO2). |
| Steam coal | | Also referred to as steaming coal, thermal coal or energy coal. It is used as a fuel source in electrical power generation, cement manufacture and various industrial applications. |
| Stripping ratio | | The tonnes of waste material which must be removed to allow the mining of one tonne of ore. |
| Solvent extraction and electrowinning (SX-EW) | | Processes for extracting metal from an ore and producing pure metal. First the metal is leached into solution; the resulting solution is then purified in the solvent extraction process; the solution is then treated in an electro-chemical process (electro-winning) to recover cathode copper. |
| Tailings | | The rock wastes which are rejected from a concentrating process after the recoverable valuable minerals have been extracted. |
| Titanium dioxide feedstock | | A feedstock rich in titanium dioxide, produced, in Rio Tinto’s case, by smelting ores containing titanium minerals. |
| Zircon | | Zirconium mineral (ZrSiO4). |
| | | |
| CONVERSION OF WEIGHTS AND MEASURES |
| | | |
| | | 1 troy ounce = 31.1 grams |
| | | 1 kilogram = 32.15 troy ounces |
| | | 1 kilogram = 2.2046 pounds |
| | | 1 metric tonne = 1,000 kilograms |
| | | 1 metric tonne = 2,204.6 pounds |
| | | 1 metric tonne = 1.1023 short tons |
| | | 1 short ton = 2,000 pounds |
| | | 1 long ton = 2,240 pounds |
| | | 1 gram per metric tonne = 0.02917 troy ounces per short ton |
| | | 1 gram per metric tonne = 0.03215 troy ounces per metric tonne |
| | | 1 kilometre = 0.6214 miles |
EXCHANGE RATES
The following table shows, for the periods and dates indicated, certain information regarding the exchange rates for the pound sterling and the Australian dollar, based on the Noon Buying Rates for pounds sterling and Australian dollars expressed in US dollars per £1.00 and per A$1.00.
| Pounds sterling | | | | | | | | | | Australian dollars | | | | | | | | | |
| Year ended 31 December | | Period | | Average | | High | | Low | | Year ended 31 December | | Period | | Average | | High | | Low | |
| | | end | | rate | | | | | | | | end | | rate | | | | | |
|
|
|
|
|
|
|
|
|
|
|
|
|
|
|
|
|
|
| |
| 2006 | | 1.96 | | 1.84 | | 1.98 | | 1.72 | | 2006 | | 0.788 | | 0.753 | | 0.791 | | 0.706 | |
| 2005 | | 1.73 | | 1.82 | | 1.93 | | 1.71 | | 2005 | | 0.734 | | 0.763 | | 0.799 | | 0.727 | |
| 2004 | | 1.93 | | 1.83 | | 1.95 | | 1.76 | | 2004 | | 0.783 | | 0.737 | | 0.798 | | 0.686 | |
| 2003 | | 1.78 | | 1.63 | | 1.79 | | 1.55 | | 2003 | | 0.749 | | 0.648 | | 0.752 | | 0.562 | |
| 2002 | | 1.61 | | 1.50 | | 1.41 | | 1.61 | | 2002 | | 0.563 | | 0.544 | | 0.575 | | 0.506 | |
|
|
|
|
|
|
|
|
|
|
|
|
|
|
|
|
|
|
| |
| | | | | | | | | | | | | | | | | | | | |
| Note |
| The Noon Buying Rate on such dates differed slightly from the rates used in the preparation of Rio Tinto’s financial statements as of such date. No representation is made that pound sterling and Australian dollar amounts have been, could have been or could be converted into dollars at the Noon Buying Rate on such dates or at any other dates. |
| Rio Tinto 2006 Form 20-F | 155 |
2006 Financial statements
CONTENTS
A-1
Back to Contents
Group income statement
Years ended 31 December
| | | 2006 | | 2005 | | 2004 | |
| | | US$m | | US$m | | US$m | |
|
|
|
|
|
|
| |
| Consolidated sales revenue | | 22,465 | | 19,033 | | 12,954 | |
| Net operating costs (excluding impairment reversals less charges) | 3 | (13,892 | ) | (12,436 | ) | (10,249 | ) |
| Impairment reversals less charges | 5 | 396 | | 3 | | (558 | ) |
| Profits less losses on disposal of interests in businesses | 39 | 5 | | 322 | | 1,180 | |
|
|
|
|
|
|
| |
| Operating profit | | 8,974 | | 6,922 | | 3,327 | |
| Share of profit after tax of equity accounted units | 6 | 1,378 | | 776 | | 523 | |
|
|
|
|
|
|
| |
| Profit before finance items and taxation | | 10,352 | | 7,698 | | 3,850 | |
| | | | | | | | |
| Finance items | | | | | | | |
| Exchange gains/(losses) on external net debt and intragroup balances | 23 | 46 | | (128 | ) | 204 | |
| Gains/(losses) on currency and interest rate derivatives not qualifying for hedge accounting | | 35 | | (51 | ) | 16 | |
| Interest receivable and similar income | 7 | 106 | | 82 | | 28 | |
| Interest payable and similar charges | 7 | (160 | ) | (173 | ) | (148 | ) |
| Amortisation of discount related to provisions | | (139 | ) | (116 | ) | (87 | ) |
|
|
|
|
|
|
| |
| | | (112 | ) | (386 | ) | 13 | |
|
|
|
|
|
|
| |
| Profit before taxation | | 10,240 | | 7,312 | | 3,863 | |
| | | | | | | | |
| Taxation | 8 | (2,373 | ) | (1,814 | ) | (619 | ) |
|
|
|
|
|
|
| |
| Profit for the year | | 7,867 | | 5,498 | | 3,244 | |
|
|
|
|
|
|
| |
| – attributable to outside equity shareholders | | 429 | | 283 | | (53 | ) |
| – attributable to equity shareholders of Rio Tinto (Net earnings) | | 7,438 | | 5,215 | | 3,297 | |
|
|
|
|
|
|
| |
| Basic earnings per ordinary share | 9 | 557.8 | c | 382.3 | c | 239.1 | c |
| Diluted earnings per ordinary share | 9 | 555.6 | c | 381.1 | c | 238.7 | c |
| | | | | | | | |
| Dividends paid during the year (US$m) | | 2,573 | | 1,141 | | 910 | |
| Dividends per share: paid during the year | | | | | | | |
| –ordinary dividend | 10 | 81.5 | c | 83.5 | c | 66.0 | c |
| – special dividend | 10 | 110.0 | c | — | | — | |
| Dividends per share: declared in the announcement of the results for the year | | | | | | | |
| – ordinary dividend | 10 | 64.0 | c | 41.5 | c | 45.0 | c |
| – special dividend | 10 | — | | 110.0 | c | — | |
|
|
|
|
|
|
| |
The notes on pages A-7 to A-68 form part of these accounts. Material variations from accounting principles generally accepted in the United States are set out on pages A-69 A-86.
A-2
Back to Contents
Group cash flow statement
Years ended 31 December
| | | 2006 | | 2005 | | 2004 | |
| | | US$m | | US$m | | US$m | |
|
|
|
|
|
|
| |
| Cash flow from consolidated operations | | 9,196 | | 7,431 | | 3,787 | |
| Dividends from equity accounted units | | 1,727 | | 600 | | 478 | |
|
|
|
|
|
|
| |
| Cash flow from operations | | 10,923 | | 8,031 | | 4,265 | |
| Net interest paid | | (128 | ) | (128 | ) | (151 | ) |
| Dividends paid to outside shareholders | | (193 | ) | (169 | ) | (56 | ) |
| Tax paid | | (2,799 | ) | (1,017 | ) | (865 | ) |
|
|
|
|
|
|
| |
| Cash flow from operating activities | | 7,803 | | 6,717 | | 3,193 | |
| | | | | | | | |
| Cash used in investing activities | | | | | | | |
| (Acquisitions) / disposals of subsidiaries, joint ventures and associates | 39 | (279 | ) | 321 | | 1,507 | |
| Purchase of property, plant and equipment and intangible assets | | (3,992 | ) | (2,590 | ) | (2,259 | ) |
| Sales of other financial assets | | 293 | | 133 | | 261 | |
| Purchases of other financial assets | | (167 | ) | (231 | ) | (30 | ) |
| Other investing cash flows | | 56 | | 110 | | 127 | |
|
|
|
|
|
|
| |
| Cash used in investing activities | | (4,089 | ) | (2,257 | ) | (394 | ) |
| | | | | | | | |
| Cash flow before financing activities | | 3,714 | | 4,460 | | 2,799 | |
| | | | | | | | |
| Cash flow from financing activities | | | | | | | |
| Equity dividends paid to Rio Tinto shareholders | | (2,573 | ) | (1,141 | ) | (906 | ) |
| Own shares purchased from Rio Tinto shareholders | | (2,370 | ) | (877 | ) | — | |
| Proceeds from issue of ordinary shares in Rio Tinto | | 31 | | 100 | | 26 | |
| Proceeds from issue of new borrowings | | 483 | | 388 | | 206 | |
| Repayment of borrowings | | (1,102 | ) | (893 | ) | (2,061 | ) |
| Other financing cash flows | | 142 | | 12 | | 30 | |
|
|
|
|
|
|
| |
| Cash used in financing activities | | (5,389 | ) | (2,411 | ) | (2,705 | ) |
|
|
|
|
|
|
| |
| Effects of exchange rates on cash and cash equivalents | | 30 | | (8 | ) | (9 | ) |
|
|
|
|
|
|
| |
| Net (decrease)/increase in cash and cash equivalents | | (1,645 | ) | 2,041 | | 85 | |
|
|
|
|
|
|
| |
| Opening cash and cash equivalents | | 2,367 | | 326 | | 241 | |
|
|
|
|
|
|
| |
| Closing cash and cash equivalents | 20 | 722 | | 2,367 | | 326 | |
|
|
|
|
|
|
| |
| | | | | | | | |
| Cash flow from consolidated operations | | | | | | | |
| Profit for the year | | 7,867 | | 5,498 | | 3,244 | |
| Adjustments for: | | | | | | | |
| Taxation | | 2,373 | | 1,814 | | 619 | |
| Finance items | | 112 | | 386 | | (13 | ) |
| Share of profit after tax of equity accounted units | | (1,378 | ) | (776 | ) | (523 | ) |
| Profit on disposal of interests in businesses (including investments) | | (5 | ) | (322 | ) | (1,180 | ) |
| Depreciation and amortisation | | 1,469 | | 1,334 | | 1,171 | |
| Impairment (reversals) less charges | 5 | (396 | ) | (3 | ) | 558 | |
| Provisions | 26 | 60 | | 202 | | 192 | |
| Utilisation of provisions | 26 | (271 | ) | (261 | ) | (220 | ) |
| Change in inventories | | (454 | ) | (249 | ) | (217 | ) |
| Change in trade and other receivables | | (394 | ) | (530 | ) | (97 | ) |
| Change in trade and other payables | | 116 | | 303 | | 237 | |
| Other items | | 97 | | 35 | | 16 | |
|
|
|
|
|
|
| |
| | | 9,196 | | 7,431 | | 3,787 | |
|
|
|
|
|
|
| |
The notes on pages A-7 to A-68 form part of these accounts. Material variations from accounting principles generally accepted in the United States are set out on pages A-69 A-86.
A-3
Back to Contents
Group balance sheet
At 31 December
| | | 2006 | | 2005 | |
| | | US$m | | US$m | |
|
|
|
|
| |
| Non-current assets | | | | | |
| Goodwill | 11 | 841 | | 1,020 | |
| Intangible assets | 12 | 384 | | 220 | |
| Property, plant and equipment | 13 | 22,207 | | 17,620 | |
| Investments in equity accounted units | 14 | 2,235 | | 1,829 | |
| Loans to equity accounted units | | 136 | | 159 | |
| Inventories | 16 | 99 | | 141 | |
| Trade and other receivables | 17 | 983 | | 703 | |
| Deferred tax assets | 18 | 225 | | 55 | |
| Tax recoverable | | 135 | | 122 | |
| Other financial assets | 19 | 374 | | 453 | |
|
|
|
|
| |
| | | 27,619 | | 22,322 | |
| Current assets | | | | | |
| Inventories | 16 | 2,540 | | 2,048 | |
| Trade and other receivables | 17 | 2,938 | | 2,488 | |
| Loans to equity accounted units | | 15 | | — | |
| Tax recoverable | | 79 | | 30 | |
| Other financial assets | 19 | 567 | | 536 | |
| Cash and cash equivalents | 20 | 736 | | 2,379 | |
|
|
|
|
| |
| | | 6,875 | | 7,481 | |
| Current liabilities | | | | | |
| Bank overdrafts repayable on demand | 20 | (14 | ) | (12 | ) |
| Borrowings | 21 | (1,490 | ) | (1,190 | ) |
| Trade and other payables | 24 | (2,693 | ) | (2,190 | ) |
| Other financial liabilities | 25 | (193 | ) | (86 | ) |
| Tax payable | | (1,024 | ) | (987 | ) |
| Provisions | 26 | (366 | ) | (321 | ) |
|
|
|
|
| |
| | | (5,780 | ) | (4,786 | ) |
|
|
|
|
| |
| Net current assets | | 1,095 | | 2,695 | |
|
|
|
|
| |
| Non-current liabilities | | | | | |
| Borrowings | 21 | (2,007 | ) | (2,783 | ) |
| Trade and other payables | 24 | (362 | ) | (269 | ) |
| Other financial liabilities | 25 | (233 | ) | (113 | ) |
| Tax payable | | (86 | ) | (51 | ) |
| Deferred tax liabilities | 18 | (2,339 | ) | (2,197 | ) |
| Provisions | 26 | (4,302 | ) | (3,865 | ) |
|
|
|
|
| |
| | | (9,329 | ) | (9,278 | ) |
|
|
|
|
| |
| Net assets | | 19,385 | | 15,739 | |
|
|
|
|
| |
| Capital and reserves | | | | | |
| Share capital | | | | | |
| – Rio Tinto plc | 27 | 172 | | 172 | |
| – Rio Tinto Limited (excl. Rio Tinto plc interest) | 28 | 1,099 | | 1,019 | |
| Share premium account | 29 | 1,919 | | 1,888 | |
| Other reserves | 29 | 641 | | (24 | ) |
| Retained earnings | 29 | 14,401 | | 11,893 | |
|
|
|
|
| |
| Equity attributable to Rio Tinto shareholders | 29 | 18,232 | | 14,948 | |
| Attributable to outside equity shareholders | 29 | 1,153 | | 791 | |
|
|
|
|
| |
| Total equity | | 19,385 | | 15,739 | |
|
|
|
|
| |
The notes on pages A-7 to A-68 form part of these accounts. Material variations from accounting principles generally accepted in the United States are set out on pages A-69 A-86.
A-4
Back to Contents
Group statement of recognised income and expense (SORIE)
| | Attributable | | Outside | | Year to 31 | |
| | to | | Interests | | December | |
| | shareholders | | | | 2006 | |
| | of Rio Tinto | | | | Total | |
| | US$m | | US$m | | US$m | |
|
|
|
|
|
| |
| Currency translation adjustment | 820 | | 42 | | 862 | |
| Cash flow hedge fair value (losses) | (178 | ) | (200 | ) | (378 | ) |
| Gains on available for sale securities | 14 | | 5 | | 19 | |
| Cash flow hedge losses transferred to the income statement | 63 | | 74 | | 137 | |
| Gains on available for sale securities transferred to the income statement | (4 | ) | — | | (4 | ) |
| Currency translation transferred to the income statement on disposals | 4 | | — | | 4 | |
| Actuarial gains on post retirement benefit plans | 338 | | 35 | | 373 | |
| Net tax recognised directly in equity | 19 | | 83 | | 102 | |
|
|
|
|
|
| |
| Net income recognised directly in equity | 1,076 | | 39 | | 1,115 | |
| | | | | | | |
| Profit after tax for the year | 7,438 | | 429 | | 7,867 | |
|
|
|
|
|
| |
| Total recognised income for the year | 8,514 | | 468 | | 8,982 | |
|
|
|
|
|
| |
| | Attributable | | Outside | | Year to 31 | |
| | to | | Interests | | December | |
| | shareholders | | | | 2005 | |
| | of Rio Tinto | | | | Total | |
| | US$m | | US$m | | US$m | |
|
|
|
|
|
| |
| Currency translation adjustment | (401 | ) | (44 | ) | (445 | ) |
| Cash flow hedge fair value (losses) | (116 | ) | (26 | ) | (142 | ) |
| Gains on available for sale securities | 32 | | 5 | | 37 | |
| Cash flow hedge losses transferred to the income statement | — | | 1 | | 1 | |
| Gains on available for sale securities transferred to the income statement | (88 | ) | — | | (88 | ) |
| Actuarial gains/(losses) on post retirement benefit plans | 179 | | (1 | ) | 178 | |
| Net tax recognised directly in equity | 56 | | 1 | | 57 | |
|
|
|
|
|
| |
| Net expense recognised directly in equity | (338 | ) | (64 | ) | (402 | ) |
| | | | | | | |
| Profit after tax for the year | 5,215 | | 283 | | 5,498 | |
|
|
|
|
|
| |
| Total recognised income for the year | 4,877 | | 219 | | 5,096 | |
|
|
|
|
|
| |
| | Attributable | | Outside | | Year to 31 | |
| | to | | Interests | | December | |
| | shareholders | | | | 2004 | |
| | of Rio Tinto | | | | Total | |
| | US$m | | US$m | | US$m | |
|
|
|
|
|
| |
| Currency translation adjustment | 365 | | 45 | | 410 | |
| Actuarial losses on post retirement benefit plans | (180 | ) | (23 | ) | (203 | ) |
| Net tax recognised directly in equity | 50 | | (2 | ) | 48 | |
|
|
|
|
|
| |
| Net income recognised directly in equity | 235 | | 20 | | 255 | |
| | | | | | | |
| Profit / (loss) after tax for the year | 3,297 | | (53 | ) | 3,244 | |
|
|
|
|
|
| |
| Total recognised income / (loss) for the year | 3,532 | | (33 | ) | 3,499 | |
|
|
|
|
|
| |
Reconciliation with Australian IFRS
The Group’s financial statements have been prepared in accordance with IFRS as adopted by the European Union ('EU IFRS') which differs in certain respects from the version of IFRS that is applicable in Australia ('Australian IFRS').
Prior to 1 January 2004, the Group's financial statements were prepared in accordance with UK GAAP. Under EU IFRS, goodwill on acquisitions prior to 1998, which was eliminated directly against equity in the Group's UK GAAP financial statements, has not been reinstated. This was permitted under the rules governing the transition to EU IFRS set out in IFRS 1. The equivalent Australian Standard, AASB 1, does not provide for the netting of goodwill against equity. As a consequence, shareholders' funds under Australian IFRS include the residue of such goodwill, which amounted to US$740 million at 31 December 2006 (US$743 million at 31 December 2005).
Save for the exception described above, the Group's financial statements drawn up in accordance with EU IFRS are consistent with the requirements of Australian IFRS.
The notes on pages A-7 to A-68 form part of these accounts. Material variations from accounting principles generally accepted in the United States are set out on pages A-69 A-86.
A-5
Back to Contents
Outline of dual listed companies structure and basis of financial statements
The Rio Tinto Group
These are the financial statements of the Rio Tinto Group (the 'Group'), formed through the merger of economic interests ('merger') of Rio Tinto plc and Rio Tinto Limited, and presented by both Rio Tinto plc and Rio Tinto Limited as their consolidated accounts in accordance with both United Kingdom and Australian legislation and regulations.
Merger terms
On 21 December 1995, Rio Tinto plc and Rio Tinto Limited, which are listed respectively on Stock Exchanges in the United Kingdom and Australia, entered into a dual listed companies ('DLC') merger. This was effected by contractual arrangements between the companies and amendments to Rio Tinto plc's Memorandum and Articles of Association and Rio Tinto Limited's constitution. |
| As a result, Rio Tinto plc and Rio Tinto Limited and their respective groups operate together as a single economic enterprise, with neither assuming a dominant role. In particular, the arrangements: |
| – | confer upon the shareholders of Rio Tinto plc and Rio Tinto Limited a common economic interest in both groups; |
| – | provide for common boards of directors and a unified management structure; |
| – | provide for equalised dividends and capital distributions; and |
| – | provide for the shareholders of Rio Tinto plc and Rio Tinto Limited to take key decisions, including the election of directors, through an electoral procedure in which the public shareholders of the two companies effectively vote on a joint basis. |
| The merger involved no change in the legal ownership of any assets of Rio Tinto plc or Rio Tinto Limited, nor any change in the ownership of any existing shares or securities of Rio Tinto plc or Rio Tinto Limited, nor the issue of any shares, securities or payment by way of consideration, save for the issue by each company of one special voting share to a trustee company which provides the joint electoral procedure for public shareholders. During 2002, each of the parent companies issued a DLC Dividend Share to facilitate the efficient management of funds within the DLC structure. |
Accounting standards
The financial statements have been drawn up in accordance with International Financial Reporting Standards as adopted by the European Union ('EU IFRS'). The merger of economic interests of Rio Tinto plc and Rio Tinto Limited was accounted for as a merger under UK GAAP. As permitted under the rules governing the transition to EU IFRS, which are set out in IFRS 1, the Group did not restate business combinations that occurred before the transition date of 1 January 2004. As a result, the DLC merger of economic interests described above continues to be accounted for as a merger under EU IFRS.
The main consequence of adopting merger rather than acquisition accounting is that the balance sheet of the merged group includes the assets and liabilities of Rio Tinto plc and Rio Tinto Limited at their carrying values prior to the merger, subject to adjustments to achieve uniformity of accounting policies, rather than at their fair values at the date of the merger. For accounting purposes Rio Tinto plc and Rio Tinto Limited are viewed as a single public parent company (with their respective public shareholders being the shareholders in that single company). As a result the amounts attributable to both Rio Tinto plc and Rio Tinto Limited public shareholders are included in the amounts attributed to equity shareholders on the balance sheet, income statement and statement of recognised income and expense.
Australian Corporations Act
The financial statements are drawn up in accordance with an order, under section 340 of the Australian Corporations Act 2001, issued by the Australian Securities and Investments Commission ('ASIC') on 27 January 2006 (as amended on 22 December 2006). The main provisions of the order are that the financial statements are: |
| – | to be made out in accordance with IFRS as adopted by the European Union ('EU IFRS'); and |
| – | to include a reconciliation from EU IFRS to the Australian equivalents of IFRS (see page A-5). |
| For further details of the ASIC Class Order relief see page A-87. |
Elimination of Separate financial statements
In previous years, the Form 20-F filed with the United States Securities and Exchange Commission ('SEC'), contained separate consolidated financial statements for the Rio Tinto plc and Rio Tinto Limited parts of the Group. These were presented on the basis of the legal ownership of the various operations within each part of the Group. The separate financial statements for Rio Tinto Limited included, on a consolidated basis, the Group undertakings under its legal ownership, and those for Rio Tinto plc included, on a consolidated basis, the Group undertakings under its legal ownership. This presentation of financial information filed with the SEC was on the assumption that the formation of the Group through the dual listed companies (DLC) arrangements was not a business combination. The financial statements filed with the SEC also included supplemental financial information that combined the consolidated financial statements of the Rio Tinto plc and Rio Tinto Limited parts of the Group to present the Rio Tinto Group, with no adjustment for fair values.
This combined financial information for the Rio Tinto Group was consistent with the financial statements that were used for the purposes of satisfying the Group's reporting obligations in the United Kingdom and Australia. The combined financial statements for the Rio Tinto Group viewed the formation of the DLC as a business combination and accounted for the transaction as a merger in accordance with UK Financial Reporting Standard No. 6 Acquisitions and Mergers ('FRS 6'). Applying FRS 6, Rio Tinto plc and Rio Tinto Limited were combined and presented as one economic entity with no adjustment for fair values.
As permitted under the transitional arrangements set out in IFRS 1 'First time adoption of International Financial Reporting Standards', which sets out the rules for first time adoption of IFRS, the Group did not apply the concepts of IFRS 3 'Business Combinations' for business combinations prior to the first time application of IFRS. Accordingly, the Group is following the same method of accounting for the DLC in its financial statements under IFRS as was historically followed under UK GAAP: the Group is presented as one economic entity at historical cost.
Subsequent to the formation of the Group, the accounting model used in filings with the SEC for the presentation of financial statements of companies that form DLCs has changed. The formation of a new DLC is now viewed as a business combination. The Group now believes that it is preferable to treat the formation of the DLC as a business combination, and as a result, that the accounting and reporting of financial statements prepared in accordance with IFRS to the SEC will be consistent with the accounting and reporting in the United Kingdom and Australia.
Accordingly, the Group has revised the presentation of its financial statements included in Form 20-F to account for the formation of the DLC as a business combination. As a consequence, separate financial statements for Rio Tinto plc and Rio Tinto Limited will no longer be presented. Instead, the financial statements will deal with the Rio Tinto Group as one combined economic entity. This new presentation is applied retrospectively for all periods presented. The IFRS information presented on this new basis in the 20-F is the same as the combined supplemental information for the Rio Tinto Group that was previously disclosed.
A-6
Back to Contents
Notes to the 2006 financial statements
| 1 | PRINCIPAL ACCOUNTING POLICIES |
The basis of preparation and accounting policies used in preparing the financial statements for the year ended 31 December 2006 are set out below.
The financial statements are prepared in accordance with International Financial Reporting Standards adopted by the EU ('EU IFRS'). These standards are subject to Interpretations issued from time to time by the International Financial Reporting Interpretations Committee (‘IFRIC’).
| Basis of preparation |
| The financial statements for the year ended 31 December 2006 have been prepared on the basis of all IFRSs and Interpretations adopted by the European Union that are mandatory for periods ending 31 December 2006 and in accordance with applicable United Kingdom law, applicable Australian law as amended by the Australian Securities and Investments Commission Orde dated 27 January 2006 (as amended on 22 December 2006) and Article 4 of the European Union IAS regulation. The 2004 comparative financial information has also been prepared on this basis, with the exception of certain standards, details of which are given below, for which comparative information has not been restated. |
| As permitted by the rules for first-time adoption of IFRS, which are set out in IFRS 1, the Group elected to adopt IAS 32, IAS 39 and IFRS 5 with effect from 1 January 2005, with no restatement of comparative information for 2004. Accounting policy notes b), e) and i) explain the treatment of non-current assets held for sale prior to and after adopting IFRS 5. Accounting policy note p) explains the basis of accounting for financial instruments pre and post 1 January 2005. |
| The EU IFRS financial information has been drawn up on the basis of accounting policies consistent with those applied in the financial statements for the year to 31 December 2005, except for the following: |
| – | the adoption of IFRIC 4 'Determining whether an arrangement contains a lease'. |
| – | a change to the Group's policy on accounting for exploration and evaluation expenditure. Previously, the Group capitalised exploration and evaluation expenditure on acquisition of a beneficial interest or option in mineral rights together with subsequent expenditure. Full provision was made for impairment unless there was a high degree of confidence in the project's viability as a consequence of which it was considered probable that future economic benefits would flow to the Group. If, as a result of developments in subsequent periods, the expenditure was considered to be recoverable, such provisions were reversed. Under the Group's revised policy, exploration and evaluation expenditure is not capitalised until the point is reached at which there is a high degree of confidence in the project's viability and it is considered probable that future economic benefits will flow to the Group. |
| – | a change to the Group's presentation of the marking to market of provisionally priced sales contracts. This is now recorded as an adjustment to sales revenue having previously been shown as an adjustment to net operating costs. |
| The effect of the above adjustments is not material to Group earnings or to shareholders' funds in the current or prior periods. Therefore, prior period information has not been restated. |
| Certain prior year information has been reclassified to conform with the current year presentation. Exploration and evaluation costs charged against income were previously included in 'Cash used in investing activities' but are now included within 'Cash flow from operating activities'. As a result, exploration and evaluation costs expensed of US$226 million and US$187 million have been reclassified in the comparative figures for 2005 and 2004 respectively, within the Cash flow statement. |
| The Group has not applied the following pronouncements, the last three of which have not been endorsed by the EU: |
| | IFRS 7 Financial Instruments: Disclosures - mandatory for year 2007 |
| | Amendment to IAS 1 Presentation of Financial Statements Capital Disclosures - mandatory for year 2007 |
| | IFRIC 8 Scope of IFRS 2 (share based payments) - mandatory for year 2007 |
| | IFRIC 11 (IFRS 2) Group and Treasury share transactions - mandatory for year 2008 |
| | IFRIC D12-D14 - Service concession arrangements - mandatory for year 2008 |
| | IFRS 8 Operating Segments - mandatory for year 2009 |
| The Group is evaluating the impact of the above pronouncements but they are not expected to be material to the Group's earnings or to shareholders' funds |
| |
Judgements in applying accounting policies and key sources of estimation uncertainty
Many of the amounts included in the financial statements involve the use of judgement and/or estimation. These judgements and estimates are based on management's best knowledge of the relevant facts and circumstances, having regard to previous experience, but actual results may differ from the amounts included in the financial statements. Information about such judgements and estimation is contained in the accounting policies and/or the Notes to the financial statements, and the key areas are summarised below.
Areas of judgement that have the most significant effect on the amounts recognised in the financial statements are: |
| – | Merger accounting for the 1995 merger of the economic interests of Rio Tinto plc and Rio Tinto Limited into the dual listedcompanies ('DLC') structure (page A-6). |
| – | Determination of ore reserve estimates - note 1(j) |
| – | Deferral of stripping costs - note 1(h) |
| – | Recognition of deferred tax on mineral rights recognised in acquisitions - note 1(m) |
| – | Capitalisation of exploration and evaluation costs - note 1(f) |
| – | Identification of functional currencies - note 1(d) |
| – | The definition of Underlying earnings - note 2 |
| – | The election to adopt IAS 32, IAS 39 and IFRS 5 from 1 January 2005 without restatement of comparatives as noted above |
| | |
A-7
Back to Contents
Notes to the 2006 financial statements
| 1 | PRINCIPAL ACCOUNTING POLICIES CONTINUED |
| | |
| Key sources of estimation uncertainty that have a significant risk of causing a material adjustment to the carrying amounts of assets and liabilities within the next financial year are: |
| – | Estimation of close down and restoration costs and the timing of expenditure - note 1(k) and note 26 |
| – | Review of asset carrying values and impairment charges and reversals note 1(e) and (i), note 5 and note 11 |
| – | Estimation of environmental clean up costs and the timing of expenditure - note 1(k) and note 26 |
| – | Recoverability of potential deferred tax assets - note 1 (m) and note 18(d) |
| – | Estimation of liabilities for post retirement costs - note 46 |
| – | Contingent liabilities regarding claims from the Australian Tax Office relating to 1997 - note 33 |
| | |
| (a) | Accounting convention |
| | The financial information included in the financial statements for the year ended 31 December 2006, and for the related comparative periods, has been prepared under the historical cost convention as modified by the revaluation of certain derivative contracts and financial assets and liabilities as set out in the notes below. |
| | |
| (b) | Basis of consolidation |
| | The financial statements consist of the consolidation of the accounts of Rio Tinto plc and Rio Tinto Limited (together 'the Companies' and their respective subsidiaries (together 'the Group'). |
| | |
| | Subsidiaries: Subsidiaries are entities over which the Companies have the power to govern the financial and operating policies in order to obtain benefits from their activities. Control is presumed to exist where the Companies own more than one half of the voting rights (which does not always equate to percentage ownership) unless in exceptional circumstances it can be demonstrated that ownership does not constitute control. Control does not exist where joint venture partners hold veto rights over significant operating and financial decisions. The consolidated financial statements include all the assets, liabilities, revenues, expenses and cash flows of the Companies and their subsidiaries after eliminating intercompany balances and transactions. For partly owned subsidiaries the net assets and net earnings attributable to outside shareholders are presented as 'Amounts attributable to outside equity shareholders' in the consolidated balance sheet and consolidated income statement. |
| | |
| | Associates: An associate is an entity, that is neither a subsidiary nor a joint venture, over whose operating and financial policies the Group exercises significant influence. Significant influence is presumed to exist where the Group has between 20 per cent and 50 per cent of the voting rights, but can also arise where the Group holds less than 20 per cent if it has the power to be actively involved and influential in policy decisions affecting the entity. The Group's share of the net assets, post tax results and reserves of associates are included in the financial statements using the equity accounting method. This involves recording the investment initially at cost to the Group, which therefore includes any goodwill on acquisition, and then, in subsequent periods, adjusting the carrying amount of the investment to reflect the Group's share of the associate's results less any impairment of goodwill and any other changes to the associate's net assets such as dividends. |
| | |
| | Joint ventures: A joint venture is a contractual arrangement whereby two or more parties undertake an economic activity that is subject to joint control. Joint control is the contractually agreed sharing of control such that significant operating and financial decisions require the unanimous consent of the parties sharing control. The Group has two types of joint ventures |
| | |
| | Jointly controlled entities ('JCEs'): A JCE is a joint venture that involves the establishment of a corporation, partnership or other entity in which each venturer has a long term interest. JCEs are accounted for using the equity accounting method. In addition, the carrying value will include any long term debt interests which in substance form part of the Group's net investment. |
| | |
| | Jointly controlled assets ('JCAs'): A JCA is a joint venture in which the venturers have joint control over the assets contributed to or acquired for the purposes of the joint venture. JCAs do not involve the establishment of a corporation, partnership or other entity. This includes situations where the participants derive benefit from the joint activity through a share of the production, rather than by receiving a share of the results of trading. The Group's proportionate interest in the assets, liabilities, revenues, expenses and cash flows of JCAs are incorporated into the Group's financial statements under the appropriate headings. In some situations, joint control exists even though the Group has an ownership interest of more than 50 per cent because of the veto rights held by join venture partners. |
| | |
| | The Group uses the term 'Equity accounted units' to refer to associates and jointly controlled entities collectively. |
| | |
| | Where necessary, adjustments are made to the results of subsidiaries, joint ventures and associates to bring their accounting policies into line with those used by the Group. |
| | |
| | The results of businesses acquired during the year are brought into the consolidated financial statements from the date at which control, joint control or significant influence commences and taken out of the financial statements from the date at which control joint control or significant influence ceases. |
| | |
| | From 1 January 2005, Individual non-current assets or 'disposal groups' (i.e. groups of assets and liabilities) to be disposed of, by sale or otherwise in a single transaction, are classified as 'held for sale' if the following criteria are met: |
| | | |
| | – | the carrying amount will be recovered principally through a sale transaction rather than through continuing use, and |
| | – | the disposal group is available for immediate sale in its present condition subject only to terms that are usual and customary for such sales, and |
| | – | the sale is highly probable. |
| | | |
Back to Contents
Notes to the 2006 financial statements
| 1 | PRINCIPAL ACCOUNTING POLICIES CONTINUED |
| | |
| (b) | Basis of consolidation (continued) |
| | Disposal groups held for sale are carried at the lower of their carrying amount and fair value less costs to sell and are presented separately on the face of the balance sheet with the related assets and liabilities being presented as a single asset and a single liability respectively. Comparative balance sheet information is not restated |
| | |
| | For a disposal group held for sale which continues to be carried at its carrying amount, the profit on disposal, calculated as net sales proceeds less the carrying amount, is recognised in the income statement in the period during which completion of the sale takes place. Where the fair value less costs to sell of a disposal group is lower than the carrying amount, the resulting charge is recognised in the income statement in the period during which the disposal group is classified as held for sale. On classification as held for sale, the assets are no longer depreciated. |
| | |
| | If the disposal group or groups represent a separate major line of business or geographical area of operations, and are part of a single co-ordinated plan of disposal or are subsidiaries acquired exclusively with a view to resale, they are classified as discontinued operations. The net results attributable to such discontinued operations are shown separately and comparative figures in the income and cash flow statements are restated. |
| | |
| | Prior to 1 January 2005, the results of businesses sold during the year were included in the consolidated financial statements for the period up to the date of disposal. Gains or losses on disposal were calculated as the difference between the sale proceeds (net of expenses) and the net assets attributable to the interest which had been sold. |
| | |
| (c) | Sales revenue |
| | Sales revenue comprises sales to third parties at invoiced amounts, with most sales being priced ex works, free on board (f.o.b.) or cost, insurance and freight (c.i.f.). Amounts billed to customers in respect of shipping and handling are classed as sales revenue where the Group is responsible for carriage, insurance and freight. All shipping and handling costs incurred by the Group are recognised as operating costs. If the Group is acting solely as an agent, amounts billed to customers are offset against the relevant costs. |
| | |
| | Sales revenue excludes any applicable sales taxes. Mining royalties are presented as an operating cost or, where they are in substance a profit based tax, within taxes. Gross sales revenue shown in the income statement includes the Group's share of the sales revenue of equity accounted units. To avoid duplication, this excludes sales by jointly controlled entities to third parties of products purchased from the Group and excludes charges by jointly controlled entities to the Group. By-product revenues are included in sales revenue. |
| | |
| | A large proportion of Group production is sold under medium to long term contracts, but sales revenue is only recognised on individual sales when persuasive evidence exists that all of the following criteria are met: |
| | – | the significant risks and rewards of ownership of the product have been transferred to the buyer; |
| | – | neither continuing managerial involvement to the degree usually associated with ownership, nor effective control over the goods sold, has been retained; |
| | – | the amount of revenue can be measured reliably; |
| | – | it is probable that the economic benefits associated with the sale will flow to the Group; and |
| | – | the costs incurred or to be incurred in respect of the sale can be measured reliably. |
| | |
| | These conditions are generally satisfied when title passes to the customer. In most instances sales revenue is recognised when the product is delivered to the destination specified by the customer, which is typically the vessel on which it will be shipped, the destination port or the customer's premises. |
| | |
| | Sales revenue is commonly subject to adjustment based on an inspection of the product by the customer. In such cases, sales revenue is initially recognised on a provisional basis using the Group's best estimate of contained metal, and adjusted subsequently. |
| | |
| | Certain products are 'provisionally priced', i.e. the selling price is subject to final adjustment at the end of a period normally ranging from 30 to 180 days after delivery to the customer, based on the market price at the relevant quotation point stipulated in the contract. Revenue on provisionally priced sales is recognised based on estimates of the fair value of the consideration receivable based on forward market prices. At each reporting date provisionally priced metal is marked to market based on the forward selling price for the quotational period stipulated in the contract. For this purpose, the selling price can be measured reliably for those products, such as copper, for which there exists an active and freely traded commodity market such as the London Metals Exchange and the value of product sold by the Group is directly linked to the form in which it is traded on that market. |
| | |
| | The marking to market of provisionally priced sales contracts is recorded as an adjustment to sales revenue. |
| | |
A-9
Back to Contents
Notes to the 2006 financial statements
| 1 | PRINCIPAL ACCOUNTING POLICIES CONTINUED |
| | | |
| (d) | Currency translation |
| | The functional currency for each entity in the Group, and for jointly controlled entities and associates, is the currency of the primary economic environment in which it operates. For most entities, this is the currency of the country in which it operates. Transactions denominated in other currencies are converted to the functional currency at the exchange rate ruling at the date of the transaction unless hedge accounting applies. Monetary assets and liabilities denominated in foreign currencies are retranslated at year end exchange rates. |
| | | |
| | The US dollar is the currency in which the Group's Financial statements are presented, as it most reliably reflects the global business performance of the Group as a whole. |
| | | |
| | On consolidation, income statement items are translated into US dollars at average rates of exchange. Balance sheet items are translated into US dollars at year end exchange rates. Exchange differences on the translation of the net assets of entities with functional currencies other than the US dollar, and any offsetting exchange differences on net debt hedging those net assets, are recognised directly in the foreign currency translation reserve. |
| | | |
| | Exchange gains and losses which arise on balances between Group entities are taken to the foreign currency translation reserve where the intra group balance is, in substance, part of the Group's net investment in the entity. |
| | | |
| | The balance of the foreign currency translation reserve relating to an operation that is disposed of is transferred to the income statement at the time of the disposal. |
| | | |
| | The Group finances its operations primarily in US dollars but a substantial part of the Group's US dollar debt is located in subsidiaries having functional currencies other than the US dollar. Except as noted above, exchange gains and losses relating to such US dollar debt are charged or credited to the Group's income statement in the year in which they arise. This means that the impact of financing in US dollars on the Group's income statement is dependent on the functional currency of the particular subsidiary where the debt is located. |
| | | |
| | Except as noted above, or in note (p) below relating to derivative contracts, all exchange differences are charged or credited to the income statement in the year in which they arise. |
| | | |
| (e) | Goodwill and intangible assets (excluding exploration and evaluation expenditure) |
| | Goodwill represents the difference between the cost of acquisition and the fair value of the identifiable assets, liabilities and contingent liabilities acquired. Goodwill on acquisition of subsidiaries is separately disclosed and goodwill on acquisitions of associates and JCEs is included within investments in equity accounted units. |
| | | |
| | In 1997 and previous years, goodwill was eliminated against reserves in the year of acquisition as a matter of accounting policy, as was then permitted under UK GAAP. Such goodwill was not reinstated under subsequent UK accounting standards or on transition to IFRS. |
| | | |
| | Goodwill is not amortised; rather it is tested annually for impairment. Goodwill is allocated to the cash generating unit or group of cash generating units expected to benefit from the related business combination for the purposes of impairment testing. Goodwill impairments cannot be reversed. |
| | | |
| | Finite life intangible assets are recorded at cost and are amortised over their useful economic lives on a straight line or units of production basis, as appropriate. From 1 January 2005, finite life intangible assets held for sale, or included within a disposal group held for sale, are not amortised. In accordance with the accounting requirements for disposal groups, intangible assets held for sale are carried at the lower of their pre-existing carrying amount and fair value less costs to sell, and are presented separately on the face of the balance sheet. Internally generated intangible assets and computer software acquired are amortised over 2 to 5 years. Other intangible assets are amortised over 2 to 20 years. Intangible assets which are not yet ready for use are reviewed annually for impairment. |
| | | |
| (f) | Exploration and evaluation |
| | Exploration and evaluation expenditure comprises costs which are directly attributable to: |
| | – | researching and analysing existing exploration data |
| | – | conducting geological studies, exploratory drilling and sampling |
| | – | examining and testing extraction and treatment methods; and/or |
| | – | compiling pre-feasibility and feasibility studies. |
| | | |
| | Exploration and evaluation expenditure also includes costs incurred in acquiring mineral rights, the entry premiums paid to gain access to areas of interest and amounts payable to third parties to acquire interests in existing projects. |
| | | |
| | Capitalisation of exploration and evaluation expenditure commences when there is a high degree of confidence in the project's viability and hence it is probable that future economic benefits will flow to the Group. |
| | | |
| | Capitalised exploration and evaluation expenditure is reviewed for impairment at each balance sheet date. In the case of undeveloped properties, there may be only inferred resources to form a basis for the impairment review. The carrying values of these assets are reviewed twice per annum by management and the results of these reviews are reported to the Audit Committee. The review is based on a status report regarding the Group's intentions for development of the undeveloped property. In some cases, the undeveloped properties are regarded as successors to ore bodies currently in production. It is intended that these will be developed and go into production when the current source of ore is exhausted. |
| | | |
| | Subsequent recovery of the resulting carrying value depends on successful development of the area of interest or sale of the project. If a project does not prove viable, all irrecoverable costs associated with the project and any related impairment provisions are written off. |
A-10
Back to Contents
Notes to the 2006 financial statements
| 1 | PRINCIPAL ACCOUNTING POLICIES CONTINUED |
| | |
| (g) | Property, plant and equipment |
| | The cost of property, plant and equipment comprises its purchase price, any costs directly attributable to bringing the asset to the location and condition necessary for it to be capable of operating in the manner intended by management and the estimated close down and restoration costs associated with the asset. Once a mining project has been established as commercially viable expenditure other than that on land, buildings, plant and equipment is capitalised under 'Mining properties and leases' together with any amount transferred from 'Exploration and evaluation'. |
| | | |
| | In open pit mining operations, it is necessary to remove overburden and other barren waste materials to access ore from which minerals can economically be extracted. The process of mining overburden and waste materials is referred to as stripping. During the development of a mine (or pit), before production commences, stripping costs are capitalised as part of the investment in construction of the mine (or pit). |
| | | |
| | Costs associated with commissioning new assets, in the period before they are capable of operating in the manner intended by management, are capitalised. Development costs incurred after the commencement of production are capitalised to the extent they are expected to give rise to a future economic benefit. Interest on borrowings related to construction or development projects is capitalised until the point when substantially all the activities that are necessary to make the asset ready for its intended use are complete. |
| | | |
| (h) | Deferred stripping |
| | As noted above, stripping costs incurred in the development of a mine (or pit) before production commences are capitalised as part of the cost of constructing the mine (or pit) and subsequently amortised over the life of the mine (or pit) on a units of production basis. |
| | | |
| | Where a mine operates several open pits that are regarded as separate operations for the purpose of mine planning, stripping costs are accounted for separately by reference to the ore from each separate pit. If, however, the pits are highly integrated for the purpose of mine planning, the second and subsequent pits are regarded as extensions of the first pit in accounting for stripping costs. In such cases, the initial stripping (i.e. overburden and other waste removal) of the second and subsequent pits is considered to be production phase stripping relating to the combined operation. |
| | | |
| | The Group defers stripping costs incurred subsequently, during the production stage of its operations, for those operations where this is the most appropriate basis for matching the costs against the related economic benefits and the effect is material. This is generally the case where there are fluctuations in stripping costs over the life of the mine (or pit), and the effect is material. The amount of stripping costs deferred is based on the ratio ('Ratio') obtained by dividing the tonnage of waste mined either by the quantity of ore mined or by the quantity of minerals contained in the ore. Stripping costs incurred in the period are deferred to the extent that the current period Ratio exceeds the life of mine (or pit) Ratio. Such deferred costs are then charged against reported profits to the extent that, in subsequent periods, the current period Ratio falls short of the life of mine (or pit) Ratio. The life of mine (or pit) Ratio is based on proved and probable reserves of the mine (or pit). |
| | | |
| | The life of mine (or pit) waste-to-ore Ratio is a function of the pit design(s), and therefore changes to that design will generally result in changes to the Ratio. Changes in other technical or economic parameters that impact on reserves will also have an impact on the life of mine (or pit) Ratio even if they do not affect the pit design(s). Changes to the life of mine (or pit) Ratio are accounted for prospectively. |
| | | |
| | In the production stage of some mines (or pits), further development of the mine (or pit) requires a phase of unusually high overburden removal activity that is similar in nature to preproduction mine development. The costs of such unusually high overburden removal activity are deferred and charged against reported profits in subsequent periods on a units of production basis. This accounting treatment is consistent with that for stripping costs incurred during the development phase of a mine (or pit), before production commences. |
| | | |
| | If the Group were to expense production stage stripping costs as incurred, there would be greater volatility in the year to year results from operations and excess stripping costs would be expensed at an earlier stage of a mine's operation. |
| | | |
| | Deferred stripping costs are included in 'Mining properties and leases' within property, plant and equipment or in investments in equity accounted units, as appropriate. These form part of the total investment in the relevant cash generating unit, which is reviewed for impairment if events or changes in circumstances indicate that the carrying value may not be recoverable. Amortisation of deferred stripping costs is included in operating costs or in the Group's share of the results of its equity accounted units, as appropriate. |
| | | |
| (i) | Depreciation and impairment |
| | Property, plant and equipment is depreciated over its useful life, or over the remaining life of the mine if shorter. The major categories of property, plant and equipment are depreciated on a units of production and/or straight-line basis as follows: |
| | | |
| | | Units of production basis |
| | | For mining properties and leases and certain mining equipment, the economic benefits from the asset are consumed in a pattern which is linked to the production level. Except as noted below, such assets are depreciated on a units of production basis. |
| | | |
| | | Straight line basis |
| | | Assets within operations for which production is not expected to fluctuate significantly from one year to another or which have a physical life shorter than the related mine are depreciated on a straight line basis as follows: |
| | | |
| | Buildings | 10 to 40 years |
| | Plant and equipment | 3 to 35 years |
| | Land | Not depreciated |
A-11
Back to Contents
Notes to the 2006 financial statements
| 1 | PRINCIPAL ACCOUNTING POLICIES CONTINUED |
| | | |
| (i) | Depreciation and impairment (continued) |
| | Residual values and useful lives are reviewed, and adjusted if appropriate, at each balance sheet date. Changes to the estimated residual values or useful lives are accounted for prospectively. In applying the units of production method, depreciation is normally calculated using the quantity of material extracted from the mine in the period as a percentage of the total quantity of material to be extracted in current and future periods based on proved and probable reserves and, for some mines, other mineral resources. Such non reserve material may be included in depreciation calculations in limited circumstances and where there is a high degree of confidence in its economic extraction. Development costs that relate to a discrete section of an ore body and which only provide benefit over the life of those reserves, are depreciated over the estimated life of that discrete section. Development costs incurred which benefit the entire ore body are depreciated over the estimated life of the ore body. |
| | | |
| | From 1 January 2005, property, plant and equipment held for sale, or which is part of a disposal group held for sale, is not depreciated. |
| | | |
| | Property, plant and equipment and finite life intangible assets are reviewed for impairment if there is any indication that the carrying amount may not be recoverable. In addition, from 1 January 2005, an impairment loss is recognised for any excess of carrying amount over the fair value less costs to sell of a non-current asset or disposal group held for sale. |
| | | |
| | When a review for impairment is conducted, the recoverable amount is assessed by reference to the higher of 'value in use' (being the net present value of expected future cash flows of the relevant cash generating unit) and 'fair value less costs to sell'. Where there is no binding sale agreement or active market, fair value less costs to sell is based on the best information available to reflect the amount the Group could receive for the cash generating unit in an arm's length transaction. The estimates used for impairment reviews are based on detailed mine plans and operating plans, modified as appropriate to meet the requirements of IAS 36 'Impairment of Assets'. Future cash flows are based on estimates of: |
| | – | the quantities of the reserves and mineral resources for which there is a high degree of confidence of economic extraction; |
| | – | future production levels; |
| | – | future commodity prices (assuming the current market prices will revert to the Group's assessment of the long term average price, generally over a period of three to five years); and |
| | – | future cash costs of production, capital expenditure, close down, restoration and environmental clean up. |
| | | |
| | The cash flow forecasts are based on best estimates of expected future revenues and costs. These may include net cash flows expected to be realised from extraction, processing and sale of mineral resources that do not currently qualify for inclusion in proved or probable ore reserves. Such non reserve material is included where there is a high degree of confidence in its economic extraction. This expectation is usually based on preliminary drilling and sampling of areas of mineralisation that are contiguous with existing reserves. Typically, the additional evaluation to achieve reserve status for such material has not yet been done because this would involve incurring costs earlier than is required for the efficient planning and operation of the mine. |
| | | |
| | The expected future cash flows of cash generating units reflect long term mine plans which are based on detailed research analysis and iterative modelling to optimise the level of return from investment, output and sequence of extraction. The plan takes account of all relevant characteristics of the ore body, including waste to ore ratios, ore grades, haul distances, chemical and metallurgical properties of the ore impacting on process recoveries and capacities of processing equipment that can be used. The mine plan is therefore the basis for forecasting production output in each future year and the related production costs. |
| | | |
| | Rio Tinto's cash flow forecasts are based on assessments of expected long term commodity prices, which for most commodities are derived from an analysis of the marginal costs of the producers of these commodities. These assessments often differ from current price levels and are updated periodically. |
| | | |
| | In some cases, prices applying to some part of the future sales volumes of a cash generating unit are predetermined by existing sales contracts. The effects of such contracts are taken into account in forecasting future cash flows. |
| | | |
| | Cost levels incorporated in the cash flow forecasts are based on the current long term mine plan for the cash generating unit. For impairment reviews, recent cost levels are considered, together with expected changes in costs that are compatible with the current condition of the business and which meet the requirements of IAS 36. IAS 36 includes a number of restrictions on the future cash flows that can be recognised in respect of future restructurings and improvement related capital expenditure. |
| | | |
| | The discount rate applied is based upon the Group's weighted average cost of capital with appropriate adjustment for the risks associated with the relevant cash flows, to the extent that such risks are not reflected in the forecast cash flows. |
| | | |
| | For operations with a functional currency other than the US dollar, the impairment review is undertaken in the relevant functional currency. The great majority of the Group’s sales are based on prices denominated in US dollars. To the extent that the currencies of countries in which the Group produces commodities strengthen against the US dollar without commodity price offset, cash flows and, therefore, net present values are reduced. |
| | | |
| | When calculating 'value in use', IAS 36 requires that calculations should be based on exchange rates current at the time of the assessment. |
| | | |
| | For the majority of Rio Tinto's businesses, by both number and by value, the recoverable amounts are substantially in excess of the carrying value in the balance sheet. For a minority of the businesses the carrying value is close to recoverable amount, and these are reviewed for impairment where appropriate. The effects of exchange rate and commodity price changes on the values of these units relative to their carrying values are monitored closely. |
A-12
Back to Contents
Notes to the 2006 financial statements
| 1 | PRINCIPAL ACCOUNTING POLICIES CONTINUED |
| | | |
| (j) | Determination of ore reserve estimates |
| | The Group estimates its ore reserves and mineral resources based on information compiled by Competent Persons as defined in accordance with the Australasian Code for Reporting of Exploration Results, Mineral Resources and Ore Reserves of December 2004 (the JORC code). Reserves, and for certain mines, other mineral resources, determined in this way are used in the calculation of depreciation, amortisation and impairment charges, the assessment of life of mine stripping ratios and for forecasting the timing of the payment of close down and restoration costs and clean up costs. |
| | | |
| | In assessing the life of a mine for accounting purposes, mineral resources are only taken into account where there is a high degree of confidence of economic extraction. |
| | | |
| | There are numerous uncertainties inherent in estimating ore reserves, and assumptions that are valid at the time of estimation may change significantly when new information becomes available. Changes in the forecast prices of commodities, exchange rates production costs or recovery rates may change the economic status of reserves and may, ultimately, result in the reserves being restated. |
| | | |
| (k) | Provisions for close down and restoration and for environmental clean up costs |
| | Close down and restoration costs include the dismantling and demolition of infrastructure and the removal of residual materials and remediation of disturbed areas. Estimated close down and restoration costs are provided for in the accounting period when the obligation arising from the related disturbance occurs, whether this occurs during the mine development or during the production phase, based on the net present value of estimated future costs. Provisions for close down and restoration costs do not include any additional obligations which are expected to arise from future disturbance. The costs are estimated on the basis of a closure plan. The cost estimates are calculated annually during the life of the operation to reflect known developments e.g. updated cost estimates and revisions to the estimated lives of operations, and are subject to formal review at regular intervals. |
| | | |
| | Close down and restoration costs are a normal consequence of mining, and the majority of close down and restoration expenditure is incurred at the end of the life of the mine. Although the ultimate cost to be incurred is uncertain, the Group's businesses estimate their respective costs based on feasibility and engineering studies using current restoration standards and techniques. |
| | | |
| | The amortisation or 'unwinding' of the discount applied in establishing the net present value of provisions is charged to the income statement in each accounting period. The amortisation of the discount is shown as a financing cost, rather than as an operating cost. |
| | | |
| | The initial closure provision together with other movements in the provisions for close down and restoration costs, including those resulting from new disturbance, updated cost estimates, changes to the estimated lives of operations and revisions to discount rates are capitalised within property, plant and equipment. These costs are then depreciated over the lives of the assets to which they relate. |
| | | |
| | Where rehabilitation is conducted systematically over the life of the operation, rather than at the time of closure, provision is made for the estimated outstanding continuous rehabilitation work at each balance sheet date and the cost is charged to the income statement. |
| | | |
| | Provision is made for the estimated present value of the costs of environmental clean up obligations outstanding at the balance sheet date. These costs are charged to the income statement. Movements in the environmental clean up provisions are presented as an operating cost, except for the unwind of the discount which is shown as a financing cost. Remediation procedures may commence soon after the time the disturbance, remediation process and estimated remediation costs become known, but can continue for many years depending on the nature of the disturbance and the remediation techniques. |
| | | |
| | As noted above, the ultimate cost of environmental remediation is uncertain and cost estimates can vary in response to many factors including changes to the relevant legal requirements, the emergence of new restoration techniques or experience at other mine sites. The expected timing of expenditure can also change, for example in response to changes in ore reserves on production rates. As a result there could be significant adjustments to the provision for close down and restoration and environmental clean up, which would affect future financial results. |
| | | |
| (l) | Inventories |
| | Inventories are valued at the lower of cost and net realisable value on a first in, first out ('FIFO') basis. Cost for raw materials and stores is purchase price and for partly processed and saleable products is generally the cost of production. For this purpose the costs of production include: |
| | – | labour costs, materials and contractor expenses which are directly attributable to the extraction and processing of ore; |
| | – | the depreciation of mining properties and leases and of property, plant and equipment used in the extraction and processing of ore; and |
| | – | production overheads. |
| | | |
| | Stockpiles represent ore that has been extracted and is available for further processing. If there is significant uncertainty as to when the stockpiled ore will be processed it is expensed as incurred. Where the future processing of this ore can be predicted with confidence, e.g. because it exceeds the mine's cut off grade, it is valued at the lower of cost and net realisable value. If the ore will not be processed within the 12 months after the balance sheet date it is included within non-current assets. Work in progress inventory includes ore stockpiles and other partly processed material. Quantities are assessed primarily through surveys and assays. |
A-13
Back to Contents
Notes to the 2006 financial statements
| 1 | PRINCIPAL ACCOUNTING POLICIES CONTINUED |
| | | |
| (m) | Taxation |
| | Current tax is the tax expected to be payable on the taxable income for the year calculated using rates that have been enacted or substantively enacted by the balance sheet date. It includes adjustments for tax expected to be payable or recoverable in respect of previous periods. |
| | | |
| | Full provision is made for deferred taxation on all temporary differences existing at the balance sheet date with certain limited exceptions. Temporary differences are the difference between the carrying value of an asset or liability and its tax base. The main exceptions to this principle are as follows: |
| | – | tax payable on the future remittance of the past earnings of subsidiaries, associates and jointly controlled entities is provided for except where Rio Tinto is able to control the remittance of profits and it is probable that there will be no remittance in the foreseeable future; |
| | – | deferred tax is not provided on the initial recognition of an asset or liability in a transaction that does not affect accounting profit or taxable profit and is not a business combination, such as on the recognition of a provision for close down and restoration costs and the related asset or on the inception of finance leases. Furthermore, with the exception of the unwind of discount, deferred tax is not recognised on subsequent changes in the carrying value of such assets and liabilities, for example where they are depreciated of finance leases are repaid; and |
| | – | deferred tax assets are recognised only to the extent that it is more likely than not that they will be recovered – this is considered having regard to the reasons why the deferred tax asset has arisen and projected future taxable profits for the relevant entity (or group of entities). |
| | | |
| | Deferred tax is provided in respect of fair value adjustments on acquisitions. These adjustments may relate to assets such as mining rights that, in general, are not eligible for income tax allowances. In such cases, the provision for deferred tax is based on the difference between the carrying value of the asset and its nil income tax base. The existence of a tax base for capital gains tax purposes is not taken into account in determining the deferred tax provision relating to such mineral rights because it is expected that the carrying amount will be recovered primarily through use and not from the disposal of mineral rights. Also, the Group is only entitled to a deduction for capital gains tax purposes if the mineral rights are sold or formally relinquished. |
| | | |
| | Current and deferred tax relating to items recognised directly in equity are recognised in equity and not in the income statement. |
| | | |
| (n) | Post employment benefits |
| | For defined benefit post employment plans, the difference between the fair value of the plan assets (if any) and the present value of the plan liabilities is recognised as an asset or liability on the balance sheet. Any asset recognised is restricted, if appropriate, to the present value of any amounts the Group expects to recover by way of refunds from the plan or reductions in future contributions. Actuarial gains and losses arising in the year are taken to the Statement of recognised income and expense. For this purpose actuarial gains and losses comprise both the effects of changes in actuarial assumptions and experience adjustments arising because of differences between the previous actuarial assumptions and what has actually occurred. |
| | | |
| | Other movements in the net surplus or deficit are recognised in the income statement, including the current service cost, any past service cost and the effect of any curtailment or settlements. The interest cost less the expected return on assets is also charged to the income statement. The amount charged to the income statement in respect of these plans is included within operating costs or in the Group's share of the results of equity accounted units as appropriate. |
| | | |
| | The most significant assumptions used in accounting for pension plans are the long term rate of return on plan assets, the discount rate and the mortality assumptions. The long term rate of return on plan assets is used to calculate interest income on pension assets, which is credited to the Group's income statement. The discount rate is used to determine the net present value or future liabilities and each year the unwinding of the discount on those liabilities is charged to the Group's income statement as the interest cost. The mortality assumption is used to project the future stream of benefit payments, which is then discounted to arrive at a net present value of liabilities. |
| | |
| | The values attributed to plan liabilities are assessed in accordance with the advice of independent qualified actuaries. |
| | | |
| | The Group's contributions to defined contribution pension plans are charged to the income statement in the period to which the contributions relate. |
| | | |
| (o) | Cash and cash equivalents |
| | Cash and cash equivalents are carried in the balance sheet at amortised cost. For the purposes of the balance sheet, cash and cash equivalents comprise cash on hand, deposits held on call with banks and short-term, highly liquid investments that are readily convertible into known amounts of cash and which are subject to insignificant risk of changes in value. For the purposes of the cash flow statement, cash and cash equivalents are net of bank overdrafts which are repayable on demand. |
A-14
Back to Contents
Notes to the 2006 financial statements
| 1 | PRINCIPAL ACCOUNTING POLICIES CONTINUED |
| (p) | Financial instruments |
| | The Group's policy with regard to 'Treasury management and financial instruments' is set out in Note 32. When the Group enters into derivative contracts these transactions are designed to reduce exposures related to assets and liabilities, firm commitments or anticipated transactions. |
| |
| | The Group adopted IAS 32 and IAS 39 from 1 January 2005. Adjustments were made to the opening balance sheet at 1 January 2005 for the adoption of IAS 39; these are shown separately in the Group statement of changes in equity. Comparative figures for the year ended 31 December 2004 were not restated to reflect IAS 39. |
| | | |
| | | Fair value: Where financial instruments are accounted for at fair value, this is the amount at which they could be exchanged in an arm's length transaction between informed and willing parties. Where available, market values have been used to determine fair values. In other cases, fair values have been calculated using quotations from independent financial institutions, or by discounting expected cash flows at prevailing market rates. The fair values of the Group's cash, short term borrowings and loans to jointly controlled entities and associates approximate to their carrying values, as a result of their short maturity or because they carry floating rates of interest. A further description of the accounting for each class of financial instrument is given below. |
| | | |
| | | Financial assets: From 1 January 2005, all financial assets are initially recorded at fair value. The Group has certain investments in companies that are not subsidiaries, associates or jointly controlled entities. These investments are classed as 'available for sale'. Such investments are subsequently measured at fair value with unrealised gains and losses recognised in equity until the investment is disposed of. Impairment charges and exchange gains and losses on such investments are recognised directly in the income statement. Other financial assets that the Group has the expressed intent and ability to hold to maturity together with loans and receivables are measured at amortised cost less any impairment charges. Prior to 1 January 2005, these investments were accounted for at cost less provisions for diminution in value. |
| | | |
| | | Borrowings: From 1 January 2005, borrowings and other financial liabilities are recognised initially at fair value, net of transaction costs incurred and are subsequently stated at amortised cost. Any difference between the amounts originally received (net of transaction costs) and the redemption value is recognised in the income statement over the period to maturity using the effective interest method. Prior to 1 January 2005, borrowings were stated at amortised cost. |
| | | |
| | Derivative financial instruments and hedge accounting |
| | Commodity based contracts that meet the 'expected purchase, sale or usage' requirements in IAS 39 are recognised in earnings as described in note c) above. |
| | | |
| | From 1 January 2005, all derivatives are initially recognised at their fair value on the date the derivative contract is entered into and are subsequently remeasured at their fair value at each balance sheet date. The method of recognising the resulting gain or loss depends on whether the derivative is designated as a hedging instrument and, if so, the nature of the item being hedged. The Group designates certain derivatives as either hedges of the fair value of recognised assets or liabilities or of firm commitments (fair value hedges) or hedges of highly probable forecast transactions (cash flow hedges). |
| | | |
| | – | Fair value hedges:Changes in the fair value of derivatives that are designated and qualify as fair value hedges arerecorded in the income statement, together with any changes in the fair value of the hedged asset or liability or firmcommitment that is attributable to the hedged risk. Where derivatives are held with different counterparties to theunderlying asset or liability or firm commitment, the fair value of the derivative is shown separately in the balance sheeas there is no legal right of offset. |
| | | |
| | – | Cash flow hedges:The effective portions of changes in the fair value of derivatives that are designated and qualify ascash flow hedges are recognised in equity. The gain or loss relating to the ineffective portion is recognised immediatelyin the income statement. Amounts accumulated in equity are recycled in the income statement in the periods when thehedged item will affect profit or loss (for instance, when the forecast sale that is being hedged takes place). |
| | | |
| | – | Derivatives that do not qualify for hedge accounting:Certain derivative contracts entered into by the Group in order tohedge its exposure to fluctuations in exchange rates against the US dollar are not located in the entity with the exposure.Such contracts, and any other derivative contracts that do not qualify for hedge accounting, are marked to market at thebalance sheet date. In respect of currency swaps, the gain or loss on the swap and the offsetting gain or loss on the financialasset or liability against which the swap forms an economic hedge are shown in separate lines in the income statement. Inrespect of other derivatives, the mark to market will give rise to charges or credits to the income statement in periods beforethe transaction against which the derivative is held as an economic hedge is recognised. |
| | | |
| | – | Embedded derivatives:Derivatives embedded in other financial instruments or other host contracts are treated asseparate derivatives when their risks and characteristics are not closely related to their host contracts. |
| | | |
| Prior to 1 January 2005, derivative financial instruments were accounted for as follows |
| – | Amounts receivable and payable in respect of interest rate swaps were recognised as adjustments to net interest over the life of the contract. | | – | Derivative contracts which had been entered into by the Group in respect of its firm commitments or anticipated transactions in order to hedge its exposure to fluctuations in exchange rates against the US dollar or to fluctuations against commodity prices and which were located in the entity with the exposure, were accounted for as hedges: gains and losses were deferred and subsequently recognised when the hedged transaction occurred. Where such contracts were not located in the entity with the exposure they were fair valued at the balance sheet date. This gave rise to charges or credits to the income statement in periods before the transaction against which the derivative was held as an economic hedge was recognised. |
|
A-15
Back to Contents
Notes to the 2006 financial statements
| 1 | PRINCIPAL ACCOUNTING POLICIES CONTINUED |
| | |
| (p) | Financial instruments (continued) |
| | – | Where contracts and financial instruments contained embedded derivatives, the derivative element was not treated as a separate derivative. |
| | – | Gains or losses on foreign currency forward contracts and currency swaps relating to financial assets and liabilities were matched against the losses or gains on the hedged items in the income statement. Where currency swaps were held with different counterparties to the underlying borrowing, the fair value of the swaps was shown separately in the balance sheet as there was no legal right of offset. |
| | | |
| | (q) | Share based payments |
| | | The fair value of cash-settled share plans is recognised as a liability over the vesting period of the awards. Movements in that liability between accounting dates are recognised as an expense. The grant date fair value of the awards is taken to be the market value of the shares at the date of award reduced by a factor for anticipated relative Total Shareholder Return ('TSR') performance. Fair values are subsequently remeasured at each accounting date to reflect the number of awards expected to vest based on the current and anticipated TSR performance. If any awards are ultimately settled in shares, the liability is transferred direct to equity as the consideration for the equity instruments issued. |
| |
| | | The Group's equity-settled share plans are settled either by the issue of shares by the relevant parent company, by the purchase of shares on market or by the use of shares previously acquired as part of a share buyback. The fair value of the share plans is recognised as an expense over the expected vesting period with a corresponding entry to retained earnings for Rio Tinto plc plans and to other reserves for Rio Tinto Limited plans. If the cost of shares acquired to satisfy the plans exceeds the expense charged, the excess is taken to the appropriate reserve. The fair value of the share plans is determined at the date of grant, taking into account any market based vesting conditions attached to the award (e.g. Total Shareholder Return). The Group uses fair values provided by independent actuaries calculated using a lattice based option valuation model. |
| |
| | | Non market based vesting conditions (e.g. earnings per share targets) are taken into account in estimating the number of awards likely to vest. The estimate of the number of awards likely to vest is reviewed at each balance sheet date up to the vesting date, at which point the estimate is adjusted to reflect the actual awards issued. No adjustment is made after the vesting date even if the awards are forfeited or not exercised. |
| |
| | | Further information about the treatment of individual share based payment plans is provided in note 45. |
A-16
Back to Contents
Notes to the 2006 Financial statements
| 2 | RECONCILIATION OF NET EARNINGS TO UNDERLYING EARNINGS |
| | Pre-tax | | Taxation | | Outside | | Net | | Net | | Net | |
| | | | | | interests | | amount | | amount | | amount | |
| | | | | | | | 2006 | | 2005 | | 2004 | |
| Exclusions from underlying earnings | | | | | | | US$m | | US$m | | US$m | |
|
|
|
|
|
|
|
|
|
|
|
| |
| Profits less losses on disposal of interests in businesses (a) (note 39) | 5 | | (2 | ) | — | | 3 | | 311 | | 1,175 | |
| Impairment reversals less charges (b) | 396 | | (276 | ) | (76 | ) | 44 | | 4 | | (321 | ) |
| Exchange differences and derivatives: | | | | | | | | | | | | |
| Exchange gains/(losses) on external debt and intragroup balances (c) | 46 | | (70 | ) | 8 | | (16 | ) | (87 | ) | 159 | |
| – Gains/(losses) on currency and interest rate derivatives not qualifying | | | | | | | | | | | | |
| for hedge accounting (d), (e) | 35 | | (9 | ) | 4 | | 30 | | (40 | ) | 8 | |
| – Gains/(losses) on external debt and derivatives not qualifying as | | | | | | | | | | | | |
| hedgesinequity accounted units (c), (d), (e) | 2 | | — | | — | | 2 | | (12 | ) | 4 | |
| Adjustment to environmental remediation provision (f) | 37 | | — | | — | | 37 | | 84 | | — | |
|
|
|
|
|
|
|
|
|
|
|
|
|
| Total excluded from underlying earnings | 521 | | (357 | ) | (64 | ) | 100 | | 260 | | 1,025 | |
|
|
|
|
|
|
|
|
|
|
|
| |
| Net earnings | 10,240 | | (2,373 | ) | (429 | ) | 7,438 | | 5,215 | | 3,297 | |
|
|
|
|
|
|
|
|
|
|
|
| |
| Underlying earnings | 9,719 | | (2,016 | ) | (365 | ) | 7,338 | | 4,955 | | 2,272 | |
|
|
|
|
|
|
|
|
|
|
|
| |
| 'Underlying earnings' is an additional measure of earnings, which is reported by Rio Tinto to provide greater understanding of the underlying business performance of its operations. Underlying earnings and Net earnings both represent amounts attributable to Rio Tinto shareholders. Items (a) to (f) below are excluded from Net earnings in arriving at Underlying earnings. |
| |
| (a) | Gains and losses arising on the disposal of interests in businesses. Additional information on these disposals is included in note 39. |
| (b) | Credits and charges relating to impairment of non-current assets other than undeveloped properties. |
| (c) | Exchange gains and losses on US dollar debt and intragroup balances. |
| (d) | Valuation changes on currency and interest rate derivatives which are ineligible for hedge accounting, other than those embedded in commercial contracts. |
| (e) | The currency revaluation of embedded US dollar derivatives contained in contracts held by entities whose functional currency is not the US dollar. |
| (f) | Other credits and charges that, individually, or in aggregate if of a similar type, are of a nature or size to require exclusion in order to provide additional insight into underlying business performance. |
The 'adjustment to environmental remediation' provision of US$37 million (2005: US$84 million; 2004: US$nil) relates to the obligations of Kennecott Utah Copper described in note 26 (e). It reverses part of an exceptional charge taken up in 2002, which was excluded from Adjusted earnings at that time, and is therefore excluded in arriving at Underlying earnings.
Change in treatment of undeveloped properties in Underlying earnings
The Group frequently sells undeveloped properties as an alternative to development, and such activities are a component of the Group's regular business activities. For this reason, the above definition of Underlying earnings has been amended in 2006 to include gains and losses on sales of undeveloped properties and impairment charges relating to these. This change in definition resulted in an increase of US$46 million in the Group's Underlying earnings for 2006 but has no impact on Underlying earnings for 2005 or 2004.
A-17
Back to Contents
Notes to the 2006 Financial statements
| | | | 2006 | | 2005 | | 2004 | |
| | Note | | US$m | | US$m | | US$m | |
|
|
|
|
|
|
|
| |
| Raw materials and consumables | | | 3,207 | | 2,860 | | 2,157 | |
| Amortisation of intangible assets | 12 | | 27 | | 19 | | 19 | |
| Depreciation of property, plant & equipment | 13 | | 1,442 | | 1,315 | | 1,152 | |
| Amortisation of deferred stripping costs | | | 40 | | 4 | | 12 | |
| Employment costs | 4 | | 2,459 | | 2,162 | | 1,817 | |
| Repairs and maintenance | | | 1,257 | | 985 | | 886 | |
| Shipping costs | | | 1,149 | | 1,141 | | 724 | |
| Other freight costs | | | 333 | | 283 | | 160 | |
| (Increase) in inventories | | | (139 | ) | (79 | ) | 98 | |
| Royalties | | | 1,004 | | 822 | | 577 | |
| Amounts charged by jointly controlled entities mainly for toll processing | | | 1,196 | | 1,128 | | 980 | |
| Other external costs | | | 1,936 | | 1,649 | | 1,519 | |
| Provisions | 26 | | 60 | | 202 | | 192 | |
| Exploration and evaluation | 12 | | 237 | | 250 | | 190 | |
| Research and development | | | 15 | | 20 | | 16 | |
| Costs included above qualifying for capitalisation | | | (69 | ) | (83 | ) | (89 | ) |
| Other operating income | | | (262 | ) | (242 | ) | (161 | ) |
|
|
|
|
|
|
|
| |
| Net operating costs (excluding impairment (reversals)/charges) | | | 13,892 | | 12,436 | | 10,249 | |
|
|
|
|
|
|
|
| |
| (a) | Information on auditors' remuneration is included in note 41. |
| | | | 2006 | | 2005 | | 2004 | |
| | Note | | US$m | | US$m | | US$m | |
|
|
|
|
|
|
|
| |
| Employment costs | | | | | | | | |
| – Wages and salaries | | | 2,337 | | 2,093 | | 1,700 | |
| – Social security costs | | | 83 | | 84 | | 68 | |
| – Net post retirement cost (a) | 46 | | 189 | | 167 | | 151 | |
| – Share option costs (b) | 45 | | 32 | | 48 | | 40 | |
|
|
|
|
|
|
|
| |
| | | | 2,641 | | 2,392 | | 1,959 | |
| Less: charged within provisions | | | (182 | ) | (230 | ) | (142 | ) |
|
|
|
|
|
|
|
| |
| | 3 | | 2,459 | | 2,162 | | 1,817 | |
|
|
|
|
|
|
|
| |
| (a) | Post retirement costs include the aggregate service and interest cost of providing post retirement benefits under defined benefit plans, net of the related expected return on plan assets. Additional detail of the amount charged to the income statement in respect of post retirement plans, and the treatment of actuarial gains and losses, is shown in note 46. |
| |
| (b) | Further details of the Groups' share options and other share based payment schemes are given in note 45. |
A-18
Back to Contents
Notes to the 2006 Financial statements
| 5 | IMPAIRMENT REVERSALS AND CHARGES |
| | Pre-tax | | Taxation | | Outside | | Net | | Net | | Net | |
| | | | | | interests | | amount | | amount | | amount | |
| | | | | | | | 2006 | | 2005 | | 2004 | |
| Cash generating unit | | | | | | | US$m | | US$m | | US$m | |
|
|
|
|
|
|
|
|
|
|
|
| |
| Kennecott Utah Copper (KUC) | 614 | | (233 | ) | — | | 381 | | — | | — | |
| Iron Ore Company of Canada (IOC) | 298 | | (110 | ) | (77 | ) | 111 | | — | | — | |
| Argyle Diamonds | (317 | ) | 28 | | — | | (289 | ) | — | | — | |
| Tarong coal mine | (188 | ) | 36 | | — | | (152 | ) | — | | — | |
| Colowyo | — | | — | | — | | — | | — | | (160 | ) |
| Palabora | — | | — | | — | | — | | — | | (161 | ) |
| Other | (11 | ) | 3 | | 1 | | (7 | ) | 4 | | — | |
|
|
|
|
|
|
|
|
|
|
|
| |
| | 396 | | (276 | ) | (76 | ) | 44 | | 4 | | (321 | ) |
|
|
|
|
|
|
|
|
|
|
|
| |
An increase in the Group’s long term copper price assumption triggered an assessment of the recoverable amount of KUC. The value in use was based on cash flows forecast in real terms and discounted at a pre-tax rate of 8%. The KUC impairment provision in 2002 was calculated using a pre-tax discount rate of 6%.
An increase in the Group’s long term iron ore price assumption triggered an assessment of the recoverable amount of IOC. The value in use was based on cash flows forecast in real terms and discounted at a pre-tax rate of 8%. The IOC impairment provision in 2002 aligned the carrying value with the value negotiated between shareholders during that year as part of a financial restructuring exercise.
A continuation of operating losses triggered an assessment of the recoverable amount of Tarong, one of the Group's coal mines in Australia. The value in use was based on cash flows forecast in real terms and discounted at a pre-tax rate of 8%.
The carrying value of Argyle included goodwill and was therefore subject to annual impairment reviews. In the case of Argyle, impairment has occurred earlier than expected as a result of adverse changes in assumptions about future prices, capital and operating costs. The impairment provision included the elimination of the balance of Argyle's goodwill, which amounted to US$223 million. The value in use was based on cash flows forecast in real terms and discounted at a pre-tax rate of 8% which was the same as the discount rate used in the 2005 annual assessment.
Against a background of adverse financial results, including limited production from the underground mine and the strengthening of the rand against the US dollar, an assessment of the recoverable amount of Palabora’s copper business was undertaken in the second half of 2004. This resulted in a provision for asset impairment of US$398 million (US$161 million after tax and outside shareholders’ interests) which aligned the balance sheet value of the assets with their recoverable amount, based on an assessment of fair value less costs to sell.
In line with market practice, fair value was estimated using a discounted cash flow analysis. The price assumption for copper was based on prevailing market prices for the first two years and long term forecast prices thereafter. The Rand exchange rate was forecast principally based on an historical average. The cash flow forecasts were discounted at a pre-tax rate of nine percent.
A detailed review of the mine plan and projected cash flows of the Colowyo coal business was undertaken in June 2004. This cash generating unit is part of RTEA. The review indicated that future operating and development costs would be substantially higher than previously expected. As a consequence, a provision for asset impairment of US$160 million was recognised (US$98 million of intangible assets and US$62 million of property, plant and equipment) based on an assessment of value in use. The pre-tax cash flows were estimated in real terms and discounted at five percent per annum. The major area of uncertainty affecting the write down related to the future operating and development costs of the Colowyo operation, which were estimated over the next 18 years.
| 6 | SHARE OF PROFIT AFTER TAX OF EQUITY ACCOUNTED UNITS |
| | 2006 | | 2005 | | 2004 | |
| | US$m | | US$m | | US$m | |
|
|
|
|
|
| |
| Sales revenue (a) | 2,975 | | 1,709 | | 1,576 | |
| Operating costs | (771 | ) | (504 | ) | (739 | ) |
|
|
|
|
|
| |
| Profit before finance items and taxation | 2,204 | | 1,205 | | 837 | |
| Exchange gains/(losses) on external net debt | 3 | | (17 | ) | 4 | |
| Gain on currency and interest rate derivatives not qualifying for hedge accounting | — | | — | | 1 | |
| Net interest payable | (45 | ) | (40 | ) | (46 | ) |
| Amortisation of discount | (14 | ) | (11 | ) | (11 | ) |
|
|
|
|
|
| |
| Profit before tax | 2,148 | | 1,137 | | 785 | |
|
|
|
|
|
| |
| Taxation | (770 | ) | (361 | ) | (262 | ) |
|
|
|
|
|
| |
| Profit after tax (Rio Tinto share) | 1,378 | | 776 | | 523 | |
|
|
|
|
|
| |
| (a) | The sales revenue of equity accounted units excludes charges by jointly controlled entities to Rio Tinto Group subsidiaries. |
A-19
Back to Contents
Notes to the 2006 Financial statements
| 7 | INTEREST RECEIVABLE AND PAYABLE |
| | | | 2006 | | 2005 | | 2004 | |
| | Note | | US$m | | US$m | | US$m | |
|
|
|
|
|
|
|
| |
| Interest receivable and similar income from: | | | | | | | | |
| – Equity accounted units | | | 27 | | 19 | | 18 | |
| – Other investments | | | 69 | | 55 | | 7 | |
|
|
|
|
|
|
|
| |
| | | | 96 | | 74 | | 25 | |
| Other interest receivable | | | 10 | | 8 | | 3 | |
|
|
|
|
|
|
|
| |
| Total interest receivable | | | 106 | | 82 | | 28 | |
|
|
|
|
|
|
|
| |
| Interest payable and similar charges | | | (220 | ) | (201 | ) | (183 | ) |
| Amounts capitalised | 13 | | 60 | | 28 | | 35 | |
|
|
|
|
|
|
|
| |
| Total Interest payable | | | (160 | ) | (173 | ) | (148 | ) |
|
|
|
|
|
|
|
| |
| | | | 2006 | | 2005 | | 2004 | |
| | | | US$m | | US$m | | US$m | |
|
|
|
|
|
|
|
| |
| UK taxation(a) | | | | | | | | |
| Corporation tax at 30% | | | | | | | | |
| – Current | | | 86 | | 137 | | 17 | |
| – Deduct: relief for overseas taxes | | | (72 | ) | (134 | ) | (15 | ) |
| – Deferred | | | 27 | | (22 | ) | — | |
|
|
|
|
|
|
|
| |
| | | | 41 | | (19 | ) | 2 | |
|
|
|
|
|
|
|
| |
| Australian taxation | | | | | | | | |
| Corporation tax at 30% | | | | | | | | |
| – Current | | | 1,517 | | 1,026 | | 508 | |
| – Deferred | | | (97 | ) | 30 | | (37 | ) |
|
|
|
|
|
|
|
| |
| | | | 1,420 | | 1,056 | | 471 | |
|
|
|
|
|
|
|
| |
| Other countries taxation(a) | | | | | | | | |
| – Current | | | 896 | | 684 | | 169 | |
| – Deferred | | | 16 | | 93 | | (23 | ) |
|
|
|
|
|
|
|
| |
| | | | 912 | | 777 | | 146 | |
|
|
|
|
|
|
|
| |
| Total taxation charge | | | 2,373 | | 1,814 | | 619 | |
|
|
|
|
|
|
|
| |
| – Current | | | 2,427 | | 1,713 | | 679 | |
| – Deferred | 18 | | (54 | ) | 101 | | (60 | ) |
|
|
|
|
|
|
|
| |
| | | | | | | | | |
| (a) | A benefit of US$335 million was recognised in 2006 (2005: US$20 million; 2004: US$15 million) for US AMT credits and operating losses that are expected to be recovered in future years. Of this benefit US$nil (2005: US$20 million; 2004: US$5 million) is included within 'UK taxation' and US$335 million (2005: US$nil; 2004: US$10 million) within 'Other countries'. |
| | |
| | 2006 | | 2005 | | 2004 | |
| | US$m | | US$m | | US$m | |
|
|
|
|
|
| |
| Prima facie tax reconciliation | | | | | | |
| Profit before taxation | 10,240 | | 7,312 | | 3,863 | |
| Deduct: share of profit after tax of equity accounted units | (1,378 | ) | (776 | ) | (523 | ) |
|
|
|
|
|
| |
| Parent companies' and subsidiaries' profit before tax | 8,862 | | 6,536 | | 3,340 | |
| Prima facie tax payable at UK and Australian rate of 30% | 2,659 | | 1,961 | | 1,002 | |
| Impact of items excluded in arriving at underlying earnings (e) | 201 | | (102 | ) | (309 | ) |
| Other permanent differences | | | | | | |
| Additional recognition of deferred tax assets (b) | (335 | ) | — | | — | |
| Utilisation of previously unrecognised deferred tax assets | (140 | ) | (83 | ) | (50 | ) |
| Adjustments to deferred tax liabilities following changes in tax rates (c) | (46 | ) | — | | — | |
| Other tax rates applicable outside the UK and Australia (d) | 242 | | 214 | | 64 | |
| Resource depletion and other depreciation allowances | (187 | ) | (164 | ) | (87 | ) |
| Research, development and other investment allowances | (21 | ) | (21 | ) | (7 | ) |
| Other | — | | 9 | | 6 | |
|
|
|
|
|
| |
| Total taxation charge | 2,373 | | 1,814 | | 619 | |
|
|
|
|
|
| |
| | | | | | | |
| (b) | The "Additional recognition of deferred tax assets" of US$335 million reflects improved prospects for future earnings from the Group's US operations |
| (c) | The "Adjustments to deferred tax liabilities following changes in tax rates", totalling US$46 million, result from a reduction in Canadian tax rates. |
| (d) | The tax reconciliations for all years analyse US tax on a regular tax basis. Previously, US taxes were analysed on an AMT basis. The presentation for 2005 and 2004 has been restated accordingly. |
A-20
Back to Contents
Notes to the 2006 Financial statements
| 8 | TAX ON PROFIT CONTINUED |
| | |
| (e) | An analysis of the impact on the tax reconciliation of items excluded in arriving at Underlying earnings is given below: |
| | 2006 | | 2005 | | 2004 | |
| | US$m | | US$m | | US$m | |
|
|
|
|
|
| |
| Disposals of interests in businesses | — | | (86 | ) | (336 | ) |
| Impairment charges and reversals | 157 | | (1 | ) | 50 | |
| Adjustment to environmental remediation provision | (11 | ) | (26 | ) | — | |
| Exchange gains / losses on external debt, intragroup balances and derivatives not designated as hedges | 55 | | 11 | | (23 | ) |
|
|
|
|
|
| |
| | 201 | | (102 | ) | (309 | ) |
|
|
|
|
|
| |
| (f) | This tax reconciliation relates to the parent companies and subsidiaries. The Group's share of profit of equity accounted units is net of tax charges of US$770 million (2005: US$361 million; 2004: US$262 million). |
| |
| 9 | EARNINGS PER ORDINARY SHARE |
| | 2006 | | 2005 | | 2004 | |
|
|
|
|
|
| |
| Weighted average number of ordinary shares in issue (millions) (b) | 1,333.4 | | 1,364.1 | | 1,379.2 | |
| Effect of dilutive securities (share options) | 5.4 | | 4.4 | | 2.2 | |
|
|
|
|
|
| |
| Diluted weighted average number of ordinary shares in issue (millions) (b) | 1,338.8 | | 1,368.5 | | 1,381.4 | |
|
|
|
|
|
| |
| Net earnings (US$m) | 7,438 | | 5,215 | | 3,297 | |
| | | | | | | |
| Basic earnings per share attributable to ordinary shareholders of Rio Tinto (US cents) | 557.8 | | 382.3 | | 239.1 | |
| Diluted earnings per share attributable to ordinary shareholders of Rio Tinto (US cents) | 555.6 | | 381.1 | | 238.7 | |
|
|
|
|
|
| |
| Underlying earnings (US$m) | 7,338 | | 4,955 | | 2,272 | |
| | | | | | | |
| Basic underlying earnings per share attiributable to ordinary shareholders of Rio Tinto (US cents) | 550.3 | | 363.2 | | 164.8 | |
| Diluted underlying earnings per share attributable to ordinary shareholders of Rio Tinto (US cents) | 548.1 | | 362.1 | | 164.5 | |
|
|
|
|
|
| |
| (a) | Underlying earnings per share are calculated from underlying earnings, detailed information on which is given in note 2. |
| (b) | The weighted average number of shares is calculated as the average number of Rio Tinto plc shares outstanding not held as treasury shares (1,047.7 million) plus the average number of Rio Tinto Limited shares outstanding not held by Rio Tinto plc (285.7 million). |
A-21
Back to Contents
Notes to the 2006 Financial statements
| | 2006 | | 2005 | | 2004 | |
| | US$m | | US$m | | US$m | |
|
|
|
|
|
| |
| Rio Tinto plc previous year Final dividend paid | 442 | | 481 | | 363 | |
| Rio Tinto plc previous year Special dividend paid | 1,171 | | — | | — | |
| Rio Tinto plc Interim dividend paid | 417 | | 412 | | 341 | |
| Rio Tinto Limited previous year Final dividend paid (b) | 118 | | 140 | | 106 | |
| Rio Tinto Limited previous year Special dividend paid (b) | 312 | | — | | — | |
| Rio Tinto Limited Interim dividend paid (b) | 113 | | 110 | | 100 | |
|
|
|
|
|
| |
| Dividends paid during the year | 2,573 | | 1,143 | | 910 | |
|
|
|
|
|
| |
| | 2006 | | 2005 | | 2004 | | 2006 | | 2005 | | 2004 | |
| | Dividends | | Dividends | | Dividends | | Number | | Number | | Number | |
| | per share | | per share | | per share | | of shares | | of shares | | of shares | |
| | | | | | | | (millions) | | (millions) | | (millions) | |
|
|
|
|
|
|
|
|
|
|
|
| |
| Rio Tinto plc previous year Finaland Special (b) | 85.24 | p | 23.94 | p | 18.68 | p | 1,063.9 | | 1,068.0 | | 1,066.7 | |
| Rio Tinto plc Interim (b) | 21.42 | p | 21.75 | p | 17.54 | p | 1,042.7 | | 1,069.3 | | 1,067.5 | |
| Rio Tinto Limited previous year Final and Special – fully franked at 30% (b) | 200.28 | c | 58.29 | c | 44.68 | c | 285.7 | | 311.9 | | 311.6 | |
| Rio Tinto Limited Interim – fully franked at 30% (b) | 52.48 | c | 50.56 | c | 45.53 | c | 285.7 | | 285.4 | | 311.7 | |
|
|
|
|
|
|
|
|
|
|
|
| |
| | | | | | | | | | | | | |
| (a) | The dividends paid in 2006 are based on the following US cents per share amounts: 2005 final– 41.5 cents, 2005 special– 110 cents, 2006 interim– 40.0 cents (2005 dividends paid: 2004 final– 45.0 cents, 2005 interim– 38.5 cents; 2004 dividends paid: 2003 final– 34.0 cents, 2004 interim 32.0 cents). |
| (b) | The number of shares on which the Rio Tinto Limited dividends are based excludes those shares held by Rio Tinto plc, in order that the dividends shown represent those paid to public shareholders. The number of shares on which Rio Tinto plc dividends are based exclude those held as treasury shares. |
| (c) | In addition, the directors of Rio Tinto announced a final dividend of 64.0 cents per share on 1 February 2007. This is expected to result in payments of US$0.9 billion (Rio Tinto plc: US$0.7 billion, Rio Tinto Limited US$0.2 billion). The dividends will be paid on 13 April 2007 to Rio Tinto plc shareholders on the register at the close of business on 9 March 2007 and to Rio Tinto Limited shareholders on the register at the close of business on 14 March 2007. |
| (d) | The proposed Rio Tinto Limited dividends will be franked out of existing franking credits or out of franking credits arising from the payment of income tax during 2007. |
| (e) | The approximate amount of the Rio Tinto Limited consolidated tax group's retained profits and reserves that could be distributed as dividends and franked out of credits, that arose from net payments of income tax in respect of periods up to 31 December 2006 (after deducting franking credits expected to be utilised on the 2006 final dividend declared), is US$4,470 million. |
A-22
Back to Contents
Notes to the 2006 Financial statements
| | 2006 | | 2005 | |
| | US$m | | US$m | |
|
|
|
| |
| Net book value | | | | |
| At 1 January | 1,020 | | 1,075 | |
| Adjustment on currency translation | 49 | | (46 | ) |
| Additions | — | | 5 | |
| Disposals | (5 | ) | — | |
| Impairment charges | (223 | ) | (14 | ) |
|
|
|
| |
| At 31 December | 841 | | 1,020 | |
|
|
|
| |
| – cost | 1,077 | | 1,034 | |
| – accumulated impairment | (236 | ) | (14 | ) |
|
|
|
| |
| At 1 January 2005 | | | | |
|
|
|
| |
| – cost | | | 1,075 | |
| – accumulated impairment | | | — | |
|
|
|
| |
Impairment Tests for Goodwill
Goodwill is reviewed annually for impairment. The amounts as at 31 December 2006 disclosed above include goodwil relating to Australian Iron Ore of US$394 million and goodwill of US$231 million relating to Rio Tinto Energy America (RTEA). Australian Iron Ore comprises the business units located in the Pilbara region of Western Australia that mine iron ore, namely Robe River and Hamersley Iron.
The recoverable amounts of the goodwill relating to Australian Iron Ore and RTEA have been assessed by reference to value in use. The valuations are based on cash flow projections that incorporate best estimates of selling prices, ore grades, production rates, future capital expenditure and production costs over the life of each mine. In line with normal practice in the mining industry, the cash flow projections are based on long term mine plans covering the expected life of each operation. The projections therefore generally cover periods well in excess of five years.
The valuations are particularly sensitive to changes in assumptions about selling prices, operating costs, exchange rates, and discount rates.
Future selling prices and operating costs have been estimated in line with the policy in note 1(i). Long term average selling prices are forecast taking account of estimates of the costs of the producers in each industry sector. To the extent that future coal sales are subject to fixed price contracts, such contracted prices are used. Forecasts of operating costs are based on detailed mine plans which take account of all relevant characteristics of the ore body.
Exchange rate assumptions are based on the spot rates as of the time of the annual goodwill impairment review. For the Australian dollar, an exchange rate US$0.76 was used.
Discount rates represent an estimate of the rate the market would apply having regard to the time value of money and the risks specific to the asset for which the future cash flow estimates have not been adjusted. The Group's weighted average cost of capital is used as a start point for determining the discount rate with appropriate adjustments for the risk profile of the individual cash generating unit. Goodwill relating to Australian Iron Ore and RTEA has been reviewed applying a discount rate of 6.5% to thepost-tax cash flows expressed in real terms.
Impact of Reasonably Possible Changes in Key Assumptions
Australian Iron Ore
It does not appear that any reasonably possible change in the key assumptions on which Australian Iron Ore's recoverable amount is based would cause its value to fall short of its carrying amount at 31 December 2006.
RTEA
The recoverable amount of goodwill relating to RTEA is similar to its carrying value at 31 December 2006. Thus, any significant adverse change in the valuation assumptions would cause its carrying value to exceed its recoverable amount.
Other
Under IAS 36, goodwill is no longer amortised but is reviewed annually for impairment. The Group's business relates to the mining and processing of finite resources and it is therefore likely that impairments of certain elements of the goodwill may occur at some stage in the future as resources are depleted. For this reason, the value of the goodwill related to RTEA is likely to fall short of its carrying value in the near future.
A-23
Back to Contents
Notes to the 2006 Financial statements
| | Exploration | | Other | | | |
| | and | | intangible | | Total | |
| Year ended 31 December 2006 | evaluation (a) | | assets (a) | | US$m | |
|
|
|
|
|
| |
| Net book value | | | | | | |
| At 1 January 2006 | 113 | | 107 | | 220 | |
| Adjustment on currency translation | 5 | | 10 | | 15 | |
| Expenditure during year | 72 | | 118 | | 190 | |
| Amortisation for the year | — | | (27 | ) | (27 | ) |
| Disposals, transfers and other movements | 6 | | (20 | ) | (14 | ) |
|
|
|
|
|
| |
| At 31 December 2006 | 196 | | 188 | | 384 | |
|
|
|
|
|
| |
| – cost | 196 | | 310 | | 506 | |
| – accumulated amortisation | — | | (122 | ) | (122 | ) |
|
|
|
|
|
| |
| | | | | | | |
| | Exploration | | Other | | | |
| | and | | intangible | | Total | |
| Year ended 31 December 2005 | evaluation | | assets | | US$m | |
|
|
|
|
|
| |
| Net book value | | | | | | |
| At 1 January 2005 | 91 | | 98 | | 189 | |
| Adjustment on currency translation | (5 | ) | (4 | ) | (9 | ) |
| Expenditure during year | 38 | | 29 | | 67 | |
| Amortisation for the year | — | | (19 | ) | (19 | ) |
| Disposals, transfers and other movements | (11 | ) | 3 | | (8 | ) |
|
|
|
|
|
| |
| At 31 December 2005 | 113 | | 107 | | 220 | |
|
|
|
|
|
| |
| – cost | 113 | | 327 | | 440 | |
| – accumulated amortisation | — | | (220 | ) | (220 | ) |
|
|
|
|
|
| |
| At 1 January 2005 | | | | | | |
|
|
|
|
|
| |
| – cost | 91 | | 305 | | 396 | |
| – accumulated amortisation | — | | (207 | ) | (207 | ) |
|
|
|
|
|
| |
| (a) | All of the net book value is related to intangible assets with finite lives. The following useful lives have been determined for the classes of intangible assets: |
| | | Exploration and evaluation: useful life not determined until transferred to property, plant & equipment |
| | | Other intangible assets: 2 to 20 years |
| (b) | There are no intangible assets either pledged as security or held under restriction of title. |
| (c) | The estimated aggregate amortisation expense for each of the next five years is generally consistent with that recognised in 2006. |
Exploration and evaluation expenditure
The charge for the year and the net amount of intangible assets capitalised during the year are as follows:
| | 2006 | | 2005 | |
| | US$m | | US$m | |
|
|
|
| |
| Cash expenditure in year (net of proceeds on disposal of undeveloped properties) | 345 | | 264 | |
| Changes in accruals (including non-cash proceeds on disposal of undeveloped properties) | (36 | ) | 24 | |
| Amount capitalised during year | (72 | ) | (38 | ) |
|
|
|
| |
| Charge for year | 237 | | 250 | |
|
|
|
| |
A-24
Back to Contents
Notes to the 2006 Financial statements
| 13 | PROPERTY, PLANT AND EQUIPMENT |
| | Mining | | Land | | Plant | | Capital | | | |
| | properties | | and | | and | | works in | | Total | |
| Year ended 31 December 2006 | and leases (a) | | buildings | | equipment | | progress (g) | | US$m | |
|
|
|
|
|
|
|
|
|
| |
| Net book value | | | | | | | | | | |
| At 1 January 2006 | 5,224 | | 2,019 | | 8,678 | | 1,699 | | 17,620 | |
| Adjustment on currency translation | 261 | | 88 | | 411 | | 105 | | 865 | |
| Capitalisation of additional closure costs (note 26) | 619 | | — | | — | | — | | 619 | |
| Interest capitalised (b) | 5 | | — | | 3 | | 52 | | 60 | |
| Other additions | 436 | | 194 | | 986 | | 2,278 | | 3,894 | |
| Depreciation for the year | (392 | ) | (159 | ) | (891 | ) | — | | (1,442 | ) |
| Impairment reversals less charges | (166 | ) | 90 | | 752 | | (2 | ) | 674 | |
| Disposals | (25 | ) | (13 | ) | (50 | ) | (21 | ) | (109 | ) |
| Transfers and other movements (c) | 165 | | 321 | | 950 | | (1,410 | ) | 26 | |
|
|
|
|
|
|
|
|
|
| |
| At 31 December 2006 | 6,127 | | 2,540 | | 10,839 | | 2,701 | | 22,207 | |
|
|
|
|
|
|
|
|
|
| |
| – cost | 9,166 | | 4,454 | | 21,553 | | 2,835 | | 38,008 | |
| – accumulated depreciation | (3,039 | ) | (1,914 | ) | (10,714 | ) | (134 | ) | (15,801 | ) |
|
|
|
|
|
|
|
|
|
| |
| Fixed assets held under finance leases (d) | — | | 39 | | 38 | | — | | 77 | |
| Other fixed assets pledged as security (e) | 35 | | — | | 1,154 | | — | | 1,189 | |
|
|
|
|
|
|
|
|
|
| |
| | Mining | | Land | | Plant | | Capital | | | |
| | properties | | and | | and | | works in | | Total | |
| Year ended 31 December 2005 | and leases (a) | | buildings | | equipment | | progress (g) | | US$m | |
|
|
|
|
|
|
|
|
|
| |
| Net book value | | | | | | | | | | |
| At 1 January 2005 | 5,195 | | 2,048 | | 7,854 | | 1,624 | | 16,721 | |
| Adjustment on currency translation | (206 | ) | (43 | ) | (306 | ) | (52 | ) | (607 | ) |
| Capitalisation of additional closure costs (note 26) | 346 | | — | | — | | — | | 346 | |
| Interest capitalised (b) | 2 | | — | | 7 | | 19 | | 28 | |
| Other additions | 206 | | 60 | | 577 | | 1,650 | | 2,493 | |
| Depreciation for the year | (406 | ) | (109 | ) | (800 | ) | — | | (1,315 | ) |
| Impairment charges | — | | (2 | ) | — | | — | | (2 | ) |
| Disposals | — | | (7 | ) | (39 | ) | — | | (46 | ) |
| Transfers and other movements (c) | 87 | | 72 | | 1,385 | | (1,542 | ) | 2 | |
|
|
|
|
|
|
|
|
|
| |
| At 31 December 2005 | 5,224 | | 2,019 | | 8,678 | | 1,699 | | 17,620 | |
|
|
|
|
|
|
|
|
|
| |
| – cost | 7,686 | | 3,824 | | 19,382 | | 1,838 | | 32,730 | |
| – accumulated depreciation | (2,462 | ) | (1,805 | ) | (10,704 | ) | (139 | ) | (15,110 | ) |
|
|
|
|
|
|
|
|
|
| |
| At 1 January 2005 | | | | | | | | | | |
|
|
|
|
|
|
|
|
|
| |
| – cost | 7,285 | | 3,809 | | 18,605 | | 1,760 | | 31,459 | |
| – accumulated depreciation | (2,090 | ) | (1,761 | ) | (10,751 | ) | (136 | ) | (14,738 | ) |
|
|
|
|
|
|
|
|
|
| |
| Fixed assets held under finance leases (d) | — | | 16 | | 140 | | — | | 156 | |
| Other fixed assets pledged as security (e) | 44 | | — | | 804 | | — | | 848 | |
|
|
|
|
|
|
|
|
|
| |
| (a) | Mining properties include deferred stripping costs of US$778 million (2005: US$699 million). |
| (b) | Interest is capitalised at a rate based on the Group's cost of borrowing or at the rate on project specific debt, where applicable. |
| (c) | 'Transfers and other movements' includes reclassifications between categories. |
| (d) | The finance leases under which these assets are held are disclosed in note 22. |
| (e) | Excludes assets held under finance leases. Fixed assets pledged as security represent amounts pledged as collateral against US$339 million (2005: US$354 million) of loans, which are included in note 21. |
| (f) | At 31 December, the net balance sheet amount for land and buildings includes amounts as follows: |
| | | 2006 | | 2005 | |
| | | US$m | | US$m | |
|
|
|
|
| |
| | Freehold | 2,445 | | 1,889 | |
| | Long leasehold | 92 | | 128 | |
| | Short leasehold | 3 | | 2 | |
|
|
|
|
| |
| | | 2,540 | | 2,019 | |
|
|
|
|
| |
| (g) | Accumulated depreciation on 'Capital works in progress' at 1 January 2005 relates to an impairment charge made in 2002. | | | | |
A-25
Back to Contents
Notes to the 2006 Financial statements
| 14 | INVESTMENTS IN EQUITY ACCOUNTED UNITS |
| | 2006 | | 2005 | |
| Summary balance sheet (Rio Tinto share) | US$m | | US$m | |
|
|
|
| |
| Rio Tinto's share of assets | | | | |
| Non-current assets | 3,654 | | 3,248 | |
| Current assets | 1,029 | | 929 | |
|
|
|
| |
| | 4,683 | | 4,177 | |
|
|
|
| |
| Rio Tinto's share of liabilities | | | | |
| Current liabilities | (763 | ) | (706 | ) |
| Non-current liabilities and provisions | (1,685 | ) | (1,642 | ) |
|
|
|
| |
| | (2,448 | ) | (2,348 | ) |
|
|
|
| |
| Rio Tinto's share of net assets | 2,235 | | 1,829 | |
|
|
|
| |
| (a) | Further details of investments in jointly controlled entities and associates are set out in notes 36 and 37. |
| (b) | At 31 December 2006, the quoted value of associates having shares listed on recognised stock exchanges was US$368 million (2005: no such associates). |
| 15 | NET DEBT OF EQUITY ACCOUNTED UNITS (EXCLUDING AMOUNTS DUE TO RIO TINTO) |
| | | | Rio Tinto | | | | Rio Tinto | |
| | Rio Tinto | | share of | | Rio Tinto | | share of | |
| | percentage | | net debt | | percentage | | net debt | |
| | 2006 | | 2006 | | 2005 | | 2005 | |
| | % | | US$m | | % | | US$m | |
|
|
|
|
|
|
|
| |
| Jointly controlled entities | | | | | | | | |
| Minera Escondida Limitada | 30.0 | | 300 | | 30.0 | | 260 | |
| Queensland Alumina Limited (QAL) | 38.6 | | 44 | | 38.6 | | 106 | |
| Associates | | | | | | | | |
| Tisand (Pty) Limited | 49.0 | | 100 | | 49.0 | | 119 | |
| Port Waratah Coal Services | 27.6 | | 122 | | 27.6 | | 91 | |
| Other equity accounted units | | | (107 | ) | | | (40 | ) |
|
|
|
|
|
|
|
| |
| | | | 459 | | | | 536 | |
|
|
|
|
|
|
|
| |
| (a) | In accordance with IAS 28 and IAS 31, the Group includes its net investment in equity accounted units in its consolidated balance sheet. This investment is net of the Group's share of the net debt of such units, which is set out above. |
| (b) | Some of the debt of equity accounted units is subject to financial and general covenants. |
A-26
Back to Contents
Notes to the 2006 Financial statements
| | 2006 | | 2005 | |
| | US$m | | US$m | |
|
|
|
| |
| Raw materials and purchased components | 448 | | 277 | |
| Consumable stores | 581 | | 428 | |
| Work in progress | 459 | | 553 | |
| Finished goods and goods for resale | 1,151 | | 931 | |
|
|
|
| |
| | 2,639 | | 2,189 | |
|
|
|
| |
| Comprising: | | | | |
| Expected to be used within one year | 2,540 | | 2,048 | |
| Expected to be used after more than one year | 99 | | 141 | |
|
|
|
| |
| | 2,639 | | 2,189 | |
|
|
|
| |
| (a) | No inventories were pledged as security for liabilities at 31 December 2006 or 2005. |
| 17 | TRADE AND OTHER RECEIVABLES |
| | Non-current | | Current | | Non-current | | Current | |
| | 2006 | | 2006 | | 2005 | | 2005 | |
| | US$m | | US$m | | US$m | | US$m | |
|
|
|
|
|
|
|
| |
| Trade debtors | 56 | | 2,133 | | 4 | | 1,730 | |
| Amounts due from equity accounted units | — | | 156 | | 1 | | 95 | |
| Other debtors | 35 | | 479 | | 21 | | 546 | |
| Pension surpluses (note 46) | 329 | | 31 | | 167 | | 33 | |
| Prepayment of tolling charges to jointly controlled entities (a) | 492 | | — | | 434 | | — | |
| Other prepayments and accrued income | 91 | | 145 | | 79 | | 108 | |
| Provision for doubtful debts | (20 | ) | (6 | ) | (3 | ) | (24 | ) |
|
|
|
|
|
|
|
| |
| | 983 | | 2,938 | | 703 | | 2,488 | |
|
|
|
|
|
|
|
| |
| (a) | Rio Tinto Aluminium has made certain prepayments to jointly controlled entities for toll processing of bauxite and alumina. These prepayments will be charged to Group operating costs as processing takes place. |
| (b) | There is no material element of trade and other receivables that is interest bearing. |
A-27
Back to Contents
Notes to the 2006 Financial statements
| | 2006 | | 2005 | |
| | US$m | | US$m | |
|
|
|
| |
| At 1 January | 2,142 | | 2,107 | |
| Adjustment on currency translation | 97 | | (69 | ) |
| (Credited)/charged to the income statement | (54 | ) | 101 | |
| Credited to SORIE (a) | (94 | ) | (60 | ) |
| Other movements (b) | 23 | | 63 | |
|
|
|
| |
| At 31 December | 2,114 | | 2,142 | |
|
|
|
| |
| Comprising: | | | | |
| – deferred tax liabilities (c) | 2,339 | | 2,197 | |
| – deferred tax (assets) (c) | (225 | ) | (55 | ) |
|
|
|
| |
Deferred tax balances for which there is a right of offset within the same jurisdiction are presented net on the face of thebalance sheet as permitted by IAS12. The closing deferred tax liabilities and assets, prior to this offsetting of balances, areshown below.
| | UK | | Australian | | Other | | 2006 | | 2005 | |
| | tax | | tax | | countries' | | Total | | Total | |
| | | | | | tax | | US$m | | US$m | |
|
|
|
|
|
|
|
|
|
| |
| Deferred tax liabilities arising from: | | | | | | | | | | |
| Accelerated capital allowances | 2 | | 1,422 | | 1,757 | | 3,181 | | 2,096 | |
| Post retirement benefits | 83 | | 9 | | 2 | | 94 | | 48 | |
| Unremitted earnings | — | | — | | 226 | | 226 | | 219 | |
| Other temporary differences | 3 | | 118 | | — | | 121 | | 388 | |
|
|
|
|
|
|
|
|
|
| |
| | 88 | | 1,549 | | 1,985 | | 3,622 | | 2,751 | |
|
|
|
|
|
|
|
|
|
| |
| Deferred tax assets arising from: | | | | | | | | | | |
| Capital allowances | — | | — | | (100 | ) | (100 | ) | (51 | ) |
| Provisions | (37 | ) | (147 | ) | (551 | ) | (735 | ) | (288 | ) |
| Post retirement benefits | (18 | ) | (2 | ) | (265 | ) | (285 | ) | (118 | ) |
| Tax losses | — | | — | | (301 | ) | (301 | ) | (50 | ) |
| Other temporary differences | — | | — | | (87 | ) | (87 | ) | (102 | ) |
|
|
|
|
|
|
|
|
|
| |
| | (55 | ) | (149 | ) | (1,304 | ) | (1,508 | ) | (609 | ) |
|
|
|
|
|
|
|
|
|
| |
| (Credited)/charged to the income statement | | | | | | | | | | |
| Accelerated capital allowances | — | | (63 | ) | 343 | | 280 | | 191 | |
| Provisions | (1 | ) | 9 | | (13 | ) | (5 | ) | (78 | ) |
| Post retirement benefits | 2 | | (1 | ) | 15 | | 16 | | 3 | |
| Tax losses | 33 | | 3 | | (316 | ) | (280 | ) | — | |
| Tax on unremitted earnings | — | | (2 | ) | — | | (2 | ) | (1 | ) |
| Other temporary differences | (7 | ) | (43 | ) | (13 | ) | (63 | ) | (14 | ) |
|
|
|
|
|
|
|
|
|
| |
| | 27 | | (97 | ) | 16 | | (54 | ) | 101 | |
|
|
|
|
|
|
|
|
|
| |
| (a) | The amounts credited directly to the SORIE relate to the provisions for tax on exchange differences on intra-group loans qualifying for reporting as part of the net investment in subsidiaries, on cash flow hedges and on actuarial gains and losses on pension schemes and post retirement healthcare plans. |
| (b) | 'Other movements' include deferred tax recognised by subsidiary holding companies that is presented in these accounts as part of the tax charge on the profits of the equity accounted unit to which it relates. |
| (c) | The deferred tax liability of US$2,339 million (2005: US$2,197 million) includes US$1,764 million (2005: US$1,678 million) due in more than one year. The deferred tax asset of US$225 million (2005: US$55 million) includes US$139 million (2005 US$18 million) receivable in more than one year. |
| (d) | US$763 million (2005: US$1,399 million) of potential deferred tax assets have not been recognised as an asset in these accounts. There is no time limit for the recovery of these potential assets, the majority of which relate to capital losses, recovery of which depends on realisation of capital gains in future years. |
| (e) | Deferred tax is not recognised on the unremitted earnings of overseas subsidiaries and jointly controlled entities where the Group is able to control the timing of the remittance and it is probable that there will be no remittance in the foreseeable future. If these earnings were remitted, tax of US$1,711 million (2005: US$1,099 million) would be payable. |
| (f) | There is a limited time period for the recovery of US$nil (2005:US$5 million) of tax losses which have been recognised as deferred tax assets in the accounts. |
A-28
Back to Contents
Notes to the 2006 Financial statements
| | Non-current | | Current | | Non-current | | Current | |
| | 2006 | | 2006 | | 2005 | | 2005 | |
| | US$m | | US$m | | US$m | | US$m | |
|
|
|
|
|
|
|
| |
| Currency and commodity contracts: hedges | 42 | | 36 | | 46 | | 28 | |
| Derivatives and embedded derivatives not related to net | | | | | | | | |
| debt: non-hedge (a) | — | | 122 | | — | | 138 | |
| Derivatives related to net debt | 3 | | 352 | | 254 | | 62 | |
| US Treasury bonds | 20 | | — | | 19 | | 90 | |
| Equity shares and quoted funds | 125 | | 51 | | 42 | | 30 | |
| Other investments, including loans | 184 | | — | | 92 | | 183 | |
| Other liquid resources (non-cash equivalent) | — | | 6 | | — | | 5 | |
|
|
|
|
|
|
|
| |
| | 374 | | 567 | | 453 | | 536 | |
|
|
|
|
|
|
|
| |
| (a) | Non-hedge derivatives and embedded derivatives include amounts of US$82 million (2005: US$95 million) which mature beyond one year. |
| (b) | Detailed information relating to the interest and maturity profile of other financial assets is given in note 32. |
| 20 | CASH AND CASH EQUIVALENTS |
| | 2006 | | 2005 | |
| | US$m | | US$m | |
|
|
|
| |
| Cash at bank and in hand | 555 | | 348 | |
| Short term bank deposits | 181 | | 2,031 | |
|
|
|
| |
| | 736 | | 2,379 | |
|
|
|
| |
| Bank overdrafts repayable on demand (unsecured) | (14 | ) | (12 | ) |
|
|
|
| |
| Balance per Group cash flow statement | 722 | | 2,367 | |
|
|
|
| |
| (a) | Cash and cash equivalents include US$55 million (2005: US$50 million) for which there are restrictions on remittances. |
| (b) | Additional information on cash and cash equivalents under US GAAP is given note 48 Reconciliation to US Accounting Principles. |
A-29
Back to Contents
Notes to the 2006 Financial statements
| | | | Non-current | | Current | | Non-current | | Current | |
| | | | 2006 | | 2006 | | 2005 | | 2005 | |
| | Note | | US$m | | US$m | | US$m | | US$m | |
|
|
|
|
|
|
|
|
|
| |
| Borrowings at 31 December | | | | | | | | | | |
| Bank loans | | | 157 | | 156 | | 162 | | 148 | |
| Other loans | | | | | | | | | | |
| Finance leases | 22 | | 96 | | 25 | | 93 | | 19 | |
| Rio Tinto Finance (USA) Limited Bonds 5.75% 2006 | | | — | | — | | — | | 502 | |
| Rio Tinto Finance (USA) Limited Bonds 2.625% 2008 | | | 586 | | — | | 581 | | — | |
| Rio Tinto Finance (USA) Limited Bonds 7.125% 2013 | | | 100 | | — | | 100 | | — | |
| Colowyo Coal Company L.P. Bonds 9.56% 2011 | | | 40 | | 7 | | 47 | | 5 | |
| Colowyo Coal Company L.P. Bonds 10.19% 2016 | | | 100 | | — | | 100 | | — | |
| European Medium Term Notes (a) | | | 430 | | 1,195 | | 1,179 | | 424 | |
| Other secured loans | | | 241 | | 7 | | 233 | | 2 | |
| Other unsecured loans | | | 257 | | 100 | | 288 | | 90 | |
|
|
|
|
|
|
|
|
|
| |
| Total borrowings | | | 2,007 | | 1,490 | | 2,783 | | 1,190 | |
|
|
|
|
|
|
|
|
|
| |
| (a) | The Group has a US$3 billion European Medium Term Note programme for the issuance of debt, of which approximately US$1.6 billion was drawn down at 31 December 2006. |
| (b) | Certain fixed rate borrowings shown above are swapped to floating rates. Details of interest rate and currency swaps and of available standby credit are shown in note 32. |
| (c) | Of the Group's US$3.5 billion borrowings, some US$0.7 billion relates to non-recourse borrowings that are the subject of various financial and general covenants with which the respective borrowers are in compliance as of 31 December 2006. |
| 22 | CAPITALISED FINANCE LEASES |
| | 2006 | | 2005 | |
| | US$m | | US$m | |
|
|
|
| |
| Present value of minimum lease payments | | | | |
| Total minimum lease payments | 141 | | 118 | |
| Effect of discounting | (20 | ) | (6 | ) |
|
|
|
| |
| | 121 | | 112 | |
|
|
|
| |
| Maturity of capitalised finance leases | | | | |
| Due within one year | 25 | | 19 | |
| Between 1 year and 5 years | 52 | | 54 | |
| More than 5 years | 44 | | 39 | |
|
|
|
| |
| | 121 | | 112 | |
|
|
|
| |
| | 2006 | | 2005 | |
| | Net debt | | Net debt | |
| | US$m | | US$m | |
|
|
|
| |
| Analysis of changes in consolidated net debt | | | | |
| Opening balance | (1,313 | ) | (3,819 | ) |
| Adjustment on currency translation | (56 | ) | 96 | |
| Exchange gains recognised in the income statement | 38 | | 13 | |
| Gains/(losses) on derivatives related to net debt | 44 | | (85 | ) |
| Cash flows excluding exchange movements | (1,146 | ) | 2,546 | |
| Other movements | (4 | ) | (64 | ) |
|
|
|
| |
| Closing balance | (2,437 | ) | (1,313 | ) |
|
|
|
| |
A-30
Back to Contents
Notes to the 2006 Financial statements
| 23 | CONSOLIDATED NET DEBT CONTINUED |
| | 2006 | | 2005 | |
| | Net debt | | Net debt | |
| | US$m | | US$m | |
|
|
|
| |
| Reconciliation to balance sheet categories | | | | |
| Borrowings (note 21) | (3,497 | ) | (3,973 | ) |
| Bank overdrafts repayable on demand (note 20) | (14 | ) | (12 | ) |
| Cash and cash equivalents (note 20) | 736 | | 2,379 | |
| Other liquid resources (note 19) | 6 | | 5 | |
| Derivatives related to net debt (note 32) | 332 | | 288 | |
|
|
|
| |
| Balances per above | (2,437 | ) | (1,313 | ) |
|
|
|
| |
| | 2006 | | 2005 | |
| | US$m | | US$m | |
|
|
|
| |
| Exchange gains/(losses) on external net debt and intragroup balances | | | | |
| Exchange gains on external net debt | 38 | | 13 | |
| Exchange (losses) on intragroup balances | (5 | ) | (145 | ) |
| Exchange gain on settlement of dividend | 13 | | 4 | |
|
|
|
| |
| Credited/(charged) to income statement | 46 | | (128 | ) |
|
|
|
| |
| (a) | Further information relating to the currency and interest rate exposures arising from net debt and related derivatives is given in note 32 on Financial Instruments. |
| 24 | TRADE AND OTHER PAYABLES |
| | Non-current | | Current | | Non-current | | Current | |
| | 2006 | | 2006 | | 2005 | | 2005 | |
| | US$m | | US$m | | US$m | | US$m | |
|
|
|
|
|
|
|
| |
| Trade creditors | — | | 1,291 | | — | | 1,055 | |
| Amounts owed to equity accounted units | — | | 143 | | — | | 199 | |
| Other creditors (a) | 190 | | 212 | | 123 | | 281 | |
| Employee entitlements | — | | 187 | | — | | 167 | |
| Royalties and mining taxes | — | | 264 | | — | | 218 | |
| Accruals and deferred income | 107 | | 595 | | 106 | | 268 | |
| Government grants deferred | 65 | | 1 | | 40 | | 2 | |
|
|
|
|
|
|
|
| |
| | 362 | | 2,693 | | 269 | | 2,190 | |
|
|
|
|
|
|
|
| |
| (a) | 'Other creditors' include deferred consideration of US$179 million (2005: US$179 million) relating to certain assets acquired. The deferred consideration is included at its net present value. The amortisation of the discount applied in establishing the net present value is treated as a finance cost. All other accounts payable and accruals are non-interest bearing. |
| 25 | OTHER FINANCIAL LIABILITIES |
| | Non-current | | Current | | Non-current | | Current | |
| | 2006 | | 2006 | | 2005 | | 2005 | |
| | US$m | | US$m | | US$m | | US$m | |
|
|
|
|
|
|
|
| |
| Forward commodity contracts: hedges | 214 | | 162 | | 93 | | 57 | |
| Derivatives related to net debt | 19 | | 4 | | 20 | | 8 | |
| Other derivatives and embedded derivatives: non-hedge | — | | 27 | | — | | 21 | |
|
|
|
|
|
|
|
| |
| | 233 | | 193 | | 113 | | 86 | |
|
|
|
|
|
|
|
| |
| (a) | Detailed information relating to other financial liabilities is given in note 32. |
A-31
Back to Contents
Notes to the 2006 Financial statements
| 26 | PROVISIONS (NOT INCLUDING TAXATION) |
| | Pensions | | Other | | Close down | | Other | | 2006 | | 2005 | |
| | and post | | employee | | & | | | | Total | | Total | |
| | retirement | | entitlements | | restoration/ | | | | | | | |
| | healthcare | | | | environmental | | | | US$m | | US$m | |
|
|
|
|
|
|
|
|
|
|
|
| |
| At 1 January | 996 | | 328 | | 2,693 | | 169 | | 4,186 | | 3,943 | |
| Adjustment on currency translation | 1 | | 21 | | 82 | | 9 | | 113 | | (86 | ) |
| Amounts capitalised | — | | — | | 619 | | — | | 619 | | 346 | |
| Charged to profit: | | | | | | | | | | | | |
| – new provisions | — | | 17 | | — | | 8 | | 25 | | 72 | |
| – increases to existing provisions | 97 | | 86 | | 92 | | 2 | | 277 | | 223 | |
| – unused amounts reversed | — | | (33 | ) | (193 | ) | (16 | ) | (242 | ) | (93 | ) |
| Amortisation of discount | — | | — | | 137 | | — | | 137 | | 111 | |
| Utilised in year | (79 | ) | (69 | ) | (67 | ) | (56 | ) | (271 | ) | (261 | ) |
| Actuarial (gains) recognised in equity | (245 | ) | — | | — | | — | | (245 | ) | (55 | ) |
| Transfers and other movements | — | | 43 | | (4 | ) | 30 | | 69 | | (14 | ) |
|
|
|
|
|
|
|
|
|
|
|
| |
| At 31 December | 770 | | 393 | | 3,359 | | 146 | | 4,668 | | 4,186 | |
|
|
|
|
|
|
|
|
|
|
|
| |
| Balance sheet analysis: | | | | | | | | | | | | |
| Current | | | | | | | | | 366 | | 321 | |
| Non-current | | | | | | | | | 4,302 | | 3,865 | |
|
|
|
|
|
|
|
|
|
|
|
| |
| Total | | | | | | | | | 4,668 | | 4,186 | |
|
|
|
|
|
|
|
|
|
|
|
| |
| (a) | The main assumptions used to determine the provision for pensions and post retirement healthcare and other information, including the expected level of future funding payments in respect of those arrangements, are given in note 46. |
| (b) | The provision for other employee entitlements includes a provision for long service leave of US$86 million (2005: US$122 million), based on the relevant entitlements in certain Group operations. |
| (c) | The Group's policy on close down and restoration costs is described in note 1(k). Close down and restoration costs are a normal consequence of mining, and the majority of close down and restoration expenditure is incurred at the end of the relevant operation. Remaining lives of mines and infrastructure range from 1 to over 50 years with an average, weighted by closure provision, of around 14 years (2005: 16 years). Although the ultimate cost to be incurred is uncertain, the Group's businesses estimate their respective costs based on feasibility and engineering studies using current restoration standards and techniques. Provisions of US$3,359 million (2005: US$2,693 million) for close down and restoration costs and environmental clean up obligations include estimates of the effect of future inflation and have been adjusted to reflect risk. |
| | These estimates have been discounted to their present value at approximately 5 per cent (2005: 5.5 per cent) per annum, being an estimate of the risk free pre-tax cost of borrowing. Excluding the effects of future inflation, but before discounting, this provision is equivalent to some US$4.7 billion (2005: US$4.0 billion). |
| (d) | Some US$50 million of environmental clean up expenditure is expected to take place within the next five years. The remainder includes amounts for the operation and maintenance of remediation facilities in later years. The provision for environmental clean up expenditure includes the issue described in (e) below. |
| (e) | In 1995, Kennecott Utah Copper ('KUC') agreed with the US Environmental Protection Agency ('EPA') and the State of Utah to complete certain source control projects and perform specific environmental studies regarding contamination of ground water in the vicinity of the Bingham Canyon mine. A remedial investigation and feasibility study on the South Zone ground water contamination, completed in March 1998, identified a range of alternative measures to address this issue. Additional studies were conducted to refine the workable alternatives. A remedial design document was completed in 2002. A joint proposal and related agreements with the State of Utah Natural Resource Damage Trustee, the State of Utah and the Jordan Valley Water Conservancy District were approved in 2004. KUC also anticipates entering into a formal agreement with the EPA in 2007, on the remedial action. |
| | The provision was reduced by US$37 million during 2006 (2005: US$84 million) following a reassessment of the expected cost of remediation and the expected timing of the expenditure to reflect recent experience. The ultimate cost of remediation remains uncertain, being dependent on the responsiveness of the contamination to pumping and acid neutralisation. |
| (f) | Other provisions deal with a variety of issues and include US$22 million (2005: US$33 million) relating to amounts received from employees for accommodation at some sites which are refundable in certain circumstances. |
| (g) | Provisions for close down, restoration and environmental obligations increased by US$279 million (2005: US$207 million) as a result of a reduction in the discount rate. Of this amount, US$221 million (2005: US$172 million) is included in 'Amounts capitalised'. |
A-32
Back to Contents
Notes to the 2006 Financial statements
| 27 | SHARE CAPITAL - RIO TINTO PLC |
| | 2006 | | 2005 | | 2006 | | 2005 | |
| | Number (m) | | Number (m) | | US$m | | US$m | |
|
|
|
|
|
|
|
| |
| Issued and fully paid up share capital | | | | | | | | |
| At 1 January | 1,071.02 | | 1,068.02 | | 172 | | 172 | |
| Ordinary shares issued (a) | 1.27 | | 3.00 | | — | | — | |
| Own shares purchased (b) | (0.80 | ) | — | | — | | — | |
| Special voting share of 10p (d) | 1 only | | 1 only | | — | | — | |
| DLC dividend share of 10p (d) | 1 only | | 1 only | | — | | — | |
|
|
|
|
|
|
|
| |
| At 31 December | 1,071.49 | | 1,071.02 | | 172 | | 172 | |
|
|
|
|
|
|
|
| |
| – shares repurchased and held in treasury (b) | 47.82 | | 2.60 | | — | | — | |
| – shares held by public | 1,023.67 | | 1,068.42 | | — | | — | |
|
|
|
|
|
|
|
| |
| Unissued share capital | | | | | | | | |
| Ordinary shares of 10p each | 349.74 | | 350.21 | | 51 | | 51 | |
| Equalisation share of 10p (d) | 1 only | | 1 only | | — | | — | |
|
|
|
|
|
|
|
| |
| Total authorised share capital | 1,421.23 | | 1,421.23 | | 223 | | 223 | |
|
|
|
|
|
|
|
| |
| (a) | 1,265,570 Ordinary shares were issued, and 1,117,021 Ordinary shares reissued from treasury during the year resulting from the exercise of options under Rio Tinto plc employee share option schemes at contracted prices between 808.8p and 1,925p (2005: 3,000,155 shares issued at prices between 809p and 1,459p). |
| (b) | At the 2006 annual general meeting, the shareholders renewed the general authority for the Company to buy back up to 10 per cent of its Ordinary shares of 10p each for a further period of 12 months. Rio Tinto is seeking renewal of this approval at its annual general meeting in 2007. During the year to 31 December 2006, 46,340,000 shares were bought back and held in treasury (2005: 2,600,000) at an average buy back price of £27.27 per share (2005: £22.47), and 800,000 (2005: nil) shares were bought back at an average buy back price of £27.36 (2005: nil) and cancelled. The total consideration paid was US$2,394 million (2005: US$103 million). |
| (c) | The aggregate consideration received for shares issued during 2006 was US$31 million (2005: US$66 million ). The aggregate consideration received for treasury shares reissued was US$24 million (2005: nil). |
| (d) | The 'Special Voting Share' was issued to facilitate the joint voting by shareholders of Rio Tinto plc and Rio Tinto Limited on Joint Decisions, following the DLC merger. Directors have the ability to issue an equalisation share if that is required under the terms of the DLC Merger Sharing Agreement. The 'DLC Dividend Share' was issued to facilitate the efficient management of funds within the DLC structure. |
| (e) | Information relating to share options and other share based incentive schemes is given in note 45 on share based payments. |
A-33
Back to Contents
Notes to the 2006 Financial statements
| 28 | SHARE CAPITAL - RIO TINTO LIMITED |
| | 2006 | | 2005 | | 2006 | | 2005 | |
| | Number (m) | | Number (m) | | US$m | | US$m | |
|
|
|
|
|
|
|
| |
| Share capital account | | | | | | | | |
| At 1 January | 285.75 | | 311.90 | | 1,019 | | 1,133 | |
| Adjustment on currency translation | | | | | 80 | | (65 | ) |
| Own shares purchased (a) | — | | (27.29 | ) | — | | (83 | ) |
| Share issues (b) | — | | 1.14 | | — | | 34 | |
|
|
|
|
|
|
|
| |
| At 31 December | 285.75 | | 285.75 | | 1,099 | | 1,019 | |
|
|
|
|
|
|
|
| |
| Share capital held by Rio Tinto plc | 171.07 | | 171.07 | | | | | |
|
|
|
|
|
|
|
| |
| Total share capital (c) | 456.82 | | 456.82 | | | | | |
|
|
|
|
|
|
|
| |
| (a) | In May 2006, shareholders authorised Rio Tinto Limited to buy back ordinary shares during the following 12 months whether on market or via off-market buy back tenders, but only to the extent that such purchases would not exceed 28.5 million Rio Tinto Limited shares during that 12 month period. Rio Tinto Limited is also authorised to buy back Rio Tinto Limited shares held by Tinto Holdings Australia Pty Limited (a wholly owned subsidiary of Rio Tinto plc). Rio Tinto Limited is seeking renewal of these approvals at its annual general meeting in 2007. |
| | No shares were bought back during the years to 31 December 2006. During the year to 31 December 2005, 27,294,139 shares were bought back via an off-market buy back tender at a buy back price of A$36.70 per share. The total consideration paid was US$774 million. Rio Tinto Limited also bought back 16,367,000 of its shares held by the above subsidiary of Rio Tinto plc at the same buy back price per share. |
| (b) | No new shares were issued during 2006. The aggregate consideration received for shares issued during 2005 was US$34 million. |
| (c) | Total share capital in issue at 31 December 2006 was 456.82 million plus one special voting share and one DLC dividend share (31 December 2005: 456.82 million plus one special voting share and one DLC dividend share . The 'Special Voting Share' was issued to facilitate the joint voting by shareholders of Rio Tinto Limited and Rio Tinto plc on Joint Decisions following the DLC merger. Directors have the ability to issue an equalisation share if that is required under the terms of the DLC Merger Sharing Agreement. The 'DLC dividend share' was issued to facilitate the efficient management of funds within the DLC structure. |
| (d) | Share options exercised during the year to 31 December 2006 under various Rio Tinto Limited employee share option schemes were satisfied by the on-market purchase of Rio Tinto Limited shares by a third party on the Group's behalf. During the year to 31 December 2005, 1,138,006 shares were issued, of which 1,130,211 resulted from the exercise of share options under share option schemes at contracted prices between A$20.37 and A$39.87 , and 7,795 from the vesting of shares under the Rio Tinto Mining Companies Comparative Plan. |
| (e) | Information relating to share options and other share based incentive schemes is given in note 45 on share based payments. |
A-34
Back to Contents
Notes to the 2006 Financial statements
| 29 | CHANGES IN EQUITY, SHARE PREMIUM AND RESERVES |
| | |
| | Attributable | | Outside | | Total | |
| | to | | Interests | | Year ended | |
| | shareholders | | | | 31 December | |
| | of Rio Tinto | | | | 2006 | |
| Summary statement of changes in equity | US$m | | US$m | | US$m | |
|
|
|
|
|
| |
| Opening balance | 14,948 | | 791 | | 15,739 | |
| | | | | | | |
| Total recognised income for the year | 8,514 | | 468 | | 8,982 | |
| Dividends (note 10) | (2,573 | ) | (193 | ) | (2,766 | ) |
| Own shares purchased from Rio Tinto shareholders: | | | | | | |
| – Under capital management programme (a) | (2,658 | ) | — | | (2,658 | ) |
| – To satisfy share options | (49 | ) | — | | (49 | ) |
| Ordinary shares issued | 31 | | — | | 31 | |
| Subsidiary company share issue | — | | 69 | | 69 | |
| Employee share options charged to the income statement | 23 | | — | | 23 | |
| Other movements | (4 | ) | 18 | | 14 | |
|
|
|
|
|
| |
| Closing balance | 18,232 | | 1,153 | | 19,385 | |
|
|
|
|
|
| |
| | | | | | | |
| | Attributable | | Outside | | Total | |
| | to | | Interests | | Year ended | |
| | shareholders | | | | 31 December | |
| | of Rio Tinto | | | | 2005 | |
| Summary statement of changes in equity | US$m | | US$m | | US$m | |
|
|
|
|
|
| |
| Opening balance | 11,967 | | 733 | | 12,700 | |
| | | | | | | |
| Total recognised income for the year | 4,877 | | 219 | | 5,096 | |
| Dividends (note 10) | (1,143 | ) | (169 | ) | (1,312 | ) |
| Own shares purchased from Rio Tinto shareholders: | | | | | | |
| – Under capital management programme | (877 | ) | — | | (877 | ) |
| Ordinary shares issued | 100 | | — | | 100 | |
| Subsidiary company share issue | — | | 4 | | 4 | |
| Employee share options charged to the income statement | 24 | | — | | 24 | |
| Other movements | — | | 4 | | 4 | |
|
|
|
|
|
| |
| Closing balance | 14,948 | | 791 | | 15,739 | |
|
|
|
|
|
| |
| (a) | Shares bought back include US$288 million in respect of a commitment entered into before the financial year end to purchase from a bank, Rio Tinto plc shares that the bank could buy in the market during the period up to the preliminary announcement of the Group's results, when the Group is unable to purchase its own shares. |
A-35
Back to Contents
Notes to the 2006 Financial statements
| 29 | CHANGES IN EQUITY, SHARE PREMIUM AND RESERVES CONTINUED |
| | |
| | 2006 | | 2005 | |
| | Total | | Total | |
| | US$m | | US$m | |
|
|
|
| |
| Share premium account | | | | |
| At 1 January | 1,888 | | 1,822 | |
| Premium on issues of ordinary shares | 31 | | 66 | |
|
|
|
| |
| At 31 December | 1,919 | | 1,888 | |
|
|
|
| |
| Retained earnings | | | | |
| At 1 January | 11,893 | | 8,388 | |
| Parent and subsidiaries' profit for the year (a) | 7,440 | | 4,853 | |
| Equity accounted units' retained profit for the year | (2 | ) | 362 | |
| Actuarial gains | 338 | | 179 | |
| Dividends | (2,573 | ) | (1,143 | ) |
| Own shares purchased from Rio Tinto shareholders under capital management programme | (2,658 | ) | (794 | ) |
| Employee share options charged to income statement | 12 | | 13 | |
| Tax recognised directly in SORIE | (45 | ) | 35 | |
| Other movements | (4 | ) | — | |
|
|
|
| |
| At 31 December | 14,401 | | 11,893 | |
| | | | | |
| Hedging reserves(b) | | | | |
| At 1 January | (77 | ) | 29 | |
| Parent and subsidiaries' net cash flow hedge fair value losses | (178 | ) | (122 | ) |
| Equity accounted units' cash flow hedge fair value gains | — | | 6 | |
| Parent and subsidiaries' net cash flow hedge losses/(gains) transferred to the income statement | 63 | | (18 | ) |
| Equity accounted units' cash flow hedge losses transferred to the income statement | — | | 18 | |
| Tax on the above | 59 | | 10 | |
|
|
|
| |
| At 31 December | (133 | ) | (77 | ) |
| | | | | |
| Available for sale revaluation reserves(c) | | | | |
| At 1 January | 20 | | 70 | |
| Gains on available for sale securities | 14 | | 32 | |
| (Gains) on available for sale securities transferred to the income statement | (4 | ) | (88 | ) |
| Tax on the above | 1 | | 6 | |
|
|
|
| |
| At 31 December | 31 | | 20 | |
| | | | | |
| Other reserves(d) | | | | |
| At 1 January | 42 | | 31 | |
| Own shares purchased from Rio Tinto shareholders to satisfy share options | (49 | ) | — | |
| Employee share options: value of services | 11 | | 11 | |
| Tax on the above | 4 | | — | |
|
|
|
| |
| At 31 December | 8 | | 42 | |
| | | | | |
| Foreign currency translation reserve(e) | | | | |
| At 1 January | (9 | ) | 322 | |
| Currency translation adjustments | 748 | | (411 | ) |
| Exchange (losses)/gains | (8 | ) | 75 | |
| Currency translation reclassified on disposal | 4 | | — | |
| Tax on exchange adjustments | — | | 5 | |
|
|
|
| |
| At 31 December | 735 | | (9 | ) |
|
|
|
| |
| Total other reserves per balance sheet | 641 | | (24 | ) |
|
|
|
| |
| (a) | Retained profit and movements in reserves of subsidiaries include those arising from the Group's share of proportionally consolidated units. |
| (b) | The hedging reserve records gains or losses on cash flow hedges that are recognised initially in equity, as described in note 1(p). |
| (c) | The available for sale revaluation reserves record fair value gains or losses relating to available for sale securities, as described in note 1(p). |
| (d) | Other reserves record the cumulative amount recognised in respect of options granted but not exercised to acquire shares in Rio Tinto Limited less, where applicable, the cost of shares purchased to satisfy share options exercised. The estimated effect of unexercised options to acquire shares in Rio Tinto plc are recorded in retained earnings. |
| (e) | Exchange differences arising on the translation of the Group's net investment in foreign controlled companies are taken to the foreign currency translation reserve, as described in note 1(d). Amounts are recognised in the income statement when the investment is disposed of. |
A-36
Back to Contents
Notes to the 2006 Financial statements
| 30 | PRIMARY SEGMENTAL ANALYSIS (BY PRODUCT GROUP) |
| |
| | 2006 | | 2005 | | 2004 | | 2006 | | 2005 | | 2004 | |
| | % | | % | | % | | US$m | | US$m | | US$m | |
|
|
|
|
|
|
|
|
|
|
|
| |
| Sales revenue | | | | | | | | | | | | |
| Iron ore | 30.9 | | 28.9 | | 23.2 | | 6,938 | | 5,497 | | 3,009 | |
| Energy | 18.1 | | 19.4 | | 21.8 | | 4,070 | | 3,693 | | 2,826 | |
| Industrial minerals | 11.1 | | 12.5 | | 15.8 | | 2,501 | | 2,374 | | 2,052 | |
| Aluminium | 15.5 | | 14.4 | | 18.2 | | 3,493 | | 2,744 | | 2,356 | |
| Copper | 19.6 | | 18.0 | | 13.6 | | 4,396 | | 3,433 | | 1,756 | |
| Diamonds | 3.7 | | 5.7 | | 5.7 | | 838 | | 1,076 | | 744 | |
| Other | 1.1 | | 1.1 | | 1.7 | | 229 | | 216 | | 211 | |
|
|
|
|
|
|
|
|
|
|
|
| |
| Consolidated sales revenue | 100.0 | | 100.0 | | 100.0 | | 22,465 | | 19,033 | | 12,954 | |
|
|
|
|
|
|
|
|
|
|
|
| |
| | | | | | | | | | | | |
|
|
|
|
|
|
|
|
|
|
|
| |
| Consolidated profit before finance items and taxation | | | | | | | | | | | |
| Iron ore | 43.2 | | 41.5 | | 26.7 | | 3,875 | | 2,872 | | 887 | |
| Energy (c) | 9.0 | | 15.4 | | 13.7 | | 807 | | 1,067 | | 455 | |
| Industrial minerals (c) | 4.1 | | 5.2 | | 10.9 | | 371 | | 362 | | 362 | |
| Aluminium | 11.9 | | 7.3 | | 15.6 | | 1,069 | | 502 | | 520 | |
| Copper (c),(d) | 37.5 | | 28.2 | | 31.2 | | 3,367 | | 1,954 | | 1,037 | |
| Diamonds | (0.2 | ) | 6.6 | | 9.3 | | (15 | ) | 459 | | 311 | |
| Exploration and evaluation | (2.1 | ) | (2.7 | ) | (3.5 | ) | (188 | ) | (193 | ) | (114 | ) |
| Other | (3.4 | ) | (1.5 | ) | (3.9 | ) | (312 | ) | (101 | ) | (131 | ) |
|
|
|
|
|
|
|
|
|
|
|
| |
| Operating profit (segment result) | 100.0 | | 100.0 | | 100.0 | | 8,974 | | 6,922 | | 3,327 | |
|
|
|
|
|
|
|
|
|
|
|
| |
| | | | | | | | | | | | | |
| Share of profit after tax of equity accounted units | | | | | | | | | | | | |
| Copper | | | | | | | 1,271 | | 660 | | 495 | |
| Other | | | | | | | 107 | | 116 | | 28 | |
|
|
|
|
|
|
|
|
|
|
|
| |
| Profit before finance items and taxation | | | | | | | 10,352 | | 7,698 | | 3,850 | |
|
|
|
|
|
|
|
|
|
|
|
| |
| | | | | | | | | | |
|
|
|
|
|
|
|
|
|
|
|
| |
| Depreciation and amortisation (excluding share of equity accounted units) | | | | | | | | | |
| Iron ore (c) | 26.3 | | 23.6 | | 16.8 | | 387 | | 315 | | 289 | |
| Energy (c) | 20.1 | | 20.9 | | 24.6 | | 295 | | 279 | | 423 | |
| Industrial minerals (c) | 11.7 | | 11.9 | | 9.4 | | 172 | | 159 | | 162 | |
| Aluminium | 9.7 | | 9.1 | | 4.9 | | 143 | | 121 | | 85 | |
| Copper (c) | 20.1 | | 18.8 | | 35.1 | | 295 | | 251 | | 603 | |
| Diamonds (c) | 9.9 | | 12.2 | | 6.3 | | 145 | | 163 | | 108 | |
| Exploration and evaluation | 0.2 | | 0.2 | | 0.1 | | 3 | | 3 | | 2 | |
| Other | 2.0 | | 3.3 | | 2.8 | | 29 | | 43 | | 47 | |
|
|
|
|
|
|
|
|
|
|
|
| |
| Product group total | 100.0 | | 100.0 | | 100.0 | | 1,469 | | 1,334 | | 1,719 | |
|
|
|
|
|
|
|
|
|
|
|
| |
| (a) | The product groups shown above reflect the Group's management structure and are the Group's primary segments in accordance with IAS14. The analysis deals with: the sales revenue, profit before finance costs and taxation, and depreciation and amortisation, for subsidiary companies and proportionally consolidated units. The amounts presented for each product group exclude equity accounted units, but include the amounts attributable to outside equity shareholders. The classification is consistent with the financial information by business unit data included on pages A-67 and A-68. However, that information includes the results of equity accounted units and presents different financial measures. |
| (b) | As detailed below, the analysis of profit before finance costs and taxation includes the profit on disposal of interests in businesses (including investments) and impairment (reversals)/charges, which are excluded from Underlying earnings. |
| (c) | The above analysis of depreciation and amortisation includes the following impairment reversals and charges. |
| | | | | | | | |
| | | 2006 | | 2005 | | 2004 | |
| | | Total | | Total | | Total | |
| | | US$m | | US$m | | US$m | |
| |
|
|
|
|
|
| |
| | Impairment reversals less charges by product group | | | | | | |
| | Iron Ore | 298 | | — | | — | |
| | Energy | (188 | ) | (13 | ) | (160 | ) |
| | Industrial Minerals | (7 | ) | 16 | | — | |
| | Copper | 610 | | — | | (398 | ) |
| | Diamonds | (317 | ) | — | | — | |
| |
|
|
|
|
|
| |
| | | 396 | | 3 | | (558 | ) |
| |
|
|
|
|
|
| |
| (d) | For the year ended 31 December 2006, the operating profit of the Copper group included the benefit of an exceptional reduction in environmental provisions of US$37 million (2005: US$84 million; 2004: US$nil). |
A-37
Back to Contents
Notes to the 2006 Financial statements
| 30 | PRIMARY SEGMENTAL ANALYSIS (BY PRODUCT GROUP) CONTINUED |
| |
| | 2006 | | 2005 | | 2006 | | 2005 | |
| | % | | % | | US$m | | US$m | |
|
|
|
|
|
|
|
| |
| Segment Assets (subsidiaries and proportionally consolidated units) | | | | | | | | |
| Iron ore | 33.8 | | 29.5 | | 10,151 | | 7,228 | |
| Energy | 16.5 | | 18.5 | | 4,965 | | 4,542 | |
| Industrial minerals | 12.0 | | 13.1 | | 3,589 | | 3,216 | |
| Aluminium | 12.9 | | 13.6 | | 3,863 | | 3,341 | |
| Copper | 16.0 | | 14.7 | | 4,814 | | 3,597 | |
| Diamonds | 5.6 | | 7.0 | | 1,671 | | 1,703 | |
| Other | 3.2 | | 3.6 | | 959 | | 869 | |
|
|
|
|
|
|
|
| |
| Product group total | 100.0 | | 100.0 | | 30,012 | | 24,496 | |
|
|
|
|
|
|
|
| |
| Equity accounted units (a) | | | | | | | | |
| Copper | 58.0 | | 53.5 | | 1,385 | | 1,063 | |
| Aluminium | 36.8 | | 42.7 | | 878 | | 849 | |
| Other | 5.2 | | 3.8 | | 123 | | 76 | |
|
|
|
|
|
|
|
| |
| Total | 100.0 | | 100.0 | | 2,386 | | 1,988 | |
|
|
|
|
|
|
|
| |
| Deferred tax assets | | | | | 225 | | 55 | |
| Current tax recoverable | | | | | 214 | | 152 | |
| Pension surpluses | | | | | 360 | | 200 | |
| Derivative assets | | | | | 555 | | 528 | |
| Cash and liquid resources | | | | | 742 | | 2,384 | |
|
|
|
|
|
|
|
| |
| Total assets | | | | | 34,494 | | 29,803 | |
|
|
|
|
|
|
|
| |
| (a) | The analysis of the Group's investment in equity accounted units includes loans to equity accounted units, which are shown separately on the face of the balance sheet. |
| | | | | | | | | |
| | 2006 | | 2005 | | 2006 | | 2005 | |
| | % | | % | | US$m | | US$m | |
|
|
|
|
|
|
|
| |
| Segment Liabilities (subsidiaries and proportionally consolidated units) | | | | | | | | |
| Iron ore | 21.1 | | 20.0 | | (1,467 | ) | (1,130 | ) |
| Energy | 21.3 | | 25.9 | | (1,480 | ) | (1,463 | ) |
| Industrial minerals | 8.0 | | 9.6 | | (558 | ) | (544 | ) |
| Aluminium | 10.7 | | 10.9 | | (745 | ) | (617 | ) |
| Copper | 23.8 | | 21.4 | | (1,653 | ) | (1,209 | ) |
| Diamonds | 4.6 | | 4.4 | | (320 | ) | (248 | ) |
| Other | 10.5 | | 7.8 | | (730 | ) | (438 | ) |
|
|
|
|
|
|
|
| |
| Total | 100.0 | | 100.0 | | (6,953 | ) | (5,649 | ) |
|
|
|
|
|
|
|
| |
| Borrowings and bank overdrafts | | | | | (3,511 | ) | (3,985 | ) |
| Current tax payable | | | | | (1,110 | ) | (1,038 | ) |
| Deferred tax liabilities | | | | | (2,339 | ) | (2,197 | ) |
| Derivative liabilities | | | | | (426 | ) | (199 | ) |
| Post retirement benefit liabilities | | | | | (770 | ) | (996 | ) |
|
|
|
|
|
|
|
| |
| Total liabilities | | | | | (15,109 | ) | (14,064 | ) |
|
|
|
|
|
|
|
| |
A-38
Back to Contents
Notes to the 2006 Financial statements
| 30 | PRIMARY SEGMENTAL ANALYSIS (BY PRODUCT GROUP) CONTINUED |
| |
| | 2006 | | 2005 | | 2004 | | 2006 | | 2005 | | 2004 | |
| | % | | % | | % | | US$m | | US$m | | US$m | |
|
|
|
|
|
|
|
|
|
|
|
| |
| Capital additions (a) | | | | | | | | | | | | |
| Iron ore | 48.4 | | 44.0 | | 37.3 | | 2,303 | | 1,291 | | 1,039 | |
| Energy | 12.4 | | 20.6 | | 11.5 | | 591 | | 604 | | 321 | |
| Industrial minerals | 8.4 | | 8.5 | | 8.8 | | 400 | | 249 | | 245 | |
| Aluminium | 5.3 | | 5.0 | | 22.9 | | 253 | | 147 | | 640 | |
| Copper | 15.9 | | 11.5 | | 9.3 | | 758 | | 337 | | 259 | |
| Diamonds | 6.0 | | 6.5 | | 8.5 | | 288 | | 192 | | 236 | |
| Other | 3.6 | | 3.9 | | 1.7 | | 170 | | 114 | | 49 | |
|
|
|
|
|
|
|
|
|
|
|
| |
| Total capital additions | 100.0 | | 100.0 | | 100.0 | | 4,763 | | 2,934 | | 2,789 | |
|
|
|
|
|
|
|
|
|
|
|
| |
| | | | | | | | | | | | | |
| | | | | | Note | | | | | | | |
|
|
|
|
|
|
|
|
|
|
|
| |
| Analysis of capital additions | | | | | | | | | | | | |
| Property, plant & equipment - cash expenditure | | | | | | | 3,800 | | 2,523 | | 2,246 | |
| Capitalised closure costs and other provisions | | | | | 13 | | 619 | | 346 | | 268 | |
| Capitalised interest | | | | | 13 | | 60 | | 28 | | 35 | |
| Intangible assets - cash expenditure | | | | | | | 192 | | 67 | | 13 | |
| Finance leases taken out | | | | | | | 2 | | 64 | | — | |
| Movement in payables for capital expenditure | | | | | | | 90 | | (94 | ) | 227 | |
|
|
|
|
|
|
|
|
|
|
|
| |
| Capital additions per above | | | | | | | 4,763 | | 2,934 | | 2,789 | |
|
|
|
|
|
|
|
|
|
|
|
| |
| (a) | Capital additions represent the total cost incurred during the period to acquire the non-current assets shown above, measured on an accruals basis, in accordance with IAS 14. These figures exclude capital additions of equity accounted units. |
A-39
Back to Contents
Notes to the 2006 Financial statements
| 31 | SECONDARY SEGMENTAL ANALYSIS (BY GEOGRAPHICAL SEGMENT) |
By destination
| | 2006 | | 2005 | | 2004 | | 2006 | | 2005 | | 2004 | |
| | % | | % | | % | | US$m | | US$m | | US$m | |
|
|
|
|
|
|
|
|
|
|
|
| |
| Gross sales revenue by destination (including share of equity accounted units) | | | | | | | | | | | | |
| North America (a) | 21.9 | | 21.7 | | 24.7 | | 5,575 | | 4,499 | | 3,588 | |
| Europe | 17.2 | | 20.5 | | 20.6 | | 4,378 | | 4,260 | | 2,991 | |
| Japan | 19.6 | | 19.1 | | 17.9 | | 4,986 | | 3,954 | | 2,597 | |
| China | 16.0 | | 15.0 | | 10.1 | | 4,062 | | 3,112 | | 1,471 | |
| Other Asia | 13.5 | | 12.8 | | 13.1 | | 3,438 | | 2,663 | | 1,906 | |
| Australia and New Zealand | 5.8 | | 6.7 | | 8.5 | | 1,477 | | 1,400 | | 1,235 | |
| Other | 6.0 | | 4.2 | | 5.1 | | 1,524 | | 854 | | 742 | |
|
|
|
|
|
|
|
|
|
|
|
| |
| | 100.0 | | 100.0 | | 100.0 | | 25,440 | | 20,742 | | 14,530 | |
|
|
|
|
|
|
|
|
|
|
|
| |
| Less: share of equity accounted units' sales revenue | | | | | | | (2,975 | ) | (1,709 | ) | (1,576 | ) |
|
|
|
|
|
|
|
|
|
|
|
| |
| Consolidated sales revenue | | | | | | | 22,465 | | 19,033 | | 12,954 | |
|
|
|
|
|
|
|
|
|
|
|
| |
| | | | | | | | | | | | | |
| Consolidated sales revenue by destination | | | | | | | | | | | | |
| North America (a) | 23.9 | | 22.3 | | 25.6 | | 5,358 | | 4,235 | | 3,314 | |
| Europe | 17.5 | | 20.8 | | 20.1 | | 3,929 | | 3,968 | | 2,607 | |
| Japan | 19.6 | | 19.0 | | 17.9 | | 4,402 | | 3,620 | | 2,319 | |
| China | 16.2 | | 15.4 | | 10.7 | | 3,648 | | 2,932 | | 1,389 | |
| Other Asia | 12.0 | | 12.4 | | 12.9 | | 2,691 | | 2,366 | | 1,676 | |
| Australia and New Zealand | 6.3 | | 7.0 | | 9.0 | | 1,412 | | 1,336 | | 1,170 | |
| Other | 4.5 | | 3.1 | | 3.8 | | 1,025 | | 576 | | 479 | |
|
|
|
|
|
|
|
|
|
|
|
| |
| Total | 100.0 | | 100.0 | | 100.0 | | 22,465 | | 19,033 | | 12,954 | |
|
|
|
|
|
|
|
|
|
|
|
| |
| | | | | | | | | | | | | |
| Gross sales revenue by country of origin (including share of equity accounted units) | |
| North America (a) | 29.6 | | 30.8 | | 31.5 | | 7,529 | | 6,397 | | 4,571 | |
| Australia and New Zealand | 49.9 | | 51.2 | | 48.3 | | 12,703 | | 10,613 | | 7,023 | |
| South America | 10.5 | | 6.3 | | 7.8 | | 2,679 | | 1,302 | | 1,131 | |
| Africa | 5.7 | | 5.5 | | 5.8 | | 1,461 | | 1,149 | | 850 | |
| Indonesia | 1.6 | | 3.4 | | 2.2 | | 396 | | 702 | | 314 | |
| Europe and other countries | 2.7 | | 2.8 | | 4.4 | | 672 | | 579 | | 641 | |
|
|
|
|
|
|
|
|
|
|
|
| |
| Total | 100.0 | | 100.0 | | 100.0 | | 25,440 | | 20,742 | | 14,530 | |
|
|
|
|
|
|
|
|
|
|
|
| |
| Less: share of equity accounted units' sales revenue | | | | | | | (2,975 | ) | (1,709 | ) | (1,576 | ) |
|
|
|
|
|
|
|
|
|
|
|
| |
| Consolidated sales revenue | | | | | | | 22,465 | | 19,033 | | 12,954 | |
|
|
|
|
|
|
|
|
|
|
|
| |
| | Segment assets | | Capital additions | |
| | 2006 | | 2005 | | 2006 | | 2005 | | 2004 | |
| | US$m | | US$m | | US$m | | US$m | | US$m | |
|
|
|
|
|
|
|
|
|
| |
| Assets and capital additions by location (excluding equity accounted units) |
| North America (a) | 10,302 | | 8,254 | | 1,430 | | 830 | | 613 | |
| Australia and New Zealand | 17,097 | | 13,850 | | 2,993 | | 1,914 | | 1,985 | |
| South America | 151 | | 126 | | 19 | | 37 | | 21 | |
| Africa | 1,168 | | 1,014 | | 204 | | 62 | | 54 | |
| Indonesia | 605 | | 679 | | 49 | | 68 | | 59 | |
| Europe and other countries | 1,049 | | 773 | | 68 | | 23 | | 57 | |
|
|
|
|
|
|
|
|
|
| |
| | 30,372 | | 24,696 | | 4,763 | | 2,934 | | 2,789 | |
| | | | | | | | | | | |
| Investments in equity accounted units (b) | | | | | | | | | | |
| North America (a) | 408 | | 61 | | | | | | | |
| Australia and New Zealand | 937 | | 893 | | | | | | | |
| South America | 993 | | 1,000 | | | | | | | |
| Other countries | 48 | | 34 | | | | | | | |
|
|
|
|
|
|
|
|
|
| |
| | 2,386 | | 1,988 | | | | | | | |
| | | | | | | | | | | |
| Deferred tax assets | 225 | | 55 | | | | | | | |
| Current tax recoverable | 214 | | 152 | | | | | | | |
| Derivative assets | 555 | | 528 | | | | | | | |
| Cash and liquid resources | 742 | | 2,384 | | | | | | | |
|
|
|
|
|
|
|
|
|
| |
| Total assets | 34,494 | | 29,803 | | | | | | | |
|
|
|
|
|
|
|
|
|
| |
| (a) | The United States of America and Canada have been combined to form the 'North America' Geographical segment, having regard to the similarity of economic and political conditions in these countries. |
| (b) | This analysis of investments in equity accounted units represents the Group's share of net assets plus loans to equity accounted units, which are shown separately on the face of the balance sheet. |
A-40
Back to Contents
Notes to the 2006 Financial statements
Financial risk management
The Group’s policies with regard to risk management are clearly defined and consistently applied. They are a fundamental tenet of the Group’s long term strategy.
The Group’s business is mining and not trading. The Group only sells commodities it has produced. In the long term, natural hedges operate in a number of ways to help protect and stabilise earnings and cash flow, obviating the need to use derivatives or other forms of synthetic hedging for this purpose. Such hedging is therefore undertaken to a strictly limited degree, as described below.
The Group has a diverse portfolio of commodities and markets, which have varying responses to the economic cycle. The relationship between commodity prices and the currencies of most of the countries in which the Group operates provides further natural protection. In addition, the Group’s policy of borrowing at floating US dollar interest rates helps to counteract the effect of economic and commodity price cycles.
Rio Tinto does not acquire or issue derivative financial instruments for trading or speculative purposes; nor does it believe that it has exposure to such trading or speculative holdings through its investments in joint ventures and associates. Derivatives are used to separate funding and cash management decisions from currency exposure and interest rate management. The Group uses interest rate swaps in conjunction with longer term funds raised in the capital markets to achieve a floating rate obligation which is consistent with the Group’s interest rate policy. Currency swaps are used to convert debt or investments into currencies, primarily the US dollar, which are consistent with the Group’s policy on currency exposure management.
Foreign exchange risk
Rio Tinto’s shareholders' equity, earnings and cash flows are influenced by a wide variety of currencies due to the geographic diversity of the Group’s sales and the countries in which it operates. The US dollar, however, is the currency in which the great majority of the Group’s sales are denominated. Operating costs are influenced by the currencies of those countries where the Group’s mines and processing plants are located and also by those currencies in which the costs of imported equipment and services are determined. The Australian and Canadian dollars are the most important currencies (apart from the US dollar) influencing costs.
Details of the derivative financial instruments entered into to manage the Group's exposure to currencies other than the US dollar are provided in note A below.
Given the dominant role of the US currency in the Group’s affairs, the US dollar is the currency in which financial results are presented both internally and externally. It is also the most appropriate currency for borrowing and holding surplus cash, although a portion of surplus cash may also be held in other currencies, most notably Australian dollars, in order to meet short term operational and capital commitments and dividend payments.
The Group finances its operations primarily in US dollars, either directly or using currency swaps, and a substantial part of the Group's US dollar debt is located in subsidiaries having functional currencies other than the US dollar.
The Group does not generally believe that active currency hedging would provide long term benefits to shareholders. Currency protection measures may be deemed appropriate in specific commercial circumstances and are subject to strict limits laid down by the Rio Tinto board. As set out in note A below, as at 31 December 2006 there were forward contracts to sell US$581 million (2005: US$512 million) in respect of future trading transactions. A significant part of the above hedge book was acquired with North Ltd. North held a substantial hedge book on acquisition which has been retained but is not being renewed as maturities occur.
Interest rate risk
Rio Tinto’s interest rate management policy is generally to borrow and invest cash at floating rates. Short term US dollar rates are normally lower than long term rates, resulting in lower interest costs to the Group. Furthermore, cyclical movements of interest rates tend to compensate in the long term, to an extent, for those of commodity prices. In some circumstances, an element of fixed rate funding may be considered appropriate. At the end of 2006, US$1.2 billion (2005: US$1.1 billion) of the Group’s debt was at fixed rates after taking into account interest rate swaps and finance leases. Based on the Group’s net debt at 31 December 2006, and with other variables unchanged, the approximate effect on the Group’s net earnings of a one percentage point increase in US dollar LIBOR interest rates would be a reduction of US$6 million (2005: US$4 million).
Commodity price risk
The Group’s normal policy is to sell its products at prevailing market prices. Exceptions to this rule are subject to strict limits laid down by the Rio Tinto board and to rigid internal controls. Rio Tinto’s exposure to commodity prices is diversified by virtue of its broad commodity spread and the Group does not generally believe commodity price hedging would provide long term benefit to shareholders. During 2005, forward contracts to sell 509 million pounds of copper at a fixed rand price per pound were entered into as a condition of the refinancing of Palabora, for which cash flow hedge accounting is achieved (of which 420 million pounds remain at 31 December 2006).
Credit risk
No material exposure is considered to exist by virtue of the possible non-performance of the counterparties to financial instruments, other than trade and other receivables held by the Group.
Given the large number of internationally dispersed customers the Group has limited concentration of credit risk, with regard to its trade and other receivables, which is closely monitored.
A-41
Back to Contents
Notes to the 2006 Financial statements
| 32 | FINANCIAL INSTRUMENTS CONTINUED |
Implementation of IAS 32 'Financial instruments: presentation and disclosure'
The Group implemented IAS 32 at 1 January 2005 without restatement of comparatives.
Implementation of IAS 39 'Financial instruments: recognition and measurement'
The Group implemented IAS 39 at 1 January 2005 without restatement of comparatives. For 2004, financial instruments were not marked to market except in the case of exchange rate derivatives that did not qualify as hedges under IAS 21.
The adoption of IAS 39 resulted in a US$90 million increase in equity attributable to Rio Tinto shareholders at 1 January 2005. This was net of consequential increases in deferred tax liabilities of US$24 million, and outside equity shareholders' interests of US$19 million. This represented the net gain on the marking to market of qualifying hedges, embedded derivatives, available for sale investments and certain derivatives that did not qualify as hedges.
The major balance sheet line items affected were financial assets: increase of US$287 million, financial liabilities: increase of US$66 million, and borrowings: increase of US$69 million. The net impact on other balance sheet items was a reduction in total assets of US$19 million.
Financial instrument disclosures
Except where stated, the information given below relates to the financial instruments of the parent companies and their subsidiaries and proportionally consolidated units, and excludes those of equity accounted units.
Trade and other receivables/payables are included only in the currency analysis. The information is grouped in the following sections:
| A | – Derivative financial instruments |
| B | – Reporting currencies and currency exposures |
| C | – Interest rates |
| D | – Liquidity |
| E | – Fair values |
| | |
| A) | DERIVATIVE FINANCIAL INSTRUMENTS |
| The Group's derivatives, including embedded derivatives, as at 31 December 2006, are summarised below: |
| | |
| a) | Forward contracts relating to trading transactions: designated as cash flow hedges |
| | | | | | | | | | | |
| Assets (note 19) | Buy currency | | Sell | | Weighted | | Total fair | | Total fair | |
| | amount | | currency | | average | | value | | value | |
| | | | amount | | rate | | 2006 | | 2005 | |
| Buy Australian dollar; sell US dollar | A$m | | US$m | | A$/US$ | | US$m | | US$m | |
|
|
|
|
|
|
|
|
|
| |
| Less than 1 year | 151 | | 92 | | 0.61 | | 26 | | 19 | |
| 1 to 5 years | 246 | | 148 | | 0.60 | | 36 | | 39 | |
|
|
|
|
|
|
|
|
|
| |
| | 397 | | 240 | | 0.60 | | 62 | | 58 | |
| Commodity contracts | | | | | | | 4 | | 6 | |
|
|
|
|
|
|
|
|
|
| |
| Total | | | | | | | 66 | | 64 | |
|
|
|
|
|
|
|
|
|
| |
The above currency forward contracts were acquired with companies purchased in 2000 and were entered into by those companies in order to reduce their exposure to the US dollar through forecast sales. The above commodity contracts have been entered into in order to reduce exposure to movements in the coal price.
| Liabilities (note 25) | Sell | | Sales | | Total fair | | Total fair | |
| | million | | price | | value | | value | |
| | lbs of Cu | | Rand/lb | | 2006 | | 2005 | |
| Sell Copper | | | | | US$m | | US$m | |
|
|
|
|
|
|
|
| |
| Less than 1 year | 99.25 | | 9.52 | | (149 | ) | (45 | ) |
| 1 to 5 years | 238.27 | | 7.41 | | (184 | ) | (57 | ) |
| More than 5 years | 82.60 | | 7.14 | | (18 | ) | (29 | ) |
|
|
|
|
|
|
|
| |
| | | | | | (351 | ) | (131 | ) |
| Other commodity contracts | | | | | (25 | ) | (19 | ) |
|
|
|
|
|
|
|
| |
| Total | | | | | (376 | ) | (150 | ) |
|
|
|
|
|
|
|
| |
The above copper forward contracts were entered into as a condition of the refinancing of Palabora in 2005, and result in a reduction in the Group's exposure to movements in the copper price. Other commodity contracts have been entered into in order to reduce exposure to movements in the coal price.
A-42
Back to Contents
Notes to the 2006 Financial statements
| 32 | FINANCIAL INSTRUMENTS CONTINUED |
| | |
| b) | Options relating to trading transactions: designated as cash flow hedges |
| | | | | | | | | | | |
| Assets (note 19) | Buy | | Sell | | Weighted | | Total | | Total | |
| | currency | | currency | | average | | fair value | | fair value | |
| | amount | | amount | | strike | | 2006 | | 2005 | |
| | | | | | rate | | | | | |
| Bought A$ call options | A$m | | US$m | | A$/US$ | | US$m | | US$m | |
|
|
|
|
|
|
|
|
|
| |
| Less than 1 year | 94 | | 66 | | 0.70 | | 8 | | 3 | |
| 1 to 5 years | 59 | | 42 | | 0.71 | | 4 | | 7 | |
|
|
|
|
|
|
|
|
|
| |
| | 153 | | 108 | | 0.71 | | 12 | | 10 | |
|
|
|
|
|
|
|
|
|
| |
The above currency option contracts were acquired with companies purchased in 2000 and were entered into by those companies in order to reduce their exposure to the US dollar forecast sales.
| Reconciliation to Balance Sheet categories | | | | |
|
|
|
| |
| – non-current assets (note 19) | 42 | | 46 | |
| – current assets (note 19) | 36 | | 28 | |
|
|
|
| |
| – current liabilities (note 25) | (162 | ) | (57 | ) |
| – non-current liabilities (note 25) | (214 | ) | (93 | ) |
|
|
|
| |
| Total derivatives designated as cash flow hedges, detailed above | (298 | ) | (76 | ) |
|
|
|
| |
| c) | Forward contracts relating to trading transactions: not designated as hedges |
| | | | | | | | | | | |
| Assets | Buy | | Sell | | Weighted | | Total fair | | Total fair | |
| | currency | | currency | | average | | value | | value | |
| | amount | | amount | | rate | | 2006 | | 2005 | |
| Buy New Zealand dollar; sell US dollar | NZ$m | | US$m | | NZ$/US$ | | US$m | | US$m | |
|
|
|
|
|
|
|
|
|
| |
| Less than 1 year | 130 | | 58 | | 0.45 | | 32 | | 29 | |
| 1 to 5 years | 390 | | 175 | | 0.45 | | 75 | | 89 | |
|
|
|
|
|
|
|
|
|
| |
| | 520 | | 233 | | 0.45 | | 107 | | 118 | |
|
|
|
|
|
|
|
|
|
| |
| Commodity contracts | | | | | | | 1 | | 2 | |
| Embedded currency derivatives | | | | | | | 10 | | 13 | |
| Other currency forward contracts | | | | | | | 4 | | 5 | |
|
|
|
|
|
|
|
|
|
| |
| Total assets relating to non hedge derivatives (note 19) | | | | | | | 122 | | 138 | |
|
|
|
|
|
|
|
|
|
| |
| | | | | | | | | | | |
| Liabilities | | | | | | | | | | |
|
|
|
|
|
|
|
|
|
| |
| Commodity contracts | | | | | | | (1 | ) | (9 | ) |
| Embedded currency derivatives | | | | | | | (26 | ) | (11 | ) |
| Interest rate derivatives | | | | | | | — | | (1 | ) |
|
|
|
|
|
|
|
|
|
| |
| Total liabilities relating to non hedge derivatives (note 25) | | | | | | | (27 | ) | (21 | ) |
|
|
|
|
|
|
|
|
|
| |
The above New Zealand dollar currency forward contracts were taken out to manage exposure on operating costs. These contracts are not designated as hedges as they are not located in the entities with the exposure.
A-43
Back to Contents
Notes to the 2006 Financial statements
| 32 | FINANCIAL INSTRUMENTS CONTINUED |
| | |
| d) | Currency and interest contracts relating to non US dollar borrowings |
| | | | | | | | | | | |
| | Buy | | Sell | | Weighted | | Total fair | | Total fair | |
| | currency | | currency | | average | | value | | value | |
| | amount | | amount | | exchange | | 2006 | | 2005 | |
| Assets | | | | | rate | | US$m | | US$m | |
|
|
|
|
|
|
|
|
|
| |
| Buy Euro: sell US dollars | | | US$m | | | | | | | |
| Less than 1 year | Euro 850m | | 781 | | 1.09 | | 338 | | 229 | |
| Buy Japanese yen: sell US dollars | | | | | | | | | | |
| Less than 1 year | Yen 5 billion | | 41 | | 122 | | 1 | | 2 | |
| 1 to 5 years | | | — | | — | | — | | 4 | |
| Buy Sterling: sell US dollars | | | | | | | | | | |
| Less than 1 year | £15 | m | 23 | | 0.65 | | 6 | | 47 | |
| 1 to 5 years | £200 | m | 390 | | 0.51 | | 3 | | 3 | |
| Buy Swiss francs: sell US dollars | | | | | | | | | | |
| Less than 1 year | | | — | | — | | — | | 3 | |
| | | | | | | | | | | |
| Liabilities | | | | | | | | | | |
|
|
|
|
|
|
|
|
|
| |
| Buy Japanese yen: sell US dollars | | | | | | | | | | |
| 1 to 5 years | Yen 5 billion | | 46 | | 109 | | (4 | ) | (3 | ) |
|
|
|
|
|
|
|
|
|
| |
| Total currency swaps | | | 1,281 | | | | 344 | | 285 | |
| – designated as hedges | | | 1,171 | | | | 341 | | 229 | |
| – not designated as hedges | | | 110 | | | | 3 | | 56 | |
|
|
|
|
|
|
|
|
|
| |
| Interest contracts relating to borrowings: assets | | | | | | | 7 | | 28 | |
| Interest contracts relating to borrowings: liabilities | | | | | | | (19 | ) | (25 | ) |
|
|
|
|
|
|
|
|
|
| |
| Total derivatives related to net debt | | | | | | | 332 | | 288 | |
|
|
|
|
|
|
|
|
|
| |
| – non-current assets (note 19) | | | | | | | 3 | | 254 | |
| – current assets (note 19) | | | | | | | 352 | | 62 | |
| – current liabilities (note 25) | | | | | | | (4 | ) | (8 | ) |
| – non-current liabilities (note 25) | | | | | | | (19 | ) | (20 | ) |
|
|
|
|
|
|
|
|
|
| |
| | | | | | | | 332 | | 288 | |
|
|
|
|
|
|
|
|
|
| |
These currency and interest rate contracts are used to fix the US dollar value of non US dollar denominated external debt and to convert certain fixed rate obligations to a floating rate. Contracts are not designated as fair value hedges where the financial instrument swaps the debt into a currency other than the functional currency of the individual entity that holds the debt.
A-44
Back to Contents
Notes to the 2006 Financial statements
| 32 | FINANCIAL INSTRUMENTS CONTINUED |
| | | |
| B) | CURRENCY EXPOSURES |
| | | |
| a) | Currency exposures arising from the Group's financial assets and liabilities (excluding non debt derivatives) |
| | Certain financial assets and liabilities are not held in the functional currency of the relevant subsidiary. This results in an accounting exposure to exchange gains and losses as the financial assets and liabilities are translated into the functional currency of the subsidiary that accounts for those assets and liabilities. These gains and losses are recorded in the Group income statement except to the extent that they can be taken to equity under the Group's accounting policy which is explained in note 1. |
| | | |
| | After taking into account relevant derivative instruments, almost all of the Group's net debt is either denominated in US dollars or in the functional currency of the entity holding the debt. |
| | | |
| | The tables below set out the currency exposures arising from each of net debt, intragroup balances and other financial assets and liabilities. These currency exposures are after taking into account the effect of currency swaps. |
| | | |
| | Net debt: | | Net debt: | |
| | (before tax and minority interests) | | (net of tax and minority interests) | |
| | Currency of exposure | | | | | | Currency of exposure | | | |
| | United | | Other | | 2006 | | 2005 | | United | | Other | | 2006 | |
| | States | | currencies | | Total | | Total | | States | | currencies | | Total | |
| | dollar | | | | | | | | dollar | | | | | |
| | US$m | | US$m | | US$m | | US$m | | US$m | | US$m | | US$m | |
|
|
|
|
|
|
|
|
|
|
|
|
|
| |
| Functional currency of entity: | | | | | | | | | | | | | | |
| United States dollar | — | | (7 | ) | (7 | ) | 11 | | — | | (5 | ) | (5 | ) |
| Australian dollar (a) | (746 | ) | 9 | | (737 | ) | (1,279 | ) | (516 | ) | 6 | | (510 | ) |
| Canadian dollar (a) | (237 | ) | 2 | | (235 | ) | (590 | ) | (106 | ) | 1 | | (105 | ) |
| South African rand | (48 | ) | 1 | | (47 | ) | (62 | ) | (19 | ) | — | | (19 | ) |
| Other currencies | 24 | | 6 | | 30 | | 15 | | 17 | | 4 | | 21 | |
|
|
|
|
|
|
|
|
|
|
|
|
|
| |
| | (1,007 | ) | 11 | | (996 | ) | (1,905 | ) | (624 | ) | 6 | | (618 | ) |
|
|
|
|
|
|
|
|
|
|
|
|
|
| |
| Net debt denominated in subsidiaries' functional currencies | | | | | (1,441 | ) | 592 | | | | | | | |
|
|
|
|
|
|
|
|
|
|
|
|
|
| |
| Net debt(note 23) | | | | | (2,437 | ) | (1,313 | ) | | | | | | |
|
|
|
|
|
|
|
|
|
|
|
|
|
| |
| (a) | Of the US$746 million of US dollar denominated net debt in Australian functional currency companies, US$46 million has been swapped to US$. The underlying currency is 5 billion yen. Similarly, of the US$237 million of US dollar denominated net debt in Canadian functional currency companies, US$64 million has been swapped to US$. The underlying currencies are: £15 million and 5 billion yen. |
| | |
| | |
| | Intragroup debt: | | Intragroup debt: | |
| | (before tax and minority interests) | | (net of tax and minority interests) | |
| | Currency of exposure | | | | | | Currency of exposure | | | |
| | United | | Other | | 2006 | | 2005 | | United | | Other | | 2006 | |
| | States | | currencies | | Total | | Total | | States | | currencies | | Total | |
| | dollar | | | | | | | | dollar | | | | | |
| | US$m | | US$m | | US$m | | US$m | | US$m | | US$m | | US$m | |
|
|
|
|
|
|
|
|
|
|
|
|
|
| |
| Functional currency of entity: | | | | | | | | | | | | | | |
| United States dollar | — | | 2,739 | * | 2,739 | | 220 | | — | | 2,747 | * | 2,747 | |
| Australian dollar | (2,254 | ) | 46 | | (2,208 | ) | (2,157 | ) | (1,522 | ) | 31 | | (1,491 | ) |
| Canadian dollar | (355 | ) | — | | (355 | ) | (432 | ) | (245 | ) | — | | (245 | ) |
| South African rand | (116 | ) | (8 | ) | (124 | ) | (131 | ) | (38 | ) | (4 | ) | (42 | ) |
| Other currencies | (54 | ) | 29 | | (25 | ) | (110 | ) | (38 | ) | 20 | | (18 | ) |
|
|
|
|
|
|
|
|
|
|
|
|
|
| |
| Total | (2,779 | ) | 2,806 | | 27 | | (2,610 | ) | (1,843 | ) | 2,794 | | 951 | |
|
|
|
|
|
|
|
|
|
|
|
|
|
| |
| The above table deals with intragroup balances that give rise to exchange differences in the income statement. Other intragroup balances are in the functional currency of the entity or they are quasi-equity |
| | | |
| * | These amounts relate to intragroup debt denominated in Australian dollars reported by subsidiaries with a US dollar functional currency. They are shown as positive balances because they have the effect of offsetting the exposures resulting from external and intragroup US dollar liabilities in Australian subsidiaries. |
A-45
Back to Contents
Notes to the 2006 Financial statements
| 32 | FINANCIAL INSTRUMENTS CONTINUED |
| | | |
| | | |
| b) | Currency exposures arising from the Group's net receivables and payables |
| | The table below sets out the currency exposures arising from the Group's net receivables and payables, that are not denominated in the functional currency of the relevant subsidiary. Gains and losses resulting from such exposures are recorded in the income statement. |
| | | |
| | Net receivables less payables | | Net receivables less payables | |
| | (before tax and minority interests) | | (net of tax and minority interests) | |
| | Currency of exposure | | | | | | Currency of exposure | | | |
| | United | | Other | | 2006 | | 2005 | | United | | Other | | 2006 | |
| | States | | currencies | | Total | | Total | | States | | currencies | | Total | |
| | dollar | | | | | | | | dollar | | | | | |
| | US$m | | US$m | | US$m | | US$m | | US$m | | US$m | | US$m | |
|
|
|
|
|
|
|
|
|
|
|
|
|
| |
| Functional currency of entity: | | | | | | | | | | | | | | |
| Australian dollar | 793 | | 1 | | 794 | | 592 | | 487 | | 1 | | 488 | |
| Canadian dollar | 179 | | 12 | | 191 | | 162 | | 86 | | 8 | | 94 | |
| South African rand | 72 | | 17 | | 89 | | 74 | | 26 | | 5 | | 31 | |
| Other currencies | 135 | | 27 | | 162 | | 101 | | 95 | | 19 | | 114 | |
|
|
|
|
|
|
|
|
|
|
|
|
|
| |
| | 1,179 | | 57 | | 1,236 | | 929 | | 694 | | 33 | | 727 | |
|
|
|
|
|
|
|
|
|
|
|
|
|
| |
| Denominated in functional currencies of subsidiaries | | | | | (364 | ) | (277 | ) | | | | | | |
| | | | | | | | | | | | | | | |
| Reconciliation to balance sheet categories | | | | | | | | | | | | | | |
|
|
|
|
|
|
|
|
|
|
|
|
|
| |
| Net receivables less payables per above | | | | | 872 | | 652 | | | | | | | |
|
|
|
|
|
|
|
|
|
|
|
|
|
| |
| – trade debtors (net of provision): non-current (note 17) | | | | | 36 | | 1 | | | | | | | |
| – trade debtors (net of provision): current (note 17) | | | | | 2,127 | | 1,706 | | | | | | | |
| – trade creditors: current (note 24) | | | | | (1,291 | ) | (1,055 | ) | | | | | | |
|
|
|
|
|
|
|
|
|
|
|
|
|
| |
| | | | | | | | | | | | | | | |
| C) | INTEREST RATES |
| | | |
| i) | Interest bearing financial assets and financial liabilities |
| | The interest rate composition of the Group's interest bearing financial assets and liabilities is shown below. This table deals with the carrying values of the financial instruments in the balance sheet, with the values of derivatives shown separately |
| | | |
| At 31 December 2006 |
| | | |
| | Floating | | Fixed interest rates Amounts falling due in: | |
| | rate | | | | | | | | | | | | | | | |
|
|
|
|
|
|
|
|
|
|
|
|
|
|
|
| |
| | | | 1 year or | | | | | | | | | | 5 years | | Total | |
| | | | less | | 1-2 years | | 2-3 years | | 3-4 years | | 4-5 years | | or more | | 2006 | |
| | | | US$m | | US$m | | US$m | | US$m | | US$m | | US$m | | US$m | |
|
|
|
|
|
|
|
|
|
|
|
|
|
|
|
| |
| Financial liabilities | | | | | | | | | | | | | | | | |
| Borrowings | (580 | ) | (1,230 | ) | (641 | ) | (40 | ) | (414 | ) | (38 | ) | (554 | ) | (3,497 | ) |
| Bank overdrafts | (14 | ) | — | | — | | — | | — | | — | | — | | (14 | ) |
| Interest rate swaps (a) | (1,753 | ) | 1,193 | | 292 | | (122 | ) | 390 | | — | | — | | — | |
| Derivatives related to net debt | (21 | ) | — | | — | | (2 | ) | — | | — | | — | | (23 | ) |
|
|
|
|
|
|
|
|
|
|
|
|
|
|
|
| |
| | (2,368 | ) | (37 | ) | (349 | ) | (164 | ) | (24 | ) | (38 | ) | (554 | ) | (3,534 | ) |
|
|
|
|
|
|
|
|
|
|
|
|
|
|
|
| |
| Financial assets | | | | | | | | | | | | | | | | |
| Loans to jointly controlled entities (b) | 379 | | — | | — | | — | | — | | — | | — | | 379 | |
| US Treasury bonds | — | | 20 | | — | | — | | — | | — | | — | | 20 | |
| Other investments | 184 | | — | | — | | — | | — | | — | | — | | 184 | |
| Derivatives related to net debt | 355 | | — | | — | | — | | — | | — | | — | | 355 | |
| Cash and cash equivalents and liquid resources | 742 | | — | | — | | — | | — | | — | | — | | 742 | |
|
|
|
|
|
|
|
|
|
|
|
|
|
|
|
| |
| | 1,660 | | 20 | | — | | — | | — | | — | | — | | 1,680 | |
|
|
|
|
|
|
|
|
|
|
|
|
|
|
|
| |
| (a) | These are the notional principal amounts which swap the fixed rate liabilities into floating rate, and certain floating rate swaps into fixed rate. |
| (b) | Loans to jointly controlled entities include amounts of US$228 million (2005: US$225 million), which are not expected to be repaid and so form part of the Group's net investment in the jointly controlled entity. |
| (c) | Interest rates on the great majority of the Group's floating rate financial liabilities and assets will have been reset within six months. The interest rates applicable to the Group's US dollar denominated floating rate financial liabilities and assets did not differ materially at the year end from the three month US dollar LIBOR rate of 5.36 per cent (2005: 4.5 per cent). |
| (d) | The above table excludes US$176 million (2005: US$72 million) of equity shares and quoted funds, which are not interest bearing. |
A-46
Back to Contents
Notes to the 2006 Financial statements
| 32 | FINANCIAL INSTRUMENTS CONTINUED |
| | |
| | |
| At 31 December 2005 |
| | |
| | Floating | | Fixed interest rates Amounts falling due in: | |
| | rate | | | | | | | | | | | | | | | |
|
|
|
|
|
|
|
|
|
|
|
|
|
|
|
| |
| | | | 1 year or | | 1-2 years | | 2-3 years | | 3-4 years | | 4-5 years | | 5 years | | Total | |
| | | | less | | | | | | | | | | or more | | 2005 | |
| | | | US$m | | US$m | | US$m | | US$m | | US$m | | US$m | | US$m | |
|
|
|
|
|
|
|
|
|
|
|
|
|
|
|
| |
| Financial liabilities | | | | | | | | | | | | | | | | |
| Borrowings | (679 | ) | (909 | ) | (1,152 | ) | (635 | ) | (27 | ) | (13 | ) | (558 | ) | (3,973 | ) |
| Bank overdrafts | (12 | ) | — | | — | | — | | — | | — | | — | | (12 | ) |
| Interest rate swaps (a) | (2,213 | ) | 886 | | 1,138 | | 265 | | (76 | ) | — | | — | | — | |
| Derivatives related to net debt | (24 | ) | — | | — | | (1 | ) | (3 | ) | — | | — | | (28 | ) |
|
|
|
|
|
|
|
|
|
|
|
|
|
|
|
| |
| | (2,928 | ) | (23 | ) | (14 | ) | (371 | ) | (106 | ) | (13 | ) | (558 | ) | (4,013 | ) |
|
|
|
|
|
|
|
|
|
|
|
|
|
|
|
| |
| Financial assets | | | | | | | | | | | | | | | | |
| Loans to jointly controlled entities (b) | 384 | | — | | — | | — | | — | | — | | — | | 384 | |
| US Treasury bonds | — | | 109 | | — | | — | | — | | — | | — | | 109 | |
| Other investments | 275 | | — | | — | | — | | — | | — | | — | | 275 | |
| Derivatives related to net debt | 316 | | — | | — | | — | | — | | — | | — | | 316 | |
| Cash and cash equivalents and liquid resources | 2,384 | | — | | — | | — | | — | | — | | — | | 2,384 | |
|
|
|
|
|
|
|
|
|
|
|
|
|
|
|
| |
| | 3,359 | | 109 | | — | | — | | — | | — | | — | | 3,468 | |
|
|
|
|
|
|
|
|
|
|
|
|
|
|
|
| |
| | | | | | | | | | | | | | | | | |
| (ii) | Fixed rate liabilities after swaps |
| | Fixed rate liabilities not converted to floating rate by means of interest rate swaps are summarised below. |
| | | |
| | Principal | | Average | | 2006 | | Principal | | Average | | 2005 | |
| | | | fixed | | (Excess) of | | | | fixed | | Excess of | |
| | | | rate | | fair value | | | | rate | | fair value | |
| | | | | | over | | | | | | over | |
| | | | | | principal | | | | | | principal | |
| Maturity | US$m | | % p.a. | | US$m | | US$m | | % p.a. | | US$m | |
|
|
|
|
|
|
|
|
|
|
|
| |
| Less than 1 year | (37 | ) | 7.3 | | (3 | ) | (23 | ) | 7.4 | | (3 | ) |
| 1 to 5 years | (575 | ) | 4.3 | | 11 | | (504 | ) | 4.0 | | 16 | |
| More than 5 years | (554 | ) | 6.0 | | (29 | ) | (558 | ) | 6.3 | | (32 | ) |
|
|
|
|
|
|
|
|
|
|
|
| |
| Fixed rate liabilities | (1,166 | ) | 5.3 | | (21 | ) | (1,085 | ) | 5.3 | | (19 | ) |
|
|
|
|
|
|
|
|
|
|
|
| |
| (a) | As a consequence of acquisitions during 2000, the Group holds a number of interest rate swaps to receive US$ floating rates and pay US$ fixed rate which have been included in the total of fixed rate liabilities shown above. |
| (b) | The Group has US$121 million of finance leases (2005: US$112 million), the largest of which has a principal of US$52 million, a maturity of 2018 and a floating interest rate. |
| (c) | The Group's fixed rate debt after interest rate swaps has a weighted average time to maturity of six years (2005: seven years). |
| | | |
| (iii) | Fixed rate assets |
| | Total fixed rate financial assets for the Group at 31 December 2006 were US$20 million, with a fair value of US$20 million (2005: US$109 million with a fair value of US$108 million). The average fixed rate per annum for 2006 was 5.1 per cent (2005: 3.5 per cent). |
A-47
Back to Contents
Notes to the 2006 Financial statements
| 32 | FINANCIAL INSTRUMENTS CONTINUED |
| | |
| D) | LIQUIDITY |
| The maturity profile of the Group's financial liabilities and financial assets, other than trade and other receivables and payables, is as follows: |
| |
| | Borrowings | | Derivatives | | Other | | Total | | Total | |
| | before | | related to | | financial | | 2006 | | 2005 | |
| | swaps | | net debt | | liabilities | | US$m | | US$m | |
|
|
|
|
|
|
|
|
|
| |
| Financial liabilities | | | | | | | | | | |
| Within 1 year, or on demand | (1,504 | ) | (3 | ) | (213 | ) | (1,720 | ) | (1,373 | ) |
| Between 1 and 2 years | (723 | ) | (15 | ) | (182 | ) | (920 | ) | (1,298 | ) |
| Between 2 and 3 years | (107 | ) | (2 | ) | (79 | ) | (188 | ) | (762 | ) |
| Between 3 and 4 years | (478 | ) | (3 | ) | (27 | ) | (508 | ) | (140 | ) |
| Between 4 and 5 years | (68 | ) | — | | (25 | ) | (93 | ) | (80 | ) |
| After 5 years | (631 | ) | — | | (56 | ) | (687 | ) | (710 | ) |
|
|
|
|
|
|
|
|
|
| |
| | (3,511 | ) | (23 | ) | (582 | ) | (4,116 | ) | (4,363 | ) |
|
|
|
|
|
|
|
|
|
| |
| | | | | | | | | | | |
| | Cash and | | Derivatives | | Other | | Total | | Total | |
| | liquid | | related to | | financial | | | | | |
| | resources | | net debt | | assets | | US$m | | US$m | |
|
|
|
|
|
|
|
|
|
| |
| Financial assets | | | | | | | | | | |
| Within 1 year, or on demand | 742 | | 350 | | 142 | | 1,234 | | 2,814 | |
| Between 1 and 2 years | — | | — | | 152 | | 152 | | 411 | |
| Between 2 and 3 years | — | | — | | 54 | | 54 | | 54 | |
| Between 3 and 4 years | — | | 5 | | 42 | | 47 | | 44 | |
| Between 4 and 5 years | — | | — | | 13 | | 13 | | 36 | |
| After 5 years | — | | — | | 556 | | 556 | | 393 | |
|
|
|
|
|
|
|
|
|
| |
| | 742 | | 355 | | 959 | | 2,056 | | 3,752 | |
|
|
|
|
|
|
|
|
|
| |
| As at 31 December 2006, a total of US$1,281 million after swaps (2005: US$1,255 million) is outstanding under the US$3 billion European Medium Term Notes facility, of which US$845 million after swaps (2005: US$331 million) is repayable within one year. |
| |
| As at 31 December 2006, the Group had unutilised standby credit facilities totalling US$2.3 billion. These facilities, which are summarised below, are for back-up support for the Group’s commercial paper programmes and for general corporate purposes: |
A-48
Back to Contents
Notes to the 2006 Financial statements
| 32 | FINANCIAL INSTRUMENTS CONTINUED |
| | |
| | |
| Unutilised standby credit facilities | 2006 | | 2005 | |
| | US$m | | US$m | |
|
|
|
| |
| Between 4 and 5 years | 2,300 | | 2,300 | |
|
|
|
| |
| E) | FAIR VALUES |
| The carrying values and the fair values of Rio Tinto's financial instruments, other than trade and other receivables and payables, a31 December are shown in the following table. Fair value is the amount at which a financial instrument could be exchanged in anarm's length transaction between informed and willing parties. Where available, market values have been used to determine fairvalues. In other cases, fair values have been calculated using quotations from independent financial institutions, or by discountingexpected cash flows at prevailing market rates. The fair values of cash, short term borrowings and loans to equity accounted unitsapproximate to their carrying values, as a result of their short maturity or because they carry floating rates of interest |
| | |
| | 2006 | | 2005 | |
| |
|
|
| |
|
|
| |
| | Carrying | | Fair | | Carrying | | Fair | |
| | value | | value | | value | | value | |
| | US$m | | US$m | | US$m | | US$m | |
|
|
|
|
|
|
|
| |
| Primary financial instruments held or issued to finance the Group's operations: | | | | | | | | |
| US Treasury bonds (note 19) | 20 | | 20 | | 109 | | 108 | |
| Equity shares and quoted funds (note 19) | 176 | | 176 | | 72 | | 72 | |
| Other investments (note 19) | 184 | | 184 | | 275 | | 275 | |
| Cash and cash equivalent assets (note 20) | 736 | | 736 | | 2,379 | | 2,379 | |
| Other liquid resources | 6 | | 6 | | 5 | | 5 | |
| Short term borrowings and bank overdrafts | (1,504 | ) | (1,507 | ) | (1,202 | ) | (1,205 | ) |
| Medium and long term borrowings (note 21) | (2,007 | ) | (2,025 | ) | (2,783 | ) | (2,799 | ) |
| Loans to jointly controlled entities (Section C (i)) | 379 | | 379 | | 384 | | 384 | |
| Deferred consideration (note 24) | (179 | ) | (179 | ) | (179 | ) | (179 | ) |
|
|
|
|
|
|
|
| |
| | (2,189 | ) | (2,210 | ) | (940 | ) | (960 | ) |
| | | | | | | | | |
| Derivative financial instruments held to manage interest rate and currency profile (excludes embedded derivatives): | | | | | | | | |
| Forward contracts: cash flow hedge (Section A (a)) | (310 | ) | (310 | ) | (86 | ) | (86 | ) |
| Option contracts: cash flow hedge (Section A (b)) | 12 | | 12 | | 10 | | 10 | |
| Forward contracts and embedded derivatives (Section A (c)) | 95 | | 95 | | 117 | | 117 | |
| Currency swaps hedging non US dollar debt (Section A (d)) | 344 | | 344 | | 285 | | 285 | |
| Interest rate swap agreements and options (Section A (d)) | (12 | ) | (12 | ) | 3 | | 3 | |
|
|
|
|
|
|
|
| |
| | (2,060 | ) | (2,081 | ) | (611 | ) | (631 | ) |
|
|
|
|
|
|
|
| |
| Total per liquidity analysis (D) | | | | | | | | |
| – financial liabilities | (4,116 | ) | | | (4,363 | ) | | |
| – financial assets | 2,056 | | | | 3,752 | | | |
|
|
|
|
|
|
|
| |
| | (2,060 | ) | | | (611 | ) | | |
|
|
|
|
|
|
|
| |
A-49
Back to Contents
Notes to the 2006 Financial statements
| 33 | CONTINGENT LIABILITIES AND COMMITMENTS |
| | 2006 | | 2005 | |
| | US$m | | US$m | |
|
|
|
| |
| Capital commitments (excluding those related to joint ventures and associates) | | | | |
| Contracted capital expenditure: property, plant and equipment | 1,912 | | 1,004 | |
| Other commitments | 163 | | 93 | |
|
|
|
| |
| Capital commitments relating to joint ventures and associates(a) | | | | |
| Capital commitments incurred by the Group | 155 | | 7 | |
| Capital commitments incurred jointly with other venturers (Rio Tinto share) | 183 | | 218 | |
|
|
|
| |
Operating leases
The aggregate amount of minimum lease payments under non-cancellable operating leases are as follows:
| | 2006 | | 2005 | |
| | US$m | | US$m | |
|
|
|
| |
| Within 1 year | 62 | | 74 | |
| Between 1 and 5 years | 123 | | 95 | |
| After 5 years | 242 | | 29 | |
|
|
|
| |
| | 427 | | 198 | |
|
|
|
| |
Unconditional purchase obligations
The aggregate amount of future payment commitments under unconditional purchase obligations outstanding at 31 December was:
| | 2006 | | 2005 | |
| | US$m | | US$m | |
|
|
|
| |
| Within 1 year | 903 | | 935 | |
| Between 1 and 2 years | 713 | | 691 | |
| Between 2 and 3 years | 498 | | 575 | |
| Between 3 and 4 years | 343 | | 438 | |
| Between 4 and 5 years | 317 | | 329 | |
| After 5 years | 826 | | 1,096 | |
|
|
|
| |
| | 3,600 | | 4,064 | |
|
|
|
| |
Unconditional purchase obligations relate to commitments to make payments in the future for fixed or minimum quantities of goods or services at fixed or minimum prices. The future payment commitments set out above have not been discounted and mainly relate to commitments under 'take or pay' power and freight contracts. They exclude unconditional purchase obligations of jointly controlled entities apart from those relating to the Group's tolling arrangements.
| | 2006 | | 2005 | |
| | US$m | | US$m | |
|
|
|
| |
| Contingent liabilities (excluding those relating to joint ventures and associates) | | | | |
| Indemnities and other performance guarantees | 79 | | 61 | |
|
|
|
| |
|
|
|
| |
| Contingent liabilities relating to joint ventures and associates(a) | | | | |
| Share of contingent liabilities of joint ventures | 5 | | 4 | |
| Incurred in relation to interests in joint ventures | 372 | | 284 | |
| Incurred in relation to other venturers' contingent liabilities | 45 | | 35 | |
|
|
|
| |
| (a) | Amounts disclosed include those arising as a result of the Group's investments in both jointly controlled assets and jointly controlled entities. |
| (b) | There are a number of legal claims currently outstanding against the Group. No material loss to the Group is expected to result from these claims. |
A-50
Back to Contents
Notes to the 2006 Financial statements
| 34 | AVERAGE NUMBER OF EMPLOYEES |
| | | | Subsidiaries and proportionally | |
| | | | consolidated units | |
| | 2006 | | 2005 | | 2004 | |
|
|
|
|
|
| |
| The principal locations of employment were: | | | | | | |
| Australia and New Zealand | 11,636 | | 9,927 | | 9,065 | |
| North America | 10,201 | | 9,375 | | 8,742 | |
| Africa | 4,269 | | 3,958 | | 4,724 | |
| Europe | 1,468 | | 1,504 | | 1,848 | |
| South America | 874 | | 834 | | 1,361 | |
| Indonesia | 1,969 | | 1,920 | | 2,265 | |
| Other countries | 225 | | 306 | | 195 | |
|
|
|
|
|
| |
| | 30,642 | | 27,824 | | 28,200 | |
|
|
|
|
|
| |
| | | | | |
| | | | Equity accounted units | |
| | | | (Rio Tinto share) (a) | |
| | 2006 | | 2005 | | 2004 | |
|
|
|
|
|
| |
| The principal locations of employment were: | | | | | | |
| Australia and New Zealand | 2,192 | | 1,910 | | 1,862 | |
| North America | 311 | | 257 | | 246 | |
| Africa | 521 | | 494 | | 441 | |
| Europe | 507 | | 529 | | 671 | |
| South America | 1,072 | | 840 | | 851 | |
| Indonesia | — | | — | | — | |
| Other countries | — | | — | | 155 | |
|
|
|
|
|
| |
| | 4,603 | | 4,030 | | 4,226 | |
|
|
|
|
|
| |
| | | | | | | |
| | | | | | Group Total | |
| | 2006 | | 2005 | | 2004 | |
|
|
|
|
|
| |
| The principal locations of employment were: | | | | | | |
| Australia and New Zealand | 13,828 | | 11,837 | | 10,927 | |
| North America | 10,512 | | 9,632 | | 8,988 | |
| Africa | 4,790 | | 4,452 | | 5,165 | |
| Europe | 1,975 | | 2,033 | | 2,519 | |
| South America | 1,946 | | 1,674 | | 2,212 | |
| Indonesia | 1,969 | | 1,920 | | 2,265 | |
| Other countries | 225 | | 306 | | 350 | |
|
|
|
|
|
| |
| | 35,245 | | 31,854 | | 32,426 | |
|
|
|
|
|
| |
| (a) | Employee numbers, which represent the average for the year, include 100 per cent of employees of subsidiary companies. Employee numbers for proportionally consolidated and equity accounted units are proportional to the Group's interest. Average employee numbers include a part year effect for companies acquired or disposed of during the year. |
| (b) | Part-time employees are included on a full time equivalent basis. Temporary employees are included in employee numbers. |
| (c) | People employed by contractors are not included. |
A-51
Back to Contents
Notes to the 2006 Financial statements
| | | | | | | | | | |
| At 31 December 2006 | | | | | | | | | |
| | | | | | | | | | |
| Company and country of | | Principal activities | | Class of | | Proportion | | Group | |
| incorporation | | | | shares held | | of class held | | interest | |
| | | | | | | % | | % | |
|
|
|
|
|
|
|
|
| |
| Australia | | | | | | | | | |
| Argyle Diamond Mines | | Mining and processing of diamonds | | (a) | | | | 100 | |
| Coal & Allied Industries Limited | | Coal mining | | Ordinary | | 75.71 | | 75.71 | |
| Rio Tinto Aluminium (Holdings) Limited | | Bauxite mining; alumina production; primary aluminium smelting | | Ordinary | | 100 | | 100 | |
| Dampier Salt Limited | | Salt production | | Ordinary | | 64.94 | | 64.94 | |
| Energy Resources of Australia Limited | | Uranium mining | | Class A | | 68.39 | | 68.39 | |
| Hamersley Iron Pty Limited | | Iron ore mining | | Ordinary | | 100 | | 100 | |
| Queensland Coal Pty Limited (b) | | Coal mining | | Ordinary | | 100 | | 100 | |
|
|
|
|
|
|
|
|
| |
| Canada | | | | | | | | | |
| Iron Ore Company of Canada Inc | | Iron ore mining; iron ore pellets | | Series A & E | | 58.72 | | 58.72 | |
| QIT-Fer et Titane Inc | | Titanium dioxide feedstock; highpurity iron and steel | | Common shares | | 100 | | 100 | |
| | | | | Class B preference shares | | 100 | | 100 | |
|
|
|
|
|
|
|
|
| |
| France | | | | | | | | | |
| Talc de Luzenac S.A. | | Mining, refining and marketing of talc | | E 15.25 | | 100 | | 100 | |
|
|
|
|
|
|
|
|
| |
| Indonesia | | | | | | | | | |
| P.T. Kelian Equatorial Mining | | Gold mining | | Ordinary US$1 | | 90 | | 90 | |
|
|
|
|
|
|
|
|
| |
| Namibia | | | | | | | | | |
| Rössing Uranium Limited (c) | | Uranium mining | | ‘B’N$1 | | 71.16 | } | 68.58 | |
| | | | | ‘C’N10c | | 70.59 | | |
|
|
|
|
|
|
|
|
| |
| Papua New Guinea | | | | | | | | | |
| Bougainville Copper Limited (d) | | Copper and gold mining | | Ordinary 1 Kina | | 53.58 | | 53.58 | |
|
|
|
|
|
|
|
|
| |
| South Africa | | | | | | | | | |
| Palabora Mining Company Limited | | Copper mining, smelting and refining | | R1 | | 72.03 | | 57.67 | |
| Richards Bay Iron and Titanium | | Titanium dioxide feedstock; high purity | | R1 | | 50.5 | | 50 | |
| (Pty) Limited | | iron | | | | | | | |
|
|
|
|
|
|
|
|
| |
| United States of America | | | | | | | | | |
| Kennecott Holdings Corporation(including Kennecott Utah Copper,Kennecott Minerals, Kennecott Landand Kennecott Exploration) | | Copper and gold mining,smelting and refining, landdevelopment and explorationactivities | | Common US$0.01 | | 100 | | 100 | |
| Rio Tinto Energy America Inc. | | Coal mining | | Common US$0.01 | | 100 | | 100 | |
| U.S. Borax Inc. | | Mining, refining and marketing of borates | | Common US$1 | | 100 | | 100 | |
|
|
|
|
|
|
|
|
| |
| (a) | This entity is unincorporated. |
| (b) | Queensland Coal Pty Limited is the main legal entity that owns the assets of the Tarong mine and also owns the shares shown in note 38 of Hail Creek, Blair Athol and Kestrel. |
| (c) | The Group's shareholding in Rössing Uranium Limited carries 35.54 per cent of the total voting rights. Rössing is consolidated by virtue of Board control. |
| (d) | The results of Bougainville Copper Limited are not consolidated, see note 44. |
| (e) | The Group comprises a large number of companies and it is not practical to include all of them in this list. The list therefore only includes those companies that have a more significant impact on the profit or assets of the Group. |
| (f) | The Group's principal subsidiaries are held by intermediate holding companies and not directly by Rio Tinto plc or Rio Tinto Limited. |
| (g) | All companies operate mainly in the countries in which they are incorporated. |
A-52
Back to Contents
Notes to the 2006 Financial statements
| 36 | PRINCIPAL JOINTLY CONTROLLED ENTITIES |
| |
At 31 December 2006
| Name and countryof incorporation/operation | | Principal activities | | Number of | | Class of | | Proportion | | Group | |
| shares held | | shares held | | of class held | | interest | |
| by the Group | | | | % | | % | |
|
|
|
|
|
|
|
|
|
|
| |
| Australia | | | | | | | | | | | |
| Boyne Smelters Limited | | Aluminium smelting | | 153,679,560 | | Ordinary | | 59.4 | | 59.4 | |
| Leichhardt Coal Pty. Limited (b) | | Coal mining | | 20,115,000 | | Ordinary | | 44.7 | | 44.7 | |
| Queensland Alumina Limited | | Alumina production | | 854,078 | | Ordinary | | 38.6 | | 38.6 | |
|
|
|
|
|
|
|
|
|
|
| |
| Chile | | | | | | | | | | | |
| Minera Escondida Limitada (c) | | Copper mining and refining | | | | | | 30 | | 30 | |
|
|
|
|
|
|
|
|
|
|
| |
| New Zealand | | | | | | | | | | | |
| New Zealand Aluminium Smelters Limited | | Aluminium smelting | | 24,998,400 | | Ordinary | | 79.36 | | 79.36 | |
|
|
|
|
|
|
|
|
|
|
| |
| United Kingdom | | | | | | | | | | | |
| Anglesey Aluminium Metal Limited | | Aluminium smelting | | | | Ordinary £1 | | 51 | | 51 | |
|
|
|
|
|
|
|
|
|
|
| |
| United States of America | | | | | | | | | | | |
| Decker | | Coal mining | | | | (d) | | | | 50 | |
|
|
|
|
|
|
|
|
|
|
| |
| (a) | The Group has joint control of the above operations which, except as disclosed in note (d) below, are independent legal entities. It therefore includes them in its accounts using the equity accounting technique. |
| (b) | Leichhardt has a 31.4 per cent interest in the Blair Athol joint venture. As a result, the Group has a further beneficial interest of 14 per cent in addition to its direct interest of 57.2 per cent, which is owned via a subsidiary of Rio Tinto Limited. The Blair Athol joint venture is disclosed as a jointly controlled asset in note 38. |
| (c) | The year end of Minera Escondida is 30 June. However, the amounts included in the consolidated financial statements of Rio Tinto are based on accounts of Minera Escondida that are coterminous with those of the Group. |
| (d) | This operation is unincorporated. The joint venture agreement creates an arrangement that is similar in form to a partnership, and is therefore classified as a jointly controlled entity. |
| (e) | The Group comprises a large number of operations and it is not practical to include all of them in this list. The list therefore only includes those entities that have a more significant impact on the profit or operating assets of the Group. |
| (f) | The Group's principal jointly controlled entities are held by intermediate holding companies and not directly by Rio Tinto plc or Rio Tinto Limited. |
| (g) | All jointly controlled entities operate mainly in the countries in which they are incorporated. |
At 31 December 2006
| Name and country | | Principal activities | | Number of | | Class of | | Proportion | | Group | |
| of incorporation/operation | | | | shares held | | shares held | | of class held | | interest | |
| | | | | by the Group | | | | % | | % | |
|
|
|
|
|
|
|
|
|
|
| |
| Canada | | | | | | | | | | | |
| Ivanhoe Mines Ltd (a) | | Copper and gold mining | | 37,089,883 | | Common | | 9.95 | | 9.95 | |
|
|
|
|
|
|
|
|
|
|
| |
| South Africa | | | | | | | | | | | |
| Tisand (Pty) Limited | | Ilmenite, rutile and zircon mining | | 7,353,675 | | R1 | | 49.0 | | 50.0 | |
|
|
|
|
|
|
|
|
|
|
| |
| United States of America | | | | | | | | | | | |
| Cortez | | Gold mining | | | | (b) | | | | 40 | |
|
|
|
|
|
|
|
|
|
|
| |
| (a) | Ivanhoe Mines Ltd is accounted for as an associated company having regard to Rio Tinto's representation on its Board of Directors and on the technical committee that will be responsible for its Oyu Tolgoi project. |
| (b) | This operation is unincorporated. |
| (c) | The Group's principal associates are held by intermediate holding companies and not directly by Rio Tinto plc or Rio Tinto Limited. |
| (d) | The Group comprises a large number of operations and it is not practical to include all of them in this list. The list therefore only includes those entities that have a more significant impact on the profit or operating assets of the Group. |
| (e) | With the exception of Ivanhoe Mines Ltd, the core assets of which are located in Mongolia, all associates operate mainly in the countries in which they are incorporated. |
A-53
Back to Contents
Notes to the 2006 Financial statements
| 38 | PRINCIPAL JOINTLY CONTROLLED ASSETS AND OTHER PROPORTIONALLY CONSOLIDATED UNITS |
| | | | | | |
| At 31 December 2006 | | | | | |
| Name and country | | Principal activities | | Group | |
| of operation | | | | interest | |
|
|
|
|
| |
| Australia | | | | | |
| Bengalla | | Coal mining | | 30.3 | |
| Blair Athol Coal (b) | | Coal mining | | 71.2 | |
| Hail Creek | | Coal mining | | 82 | |
| Kestrel | | Coal mining | | 80 | |
| Mount Thorley | | Coal mining | | 60.6 | |
| Warkworth | | Coal mining | | 42.1 | |
| Northparkes Mine | | Copper/gold mining and processing | | 80 | |
| Gladstone Power Station | | Power generation | | 42.1 | |
| Robe River Iron Associates | | Iron ore mining | | 53 | |
| Hope Downs Joint Venture | | Iron ore mining | | 50 | |
| HIsmelt® | | Iron technology | | 60 | |
|
|
|
|
| |
| Canada | | | | | |
| Diavik | | Mining and processing of diamonds | | 60 | |
|
|
|
|
| |
| Indonesia | | | | | |
| Grasberg expansion | | Copper and gold mining | | 40 | |
|
|
|
|
| |
| United States of America | | | | | |
| Greens Creek | | Silver, gold, zinc and lead mining | | 70.3 | |
|
|
|
|
| |
| (a) | The Group comprises a large number of operations, and it is not practical to include all of them in this list. The list therefore only includes those proportionally consolidated units that have a more significant impact on the profit or operating assets of the Group. |
| (b) | The Group has a direct interest of 57.2 per cent in Blair Athol Coal, and an additional 14 per cent interest through its investment in Leichhardt Coal Pty Limited, which is disclosed as a jointly controlled entity in note 36. |
| (c) | The Group's proportionally consolidated units are held by intermediate holding companies and not directly by Rio Tinto plc or Rio Tinto Limited. |
A-54
Back to Contents
Notes to the 2006 Financial statements
| 39 | SALES AND PURCHASES OF SUBSIDIARIES, JOINT VENTURES, ASSOCIATES AND OTHER INTERESTS IN BUSINESSES |
| | | | | | | | | | |
| 2006 Acquisitions | | | | | | | | | |
| Name of operation | | Location | | Principal activities | | Ownership | | | |
| | | | | | | acquired | | Date of | |
| | | | | | | % | | acquisition | |
|
|
|
|
|
|
|
|
| |
| Associates | | | | | | | | | |
| Ivanhoe Mines | | Canada | | Copper and gold mining | | 9.95 | | 18 October 2006 | |
|
|
|
|
|
|
|
|
| |
| Proportionally consolidated units | | | | | | | | | |
| Hope Downs Joint Venture | | Australia | | Iron ore mining | | 50 | | 16 March 2006 | |
|
|
|
|
|
|
|
|
| |
| | | | | | | | | | |
| 2006 Disposals | | | | | | | | | |
| Name of operation | | Location | | Principal activities | | Ownership | | Date of | |
| | | | | | | disposed | | disposal | |
|
|
|
|
|
|
|
|
| |
| Jointly Controlled Entities | | | | | | | | | |
| Eurallumina SpA | | Italy | | Alumina production | | 56.16 | | 2 November 2006 | |
|
|
|
|
|
|
|
|
| |
| (a) | The aggregate profit on disposal of interests in businesses in 2006 was US$5 million (US$3 million net of tax). These gains have been excluded from Underlying earnings, as shown in note 2. |
| (b) | The Cash flow statement includes the following relating to acquisitions and disposals of interests in businesses: |
| | – | US$279 million in '(Acquisitions) / disposals of subsidiaries, joint ventures and associates', comprising US$303 million paid for acquisitions, net of US$24 million of disposal proceeds. In accordance with IAS 7, these proceeds were stated net of US$17 million cash and cash equivalents transferred on sale of subsidiaries. |
| | – | US$167 million included in 'purchase of financial assets'. |
| (c) | Non-cash disposal proceeds of US$23 million were received during the year. |
| 2005 Disposals | | | | | | | | | |
| Name of operation | | Location | | Principal activities | | Ownership | | | |
| | | | | | | disposed | | Date of | |
| | | | | | | % | | disposal | |
|
|
|
|
|
|
|
|
| |
| Associates | | | | | | | | | |
| Lihir Gold Limited | | Papua New Guinea | | Gold mining | | 14.46 | | 30 November 2005 | |
|
|
|
|
|
|
|
|
| |
| Other investments | | | | | | | | | |
| Labrador Iron Ore Royalty | | | | | | | | | |
| Income Fund | | Canada | | Investing | | 19 | | 30 March 2005 | |
|
|
|
|
|
|
|
|
| |
| (a) | The aggregate profit on disposal of interests in businesses in 2005 was US$322 million (US$311 million net of tax). These gains were excluded from underlying earnings. |
| (b) | The Cash flow statement included proceeds from disposals of interests in businesses as follows: |
| | – | US$323 million included in 'Disposals of subsidiaries, joint ventures and associates (less acquisitions)' which comprised |
| | | US$295 million in respect of associates and US$28 million in respect of subsidiaries. |
| | – | US$133 million included in 'sales of other financial assets'. |
A-55
Back to Contents
Notes to the 2006 Financial statements
| 40 | DIRECTORS' AND KEY MANAGEMENT REMUNERATION |
| |
| Aggregate remuneration, calculated in accordance with the Companies Act 1985, of the directors of the parent companies was as follows: |
| | | 2006 | | 2005 | | 2004 | |
| | | US$’000 | | US$’000 | | US$’000 | |
|
|
|
|
|
|
| |
| Emoluments | | 9,569 | | 7,523 | | 9,992 | |
| Long term incentive plans | | 255 | | 2,298 | | 57 | |
|
|
|
|
|
|
| |
| | | 9,824 | | 9,821 | | 10,049 | |
|
|
|
|
|
|
| |
| Pension contributions: defined contribution plans | | 60 | | 58 | | 87 | |
|
|
|
|
|
|
| |
| Gains made on exercise of share options | | 1,260 | | 5,763 | | 2,414 | |
For 2006, a total of US$3,576,100 (2005: US$8,024,100; 2004: US$4,190,900) was attributable to the highest paid director in respect of the aggregate amounts disclosed in the above table, including gains made on exercise of share options. The accrued pension lump sum entitlement for the highest paid director was US$12,124,400 (2005: US$712,100 annualised pension value; 2004: US$712,400 annualised pension value).
The aggregate remuneration incurred by Rio Tinto plc in respect of its directors was US$7,151,400 (2005: US$12,270,000; 2004: US$7,756,000). There were no pension contributions made (2005 and 2004: no pension contributions).
The aggregate remuneration, including pension contributions and other retirement benefits, incurred by Rio Tinto Limited in respect of its directors was US$3,992,900 (2005: US$3,372,000; 2004: US$4,794,000). The aggregate pension contribution to defined contribution plans was US$60,000 (2005: US$58,000; 2004: US$87,000 to defined contribution plans).
During 2006, three directors (2005: three; 2004: four) accrued retirement benefits under defined benefit arrangements, and one director (2005: one; 2004: two) accrued retirement benefits under defined contribution arrangements.
Emoluments included in the table above have been translated from local currency at the average rate for the year with the exception of bonus payments which, together with amounts payable under long term incentive plans, have been translated at the year end rate.
More detailed information concerning directors’ remuneration, shareholdings and options is shown in the Remuneration report, including Tables 1 to 5, on pages 95 to 121.
Aggregate compensation, representing the expense recognised under EU IFRS, of the Group's key management, including directors, was as follows:
| | | 2006 | | 2005 | | 2004 | |
| | | US$’000 | | US$’000 | | US$’000 | |
|
|
|
|
|
|
| |
| Short-term employee benefits and costs | | 20,380 | | 19,204 | | 22,501 | |
| Post-employment benefits | | 3,444 | | 2,325 | | 2,354 | |
| Other long-term benefits | | 737 | | 737 | | 1,325 | |
| Termination benefits | | — | | 1,129 | | — | |
| Share-based payments | | 1,631 | | 12,154 | | 10,134 | |
|
|
|
|
|
|
| |
| | | 26,192 | | 35,549 | | 36,314 | |
|
|
|
|
|
|
| |
The figures for 2005 and 2004 have been restated to include compensation for 2005 and 2004 of an individual who became part of the Group's key management in 2006.
More detailed information concerning remuneration of key management is shown in the Remuneration report, including Tables 1 to 5, on pages 95 to 121.
A-56
Back to Contents
Notes to the 2006 Financial statements
| | | 2006 | | 2005 | | 2004 | |
| | | US$m | | US$m | | US$m | |
|
|
|
|
|
|
| |
| Group Auditors' remuneration (a) | | | | | | | |
| Audit services pursuant to legislation – fees payable | | | | | | | |
| – the audit of the Group's annual accounts | | 2.8 | | 2.0 | | 1.5 | |
| – the audit of the accounts of the Group's subsidiaries (b) | | 8.0 | | 6.3 | | 5.0 | |
|
|
|
|
|
|
| |
| | | 10.8 | | 8.3 | | 6.5 | |
| Other services | | | | | | | |
| – other services supplied pursuant to legislation (c) | | 2.4 | | 3.0 | | 1.1 | |
| – taxation services (d) | | 0.8 | | 1.6 | | 1.8 | |
| – other services (e) | | 0.9 | | 2.4 | | 1.9 | |
|
|
|
|
|
|
| |
| | | 4.1 | | 7.0 | | 4.8 | |
| Fees in respect of pension scheme audits | | 0.1 | | 0.2 | | 0.2 | |
|
|
|
|
|
|
| |
| | | 15.0 | | 15.5 | | 11.5 | |
|
|
|
|
|
|
| |
| Remuneration payable to other accounting firms (f) | | | | | | | |
| Non-Audit Services | | | | | | | |
| – the auditing of accounts of the Group's subsidiaries pursuant to legislation | | 0.3 | | 0.2 | | 0.4 | |
| – taxation services | | 2.8 | | 3.1 | | 3.0 | |
| – financial systems design and implementation | | 0.3 | | 1.2 | | 1.6 | |
| – internal audit | | 4.2 | | 3.3 | | 3.7 | |
| – litigation services | | 0.1 | | — | | — | |
| – other services (g) | | 7.1 | | 9.7 | | 2.4 | |
|
|
|
|
|
|
| |
| | | 14.8 | | 17.5 | | 11.1 | |
| Fees in respect of pension scheme audits | | 0.2 | | — | | — | |
|
|
|
|
|
|
| |
| | | 15.0 | | 17.5 | | 11.1 | |
|
|
|
|
|
|
| |
| | | 30.0 | | 33.0 | | 22.6 | |
|
|
|
|
|
|
| |
Remuneration of auditors is required to be presented in accordance with the requirements of The Companies (Disclosure of Auditor Remuneration) Regulations 2005 ('the legislation') for the first time in 2006. Comparative amounts for 2005 and 2004 have been restated on this basis.
| (a) | The remuneration payable to PricewaterhouseCoopers, the Group Auditors, is approved by the Audit committee. The committee sets the policy for the award of non-audit work to the auditors and approves the nature and extent of such work, and the amount of the related fees, to ensure that independence is maintained. The fees disclosed above consolidate all payments made to PricewaterhouseCoopers by the Companies and their subsidiaries, together with the Group's share of the payments made by proportionally consolidated units. |
| (b) | Fees payable for the 'audit of the accounts of the Group's subsidiaries pursuant to legislation' includes the statutory audit of subsidiaries and other audit work performed to support the audit of the Group financial statements. |
| (c) | 'Other services supplied pursuant to legislation' primarily relates to preparatory work relating to compliance with the Sarbanes-Oxley Act. |
| (d) | 'Taxation services' includes tax compliance and advisory services, involving the preparation or review of returns for corporation, income, sales and excise taxes; advice on acquisitions; advice on transfer pricing and, in 2005 and 2004, dealing with tax returns for expatriates. |
| (e) | 'Other services' includes advice on accounting matters (including the IFRS restatement in 2005) and assurance services in relation to issues of loan notes. |
| (f) | 'Remuneration payable to other accounting firms' does not include fees for similar services payable to suppliers of consultancy services other than accountancy firms. |
| (g) | 'Other services' in respect of other accounting firms includes pension fund and payroll administration, advice on accounting matters, secondments of accounting firms' staff, forensic audit, advisory services in connection with Section 404 of the Sarbanes-Oxley Act and other consultancy. |
A-57
Back to Contents
Notes to the 2006 Financial statements
| 42 | RELATED PARTY TRANSACTIONS |
| |
| Information about material related party transactions of the Rio Tinto Group is set out below: |
Subsidiary companies and proportionally consolidated units
Details of investments in principal subsidiary companies are disclosed in note 35.
Information relating to proportionally consolidated units can be found in note 38.
Equity accounted units
Transactions and balances with equity accounted units are summarised below. Purchases relate largely to amounts charged by jointly controlled entities for toll processing of bauxite and alumina. Sales relate largely to charges for supply of coal to jointly controlled marketing entities for onsale to third party customers.
| | | 2006 | | 2005 | | 2004 | |
| Income statement items | | US$m | | US$m | | US$m | |
|
|
|
|
|
|
| |
| Purchases from equity accounted units | | (1,364 | ) | (1,259 | ) | (1,078 | ) |
| Sales to equity accounted units | | 1,497 | | 1,296 | | 692 | |
|
|
|
|
|
|
| |
| | | | | | | | |
| Balance sheet items | | US$m | | US$m | | | |
|
|
|
|
| | | |
| Investments in equity accounted units (note 14) | | 2,235 | | 1,829 | | | |
| Loans to equity accounted units | | 151 | | 159 | | | |
| Loans from equity accounted units | | (65 | ) | (14 | ) | | |
| Trade and other receivables: amounts due from equity accounted units (note 17) | | 648 | | 530 | | | |
| Trade and other payables: amounts due to equity accounted units (note 24) | | (143 | ) | (199 | ) | | |
|
|
|
|
| | | |
| | | | | | | | |
| Cash flow statement items | | US$m | | US$m | | US$m | |
|
|
|
|
|
|
| |
| (Funding of)/repayments from equity accounted units | | (47 | ) | 17 | | 9 | |
|
|
|
|
|
|
| |
Pension funds
Information relating to pension fund arrangements is disclosed in note 46.
Directors and key management
Details of directors' and key management remuneration are set out in note 40 and in the remuneration report on page xx to xx.
| 43 | EXCHANGE RATES IN US$ |
| |
| The principal exchange rates used in the preparation of the 2006 financial statements are: |
| | | Annual average | | Year end | |
| | | 2006 | | 2005 | | 2004 | | 2006 | | 2005 | | 2004 | |
|
|
|
|
|
|
|
|
|
|
|
|
| |
| Sterling | | 1.84 | | 1.82 | | 1.83 | | 1.96 | | 1.73 | | 1.93 | |
| Australian dollar | | 0.75 | | 0.76 | | 0.73 | | 0.79 | | 0.73 | | 0.78 | |
| Canadian dollar | | 0.88 | | 0.83 | | 0.77 | | 0.86 | | 0.86 | | 0.83 | |
| South African rand | | 0.148 | | 0.157 | | 0.155 | | 0.143 | | 0.158 | | 0.177 | |
|
|
|
|
|
|
|
|
|
|
|
|
| |
| | |
| 44 | BOUGAINVILLE COPPER LIMITED ('BCL') |
| |
The Panguna mine remains shut down. Access to the mine site has not been possible and an accurate assessment of the condition of the assets cannot be determined. Considerable funding would be required to recommence operations to the level which applied at the time of the mine's closure in 1989 and these funding requirements cannot be forecast accurately. The directors do not have access to reliable, verifiable or objective information on BCL and the directors have therefore decided to exclude BCL information from the financial statements. BCL reported a net profit of US$1 million for the financial year (2005: US$nil; 2004: US$1 million). This is based upon actual transactions for the financial year.
The aggregate amount of capital and reserves reported by BCL as at 31 December 2006 was US$129 million (2005: US$112 million). The Group owns 214,887,966 shares in BCL, representing 53.6 per cent of the issued share capital. The investment of US$195 million was fully provided against in 1991. At 31 December 2006, the number of shares in BCL held by the Group, multiplied by the share price, resulted in an amount of US$119 million. |
A-58
Back to Contents
Notes to the 2006 Financial statements
| 45 | SHARE BASED PAYMENTS |
| |
Rio Tinto plc and Rio Tinto Limited have a number of share-based payment plans, which are described in detail in the Remuneration Report. These plans have been accounted for in accordance with the fair value recognition provisions of IFRS 2, 'Share-based Payments', which means that IFRS 2 has been applied to all grants of employee share-based payments that had not vested as at 1 January 2004.
The compensation cost that has been recognised in income for Rio Tinto's share-based compensation plans, and related liabilities, are set out in the table below. |
| | | Expense recognised for | | | |
| | | the period | | Liability at end of period | |
| | | 2006 | | 2005 | | 2004 | | 2006 | | 2005 | |
| | | US$m | | US$m | | US$m | | US$m | | US$m | |
|
|
|
|
|
|
|
|
|
|
| |
| Equity-settled plans | | 25 | | 26 | | 31 | | | | | |
| Cash-settled plans | | 7 | | 22 | | 9 | | 43 | | 39 | |
|
|
|
|
|
|
|
|
|
|
| |
| Total | | 32 | | 48 | | 40 | | 43 | | 39 | |
|
|
|
|
|
|
|
|
|
|
| |
Lattice-based option valuation model
The fair value of share options is estimated as at the date of grant using a lattice-based option valuation model. The significant assumptions used in the valuation model are disclosed below. Expected volatilities are based on the historical volatility of Rio Tinto's share returns under the UK and Australian listings. Historical data were used to estimate employee turnover rates within the valuation model. Under the Share Option Plans, it is assumed that after options have vested, 20 per cent p.a. of participants will exercise their options when the market price is at least 20 per cent above the exercise price of the option. Participants in the Share Savings Plans are assumed to exercise their options immediately after vesting. The implied lifetime of options granted is derived from the output of the option valuation model and represents the period of time that options granted are expected to be outstanding. The risk-free rate used in the valuation model is equal to the yield available on UK and Australian zero-coupon government bonds (for plc and Limited options respectively) at the date of grant with a term equal to the expected term of the options.
Summary of options outstanding
A summary of the status of the Companies' fixed share option plans at 31 December 2006, and changes during the year ended 31 December 2006, is presented below.
| | | Number | | Weighted | | Weighted | | Aggregate | | Aggregate | |
| | | | | average | | average | | intrinsic | | intrinsic | |
| | | | | exercise | | remaining | | value | | value | |
| | | | | price | | contractual | | | | | |
| | | | | | | life | | 2006 | | 2005 | |
| Options outstanding at 31 December 2006 | | | | | | (years) | | US$'m | | US$'m | |
|
|
|
|
|
|
|
|
|
|
| |
| Rio Tinto plc share savings plan £8 - £21 | | 1,497,463 | | 14.26 | | 2.1 | | 37 | | 41 | |
| Rio Tinto plc share option plan £8 - £27.25 | | 5,185,847 | | 16.33 | | 6.8 | | 110 | | 142 | |
| Rio Tinto Limited share savings plan A$25 - A$57 | | 2,748,026 | | 36.00 | | 2.3 | | 83 | | 78 | |
| Rio Tinto Limited share option plan A$23 - A$72 | | 3,540,588 | | 43.53 | | 6.9 | | 86 | | 95 | |
|
|
|
|
|
|
|
|
|
|
| |
| | | | | | | | | 316 | | 356 | |
|
|
|
|
|
|
|
|
|
|
| |
| Options exercisable at 31 December 2006 | | | | | | | | | | | |
|
|
|
|
|
|
|
|
|
|
| |
| Rio Tinto plc share savings plan £12 - £18 | | 84,150 | | 12.64 | | 0.0 | | 2 | | — | |
| Rio Tinto plc share option plan £8 - £18 | | 2,363,000 | | 12.84 | | 5.3 | | 67 | | 62 | |
| Rio Tinto Limited share option plan A$23 - A$40 | | 1,531,393 | | 34.02 | | 5.2 | | 49 | | 36 | |
|
|
|
|
|
|
|
|
|
|
| |
| | | | | | | | | 118 | | 98 | |
|
|
|
|
|
|
|
|
|
|
| |
As at 31 December 2006 and 2005 there were no options exercisable under the Rio Tinto Limited share savings plan.
Share Savings Plans
Awards under these plans are settled in equity and accounted for accordingly. The fair value of each award on the day of grant was estimated using a lattice-based option valuation model, including allowance for the exercise price being at a discount to market price. The key assumptions used in the valuation are noted in the following table.
| | | Risk-free | | Expected | | Dividend | | Turnover | | Implied | |
| | | interest | | volatility | | yield | | rates | | lifetime | |
| | | rate | | | | | | | | | |
| | | % | | % | | % | | % | | (years) | |
|
|
|
|
|
|
|
|
|
|
| |
| Awards made in 2006 | | | | | | | | | | | |
| – Rio Tinto plc | | 4.7-4.9 | | 34.0 | | 1.7 | | 10.0 | | 2.0-5.2 | |
| – Rio Tinto Limited | | 5.6-5.7 | | 27.0 | | 1.5 | | 10.0 | | 3.2-5.2 | |
|
|
|
|
|
|
|
|
|
|
| |
A-59
Back to Contents
Notes to the 2006 Financial statements
| 45 | SHARE BASED PAYMENTS CONTINUED |
| |
| Rio Tinto plc – share savings plan |
| |
| | 2006 | | 2006 | | 2005 | | 2005 | | 2004 | | 2004 | |
| | Number | | Weighted | | Number | | Weighted | | Number | | Weighted | |
| | | | average | | | | average | | | | average | |
| | | | exercise | | | | exercise | | | | exercise | |
| | | | price | | | | price | | | | price | |
| | | | £ | | | | £ | | | | £ | |
|
|
|
|
|
|
|
|
|
|
|
| |
| Options outstanding at 1 January | 1,624,492 | | 11.84 | | 1,709,069 | | 10.11 | | 1,995,504 | | 8.63 | |
| Granted | 323,256 | | 20.72 | | 393,275 | | 16.64 | | 412,785 | | 11.40 | |
| Forfeited | (35,953 | ) | 14.06 | | (32,350 | ) | 10.25 | | (121,112 | ) | 9.64 | |
| Exercised | (376,802 | ) | 9.59 | | (334,750 | ) | 9.32 | | (527,641 | ) | 5.74 | |
| Cancellations | (25,097 | ) | 12.38 | | (70,027 | ) | 10.98 | | (15,773 | ) | 10.09 | |
| Expired | (12,433 | ) | 11.72 | | (40,725 | ) | 9.13 | | (34,694 | ) | 8.41 | |
|
|
|
|
|
|
|
|
|
|
|
| |
| Options outstanding at 31 December | 1,497,463 | | 14.26 | | 1,624,492 | | 11.84 | | 1,709,069 | | 10.11 | |
|
|
|
|
|
|
|
|
|
|
|
| |
| Weighted average grant-date fair value of | | | | | | | | | | | | |
| options granted during the year (£) | | | 7.93 | | | | 8.09 | | | | 5.48 | |
| Share price at date of grant for options | | | | | | | | | | | | |
| granted during the year (£) | | | 24.63 | | | | 22.34 | | | | 15.00 | |
| Estimated weighted average share price of | | | | | | | | | | | | |
| options exercised during the year (£) | | | 27.86 | | | | 16.95 | | | | 14.73 | |
| | | | | | | | | | | | | |
| Rio Tinto Limited – share savings plan | | | | | | | | | | | | |
| | 2006 | | 2006 | | 2005 | | 2005 | | 2004 | | 2004 | |
| | Number | | Weighted | | Number | | Weighted | | Number | | Weighted | |
| | | | average | | | | average | | | | average | |
| | | | exercise | | | | exercise | | | | exercise | |
| | | | price | | | | price | | | | price | |
| | | | A$ | | | | A$ | | | | A$ | |
|
|
|
|
|
|
|
|
|
|
|
| |
| Options outstanding at 1 January | 2,786,301 | | 30.56 | | 2,680,986 | | 27.18 | | 2,415,421 | | 26.71 | |
| Granted | 494,141 | | 56.80 | | 707,144 | | 40.92 | | 547,052 | | 29.04 | |
| Forfeited | (81,201 | ) | 30.85 | | (49,532 | ) | 27.31 | | (254,478 | ) | 26.72 | |
| Exercised | (414,201 | ) | 25.65 | | (407,195 | ) | 27.82 | | (27,009 | ) | 27.13 | |
| Cancellations | (36,936 | ) | 30.94 | | (131,498 | ) | 27.34 | | — | | — | |
| Expired | (78 | ) | 25.57 | | (13,604 | ) | 27.86 | | — | | — | |
|
|
|
|
|
|
|
|
|
|
|
| |
| Options outstanding at 31 December | 2,748,026 | | 36.00 | | 2,786,301 | | 30.56 | | 2,680,986 | | 27.18 | |
|
|
|
|
|
|
|
|
|
|
|
| |
| Weighted average grant-date fair value of | | | | | | | | | | | | |
| options granted during the year (A$) | | | 23.56 | | | | 21.62 | | | | 14.10 | |
| Share price at date of grant for options | | | | | | | | | | | | |
| grant for options granted during the year (A$) | | | 69.25 | | | | 56.50 | | | | 38.85 | |
| Estimated weighted average share price of | | | | | | | | | | | | |
| options exercised during the year (A$) | | | 74.16 | | | | 43.83 | | | | 36.32 | |
Share option plans
The Group has a policy of settling these awards in equity, although the directors at their discretion can offer a cash alternative. The awards are accounted for in accordance with the requirements applying to equity-settled share-based payment transactions. The performance conditions in relation to Total Shareholder Return have been incorporated in the measurement of fair value for these awards by modelling the correlation between Rio Tinto's TSR and that of the index. The relationship between Rio Tinto's TSR and the index was simulated many thousands of times to derive a distribution which, in conjunction with the lattice-based option valuation model, was used to determine the fair value of the options. The key assumptions are noted in the following table.
| | Risk-free | | Expected | | Dividend | | Turnover | | Implied | |
| | interest | | volatility | | yield | | rates | | lifetime | |
| | rate | | | | | | | | | |
| | % | | % | | % | | % | | (years) | |
|
|
|
|
|
|
|
|
|
| |
| Awards made in 2006 | | | | | | | | | | |
| – Rio Tinto plc | 4.3 | | 33.0 | | 1.7 | | 3.0 | | 5.8 | |
| – Rio Tinto Limited | 5.4 | | 26.0 | | 1.5 | | 3.0 | | 6.8 | |
|
|
|
|
|
|
|
|
|
| |
| | | | | | | | | | | |
A-60
Back to Contents
Notes to the 2006 Financial statements
| 45 | SHARE BASED PAYMENTS CONTINUED |
A summary of the status of the Companies' performance-based share option plans at 31 December 2006, and changes during the year ended 31 December 2006, is presented below.
| Rio Tinto plc – share option plan | | | | | | | | | | | | |
| | 2006 | | 2006 | | 2005 | | 2005 | | 2004 | | 2004 | |
| | Number | | Weighted | | Number | | Weighted | | Number | | Weighted | |
| | | | average | | | | average | | | | average | |
| | | | exercise | | | | exercise | | | | exercise | |
| | | | price | | | | price | | | | price | |
| | | | £ | | | | £ | | | | £ | |
|
|
|
|
|
|
|
|
|
|
|
| |
| Options outstanding at 1 January | 6,290,155 | | 13.45 | | 8,053,292 | | 12.33 | | 7,662,925 | | 11.93 | |
| Granted | 931,418 | | 27.11 | | 979,593 | | 18.26 | | 1,134,053 | | 13.29 | |
| Forfeited | (63,713 | ) | 25.16 | | (71,312 | ) | 14.96 | | (159,423 | ) | 13.09 | |
| Exercised | (1,972,013 | ) | 11.95 | | (2,671,418 | ) | 11.80 | | (584,263 | ) | 8.69 | |
|
|
|
|
|
|
|
|
|
|
|
| |
| Options outstanding at 31 December | 5,185,847 | | 16.33 | | 6,290,155 | | 13.45 | | 8,053,292 | | 12.33 | |
|
|
|
|
|
|
|
|
|
|
|
| |
| Weighted average fair value of options | | | | | | | | | | | | |
| granted during the year (£) | | | 7.40 | | | | 4.09 | | | | 2.81 | |
| Share price at date of grant for options | | | | | | | | | | | | |
| granted during the year (£) | | | 26.89 | | | | 18.25 | | | | 12.76 | |
| Estimated weighted average share price | | | | | | | | | | | | |
| of options exercised during the year (£) | | | 29.01 | | | | 20.37 | | | | 15.22 | |
In addition to the equity-settled share option plan grants shown above there were 118,125 cash-settled share option plan awards outstanding as at 31st December 2006. The total liability for these awards as at 31st December 2006 was US$1 million.
| Rio Tinto Limited – share option plan | | | | | | | | | | | | |
| | 2006 | | 2006 | | 2005 | | 2005 | | 2004 | | 2004 | |
| | Number | | Weighted | | Number | | Weighted | | Number | | Weighted | |
| | | | average | | | | average | | | | average | |
| | | | exercise | | | | exercise | | | | exercise | |
| | | | price | | | | price | | | | price | |
| | | | A$ | | | | A$ | | | | A$ | |
|
|
|
|
|
|
|
|
|
|
|
| |
| Options outstanding at 1 January | 3,959,472 | | 36.17 | | 4,073,599 | | 34.24 | | 3,602,137 | | 33.58 | |
| Granted | 716,318 | | 71.06 | | 669,731 | | 47.04 | | 796,683 | | 34.41 | |
| Forfeited | (89,041 | ) | 53.64 | | (48,880 | ) | 37.60 | | (128,613 | ) | 34.91 | |
| Exercised | (1,043,766 | ) | 33.65 | | (734,978 | ) | 35.30 | | (196,608 | ) | 22.25 | |
| Expired | (2,395 | ) | 39.87 | | — | | — | | — | | — | |
|
|
|
|
|
|
|
|
|
|
|
| |
| Options outstanding at 31 December | 3,540,588 | | 43.53 | | 3,959,472 | | 36.17 | | 4,073,599 | | 34.24 | |
|
|
|
|
|
|
|
|
|
|
|
| |
| Weighted average fair value of options | | | | | | | | | | | | |
| granted during the year (A$) | | | 17.09 | | | | 8.93 | | | | 6.17 | |
| Share price at date of grant for options | | | | | | | | | | | | |
| granted during the year (A$) | | | 70.85 | | | | 46.89 | | | | 33.17 | |
| Estimated weighted average share price | | | | | | | | | | | | |
| of options exercised during the year (A$) | | | 76.64 | | | | 49.86 | | | | 38.28 | |
In addition to the equity-settled share option plan grants shown above there were 57,396 cash-settled share option plan awards outstanding as at 31st December 2006. The total liability for these awards as at 31st December 2006 was US$2 million.
Share Ownership Plan
The fair values of awards of Matching and Free Shares made by Rio Tinto are taken to be the market value of the shares on the date of purchase. These awards are settled in equity. The total fair value of shares awarded during the year was £988,000 (2005: £877,000; 2004: £873,000).
Mining Companies Comparative Plan
Awards under this plan are accounted for in accordance with the requirements applying to cash-settled share-based payment transactions. If any awards are ultimately settled in shares, the liability is transferred direct to equity as the consideration for the equity instruments issued. The grant date fair value of the awards is taken to be the market value of the shares at the date of award reduced by 50 per cent for anticipated relative TSR performance. In addition, for the valuations after 2005 the market value is reduced for non-receipt of dividends between measurement date and date of vesting (excluding post-2003 awards for Executive Directors and Product Group CEOs). Forfeitures are assumed prior to vesting at three per cent p.a. of outstanding awards. In accordance with the method of accounting for cash settled awards, fair values are subsequently remeasured each year to reflect the number of awards expected to vest based on the current and anticipated TSR performance.
A-61
Back to Contents
Notes to the 2006 Financial statements
| 45 | SHARE BASED PAYMENTS CONTINUED |
A summary of the status of the Companies' performance-based share plans at 31 December 2006, and changes during the year, is presented below.
| Rio Tinto plc – mining companies comparative plan | | | | | | | | | | | | |
| | 2006 | | 2006 | | 2005 | | 2005 | | 2004 | | 2004 | |
| | Number | | Weighted | | Number | | Weighted | | Number | | Weighted | |
| | | | average | | | | average | | | | average | |
| | | | fair value | | | | fair value | | | | fair value | |
| | | | at grant | | | | at grant | | | | at grant | |
| | | | date | | | | date | | | | date | |
| | | | £ | | | | £ | | | | £ | |
|
|
|
|
|
|
|
|
|
|
|
| |
| Nonvested shares at 1 January | 2,276,511 | | 6.62 | | 1,819,497 | | 6.20 | | 1,212,085 | | 5.77 | |
| Awarded | 850,126 | | 9.02 | | 891,010 | | 7.03 | | 922,534 | | 6.45 | |
| Forfeited | (60,826 | ) | 8.18 | | (21,532 | ) | 6.78 | | (41,805 | ) | 6.28 | |
| Failed performance conditions | (233,843 | ) | 6.20 | | (343,731 | ) | 5.59 | | (102,513 | ) | 5.12 | |
| Vested | (54,594 | ) | 6.22 | | (68,733 | ) | 6.04 | | (170,804 | ) | 5.12 | |
|
|
|
|
|
|
|
|
|
|
|
| |
| Nonvested shares at 31 December | 2,777,374 | | 7.36 | | 2,276,511 | | 6.62 | | 1,819,497 | | 6.20 | |
|
|
|
|
|
|
|
|
|
|
|
| |
| Weighted-average share price at vesting (£) | | | 28.67 | | | | 17.59 | | | | 14.41 | |
| | | | | | | | | | | | | |
| | | | £'000s | | | | £'000s | | | | £'000s | |
|
|
|
|
|
|
|
|
|
|
|
| |
| Total fair value of shares issued in | | | | | | | | | | | | |
| settlement of shares vested during the year | | | 529 | | | | 134 | | | | 208 | |
| Total cash payments made in settlement | | | | | | | | | | | | |
| of shares vested during the year | | | 1,035 | | | | 258 | | | | 2,252 | |
| Total cash payments made in settlement | | | | | | | | | | | | |
| of shares vested during previous years | | | 1,374 | | | | — | | | | — | |
|
|
|
|
|
|
|
|
|
|
|
| |
| | | | | | | | | | | | | |
| Rio Tinto Limited – mining companies comparative plan | | | | | | | | | | | | |
| | 2006 | | 2006 | | 2005 | | 2005 | | 2004 | | 2004 | |
| | Number | | Weighted | | Number | | Weighted | | Number | | Weighted | |
| | | | average | | | | average | | | | average | |
| | | | fair value | | | | fair value | | | | fair value | |
| | | | at grant | | | | at grant | | | | at grant | |
| | | | date | | | | date | | | | date | |
| | | | A$ | | | | A$ | | | | A$ | |
|
|
|
|
|
|
|
|
|
|
|
| |
| Nonvested shares at 1 January | 1,510,846 | | 17.27 | | 1,129,237 | | 16.11 | | 721,094 | | 15.00 | |
| Granted | 646,637 | | 23.59 | | 588,483 | | 18.15 | | 603,686 | | 16.44 | |
| Forfeited | (83,092 | ) | 19.90 | | (12,337 | ) | 17.35 | | (25,270 | ) | 16.44 | |
| Failed performance conditions | (146,738 | ) | 16.84 | | (176,741 | ) | 13.21 | | (63,869 | ) | 12.51 | |
| Vested | (30,645 | ) | 16.84 | | (17,796 | ) | 13.41 | | (106,404 | ) | 12.51 | |
|
|
|
|
|
|
|
|
|
|
|
| |
| Nonvested shares at 31 December | 1,897,008 | | 19.35 | | 1,510,846 | | 17.27 | | 1,129,237 | | 16.11 | |
|
|
|
|
|
|
|
|
|
|
|
| |
| Weighted-average share price at vesting (A$) | | | 71.65 | | | | 43.89 | | | | 35.83 | |
| | | | | | | | | | | | | |
| | | | A$000's | | | | A$'000s | | | | A$'000s | |
|
|
|
|
|
|
|
|
|
|
|
| |
| Total fair value of shares issued in settlement | | | | | | | | | | | | |
| of shares vested during the year | | | 1,136 | | | | 342 | | | | 2,032 | |
| Total cash payments made in settlement | | | | | | | | | | | | |
| of shares vested during the year | | | 1,060 | | | | 394 | | | | 1,780 | |
|
|
|
|
|
|
|
|
|
|
|
| |
A-62
Back to Contents
Notes to the 2006 Financial statements
| 46 | POST RETIREMENT BENEFITS |
Description of plans
The Group operates a number of pension and post-retirement healthcare plans around the world. Some of these plans are defined contribution and some are defined benefit, with assets held in separate trustee administered funds. Valuations of these plans are produced and updated annually to 31 December by independent qualified actuaries.
Pension plans
The majority of the Group's pension obligations are in the UK, US, Canada and Australia.
In the UK, the main pension arrangement is the Rio Tinto Pension Fund, a funded tax-approved plan. The plan has defined benefit and defined contribution sections; the defined benefit section of the plan gives benefits related to final average pay and was closed to new entrants on 1 April 2005. New employees are admitted to the defined contribution section.
In Australia, the Rio Tinto Staff Superannuation Fund is the only significant plan. This plan principally contains defined contribution liabilities but also has defined benefit liabilities. The defined benefits are linked to final average pay and are typically paid in lump sum form.
A number of defined benefit pension plans are sponsored by the US and Canadian entities, typically with separate provision for salaried and hourly paid staff. Benefits for salaried staff include benefits linked to final average pay and benefits determined according to an accumulated cash balance. Benefits for hourly paid staff are reviewed in negotiation with unions.
The Group also operates a number of unfunded defined benefit plans, which are included in the figures below.
Post retirement healthcare plans
Certain subsidiaries of the Group, mainly in the US and Canada, provide health and life insurance benefits to retired employees and in some cases to their beneficiaries and covered dependants. Eligibility for cover is dependent upon certain age and service criteria. These arrangements are unfunded.
Plan assets
The proportions of the total fair value of assets in the pension plans for each asset class at the balance sheet date were:
| | 2006 | | 2005 | |
|
|
|
| |
| Equities | 67.2 | % | 66.4 | % |
| Bonds | 25.2 | % | 24.5 | % |
| Property | 4.3 | % | 2.8 | % |
| Other | 3.3 | % | 6.3 | % |
|
|
|
| |
| | 100.0 | % | 100.0 | % |
|
|
|
| |
The plans do not invest directly in property occupied by the Group or in the Group's own financial instruments.
Main assumptions (rates per annum)
The main assumptions for the valuations of the plans are set out below:
| | | | | | | | | | Other | |
| | | | | | | | | | (mainly | |
| | UK | | Australia (a) | | US | | Canada | | Africa) (b) | |
|
|
|
|
|
|
|
|
|
| |
| At 31 December 2006 | | | | | | | | | | |
| Rate of increase in salaries | 5.1 | % | 5.1 | % | 3.9 | % | 3.8 | % | 6.8 | % |
| Rate of increase in pensions | 3.1 | % | 3.1 | % | — | | — | | 4.8 | % |
| Discount rate | 5.2 | % | 5.0 | % | 5.9 | % | 5.0 | % | 7.4 | % |
| Inflation | 3.1 | % | 3.1 | % | 2.4 | % | 2.3 | % | 4.8 | % |
| | | | | | | | | | | |
| At 31 December 2005 | | | | | | | | | | |
| Rate of increase in salaries | 4.8 | % | 4.8 | % | 3.9 | % | 4.3 | % | 6.5 | % |
| Rate of increase in pensions | 2.8 | % | 2.8 | % | — | | — | | 4.5 | % |
| Discount rate | 4.8 | % | 4.4 | % | 5.6 | % | 4.8 | % | 7.3 | % |
| Inflation | 2.8 | % | 2.8 | % | 2.4 | % | 2.6 | % | 4.5 | % |
| | | | | | | | | | | |
| (a) | The discount rate assumed for Australia is after tax. |
| (b) | The assumptions vary by location for the 'Other' plans. Assumptions shown are for Southern Africa. |
The main financial assumptions used for the healthcare plans, which are predominantly in the US, were: discount rate: 5.8%
(2005: 5.6%), medical trend rate: 8.2% reducing to 5.2% by the year 2011 broadly on a straight line basis (2005: 9.4%, reducing to 4.9% by the year 2011), claims cost based on individual company experience.
For both the pension and healthcare arrangements the post-retirement mortality assumptions allow for future improvements in mortality. The mortality tables used for the main arrangements imply that a male aged 60 at the balance sheet date has an expected future lifetime of 24 years (2005: 24 years).
A-63
Back to Contents
Notes to the 2006 Financial statements
| 46 | POST RETIREMENT BENEFITS CONTINUED |
| | | | | | | | | | | |
| | | | | | | | | | Other | |
| | | | | | | | | | (mainly | |
| | UK | | Australia | | US | | Canada | | Africa) (a) | |
|
|
|
|
|
|
|
|
|
| |
| Long term rate of return expected at 1 January 2006 | | | | | | | | | | |
| Equities | 7.3 | % | 6.8 | % | 6.9 | % | 7.1 | % | 9.0 | % |
| Bonds | 4.3 | % | 4.6 | % | 4.9 | % | 4.3 | % | 7.3 | % |
| Property | 5.7 | % | 5.6 | % | 5.7 | % | 5.6 | % | 8.2 | % |
| Other | 4.0 | % | 3.2 | % | 3.4 | % | 3.6 | % | 5.5 | % |
| Long term rate of return expected at 1 January 2005 | | | | | | | | | | |
| Equities | 7.9 | % | 7.2 | % | 7.7 | % | 7.7 | % | 9.0 | % |
| Bonds | 4.8 | % | 4.7 | % | 5.1 | % | 5.1 | % | 8.5 | % |
| Property | 6.2 | % | 5.9 | % | 6.3 | % | 6.3 | % | 8.8 | % |
| Other | 4.5 | % | 3.2 | % | 3.7 | % | 4.0 | % | 5.0 | % |
| | | | | | | | | | | |
| (a) | The assumptions vary by location for the 'Other' plans. Assumptions shown are for Southern Africa. |
The expected rate of return on pension plan assets is determined as management's best estimate of the long term returns of the major asset classes – equities, bonds, property and other – weighted by the actual allocation of assets among the categories at the measurement date. The expected rate of return is calculated using geometric averaging. The expected rates of return shown have been reduced to allow for plan expenses including, where appropriate, taxes incurred within pension plans on investment returns.
The sources used to determine management's best estimate of long term returns are numerous and include country-specific bond yields, which may be derived from the market using local bond indices or by analysis of the local bond market, and country-specific inflation and investment market expectations derived from market data and analysts' or governments' expectations as applicable.
Total expense recognised in the income statement | | | | | | | | | | |
| | | | | | 2006 | | 2005 | | 2004 | |
| | Pension | | Other | | Total | | Total | | Total | |
| | benefits | | benefits | | US$m | | US$m | | US$m | |
|
|
|
|
|
|
|
|
|
| |
| Current employer service cost for Defined Benefits ("DB") | (93 | ) | (9 | ) | (102 | ) | (90 | ) | (80 | ) |
| Current employer service cost for Defined Contribution benefits within DB plans | (74 | ) | — | | (74 | ) | (69 | ) | (53 | ) |
| Current employer service cost for Defined Contribution plans | (21 | ) | — | | (21 | ) | (13 | ) | (11 | ) |
| Interest cost | (288 | ) | (26 | ) | (314 | ) | (308 | ) | (286 | ) |
| Expected return on assets | 326 | | — | | 326 | | 306 | | 263 | |
| Past service cost | (6 | ) | (1 | ) | (7 | ) | (1 | ) | (19 | ) |
| Gains on curtailment and settlement | 3 | | — | | 3 | | 8 | | 35 | |
|
|
|
|
|
|
|
|
|
| |
| Total expense | (153 | ) | (36 | ) | (189 | ) | (167 | ) | (151 | ) |
|
|
|
|
|
|
|
|
|
| |
The above expense is included as an employee cost within net operating costs.
Total amount recognised in the Statement of Recognised Income and Expense
| | 2006 | | 2005 | | 2004 | |
| | US$m | | US$m | | US$m | |
|
|
|
|
|
| |
| Actuarial gain/(loss) | 373 | | 178 | | (203 | ) |
|
|
|
|
|
| |
| Cumulative amount recognised in the Statement of Recognised Income and Expense at 31 December | 348 | | (25 | ) | (203 | ) |
|
|
|
|
|
| |
Surpluses/(deficits) in the plans
The following amounts were measured in accordance with IAS 19:
| | | | | | 2006 | | 2005 | | 2004 | |
| | Pension | | Other | | Total | | Total | | Total | |
| | benefits | | benefits | | US$m | | US$m | | US$m | |
|
|
|
|
|
|
|
|
|
| |
| Total fair value of plan assets | 6,031 | | — | | 6,031 | | 5,115 | | 4,777 | |
| Present value of obligations – funded | (5,847 | ) | — | | (5,847 | ) | (5,315 | ) | (5,118 | ) |
| Present value of obligations – unfunded | (136 | ) | (461 | ) | (597 | ) | (596 | ) | (649 | ) |
|
|
|
|
|
|
|
|
|
| |
| Present value of obligations – Total | (5,983 | ) | (461 | ) | (6,444 | ) | (5,911 | ) | (5,767 | ) |
|
|
|
|
|
|
|
|
|
| |
| Unrecognised past service cost | — | | 3 | | 3 | | — | | — | |
|
|
|
|
|
|
|
|
|
| |
| Aggregate surplus/(deficit) to be shown in the balance sheet | 48 | | (458 | ) | (410 | ) | (796 | ) | (990 | ) |
|
|
|
|
|
|
|
|
|
| |
| Comprising: | | | | | | | | | | |
| – Deficits | (312 | ) | (458 | ) | (770 | ) | (996 | ) | (1,069 | ) |
|
|
|
|
|
|
|
|
|
| |
| – Surpluses | 360 | | — | | 360 | | 200 | | 79 | |
|
|
|
|
|
|
|
|
|
| |
| Net surpluses/(deficits) on pension plans | 48 | | | | 48 | | (324 | ) | (450 | ) |
| Unfunded post retirement healthcare obligation | | | (458 | ) | (458 | ) | (472 | ) | (540 | ) |
|
|
|
|
|
|
|
|
|
| |
The surplus amounts shown above are included in the balance sheet as Trade and Other Receivables. Deficits are included within Provisions.
A-64
Back to Contents
Notes to the 2006 Financial statements
| 46 | POST RETIREMENT BENEFITS CONTINUED |
Contributions to plans
Contributions to pension plans totalled US$172 million (2005: US$192 million; 2004: US$162 million). These contributions include US$12 million (2005: US$8 million; 2004: US$7 million) for plans providing purely defined contribution benefits. These contributions are charged against profits, and are included in the figures for "current employer service cost" shown above. In addition, contributions of US$14 million (2005: US$12 million; 2004: US$11 million) were made to 401k plans in the US.
In addition, contributions of US$9 million (2005: US$5 million; 2004: US$4 million) were made to an industry-wide arrangement that is principally defined contribution in nature.
Contributions for other benefits totalled US$19 million (2005: US$26 million; 2004: US$26 million).
Contributions to pension plans for 2007 are estimated to be around US$8 million higher than for 2006. Healthcare plans are unfunded and contributions for future years will be equal to benefit payments and therefore cannot be predetermined.
Movements in the present value of the defined benefit obligation and in the fair value of assets
The amounts shown below include, where appropriate, 100 per cent of the costs, contributions, gains and losses in respect of employees who participate in the plans and who are employed in operations that are proportionally consolidated or equity accounted. Consequently, the costs, contributions, gains and losses do not correspond directly to the amounts disclosed above in respect of the Group. Pure defined contribution plans and industry-wide plans are excluded from the movements below.
| | | | | | 2006 | | 2005 | |
| | Pension | | Other | | Total | | Total | |
| | benefits | | benefits | | US$m | | US$m | |
|
|
|
|
|
|
|
| |
| Change in present value of obligation: | | | | | | | | |
| Present value of obligation at start of the year | (5,439 | ) | (472 | ) | (5,911 | ) | (5,767 | ) |
| Current employer service cost | (197 | ) | (9 | ) | (206 | ) | (174 | ) |
| Interest cost | (288 | ) | (26 | ) | (314 | ) | (308 | ) |
| Contributions by plan participants | (113 | ) | — | | (113 | ) | (35 | ) |
| Experience gain/(loss) | (98 | ) | 9 | | (89 | ) | 139 | |
| Changes in actuarial assumptions gain/(loss) | 105 | | 19 | | 124 | | (180 | ) |
| Benefits paid | 342 | | 19 | | 361 | | 348 | |
| Inclusion/removal of arrangements | 42 | | — | | 42 | | — | |
| Past service cost | (6 | ) | (4 | ) | (10 | ) | (1 | ) |
| Settlement gains | — | | — | | — | | 8 | |
| Curtailment gains | 3 | | — | | 3 | | — | |
| Currency exchange rate (loss)/gain | (334 | ) | 3 | | (331 | ) | 59 | |
|
|
|
|
|
|
|
| |
| Present value of obligation at end of the year | (5,983 | ) | (461 | ) | (6,444 | ) | (5,911 | ) |
|
|
|
|
|
|
|
| |
Gains and losses on obligations
| | 2006 | | 2005 | | 2004 | |
|
|
|
|
|
| |
| Experience gains and (losses): (i.e. variances between the estimate of obligations and the subsequent outcome) (Loss)/gain (US$m) | (89 | ) | 139 | | (148 | ) |
| As a percentage of the present value of the obligations | -1 | % | 2 | % | -3 | % |
|
|
|
|
|
| |
| Change in assumptions gain/(loss) (US$m) | 124 | | (180 | ) | (429 | ) |
|
|
|
|
|
| |
| | | | | | 2006 | | 2005 | |
| | Pension | | Other | | Total | | Total | |
| | benefits | | benefits | | US$m | | US$m | |
|
|
|
|
|
|
|
| |
| Change in plan assets: | | | | | | | | |
| Fair value of plan assets at the start of the year | 5,115 | | — | | 5,115 | | 4,777 | |
| Expected return on plan assets | 326 | | — | | 326 | | 306 | |
| Actuarial gain on plan assets | 338 | | — | | 338 | | 223 | |
| Contributions by plan participants | 113 | | — | | 113 | | 35 | |
| Contributions by employer | 170 | | 19 | | 189 | | 207 | |
| Benefits paid | (342 | ) | (19 | ) | (361 | ) | (348 | ) |
| Inclusion/removal of arrangements | (41 | ) | — | | (41 | ) | — | |
| Assets refunded to the employer | — | | — | | — | | (12 | ) |
| Currency exchange rate gain/(loss) | 352 | | — | | 352 | | (73 | ) |
|
|
|
|
|
|
|
| |
| Fair value of plan assets at the end of the year | 6,031 | | — | | 6,031 | | 5,115 | |
|
|
|
|
|
|
|
| |
| Actual return on plan assets | | | | | 664 | | 529 | |
| | 2006 | | 2005 | | 2004 | |
|
|
|
|
|
| |
| Difference between the expected and actual return on plan assets: | | | | | | |
| Gain (US$m) | 338 | | 223 | | 387 | |
| As a percentage of plan assets | 6% | | 4% | | 8% | |
|
|
|
|
|
| |
A-65
Back to Contents
Notes to the 2006 Financial statements
| 46 | POST RETIREMENT BENEFITS CONTINUED |
Post-retirement healthcare – sensitivity to changes in assumptions
An increase of 1 per cent in the assumed medical cost trend rates would increase the aggregate of the current service cost and interest cost components of the post-retirement healthcare expense by US$6m (2005 and 2004: US$6m), and increase the benefit obligation for these plans by US$73m (2005: US$67m; 2004: US$66m). A decrease of 1 per cent in the assumed medical cost trend rates would decrease the aggregate of the current service cost and interest cost components of the post-retirement healthcare expense by US$5m (2005 and 2004: US$5m), and decrease the benefit obligation for these plans by US$62m (2005: US$56m; 2004: US$54m).
A-66
Back to Contents
Notes to the 2006 Financial statements
| 47 | RIO TINTO FINANCIAL INFORMATION BY BUSINESS UNIT |
| | Rio Tinto | | Gross sales revenue | | EBITDA | | Net earnings | |
| | interest | | (a) | | (b) | | (c) | |
| | | | 2006 | | 2005 | | 2004 | | 2006 | | 2005 | | 2004 | | 2006 | | 2005 | | 2004 | |
| | % | | US$m | | US$m | | US$m | | US$m | | US$m | | US$m | | US$m | | US$m | | US$m | |
|
|
|
|
|
|
| |
| Iron Ore | | | | | | | | | | | | | | | | | | | | |
| Hamersley (inc. HIsmelt®) | 100.0 | | 4,416 | | 3,387 | | 1,858 | | 2,594 | | 1,924 | | 772 | | 1,660 | | 1,219 | | 430 | |
| Robe River | 53.0 | | 1,379 | | 1,113 | | 614 | | 902 | | 726 | | 318 | | 461 | | 362 | | 130 | |
| Iron Ore Company of Canada | 58.7 | | 1,051 | | 954 | | 428 | | 441 | | 451 | | 55 | | 145 | | 148 | | 4 | |
| Rio Tinto Brasil | 100.0 | | 92 | | 43 | | 109 | | 27 | | 1 | | 31 | | 13 | | (7 | ) | 1 | |
|
|
|
|
|
|
|
|
|
|
|
|
|
|
|
|
|
|
|
| |
| | | | 6,938 | | 5,497 | | 3,009 | | 3,964 | | 3,102 | | 1,176 | | 2,279 | | 1,722 | | 565 | |
|
|
|
|
|
|
|
|
|
|
|
|
|
|
|
|
|
|
|
| |
| Energy | | | | | | | | | | | | | | | | | | | | |
| Rio Tinto Energy America | 100.0 | | 1,428 | | 1,197 | | 1,125 | | 302 | | 257 | | 298 | | 177 | | 135 | | 180 | |
| Rio Tinto Coal Australia | (d | ) | 2,344 | | 2,302 | | 1,585 | | 920 | | 1,067 | | 536 | | 490 | | 572 | | 236 | |
| Rössing | 68.6 | | 229 | | 163 | | 124 | | 71 | | 24 | | 8 | | 27 | | 2 | | (4 | ) |
| Energy Resources of Australia | 68.4 | | 239 | | 205 | | 174 | | 79 | | 94 | | 70 | | 17 | | 24 | | 19 | |
|
|
|
|
|
|
|
|
|
|
|
|
|
|
|
|
|
|
|
| |
| | | | 4,240 | | 3,867 | | 3,008 | | 1,372 | | 1,442 | | 912 | | 711 | | 733 | | 431 | |
|
|
|
|
|
|
|
|
|
|
|
|
|
|
|
|
|
|
|
| |
| Industrial Minerals | | | 2,623 | | 2,487 | | 2,126 | | 624 | | 563 | | 554 | | 243 | | 187 | | 243 | |
| Aluminium | (e | ) | 3,493 | | 2,744 | | 2,356 | | 1,365 | | 855 | | 688 | | 746 | | 392 | | 331 | |
|
|
|
|
|
|
|
|
|
|
|
|
|
|
|
|
|
|
|
| |
| Copper | | | | | | | | | | | | | | | | | | | | |
| Kennecott Utah Copper | 100.0 | | 2,829 | | 2,141 | | 1,091 | | 2,103 | | 1,436 | | 498 | | 1,804 | | 1,037 | | 311 | |
| Escondida | 30.0 | | 2,575 | | 1,239 | | 1,003 | | 2,105 | | 1,014 | | 699 | | 1,250 | | 602 | | 406 | |
| Freeport | (h | ) | — | | — | | 43 | | — | | — | | 7 | | — | | — | | (4 | ) |
| Grasberg joint venture | (f | ) | 373 | | 657 | | 159 | | 258 | | 436 | | 98 | | 122 | | 232 | | 32 | |
| Palabora | 57.7 | | 588 | | 371 | | 305 | | 203 | | 77 | | (20 | ) | 52 | | 19 | | (21 | ) |
| Kennecott Minerals | 100.0 | | 277 | | 256 | | 263 | | 139 | | 119 | | 130 | | 105 | | 73 | | 82 | |
| Northparkes | 80.0 | | 437 | | 175 | | 85 | | 346 | | 109 | | 43 | | 229 | | 57 | | 25 | |
| Other copper | | | — | | — | | 84 | | — | | — | | 48 | | — | | — | | 29 | |
|
|
|
|
|
|
|
|
|
|
|
|
|
|
|
|
|
|
|
| |
| | | | 7,079 | | 4,839 | | 3,033 | | 5,154 | | 3,191 | | 1,503 | | 3,562 | | 2,020 | | 860 | |
|
|
|
|
|
|
|
|
|
|
|
|
|
|
|
|
|
|
|
| |
| Diamonds | | | | | | | | | | | | | | | | | | | | |
| Argyle | 100.0 | | 345 | | 572 | | 322 | | 167 | | 252 | | 102 | | 64 | | 117 | | 40 | |
| Diavik | 60.0 | | 460 | | 460 | | 420 | | 297 | | 334 | | 316 | | 131 | | 143 | | 147 | |
| Murowa | 77.8 | | 33 | | 44 | | 2 | | 19 | | 31 | | 1 | | 10 | | 21 | | 1 | |
|
|
|
|
|
|
|
|
|
|
|
|
|
|
|
|
|
|
|
| |
| | | | 838 | | 1,076 | | 744 | | 483 | | 617 | | 419 | | 205 | | 281 | | 188 | |
|
|
|
|
|
|
|
|
|
|
|
|
|
|
|
|
|
|
|
| |
| Other Operations | | | 229 | | 232 | | 254 | | 39 | | 81 | | 122 | | 33 | | 40 | | 56 | |
|
|
|
|
|
|
|
|
|
|
|
|
|
|
|
|
|
|
|
| |
| | | | 25,440 | | 20,742 | | 14,530 | | 13,001 | | 9,851 | | 5,374 | | 7,779 | | 5,375 | | 2,674 | |
|
|
|
|
|
|
|
|
|
|
|
|
|
|
|
|
|
|
|
| |
| Other items | | | | | | | | | (289 | ) | (329 | ) | (291 | ) | (261 | ) | (202 | ) | (205 | ) |
| Exploration and evaluation | | | | | | | | | (188 | ) | (190 | ) | (142 | ) | (163 | ) | (174 | ) | (128 | ) |
| Net interest | | | | | | | | | | | | | | | (17 | ) | (44 | ) | (69 | ) |
|
|
|
|
|
|
|
|
|
|
|
|
|
|
|
|
|
|
|
| |
| Underlying earnings | | | | | | | | | 12,524 | | 9,332 | | 4,941 | | 7,338 | | 4,955 | | 2,272 | |
| Items excluded from Underlying earnings | | | | | | | | | 42 | | 407 | | 1,170 | | 100 | | 260 | | 1,025 | |
| Less: share of equity accounted units sales revenue | | | (2,975 | ) | (1,709 | ) | (1,576 | ) | | | | | | | | | | | | |
|
|
|
|
|
|
|
|
|
|
|
|
|
|
|
|
|
|
|
| |
| Total | | | 22,465 | | 19,033 | | 12,954 | | 12,566 | | 9,739 | | 6,111 | | 7,438 | | 5,215 | | 3,297 | |
|
|
|
|
|
|
|
|
|
|
|
|
|
|
|
|
|
|
|
| |
| Depreciation and amortisation in subsidiaries (i) | | | | | | | | (1,509 | ) | (1,334 | ) | (1,171 | ) | | | | | | |
| Impairment reversals less charges | | | | | | | | | 396 | | 3 | | (548 | ) | | | | | | |
| Depreciation and amortisation in equity accounted units | | | | | | | | (275 | ) | (281 | ) | (228 | ) | | | | | | |
| Taxation and finance items in equity accounted units | | | | | | | | (826 | ) | (429 | ) | (314 | ) | | | | | | |
|
|
|
|
|
|
|
|
|
|
|
|
|
|
|
|
|
|
|
| |
| Profit on ordinary activities before finance costs and tax | | | | | | | | 10,352 | | 7,698 | | 3,850 | | | | | | | |
|
|
|
|
|
|
|
|
|
|
|
|
|
|
|
|
|
|
| |
| (a) | Gross sales revenue includes 100 per cent of subsidiaries' sales revenue and the Group's share of the sales revenue of equity accounted units. |
| (b) | EBITDA of subsidiaries and the Group's share of equity accounted units represents profit before: tax, net finance items, depreciation and amortisation. |
| (c) | Net earnings represent profit after tax for the year attributable to the Rio Tinto Group. Earnings of subsidiaries are stated before finance items but after the amortisation of the discount related to provisions. Earnings attributable to equity accounted units include interest charges and amortisation of discount. Earnings attributed to business units exclude amounts that are excluded in arriving at Underlying earnings. |
| (d) | Includes Rio Tinto's 75.7 per cent interest in Coal & Allied, which is managed by Rio Tinto Coal Australia, a 100 per cent subsidiary of Rio Tinto. |
| (e) | Includes Rio Tinto's interests in Anglesey Aluminium (51 per cent) and Rio Tinto Aluminium (100 per cent). |
| (f) | Under the terms of a joint venture agreement, Rio Tinto is entitled to 40 per cent of additional material mined as a consequence of expansions and developments of the Grasberg facilities since 1998. |
| (g) | Business units have been classified according to the Group’s management structure. Generally, this structure has regard to the primary product of each business unit but exceptions exist. For example, the Copper group includes certain gold operations. |
| (h) | On 30 March 2004, Rio Tinto sold its 13.1 per cent shareholding in Freeport-McMoRan Copper & Gold Inc. The sale of the shares does not affect the terms of the Grasberg joint venture. |
A-67
Back to Contents
Notes to the 2006 Financial statements
| 47 | RIO TINTO FINANCIAL INFORMATION BY BUSINESS UNIT CONTINUED |
| | | | | | | | | |
| | Capital expenditure (i) | | Depreciation &amortisation (j) | | Operating assets(k) | | Employees | |
| |
| |
| |
| |
| |
| | 2006 | | 2005 | | 2004 | | 2006 | | 2005 | | 2004 | | 2006 | | 2005 | | 2004 | | 2006 | | 2005 | | 2004 | |
| | US$m | | US$m | | US$m | | US$m | | US$m | | US$m | | US$m | | US$m | | US$m | | | | | | | |
|
|
|
|
|
|
|
| |
| Iron Ore | | | | | | | | | | | | | | | | | | | | | | | | |
| Hamersley (inc. HIsmelt®) | 1,696 | | 935 | | 757 | | 231 | | 174 | | 158 | | 4,321 | | 2,555 | | 2,234 | | 4,161 | | 2,926 | | 2,581 | |
| Robe River | 104 | | 160 | | 109 | | 90 | | 89 | | 83 | | 1,593 | | 1,487 | | 1,640 | | 678 | | 553 | | 527 | |
| Iron Ore Company of Canada | 151 | | 98 | | 51 | | 58 | | 47 | | 41 | | 651 | | 451 | | 521 | | 1,886 | | 1,752 | | 1,528 | |
| Rio Tinto Brasil | 18 | | 36 | | 18 | | 8 | | 5 | | 7 | | 97 | | 81 | | 50 | | 522 | | 449 | | 975 | |
|
|
|
|
|
|
|
|
|
|
|
|
|
|
|
|
|
|
|
|
|
|
|
| |
| | 1,969 | | 1,229 | | 935 | | 387 | | 315 | | 289 | | 6,662 | | 4,574 | | 4,445 | | 7,247 | | 5,680 | | 5,611 | |
|
|
|
|
|
|
|
|
|
|
|
|
|
|
|
|
|
|
|
|
|
|
|
| |
| Energy | | | | | | | | | | | | | | | | | | | | | | | | |
| Rio Tinto Energy America | 262 | | 204 | | 162 | | 116 | | 85 | | 86 | | 1,097 | | 908 | | 810 | | 2,297 | | 1,958 | | 1,771 | |
| Rio Tinto Coal Australia | 251 | | 171 | | 73 | | 170 | | 164 | | 167 | | 1,397 | | 1,147 | | 1,282 | | 2,462 | | 2,228 | | 1,999 | |
| Rössing | 38 | | 3 | | 2 | | 6 | | 16 | | 15 | | 68 | | 66 | | 40 | | 936 | | 831 | | 814 | |
| Energy Resources of Australia | 31 | | 34 | | 7 | | 32 | | 40 | | 35 | | 201 | | 180 | | 179 | | 366 | | 330 | | 273 | |
|
|
|
|
|
|
|
|
|
|
|
|
|
|
|
|
|
|
|
|
|
|
|
| |
| | 582 | | 412 | | 244 | | 324 | | 305 | | 303 | | 2,763 | | 2,301 | | 2,311 | | 6,061 | | 5,347 | | 4,857 | |
|
|
|
|
|
|
|
|
|
|
|
|
|
|
|
|
|
|
|
|
|
|
|
| |
| Industrial Minerals | 360 | | 235 | | 248 | | 189 | | 172 | | 173 | | 2,682 | | 2,311 | | 2,209 | | 6,744 | | 6,698 | | 6,575 | |
|
|
|
|
|
|
|
|
|
|
|
|
|
|
|
|
|
|
|
|
|
|
|
| |
| Aluminium | 236 | | 242 | | 505 | | 266 | | 274 | | 190 | | 3,607 | | 3,361 | | 3,521 | | 4,347 | | 4,296 | | 4,077 | |
|
|
|
|
|
|
|
|
|
|
|
|
|
|
|
|
|
|
|
|
|
|
|
| |
| Copper | | | | | | | | | | | | | | | | | | | | | | | | |
| Kennecott Utah Copper | 295 | | 164 | | 69 | | 151 | | 136 | | 90 | | 1,789 | | 1,144 | | 1,075 | | 1,744 | | 1,571 | | 1,418 | |
| Escondida | 155 | | 229 | | 113 | | 96 | | 69 | | 54 | | 792 | | 812 | | 594 | | 1,072 | | 840 | | 851 | |
| Freeport | — | | — | | — | | — | | — | | 3 | | — | | — | | — | | — | | — | | — | |
| Grasberg joint venture | 45 | | 45 | | 30 | | 43 | | 35 | | 43 | | 412 | | 321 | | 397 | | 1,781 | | 1,729 | | 1,783 | |
| Palabora | 18 | | 17 | | 30 | | 40 | | 32 | | 41 | | 104 | | 226 | | 360 | | 1,811 | | 1,796 | | 1,734 | |
| Kennecott Minerals | 111 | | 34 | | 36 | | 26 | | 32 | | 27 | | 198 | | 129 | | 135 | | 409 | | 388 | | 372 | |
| Northparkes | 16 | | 12 | | 34 | | 48 | | 33 | | 10 | | 89 | | 152 | | 177 | | 182 | | 174 | | 193 | |
| Other copper | — | | — | | 14 | | — | | — | | 13 | | — | | — | | — | | — | | — | | 274 | |
|
|
|
|
|
|
|
|
|
|
|
|
|
|
|
|
|
|
|
|
|
|
|
| |
| | 640 | | 501 | | 326 | | 404 | | 337 | | 281 | | 3,384 | | 2,784 | | 2,738 | | 6,999 | | 6,498 | | 6,625 | |
|
|
|
|
|
|
|
|
|
|
|
|
|
|
|
|
|
|
|
| |
| |
| |
| Diamonds | | | | | | | | | | | | | | | | | | | | | | | | |
| Argyle | 120 | | 77 | | 89 | | 68 | | 78 | | 44 | | 405 | | 523 | | 632 | | 772 | | 817 | | 809 | |
| Diavik | 105 | | 121 | | 49 | | 109 | | 79 | | 64 | | 639 | | 548 | | 574 | | 430 | | 362 | | 377 | |
| Murowa | 4 | | 5 | | 14 | | 4 | | 5 | | — | | 12 | | 14 | | 16 | | 152 | | 81 | | 76 | |
|
|
|
|
|
|
|
|
|
|
|
|
|
|
|
|
|
|
|
|
|
|
|
| |
| | 229 | | 203 | | 152 | | 181 | | 162 | | 108 | | 1,056 | | 1,085 | | 1,222 | | 1,354 | | 1,260 | | 1,262 | |
|
|
|
|
|
|
|
|
|
|
|
|
|
|
|
|
|
|
|
|
|
|
|
| |
| Other Operations | 48 | | 31 | | 19 | | 3 | | 34 | | 47 | | 551 | | 167 | | 179 | | 365 | | 223 | | 1,587 | |
|
|
|
|
|
|
|
|
|
|
|
|
|
|
|
|
|
|
|
|
|
|
|
| |
| | 4,064 | | 2,853 | | 2,429 | | 1,754 | | 1,599 | | 1,391 | | 20,705 | | 16,583 | | 16,625 | | 33,117 | | 30,002 | | 30,594 | |
|
|
|
|
|
|
|
|
|
|
|
|
|
|
|
|
|
|
|
|
|
|
|
| |
| Other items | 174 | | 45 | | (1 | ) | 30 | | 16 | | 556 | | (36 | ) | (322 | ) | (939 | ) | 2,128 | | 1,852 | | 1,832 | |
| Less: equity accounted units | (322 | ) | (382 | ) | (213 | ) | (275 | ) | (281 | ) | (228 | ) | | | | | | | | | | | | |
|
|
|
|
|
|
|
|
|
|
|
|
|
|
|
|
|
|
|
|
|
|
|
| |
| Total | 3,916 | | 2,516 | | 2,215 | | 1,509 | | 1,334 | | 1,719 | | 20,669 | | 16,261 | | 15,686 | | 35,245 | | 31,854 | | 32,426 | |
|
|
|
|
|
|
|
|
|
|
|
|
|
|
|
|
|
|
|
|
|
|
|
| |
| Less: net debt | | | | | | | | | | | | | (2,437 | ) | (1,313 | ) | (3,809 | ) | | | | | | |
|
|
|
|
|
|
|
|
|
|
|
|
|
|
|
|
|
|
|
|
|
|
|
| |
| Rio Tinto shareholders' equity | | | | | | | | | | | | | 18,232 | | 14,948 | | 11,877 | | | | | | | |
|
|
|
|
|
|
|
|
|
|
|
|
|
|
|
|
|
|
|
|
|
|
|
| |
| (i) | Capital expenditure comprises the net cash outflow on purchases less disposals of property, plant and equipment and intangible assets other than exploration. The details provided include 100 per cent of subsidiaries' capital expenditure and Rio Tinto's share of the capital expenditure of equity accounted units. Amounts relating to equity accounted units not specifically funded by Rio Tinto are deducted before arriving at total capital expenditure for the Group. |
| (j) | Depreciation figures include 100 per cent of subsidiaries' depreciation and amortisation and include Rio Tinto's share of the depreciation and amortisation of equity accounted units. Amounts relating to equity accounted units are deducted before arriving at the total depreciation and amortisation charge. |
| | Depreciation and amortisation includes US$40 million relating to deferred stripping costs which are included in 'Other items' in the Group cash flow statement. |
| (k) | Operating assets of subsidiaries comprise net assets before deducting net debt, less outside shareholders' interests which are calculated by reference to the net assets of the relevant companies (i.e. net of such companies' debt). For equity accounted units, Rio Tinto's net investment is shown. |
A-68
Back to Contents
RIO TINTO GROUP
NOTES TO FINANCIAL STATEMENTS – (continued)
| 48 | RECONCILIATION TO US ACCOUNTING PRINCIPLES |
| | | 2006 | | 2005 | | 2004 | |
| | | US$m | | US$m | | US$m | |
|
|
|
|
|
|
| |
| Profit for the period under IFRS | | 7,867 | | 5,498 | | 3,244 | |
| Less attributable to outside equity shareholders | | (429 | ) | (283 | ) | 53 | |
|
|
|
|
|
|
| |
| Profit excluding amounts attributable to outside shareholders under IFRS | | 7,438 | | 5,215 | | 3,297 | |
| Increase / (decrease) before tax in respect of: | | | | | | | |
| Effect of purchase accounting for DLC combination - depreciation | (c) | (93 | ) | (140 | ) | (125 | ) |
| Amortisation of intangibles | | (30 | ) | (40 | ) | (44 | ) |
| Additional amounts attributed to assets on acquisition under US GAAP | | (41 | ) | (37 | ) | (30 | ) |
| Mark to market of derivative contracts | | (8 | ) | (4 | ) | (8 | ) |
| Adjustments to asset carrying values | | (769 | ) | — | | (5 | ) |
| Pensions / post retirement benefits | | (64 | ) | (68 | ) | (25 | ) |
| Evaluation costs capitalised under IFRS | | (91 | ) | (69 | ) | (62 | ) |
| Depreciation based on proven & probable ore reserves | | (119 | ) | (163 | ) | (68 | ) |
| Effect of price assumptions specified for determination of ore reserves on depreciation & amortisation | | 12 | | (5 | ) | (90 | ) |
| Effect of changes in functional currency | | (16 | ) | (32 | ) | — | |
| Stripping costs deferred under IFRS | | (44 | ) | — | | — | |
| Other | | (197 | ) | 33 | | (110 | ) |
| Taxation: | | | | | | | |
| Tax effect of the above adjustments | (c) | 511 | | 130 | | 124 | |
| Other tax adjustments | | 6 | | 45 | | (119 | ) |
| Outside shareholders' interests in the above adjustments | (c) | 180 | | 28 | | 19 | |
| Share of US GAAP adjustments of equity accounted units | (a) | (26 | ) | (19 | ) | (16 | ) |
|
|
|
|
|
|
| |
| Net income under US GAAP (revised for 2005 and 2004) | (c) | 6,649 | | 4,874 | | 2,738 | |
|
|
|
|
|
|
| |
| | | | | | | | |
| Basic earnings per ordinary share under US GAAP (revised for 2005 and 2004) | (c) | 498.6 | c | 357.3 | c | 198.5 | c |
| Diluted earnings per ordinary share under US GAAP (revised for 2005 and 2004) | (c) | 496.6 | c | 356.2 | c | 198.2 | c |
| | | | | | | | | |
| (a) | 'Share of US GAAP adjustments of equity accounted units' comprises: | | | | | | | |
| | Amortisation of intangibles | | (2 | ) | (4 | ) | (6 | ) |
| | Additional amounts attributed to assets on acquisition under US GAAP | | (10 | ) | (5 | ) | (5 | ) |
| | Effect of price assumptions specified for determination of ore reserves on depreciation & amortisation | | (1 | ) | (3 | ) | (4 | ) |
| | Stripping costs deferred under IFRS | | (1 | ) | — | | — | |
| | Other | | (12 | ) | (7 | ) | (1 | ) |
| |
|
|
|
|
|
|
| |
| | Share of US GAAP adjustments of equity accounted units | | (26 | ) | (19 | ) | (16 | ) |
| |
|
|
|
|
|
|
| |
| (b) | There are no differences between International Financial Reporting Standards (IFRS) and IFRS as adopted by the European Union (EU IFRS) that would impact on the financial statements of the Rio Tinto Group for the years ended 31 December 2004, 2005 and 2006. |
| (c) | Net income under US GAAP and basic and diluted earnings per ordinary share under US GAAP have been revised to reflect the application of purchase accounting to the formation of the DLC structure in 1995. See pages A-71 and A-72 for further details. |
A-69
Back to Contents
RIO TINTO GROUP
NOTES TO FINANCIAL STATEMENTS – (continued)
| 48 | RECONCILIATION TO US ACCOUNTING PRINCIPLES CONTINUED |
| | |
| | | | 2006 | | 2005 | |
| | | | US$m | | US$m | |
|
|
|
|
|
| |
| Total equity under IFRS | | | 19,385 | | 15,739 | |
| Less attributable to outside equity shareholders | | | (1,153 | ) | (791 | ) |
|
|
|
|
|
| |
| Equity excluding amounts attributable to outside shareholders under IFRS | | | 18,232 | | 14,948 | |
| Increase / (decrease) before tax in respect of: | | | | | | |
| Effect of purchase accounting for DLC combination | (b | ) | 2,173 | | 2,097 | |
| Goodwill | | | 1,420 | | 1,394 | |
| Intangibles | | | 132 | | 156 | |
| Additional amounts attributed to assets on acquisition under US GAAP | | | 937 | | 917 | |
| Mark to market of derivative contracts | | | (29 | ) | (17 | ) |
| Adjustments to asset carrying values | | | (387 | ) | 387 | |
| Pensions / post retirement benefits | | | (107 | ) | 376 | |
| Evaluation costs capitalised under IFRS | | | (385 | ) | (226 | ) |
| Depreciation based on proven and probable ore reserves | | | (503 | ) | (329 | ) |
| Effect of price assumptions specified for determination of ore reserves on depreciation & amortisation | | | (148 | ) | (173 | ) |
| Effect of changes in functional currency | | | 139 | | 157 | |
| Provision for closedown and restoration costs | | | (83 | ) | 40 | |
| Stripping costs deferred under IFRS | | | (701 | ) | — | |
| Provision, under IFRS, for shares to be repurchased | | | 288 | | — | |
| Other | | | (127 | ) | (109 | ) |
| Taxation: | | | | | | |
| Tax effect of the above adjustments | (b | ) | (102 | ) | (918 | ) |
| Other tax adjustments | | | 64 | | 124 | |
| Outside shareholders' interests in the above adjustments | (b | ) | (83 | ) | (286 | ) |
| Share of US GAAP adjustments of equity accounted units | (a | ) | 61 | | 139 | |
|
|
|
|
|
| |
| Shareholders' funds under US GAAP (revised for 2005) | (b | ) | 20,791 | | 18,677 | |
|
|
|
|
|
| |
| (a) | 'Share of US GAAP adjustments of equity accounted units' comprises: | | | | | | |
| | Goodwill | | | 3 | | 5 | |
| | Intangibles | | | 18 | | 32 | |
| | Additional amounts attributed to assets on acquisition under US GAAP | | | 132 | | 110 | |
| | Mark to market of derivative contracts | | | 6 | | 5 | |
| | Evaluation costs capitalised under IFRS | | | — | | (10 | ) |
| | Effect of price assumptions specified for determination of ore reserves on depreciation & amortisation | | | (12 | ) | (11 | ) |
| �� | Provision for closedown and restoration costs | | | — | | 8 | |
| | Stripping costs deferred under IFRS | | | (95 | ) | — | |
| | Other | | | 9 | | — | |
|
|
|
|
|
|
| |
| | Share of US GAAP adjustments of equity accounted units | | | 61 | | 139 | |
|
|
|
|
|
|
| |
| (b) | Shareholders' funds under US GAAP have been revised to reflect the application of purchase accounting to the formation of the DLC structure in 1995. As of 31 December 2006, the adjustment, before the effects of taxation and outside shareholders' interests, would be allocated US$2,005 million to property, plant and equipment and US$168 million to goodwill. See pages A-71 and A-72 for further details. |
A-70
Back to Contents
RIO TINTO GROUP
NOTES TO FINANCIAL STATEMENTS – (continued)
| 48 | RECONCILIATION TO US ACCOUNTING PRINCIPLES CONTINUED |
| | |
| A. | Differences Between IFRS and US GAAP |
| |
| The Group’s financial statements have been prepared in accordance with the Standards and Interpretations included within International Financial Reporting Standards ('IFRS') as adopted by the European Union, which differ in certain respects from those in the United States ('US GAAP'). These differences relate principally to the following items, and the effect of each of the adjustments to net earnings and Rio Tinto shareholders' funds that would be required under US GAAP is set out on the preceding pages. |
Effect of purchase accounting for DLC combination
As described in ‘Outline of Dual Listed Companies structure and basis of financial statements’ on page A-6, the Group has revised the presentation of its financial statements included in Form 20-F. The formation of the DLC is now accounted for as a business combination. Separate financial statements for Rio Tinto plc and Rio Tinto Limited are no longer presented. Instead, the financial statements consist of the Rio Tinto Group representing one combined economic entity.
Whereas merger accounting is applied in the Group’s IFRS financial statements, for the purposes of US GAAP reporting, the Group now accounts for the formation of the DLC using the purchase method. In so doing it follows the guidance that was applicable at the time of the formation of the DLC, which was APB Opinion No. 16 'Business Combinations'. Accordingly, the combined financial information under US GAAP has been restated for all periods presented.
The purchase price of the additional 51% of Rio Tinto Limited accounted for as acquired by Rio Tinto plc has been determined by reference to the average market price of the shares in the period from two days before until two days after October 9, 1995. This was the date that Rio Tinto plc and Rio Tinto Limited agreed to the terms and announced the formation of the DLC. The purchase price has been allocated to the assets and liabilities of Rio Tinto Limited based on their estimated fair values at that time, as follows (in US$ millions):
| | | | Purchase | | | |
| | Book | | accounting | | Fair | |
| | value | | adjustment | | value | |
|
|
|
| |
| Current assets | 934 | | — | | 934 | |
| Property, plant and equipment | 1,818 | | 4,057 | | 5,875 | |
| Other non current assets | 423 | | 247 | | 670 | |
| Goodwill | 159 | | 184 | | 343 | |
|
|
|
|
|
| |
| Total assets acquired | 3,334 | | 4,488 | | 7,822 | |
| Current liabilities | (381 | ) | — | | (381 | ) |
| Medium and long term borrowings | (465 | ) | — | | (465 | ) |
| Other long term liabilities | (148 | ) | — | | (148 | ) |
| Deferred tax liability | (271 | ) | (1,458 | ) | (1,729 | ) |
| Attributable to outside equity shareholders | (249 | ) | (441 | ) | (690 | ) |
|
|
|
|
|
| |
| Total liabilities assumed | (1,514 | ) | (1,899 | ) | (3,413 | ) |
|
|
|
|
|
| |
| Net assets acquired | 1,820 | | 2,589 | | 4,409 | |
|
|
|
|
|
| |
The increase in equity attributable to Rio Tinto shareholders represents the difference between the historical book value and fair value of 51% of Rio Tinto Limited. In prior years, the Group presented financial information on a combined basis with no adjustment for fair values. The increase in shareholders’ funds is attributable to the application of the purchase method of accounting. The information presented below reflects the incremental effect of this increase in net assets as a result of using the purchase method over the amounts that were presented in the combined financial statements using historical cost.
The properties would have been depreciated on a units of production basis over periods not exceeding 40 years and goodwill would have been amortised over a period of 40 years until December 31, 2001, when amortisation ceased on the introduction of SFAS 141 'Business Combinations'.
From the date of the business combination in December 1995, through December 31, 2003, the Group would have recorded cumulative additional income statement amounts as follows:
| | US$m | |
|
| |
| Depreciation of property, plant and equipment | (1,128 | ) |
| Amortisation of goodwill | (24 | ) |
| Impairment charges | (35 | ) |
| Loss on sale of properties | (273 | ) |
| Deferred tax benefit | 580 | |
| Attributable to outside equity shareholders | 60 | |
|
| |
| Total additional expense | (820 | ) |
|
| |
Excluding any impairment charges and gains/losses on sales of properties, the additional depreciation relating to property, plant and equipment before tax and outside shareholder interests related to each year ranged from US$96 million to US$230 million.
The adjustments to the combined income statement information previously reported are as follows:
| | 2005 | | 2004 | |
| | US$m | | US$m | |
|
|
|
|
|
| Depreciation of property, plant and equipment | (140 | ) | (125 | ) |
| Deferred tax benefit | 42 | | 37 | |
| Attributable to outside equity shareholders | 3 | | 3 | |
|
|
|
|
|
| Decrease in net income | (95 | ) | (85 | ) |
| Net income as previously reported | 4,969 | | 2,823 | |
|
|
|
|
|
| Net income as revised | 4,874 | | 2,738 | |
|
|
|
|
|
A-71
Back to Contents
RIO TINTO GROUP
NOTES TO FINANCIAL STATEMENTS – (continued)
| 48 | RECONCILIATION TO US ACCOUNTING PRINCIPLES CONTINUED |
| | |
| A. | Differences Between IFRS and US GAAP Continued |
| | |
| | 2005 | | 2004 | |
|
|
|
| |
| Basic earnings per share | | | | |
| As previously reported | 364.3 | c | 204.7 | c |
| Adjustment | (7.0 | )c | (6.2 | )c |
|
|
|
| |
| As revised | 357.3 | c | 198.5 | c |
|
|
|
| |
| Fully diluted earnings per share | | | | |
| As previously reported | 363.1 | c | 204.4 | c |
| Adjustment | (6.9 | )c | (6.2 | )c |
|
|
|
| |
| As revised | 356.2 | c | 198.2 | c |
|
|
|
| |
The adjustment to the combined balance sheet information previously reported at December 31, 2005 is determined as follows:
| | US$m | |
|
| |
| Increase in shareholders' funds on formation of the DLC | 2,589 | |
| Additional expense 1995 to 2003 | (820 | ) |
| Additional expense 2004 | (85 | ) |
| Additional expense 2005 | (95 | ) |
| Currency translation adjustment | (126 | ) |
|
| |
| Increase in shareholders’ funds at 31 December 2005 | 1,463 | |
| Shareholders’ funds as previously reported | 17,214 | |
|
| |
| Shareholders’ funds as revised | 18,677 | |
|
| |
This adjustment would be allocated among the following assets and liabilities in the balance sheet at December 31, 2005:
| | US$m | |
|
| |
| Property, plant and equipment | 1,943 | |
| Goodwill | 154 | |
| Deferred tax liability | (594 | ) |
| Attributable to outside equity shareholders | (40 | ) |
|
| |
| Increase in shareholders’ equity | 1,463 | |
|
| |
Goodwill and indefinite lived intangible assets
Goodwill included in the Group's opening IFRS balance sheet in respect of acquisitions made prior to 1 January 2004 is stated at its carrying amount on that date under UK GAAP ('previous GAAP'). Goodwill on acquisitions in 1997 and previous years was eliminated against reserves under the previous GAAP and was not reinstated on transition to IFRS. Goodwill on acquisitions between 1998 and 2003 inclusive was capitalised and amortised over its expected useful economic life and any amortisation charged up to 1 January 2004 was not reversed under IFRS. From 2004, under IFRS, goodwill and indefinite lived intangible assets are capitalised and tested annually for impairment but are not subject to amortisation. Under US GAAP, goodwill is capitalised and, until 2001, was amortised by charges against income over the period during which it was expected to be of benefit, subject to a maximum of 40 years. Goodwill eliminated against reserves under IFRS is therefore added back under US GAAP. From 1 January 2002, goodwill and indefinite lived intangible assets are no longer amortised under US GAAP but are reviewed annually for impairment under SFAS 142 'Goodwill and Other Intangible Assets'.
Intangible assets
The implementation of SFAS 141 'Business Combinations' resulted in the reclassification of US$340 million from goodwill to finite lived intangible assets at 1 January 2002 under US GAAP. The accumulated cost relating to these intangible assets at 31 December 2006 was US$701 million and accumulated amortisation was US$539 million. This reclassification, which relates to acquisitions prior to 1 January 2004, has not been recognised under IFRS. The total amortisation expense for 2006 in respect of the amounts reclassified under US GAAP was US$32 million, of which US$11 million is related to the amortisation of goodwill previously eliminated against reserves and classified as finite lived intangible assets under US GAAP. The remaining US$21 million relates to the amortisation of assets classified as goodwill on the IFRS balance sheet but classified as finite lived intangible assets under US GAAP. The estimated incremental amortisation charge under US GAAP relating to intangible assets is US$32 million per year.
Additional amounts attributed to assets on acquisition under US GAAP
IFRS requires the recognition of a provision for deferred tax on all fair value adjustments arising on acquisition other than those recorded as goodwill. On first application of IFRS, this resulted in an additional provision for deferred tax in respect of acquisitions prior to 1 January 2004 which was charged against retained earnings and gave rise to a reduction in IFRS shareholders' funds. For acquisitions post 1 January 2004, these deferred tax provisions give rise to a corresponding increase in amounts attributable to acquired assets and/or goodwill. Under US GAAP, provision for deferred tax on acquisitions produces a corresponding increase in the amounts attributed to acquired assets and/or goodwill and therefore has no effect on shareholders' funds. This results in an additional amount attributed to assets under US GAAP in respect of acquisitions prior to 1 January 2004. This also means that an additional charge arises under US GAAP in respect of depreciation of the amounts attributed to acquired assets.
Mark to market of derivative contracts
The Group is party to derivative contracts designed to reduce exposures related to assets and liabilities, firm commitments or anticipated transactions. From 1 January 2005, under IAS 39 'Financial Instruments: Recognition and Measurement', all derivatives are initially recognised at their fair value on the date the derivative contract is entered into and are subsequently remeasured at their fair value. The method of recognising the resulting gain or loss depends on whether the derivative is designated as a hedging instrument and, if so, the nature of the item being hedged. The Group designates certain derivatives as either hedges of the fair value of recognised assets or liabilities or a firm commitment (fair value hedges) or hedges of highly probable forecast transactions (cash flow hedges).
A-72
Back to Contents
RIO TINTO GROUP
NOTES TO FINANCIAL STATEMENTS – (continued)
| 48 | RECONCILIATION TO US ACCOUNTING PRINCIPLES CONTINUED |
The US standard, SFAS 133 'Accounting for Derivative Instruments and Hedging Activities', is similar but not identical to IAS 39. In 2006 and 2005, respectively, additional losses of US$8 million (US$5 million after tax and minorities) and US$4 million (US$1 million gain after tax and minorities) were recognised in US GAAP earnings primarily as a result of the recognition at fair value of additional embedded derivatives for US GAAP. For IFRS, the currency exposures in these contracts are not recognised in the balance sheet because the currency of the contract is considered to be 'commonly used' in the counterparty's country of operation.
Adjustments to asset carrying values
Impairment of fixed assets under IFRS is recognised and measured by reference to the discounted cash flows expected to be generated by a Cash Generating Unit or fair value less costs to sell if higher. Under US GAAP, impairment, other than that relating to goodwill and equity accounted investments, is recognised only when the anticipated undiscounted cash flows are insufficient to recover the carrying value of the asset group.
However, where an asset group is found to be impaired under US GAAP, its carrying value is written down to fair value. Fair value is normally assessed by reference to the discounted cash flows expected to be generated from the asset group, generally using the same assumptions and bases as those applicable under IFRS. For example, the evaluation is on a pre-tax and pre-debt basis. The amount of such impairment is, therefore, generally similar under US GAAP to that computed under IFRS, except where the US GAAP carrying value is different from that under IFRS. This may result from additional goodwilll carried in the balance sheet under US GAAP.
Under IFRS, impairment provisions, except those relating to goodwill, may be written back in a subsequent year if the expected recoverable amount of the Cash Generating Unit increases. Any credits to IFRS earnings resulting from such write backs are reversed in the reconciliation to US GAAP because the writing back of impairment provisions is not permitted under US GAAP. For additional information on amounts written back under IFRS during 2006, see note 5.
Pensions/post retirement benefits
For UK and Australian reporting, Rio Tinto reports pensions and post retirement benefits in accordance with IAS 19. The annual pension cost comprises the estimated cost of benefits accrued during the period, plus the interest cost on the obligation less the expected return on plan assets, plus the full impact of any prior service costs, curtailments and settlements. Actuarial gains and losses are recognised immediately in the period in which they occur but are taken through the Statement of Recognised Income and Expense ('SORIE'), not the Income Statement. For US GAAP reporting, following the adoption of SFAS 158 'Employers' Accounting for Defined Benefit Pension and Other Postretirement Plans' in 2006, actuarial gains and losses are recognised initially in the year in which they occur in other comprehensive income ('OCI'). However, unlike IFRS, US GAAP requires that these amounts recognised in OCI be amortised into the pension cost in profit and loss in subsequent years. The closing balance sheet position under US GAAP differs from that under IFRS largely because the pension fund assets are valued as at 30 September in each year for US GAAP purposes, whereas for IFRS they are valued as at the end of the financial year. For further discussion of the impact of adopting SFAS 158 during 2006, see C. Post Retirement Benefits.
Evaluation costs capitalised under IFRS
Under IFRS, evaluation expenditure on a project can be carried forward after it has reached a stage where there is a high degree of confidence in its viability. Under US GAAP, exploration and evaluation expenditure is expensed as incurred.
Depreciation based on proven & probable reserves
Under IFRS, mining assets are fully depreciated over their economic lives or the remaining life of the mine if shorter. In some cases, mineralised material that does not yet have the status of reserves is taken into account in determining depreciation and amortisation charges, where there is a high degree of confidence that it will be mined economically. For US GAAP, only 'proven and probable reserves' are taken into account in the calculation of depreciation and amortisation charges. As a result, adjustments have been made to depreciation and amortisation, which reduce US GAAP earnings.
Effect of price assumptions specified for determination of ore reserves for US GAAP depreciation & amortisation
For UK and Australian reporting, the Group’s ore reserve estimates are determined in accordance with the JORC code and are based on forecasts of future commodity prices. During 2003, the SEC formally indicated that, for US reporting, historical price data should be used to test the determination of reserves. The application of historical prices to test the reserve estimates led to reduced ore reserve quantities for US reporting purposes for certain of the Group’s operations in previous years, which resulted in lower earnings for US reporting, largely as a result of higher depreciation charges. The reduced ore reserves also had the effect of increasing the present value of provisions for closure obligations for certain of the Group's operations.
Effect of change in functional currency
At 1 January 2005, the functional currency of two business units was determined to have changed from the US dollar to their local currencies. Under IFRS, the change in functional currency was recognised by converting the US dollar balances to the local currencies using the exchange rates at 1 January 2005. Under US GAAP, SFAS 52 'Foreign Currency Translation' requires that such a change in functional currency should be dealt with using values based on the historical cost of the non-monetary assets, in local currency, at the date of acquisition. The cumulative adjustment attributable to translating the non-monetary assets of these business units at the historical rate rather than the current rate was reported in other comprehensive income. Additional charges/credits arise under US GAAP in respect of depreciation and other movements in the underlying assets because their carrying values under US GAAP are different from IFRS as a consequence of the different treatment described above.
A-73
Back to Contents
RIO TINTO GROUP
NOTES TO FINANCIAL STATEMENTS – (continued)
| 48 | RECONCILIATION TO US ACCOUNTING PRINCIPLES CONTINUED |
| | |
| A. | Differences Between IFRS and US GAAP Continued |
Provisions for close down and restoration costs
In accordance with SFAS 143 'Accounting for Asset Retirement Obligations', provision is made in the accounting period when the related environmental disturbance occurs, based on the net present value of estimated future costs. The costs so recognised are capitalised and depreciated over the estimated useful life of the related asset. In each subsequent year, the discount applied to the provision 'unwinds', resulting in a charge to the income statement for the year and an increase in the present value of the provision. This accounting treatment is broadly similar to Rio Tinto's policy under IFRS with a few exceptions. In particular, the effect of price assumptions specified for the determination of ore reserves for US GAAP has had the impact of reducing the ore reserves for certain of the Group's operations and consequently increasing the present value of provisions for closure obligations.
Stripping costs deferred under IFRS
Under IFRS, stripping (i.e. overburden and other waste removal) costs incurred in the development of a mine or pit before production commences are capitalised as part of the cost of constructing the mine. Such pre-production stripping costs are subsequently amortised over the life of the operation.
Under IFRS, the Group defers stripping costs incurred during a mine's (or pit's) production phase for those surface mines where deferral is considered the most appropriate basis for matching costs against the related economic benefits. Additional information is given in note 1, (h) Deferred stripping.
In 2006, the Group adopted EITF Issue No. 04-06 'Accounting for Stripping Costs Incurred during Production in the Mining Industry' ('EITF 04-06') for US GAAP. Under EITF 04-06, the Group includes as a component of production cost those stripping costs incurred during the production phase of a mine, except to the extent they can be attributed to inventory in accordance with normal inventory valuation principles.
Under IFRS, where a mine operates several open pits and those pits are regarded as separate operations, the Group capitalises the pre-production stripping costs incurred in the development of second and subsequent pits where it is probable that the associated future economic benefits will flow to the Group and where the costs can be measured reliably. These stripping costs are pre-production mine development that is necessary to access ore from the second and subsequent pits and generate economic benefits over the lives of such pits. Such costs, therefore, are capitalised and amortised over the production from such pits under EITF 04-06 as well as under IFRS.
If, however, the pits are highly integrated, the second and subsequent pits are regarded as extensions of the first pit in accounting for stripping costs. In such cases, the initial stripping of the second and subsequent pits is considered production phase stripping relating to the combined operation and would be deferred under IFRS if this is considered to be the most appropriate basis for matching costs against the related economic benefits. However, under US GAAP such costs are expensed because they are production phase stripping.
The Group’s determination of whether multiple pit mines are considered separate or integrated operations depends on each mine’s specific circumstances and is the same for IFRS and US GAAP. The following factors would point towards the stripping costs for the individual pits being accounted for separately:
| – | If mining of the second and subsequent pits is conducted consecutively with that of the first pit, rather than concurrently. |
| – | If separate investment decisions are made to develop each pit, rather than a single investment decision being made at the outset. |
| – | If the pits are operated as separate units in terms of mine planning and the sequencing of overburden and ore mining, rather than as an integrated unit. |
| – | If expenditures for additional infrastructure to support the second and subsequent pits are relatively large. |
| – | If the pits extract ore from separate and distinct ore bodies, rather than from a single ore body. |
This additional factor would point to an integrated operation in accounting for stripping costs:
| – | If the designs of the second and subsequent pits are significantly influenced by opportunities to optimise output from the several pits combined, including the co-treatment or blending of the output from the pits. |
The relative importance of each of the above factors is considered in each case to determine whether, on balance, the stripping costs should be attributed to the individual pit or to the combined output from the several pits. As this analysis requires judgment, another company could make the determination that a mine is separate or integrated differently than the Group, even if the fact pattern appears to be similar. To the extent the determination is different, the resulting accounting would also be different.
As of 31 December 2006 and 2005, the net book values of capitalised stripping costs incurred in the development of second and subsequent pits at multiple pit mines where pits are considered separate operations were US$53 million and US$57 million, respectively.
On adoption of EITF 04-06 at 1 January 2006, a cumulative adjustment of US$651 million (US$415 million net of taxation) attributable to subsidiaries was recognised directly in US GAAP equity. A further US$94 million net of taxation related to equity accounted units was recognised directly in US GAAP equity. Both of these amounts are included in the adjustments for deferred stripping, which form part of the reconciliation to Rio Tinto shareholders' funds.
Provision, under IFRS, for shares to be repurchased
Under IFRS, the Group is required to recognise a liability in respect of irrevocable commitments made to purchase Rio Tinto plc shares that a counterparty has been authorised to buy in the market at the counterparty's discretion during the period up to the preliminary announcement of the Group's results, when the Group is unable to purchase its own shares. A corresponding reduction in shareholders' funds is also recorded.
Under US GAAP, the commitment is not recorded as a liability where the counterparty has not purchased the shares at the balance sheet date as there is no fixed price or fixed number of shares.
A-74
Back to Contents
RIO TINTO GROUP
NOTES TO FINANCIAL STATEMENTS – (continued)
| 48 | RECONCILIATION TO US ACCOUNTING PRINCIPLES CONTINUED |
| | |
| A. | Differences Between IFRS and US GAAP Continued |
Other
Other adjustments include amounts relating to differences between IFRS and US accounting principles in respect of profit on sale of operations, higher cost of sales resulting from acquisition accounting and restructuring costs.
Profit on sale of operations – The profit on sale of operations may be different under US GAAP when the book values under US GAAP include goodwill, which is not reinstated under IFRS, or other GAAP adjustments, which increase or decrease the carrying value of operations sold.
Higher cost of sales resulting from acquisition accounting –Under IFRS, the inventories of acquired companies are valued at the lower of replacement cost and net realisable value. Under US GAAP, such inventories are recognised at the time of acquisition on the basis of expected net sales proceeds.
Retructuring costs –Under US GAAP, SFAS 146 'Accounting for Costs Associated with Exit or Disposal Activities' requires that the timing of recognition of a liability for one-time termination benefits depends on whether employees are required to render service until they leave the company in order to receive the termination benefits. In 2005 an adjustment was made to pre-tax earnings and shareholders' funds to reverse a US$20 million liability for one-time termination benefits recognised under IFRS which instead is being recognised over the future service period of the employees under US GAAP.
Share-based payment
The Group adopted the fair value recognition provisions of IFRS 2, 'Share-based Payments' with effect from 1 January 2004. As permitted by IFRS 2, on the basis that the fair value of the awards had been previously disclosed, the Group has applied IFRS 2 to all grants of employee share-based payments that had not vested as at 1 January 2004. A cumulative adjustment was recognised as at 1 January 2004 to reflect the compensation cost that would have been recognised had the recognition provisions of IFRS 2 been applied to such awards in prior periods. The fair values used for grants of awards in prior periods under IFRS are similar to those determined under US accounting standard SFAS 123 'Accounting for Stock-Based Compensation'. The Group adopted the fair value recognition provisions of SFAS 123 in 2002, and as a result, under US GAAP, all periods presented reflect the compensation cost recognised as if SFAS 123 had been applied to all awards granted to employees after 1 January 1995.
In December 2004, the FASB issued SFAS No. 123 (revised 2004), which requires all share-based payments to employees, including grants of employee stock options, to be recognised in the financial statements based on their fair values beginning with the first annual period after 15 June 2005. The Group has applied the provisions of SFAS 123R for 2006. The adoption of SFAS 123R has not had any impact on its financial position, results of operations or cash flows because since 1 January 2004 the provisions of SFAS 123 have been applied in a manner which is consistent with the new requirements of SFAS 123R.
Other tax adjustments
In 2004 a valuation allowance of US$114 million was recorded against a deferred tax asset that existed in the opening US GAAP balance sheet, resulting in a non-recurring charge against earnings. No such asset was recognised on transition to IFRS.
Under IFRS, no provision for deferred tax is recognised in respect of the depreciation of capitalised amounts of asset retirement obligations except where such obligations are recognised in accounting for a business combination. Under US GAAP, full provision is made for such temporary differences, resulting in the recognition of tax relief on such depreciation.
Under FAS 123(R), the measurement of the deferred tax asset is based on an estimate at the time the options are granted of the future tax deduction, if any, for the amount of compensation cost recognised for book purposes. Changes in the share price do not impact the deferred tax asset. Under IFRS 2, the measurement of the deferred tax asset is based on an estimate of the future tax deduction, if any, for the award updated at the end of each reporting period. Changes in the share price impact the deferred tax asset to the extent that they affect the expected future tax deduction.
Consolidated statement of cash flows
The consolidated statement of cash flows prepared in accordance with International Accounting Standard 7 (IAS 7) presents substantially the same information as that required under US GAAP. Under US GAAP, however, there are certain differences from IFRS with regard to the classification of items within the cash flow statement and with regard to the definition of cash and cash equivalents. Under IFRS, cash for the purposes of the cash flow statement comprises cash on hand, deposits held on call with banks, short-term, highly liquid investments that are readily convertible into known amounts of cash and that are subject to insignificant risk of changes in value, and bank overdrafts that are payable on demand. An investment usually qualifies as a cash equivalent under IFRS when it has a short maturity of, say, three months or less from the date of acquisition. Under US GAAP, cash equivalents comprise cash balances and current asset investments with an original maturity of less than three months and exclude bank overdrafts repayable on demand.
Underlying earnings
As permitted under IFRS, 'Underlying earnings' as defined in note 2 to the Financial statements, has been presented to provide greater understanding of the underlying business performance of the operations of the Group. This is in addition to the presentation of Profit for the year attributable to equity shareholders of Rio Tinto (Net earnings). US GAAP net earnings has been presented, with no additional measure of Underlying earnings because such additional measures are not permitted under US GAAP.
Guarantor's accounting
Material guarantees issued by the Group relate to its own future performance. These include counter-indemnities to financial institutions that have guaranteed to third parties that the Group will perform certain obligations. Examples of such obligations include restoration and environmental remediation activities during mine and refinery operations and after mine closure, agreements to supply products to certain customers and agreements with certain governmental agencies to build processing facilities. Where appropriate, provisions already exist in the balance sheet for these obligations.
Variable Interest Entities
Under FIN 46(R) ‘Consolidation of Variable Interest Entities’, a variable interest entity (VIE) is consolidated by the 'primary beneficiary' of the entity. The primary beneficiary is generally defined as the party exposed to the majority of the risks and rewards arising from the VIE. The Group currently has VIEs that would be consolidated for US GAAP which are equity accounted under IFRS. Additional information on these VIEs is provided in section F of note 48.
A-75
Back to Contents
RIO TINTO GROUP
NOTES TO FINANCIAL STATEMENTS – (continued)
| 48 | RECONCILIATION TO US ACCOUNTING PRINCIPLES CONTINUED |
| | |
| B. | New US Accounting Standards |
In June 2006, FASB Interpretation No. 48, 'Accounting for Uncertainty in Income Taxes, an Interpretation of FASB Statement No. 109' ('FIN 48') was issued. FIN 48 prescribes bases for the financial statement recognition and measurement of a tax position taken or expected to be taken in a tax return. FIN 48 requires tax benefits from an uncertain position to be recognised only if it is 'more likely than not' that the position is sustainable upon audit, based on its technical merits. The interpretation also requires qualitative and quantitative disclosures, including discussion of reasonably possible changes that might occur in recognised tax benefits over the next 12 months, a description of open tax years by major jurisdiction and a roll-forward of all unrecognised tax benefits. FIN 48 first applies for the Group’s financial year beginning 1 January 2007. The Group is currently assessing the impact of adopting FIN 48.
In February 2006, the FASB issued SFAS 155, 'Accounting for Certain Hybrid Financial Instruments, an amendment of FASB Statements No. 133 and 140'. The Statement resolves issues addressed in Statement 133 Implementation Issue No. D1, 'Application of Statement 133 to Beneficial Interests in Securitized Financial Assets.' SFAS 155 permits fair value remeasurement for any hybrid financial instrument that contains an embedded derivative that otherwise would require bifurcation. SFAS 155 is effective for all financial instruments acquired or issued by the Group beginning 1 January 2007. The Group is currently assessing the impact of SFAS 155.
In September 2006, the FASB issued SFAS 157, 'Fair Value Measurements', which defines fair value, establishes a framework for measuring fair value under US GAAP and expands disclosures about fair value measurements. SFAS 157 applies under other accounting pronouncements that require or permit fair value measurements; accordingly, it does not require any new fair value measurements but may change current practice. SFAS 157 is effective for the Group’s financial year beginning 1 January 2008. The Group is currently assessing the impact of adopting SFAS 157.
In September 2006, the FASB issued SFAS 158. SFAS 158 requires companies that sponsor single-employer defined benefit plans to recognise their overfunded or underfunded status as an asset or liability in the statement of financial position and to recognise changes in that funded status in the year in which changes occur, as a component of other comprehensive income. The Statement also requires disclosure of additional information about certain effects on earnings for the subsequent fiscal year arising from the delayed recognition in earnings of amounts initially recognised as a component of other comprehensive income. The Group adopted the recognition and disclosure provisions of SFAS 158 as of the end of its fiscal year ending 31 December 2006. The Group is required to adopt the measurement provisions of SFAS 158 for the Group’s financial year ending 31 December 2008. The Group is currently assessing the impact of adopting the measurement provisions of SFAS 158.
In February 2007, the FASB issued SFAS 159 'The Fair Value Option for Financial Assets and Financial Liabilities, Including an amendment of FASB Statement No. 115', which permits entities to choose to measure many financial instruments and certain other items at fair value. SFAS 159 is effective for the Group as of 1 January 2008. The Group is currently assessing the impact of adopting SFAS 159.
A-76
Back to Contents
RIO TINTO GROUP
NOTES TO FINANCIAL STATEMENTS – (continued)
| 48 | RECONCILIATION TO US ACCOUNTING PRINCIPLES CONTINUED |
| | |
| C. | Post Retirement Benefits |
Information in respect of the net periodic benefit cost and related obligation determined in accordance with US Statements of Financial Accounting Standards 87, 88, 106, 132R and 158 is given below. The measurement date used to establish year end asset values and benefit obligations was 30 September 2006. The previous measurement date, used to determine 2006 costs, was 30 September 2005.
Benefits under the major pension plans are principally determined by years of service and employee remuneration. The Group’s largest defined benefit pension plans are in the UK, Australia, the US and Canada and a description of the investment policies and strategies followed is set out below.
In the UK and North America, the investment strategy is determined by the pension plan trustee and investment committees respectively, after consulting the company. Agreed investment policies aim to ensure that the objectives are met in a prudent manner, consistent with established guidelines. The investment objectives include generating a return that exceeds consumer price and wage inflation over the long term. Ranges for the proportions to be held in each asset class have been agreed; a substantial proportion of the assets is invested in a spread of domestic and overseas equities, with a smaller proportion in fixed and variable income bonds, cash and real estate. Risk is managed in various ways, including identifying investments considered to be unsuitable and placing limits on some types of investment.
In Australia, the majority of investments are in respect of defined contribution funds. The investments reflect the various defined benefit and defined contribution liabilities and are primarily in Australian and overseas equities and fixed interest stocks.
The Group's defined benefit plans do not invest directly in property occupied by the Group or in the Group's own financial instruments.
At 30 September 2006, funded pension plans held assets invested in the following proportions:
| | UK target | | US target (a) | | Canada target | | Group Actual | |
| |
| |
| |
| |
| |
| | 2006 | | 2005 | | 2006 | | 2005 | | 2006 | | 2005 | | 2006 | | 2005 | |
|
|
|
|
|
|
|
|
|
|
|
|
|
|
|
| |
| Equities | 45%-85 | % | 45%-85 | % | 65 | % | 65 | % | 65 | % | 65 | % | 67 | % | 65 | % |
| Debt securities | 10%-40 | % | 15%-45 | % | 30 | % | 30 | % | 35 | % | 35 | % | 26 | % | 25 | % |
| Real estate | — | | — | | 5 | % | 5 | % | — | | — | | 3 | % | 3 | % |
| Other | 0%–10 | % | 0% – 10 | % | — | | — | | — | | — | | 4 | % | 7 | % |
The expected rate of return on pension plan assets is determined as management’s best estimate on the long term return of the major asset classes – equity, debt, real estate and other – weighted by the actual allocation of assets among the categories at the measurement date.
Pension plan contributions are determined through regular funding valuations in line with local funding requirements. Contributions to be paid in 2007 are expected to be around US$8m higher than for 2006.
A refund of US$26 million is expected to be received by the Group in 2007, as part of the distribution of surplus to members and the employer relating to South African plans.
Assumptions used to determine the net periodic benefit cost and the end of year benefit obligation for the major pension plans are within the ranges shown below. The average rate for each assumption has been weighted by the relevant benefit obligation. The assumptions used to determine the end of year benefit obligation are also used to calculate the following year’s cost.
| | 2006 Cost (a) | | Year end benefit obligation | |
|
|
|
| |
| Discount rate | 4.8% to 8.0% (Average: 5.1% | ) | 4.7% to 8.4% (Average: 5.3% | ) |
| Long term rate of return on plan assets | 5.9% to 7.6% (Average: 6.2% | ) | 6.4% to 10.5% (Average: 6.9% | ) |
| Increase in compensation levels | 4.1% to 6.3% (Average: 4.6% | ) | 3.9% to 7.8% (Average: 4.6% | ) |
| | |
| (a) | 31 December 2005 year end benefit obligations were measured on the same assumptions as the 2006 cost. |
The actuarial calculations in respect of the UK plans assume a rate of increase of pensions in payment of 3.0 percent per annum at the year end. This assumption is consistent with the inflation rate included in the expected rates of return and salary increase assumptions in the respective valuations. Appropriate assumptions were made for plans in other countries.
Discount rates have been set based on the yields available on AA rated corporate bonds in the appropriate currency, or government bonds where there is no deep market in AA rated corporate bonds. The discount rate reflects the weighted average yield over the term of the liabilities.
The expected average remaining service life in the major plans ranges from 6 to 15 years with an overall average of 11 years.
Other post retirement benefits are provided to employees who meet the eligibility requirements, and their beneficiaries and dependants, through unfunded self-insurance arrangements. The majority of these plans are for employees in the United States. The plans are non-contributory, although some contain an element of cost sharing such as deductibles and co-insurance.
In the US, the Medicare Prescription Drug, Improvement and Modernization Act of 2003 provides an employer subsidy, which began in 2006. The Group's post retirement medical plans are eligible for this employer subsidy.
The weighted average assumptions used in determining the costs and year end benefit obligation for the major post retirement benefit plans other than pension plans were as shown below:
A-77
Back to Contents
RIO TINTO GROUP
NOTES TO FINANCIAL STATEMENTS – (continued)
| 48 | RECONCILIATION TO US ACCOUNTING PRINCIPLES CONTINUED |
| | |
| C. | Post Retirement Benefits Continued |
| | | | | |
| | 2006 Cost (a) | | Year end benefit obligation | |
|
|
|
| |
| Discount rate | 4.8% to 8.0% (average 5.6% | ) | 4.7% to 8.4% (average 6.0% | ) |
| Average healthcare cost trend rate | | | | |
| – trend in first year | 6.3% to 9.6% (average 9.1% | ) | 5.5% to 10.8% (average 8.4% | ) |
| – reducing to long term rate by 2011 broadly on a straight-line basis | 5.1% to 6.8% (average 5.4% | ) | 4.9% to 8.3% (average 5.4% | ) |
| (a) | 31 December 2005 year end benefit obligations were measured on the same assumptions as the 2006 cost. |
| | |
| The components of net benefit expense under US GAAP are detailed in the table below. |
| | | | | | | |
| | 2006 | | 2005 | | 2004 | |
| Pension benefits | US$m | | US$m | | US$m | |
|
|
|
|
|
| |
| Service cost | (197 | ) | (152 | ) | (133 | ) |
| Interest cost on benefit obligation | (279 | ) | (274 | ) | (238 | ) |
| Expected return on plan assets | 298 | | 289 | | 250 | |
| Net amortisation and deferral: | | | | | | |
| – transitional obligation | 1 | | 1 | | 5 | |
| – recognised losses | (42 | ) | (41 | ) | (32 | ) |
| – prior service cost recognised | (21 | ) | (24 | ) | (22 | ) |
|
|
|
|
|
| |
| Total net amortisation and deferral | (62 | ) | (64 | ) | (49 | ) |
|
|
|
|
|
| |
| Net periodic benefit cost | (240 | ) | (201 | ) | (170 | ) |
| Curtailment and settlement credit/(charge) | 2 | | (1 | ) | 37 | |
|
|
|
|
|
| |
| Net benefit expense | (238 | ) | (202 | ) | (133 | ) |
|
|
|
|
|
| |
| | |
| The 2006 pension cost shown above includes US$21 million (2005: US$8 million; 2004: US$6 million) in relation to defined contribution plans. In addition, contributions of US$14 million (2005: US$12 million; 2004: US$11 million) were paid to 401k plans in the US. |
| | | | | | | |
| | 2006 | | 2005 | | 2004 | |
| Other benefits | US$m | | US$m | | US$m | |
|
|
|
|
|
| |
| Service cost | (10 | ) | (10 | ) | (10 | ) |
| Interest cost on benefit obligation | (26 | ) | (28 | ) | (32 | ) |
| Net amortisation and deferral: | | | | | | |
| – recognised gains | 5 | | 4 | | 1 | |
| – prior service cost recognised | — | | 1 | | (3 | ) |
|
|
|
|
|
| |
| Total net amortisation and deferral | 5 | | 5 | | (2 | ) |
|
|
|
|
|
| |
| Net periodic benefit cost | (31 | ) | (33 | ) | (44 | ) |
| Curtailment and settlement credit | — | | — | | 3 | |
|
|
|
|
|
| |
| Net benefit expense | (31 | ) | (33 | ) | (41 | ) |
|
|
|
|
|
| |
| | |
| The funded status of the Group's principal schemes is summarised in the table below. |
| | |
| | 2006 | | 2005 | |
| Pension benefits | US$m | | US$m | |
|
|
|
| |
| Benefit obligation at end of year | (5,846 | ) | (5,109 | ) |
| Fair value of plan assets | 5,808 | | 4,978 | |
|
|
|
| |
| Funded status | (38 | ) | (131 | ) |
|
|
|
| |
| Unrecognised prior service cost | 108 | | 112 | |
| Unrecognised net loss | 362 | | 469 | |
| Unrecognised transitional asset | (3 | ) | (5 | ) |
| Company contributions in fourth quarter | 16 | | 22 | |
|
|
|
| |
| Net amount recognised at end of year (before implementation of SFAS 158) | 445 | | 467 | |
|
|
|
| |
| Comprising (before implementation of SFAS 158): | | | | |
| – benefit prepayment | 407 | | 394 | |
| – benefit provision | (251 | ) | (327 | ) |
| – intangible asset | 40 | | 45 | |
| – amount recognised through accumulated other comprehensive income | 249 | | 355 | |
|
|
|
| |
| Net amount recognised (before implementation of SFAS 158) | 445 | | 467 | |
|
|
|
| |
A-78
Back to Contents
RIO TINTO GROUP
NOTES TO FINANCIAL STATEMENTS – (continued)
| 48 | RECONCILIATION TO US ACCOUNTING PRINCIPLES CONTINUED |
| | |
| C. | Post Retirement Benefits Continued |
| In accordance with SFAS 158, all unrecognised amounts were recognised in OCI on 31 December 2006. The amounts recognised in the balance sheet are as follows: |
| | 2006 | |
| | US$m | |
|
| |
| Non current assets | 287 | |
| Current liabilities | (6 | ) |
| Non current liabilities | (319 | ) |
|
| |
| Total | (38 | ) |
|
| |
| | |
| As of 31 December 2006, after implementation of SFAS 158, amounts recognised in accumulated OCI consist of: |
| | 2006 | |
| | US$m | |
|
| |
| Net loss | 362 | |
| Prior service cost | 108 | |
| Transitional asset | (3 | ) |
| Adjustment in respect of contributions in fourth quarter | 16 | |
|
| |
| Total | 483 | |
|
| |
| | |
| The aggregate benefit obligations and aggregate fair values of plan assets for plans with benefit obligations in excess of plan assets as at 30 September 2006 are summarised in the table below. These benefit obligations include an allowance for future salary increases. |
| | |
| | 2006 | | 2005 | |
| Pension benefits | US$m | | US$m | |
|
|
|
| |
| Benefit obligation at end of year | (2,019 | ) | (2,006 | ) |
| Fair value of plan assets | 1,694 | | 1,588 | |
|
|
|
| |
| Benefit obligations in excess of plan assets | (325 | ) | (418 | ) |
|
|
|
| |
| | |
| The aggregate accumulated benefit obligations and aggregate fair values of plan assets for plans with accumulated benefit obligations (i.e. with no allowance for future salary increases) in excess of plan assets as at 30 September 2006 are summarised in the table below. |
| | |
| | 2006 | | 2005 | |
| Pension benefits | US$m | | US$m | |
|
|
|
| |
| Accumulated benefit obligation at end of year | (1,536 | ) | (1,916 | ) |
| Fair value of plan assets | 1,289 | | 1,588 | |
|
|
|
| |
| Accumulated benefit obligations in excess of plan assets | (247 | ) | (328 | ) |
|
|
|
| |
| | |
| The funded status of the Group's principal schemes other than pensions is summarised in the table below. |
| | |
| | 2006 | | 2005 | |
| Other benefits | US$m | | US$m | |
|
|
|
| |
| Benefit obligation at end of year | (491 | ) | (493 | ) |
| Unrecognised prior service cost | 3 | | (1 | ) |
| Unrecognised net gain | (67 | ) | (54 | ) |
| Company contributions in fourth quarter | 5 | | 6 | |
|
|
|
| |
| Net amount recognised at end of year (before implementation of SFAS 158) | (550 | ) | (542 | ) |
|
|
|
| |
| Comprising (before implementation of SFAS 158): | | | | |
| – benefit provision | (550 | ) | (542 | ) |
|
|
|
| |
| Net amount recognised (before implementation of SFAS 158) | (550 | ) | (542 | ) |
|
|
|
| |
| | |
| In accordance with SFAS 158, all unrecognised amounts were recognised in OCI on 31 December 2006. The amounts recognised in the balance sheet are as follows: |
| | |
| | 2006 | |
| | US$m | |
|
| |
| Current liabilities | (22 | ) |
| Non current liabilities | (469 | ) |
|
| |
| Total | (491 | ) |
|
| |
| | |
| As of 31 December 2006, after implementation of SFAS 158, amounts recognised in accumulated OCI consist of: |
| | |
| | 2006 | |
| | US$m | |
|
| |
| Net gain | (67 | ) |
| Prior service cost | 3 | |
| Adjustment in respect of contributions in fourth quarter | 5 | |
|
| |
| Total | (59 | ) |
|
| |
A-79
Back to Contents
RIO TINTO GROUP
NOTES TO FINANCIAL STATEMENTS – (continued)
| 48 | RECONCILIATION TO US ACCOUNTING PRINCIPLES CONTINUED |
| | |
| C. | Post Retirement Benefits Continued |
Change in benefit obligation
The amounts shown below include, where appropriate, 100 per cent of the costs, contributions, gains and losses in respect of employees who participate in the plans and who are employed in operations that are proportionally consolidated or equity accounted. Consequently, the costs, contributions, gains and losses do not correspond directly to the amounts disclosed above in respect of the Group. Pure defined contribution plans and industry-wide plans are excluded from the movements below.| | | | | |
| | 2006 | | 2005 | |
| Pension benefits | US$m | | US$m | |
|
|
|
| |
| Benefit obligation at start of year | (5,109 | ) | (4,817 | ) |
| Service cost | (184 | ) | (151 | ) |
| Interest cost | (279 | ) | (274 | ) |
| Contributions by plan participants | (106 | ) | (36 | ) |
| Actuarial losses | (160 | ) | (213 | ) |
| Benefits paid | 344 | | 343 | |
| Newly consolidated | (13 | ) | — | |
| Plan amendments | (8 | ) | (12 | ) |
| Settlement loss | — | | (1 | ) |
| Curtailment gain | 3 | | — | |
| Currency adjustments | (334 | ) | 52 | |
|
|
|
| |
| Benefit obligation at end of year | (5,846 | ) | (5,109 | ) |
|
|
|
| |
The benefit obligation shown above includes an allowance for future salary increases, where applicable; the accumulated benefit obligation does not include this allowance. The accumulated benefit obligations for pension plans at 30 September 2006 amounted to US$5,557 million (30 September 2005: US$4,921 million).
| | 2006 | | 2005 | |
| Other benefits | US$m | | US$m | |
|
|
|
| |
| Benefit obligation at start of year | (493 | ) | (538 | ) |
| Service cost | (10 | ) | (10 | ) |
| Interest cost | (26 | ) | (28 | ) |
| Actuarial gains | 19 | | 60 | |
| Benefits paid | 21 | | 23 | |
| Plan amendments | (4 | ) | — | |
| Currency adjustments | 2 | | — | |
|
|
|
| |
| Benefit obligation at end of year | (491 | ) | (493 | ) |
|
|
|
| |
Change in plan assets
| | | | | |
| | 2006 | | 2005 | |
| Pension fund assets | US$m | | US$m | |
|
|
|
| |
| Fair value of plan assets at start of year | 4,978 | | 4,515 | |
| Actual return on plan assets | 551 | | 658 | |
| Contributions by plan participants | 106 | | 36 | |
| Contributions by employer | 159 | | 182 | |
| Benefits paid | (344 | ) | (343 | ) |
| Newly consolidated | 15 | | — | |
| Currency and other adjustments | 343 | | (70 | ) |
|
|
|
| |
| Fair value of plan assets at end of year | 5,808 | | 4,978 | |
|
|
|
| |
| | | | | |
| | 2006 | | 2005 | |
| Other benefit plan assets | US$m | | US$m | |
|
|
|
| |
| Fair value of plan assets at start of year | — | | — | |
| Contributions by employer | 21 | | 23 | |
| Benefits paid | (21 | ) | (23 | ) |
|
|
|
| |
| Fair value of plan assets at end of year | — | | — | |
|
|
|
| |
Change in additional minimum liability before tax (before application of SFAS158)
| | 2006 | | 2005 | |
| Pension benefits | US$m | | US$m | |
|
|
|
| |
| Accrued pension benefit expense | (111 | ) | (11 | ) |
| Decrease in intangible asset | 5 | | 3 | |
|
|
|
| |
| Other comprehensive income before tax | (106 | ) | (8 | ) |
|
|
|
| |
A-80
<<Back to Contents
RIO TINTO GROUP
NOTES TO FINANCIAL STATEMENTS - (continued)
| 48 | RECONCILIATION TO US ACCOUNTING PRINCIPLES CONTINUED |
| | |
| C. | Post Retirement Benefits Continued |
Incremental effect of applying SFAS 158 on individual balance sheet line items
Adoption of the recognition provisions of SFAS 158 required the recognition of the funded status of each single-employer defined benefit plan on the balance sheet as of 31 December 2006, with offsetting amounts recognised as components of accumulated OCI. Additional minimum pension liabilities (AML) and related intangible assets were also derecognised upon adoption of SFAS 158. The effect of the derecognition of the AML prior to the adoption of SFAS158 and the impact of the initial adoption of SFAS 158 on individual balance sheet accounts is as follows:| | Prior to | | | | | | Post | |
| | adjustment for | | | | | | adjustment for | |
| | AML and | | Adjust | | Adjust | | AML and | |
| | SFAS 158 | | AML | | SFAS 158 | | SFAS 158 | |
|
|
|
|
|
|
|
| |
| Prepaid post-retirement costs | 407 | | 140 | | (260 | ) | 287 | |
| Post-retirement provision | (801 | ) | 149 | | (164 | ) | (816 | ) |
| Intangible asset | 40 | | (40 | ) | — | | — | |
| Accumulated other comprehensive income | 249 | | (249 | ) | 424 | | 424 | |
The adoption of SFAS 158 also resulted in a decrease in the net deferred tax liability of US$54 million and a decrease in equity attributable to outside equity shareholders' of US$12 million.
Sensitivity to change in healthcare trend
Changing the healthcare cost trend rates by 1% would result in the following effects:
| | 1% Increase | | 1% Decrease | |
| | US$m | | US$m | |
|
|
|
| |
| 2006 | | | | |
| (Increase)/decrease in service cost plus interest cost | (6 | ) | 5 | |
| (Increase)/decrease in benefit obligation at 30 September | (74 | ) | 62 | |
| | | | | |
| 2005 | | | | |
| (Increase)/decrease in service cost plus interest cost | (6 | ) | 5 | |
| (Increase)/decrease in benefit obligation at 30 September | (66 | ) | 55 | |
| | | | | |
| 2004 | | | | |
| (Increase)/decrease in service cost plus interest cost | (6 | ) | 5 | |
| Expected benefit payments | | |
| | US$m | |
|
| |
| Pension benefits | | |
| Expected benefit payments in 2007 | 382 | |
| Expected benefit payments in 2008 | 385 | |
| Expected benefit payments in 2009 | 390 | |
| Expected benefit payments in 2010 | 402 | |
| Expected benefit payments in 2011 | 415 | |
| Expected benefit payments from 2012 to 2016 | 2,205 | |
| | | |
| Other benefits | | |
| Expected benefit payments in 2007 | 22 | |
| Expected benefit payments in 2008 | 23 | |
| Expected benefit payments in 2009 | 24 | |
| Expected benefit payments in 2010 | 25 | |
| Expected benefit payments in 2011 | 26 | |
| Expected benefit payments from 2012 to 2016 | 139 | |
The amounts in accumulated other comprehensive income expected to be recognised in net periodic benefit cost in 2007 are as follows:
| Pension benefits | US$m | |
|
| |
| Amortisation of | | |
| – transitional obligation | 2 | |
| – recognised losses | (37 | ) |
| – prior service cost recognised | (20 | ) |
|
| |
| Total | (55 | ) |
|
| |
| | | |
| Other benefits | US$m | |
|
| |
| Amortisation of | | |
| – recognised gains | 6 | |
|
| |
| Total | 6 | |
|
| |
A-81
Back to Contents
RIO TINTO GROUP
NOTES TO FINANCIAL STATEMENTS – (continued)
| 48 | RECONCILIATION TO US ACCOUNTING PRINCIPLES CONTINUED |
| | |
| D. | Accumulated Foreign Currency Translation Gains and (Losses) Recorded Directly in Shareholders' Funds under US GAAP |
| | | |
| | US$m | |
|
| |
| At 1 January 2006 | 280 | |
| Current period change | 986 | |
|
| |
| At 31 December 2006 | 1,266 | |
|
| |
| At 1 January 2005 | 814 | |
| Current period change | (534 | ) |
|
| |
| At 31 December 2005 | 280 | |
|
| |
| At 1 January 2004 | 200 | |
| Current period change | 614 | |
|
| |
| At 31 December 2004 | 814 | |
|
| |
| | |
| (a) | The amounts above for 2005 and 2004 have been revised to reflect the application of purchase accounting to the formation of the DLC structure in 1995. See pages A-71 and A-72 for a detailed discussion of the impact on amounts presented under US GAAP. |
| |
| E. | Deferred Stripping |
| Information about the stripping ratios of the Business Units, including equity accounted units, that account for the majority of the deferred stripping balance under IFRS at 31 December 2006, along with the year in which deferred stripping is expected to be fully amortised (as shown in brackets), is set out in the following table: |
| | | | | | | | |
| | Actual annual strip ratio | | Life of mine strip ratio | |
| |
|
|
| |
|
|
|
|
| |
| | 2006 | | 2005 | | 2004 | | 2006 | | 2005 | | 2004 | |
|
|
|
|
|
|
|
|
|
|
|
| |
| Kennecott Utah Copper (2019) (a) (b) | 2.04 | | 2.02 | | 1.83 | | 1.36 | | 1.51 | | 1.24 | |
| Argyle Diamonds (2009) (a) | 4.00 | | 6.60 | | 6.70 | | 4.40 | | 4.40 | | 4.91 | |
| Grasberg Joint Venture (2015) (a) | 3.01 | | 3.12 | | 3.39 | | 2.63 | | 2.43 | | 2.43 | |
| Diavik (2008) (c) | 0.89 | | 1.21 | | 1.47 | | 0.96 | | 0.91 | | 0.94 | |
| Escondida (2042) (d) | 0.08 | | 0.09 | | 0.11 | | 0.12 | | 0.12 | | 0.11 | |
| | |
| (a) | Strip ratios shown are waste to ore. |
| (b) | Kennecott's life of mine strip ratio decreased as the latest mine plan provides for the pit walls to be made steeper in an area within the mine, which resulted in adding ore without adding waste. |
| (c) | Diavik's strip ratio is disclosed as bank cubic metre per carat. |
| (d) | Escondida's strip ratio is based on waste tonnes to pounds of copper mined. |
Borax capitalised stripping costs as part of a distinct period of new development during the production stage of the mine. Capitalisation stopped in 2004. The capitalised costs will be fully amortised in 2034.
| F. | Equity Method Investments (IFRS) |
| The aggregated profit and loss accounts and balance sheets on a 100 per cent basis for entities that are accounted for under IFRS using the equity method are as follows: |
| | | | | | | |
| | 2006 | | 2005 | | 2004 | |
| | US$m | | US$m | | US$m | |
|
|
|
|
|
| |
| Profit and loss account | | | | | | |
| Sales revenue (a) | 11,562 | | 7,103 | | 6,655 | |
| Cost of sales | (4,474 | ) | (3,402 | ) | (3,836 | ) |
|
|
|
|
|
| |
| Operating profit | 7,088 | | 3,701 | | 2,819 | |
| Profit of equity accounted companies | — | | — | | 1 | |
| Gains/(losses) on derivatives and debt | 5 | | (31 | ) | (8 | ) |
| Net interest | (136 | ) | (118 | ) | (157 | ) |
|
|
|
|
|
| |
| Profit before tax | 6,957 | | 3,552 | | 2,655 | |
| Taxation | (2,541 | ) | (1,160 | ) | (872 | ) |
|
|
|
|
|
| |
| Net profit on ordinary activities (100 per cent basis) | 4,416 | | 2,392 | | 1,783 | |
|
|
|
|
|
| |
| | | | | |
| | 2006 | | 2005 | |
| | US$m | | US$m | |
|
|
|
| |
| Balance sheet | | | | |
| Intangible fixed assets | 16 | | 2 | |
| Property, plant and equipment | 7,292 | | 6,851 | |
| Investments | 185 | | 15 | |
| Working capital | 1,010 | | 1,604 | |
| Net cash less current debt | 476 | | (351 | ) |
| Long term debt | (2,306 | ) | (2,072 | ) |
| Provisions | (1,349 | ) | (1,504 | ) |
| Aggregate shareholders' funds (100 per cent basis) | 5,324 | | 4,545 | |
| | |
| (a) | Sales revenue includes US$1,693 million (2005: US$1,712 million; 2004: US$1,444 million) charged by equity accounted companies to their investors. |
A-82
Back to Contents
RIO TINTO GROUP
NOTES TO FINANCIAL STATEMENTS – (continued)
| 48 | RECONCILIATION TO US ACCOUNTING PRINCIPLES CONTINUED |
| | |
| F. | Equity Method Investments Continued |
| | |
| (b) | Included in the disclosures above are certain entities that have entered into sales arrangements with their shareholders wherein the pricesare designed to recover costs. Because of these arrangements, the entities are considered to be VIEs under FIN 46(R) and are consolidatedunder US GAAP. The full consolidation of these VIEs, whose principal activities are aluminium smelting, would affect the Group's US GAAPbalance sheet and profit and loss accounts as follows: |
| | | | | |
| | 2006 | | 2005 | |
| | US$m | | US$m | |
|
|
|
| |
| Balance sheet | | | | |
| Increase in property, plant and equipment | 1,542 | | 1,522 | |
| Decrease in investments in equity accounted units | (583 | ) | (588 | ) |
| Decrease in other non-current assets | (362 | ) | (375 | ) |
| Increase in current assets | 224 | | 220 | |
| Increase in current liabilities | (156 | ) | (60 | ) |
| Increase in provisions and other non-current liabilities (c) | (370 | ) | (457 | ) |
| Increase in equity attributable to outside equity shareholders | (295 | ) | (262 | ) |
|
|
|
| |
| Impact on Rio Tinto shareholders' funds | — | | — | |
|
|
|
| |
| | | | | | | |
| | 2006 | | 2005 | | 2004 | |
| | US$m | | US$m | | US$m | |
|
|
|
|
|
| |
| Profit and loss account | | | | | | |
| Increase in sales revenue | 316 | | 310 | | 267 | |
| Increase / (decrease) in share of profit after tax of equity accounted units | 3 | | (74 | ) | 28 | |
| (Decrease) / increase in share of profit after tax of subsidiaries | (3 | ) | 74 | | (28 | ) |
|
|
|
|
|
| |
| Impact on net earnings | — | | — | | — | |
|
|
|
|
|
| |
| | |
| (c) | Includes amounts due to other shareholders; however, these entities have no other debt. |
| | |
| G. | Joint Arrangements Equity Accounted for under US GAAP |
| The Group accounts for two joint arrangements using proportional consolidation under IFRS for which the equity method of accounting would be applied under US GAAP. The difference in treatment between proportional consolidation and the equity method of accounting has no impact on shareholders' funds or net income. Condensed financial information relating to the Group's proportionate interest in the joint arrangements that would be equity accounted under US GAAP is as follows: |
| | 2006 | | 2005 | | 2004 | |
| | US$m | | US$m | | US$m | |
|
|
|
|
|
| |
| Profit and loss account | | | | | | |
| Operating (loss) / profit | (69 | ) | 3 | | 5 | |
| Net (loss) / income | (46 | ) | (2 | ) | 7 | |
| | | | | | | |
| Cash flow statement | | | | | | |
| Net cash flow (used in)/from operating activities | (36 | ) | (9 | ) | 19 | |
| Net cash flow from / (used in) investing activities | 4 | | (31 | ) | (97 | ) |
| Net cash flow from financing activities | 23 | | 48 | | 80 | |
| | | | | | | |
| Balance sheet | | | | | | |
| Current assets | 87 | | 62 | | | |
| Non-current assets | 514 | | 459 | | | |
| Current liabilities | (27 | ) | (27 | ) | | |
| Non-current liabilities | (661 | ) | (535 | ) | | |
| | | | | | | |
| H. | Property, plant and equipment by location (IFRS) |
| The following supplements segmental information provided elsewhere in this report to provide additional information required under US GAAP: |
| | | | | | | | | |
| | 2006 | | 2005 | | 2006 | | 2005 | |
| | % | | % | | US$m | | US$m | |
|
|
|
|
|
|
|
| |
| North America (a) | 35.7 | | 35.1 | | 7,924 | | 6,192 | |
| Australia and New Zealand | 58.2 | | 57.1 | | 12,923 | | 10,056 | |
| South America | 0.4 | | 0.5 | | 93 | | 86 | |
| Africa | 2.7 | | 2.9 | | 608 | | 517 | |
| Indonesia | 2.2 | | 2.8 | | 498 | | 496 | |
| Europe and other countries | 0.8 | | 1.6 | | 161 | | 273 | |
|
|
|
|
|
|
|
| |
| | 100.0 | | 100.0 | | 22,207 | | 17,620 | |
|
|
|
|
|
|
|
| |
| | |
| (a) | North American property, plant and equipment includes US$4,972 million in the United States (2005: US$3,720 million). |
| | |
| I. | Additional Share Options Information |
The related tax benefit recognised in income in relation to share plans for 2006 was US$9 million (2005: US$8 million; 2004: US$4 million). The actual tax benefit realised for the tax deductions from the exercise of options and the vesting of shares totalled US$18 million, US$11 million and US$8 million for the years ended 31 December 2006, 2005 and 2004, respectively. No compensation cost was capitalised as the cost of an asset. At 31 December 2006, the total compensation cost related to the equity-settled share option plans not yet recognised was US$42 million and that cost is expected to be recognised over a weighted-average period of 2.3 years. At the same date, the total compensation cost related to the cash-settled share option plans not yet recognised was US$49 million and that cost is expected to be recognised over a weighted-average period of 2.5 years. Cash received from the exercise of options under all share-based payment plans for the years ended 31 December 2006, 2005 and 2004 was US$84 million, US$92 million and US$19 million respectively. |
A-83
Back to Contents
RIO TINTO GROUP
NOTES TO FINANCIAL STATEMENTS – (continued)
| 48 | RECONCILIATION TO US ACCOUNTING PRINCIPLES CONTINUED |
| | |
| I. | Additional Share Options Information Continued |
| Share option exercises under the Rio Tinto plc Share Option Plan are usually satisfied by the issue of shares from Treasury. Exercises under the Rio Tinto plc Share Savings Plan are satisfied by the issue of new shares. Exercises under the Rio Tinto Ltd Share Option Plan and Rio Tinto Ltd Share Savings Plan are satisfied by the purchase of shares in the market. As a result of this policy, the Group expects to purchase approximately 0.8 million shares during 2007 based upon the assumptions used for valuing the awards. The rules of the share option plans contain various restrictions on the number of shares that may be authorised for awards of share options. In particular, the number of shares that may be allocated for share option awards when added to shares allocated in the previous 10 years may not exceed 10% of ordinary share capital. |
Share savings plans
The key assumptions used in the valuation of the 2004 and 2005 grants are noted in the following table.
| | Risk-free | | Expected | | Dividend | | Employee | | Implied | |
| | interest | | volatility | | yield | | turnover | | option | |
| | rate | | | | | | rate | | lifetime | |
| | % | | % | | % | | % | | (years) | |
|
|
|
|
|
|
|
|
|
| |
| Year ended 31 December 2005 | | | | | | | | | | |
| – Rio Tinto plc | 4.2 | | 32.0 | | 1.9 | | 10.0 | | 2.0-5.2 | |
| – Rio Tinto Limited | 5.3 | | 26.0 | | 1.8 | | 10.0 | | 3.2-5.2 | |
|
|
|
|
|
|
|
|
|
| |
| Year ended 31 December 2004 | | | | | | | | | | |
| – Rio Tinto plc | 4.7-4.8 | | 32.0 | | 2.3 | | 10.0 | | 2.2-5.4 | |
| – Rio Tinto Limited | 5.3-5.4 | | 26.0 | | 2.3 | | 10.0 | | 3.4-5.4 | |
Share option plans
The key assumptions used in the valuation of the 2004 and 2005 grants are noted in the following table.
| | Risk-free | | Expected | | Dividend | | Employee | | Implied | |
| | interest | | volatility | | yield | | turnover | | option | |
| | rate | | | | | | rate | | lifetime | |
| | % | | % | | % | | % | | (years) | |
|
|
|
|
|
|
|
|
|
| |
| Year ended 31 December 2005 | | | | | | | | | | |
| – Rio Tinto plc | 4.9 | | 32.0 | | 2.2 | | 3.0 | | 5.5 | |
| – Rio Tinto Limited | 5.6 | | 26.0 | | 2.1 | | 3.0 | | 6.2 | |
|
|
|
|
|
|
|
|
|
| |
| Year ended 31 December 2004 | | | | | | | | | | |
| – Rio Tinto plc | 4.9 | | 32.0 | | 3.0 | | 5.0 | | 4.7 | |
| – Rio Tinto Limited | 5.7 | | 26.0 | | 2.8 | | 5.0 | | 5.0 | |
The total intrinsic value of options exercised during the year
| | 2006 | | 2005 | | 2004 | |
|
|
|
|
|
| |
| Rio Tinto plc – share savings plan (£'000) | 6,885 | | 2,554 | | 4,743 | |
| Rio Tinto plc – share option plan (£'000) | 33,637 | | 22,894 | | 3,815 | |
| Rio Tinto plc – executive share option scheme (£'000) | — | | — | | 128 | |
| Rio Tinto Limited – share savings plan (A$'000) | 20,090 | | 6,519 | | 248 | |
| Rio Tinto Limited – share option plan (A$'000) | 44,863 | | 10,701 | | 3,152 | |
Details as at 31 December 2006 for vested options and options expected to vest
Based on the number of outstanding awards and the assumptions used in the valuation of those awards, the number of awards vested or expected to vest is as follows:
| | Number | | Weighted | Weighted | | Aggregate | |
| | of | | average | average | | intrinsic | |
| | options | | exercise | remaining | | value | |
| | | | price | contractual | | | |
| | | | | life | | | |
| | | | | (years) | | '000s | |
|
|
|
|
|
|
| |
| Rio Tinto plc – share savings plan | 1,264,290 | | £13.95 | 2.0 | | £16,727 | |
| Rio Tinto plc – share option plan | 3,725,556 | | £15.42 | 6.4 | | £43,813 | |
| Rio Tinto plc – mining companies comparative plan | 995,925 | | n/a | 2.1 | | £27,069 | |
| Rio Tinto Limited – share savings plan | 2,293,235 | | A$34.76 | 2.1 | | A$90,675 | |
| Rio Tinto Limited – share option plan | 2,409,571 | | A$40.71 | 6.3 | | A$80,937 | |
| Rio Tinto Limited – mining companies comparative plan | 652,591 | | n/a | 2.2 | | A$48,488 | |
A-84
Back to Contents
RIO TINTO GROUP
NOTES TO FINANCIAL STATEMENTS – (continued)
| 48 | RECONCILIATION TO US ACCOUNTING PRINCIPLES CONTINUED |
| | |
| J. | SFAS 131 Segmental Disclosures (IFRS) |
| | | | | | | | | | | | | |
| | (a) | | (b) | | (d) | | (e) | | (f) | | (g) | |
| Year to 31 December 2006 | Gross | | Depreciation & | | Tax | | Underlying | | Capital | | Operating | |
| US$m | sales revenue | | amortisation | | charge | | earnings | | expenditure | | assets | |
|
|
|
|
|
|
|
|
|
| |
| Iron Ore | 6,938 | | 387 | | 1,066 | | 2,279 | | 1,969 | | 6,662 | |
| Energy | 4,240 | | 324 | | 240 | | 711 | | 582 | | 2,763 | |
| Industrial Minerals | 2,623 | | 189 | | 85 | | 243 | | 360 | | 2,682 | |
| Aluminium | 3,493 | | 266 | | 319 | | 746 | | 236 | | 3,607 | |
| Copper | 7,079 | | 404 | | 309 | | 3,562 | | 640 | | 3,384 | |
| Diamonds | 838 | | 181 | | 86 | | 205 | | 229 | | 1,056 | |
| Other operations | 229 | | 3 | | 4 | | 33 | | 48 | | 551 | |
| Other items | | | 27 | | (55 | ) | (261 | ) | 169 | | (152 | ) |
| Exploration and evaluation | | | 3 | | (20 | ) | (163 | ) | 77 | | 116 | |
| Net interest | | | | | (18 | ) | (17 | ) | | | | |
|
|
|
|
|
|
|
|
|
|
|
| |
| Total before reconciling items | 25,440 | | 1,784 | | 2,016 | | 7,338 | | 4,310 | | 20,669 | |
| Reconciling items | (2,975 | ) | (275 | ) | 357 | | 100 | | (318 | ) | (2,437 | ) |
|
|
|
|
|
|
|
|
|
|
|
| |
| Totals per the financial statements | 22,465 | | 1,509 | | 2,373 | | 7,438 | | 3,992 | | 18,232 | |
|
|
|
|
|
|
|
|
|
|
|
| |
| | | | | | | | | | | | | |
| | (a) | | (b) | | (d) | | (e) | | (f) | | (g) | |
| Year to 31 December 2005 | Gross | | Depreciation & | | Tax | | Underlying | | Capital | | Operating | |
| US$m | sales revenue | | amortisation | | charge | | earnings | | expenditure | | assets | |
|
|
|
|
|
| |
| Iron Ore | 5,497 | | 315 | | 859 | | 1,722 | | 1,229 | | 4,574 | |
| Energy | 3,867 | | 305 | | 314 | | 733 | | 412 | | 2,301 | |
| Industrial Minerals | 2,487 | | 172 | | 115 | | 187 | | 235 | | 2,311 | |
| Aluminium | 2,744 | | 274 | | 156 | | 392 | | 242 | | 3,361 | |
| Copper | 4,839 | | 337 | | 403 | | 2,020 | | 501 | | 2,784 | |
| Diamonds | 1,076 | | 162 | | 160 | | 281 | | 203 | | 1,085 | |
| Other operations | 232 | | 34 | | 1 | | 40 | | 31 | | 167 | |
| Other items | | | 13 | | (128 | ) | (202 | ) | 41 | | (304 | ) |
| Exploration and evaluation | | | 3 | | (16 | ) | (174 | ) | 42 | | (18 | ) |
| Net interest | | | | | (17 | ) | (44 | ) | | | | |
|
|
|
|
|
|
|
|
|
|
|
| |
| Total before reconciling items | 20,742 | | 1,615 | | 1,847 | | 4,955 | | 2,936 | | 16,261 | |
| Reconciling items | (1,709 | ) | (281 | ) | (33 | ) | 260 | | (346 | ) | (1,313 | ) |
|
|
|
|
|
|
|
|
|
|
|
| |
| Totals per the financial statements | 19,033 | | 1,334 | | 1,814 | | 5,215 | | 2,590 | | 14,948 | |
|
|
|
|
|
|
|
|
|
|
|
| |
| | | | | | | | | | | | | |
| | (a) | | (b) | | (d) | | (e) | | (f) | | | |
| Year to 31 December 2004 | Gross | | Depreciation & | | Tax | | Underlying | | Capital | | | |
| US$m | sales revenue | | amortisation | | charge | | earnings | | expenditure | | | |
|
|
|
|
|
| |
| Iron Ore | 3,009 | | 289 | | 259 | | 565 | | 935 | | | |
| Energy | 3,008 | | 303 | | 129 | | 431 | | 244 | | | |
| Industrial Minerals | 2,126 | | 173 | | 84 | | 243 | | 248 | | | |
| Aluminium | 2,356 | | 190 | | 139 | | 331 | | 505 | | | |
| Copper | 3,033 | | 281 | | 77 | | 860 | | 326 | | | |
| Diamonds | 744 | | 108 | | 117 | | 188 | | 152 | | | |
| Other operations | 254 | | 47 | | 8 | | 56 | | 19 | | | |
| Other items | | | 6 | | (99 | ) | (205 | ) | 2 | | | |
| Exploration and evaluation | | | 2 | | (8 | ) | (128 | ) | | | | |
| Net interest | | | | | (30 | ) | (69 | ) | | | | |
|
|
|
|
|
|
|
|
|
|
|
| |
| Total before reconciling items | 14,530 | | 1,399 | | 676 | | 2,272 | | 2,431 | | | |
| Reconciling items | (1,576 | ) | (228 | ) | (57 | ) | 1,025 | | (172 | ) | | |
|
|
|
|
|
|
|
|
|
|
|
| |
| Totals per the financial statements | 12,954 | | 1,171 | | 619 | | 3,297 | | 2,259 | | | |
|
|
|
|
|
|
|
|
|
|
|
| |
Rio Tinto's management structure is based on the principal product groups shown above. The product groups represent the Group's segments for the purposes of SFAS 131 'Disclosures about segments of an enterprise and related information'. The chief executive of each product group reports to the chief executive of Rio Tinto. Generally, business units are allocated to product groups based on their primary product. The Energy group includes both coal and uranium businesses. The main products of the industrial minerals group are borates, talc, salt and titanium dioxide feedstock. The Copper group includes certain gold operations in addition to copper operations.
| a) | Gross sales revenue |
| | Product group gross sales revenue includes 100 per cent of subsidiaries' sales revenue and the Group's share of the sales revenue of equity accounted units. There are minimal sales between product groups. The reconciling item is Rio Tinto's share of the sales revenue of equity accounted units, which is deducted in arriving at consolidated sales revenue as shown on the income statement. |
| | |
| b) | Depreciation and amortisation |
| | Product group totals of depreciation include 100 per cent of subsidiaries' depreciation and amortisation and include Rio Tinto's share of the depreciation and amortisation of equity accounted units. The reconciling item is Rio Tinto's share of the depreciation and amortisation charge of equity accounted units. This is deducted in arriving at the depreciation and amortisation charge for the Group which is shown in note 3 to the financial statements. These figures exclude impairment charges, which are included in c), below. |
| | |
| c) | Items excluded from Underlying earnings |
| | Product group pre tax totals for significant non cash items excluded from Underlying earnings in 2006 comprise net impairment reversals of US$396 million and an exceptional reduction in environmental provisions of US$37 million. In 2005, product group pre tax totals for significant non cash items excluded from Underlying earnings comprise net impairment reversals of US$3 million and an exceptional reduction in environmental provisions of US$84 million. In 2004, there were net impairment charges of US$558 million, of which US$548 million related to accelerated depreciation. Other items excluded from Underlying earnings are gains on disposals of businesses. |
A-85
Back to Contents
RIO TINTO GROUP
NOTES TO FINANCIAL STATEMENTS – (continued)
| 48 | RECONCILIATION TO US ACCOUNTING PRINCIPLES CONTINUED |
| | |
| J. | SFAS 131 Segmental Disclosures (IFRS) Continued |
| | | | | | | | | | | | | | | | | | | |
| | Other | | | | | | Other | | | | | | Other | | | | | |
| | significant | | | | | | significant | | | | | | significant | | | | | |
| | non cash | | Other | | | | non cash | | Other | | | | non cash | | Other | | | |
| | items | | exclusions | | Total | | items | | exclusions | | Total | | items | | exclusions | | Total | |
| | 2006 | | 2006 | | 2006 | | 2005 | | 2005 | | 2005 | | 2004 | | 2004 | | 2004 | |
| | US$m | | US$m | | US$m | | US$m | | US$m | | US$m | | US$m | | US$m | | US$m | |
|
|
|
|
|
|
|
|
|
|
|
|
|
|
|
|
|
| |
| Iron Ore | 298 | | | | 298 | | | | 85 | | 85 | | | | | | | |
| Energy | (188 | ) | | | (188 | ) | (13 | ) | | | (13 | ) | (160 | ) | 64 | | (96 | ) |
| Industrial Minerals | (7 | ) | | | (7 | ) | 16 | | | | 16 | | | | | | | |
| Aluminium | | | 5 | | 5 | | | | 11 | | 11 | | | | 4 | | 4 | |
| Copper | 647 | | | | 647 | | 84 | | 30 | | 114 | | (398 | ) | 976 | | 578 | |
| Diamonds | (317 | ) | | | (317 | ) | | | | | | | | | | | | |
|
|
|
|
|
|
|
|
|
|
|
|
|
|
|
|
|
| |
| | 433 | | 5 | | 438 | | 87 | | 126 | | 213 | | (558 | ) | 1,044 | | 486 | |
| Other gains on disposal | | | | | | | | | 196 | | 196 | | | | 136 | | 136 | |
| | | | | | | | | | | | | | | | | | | |
| Exchange gains and losses excluded from Underlying earnings | | | 83 | | 83 | | | | (191 | ) | (191 | ) | | | 224 | | 224 | |
|
|
|
|
|
|
|
|
|
|
|
|
|
|
|
|
|
| |
| Pre tax total excluded from Underlying earnings | 433 | | 88 | | 521 | | 87 | | 131 | | 218 | | (558 | ) | 1,404 | | 846 | |
|
|
|
|
|
|
|
|
|
|
|
|
|
|
|
|
|
| |
| Tax on items excluded from Underlying earnings | | | | | (357 | ) | | | | | 33 | | | | | | 57 | |
| Outside interests on items excluded from | | | | | | | | | | | | | | | | | | |
| underlying earnings | | | | | (64 | ) | | | | | 9 | | | | | | 122 | |
| | | | |
|
| | | | |
|
| | | | |
| |
| Total excluded from underlying earnings | | | | | 100 | | | | | | 260 | | | | | | 1,025 | |
| | | | |
|
| | | | |
|
| | | | |
| |
| | |
| d) | Tax charge |
| The reconciling item is the tax on amounts that are excluded in arriving at Underlying Earnings. These amounts excluded in arriving at Underlying Earnings are included in (c) above. Within product groups, tax of subsidiaries is stated before tax on finance items but after tax on the amortisation of the discount related to provisions. The tax charge excludes tax on the earnings of equity accounted units. |
| Due to improved prospects for future earnings from the Group's US operations, the Group recongised in 2006 additional deferred tax assets of US$335 million, of which US$303 million was allocated to the copper product group and US$32 million was allocated to other product groups. |
| | |
| e) | Underlying earnings |
| The reconciling items are the amounts shown in note c) above, post tax and minority interests. These amounts are excluded from Underlying earnings attributable to product groups. The total after reconciling items is ‘net earnings’, which is shown on the face of the income statement. |
| Product group earnings include earnings of subsidiaries stated before finance items but after the amortisation of the discount related to provisions. Earnings attributable to equity accounted units include interest charges and amortisation of discount. |
| Rio Tinto's share of the profit after tax of equity accounted units of US$1,378 million is shown on the income statement. This amount is attributable US$1,271 million to the copper product group and US$107 million to other product groups and is included in product group underlying earnings (2005: US$660 million to the copper group and US$116 million to other product groups; 2004: US$495 million to the copper group and US$28 million to other product groups). |
| | |
| f) | Capital expenditure |
| Product Group capital expenditure comprises the net cash outflow on purchases less disposals of property, plant and equipment and intangible assets other than capitalised exploration, which is attributed to the exploration and evaluation product group. The product group totals include 100 per cent of subsidiaries' capital expenditure and Rio Tinto's share of the capital expenditure of equity accounted units. The reconciling item is the net of Rio Tinto’s share of the capital expenditure of equity accounted units, which is excluded in arriving at the outflow for purchase of property, plant & equipment and intangible assets in the cash flow statement, and US$37 million (2005: US$36 million; 2004: US$41 million) for the proceeds of disposals of property, plant and equipment and intangible assets which are shown separately in the cash flow statement. |
| | |
| g) | Operating assets |
| Product group totals of operating assets include the net assets of subsidiaries before deducting net debt, less outside shareholders' interests, which are calculated by reference to the net assets of the relevant companies (i.e. net of such companies' debt). For equity accounted units, Rio Tinto's net investment is included. The reconciling item is the Group's net debt which is deducted in arriving at the net assets attributable to Rio Tinto shareholders in the balance sheet. In 2006, Rio Tinto's share of investment in equity accounted units is attributable US$1,385 million to the copper product group, US$878 million to the aluminium product group and US$123 million to other product groups (2005: US$1,063 million to the copper product group, US$849 million to the aluminium product group and US$76 million to other product groups). |
A-86
Back to Contents
Australian Corporations Act— summary of ASIC relief
| Pursuant to section 340 of the Corporations Act 2001 ("Corporations Act"), the Australian Securities and Investments Commission issued an ordered dated 27 January 2006 (as amended on 22 December 2006) that granted relief to Rio Tinto Limited from certain requirements of the Corporations Act in relation to the Company's financial statements and associated reports. The order essentially continues the relief that has applied to Rio Tinto Limited since the formation of the Group's Dual Listed Companies ("DLC") structure in 1995. The order applied to Rio Tinto Limited's financial reporting obligations for financial years and half-years ending between 31 December 2005 and 31 December 2009 (inclusive) |
| | |
| In essence, instead of being required under the Corporations Act to prepare consolidated financial statements covering only itself and its controlled entities, the order allows Rio Tinto Limited to prepare consolidated financial statements in which it, Rio Tinto plc and their respective controlled entities are treated as a single economic entity. In addition, those consolidated financial statements are to be prepared: |
| | |
| – | in accordance with the principles and requirements of International Financial Reporting Standards as adopted by the European Union ("EU IFRS") rather than the Australian equivalents of International Financial Reporting Standards ("AIFRS") (except for one limited instance in the case of any concise report), and in accordance with United Kingdom financial reporting obligations generally; |
| | |
| – | on the basis that the transitional provisions of International Financial Reporting Standard 1 "First-time Adoption of International Financial Reporting Standards" should be applied using the combined financial statements previously prepared for Rio Tinto Limited, Rio Tinto plc and their respective controlled entities under Generally Accepted Accounting Principles in the United Kingdom, under which the DLC merger between Rio Tinto Limited and Rio Tinto plc was accounted for using "merger", rather than "acquisition", accounting (reflecting that neither Rio Tinto Limited nor Rio Tinto plc was acquired by, or is controlled by, the other, and meaning that the existing carrying amounts, rather than fair values, of assets and liabilities at the time of the DLC merger were used to measure those assets and liabilities at formation); |
| | |
| – | on the basis that Rio Tinto Limited and Rio Tinto plc are a single company (with their respective shareholders being the shareholders in that single company); and |
| | |
| – | with a reconciliation, from EU IFRS to AIFRS, of the following amounts: consolidated profit for the financial year, total consolidated recognised income for the financial year and total consolidated equity at the end of the financial year (see page A-5). |
| | |
| Those consolidated financial statements must also be audited in accordance with relevant United Kingdom requirements. Rio Tinto Limited must also prepare a directors' report which satisfies the content requirements of the Corporations Act (applied on the basis that the consolidated entity for those purposes is the Group), except that the order allows Rio Tinto Limited to prepare a separate Remuneration report that is merely cross-referenced in the directors' report, instead of including in the Directors' report the Remuneration report otherwise required by the Corporations Act. The separate Remuneration report (see pages 95 to 121) must include all the information required to be included in a remuneration report under the Corporations Act, as well as the information required by AIFRS (namely, AASB 124) dealing with compensation of directors and executives who are "key management personnel", and certain other disclosures. |
| | |
| Rio Tinto Limited is also required to comply generally with the lodgement and distribution requirements of the Corporations Act (including timing requirements) in relation to those consolidated financial statements (including any concise financial statements), the auditor's report and the directors' report. The separate Remuneration report is also required to be lodged with the Australian Securities and Investments Commission at the same time as the consolidated financial statements, and Rio Tinto Limited must not distribute or make available the Remuneration report without the consolidated financial statements and directors' report. At the Company's AGM, it is required to allow shareholders to vote on a non binding resolution to adopt the Remuneration report, on the same basis as would otherwise be required for a Remuneration report under the Corporations Act. |
| | |
| Rio Tinto Limited is not required to prepare separate consolidated financial statements solely for it and its controlled entities. Rio Tinto Limited is required to prepare and lodge parent entity financial statements for itself in respect of each relevant financial year, in accordance with the principles and requirements of AIFRS (other than in respect of key management personnel compensation disclosures under AASB 124, which as noted above are instead incorporated into the separate Remuneration report), and to have those statements audited. Those financial statements are not required to be laid before the Company's AGM or distributed to shareholders as a matter of course. |
| | |
| However, Rio Tinto Limited must: |
| – | include in the consolidated financial statements for the Group, as a note, Rio Tinto Limited's parent entity balance sheet, income statement, statement of changes in equity and statement of cashflows, prepared in accordance with AIFRS; and |
| | |
| – | make available the full parent entity financial statements free of charge to shareholders on request, and also include a copy of them on the Company's website. |
| | |
| The parent entity financial statements are available for download from the Rio Tinto website at www.riotinto.com. Shareholders may also request a copy free of charge by contacting the Rio Tinto Limited company secretary. |
A-87
Back to Contents
Report of Independent Registered Public Accounting Firms
To the Boards of Directors and Shareholders of Rio Tinto plc and Rio Tinto Limited:
We have completed an integrated audit of the Rio Tinto Group’s 31 December 2006 consolidated financial statements and of its internal control over financial reporting as of 31 December 2006 and an audit of its 31 December 2005 and 31 December 2004 consolidated financial statements in accordance with the standards of the Public Company Accounting Oversight Board (United States). Our opinions, based on our audits, are presented below.
Consolidated financial statements
In our opinion, the accompanying consolidated income statements and the related consolidated balance sheets, consolidated statements of cash flows and consolidated statements of recognised income and expense present fairly, in all material respects, the financial position of the Rio Tinto Group at 31 December 2006 and 31 December 2005 and the results of their operations and cash flows for each of the three years in the period ended 31 December 2006, in conformity with International Financial Reporting Standards (IFRS) as adopted by the European Union. These financial statements are the responsibility of Rio Tinto Group's management. Our responsibility is to express an opinion on these financial statements based on our audits. We conducted our audits of these financial statements in accordance with the standards of the Public Company Accounting Oversight Board (United States). Those standards require that we plan and perform the audit to obtain reasonable assurance about whether the financial statements are free of material misstatement. An audit of financial statements includes examining, on a test basis, evidence supporting the amounts and disclosures in the financial statements, assessing the accounting principles used and significant estimates made by management, and evaluating the overall financial statements presentation. We believe that our audits provide a reasonable basis for our opinion.
IFRS as adopted by the European Union vary in certain significant respects from accounting principles generally accepted in the United States of America. Information relating to the nature and effect of such differences is presented in Note 48 to the consolidated financial statements.
As discussed under the heading "Basis of preparation" on page A-7 in Note 1 to the consolidated financial statements, as a result of adopting IAS 21, IAS 39 and IFRS 5 on 1 January 2005, the Group changed its method of accounting for financial instruments and non-current assets held for sale. In line with the relevant transitional provisions, the prior period comparatives have not been re-stated.
Internal control over financial reporting
Also, in our opinion, management’s assessment, included in the accompanying "Management's Report on Internal Control over Financial Reporting” as set out in item 15 on page 147, that the Rio Tinto Group maintained effective internal control over financial reporting as of 31 December 2006 based on criteria established in ‘Internal Control– Integrated Framework’ issued by the Committee of Sponsoring Organizations of the Treadway Commission (COSO), is fairly stated, in all material respects, based on those criteria. Furthermore, in our opinion, the Rio Tinto Group maintained, in all material respects, effective internal control over financial reporting as of 31 December 2006, based on criteria established in "Internal Control– Integrated Framework" issued by the COSO. The Group’s management is responsible for maintaining effective internal control over financial reporting and for its assessment of the effectiveness of internal control over financial reporting. Our responsibility is to express opinions on management’s assessment and on the effectiveness of the Group’s internal control over financial reporting based on our audit.
We conducted our audit of internal control over financial reporting in accordance with the standards of the Public Company Accounting Oversight Board (United States). Those standards require that we plan and perform the audit to obtain reasonable assurance about whether effective internal control over financial reporting was maintained in all material respects. An audit of internal control over financial reporting includes obtaining an understanding of internal control over financial reporting, evaluating management’s assessment, testing and evaluating the design and operating effectiveness of internal control, and performing such other procedures as we consider necessary in the circumstances. We believe that our audit provides a reasonable basis for our opinions.
A company’s internal control over financial reporting is a process designed to provide reasonable assurance regarding the reliability of financial reporting and the preparation of financial statements for external purposes in accordance with generally accepted accounting standards and principles. A company’s internal control over financial reporting includes those policies and procedures that (i) pertain to the maintenance of records that, in reasonable detail, accurately and fairly reflect the transactions and dispositions of the assets of the company; (ii) provide reasonable assurance that transactions are recorded as necessary to permit preparation of financial statements in accordance with generally accepted accounting standards and principles, and that receipts and expenditures of the company are being made only in accordance with authorisations of management and directors of the company; and (iii) provide reasonable assurance regarding prevention or timely detection of unauthorised acquisition, use, or disposition of the company’s assets that could have a material effect on the financial statements.
Because of its inherent limitations, internal control over financial reporting may not prevent or detect misstatements. Also, projections of any evaluation of effectiveness to future periods are subject to the risk that controls may become inadequate because of changes in conditions, or that the degree of compliance with the policies or procedures may deteriorate.
| | |
| /s/ PricewaterhouseCoopers LLP | /s/ PricewaterhouseCoopers LLP |
| PricewaterhouseCoopers LLP | PricewaterhouseCoopers |
| Chartered Accountants | Chartered Accountants |
| London, United Kingdom | Perth, Australia |
| 27 June 2007 | 27 June 2007 |
| In respect of the Board of Directors and Shareholders of Rio Tinto plc | In respect of the Board of Directors and Shareholders of Rio Tinto Limited |
A-88
Back to Contents
MINERA ESCONDIDA LIMITADA
Financial Statements
June 30, 2006 and 2005
(With Independent Auditor’s Report Thereon)
A-89
Back to Contents
MINERA ESCONDIDA LIMITADA
CONTENTS
A-90
Back to Contents
Independent Auditors’ Report
The Owners
Minera Escondida Limitada:
We have audited the accompanying balance sheets of Minera Escondida Limitada as of June 30, 2006 and 2005, and the related statements of income, equity, and cash flows for the years then ended. These financial statements are the responsibility of the Company’s management. Our responsibility is to express an opinion on these financial statements based on our audits.
We conducted our audits in accordance with auditing standards generally accepted in the United States of America. Those standards require that we plan and perform the audit to obtain reasonable assurance about whether the financial statements are free of material misstatement. An audit includes consideration of internal control over financial reporting as a basis for designing audit procedures that are appropriate in the circumstances, but not for the purpose of expressing an opinion on the effectiveness of the Company’s internal control over financial reporting. Accordingly, we express no such opinion. An audit includes examining, on a test basis, evidence supporting the amounts and disclosures in the financial statements. An audit also includes assessing the accounting principles used and significant estimates made by management, as well as evaluating the overall financial statement presentation. We believe that our audits provide a reasonable basis for our opinion.
In our opinion, the financial statements referred to above present fairly, in all material respects, the financial position of Minera Escondida Limitada as of June 30, 2006 and 2005, and the results of its operations and its cash flows for the years then ended in conformity with accounting principles generally accepted in the United States of America.
/s/ KPMG Ltda.
Santiago, Chile
15 October 2006
A-91
Back to Contents
MINERA ESCONDIDA LIMITADA
Balance Sheets
June 30, 2006 and 2005
(in thousands of USD)