The Group’s financial statements have been prepared in accordance with generally accepted accounting principles in the United Kingdom (‘UK GAAP’), which differ in certain respects from those in the United States ('US GAAP'). These differences relate principally to the following items, and the effect of each of the adjustments to net earnings and shareholders' funds that would be required under US GAAP is set out on this and the preceding page.
Back to Contents
RIO TINTO PLC - RIO TINTO LIMITED
NOTES TO FINANCIAL STATEMENTS - (continued)
42 Reconciliation to US Accounting Principles (continued)
Mark to market of derivative contracts
The Group is party to derivative contracts in respect of some of its future transactions in order to hedge its exposure to fluctuations in exchange rates against the US dollar. Under UK GAAP, these contracts are accounted for as hedges: gains and losses are deferred and subsequently recognised when the hedged transaction occurs. Under FAS 133 ' Accounting for Derivative Instruments and Hedging Activities', which applied to Rio Tinto from 1 January 2001, all derivative instruments are included in the balance sheet as assets or liabilities measured at fair value. Certain of the Group's derivative contracts do not qualify for hedge accounting under FAS 133, principally because the hedge is not located in the entity with the relevant exposure. Unrealised pre-tax gains for the Rio Tinto Group of US$182 million (2002: US$148 million), US$115 million after tax and minorities (2002: US$104 million after tax and minorities), on such derivatives have therefore been recorded in US GAAP earnings. Realised gains of US$105 million pre tax (2002: US$9 million pre tax), US$75 million after tax and minorities, (2002: US$6 million after tax and minorities), which have been capitalised under UK GAAP have also been recorded in earnings under US GAAP.
Adjustments to asset carrying values
Following the implementation of FRS 11 in 1998, impairment of fixed assets under UK GAAP is recognised and measured by reference to the discounted cash flows expected to be generated by an income generating unit. Under US GAAP, impairment is recognised only when the anticipated undiscounted cash flows are insufficient to recover the carrying value of the income generating unit. Where an asset is found to be impaired under US GAAP, the amount of such impairment is generally similar under US GAAP to that computed under UK GAAP, except where the US GAAP carrying value includes additional goodwill. Under UK GAAP, impairment provisions may be written back in a future year if the expected recoverable amount of the asset increases. Such write backs of provisions are not permitted under US GAAP. Therefore, any credits to UK GAAP earnings resulting from such write backs are reversed in the reconciliation to US GAAP. The adjustment to asset carrying values for the Rio Tinto Group in 2003 under US GAAP, of US$32 million, relates to the reversal of a credit made to UK GAAP earnings on the write back of an impairment provision.
The asset write downs for the Rio Tinto Group in 2002, under US GAAP, include amounts recognised in 2001 under UK GAAP of US$445 million and excludes asset write downs recognised in 2002 under UK GAAP of US$235 million. The 2002 Rio Tinto Group US GAAP asset write downs also include an adjustment for goodwill. The 2002 US GAAP impairment write-down for the Rio Tinto Group was US$1,067 million pre-tax (US$1,060 million net of tax and minorities). This is US$89 million pre-tax (US$297 million net of tax and minorities) above the charge of US$978 million pre-tax (US$763 million net of tax and minorities) included under UK GAAP. The asset write downs for Rio Tinto plc in 2002, under US GAAP, include amounts recognised in 2001 under UK GAAP, of US$445 million. The 2002 Rio Tinto plc asset write downs also include an adjustment for goodwill. The 2002 US GAAP impairment write-down for Rio Tinto plc was US$1,059 million pre-tax (US$1,052 million net of tax and minorities). This is US$420 million pre-tax (US$429 million net of tax and minorities) above the charge of US$639 million pre-tax (US$623 million net of tax and minorities) included under UK GAAP.
The asset write downs for Rio Tinto Limited in 2002, under US GAAP, exclude asset write downs recognised in 2002 under UK GAAP of US$212 million. The 2002 US GAAP impairment write-down for Rio Tinto Limited was US$13 million pre-tax (US$13 million net of tax and minorities). This is US$420 million pre-tax (US$212 million net of tax and minorities) below the charge of US$433 million pre-tax (US$225 million net of tax and minorities) included under UK GAAP. The 2001 US GAAP impairment write-down is US$243 million pre tax for the Rio Tinto Group, US$199 million pre tax for Rio Tinto plc and US$71 million pre tax for Rio Tinto Limited (Rio Tinto Group: US$183 million net of tax and minorities). For the Rio Tinto Group and for Rio Tinto plc this is US$472 million pre-tax (Rio Tinto Group: US$400 million net of tax and minorities) below the charges of US$715 million and US$671 million pre-tax included under UK GAAP for the Rio Tinto Group and Rio Tinto plc respectively (Rio Tinto Group: US$583 million net of tax and minorities). The net difference of US$468 million related to asset write-downs for the Rio Tinto Group and Rio Tinto plc comprises the above US$472 million, offset by US$4 million (Rio Tinto Group: US$3 million net of tax and minorities) of additional current year amortisation related to US GAAP adjustments made in previous years.
Pensions/post retirement benefits
Under UK GAAP, post retirement benefits are accounted for in accordance with Statement of Standard Accounting Practice 24. The expected costs under defined benefit arrangements are spread over the service lives of employees entitled to those benefits. Variations from the regular cost are spread on a straight line basis over the expected average remaining service lives of relevant current employees. Under US GAAP, the annual pension cost comprises the estimated cost of benefits accruing in the period adjusted for the amortisation of the surplus arising when FAS 87, 'Employers' Accounting for Pensions', was adopted. The charge is further adjusted to reflect the cost of benefit improvements and any surpluses/deficits that emerge as a result of variances from actuarial assumptions. For US purposes, only those surpluses/deficits outside a ten per cent fluctuation 'corridor' are spread.
The reductions in shareholders' funds at 31 December 2003, 2002 and 2001 also include the effect of the US GAAP requirement to make immediate provision for pension fund deficits through other comprehensive income. The provision reflects the reduction in equity values over recent years.
Mandatory implementation of FRS 17, 'Retirement Benefits', has been delayed until 2005 but additional disclosures are required for 2001 onwards, which are included in note 14 to the financial statements.
Exploration and evaluation
Under UK GAAP, expenditure on a project can be carried forward after it has reached a stage where there is a high degree of confidence in its viability. US GAAP does not allow expenditure to be carried forward unless the viability of the project is supported by a final feasibility study. In addition, under UK GAAP, provisions made against exploration and evaluation in prior years can be reversed when the project proceeds to development, to the extent that the relevant costs are recoverable. US GAAP does not allow such provisions to be reversed.
Share option plans
Under UK GAAP, no cost is accrued where the option scheme applies to all relevant employees and the intention is to satisfy the share options by the issuance of new shares. Under the fair value recognition provisions of FAS 123, ' Accounting for Stock-Based Compensation', the fair value of the plans is determined using an option pricing model.
A-61
Back to Contents
RIO TINTO PLC - RIO TINTO LIMITED
NOTES TO FINANCIAL STATEMENTS - (continued)
42 Reconciliation to US Accounting Principles (continued)
Effect of historical average commodity prices in ore reserve determination
For UK and Australian reporting, the Group’s ore reserve estimates are determined in accordance with the JORC code and are based on forecasts of future commodity prices. During 2003, the SEC formally indicated that, for US reporting, historical price data should be used. The application of historical prices has led to reduced ore reserve quantities for US reporting purposes for certain of the Group’s operations, which results in lower earnings for US reporting, largely as a result of higher depreciation charges. The reduced ore reserves also had the effect of increasing the present value of the provision for close down costs, which increased the cumulative effect of the change in accounting principle recorded on implementation of FAS 143 in the US GAAP reconciliation for 2003.
Details of the differences in ore reserves used for US reporting are set out on page A-75.
Provisions for close down and restoration costs
FAS 143 'Accounting for Asset Retirement Obligations' has been implemented with effect from 1 January 2003. Under this US standard, provision is made in the accounting period when the related environmental disturbance occurs, based on the net present value of estimated future costs. The costs so recognised are capitalised and depreciated over the estimated useful life of the related asset. In each subsequent year, the discount applied to the provision 'unwinds', resulting in a charge to the profit and loss account for the year and an increase in the present value of the provision. This accounting treatment is broadly similar to Rio Tinto's established policy under UK GAAP. Consequently, the pre tax adjustment to the 'Provision for close down and restoration costs' included in the above reconciliation at 31 December 2002 has now been substantially reduced through the cumulative effect of this change in accounting principle.
Higher cost of sales resulting from acquisition accounting
Under UK GAAP, the inventories of acquired companies are valued at the lower of replacement cost and net realisable value. Under US GAAP, such inventories are recognised at the time of acquisition on the basis of expected net sales proceeds. 2001 earnings are lower under US GAAP as a result of the higher cost of sales relating to inventories that were held at the date of acquisition. There is no effect on 2003 or 2002 earnings.
Start up costs
Under US GAAP, Statement of Position 98-5, 'Reporting on the Costs of Start-up Activities', requires that the costs of start up activities are expensed as incurred. Under UK GAAP, some of these start up costs qualify for capitalisation and are amortised over the economic lives of the relevant assets.
Proposed dividends
Under UK GAAP, ordinary dividends are recognised in the financial year in respect of which they are paid. Under US GAAP, such dividends are not recognised until they are formally declared by the board of directors or approved by the shareholders.
Other
Other adjustments include amounts relating to differences between UK and US accounting principles in respect of depreciation of mining assets, revenue recognition and unrealised holding gains and losses.
Depreciation of mining assets - Under UK GAAP, mining assets are fully depreciated over their economic lives or the remaining life of the mine if shorter. In some cases, mineral resources that do not yet have the status of reserves are taken into account in determining depreciation charges, where there is a high degree of confidence that they will be mined economically. For US GAAP, only 'proven and probable reserves' are taken into account in the calculation of depreciation, depletion and amortisation charges. As a result, adjustments have been made to depreciation reducing Rio Tinto Group US GAAP pre tax earnings by US$59 million (2002: US$10 million, 2001: US$6 million), reducing Rio Tinto Plc pre tax earnings by US$12 million (2002: US$3 million increase, 2001: US$3 million increase) and reducing Rio Tinto Limited pre tax earnings by US$75 million (2002: US$20 million, 2001: US$15 million).
Revenue recognition - Staff Accounting Bulletin No. 101 ('SAB 101') 'Revenue Recognition in Financial Statements' has the result that, in some cases, sales recorded as revenue under UK GAAP are deferred and are not recognised as revenue under US GAAP until a future accounting period. Occasionally, sales of goods recorded as revenue for UK GAAP purposes may be kept in store by Rio Tinto at the request of the buyer. Under US GAAP, such transactions cannot be recognised as revenue unless the goods are physically segregated from the supplier's other inventory and certain additional criteria are met. In 2003, such timing differences resulted in a reduction in Rio Tinto Group US GAAP pre tax earnings of US$17 million (2002: US$4 million increase, 2001: US$5 million increase). The timing differences reduced Rio Tinto plc pre tax earnings by US$19 million (2002: US$2 million increase, 2001: US$4 million increase); and increased Rio Tinto Ltd's pre tax earnings by US$3 million (2002: US$4 million increase, 2001: US$1 million increase).
Unrealised holding gains and losses - UK GAAP permits current asset investments to be valued at the lower of cost and net realisable value. Under US GAAP, FAS 115 requires that unrealised holding gains and losses on investments classified as 'available for sale' are reported within a separate component of shareholders' funds and excluded from earnings until realised.
Taxation
Under UK GAAP, provision for taxes arising on remittances of earnings can only be made if the dividends have been accrued or if there is a binding agreement for the distribution of the earnings. Under US GAAP, provision must be made for tax arising on expected future remittances of past earnings. Under UK GAAP, deferred tax is not provided in respect of upward fair value adjustments to tangible fixed assets and inventories made on acquisitions. Under US GAAP, deferred tax must be provided on all fair value adjustments to non-monetary assets recorded on acquisition with a consequential increase in the amount allocated to mining properties or goodwill as appropriate. Under UK GAAP, tax benefits associated with goodwill charged directly to reserves in 1997 and previous years, must be accumulated in the deferred tax provision. This means that the tax benefits are not included in earnings until the related goodwill is charged through the profit and loss account on disposal or closure. For US GAAP, no provision is required for such deferred tax because the goodwill that gave rise to these tax benefits was capitalised and gives rise to amortisation charges against profit.
Profit contribution from equity accounted operations
Under US GAAP, investments in affiliates are accounted for using the equity method, and the reporting entity's share of the after tax profits and losses of its affiliates is included in the income statement as a single line item. Under UK GAAP, the reporting entity's share of the trading results of its associates and joint ventures is split in the profit and loss account between its share of their operating profits/losses, interest receivable/payable and taxation.
The Group's share of the after tax profits and losses of associates and joint ventures is shown in its 'Statement of Total Recognised Gains and Losses'.
A-62
Back to Contents
RIO TINTO PLC - RIO TINTO LIMITED
NOTES TO FINANCIAL STATEMENTS - (continued)
42 Reconciliation to US Accounting Principles (continued)
Consolidated statement of cash flows
The consolidated statement of cash flows prepared in accordance with FRS 1 (revised) presents substantially the same information as that required under US GAAP. Under US GAAP, however, there are certain differences from UK GAAP with regard to the classification of items within the cash flow statement and with regard to the definition of cash and cash equivalents. Under US GAAP, tax paid and interest would form part of operating cash flow. Similarly, deferred stripping costs which are shown as capital expenditure under UK GAAP are included in operating cash flow for the purposes of the US GAAP cash flow disclosure. Under UK GAAP, cash for the purposes of the cash flow statement is defined as cash in hand and deposits repayable on demand with any qualifying financial institution, less bank borrowings from any qualifying financial institution repayable on demand. Deposits are repayable on demand if they can be withdrawn at any time without notice and without penalty or if a maturity or period of notice of not more than 24 hours or one working day has been agreed. Under US GAAP, cash equivalents comprise cash balances and current asset investments with an original maturity of less than three months and exclude bank borrowings repayable on demand.
Adjusted earnings
As permitted under UK GAAP, adjusted earnings and adjusted earnings per share have been presented excluding the impact of exceptional items to provide a measure that reflects the underlying performance of the Group. This is in addition to the presentation of earnings and earnings per share, which include the exceptional items. In accordance with US GAAP, earnings and earnings per share have been presented based on US GAAP earnings, without adjustment for the impact of exceptional items. Such additional measures of underlying performance are not permitted under US GAAP.
Guarantor's Accounting
Under US GAAP there is a requirement for entities to recognise, upon issue of a guarantee, an initial liability for the fair value, or market value, of the associated obligation with disclosure of that information in its interim and annual financial statements. FIN 45 is effective, on a prospective basis, to guarantees issued or modified after 31 December 2002. The disclosure requirements of FIN 45 apply to these accounts and the following information is given in response to these.
Note 29 to the financial statements discloses indemnities and other performance guarantees totalling US$266 million on which no material loss is expected. This includes US$19 million relating to the Group's commitment to pay deferred consideration in relation to acquisitions of mining properties in 2002 and previous years. This does not include guarantees of payment of US$266 million entered into by the Group relating to deferred consideration arising from such acquisitions because the deferred consideration has been recognised as a liability within the Group's balance sheet. The disclosure in note 29 also includes guarantees for up to US$140 million relating to the costs of infrastructure financed by certain government authorities, which would be subject to reimbursement by the Group if the facilities are not completed or certain tests relating to the related project are not met. Of the remaining US$107 million disclosed in note 29, US$32 million would be subject to reimbursement by a third party in the event that the Group was required to make payment under the guarantees.
In addition to the above, the Group has issued guarantees and indemnities totalling US$652 million relating to its close down, restoration and environmental remediation obligations. These are not disclosed as contingent liabilities because the obligations are included in the amounts recognised in the balance sheet as provisions for liabilities and charges.
A Group company has guaranteed that the quality of product from a joint venture in which it participates will be in accordance with agreed specifications. It has also undertaken to make up any shortfalls from minimum ore reserve quantities over the life of the joint venture. Currently, no shortfalls are anticipated.
As explained in note 14 to the financial statements, the Group has a partnership interest in the Colowyo Coal Company and has undertaken, via a subsidiary company which entered into a management agreement, to cause the partnership to perform its obligations under certain coal supply contracts. The debt of US$163 million owed by the Colowyo Coal Company is to be serviced and repaid out of the proceeds of these contracts.
Variable Interest Entities
In January 2003, the FASB issued interpretation No. 46, 'Consolidation of Variable Interest Entities' (FIN 46). Under FIN 46, certain entities labelled “Variable Interest Entities” (VIE), must be consolidated by the “primary beneficiary” of the entity. The primary beneficiary is generally defined as the party exposed to the majority of the risks and rewards arising from the VIE. For VIE’s in which a significant variable interest is held that is not a majority interest, certain disclosures are required. Full implementation of this interpretation is required in the Group’s financial statements for the year to 31 December 2004.
The Group has a 20% general partnership interest in the Colowyo limited partnership, which was acquired for US$25 million in December 1994. This joint venture may fall within the definition of a Variable Interest Entity set out in FIN 46. The Colowyo joint venture produces coal, which is sold under long-term contracts. Colowyo’s total sales revenues for 2003 were US$101 million and its total assets as at 31 December 2003 were US$100 million. It is included in the Group accounts on the equity accounting basis and the carrying value of the net investment at 31 December 2003 was US$27 million under US GAAP. Colowyo has bonds in issue with outstanding capital of US$163 million at 31 December 2003. These are repayable by instalments up to 2016 with interest at rates between 9.56% and 10.19% per annum. The bonds are to be serviced and repaid exclusively out of the net revenues from certain specified sales contracts relating to coal supplies by Colowyo. The bondholders bear the risks of loss that might arise if the revenues are interrupted due to failure of the purchasers or force majeure. The Rio Tinto Group is responsible under a management contract in which it agreed, for the sole and exclusive benefit of the bondholders, to cause Colowyo to perform its obligations under the specified coal sales contracts.
A-63
Back to Contents
RIO TINTO PLC - RIO TINTO LIMITED
NOTES TO FINANCIAL STATEMENTS - (continued)
42 Reconciliation to US Accounting Principles (continued)
Post Retirement benefits
Information in respect of the net periodic benefit cost and related obligation determined in accordance with US Statements of Financial Accounting Standards 87,106 and 132 is given below.
The measurement date used to establish year end asset values and benefit obligations was 30 September 2003. The previous measurement date, used to determine 2003 costs, was 30 September 2002.
Benefits under the major pension plans are principally determined by years of service and employee remuneration. The Group’s largest defined benefit pension plans are in the UK, Australia and the US and a description of the investment policies and strategies followed is set out below.
In the UK and the US, the investment strategy is determined by the pension plan trustee and investment committee respectively, after consulting the company. Agreed investment policies aim to ensure that the objectives are met in a prudent manner, consistent with established guidelines. The investment objectives include generating a return that exceeds consumer price and wage inflation over the long term. Ranges for the proportions to be held in each asset class have been agreed; a substantial proportion of the assets is invested in a spread of domestic and overseas equities, with a smaller proportion in fixed and variable income bonds, cash and, in the US, real estate. Risk is managed in various ways, including identifying investments considered to be unsuitable and placing limits on some types of investment. In particular, the funds are not allowed to invest directly in any Rio Tinto Group company.
In Australia, the investments reflect the various defined benefit and defined contribution liabilities and are primarily in Australian and overseas equities and fixed interest stocks.
At 30 September 2003, funded pension plans held assets invested in the following proportions:
| | UK target | US target* | | Group actual | |
| Equities | 45%-85% | 65% | | 65% | |
| Debt securities | 15%-45% | 30% | | 27% | |
| Real estate | - | 5% | | 3% | |
| Other | 0%-10% | - | | 5% | |
| | | | | | |
| *plus or minus 5% | | | | | |
The split of pension investments at 30 September 2002 is not readily available. However, a summary as at 31 December 2002 is set out in the FRS17 transitional disclosures on page A-54.
The expected rate of return on pension plan assets is determined as management’s best estimate of the long term return of the major asset classes –equity, debt, real estate and other – weighted by the actual allocation of assets among the categories at the measurement date.
Pension plan funding policy is based on annual contributions at a rate that is intended to fund benefits as a level percentage of pay over the working lifetime of a plan’s participants, subject to local statutory minimum contribution requirements. Details of anticipated contributions in 2004 are set out in the FRS17 transitional disclosures on page A-54.
Assumptions used to determine the net periodic benefit cost and the end of year benefit obligation for the major pension plans varied between the limits shown below. The average rate for each assumption has been weighted by benefit obligation. The assumptions used to determine the end of year benefit obligation are also used to calculate the following year’s cost.
| | 2003 Cost | | Year end benefit obligation |
| |
| |
|
| Discount rate | 5.8% to 12.0% (Average: 6.7%) | | 5.4% to 9.5% (Average: 5.9%) |
| Long term rate of return on plan assets | 6.5% to 12.0% (Average: 7.2%) | | 6.3% to 11.0% (Average: 6.6%) |
| Increase in compensation levels | 3.3% to 11.0% (Average: 4.8%) | | 3.7% to 6.5% (Average: 4.2%) |
The actuarial calculations in respect of the UK plans assume a rate of increase of pensions in payment of 2.6 per cent per annum. This assumption is consistent with the expected rates of return and salary increase assumptions in the respective valuations. Appropriate assumptions were made for plans in other countries.
Other post retirement benefits are provided to employees who meet the eligibility requirements, and their beneficiaries and dependants, through unfunded self-insurance arrangements. The majority of these plans are for employees in the United States. The plans are non-contributory, although some contain an element of cost sharing such as deductibles and co-insurance.
The weighted average assumptions used in determining the costs and year end benefit obligation for the major post retirement benefit plans other than pension plans were as below:
| | Cost | | Year end benefit obligation |
| |
| |
|
| Discount rate | 6.5% (2002: 6.5%) | | 6.1% (2002: 6.5%) |
| Healthcare cost trend rate | 8.0% reducing to 5.0% by 2009 (2002: 8.5% reducing to 5.0% by 2009) | | 11.2% reducing to 4.7% by 2011 (2002: 8.0% reducing to 5.0% by 2009) |
A-64
Back to Contents
RIO TINTO PLC - RIO TINTO LIMITED
NOTES TO FINANCIAL STATEMENTS - (continued)
42 Reconciliation to US Accounting Principles (continued)
| Components of net benefit expense | | | | | | |
| | Rio Tinto plc - | | Rio Tinto Limited - | | | |
| | part of Rio Tinto Group | | part of Rio Tinto Group | | Rio Tinto Group | |
| |
| |
| |
| |
| | 2003 | | 2002 | | 2001 | | 2003 | | 2002 | | 2001 | | 2003 | | 2002 | | 2001 | |
| |
| |
| |
| |
| |
| |
| |
| |
| |
| |
| Pension Benefits | US$m | | US$m | | US$m | | US$m | | US$m | | US$m | | US$m | | US$m | | US$m | |
| Service cost | (55 | ) | (42 | ) | (45 | ) | (68 | ) | (55 | ) | (47 | ) | (123 | ) | (97 | ) | (92 | ) |
| Interest cost on benefit obligation | (140 | ) | (147 | ) | (138 | ) | (70 | ) | (60 | ) | (57 | ) | (210 | ) | (207 | ) | (195 | ) |
| Expected return on plan assets | 182 | | 197 | | 210 | | 70 | | 61 | | 69 | | 252 | | 258 | | 279 | |
| Net amortisation and deferral: | | | | | | | | | | | | | | | | | | |
| - transitional obligation | 10 | | 10 | | 12 | | - | | - | | - | | 10 | | 10 | | 12 | |
| - recognised gains/(losses) | 3 | | 18 | | 4 | | (9 | ) | (8 | ) | (4 | ) | (6 | ) | 10 | | - | |
| - prior service cost recognised | (21 | ) | (21 | ) | (18 | ) | (2 | ) | (1 | ) | (1 | ) | (23 | ) | (22 | ) | (19 | ) |
| |
| |
| |
| |
| |
| |
| |
| |
| |
| |
| Total net amortisation and deferral | (8 | ) | 7 | | (2 | ) | (11 | ) | (9 | ) | (5 | ) | (19 | ) | (2 | ) | (7 | ) |
| |
| |
| |
| |
| |
| |
| |
| |
| |
| |
| Net periodic benefit (cost)/credit | (21 | ) | 15 | | 25 | | (79 | ) | (63 | ) | (40 | ) | (100 | ) | (48 | ) | (15 | ) |
| Curtailment (charge)/credit | - | | (8 | ) | (4 | ) | - | | - | | - | | - | | (8 | ) | (4 | ) |
| |
| |
| |
| |
| |
| |
| |
| |
| |
| |
| Net benefit credit/(expense) | (21 | ) | 7 | | 21 | | (79 | ) | (63 | ) | (40 | ) | (100 | ) | (56 | ) | (19 | ) |
| |
| |
| |
| |
| |
| |
| |
| |
| |
| |
The 2003 pension cost recognised for defined contribution plans, of US$9 million (2002: US$5 million), is included in the above.
| | Rio Tinto plc - | | Rio Tinto Limited - | | | |
| | part of Rio Tinto Group | | part of Rio Tinto Group | | Rio Tinto Group | |
| |
| |
| |
| |
| | 2003 | | 2002 | | 2001 | | 2003 | | 2002 | | 2001 | | 2003 | | 2002 | | 2001 | |
| |
| |
| |
| |
| |
| |
| |
| |
| |
| |
| Other Benefits | US$m | | US$m | | US$m | | US$m | | US$m | | US$m | | US$m | | US$m | | US$m | |
| Service cost | (8 | ) | (6 | ) | (6 | ) | (1 | ) | (1 | ) | - | | (9 | ) | (7 | ) | (6 | ) |
| Interest cost on benefit obligation | (25 | ) | (23 | ) | (21 | ) | (3 | ) | (2 | ) | (3 | ) | (28 | ) | (25 | ) | (24 | ) |
| Net amortisation and deferral: | | | | | | | | | | | | | | | | | | |
| - recognised gains | 5 | | 8 | | 8 | | - | | - | | 3 | | 5 | | 8 | | 11 | |
| - prior service cost recognised | 1 | | 1 | | 1 | | - | | - | | - | | 1 | | 1 | | 1 | |
| |
| |
| |
| |
| |
| |
| |
| |
| |
| |
| Total net amortisation and deferral | 6 | | 9 | | 9 | | - | | - | | 3 | | 6 | | 9 | | 12 | |
| |
| |
| |
| |
| |
| |
| |
| |
| |
| |
| Net periodic benefit cost | (27 | ) | (20 | ) | (18 | ) | (4 | ) | (3 | ) | - | | (31 | ) | (23 | ) | (18) | |
| Curtailment (charge)/credit | 3 | | (2 | ) | - | | - | | - | | - | | 3 | | (2 | ) | - | |
| |
| |
| |
| |
| |
| |
| |
| |
| |
| |
| Net benefit expense | (24 | ) | (22 | ) | (18 | ) | (4 | ) | (3 | ) | - | | (28 | ) | (25 | ) | (18) | |
| |
| |
| |
| |
| |
| |
| |
| |
| |
| |
| | | | | | | | | | | | | | | | | | | |
| Funded status of the Group's principal schemes | | | | | |
| | Rio Tinto plc - | | Rio Tinto Limited - | | | |
| | part of Rio Tinto Group | | part of Rio Tinto Group | | Rio Tinto Group | |
| |
| |
| |
| |
| | 2003 | | 2002 | | 2001 | | 2003 | | 2002 | | 2001 | | 2003 | | 2002 | | 2001 | |
| |
| |
| |
| |
| |
| |
| |
| |
| |
| |
| Pension benefits | US$m | | US$m | | US$m | | US$m | | US$m | | US$m | | US$m | | US$m | | US$m | |
| Benefit obligation at end of year | (2,680 | ) | (2,377 | ) | (1,903 | ) | (1,481 | ) | (989 | ) | (900 | ) | (4,161 | ) | (3,366 | ) | (2,803 | ) |
| Fair value of plan assets | 2,488 | | 2,256 | | 2,271 | | 1,347 | | 910 | | 917 | | 3,835 | | 3,166 | | 3,188 | |
| |
| |
| |
| |
| |
| |
| |
| |
| |
| |
| Plan assets (below)/in excess of benefit obligation | (192 | ) | (121 | ) | 368 | | (134 | ) | (79 | ) | 17 | | (326 | ) | (200 | ) | 385 | |
| Unrecognised prior service cost | 140 | | 155 | | 149 | | 4 | | 4 | | 4 | | 144 | | 159 | | 153 | |
| Unrecognised net (gain)/loss | 305 | | 239 | | (252 | ) | 317 | | 225 | | 158 | | 622 | | 464 | | (94 | ) |
| Unrecognised transitional (asset)/obligation | (9 | ) | (27 | ) | (35 | ) | (2 | ) | (2 | ) | (2 | ) | (11 | ) | (29 | ) | (37 | ) |
| Company contributions in fourth quarter | 4 | | 2 | | 1 | | 25 | | 5 | | 3 | | 29 | | 7 | | 4 | |
| |
| |
| |
| |
| |
| |
| |
| |
| |
| |
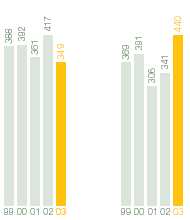
| Net amount recognised at end of year | 248 | | 248 | | 231 | | 210 | | 153 | | 180 | | 458 | | 401 | | 411 | |
| |
| |
| |
| |
| |
| |
| |
| |
| |
| |
| Comprising: | | | | | | | | | | | | | | | | | | |
| - benefit prepayment | 243 | | 212 | | 270 | | 171 | | 134 | | 187 | | 414 | | 346 | | 457 | |
| - benefit (provision) | (293 | ) | (236 | ) | (124 | ) | (116 | ) | (83 | ) | (75 | ) | (409 | ) | (319 | ) | (199 | ) |
| - Intangible asset | 52 | | 53 | | 32 | | 1 | | - | | - | | 53 | | 53 | | 32 | |
| - amount recognised through accumulated | | | | | | | | | | | | | | | | | | |
| other comprehensive income | 246 | | 219 | | 53 | | 154 | | 102 | | 68 | | 400 | | 321 | | 121 | |
| |
| |
| |
| |
| |
| |
| |
| |
| |
| |
| Net amount recognised | 248 | | 248 | | 231 | | 210 | | 153 | | 180 | | 458 | | 401 | | 411 | |
| |
| |
| |
| |
| |
| |
| |
| |
| |
| |
| | | | | | | | | | | | | | | | | | | |
| | Rio Tinto plc - | | Rio Tinto Limited - | | | |
| | part of Rio Tinto Group | | part of Rio Tinto Group | | Rio Tinto Group | |
| |
| |
| |
| |
| | 2003 | | 2002 | | 2001 | | 2003 | | 2002 | | 2001 | | 2003 | | 2002 | | 2001 | |
| |
| |
| |
| |
| |
| |
| |
| |
| |
| |
| Other benefits | US$m | | US$m | | US$m | | US$m | | US$m | | US$m | | US$m | | US$m | | US$m | |
| Benefit obligation at end of year | (501 | ) | (396 | ) | (323 | ) | (62 | ) | (41 | ) | (39 | ) | (563 | ) | (437 | ) | (362 | ) |
| Fair value of plan assets | - | | - | | - | | - | | - | | - | | - | | - | | - | |
| |
| |
| |
| |
| |
| |
| |
| |
| |
| |
| Plan assets (below)/in excess of benefit obligation | (501 | ) | (396 | ) | (323 | ) | (62 | ) | (41 | ) | (39 | ) | (563 | ) | (437 | ) | (362 | ) |
| Unrecognised prior service cost | (2 | ) | (2 | ) | (2 | ) | - | | - | | - | | (2 | ) | (2 | ) | (2 | ) |
| Unrecognised net (gain)/loss | 45 | | (40 | ) | (96 | ) | 9 | | - | | - | | 54 | | (40 | ) | (96 | ) |
| Company contributions in fourth quarter | 4 | | - | | - | | 1 | | - | | - | | 5 | | - | | - | |
| |
| |
| |
| |
| |
| |
| |
| |
| |
| |
| Net amount recognised at end of year | (454 | ) | (438 | ) | (421 | ) | (52 | ) | (41 | ) | - | | (506 | ) | (479 | ) | (460 | ) |
| |
| |
| |
| |
| |
| |
| |
| |
| |
| |
| Comprising: | | | | | | | | | | | | | | | | | | |
| - benefit (provision) | (454 | ) | (438 | ) | (421 | ) | (52 | ) | (41 | ) | (39 | ) | (506 | ) | (479 | ) | (460 | ) |
| |
| |
| |
| |
| |
| |
| |
| |
| |
| |
| Net amount recognised | (454 | ) | (438 | ) | (421 | ) | (52 | ) | (41 | ) | (39 | ) | (506 | ) | (479 | ) | (460 | ) |
| |
| |
| |
| |
| |
| |
| |
| |
| |
| |
A-65
Back to Contents
RIO TINTO PLC - RIO TINTO LIMITED
NOTES TO FINANCIAL STATEMENTS - (continued)
42 Reconciliation to US Accounting Principles (continued)
Change in additional minimum liability before tax
| | | Rio Tinto Group | |
| | |
|
|
|
|
| |
| | | 2003 | | 2002 | | 2001 | |
| | |
| |
| |
| |
| Pension benefits | | US$m | | US$m | | US$m | |
| Accrued pension benefit expense | | 79 | | 221 | | 148 | |
| Increase in intangible asset | | - | | (21 | ) | (32 | ) |
| | |
| |
| |
| |
| Other comprehensive income before tax | | 79 | | 200 | | 116 | |
| | |
| |
| |
| |
Change in benefit obligation
| | | Rio Tinto plc - | | Rio Tinto Limited - | | | |
| | | part of Rio Tinto Group | | part of Rio Tinto Group | | Rio Tinto Group | |
| | |
|
|
|
|
| |
|
|
|
|
| |
|
|
|
|
| |
| | | 2003 | | 2002 | | 2001 | | 2003 | | 2002 | | 2001 | | 2003 | | 2002 | | 2001 | |
| | |
| |
| |
| |
| |
| |
| |
| |
| |
| |
| Pension benefits | | US$m | | US$m | | US$m | | US$m | | US$m | | US$m | | US$m | | US$m | | US$m | |
| Benefit obligation at start of year | | (2,377 | ) | (1,903 | ) | (2,033 | ) | (989 | ) | (900 | ) | (861 | ) | (3,366 | ) | (2,803 | ) | (2,894 | ) |
| Service cost | | (50 | ) | (42 | ) | (45 | ) | (62 | ) | (55 | ) | (47 | ) | (112 | ) | (97 | ) | (92 | ) |
| Interest cost | | (140 | ) | (147 | ) | (138 | ) | (70 | ) | (60 | ) | (57 | ) | (210 | ) | (207 | ) | (195 | ) |
| Contributions by plan participants | | (3 | ) | (3 | ) | (2 | ) | (23 | ) | (6 | ) | (4 | ) | (26 | ) | (9 | ) | (6 | ) |
| Actuarial gains and (losses) | | (381 | ) | (246 | ) | 90 | | (172 | ) | 42 | | 1 | | (553 | ) | (204 | ) | 91 | |
| Benefits paid | | 151 | | 141 | | 125 | | 109 | | 54 | | 70 | | 260 | | 195 | | 195 | |
| Benefits bought out | | 191 | | - | | - | | - | | - | | - | | 191 | | - | | - | |
| Plan amendments | | (6 | ) | (16 | ) | (12 | ) | (1 | ) | - | | - | | (7 | ) | (16 | ) | (12 | ) |
| Inclusion of DC liabilities | | - | | - | | (2 | ) | - | | - | | (61 | ) | - | | - | | (63 | ) |
| Settlement, curtailment and other gain/(loss) | | (13 | ) | - | | - | | 23 | | - | | - | | 10 | | - | | - | |
| Currency and other adjustments | | (52 | ) | (161 | ) | 114 | | (296 | ) | (64 | ) | 59 | | (348 | ) | (225 | ) | 173 | |
| | |
| |
| |
| |
| |
| |
| |
| |
| |
| |
| Benefit obligation at end of year | | (2,680 | ) | (2,377 | ) | (1,903 | ) | (1,481 | ) | (989 | ) | (900 | ) | (4,161 | ) | (3,366 | ) | (2,803 | ) |
| | |
| |
| |
| |
| |
| |
| |
| |
| |
| |
| | | Rio Tinto plc - | | Rio Tinto Limited - | | | |
| | | part of Rio Tinto Group | | part of Rio Tinto Group | | Rio Tinto Group | |
| | |
|
|
|
|
| |
|
|
|
|
| |
|
|
|
|
| |
| | | 2003 | | 2002 | | 2001 | | 2003 | | 2002 | | 2001 | | 2003 | | 2002 | | 2001 | |
| | |
| |
| |
| |
| |
| |
| |
| |
| |
| |
| Other benefits | | US$m | | US$m | | US$m | | US$m | | US$m | | US$m | | US$m | | US$m | | US$m | |
| Benefit obligation at start of year | | (396 | ) | (323 | ) | (315 | ) | (41 | ) | (39 | ) | (40 | ) | (437 | ) | (362 | ) | (355 | ) |
| Service cost | | (8 | ) | (6 | ) | (6 | ) | (1 | ) | (1 | ) | - | | (9 | ) | (7 | ) | (6 | ) |
| Interest cost | | (25 | ) | (23 | ) | (21 | ) | (3 | ) | (2 | ) | (3 | ) | (28 | ) | (25 | ) | (24 | ) |
| Actuarial (losses) | | (83 | ) | (48 | ) | (8 | ) | (10 | ) | - | | - | | (93 | ) | (48 | ) | (8 | ) |
| Benefits paid | | 16 | | 14 | | 11 | | 2 | | 2 | | 2 | | 18 | | 16 | | 13 | |
| Plan amendments | | 5 | | (2 | ) | - | | - | | - | | - | | 5 | | (2 | ) | - | |
| Settlement, curtailment and other gain/(loss) | | 3 | | - | | - | | - | | - | | - | | 3 | | - | | - | |
| Currency and other adjustments | | (13 | ) | (8 | ) | 16 | | (9 | ) | (1 | ) | 2 | | (22 | ) | (9 | ) | 18 | |
| | |
| |
| |
| |
| |
| |
| |
| |
| |
| |
| Benefit obligation at end of year | | (501 | ) | (396 | ) | (323 | ) | (62 | ) | (41 | ) | (39 | ) | (563 | ) | (437 | ) | (362 | ) |
| | |
| |
| |
| |
| |
| |
| |
| |
| |
| |
Change in plan assets
| | | Rio Tinto plc - | | Rio Tinto Limited - | | | |
| | | part of Rio Tinto Group | | part of Rio Tinto Group | | Rio Tinto Group | |
| | |
|
|
|
|
| |
|
|
|
|
| |
|
|
|
|
| |
| | | 2003 | | 2002 | | 2001 | | 2003 | | 2002 | | 2001 | | 2003 | | 2002 | | 2001 | |
| | |
| |
| |
| |
| |
| |
| |
| |
| |
| |
| Pension benefits | | US$m | | US$m | | US$m | | US$m | | US$m | | US$m | | US$m | | US$m | | US$m | |
| Fair value of plan assets at start of year | | 2,256 | | 2,271 | | 2,840 | | 910 | | 917 | | 1,024 | | 3,166 | | 3,188 | | 3,864 | |
| Actual return/(loss) on plan assets | | 486 | | (108 | ) | (296 | ) | 203 | | (42 | ) | (44 | ) | 689 | | (150 | ) | (340 | ) |
| Contributions by plan participants | | 3 | | 3 | | 2 | | 23 | | 6 | | 4 | | 26 | | 9 | | 6 | |
| Contributions by employer | | 25 | | 13 | | 9 | | 67 | | 17 | | 13 | | 92 | | 30 | | 22 | |
| Benefits (paid) | | (151 | ) | (141 | ) | (125 | ) | (109 | ) | (54 | ) | (70 | ) | (260 | ) | (195 | ) | (195 | ) |
| Benefits bought out | | (191 | ) | - | | - | | - | | - | | - | | (191 | ) | - | | - | |
| Settlement, curtailment and other gain/(loss) | | 4 | | - | | - | | (23 | ) | - | | - | | (19 | ) | - | | - | |
| Currency and other adjustments | | 56 | | 218 | | (159 | ) | 276 | | 66 | | (10 | ) | 332 | | 284 | | (169 | ) |
| | |
| |
| |
| |
| |
| |
| |
| |
| |
| |
| Fair value of plan assets at end of year | | 2,488 | | 2,256 | | 2,271 | | 1,347 | | 910 | | 917 | | 3,835 | | 3,166 | | 3,188 | |
| | |
| |
| |
| |
| |
| |
| |
| |
| |
| |
| | | Rio Tinto plc - | | Rio Tinto Limited - | | | |
| | | part of Rio Tinto Group | | part of Rio Tinto Group | | Rio Tinto Group | |
| | |
|
|
|
|
| |
|
|
|
|
| |
|
|
|
|
| |
| | | 2003 | | 2002 | | 2001 | | 2003 | | 2002 | | 2001 | | 2003 | | 2002 | | 2001 | |
| | |
| |
| |
| |
| |
| |
| |
| |
| |
| |
| Other benefits | | US$m | | US$m | | US$m | | US$m | | US$m | | US$m | | US$m | | US$m | | US$m | |
| Fair value of plan assets at start of year | | - | | - | | - | | - | | - | | - | | - | | - | | - | |
| Contributions by employer | | 16 | | 14 | | 11 | | 2 | | 2 | | 2 | | 18 | | 16 | | 13 | |
| Benefits (paid) | | (16 | ) | (14 | ) | (11 | ) | (2 | ) | (2 | ) | (2 | ) | (18 | ) | (16 | ) | (13 | ) |
| | |
| |
| |
| |
| |
| |
| |
| |
| |
| |
| Fair value of plan assets at end of year | | - | | - | | - | | - | | - | | - | | - | | - | | - | |
| | |
| |
| |
| |
| |
| |
| |
| |
| |
| |
A-66
Back to Contents
RIO TINTO PLC - RIO TINTO LIMITED
NOTES TO FINANCIAL STATEMENTS - (continued)
42 Reconciliation to US Accounting Principles (continued)
Sensitivity to change in healthcare trend
Changing the healthcare cost trend rates by 1% would result in the following effects:
| | | Rio Tinto plc - | | Rio Tinto Limited - | | | |
| | | part of Rio Tinto Group | | part of Rio Tinto Group | | Rio Tinto Group | |
| | |
|
|
| |
|
|
| |
|
|
| |
| | | 1% Increase | | 1% Decrease | | 1% Increase | | 1% Decrease | | 1% Increase | | 1% Decrease | |
| | |
| |
| |
| |
| |
| |
| |
| 2003 | | US$m | | US$m | | US$m | | US$m | | US$m | | US$m | |
| | | | | | | | | | | | | | |
| (Increase)/decrease in service cost plus interest cost | | (5 | ) | 4 | | - | | - | | (5 | ) | 4 | |
| (Increase)/decrease in benefit obligation at September 30 | | (61 | ) | 54 | | (7 | ) | 6 | | (68 | ) | 60 | |
| | | | | | | | | | | | | | |
| 2002 | | | | | | | | | | | | | |
| | | | | | | | | | | | | | |
| (Increase)/decrease in service cost plus interest cost | | (5 | ) | 4 | | - | | - | | (5 | ) | 4 | |
| (Increase)/decrease in benefit obligation at September 30 | | (43 | ) | 35 | | (5 | ) | 5 | | (48 | ) | 40 | |
| | | | | | | | | | | | | | |
| 2001 | | | | | | | | | | | | | |
| | | | | | | | | | | | | | |
| (Increase)/decrease in service cost plus interest cost | | (5 | ) | 4 | | - | | - | | (5 | ) | 4 | |
| (Increase)/decrease in benefit obligation at September 30 | | (34 | ) | 30 | | (5 | ) | 4 | | (39 | ) | 34 | |
Effect of Medicare Prescription Drug, Improvement and Modernisation Act of 2003
In January 2004, the FASB issued FASB Staff Position (“FSP”) 106-1, Accounting and Disclosure Requirements Related to Medicare Prescription Drug, Improvement and Modernization Act of 2003 (the “Act”). This FSP addresses the accounting implications of the newly issued Act to an entity that sponsors a postretirement health care plan that provides prescription drug benefits. This Act, signed into law on 8 December 2003 in the United States, introduces a prescription drug benefit under Medicare as well as a federal subsidy to sponsors of certain retiree health care benefit plans. The FSP includes an election to defer accounting for the implications of this new law until specific authoritative guidance to address the accounting treatment has been issued. As such, as a result of the lack of the existence of such guidance, any measures included in these financial statements of the accumulated post retirement benefit obligation (APBO) or net periodic postretirement benefit cost in the financial statements or accompanying notes do not reflect the effects of the Act on the plan. Authoritative guidance, when issued, could require a change in previously reported information.
A-67
Back to Contents
RIO TINTO PLC - RIO TINTO LIMITED
NOTES TO FINANCIAL STATEMENTS - (continued)
42 Reconciliation to US Accounting Principles (continued)
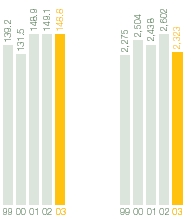
Accumulated foreign currency translation gains and (losses) recorded directly in shareholders' funds under US GAAP
| | | Rio Tinto plc - | | Rio Tinto Limited - | | | |
| | | part of Rio Tinto Group | | part of Rio Tinto Group | | Rio Tinto Group | |
| | |
| |
| |
| |
| | | US$m | | US$m | | US$m | |
| | |
| |
| |
| |
| At 1 January 2003 | | (871 | ) | (261 | ) | (1,014 | ) |
| Current period change | | 784 | | 829 | | 1,301 | |
| | |
| |
| |
| |
| At 31 December 2003 | | (87 | ) | 568 | | 287 | |
| | |
| |
| |
| |
| At 1 January 2002 | | (1,189 | ) | (428 | ) | (1,436 | ) |
| Current period change | | 318 | | 167 | | 422 | |
| | |
| |
| |
| |
| At 31 December 2002 | | (871 | ) | (261 | ) | (1,014 | ) |
| | |
| |
| |
| |
| At 1 January 2001 | | (935 | ) | (313 | ) | (1,111 | ) |
| Current period change | | (254 | ) | (115 | ) | (325 | ) |
| | |
| |
| |
| |
| At 31 December 2001 | | (1,189 | ) | (428 | ) | (1,436 | ) |
| | |
| |
| |
| |
Additional US GAAP cash flow information
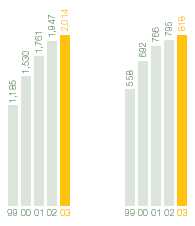
A summary of Rio Tinto's operating, investing and financing activities classified in accordance with US GAAP is presented below:
| | | Rio Tinto plc - | | Rio Tinto Limited - | | | |
| | | part of Rio Tinto Group | | part of Rio Tinto Group | | Rio Tinto Group | |
| | |
|
|
|
|
| |
|
|
|
|
| |
|
|
|
|
| |
| | | 2003 | | 2002 | | 2001 | | 2003 | | 2002 | | 2001 | | 2003 | | 2002 | | 2001 | |
| | |
| |
| |
| |
| |
| |
| |
| |
| |
| |
| | | US$m | | US$m | | US$m | | US$m | | US$m | | US$m | | US$m | | US$m | | US$m | |
| Net cash flow from operating activities | | 1,413 | | 1,536 | | 1,108 | | 1,156 | | 1,379 | | 1,327 | | 2,292 | | 2,640 | | 2,326 | |
| Net cash flow from investing activities | | 112 | | (1,042 | ) | (1,122 | ) | (667 | ) | (592 | ) | (1,277 | ) | (1,268 | ) | (1,663 | ) | (2,113 | ) |
| Net cash flow from financing activities | | (1,439 | ) | (507 | ) | (17 | ) | (505 | ) | (948 | ) | (87 | ) | (954 | ) | (1,151 | ) | (281 | ) |
| | |
| |
| |
| |
| |
| |
| |
| |
| |
| |
| Increase/(decrease) in cash and cash equivalents per US GAAP | | 86 | | (13 | ) | (31 | ) | (16 | ) | (161 | ) | (37 | ) | 70 | | (174 | ) | (68 | ) |
| | |
| |
| |
| |
| |
| |
| |
| |
| |
| |
| (Decrease)/increase in cash per UK GAAP | | (9 | ) | (16 | ) | 6 | | (74 | ) | (114 | ) | 34 | | (83 | ) | (130 | ) | 40 | |
| Decrease/(Increase) in non qualifying liquid resources for US GAAP | | 110 | | (2 | ) | (31 | ) | 10 | | (25 | ) | (26 | ) | 120 | | (27 | ) | (57 | ) |
| Increase/(decrease) in bank borrowings repayable on demand included in cash under UK GAAP | | (15 | ) | 5 | | (6 | ) | 48 | | (22 | ) | (45 | ) | 33 | | (17 | ) | (51 | ) |
| | |
| |
| |
| |
| |
| |
| |
| |
| |
| |
| Increase/(decrease) in cash and cash equivalents per US GAAP | | 86 | | (13 | ) | (31 | ) | (16 | ) | (161 | ) | (37 | ) | 70 | | (174 | ) | (68 | ) |
| | |
| |
| |
| |
| |
| |
| |
| |
| |
| |
| Cash per balance sheet under UK GAAP | | 257 | | 174 | | 364 | | 138 | | 151 | | 315 | | 395 | | 325 | | 679 | |
| Qualifying liquid resources less non qualifying deposits | | - | | (1 | ) | (135 | ) | (36 | ) | (44 | ) | (48 | ) | (36 | ) | (45 | ) | (183 | ) |
| | |
| |
| |
| |
| |
| |
| |
| |
| |
| |
| Cash and cash equivalents under US GAAP | | 257 | | 173 | | 229 | | 102 | | 107 | | 267 | | 359 | | 280 | | 496 | |
| | |
| |
| |
| |
| |
| |
| |
| |
| |
| |
The year end cash and cash equivalents position under US GAAP included in the above table reflects both the movement in cash and cash equivalents in the year and the impact of exchange gains and losses in the year.
Deferred tax credit/(charge)
| | | Rio Tinto plc - | | Rio Tinto Limited - | | | |
| | | part of Rio Tinto Group | | part of Rio Tinto Group | | Rio Tinto Group | |
| | |
|
|
|
|
| |
|
|
|
|
| |
|
|
|
|
| |
| | | 2003 | | 2002 | | 2001 | | 2003 | | 2002 | | 2001 | | 2003 | | 2002 | | 2001 | |
| | |
| |
| |
| |
| |
| |
| |
| |
| |
| |
| | | US$m | | US$m | | US$m | | US$m | | US$m | | US$m | | US$m | | US$m | | US$m | |
| The credit/(charge) for deferred taxation arises as follows: | | | | | | | | | | | | | | | | | | | |
| - accelerated capital allowances | | (80 | ) | 158 | | 168 | | (3 | ) | 28 | | 39 | | (83 | ) | 186 | | 207 | |
| - pension prepayments | | 47 | | (1 | ) | (39 | ) | 1 | | 12 | | 9 | | 48 | | 11 | | (30 | ) |
| - provisions | | (26 | ) | 20 | | 68 | | 2 | | (14 | ) | (27 | ) | (24 | ) | 6 | | 41 | |
| - provision against AMT credits and US tax losses | | 50 | | (228 | ) | (144 | ) | - | | - | | - | | 50 | | (228 | ) | (144 | ) |
| - other timing differences | | 28 | | 30 | | 5 | | 6 | | 11 | | (47 | ) | 34 | | 41 | | (42 | ) |
| | |
| |
| |
| |
| |
| |
| |
| |
| |
| |
| | | 19 | | (21 | ) | 58 | | 6 | | 37 | | (26 | ) | 25 | | 16 | | 32 | |
| | |
| |
| |
| |
| |
| |
| |
| |
| |
| |
A-68
Back to Contents
RIO TINTO PLC - RIO TINTO LIMITED
NOTES TO FINANCIAL STATEMENTS - (continued)
42 Reconciliation to US Accounting Principles (continued)
Fixed asset investments
The aggregated profit and loss accounts and balance sheets of equity and gross equity accounted companies on a 100 per cent basis are set out below:
| | Rio Tinto plc - | | Rio Tinto Limited - | | | | | | | |
| | part of Rio Tinto Group | | part of Rio Tinto Group | | Rio Tinto Group | |
| |
| |
| |
| |
| | 2003 | | 2002 | | 2001 | | 2003 | | 2002 | | 2001 | | 2003 | | 2002 | | 2001 | |
| |
| |
| |
| |
| |
| |
| |
| |
| |
| |
| | US$m | | US$m | | US$m | | US$m | | US$m | | US$m | | US$m | | US$m | | US$m | |
| Profit and loss account: | | | | | | | | | | | | | | | | | | |
| Sales revenue | 11,230 | | 9,295 | | 9,966 | | 1,044 | | 1,841 | | 1,643 | | 7,078 | | 6,622 | | 6,313 | |
| Cost of sales | (7,860 | ) | (6,826 | ) | (6,873 | ) | (860 | ) | (1,217 | ) | (1,066 | ) | (4,652 | ) | (4,384 | ) | (4,068 | ) |
| |
| |
| |
| |
| |
| |
| |
| |
| |
| |
| Operating profit | 3,370 | | 2,469 | | 3,093 | | 184 | | 624 | | 577 | | 2,426 | | 2,238 | | 2,245 | |
| Profit of equity accounted companies | 137 | | 325 | | 320 | | - | | - | | - | | - | | - | | - | |
| Profit on sale of fixed asset invesments | 126 | | - | | - | | - | | - | | - | | - | | - | | - | |
| Net interest | (445 | ) | (475 | ) | (534 | ) | (8 | ) | (49 | ) | (67 | ) | (317 | ) | (377 | ) | (392 | ) |
| |
| |
| |
| |
| |
| |
| |
| |
| |
| |
| Profit before tax | 3,188 | | 2,319 | | 2,879 | | 176 | | 575 | | 510 | | 2,109 | | 1,861 | | 1,853 | |
| Taxation | (1,070 | ) | (911 | ) | (963 | ) | (4 | ) | (91 | ) | (163 | ) | (714 | ) | (579 | ) | (604 | ) |
| Profit attributable to outside shareholders | (59 | ) | 90 | | (115 | ) | - | | - | | - | | (48 | ) | (36 | ) | (43 | ) |
| |
| |
| |
| |
| |
| |
| |
| |
| |
| |
| Net profit on ordinary activities (100 per cent basis) | 2,059 | | 1,498 | | 1,801 | | 172 | | 484 | | 347 | | 1,347 | | 1,246 | | 1,206 | |
| |
| |
| |
| |
| |
| |
| |
| |
| |
| |
| | | | | | | | | | | | | | | | | | | |
| | Rio Tinto plc - | | Rio Tinto Limited - | | | | | | | |
| | part of Rio Tinto Group | | part of Rio Tinto Group | | Rio Tinto Group | |
| |
| |
| |
| |
| | 2003 | | 2002 | | 2001 | | 2003 | | 2002 | | 2001 | | 2003 | | 2002 | | 2001 | |
| |
| |
| |
| |
| |
| |
| |
| |
| |
| |
| | US$m | | US$m | | US$m | | US$m | | US$m | | US$m | | US$m | | US$m | | US$m | |
| Balance sheet: | | | | | | | | | | | | | | | | | | |
| Intangible fixed assets | 1,062 | | 988 | | 942 | | 1 | | 1 | | 1 | | 64 | | 194 | | 196 | |
| Tangible fixed assets | 18,499 | | 15,942 | | 15,549 | | 2,002 | | 2,758 | | 2,491 | | 11,406 | | 12,086 | | 11,765 | |
| Investments | 1,247 | | 1,235 | | 983 | | 2 | | 3 | | 3 | | 78 | | 166 | | 162 | |
| Working capital | 1,040 | | (434 | ) | (363 | ) | 17 | | 86 | | 194 | | 775 | | 593 | | 516 | |
| Net cash less current debt | (1,182 | ) | (2,658 | ) | (2,031 | ) | (13 | ) | (33 | ) | (97 | ) | 319 | | (835 | ) | (164 | ) |
| Long term debt | (6,954 | ) | (5,667 | ) | (6,098 | ) | (402 | ) | (1,005 | ) | (1,181 | ) | (5,066 | ) | (5,406 | ) | (5,838 | ) |
| Provisions | (3,457 | ) | (2,648 | ) | (2,853 | ) | (164 | ) | (361 | ) | (377 | ) | (1,462 | ) | (1,658 | ) | (1,949 | ) |
| Outside shareholders' interests | (1,580 | ) | (847 | ) | (902 | ) | (1 | ) | - | | - | | (321 | ) | (290 | ) | (249 | ) |
| |
| |
| |
| |
| |
| |
| |
| |
| |
| |
| Aggregate shareholders' funds (100 per cent basis) | 8,675 | | 5,911 | | 5,227 | | 1,442 | | 1,449 | | 1,034 | | 5,793 | | 4,850 | | 4,439 | |
| |
| |
| |
| |
| |
| |
| |
| |
| |
| |
For Rio Tinto plc the above disclosures include 100 per cent of the profit and loss account and balance sheet of Rio Tinto Limited.
Deferred Stripping
Information about the stripping ratios of the Business Units that account for the majority of the deferred stripping balance at 31 December 2003, and year in which deferred stripping is expected to be fully amortised, is set out in the following table:
| | Actual stripping ratio | | Life of mine stripping | |
| | for year | | ratio | |
| | 2003 | | 2002 | | 2001 | | 2003 | | 2002 | | 2001 | |
| |
| |
| |
| |
| |
| |
| |
| | | | | | | | | | | | | |
| Kennecott Utah Copper (2014) | 1.86 | | 2.05 | | 2.21 | | 1.24 | | 1.19 | | 0.91 | |
| Borax (2037) | 23.00 | | 25.00 | | 28.00 | | 16.00 | | 16.00 | | 16.00 | |
| Argyle Diamonds (2007) | 6.10 | | 7.29 | | 6.62 | | 4.10 | | 4.40 | | 4.60 | |
| Freeport Joint Venture (2014) | 2.84 | | 2.35 | | 2.11 | | 1.93 | | 1.77 | | 1.60 | |
In addition, Escondida, Rio Tinto's 30 per cent owned joint venture, defers stripping costs based on the ratio of waste to pounds of copper mined. The actual stripping ratio for 2003 was 0.1015 (2002: 0.1458, 2001: 0.1476). The life of mine stripping ratio for 2003 was 0.1103 (2002: 0.1094, 2001: 0.1094). The deferred stripping balance is expected to be fully amortised in 2039.
A-69
Back to Contents
RIO TINTO PLC - RIO TINTO LIMITED
NOTES TO FINANCIAL STATEMENTS - (continued)
42 Reconciliation to US Accounting Principles (continued)
Unrealised holding gains and losses
Under FAS 115, unrealised holding gains and losses on investments classified as 'available for sale' are excluded from earnings and reported within a separate component of shareholders' funds until realised.
The following tables show the investments in debt and equity securities which are held as 'available for sale' in accordance with FAS 115, for the Rio Tinto Group, Rio Tinto plc and Rio Tinto Limited.
| | | | Unrealised | | Unrealised | | | | Net unrealised | |
| Rio Tinto Group | Net book | | holding | | holding | | Market | | holding | |
| | value | | gains | | losses | | value | | gains/(losses) | |
| |
| |
| |
| |
| |
| |
| | US$m | | US$m | | US$m | | US$m | | US$m | |
| At 1 January 2003 | 70 | | 5 | | (5 | ) | 70 | | - | |
| Change | 9 | | 14 | | (1 | ) | 22 | | 13 | |
| |
| |
| |
| |
| |
| |
| At 31 December 2003 | 79 | | 19 | | (6 | ) | 92 | | 13 | |
| |
| |
| |
| |
| |
| |
| | | | | | | | | | | |
| | | | Unrealised | | Unrealised | | | | Net unrealised | |
| Rio Tinto plc | Net book | | holding | | holding | | Market | | holding | |
| | value | | gains | | losses | | value | | gains/(losses) | |
| |
| |
| |
| |
| |
| |
| | US$m | | US$m | | US$m | | US$m | | US$m | |
| At 1 January 2003 | 56 | | - | | (1 | ) | 55 | | (1 | ) |
| Change | 13 | | 19 | | 1 | | 33 | | 20 | |
| |
| |
| |
| |
| |
| |
| At 31 December 2003 | 69 | | 19 | | - | | 88 | | 19 | |
| |
| |
| |
| |
| |
| |
| | | | | | | | | | | |
| | | | Unrealised | | Unrealised | | | | Net unrealised | |
| Rio Tinto Limited | Net book | | holding | | holding | | Market | | holding | |
| | value | | gains | | losses | | value | | gains/(losses) | |
| |
| |
| |
| |
| |
| |
| | US$m | | US$m | | US$m | | US$m | | US$m | |
| At 1 January 2003 | 14 | | 5 | | (4 | ) | 15 | | 1 | |
| Change | (4 | ) | (5 | ) | (2 | ) | (11 | ) | (7 | ) |
| |
| |
| |
| |
| |
| |
| At 31 December 2003 | 10 | | - | | (6 | ) | 4 | | (6 | ) |
| |
| |
| |
| |
| |
| |
Share Option Plans
At 31 December 2003, Rio Tinto plc and Rio Tinto Limited have a number of share based option plans, which are described below. The Company accounts for the fair value of its grants under those plans in accordance with FASB Statement 123. The compensation cost that has been charged against income for those plans was US$8 million, US$17 million and US$21 million for 2001, 2002 and 2003 respectively.
Fixed Share Option Plans
Under these plans, the exercise price of each option equals the market price of the Company's shares on the date of grant less a 20% discount and the maximum term of the option is between 2 and 5 years.
The fair value of each option grant is estimated on the date of grant using an adjusted Black-Scholes option-pricing model prior to 2003 and an actuarial binomial option-pricing model for options granted during 2003, with the following weighted average assumptions for grants in 2001, 2002 and 2003:
| | 2003 | | | | | | | | | |
| |
| | | | | | | | | |
| | Risk-free | | Expected | | Dividend | | Implied | | | | | | | | | |
| | interest rate | | volatility | | yield | | Lifetime | | | | | | | | | |
| |
| |
| |
| |
| | | | | | | | | |
| | % | | % | | % | | years | | | | | | | | | |
| Rio Tinto plc | 4.42 | | 30.00 | | 2.60 | | 3.7 | | | | | | | | | |
| Rio Tinto Limited | 5.28 | | 25.00 | | 2.60 | | 4.4 | | | | | | | | | |
| | | | | | | | | | | | | | | | | |
| | | | | | | | | | | | | | | | | |
| | 2002 | | 2001 | |
| |
| |
| |
| | Risk-free | | Expected | | Dividend | | Implied | | Risk-free | | Expected | | Dividend | | Implied | |
| | interest rate | | volatility | | yield | | Lifetime | | interest rate | | volatility | | yield | | Lifetime | |
| |
| |
| |
| |
| |
| |
| |
| |
| |
| | % | | % | | % | | years | | % | | % | | % | | years | |
| Rio Tinto plc | 4.41 | | 31.82 | | 4.48 | | 4.2 | | 4.60 | | 42.57 | | 2.98 | | 3.6 | |
| Rio Tinto Limited | 5.35 | | 26.13 | | 2.58 | | 4.8 | | 5.38 | | 26.02 | | 3.30 | | 4.7 | |
A summary of the status of the Companies’ fixed share option plans as at 31 December 2001, 2002 and 2003, and changes during the years ending on those dates is presented below:
| | Rio Tinto plc | |
| Share Savings Plan |
| |
| |
| | 2003 | | 2002 | | 2001 | |
| |
|
|
| |
|
|
| |
|
|
| |
| | | | Weighted | | | | Weighted | | | | Weighted | |
| | | | average | | | | average | | | | average | |
| | Number | | share price | | Number | | share price | | Number | | share price | |
| |
| |
| |
| |
| |
| |
| |
| | | | £ | | | | £ | | | | £ | |
| Options outstanding at 1 January | 2,079,845 | | 8.14 | | 2,010,403 | | 7.74 | | 1,285,340 | | 6.32 | |
| Granted | 390,518 | | 11.21 | | 509,954 | | 8.76 | | 975,577 | | 9.50 | |
| Exercised | (367,866 | ) | 8.47 | | (278,134 | ) | 5.96 | | (181,581 | ) | 7.27 | |
| Cancelled | (182,067 | ) | 9.06 | | (162,378 | ) | 8.85 | | (68,933 | ) | 7.59 | |
| |
| |
| |
| |
| |
| |
| |
| Options outstanding at 31 December | 1,920,430 | | 8.61 | | 2,079,845 | | 8.14 | | 2,010,403 | | 7.74 | |
| |
| |
| |
| |
| |
| |
| |
| | | | | | | | | | | | | |
| Weighted-average fair value of options granted during the year | | | 4.20 | | | | 2.78 | | | | 3.98 | |
| | | | | | | | | | | | | |
A-70
Back to Contents
RIO TINTO PLC - RIO TINTO LIMITED
NOTES TO FINANCIAL STATEMENTS - (continued)