The table below shows the additional assets and liabilities consolidated by the Group in respect of the increase in Rio Tinto's interest in Boyne Smelters, a joint arrangement. It also reflects the reduction in the outside shareholders' interests of Coal & Allied and IOC resulting from the above transactions.
Mining properties, included within tangible fixed assets and investments in joint ventures, were revalued by reference to the net present values of the projected cash flows for each business acquired, based on circumstances existing at the date of acquisition, less the estimated fair values of other separately identifiable assets and liabilities. Revaluation adjustments to other tangible fixed assets were based on depreciated replacement cost or, where appropriate, the asset's recoverable amount.
The fair values attributed to the mining properties and joint ventures of the Australian coal operations of the Peabody Group, acquired in 2001, in the balance sheet reported at 31 December 2001 were provisional. These fair values have been updated during 2002 to take account of updated estimates of the future cash flows for the businesses acquired, based on a closer examination of the potential of these businesses at the date of acquisition, a further analysis of tax and other liabilities and the proceeds of the disposals referred to below. This has resulted in an increase in the fair values ascribed to the retained joint ventures of US$55 million, an increase in current tax liabilities of US$46 million, an increase in tangible fixed assets of US$15 million, an increase in provisions of US$12 million and a decrease in assets held for resale (see below) of US$12 million.
The ownership of Itallumina was transferred from a Rio Tinto Limited subsidiary to a Rio Tinto plc subsidiary during 2002 for a consideration of US$13 million.
Back to Contents
RIO TINTO PLC - RIO TINTO LIMITED
NOTES TO FINANCIAL STATEMENTS - (continued)
36 Directors' remuneration
Aggregate remuneration of the directors of the parent Companies was as follows:
| | Rio Tinto Group | |
| |
| |
| | 2002 | | 2001 | | 2000 | |
| |
| |
| |
| |
| | US$'000 | | US$'000 | | US$'000 | |
| | | | | | | |
| Emoluments | 9,541 | | 8,402 | | 8,973 | |
| Long term incentive plans | 8,443 | | 4,439 | | 2,870 | |
| |
| |
| |
| |
| | 17,984 | | 12,841 | | 11,843 | |
| |
| |
| |
| |
| Pension contributions | 65 | | 4 | | 4 | |
| Gains made on exercise of share options | 2,992 | | 17 | | 9 | |
For 2002, a total of £3,467,688 (A$9,701,754) (US$5,389,636), (2001: £2,030,214 (A$5,719,166)(US$2,937,132) was attributable to the highest paid director in respect of the aggregate amounts disclosed in the above table, including gains made on exercise of share options. The accrued pension entitlement for the highest paid director was £656,000 (A$1,812,528) (US$984,000), (2001: £579,000 (A$1,642,452) (US$840,129)).
The aggregate remuneration, including pension contributions and other retirement benefits, incurred by Rio Tinto plc in respect of its directors was £7,333,000 (US$11,492,000) (2001: £5,384,000 (US$7,786,000)). There were no pension contributions.
The aggregate remuneration, including pension contributions and other retirement benefits, incurred by Rio Tinto Limited in respect of its directors was A$11,756,000 (US$6,557,000) (2001: A$9,841,000 (US$5,059,000)). The aggregate pension contribution was A$119,232 (US$64,730) (2001: A$7,200 (US$3,723)).
During 2002, seven directors (2001: six) accrued retirement benefits under defined benefit arrangements.
Shares awarded last year in respect of the MCCP 1998 performance period vested after the publication of the 2001 Annual Report and financial statements and the value of awards provided therein were estimated based on share prices of 1,399p and A$39.594. The actual share prices on 1 March 2002 when the awards vested were 1,420p and A$39.30 and the above 2002 figures for long term incentive plans have been adjusted accordingly. Further details are given in the Remuneration report on page 58 of the 2002 Annual Report and Financial Statements.
Emoluments included in the table above have been translated from local currency at the average rate for the year with the exception of bonus payments, which, together with amounts payable under long term incentive plans, have been translated at the year end rate.
More detailed information concerning directors’ remuneration, shareholdings and options is shown in the Remuneration report, including Tables 1 to 5, on pages 56 to 59 of the 2002 Annual Report and Financial Statements.
37 Auditors' remuneration
| Rio Tinto plc - part of Rio Tinto Group | | Rio Tinto Limited - part of Rio Tinto Group | | Rio Tinto Group | | |
| |
| |
| |
| |
| | |
| | 2002 | | 2001 | | 2000 | | 2002 | | 2001 | | 2000 | | 2002 | | 2001 | | 2000 | |
| |
| |
| |
| |
| |
| |
| |
| |
| |
| | |
| Auditors' remuneration | US$m |
| US$m |
| US$m |
| US$m |
| US$m |
| US$m |
| US$m |
| US$m |
| US$m | | |
| Group auditors | 2.7 | | 2.6 | | 2.4 | | 1.4 | | 1.4 | | 1.4 | | 4.1 | | 4.0 | | 3.8 | |
| Other auditors | 0.2 | | 0.2 | | 0.2 | | 0.1 | | 0.3 | | 0.1 | | 0.3 | | 0.5 | | 0.3 | |
| |
| |
| |
| |
| |
| |
| |
| |
| |
| |
| | 2.9 | | 2.8 | | 2.6 | | 1.5 | | 1.7 | | 1.5 | | 4.4 | | 4.5 | | 4.1 | |
| |
| |
| |
| |
| |
| |
| |
| |
| |
| | |
| Amounts payable to the Group Auditors | | | | | | | | | | | | | | | | | | | |
| for non audit work: | | | | | | | | | | | | | | | | | | | |
| Tax | 0.6 | | 0.9 | | 0.3 | | 1.7 | | 0.9 | | 0.8 | | 2.3 | | 1.8 | | 1.1 | |
| Internal audit | 0.3 | | 0.2 | | 0.4 | | - | | - | | - | | 0.3 | | 0.2 | | 0.4 | |
| Half year review and other public filings | 0.3 | | 0.6 | | 0.2 | | 0.2 | | 0.1 | | 0.1 | | 0.5 | | 0.7 | | 0.3 | |
| Work connected with acquisitions and | | | | | | | | | | | | | | | | | | | |
| disposals | - | | - | | - | | 0.3 | | 0.4 | | 0.7 | | 0.3 | | 0.4 | | 0.7 | |
| Other | 0.8 | | 1.4 | | 1.5 | | 0.4 | | 0.8 | | 0.9 | | 1.2 | | 2.2 | | 2.4 | |
| |
| |
| |
| |
| |
| |
| |
| |
| |
| |
| | 2.0 | | 3.1 | | 2.4 | | 2.6 | | 2.2 | | 2.5 | | 4.6 | | 5.3 | | 4.9 | |
| |
| |
| |
| |
| |
| |
| |
| |
| |
| |
| | |
| (a) | The audit fees payable to PricewaterhouseCoopers, the Group auditors, are reviewed by the Audit committee. The committee sets the policy for awarding non audit work to the auditors and reviews the nature and extent of such work, and the amount of the related fees, to ensure that independence is maintained. The fees disclosed above consolidate all payments made to PricewaterhouseCoopers by the Companies and their subsidiaries. |
| (b) | Amounts payable to PricewaterhouseCoopers for non audit work for the Group's UK companies were US$0.9 million (2001: US$1.5 million, 2000: US$0.4 million) and for the Group's Australian companies were US$1.7 million (2001: US$1.9 million, 2000: US$2.5 million). |
| (c) | Fees to firms of accountants other than PricewaterhouseCoopers for non audit services amounted to US$5.5 million (2001: US$10.4 million). Such services included assistance with the implementation of new systems, internal audit and tax advice. |
A-50
Back to Contents
RIO TINTO PLC - RIO TINTO LIMITED
NOTES TO FINANCIAL STATEMENTS - (continued)
38 Related party transactions
Information about material related party transactions of the Rio Tinto Group is set out below:
Subsidiary companies: Details of investments in principal subsidiary companies are disclosed in note 31.
Joint ventures and associates: Information relating to joint ventures and associates can be found in the following notes
Note 5
Note 6
Note 7
Note 13
Note 16
Note 19
Note 25
Note 26
Note 27
Note 32
Note 33
Note 35
| - Net interest payable and similar charges
- Amortisation of discount
- Taxation charge for the year
- Fixed asset investments
- Accounts receivable and prepayments
- Accounts payable and accruals
- Share premium and reserves
- Product analysis
- Geographical analysis
- Principal joint venture interests
- Principal associates
- Purchases and sales of subsidiaries, joint arrangements, joint ventures and associates |
Information relating to joint arrangements can be found in note 34 - Principal joint arrangements.
Pension funds: Information relating to pension fund arrangements is disclosed in note 40
Directors: Details of directors' remuneration are set out in note 36 and in the remuneration report on pages 53 to 59 of the 2002 Annual Report and Financial Statements.
Leighton Holdings Limited (Leighton)
In 2001, Mr Morschel became a director and, subsequently, the chairman of Leighton, Australia's largest project development and contracting group. A number of Rio Tinto companies in Australia and Indonesia have, in the ordinary course of their businesses, awarded commercial contracts to subsidiaries of Leighton. The Board does not consider the value of these contracts to be material to the business of either Leighton or the Rio Tinto Group.
Transactions between the Rio Tinto plc part of the Group and the Rio Tinto Limited part of the Group
These are eliminated on the consolidation of the Rio Tinto Group. Transactions during the year included the following:
| - | A dividend of US $146 million was paid by Rio Tinto Limited on the DLC Dividend Share, which was issued to facilitate the efficient management of funds within the DLC structure. Of this, US$55 million was paid out of Rio Tinto plc's 37.4% share of the reserves of Rio Tinto Limited and, therefore, had no impact on the shareholders' funds of Rio Tinto plc. The remaining US$91 million of this dividend gave rise to an increase in the shareholders' funds of the Rio Tinto plc part of the Group. This dividend, however, had no impact on the shareholders' funds of the Rio Tinto Group as the economic interests of shareholders both of Rio Tinto plc and Rio Tinto Limited are in the combined net assets of the two dual listed companies. |
| | |
| - | The ownership of Itallumina was transferred from a Rio Tinto Limited subsidiary to a Rio Tinto plc subsidiary during 2002 for a consideration of US$13 million. The Rio Tinto Limited part of the Group recognised a gain of US$5 million in respect of this disposal. |
39 Bougainville Copper Limited ('BCL')
The Panguna mine remains shut down. Access to the mine site has not been possible and an accurate assessment of the condition of the assets cannot be determined. Considerable funding would be required to recommence operations to the level which applied at the time of the mine's closure in 1989 and these funding requirements cannot be forecast accurately. The directors do not have access to reliable, verifiable or objective information on BCL and the directors have therefore decided to exclude BCL information from the financial statements. BCL reported a net profit of US$2 million for the financial year (2001: profit of US$3 million, 2000: profit of US$6 million). This is based upon actual transactions for the financial year. The aggregate amount of capital and reserves reported by BCL as at 31 December 2002 was US$76 million (2001: US$79 million). The Group owns 214,887,966 shares in BCL, representing 53.6 per cent of the issued share capital. The investment of US$195 million was fully provided against in 1991. At 31 December 2002, the market value of the shareholding in BCL was US$16 million.
A-51
Back to Contents
RIO TINTO PLC - RIO TINTO LIMITED
NOTES TO FINANCIAL STATEMENTS - (continued)
40 Post retirement benefits
a) Description of schemes
The Group operates a number of pension plans around the world. Whilst some of these plans are defined contribution, the majority are of the defined benefit type, with assets held in separate trustee administered funds, which are reviewed by independent qualified actuaries. A triennial actuarial valuation of the Group's UK plan was made at 31 March 2000 using the projected unit method. The main financial assumptions used for the independent actuarial review as at 31 December 2002 were: rate of return on investments 6.5 per cent (2001: 7.0 per cent), rate of earnings growth 4.8 per cent (2001: 5.0 per cent) plus promotional salary scale, rate of pension increase 2.3 per cent (2001: 2.5 per cent). Assets were measured at market value, smoothed over a one year period (2001: smoothed market value).
Based on an average of market prices for the four quarters to 31 December 2002, the value of the assets in the UK pension plans was sufficient to cover 129 per cent (2001: 154 per cent) of the benefits that had accrued to members after allowing for expected increases in earnings. The smoothed market value of the assets was US$1,358 million (2001: US$1,417 million).
In Australia, whilst Group companies sponsor or subscribe to a number of pension plans, the Rio Tinto Staff Superannuation Fund is the only significant plan. This plan principally contains defined contribution liabilities but also has defined benefit liabilities. Independent actuarial valuations are made annually using the projected unit method. The main financial assumptions used for the valuation as at 30 September 2002 were: rate of return on investments (after tax) 6.5 per cent (2001: 6.5 per cent), rate of earnings growth 4.0 per cent (2001: 4.0 per cent) plus promotional salary scale, rate of pension increase 2.5 per cent (2001: 2.5 per cent). Assets were measured at smoothed market value (2001: smoothed market value).
Based on an average of the market prices for the four quarters to 31 December 2002, the value of the assets in the Australian pension plans was sufficient to cover 103 per cent (2001: 115 per cent) of the benefits that had accrued to members after allowing for expected increases in earnings. The smoothed market value of the assets was US$600 million (2001: US$586 million).
A number of defined benefit pension plans are sponsored by the US entities, typically with separate provision for salaried and hourly paid staff. Independent actuarial valuations are made annually using the projected unit method. The main financial assumptions used for the valuation as at 30 September 2002 were: rate of return on investments 6.7 per cent (2001: 7.5 per cent), rate of earnings growth, where appropriate, 3.25 per cent (2001: 3.5 per cent). Assets were measured at smoothed market value (2001: smoothed market value).
Based on an average of the market prices for the four quarters to 31 December 2002, the value of the assets in the US plans was sufficient to cover 81 per cent (2001: 103 per cent) of the benefits that had accrued to members after allowing for expected increases in earnings. Within the total there were plans which had deficits of US$136 million (2001: US$67 million). The smoothed market value of the assets was US$551 million (2001: US$613 million). Contributions will be paid, if necessary, to ensure that the plans meet statutory US funding levels.
A number of defined benefit pension plans are sponsored by entities in Canada. Independent actuarial valuations are made annually using the projected unit method. The main financial assumptions used for the valuation as at 30 September 2002 were: rate of return on investments 6.5 per cent (2001: 7.75 per cent), rate of earnings growth, where appropriate, 3.7 per cent (2001: 5.0 per cent). Assets were measured at smoothed market value (2001: smoothed market value).
Based on an average of the market prices for the four quarters to 31 December 2002, the value of the assets in the Canadian plans was sufficient to cover 82 per cent (2001: 105 per cent) of the benefits that had accrued to members after allowing for expected increases in earnings. Within the total there were plans which had deficits of US$134 million (2001: US$27 million). The smoothed market value of the assets was US$538 million (2001: US$557 million). Additional contributions will be paid in 2003 to meet a funding shortfall in one Canadian plan.
The main defined benefit plans outside the UK, Australia and North America were assessed at various dates during 2001 and 2002. The total market value of the assets at the assessment dates was US$202 million (2001: US$224 million). The actuarial value of the total assets of these plans was sufficient to cover 141 per cent (2001: 137 per cent) of the benefits that had accrued to members after allowing for expected increases in earnings. The expected average remaining service life in the major plans ranges from 10 to 20 years with an overall average of 12 years.
The main pension plans providing purely defined contribution benefits held assets, equal to their liabilities, of US$101 million as at 31 December 2002. The Group's contributions to these plans are charged against profits.
The Group uses asset values smoothed over a one year period in arriving at its pension costs under SSAP 24. Pension costs for 2003 are expected to be higher than in 2002 as a result of changes in stock market values.
Certain subsidiaries of the Group, mainly in the US, provide health and life insurance benefits to retired employees and in some cases their beneficiaries and covered dependants. Eligibility for cover is dependent upon certain age and service criteria. These arrangements are unfunded. On 30 September 2002, the unfunded accumulated post retirement benefits obligation and annual cost of accrual of benefits were determined by independent actuaries using the projected unit method. In the US, the main financial assumptions were: discount rate 6.5 per cent (at 30 September 2001: 7.5 per cent), Medical Trend Rate 8.0 per cent reducing to 5.0 per cent by the year 2009 (at 30 September 2001 initially 8.5 per cent reducing to 5.0 per cent by the year 2009), claims cost based on individual company experience. The assumptions were consistent with those adopted for determining pension costs. At 30 September 2002, the unfunded accumulated post retirement benefits obligation (excluding associates and joint ventures) was US$437 million (at 30 September 2001: US$362 million).
b) FRS 17 Transitional disclosures for 2002
Mandatory implementation of FRS 17 - 'Retirement Benefits', which deals with accounting for post retirement benefits, has been delayed until the year ending 31 December 2005 but additional disclosures are required for the current year, which are shown below. The standard requires pension deficits, and surpluses to the extent that they are considered recoverable, to be recognised in full. Annual service cost and net financial income on the assets and liabilities of the schemes are recognised through earnings. Other fluctuations in the value of the surpluses/deficits are recognised in the Statement of Total Recognised Gains and Losses (STRGL).
Details of post retirement benefit scheme assets and liabilities at 31 December 2002 and 2001, valued on a projected unit basis in accordance with FRS 17, are set out below:
A-52
Back to Contents
RIO TINTO PLC - RIO TINTO LIMITED
NOTES TO FINANCIAL STATEMENTS - (continued)
40 Post retirement benefits (continued)
| | UK | | Australia | | US | | Canada | | Other (mainly Africa) | |
| |
| |
| |
| |
| |
| |
| Main assumptions for FRS 17 purposes | | | | | | | | | | |
| At 31 December 2002 | | | | | | | | | | |
| Rate of increase in salaries | 4.8 | % | 4.0 | % | 3.2 | % | 3.7 | % | 10.5 | % |
| Rate of increase in pensions | 2.3 | % | 2.5 | % | - | | - | | 7.0 | % |
| Discount rate | 5.6 | % | 6.2 | % | 6.2 | % | 6.5 | % | 11.5 | % |
| Inflation | 2.3 | % | 2.5 | % | 2.2 | % | 2.2 | % | 7.0 | % |
| | | | | | | | | | | |
| At 31 December 2001 | | | | | | | | | | |
| Rate of increase in salaries | 5.5 | % | 4.0 | % | 3.5 | % | 4.0 | % | 10.5 | % |
| Rate of increase in pensions | 2.5 | % | 2.5 | % | - | | - | | 5.8 | % |
| Discount rate | 6.0 | % | 6.5 | % | 7.0 | % | 7.0 | % | 11.5 | % |
| Inflation | 2.5 | % | 2.5 | % | 2.5 | % | 2.5 | % | 5.8 | % |
The main financial assumptions used for the health care schemes, which are predominantly in the US, were: discount rate 6.2% (2001: 7%), Medical Trend rate: 8% reducing to 5% by the year 2009 (2001: Medical Trend rate: 8.5% reducing to 5% by the year 2009), claims cost based on individual company experience.
| | UK | | Australia | | US | | Canada | | Other (mainly Africa) | |
| |
| |
| |
| |
| |
| |
| Long term rate of return expected at 31 December 2002 | | | | | | | | | | |
| Equities | 7.3 | % | 7.0 | % | 7.2 | % | 7.2 | % | 12.5 | % |
| Bonds | 5.0 | % | 5.5 | % | 5.6 | % | 6.0 | % | 11.0 | % |
| Other | 4.6 | % | 5.9 | % | 6.4 | % | 5.0 | % | 10.2 | % |
| | | | | | | | | | | |
| Long term rate of return expected at 31 December 2001 | | | | | | | | | | |
| Equities* | 7.5 | % | 7.0 | % | 7.5 | % | 7.5 | % | 12.5 | % |
| Bonds | 5.5 | % | 6.0 | % | 6.5 | % | 6.5 | % | 11.0 | % |
| Other | 5.3 | % | 6.3 | % | 6.8 | % | 5.1 | % | 9.7 | % |
* The equity return assumptions applied in determining the impact of FRS 17 on the profit and loss account for 2002 have been reduced by approximately 1 per cent on average from those quoted in the 2001 Annual report and financial statements.
Scheme assets
The assets in the schemes and the contributions made were:
| | UK | | Australia | | US | | Canada | | Other
(mainly
Africa) | | Total | |
| |
| |
| |
| |
| |
| |
| |
| Value at 31 December 2002 | US$m | | US$m | | US$m | | US$m | | US$m | | US$m | |
| Equities | 823 | | 377 | | 342 | | 271 | | 93 | | 1,906 | |
| Bonds | 294 | | 165 | | 150 | | 180 | | 18 | | 807 | |
| Other | 155 | | 65 | | 39 | | 64 | | 190 | | 513 | |
| |
| |
| |
| |
| |
| |
| |
| | 1,272 | | 607 | | 531 | | 515 | | 301 | | 3,226 | |
| |
| |
| |
| |
| |
| |
| |
| | | | | | | | | | | | | |
| Value at 31 December 2001 | | | | | | | | | | | | |
| Equities | 965 | | 416 | | 441 | | 375 | | 161 | | 2,358 | |
| Bonds | 244 | | 137 | | 135 | | 189 | | 45 | | 750 | |
| Other | 147 | | 64 | | 56 | | 17 | | 30 | | 314 | |
| |
| |
| |
| |
| |
| |
| |
| | 1,356 | | 617 | | 632 | | 581 | | 236 | | 3,422 | |
| |
| |
| |
| |
| |
| |
| |
| | | | | | | | | | | | | |
| Employer contributions made during 2002 | - | | 10 | | 4 | | 15 | | 4 | | 33 | |
| |
| |
| |
| |
| |
| |
| |
| | | | | | | | | | | | | |
| Employer contributions made during 2001 | - | | 6 | | 3 | | 13 | | - | | 22 | |
| |
| |
| |
| |
| |
| |
| |
In addition, there were contributions of US$16 million (2001: US$13 million) in respect of unfunded health care schemes in the year. Since these schemes are unfunded, contributions for future years will be equal to benefit payments and therefore cannot be pre-determined.
A-53
Back to Contents
RIO TINTO PLC - RIO TINTO LIMITED
NOTES TO FINANCIAL STATEMENTS - (continued)
40 Post retirement benefits (continued)
In relation to pensions, it is expected that there will be no regular employer or employee contributions to the UK plan in the period before the next full valuation. There are no pre-agreed contribution rates outside the UK, Canada and Australia for periods beyond 2003. Cash contributions to the main Australian plan recommended in December 2002 at rates set by the actuary to the plan and are primarily to defined contribution arrangements. In the US, contributions are agreed annually in nominal terms. Contribution rates for the Canadian schemes vary between the plans from zero to 6.5 per cent, although additional contributions will be paid in 2003 to meet a funding shortfall in one plan.
The most recent full valuation of the UK schemes was at 31 March 2000. The most recent full valuation of the Australian schemes was at 30 September 2002. For both the US and Canadian schemes, the most recent full valuation was at 1 January 2002.
Surpluses/(deficits) in the plans
The following amounts were measured in accordance with FRS 17:
| At 31 December 2002 | UK US$m | | Australia US$m | | US US$m | | Canada US$m | | Other US$m | | Healthcare US$m | | Total US$m | |
| |
| |
| |
| |
| |
| |
| |
| |
| Total market value of assets | 1,272 | | 607 | | 531 | | 515 | | 301 | | - | | 3,226 | |
| Present value of plan liabilities | (1,178 | ) | (594 | ) | (721 | ) | (670 | ) | (312 | ) | (417 | ) | (3,892 | ) |
| |
| |
| |
| |
| |
| |
| |
| |
| Surplus/(deficit) in the plans | 94 | | 13 | | (190 | ) | (155 | ) | (11 | ) | (417 | ) | (666 | ) |
| |
| |
| |
| |
| |
| |
| | | |
| Related deferred tax | | | | | | | | | | | | | 113 | |
| Related outside shareholders' interest | | | | | | | | | | | | | 47 | |
| | | | | | | | | | | | | |
| |
| Net post retirement liability | | | | | | | | | | | | | (506 | ) |
| | | | | | | | | | | | | |
| |
| Surplus/(deficit) in the plans comprises: | | | | | | | | | | | | | | |
| Surplus | 108 | | 13 | | 45 | | 2 | | - | | - | | 168 | |
| Deficit | (14 | ) | - | | (235 | ) | (157 | ) | (11 | ) | (417 | ) | (834 | ) |
| |
| |
| |
| |
| |
| |
| |
| |
| | 94 | | 13 | | (190 | ) | (155 | ) | (11 | ) | (417 | ) | (666 | ) |
| |
| |
| |
| |
| |
| |
| |
| |
| At 31 December 2001 | UK US$m | | Australia US$m | | US US$m | | Canada US$m | | Other US$m | | Healthcare US$m | | Total US$m | |
| |
| |
| |
| |
| |
| |
| |
| |
| Total market value of assets | 1,356 | | 617 | | 632 | | 581 | | 236 | | - | | 3,422 | |
| Present value of plan liabilities | (1,036 | ) | (537 | ) | (619 | ) | (587 | ) | (242 | ) | (323 | ) | (3,344 | ) |
| |
| |
| |
| |
| |
| |
| |
| |
| Surplus/(deficit) in the plans | 320 | | 80 | | 13 | | (6 | ) | (6 | ) | (323 | ) | 78 | |
| |
| |
| |
| |
| |
| |
| | | |
| Related deferred tax | | | | | | | | | | | | | (19 | ) |
| Related outside shareholders' interest | | | | | | | | | | | | | 24 | |
| | | | | | | | | | | | | |
| |
| Net post retirement asset | | | | | | | | | | | | | 83 | |
| | | | | | | | | | | | | |
| |
| Surplus/(deficit) in the plans comprises: | | | | | | | | | | | | | | |
| Surplus | 327 | | 80 | | 129 | | 19 | | - | | - | | 555 | |
| Deficit | (7 | ) | - | | (116 | ) | (25 | ) | (6 | ) | (323 | ) | (477 | ) |
| |
| |
| |
| |
| |
| |
| |
| |
| | 320 | | 80 | | 13 | | (6 | ) | (6 | ) | (323 | ) | 78 | |
| |
| |
| |
| |
| |
| |
| |
| |
If the above amounts had been recognised in the financial statements, the Group's shareholders' funds at 31 December would have been as follows:
| | 2002 US$m | | 2001 US$m | |
| |
| |
| |
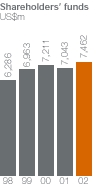
| Shareholders' funds including SSAP 24 post retirement net asset (2001 as restated) | 7,462 | | 7,043 | |
| Deduct: SSAP 24 post retirement net asset | 96 | | 140 | |
| |
| |
| |
| Shareholders' funds excluding SSAP 24 post retirement net asset | 7,366 | | 6,903 | |
| Add: FRS 17 post retirement net (liability)/asset | (506 | ) | 83 | |
| |
| |
| |
| Shareholders' funds including FRS 17 post retirement net (liability)/asset | 6,860 | | 6,986 | |
| |
| |
| |
A-54
Back to Contents
RIO TINTO PLC - RIO TINTO LIMITED
NOTES TO FINANCIAL STATEMENTS - (continued)
40 Post retirement benefits (continued)
Movements in surplus/(deficit) during the year
The net post retirement surplus/(deficit) under FRS 17 would have moved as follows during 2002:
| | 2002 | |
| | US$m | |
| |
| |
| Net post retirement surplus at 1 January | 78 | |
| Movement in year: | | |
| Currency translation adjustment | 19 | |
| Total current service cost (employer and employee) | (113 | ) |
| Past service cost | (11 | ) |
| Curtailment and settlement loss (one-off costs associated with early retirements on restructuring) | (2 | ) |
| Other net finance income | 23 | |
| Contributions (including employee contributions) | 59 | |
| Actuarial loss recognised in STRGL | (719 | ) |
| |
| |
| Net post retirement deficit at 31 December | (666 | ) |
| |
| |
| Amounts which would have been recognised in the profit and loss account and in the STRGL under FRS 17 | | |
| The following amounts would have been included within operating profit under FRS 17: | | |
| | 2002 | |
| | US$m | |
| |
| |
| Employer current service cost | (103 | ) |
| Past service cost | (11 | ) |
| Curtailment and settlement cost | (2 | ) |
| |
| |
| Total operating charge (of which US$13 million related to defined contribution schemes) | (116 | ) |
| |
| |
| | | |
| The following amounts would have been included as other net finance income under FRS 17: | | |
| | 2002 | |
| | US$m | |
| |
| |
| Expected return on pension scheme assets (a) | 254 | |
| Interest on post retirement liabilities | (231 | ) |
| |
| |
| Net return | 23 | |
| |
| |
If the above amounts had been recognised in the financial statements, the Group's reported net earnings for 2002 would have decreased by US$15 million.
The following amounts would have been recognised within the Statement of Total Recognised Gains and Losses (STRGL) under FRS 17:
| | 2002 | | 2002 | |
| | % | | US$m | |
| |
| |
| |
| | | | | |
| Actual return on pension scheme assets less expected return (a) | | | (599 | ) |
| - as a percentage of scheme assets at 31 December 2002 | (19 | )% | | |
| | | | | |
| Experience gains and losses on post retirement liabilities (i.e. variances between the actuarial | | | | |
| estimate of liabilities and the subsequent outcome) | | | 28 | |
| - as a percentage of the present value of post retirement liabilities at 31 December 2002 | 1 | % | | |
| | | | | |
| Change in assumptions | | | (148 | ) |
| |
| |
| |
| Total amount recognised in STRGL | | | (719 | ) |
| - as a percentage of the present value of post retirement liabilities at 31 December 2002 | (18 | )% | | |
| |
| |
| |
| | | | | |
| (a) As calculated using the revised assumptions for equity returns as at 31 December 2001. | | | | |
A-55
Back to Contents
RIO TINTO PLC - RIO TINTO LIMITED
NOTES TO FINANCIAL STATEMENTS - (continued)
41 Rio Tinto financial information by business unit
| | | | Gross turnover (a) | | EBITDA (b) | | Net earnings (c) | |
| Rio Tinto |
|
|
|
|
|
|
|
|
|
|
|
|
|
|
|
| interest | 2002 | | 2001 | | 2000 | 2002 | | 2001 | | 2000 | 2002 | | 2001 | | 2000 |
|
|
|
|
|
|
|
|
|
|
| % | US$m | US$m | US$m | US$m | US$m | US$m | US$m | US$m | US$m |
| Iron Ore | | | | | | | | | | | | | | | | | | | | |
| Hamersley (incl. HIsmel† ®) | 100.0 | | 1,117 | | 1,118 | | 1,100 | | 688 | | 733 | | 621 | | 410 | | 441 | | 344 | |
| Robe River | 53.0 | | 240 | | 193 | | 90 | | 160 | | 127 | | 50 | | 54 | | 45 | | 16 | |
| Iron Ore Company of Canada | 58.7 | | 400 | | 380 | | 179 | | 16 | | 67 | | 42 | | (6 | ) | 16 | | 7 | |
| | | |
| |
| |
| |
| |
| |
| |
| |
| |
| |
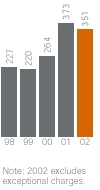
| | | | 1,757 | | 1,691 | | 1,369 | | 864 | | 927 | | 713 | | 458 | | 502 | | 367 | |
| | | |
| |
| |
| |
| |
| |
| |
| |
| |
| |
| Energy | | | | | | | | | | | | | | | | | | | | |
| Kennecott Energy | 100.0 | | 949 | | 882 | | 817 | | 260 | | 223 | | 210 | | 86 | | 84 | | 81 | |
| Pacific Coal | 100.0 | | 417 | | 362 | | 341 | | 236 | | 201 | | 177 | | 136 | | 117 | | 93 | |
| Kaltim Prima Coal | 50.0 | | 216 | | 212 | | 150 | | 79 | | 101 | | 66 | | 26 | | 42 | | 18 | |
| Coal & Allied | 75.7 | | 623 | | 647 | | 340 | | 207 | | 255 | | 128 | | 68 | | 102 | | 49 | |
| Rossing | 68.6 | | 112 | | 115 | | 124 | | 52 | | 68 | | 54 | | 23 | | 21 | | 19 | |
| Energy Resources of Australia | 68.4 | | 113 | | 90 | | 33 | | 50 | | 38 | | 19 | | 12 | | 7 | | 4 | |
| | | |
| |
| |
| |
| |
| |
| |
| |
| |
| |
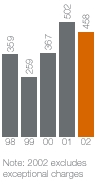
| | | | 2,430 | | 2,308 | | 1,805 | | 884 | | 886 | | 654 | | 351 | | 373 | | 264 | |
| | | |
| |
| |
| |
| |
| |
| |
| |
| |
| |
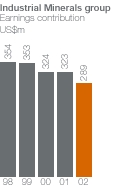
| Industrial Minerals | | | 1,847 | | 1,768 | | 1,869 | | 722 | | 797 | | 786 | | 289 | | 323 | | 324 | |
| | | |
| |
| |
| |
| |
| |
| |
| |
| |
| |
| Aluminium - Comalco | 100.0 | | 1,454 | | 1,499 | | 1,589 | | 504 | | 598 | | 731 | | 256 | | 313 | | 338 | |
| | | |
| |
| |
| |
| |
| |
| |
| |
| |
| |
| Copper | | | | | | | | | | | | | | | | | | | | |
| Kennecott Utah Copper | 100.0 | | 755 | | 675 | | 804 | | 223 | | 271 | | 295 | | 78 | | 81 | | 100 | |
| Escondida | 30.0 | | 283 | | 289 | | 388 | | 121 | | 142 | | 236 | | 32 | | 41 | | 97 | |
| Freeport | 16.5 | | 306 | | 296 | | 307 | | 139 | | 128 | | 125 | | 19 | | 4 | | 2 | |
| Freeport Joint Venture | 40.0 | | 349 | | 316 | | 273 | | 215 | | 186 | | 149 | | 113 | | 88 | | 71 | |
| Palabora | 49.2 | | 201 | | 233 | | 252 | | 54 | | 66 | | 71 | | 13 | | 14 | | 15 | |
| Peak/Northparkes | (d | ) | 74 | | 87 | | 58 | | 22 | | 43 | | 31 | | (1 | ) | 13 | | 7 | |
| Other copper | | | 148 | | 145 | | 83 | | 78 | | 64 | | 38 | | 36 | | 10 | | 8 | |
| Other metals | (e | ) | 240 | | 251 | | 252 | | 24 | | 43 | | 61 | | - | | 11 | | 23 | |
| | | |
| |
| |
| |
| |
| |
| |
| |
| |
| |
| | | | 2,356 | | 2,292 | | 2,417 | | 876 | | 943 | | 1,006 | | 290 | | 262 | | 323 | |
| | | |
| |
| |
| |
| |
| |
| |
| |
| |
| |
| Diamonds & Gold | | | | | | | | | | | | | | | | | | | | |
| Argyle | 100.0 | | 372 | | 278 | | 261 | | 178 | | 147 | | 134 | | 65 | | 58 | | 68 | |
| Diavik | 60.0 | | - | | - | | - | | - | | - | | 0 | | - | | - | | - | |
| Kennecott Minerals | 100.0 | | 205 | | 196 | | 185 | | 93 | | 83 | | 91 | | 38 | | 33 | | 43 | |
| Kelian | 90.0 | | 168 | | 127 | | 90 | | 66 | | 35 | | 26 | | 17 | | 1 | | (9 | ) |
| Brazil | (f | ) | 115 | | 111 | | 148 | | 40 | | 46 | | 68 | | 16 | | 26 | | 45 | |
| Other Diamonds & Gold | | | 40 | | 106 | | 169 | | 15 | | 26 | | 42 | | 8 | | 15 | | 16 | |
| | | |
| |
| |
| |
| |
| |
| |
| |
| |
| |
| | | | 900 | | 818 | | 853 | | 392 | | 337 | | 361 | | 144 | | 133 | | 163 | |
| | | |
| |
| |
| |
| |
| |
| |
| |
| |
| |
| Other items | | | 84 | | 62 | | 70 | | (152 | ) | (50 | ) | (87 | ) | (54 | ) | 27 | | (26 | ) |
| Exploration and evaluation | | | | | | | | | (130 | ) | (130 | ) | (136 | ) | (109 | ) | (104 | ) | (108 | ) |
| Net interest | | | | | | | | | | | | | | | (95 | ) | (167 | ) | (138 | ) |
| | | | | | | | | |
| |
| |
| |
| |
| |
| |
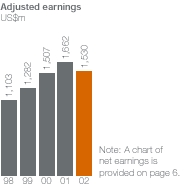
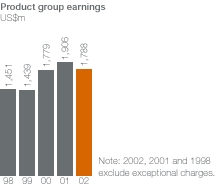
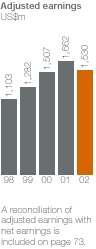
| Adjusted EBITDA and adjusted earnings | | | | | | | | | 3,960 | | 4,308 | | 4,028 | | 1,530 | | 1,662 | | 1,507 | |
| Exceptional charges | | | | | | | | | (116 | ) | - | | | | (879 | ) | (583 | ) | - | |
| | | |
| |
| |
| |
| |
| |
| |
| |
| |
| |
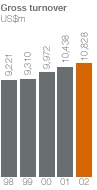
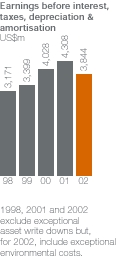
| Total | | | 10,828 | | 10,438 | | 9,972 | | 3,844 | | 4,308 | | 4,028 | | 651 | | 1,079 | | 1,507 | |
| | | |
| |
| |
| |
| |
| |
| |
| |
| |
| |
| | | | | | | | | | | | | | | | | | | | | |
| Reconciliation of EBITDA | | | | | | | | | | | | | | | | | | | | |
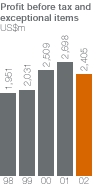
| Profit on ordinary activities before interest | | | | | | | | | 1,602 | | 2,387 | | 2,912 | | | | | | | |
| Depreciation & amortisation in subsidiaries | | | | | | | | | 954 | | 929 | | 849 | | | | | | | |
| Asset write downs relating to subsidiaries & joint ventures | | | | | | | | 955 | | 701 | | - | | | | | | | |
| Depreciation & amortisation in joint ventures & associates | | | | | | | | 333 | | 291 | | 267 | | | | | | | |
| | | | | | | | | |
| |
| |
| | | | | | | |
| | | | | | | | | | 3,844 | | 4,308 | | 4,028 | | | | | | | |
| | | | | | | | | |
| |
| |
| | | | | | | |
| | |
| (a) | Gross turnover includes 100 per cent of subsidiaries' turnover and the Group's share of the turnover of joint ventures and associates. |
| (b) | EBITDA of subsidiaries, joint ventures and associates represents profit before: tax, net interest payable, depreciation and amortisation. |
| (c) | Net earnings represent after tax earnings attributable to the Rio Tinto Group. Earnings of subsidiaries are stated before interest charges but after the amortisation of the discount related to provisions. Earnings attributable to joint ventures and associates include interest charges. |
| (d) | Rio Tinto has a 100 per cent interest in Peak and an 80 per cent interest in the Northparkes joint venture. |
| (e) | Includes Anglesey Aluminium in which Rio Tinto’s interest is 51 per cent. |
| (f) | Includes Morro do Ouro in which Rio Tinto’s interest is 51 per cent. |
| (g) | Business units have been classified above according to the Group’s management structure. Generally, this structure has regard to the primary product of each business unit but there are exceptions. For example, the Copper group includes the gold revenues of Kennecott Utah Copper and Freeport (Rio Tinto share) and the businesses of Rio Tinto Aluminium and Zinkgruvan. This summary differs, therefore, from the Product Analysis in which the contributions of individual business units are attributed to several products as appropriate. |
A-56
Back to Contents
RIO TINTO PLC - RIO TINTO LIMITED
NOTES TO FINANCIAL STATEMENTS - (continued)
41 Rio Tinto financial information by business unit (continued)
| Capital expenditure (h) | | Depreciation (i) | | Operating
assets (j) | | Employees (k) | |
|
|
|
|
|
|
|
|
|
|
|
|
|
|
|
|
|
|
2002 | | 2001 | | 2000 | 2002 | | 2001 | | 2000 | 2002 | | 2001 | 2002 | | 2001 | | 2000 |
|
|
|
|
|
|
|
|
|
|
|
US$m | US$m | US$m | US$m | US$m | US$m | US$m | US$m | Number | Number | Number |
| Iron Ore | | | | | | | | | | | | | | | | | | | | | | |
| Hamersley (incl. HIsmelt ®) | 79 | | 58 | | 76 | | 94 | | 90 | | 104 | | 923 | | 762 | | 2,006 | | 2,070 | | 2,164 | |
| Robe River | 81 | | 203 | | 35 | | 50 | | 37 | | 13 | | 1,409 | | 1,221 | | 496 | | 449 | | 208 | |
| Iron Ore Company of Canada | 39 | | 242 | | 62 | | 35 | | 36 | | 18 | | 408 | | 612 | | 1,936 | | 2,099 | | 694 | |
| |
| |
| |
| |
| |
| |
| |
| |
| |
| |
| |
| |
| | 199 | | 503 | | 173 | | 179 | | 163 | | 135 | | 2,740 | | 2,595 | | 4,438 | | 4,618 | | 3,066 | |
| |
| |
| |
| |
| |
| |
| |
| |
| |
| |
| |
| |
| Energy | | | | | | | | | | | | | | | | | | | | | | |
| Kennecott Energy | 152 | | 54 | | 33 | | 128 | | 110 | | 100 | | 454 | | 439 | | 1,710 | | 1,656 | | 1,450 | |
| Pacific Coal | 126 | | 20 | | 11 | | 37 | | 31 | | 37 | | 406 | | 275 | | 679 | | 526 | | 473 | |
| Kaltim Prima Coal | 5 | | 4 | | 6 | | 21 | | 22 | | 25 | | 46 | | 59 | | 1,380 | | 1,348 | | 1,353 | |
| Coal & Allied | 58 | | 31 | | 14 | | 69 | | 44 | | 34 | | 626 | | 786 | | 1,375 | | 1,379 | | 662 | |
| Rossing | 5 | | (1 | ) | 7 | | 5 | | 5 | | 6 | | 47 | | 25 | | 786 | | 794 | | 911 | |
| Energy Resources of Australia | 4 | | 2 | | 1 | | 23 | | 22 | | 9 | | 140 | | 165 | | 262 | | 232 | | 88 | |
| |
| |
| |
| |
| |
| |
| |
| |
| |
| |
| |
| |
| | 350 | | 110 | | 72 | | 283 | | 234 | | 211 | | 1,719 | | 1,749 | | 6,192 | | 5,935 | | 4,937 | |
| |
| |
| |
| |
| |
| |
| |
| |
| |
| |
| |
| |
| Industrial Minerals | 133 | | 146 | | 194 | | 158 | | 144 | | 147 | | 2,098 | | 2,046 | | 6,723 | | 7,079 | | 7,239 | |
| |
| |
| |
| |
| |
| |
| |
| |
| |
| |
| |
| |
| Aluminium - Comalco | 261 | | 99 | | 52 | | 132 | | 117 | | 131 | | 2,353 | | 1,893 | | 3,374 | | 3,426 | | 3,354 | |
| |
| |
| |
| |
| |
| |
| |
| |
| |
| |
| |
| |
| Copper | | | | | | | | | | | | | | | | | | | | | | |
| Kennecott Utah Copper | 97 | | 115 | | 84 | | 129 | | 167 | | 161 | | 1,135 | | 1,838 | | 1,596 | | 1,926 | | 2,311 | |
| Escondida | 117 | | 188 | | 68 | | 52 | | 52 | | 53 | | 449 | | 447 | | 704 | | 623 | | 637 | |
| Freeport | 23 | | 25 | | 42 | | 50 | | 54 | | 55 | | 128 | | 109 | | 1,445 | | 1,475 | | 1,498 | |
| Freeport Joint Venture | 55 | | 57 | | 18 | | 40 | | 35 | | 27 | | 412 | | 398 | | | | | | | |
| Palabora | 64 | | 83 | | 76 | | 13 | | 21 | | 20 | | 282 | | 207 | | 2,176 | | 2,269 | | 2,803 | |
| Peak/Northparkes | 37 | | 31 | | 17 | | 23 | | 24 | | 18 | | 113 | | 102 | | 321 | | 323 | | 196 | |
| Other copper | 17 | | 13 | | 7 | | 39 | | 36 | | 16 | | 202 | | 155 | | 669 | | 673 | | 571 | |
| Other metals | 14 | | 13 | | 9 | | 16 | | 18 | | 16 | | 133 | | 150 | | 831 | | 879 | | 665 | |
| |
| |
| |
| |
| |
| |
| |
| |
| |
| |
| |
| |
| | 424 | | 525 | | 321 | | 362 | | 407 | | 366 | | 2,854 | | 3,406 | | 7,742 | | 8,168 | | 8,681 | |
| |
| |
| |
| |
| |
| |
| |
| |
| |
| |
| |
| |
| Diamonds & Gold | | | | | | | | | | | | | | | | | | | | | | |
| Argyle | 31 | | 52 | | 11 | | 76 | | 55 | | 24 | | 488 | | 493 | | 751 | | 794 | | 520 | |
| Diavik | 206 | | 182 | | 94 | | - | | - | | - | | 484 | | 318 | | 250 | | 99 | | 72 | |
| Kennecott Minerals | 21 | | 21 | | 22 | | 43 | | 41 | | 31 | | 155 | | 166 | | 763 | | 814 | | 877 | |
| Kelian | 2 | | 4 | | 2 | | 32 | | 31 | | 40 | | 20 | | 50 | | 835 | | 979 | | 1,035 | |
| Brazil | 14 | | 22 | | 16 | | 11 | | 11 | | 11 | | 91 | | 119 | | 1,320 | | 1,181 | | 1,154 | |
| Other diamonds & gold | 4 | | 9 | | 18 | | 4 | | 7 | | 13 | | 94 | | 118 | | 1,954 | | 2,005 | | 2,303 | |
| |
| |
| |
| |
| |
| |
| |
| |
| |
| |
| |
| |
| | 278 | | 290 | | 163 | | 166 | | 145 | | 119 | | 1,332 | | 1,264 | | 5,873 | | 5,872 | | 5,961 | |
| |
| |
| |
| |
| |
| |
| |
| |
| |
| |
| |
| |
| Other | 13 | | 3 | | (1 | ) | 7 | | 10 | | 7 | | 113 | | (199 | ) | 1,451 | | 1,418 | | 1,536 | |
| Less: joint ventures and | | | | | | | | | | | | | | | | | | | | | | |
| associates (h), (i) | (241 | ) | (271 | ) | (176 | ) | (333 | ) | (291 | ) | (267 | ) | | | | | | | | | | |
| |
| |
| |
| |
| |
| |
| |
| |
| |
| |
| |
| |
| Total | 1,417 | | 1,405 | | 798 | | 954 | | 929 | | 849 | | 13,209 | | 12,754 | | 35,793 | | 36,516 | | 34,774 | |
| |
| |
| |
| |
| |
| |
| | | | | |
| |
| |
| |
| Net debt | | | | | | | | | | | | | (5,747 | ) | (5,711 | ) | | | | | | |
| | | | | | | | | | | | | |
| |
| | | | | | | |
| Net assets | | | | | | | | | | | | | 7,462 | | 7,043 | | | | | | | |
| | | | | | | | | | | | | |
| |
| | | | | | | |
| (h) | Capital expenditure comprises the net cash outflow on purchases less disposals of property, plant and equipment. The details provided include 100 per cent of subsidiaries' capital expenditure and Rio Tinto's share of the capital expenditure of joint ventures and associates. Amounts relating to joint ventures and associates not specifically funded by Rio Tinto are deducted before arriving at total capital expenditure. |
| (i) | Depreciation figures include 100 per cent of subsidiaries' depreciation and amortisation of goodwill and include Rio Tinto's share of the depreciation and goodwill amortisation of joint ventures and associates. Amounts relating to joint ventures and associates are deducted before arriving at the total depreciation charge. |
| (j) | Operating assets of subsidiaries comprise net assets before deducting net debt, less outside shareholders' interests which are calculated by reference to the net assets of the relevant companies (i.e. net of such companies' debt). For joint ventures and associates, Rio Tinto's net investment is shown. For joint ventures and associates shown above, Rio Tinto's shares of operating assets, defined as for subsidiaries, are as follows: Escondida US$913 million (2001 : US$855 million), Freeport joint venture US$412 million (2001: US$398 million), Freeport associate US$533 million (2001: US$496 million), Kaltim Prima US$111 million (2001: US$144 million). |
| (k) | Employee numbers, which represent the average for the year, include 100 per cent of employees of subsidiary companies. Employee numbers for joint arrangements, joint ventures and associates are proportional to the Group's equity interest. Part time employees are included on a full time equivalent basis and people employed by contractors are not included. Average employee numbers include a part year effect for companies acquired during the year. Temporary employees are included in employee numbers. |
A-57
Back to Contents
RIO TINTO PLC - RIO TINTO LIMITED
NOTES TO FINANCIAL STATEMENTS - (continued)
42 Reconciliation to US Accounting Principles
Reconciliation with US GAAP
| | Rio Tinto plc - | | Rio Tinto Limited - | | | |
| part of Rio Tinto Group | part of Rio Tinto Group | Rio Tinto Group |
|
|
|
|
|
|
|
|
|
|
|
|
|
|
|
| 2002 | | 2001 | | 2000 | 2002 | | 2001 | | 2000 | 2002 | | 2001 | | 2000 |
| | Restated | Restated | | Restated | Restated | | Restated | Restated |
|
|
|
|
|
|
|
|
|
| US$m | US$m | US$m | US$m | US$m | US$m | US$m | US$m | US$m |
| Net earnings under UK GAAP | 195 | | 491 | | 1,064 | | 736 | | 942 | | 771 | | 651 | | 1,079 | | 1,507 | |
| Increase/(decrease) before tax in respect of: | | | | | | | | | | | | | | | | | | |
| Amortisation of goodwill - subsidiaries | | | | | | | | | | | | | | | | | | |
| and joint arrangements | 52 | | (88 | ) | (65 | ) | 38 | | (9 | ) | (10 | ) | 90 | | (97 | ) | (75 | ) |
| Amortisation of goodwill - equity | | | | | | | | | | | | | | | | | | |
| accounted companies (excluding Rio Tinto Limited) | - | | (35 | ) | (29 | ) | - | | - | | - | | - | | (35 | ) | (29 | ) |
| Amortisation of intangibles - subsidiaries | | | | | | | | | | | | | | | | | | |
| and joint arrangements | (59 | ) | - | | - | | - | | - | | - | | (59 | ) | - | | - | |
| Amortisation of intangibles - equity accounted | | | | | | | | | | | | | | | | | | |
| companies (excluding Rio Tinto Limited) | (9 | ) | - | | - | | - | | - | | - | | (9 | ) | - | | - | |
| Exchange differences taken to earnings under US GAAP | (53 | ) | 9 | | - | | 293 | | (225 | ) | (139 | ) | 240 | | (216 | ) | (139 | ) |
| Mark to market of certain derivative contracts | 6 | | (6 | ) | (15 | ) | 151 | | (42 | ) | (88 | ) | 157 | | (48 | ) | (103 | ) |
| Asset write downs - subsidiaries and joint | | | | | | | | | | | | | | | | | | |
| arrangements | (422 | ) | 571 | | - | | 420 | | - | | - | | (2 | ) | 571 | | - | |
| Asset write downs - equity accounted companies | | | | | | | | | | | | | | | | | | |
| excluding Rio Tinto Limited | (87 | ) | (103 | ) | - | | - | | - | | - | | (87 | ) | (103 | ) | - | |
| Pensions/post retirement benefits | 8 | | (73 | ) | (73 | ) | (7 | ) | - | | (3 | ) | 1 | | (73 | ) | (76 | ) |
| Exploration and evaluation | - | | - | | - | | (17 | ) | (83 | ) | 1 | | (17 | ) | (83 | ) | 1 | |
| Share options | (12 | ) | (6 | ) | (11 | ) | (5 | ) | (2 | ) | (2 | ) | (17 | ) | (8 | ) | (13 | ) |
| Higher cost of sales resulting from | | | | | | | | | | | | | | | | | | |
| acquisition accounting | - | | - | | - | | - | | (6 | ) | (41 | ) | - | | (6 | ) | (41 | ) |
| Other | (29 | ) | 7 | | (22 | ) | (52 | ) | (52 | ) | (17 | ) | (81 | ) | (45 | ) | (39 | ) |
| Taxation: | | | | | | | | | | | | | | | | | | |
| Tax effect of adjustments above | 11 | | (51 | ) | 37 | | (125 | ) | 134 | | 137 | | (114 | ) | 83 | | 174 | |
| Other tax adjustments | (13 | ) | 3 | | 2 | | - | | - | | - | | (13 | ) | 3 | | 2 | |
| Minority effect of adjustments above | 6 | | 2 | | - | | (165 | ) | 14 | | 5 | | (159 | ) | 16 | | 5 | |
| Share of Rio Tinto Limited US GAAP adjustments | 200 | | (103 | ) | (68 | ) | - | | - | | - | | - | | - | | - | |
| |
| |
| |
| |
| |
| |
| |
| |
| |
| |
| Net income/(loss) under US GAAP | (206 | ) | 618 | | 820 | | 1,267 | | 671 | | 614 | | 581 | | 1,038 | | 1,174 | |
| |
| |
| |
| |
| |
| |
| |
| |
| |
| |
| Basic earnings per ordinary share under | | | | | | | | | | | | | | | | | | |
| US GAAP | (19.3) | c | 58.1 | c | 77.1 | c | 254.0 | c | 134.6 | c | 113.9 | | 42.2 | c | 75.5 | c | 85.5 | c | |
| |
| |
| |
| |
| |
| |
| |
| |
| |
| |
| Diluted earnings per ordinary share | | | | | | | | | | | | | | | | | | |
| under US GAAP | (19.3) | c | 58.0 | c | 77.1 | c | 253.7 | c | 134.5 | c | 113.9 | c | 42.1 | c | 75.4 | c | 85.4 | c |
| |
| |
| |
| |
| |
| |
| |
| |
| |
| |
A-58
Back to Contents
RIO TINTO PLC - RIO TINTO LIMITED
NOTES TO FINANCIAL STATEMENTS - (continued)
42 Reconciliation to US Accounting Principles (continued)
| | Rio Tinto plc - | | Rio Tinto Limited - | | | |
| part of Rio Tinto Group | part of Rio Tinto Group | Rio Tinto Group |
|
|
|
|
|
|
| 2002 | | 2001 | | 2000 | 2002 | | 2001 | | 2000 | 2002 | | 2001 | | 2000 |
| | Restated | Restated | | Restated | Restated | | Restated | Restated |
|
|
|
|
|
|
|
|
|
US$m | US$m | US$m | US$m | US$m | US$m | US$m | US$m | US$m |
| Shareholders' funds under UK GAAP (2001 and | | | | | | | | | | | | | | | | | | |
| 2000 as previously reported) | 5,899 | | 6,039 | | 6,462 | | 2,510 | | 1,822 | | 1,414 | | 7,462 | | 7,176 | | 7,344 | |
| Prior year adjustment | - | | (137 | ) | (137 | ) | - | | 6 | | 6 | | - | | (133 | ) | (133 | ) |
| |
| |
| |
| |
| |
| |
| |
| |
| |
| |
| Shareholders' funds under UK GAAP (as | | | | | | | | | | | | | | | | | | |
| restated) | 5,899 | | 5,902 | | 6,325 | | 2,510 | | 1,828 | | 1,420 | | 7,462 | | 7,043 | | 7,211 | |
| Increase/(decrease) before tax in respect of: | | | | | | | | | | | | | | | | | | |
| Goodwill - subsidiaries and joint arrangements | 862 | | 1,110 | | 1,199 | | 203 | | 160 | | 185 | | 1,065 | | 1,270 | | 1,384 | |
| Goodwill - equity accounted companies | | | | | | | | | | | | | | | | | | |
| (excluding Rio Tinto Limited) | 352 | | 508 | | 543 | | - | | - | | - | | 352 | | 508 | | 543 | |
| Intangibles - subsidiaries and joint | | | | | | | | | | | | | | | | | | |
| arrangements | 271 | | - | | - | | - | | - | | - | | 271 | | - | | - | |
| Intangibles - equity accounted companies | | | | | | | | | | | | | | | | | | |
| (excluding Rio Tinto Limited) | 49 | | - | | - | | - | | - | | - | | 49 | | - | | - | |
| Mark to market of derivative contracts | (10 | ) | (2 | ) | (19 | ) | (44 | ) | (331 | ) | (84 | ) | (54 | ) | (332 | ) | (103 | ) |
| Asset write downs - subsidiaries and joint | | | | | | | | | | | | | | | | | | |
| arrangements | 133 | | 578 | | 7 | | 420 | | - | | - | | 553 | | 578 | | 7 | |
| Asset write downs - equity | | | | | | | | | | | | | | | | | | |
| accounted companies | | | | | | | | | | | | | | | | | | |
| (excluding Rio Tinto Limited) | - | | - | | 103 | | - | | - | | - | | - | | - | | 103 | |
| Pensions/post retirement benefits | (454 | ) | (296 | ) | (172 | ) | (18 | ) | 21 | | 97 | | (472 | ) | (275 | ) | (75 | ) |
| Exploration and evaluation | - | | - | | - | | (124 | ) | (102 | ) | (19 | ) | (124 | ) | (102 | ) | (19 | ) |
| Share options | (29 | ) | (17 | ) | (11 | ) | (9 | ) | (4 | ) | (2 | ) | (38 | ) | (21 | ) | (13 | ) |
| Higher cost of sales resulting from | | | | | | | | | | | | | | | | | | |
| acquisition accounting | - | | - | | - | | (49 | ) | (44 | ) | (41 | ) | (49 | ) | (44 | ) | (41 | ) |
| Reversal of additional provisions | | | | | | | | | | | | | | | | | | |
| under FRS 12 | 270 | | 270 | | 271 | | 114 | | 103 | | 110 | | 384 | | 373 | | 381 | |
| Amortisation on reversal of additional | | | | | | | | | | | | | | | | | | |
| provisions under FRS 12 | (54 | ) | (40 | ) | (35 | ) | (43 | ) | (32 | ) | (24 | ) | (97 | ) | (72 | ) | (59 | ) |
| Start up costs | (81 | ) | (79 | ) | (86 | ) | (29 | ) | (21 | ) | (10 | ) | (110 | ) | (100 | ) | (96 | ) |
| Proposed dividends | 272 | | 343 | | 336 | | 158 | | 194 | | 193 | | 430 | | 537 | | 529 | |
| Other | 15 | | 2 | | 3 | | (33 | ) | (22 | ) | 1 | | (18 | ) | (20 | ) | 4 | |
| Deferred tax on acquisitions: | | | | | | | | | | | | | | | | | | |
| Impact on mining property | - | | - | | - | | 825 | | 853 | | 666 | | 825 | | 853 | | 666 | |
| Impact on tax provisions | - | | - | | - | | (825 | ) | (853 | ) | (666 | ) | (825 | ) | (853 | ) | (666 | ) |
| Tax effect of other adjustments above | (32 | ) | (30 | ) | 1 | | (28 | ) | 138 | | (16 | ) | (60 | ) | 107 | | (15 | ) |
| Other tax adjustments | 80 | | 93 | | 90 | | (6 | ) | (6 | ) | (6 | ) | 74 | | 87 | | 84 | |
| Minority effect of adjustments above | (1 | ) | (4 | ) | (4 | ) | (100 | ) | 38 | | (9 | ) | (101 | ) | 34 | | (13 | ) |
| Share of Rio Tinto Limited US GAAP | | | | | | | | | | | | | | | | | | |
| adjustments | 155 | | 33 | | 142 | | - | | - | | - | | - | | - | | - | |
| |
| |
| |
| |
| |
| |
| |
| |
| |
| |
| Shareholders' funds under US GAAP | 7,697 | | 8,371 | | 8,693 | | 2,922 | | 1,920 | | 1,795 | | 9,517 | | 9,571 | | 9,812 | |
| |
| |
| |
| |
| |
| |
| |
| |
| |
| |
The Group’s financial statements have been prepared in accordance with generally accepted accounting principles in the United Kingdom ('UK GAAP'), which differ in certain respects from those in the United States ('US GAAP'). These differences relate principally to the following items, and the effect of each of the adjustments to net earnings and shareholders' funds that would be required under US GAAP is set out on this and the preceding page.
Goodwill
For 1997 and prior years, UK GAAP permitted the write off of purchased goodwill on acquisition, directly against reserves. For acquisitions in 1998 and subsequent years, goodwill is capitalised and amortised over its expected useful life under UK GAAP. Under US GAAP, goodwill is capitalised and, until 2001, was amortised by charges against income over the period during which it was expected to be of benefit, subject to a maximum of 40 years. Goodwill previously written off directly to reserves in the UK GAAP financial statements was therefore reinstated and amortised, under US GAAP. From 1 January 2002, goodwill and indefinite lived intangible assets are no longer amortised under US GAAP but are reviewed annually for impairment under FAS 142 'Goodwill and Other Intangible Assets'. Goodwill amortisation of US$90 million charged against UK GAAP earnings for 2002 is added back in the US GAAP reconciliation. No impairment write-downs were required on the initial introduction of FAS 142. Implementation of FAS 141 'Business Combinations' resulted in the reclassification of US$340 million from goodwill to finite lived intangible assets.
| | Rio Tinto plc - | | Rio Tinto Limited - | | | |
| part of | part of |
| Rio Tinto Group | Rio Tinto Group | Rio Tinto Group |
|
|
|
|
|
|
|
|
|
2001
| | 2000
| 2001
| | 2000
| 2001
| | 2000
|
US$m | US$m | US$m | US$m | US$m | | US$m |
| Net income under US GAAP as reported | 618 | | 820 | | 671 | | 614 | | 1,038 | | 1,174 | |
| Goodwill amortisation | 125 | | 100 | | 37 | | 16 | | 148 | | 109 | |
| |
| |
| |
| |
| |
| |
| |
| Net income under US GAAP on a FAS 142 basis | 743 | | 920 | | 708 | | 630 | | 1,186 | | 1,283 | |
| |
| |
| |
| |
| |
| |
| |
| Basic earnings per ordinary share under US GAAP on a FAS 142 basis | 69.8 | c | 86.6 | c | 142.1 | c | 116.9 | c | 86.3 | c | 93.5 | c |
| |
| |
| |
| |
| |
| |
| |
| Diluted earnings per ordinary share under US GAAP on a FAS 142 basis | 69.7 | c | 86.5 | c | 142.0 | c | 116.8 | c | 86.1 | c | 93.4 | c |
| |
| |
| |
| |
| |
| |
| |
A-59
Back to Contents
RIO TINTO PLC - RIO TINTO LIMITED
NOTES TO FINANCIAL STATEMENTS - (continued)
42 Reconciliation to US Accounting Principles (continued)
Exchange differences taken to earnings under US GAAP
The Group finances its operations primarily in US dollars and a significant proportion of the Group's US dollar debt is located in its Australian operations. Under UK GAAP, this debt is dealt with in the context of the currency status of the Group as a whole and exchange differences reported by the Australian operations are adjusted through reserves. US GAAP permits such exchange gains and losses to be taken to reserves only to the extent that the US dollar debt hedges US dollar assets in the Australian Group. Exchange gains of the Rio Tinto Group of US$240 million pre-tax (2001: losses of US$216 million, 2000: losses of US$139 million), US$177 million net of tax and minorities (2001: US$148 million net of tax and minorities, 2000: US$56 million net of tax and minorities), on US dollar debt that do not qualify for hedge accounting under US GAAP have therefore been recorded in US GAAP earnings.Mark to market of derivative contracts
The Group is party to derivative contracts in respect of some of its future transactions in order to hedge its exposure to fluctuations in exchange rates against the US dollar. Under UK GAAP, these contracts are accounted for as hedges: gains and losses are deferred and subsequently recognised when the hedged transaction occurs. Under US standard FAS 52, which applied prior to 1 January 2001, some of these transactions did not qualify for hedge accounting, principally because they were not yet contractual commitments. Provision for unrealised pre-tax losses of the Rio Tinto Group of US$103 million, Rio Tinto plc US$53 million, Rio Tinto Limited US$88 million (Rio Tinto Group US$67 million net of tax and minorities) on derivatives relating to such transactions was therefore recognised in earnings under US GAAP at 31 December 2000. Under FAS 133 ' Accounting for Derivative Instruments and Hedging Activities', which applies to Rio Tinto f rom 1 January 2001, all derivative instruments are included in the balance sheet as assets or liabilities measured at fair value. Certain of the Group's derivative contracts do not qualify for hedge accounting under FAS 133, principally because the hedge is not located in the entity with the exposure. Unrealised pre-tax gains for the Rio Tinto Group of US$157 million (2001: losses of US$48 million), US$111 million after tax and minorities (2001: US$26 million after tax and minorities), on such derivatives have therefore been taken to US GAAP earnings.
Asset write downs
Following the implementation of FRS 11 in 1998, impairment of fixed assets under UK GAAP is recognised and measured by reference to the discounted cash flows expected to be generated by an income generating unit. Under US GAAP, impairment is recognised only when the anticipated undiscounted cash flows are insufficient to recover the carrying value of the income generating unit. Where an asset is found to be impaired under US GAAP, the amount of such impairment is generally similar under US GAAP to that computed under UK GAAP, except where the US GAAP carrying value includes additional goodwill. The asset write downs for the Rio Tinto Group in 2002, under US GAAP, include amounts recognised in 2001 under UK GAAP of US$445 million and excludes asset write downs recognised in 2002 under UK GAAP of US$235 million. The 2002 Rio Tinto Group US GAAP asset write downs also include an adjustment for goodwill. The 2002 US GAAP impairment write-down for the Rio Tin to Group was US$1,067 million pre-tax (US$1,060 million net of tax and minorities). This is US$89 million pre-tax (US$297 million net of tax and minorities) above the charge of US$978 million pre-tax (US$763 million net of tax and minorities) included under UK GAAP.
The asset write downs for Rio Tinto plc in 2002, under US GAAP, include amounts recognised in 2001 under UK GAAP of US$445 million. The 2002 Rio Tinto plc asset write downs also include an adjustment for goodwill. The 2002 US GAAP impairment write-down for Rio Tinto plc was US$1,059 million pre-tax (US$1,052 million net of tax and minorities). This is US$420 million pre-tax (US$429 million net of tax and minorities) above the charge of US$639 million pre-tax (US$623 million net of tax and minorities) included under UK GAAP.
The asset write downs for Rio Tinto Limited in 2002, under US GAAP, exclude asset write downs recognised in 2002 under UK GAAP of US$212 million. The 2002 US GAAP impairment write-down for Rio Tinto Limited was US$13 million pre-tax (US$13 million net of tax and minorities). This is US$420 million pre-tax (US$212 million net of tax and minorities) below the charge of US$433 million pre-tax (US$225 million net of tax and minorities) included under UK GAAP. The 2001 US GAAP impairment write-down is US$243 million pre tax for the Rio Tinto Group, US$199 million pre tax for Rio Tinto plc and US$71 million pre tax for Rio Tinto Limited (Rio Tinto Group: US$183 million net of tax and minorities). For the Rio Tinto Group and for Rio Tinto plc this is US$472 million pre-tax (Rio Tinto Group: US$400 million net of tax and minorities) below the charges of US$715 million and US$671 million pre-tax included under UK GAAP for the Rio Tinto Group and Rio Tinto plc respectively (Rio Tinto Group: US$583 million net of tax and minorities). The net difference of US$468 million related to asset write-downs for the Rio Tinto Group and Rio Tinto plc comprises the above US$472 million, offset by US$4 million (Rio Tinto Group: US$3 million net of tax and minorities) of additional current year amortisation related to US GAAP adjustments made in previous years.
Exploration and evaluation
Under UK GAAP, expenditure on a project can be carried forward after it has reached a stage where there is a high degree of confidence in its viability. US GAAP does not allow expenditure to be carried forward unless the viability of the project is supported by a final feasibility study. In addition, under UK GAAP, provisions made against exploration and evaluation in prior years can be reversed when the project proceeds to development to the extent that the relevant costs are recoverable. US GAAP does not allow such provisions to be reversed.
Pensions/post retirement benefits
Under UK GAAP, post retirement benefits are accounted for in accordance with Statement of Standard Accounting Practice 24. The expected costs under defined benefit arrangements are spread over the service lives of employees entitled to those benefits. Variations from the regular cost are spread on a straight line basis over the expected average remaining service lives of relevant current employees. Under US GAAP, the annual pension cost comprises the estimated cost of benefits accruing in the period adjusted for the amortisation of the surplus arising when FAS 87, 'Employers' Accounting for Pensions', was adopted. The charge is further adjusted to reflect the cost of benefit improvements and any surpluses/deficits that emerge as a result of variances from actuarial assumptions. For US purposes, only those surpluses/deficits outside a 10 per cent fluctuation 'corridor' are spread.
The reduction in shareholders' funds at 31 December 2002 and 2001 also includes the effect of the US GAAP requirement to make immediate provision for pension fund deficits through other comprehensive income. The provision reflects the reduction in equity values in the relevant years.
Higher cost of sales resulting from acquisition accounting
Under UK GAAP, the inventories of acquired companies are valued at the lower of replacement cost and net realisable value. Under US GAAP, such inventories are recognised at the time of acquisition on the basis of expected net sales proceeds. Earnings for 2001 and 2000 are lower under US GAAP as a result of the higher cost of sales relating to inventories that were held at the date of acquisition.
Share option plans
Under UK GAAP, no cost is accrued where the option scheme applies to all relevant employees and the intention is to satisfy the share options by the issuance of new shares. Prior to 2002, under US GAAP the Group accounted for share option plans under the recognition and measurement provisions of APB Opinion No. 25, 'Accounting for Stock Issued to Employees', and related Interpretations. In 2002, the Group adopted the fair value recognition provisions of FAS 123, ' Accounting for Stock-Based Compensation', which is considered by the SEC to be a preferable accounting method for share based employee compensation. As permitted by FAS 148, 'Accounting for Stock-Based Compensation - Transition and Disclosure' , all prior periods presented have been restated to reflect the compensation cost that would have been recognised had the recognition provisions of FAS 123 been applied to all awards granted to employees after 1 January 1995. An adjustment is therefore re quired to reflect the increased cost of the schemes under US GAAP compared to UK GAAP. Fair value is determined using an option pricing model.
A-60
Back to Contents
RIO TINTO PLC - RIO TINTO LIMITED
NOTES TO FINANCIAL STATEMENTS - (continued)
42 Reconciliation to US Accounting Principles (continued)
Proposed dividends
Under UK GAAP, ordinary dividends are recognised in the financial year in respect of which they are paid. Under US GAAP, such dividends are not recognised until they are formally declared by the board of directors or approved by the shareholders.
Other
Other adjustments to earnings include amounts related to differences between UK and US accounting principles in respect of depreciation of mining assets, revenue recognition, start up and close down and restoration costs (see below).
Depreciation of mining assets
Under UK GAAP, mining assets are fully depreciated over their economic lives or the remaining life of the mine if shorter. In some cases, mineral resources that do not yet have the status of reserves are taken into account in determining depreciation charges, where there is a high degree of confidence that they will be mined economically. For US GAAP, only 'proven and probable reserves' are taken into account in the calculation of depreciation, depletion and amortisation charges. As a result, adjustments have been made in 2002 to depreciation included in 'Other' that reduced Rio Tinto Group US GAAP pre tax earnings by US$10 million (2001: US$6 million), increased Rio Tinto plc pre tax earnings by US$3 million (2001: US$3 million) and reduced Rio Tinto Limited's pre tax earnings by US$20 million (2001: US$15 million).
Revenue recognition
Staff Accounting Bulletin No. 101 (SAB 101) 'Revenue Recognition in Financial Statements' has the result that, in some cases, sales recorded as revenue under UK GAAP are deferred and are not recognised as revenue under US GAAP until a future accounting period. Occasionally, sales of goods recorded as revenue for UK GAAP purposes may be kept in store by Rio Tinto at the request of the buyer. Under US GAAP, such transactions cannot be recognised as revenue unless the goods are physically segregated from the supplier's other inventory and certain additional criteria are met. Also, under UK GAAP, certain sales contracts are recognised as revenue when the goods are delivered to the ship for export to the customer; but do not qualify for recognition under US GAAP until they have reached the destination specified by the customer in the sales contract and title has passed. In 2002, such timing differences resulted in an adjustment, included in 'Other', that increased US GAAP pre-tax earnings of the Rio Tinto Group by US$4 million, Rio Tinto plc's pre-tax earnings by US$2 million and Rio Tinto Limited's pre-tax earnings by US$4 million (2001: increased US GAAP pre-tax earnings of the Rio Tinto Group by US$5 million, Rio Tinto plc US$4 million, Rio Tinto Limited US$1 million), (2000: reduced US GAAP pre tax earnings of the Rio Tinto Group by US$16 million, Rio Tinto plc US$11 million, Rio Tinto Limited US$9 million).
Start up costs
Under US GAAP, Statement of Position 98-5, 'Reporting on the Costs of Start-up Activities', requires that the costs of start up activities are expensed as incurred. Under UK GAAP, some of these start up costs qualify for capitalisation and are amortised over the economic lives of the relevant assets.
Provisions
Additional provisions were recognised for UK GAAP purposes on implementation of FRS 12 in 1999. There was no corresponding change in US accounting standards. The additional provisions are therefore reversed in the calculation of shareholders' funds under US GAAP.
Taxation
Rio Tinto has implemented FRS 19, the new UK Accounting Standard on deferred tax. This has resulted in a prior year adjustment under UK GAAP, which reduced shareholders’ funds at 1 January 2001 by US$133 million. Of this amount, US$46 million results from the requirement under FRS 19 to provide in full for deferred taxation on most timing differences. These additional provisions were already recognised under US GAAP.
The remaining US$87 million of the prior year adjustment relates to features of FRS 19 that give rise to new variations from US GAAP. Accordingly, this element of the prior year adjustment has been reversed in arriving at US GAAP shareholders’ funds. These variations, which also affect the determination of earnings under US GAAP, relate principally to the following:
(a) Under FRS 19, provision for taxes arising on remittances of earnings can only be made if the dividends have been accrued or if there is a binding agreement for the distribution of the earnings. Under US GAAP, provision must be made for tax arising on expected future remittances of past earnings.
(b) Under FRS 19, tax benefits associated with goodwill charged directly to reserves in 1997 and previous years must be accumulated in the deferred tax provision. This means that the tax benefits are not included in earnings until the related goodwill is charged through the profit and loss account on disposal or closure. For US GAAP, no provision is required for such deferred tax because the goodwill that gave rise to these tax benefits was capitalised and gives rise to amortisation charges against profit.
Deferred tax on acquisitions
Under UK GAAP, deferred tax is not provided in respect of upward fair value adjustments to tangible fixed assets and inventories made on acquisitions. Under US GAAP, deferred tax must be provided on all fair value adjustments to non monetary assets recorded on acquisition with a consequential increase in the amount allocated to mining properties or goodwill as appropriate.
Profit contribution from equity accounted operations
Under US GAAP, investments in affiliates are accounted for using the equity method, and the reporting entity's share of the after tax profits and losses of its affiliates is included in the income statement as a single line item. Under UK GAAP, the reporting entity's share of the trading results of its associates and joint ventures is split in the profit and loss account between its share of their operating profits/losses, interest receivable/payable and taxation.
The Group's share of the after tax profits and losses of associates and joint ventures is shown in its 'Statement of Total Recognised Gains and Losses'.
Consolidated statement of cash flows
The consolidated statement of cash flows prepared in accordance with FRS 1 (revised) presents substantially the same information as that required under US GAAP. Under US GAAP, however, there are certain differences from UK GAAP with regard to the classification of items within the cash flow statement and with regard to the definition of cash and cash equivalents. Under US GAAP, tax paid and interest would form part of operating cash flow. Similarly, deferred stripping costs which are shown as capital expenditure under UK GAAP are included in operating cash flow for the purposes of the US GAAP cash flow disclosure. Under UK GAAP, cash for the purposes of the cash flow statement is defined as cash on hand and deposits repayable on demand with any qualifying financial institution, less bank borrowings from any qualifying financial institution repayable on demand. Deposits are repayable on demand if they can be withdrawn at any time without notice and without penalty or if a maturity or period of notice of not more than 24 hours or one working day has been agreed. Under US GAAP, cash equivalents comprise cash balances and current asset investments with an original maturity of less than three months and exclude bank borrowings repayable on demand.
A-61
Back to Contents
RIO TINTO PLC - RIO TINTO LIMITED
NOTES TO FINANCIAL STATEMENTS - (continued)
42 Reconciliation to US Accounting Principles (continued)
Unrealised holding gains and losses
UK GAAP permits current asset investments to be valued at the lower of cost and net realisable value. Under US GAAP, FAS 115 requires that unrealised holding gains and losses on investments classified as 'available for sale' are excluded from earnings and reported instead within a separate component of shareholders' funds until realised.
Adjusted earnings
As permitted under UK GAAP, adjusted earnings and adjusted earnings per share have been presented excluding the impact of exceptional charges to provide a measure that reflects the underlying performance of the Group. This is in addition to the presentation of earnings and earnings per share, which include the exceptional charges. In accordance with US GAAP, earnings and earnings per share have been presented based on US GAAP earnings, without adjustment for the impact of exceptional charges. Such additional measures of underlying performance are not permitted under US GAAP.
New US accounting standards
In July 2001, the Financial Accounting Standards Board ('FASB') issued FAS 143, 'Accounting for Obligations Associated with the Retirement of Long-Lived Assets'. FAS 143 will be effective for the financial year ending 31 December 2003. The standard requires that the obligation for close down and restoration costs is capitalised at the time of recognition. The asset is subsequently amortised over its useful life and the discount on the liability is unwound. The Group is currently evaluating the impact of this statement on its results of operations and financial position, however, the expectation is that the current GAAP difference relating to closure provisions made under the UK standard FRS 12 will be largely eliminated.
In July 2002, the FASB issued FAS 146, 'Accounting for Costs Associated with Exit or Disposal Activities'. The statement requires companies to recognise costs associated with certain exit or disposal activities when they are incurred rather than at the date of a commitment to an exit or disposal plan. FAS 146 will be applied by the Group prospectively to applicable exit or disposal activities initiated after 31 December 2002. The adoption of FAS 146 is not expected to have a material effect on the reported financial position, results of operations or cash flows of the Rio Tinto Group.
In November 2002, the FASB issued Interpretation No. 45 (FIN 45) ‘Guarantor's Accounting and Disclosure Requirements for Guarantees, Including Indirect Guarantees of Indebtedness of Others’. FIN 45 elaborates on the existing disclosure requirements for most guarantees and requires entities to recognise, upon issue of a guarantee, an initial liability for the fair value, or market value, of the associated obligation with disclosure of that information in its interim and annual financial statements. FIN 45 will be effective, on a prospective basis, to guarantees issued or modified after 31 December 2002. The adoption of FIN 45 is not expected to have a material effect on the reported financial position, results of operations or cash flows of the Rio Tinto Group.
The disclosure requirements of FIN 45 apply to these accounts and the following information is given in response to these.
Note 29 to the financial statements discloses indemnities and other performance guarantees totalling US$145 million on which no material loss is expected. This includes US$15 million relating to the Group's commitment to pay deferred consideration in relation to acquisitions of mining properties in 2002 and previous years. This does not include guarantees of payment of US$341 million entered into by the Group relating to deferred consideration arising from such acquisitions because the deferred consideration has been recognised as a liability within the Group's balance sheet. The disclosure in note 29 also includes guarantees for up to US$32 million relating to the costs of infrastructure financed by certain government authorities, which would be subject to reimbursement by the Group if the facilities are not completed or certain tests relating to the related project are not met. Of the remaining US$98 million disclosed in note 29, US$25 million would be s ubject to reimbursement by a third party in the event that the Group was required to make payment under the guarantees.
In addition to the above, the Group has issued guarantees and indemnities totalling US$546 million relating to its close down, restoration and environmental remediation obligations. These are not disclosed as contingent liabilities because the obligations are included in the amounts recognised in the balance sheet as provisions for liabilities and charges.
A Group company has guaranteed that the quality of product from a joint venture in which it participates will be in accordance with agreed specifications. It has also undertaken to make up any shortfalls from minimum ore reserve quantities over the life of the joint venture. Currently, no shortfalls are anticipated.
As explained in note 14 to the financial statements, the Group has a partnership interest in the Colowyo Coal Company and has undertaken, via a subsidiary company which entered into a management agreement, to cause the partnership to perform its obligations under certain coal supply contracts. The debt of US$173 million owed by the Colowyo Coal Company is to be serviced and repaid out of the proceeds of these contracts.
In January 2003, the FASB issued interpretation No. 46, 'Consolidation of Variable Interest Entities' (FIN 46). Under FIN 46, certain entities labelled “Variable Interest Entities” (VIE), must be consolidated by the “primary beneficiary” of the entity. The primary beneficiary is generally defined as the party exposed to the majority of the risks and rewards arising from the VIE. For VIE’s in which a significant variable interest is held that is not a majority interest, certain disclosures are required. Full implementation of this interpretation is required in the Group’s financial statements for the year to 31 December 2004; but certain disclosures are required in the meantime, which are set out below.
The Group has a 20% general partnership interest in the Colowyo limited partnership, which was acquired for US$25 million in December 1994. This joint venture may fall within the definition of a Variable Interest Entity set out in FIN 46. The Colowyo joint venture produces coal, which is sold under long-term contracts. Colowyo’s total sales revenues for 2002 were US$108 million and its total assets as at 31 December 2002 were US$101 million. It is included in the Group accounts on the equity accounted basis and the carrying value of the net investment at 31 December 2002 was US$8 million under US GAAP.
Colowyo has bonds in issue with outstanding capital of US$173 million at 31 December 2002. These are repayable by instalments up to 2016 with interest at rates between 9.56% and 10.19% per annum. The bonds are to be serviced and repaid exclusively out of the net revenues from certain specified sales contracts relating to coal supplies by Colowyo. The bondholders bear the risks of loss that might arise if the revenues are interrupted due to failure of the purchasers or force majeur. The Rio Tinto Group is responsible under a management contract in which it agreed, for the sole and exclusive benefit of the bondholders, to cause Colowyo to perform its obligations under the specified coal sales contracts.
New UK accounting standards
Mandatory implementation of FRS 17 - 'Retirement Benefits' has been delayed until 2005 but additional disclosures are required for 2001 and 2002 which are included in note 40 to the financial statements.
A-62
Back to Contents
RIO TINTO PLC - RIO TINTO LIMITED
NOTES TO FINANCIAL STATEMENTS - (continued)
42 Reconciliation to US Accounting Principles (continued)
Post Retirement benefits
Information in respect of the net periodic benefit cost and related obligation determined in accordance with FAS 87,106 and 132 is given below.
Benefits under the major pension schemes are principally determined by years of service and employee remuneration.
Pension scheme funding policy is based on annual contributions at a rate that is intended to fund benefits as a level percentage of pay over the working lifetime of the scheme's participants. The assets of the UK schemes are invested primarily in UK and overseas equities and UK fixed interest stocks. The assets of the Australian schemes are invested primarily in Australian and overseas equities and fixed interest stocks.
The assets of the most significant pension schemes outside the UK and Australia are invested primarily in common stocks, corporate and treasury bonds, real estate or real estate investment funds, under the direction of investment managers.
Other post retirement benefits are provided to employees who meet the eligibility requirements, and their beneficiaries and dependants, through unfunded self insurance arrangements. The majority of these plans are for employees in the US. The plans are non contributory, although some contain an element of cost sharing such as deductibles and co-insurance.
Assumptions used to determine the net periodic benefit cost and the year end benefit obligation for the major pension schemes varied within the limits shown below. The average rate for each assumption has been weighted by benefit obligation. The assumptions used to determine the end of year benefit obligation are also used to calculate the following year's cost.
| | | 2002 Cost | | Year end benefit obligation |
| | |
| |
|
| Discount rate | | 6.5% to 12.0% (Average: 7.0%) | | 5.8% to 12.0% (Average: 6.7%) |
| Long term rate of return on plan assets | | 6.5% to 12.0% (Average: 7.3%) | | 6.5% to 12.0% (Average: 7.2%) |
| Increase in compensation levels | | 4.0% to 11.0% (Average: 5.0%) | | 3.3% to 11.0% (Average: 4.8%) |
The actuarial calculations in respect of the UK plans assume a rate of increase of pensions in payment of 2.5 per cent per annum. The actuarial calculations in respect of Australian plans assume a rate of increase of pensions in payment of 2.5 per cent per annum. These assumptions are consistent with the expected rates of return and salary increase assumptions in the respective valuations. Appropriate assumptions were made for plans in other countries.
The weighted average discount rates used in determining the benefit obligation for the major post retirement benefit plans other than pension schemes were 7.5 per cent and 6.5 per cent as of 30 September 2001, and 30 September 2002, respectively. A healthcare cost trend rate of 8.5 per cent, decreasing to 5.0 per cent by the year 2009, was used for 2002 costs. A healthcare cost trend rate of 8.0 per cent, decreasing to 5.0 per cent by the year 2009 was used to determine the benefit obligation at 30 September 2002.
The components of net benefit expense are detailed in the table below.
| | Rio Tinto plc - | | Rio Tinto Limited - | | | | | | | |
| | part of Rio Tinto Group | | part of Rio Tinto Group | | Rio Tinto Group | |
| |
| |
| |
| |
| | 2002 | | 2001 | | 2000 | | 2002 | | 2001 | | 2000 | | 2002 | | 2001 | | 2000 | |
| |
| |
| |
| |
| |
| |
| |
| |
| |
| |
| Pension Benefits | US$m | | US$m | | US$m | | US$m | | US$m | | US$m | | US$m | | US$m | | US$m | |
| Service cost | (42 | ) | (45 | ) | (42 | ) | (55 | ) | (47 | ) | (42 | ) | (97 | ) | (92 | ) | (84 | ) |
| Interest cost on benefit obligation | (147 | ) | (138 | ) | (138 | ) | (60 | ) | (57 | ) | (39 | ) | (207 | ) | (195 | ) | (177 | ) |
| Expected return on plan assets | 197 | | 210 | | 202 | | 61 | | 69 | | 51 | | 258 | | 279 | | 253 | |
| Net amortisation and deferral: | | | | | | | | | | | | | | | | | | |
| - transitional obligation | 10 | | 12 | | 14 | | - | | - | | - | | 10 | | 12 | | 14 | |
| - recognised gains/(losses) | 18 | | 4 | | 15 | | (8 | ) | (4 | ) | (2 | ) | 10 | | - | | 13 | |
| - prior service cost recognised | (21 | ) | (18 | ) | (18 | ) | (1 | ) | (1 | ) | (1 | ) | (22 | ) | (19 | ) | (19 | ) |
| |
| |
| |
| |
| |
| |
| |
| |
| |
| |
| | 7 | | (2 | ) | 11 | | (9 | ) | (5 | ) | (3 | ) | (2 | ) | (7 | ) | 8 | |
| |
| |
| |
| |
| |
| |
| |
| |
| |
| |
| Net periodic benefit (cost)/credit | 15 | | 25 | | 33 | | (63 | ) | (40 | ) | (33 | ) | (48 | ) | (15 | ) | - | |
| Curtailment and settlement (cost)/credit | (8 | ) | (4 | ) | - | | - | | - | | - | | (8 | ) | (4 | ) | - | |
| |
| |
| |
| |
| |
| |
| |
| |
| |
| |
| Net benefit credit/(expense) | 7 | | 21 | | 33 | | (63 | ) | (40 | ) | (33 | ) | (56 | ) | (19 | ) | - | |
| |
| |
| |
| |
| |
| |
| |
| |
| |
| |
| | Rio Tinto plc - | | Rio Tinto Limited - | | | | | | | |
| | part of Rio Tinto Group | | part of Rio Tinto Group | | Rio Tinto Group | |
| |
| |
| |
| |
| | 2002 | | 2001 | | 2000 | | 2002 | | 2001 | | 2000 | | 2002 | | 2001 | | 2000 | |
| |
| |
| |
| |
| |
| |
| |
| |
| |
| |
| Other Benefits | US$m | | US$m | | US$m | | US$m | | US$m | | US$m | | US$m | | US$m | | US$m | |
| Service cost | (6 | ) | (6 | ) | (6 | ) | (1 | ) | - | | - | | (7 | ) | (6 | ) | (6 | ) |
| Interest cost on benefit obligation | (23 | ) | (21 | ) | (23 | ) | (2 | ) | (3 | ) | (1 | ) | (25 | ) | (24 | ) | (24 | ) |
| Net amortisation and deferral: | | | | | | | | | | | | | | | | | | |
| - recognised gains/(losses) | 8 | | 8 | | 9 | | - | | 3 | | - | | 8 | | 11 | | 9 | |
| - prior service cost recognised | 1 | | 1 | | 1 | | - | | - | | - | | 1 | | 1 | | 1 | |
| |
| |
| |
| |
| |
| |
| |
| |
| |
| |
| | 9 | | 9 | | 10 | | - | | 3 | | - | | 9 | | 12 | | 10 | |
| |
| |
| |
| |
| |
| |
| |
| |
| |
| |
| Net periodic benefit cost | (20 | ) | (18 | ) | (19 | ) | (3 | ) | - | | (1 | ) | (23 | ) | (18 | ) | (20 | ) |
| Curtailment and settlement cost | (2 | ) | - | | - | | - | | - | | - | | (2 | ) | - | | - | |
| |
| |
| |
| |
| |
| |
| |
| |
| |
| |
| Net benefit expense | (22 | ) | (18 | ) | (19 | ) | (3 | ) | - | | (1 | ) | (25 | ) | (18 | ) | (20 | ) |
| |
| |
| |
| |
| |
| |
| |
| |
| |
| |
A-63
Back to Contents
RIO TINTO PLC - RIO TINTO LIMITED
NOTES TO FINANCIAL STATEMENTS - (continued)
42 Reconciliation to US Accounting Principles (continued)
Accumulated foreign currency translation gains and losses recorded directly in shareholders' funds under US GAAP
| | Rio Tinto plc - part of Rio Tinto Group | | Rio Tinto Limited - part of Rio Tinto Group | | Rio Tinto Group | |
| |
| |
| |
| |
| | US$m | | US$m | | US$m | |
| |
| |
| |
| |
| At 1 January 2002 | (1,189 | ) | (428 | ) | (1,436 | ) |
| Current period change | 318 | | 167 | | 422 | |
| |
| |
| |
| |
| At 31 December 2002 | (871 | ) | (261 | ) | (1,014 | ) |
| |
| |
| |
| |
| At 1 January 2001 | (935 | ) | (313 | ) | (1,111 | ) |
| Current period change | (254 | ) | (115 | ) | (325 | ) |
| |
| |
| |
| |
| At 31 December 2001 | (1,189 | ) | (428 | ) | (1,436 | ) |
| |
| |
| |
| |
| At 1 January 2000 | (631 | ) | 37 | | (606 | ) |
| Current period change | (304 | ) | (350 | ) | (505 | ) |
| |
| |
| |
| |
| At 31 December 2000 | (935 | ) | (313 | ) | (1,111 | ) |
| |
| |
| |
| |
Additional US GAAP cash flow information
A summary of Rio Tinto's operating, investing and financing activities classified in accordance with US GAAP is presented below:
Funded status of the Group's principal schemes.
| | Rio Tinto plc - | | Rio Tinto Limited - | | | | | |
| Pension Benefits | part of Rio Tinto Group | part of Rio Tinto Group | Rio Tinto Group |
| |
| |
| |
| |
| | 2002 | | 2001 | | 2002 | | 2001 | | 2002 | | 2001 | |
| |
| |
| |
| |
| |
| |
| |
| | US$m | | US$m | | US$m | | US$m | | US$m | | US$m | |
| Benefit obligation at end of year | (2,377 | ) | (1,903 | ) | (989 | ) | (900 | ) | (3,366 | ) | (2,803 | ) |
| Fair value of plan assets | 2,256 | | 2,271 | | 910 | | 917 | | 3,166 | | 3,188 | |
| |
| |
| |
| |
| |
| |
| |
| Plan assets (below)/in excess of benefit obligation | (121 | ) | 368 | | (79 | ) | 17 | | (200 | ) | 385 | |
| Unrecognised prior service cost | 155 | | 149 | | 4 | | 4 | | 159 | | 153 | |
| Unrecognised net loss/(gain) | 239 | | (252 | ) | 225 | | 158 | | 464 | | (94 | ) |
| Unrecognised transitional asset | (27 | ) | (35 | ) | (2 | ) | (2 | ) | (29 | ) | (37 | ) |
| Company contributions in fourth quarter | 2 | | 1 | | 5 | | 3 | | 7 | | 4 | |
| |
| |
| |
| |
| |
| |
| |
| Net amount recognised | 248 | | 231 | | 153 | | 180 | | 401 | | 411 | |
| |
| |
| |
| |
| |
| |
| |
| Comprising: | | | | | | | | | | | | |
| - benefit prepayment | 212 | | 270 | | 134 | | 187 | | 346 | | 457 | |
| - benefit provision (including additional minimum liability) | (236 | ) | (124 | ) | (83 | ) | (75 | ) | (319 | ) | (199 | ) |
| - intangible asset | 53 | | 32 | | - | | - | | 53 | | 32 | |
| - amount recognised through accumulated other | | | | | | | | | | | | |
| comprehensive income | 219 | | 53 | | 102 | | 68 | | 321 | | 121 | |
| |
| |
| |
| |
| |
| |
| |
| Net amount recognised | 248 | | 231 | | 153 | | 180 | | 401 | | 411 | |
| |
| |
| |
| |
| |
| |
| |
| | Rio Tinto plc - | | Rio Tinto Limited - | | | | | |
| | part of Rio Tinto Group | | part of Rio Tinto Group | | Rio Tinto Group | |
| |
| |
| |
| |
| Other Benefits | 2002 | | 2001 | | 2002 | | 2001 | | 2002 | | 2001 | |
| |
| |
| |
| |
| |
| |
| |
| | US$m | | US$m | | US$m | | US$m | | US$m | | US$m | |
| Benefit obligation at end of year | (396 | ) | (323 | ) | (41 | ) | (39 | ) | (437 | ) | (362 | ) |
| Fair value of plan assets | - | | - | | - | | - | | - | | - | |
| |
| |
| |
| |
| |
| |
| |
| Benefit obligation in excess of plan assets | (396 | ) | (323 | ) | (41 | ) | (39 | ) | (437 | ) | (362 | ) |
| Unrecognised prior service cost | (2 | ) | (2 | ) | - | | - | | (2 | ) | (2 | ) |
| Unrecognised net loss/(gain) | (40 | ) | (96 | ) | - | | - | | (40 | ) | (96 | ) |
| |
| |
| |
| |
| |
| |
| |
| Net amount recognised at end of year | (438 | ) | (421 | ) | (41 | ) | (39 | ) | (479 | ) | (460 | ) |
| |
| |
| |
| |
| |
| |
| |
| Comprising: | | | | | | | | | | | | |
| - benefit provision | (438 | ) | (421 | ) | (41 | ) | (39 | ) | (479 | ) | (460 | ) |
| |
| |
| |
| |
| |
| |
| |
| Net amount recognised | (438 | ) | (421 | ) | (41 | ) | (39 | ) | (479 | ) | (460 | ) |
| |
| |
| |
| |
| |
| |
| |
| Change in additional minimum liability before tax: | | | | |
| | 2002 | | 2001 | |
| |
| |
| |
| | US$m | | US$m | |
| Accrued pension benefit expense | 221 | | 148 | |
| Increase in intangible asset | (21 | ) | (32 | ) |
| |
| |
| |
| Other comprehensive income before tax | 200 | | 116 | |
| |
| |
| |
| Change in benefit obligation | | | | | | | | | | | | |
| | Rio Tinto plc - | | Rio Tinto Limited - | | | | | |
| Pension Benefits | part of Rio Tinto Group | | part of Rio Tinto Group | | Rio Tinto Group | |
| |
| |
| |
| |
| | 2002 | | 2001 | | 2002 | | 2001 | | 2002 | | 2001 | |
| |
| |
| |
| |
| |
| |
| |
| | US$m | | US$m | | US$m | | US$m | | US$m | | US$m | |
| Benefit obligation at start of year | (1,903 | ) | (2,033 | ) | (900 | ) | (861 | ) | (2,803 | ) | (2,894 | ) |
| Service cost | (42 | ) | (45 | ) | (55 | ) | (47 | ) | (97 | ) | (92 | ) |
| Interest cost | (147 | ) | (138 | ) | (60 | ) | (57 | ) | (207 | ) | (195 | ) |
| Contributions by plan participants | (3 | ) | (2 | ) | (6 | ) | (4 | ) | (9 | ) | (6 | ) |
| Actuarial (losses) and gains | (246 | ) | 90 | | 42 | | 1 | | (204 | ) | 91 | |
| Benefits paid | 141 | | 125 | | 54 | | 70 | | 195 | | 195 | |
| Plan amendments | (16 | ) | (12 | ) | - | | - | | (16 | ) | (12 | ) |
| Inclusion of defined contribution liabilities | - | | (2 | ) | - | | (61 | ) | - | | (63 | ) |
| Currency translation | (161 | ) | 114 | | (64 | ) | 59 | | (225 | ) | 173 | |
| |
| |
| |
| |
| |
| |
| |
| Benefit obligation at end of year | (2,377 | ) | (1,903 | ) | (989 | ) | (900 | ) | (3,366 | ) | (2,803 | ) |
| |
| |
| |
| |
| |
| |
| |
A-64
Back to Contents
RIO TINTO PLC - RIO TINTO LIMITED
NOTES TO FINANCIAL STATEMENTS - (continued)
42 Reconciliation to US Accounting Principles (continued)
| | Rio Tinto plc - | | Rio Tinto Limited - | | | | | |
| Other Benefits | part of Rio Tinto Group | | part of Rio Tinto Group | | Rio Tinto Group | |
| |
| |
| |
| |
| | 2002 | | 2001 | | 2002 | | 2001 | | 2002 | | 2001 | |
| |
| |
| |
| |
| |
| |
| |
| | US$m | | US$m | | US$m | | US$m | | US$m | | US$m | |
| Benefit obligation at start of year | (323 | ) | (315 | ) | (39 | ) | (40 | ) | (362 | ) | (355 | ) |
| Service cost | (6 | ) | (6 | ) | (1 | ) | - | | (7 | ) | (6 | ) |
| Interest cost | (23 | ) | (21 | ) | (2 | ) | (3 | ) | (25 | ) | (24 | ) |
| Actuarial losses | (48 | ) | (8 | ) | - | | - | | (48 | ) | (8 | ) |
| Benefits paid | 14 | | 11 | | 2 | | 2 | | 16 | | 13 | |
| Plan amendments | (2 | ) | - | | - | | - | | (2 | ) | - | |
| Currency translation | (8 | ) | 16 | | (1 | ) | 2 | | (9 | ) | 18 | |
| |
| |
| |
| |
| |
| |
| |
| Benefit obligation at end of year | (396 | ) | (323 | ) | (41 | ) | (39 | ) | (437 | ) | (362 | ) |
| |
| |
| |
| |
| |
| |
| |
| Change in plan assets | | | | | | | | | | | | |
| | Rio Tinto plc - | | Rio Tinto Limited - | | | | | |
| Pension Benefits | part of Rio Tinto Group | | part of Rio Tinto Group | | Rio Tinto Group | |
| |
| |
| |
| |
| | 2002 | | 2001 | | 2002 | | 2001 | | 2002 | | 2001 | |
| |
| |
| |
| |
| |
| |
| |
| | US$m | | US$m | | US$m | | US$m | | US$m | | US$m | |
| Fair value of plan assets at start of year | 2,271 | | 2,840 | | 917 | | 1,024 | | 3,188 | | 3,864 | |
| Actual return on plan assets | (108 | ) | (296 | ) | (42 | ) | (44 | ) | (150 | ) | (340 | ) |
| Contributions by plan participants | 3 | | 2 | | 6 | | 4 | | 9 | | 6 | |
| Contributions by employer | 13 | | 9 | | 17 | | 13 | | 30 | | 22 | |
| Benefits paid | (141 | ) | (125 | ) | (54 | ) | (70 | ) | (195 | ) | (195 | ) |
| Inclusion of defined contribution assets | - | | 2 | | - | | 61 | | - | | 63 | |
| Currency translation | 218 | | (161 | ) | 66 | | (71 | ) | 284 | | (232 | ) |
| |
| |
| |
| |
| |
| |
| |
| Fair value of plan assets at end of year | 2,256 | | 2,271 | | 910 | | 917 | | 3,166 | | 3,188 | |
| |
| |
| |
| |
| |
| |
| |
| | Rio Tinto plc - | | Rio Tinto Limited - | | | |
| Other Benefits | part of Rio Tinto Group | part of Rio Tinto Group | Rio Tinto Group |
| |
| |
| |
| |
| | 2002 | | 2001 | | 2002 | | 2001 | | 2002 | | 2001 | |
| |
| |
| |
| |
| |
| |
| |
| | US$m | | US$m | | US$m | | US$m | | US$m | | US$m | |
| Fair value of plan assets at start of year | - | | - | | - | | - | | - | | - | |
| Contributions by employer | 14 | | 11 | | 2 | | 2 | | 16 | | 13 | |
| Benefits paid | (14 | ) | (11 | ) | (2 | ) | (2 | ) | (16 | ) | (13 | ) |
| |
| |
| |
| |
| |
| |
| |
| Fair value of plan assets at end of year | - | | - | | - | | - | | - | | - | |
| |
| |
| |
| |
| |
| |
| |
Sensitivity to change in healthcare trend
The healthcare cost trend rate assumption has a significant effect on the amounts reported. Changing the healthcare cost trend rates by one per cent would result in the following annual effects:
| Rio Tinto Group | 1% increase | | 1% decrease | |
| | 2002 | | 2001 | | 2002 | | 2001 | |
| |
| |
| |
| |
| |
| | US$m | | US$m | | US$m | | US$m | |
| (Increase)/decrease in service cost plus interest cost | (5 | ) | (5 | ) | 4 | | 4 | |
| (Increase)/decrease in benefit obligation at 30 September | (48 | ) | (39 | ) | 40 | | 34 | |
| | | | | | | | | |
| Rio Tinto plc - part of Rio Tinto Group | | | | | | | | |
| | | | | | | | | |
| (Increase)/decrease in service cost plus interest cost | (5 | ) | (5 | ) | 4 | | 4 | |
| (Increase)/decrease in benefit obligation at 30 September | (43 | ) | (34 | ) | 35 | | 30 | |
| | | | | | | | | |
| Rio Tinto Limited - part of Rio Tinto Group | | | | | | | | |
| | | | | | | | | |
| (Increase)/decrease in service cost plus interest cost | - | | - | | - | | - | |
| (Increase)/decrease in benefit obligation at 30 September | (5 | ) | (5 | ) | 5 | | 4 | |
A-65
Back to Contents
RIO TINTO PLC - RIO TINTO LIMITED
NOTES TO FINANCIAL STATEMENTS - (continued)
42 Reconciliation to US Accounting Principles (continued)
| | Rio Tinto plc -
part of Rio Tinto Group | | Rio Tinto Limited -
part of Rio Tinto Group | | Rio Tinto Group | |
| |
| |
| |
| |
| | 2002 | | 2001 | | 2000 | | 2002 | | 2001 | | 2000 | | 2002 | | 2001 | | 2000 | |
| | US$m | | US$m | | US$m | | US$m | | US$m | | US$m | | US$m | | US$m | | US$m | |
| |
| |
| |
| |
| |
| |
| |
| |
| |
| |
| Net cash flow from operating activities | 1,536 | | 1,108 | | 1,213 | | 1,379 | | 1,327 | | 1,431 | | 2,640 | | 2,326 | | 2,510 | |
| Net cash flow from investing activities | (1,042 | ) | (1,122 | ) | (396 | ) | (592 | ) | (1,277 | ) | (3,616 | ) | (1,663 | ) | (2,113 | ) | (4,012 | ) |
| Net cash flow from financing activities | (507 | ) | (17 | ) | (973 | ) | (948 | ) | (87 | ) | 2,218 | | (1,151 | ) | (281 | ) | 1,379 | |
| |
| |
| |
| |
| |
| |
| |
| |
| |
| |
(Decrease)/increase in cash and cash
equivalents per US GAAP | (13 | ) | (31 | ) | (156 | ) | (161 | ) | (37 | ) | 33 | | (174 | ) | (68 | ) | (123 | ) |
| |
| |
| |
| |
| |
| |
| |
| |
| |
| |
| (Decrease)/increase in cash per UK GAAP | (16 | ) | 6 | | (78 | ) | (114 | ) | 34 | | 34 | | (130 | ) | 40 | | (44 | ) |
| Increase in non qualifying liquid resources for | | | | | | | | | | | | | | | | | | |
| US GAAP | (2 | ) | (31 | ) | (138 | ) | (25 | ) | (26 | ) | (57 | ) | (27 | ) | (57 | ) | (195 | ) |
(Decrease)/increase in bank borrowings
repayable on demand included in cash under
UK GAAP | 5 | | (6 | ) | 60 | | (22 | ) | (45 | ) | 56 | | (17 | ) | (51 | ) | 116 | |
| |
| |
| |
| |
| |
| |
| |
| |
| |
| |
(Decrease)/increase in cash and cash
equivalents per US GAAP | (13 | ) | (31 | ) | (156 | ) | (161 | ) | (37 | ) | 33 | | (174 | ) | (68 | ) | (123 | ) |
| |
| |
| |
| |
| |
| |
| |
| |
| |
| |
| | Rio Tinto plc - part of Rio Tinto Group | | Rio Tinto Limited - part of Rio Tinto Group | | Rio Tinto Group | |
| |
|
| |
| |
| | 2002 | | 2001 | | 2002 | | 2001 | | 2002 | | 2001 | |
| |
| |
| |
| |
| |
| |
| |
| | US$m | | US$m | | US$m | | US$m | | US$m | | US$m | |
| Cash and cash equivalents under US GAAP: | | | | | | | | | | | | |
| Cash per balance sheet under UK GAAP | 174 | | 364 | | 151 | | 315 | | 325 | | 679 | |
| Qualifying liquid resources less non qualifying deposits | (1 | ) | (135 | ) | (44 | ) | (48 | ) | (45 | ) | (183 | ) |
| |
| |
| |
| |
| |
| |
| |
| Cash and cash equivalents under US GAAP | 173 | | 229 | | 107 | | 267 | | 280 | | 496 | |
| |
| |
| |
| |
| |
| |
| |
There was an exchange loss for the Rio Tinto Group of US$47 million, an exchange loss for Rio Tinto plc of US$28 million and for Rio Tinto Limited an exchange loss of US$19 million (2001: gain for the Group of US$1 million, gain for Rio Tinto plc US$2 million, loss for Rio Tinto Limited US$1 million) relating to US GAAP cash and cash equivalents during the year.
Deferred tax credit/(charge)
| | Rio Tinto plc -
part of Rio Tinto Group | | Rio Tinto Limited -
part of Rio Tinto Group | | Rio Tinto Group | |
| |
| |
| |
| |
| | 2002 | | 2001 | | 2000 | | 2002 | | 2001 | | 2000 | | 2002 | | 2001 | | 2000 | |
| |
| |
| |
| |
| |
| |
| |
| |
| |
| |
| | US$m | | US$m | | US$m | | US$m | | US$m | | US$m | | US$m | | US$m | | US$m | |
| The credit/(charge) for deferred taxation arises as follows: | | | | | | | | | | | | | | | | | |
| - accelerated capital allowances | 158 | | 168 | | (23 | ) | 28 | | 39 | | 10 | | 186 | | 207 | | (13 | ) |
| - pension prepayments | (1 | ) | (39 | ) | (29 | ) | 12 | | 9 | | 5 | | 11 | | (30 | ) | (24 | ) |
| - provisions | 20 | | 68 | | (25 | ) | (14 | ) | (27 | ) | 18 | | 6 | | 41 | | (7 | ) |
| - provision against AMT credits and US tax losse | (228 | ) | (144 | ) | (26 | ) | - | | - | | - | | (228 | ) | (144 | ) | (26 | ) |
| - other timing differences | 30 | | 5 | | (5 | ) | 11 | | (47 | ) | (30 | ) | 41 | | (42 | ) | (35 | ) |
| |
| |
| |
| |
| |
| |
| |
| |
| |
| |
| | (21 | ) | 58 | | (108 | ) | 37 | | (26 | ) | 3 | | 16 | | 32 | | (105 | ) |
| |
| |
| |
| |
| |
| |
| |
| |
| |
| |
A-66
Back to Contents
RIO TINTO PLC - RIO TINTO LIMITED
NOTES TO FINANCIAL STATEMENTS - (continued)
42 Reconciliation to US Accounting Principles (continued)
Fixed asset investments
The aggregates of the profit and loss accounts and balance sheets of equity and gross equity accounted companies on a 100 per cent basis are set out below:
| | Rio Tinto plc -
part of Rio Tinto Group | | Rio Tinto Limited -
part of Rio Tinto Group | | Rio Tinto Group | |
| |
| |
| |
| |
| | 2002 | | 2001 | | 2000 | | 2002 | | 2001 | | 2000 | | 2002 | | 2001 | | 2000 | |
| |
| |
| |
| |
| |
| |
| |
| |
| |
| |
| | US$m | | US$m | | US$m | | US$m | | US$m | | US$m | | US$m | | US$m | | US$m | |
| Profit and loss account: | | | | | | | | | | | | | | | | | | |
| Sales revenue | 9,295 | | 9,966 | | 8,921 | | 1,841 | | 1,643 | | 922 | | 6,622 | | 6,313 | | 5,961 | |
| Cost of sales | (6,826 | ) | (6,873 | ) | (5,686 | ) | (1,217 | ) | (1,066 | ) | (629 | ) | (4,384 | ) | (4,068 | ) | (3,889 | ) |
| |
| |
| |
| |
| |
| |
| |
| |
| |
| |
| Operating profit | 2,469 | | 3,093 | | 3,235 | | 624 | | 577 | | 293 | | 2,238 | | 2,245 | | 2,072 | |
| Profit of equity accounted companies | 325 | | 320 | | 183 | | - | | - | | - | | - | | - | | - | |
| Net interest | (475 | ) | (534 | ) | (544 | ) | (49 | ) | (67 | ) | (36 | ) | (377 | ) | (392 | ) | (429 | ) |
| |
| |
| |
| |
| |
| |
| |
| |
| |
| |
| Profit before tax | 2,319 | | 2,879 | | 2,874 | | 575 | | 510 | | 257 | | 1,861 | | 1,853 | | 1,643 | |
| Taxation | (911 | ) | (963 | ) | (966 | ) | (91 | ) | (163 | ) | (69 | ) | (579 | ) | (604 | ) | (583 | ) |
| Profit attributable to outside shareholders | 90 | | (115 | ) | (119 | ) | - | | - | | - | | (36 | ) | (43 | ) | (37 | ) |
| |
| |
| |
| |
| |
| |
| |
| |
| |
| |
| Net profit on ordinary activities (100 per cent basis) | 1,498 | | 1,801 | | 1,789 | | 484 | | 347 | | 188 | | 1,246 | | 1,206 | | 1,023 | |
| |
| |
| |
| |
| |
| |
| |
| |
| |
| |
| | Rio Tinto plc - part of Rio Tinto Group | | Rio Tinto Limited - part of Rio Tinto Group | | Rio Tinto Group | |
| |
|
| |
| |
| | 2002 | | 2001 | | 2002 | | 2001 | | 2002 | | 2001 | |
| |
| |
| |
| |
| |
| |
| |
| | US$m | | US$m | | US$m | | US$m | | US$m | | US$m | |
| Balance sheet | | | | | | | | | | | | |
| Intangible fixed assets | 988 | | 942 | | 1 | | 1 | | 194 | | 196 | |
| Tangible fixed assets | 15,942 | | 15,549 | | 2,758 | | 2,491 | | 12,086 | | 11,765 | |
| Investments | 1,235 | | 983 | | 3 | | 3 | | 166 | | 162 | |
| Working capital | (434 | ) | (363 | ) | 86 | | 194 | | 593 | | 516 | |
| Net cash less current debt | (2,658 | ) | (2,031 | ) | (33 | ) | (97 | ) | (835 | ) | (164 | ) |
| Long term debt | (5,667 | ) | (6,098 | ) | (1,005 | ) | (1,181 | ) | (5,406 | ) | (5,838 | ) |
| Provisions | (2,648 | ) | (2,853 | ) | (361 | ) | (377 | ) | (1,658 | ) | (1,949 | ) |
| Outside shareholders' interests | (847 | ) | (902 | ) | - | | - | | (290 | ) | (249 | ) |
| |
| |
| |
| |
| |
| |
| |
| Aggregate shareholders' funds (100 per cent basis) | 5,911 | | 5,227 | | 1,449 | | 1,034 | | 4,850 | | 4,439 | |
| |
| |
| |
| |
| |
| |
| |
For Rio Tinto plc the above disclosures include 100 per cent of the profit and loss account and balance sheet of Rio Tinto Limited
Acquisitions
The following information gives pro forma effect to the acquisitions of North, Ashton and the Comalco minority made by Rio Tinto Limited during 2000 as if those acquisitions had taken place on 1 January 2000 as required for the purposes of preparing the unaudited pro forma combined results ('the pro forma') for 2000. The pro forma contains the consolidated results of Rio Tinto Limited and its acquisitions after giving effect to certain adjustments. These adjustments include estimates of the effect on the pro forma of Rio Tinto Limited's accounting policies, as applied to the results of the acquisitions, the fair value adjustments calculated at the acquisition date; and the increased net interest expense, together with the associated tax effects, as a result of financing the acquisition. The pro forma does not necessarily reflect the results of operations as they would have been if Rio Tinto Limited and the acquired companies had constituted a single entity during 2000.
| | Rio Tinto plc - part of Rio Tinto Group | | Rio Tinto Limited - part of Rio Tinto Group | | Rio Tinto Group | |
| |
| |
| |
| |
| | Year ended 31 December | | Year ended 31 December | | Year ended 31 December | |
| |
| |
| |
| |
| | Unaudited | | Unaudited | | Unaudited | |
| |
| |
| |
| |
| | 2000 | | 2000 | | 2000 | |
| |
| |
| |
| |
| | US$m | | US$m | | US$m | |
| Gross turnover | 7,545 | | 5,267 | | 10,803 | |
| Consolidated turnover | 3,993 | | 4,660 | | 8,653 | |
| Operating profit | 2,075 | | 1,581 | | 3,037 | |
| Net earnings | 1,062 | | 765 | | 1,501 | |
| | | | | | | |
| Combined earnings per share - basic | 99.9 | c | 141.4 | c | 109.3 | c |
| Combined earnings per share - diluted | 99.8 | c | 141.4 | c | 109.2 | c |
A-67
Back to Contents
RIO TINTO PLC - RIO TINTO LIMITED
NOTES TO FINANCIAL STATEMENTS - (continued)
42 Reconciliation to US Accounting Principles (continued)
Unrealised holding gains and losses
Under FAS 115, unrealised holding gains and losses on investments classified as 'available for sale' are excluded from earnings and reported instead within a separate component of shareholders' funds until realised.
The following tables show the investments in debt and equity securities which are held as 'available for sale' in accordance with FAS 115 for the Rio Tinto Group, Rio Tinto plc and Rio Tinto Limited.
| Rio Tinto Group | FAS 115 net book value | | Unrealised holding gains | | Unrealised holding losses | | Market value | | Net unrealised holding gains/(losses) | |
| |
| |
| |
| |
| |
| |
| | US$m | | US$m | | US$m | | US$m | | US$m | |
| At 1 January 2002 | 70 | | 3 | | (10 | ) | 63 | | (7 | ) |
| Change in unrealised holding gains/(losses) | - | | 2 | | 5 | | 7 | | 7 | |
| |
| |
| |
| |
| |
| |
| At 31 December 2002 | 70 | | 5 | | (5 | ) | 70 | | - | |
| |
| |
| |
| |
| |
| |
| Rio Tinto plc | FAS 115 net book value | | Unrealised holding gains | | Unrealised holding losses | | Market value | | Net unrealised holding gains/(losses) | |
| |
| |
| |
| |
| |
| |
| | US$m | | US$m | | US$m | | US$m | | US$m | |
| At 1 January 2002 | 56 | | - | | (4 | ) | 52 | | (4 | ) |
| Change in unrealised holding gains/(losses) | - | | - | | 3 | | 3 | | 3 | |
| |
| |
| |
| |
| |
| |
| At 31 December 2002 | 56 | | - | | (1 | ) | 55 | | (1 | ) |
| |
| |
| |
| |
| |
| |
| Rio Tinto Limited | FAS 115 net book value | | Unrealised holding gains | | Unrealised holding losses | | Market value | | Net unrealised holding gains/(losses) | |
| |
| |
| |
| |
| |
| |
| | US$m | | US$m | | US$m | | US$m | | US$m | |
| At 1 January 2002 | 14 | | 3 | | (6 | ) | 11 | | (3 | ) |
| Change in unrealised holding gains/(losses) | - | | 2 | | 2 | | 4 | | 4 | |
| |
| |
| |
| |
| |
| |
| At 31 December 2002 | 14 | | 5 | | (4 | ) | 15 | | 1 | |
| |
| |
| |
| |
| |
| |
Share Option Plans
At 31 December 2002, Rio Tinto plc and Rio Tinto Limited have a number of share based option plans, which are described below:
Fixed Share Option Plans
Under these plans, the exercise price of each option equals the market price of the Company's shares on the date of grant less a 20% discount and the maximum term of the option is between 2 and 5 years.
The fair value of each option grant is estimated on the date of grant using the Black-Scholes option-pricing model with the following weighted average assumptions used for grants in 2000, 2001 and 2002:
| | 2002 | | 2001 | | 2000 | |
| |
| |
| |
| |
| | Risk-free | | Expected | | Dividend | | Risk-free | | Expected | | Dividend | | Risk-free | | Expected | | Dividend | |
| | interest rate | | volatility | | yield | | interest rate | | volatility | | yield | | interest rate | | volatility | | yield | |
| |
| |
| |
| |
| |
| |
| |
| |
| |
| |
| | % | | % | | % | | % | | % | | % | | % | | % | | % | |
| Rio Tinto plc | 4.41 | | 31.82 | | 4.48 | | 4.60 | | 42.57 | | 2.98 | | 5.23 | | 33.24 | | 3.57 | |
| Rio Tinto Limited | 5.35 | | 26.13 | | 2.58 | | 5.38 | | 26.02 | | 3.30 | | - | | - | | - | |
A summary of the status of the Companies’ fixed share option plans as at 31 December 2000, 2001 and 2002, and changes during the years ending on those dates is presented below:
| | Rio Tinto plc Share Savings Plan | |
| |
| |
| | 2002 | | 2001 | | 2000 | |
| |
| |
| |
| |
| | | | Weighted | | | | Weighted | | | | Weighted | |
| | | | average | | | | average | | | | average | |
| | Number | | share price | | Number | | share price | | Number | | share price | |
| |
| |
| |
| |
| |
| |
| |
| | | | £s | | | | £s | | | | £s | |
| Options outstanding at 1 January 2002 | 2,010,403 | | 7.74 | | 1,285,340 | | 6.32 | | 1,462,462 | | 6.14 | |
| Granted | 509,954 | | 8.76 | | 975,577 | | 9.50 | | 159,294 | | 8.55 | |
| Exercised | (278,134 | ) | 5.96 | | (181,581 | ) | 7.27 | | (222,693 | ) | 6.73 | |
| Cancelled | (162,378 | ) | 8.85 | | (68,933 | ) | 7.59 | | (113,723 | ) | 6.36 | |
| |
| |
| |
| |
| |
| |
| |
| Options outstanding at 31 December 2002 | 2,079,845 | | 8.14 | | 2,010,403 | | 7.74 | | 1,285,340 | | 6.32 | |
| |
| |
| |
| |
| |
| |
| |
| | | | | | | | | | | | | |
| Weighted-average fair value of options granted during the year | | 2.78 | | | | 3.98 | | | | 3.17 | |
A-68
Back to Contents
RIO TINTO PLC - RIO TINTO LIMITED
NOTES TO FINANCIAL STATEMENTS - (continued)
42 Reconciliation to US Accounting Principles (continued)
| | Rio Tinto Limited - Share Savings Plan | |
| |
| |
| | 2002 | | 2001 | | 2000 | |
| |
| |
| |
| |
| | | | Weighted | | | | Weighted | | | | Weighted | |
| | | | average | | | | average | | | | average | |
| | Number | | share price | | Number | | share price | | Number | | share price | |
| |
| |
| |
| |
| |
| |
| |
| | | | A$'s | | | | A$'s | | | | A$'s | |
| Options outstanding at 1 January 2002 | 1,380,826 | | 27.86 | | - | | - | | - | | - | |
| Granted | 1,245,639 | | 25.57 | | 1,393,415 | | 27.86 | | - | | - | |
| Exercised | (2,130 | ) | 27.86 | | - | | - | | - | | - | |
| Cancelled | (378,161 | ) | 27.86 | | (12,589 | ) | 27.86 | | - | | - | |
| |
| |
| |
| |
| |
| |
| |
| Options outstanding at 31 December 2002 | 2,246,174 | | 26.59 | | 1,380,826 | | 27.86 | | - | | - | |
| |
| |
| |
| |
| |
| |
|
| | | | | | | | | | | | | |
| Weighted-average fair value of options granted during the year | | 7.59 | | | | 11.34 | | | | - | |
| | | |
| | Rio Tinto plc - Share Savings Plan | |
| |
| |
| As at 31 December 2002: | Options outstanding | | Options exercisable | |
| |
| |
| |
| | | | Weighted | | Weighted | | | | Weighted | |
| | | | average | | average | | | | average | |
| Range of exercise prices | Number | | remaining life | | ex price | | Number | | ex price | |
| |
| |
| |
| |
| |
| |
| | | | years | | £'s | | | | £'s | |
| £5.20 - £7.80 | 560,972 | | 0.9 | | 5.46 | | 3,554 | | 7.44 | |
| £7.85 - £10.70 | 1,518,873 | | 2.3 | | 9.05 | | - | | - | |
| |
| |
| |
| |
| |
| |
| £5.20 - £10.70 | 2,079,845 | | 1.9 | | 8.08 | | 3,554 | | 7.44 | |
| |
| |
| |
| |
| |
| |
At 31 December 2001 and 31 December 2000 there were no options exercisable
| | Rio Tinto Limited - Share Savings Plan |
| |
| |
|
| | Options outstanding | | Options exercisable |
| |
| |
|
| | | | | | | | | | |
| | | | Weighted | | Weighted | | | | Weighted |
| | | | average | | average | | | | average |
| Range of exercise prices | Number | | remaining life | | ex price | | Number | | ex price |
| |
| |
| |
| |
| |
|
| | | | years | | A$'s | | | | A$'s |
| A$20 - A$26 | 1,245,639 | | 3.8 | | 25.57 | | - | | - |
| A$27 - A$30 | 1,000,535 | | 2.8 | | 27.86 | | - | | - |
| |
| |
| |
| |
| |
|
| A$20 - A$30 | 2,246,174 | | 3.4 | | 26.59 | | - | | - |
| |
| |
| |
| |
| |
|
At 31 December 2001 and 31 December 2000 there were no options exercisable.
Performance Based Share Option Plan
Under its 1998 Executive Share Option Scheme and Share Option Plan, the Company grants selected executives and other key employees share option awards vesting of which is contingent upon increases in the Company's earnings per share above certain predetermined target levels. The exercise price of each option, which has a 10-year life, is equal to the market price of the Company's shares on the date of grant.
The fair value of each option grant is estimated on the date of grant using the Black-Scholes option-pricing model with the following weighted average assumptions used for grants in 2000, 2001 and 2002:
| | 2002 | | 2001 | | 2000 | |
| |
| |
| |
| |
| | Risk-free | | Expected | | Dividend | | Risk-free | | Expected | | Dividend | | Risk-free | | Expected | | Dividend | |
| | interest rate | | volatility | | yield | | interest rate | | volatility | | yield | | interest rate | | volatility | | yield | |
| |
| |
| |
| |
| |
| |
| |
| |
| |
| |
| | % | | % | | % | | % | | % | | % | | % | | % | | % | |
| Rio Tinto plc | 5.22 | | 30.84 | | 2.83 | | 4.76 | | 30.04 | | 3.18 | | 5.28 | | 30.5 | | 3.59 | |
| Rio Tinto Limited | 6.51 | | 25.92 | | 2.76 | | 5.27 | | 26.02 | | 2.98 | | 6.76 | | 25.3 | | 3.61 | |
A summary of the status of the Company's performance-based share option plan as of 31 December 2001 and 2002, and changes during the years ending on those dates is presented below:
| | Rio Tinto plc - Share Option Plan | |
| |
| |
| | 2002 | | 2001 | | 2000 | |
| |
| |
| |
| |
| | | | Weighted | | | | Weighted | | | | Weighted | |
| | | | average | | | | average | | | | average | |
| | Number | | share price | | Number | | share price | | Number | | share price | |
| |
| |
| |
| |
| |
| |
| |
| | | | £'s | | | | £'s | | | | £'s | |
| Options outstanding at 1 January | 5,785,625 | | 9.97 | | 4,381,611 | | 8.66 | | 2,926,822 | | 8.14 | |
| Granted | 2,095,314 | | 14.59 | | 1,931,747 | | 12.66 | | 1,534,306 | | 9.65 | |
| Exercised | (540,568 | ) | 8.16 | | (392,021 | ) | 8.20 | | - | | - | |
| Cancelled | (154,117 | ) | 14.72 | | (135,712 | ) | 10.86 | | (79,517 | ) | 8.61 | |
| |
| |
| |
| |
| |
| |
| |
| Options outstanding at 31 December | 7,186,254 | | 11.35 | | 5,785,625 | | 9.97 | | 4,381,611 | | 8.66 | |
| |
| |
| |
| |
| |
| |
| |
| | | | | | | | | | | | | |
| Weighted-average fair value of options granted during the year | | 4.99 | | | | 4.52 | | | | 3.06 | |
A-69
Back to Contents
42 Reconciliation to US Accounting Principles (continued)
RIO TINTO PLC - RIO TINTO LIMITED
NOTES TO FINANCIAL STATEMENTS - (continued)
| | Rio Tinto Limited - Share Option Plan | |
| |
| |
| | 2002 | | 2001 | | 2000 | |
| |
| |
| |
| |
| | | | Weighted | | | | Weighted | | | | Weighted | |
| | | | average | | | | average | | | | average | |
| | Number | | share price | | Number | | share price | | Number | | share price | |
| |
| |
| |
| |
| |
| |
| |
| | | | A$'s | | | | A$'s | | | | A$'s | |
| Options outstanding at 1 January | 1,694,730 | | 28.09 | | 853,188 | | 22.13 | | 586,691 | | 21.26 | |
| Granted | 1,003,849 | | 39.87 | | 932,265 | | 33.01 | | 266,497 | | 24.07 | |
| Exercised | (208,528 | ) | 20.15 | | (78,775 | ) | 21.15 | | - | | - | |
| Cancelled | (50,721 | ) | 37.65 | | (11,948 | ) | 32.53 | | - | | - | |
| |
| |
| |
| |
| |
| |
| |
| Options outstanding at 31 December | 2,439,330 | | 33.42 | | 1,694,730 | | 28.09 | | - | | 22.13 | |
| |
| |
| |
| |
| |
| |
| |
| | | | | | | | | | | | | |
| Weighted-average fair value of options granted during the year | | 13.71 | | | | 11.10 | | | | 7.50 | |
| | | |
| | Rio Tinto plc - Share Option Plan | |
| |
| |
| As at 31 December 2002: | | | Options Outstanding | | | | Options exercisable | |
| |
| |
| |
| | | | Weighted | | Weighted | | | | Weighted | |
| | | | average | | average | | | | average | |
| Range of exercise prices | Number | | remaining life | | ex price | | Number | | ex price | |
| |
| |
| |
| |
| |
| |
| | | | years | | £'s | | | | £'s | |
| £8 - £10 | 3,388,982 | | 0.3 | | 8.78 | | 1,933,796 | | 8.13 | |
| £12 - £15 | 3,797,272 | | 5.7 | | 13.64 | | - | | - | |
| |
| |
| |
| |
| |
| |
| £8 - £15 | 7,186,254 | | 3.1 | | 11.35 | | - | | 8.13 | |
| |
| |
| |
| |
| |
| |
At 31 December 2001 there were 1 million (2000: nil) options exercisable with a weighted average exercise price of £8.20
| | Rio Tinto Limited - Share Option Plan | |
| |
| |
| | Options Outstanding | | Options exercisable | |
| |
| |
| |
| | | | Weighted | | Weighted | | | | Weighted | |
| | | | average | | average | | | | average | |
| Range of exercise price | Number | | remaining life | | ex price | | Number | | ex price | |
| |
| |
| |
| |
| |
| |
| | | | years | | A$'s | | | | A$'s | |
| A$20 - A$25 | 565,243 | | 0.3 | | 23.00 | | 318,273 | | 22.18 | |
| A$30 - A$40 | 1,874,087 | | 5.7 | | 36.56 | | - | | - | |
| |
| |
| |
| |
| |
| |
| A$20 - A$40 | 2,439,330 | | 4.4 | | 33.42 | | 318,273 | | 22.18 | |
| |
| |
| |
| |
| |
| |
At 31 December 2001 there were 0.2 million (2000: nil) options exercisable with a weighted average exercise price of A$20.14
| | Rio Tinto plc - Executive Share Option Scheme | |
| |
| |
| | 2002 | | 2001 | | 2000 | |
| |
| |
| |
| |
| | | | Weighted | | | | Weighted | | | | Weighted | |
| | | | average | | | | average | | | | average | |
| | Number | | share price | | Number | | share price | | Number | | share price | |
| |
| |
| |
| |
| |
| |
| |
| | | | £'s | | | | £'s | | | | £'s | |
| Options outstanding at 1 January | 130,786 | | 8.09 | | 238,336 | | 7.89 | | 277,067 | | 7.55 | |
| Exercised | (68,786 | ) | 7.73 | | (107,550 | ) | 7.65 | | (38,731 | ) | 5.45 | |
| |
| |
| |
| |
| |
| |
| |
| Options outstanding at 31 December | 62,000 | | 8.49 | | 130,786 | | 8.09 | | - | | 7.89 | |
| |
| |
| |
| |
| |
| |
| |
| | | | | | | | | | | | | |
| Number of options exercisable at year end | 62,000 | | | | 130,786 | | | | 238,336 | | | |
| Weighted-average exercise price of options exercisable at year end | 8.49 | | | | 8.09 | | | | 7.89 | |
As at 31 December 2002, Rio Tinto plc has 0.06 million performance options outstanding under the 1998 Executive Share Option Scheme with exercise prices between £6.89 and £8.61. These options have vested and have a weighted average remaining life of 1.3 years.
A-70
Back to Contents
RIO TINTO PLC - RIO TINTO LIMITED
NOTES TO FINANCIAL STATEMENTS - (continued)
42 Reconciliation to US Accounting Principles (continued)
The following supplements segmental information provided elsewhere in this report to provide additional information required under US GAAP
| Property, plant and equipment by location | | |
| | Rio Tinto Group | |
| |
| |
| | Restated | | Restated | |
| | 2002 | | 2001 | | 2002 | | 2001 | |
| |
| |
| |
| |
| |
| | % | | % | | US$m | | US$m | |
| | | | | | | | | |
| North America | 42.7 | | 48.3 | | 5,204 | | 5,566 | |
| Australia and New Zealand | 48.5 | | 44.0 | | 5,912 | | 5,071 | |
| South America | 0.9 | | 1.2 | | 112 | | 139 | |
| Africa | 5.0 | | 3.6 | | 608 | | 420 | |
| Indonesia | 0.4 | | 0.5 | | 50 | | 52 | |
| Europe and other countries | 2.5 | | 2.4 | | 297 | | 264 | |
| |
| |
| |
| |
| |
| | 100.0 | | 100.0 | | 12,183 | | 11,512 | |
| |
| |
| |
| |
| |
| Tax charge by product group | | | | | | | | |
| | | | | | | | | |
| | Rio Tinto Group | |
| |
| |
| | 2002 | | 2001 | | 2000 | |
| |
| |
| |
| |
| | US$m | | US$m | | US$m | |
| Iron Ore | (215 | ) | (239 | ) | (191 | ) |
| Energy | (197 | ) | (212 | ) | (125 | ) |
| Industrial Minerals | (200 | ) | (219 | ) | (224 | ) |
| Aluminium - Comalco | (107 | ) | (160 | ) | (211 | ) |
| Copper | (118 | ) | (154 | ) | (182 | ) |
| Diamonds and Gold | (59 | ) | (43 | ) | (53 | ) |
| Tax on exploration | 18 | | 26 | | 28 | |
| Other items, including tax relief on asset write downs | 170 | | 283 | | 139 | |
| |
| |
| |
| |
| | (708 | ) | (718 | ) | (819 | ) |
| |
| |
| |
| |
Covenants
Of the Rio Tinto Group's medium and long term borrowings of US$2.7 billion, some US$0.6 billion relates to the Group's share of non-recourse borrowings which are the subject of various financial and general covenants with which the respective borrowers are in compliance.
Intangible assets under US GAAP (Rio Tinto Group and Rio Tinto plc)
The implementation of FAS 141 resulted in the reclassification of US$340 million from goodwill to finite lived intangible assets at 1 January 2002. The accumulated cost relating to these intangible assets at 31 December 2002 was US$714 million and accumulated amortisation was US$394 million. The total amortisation expense was US$68 million of which US$20 million is related to the amortisation of goodwill previously written off to reserves under UK GAAP now reclassified as finite lived intangible assets under US GAAP. The remaining US$48 million relates to the amortisation of goodwill included as an asset on the UK GAAP balance sheet but now reclassified as finite lived intangible assets under US GAAP. The estimated amortisation charge relating to intangible assets for each of the next five years is US$68 million.
A-71
Back to Contents
RIO TINTO PLC - RIO TINTO LIMITED
NOTES TO FINANCIAL STATEMENTS - (continued)
42 Reconciliation to US Accounting Principles (continued)
Accounting for derivative instruments and hedging activities
During 2002, the following movements, pre tax and minorities, took place in Other comprehensive income (OCI) and earnings in relation to net derivative liabilities:
| | Net | | Recorded | | Recorded | |
| | derivative | | in OCI | | in retained | |
| | liabilities | | | | earnings | |
| | US$m | | US$m | | US$m | |
| |
| |
| |
| |
| Net derivative liabilities on balance sheet at 31 December 2001 | (332 | ) | (181 | ) | (151 | ) |
| Less: net derivative liabilities marked to market through OCI at 1 January 2002 | | | | | | |
| relating to contracts maturing in 2002 (a) | 31 | | 31 | | - | |
| Less: net derivative liabilities marked to market through retained earnings at | | | | | | |
| 1 January 2002 relating to contracts maturing in 2002 (b) | 40 | | - | | 40 | |
| Add: mark to market of net derivative liabilities designated as FAS 133 | | | | | | |
| cash flow hedges at 31 December 2002 (c) | 90 | | 90 | | - | |
| Add: mark to market of net derivative liabilities not designated as hedges under | | | | | | |
| FAS 133 at 31 December 2002 (d) | 117 | | - | | 117 | |
| |
| |
| |
| |
| On balance sheet at 31 December 2002 | (54 | ) | (60 | ) | 6 | |
| |
| |
| |
| |
| | | | | | | |
| (a) | During 2002, net losses of US$31 million relating to derivatives designated as cash flow hedges under FAS 133 were transferred from accumulated OCI to US GAAP earnings on maturity of the contracts. |
| (b) | During 2002, accrued losses of US$40 million relating to derivatives that were not designated as hedges under FAS 133 were realised on maturity of the contracts. |
| (c) | The fair value of net derivative liabilities designated as cash flow hedges under FAS 133 reduced by US$90 million during 2002 resulting in a closing debit balance related to cash flow hedging activities of US$60 million in OCI. These cash flow hedges hedge the Group's exposure to the US dollar in relation to future trading transactions. The Group expects to reclassify US$18 million of this amount as reductions in earnings over the next twelve months as these contracts and the transactions which they hedge mature. As at 31 December 2002, the Group had US$102 million of cash flow hedge derivative liabilities and US$42 million of cash flow hedge derivative assets. The cash flow hedges extend to 2010. |
| (d) | Certain of the Group's derivative contracts do not qualify for hedge accounting under FAS 133, principally because the hedge is not located in the entity with the exposure. The fair value of these net derivative liabilities reduced by US$117 million during 2002. As at 31 December 2002, the Group had US$102 million of assets relating to derivatives which do not qualify for hedge accounting under FAS 133, and US$96 million of liabilities. |
A-72